the Creative Commons Attribution 4.0 License.
the Creative Commons Attribution 4.0 License.
 | 26 Jul 2024
Distributions of in situ parameters, dissolved (in)organic carbon, and nutrients in the water column and pore waters of Arctic fjords (western Spitsbergen) during a melting season
Michael Ernst Böttcher
Wei-Li Hong
Karol Kuliński
Aivo Lepland
Arunima Sen
Beata Szymczycha
A nutrient distribution, such as that of phosphate (), ammonium (), nitrate (), dissolved silica (Si), total dissolved nitrogen (TN), and dissolved organic nitrogen (DON), together with dissolved organic carbon (DOC) and inorganic carbon (DIC), was investigated during a high-melting season in 2021 in the western Spitsbergen fjords (Hornsund, Isfjorden, Kongsfjorden, and Krossfjorden). Both the water column and the pore water were investigated for nutrients and dissolved carbon distribution and gradients. The water column concentrations of most measured parameters, such as , , , Si, and DIC, showed significant changes among fjords and water masses. In addition, pore water gradients of , , , Si, DIC, and DOC revealed significant variability between fjords and are likely substantial sources of the investigated elements for the water column. The reported dataset reflects differences in hydrography and biogeochemical ecosystem functions of the investigated western Spitsbergen fjords and may form the base for further modeling of physical oceanographic and biogeochemical processes within these fjords. All data discussed in this communication are stored in the Zenodo online repository at https://doi.org/10.5281/zenodo.11237340 (Szymczycha et al., 2024).
- Article
(9237 KB) - Full-text XML
- BibTeX
- EndNote


The Arctic is facing significant and rapid transformations due to Arctic amplification accelerating climate change in the region (Dunse et al., 2022). The warming of the climate causes a change in oceanic and atmospheric circulation patterns, permafrost degradation, and decrease in the thickness and extent of sea ice, as well as shrinkage of glaciers (IPCC, 2022; Dunse et al., 2022). Freshwater released from glacial meltwater runoff or frontal ablation and accompanying fluxes of solutes is a significant factor that changes the hydrographic pattern and biogeochemistry of water masses, which in turn affects the biological productivity in the ocean and fjords (Hopwood et al., 2016, 2020).
Many studies have investigated the biogeochemistry of nutrients in the Barents Sea and Arctic region (Henley et al., 2020; Gundersen et al., 2022; Tuerena et al., 2022). Substantial efforts have been made in existing Arctic monitoring programs, research initiatives, and scientific projects to describe, explain, and predict environmental changes due to diverse pressures on the Arctic ecosystem (Townhill et al., 2022). Studies indicate that net primary production in open Arctic waters is mainly sustained by the upwelling of nutrients and light availability (Henley et al., 2020; Stroeve et al., 2021), while nitrogen is considered to be the key limiting nutrient in the Arctic Ocean (Mills et al., 2018; Ko et al., 2020). In addition, Henley et al. (2020) indicated that, with ongoing sea ice losses due to Atlantification, the expected shift from more Arctic-like ice-impacted conditions to more Atlantic-like ice-free conditions is projected to increase nutrient availability and the duration of the vegetation period in the Arctic shelf region.
Arctic fjords have not gained similar attention, and investigations were usually focused on individual fjord systems (Codispoti et al., 2013; Henley et al., 2020; Kim et al., 2022; Pogojeva et al., 2022). Spatially wide studies of fjords and investigations focusing on the hydrography and biogeochemical functioning of the Arctic shelf seafloor are still lacking. To address the existing knowledge gaps, we studied the water masses and pore waters together with their biogeochemical composition in the western Spitsbergen fjords. The selected area is an excellent research site for investigating the effects of both rapidly occurring climate change and varied levels of Atlantification, as different fjords are under the diverse impact of the East Spitsbergen Current, bringing cold Arctic water (ArW), and the West Spitsbergen Current, carrying warmer and more saline Atlantic water (AtW). This was also our motivation for releasing this macronutrient dataset, which we believe may constitute a biogeochemical reference for other experimental and modeling research in the region.
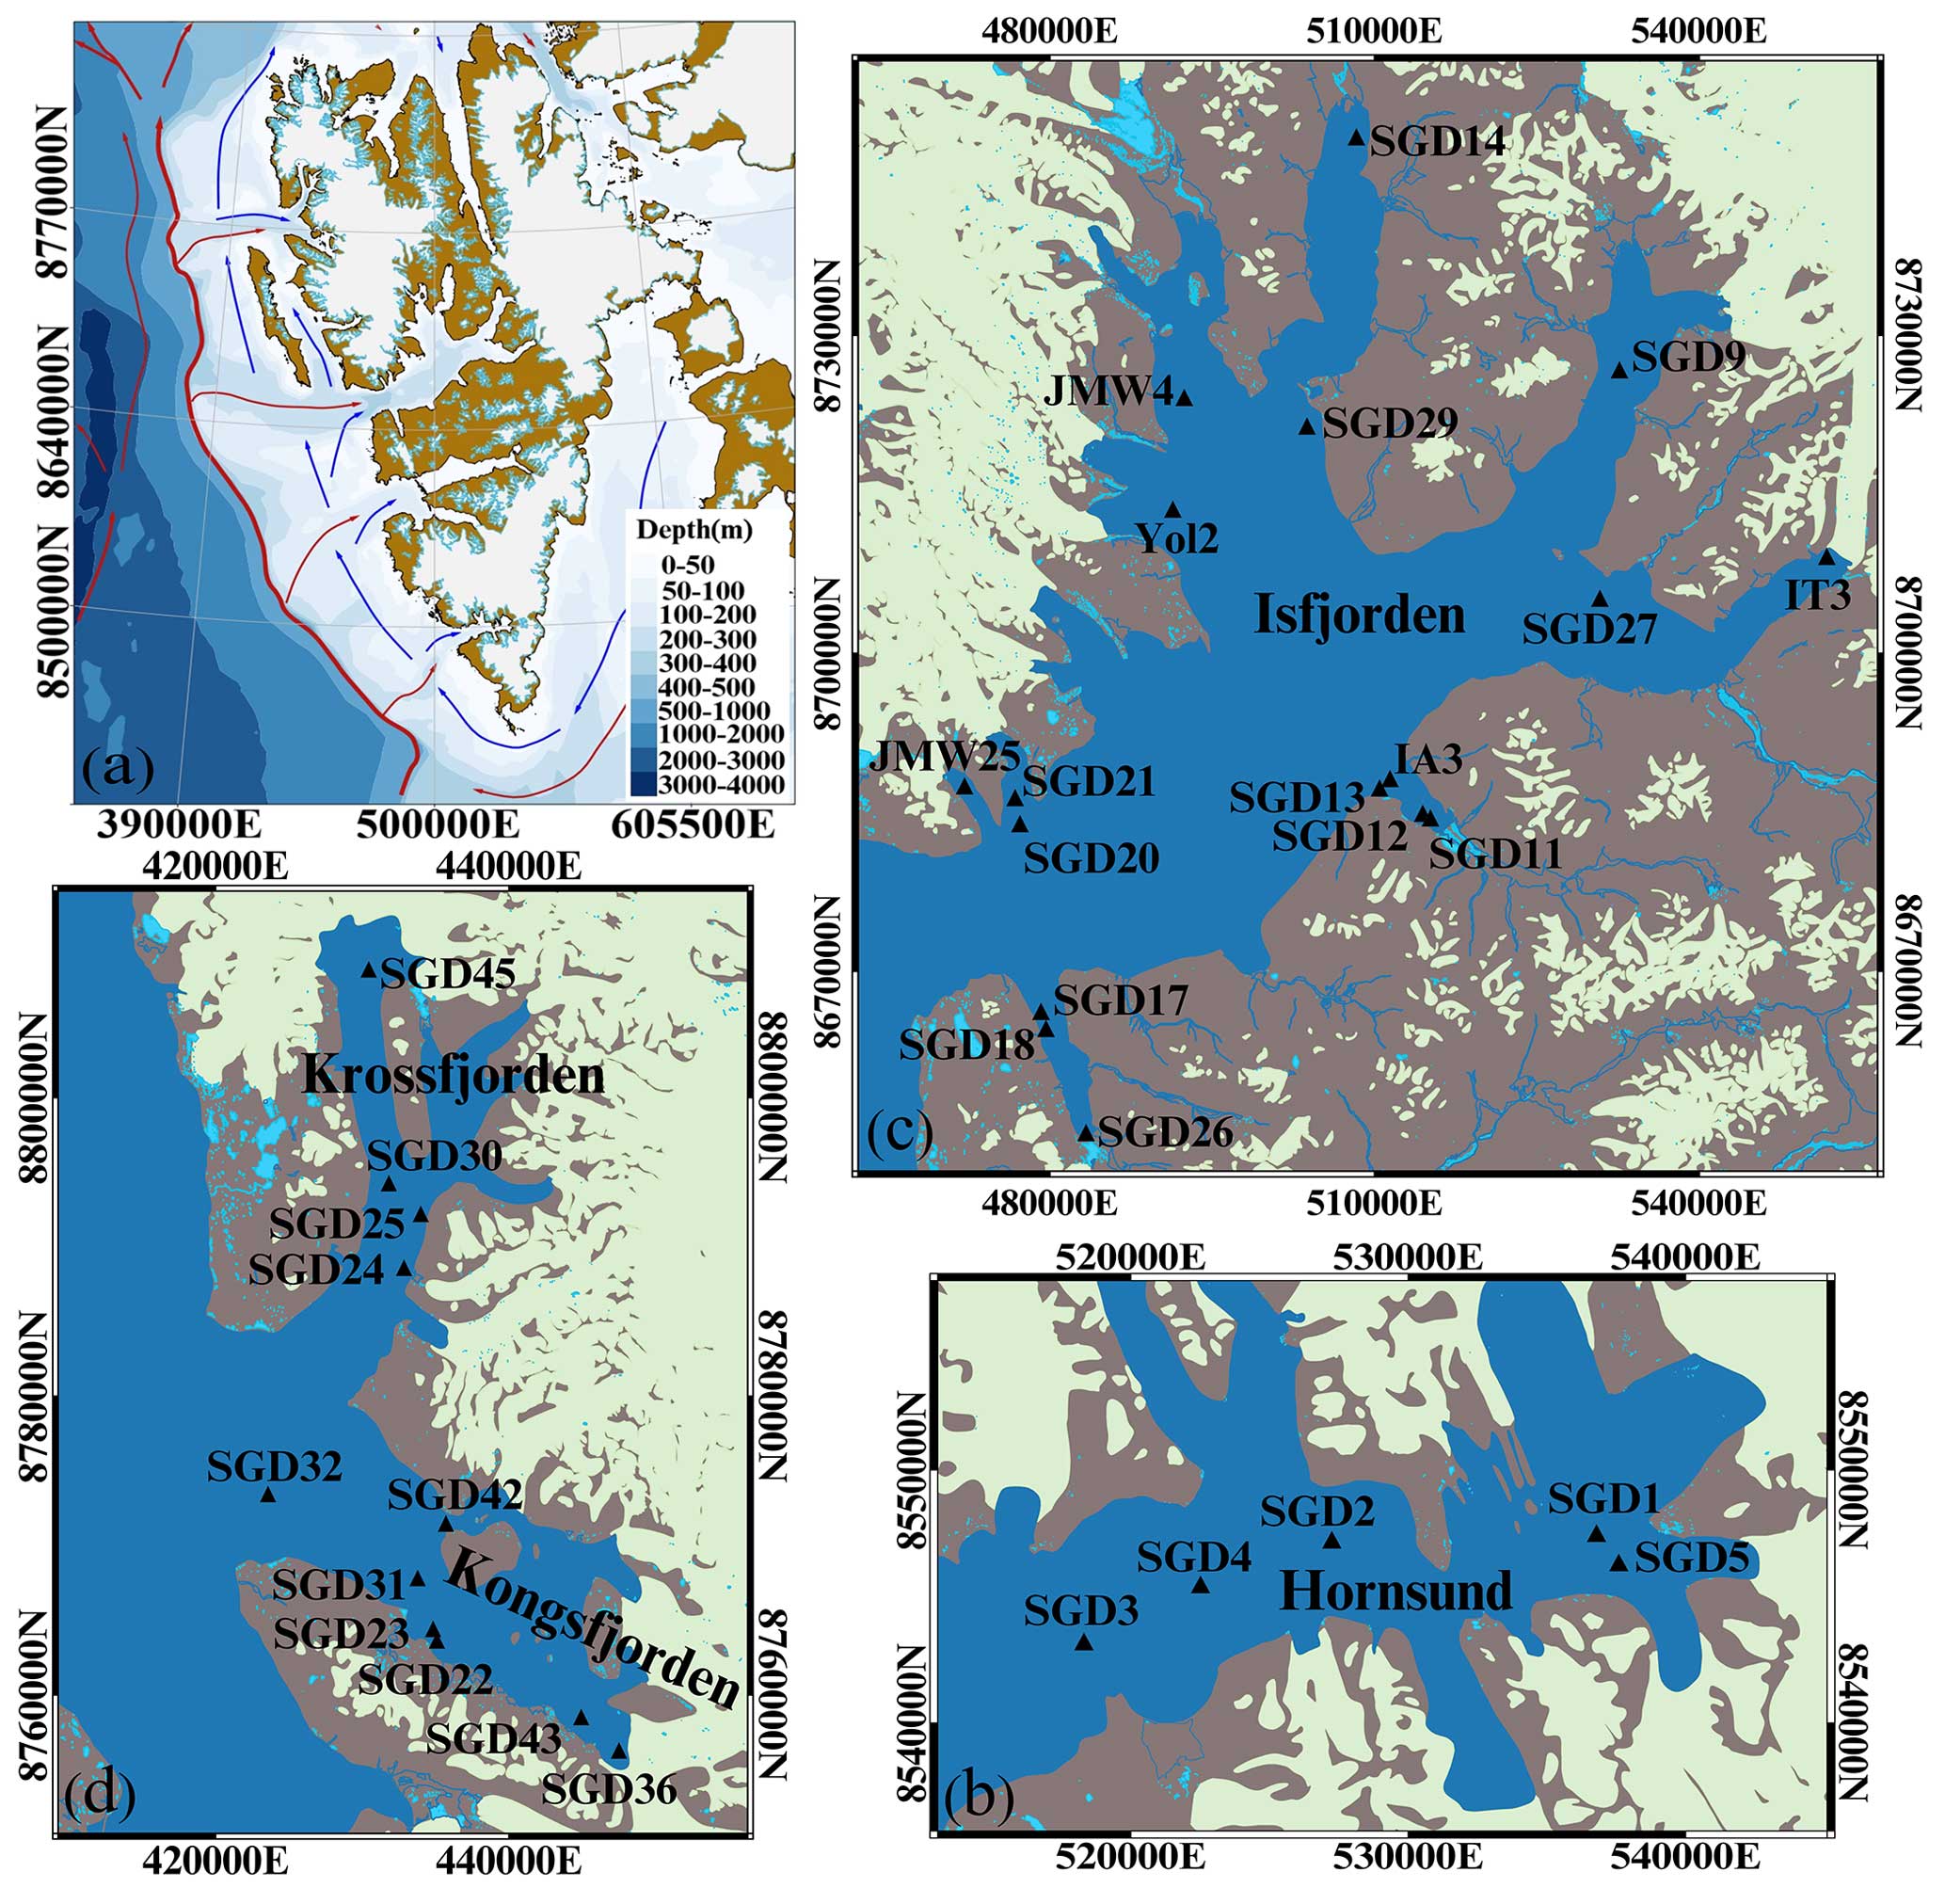
Figure 1(a) The study area, including the general map of Spitsbergen, highlighting the depths of the fjords and the surrounding Svalbard shelf (a). The warm West Spitsbergen Current and cold East Spitsbergen Current are indicated by red and blue arrows, respectively (Vihtakari, 2024, 2019). Study sites located in (b) Hornsund, (c) Isfjorden, and (d) Kongsfjorden and Krossfjorden are presented as black triangles.
2.1 Study area description
The west coast of the Svalbard archipelago (76–80° N) consists of different fjords and sub-fjords (Fig. 1). All investigated fjords (Hornsund, Isfjorden, Kongsfjorden, and Krossfjorden) are influenced by the East Spitsbergen Current, carrying cold ArW from the Barents Sea, and the West Spitsbergen Current, with warmer and more saline AtW from the Norwegian Sea (Promińska et al., 2018) (Fig. 1, Table 1). When AtW mixes with ArW, the warmer transformed Atlantic water (TAW) forms (Table 1, Cottier et al., 2005). Surface water (SW) (Table 1) is formed locally from glacial melt and river runoff and occupies the surface layer of the fjord. Intermediate water (IW) forms as a result of mixing AtW or TAW with overlying fresher SW. Local water (LW) and winter-cooled water (WCW) usually form during autumn and winter (Cottier et al., 2005; Hop et al., 2006; Cantoni et al., 2020) in depressions within the inner fjords.
Hornsund is located on the southern end of Spitsbergen and is about 30 km long and 15 km wide (Fig. 1). The fjord is divided into the main basin and inner basin (Brepollen) by a shallow sill located in the center of the fjord (Błaszczyk et al., 2019). The average depth is approximately 90 m, while the deepest section reaches 250 m (Moskalik et al., 2014). Sediments consist of mud and sandy mud, laminated mud, homogeneous to bioturbated mud, and sandy gravel (Drewnik et al., 2016). Freshwater discharge to the fjord was estimated to be approximately 1.8 km3 annually (Węsławski et al., 1991), mainly due to glacier melting (64 %), with the fastest retreating rate being in Svalbard (with an average rate of between 100 and >200 m yr−1; Grabiec et al., 2018). Other freshwater sources, such as frontal ablation and river runoff, primarily influence the upper water column (Zaborska et al., 2020). Hornsund exhibits high nutrient enrichment and experiences a strong influence from the ArW and colder coastal water (Włodarska-Kowalczuk et al., 1998). These conditions contribute to greater productivity in Hornsund compared to the warmer and saline fjords (Santos-Garcia et al., 2022).
Isfjorden stands as the largest fjord system on Spitsbergen, with about 100 km in length from the mouth to the head and up to 425 m in depth (Table 1). Isfjorden has several sub-fjords and bays. Studies conducted in Isfjorden have provided evidence of the significant impact of freshwater on the water column (McGovern et al., 2020; Finne et al., 2022). Seasonal stratification has been responsible for the retention of terrestrial carbon and nutrients within the euphotic zone and a decrease in vertical mixing during the most productive season (McGovern et al., 2020; Finne et al., 2022). The enhanced freshwater input contributes to the overall nutrient loading in the system, affecting the biogeochemical processes and ecosystem functioning.
Kongsfjorden is about 20 km long and up to 10 km wide, with an orientation from the southeast to the northwest (Promińska et al., 2017, Table 1). The depth at the mouth of the fjord is about 360 m and decreases towards the inner part, where it does not exceed 100 m (Svendsen et al., 2002). Kongsfjorden has remained sea-ice-free since 2011, invoking profound biogeochemical transformations (Hop and Wiencke, 2019; Pavlova et al., 2019). Unlike other Arctic fjords, it experiences a distinct influence of the intrusion of warm and saline waters (Hodal et al., 2012). The inflow of AtW and ArW from one side and glacier meltwater from another (Halbach et al., 2019) leads to amplified nutrients and carbon cycling, enhanced net primary productivity, and oxygen depletion in deeper waters (Santos-Garcia et al., 2022).
Krossfjorden exhibits a northeast-to-southwest orientation, stretching approximately 30 km in length and reaching widths from 3 to 6 km (Table 1). The total volume of Krossfjorden is 25 km3, and its maximum depth is 373 m (Svendsen et al., 1992). Krossfjorden, characterized by a colder spring and less intrusion of AtW, shares similar conditions with the inner part of Kongsfjorden. However, it experiences a shorter period of glacier retreat compared to Kongsfjorden (Gamboa-Sojo et al., 2022). Studies on chlorophyll and other pigment distribution in surface sediments suggest that Krossfjorden is more productive than Kongsfjorden (Singh and Krishnan, 2019).
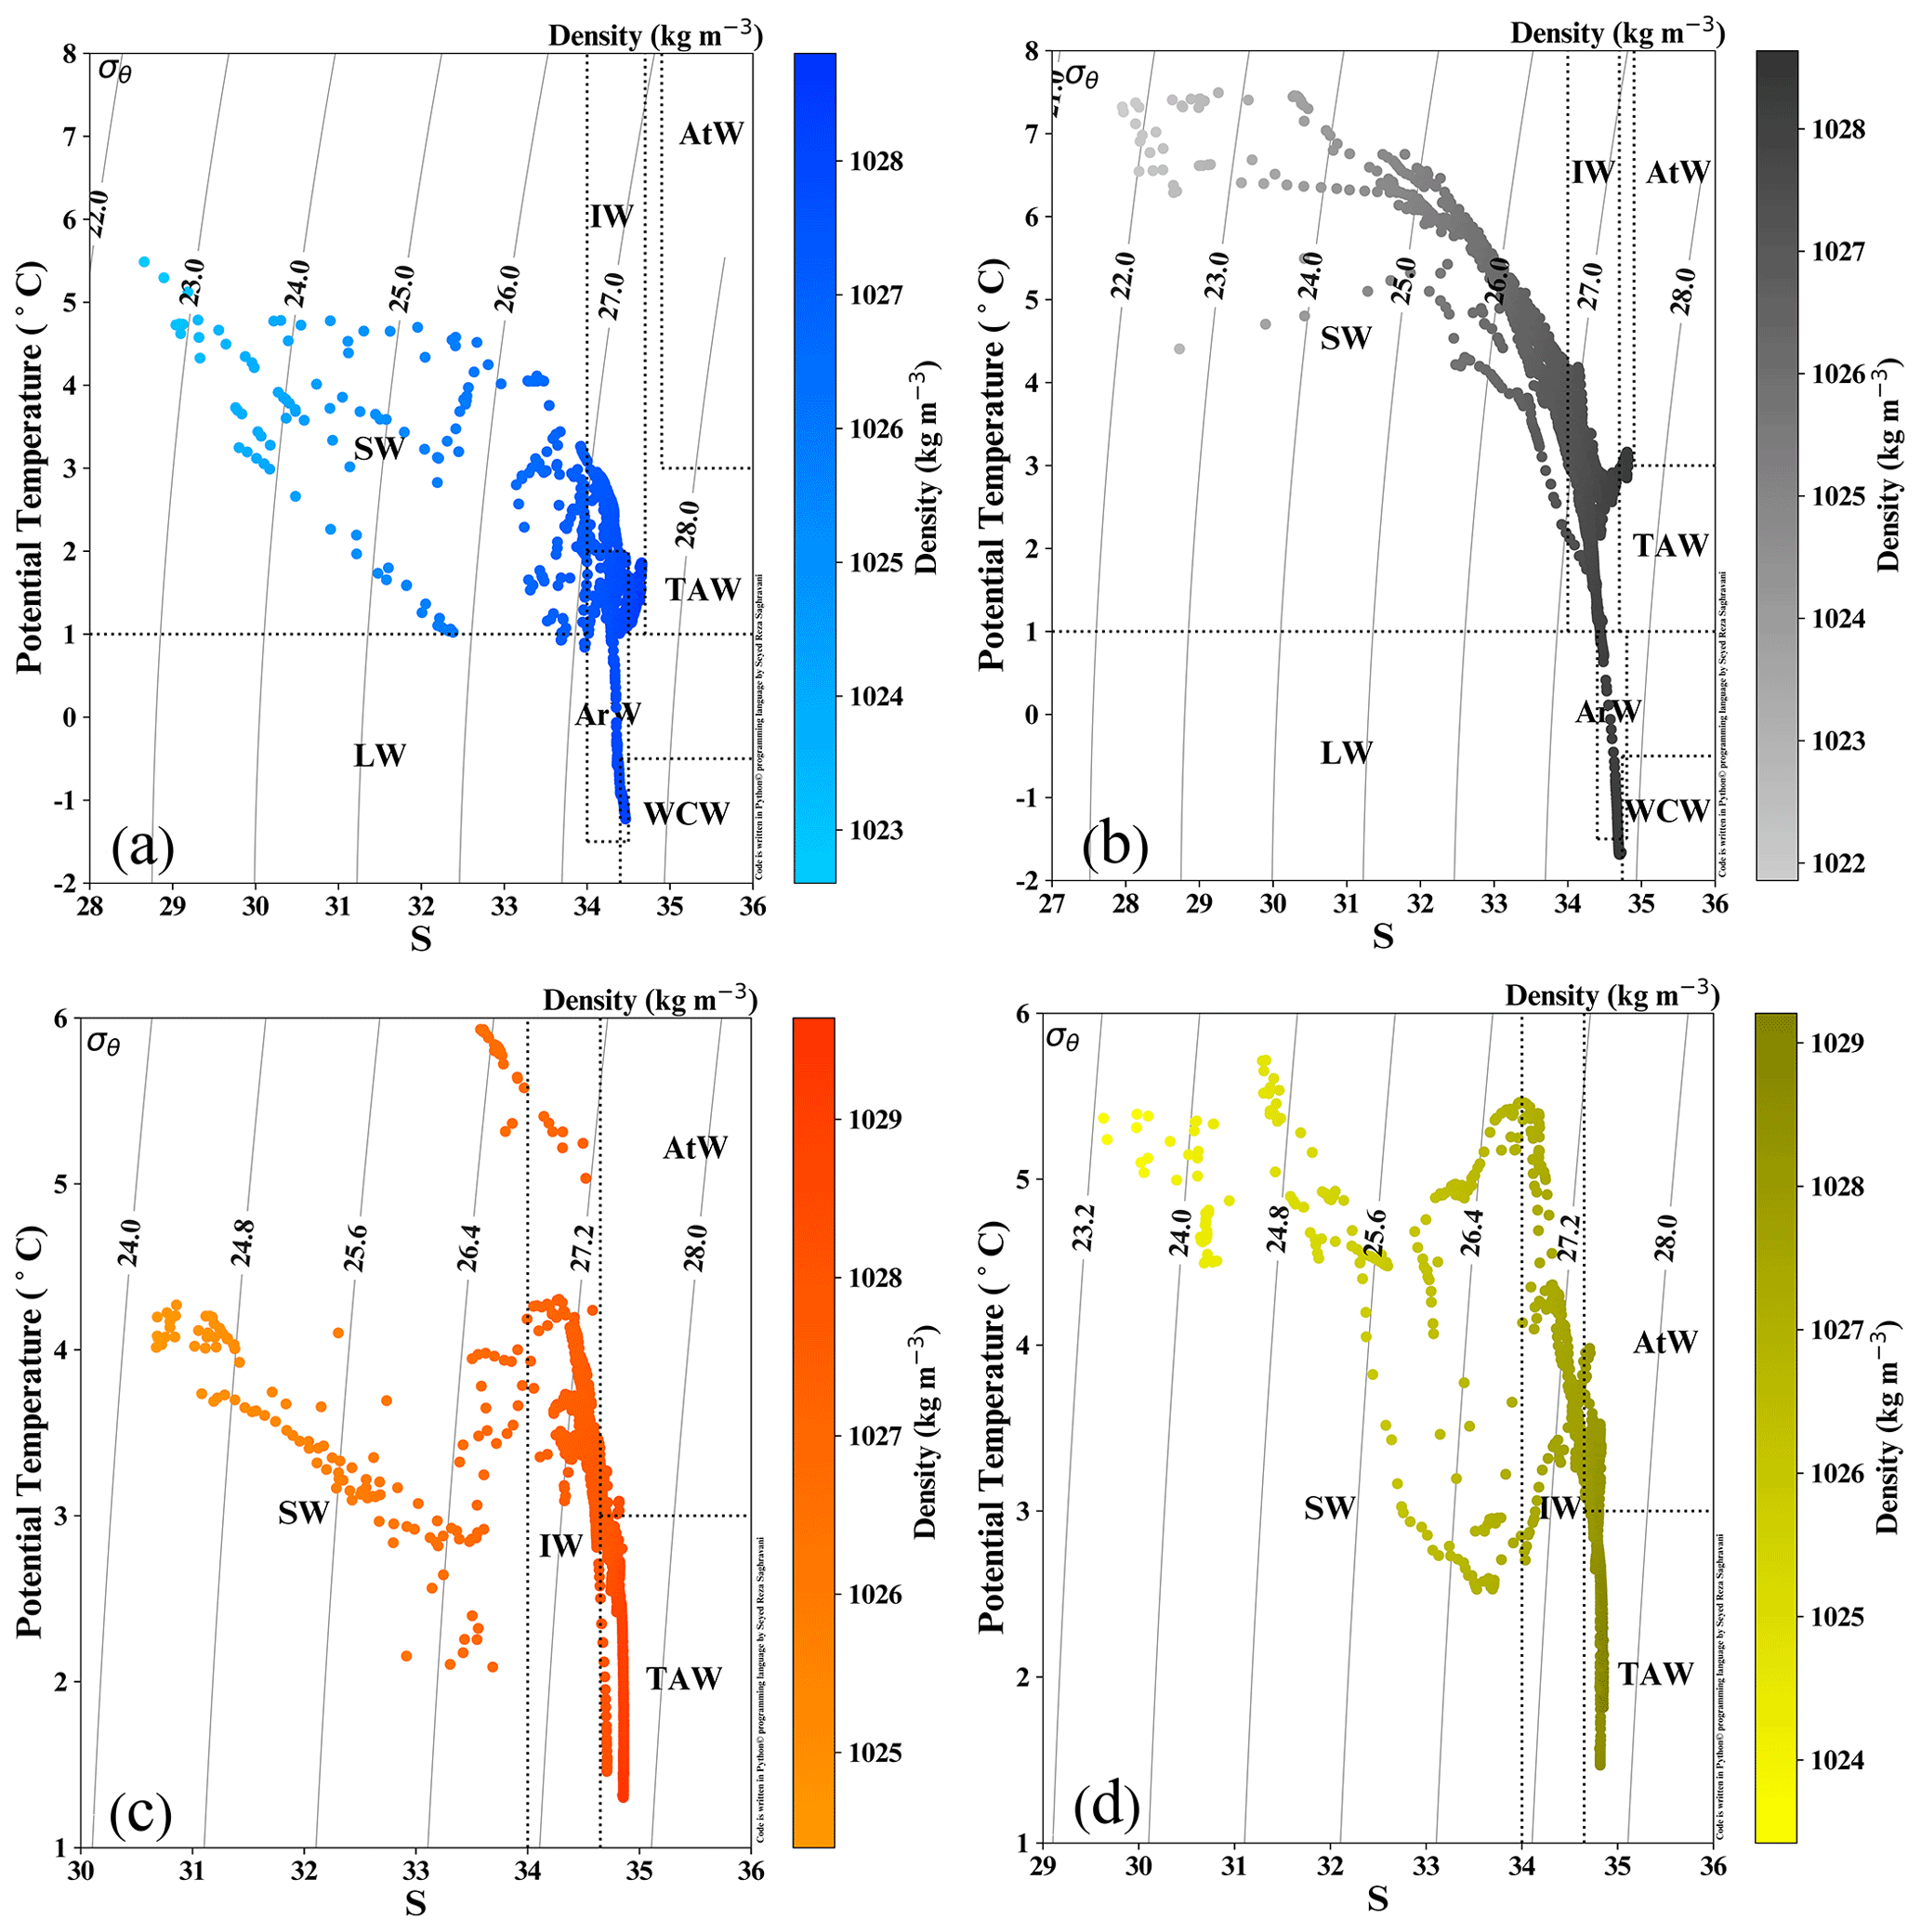
Figure 2The water mass distribution, including surface water (SW), Arctic water (ArW), winter-cooled water (WCW), intermediate water (IW), local water (LW), transformed Atlantic water (TAW), and Atlantic water (AtW) in (a) Hornsund, (b) Isfjorden, (c) Kongsfjorden, and (d) Krossfjorden.
2.2 Sampling and analyses
Sampling was carried out from 25 July to 20 August 2021 on board the R/V Oceania, belonging to the Institute of Oceanology, Polish Academy of Sciences (IOPAN). A towed CTD profiling system (rosette) equipped with 10 L Niskin bottles was used to collect water samples from three to five depths at each location (selected based on salinity and oxygen profiles). Temperature (T), salinity (S), and oxygen (O2) concentration were measured in situ using a Sea-Bird Scientific SBE 911plus CTD profiler equipped with oxygen module SBE 43 (calibrated prior to the cruise). The accuracy of T, S, and O2 is equal to ±0.002 °C, ±1 %, and ±0.015 %, respectively. The results of averaged data for 0.5 m intervals are presented in the database. Temperature and salinity from layers where discrete samples were collected were used for an oceanographic classification of water masses.
2.2.1 Seawater sampling
Exactly 10 mL of seawater was filtered (cellulose acetate filters with a pore size of 0.45 µm), frozen in a pre-cleaned high-density polyethylene (PE) bottle, and stored at −20 °C for further nutrient analysis. The seawater for DIC analysis was transferred into the pre-cleaned 250 mL glass bottle and poisoned with 100 µL saturated HgCl2. Furthermore, 20 mL of seawater for DOC and TN analysis was filtered through pre-combusted 0.45 µm MN GF-5 filters, transferred into the pre-combusted glass bottle, and acidified to pH ∼2 with HClconc. to stop mineralization and remove carbonates.
2.2.2 Pore water sampling
GEMAX and Nemisto gravity corers were used to collect up to approximately 40 cm long sediment cores. However, the retrieval of the cores in some locations was not possible due to the consolidated seafloor. Additionally, the pore water extracted from some sediment cores was insufficient to perform all analyses. Pore water was extracted from sediments through pre-drilled holes in the core liners via Rhizon® samplers (Rhizosphere; diameter of 2.5 mm and mean pore size of 0.15 µm) directly after extracting the cores. Up to 5 mL of pore water was frozen in a pre-cleaned high-density polyethylene bottle and stored at −20 °C for further nutrient analysis, and approximately 2 mL of pore water was kept in PE vials for further Cl− analysis. For further DIC, DOC, and TN analysis, 12 mL of pore water was transferred into the pre-combusted glass bottle and poisoned with 50 µL saturated HgCl2. Seawater pH was measured with a WTW 3400i multi-parameter field meter that yielded an accuracy of ±0.1. The pH results are given for a reference temperature of 25 °C.
2.2.3 Chemical analyses
Nutrient concentrations were determined using a SEAL AA500 AutoAnalyzer (Seal Analytical) and applying standard photometric methods (Grasshoff et al., 2009). Quality control consists of repeated measurements of two different CRMs (QC3179 by Sigma Aldrich and HAMIL by Environment Canada). Method detection limits are 0.33 µmol L−1 for nitrate (NO), 0.27 µmol L−1 for NH, 0.1 µmol L−1 for phosphate (PO), and 0.3 µmol L−1 for dissolved silicates (Si). The accuracy of NO, NH, PO, and Si measurements was 98.8 %, 98.8 %, 99.0 %, and 100.1 %, respectively, while the precision was 0.01, 0.02, 0.01, and 0.03 µmol L−1, respectively. Chloride (Cl−) was determined by titration (Mohr's method), with a precision of 0.1 mmol L−1. The DIC analyses were carried out based on sample acidification with Apollo SciTech's AS-C6L DIC analyzer, equipped with the laser-based CO2 detector (LI-7815; Li-Cor, USA). The accuracy of DIC measurements was ensured using certified reference materials (CRMs; batch nos. 190 and 195) by Andrew Dickson (Scripps Institution of Oceanography, USA), and the precision was obtained from triplicate measurements of individual samples and was not worse than ±3 µmol L−1, with an average recovery of 99.0 %. The DOC and TN analyses were done in a TOC-L analyzer (Shimadzu) using a high-temperature (680 °C) oxidation method with Pt as the catalyst. The precision of the DOC measurements was ±4 µmol L−1; the accuracy was determined by repeated measurements of the certified reference materials (CRMs) provided by the laboratory of Dennis A. Hansell (University of Miami, USA), and the recovery was 99 %. The accuracy of the TN measurements was guaranteed using the same CRMs used to determine DOC, ad average recovery was 97 %. DON was determined by subtracting the sum of NO and from TN results.
2.3 Statistics and data analysis
All statistical analyses were carried out using Statistica (version 13), while the evaluation of the statistical significance was made using the Kruskal–Wallis test. Figure 1 was prepared using the map of Svalbard. Temperature–salinity (TS) diagrams were made using the Python programming language, while box plots were made by means of Statistica.
Table 1Salinity and temperature of various water masses in fjords. The classification was done based on Cottier et al. (2005), Nilsen et al. (2008), and Promińska et al. (2018) separately for each fjord.
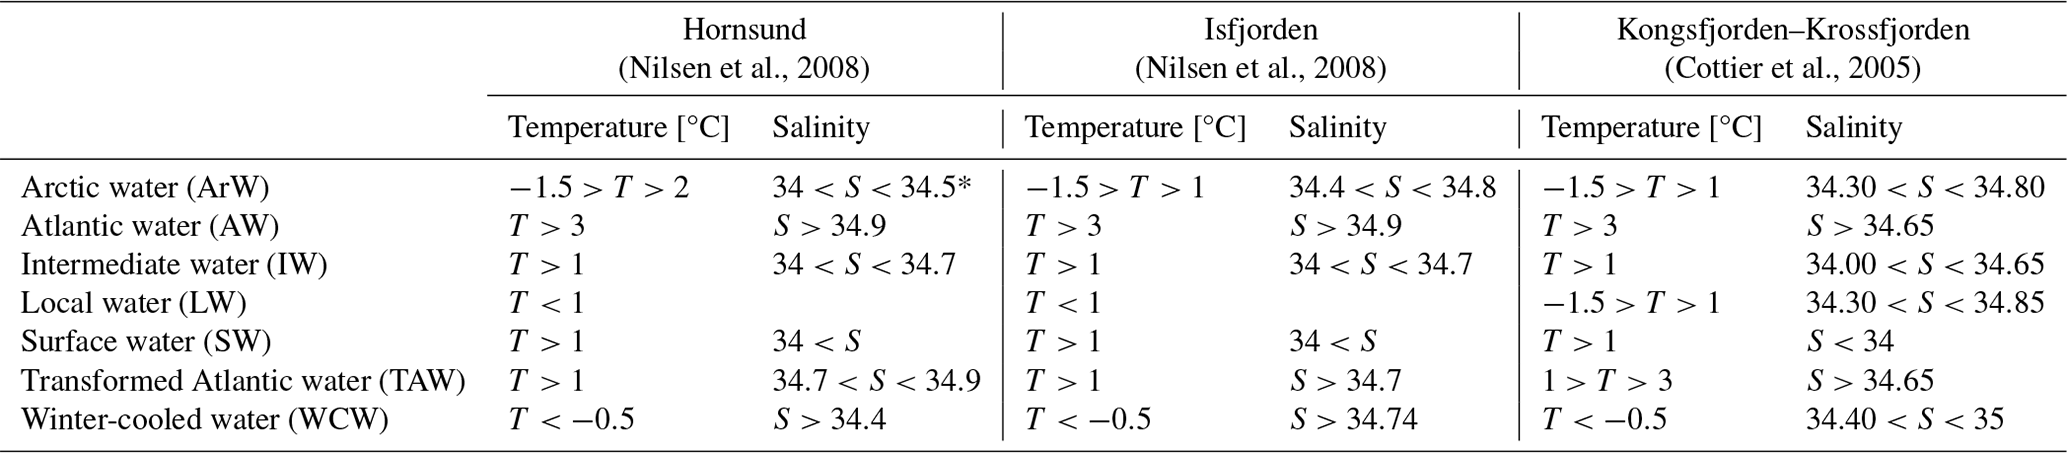
* Promińska et al. (2018).
3.1 Water mass distribution
Different water masses were distinguished within the investigated fjords (Fig. 2; Szymczycha et al., 2024). The classification was done based on Cottier et al. (2005), Nilsen et al. (2008), and Promińska et al. (2018) separately for each fjord (Table 1). All the identified water masses align with those previously recognized in Arctic regions (Rudels et al., 2000), with some interesting differences found between the fjords. In Hornsund, SW, ArW, WCW, and IW were found. In Isfjorden, SW, ArW, IW, LW, and TAW occurred. In Kongsfjorden and Krossfjorden, IW, TAW, and AT were observed. It is worth noticing that Hornsund did not show any impact of TAW and AtW.
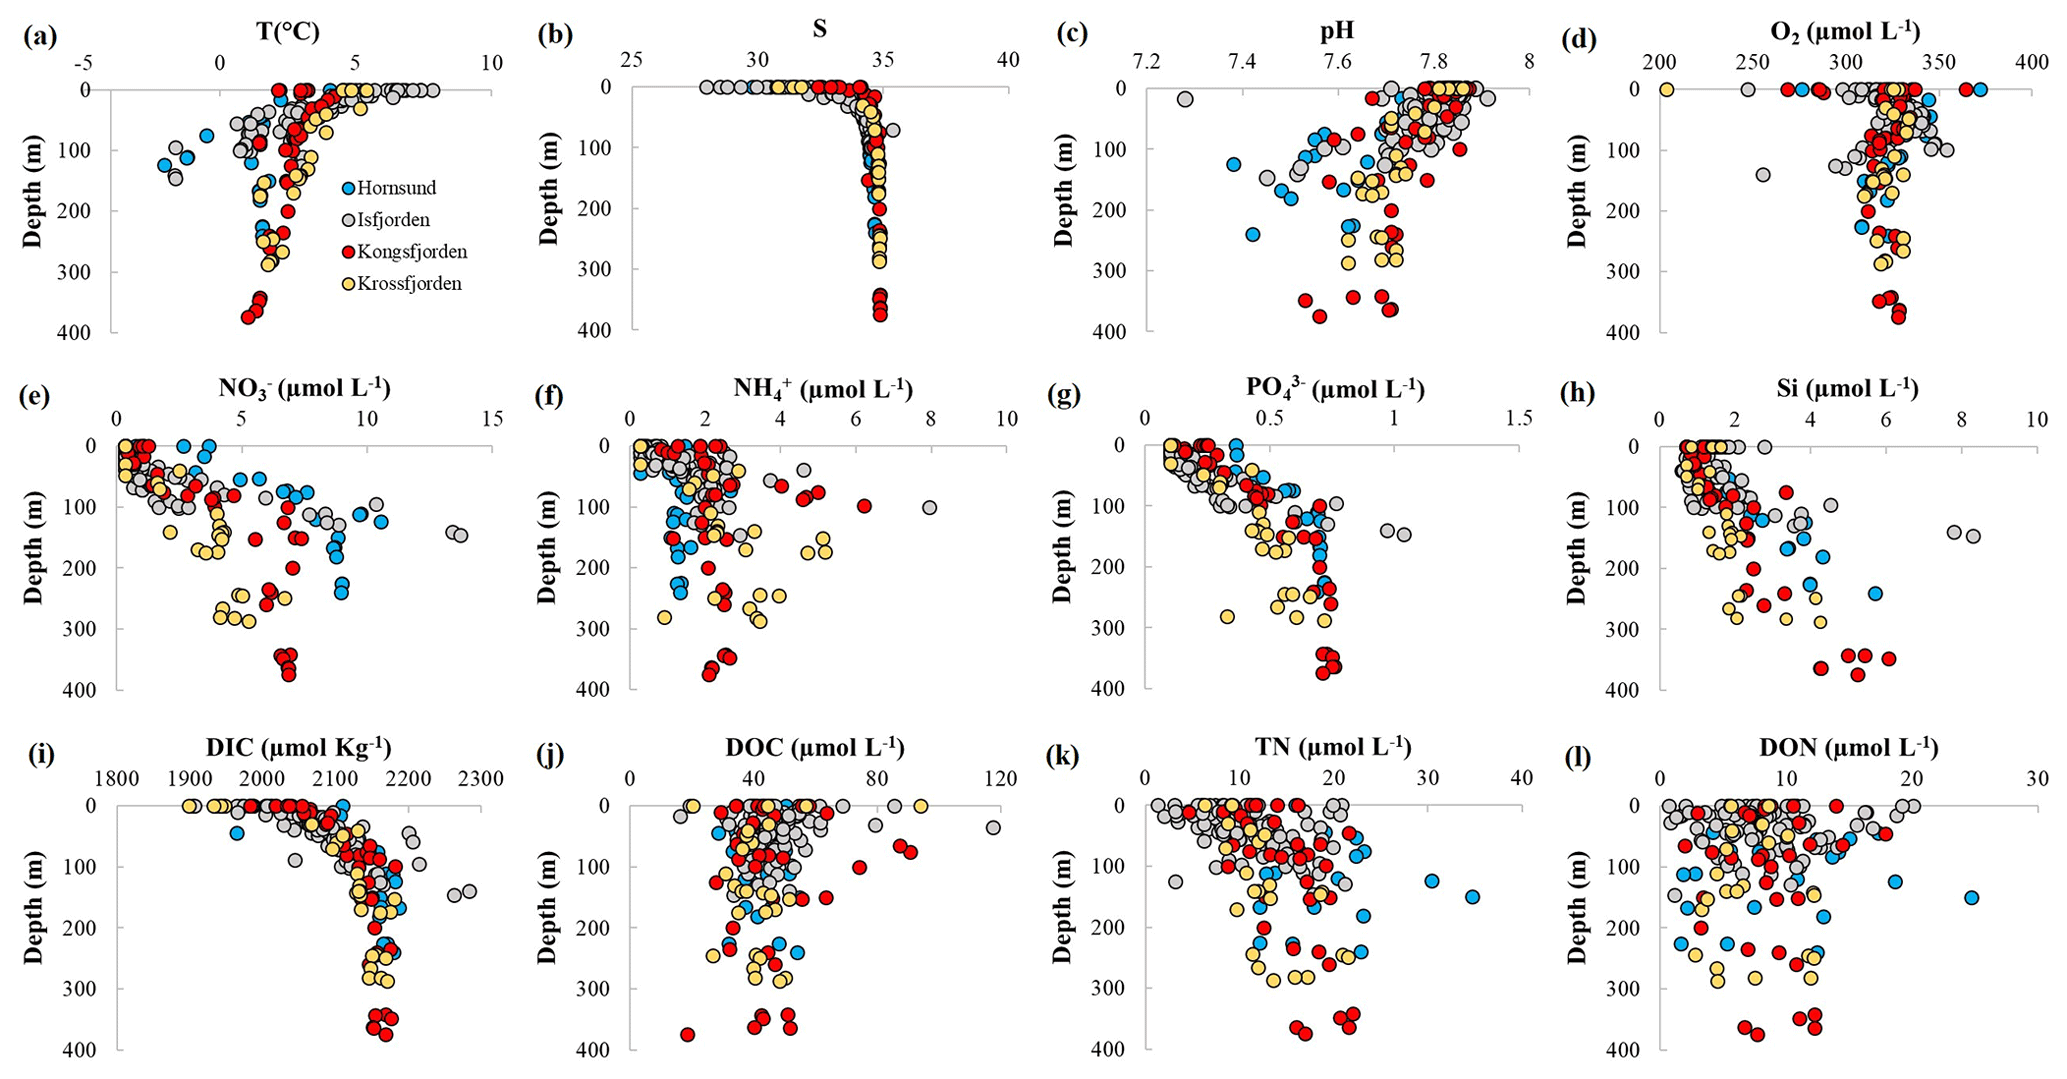
Figure 3The distribution of (a) temperature (T), (b) salinity (S), (c) pH, (d) oxygen (O2), (e) nitrate (NO), (f) ammonium (NH), (g) phosphate (PO), (h) dissolved silica (Si), (i) dissolved inorganic carbon (DIC), (j) dissolved organic carbon (DOC), (k) total dissolved nitrogen (TN), and (l) dissolved organic nitrogen (DON) in Hornsund (marked blue), Isfjorden (marked grey), Kongsfjorden (marked red), and Krossfjorden (marked yellow).
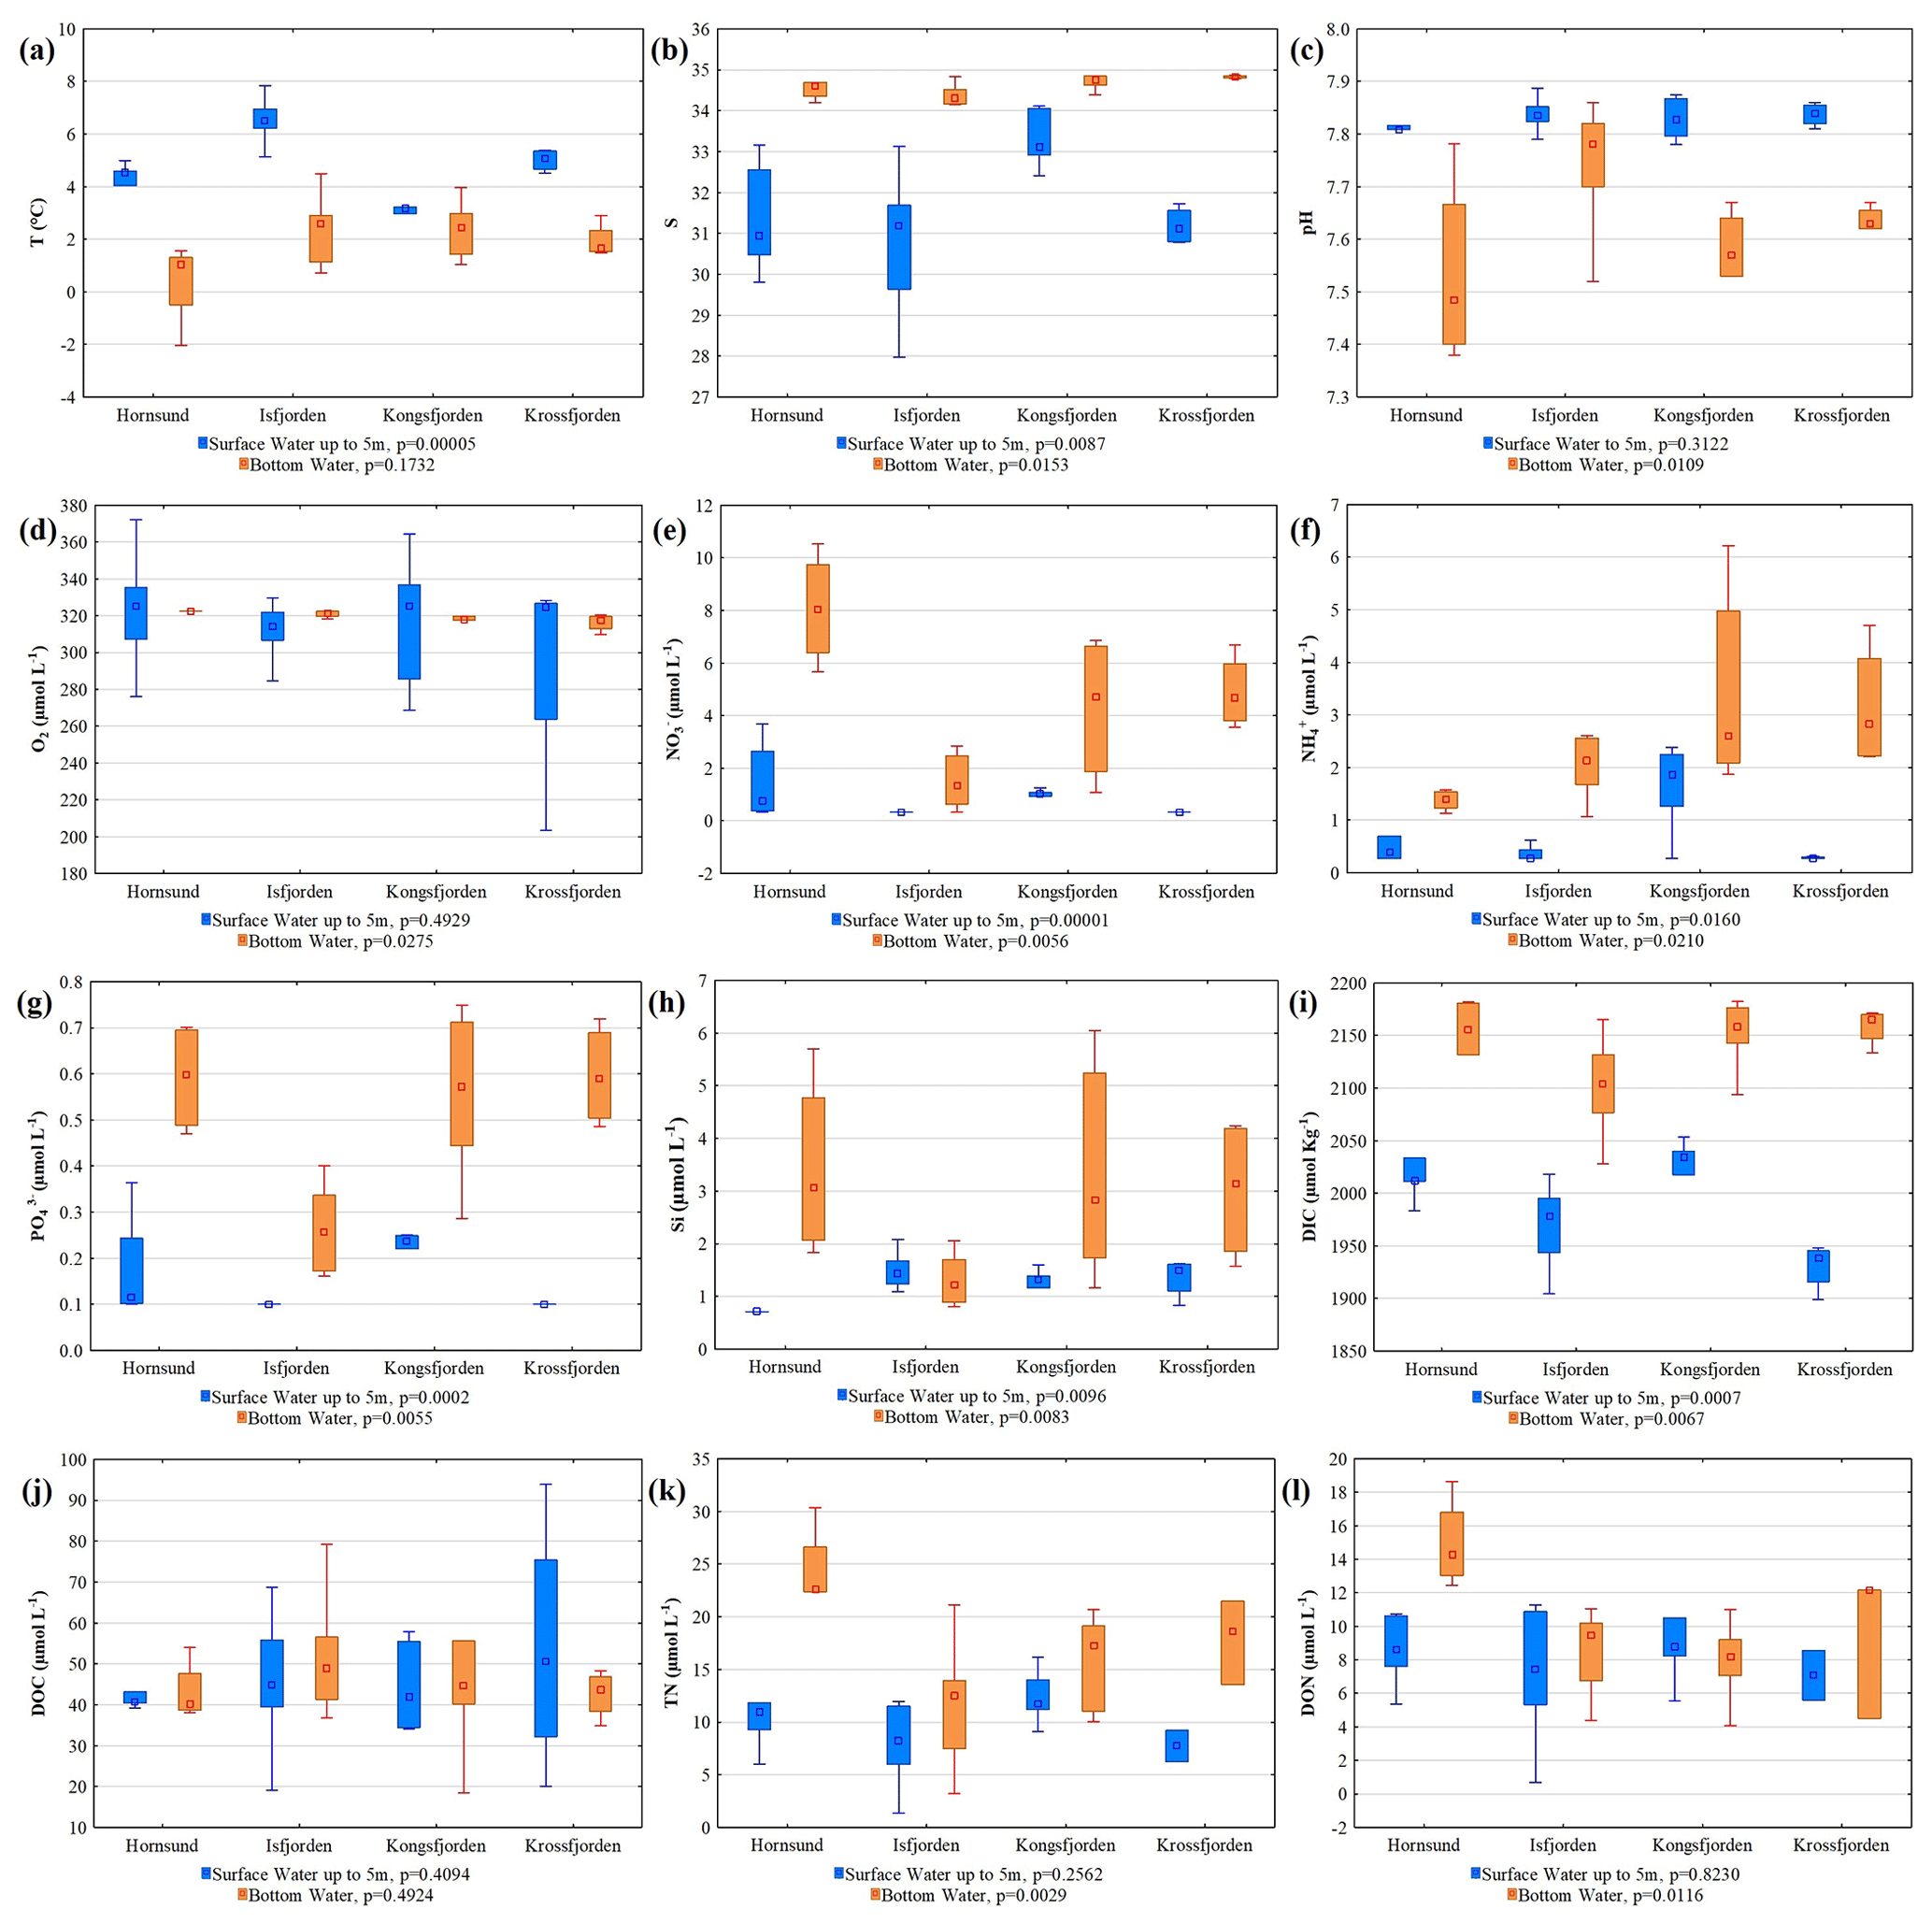
Figure 4Box plots of (a) temperature (T), (b) salinity (S), (c) pH, (d) oxygen (O2), (e) nitrate (NO), (f) ammonium (NH), (g) phosphate (PO), (h) dissolved silica (Si), (i) dissolved inorganic carbon (DIC), (j) dissolved organic carbon (DOC), (k) total dissolved nitrogen (TN), and (l) dissolved organic nitrogen (DON) in surface water (marked blue) and bottom water (marked orange) in Hornsund, Isfjorden, Kongsfjorden, and Krossfjorden. The p values indicate significant differences in the median concentration of the parameter between the investigated fjords.
3.2 Water column data
The distribution of T, S, pH, O2, NO, NH, PO, Si, DIC, DOC, TN, and DON in summer 2021 in western Spitsbergen fjords was investigated. The obtained results were divided into fjords such as Hornsund (marked blue), Isfjorden (marked grey), Kongsfjorden (marked red), and Krossfjorden (marked yellow) (Fig. 3; Szymczycha et al., 2024). In all studied fjords, similar trends were observed, such as a decrease in T and pH and an increase in S, NO, NH, PO, Si, DIC, and TN with depth, while O2, DOC, and DON were variable with depth and did not show any patterns. To show the variability in measured parameters between fjords and separate the most freshened surface waters, the results were divided into the surface water layer (the uppermost layer up to 5 m based on salinity and temperature) and the bottom water (the lowermost layer in the water column) in each fjord (Fig. 4). Generally, the temperature of the surface water was warmer than that of the bottom water and shows a significant difference between the fjords (p=0.00005), with the highest being in Isfjorden and the coldest in Kongsfjorden. The bottom water temperature was similar in all fjords (p=0.1732), however, only reaching negative values in Hornsund. Salinity was much higher in bottom water (median >34) than in surface water (median <33.5) and did not show significant differences between fjords (p<0.05) in both surface and bottom water. The pH of the surface water was high (median >7.8) and did not vary significantly between the fjords, while the pH of the bottom water was lower than the pH of the surface water and differed significantly between the fjords (p=0.0109). The median concentration of O2 in both surface and bottom water was comparable and ranged from 308.8 to 333.8 µmol L−1. NO, NH, PO, and DIC showed a significant difference in the median concentration between surface and bottom water and significantly varied between fjords in both water types (p<0.05). Si showed a pattern similar to that of the other nutrients; however, in Isfjorden, no significant change was observed between the surface and bottom water. DOC did not change substantially between fjords and between water types. Interestingly, DOC, TN, and DON showed similar behavior in all fjords.
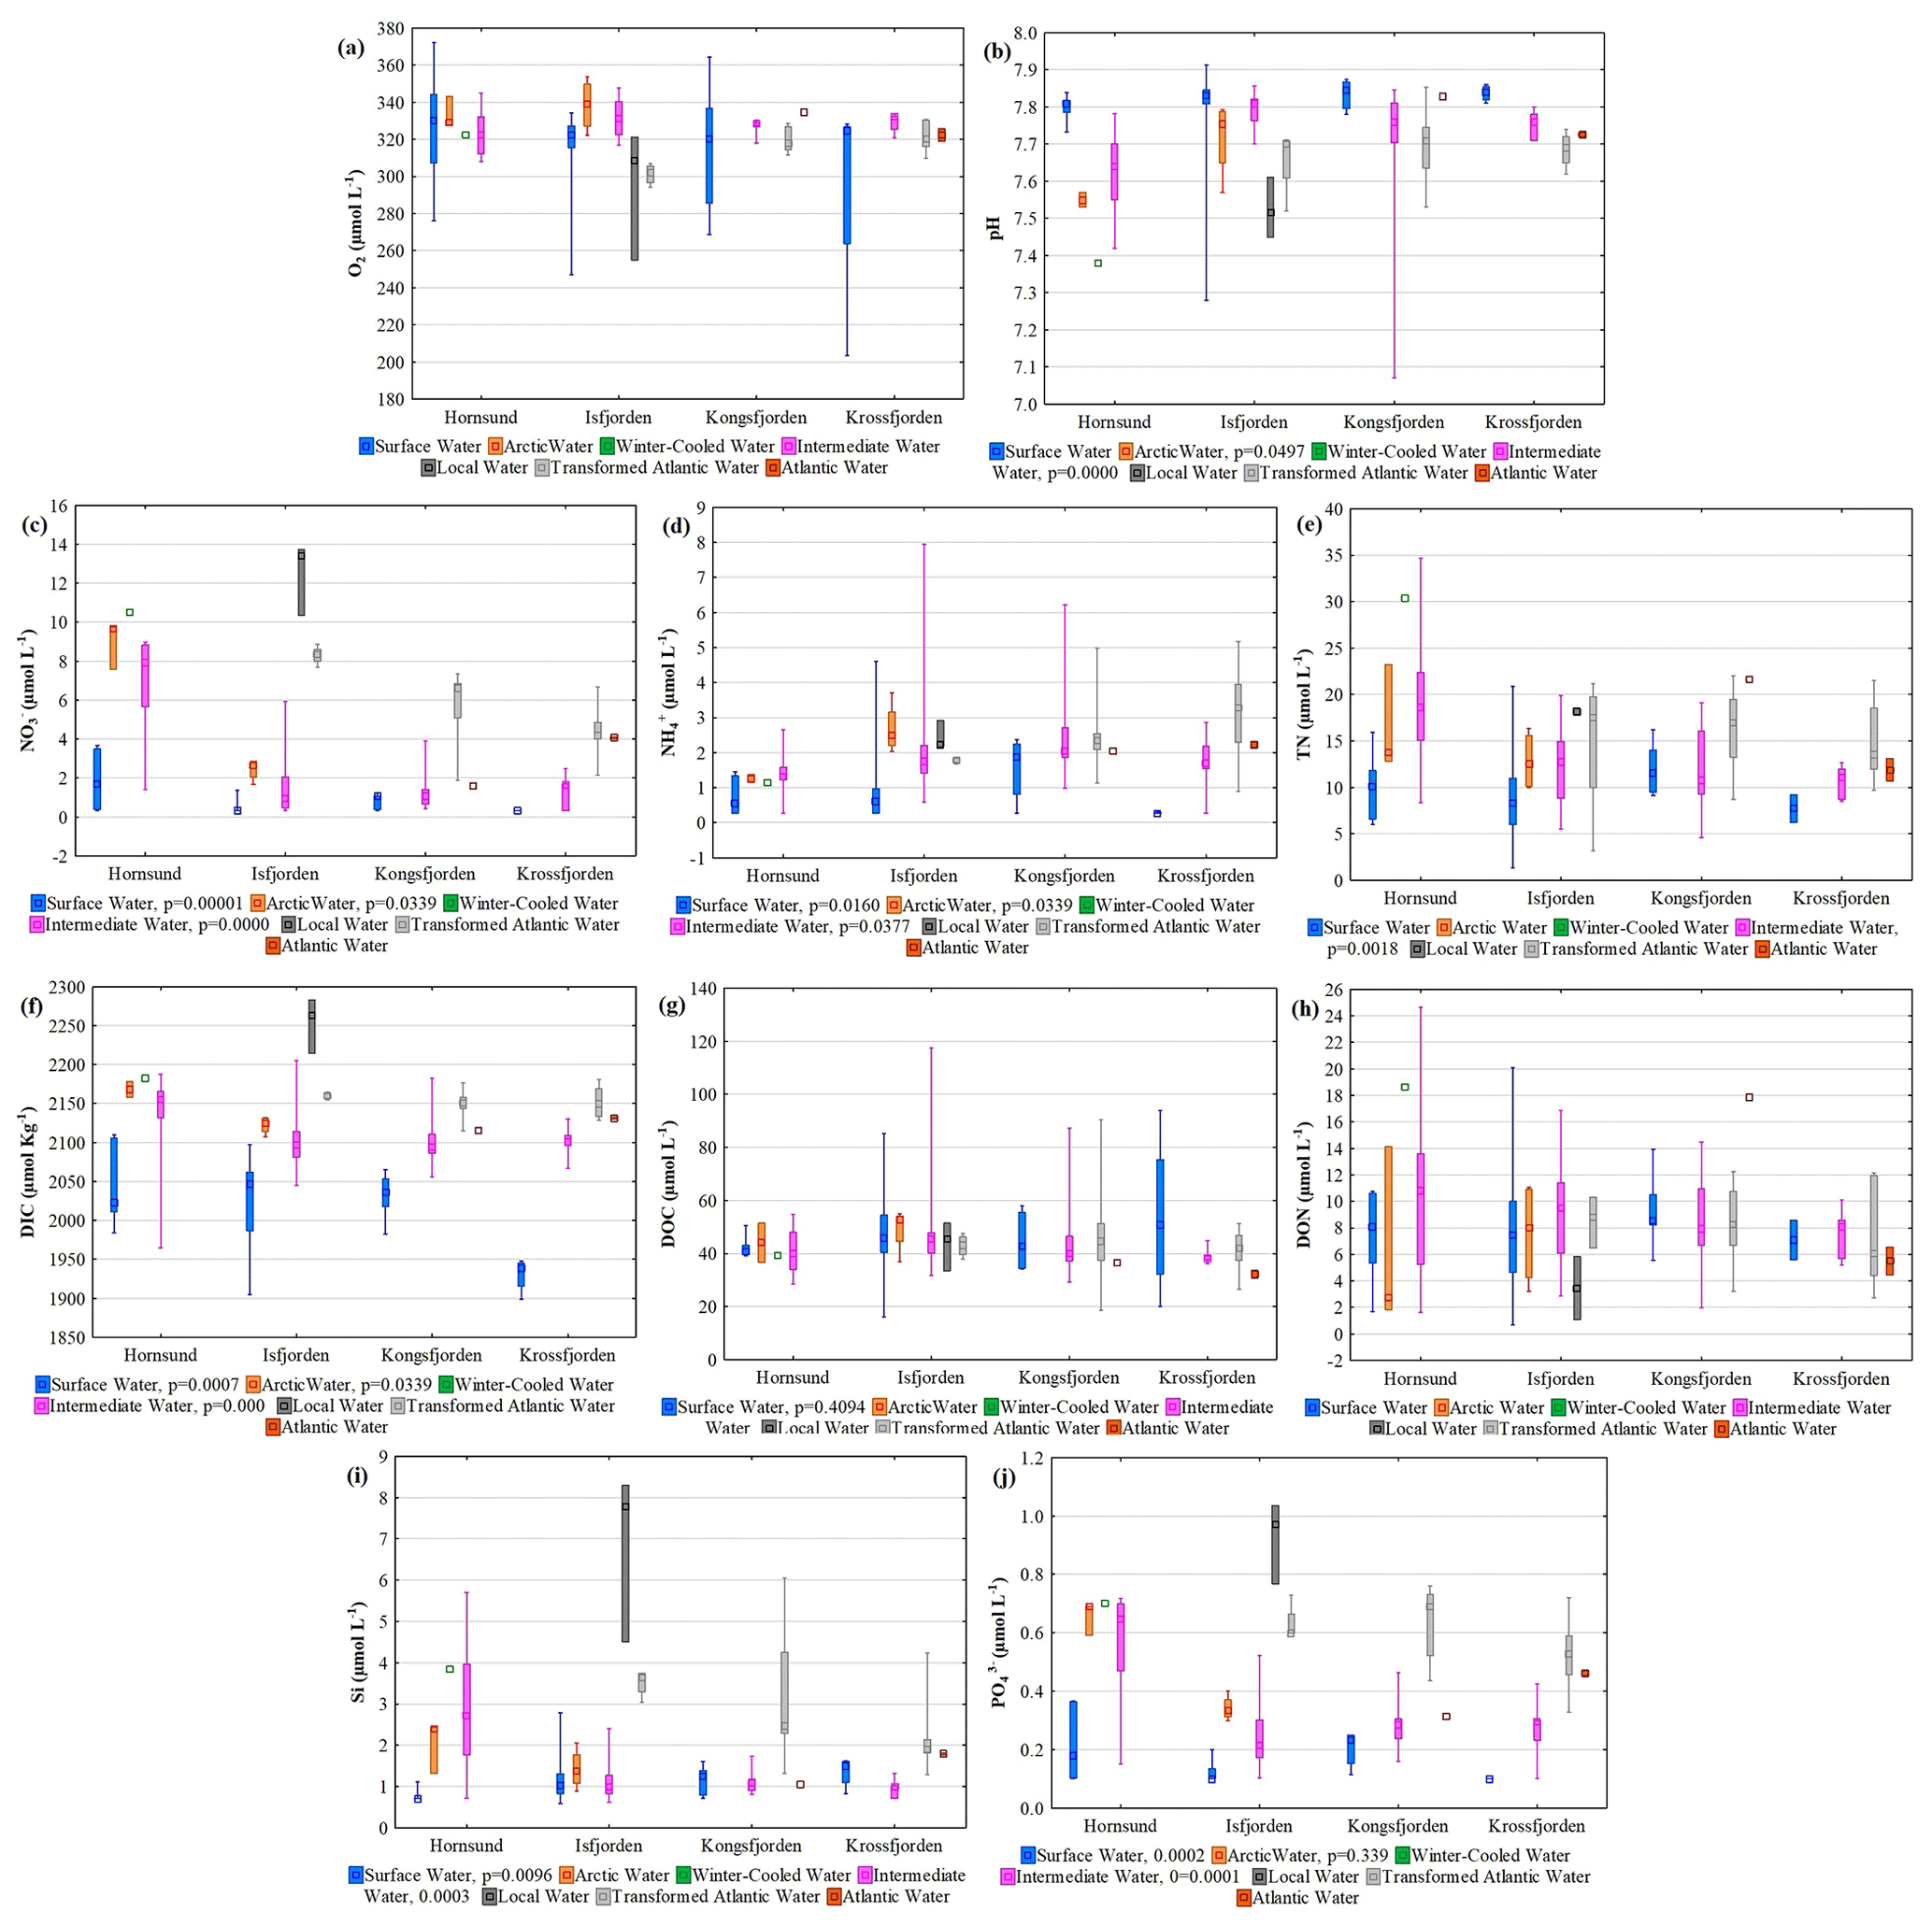
Figure 5(a) Oxygen (O2), (b) pH, (c) nitrate (NO), (d) ammonium (NH), (e) total dissolved nitrogen (TN), (f) dissolved inorganic carbon (DIC), (g) dissolved organic carbon (DOC), (h) dissolved organic nitrogen (DON), (i) dissolved silica (Si), and (j) phosphate (PO) in surface water (marked as blue), Arctic water (marked orange), winter-cooled water (marked green), intermediate water (marked pink), local water (marked dark grey), transformed Atlantic water (marked light grey), and Atlantic water (marked red) in Hornsund, Isfjorden, Kongsfjorden, and Krossfjorden. The p values indicate significant differences in the median concentration of the parameter between the investigated fjords, presented only if statistically significant.
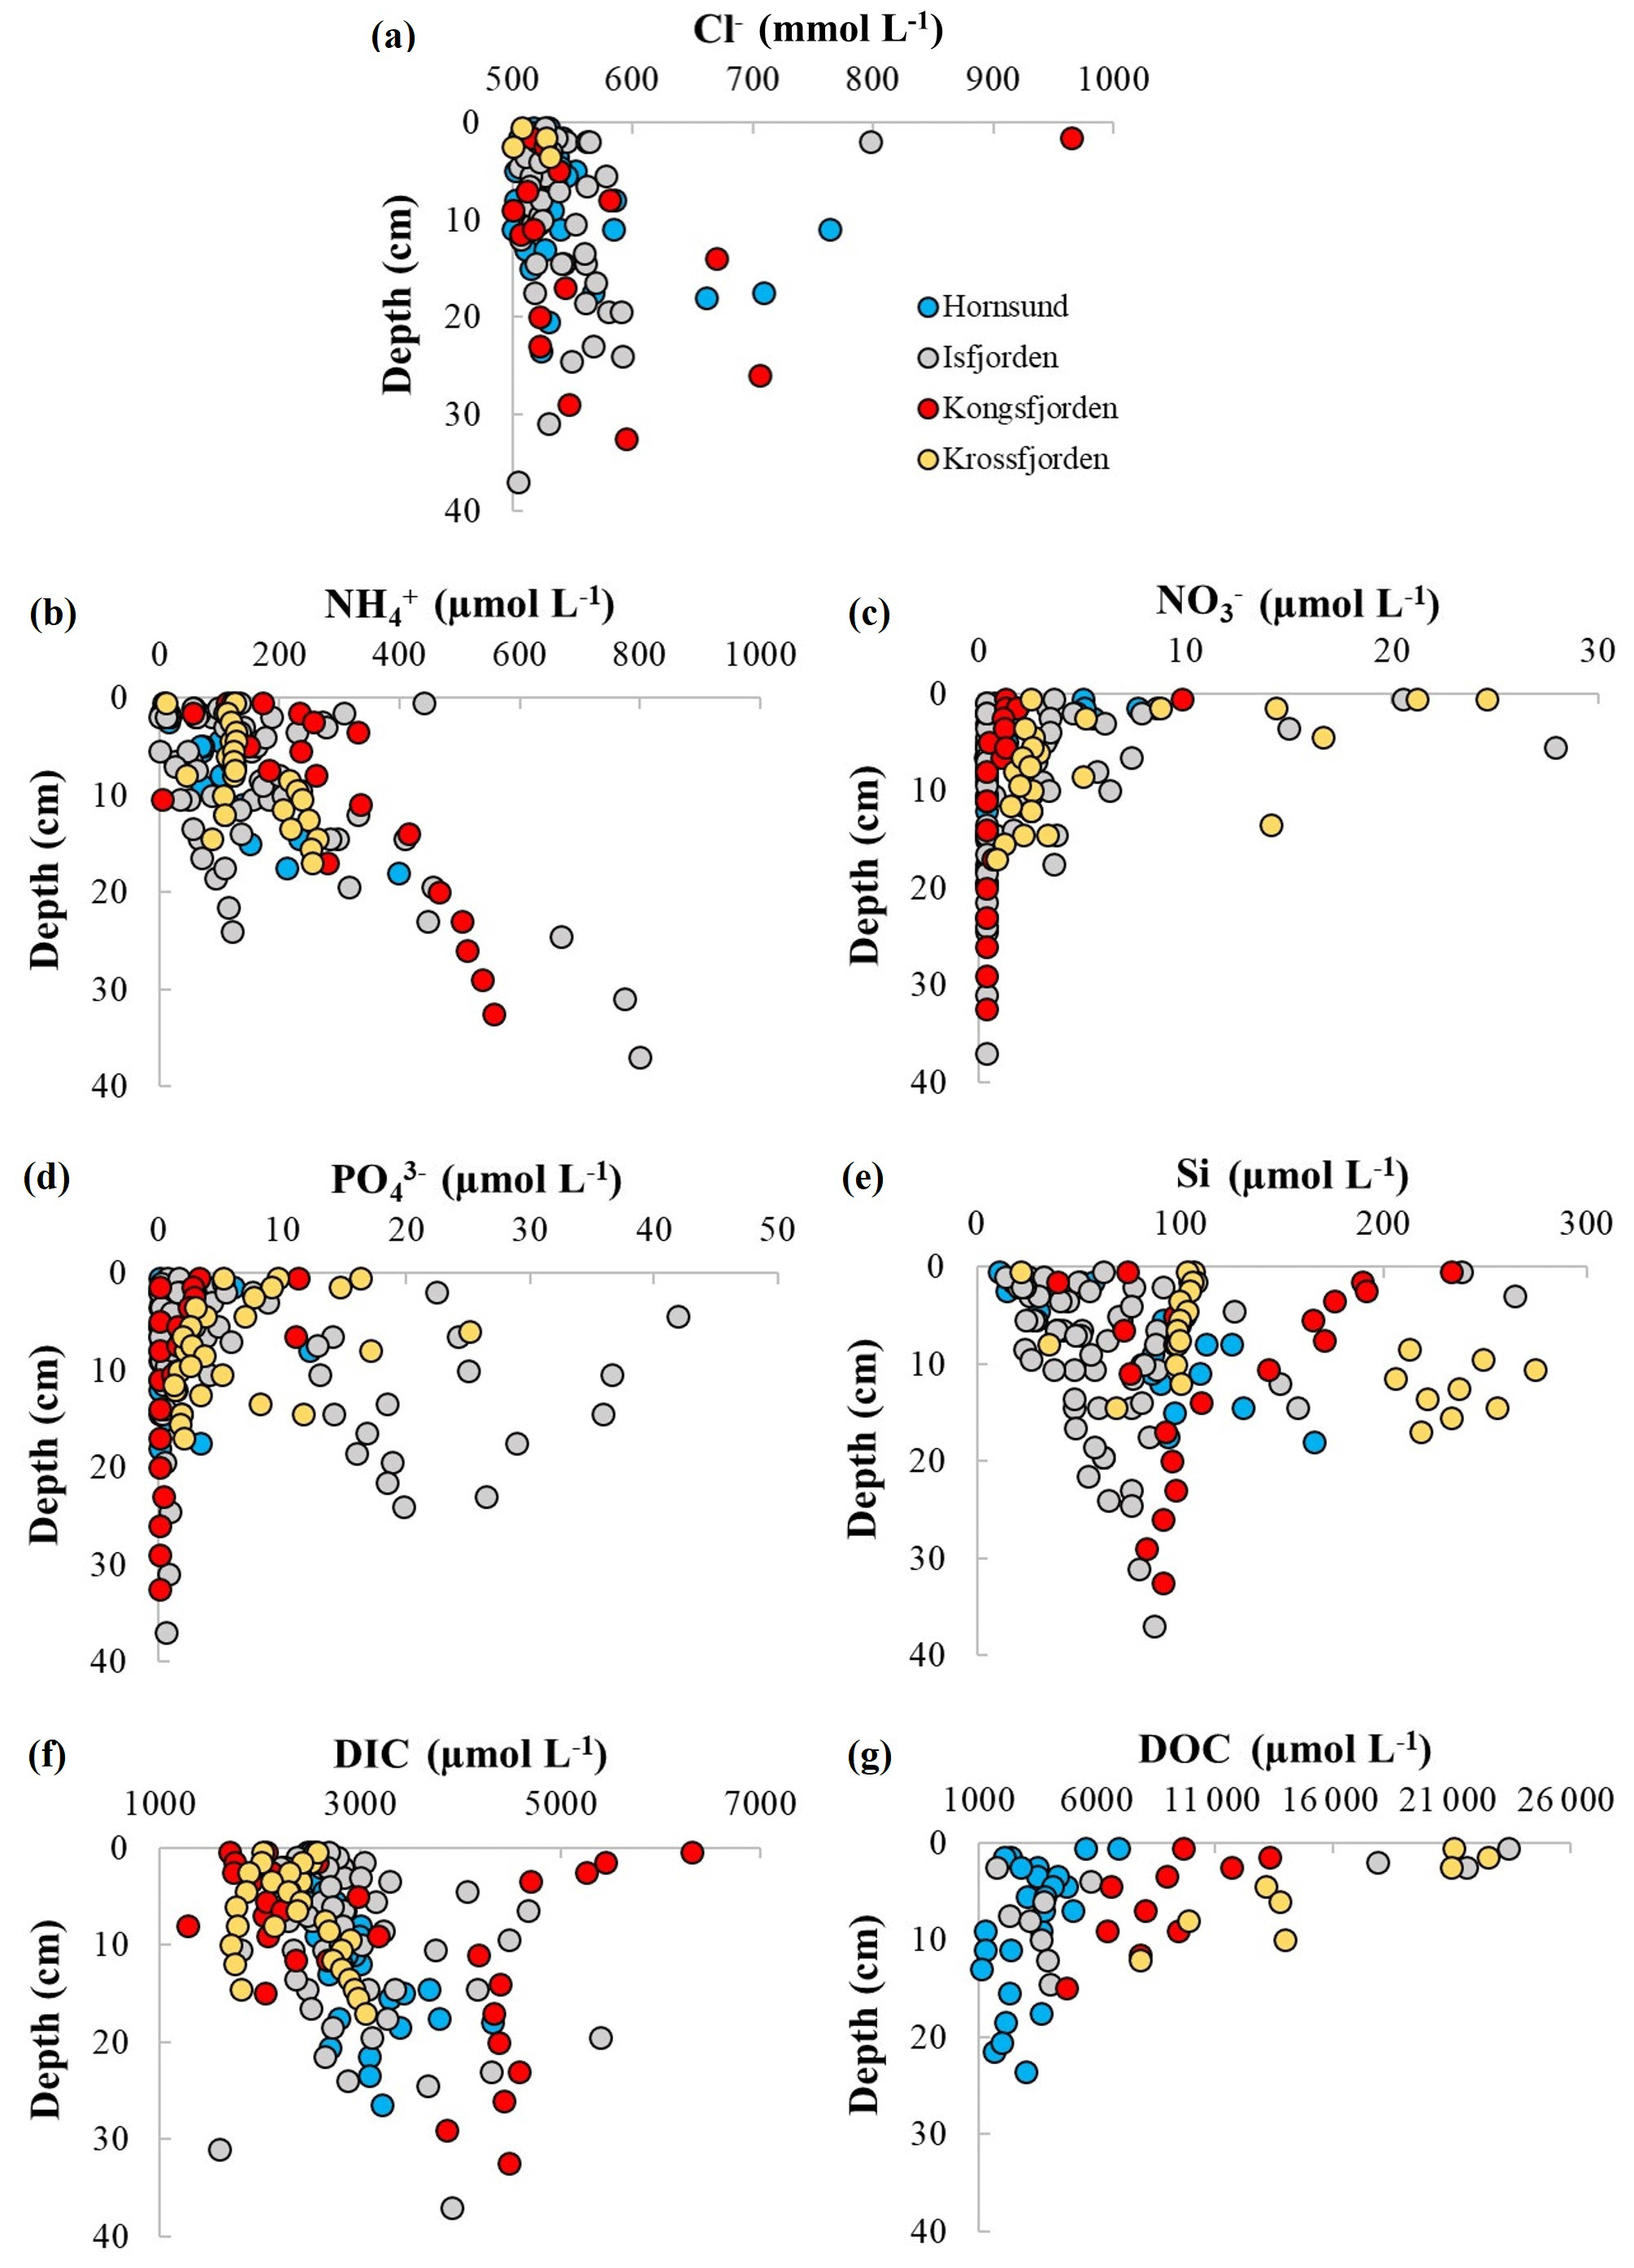
Figure 6Distribution of (a) chloride (Cl−), (b) nitrate (NO), (c) ammonium (NH), (d) phosphate (PO), (f) dissolved silica (Si), (g) dissolved inorganic carbon (DIC), and (h) dissolved organic carbon (DOC) in pore water in Hornsund (marked blue), Isfjorden (marked grey), Kongsfjorden (marked red), and Krossfjorden (marked yellow).
3.3 Biogeochemistry of the water masses
In general, all fjord systems are transition zones between land and sea, resulting in complex and dynamic environments (Schlegel et al., 2023). The west Spitsbergen fjords are highly stratified (Fig. 3) and provide a pathway for the exchange of heat, salt, nutrients, and dissolved carbon between near-glacier waters and adjacent coastal regions (Hopwood et al., 2020). These coastal regions are additionally under varying influence of the East Spitsbergen Current and the West Spitsbergen Current, which bring cold ArW and warmer and more saline AtW, respectively. It is worth mentioning that the West Spitsbergen Current, in addition to transporting the majority of heat, also transports carbon that supplies plan (Menze et al., 2020). However, the West Spitsbergen Current along its way up to Kongsfjorden depletes in nutrients (Smoła et al., 2017), and, therefore, its influence on Kongsfjorden will be different from that on the Isfjorden. Thus, understanding the biogeochemical processes in the fjords and characterizing the differences among them is not possible without a detailed understanding of the water circulation. To characterize the distribution of T, S, pH, O2, NO, NH, PO, Si, DIC, DOC, TN, and DON in the investigated fjords, we used the Kruskal–Wallis test to characterize the differences in the concentrations of these constituents between different water masses within and between investigated fjords (Fig. 5). The p value is presented only if there was a significant difference in the median concentration of the parameter considered between the investigated fjords. SW, ArW, and IW were characterized by different compositions of most of the measured parameters, such as NO, NH, PO, Si, and DIC between fjords. Besides NH, Arctic water is richer in nutrients and DIC in Hornsund in comparison to Isfjorden. However, LW, which was only observed in Isfjorden, was characterized by the highest concentration of NO, PO, Si, and DIC between all water masses.
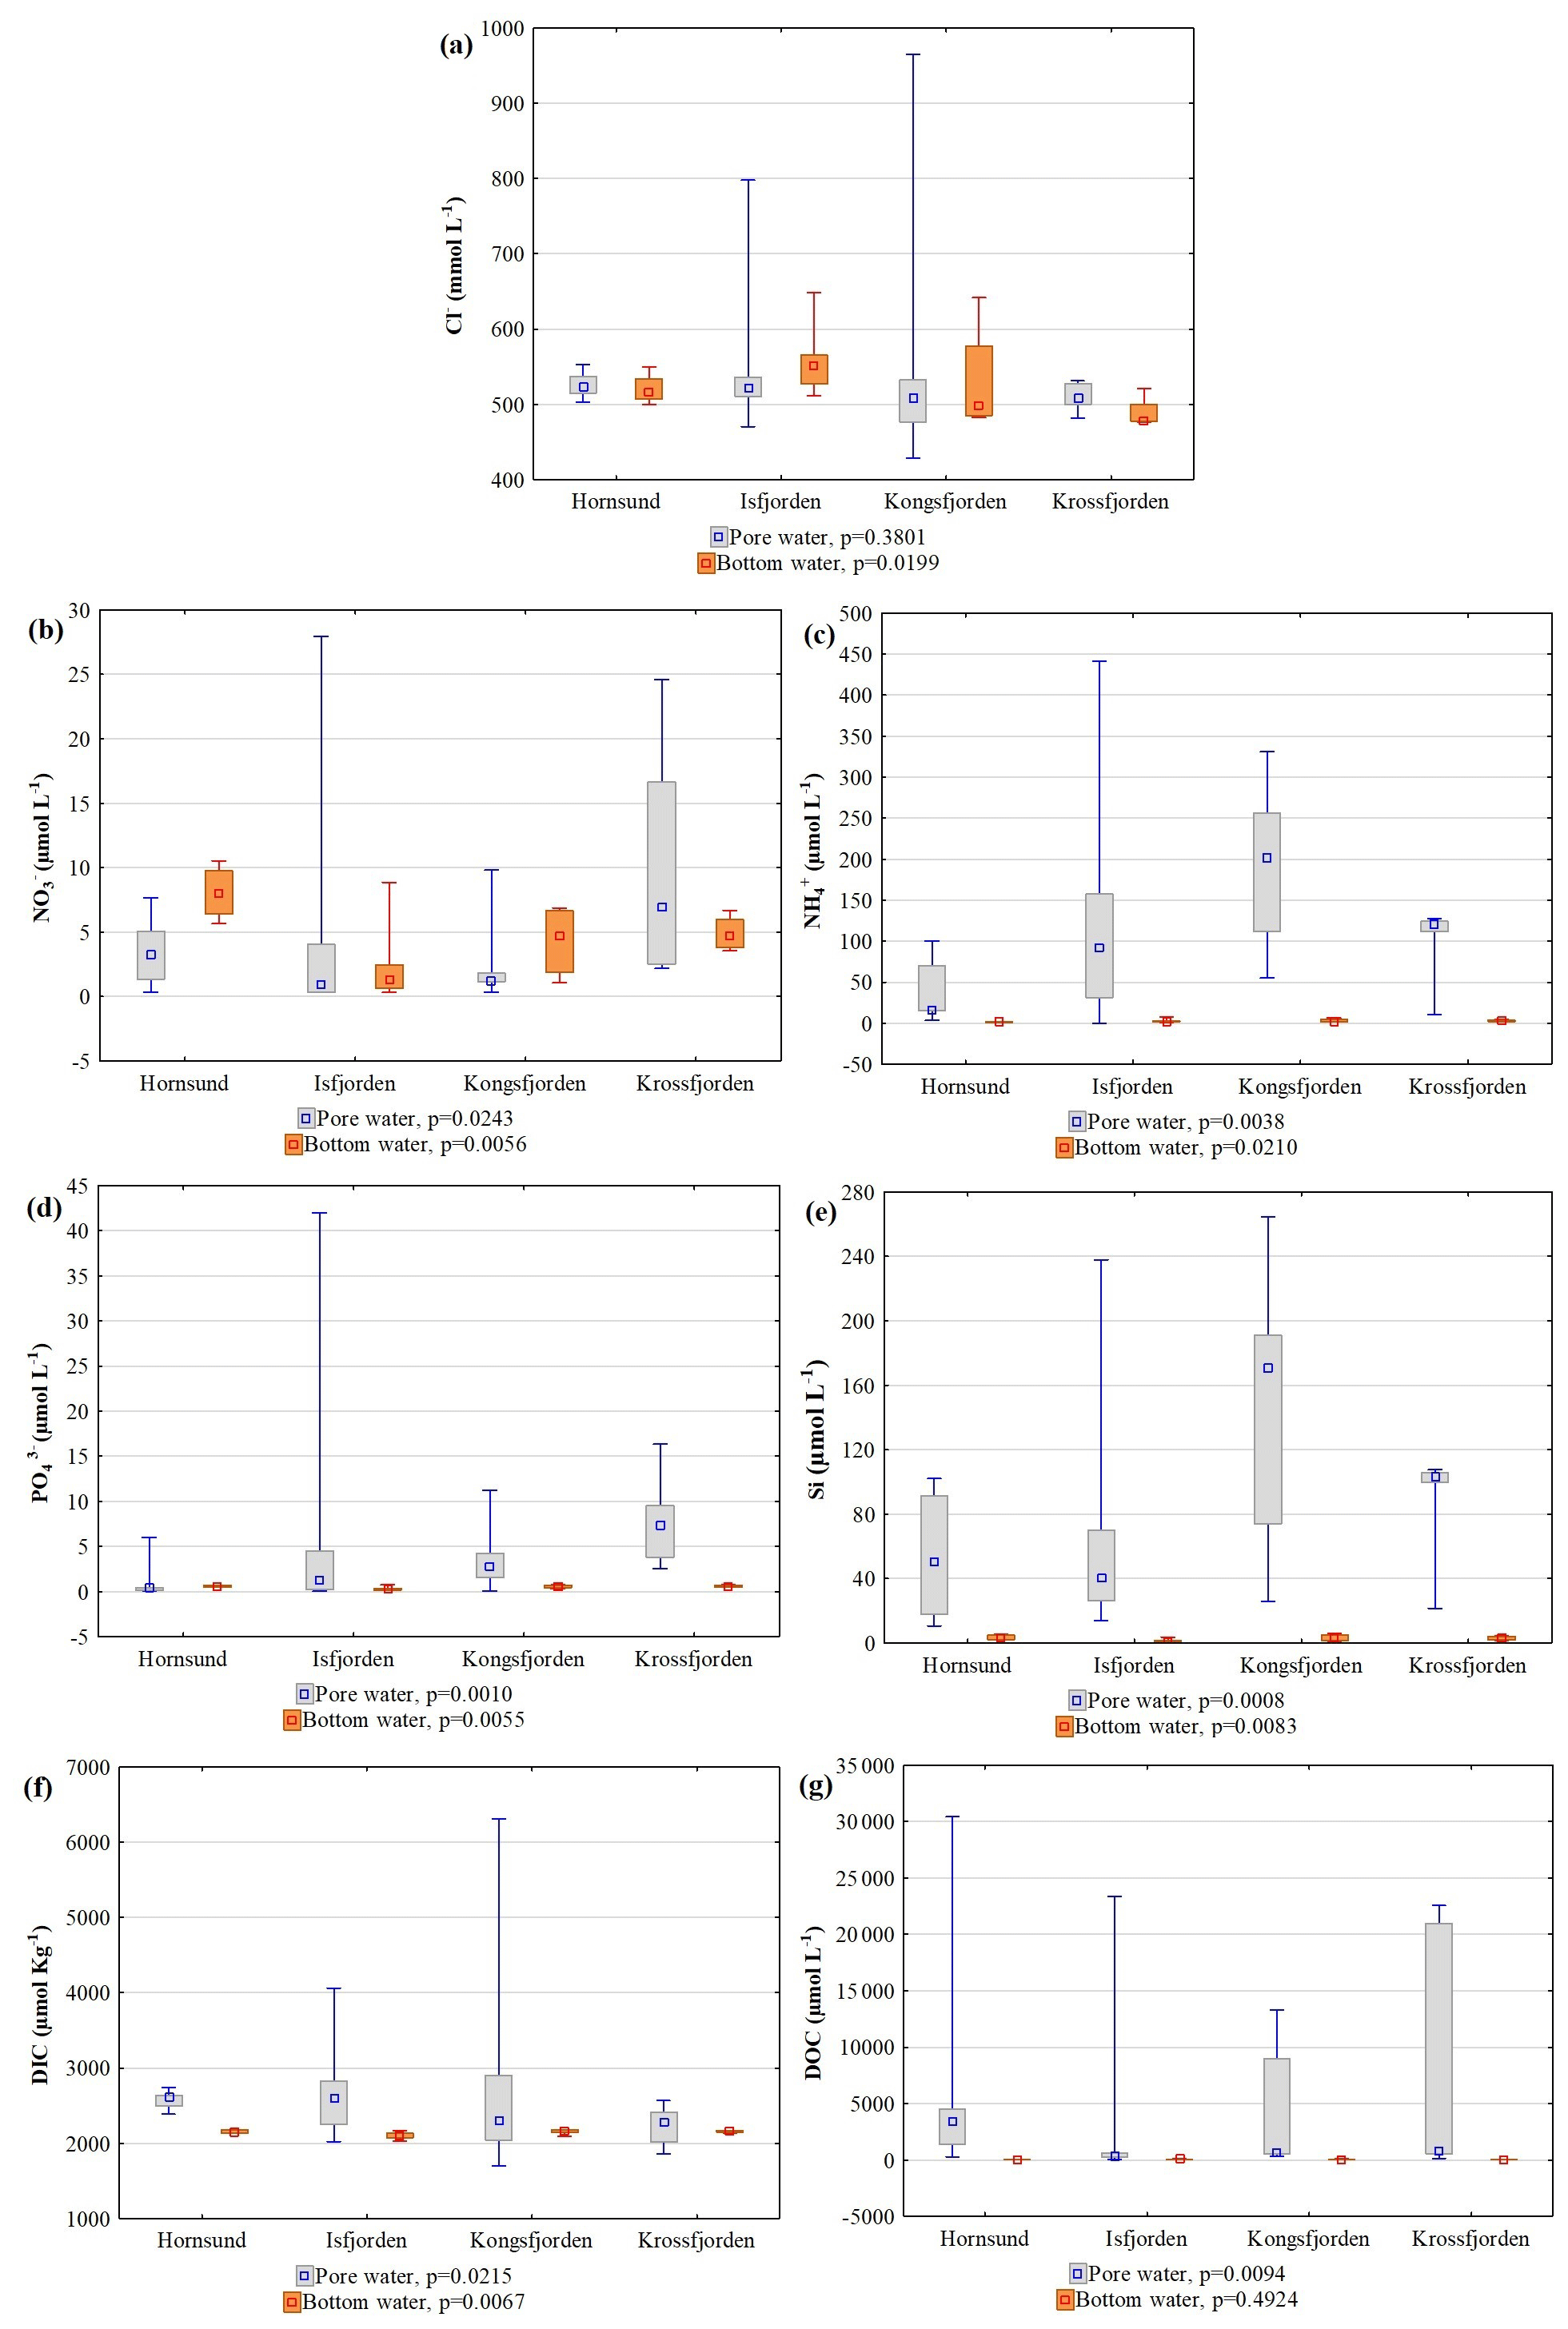
Figure 7Box plots of (a) chloride (Cl−), (b) nitrate (NO), (c) ammonium (NH), (d) phosphate (PO), (e) dissolved silica (Si), (f) dissolved inorganic carbon (DIC), and (g) dissolved organic carbon (DOC) in pore water (marked grey) and bottom water (marked orange) in Hornsund, Isfjorden, Kongsfjorden, and Krossfjorden. The p values indicate significant differences in the median concentration of the parameter between the investigated fjords.
3.4 Pore water data
The distribution and gradients of Cl−, NO, NH, PO, Si, DIC, and DOC in pore waters in the investigated fjords are presented in Fig. 6 (Szymczycha et al., 2024). Generally, Cl−, NH, PO, Si, and DIC increased with depth and NO and DOC decreased with depth. PO decreased in every fjord except Isfjorden. To highlight the potential of the pore waters dataset for further assessment and interpretation by data users, the concentrations of investigated parameters in pore water up to 5 cm depth and the concentrations in bottom water are compared in Fig. 7.
The median concentrations of Cl− in pore water did not differ significantly among fjords and were comparable to those of bottom water, apart from at Isfjorden, where the median concentrations of Cl− in pore water were smaller than those of bottom water. In all fjords, NO was higher in bottom water compared to pore water, while NH, PO, Si, and DIC were significantly higher in pore water in comparison to bottom water. The median concentration of NO, NH, PO, Si, and DIC was significantly different in both water types (p<0.05). The median concentration of DOC was slightly higher in pore water than in bottom water. However, it is worth noticing that the concentration ranges for all of the measured parameters differ between and within the investigated fjords.
All data described in this paper are stored in the Zenodo online repository (https://doi.org/10.5281/zenodo.11237340, Szymczycha et al., 2024).
This dataset is beneficial for the broad scientific community that is interested in Arctic physical oceanography and marine biogeochemistry. In addition, the presented dataset provides evidence for the spatial distribution of nutrients and the dissolved carbon species in the investigated Arctic fjords. The data are made accessible as a basis for a wider dissemination that will lead to an enhanced understanding and new scientific insights into the nutrient cycles in the Arctic fjords. Possible applications may include (1) being a reference and allowing for comparison of the current measurements of the nutrients and dissolved carbon distribution in both the water column and sediments in the same region with future studies; (2) the determination of ratios in different water masses and their comparison between fjords as an assessment of the environmental controls and limiting factors for the primary production; and (3) parameterization, validation, and improvement of existing and future biogeochemical models.
SRS: conceptualization, data interpretation, preparation of figures, investigation, and writing (original draft, reviewing, and editing). MEB, WLH, KK, AL, AS, and BS: reviewing and editing.
The contact author has declared that none of the authors has any competing interests.
Publisher's note: Copernicus Publications remains neutral with regard to jurisdictional claims made in the text, published maps, institutional affiliations, or any other geographical representation in this paper. While Copernicus Publications makes every effort to include appropriate place names, the final responsibility lies with the authors.
We thank our colleagues (Przemysław Makuch, Magdalena Diak, Marta Borecka, Katarzyna Koziorowska-Makuch, Fernando Aquado Gonzalo, Marcin Stokowski, Aleksandra Winogradow, Miłosz Grabowski, and Marek Zajączkowski) for sharing ideas and for their help with field and laboratory work. We would like to acknowledge Laura Bromboszcz and Piotr Prusiński for their technical support. We would like to thank the captain and the crew of R/V Oceania. CTD data were collected and processed at the Observational Oceanography Laboratory under the AREX monitoring program as a contribution to statutory research areas (task I.4).
The research leading to these results has received funding from the Norwegian Financial Mechanism 2014–2021 (project nos. 2019/34/H/ST10/00645 and 2019/34/H/ST10/00504). In addition, the present study is financed by statutory activities of the Institute of Oceanology of the Polish Academy of Sciences and National Science Centre (project no. 2019/34/E/ST10/00167).
This paper was edited by Sebastiaan van de Velde and reviewed by Astrid Hylen and Wytze Lenstra.
Błaszczyk M., Ignatiuk D., Uszczyk A., Cielecka-Nowak K., Grabiec M., Jania J. A., Moskalik M., and Walczowski W.: Freshwater input to the Arctic fjord Hornsund (Svalbard), Polar Res., 38, 3506, https://doi.org/10.33265/polar.v38.3506, 2019.
Cantoni, C., Hopwood, M. J., Clarke, J. S., Chiggiato, J., Achterberg, E. P., and Cozzi, S.: Glacial Drivers of Marine Biogeochemistry Indicate a Future Shift to More Corrosive Conditions in an Arctic Fjord, J. Geophys. Res.-Biogeo., 125, e2020JG005633, https://doi.org/10.1029/2020JG005633, 2020.
Codispoti, L. A., Kelly, V., Thessen, A., Matrai, P., Suttles, S., Hill, V., Steele, M., and Light, B.: Synthesis of primary production in the Arctic Ocean: III. Nitrate and phosphate based estimates of net community production, Prog. Oceanogr., 110, 126–150, https://doi.org/10.1016/j.pocean.2012.11.006, 2013.
Cottier, F., Tverberg, V., Inall, M., Svendsen, H., Nilsen, F., and Griffiths, C.: Water mass modification in an Arctic fjord through cross-shelf exchange: The seasonal hydrography of Kongsfjorden, Svalbard, J. Geophys. Res.-Ocean., 110, 1–18, https://doi.org/10.1029/2004JC002757, 2005.
Drewnik, A., Węsławski, J. M., Włodarska-Kowalczuk, M., Łącka, M., Promińska, A., Zaborska, A., and Gluchowska, M.: From the worm's point of view. I: Environmental settings of benthic ecosystems in Arctic fjord (Hornsund, Spitsbergen), Polar Biol., 39, 1411–1424, https://doi.org/10.1007/s00300-015-1867-9, 2016.
Dunse, T., Dong, K., Aas, K. S., and Stige, L. C.: Regional-scale phytoplankton dynamics and their association with glacier meltwater runoff in Svalbard, Biogeosciences, 19, 271–294, https://doi.org/10.5194/bg-19-271-2022, 2022.
Finne, E. A., Varpe, Ø., Durant, J. M., Gabrielsen, G. W., and Poste, A. E.: Nutrient fluxes from an Arctic seabird colony to the adjacent coastal marine ecosystem, Polar Biol., https://doi.org/10.1007/s00300-022-03024-5, 2022.
Gamboa-Sojo, V. M., Husum, K., Morigi, C., Divine, D., and Miettinen, A.: Environmental changes in Krossfjorden, Svalbard, since 1950: Benthic foraminiferal and stable isotope evidence, Arctic, Antarct. Alp. Res., 54, 465–477, https://doi.org/10.1080/15230430.2022.2120246, 2022.
Grabiec, M., Ignatiuk, D., Jania, J. A., Moskalik, M., Głowacki, P., Błaszczyk, M., Budzik, T., and Walczowski, W.: Coast formation in an Arctic area due to glacier surge and retreat: The Hornbreen-Hambergbreen case from Spistbergen, Earth Surf. Process. Landforms, 43, 387–400, https://doi.org/10.1002/esp.4251, 2018.
Grasshoff, K., Kremling, K., and Ehrhardt, M. (Eds.): Methods of seawater analysis, John Wiley & Sons, ISBN 3-527-29589-5, 2009.
Gundersen, K., Møgster, J. S., Lien, V. S., Ershova, E., Lunde, L. F., Arnesen, H., and Olsen, A.-K.: Thirty Years of Nutrient Biogeochemistry in the Barents Sea and the adjoining Arctic Ocean, 1990–2019, Sci. Data, 9, 649, https://doi.org/10.1038/s41597-022-01781-w, 2022.
Halbach, L., Vihtakari, M., Duarte, P., Everett, A., Granskog, M. A., Hop, H., Kauko, H. M., Kristiansen, S., Myhre, P. I., Pavlov, A. K., Pramanik, A., Tatarek, A., Torsvik, T., Wiktor, J. M., Wold, A., Wulff, A., Steen, H., and Assmy, P.: Tidewater Glaciers and Bedrock Characteristics Control the Phytoplankton Growth Environment in a Fjord in the Arctic, Front. Mar. Sci., 6, 1–18, https://doi.org/10.3389/fmars.2019.00254, 2019.
Henley, S. F., Porter, M., Hobbs, L., Braun, J., Guillaume-Castel, R., Venables, E. J., Dumont, E., and Cottier, F.: Nitrate supply and uptake in the Atlantic Arctic sea ice zone: seasonal cycle, mechanisms and drivers, Philos. T. R. Soc. A, 378, 20190361, https://doi.org/10.1098/rsta.2019.0361, 2020.
Hodal, H., Falk-Petersen, S., Hop, H., Kristiansen, S., and Reigstad, M.: Spring bloom dynamics in Kongsfjorden, Svalbard: Nutrients, phytoplankton, protozoans and primary production, Polar Biol., 35, 191–203, https://doi.org/10.1007/s00300-011-1053-7, 2012.
Hop, H. and Wiencke, C.: The Ecosystem of Kongsfjorden, Svalbard, 1–20, https://doi.org/10.1007/978-3-319-46425-1_1, 2019.
Hop, H., Falk-Petersen, S., Svendsen, H., Kwasniewski, S., Pavlov, V., Pavlova, O., and Søreide, J. E.: Physical and biological characteristics of the pelagic system across Fram Strait to Kongsfjorden, Prog. Oceanogr., 71, 182–231, https://doi.org/10.1016/j.pocean.2006.09.007, 2006.
Hopwood, M. J., Connelly, D. P., Arendt, K. E., Juul-Pedersen, T., Stinchcombe, M. C., Meire, L., Esposito, M., and Krishna, R.: Seasonal Changes in Fe along a Glaciated Greenlandic Fjord, Front. Earth Sci., 4, 15, https://doi.org/10.3389/feart.2016.00015, 2016.
Hopwood, M. J., Carroll, D., Dunse, T., Hodson, A., Holding, J. M., Iriarte, J. L., Ribeiro, S., Achterberg, E. P., Cantoni, C., Carlson, D. F., Chierici, M., Clarke, J. S., Cozzi, S., Fransson, A., Juul-Pedersen, T., Winding, M. H. S., and Meire, L.: Review article: How does glacier discharge affect marine biogeochemistry and primary production in the Arctic?, The Cryosphere, 14, 1347–1383, https://doi.org/10.5194/tc-14-1347-2020, 2020.
Intergovernmental Panel on Climate Change (IPCC): The Ocean and Cryosphere in a Changing Climate, Cambridge University Press, 203–320 pp., https://doi.org/10.1017/9781009157964, 2022.
Kim, J. H., Ryu, J. S., Hong, W. L., Jang, K., Joo, Y. J., Lemarchand, D., Hur, J., Park, M. H., Chen, M., Kang, M. H., Park, S., Nam, S. Il, and Lee, Y. K.: Assessing the impact of freshwater discharge on the fluid chemistry in the Svalbard fjords, Sci. Total Environ., 835, 155516, https://doi.org/10.1016/j.scitotenv.2022.155516, 2022.
Ko, E., Gorbunov, M. Y., Jung, J., Joo, H. M., Lee, Y., Cho, K., Yang, E. J., Kang, S., and Park, J.: Effects of Nitrogen Limitation on Phytoplankton Physiology in the Western Arctic Ocean in Summer, J. Geophys. Res.-Ocean., 125, e2020JC016501, https://doi.org/10.1029/2020JC016501, 2020.
McGovern, M., Pavlov, A. K., Deininger, A., Granskog, M. A., Leu, E., Søreide, J. E., and Poste, A. E.: Terrestrial Inputs Drive Seasonality in Organic Matter and Nutrient Biogeochemistry in a High Arctic Fjord System (Isfjorden, Svalbard), Front. Mar. Sci., 7, 1–15, https://doi.org/10.3389/fmars.2020.542563, 2020.
Menze, S., Ingvaldsen, R. B., Nikolopoulos, A., Hattermann, T., Albretsen, J., and Gjøsæter, H.: Productive detours – Atlantic water inflow and acoustic backscatter in the major troughs along the Svalbard shelf, Prog. Oceanogr., 188, 102447, https://doi.org/10.1016/j.pocean.2020.102447, 2020.
Mills, M. M., Brown, Z. W., Laney, S. R., Ortega-Retuerta, E., Lowry, K. E., van Dijken, G. L., and Arrigo, K. R.: Nitrogen Limitation of the Summer Phytoplankton and Heterotrophic Prokaryote Communities in the Chukchi Sea, Front. Mar. Sci., 5, 362, https://doi.org/10.3389/fmars.2018.00362, 2018.
Moskalik, M., Tęgowski, J., Grabowiecki, P., and Żulichowska, M.: Principal Component and Cluster Analysis for determining diversification of bottom morphology based on bathymetric profiles from Brepollen (Hornsund, Spitsbergen)**The project was partly supported by The Polish Ministry of Sciences and Higher Education Gr, Oceanologia, 56, 59–84, https://doi.org/10.5697/oc.56-1.059, 2014.
Nilsen, F., Cottier, F., Skogseth, R., and Mattsson, S.: Fjord-shelf exchanges controlled by ice and brine production: The interannual variation of Atlantic Water in Isfjorden, Svalbard, Cont. Shelf Res., 28, 1838–1853, https://doi.org/10.1016/j.csr.2008.04.015, 2008.
Pavlova, O., Gerland, S., and Hop, H.: Changes in Sea-Ice Extent and Thickness in Kongsfjorden, Svalbard (2003–2016), SpringerLink, 105–136, https://doi.org/10.1007/978-3-319-46425-1_4, 2019.
Pogojeva, M., Polukhin, A., Makkaveev, P., Staalstrøm, A., Berezina, A., and Yakushev, E.: Arctic Inshore Biogeochemical Regime Influenced by Coastal Runoff and Glacial Melting (Case Study for the Templefjord, Spitsbergen), Geosci., 12, 44, https://doi.org/10.3390/geosciences12010044, 2022.
Promińska, A., Cisek, M., and Walczowski, W.: Kongsfjorden and Hornsund hydrography – comparative study based on a multiyear survey in fjords of west Spitsbergen, Oceanologia, 59, 397–412, https://doi.org/10.1016/j.oceano.2017.07.003, 2017.
Promińska, A., Falck, E., and Walczowski, W.: Interannual variability in hydrography and water mass distribution in Hornsund, an Arctic fjord in Svalbard, Polar Res., 37, 1495546, https://doi.org/10.1080/17518369.2018.1495546, 2018.
Rudels, B., Meyer, R., Fahrbach, E., Ivanov, V. V., Østerhus, S., Quadfasel, D., Schauer, U., Tverberg, V., and Woodgate, R. A.: Water mass distribution in Fram Strait and over the Yermak Plateau in summer 1997, Ann. Geophys., 18, 687–705, https://doi.org/10.1007/s00585-000-0687-5, 2000.
Santos-Garcia, M., Ganeshram, R. S., Tuerena, R. E., Debyser, M. C. F., Husum, K., Assmy, P., and Hop, H.: Nitrate isotope investigations reveal future impacts of climate change on nitrogen inputs and cycling in Arctic fjords: Kongsfjorden and Rijpfjorden (Svalbard), Biogeosciences, 19, 5973–6002, https://doi.org/10.5194/bg-19-5973-2022, 2022.
Schlegel, R., Bartsch, I., Bischof, K., Bjørst, L. R., Dannevig, H., Diehl, N., Duarte, P., Hovelsrud, G. K., Juul-Pedersen, T., Lebrun, A., Merillet, L., Miller, C., Ren, C., Sejr, M., Søreide, J. E., Vonnahme, T. R., and Gattuso, J.-P.: Drivers of change in Arctic fjord socio-ecological systems: Examples from the European Arctic, Cambridge Prism. Coast. Futur., 1, e13, https://doi.org/10.1017/cft.2023.1, 2023.
Singh, A. and Krishnan, K. P.: The spatial distribution of phytoplankton pigments in the surface sediments of the Kongsfjorden and Krossfjorden ecosystem of Svalbard, Arctic, Reg. Stud. Mar. Sci., 31, 100815, https://doi.org/10.1016/j.rsma.2019.100815, 2019.
Smoła, Z. T., Tatarek, A., Wiktor, J. M., Wiktor, J. M. W., Kubiszyn, A., and Węsławski, J. M.: Primary producers and production in Hornsund and Kongsfjorden – Comparison of two fjord systems, Polish Polar Res., 38, 351–373, https://doi.org/10.1515/popore-2017-0013, 2017.
Stroeve, J., Vancoppenolle, M., Veyssiere, G., Lebrun, M., Castellani, G., Babin, M., Karcher, M., Landy, J., Liston, G. E., and Wilkinson, J.: A Multi-Sensor and Modeling Approach for Mapping Light Under Sea Ice During the Ice-Growth Season, Front. Mar. Sci., 7, 1–28, https://doi.org/10.3389/fmars.2020.592337, 2021.
Svendsen, H., Beszczynska-Møller, A., Hagen, J. O., Lefauconnier, B., Tverberg, V., Gerland, S., Ørbøk, J. B., Bischof, K., Papucci, C., Zajaczkowski, M., Azzolini, R., Bruland, O., Wiencke, C., Winther, J. G., and Dallmann, W.: The physical environment of Kongsfjorden-Krossfjorden, and Arctic fjord system in Svalbard, Polar Res., 21, 133–166, https://doi.org/10.1111/j.1751-8369.2002.tb00072.x, 2002.
Svendsen, J. I., Mangerud, J., Elverhøi, A., Solheim, A., and Schüttenhelm, R. T. E.: The Late Weichselian glacial maximum on western Spitsbergen inferred from offshore sediment cores, Mar. Geol., 104, 1–17, https://doi.org/10.1016/0025-3227(92)90081-R, 1992.
Szymczycha, B., Saghravani, S. R., Böttcher, M. E., Hong, W.-L., Kuliński, K., Lepland, A., and Sen, A.: In-situ parameters, nutrients and dissolved carbon distribution in the water column and pore waters of Arctic Fjords (Western Spitsbergen) during a melting season, Zenodo [data set], https://doi.org/10.5281/zenodo.11237340, 2024.
Townhill, B. L., Reppas-Chrysovitsinos, E., Sühring, R., Halsall, C. J., Mengo, E., Sanders, T., Dähnke, K., Crabeck, O., Kaiser, J., and Birchenough, S. N. R.: Pollution in the Arctic Ocean: An overview of multiple pressures and implications for ecosystem services, Ambio, 51, 471–483, https://doi.org/10.1007/s13280-021-01657-0, 2022.
Tuerena, R. E., Mahaffey, C., Henley, S. F., de la Vega, C., Norman, L., Brand, T., Sanders, T., Debyser, M., Dähnke, K., Braun, J., and März, C.: Nutrient pathways and their susceptibility to past and future change in the Eurasian Arctic Ocean, Ambio, 51, 355–369, https://doi.org/10.1007/s13280-021-01673-0, 2022.
Vihtakari, M.: PlotSvalbard: PlotSvalbard-Plot research data from Svalbard on maps. R package version 0.8, https://mikkovihtakari.github.io/PlotSvalbard/articles/PlotSvalbard.html#citing-plotsvalbard-1 (last access: December 2023), 2019.
Vihtakari, M.: ggOceanMaps: Plot Data on Oceanographic Maps using “ggplot2”, R package version 2.2.0, https://mikkovihtakari.github.io/ggOceanMaps/ (last access: December 2023), 2024.
Węsławski, J. M., Szymelfenig, M., Zajaczkowski, M., and Keck, A.: Influence of salinity and suspended matter on benthos of an Arctic tidal flat, ICES J. Mar. Sci., 56, S194–S202, 1999.
Włodarska-Kowalczuk, M., Węsławski, J. M., and Kotwicki, L.: Spitsbergen glacial bays macrobenthos – a comparative study, Polar Biol., 20, 66–73, https://doi.org/10.1007/s003000050277, 1998.
Zaborska, A., Strzelewicz, A., Rudnicka, P., and Moskalik, M.: Processes driving heavy metal distribution in the seawater of an Arctic fjord (Hornsund, southern Spitsbergen), Mar. Pollut. Bull., 161, 111719, https://doi.org/10.1016/j.marpolbul.2020.111719, 2020.