the Creative Commons Attribution 4.0 License.
the Creative Commons Attribution 4.0 License.
 | 24 Jul 2024
Climatological distribution of ocean acidification variables along the North American ocean margins
Tim P. Boyer
Christopher R. Paver
Hyelim Yoo
James R. Reagan
Simone R. Alin
Leticia Barbero
Brendan R. Carter
Richard A. Feely
Rik Wanninkhof
Climatologies, which depict mean fields of oceanographic variables on a regular geographic grid, and atlases, which provide graphical depictions of specific areas, play pivotal roles in comprehending the societal vulnerabilities linked to ocean acidification (OA). This significance is particularly pronounced in coastal regions where most economic activities, such as commercial and recreational fisheries and aquaculture industries, occur. In this paper, we unveil a comprehensive data product featuring coastal ocean acidification climatologies and atlases, encompassing the fugacity of carbon dioxide, pH on the total scale, total hydrogen ion content, free hydrogen ion content, carbonate ion content, aragonite saturation state, calcite saturation state, Revelle factor, total dissolved inorganic carbon content, and total alkalinity content. These variables are provided on 1° × 1° spatial grids at 14 standardized depth levels, ranging from the surface to a depth of 500 m, along the North American ocean margins, defined as the region between the coastline and a distance of 200 nautical miles (∼370 km) offshore. The climatologies and atlases were developed using the World Ocean Atlas (WOA) gridding methods of the NOAA National Centers for Environmental Information (NCEI) based on the recently released Coastal Ocean Data Analysis Product in North America (CODAP-NA), along with the 2021 update to the Global Ocean Data Analysis Project version 2 (GLODAPv2.2021) data product. The relevant variables were adjusted to the index year of 2010. The data product is available in NetCDF (https://doi.org/10.25921/g8pb-zy76, Jiang et al., 2022b) on the NOAA Ocean Carbon and Acidification Data System: https://www.ncei.noaa.gov/data/oceans/ncei/ocads/metadata/0270962.html (last access: 15 July 2024). It is recommended to use the objectively analyzed mean fields (with “_an” suffix) for each variable. The atlases can be accessed at https://www.ncei.noaa.gov/access/ocean-carbon-acidification-data-system/synthesis/nacoastal.html (last access: 15 July 2024).
- Article
(2584 KB) - Full-text XML
- Companion paper
- BibTeX
- EndNote


The chemistry of the mildly alkaline ocean has been changing as a result of absorbing ∼ 25 % of the carbon dioxide (CO2) released by human activities (Gruber et al., 2019; Jiang et al., 2019; DeVries, 2022; Friedlingstein et al., 2023; Ma et al., 2023; Feely et al., 2023; Jiang et al., 2023; Richardson et al., 2023). This process, which is causing an increase in ocean acidity and a decrease in the substance content of carbonate ion (a building block for the shells and skeletal structures of many marine organisms), is commonly referred to as ocean acidification (OA) (Caldeira and Wickett, 2003; Feely et al., 2004; Orr et al., 2005; Doney et al., 2009; Gattuso and Hansson, 2011). Studies have shown that OA can negatively affect marine organisms that form shells and skeletons using calcium carbonate (CaCO3, with aragonite and calcite being the dominant mineral forms) and has the potential to significantly impact shellfish fisheries and aquaculture (Cooley and Doney, 2009; Andersson and Gledhill, 2013; Gattuso et al., 2015; Albright et al., 2016; Connell et al., 2018; Kawahata et al., 2019; Doney et al., 2020).
Despite occupying just 7 % of the ocean surface area, coastal seas (<200 m deep near land) are among the most productive parts of the global ocean, accounting for 90 % of the yield of global fisheries (Tickler et al., 2018). The coastal ocean also contains some of the richest biodiversity (80 % of known species of marine fish; Cicin-Sain et al., 2002) and provides important ecosystem goods and services to billions of people in the form of food security, fishery and aquaculture industries, and recreational activities. These goods and services are worth more than USD 27.7 trillion annually, a number larger than the annual US gross domestic product (de Groot et al., 2012; Costanza et al., 2014; Kubiszewski et al., 2017). Thus, understanding the status of OA in the coastal ocean is critical to guide society's OA mitigation and adaptation efforts.
In a recent study, 2 decades of discrete measurements of carbonate system parameters, oxygen, and nutrients from the North American ocean margins were compiled, quality controlled (QCed), and synthesized to generate a data product called the Coastal Ocean Data Analysis Product in North America (CODAP-NA) (Jiang et al., 2021). CODAP-NA makes the QCed cruise data available in various uniform formats, e.g., CSV, Excel, NetCDF, and MATLAB, facilitating future OA research in the North American ocean margins. However, it does not provide their values on standardized spatial grids and depth levels.
In this companion paper, we describe the climatologies (mean fields of oceanographic variables on a regular geographic grid) and atlases (maps of these properties for the area of interest) at 14 standard depth levels from the surface to 500 m for the fugacity of carbon dioxide (fCO2), pH on the total scale (pHT), total hydrogen ion content ([H+]total), free hydrogen ion content ([H+]free), carbonate ion content ([CO]), aragonite saturation state (Ωarag), calcite saturation state (Ωcalc), Revelle factor (RF), total dissolved inorganic carbon content (DIC), and total alkalinity content (TA). The generated climatologies are available as NetCDF files, and the atlases are available as still images (JPEG). The produced climatologies and atlases provide a baseline for current OA conditions for use in assessing future changes along the North American ocean margins, enabling the identification of more vulnerable vs. potentially resilient regions. Additionally, the climatologies will facilitate regional model validation; allow users to plot the distribution of an OA variable in horizontal or vertical sections in different regions easily; and make it possible to extract values at specific longitude, latitude, and depth combinations. The atlas visualizations of these parameters will inform coastal enterprises, decision-makers and stakeholders, and the general public about the current status of OA in each region so as to provide actionable information for the coastal mitigation and adaptation efforts.
Climatologies and atlases for a total of 10 OA variables, namely fCO2, pHT, [H+]total, [H+]free, [CO], Ωarag, Ωcalc, RF, DIC, and TA, along with temperature and salinity, were created in the ocean margins of North America (Table 1). Input data came primarily from the QCed cruise data from CODAP-NA, which contains discrete measurements throughout the water column of the coastal region (Jiang et al., 2021), and the 2021 update to the Global Ocean Data Analysis Project (GLODAPv2.2021), which includes discrete measurements from the open ocean (Lauvset et al., 2021), both spanning from the ocean surface to the seafloor. The relevant carbonate system variables were indexed to the year of 2010 based on the algorithms developed by Carter et al. (2021). Specifically, “ESPER_Mixed” was used to estimate the delta dissolved inorganic carbon (DIC) differences between the sampling year and 2010. For more details regarding this temporal adjustment, refer to Jiang et al. (2023). The carbonate system calculations were conducted using a Julia version (CO2System.jl v2.0.5, Humphreys et al., 2022) of the CO2SYS program (Lewis and Wallace, 1998), with the dissociation constants for carbonic acid of Lueker et al. (2000), the bisulfate (HSO) of Dickson (1990), the hydrofluoric acid (HF) of Perez and Fraga (1987), and the total borate equations of Lee et al. (2010) as recommended by Jiang et al. (2022a). When more than two carbonate variable measurements were available for a profile, the variables used for carbonate system calculations were chosen based on the preference order of DIC > TA > pH. This preference order corresponds to the frequency of availability of these measurement types in the underlying data products and is therefore chosen on the basis of maximizing the consistency of the underlying calculations. It has been noted that the stated uncertainty in seawater pH measurements is often low enough to result in reduced uncertainties in calculations using this variable compared to the other variables, but we nevertheless use this ordering to ensure our underlying calculations are maximally consistent and because of lingering issues with the accuracy of pH at depth (Carter et al., 2023).
[H+]total and [H+]free (unit: 10−9 mol kg−1) were directly calculated from a Julia version of the CO2SYS (CO2System.jl). Because pH is on a logarithmic scale, it was not gridded directly. Instead, its corresponding [H+]total was gridded, and the gridded pH values were then calculated using the definition of pH (Eq. 1).
Note that, in Eq. (1), the unit for [H+]total is moles per kilogram. The saturation state of carbonate minerals (unitless) is defined as follows:
where Ω is the saturation state (Ω>1 favors precipitation, and Ω<1 favors dissolution), and [Ca2+] and [CO] are the calcium and carbonate ion contents, respectively (units: µmol kg−1). is the apparent solubility product of the calcium carbonate minerals (e.g., aragonite or calcite). [Ca2+] in seawater was assumed to be conservative with salinity according to Millero (1995). The Revelle factor (RF) quantifies the buffer capacity for the seawater carbonate system, defined by Revelle and Suess (1957) as the ratio of the fractional change in fCO2 to the fractional change in DIC, with TA being constant. A higher RF indicates a smaller DIC change (in terms of the amount of carbon the ocean absorbs) for a specific change in sea surface fCO2. A higher RF also suggests that a given addition of DIC will have a larger impact on fCO2, implying that the seawater is less well-buffered (Broecker et al., 1979).
Table 1Variables included in this data product. All of them are reported at in situ temperature and pressure. The leftmost column shows the abbreviations used in the NetCDF files.
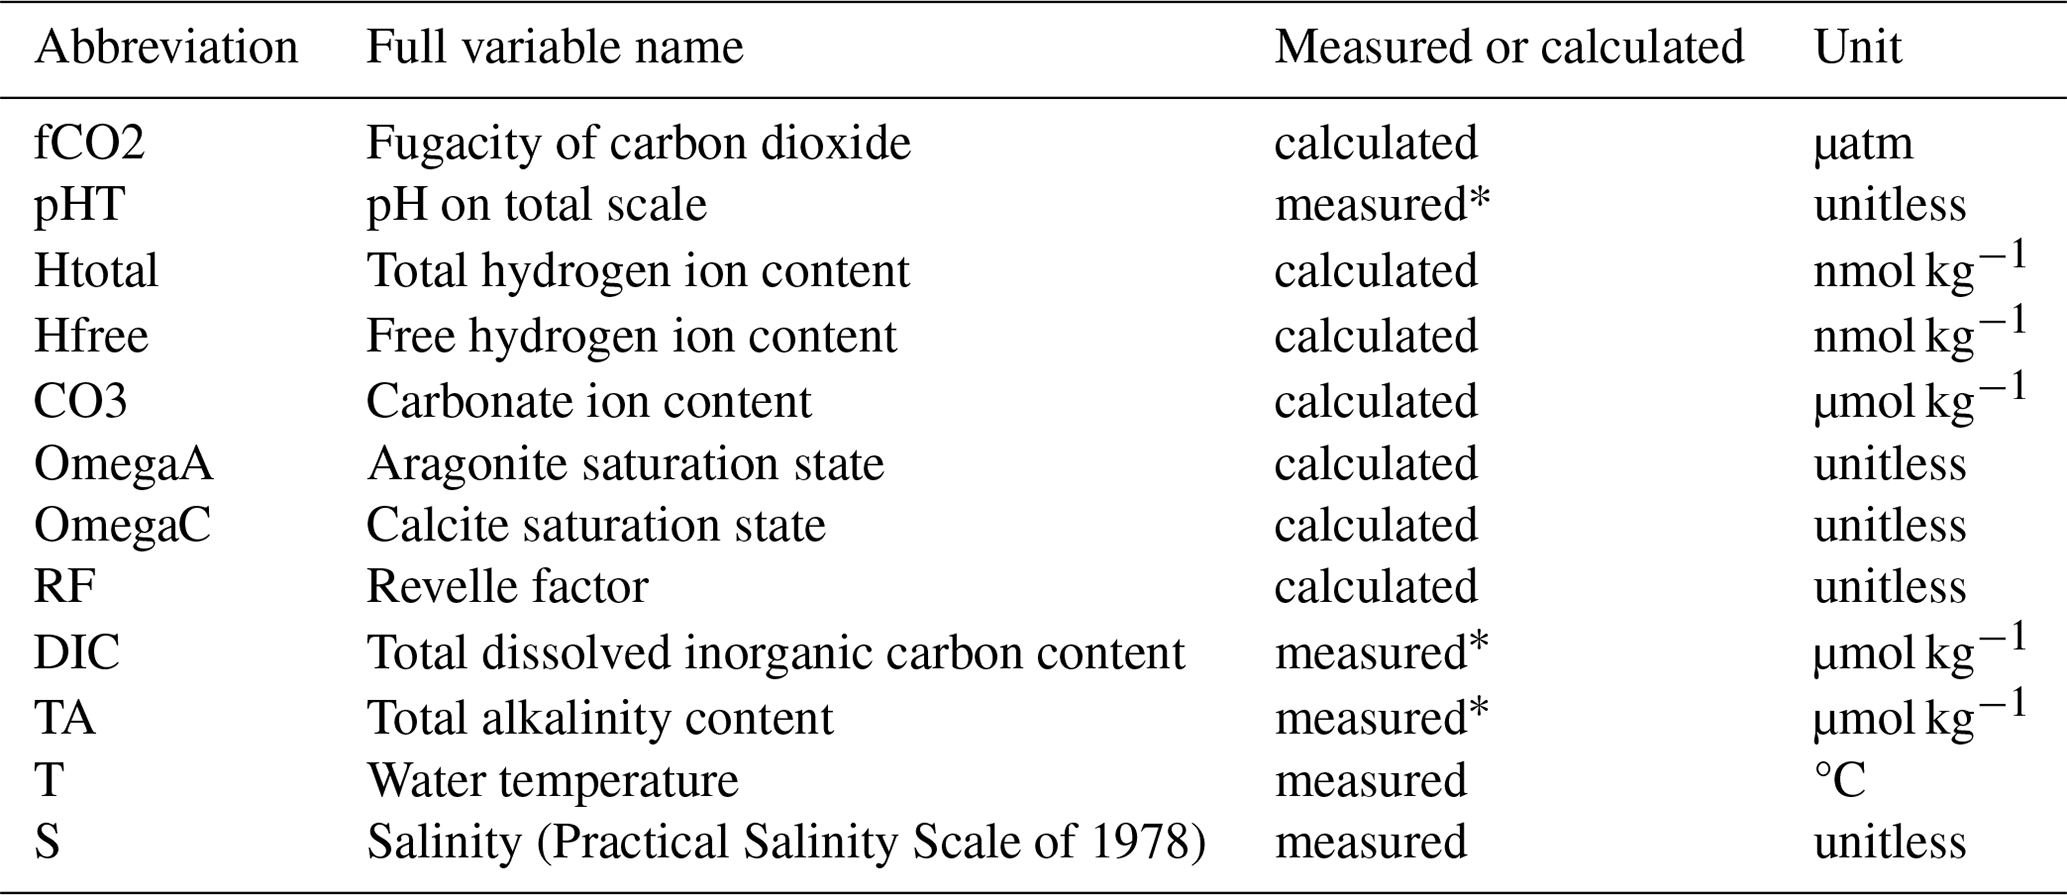
* These variables served as the basis for calculating the remaining variables based on the preference order of DIC > TA > pH. They were not always measured, particularly for pH. Additionally, both DIC and pH were adjusted to the year 2010, and TA could also be a calculated value in rare cases where only DIC and pH were available.
For all OA variables, the data were vertically interpolated onto 14 standardized depth levels – 0, 10, 20, 30, 50, 75, 100, 125, 150, 200, 250, 300, 400, and 500 m – before they were horizontally gridded. These standardized depth levels are the same as those used in the GLODAPv2 gridded data product (Lauvset et al., 2016), as originally chosen by Levitus and Boyer (1994). Vertical interpolation was performed using the four-point Reiniger–Ross interpolation approach when the data permitted it; otherwise, a three-point Lagrangian interpolation was used, with linear interpolation serving as a last resort (Reiniger and Ross, 1968).
The algorithm used to produce horizontally gridded data at specified standard depths in the ocean is based on the objective analysis technique, originally developed for atmospheric variables by Barnes (1964) and subsequently adapted for oceanographic applications (non-continuous globally due to land and ocean bottom) by Levitus (1982). The technique adjusts a first-guess field (best estimate) at the center of a 1° × 1° grid box by aggregating distance-weighted influences from all grid boxes within a predetermined radius of influence. The initial first-guess fields for each of these variables on global 1° × 1° grids at all depth levels were calculated using the Empirical Seawater Property Estimation Routines (ESPERs) algorithms (Carter et al., 2021) based on the WOA 2018 data for salinity (Zweng et al., 2018), temperature (Locarnini et al., 2018), and dissolved oxygen (Garcia et al., 2018).
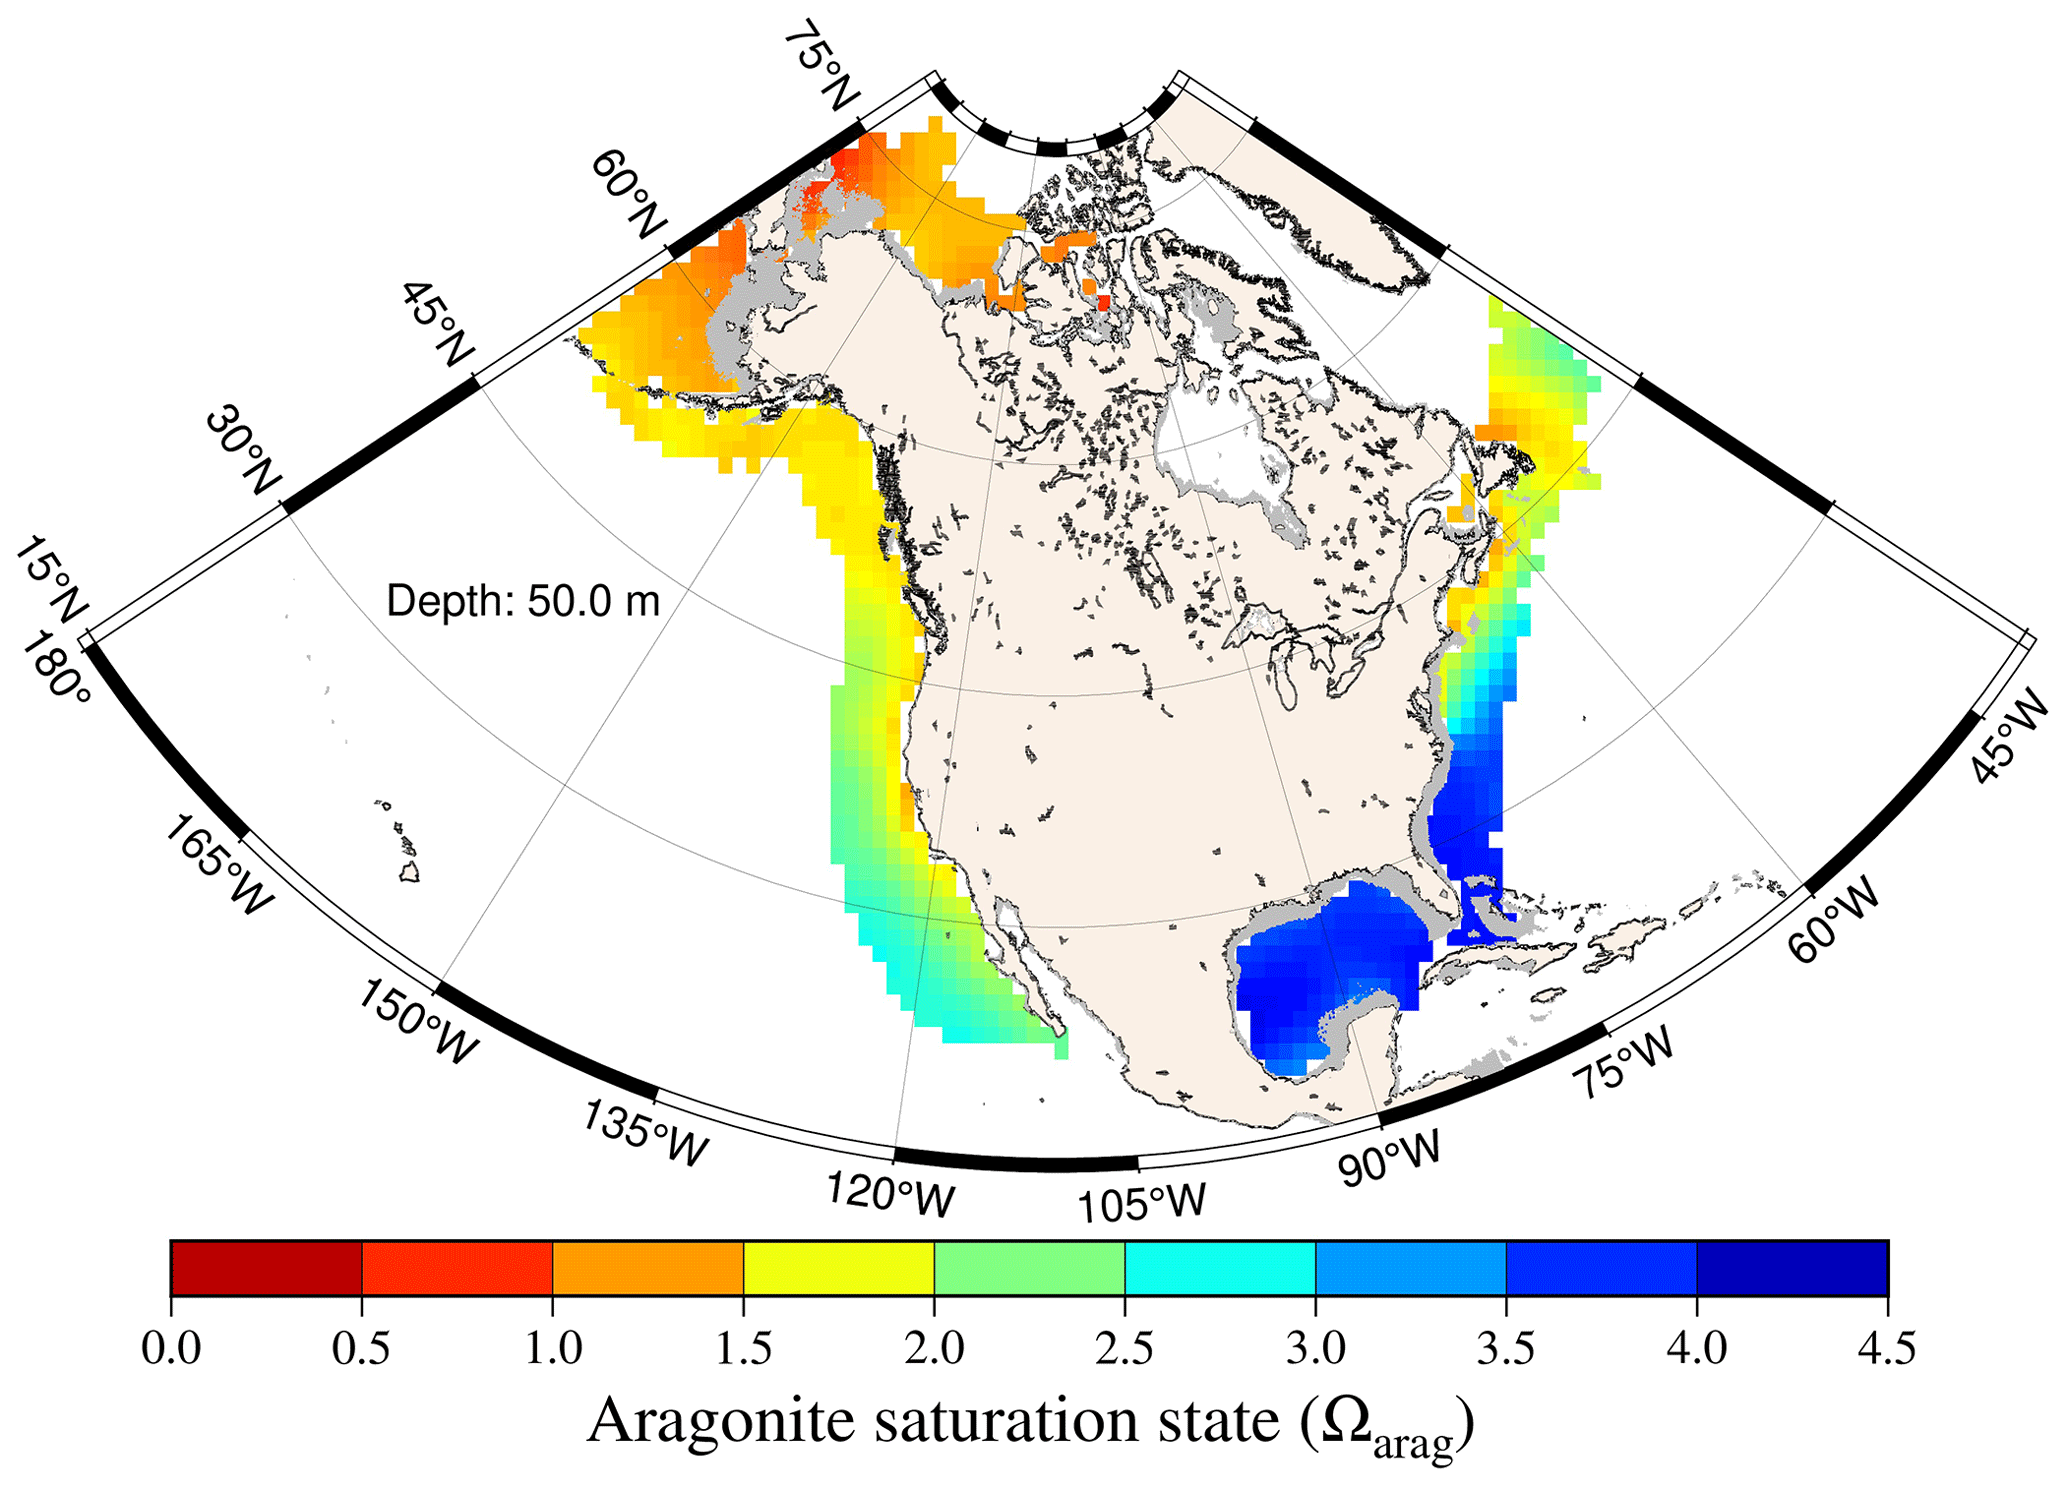
Figure 1Aragonite saturation state at 50 m depth on the North American ocean margins.
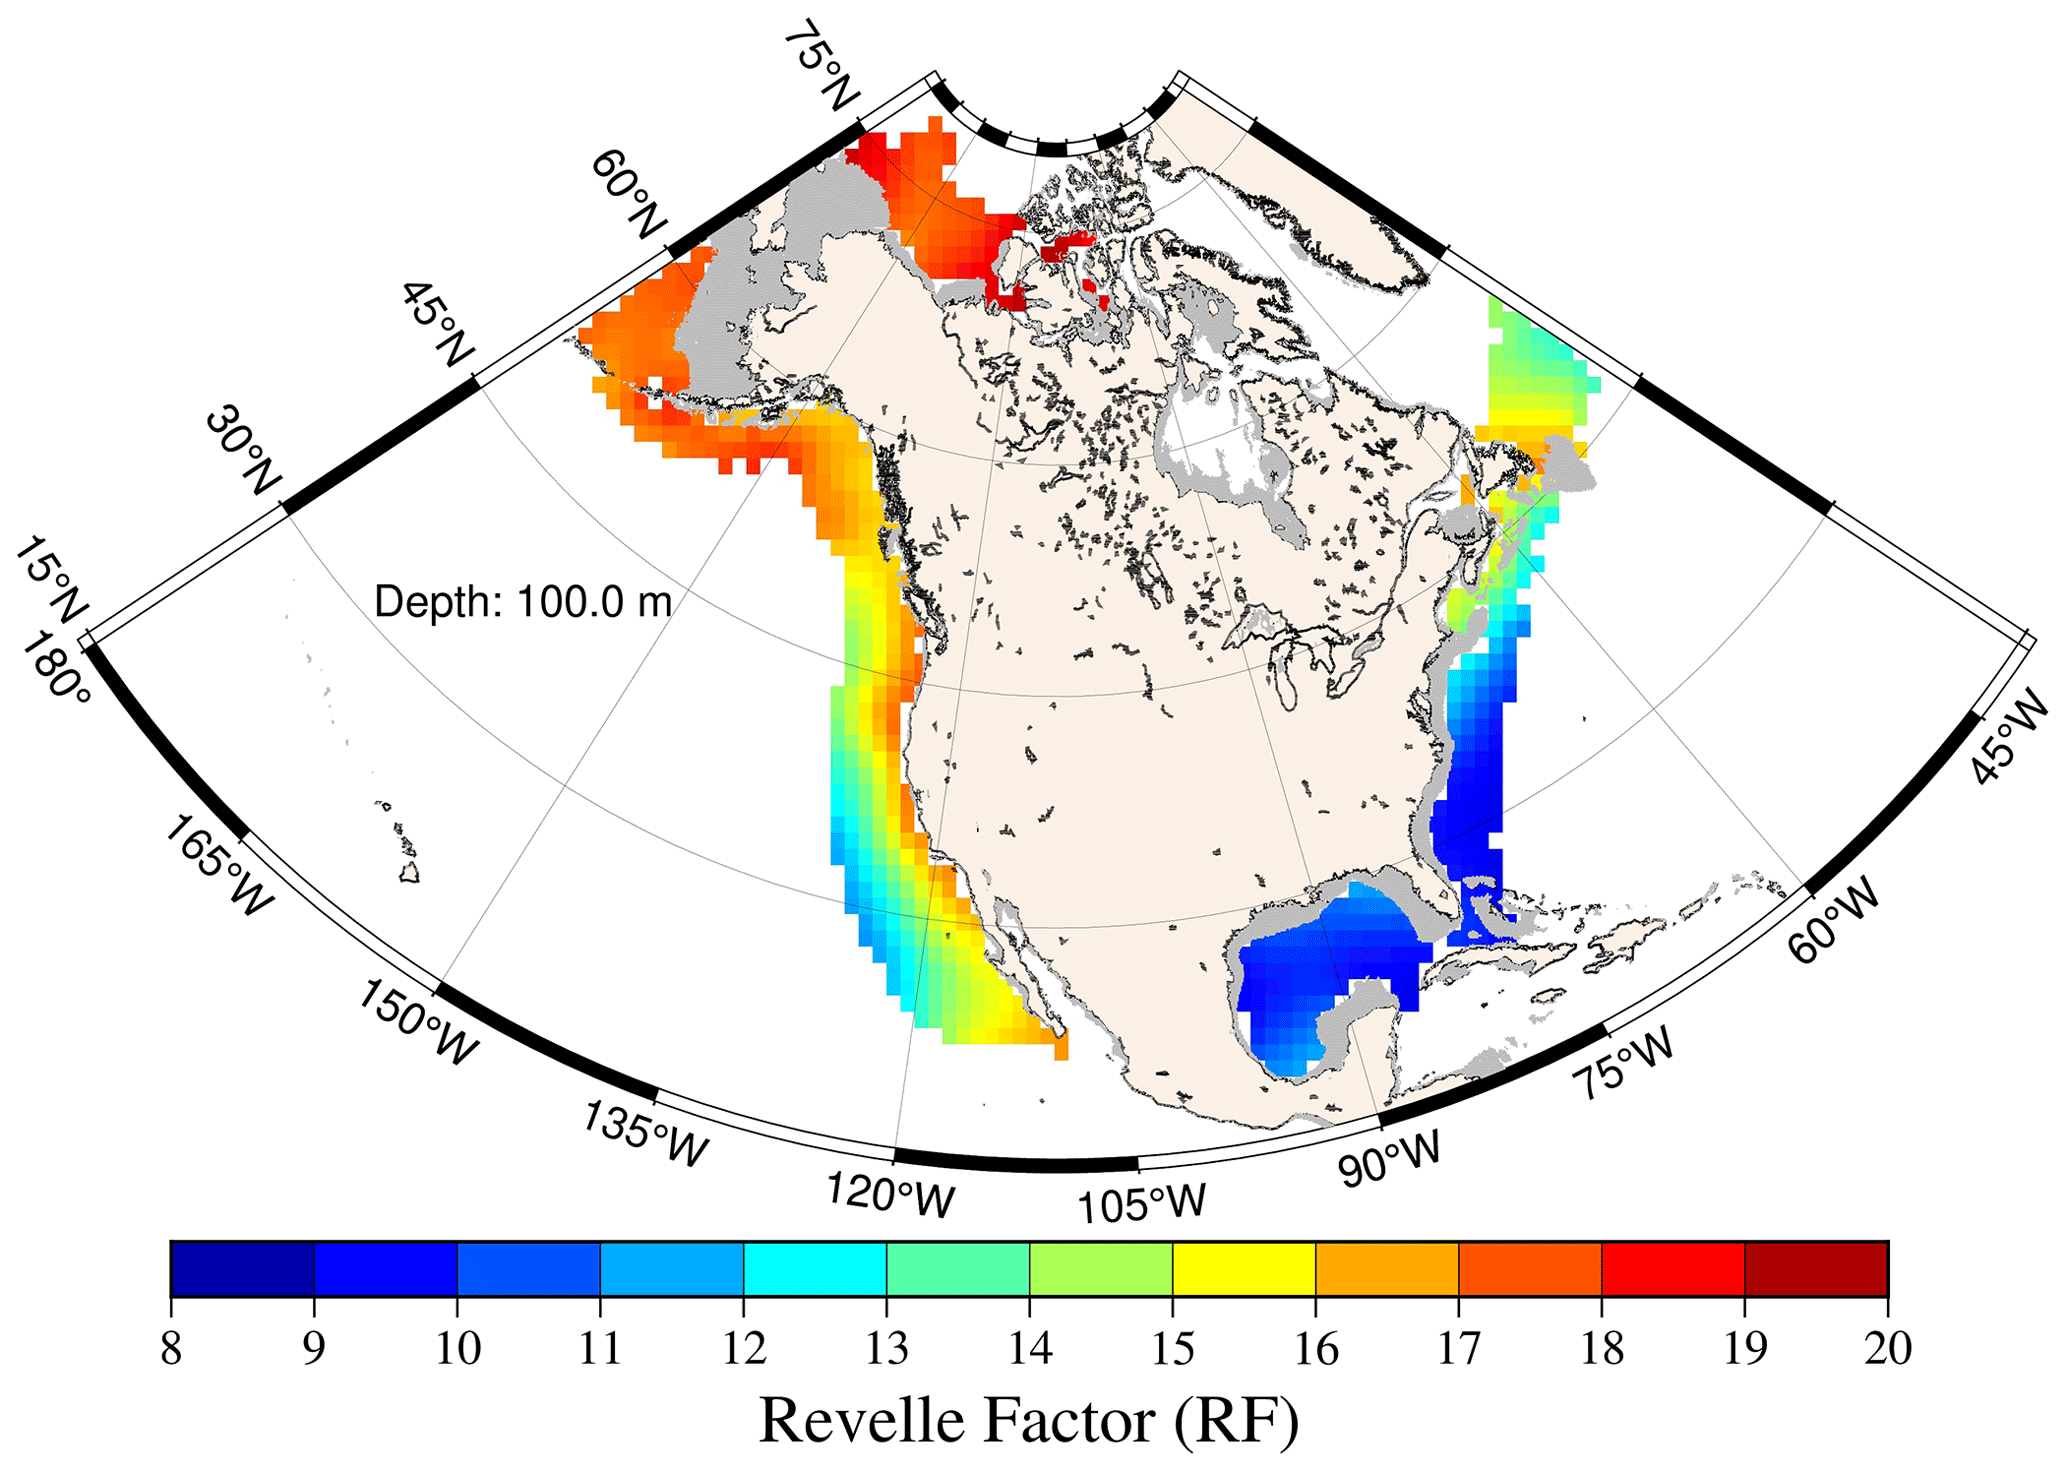
Figure 2Revelle factor at 100 m depth on the North American ocean margins.
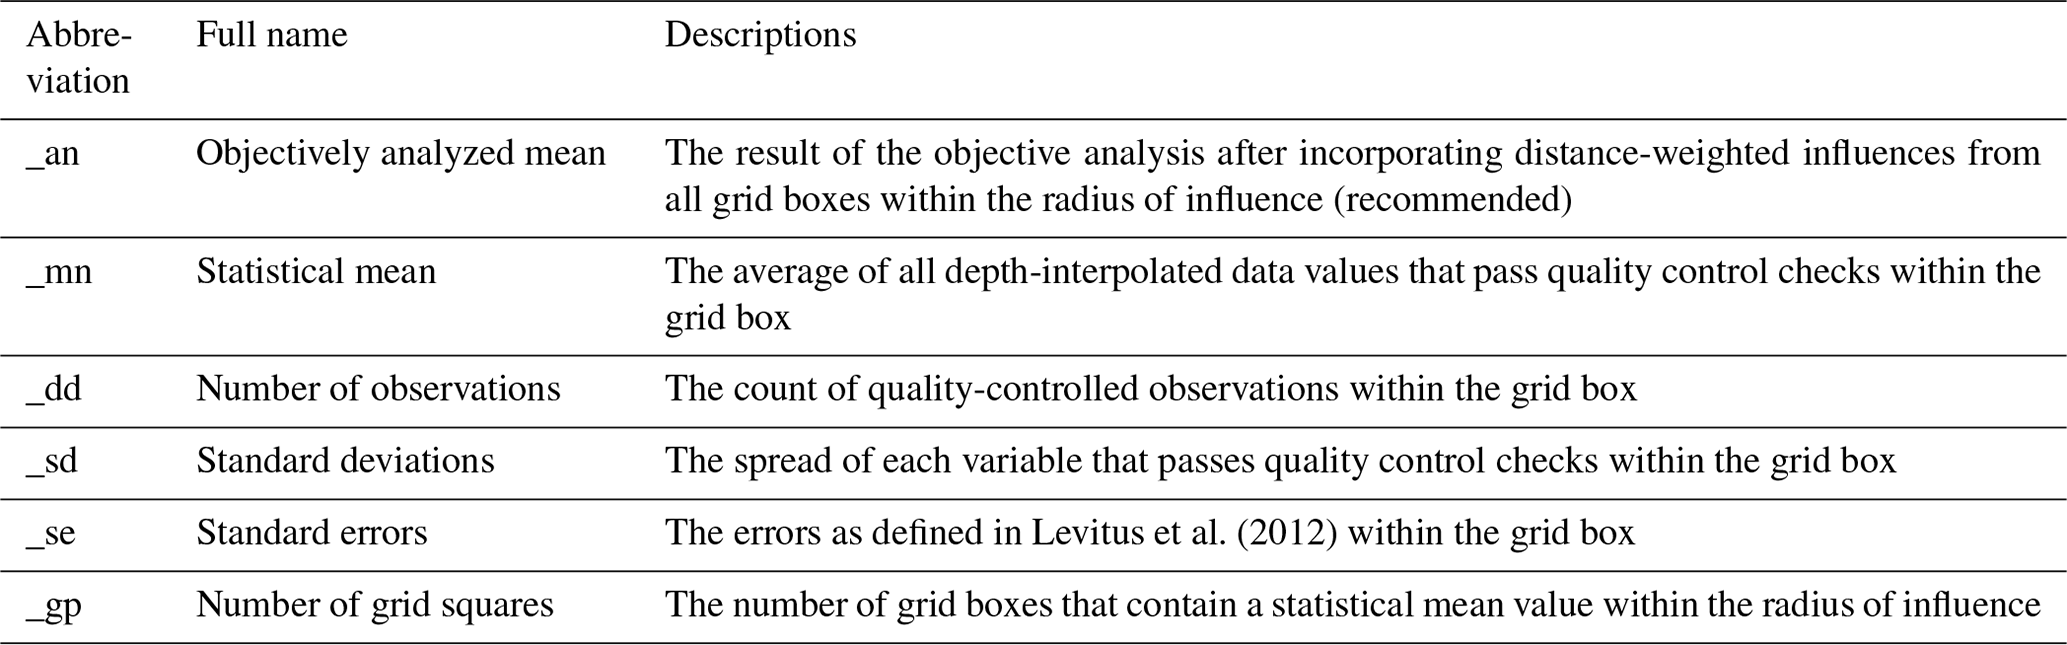
Table 2Gridding parameters for each variable within this data product. The leftmost column shows the abbreviations used in the NetCDF files.
Each grid box within the radius of influence, including the grid box being analyzed, contributes to this adjustment based on two factors: (a) the difference between the statistical mean of all observations (vertically interpolated from observations if necessary) and its first-guess field and (b) the distance between this grid box and the focal grid box. Refer to Reagan et al. (2023) and Boyer et al. (2005) for more details. The radius of influence was determined by physical oceanic factors such as the Rossby radius. Applying a three-pass analysis method pioneered by Barnes (1964), influence radii of 446, 669, and 892 km were utilized for this analysis, covering approximately four latitude–longitude lengths at the Equator (roughly 446 km, equivalent to approximately two Rossby radii of deformation) to eight latitude–longitude lengths in specific regions. This objective analysis method filters out shorter wavelengths (representative of noise in the mean field) to retain larger wavelength features (representative of general characteristics of the area).
In addition to the objectively analyzed means (recommended), other gridding parameters, e.g., statistical mean, number of observations, standard deviation, and standard error, were also generated and made available as part of this product (Jiang et al., 2022b). See Table 2 for their definitions. While these climatologies offer extensive spatial and vertical coverage, they provide only a static view of OA conditions referenced to 2010. Insufficient observational data precluded the delineation of seasonal or sub-annual variations. Furthermore, the data used for generating these climatologies were primarily collected during the summer and fall seasons. The atlases of this product were produced using the Generic Mapping Tools (GMT) software (Wessel et al., 2019). Refer to Figs. 1 and 2 for examples.
The produced climatologies (gridded data at standard depth levels) are available in NetCDF through NCEI's archive (NCEI accession no. 0270962, https://doi.org/10.25921/g8pb-zy76, Jiang et al., 2022b): https://www.ncei.noaa.gov/data/oceans/ncei/ocads/metadata/0270962.html.
Their corresponding atlases (plotted color maps based on the gridded data) of these variables at 14 standardized depth levels from the surface to 500 m are accessible through a web interface: https://www.ncei.noaa.gov/access/ocean-carbon-acidification-data-system/synthesis/nacoastal.html (last access: 15 July 2024).
In this study, we utilized the World Ocean Atlas (WOA) gridding methodologies from NOAA's National Centers for Environmental Information (NCEI) to generate a data product featuring coastal ocean acidification climatologies and atlases for North American ocean margins on 1° × 1° grids from the surface to 500 m. This product showcases 10 OA variables across 14 standardized depth levels: 0, 10, 20, 30, 50, 75, 100, 125, 150, 200, 250, 300, 400, and 500 m. The OA variables comprise the fugacity of carbon dioxide, pH on the total scale, total hydrogen ion content, free hydrogen ion content, carbonate ion content, aragonite saturation state, calcite saturation state, Revelle factor, total dissolved inorganic carbon content, and total alkalinity content, as well as temperature and salinity. The basis for this work is the recently released CODAP-NA, which encompasses 3391 oceanographic profiles from 61 research cruises, including 18 341 DIC measurements and 18 351 TA measurements, along with GLODAPv2.2021. All variables were adjusted to the year of 2010 before the gridding process.
All authors contributed to the writing of the paper. LQJ coordinated with the overall effort, performed the carbon system calculations, created the plots, and prepared the initial draft of the paper. TPB programmed the World Ocean Atlas tools and acting as a mentor to the team for gridded product creation. CRP developed the climatologies and conducted quality controlling for numerous parameters, including pH on the total scale, total and free hydrogen ions, carbonate ion, aragonite and calcite saturation states, and both total dissolved inorganic carbon and alkalinity. In a similar capacity, HY processed the fugacity of carbon dioxide and the Revelle factor. JRR and HY worked together to extract the climatologies for temperature and salinity out of WOA 2023. JRR offered essential programming assistance for the development of these climatologies. SRA, LB, BRC, RAF, and RW (listed alphabetically by surname) contributed data, determined the calculation and gridding approach, and provided guidance to LQJ throughout the process regarding this overall effort.
The contact author has declared that none of the authors has any competing interests.
Publisher's note: Copernicus Publications remains neutral with regard to jurisdictional claims made in the text, published maps, institutional affiliations, or any other geographical representation in this paper. While Copernicus Publications makes every effort to include appropriate place names, the final responsibility lies with the authors.
We thank Alex Kozyr (University of Maryland, partially funded by the National Oceanic and Atmospheric Administration (NOAA) Global Ocean Monitoring and Observing Program) for helping archive the final data product. We are grateful to Liem Nguyen (University of Maryland) for helping develop the visualization web interface. This is NOAA Pacific Marine Environmental Laboratory (NOAA/PMEL) contribution no. 5605 and the University of Washington Cooperative Institute for Climate, Ocean, and Ecosystem Studies (UW/CICOES) contribution no. 2024-1343.
Funding for Li-Qing Jiang is from the NOAA Ocean Acidification Program (OAP, https://ror.org/02bfn4816, last access: 15 July 2024) and the NOAA National Centers for Environmental Information (NCEI) through a NOAA Cooperative Institute for Satellite Earth System Studies (CISESS) grant (no. NA19NES4320002) at the Earth System Science Interdisciplinary Center (ESSIC), University of Maryland. Simone R. Alin and Richard A. Feely thank the NOAA Pacific Marine Environmental Laboratory for the salary support. Brendan R. Carter thanks the Carbon Data Management and Synthesis Grant (grant no. 100007298) from the NOAA's Global Ocean Monitoring and Observation division. This publication was partially funded by the Cooperative Institute for Climate, Ocean, and Ecosystem Studies (CICOES), University of Washington, under NOAA cooperative agreement no. NA20OAR4320271.
This paper was edited by Frédéric Gazeau and reviewed by Abed El Rahman Hassoun and one anonymous referee.
Andersson, A. J. and Gledhill, D.: Ocean acidification and coral reefs: Effects on breakdown, dissolution, and Net Ecosystem Calcification, Annu. Rev. Mar. Sci., 5, 321–348, https://doi.org/10.1146/annurev-marine-121211-172241, 2013.
Albright, R., Caldeira, L., Hosfelt, J., Kwiatkowski, L., Maclaren, J. K., Mason, B. M., Nebuchina, Y., Ninokawa, A., Pongratz, J., Ricke, K. L., Rivlin, T., Schneider, K., Sesboüé, M., Shamberger, K., Silverman, J., Wolfe, K., Zhu, K., and Caldeira, K.: Reversal of ocean acidification enhances net coral reef calcification, Nature, 531, 362–365, https://doi.org/10.1038/nature17155, 2016.
Barnes, S. L.: A technique for maximizing details in numerical weather-map analysis, J. Appl. Meteorol., 3, 396–409, 1964.
Boyer, T., Levitus, S., Garcia, H., Locarnini, R. A., Stephens, C., and Antonov, J.: Objective analyses of annual, seasonal, and monthly temperature and salinity for the world ocean on a 0.25° grid, Int. J. Climatol., 25, 931–945, https://doi.org/10.1002/joc.1173, 2005.
Broecker, W. S., Takahashi, T., Simpson, H. J., and Peng, T.-H.: Fate of fossil fuel carbon dioxide and the Global Carbon Budget, Science, 206, 409–418, https://doi.org/10.1126/science.206.4417.409, 1979.
Caldeira, K. and Wickett, M. E.: Anthropogenic carbon and ocean pH, Nature, 425, 365, https://doi.org/10.1038/425365a, 2003.
Carter, B. R., Bittig, H. C., Fassbender, A. J., Sharp, J. D., Takeshita, Y., Xu, Y., Álvarez, M., Wanninkhof, R., Feely, R. A., and Barbero, L.: New and updated global empirical seawater property estimation routines. Limnol. Oceanogr. Meth., 19, 785–809, https://doi.org/10.1002/lom3.10461, 2021.
Carter, B. R., Sharp, J. D., Dickson, A. G., Álvarez, M., Fong, M. B., García-Ibáñez, M. I., Woosley, R. J., Takeshita, Y., Barbero, L., Byrne, R. H., Cai, W., Chierici, M., Clegg, S. L., Easley, R. A., Fassbender, A. J., Fleger, K. L., Li, X., Martín-Mayor, M., Schockman, K. M., and Wang, Z. A.: Uncertainty sources for measurable ocean carbonate chemistry variables, Limnol. Oceanogr., 69, 1–21, https://doi.org/10.1002/lno.12477, 2023.
Cicin-Sain, B., Bernal, P., Vandeweerd, V., Belfiore, S., and Goldstein, K.: A Guide to Oceans, Coasts, and Islands at the World Summit on Sustainable Development, Center for the Study of Marine Policy, Newark, Delaware, August 2002.
Connell, S. D., Doubleday, Z. A., Foster, N. R., Hamlyn, S. B., Harley, C. D. G., Helmuth, B., Kelaher, B. P., Nagelkerken, I., Rodgers, K. L., Sarà, G., and Russell, B. D.: The duality of ocean acidification as a resource and a stressor, Ecology, 99, 1005–1010, https://doi.org/10.1002/ecy.2209, 2018.
Cooley, S. R. and Doney, S. C.: Anticipating ocean acidification's economic consequences for commercial fisheries, Environ. Res. Lett., 4, 024007, https://doi.org/10.1088/1748-9326/4/2/024007, 2009.
Costanza, R., de Groot, R., Sutton, P., van der Ploeg, S., Anderson, S. J., Kubiszewski, I., Farber, S., and Turner, R. K.: Changes in the global value of Ecosystem Services, Global Environ. Change, 26, 152–158, https://doi.org/10.1016/j.gloenvcha.2014.04.002, 2014.
de Groot, R., Brander, L., van der Ploeg, S., Costanza, R., Bernard, F., Braat, L., Christie, M., Crossman, N., Ghermandi, A., Hein, L., Hussain, S., Kumar, P., McVittie, A., Portela, R., Rodriguez, L. C., ten Brink, P., and van Beukering, P.: Global estimates of the value of ecosystems and their services in monetary units, Ecosyst. Serv., 1, 50–61, https://doi.org/10.1016/j.ecoser.2012.07.005, 2012.
DeVries, T.: The Ocean Carbon Cycle, Annu. Rev. Env. Resour., 47, 317–341, https://doi.org/10.1146/annurev-environ-120920-111307, 2022.
Dickson, A. G.: Standard potential of the reaction: AgCl(s) + 1/2 H2(g) = Ag(s) + HCl(aq), and the standard acidity constant of the ion HSO4− in synthetic seawater from 273.15 to 318.15 K, J. Chem. Thermodyn., 22, 113–127, https://doi.org/10.1016/0021-9614(90)90074-Z, 1990.
Doney, S. C., Fabry, V. J., Feely, R. A., and Kleypas, J. A.: Ocean acidification: the other CO2 problem, Annu. Rev. Mar. Sci., 1, 169–192, 2009.
Doney, S. C., Busch, D. S., Cooley, S. R., and Kroeker, K. J.: The impacts of ocean acidification on marine ecosystems and reliant human communities. Annu. Rev. Env. Resour., 45, 83–112, https://doi.org/10.1146/annurev-environ-012320-083019, 2020.
Feely, R. A., Sabine, C. L., Lee, K., Berelson, W., Kleypas, J., Fabry, V. J., and Millero, F. J.: Impact of anthropogenic CO2 on the CaCO3 system in the oceans, Science, 305, 362–366, 2004.
Feely, R. A., Jiang, L.-Q., Wanninkhof, R., Carter, B. R., Alin, S. R., Bednaršek, N., and Cosca, C. E.: Acidification of the global surface ocean: What we have learned from observations, Oceanography, 36, 120–129, https://doi.org/10.5670/oceanog.2023.222, 2023.
Friedlingstein, P., O'Sullivan, M., Jones, M. W., Andrew, R. M., Bakker, D. C. E., Hauck, J., Landschützer, P., Le Quéré, C., Luijkx, I. T., Peters, G. P., Peters, W., Pongratz, J., Schwingshackl, C., Sitch, S., Canadell, J. G., Ciais, P., Jackson, R. B., Alin, S. R., Anthoni, P., Barbero, L., Bates, N. R., Becker, M., Bellouin, N., Decharme, B., Bopp, L., Brasika, I. B. M., Cadule, P., Chamberlain, M. A., Chandra, N., Chau, T.-T.-T., Chevallier, F., Chini, L. P., Cronin, M., Dou, X., Enyo, K., Evans, W., Falk, S., Feely, R. A., Feng, L., Ford, D. J., Gasser, T., Ghattas, J., Gkritzalis, T., Grassi, G., Gregor, L., Gruber, N., Gürses, Ö., Harris, I., Hefner, M., Heinke, J., Houghton, R. A., Hurtt, G. C., Iida, Y., Ilyina, T., Jacobson, A. R., Jain, A., Jarníková, T., Jersild, A., Jiang, F., Jin, Z., Joos, F., Kato, E., Keeling, R. F., Kennedy, D., Klein Goldewijk, K., Knauer, J., Korsbakken, J. I., Körtzinger, A., Lan, X., Lefèvre, N., Li, H., Liu, J., Liu, Z., Ma, L., Marland, G., Mayot, N., McGuire, P. C., McKinley, G. A., Meyer, G., Morgan, E. J., Munro, D. R., Nakaoka, S.-I., Niwa, Y., O'Brien, K. M., Olsen, A., Omar, A. M., Ono, T., Paulsen, M., Pierrot, D., Pocock, K., Poulter, B., Powis, C. M., Rehder, G., Resplandy, L., Robertson, E., Rödenbeck, C., Rosan, T. M., Schwinger, J., Séférian, R., Smallman, T. L., Smith, S. M., Sospedra-Alfonso, R., Sun, Q., Sutton, A. J., Sweeney, C., Takao, S., Tans, P. P., Tian, H., Tilbrook, B., Tsujino, H., Tubiello, F., van der Werf, G. R., van Ooijen, E., Wanninkhof, R., Watanabe, M., Wimart-Rousseau, C., Yang, D., Yang, X., Yuan, W., Yue, X., Zaehle, S., Zeng, J., and Zheng, B.: Global Carbon Budget 2023, Earth Syst. Sci. Data, 15, 5301–5369, https://doi.org/10.5194/essd-15-5301-2023, 2023.
Garcia, H. E., Weathers, K., Paver, C. R., Smolyar, I., Boyer, T. P., Locarnini, R. A., Zweng, M. M., Mishonov, A. V., Baranova, O. K., Seidov, D., and Reagan, J. R.: World Ocean Atlas 2018, Volume 3: Dissolved Oxygen, Apparent Oxygen Utilization, and Oxygen Saturation, A. Mishonov Technical Ed., NOAA Atlas NESDIS 83, 38 pp., 2018.
Gattuso, J.-P. and Hansson, L.: Ocean acidification, 326 pp., Oxford University Press, https://doi.org/10.1093/oso/9780199591091.001.0001, 2011.
Gattuso, J.-P., Magnan, A., Bille, R., Cheung, W. W. L., Howes, E. L., Joos, F., Allemand, D., Bopp, L., Cooley, S. R., Eakin, C. M., Hoegh-Guldberg, O., Kelly, R. P., Portner, H.-O., Rogers, A. D., Baxter, J. M., Laffoley, D., Osborn, D., Rankovic, A., Rochette, J., Sumaila, U. R., Treyer, S., and Turley, C.: Contrasting futures for ocean and society from different anthropogenic CO2 emissions scenarios, Science, 349, aac4722, https://doi.org/10.1126/science.aac4722, 2015.
Gruber, N., Clement, D., Carter, B. R., Feely, R. A., van Heuven, S., Hoppema, M., Ishii, M., Key, R. M., Kozyr, A., Lauvset, S. K., Lo Monaco, C., Mathis, J. T., Murata, A., Olsen, A., Perez, F. F., Sabine, C. L., Tanhua, T., and Wanninkhof, R.: The oceanic sink for anthropogenic CO2 from 1994 to 2007, Science, 363, 1193–1199, https://doi.org/10.1126/science.aau5153, 2019.
Humphreys, M. P., Orr, J. C., van Heuven, S. M. A. C., Pierrot, D., Lewis, E. R., and Wallace, D. W. R.: mvdh7/CO2System.jl: CO2System.jl: CO2SYS in Julia (v2.0.5-jl.1), Zenodo, https://doi.org/10.5281/zenodo.6395674, 2022.
Jiang, L.-Q., Carter, B., Feely, R. A., Lauvset, S., and Olsen, A., Surface ocean pH and buffer capacity: past, present and future, Nature Scientific Reports, 9, 18624, https://doi.org/10.1038/s41598-019-55039-4, 2019.
Jiang, L.-Q., Feely, R. A., Wanninkhof, R., Greeley, D., Barbero, L., Alin, S., Carter, B. R., Pierrot, D., Featherstone, C., Hooper, J., Melrose, C., Monacci, N., Sharp, J. D., Shellito, S., Xu, Y.-Y., Kozyr, A., Byrne, R. H., Cai, W.-J., Cross, J., Johnson, G. C., Hales, B., Langdon, C., Mathis, J., Salisbury, J., and Townsend, D. W.: Coastal Ocean Data Analysis Product in North America (CODAP-NA) – an internally consistent data product for discrete inorganic carbon, oxygen, and nutrients on the North American ocean margins, Earth Syst. Sci. Data, 13, 2777–2799, https://doi.org/10.5194/essd-13-2777-2021, 2021.
Jiang, L.-Q., Pierrot, D., Wanninkhof, R., Feely, R. A., Tilbrook, B., Alin, S., Barbero, L., Byrne, R. H., Carter, B. R., Dickson, A. G., Gattuso, J.-P., Greeley, D., Hoppema, M., Humphreys, M. P., Karstensen, J., Lange, N., Lauvset, S. K., Lewis, E. R., Olsen, A., Perez, F. F., Sabine, C. L., Sharp, J. D., Tanhua, T., Trull, T. W., Velo, A., Allegra, A. J., Barker, P., Burger, E., Cai, W.-J., Chen, C.-T., A., Cross, J., Garcia, H., Hernandez-Ayon, J. M., Hu, X., Kozyr, A., Langdon, C., Lee, K., Salisbury, J., Wang, Z. A., and Xue, L.: Best practice data standards for discrete chemical oceanographic observations, Front. Mar. Sci., 8, 705638, https://doi.org/10.3389/fmars.2021.705638, 2022a.
Jiang, L.-Q., Boyer, T. P., Paver, C. R., Reagan, J. R., Alin, S. R., Barbero, L., Carter, B. R., Feely, R. A., and Wanninkhof, R.: Climatological distribution of ocean acidification indicators from surface to 500 meters water depth on the North American ocean margins from 2003-12-06 to 2018-11-22 (NCEI Accession 0270962), NOAA National Centers for Environmental Information [data set], https://doi.org/10.25921/g8pb-zy76, 2022b.
Jiang, L.-Q., Dunne, J., Carter, B. R., Tjiputra, J. F., Terhaar, J., Sharp, J. D., Olsen, A., Alin, S., Bakker, D. C. E., Feely, R. A., Gattuso, J.-P., Hogan, P., Ilyina, T., Lange, N., Lauvset, S. K., Lewis, E. R., Lovato, T., Palmieri, J., Santana-Falcón, Y., Schwinger, J., Séférian, R., Strand, G., Swart, N., Tanhua, T., Tsujino, H., Wanninkhof, R., Watanabe, M., Yamamoto, A., and Ziehn, T.: Global surface ocean acidification indicators from 1750 to 2100, J. Adv. Model. Earth Sy., 15, e2022MS003563, https://doi.org/10.1029/2022MS003563, 2023.
Kawahata, H., Fujita, K., Iguchi, A., Inoue, M., Iwasaki, S., Kuroyanagi, A., Maeda, A., Manaka, T., Moriya, K., Takagi, H., Toyofuku, T., Yoshimura, T., and Suzuki, A.: Perspective on the response of marine calcifiers to global warming and ocean acidification – Behavior of corals and foraminifera in a high CO2 world “hot house”, Prog. Earth Planet. Sc., 6, 5, https://doi.org/10.1186/s40645-018-0239-9, 2019.
Kubiszewski, I., Costanza, R., Anderson, S., and Sutton, P.: The future value of ecosystem services: Global scenarios and national implications, Ecosyst. Serv., 26, 289–301, https://doi.org/10.1016/j.ecoser.2017.05.004, 2017.
Lauvset, S. K., Key, R. M., Olsen, A., van Heuven, S., Velo, A., Lin, X., Schirnick, C., Kozyr, A., Tanhua, T., Hoppema, M., Jutterström, S., Steinfeldt, R., Jeansson, E., Ishii, M., Perez, F. F., Suzuki, T., and Watelet, S.: A new global interior ocean mapped climatology: the 1° × 1° GLODAP version 2, Earth Syst. Sci. Data, 8, 325–340, https://doi.org/10.5194/essd-8-325-2016, 2016.
Lauvset, S. K., Lange, N., Tanhua, T., Bittig, H. C., Olsen, A., Kozyr, A., Álvarez, M., Becker, S., Brown, P. J., Carter, B. R., Cotrim da Cunha, L., Feely, R. A., van Heuven, S., Hoppema, M., Ishii, M., Jeansson, E., Jutterström, S., Jones, S. D., Karlsen, M. K., Lo Monaco, C., Michaelis, P., Murata, A., Pérez, F. F., Pfeil, B., Schirnick, C., Steinfeldt, R., Suzuki, T., Tilbrook, B., Velo, A., Wanninkhof, R., Woosley, R. J., and Key, R. M.: An updated version of the global interior ocean biogeochemical data product, GLODAPv2.2021, Earth Syst. Sci. Data, 13, 5565–5589, https://doi.org/10.5194/essd-13-5565-2021, 2021.
Lee, K., Kim, T.-W., Byrne, R. H., Millero, F. J., Feely, R. A., and Liu, Y.-M.: The universal ratio of boron to chlorinity for the North Pacific and North Atlantic oceans. Geochim. Cosmochim. Ac., 74, 1801–1811, https://doi.org/10.1016/j.gca.2009.12.027, 2010.
Levitus, S.: Climatological Atlas of the World Ocean, in: NOAA Professional Paper No. 13, U.S. Department of Commerce, National Oceanic and Atmospheric Administration, Rockwell, MD173, 1982.
Levitus, S. and Boyer, T. P.: World Ocean Atlas, vol. 4, Temperature, NOAA Atlas NESDIS 4, National Oceanic and Atmospheric Administration, Silver Spring, Md., 1994.
Levitus, S., Antonov, J. I., Boyer, T. P., Baranova, O. K., Garcia, H. E., Locarnini, R. A., Mishonov, A. V., Reagan, J. R., Seidov, D., Yarosh, E. S., and Zweng, M. M.: World Ocean Heat content and thermosteric sea level change (0–2000 m), 1955–2010, Geophys. Res. Lett., 39, https://doi.org/10.1029/2012gl051106, 2012.
Lewis, E. and Wallace, D. W. R.: Program Developed for CO2 System Calculations, ORNL/CDIAC-105 (Carbon Dioxide Information Analysis Center, Oak Ridge National Laboratory, U. S. Department of Energy, Oak Ridge, Tennessee, 1998.
Locarnini, R. A., Mishonov, A. V., Baranova, O. K., Boyer, T. P., Zweng, M. M., Garcia, H. E., Reagan, J. R., Seidov, D., Weathers, K., Paver, C. R., and Smolyar, I.: World Ocean Atlas 2018, Volume 1: Temperature, A. Mishonov Technical Ed., NOAA Atlas NESDIS 81, 52 pp., 2018.
Lueker, T. J., Dickson, A. G., and Keeling, C. D.: Ocean pCO2 calculated from dissolved inorganic carbon, alkalinity, and equations for K1 and K2: validation based on laboratory measurements of CO2 in gas and seawater at equilibrium, Mar. Chem., 70, 105–119, 2000.
Ma, D., Gregor, L., and Gruber, N.: Four decades of trends and drivers of global surface ocean acidification, Global Biogeochem. Cy., 37, e2023GB007765, https://doi.org/10.1029/2023gb007765, 2023.
Millero, F. J.: Thermodynamics of the carbon dioxide system in the oceans, Geochim. Cosmochim. Ac., 59, 661–677, 1995.
Orr, J. C., Fabry, V. J., Aumont, O., Bopp, L., Doney, S. C., Feely, R. A., Gnanadesikan, A., Gruber, N., Ishida, A., Joos, F., Key, R. M., Lindsay, K., Maier-Reimer, E., Matear, R., Monfray, P., Mouchet, A., Najjar, R. G., Plattner, G.-K., Rodgers, K. B., Sabine, C. L., Sarmiento, J. L., Schlitzer, R., Slater, R. D., Totterdell, I. J., Weirig, M.-F., Yamanaka, Y., and Yool, A.: Anthropogenic ocean acidification over the twenty-first century and its impact on calcifying organisms, Nature, 437, 681–686, https://doi.org/10.1038/nature04095, 2005.
Perez, F. F. and Fraga, F.: Association constant of fluoride and hydrogen ions in seawater, Mar. Chem., 21, 161–168, https://doi.org/10.1016/0304-4203(87)90036-3, 1987.
Reagan, J. R., Seidov, D., Wang, Z., Dukhovskoy, D., Boyer, T. P., Locarnini, R. A., Baranova, O. K., Mishonov, A. V., Garcia, H. E., Bouchard, C., Cross, S. L., and Paver, C. R.: World Ocean Atlas 2023, Volume 2: Salinity, A. Mishonov, Technical Editor, NOAA Atlas NESDIS 90, https://doi.org/10.25923/70qt-9574, 2023.
Reiniger, R. F. and Ross, C. F.: A method of interpolation with application to oceanographic data, Deep-Sea Res., 9, 185–193, 1968.
Revelle, R. and Suess, H. E.: Carbon dioxide exchange between atmosphere and ocean and the question of an increase of atmospheric CO2 during the past decades, Tellus, 9, 18–27, https://doi.org/10.1111/j.2153-3490.1957.tb01849.x, 1957.
Richardson, K., Steffen, W., Lucht, W., Bendtsen, J., Cornell, S. E., Donges, J. F., Drüke, M., Fetzer, I., Bala, G., von Bloh, W., Feulner, G., Fiedler, S., Gerten, D., Gleeson, T., Hofmann, M., Huiskamp, W., Kummu, M., Mohan, C., Nogués- Bravo, D., Petri, S., Porkka, M., Rahmstorf, S., Schaphoff, S., Thonicke, K., Tobian, A., Virkki, V., Weber, L., and Rockström, J.: Earth beyond six of nine planetary boundaries, Sci. Adv., 9, 1–16, https://doi.org/10.1126/sciadv.adh2458, 2023.
Tickler, D., Meeuwig, J. J., Palomares, M.-L., Pauly, D., and Zeller, D.: Far from home: Distance Patterns of Global Fishing Fleets, Sci. Adv., 4, eaar3279, https://doi.org/10.1126/sciadv.aar3279, 2018.
Wessel, P., Luis, J. F., Uieda, L., Scharroo, R., Wobbe, F., Smith, W. H., and Tian, D.: The generic mapping tools version 6, Geochem. Geophy. Geosy., 20, 5556–5564, https://doi.org/10.1029/2019gc008515, 2019.
Zweng, M. M., Reagan, J. R., Seidov, D., Boyer, T. P., Locarnini, R. A., Garcia, H. E., Mishonov, A. V., Baranova, O. K., Weathers, K., Paver, C. R., and Smolyar, I.: World Ocean Atlas 2018, Volume 2: Salinity, A. Mishonov Technical Ed., NOAA Atlas NESDIS 82, 50 pp., 2018.