the Creative Commons Attribution 4.0 License.
the Creative Commons Attribution 4.0 License.
 | 01 Jul 2024
A global forest burn severity dataset from Landsat imagery (2003–2016)
Kang He
Xinyi Shen
Emmanouil N. Anagnostou
Forest fires, while destructive and dangerous, are important to the functioning and renewal of ecosystems. Over the past 2 decades, large-scale, severe forest fires have become more frequent globally, and the risk is expected to increase as fire weather and drought conditions intensify. To improve quantification of the intensity and extent of forest fire damage, we have developed a 30 m resolution global forest burn severity (GFBS) dataset of the degree of biomass consumed by fires from 2003 to 2016. To develop this dataset, we used the Global Fire Atlas product to determine when and where forest fires occurred during that period and then we overlaid the available Landsat surface reflectance products to obtain pre-fire and post-fire normalized burn ratios (NBRs) for each burned pixel, designating the difference between them as dNBR and the relative difference as RdNBR. We compared the GFBS dataset against the Canada Landsat Burned Severity (CanLaBS) product, showing better agreement than the existing Moderate Resolution Imaging Spectrometer (MODIS)-based global burn severity dataset (MOdis burn SEVerity, MOSEV) in representing the distribution of forest burn severity over Canada. Using the in situ burn severity category data available for the 2013 wildfires in southeastern Australia, we demonstrated that GFBS could provide burn severity estimation with clearer differentiation between the high-severity and moderate-/low-severity classes, while such differentiation among the in situ burn severity classes is not captured in the MOSEV product. Using the CONUS-wide composite burn index (CBI) as a ground truth, we showed that dNBR from GFBS was more strongly correlated with CBI (r=0.63) than dNBR from MOSEV (r=0.28). RdNBR from GFBS also exhibited better agreement with CBI (r=0.56) than RdNBR from MOSEV (r=0.20). On a global scale, while the dNBR and RdNBR spatial patterns extracted by GFBS are similar to those of MOSEV, MOSEV tends to provide higher burn severity levels than GFBS. We attribute this difference to variations in reflectance values and the different spatial resolutions of the two satellites. The GFBS dataset provides a more precise and reliable assessment of burn severity than existing available datasets. These enhancements are crucial for understanding the ecological impacts of forest fires and for informing management and recovery efforts in affected regions worldwide. The GFBS dataset is freely accessible at https://doi.org/10.5281/zenodo.10037629 (He et al., 2023).
- Article
(13771 KB) - Full-text XML
- BibTeX
- EndNote


In recent years, many regions around the world have experienced an increase in the frequency, intensity, and extent of wildfires (Doerr and Santín, 2016; Shukla et al., 2019; Dupuy et al., 2020). Wildfires are now among the most popular research topics as a result of this rising global concern, which is further heightened by changes expected in fire regimes as a consequence of changes in climate and land use (Moreira et al., 2020). While most wildfires occur in grasslands and savannas (Scholes and Archer, 1997; Abreu et al., 2017), forest fires are more dangerous and destructive and perhaps of greater interest because of their importance to the functioning and renewal of ecosystems (Flannigan et al., 2000, 2006; Nasi et al., 2002). Changes brought by the warming climate, which has dried fuels and lengthened fire seasons across the globe (Jolly et al., 2015), are also particularly significant to forested ecosystems with abundant fuels (Kasischke and Turetsky, 2006; Aragão et al., 2018).
With the rapid development of remote sensing techniques, more frequent observations from satellites facilitate the monitoring of global fire activities. The valuable information they provide at fine spatial and temporal resolutions can be used to study the number and size distributions of individual fires (Archibald and Roy, 2009; Hantson et al., 2015; Oom et al., 2016), fire shapes (Nogueira et al., 2016; Laurent et al., 2018), and locations of ignition points (Benali et al., 2016; Fusco et al., 2016). Among the most widely accepted techniques are those based on the Moderate Resolution Imaging Spectrometer (MODIS) (Chuvieco et al., 2016), which retrieves information on the entire Earth in 36 spectral bands every 1 to 2 d. The MODIS-derived burn area (BA) products are essential for ascertaining the patterns of fire occurrence, extent, propagation (Rodrigues and Febrer, 2018), and frequency (Andela et al., 2019). Based on these products, an essential indicator called “burn severity” has been derived to determine the degree of biomass consumption and the overall impact of fire on ecosystems (Keeley, 2009).
Traditionally, burn severity could be quantified from satellite sensors through spectrum information. The changes caused by fire to near-infrared (NIR) and shortwave-infrared (SWIR) reflectance are highly sensitive to, respectively, canopy density and moisture content (Chuvieco et al., 2010). Several burn severity datasets have been generated and released based on this method. Regionally, the Monitoring Trends in Burn Severity (MTBS) dataset, which includes burn severity assessments for the contiguous United States (CONUS) and provides information on fire perimeters and severity classes, uses satellite data – specifically Landsat imagery (Eidenshink et al., 2007). Similarly, the Canadian Landsat Burn Severity (CanLaBS) product uses Landsat imagery to assess and map burn severity on a national scale (Guindon et al., 2021). Globally, MOdis burn SEVerity (MOSEV) has provided monthly burn severity data with global coverage at a 500 m spatial resolution based on MODIS Terra and Aqua satellites (Alonso-González and Fernández-García, 2021). However, a dataset for assessing and mapping global forest burn severity based on Landsat at a high spatial resolution (30 m resolution) is not yet available. Such a product would support advances in fire management strategies and ecosystem conservation efforts, leading to more resilient and sustainable landscapes.
In this paper, we describe a new global dataset comprising information on burn severity derived at a high spatial resolution (30 m) from Landsat imagery from the period 2003–2016. This dataset represents a step forward in quantifying and analyzing wildfire impact on forest ecosystems worldwide. We begin with a section detailing the input data and the algorithm used to process the dataset, as well as the analytical techniques employed. The following section presents the characteristics of the dataset and its performance in representing the distribution of forest fires. In the Results section, we analyze the advantages and disadvantages of the dataset and set forth its main contributions to forest fire management strategies worldwide. The last section summarizes the primary findings and suggests possible implications of the dataset.
Below, we delineate the specifics of data input and pre-processing and the analytical techniques we employed to create the dataset. The Global Fire Atlas was the main source of global fire records, which was overlaid with annual land cover types from Moderate Resolution Imaging Spectroradiometer (MODIS) Land Cover Type (MCD12Q1) to determine when and where forest fires occurred. We then utilized the reflectance information from Landsat's satellite archives to calculate burn severity indices for the burned forest areas. Finally, we compared GFBS with the CanLaBS dataset available over Canada and used the field-assessed burn severity category data in southeastern Australia and the CONUS-wide composite burn index (CBI) as the ground truth to evaluate the performance of GFBS relative to that of the existing MODIS-based global burn severity dataset (MOSEV).
2.1 Input data
The input data we used to build the GFBS dataset comprised the fire records available in the Global Fire Atlas for the years 2003–2016 and all Landsat images for the same period.
The Global Fire Atlas tracks the daily dynamics of individual fires globally to determine the time and location of ignition, area burned, and duration as well as daily expansion, fireline length, velocity, and direction of spread. A detailed description of its underlying methodology is provided by Andela et al. (2019).
The Terra and Aqua combined Moderate Resolution Imaging Spectroradiometer (MODIS) Land Cover Type (MCD12Q1) version 6.1 data product provides global land cover types at yearly intervals (Friedl and Sulla-Menashe, 2022). With its global coverage and the insights it offers into the planet's diversity of land cover types, the MCD12Q1 dataset is pivotal to various ecological and environmental studies.
The Landsat 5, 7, and 8 scenes are 16 d composite images with 7, 8, and 11 surface reflectance bands, respectively. With its 30 m resolution and global coverage, it provides a high-quality, atmospherically corrected snapshot of the Earth's surface. The use of the best available observations gathered over the 16 d period ensures the image is as clear and accurate as possible, minimizing issues such as cloud cover that can obscure the satellite's view (https://developers.google.com/earth-engine/datasets/catalog/landsat, last access: 16 July 2023).
2.2 Pre-processing
To pre-process the data, we first imported individual fire polygons from the Global Fire Atlas into the Google Earth Engine (GEE) and then collected the most recent Landsat images based on the tags demarcating the start and end times of each individual fire. We applied a cloud-and-snow-masking algorithm to remove any snow, clouds, and their shadows from all imagery based on each sensor's pixel quality assessment band. By mosaicking the masked images, we created a composite with the smallest possible cloud and shadow extent (https://developers.google.com/earth-engine/guides/landsat, last access: 16 July 2023).
2.3 Algorithm overview
In the first step, we determined the forest fire polygons using the Global Fire Atlas data associated with the MCD12Q1 land cover data and then utilized reflectance information from Landsat's satellite archives to obtain the forest fire NBRs from the Landsat composites. Healthy plants absorb most of the visible light (for photosynthesis) while reflecting a large portion of the near-infrared (NIR) light. In contrast, areas that have been burned exhibit low NIR reflectance and high shortwave-infrared (SWIR) reflectance (Key and Benson, 2003; Montero et al., 2023). This change in spectral properties is due to the loss of vegetation and the exposure of the underlying soil and charred material, which have different reflective characteristics. By computing this ratio for images taken before and after a fire, it's possible to determine the extent and severity of the burn (Cocke et al., 2005; Alcaras et al., 2022).
In the second step, we used the pre- and post-fire dates by the Global Fire Atlas data to obtain the corresponding pre- and post-fire NBRs, which allowed us to create the burn severity indices – that is, dNBR and RdNBR – based on the respective differences between them.
We took additional steps to validate the performance of the dataset by comparing the burn severity category data over southeastern Australia and CBIs over CONUS with those based on the MOSEV dataset. These steps are detailed in Sect. 2.3.1–2.3.3.
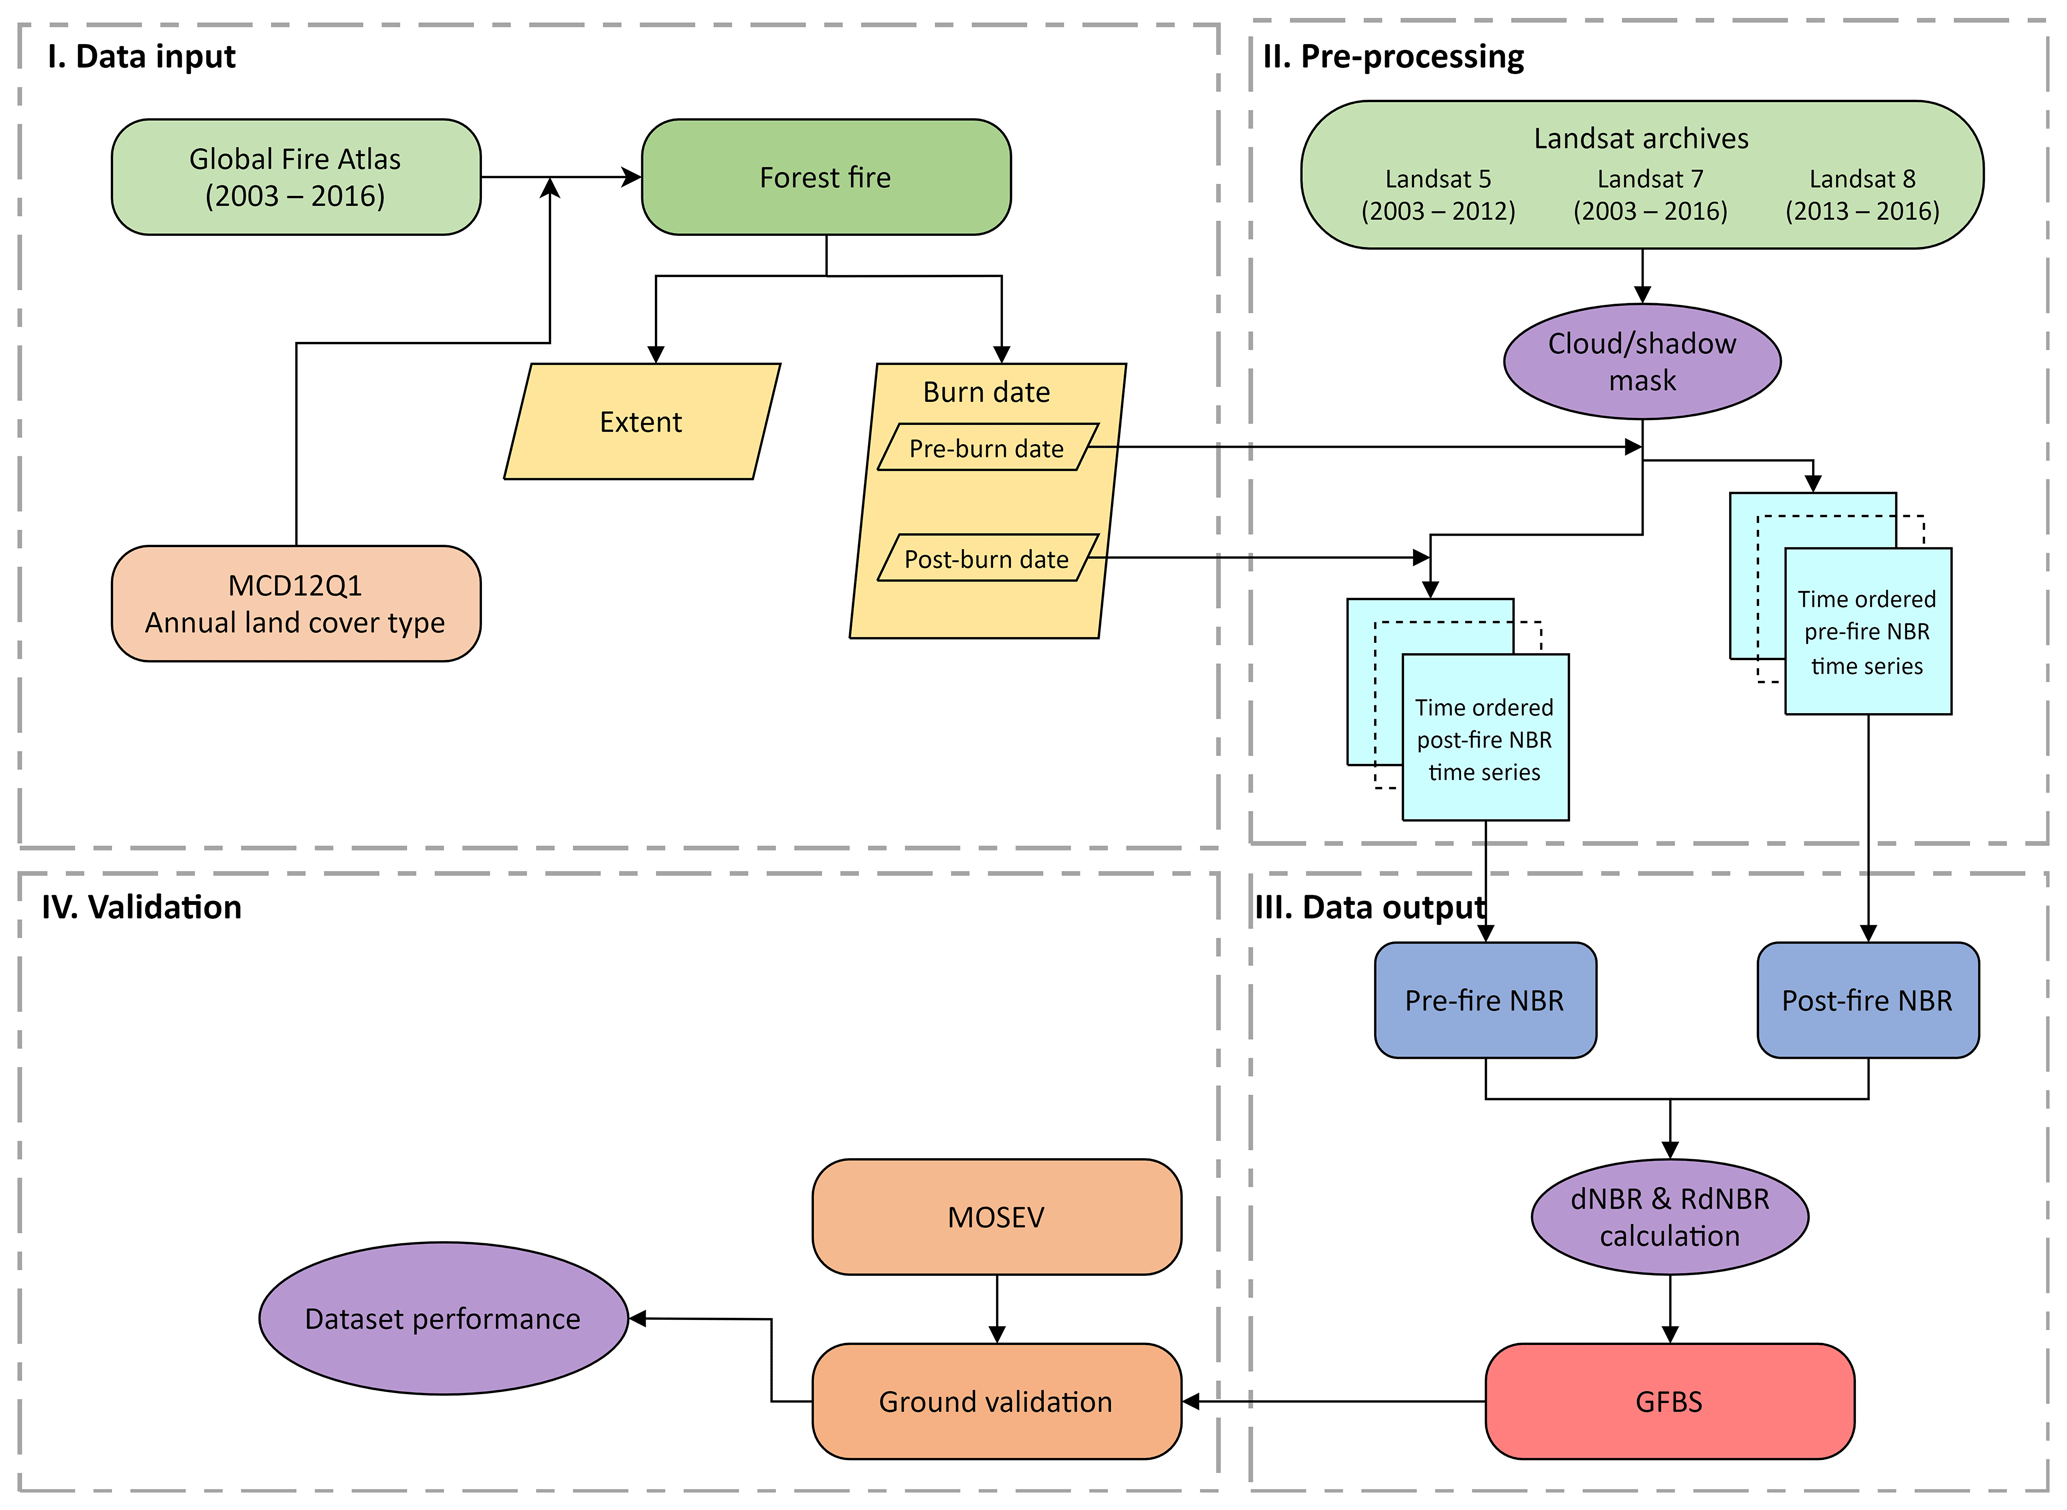
Figure 1Methodology for building the GFBS database (2003–2016) and validation and comparison with the MOSEV benchmark.
2.3.1 Identification of global forest fires
To identify global forest fires, we first overlaid the fire polygons from the Global Fire Atlas with MCD12Q1 data from the corresponding year. Based on annual International Geosphere–Biosphere Programme (IGBP) classifications of land cover, we identified a forest fire polygon within each area where we found forest to be the dominant land cover type within the fire extent – that is, wherever the proportion of burned pixels representing forest, including evergreen needleleaf forests, evergreen broadleaf forests, deciduous needleleaf forests, deciduous broadleaf forests, and mixed forests, was largest relative to the proportion of burned pixels for other land cover types, such as shrublands and grasslands.
2.3.2 Estimation of the normalized burn ratio (NBR)
We calculated the normalized burn ratio (NBR) spectral index for each Landsat composite according to the formula in Eq. (1) (https://www.usgs.gov/landsat-missions/landsat-normalized-burn-ratio, last access: 27 September 2023).
In Landsat series 4 through 7, we collected NIR information from Band 4 and SWIR information from Band 7. In Landsat 8, we collected NIR information from Band 5 and SWIR information from Band 7.
2.3.3 Estimation of dNBR and RdNBR
Having obtained burn area locations and burn dates from the Global Fire Atlas product, we selected from the Landsat 16 d time series valid pre-fire and post-fire NBR pixels that were, respectively, from the date most closely preceding the start date and the date most closely following the end date of each burned polygon within a 3-month time window.
The dNBR index, calculated according to Key and Benson (2006) as shown in Eq. (2), is the reference burn severity spectral index used by the European Forest Fire Information System (https://effis.jrc.ec.europa.eu/about-effis, last access: 27 September 2023) and by the United States' Monitoring Trends in Burn Severity program (https://www.mtbs.gov, last access: 27 September 2023). Larger dNBR values indicate higher burn severity.
RdNBR is another burn severity spectral index that is widely used, including by the United States' Monitoring Trends in Burn Severity program (https://www.mtbs.gov/, last access: 1 May 2021). The RdNBR normalizes the dNBR to the square root of pre-fire NBR value, which helps in reducing the variability caused by pre-fire vegetation conditions and enhances the accuracy in assessing burn severity (Miller et al., 2009). As formulated in Eq. (3) (Miller and Thode, 2007), higher RdNBR values indicate higher burn severity.
2.4 Validation
To validate the GFBS database, we used data on 112 ground-verified burn severity sites following the Fire Extent and Severity Mapping (FESM) scheme for the 2013 wildfires over southeastern Australia. The FESM severity classes include unburnt, low severity (burnt understory and unburnt canopy), moderate severity (partial canopy scorch), high severity (complete canopy scorch and partial canopy consumption), and extreme severity (full canopy consumption). Besides FESM, we used the ground-measured CONUS-wide composite burn index (CBI) from 2003 to 2016. CBI was developed by Key and Benson (2006) to assess the aboveground effects of fire on vegetation and soil land use types (i.e., burn severity). It is determined through direct field observations after a fire when assessors visit various sites within the burned area to evaluate the effects of the fire on different components of the ecosystem, such as the degree of charring, percentage of foliage consumed, changes in ground cover, and mortality of plants. The CBI score for each site was calculated by averaging the scores of the different components. This overall score represents the burn severity at a specific site. The index ranges continuously from 0 (unburned) to 3 (high severity). These values have been related to satellite-derived burn severity values through regression equations (https://burnseverity.cr.usgs.gov/products/cbi, last access: 2 October 2023). In this study, we used all available CBI values over CONUS to establish relationships between CBI and the dNBR and RdNBR values of the GFBS and MOSEV datasets. We used the Pearson correlation coefficient and bias as metrics to evaluate the performance of the two datasets. Figure 2a shows the locations of the 112 ground-verified burn severity sites for the 2013 wildfires over southeastern Australia. Figure 2b shows the locations of CBI observations over CONUS for the period from 2003 to 2016. Of the 1315 ground-surveyed CBI reports for forest fires during that time, most came from western states, such as Arizona, Colorado, and Oregon, where forest fires are more frequent and severe. Fewer CBI records are available in eastern states, such as Florida and Georgia.
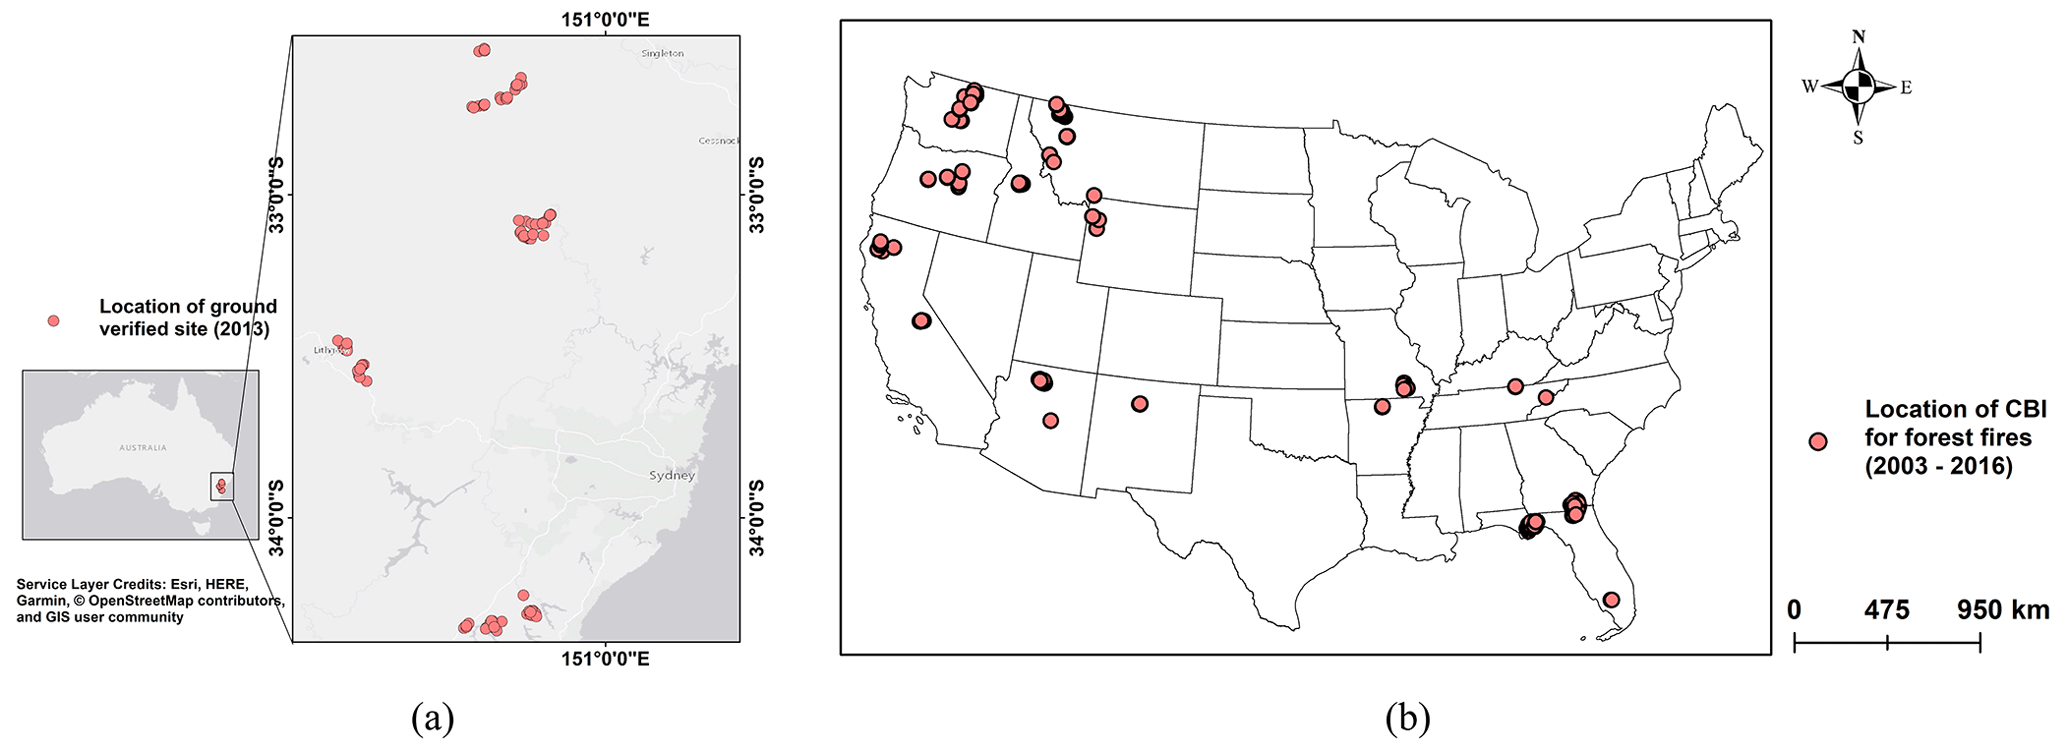
Figure 2Locations of (a) ground verification burn severity sites over southeastern Australia and (b) forest fire CBIs over CONUS.
In addition to validation against in situ data., we also compared the fire severity magnitudes of GFBS with the CanLaBS dataset available over Canada. CanLaBS provides burn severity information for burned areas identified from the Canada Landsat Disturbance product at the level of individual 30 m resolution pixels. The dataset is derived from Landsat imagery and uses values of differences in pre-fire and post-fire dNBRs for nearly 60×106 ha of burned areas across Canada's forests from 1985 to 2015 (Guindon et al., 2017, 2018).
3.1 Forest fire coverage of Landsat composites
Figure 3a shows the number of forest fire polygons globally between 2003 and 2016, representing individual fire events, from the Global Fire Atlas dataset. Approximately 80 000 forest fire events occur in the world each year on average, where more than 90 000 happened in 2004 and more than 100 000 in 2003 and 2015 each. Figure 3a displays the availability of Landsat imagery covering the burn area where individual forest fires happened worldwide. From 2003 to 2012, Landsat 5 could provide images covering between 35 % and 68 % of the recorded forest fire events in the Global Fire Atlas, while Landsat 7 images covered 83 % to 93 % of the Global Fire Atlas events. From 2013 to 2016, Landsat 7 images covered between 90 % and 98 % of the fire events, while Landsat 8 images covered more than 97 %. The Landsat composites combining all available Landsat 5 and Landsat 7 images from 2003 to 2012 and Landsat 7 and Landsat 8 images from 2013 to 2016 significantly increased the number of forest fires shown by Landsat images, with coverage of the fire events ranging from 88 % to 99 %. Figure 3b shows the distribution of the spatial coverage of cloud-free Landsat composites for individual fires from the Global Fire Atlas. We used an algorithm for cloud and shadow removal to eliminate invalid poor-quality pixels from recorded forest fires, resulting in a line chart showing the distribution of the percentages of valid pixels compared to the total burn pixels in each year. Overall, the spatial coverage was above 72 %, and the coverage has been above 85 % since 2013, when Landsat 8 was launched.
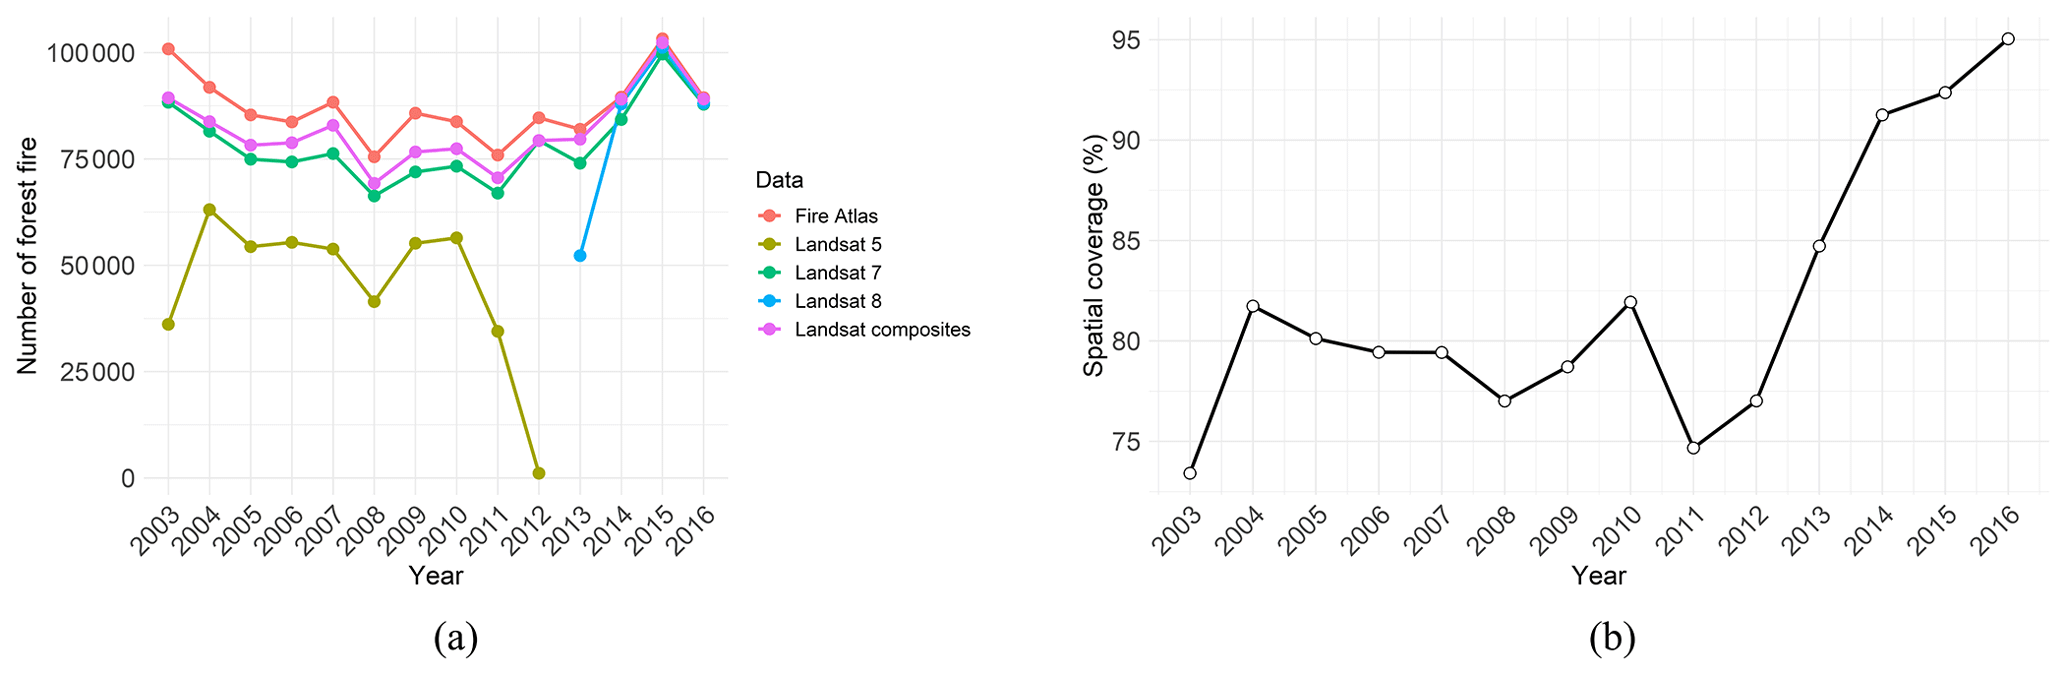
Figure 3(a) Number of individual fires from the Global Fire Atlas and available Landsat imagery. (b) Spatial coverage of cloud-free Landsat composites for individual fires reported in the Global Fire Atlas.
Figure 4 shows the data process for a single post-NBR Landsat composite for the fire event that ended on 17 September 2015 in north Washington. The first prior image for the NBR calculation was on 20 September 2015 from Landsat 8 (as image 1). The cloud and shadows are removed in image 1 after applying the cloud/shadow mask. The next available image, taken on 21 September 2015 from Landsat 7 (as image 2), was then used to fill those gaps in image 1 and obtain a new Landsat composite (phase 1). The third available image, taken on 29 September 2015 from Landsat 8 (as image 3), alongside the image taken on 15 October 2015 if needed, was adopted sequentially to fill the unscanned gap pixels in phase 1 and generate the final post-NBR image for this event. The process for pre-NBR image calculation is the same but in a reversed time order from the start time of the fire event.
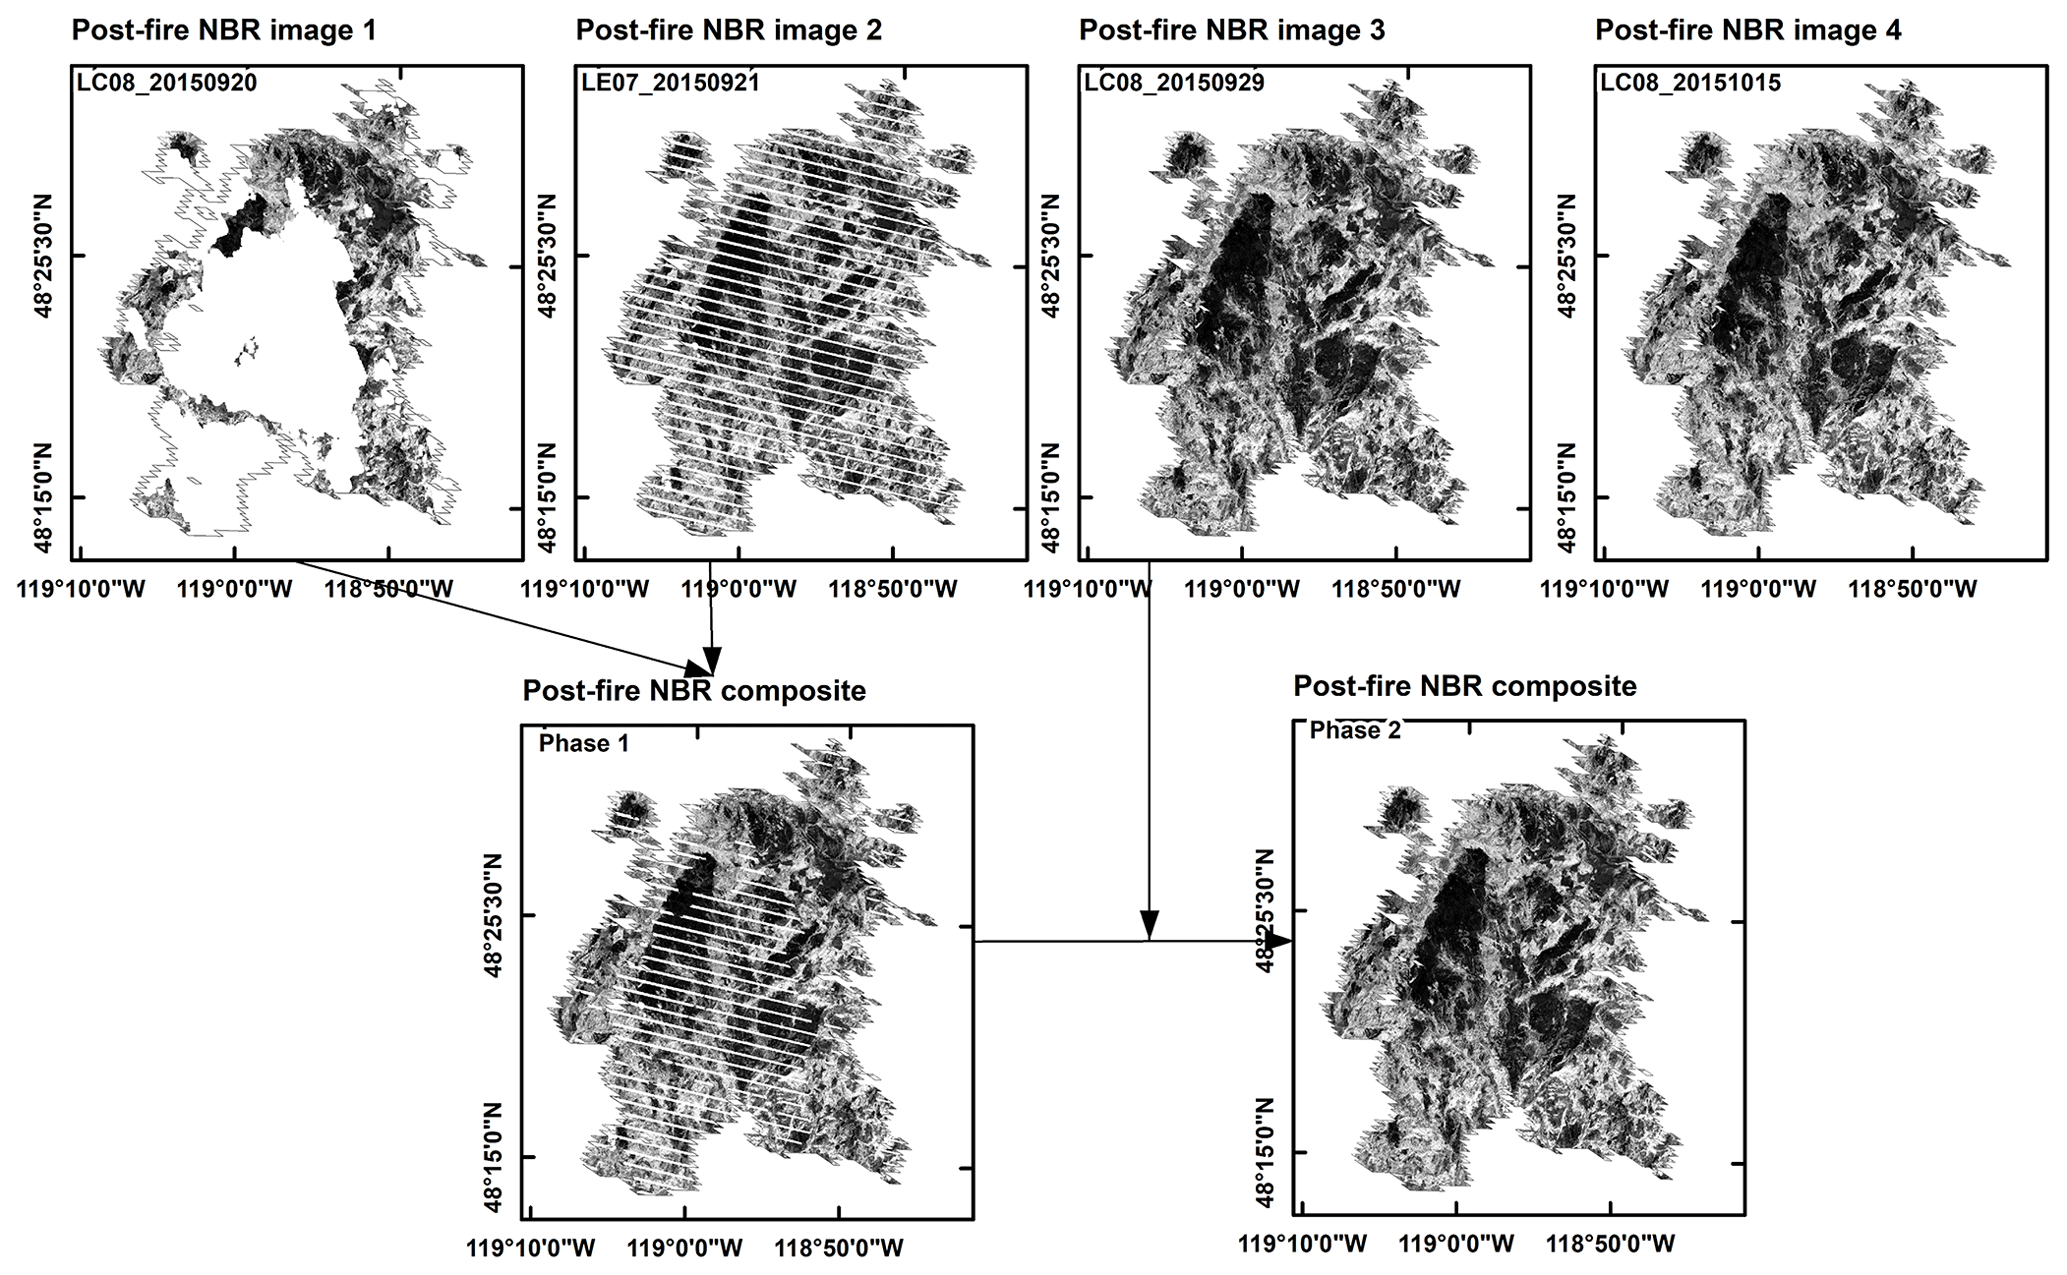
Figure 4NBR image process for Landsat composite for the fire event that ended on 17 September 2015 in north Washington.
The scatterplot in Fig. 5a shows the NBR values of the overlapping pixels in image 1 and image 2 with the associated distributions of NBR for the fire event. It is noted that NBR values in images 1 and 2 show a high correlation (r=0.96), relatively low bias (−23.81 %), and similar probability densities even though they are derived from two different Landsat images (Landsat 8 and Landsat 7). The scatterplot in Fig. 5b shows the NBR values of overlapping pixels in image 1 and image 3 with the associated distribution of NBR for the fire event. Similarly, NBR values in image 1 and image 3 have a high correlation (r=0.96), low bias (12.30 %), and similar probability densities even though they are derived from different times (9 d apart). The results indicate that the cloud-free NBR composite mosaic of all available Landsat images has reasonable accuracy with high spatial and temporal consistency.
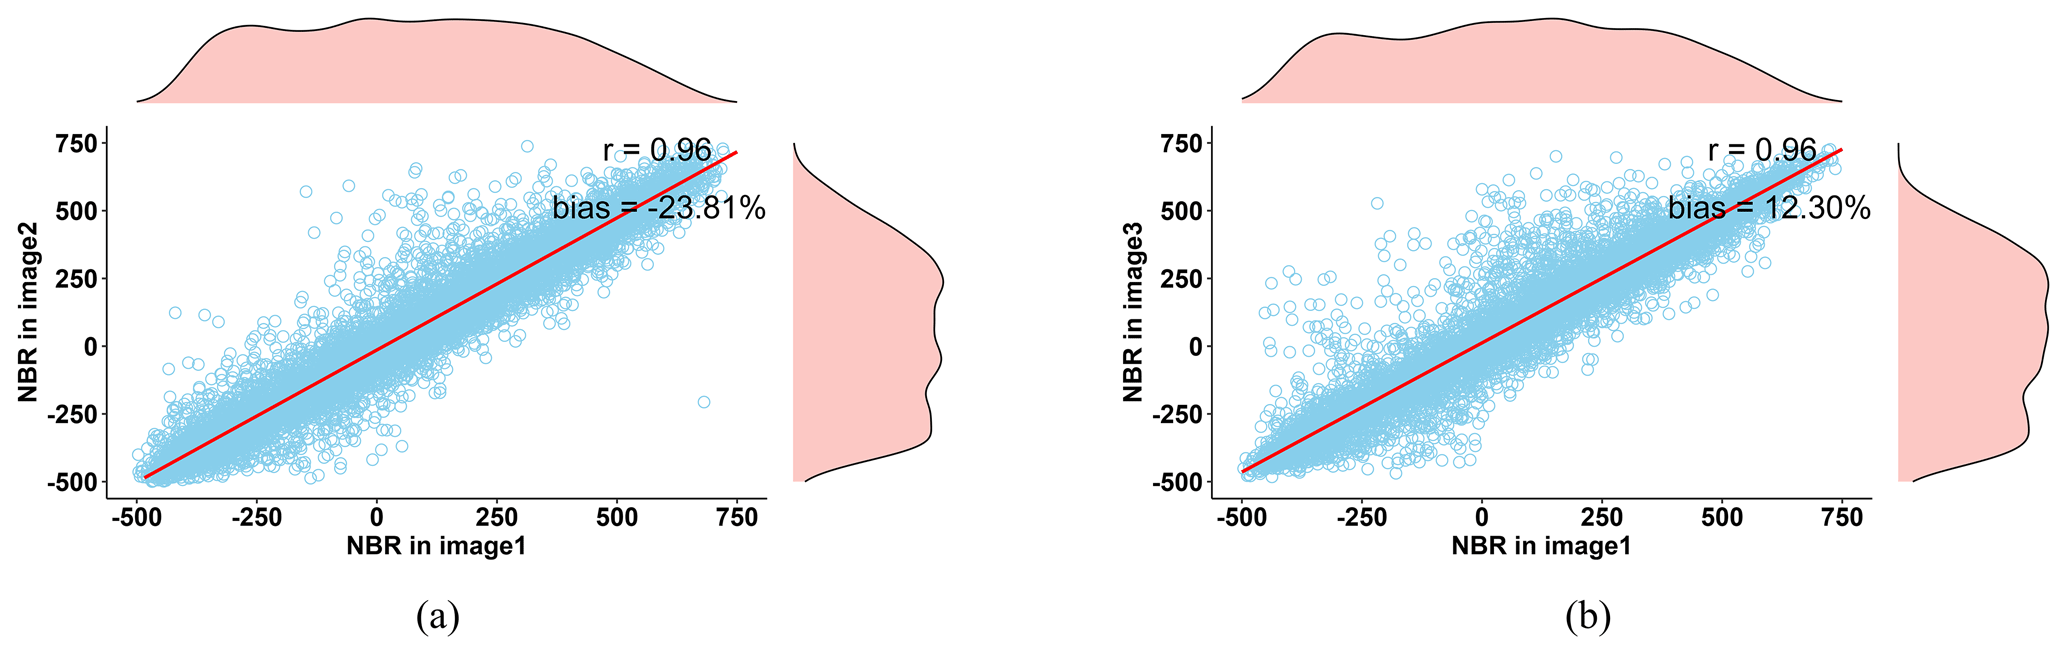
Figure 5Scatterplots of overlapped pixel values in (a) image 1 and image 2 and (b) image 1 and image 3.
3.2 Comparison between GFBS and CanLaBS over Canada
In this section we describe the comparison of the fire severity maps of GFBS and MOSEV datasets to the ones from the CanLaBS dataset over Canada for an overlapping period from 2003 to 2015. Figure 6 shows the number and the trend of forest fires over Canada from 2003 to 2015 recorded by CanLaBS data and GFBS products, while the vertical bar represents the number of forest fires recorded by both CanLaBS and GFBS each year. Due to the different sources and algorithms to map the burn area, the number of forest fires depicted by CanLaBS is larger than those depicted by GFBS each year. Nevertheless, it is noted that GFBS agrees with CanLaBS in terms of the variations in forest fire activities, such as the intense forest fires in 2004 and 2015 and the relatively low number of forest fires in 2007 and 2008.
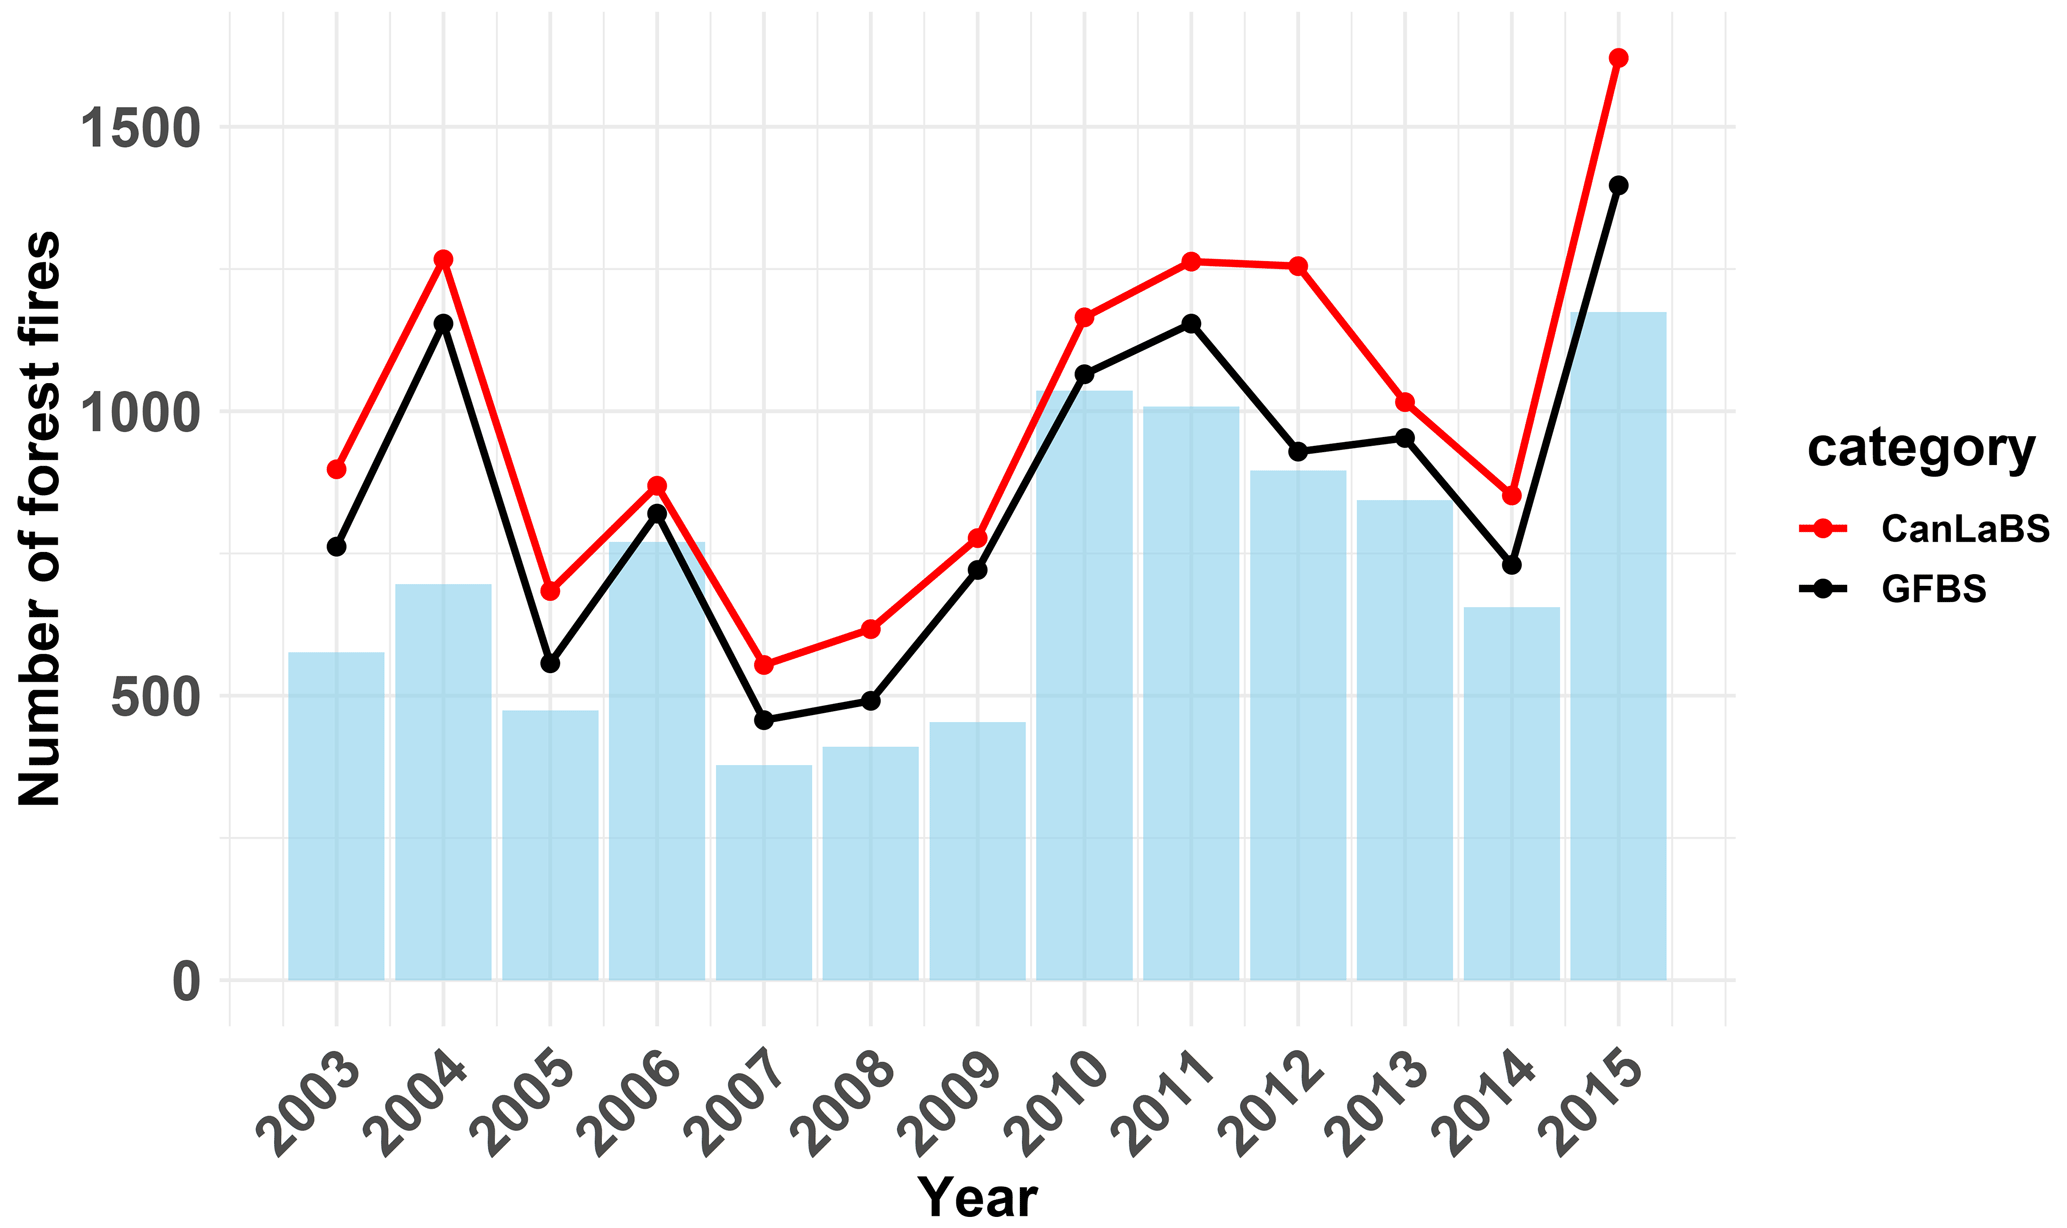
Figure 6Number of forest fires by CanLaBS and GFBS datasets. Vertical bars show the number of overlapping forest fires.
Figure 7 illustrates the scatterplots of dNBR of forest fires from CanLaBS alongside those from GFBS (panel a) and MOSEV (panel b), for the period from 2003 to 2015. Consistent with the results shown in Fig. 6, dNBR from GFBS shows a strong correlation with the dNBR from CanLaBS, with r being 0.77, and a slight underestimation of the overall dNBR for forest fires (with a bias of −12.42 %). On the other hand, dNBR from MOSEV exhibited low correlation with the dNBR from CanLaBS (r=0.42) and slight overestimation (with a bias of 11.84 %). Figure 7c displays the probability density function (PDF) plots of CanLaBS dNBR, GFBS dNBR, and MOSEV dNBR. The close PDFs of GFBS dNBR and CanLaBS dNBR are noted, though the mode of GFBS distribution is at slightly lower dNBR values relative to the CanLaBS distribution. On the other hand, the distribution of MOSEV dNBR significantly deviates from CanLaBS dNBR, having a lower peak and larger tails.
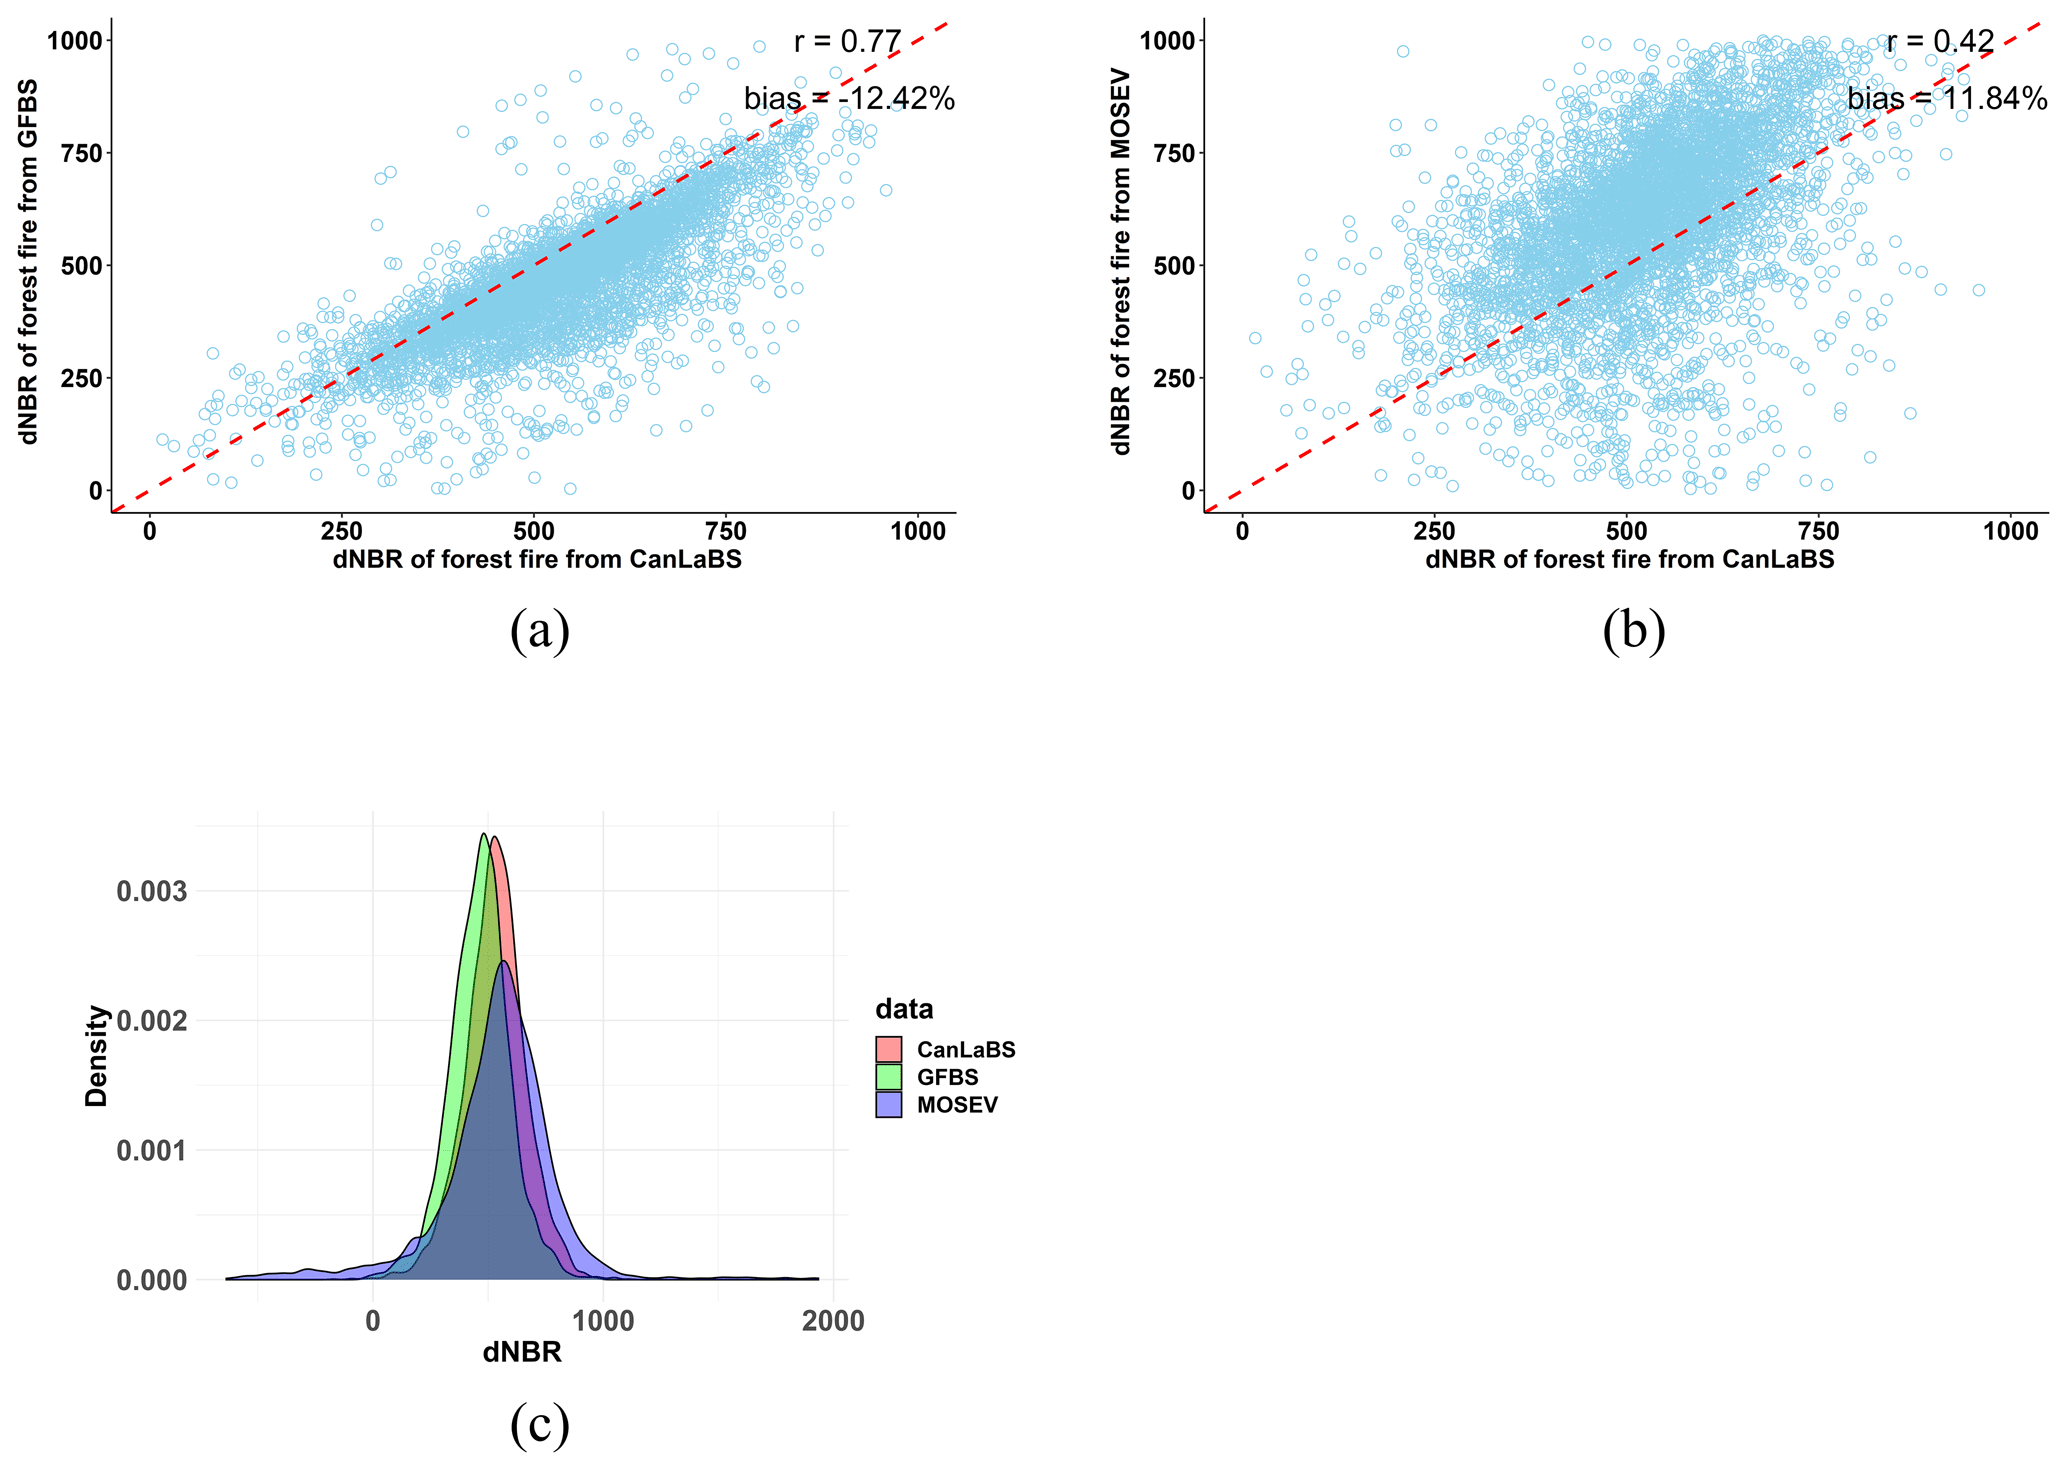
Figure 7Scatterplots of dNBR from CanLaBS against those from (a) GFBS and (b) MOSEV. (c) Density plot of dNBR from CanLaBS, GFBS, and MOSEV for forest fires from 2003 to 2015 over Canada.
Figure 8 presents the box plots of distributions of dNBR from CanLaBS, GFBS, and MOSEV separated by year. Consistent with the previous results, GFBS compares well with CanLaBS in terms of the dNBR distribution of annual forest fires and the variations in dNBR over time even though it provides slightly lower dNBR values compared to CanLaBS. On the other hand, MOSEV compared poorly with CanLaBS annual dNBR distributions, exhibiting overall larger dNBR values and larger anomalies over time.
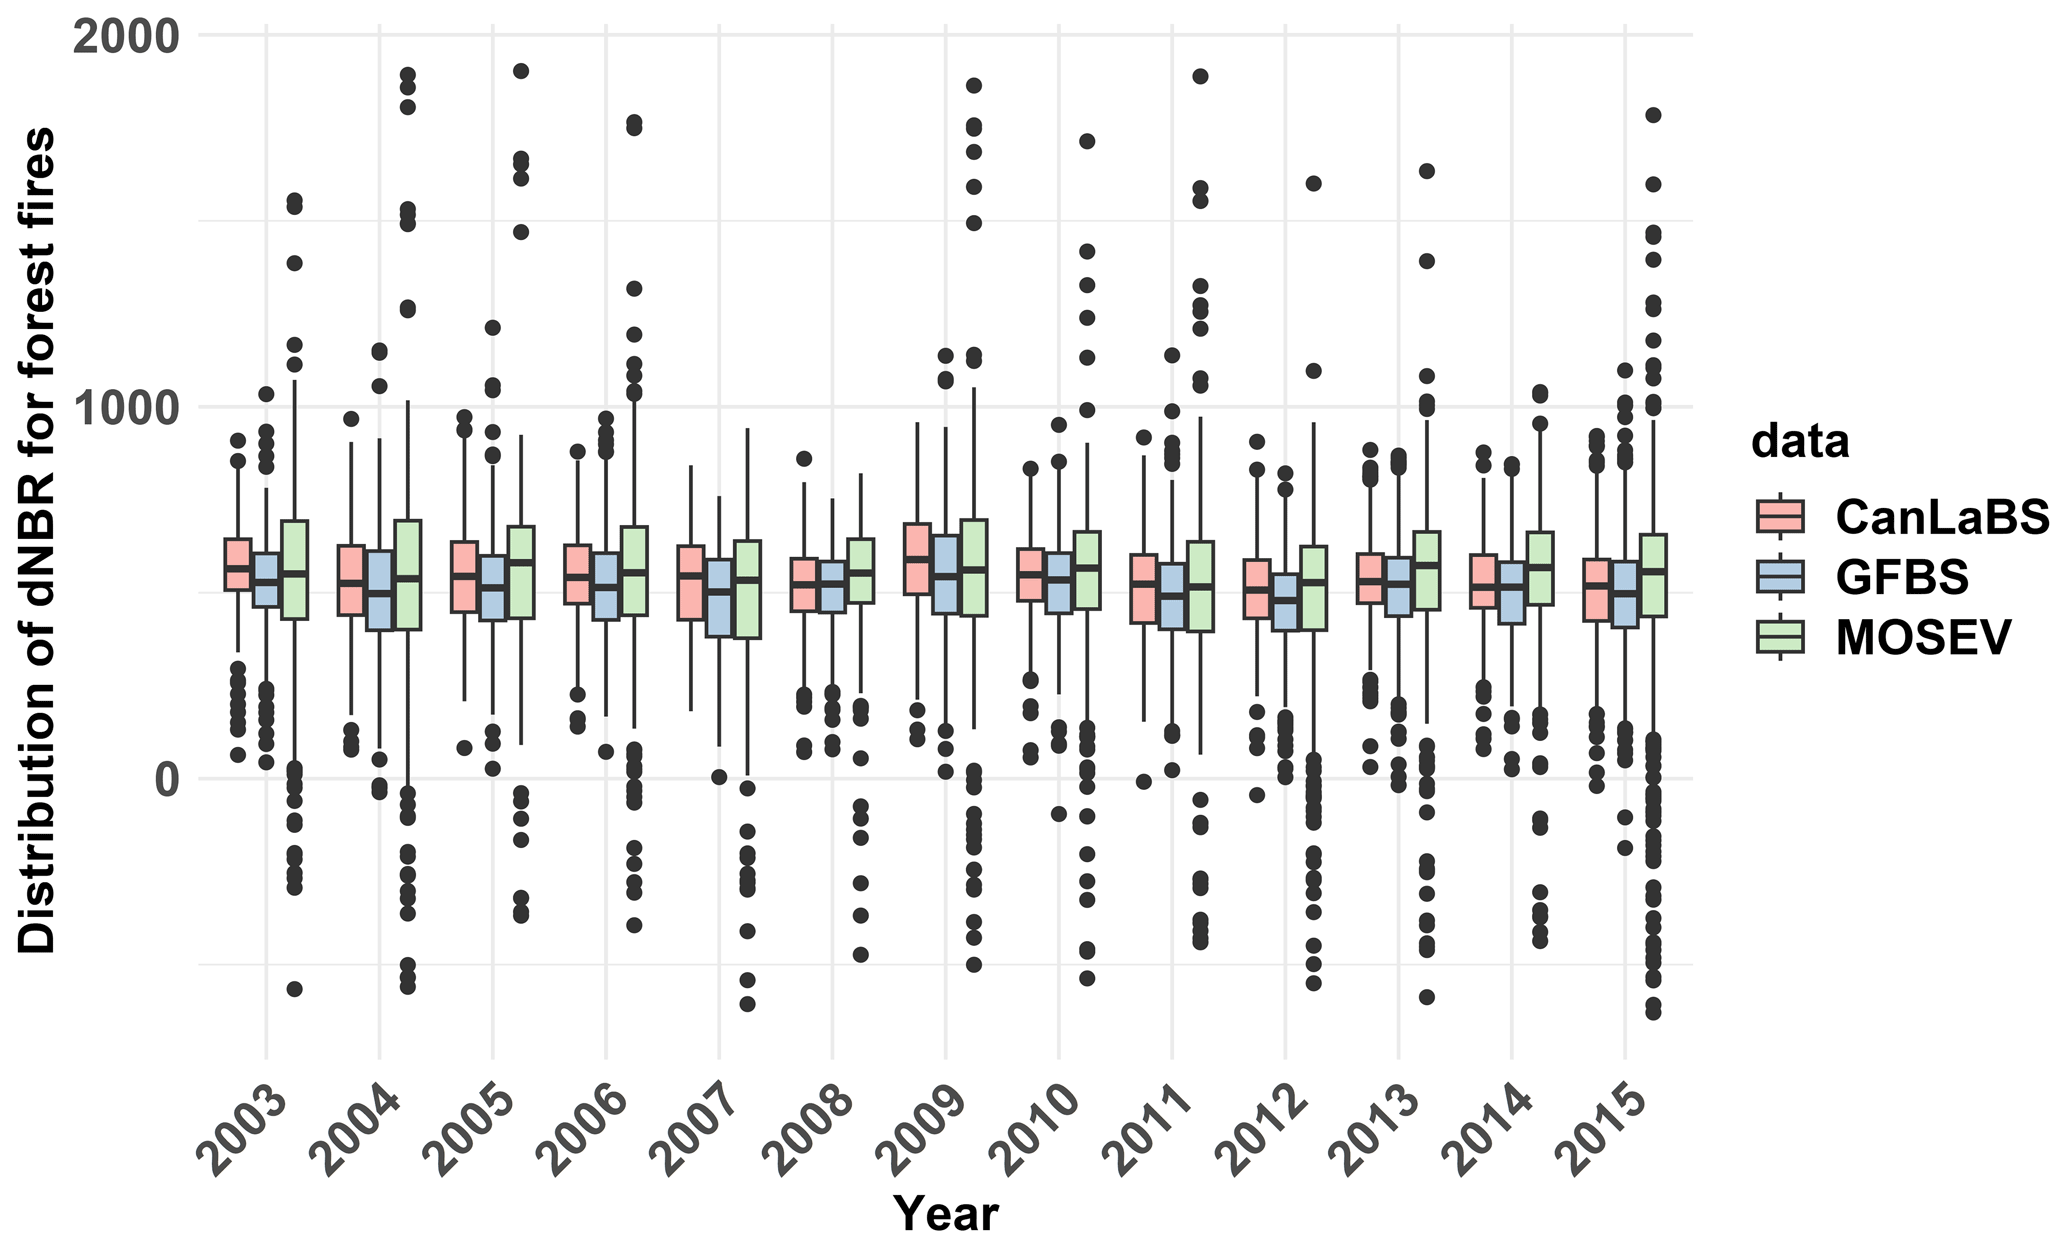
Figure 8Box plots of annual distributions of dNBR values from CanLaBS, GFBS, and MOSEV for forest fires over Canada from 2003 to 2015.
3.3 Validation against in situ fire severity category over southeastern Australia
Using the in situ burn severity categorizations from the 2013 wildfires over southeastern Australia as the ground truth, we evaluate the performance of GFBS and MOSEV datasets. Figure 9a–c display the spatial patterns of GFBS dNBR and MOSEV dNBR for wildfires that happened on 15, 17, and 21 October 2023, respectively, in southeastern Australia, where relatively dense in situ burn severity categorization data are available. It is noted that GFBS dNBR shows similar spatial patterns to the MOSEV dNBR in the events on 15 and 17 October 2023, both showing significant fire centers where high dNBR is found. For the 21 October 2023 event, however, the dNBR map from MOSEV shows a larger high-burn-severity area than GFBS.
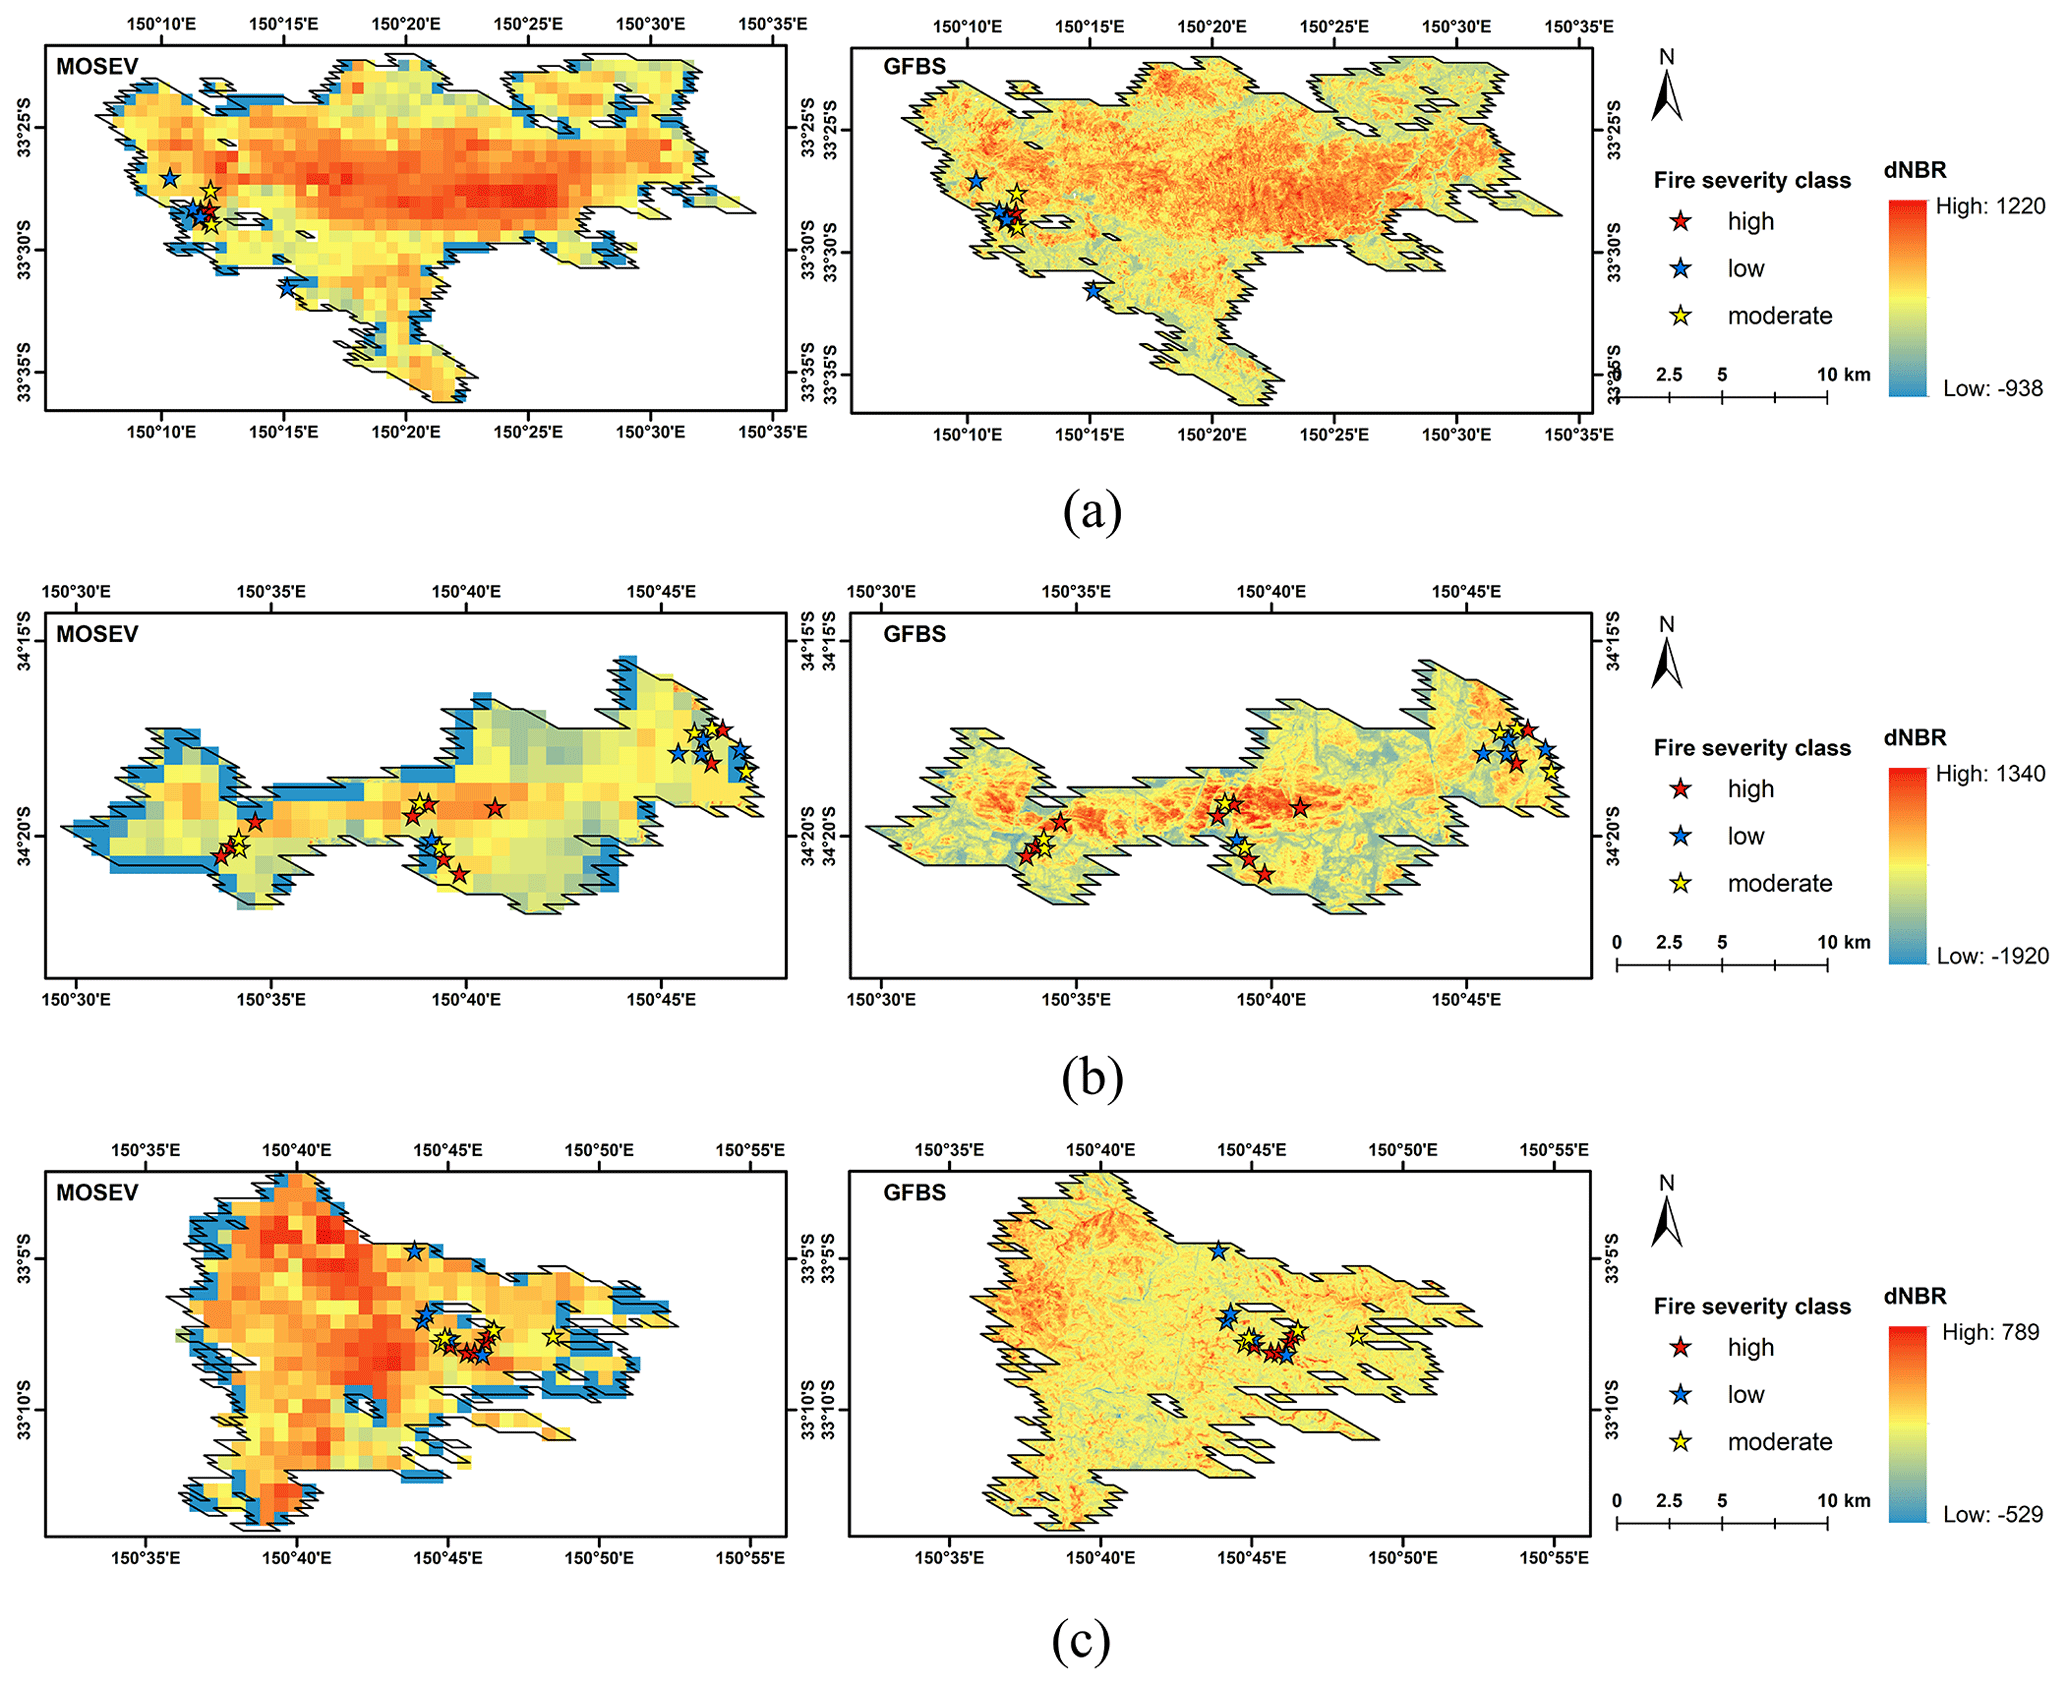
Figure 9Spatial patterns of dNBR for wildfires on (a) 15 October 2023, (b) 17 October 2023, and (c) 21 October 2023 in southeastern Australia, derived from the GFBS and MOSEV datasets.
The box plots in Fig. 10a–c display the corresponding distributions of dNBR from GFBS and MOSEV at different observed severity classes in the events on 15, 17, and 21 October 2023, respectively. The severity classes, i.e., low, moderate, and high, are categorized from the field assessed sites in the corresponding fire events. For the event on 15 October 2023, dNBR from GFBS shows a significant difference between the moderate-/high- and low-severity classes and no difference between high- and moderate-severity classes. The dNBR from MOSEV, however, presents lower dNBR for the high-severity class than those for moderate- and low-severity classes. For the event on 17 October 2023, both GFBS and MOSEV show significant discrepancies on dNBR between high- and moderate-/low-severity classes. For the event on 21 October 2023, GFBS could clearly differentiate among high-, moderate-, and low-severity classes in terms of dNBR values, whereas MOSEV presented the lowest dNBR values for the moderate-severity class, while exhibiting small differences in dNBR values between the low- and high-severity classes. Figure 10d shows the overall performances of dNBR from GFBS and MOSEV for the different severity classes, combining all 112 ground verification sites. More significant differences are shown in the GFBS dNBR box plots between high-, moderate-, and low-severity classes than those from MOSEV, indicating that GFBS is more skilled at distinguishing between forest fires of different severity levels.
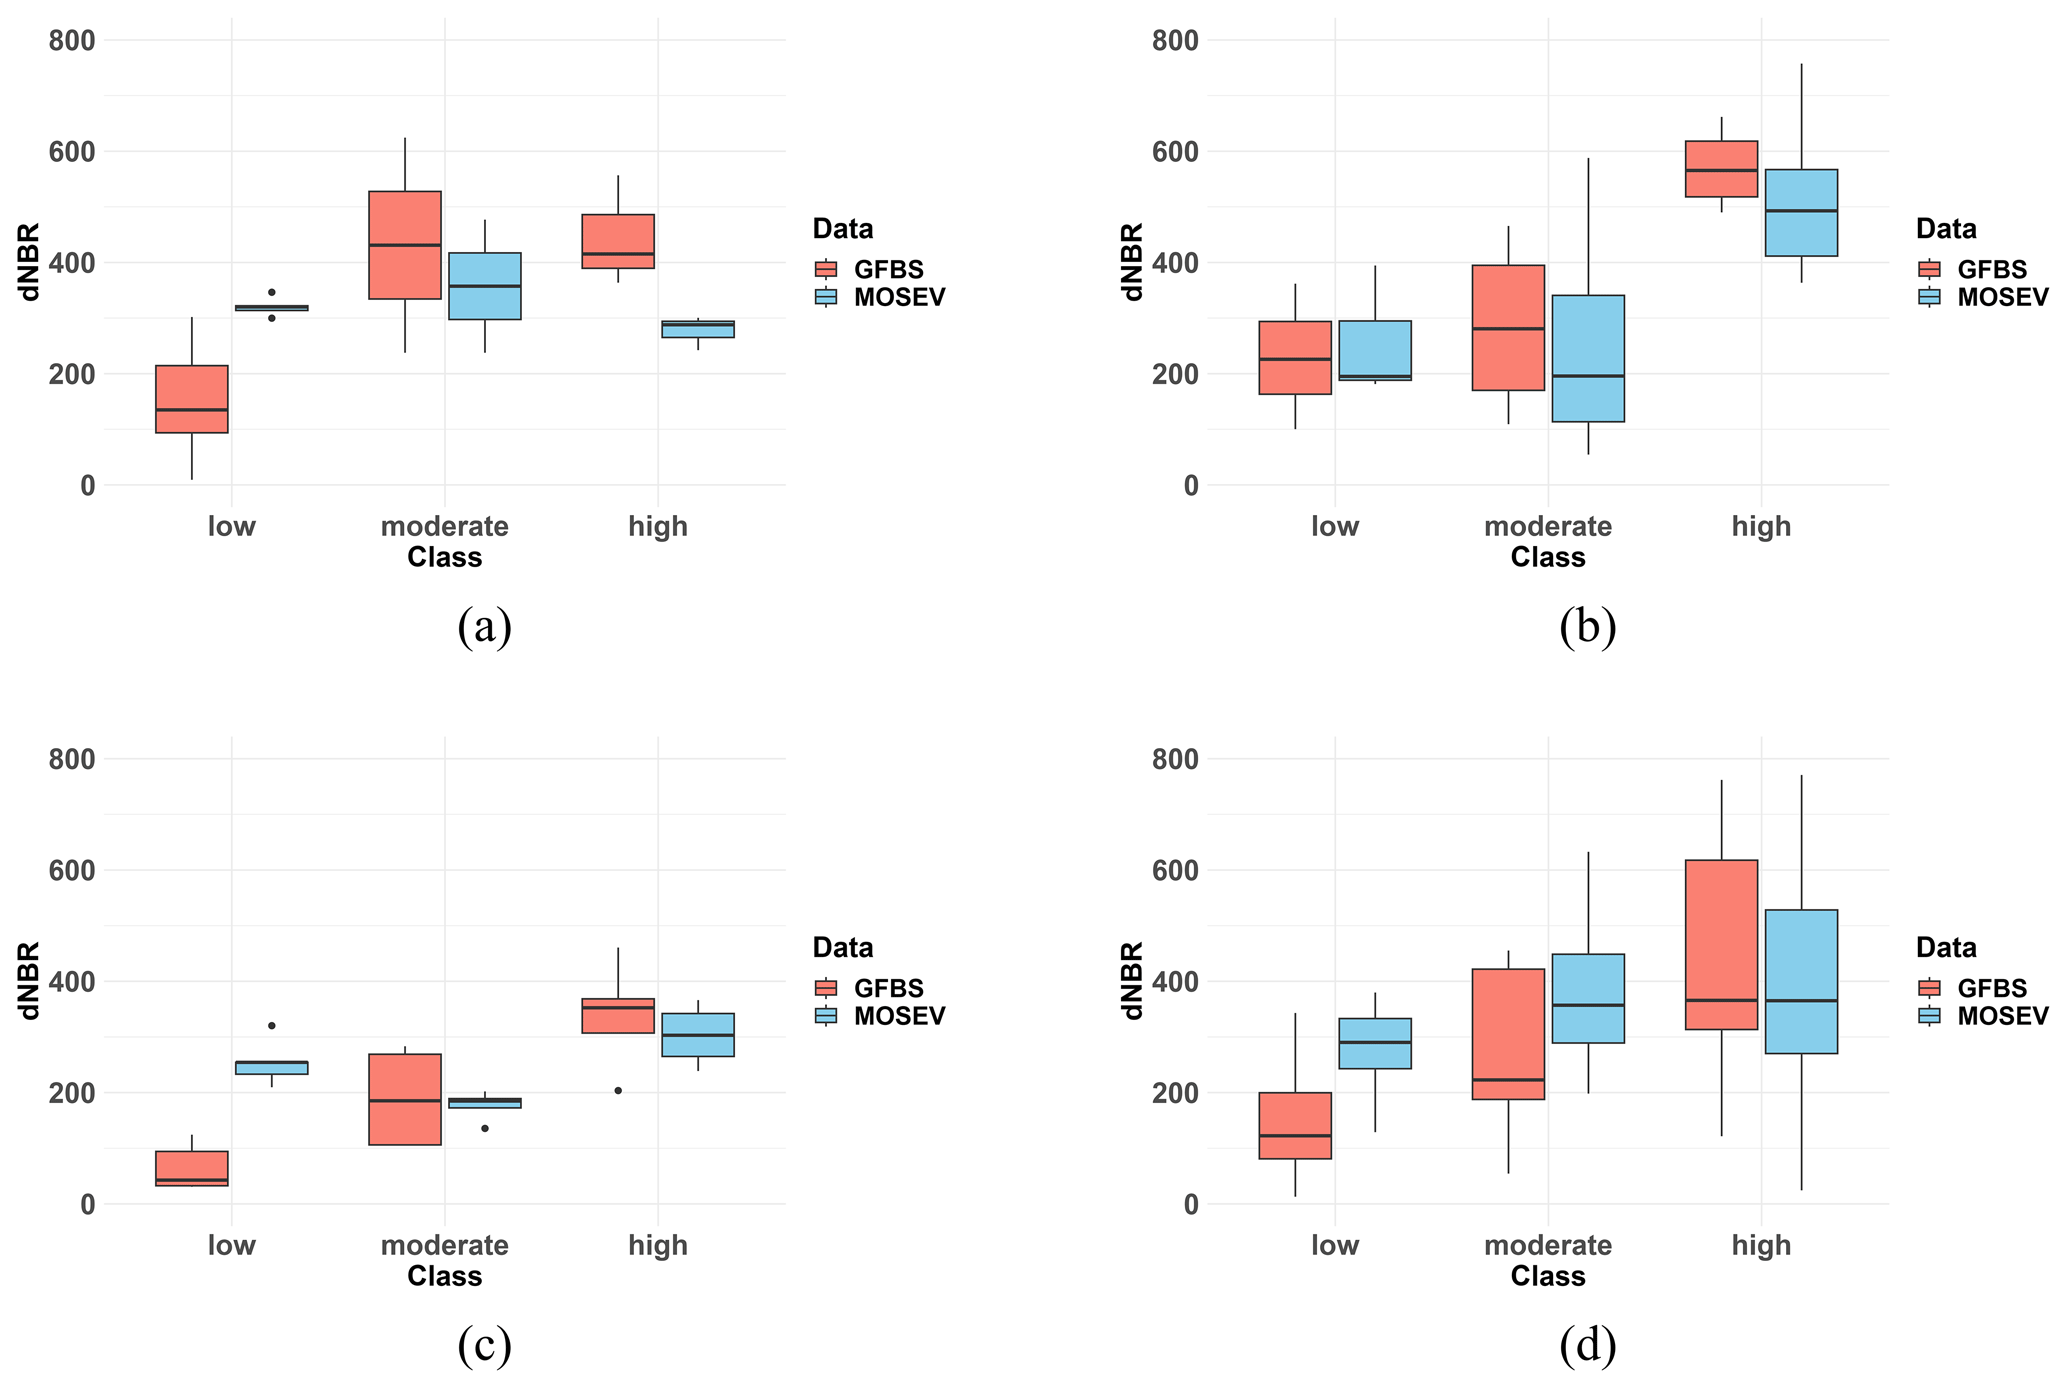
Figure 10Box plots of distributions of dNBR for different burn severity classes from the in situ data for (a) event on 15 October 2023, (b) event on 17 October 2023, (c) event on 21 October 2023, and (d) combining all events with in situ data.
As mentioned above, MOSEV gave relatively small dNBR values in the event on 15 October 2023, where burn severity is classified according to in situ measurements as high. Figure 11a displays the location of the ground verification sites with the corresponding burn severity class and associated dNBR values from MOSEV and GFBS. It is noted that within one MOSEV grid cell (500 m), four ground verification sites are located. The dNBR value from MOSEV is 295 for all four sites, while three of the sites are classified as low-severity and only one site is classified as high-severity. On the other hand, at the GFBS resolution (30 m), we can note significant spatial variation in dNBR, with GFBS dNBR being 239 for the site classified as high-severity and 9, 16, and 68 for the sites classified as low-severity. In a surrounding MOSEV pixel, we note a site classified as high-severity, but dNBR from MOSEV is 188, while dNBR from GFBS is 397. In the event on 21 October 2023, we found that MOSEV gave relatively high dNBR values at ground verification sites that are classified as low-severity. Figure 11b shows the locations of ground verification sites with corresponding classified burn severity and associated dNBR values from MOSEV and GFBS. In the two adjacent MOSEV grids, the dNBR values from MOSEV are 287 and 327, respectively, where both sites are classified as low-severity. At the GFBS resolution, more significant changes between high and low dNBR are found within the same MOSEV grid, resulting in dNBR values of 30 and 32 for the ground verification sites classified as low-severity. The results demonstrate the significance of GFBS high-resolution data in representing the small-scale variations in dNBR and providing more granular and reliable dNBR estimations.
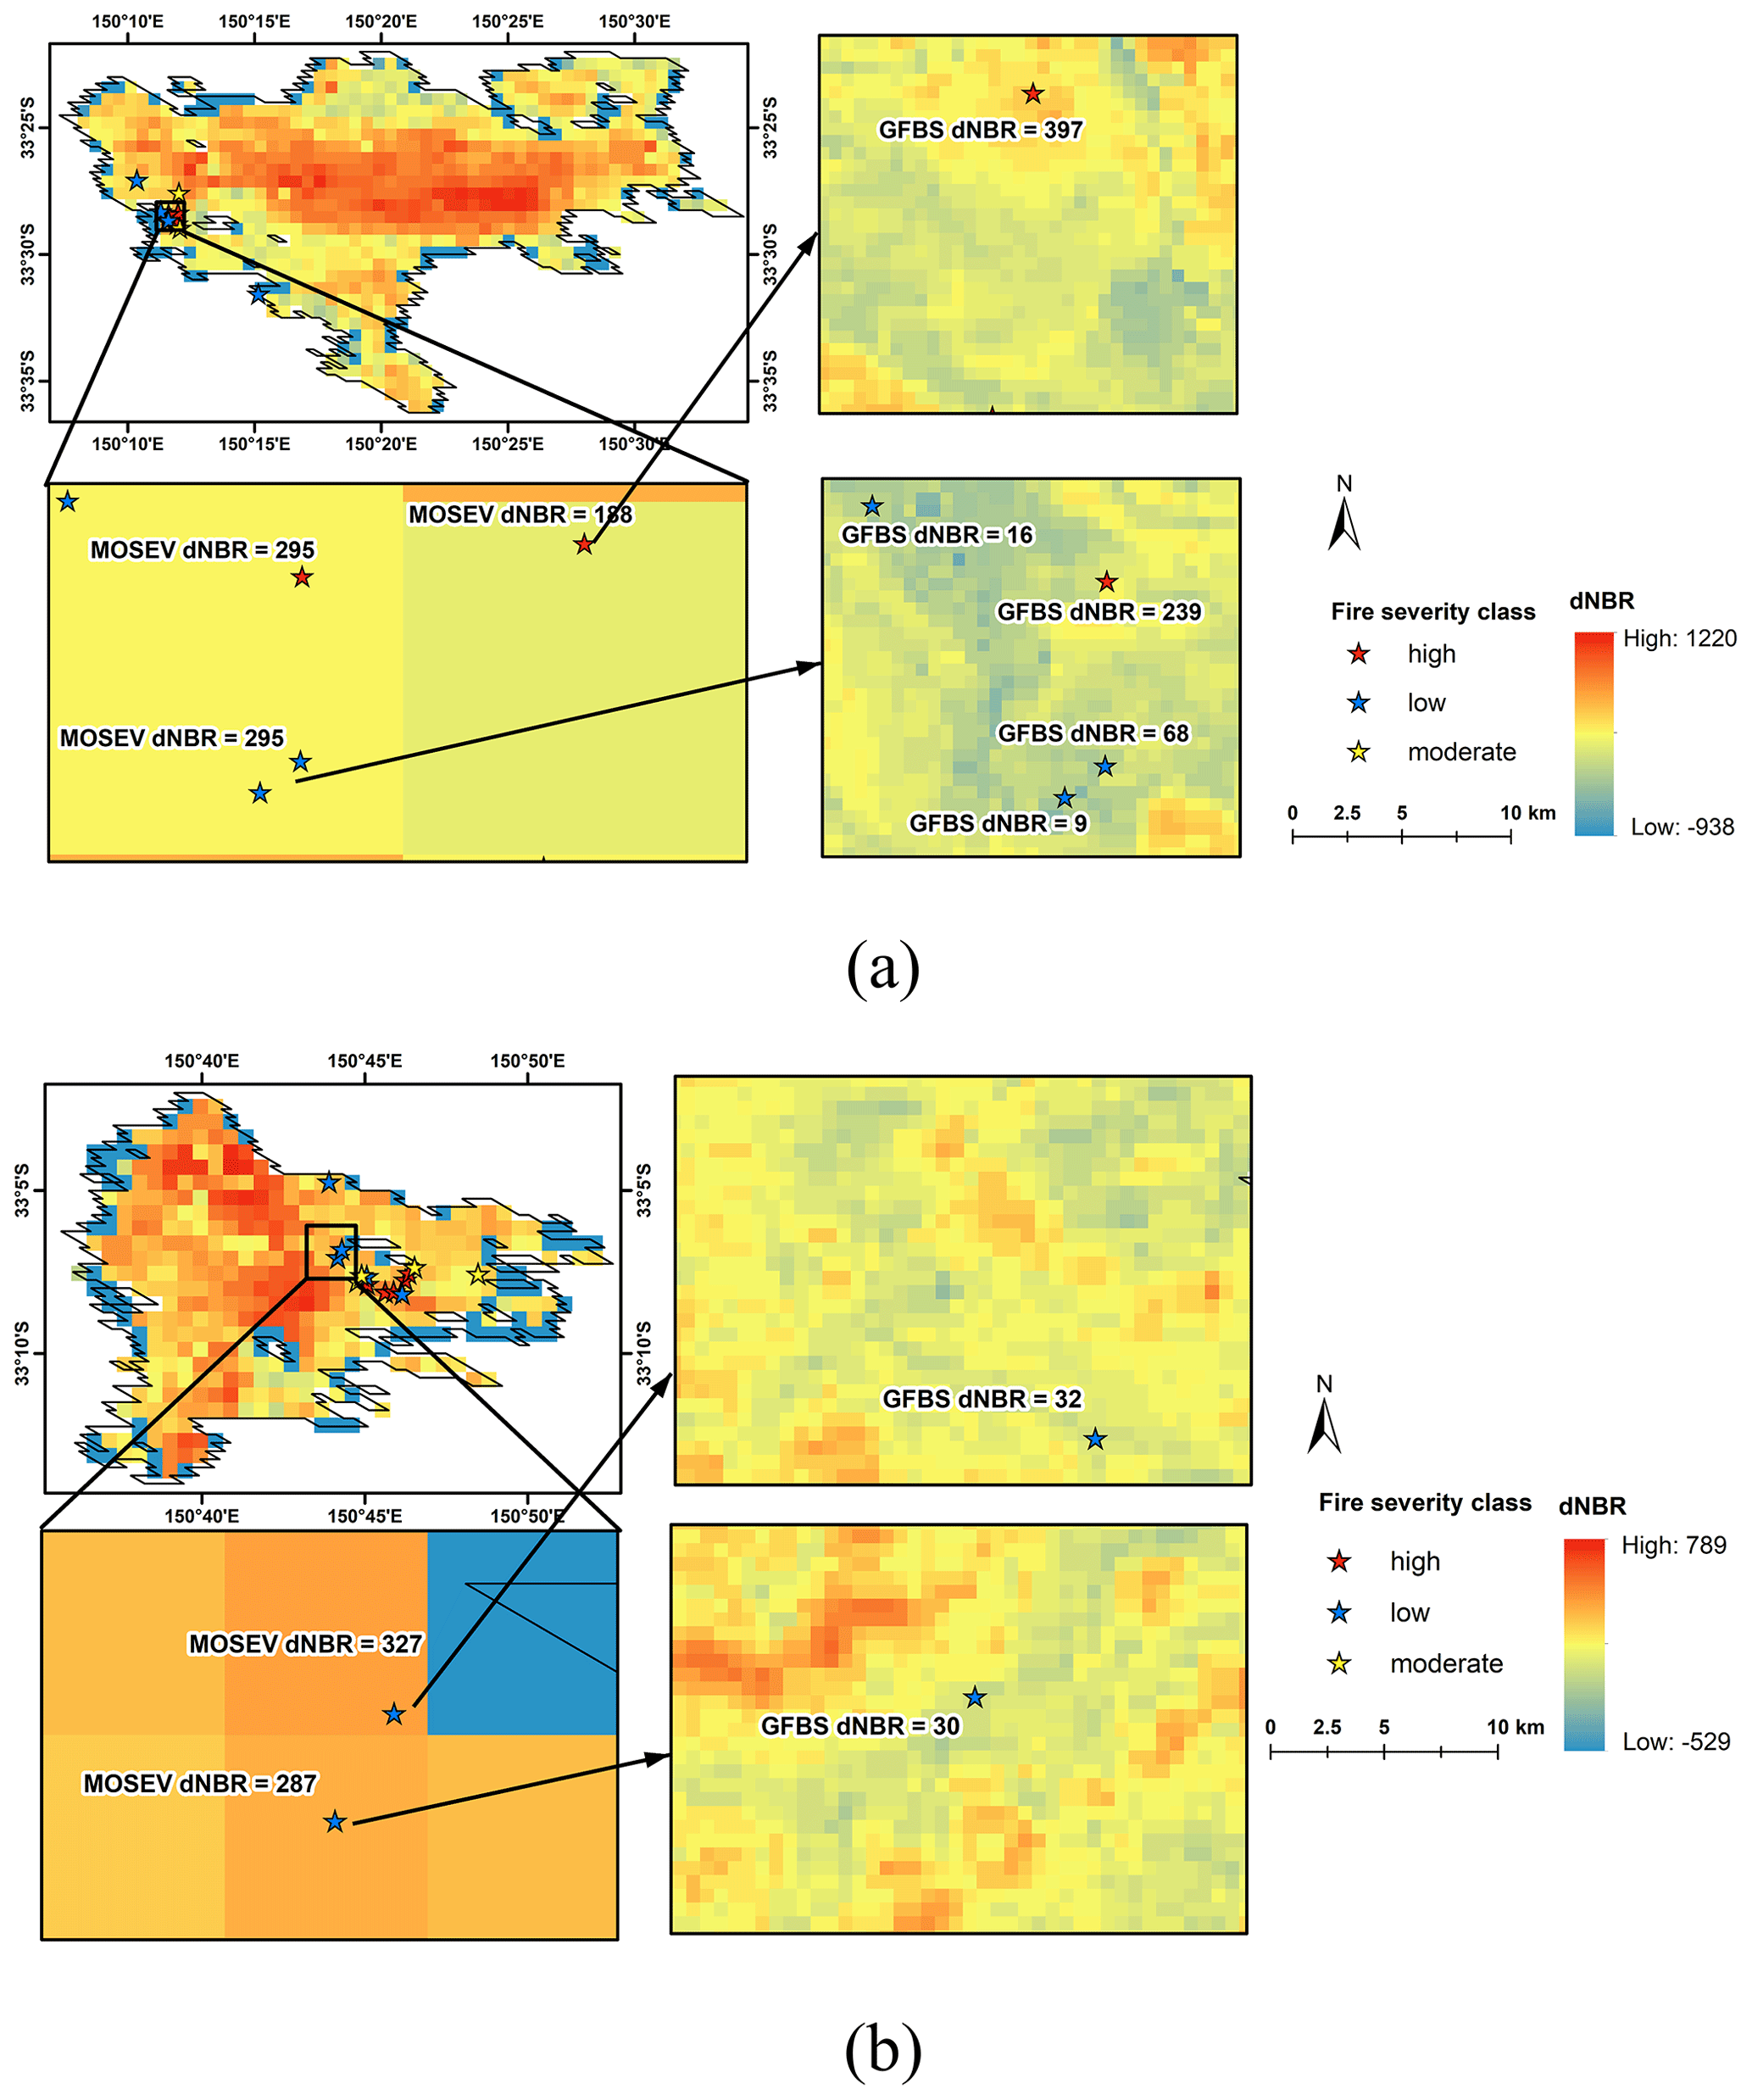
Figure 11The location of ground verification sites with burn severity classes overlaid by dNBR values from GFBS and MOSEV for the fire events of (a) 15 October 2023 and (b) 21 October 2023.
3.4 Validation against CBI over CONUS
Figure 12a–d shows the spatial patterns of dNBR derived from GFBS and MOSEV over CONUS for the forest fires with the largest burn areas (referred to as annual maximum forest fire hereafter) in 2004, 2006, 2007, and 2013, respectively, for which CBI records are available. The figures present the PDFs of dNBR values from GFBS and MOSEV along with spatial distribution maps of dNBR. The similarity in spatial patterns between GFBS burn severity and MOSEV burn severity is noted in these plots. Significant differences occur, however, between dNBRs from GFBS and MOSEV. Specifically, MOSEV tends to provide overall larger dNBR values, but where dNBR from GFBS is relatively high, MOSEV dNBR values are relatively lower. This difference could also be inferred from the PDFs of dNBR from GFBS and MOSEV, where dNBR from MOSEV distributed more on the mean dNBR of around 300, while dNBR from GFBS is bimodal with peaks on both low and high values. For the annual maximum forest fire in 2007 in particular, MOSEV showed more extensive areas with high dNBR values compared to GFBS, which is a difference that was also revealed in the large deviation of mean dNBR values in the PDFs of dNBR from the GFBS (mean dNBR of around 100) and MOSEV (mean dNBR of around 500) datasets.
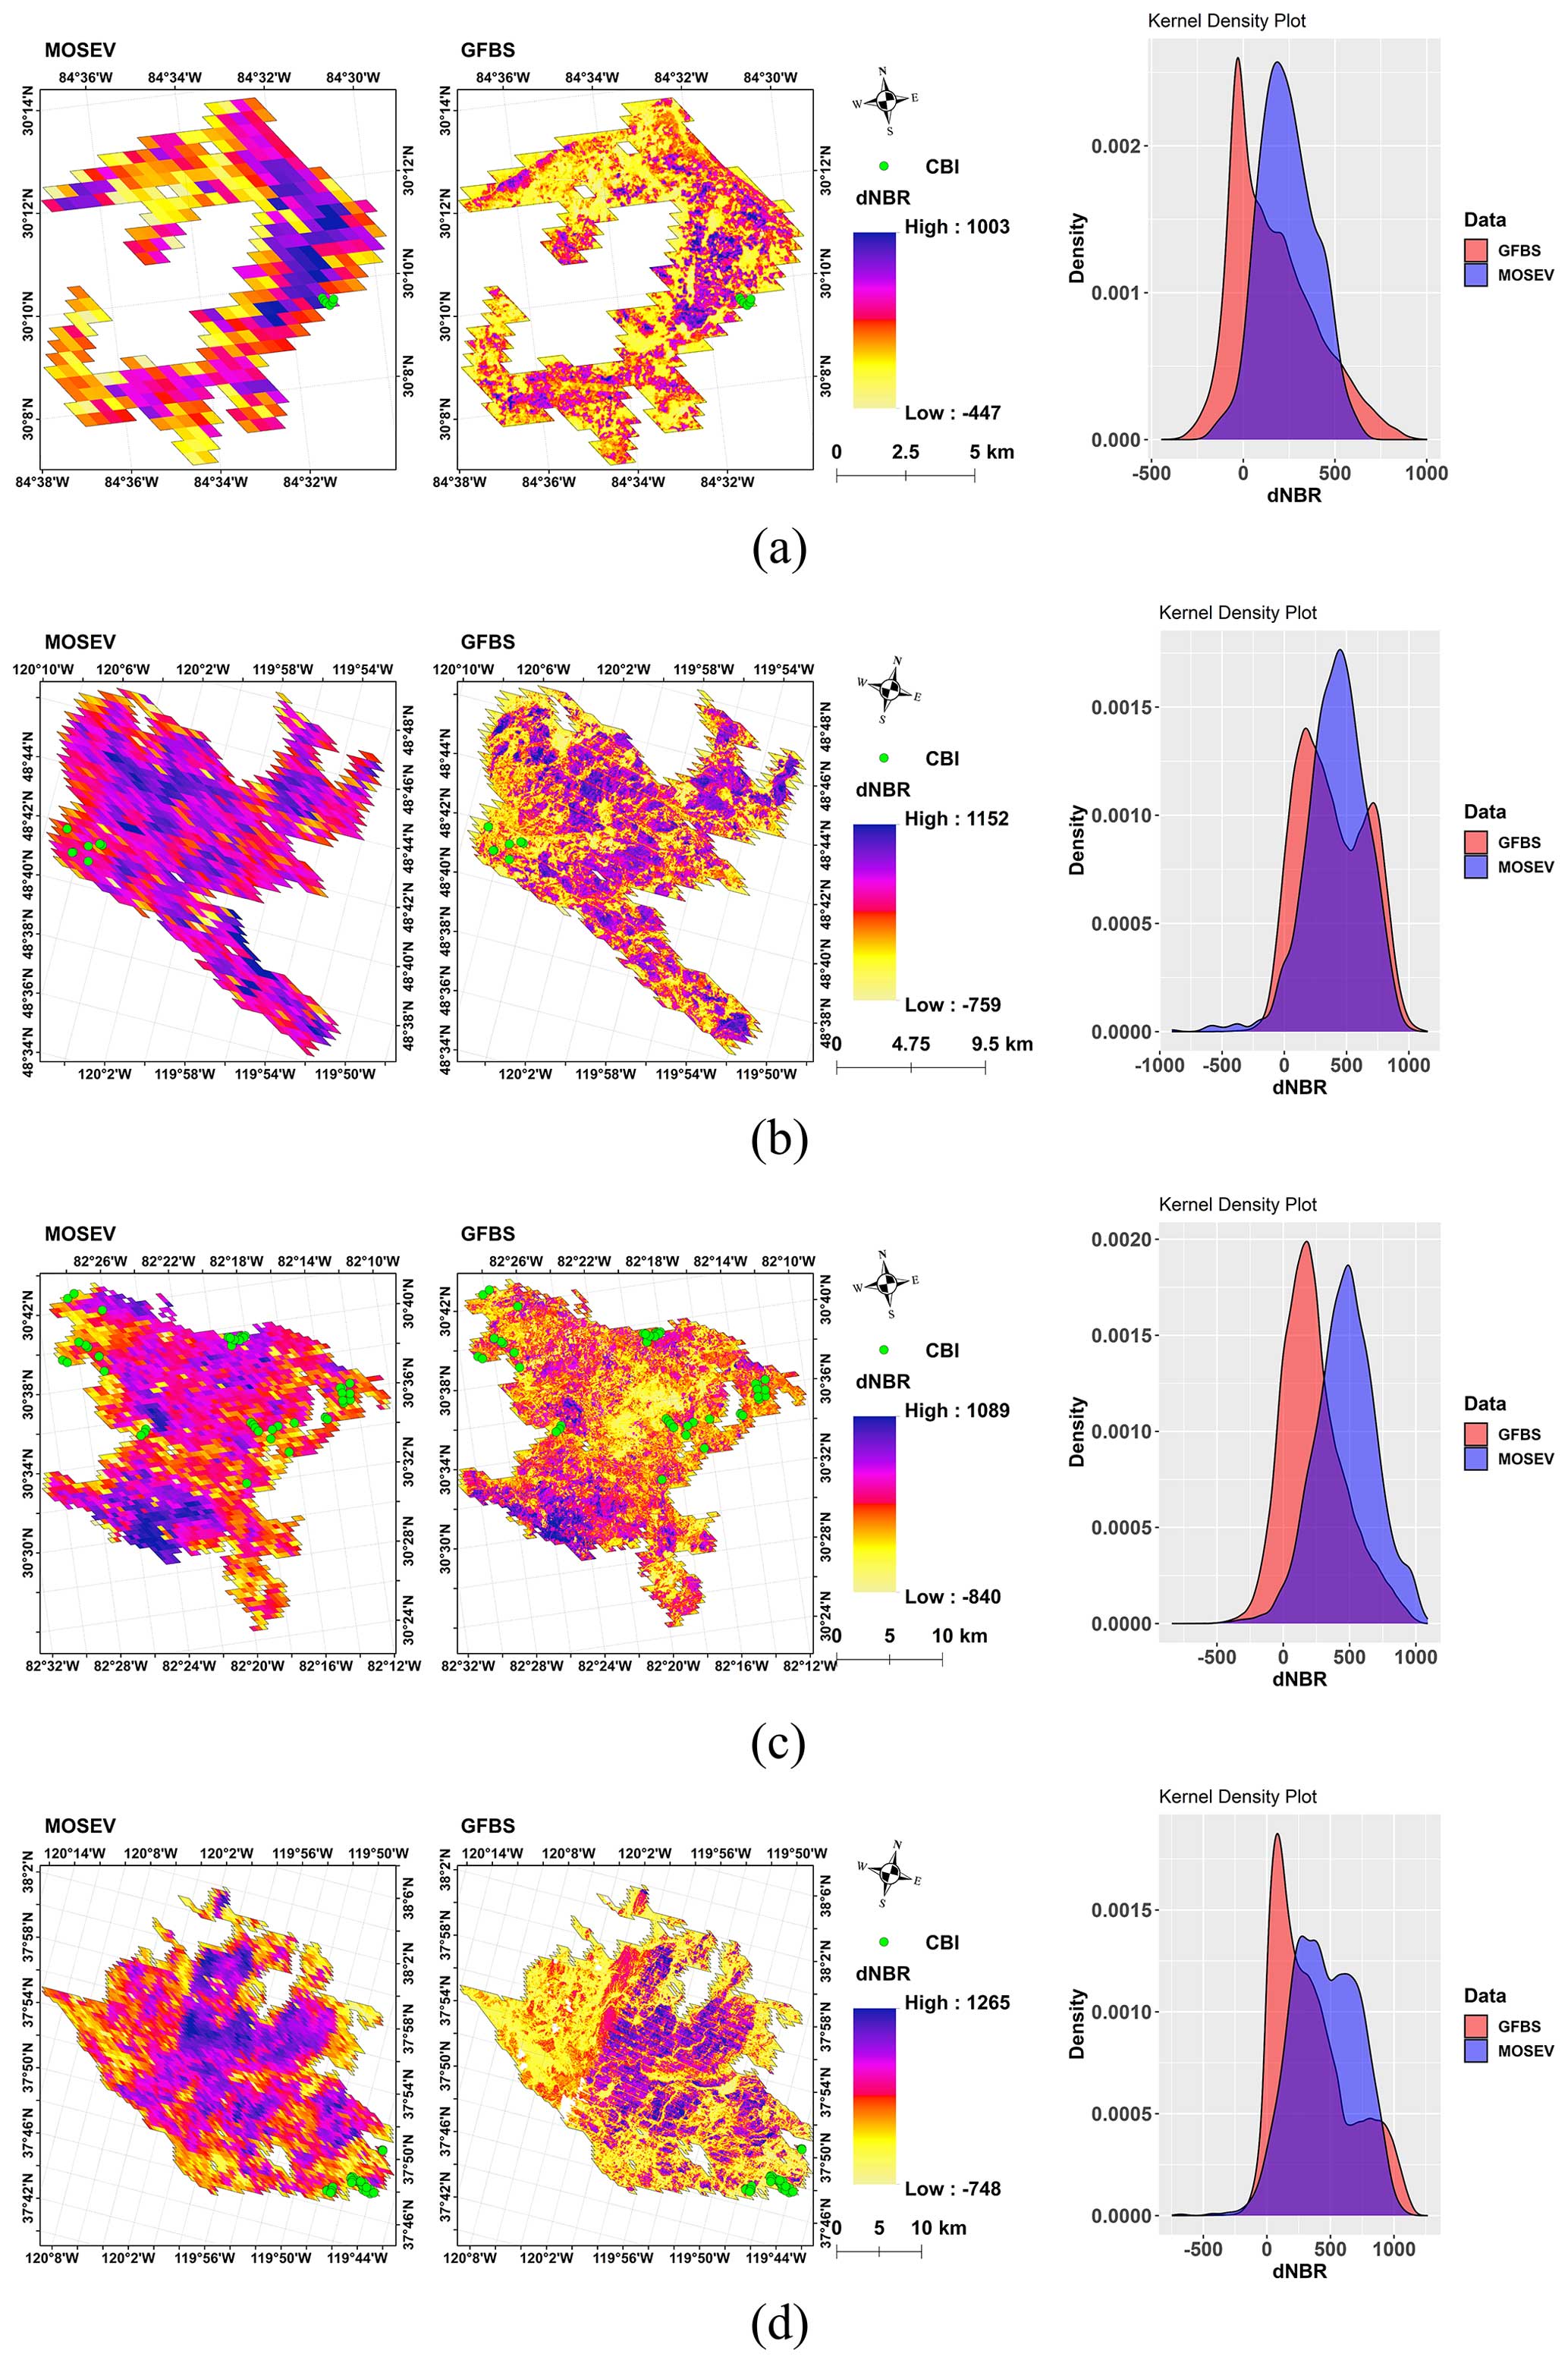
Figure 12Spatial patterns of dNBRs for annual maximum fires over CONUS with distribution of probability density functions in (a) 2004, (b) 2006, (c) 2007, and (d) 2013, derived from the GFBS and MOSEV datasets.
The density plot of dNBR in Fig. 12 also shows the bi-modal distribution for dNBR from GFBS at around 100 (associated with low severity) and 700 (associated with high severity) for the annual maximum forest fire in 2006. dNBR from MOSEV, on the other hand, shows a single-peak distribution at around 500, indicating that dNBR from MOSEV underestimated the high-severity occurrences and overestimated the low-severity ones, as depicted in the GFBS dataset. For the annual maximum forest fire in 2013, the density plot presents two different peaks in the distributions of GFBS and MOSEV, indicating a significant difference in the burn severity depicted in the two datasets.
Figure 13a–d present the scatterplots of CBI against dNBR from GFBS and dNBR from MOSEV for the annual maximum forest fires in 2004, 2006, 2007, and 2013, respectively. For the annual maximum forest fire in 2004, Fig. 13a shows a positive correlation between CBI (r=0.45) and dNBR from GFBS, while we found no correlation between CBI and dNBR from MOSEV. For the annual maximum forest fire in 2006, we found good agreement between the CBI and dNBR from GFBS, with an r value of 0.85, while the r value was only 0.28 for dNBR from MOSEV. Though correlations between CBI and dNBR from GFBS and MOSEV were poor, dNBR from GFBS showed a positive trend to CBI, while the relationship between CBI and dNBR from MOSEV was negative for the annual maximum forest fire in 2007. For the annual maximum forest fire in 2013, dNBR from GFBS (r=0.72) was more strongly correlated with CBI than dNBR from MOSEV (r=0.36).
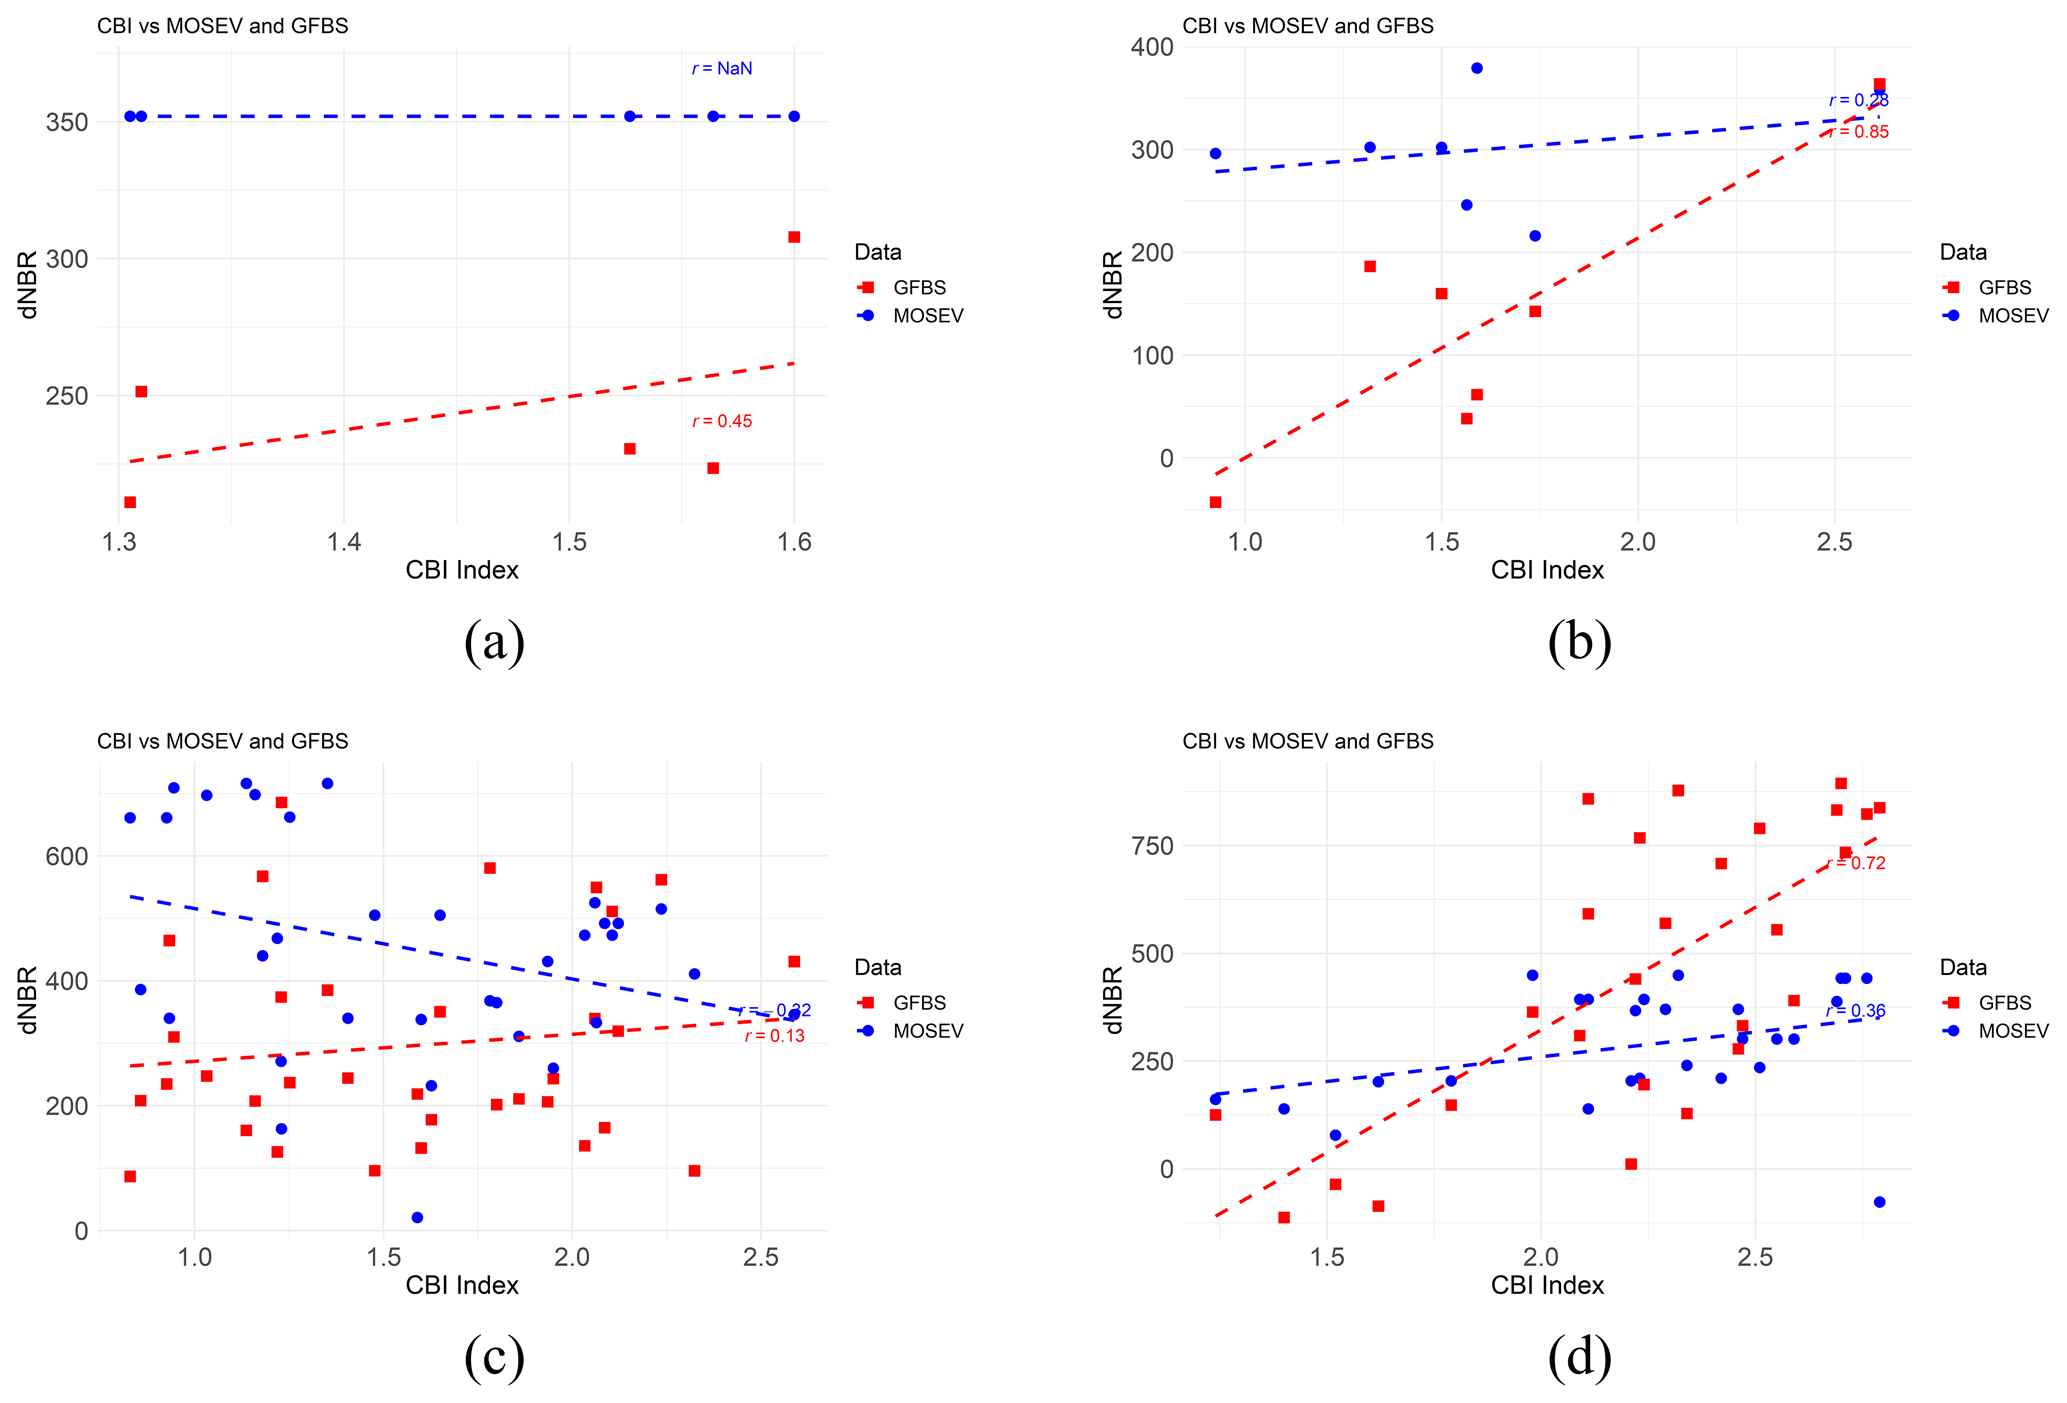
Figure 13Scatterplots of CBI against dNBR from GFBS and MOSEV for annual maximum fires in (a) 2004, (b) 2006, (c) 2007, and (d) 2013.
Figure 14a–d show the spatial patterns of RdNBR from GFBS and MOSEV along with the associated PDFs of RdNBR for the forest fires over CONUS with the largest burn areas (referred to as annual maximum forest fire hereafter) in 2004, 2006, 2007, and 2013, respectively. RdNBR from GFBS and MOSEV exhibit similar spatial patterns yet provide different ranges of RdNBR values over burn area. RdNBR from MOSEV tended to be higher than RdNBR from GFBS, which is consistent with the density plots of RdNBR from GFBS. The mean value in the distribution of RdNBRs from MOSEV is larger than the mean value in the distribution of RdNBRs from GFBS for the annual maximum forest fires in 2003, 2006 and 2007. The density plots of RdNBR from GFBS and MOSEV are largely overlapped for the annual maximum forest fire in 2013, but RdNBR from MOSEV distributed more at the mean values around 800 than RdNBR from GFBS, while RdNBR from GFBS distributed more on the extreme low values above 0 and high values above 1500. These findings demonstrate that RdNBR from MOSEV represents overall larger burn severity estimations than RdNBR from GFBS.
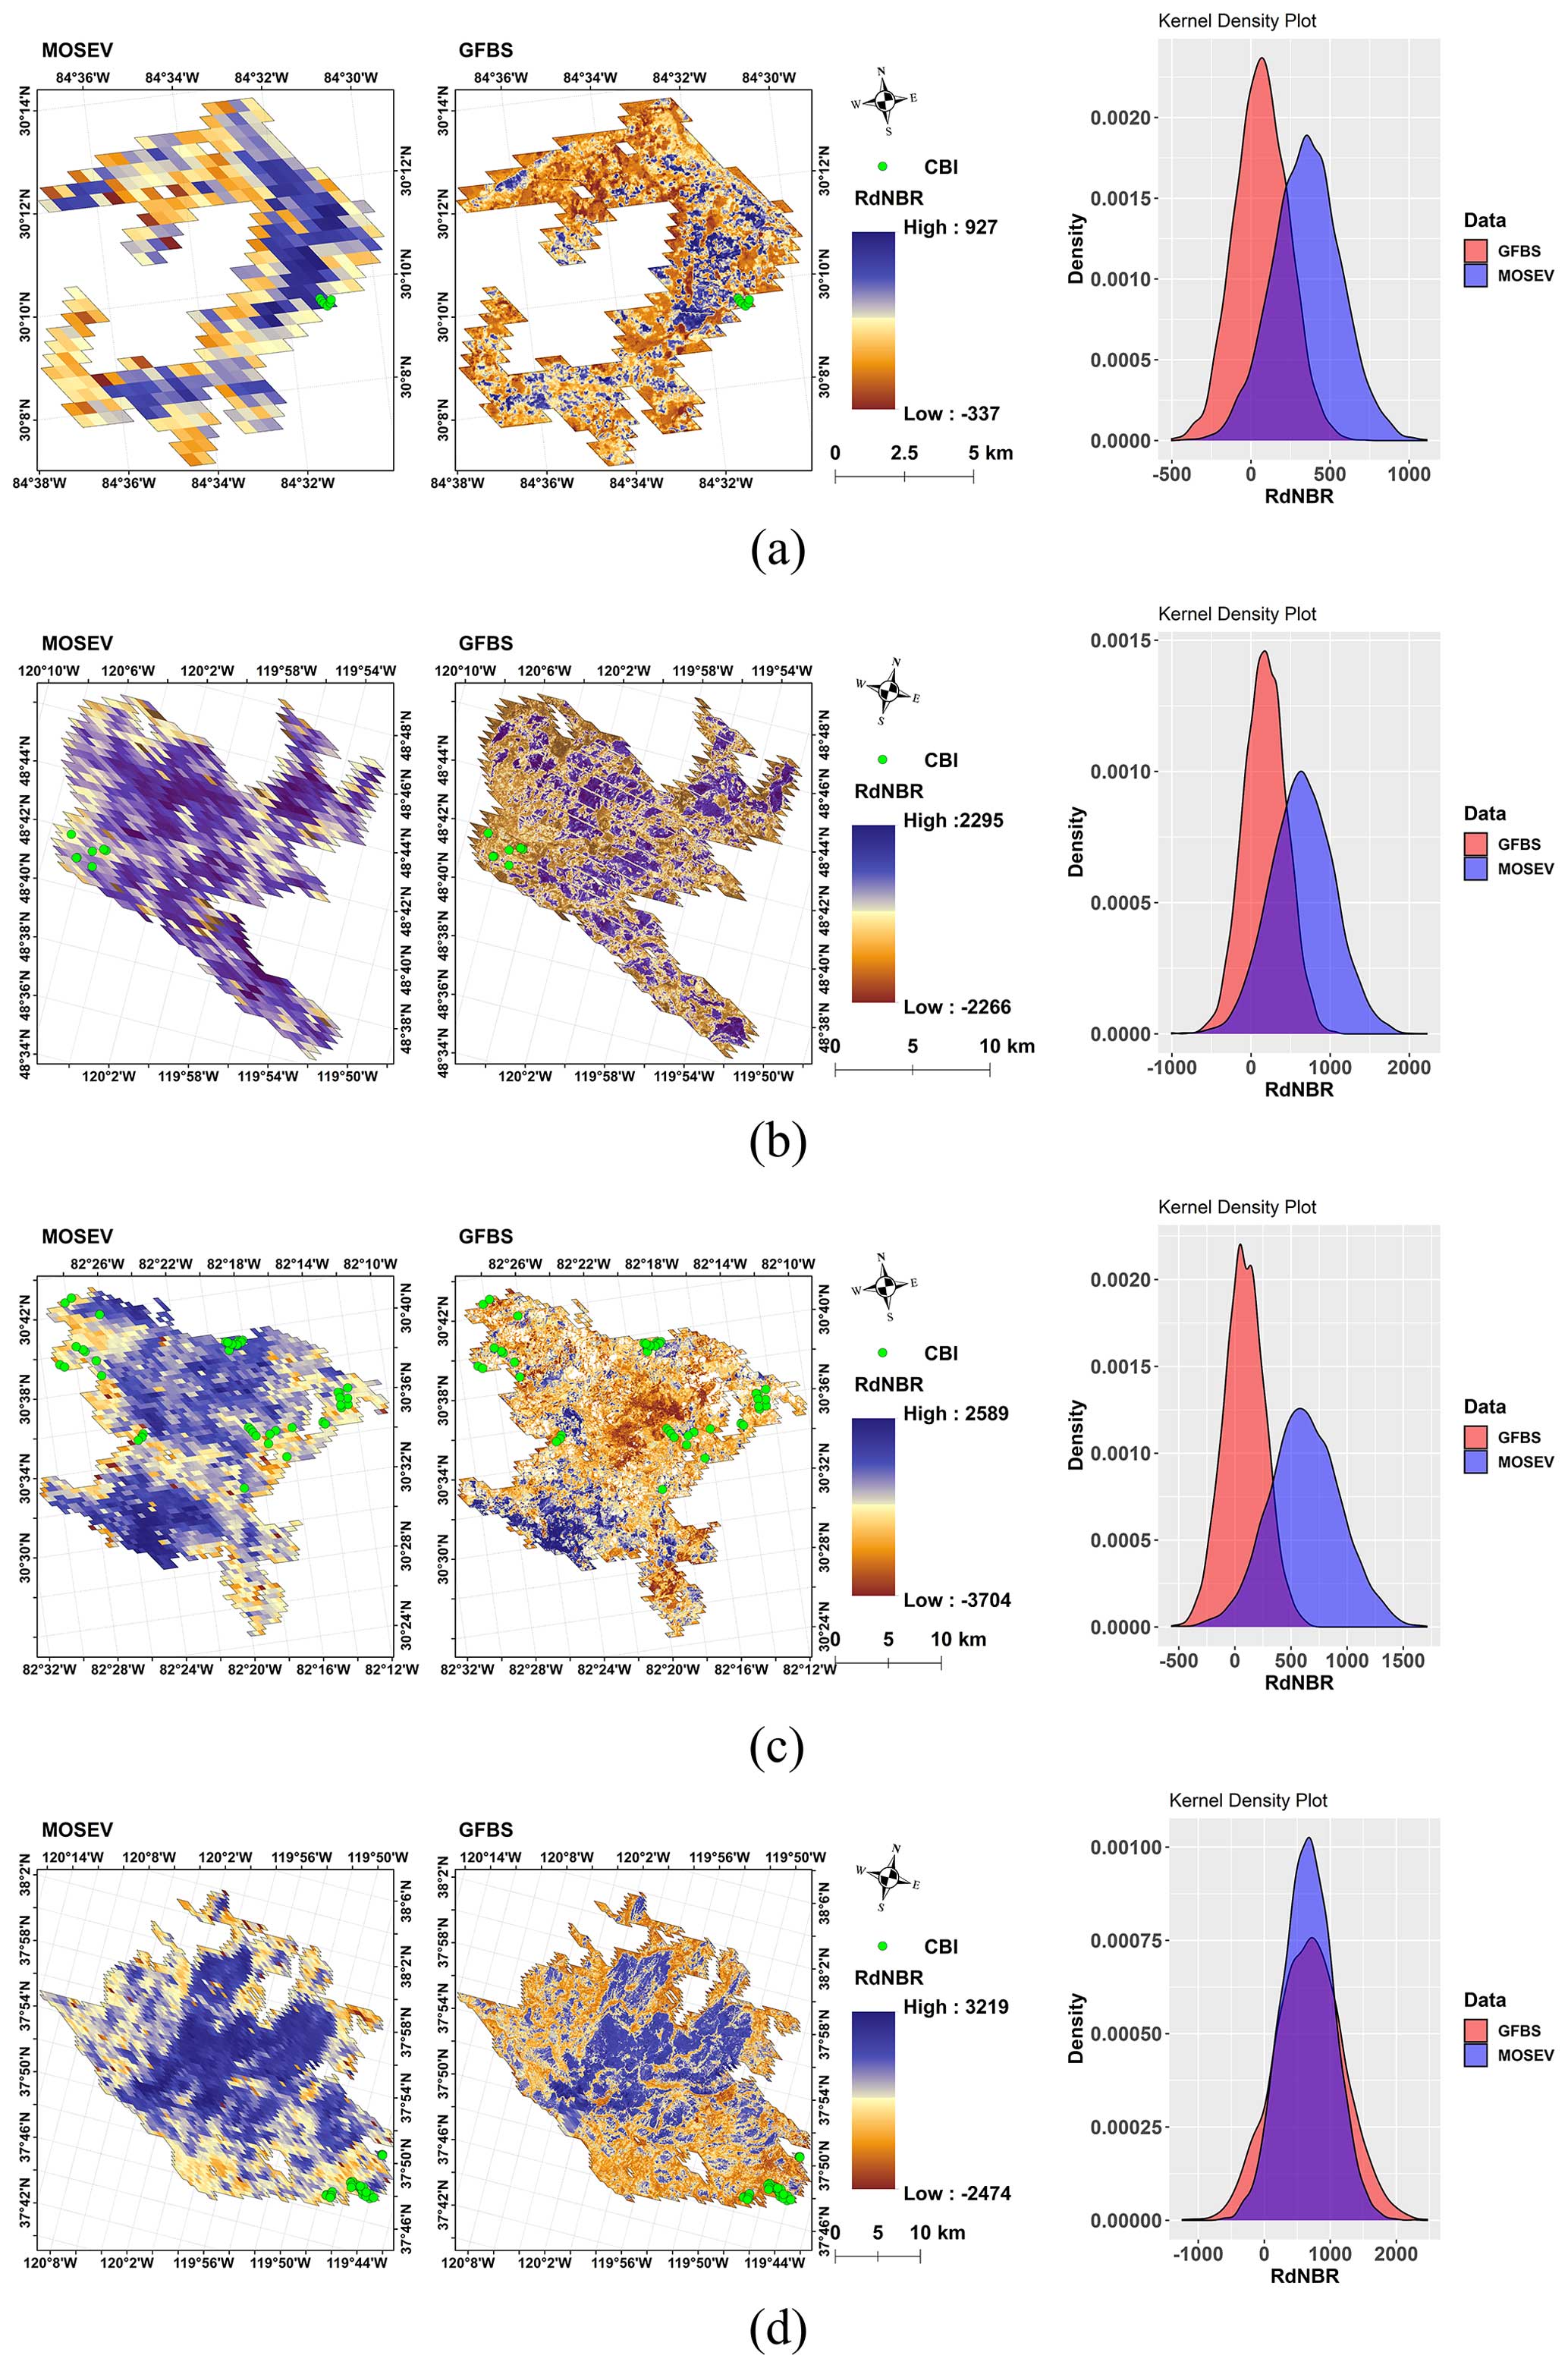
Figure 14Spatial patterns of RdNBRs for annual maximum fires over CONUS with distribution of probability density functions in (a) 2004, (b) 2006, (c) 2007, and (d) 2013, derived from the GFBS and MOSEV datasets.
Figure 15a–d present the scatterplots of CBI against RdNBR from GFBS and MOSEV for the annual maximum forest fires in 2004, 2006, 2007, and 2013, respectively. For the annual maximum forest fire in 2004, RdNBR from GFBS shows a positive correlation with CBI (r=0.57), while no correlation was found between CBI and RdNBR from MOSEV. For the annual maximum forest fire in 2006, RdNBR from GFBS correlated well with the CBI, showing an r value of 0.85, while the r value was only 0.18 between CBI and RdNBR from MOSEV. The correlations between CBI and RdNBR from GFBS and MOSEV are bad for the annual maximum forest fire in 2007; the RdNBR from GFBS showed a positive trend to CBI, with r=0.15, while the RdNBR from MOSEV showed a negative trend to CBI, with . For the annual maximum forest fire in 2013, RdNBR from GFBS (r=0.74) was more strongly correlated with CBI than RdNBR from MOSEV (r=0.40).
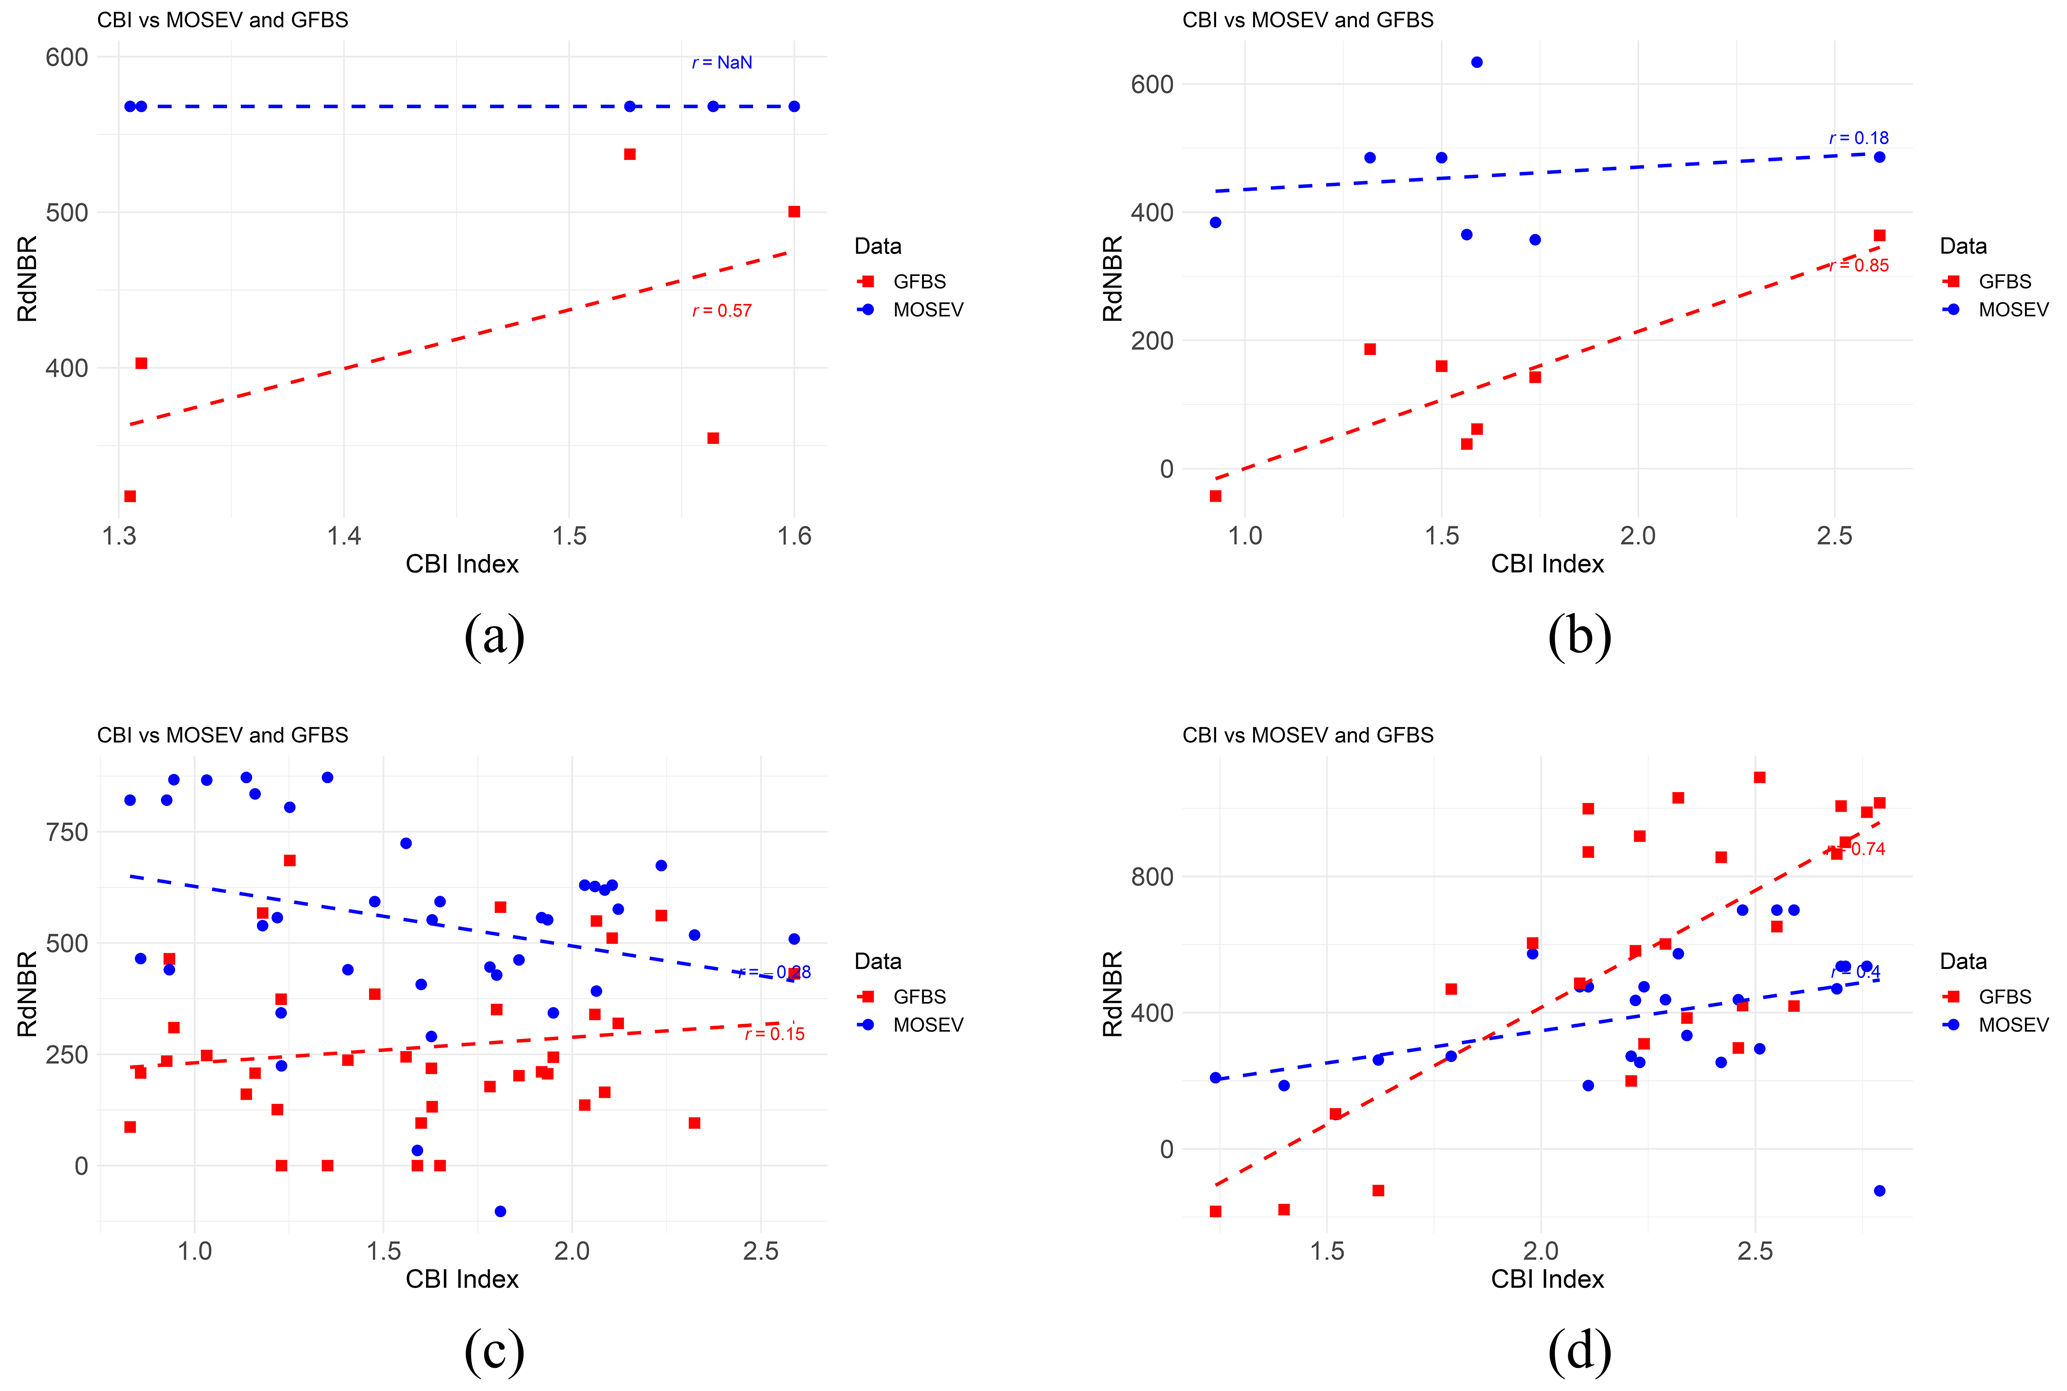
Figure 15Scatterplots of CBI against RdNBR from GFBS and MOSEV for annual maximum fires in (a) 2004, (b) 2006, (c) 2007, and (d) 2013.
Figure 16a and b shows the scatterplots of CBI against dNBR from GFBS and MOSEV, respectively, for all forest fires from 2003 to 2016 over CONUS. Involving all ground validations, we found that GFBS dNBR shows a stronger correlation with CBI (r=0.63) than MOSEV dNBR (r=0.28). Using RdNBR as the burn severity, Fig. 16c and d show that GFBS RdNBR (r=0.56) outperformed MOSEV RdNBR (r=0.20).
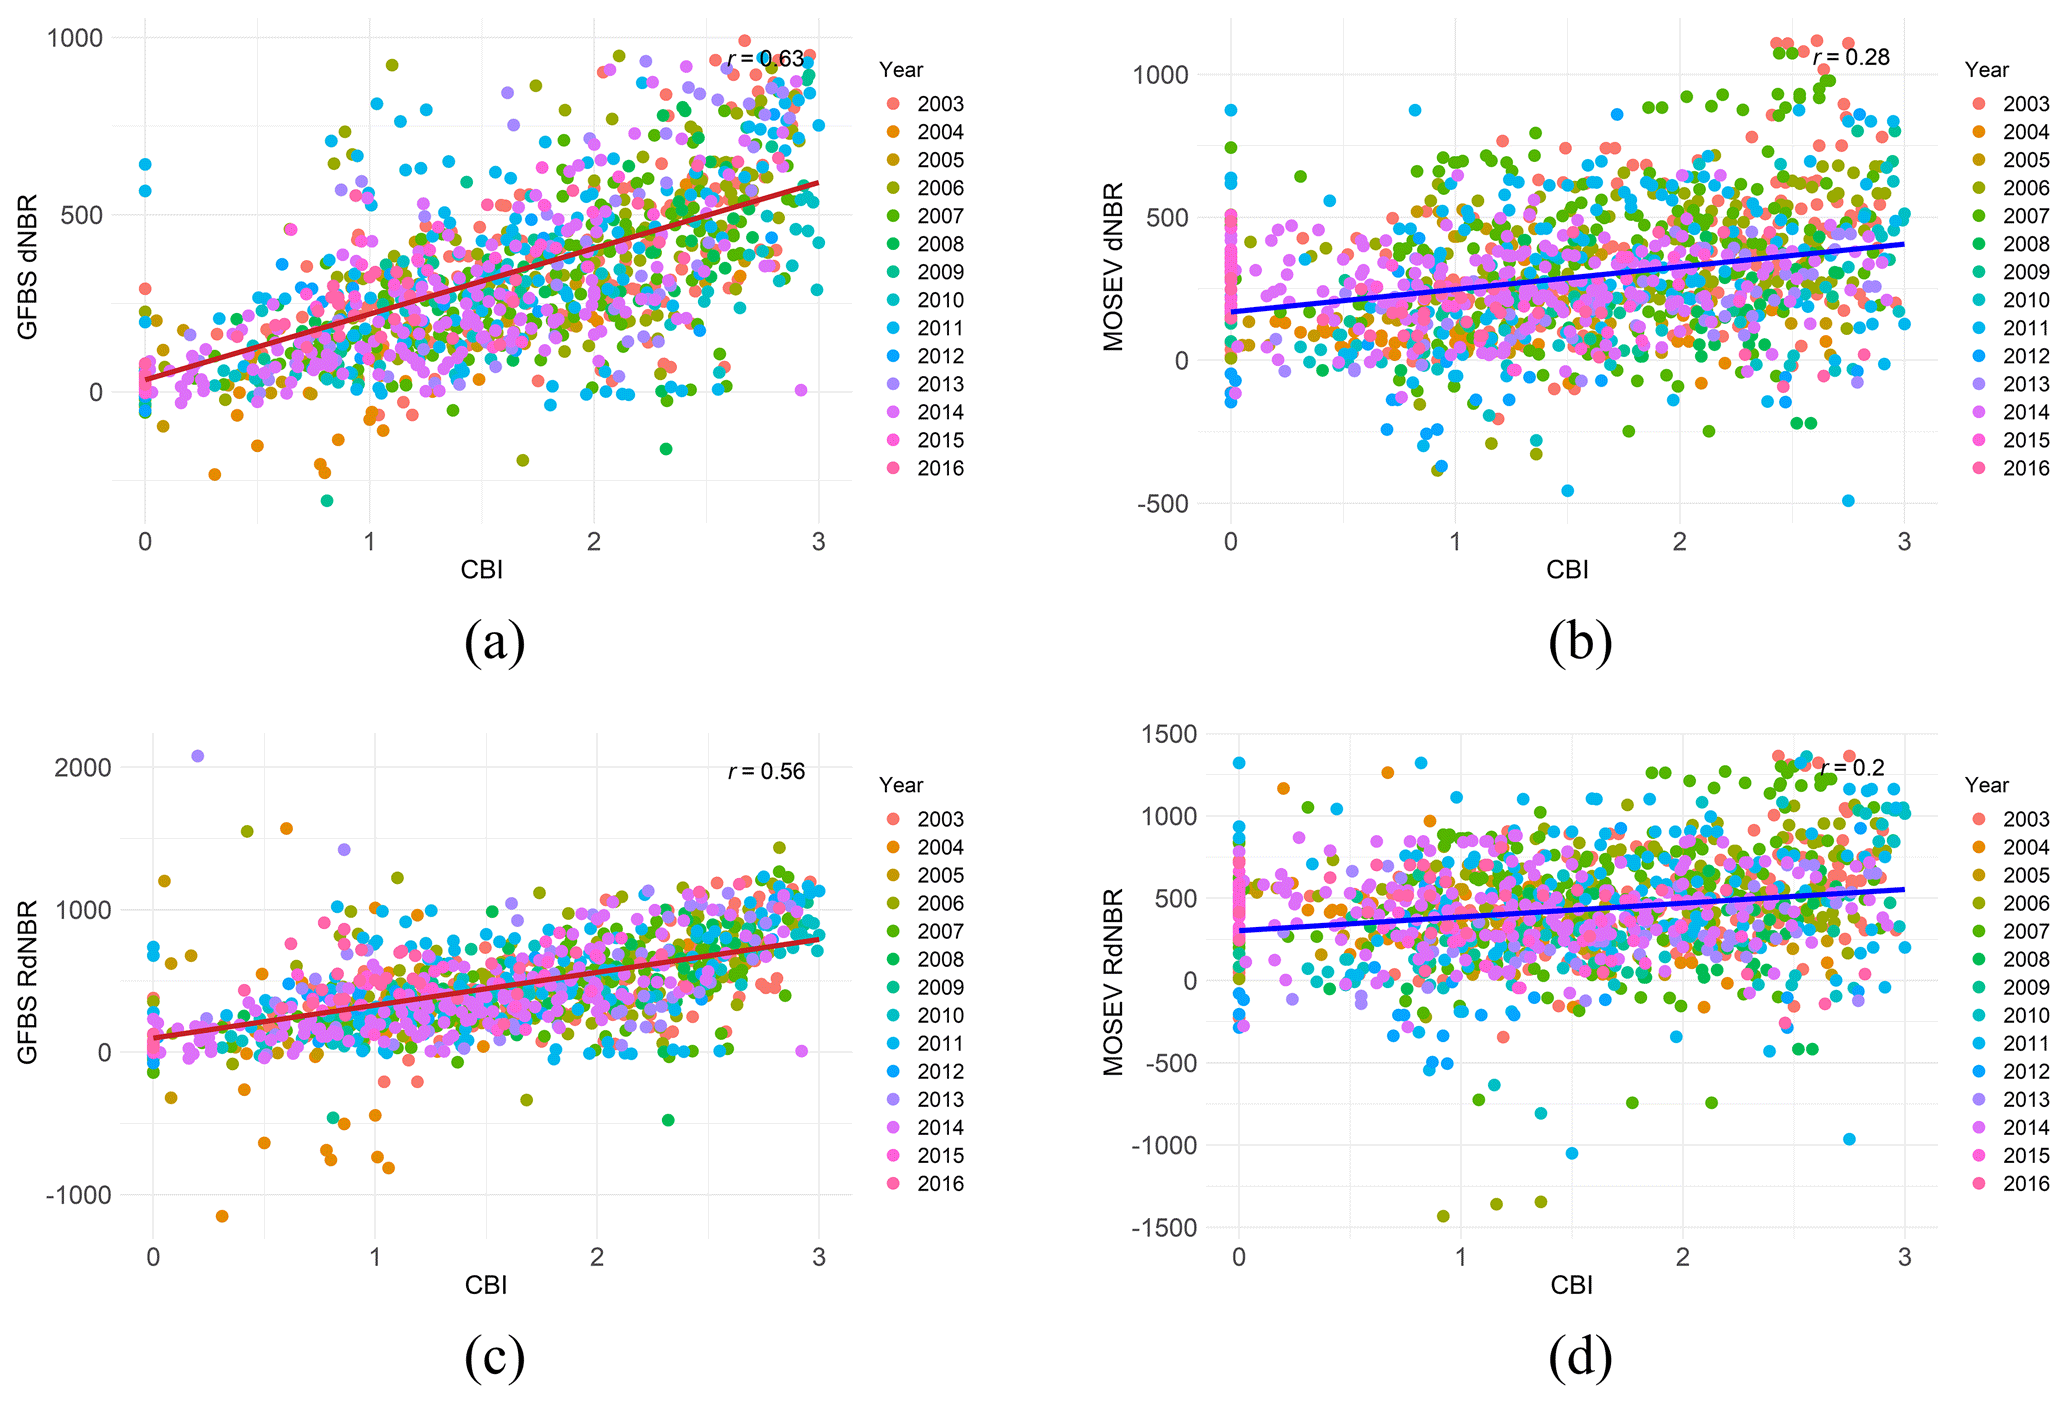
Figure 16Scatterplots of CBI against (a) dNBR from GFBS, (b) dNBR from MOSEV, (c) RdNBR from GFBS, and (d) RdNBR from MOSEV for forest fires from 2003 to 2016 over CONUS.
3.5 Comparison of GFBS and MOSEV globally
Figure 17a displays the global spatial distributions of the overlapping area between the density plots of dNBR from GFBS and MOSEV, which is defined as the area intersected by two probability density functions presented in Figs. 12 and 14. The overlapping areas in density plots typically represent the percentage of common values between the distributions of two datasets, which range from 0 to 1 for the larger value, indicating that the two distributions are more likely to come from the same distribution. As Fig. 17a shows, we found the overlapping area over most of the world to be above 0.4, indicating a similarity of 40 % between the burn severity information provided by GFBS and MOSEV in these regions. For some regions, like South America, western Europe, and southeast Australia, the overlap was above 0.6.
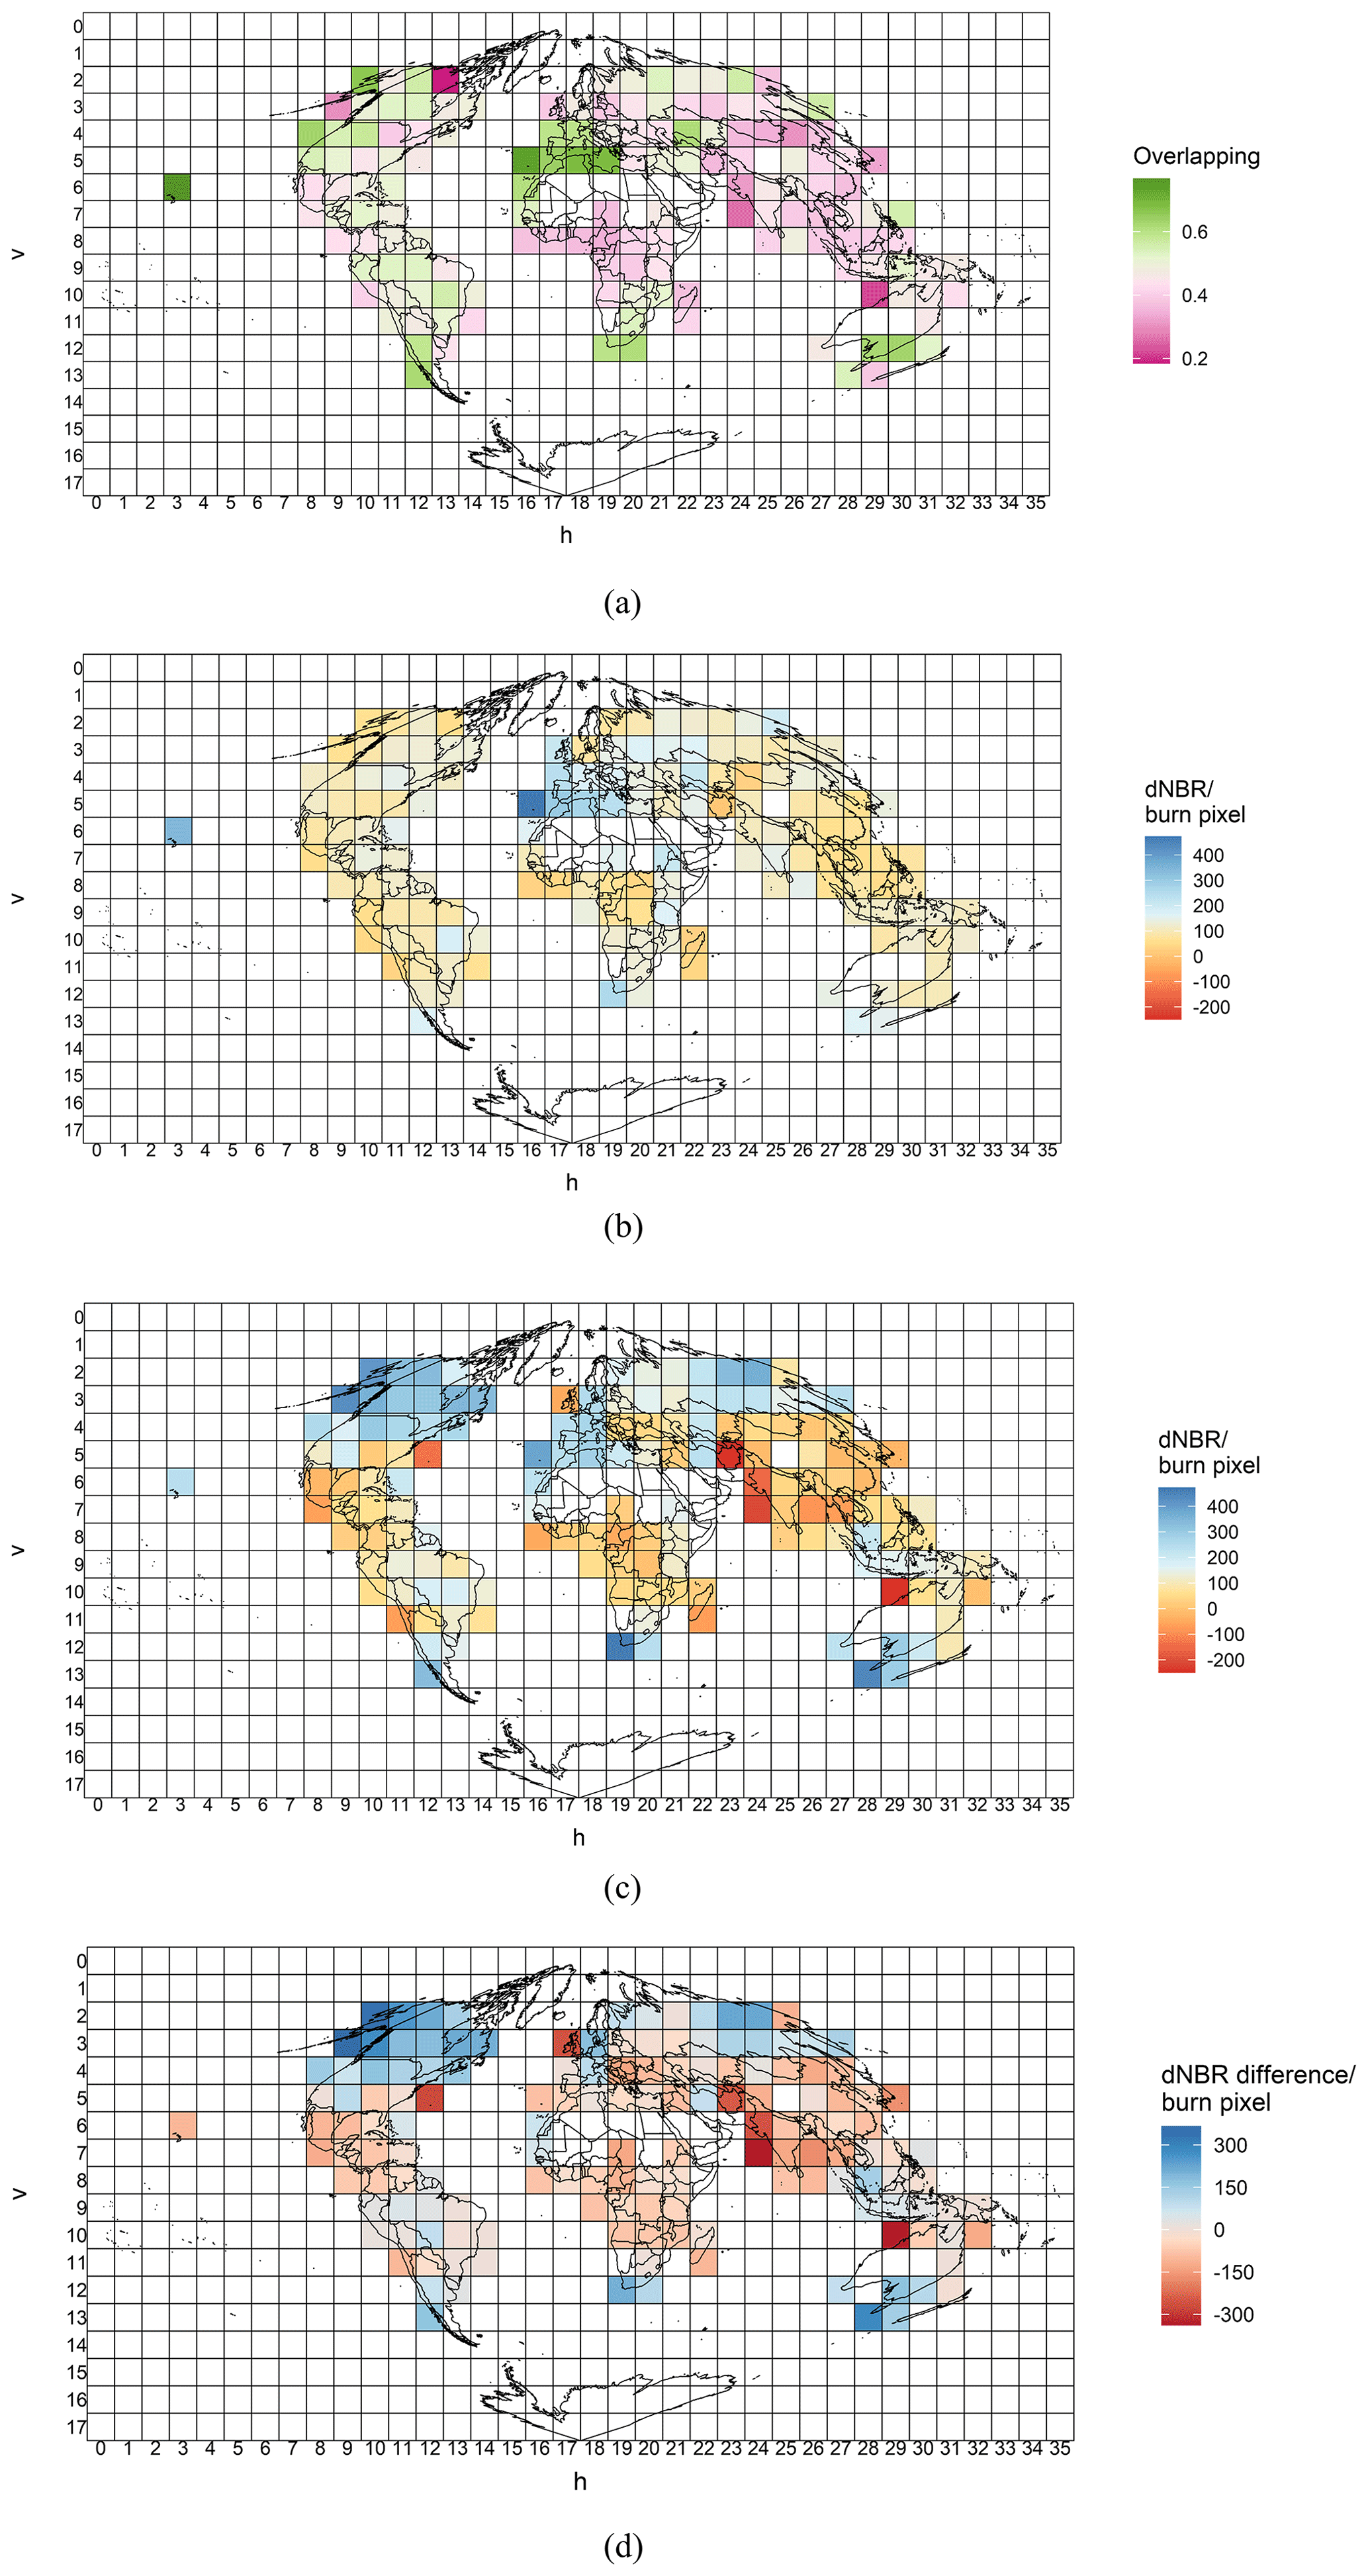
Figure 17Global spatial distributions of (a) the overlapping areas between the density plots of dNBR from GFBS and MOSEV, (b) the mean dNBR per burn pixel from GFBS, (c) the mean dNBR per burn pixel from MOSEV, and (d) the differences in the mean dNBR per burn pixel between MOSEV and GFBS (MOSEV − GFBS).
From Fig. 17b, which shows the global distribution of the mean dNBR for each burn pixel derived from GFBS, we found the global spatial heterogeneity of burn severity to be small, with dNBR values from GFBS of around 100 and 200. The exception was in western Europe, where dNBR was above 300. The global distribution of the mean dNBR for each burn pixel derived from MOSEV, as shown in Fig. 17c, however, indicated a large spatial variability in burn severity globally. The MOSEV dataset, for example, indicated that the forest fires in north CONUS and Canada should have an average dNBR above 300, while in the GFBS dataset, the average dNBR value was around 100 to 200. The MOSEV dataset also indicated that the average dNBR values for forest fires in south Africa and China should be close to or below 0, while in the GFBS dataset, they were around 100 to 200, respectively.
Figure 17d presents a more detailed comparison between the dNBR from GFBS and MOSEV globally, showing the difference in the mean dNBR for each burn pixel, as calculated by deducting GFBS dNBR from MOSEV dNBR. Globally, MOSEV data indicated higher forest burn severity than GFBS over Canada and CONUS (also found in the results presented in Sect. 3.2 and 3.4), as well as southeast Australia (also found in the results presented in Sect. 3.3). MOSEV data presented lower forest burn severity over Mexico, South Africa, Europe, China, and southeast Asia. These findings revealed that the forest burn severity information provided by GFBS might be more reliable and reasonable than that provided by MOSEV for some fire-prone areas, such as CONUS, as validated in this study. This improved accuracy over MOSEV data would support advances in decision-making in fire management strategies and ecosystem conservation efforts.
The GFBS dataset presented in this paper is the first to provide fine-spatial-resolution (30 m) burn severity information for global forest fires from 2003 to 2016. Compared with the existing Landsat-based CanLaBS dataset, GFBS shows closer agreement to CanLaBS in describing the distribution of annual forest fire burn severity than the MODIS-based MOSEV data. As suggested by the validation against the ground reference, GFBS can represent the spatial variability better and provide better performance than the MOSEV dataset. In addition, GFBS is shown to have more reliable burn severity estimations than MOSEV for some fire-prone areas, like CONUS, Canada, and Australia, which could support advances in decision-making in fire management strategies and ecosystem conservation efforts.
The difference in the performance of GFBS and MOSEV with respect to burn severity can be attributed to two sources. The first is spatial resolution. GFBS, based on Landsat (5, 7, and 8) images, is at a resolution of 30 m, while MOSEV is based on MODIS Terra MOD09A1 and Aqua MYD09A1 images, with a resolution of 500 m. As shown in Fig. 11a, stemming from the coarse spatial resolution, MOSEV provides a dNBR value of 295 for the site classified as high-severity as well as for those classified as low-severity, leading to an overestimation for low-severity sites. With the improved spatial resolution, GFBS is able to capture more detailed localized variability in dNBR, providing a more reasonable dNBR estimation for low-severity sites (dNBR equal to 9, 16, and 68). Similarly, in the event shown in Fig. 11b, MOSEV provides dNBR estimations of 287 and 327 for the low-severity sites, which are relatively too large. In GFBS, the relative lower dNBRs of 30 and 32 are provided at the corresponding low-severity sites. The coarse resolution of MOSEV could also make it more difficult to capture the extreme values, as we found to be the case for the annual maximum forest fires in 2006 over CONUS. dNBR from GFBS clearly showed two peaks in the density plot of dNBR at around 100 and 700, representing the low and high severity, respectively. dNBR from MOSEV, however, showed only a single peak at around 500, indicating that the extreme low/high values in the 30 m grid were averaged in the 500 m grid. These findings reveal that burn severity from MOSEV has higher uncertainty for wildfires with larger spatial variabilities.
Another reason leading to the difference in the performances of the two data sets was related to sensors on board Landsat and MODIS. MODIS has a wider spectral range and more spectral bands (36) than Landsat 7 and 8 (7 spectral bands and 11 spectral bands, respectively), which resulted in different sensitivity to surface reflectance. For example, the NBR is commonly calculated using near-infrared (NIR) and shortwave-infrared (SWIR) bands. In MOSEV, the bands used to calculate NBR are NIR Band 2 (0.841–0.876 µm range) and SWIR Band 7 (2.105–2.155 µm range). In GFBS, they are Landsat 5 Band 4 (0.76–0.90 µm range) and SWIR Band 7 (Range 2.08–2.35 µm), Landsat 7 Band 4 (0.77–0.90 µm range) and SWIR Band 7 (2.09–2.35 µm range), and Landsat 8 Band 5 (0.85–0.88 µm range) and SWIR Band 7 (2.11–2.29 µm range). While MODIS and Landsat 8 are close in NIR and SWIR band information, Landsat 5 and 7 both have wider spectrums in NIR and SWIR than MODIS.
This study has shown that combining all available Landsat images, including those from Landsat 5, 7, and 8, could significantly improve the probability of obtaining dense cloud-free NBR time series. The NBR composite shows high spatial and temporal consistency with the NBR images closest to the start and end time of the fire event despite different band settings that are used from Landsat 5, 7, and 8. Studies by Koutsias and Pleniou (2015) and Chen et al. (2020) have also shown that differences are small when using reflectance values from sensors aboard the Landsat 5, 7, and 8 satellites to calculate burn severity over burned area. While studies (Mallinis et al., 2018; Howe et al., 2022) have demonstrated that Sentinel-2 generally performed as well as Landsat 8 in burn severity mapping, the further extension of this study will also incorporate images from Sentinel-2 to obtain a dNBR composite, especially for extending the GFBS dataset to the present. With the finer spatial resolution (10 m) and more frequent revisit period (5 d), GFBS could provide improved burn severity information when incorporating Sentinel-2 images. The National Aeronautics and Space Administration (NASA) has launched the Harmonized Landsat and Sentinel-2 (HLS) project aiming to produce a seamless surface reflectance record from the operational land imager (OLI) and multispectral instrument (MSI) aboard Landsat 8/9 and Sentinel-2A/B remote sensing satellites, respectively, which is an alternative source for extending the GFBS dataset (https://hls.gsfc.nasa.gov/, last access: 4 March 2024).
With the development of radar-based techniques, synthetic aperture radar (SAR) polarimetric images have been proven to be effective in burn severity mapping, owing to the strong correlation between SAR backscatter and burn severity (Czuchlewski and Weissel, 2005; Tanase et al., 2010a, 2011; Addison and Oommen, 2018). With the unique properties of L-band SAR, it is suitable for assessing and monitoring post-fire effects and burn severity (Tanase et al., 2010b; Peacock et al., 2023). For example, the frequency of L-band (1.26 GHz) allows it to penetrate through smoke; ash; and, to some extent, vegetation canopy. This capability makes L-band SAR particularly useful for assessing areas immediately after a fire even in the presence of smoke or cloud cover that would obstruct optical sensors. The incorporation of L-band synthetic aperture radar (SAR) data, such as the ALOS-2 PALSAR-2 ScanSAR Level 2.2 data (https://www.eorc.jaxa.jp/ALOS/en/alos-2/a2_about_e.htm, last access: 4 March 2024) and the incoming NASA–ISRO synthetic aperture radar (NISAR; https://nisar.jpl.nasa.gov/, last access: 4 March 2024), can also facilitate the retrieval of burn severity.
By comparing GFBS with CanLaBS, we found that the number of forest fires in CanLaBS dataset is larger than those in GFBS. This is because CanLaBS is based on the burn area map from Canada Landsat Disturbance product at a 30 m resolution, while GFBS is based on the burn area map from the Global Fire Atlas, which is derived from the MODIS burn area product at a 500 m resolution. This difference in the spatial resolution of the burn area causes some small forest fires to be ignored in the GFBS dataset. Therefore, a finer-spatial-resolution burn area product (10/30 m) is promoted regionally and globally to reveal the forest fire behavior, e.g., fire number, size and severity, better (Roy et al., 2019; Bar et al., 2020). Despite the differences in the number of forest fires, GFBS agreed well with CanLaBS in terms of the annual forest burn severity. While the method to generate GFBS remains consistent, with the small difference that is to be ignored in banding settings from Landsat 5, 7, and 8, GFBS provides comprehensive temporal coverage spanning from 2003 to 2016 for forest burn severity, indicating the potential application of GFBS in long-term analysis of burn severity for forest fires beyond Canada, i.e., regions over the globe, such as CONUS and Australia, where GFBS has been demonstrated to perform well against ground truth. Moreover, integrating the 30 m GFBS into the regional forest planning can enhance fire resilience in vulnerable areas, shaping policies that prioritize the forest environment (Bradley et al., 2016). As climate change exacerbates the frequency, intensity, and unpredictability of wildfires globally, the analysis of GFBS data can help to assess the impact of these fires on carbon emissions (Xu et al., 2020), forest recovery (Meng et al., 2018), and biodiversity (Huerta et al., 2022), which would in turn inform predictive models that project future fire behavior under various climate scenarios.
The GFBS data are freely accessible at https://doi.org/10.5281/zenodo.10037629 (He et al., 2023).
We have introduced a newly developed dataset, named GFBS, which provides forest burn severity information with global coverage for the period 2003–2016. We identified global forest fires by overlaying the Global Fire Atlas data with the annual land cover data, MCD12Q1, and proposed an automated algorithm for calculating the severity of these fires. The algorithm used the band information from Landsat 5, 7, and 8 surface reflectance imagery to compute the most used burn severity spectral indices (dNBR and RdNBR) with a 30 m spatial resolution and provide the output depicted in the GFBS dataset. Comparison between CanLaBS and GFBS showed good agreement in representing the distribution of forest burn severity over Canada. The validation against field-assessed burn severity category data in southeastern Australia showed that GFBS could provide burn severity estimation with clear differentiation between the high-severity class and the moderate-/low-severity classes of the in situ data, while such differences among burn severity class were not obvious in the MOSEV dataset. The validation results over CONUS showed dNBR values from GFBS to be more strongly correlated with CBI (r=0.63) than dNBR from MOSEV (r=0.28). RdNBR from GFBS also showed better agreement with CBI (r=0.56) than RdNBR from MOSEV (r=0.20). Thus, this database could be more reliable than prior sources of information for future studies of forest burn severity on a global scale as well as for studies to which forest burn severity could be relevant, such as in forest management and CO2 emissions research.
A future direction for this study would be to extend the GFBS dataset to the present based on updated Global Fire Atlas data or other datasets providing global burn area and burn date information. Another direction is to involve more ground validations from the fire-prone areas like south Africa and south Mexico to further evaluate and improve the performance of GFBS data globally.
KH and ENA designed and organized the paper. KH and XS prepared the related materials and ran the models for generating GFBS and the related assessments. XS and ENA made contributions to the scientific framework of this study and discussed the interpretation of the results. All authors discussed the results and commented on the paper.
The contact author has declared that none of the authors has any competing interests.
Publisher's note: Copernicus Publications remains neutral with regard to jurisdictional claims made in the text, published maps, institutional affiliations, or any other geographical representation in this paper. While Copernicus Publications makes every effort to include appropriate place names, the final responsibility lies with the authors.
This research was supported by a National Science Foundation HDR award entitled “Collaborative Research: Near Term Forecast of Global Plant Distribution Community Structure and Ecosystem Function”. Kang He received the support of the China Scholarship Council for four years' PhD study at the University of Connecticut (under grant agreement no. 201906320068). Thanks to Rachael Gallagher and Eli Bendall from Western Sydney University for sharing the field-assessed fire severity category data over southeastern Australia.
This research has been supported by the National Science Foundation (grant no. 1934712).
This paper was edited by Han Ma and reviewed by two anonymous referees.
Abreu, R. C., Hoffmann, W. A., Vasconcelos, H. L., Pilon, N. A., Rossatto, D. R., and Durigan, G.: The biodiversity cost of carbon sequestration in tropical savanna, Sci. Adv., 3, e1701284, https://doi.org/10.1126/sciadv.1701284, 2017.
Addison, P. and Oommen, T.: Utilizing satellite radar remote sensing for burn severity estimation, Int. J. Appl. Earth Obs., 73, 292–299, https://doi.org/10.1016/j.jag.2018.07.002, 2018.
Alcaras, E., Costantino, D., Guastaferro, F., Parente, C., and Pepe, M.: Normalized Burn Ratio Plus (NBR+): A New Index for Sentinel-2 Imagery, Remote Sens.-Basel, 14, 1727, https://doi.org/10.3390/rs14071727, 2022.
Alonso-González, E. and Fernández-García, V.: MOSEV: a global burn severity database from MODIS (2000–2020), Earth Syst. Sci. Data, 13, 1925–1938, https://doi.org/10.5194/essd-13-1925-2021, 2021.
Andela, N., Morton, D. C., Giglio, L., Paugam, R., Chen, Y., Hantson, S., van der Werf, G. R., and Randerson, J. T.: The Global Fire Atlas of individual fire size, duration, speed and direction, Earth Syst. Sci. Data, 11, 529–552, https://doi.org/10.5194/essd-11-529-2019, 2019.
Aragão, L. E., Anderson, L. O., Fonseca, M. G., Rosan, T. M., Vedovato, L. B., Wagner, F. H., Silva, C. V., Silva Junior, C. H., Arai, E., Aguiar, A. P., and Barlow, J.: 21st Century drought-related fires counteract the decline of Amazon deforestation carbon emissions, Nat. Commun., 9, 536, https://doi.org/10.1038/s41467-017-02771-y, 2018.
Archibald, S. and Roy, D. P.: Identifying individual fires from satellite-derived burned area data, 2009 IEEE International Geoscience and Remote Sensing Symposium, Cape Town, South Africa, 12–17 July 2009, 11150061, https://doi.org/10.1109/IGARSS.2009.5417974, 2009.
Bar, S., Parida, B. R., and Pandey, A. C.: Landsat-8 and Sentinel-2 based Forest fire burn area mapping using machine learning algorithms on GEE cloud platform over Uttarakhand, Western Himalaya, Remote Sens. Appl., 18, 100324, https://doi.org/10.1016/j.rsase.2020.100324, 2020.
Benali, A., Russo, A., Sá, A. C., Pinto, R. M., Price, O., Koutsias, N., and Pereira, J. M.: Determining fire dates and locating ignition points with satellite data, Remote. Sens.-Basel, 8, 326, https://doi.org/10.3390/rs8040326, 2016.
Bradley, C. M., Hanson, C. T., and DellaSala, D. A.: Does increased forest protection correspond to higher fire severity in frequent-fire forests of the western United States?, Ecosphere, 7, e01492, https://doi.org/10.1002/ecs2.1492, 2016.
Chen, D., Loboda, T. V., and Hall, J. V.: A systematic evaluation of influence of image selection process on remote sensing-based burn severity indices in North American boreal forest and tundra ecosystems, ISPRS J. Photogramm., 159, 63–77, https://doi.org/10.1016/j.isprsjprs.2019.11.011, 2020.
Chuvieco, E., De Santis, A., Riaño, D., and Halligan, K.: Simulation Approaches for Burn Severity Estimation Using Remotely Sensed Images, Fire Ecol., 6, 85–101, https://doi.org/10.4996/fireecology.0603085, 2010.
Chuvieco, E., Yue, C., Heil, A., Mouillot, F., Alonso-Canas, I., Padilla, M., Pereira, J. M., Oom, D., and Tansey, K.: A new global burned area product for climate assessment of fire impacts, Global Ecol. Biogeogr., 25, 619–629, https://doi.org/10.1111/geb.12440, 2016.
Cocke, A. E., Fulé, P. Z., and Crouse, J. E.: Comparison of burn severity assessments using Differenced Normalized Burn Ratio and ground data, Int. J. Wildland Fire, 14, 189–198, https://doi.org/10.1071/WF04010, 2005.
Czuchlewski, K. R. and Weissel, J. K.: Synthetic Aperture Radar (SAR)-based mapping of wildfire burn severity and recovery, in: Proceedings 2005 IEEE International Geoscience and Remote Sensing Symposium, IGARSS'05, Vol. 1, https://doi.org/10.1109/IGARSS.2005.1526102, 2005.
Doerr, S. H. and Santín, C.: Global trends in wildfire and its impacts: perceptions versus realities in a changing world, Philos. T. Roy. Soc. B, 371, 1696, https://doi.org/10.1098/rstb.2015.0345, 2016.
Dupuy, J. L., Fargeon, H., Martin-StPaul, N., Pimont, F., Ruffault, J., Guijarro, M., Hernando, C., Madrigal, J., and Fernandes, P.: Climate change impact on future wildfire danger and activity in southern Europe: a review, Ann. For. Sci., 77, 1–24, https://doi.org/10.1007/s13595-020-00933-5, 2020.
Eidenshink, J., Schwind, B., Brewer, K., Zhu, Z. L., Quayle, B., and Howard, S.: A project for monitoring trends in burn severity, Fire Ecol., 3, 3–21, https://doi.org/10.4996/fireecology.0301003, 2007.
Flannigan, M. D., Stocks, B. J., and Wotton, B. M.: Climate change and forest fires, Sci. Total Environ., 262, 221–229, https://doi.org/10.1016/S0048-9697(00)00524-6, 2000.
Flannigan, M. D., Amiro, B. D., Logan, K. A., Stocks, B. J., and Wotton, B. M.: Forest fires and climate change in the 21st century, Mitig. Adapt. Strat. Gl., 11, 847–859, https://doi.org/10.1007/s11027-005-9020-7, 2006.
Friedl, M. and Sulla-Menashe, D.: MODIS/Terra+Aqua Land Cover Type Yearly L3 Global 500 m SIN Grid V061, NASA EOSDIS Land Processes Distributed Active Archive Center [data set], https://doi.org/10.5067/MODIS/MCD12Q1.061, 2022.
Fusco, E. J., Abatzoglou, J. T., Balch, J. K., Finn, J. T., and Bradley, B. A.: Quantifying the human influence on fire ignition across the western USA, Ecol. Appl., 26, 2390–2401, https://doi.org/10.1002/eap.1395, 2016.
Guindon, L., Villemaire, P., St-Amant, R., Bernier, P. Y., Beaudoin, A., Caron, F., Bonucelli, M., and Dorion, H.: Canada Landsat Disturbance (CanLaD): a Canada-wide Landsat-based 30 m resolution product of fire and harvest detection and attribution since 1984, https://doi.org/10.23687/add1346b-f632-4eb9-a83d-a662b38655ad, 2017.
Guindon, L., Bernier, P. Y., Gauthier, S., Stinson, G., Villemaire, P., and Beaudoin, A.: Missing forest cover gains in boreal forests explained, Ecosphere, 9, e02094, https://doi.org/10.1002/ecs2.2094, 2018.
Guindon, L., Gauthier, S., Manka, F., Parisien, M. A., Whitman, E., Bernier, P., Beaudoin, A., Villemaire, P., and Skakun, R.: Trends in wildfire burn severity across Canada, 1985 to 2015, Can. J. Forest Res., 51, 1230–1244, https://doi.org/10.1139/cjfr-2020-0353, 2021.
Hantson, S., Pueyo, S., and Chuvieco, E.: Global fire size distribution is driven by human impact and climate, Global Ecol. Biogeogr., 24, 77–86, https://doi.org/10.1111/geb.12246, 2015.
He, K., Shen, X., and Anagnostou, E. N.: A Global Forest Burn Severity Dataset from Landsat Imagery (2003–2016), Zenodo [data set], https://doi.org/10.5281/zenodo.10037629, 2023.
Howe, A. A., Parks, S. A., Harvey, B. J., Saberi, S. J., Lutz, J. A., and Yocom, L. L.: Comparing Sentinel-2 and Landsat 8 for burn severity mapping in Western North America, Remote Sens.-Basel, 14, 5249, https://doi.org/10.3390/rs14205249, 2022.
Huerta, S., Marcos, E., Fernández-García, V., and Calvo, L.: Short-term effects of burn severity on ecosystem multifunctionality in the northwest Iberian Peninsula, Sci. Total Environ., 844, 157193, https://doi.org/10.1016/j.scitotenv.2022.157193, 2022.
Jolly, W. M., Cochrane, M. A., Freeborn, P. H., Holden, Z. A., Brown, T. J., Williamson, G. J., and Bowman, D. M.: Climate-induced variations in global wildfire danger from 1979 to 2013, Nat. Commun., 6, 7537, https://doi.org/10.1038/ncomms8537, 2015.
Kasischke, E. S. and Turetsky, M. R.: Recent changes in the fire regime across the North American boreal region – Spatial and temporal patterns of burning across Canada and Alaska, Geophys. Res. Lett., 33, L09703, https://doi.org/10.1029/2006GL025677, 2006.
Keeley, J. E.: Fire intensity, burn severity and burn severity: a brief review and suggested usage, Int. J. Wildland Fire, 18, 116–126, https://doi.org/10.1071/WF07049, 2009.
Key, C. H. and Benson, N. C.: The Normalized Burn Ratio (NBR): A Landsat TM radiometric measure of burn severity, US Department of the Interior, US Geological Survey, Northern Rocky Mountain Science Center, https://www.frames.gov/catalog/5860 (last access: 27 September 2023), 2003.
Key, C. H. and Benson, N. C.: Landscape assessment (LA): Sampling and Analysis Methods, USDA Forest Service, 55 pp., https://www.fs.usda.gov/research/treesearch/24066 (last access: 27 September 2023), 2006.
Koutsias, N. and Pleniou, M.: Comparing the spectral signal of burned surfaces between Landsat 7 ETM+ and Landsat 8 OLI sensors, Int. J. Remote Sens., 36, 3714–3732, https://doi.org/10.1080/01431161.2015.1070322, 2015.
Laurent, P., Mouillot, F., Yue, C., Ciais, P., Moreno, M. V., and Nogueira, J. M.: FRY, a global database of fire patch functional traits derived from space-borne burned area products, Sci. Data, 5, 1–12, https://doi.org/10.1038/sdata.2018.132, 2018.
Mallinis, G., Mitsopoulos, I., and Chrysafi, I.: Evaluating and comparing Sentinel 2A and Landsat-8 Operational Land Imager (OLI) spectral indices for estimating fire severity in a Mediterranean pine ecosystem of Greece, GIsci Remote Sens., 55, 1–18, https://doi.org/10.1080/15481603.2017.1354803, 2018.
Meng, R., Wu, J., Zhao, F., Cook, B. D., Hanavan, R. P., and Serbin, S. P.: Measuring short-term post-fire forest recovery across a burn severity gradient in a mixed pine-oak forest using multi-sensor remote sensing techniques, Remote Sens. Environ., 210, 282–296, https://doi.org/10.1016/j.rse.2018.03.019, 2018.
Miller, J. D. and Thode, A. E.: Quantifying burn severity in a heterogeneous landscape with a relative version of the delta Normalized Burn Ratio (dNBR), Remote Sens. Environ., 109, 66–80, https://doi.org/10.1016/j.rse.2006.12.006, 2007.
Miller, J. D., Knapp, E. E., Key, C. H., Skinner, C. N., Isbell, C. J., Creasy, R. M., and Sherlock, J. W.: Calibration and validation of the relative differenced Normalized Burn Ratio (RdNBR) to three measures of fire severity in the Sierra Nevada and Klamath Mountains, California, USA, Remote Sens. Environ., 113, 645–656, https://doi.org/10.1016/j.rse.2008.11.009, 2009.
Montero, D., Aybar, C., Mahecha, M. D., Martinuzzi, F., Söchting, M., and Wieneke, S.: A standardized catalogue of spectral indices to advance the use of remote sensing in Earth system research, Sci. Data, 10, 197, https://doi.org/10.1038/s41597-023-02096-0, 2023.
Moreira, F., Ascoli, D., Safford, H., Adams, M. A., Moreno, J. M., Pereira, J. M., Catry, F. X., Armesto, J., Bond, W., González, M. E., and Curt, T.: Wildfire management in Mediterranean-type regions: paradigm change needed, Environ. Res. Lett., 15, 011001, https://doi.org/10.1088/1748-9326/ab541e, 2020.
Nasi, R., Dennis, R., Meijaard, E., Applegate, G., and Moore, P.: Forest fire and biological diversity, UNASYLVA-FAO, 36–40, https://www.fao.org/4/y3582e/y3582e08.htm (last access: 1 November 2023), 2002.
Nogueira, J. M., Ruffault, J., Chuvieco, E., and Mouillot, F.: Can we go beyond burned area in the assessment of global remote sensing products with fire patch metrics?, Remote Sens.-Basel, 9, 7, https://doi.org/10.3390/rs9010007, 2016.
Oom, D., Silva, P. C., Bistinas, I., and Pereira, J. M.: Highlighting biome-specific sensitivity of fire size distributions to time-gap parameter using a new algorithm for fire event individuation, Remote Sens.-Basel, 8, 663, https://doi.org/10.3390/rs8080663, 2016.
Peacock, A., Pinto, N., and Lou, Y.: Burn Severity Mapping with L-band UAVSAR Observations Over Los Angeles' Largest Wildfire, in: IGARSS 2023–2023 IEEE International Geoscience and Remote Sensing Symposium, https://doi.org/10.1109/IGARSS52108.2023.10281609, 2023.
Rodrigues, M. and Febrer, M.: Spatial-temporal modeling of forest fire behavior: modeling fire ignition and propagation from MCD64A1, 20th EGU General Assembly, Vienna, Austria, 4–13 April 2018, EGU2018-14568, 2018.
Roy, D. P., Huang, H., Boschetti, L., Giglio, L., Yan, L., Zhang, H. H., and Li, Z.: Landsat-8 and Sentinel-2 burned area mapping-A combined sensor multi-temporal change detection approach, Remote Sens. Environ., 231, 111254, https://doi.org/10.1016/j.rse.2019.111254, 2019.
Scholes, R. J. and Archer, S. R.: Tree-grass interactions in savannas, Annu. Rev. Ecol. Syst., 28, 517–544, https://doi.org/10.1146/annurev.ecolsys.28.1.517, 1997.
Shukla, P. R., Skea, J., Calvo Buendia, E., Masson-Delmotte, V., Pörtner, H. O., Roberts, D. C., Zhai, P., Slade, R., Connors, S., Van Diemen, R., and Ferrat, M.: Climate Change and Land: an IPCC special report on climate change, desertification, land degradation, sustainable land management, food security, and greenhouse gas fluxes in terrestrial ecosystems, IPCC, 874 pp., https://www.ipcc.ch/srccl/ (last access: 1 November 2023), 2019.
Tanase, M., Santoro, M., de la Riva, J., Kasischke, E., and Korets, M. A.: L-band SAR backscatter prospects for burn severity estimation in boreal forests, in: Proc. ESA Living Planet Symp., Bergen, Norway, ESA Publications Division, SP-686, 1–6, ISBN 978-92-9221-250-6, 2010a.
Tanase, M., Santoro, M., de la Riva, J., Fernando, P., and Le Toan, T.: Sensitivity of X-, C-, and L-band SAR backscatter to burn severity in Mediterranean pine forests, IEEE T. Geosci., 48, 3663–3675, https://doi.org/10.1109/IGARSS52108.2023.10281609, 2010b.
Tanase, M., de la Riva, J., Santoro, M., Pérez-Cabello, F., and Kasischke, E.: Sensitivity of SAR data to post-fire forest regrowth in Mediterranean and boreal forests, Remote Sens. Environ., 115, 2075–2085, https://doi.org/10.1016/j.rse.2011.04.009, 2011.
Xu, W., He, H. S., Hawbaker, T. J., Zhu, Z., and Henne, P. D.: Estimating burn severity and carbon emissions from a historic megafire in boreal forests of China, Sci. Total Environ., 716, 136534, https://doi.org/10.1016/j.scitotenv.2020.136534, 2020.