the Creative Commons Attribution 4.0 License.
the Creative Commons Attribution 4.0 License.
 | 12 Jan 2024
Comprehensive data set of in situ hydraulic stimulation experiments for geothermal purposes at the Äspö Hard Rock Laboratory (Sweden)
Arno Zang
Peter Niemz
Sebastian von Specht
Günter Zimmermann
Claus Milkereit
Katrin Plenkers
Gerd Klee
In this article, a high-resolution acoustic emission sensor, accelerometer, and broadband seismometer array data set is made available and described in detail from in situ experiments performed at Äspö Hard Rock Laboratory in May and June 2015. The main goal of the hydraulic stimulation tests in a horizontal borehole at 410 m depth in naturally fractured granitic rock mass is to demonstrate the technical feasibility of generating multi-stage heat exchangers in a controlled way superiorly to former massive stimulations applied in enhanced geothermal projects. A set of six, sub-parallel hydraulic fractures is propagated from an injection borehole drilled parallel to minimum horizontal in situ stress and is monitored by an extensive complementary sensor array implemented in three inclined monitoring boreholes and the nearby tunnel system. Three different fluid injection protocols are tested: constant water injection, progressive cyclic injection, and cyclic injection with a hydraulic hammer operating at 5 Hz frequency to stimulate a crystalline rock volume of size 30 m × 30 m × 30 m at depth. We collected geological data from core and borehole logs, fracture inspection data from an impression packer, and acoustic emission hypocenter tracking and tilt data, as well as quantified the permeability enhancement process. The data and interpretation provided through this publication are important steps in both upscaling laboratory tests and downscaling field tests in granitic rock in the framework of enhanced geothermal system research. Data described in this paper can be accessed at GFZ Data Services under https://doi.org/10.5880/GFZ.2.6.2023.004 (Zang et al., 2023).
- Article
(4203 KB) - Full-text XML
- BibTeX
- EndNote


Climate change on Earth poses great challenges to the transition from energy production based on fossil fuels to low-carbon renewables. Among renewable energy sources, geothermal energy provides a local solution for district heating and electricity supply. As such, it has the potential to provide safe and clean energy for growing urban areas worldwide, although geothermal settings are also located in remote areas, e.g., the Geysers (USA), Coso (USA), or Cooper Basin (Australia). Conventionally, geothermal energy is extracted from deep rock formations that are naturally fractured and faulted. Permeable fractures and faults can serve as fluid pathways, thereby improving fluid production from and injection into a reservoir. However, faults are also at risk to abruptly slip, resulting in seismic events caused by geothermal energy operations (Buijze et al., 2019; Zang et al., 2014; Majer et al., 2012). The risk of such induced seismicity is the major factor opposing the widespread development of geothermal energy. Injection-induced geothermal seismic risk must be addressed (Giardini, 2009), and new methods are required to make this environmentally friendly energy source available to the wider community (e.g., in urban areas) by mitigating the risk of larger induced seismic events (Bommer, 2022; Grünthal, 2014). From a seismic risk assessment perspective, the fatigue concept described and discussed in this study aims to reduce seismic risk by reducing the seismic hazard and not by changing vulnerability and exposure. This is insofar different from natural seismicity risk as the hazard of naturally occurring earthquakes is considered to be immutable.
After the massive stimulation of a granitic rock mass under the city of Basel, Switzerland, in 2006 (Häring et al., 2008), apart from traffic light systems to control induced seismicity (Bommer et al., 2006; Baisch et al., 2019), the idea of multistage fracturing in enhanced geothermal systems (EGSs) wells also evolved (Meier et al., 2015). The core idea of multistage fracturing is adopted from shale gas production perforated completion design (parallel and isolated fractures), which is applied to economically produce gas from horizontal wells. When adapted to an EGS, multistage fracturing will economically produce heat by increasing the size of heat exchangers in a controlled way: one heat exchanger per perforation (Glauser et al., 2013; Fleckenstein et al., 2022). Planned in 2014 and executed in 2015, the Äspö underground experiment described in this study was a mine-scale test campaign in naturally fractured granitic rock demonstrating the safe development of sub-parallel, zonal-isolated multi-fractures as potential heat exchangers for geothermal purposes (Zang and Stephansson, 2019). After completion of the Äspö experiment, similar and more sophisticated underground campaigns followed, e.g., the 2016+ stimulation at Grimsel Test Site, Switzerland (Amann et al., 2018); the 2018+ EGS Collab Project underground tests at Sanford Underground Research Facility (SURF) in South Dakota, USA (Kneafsey et al., 2018); the Stimtec experiment in Reiche Zeche (Boese et al., 2022; Plenkers et al., 2023); and a planned larger-scale fracture and fault stimulation experiment in Aar granite at Bedretto Underground Laboratory in Switzerland (Ma et al., 2022).
There is a substantial lack of in situ observations of acoustic, geologic, and hydraulic properties of rock mass at the intermediate scale in the literature (Amann et al., 2018). The importance of such meso-experiments is 2-fold: first, mine-scale tests allow us to upscale laboratory tests and to downscale field tests in naturally fractured rock. This is an important point to better understand the physical mechanisms behind hydraulic fracture growth. Does the fluid injection scheme at the laboratory scale impact the stimulation process and seismic response of the rock mass in a similar way as tests at the mine and field scale? If not, what are the driving factors of fluid-induced fracture onset and growth at different scales? Is it the pressure distribution in the fracture, the release of natural proppants from the fracture walls, or the leak-off of fluid into the surrounding rock which dictates hydraulic fracturing versus hydraulic shearing? How can we properly precondition an enhanced geothermal system (EGS) reservoir for hydro-shearing? What are the mechanisms of fluid-injection-induced seismicity at different scales? The second aspect of meso-experiments is of an economic nature: the cost of mine-scale tests is far less and more controllable than field-scale borehole operations. Furthermore, evidence of geothermal concepts (multi-stage heat exchangers) at the mine scale are more reliable than small-scale laboratory tests of granite cores or cubes. At different scales, fractures and faults may exhibit similar sensitivities to permeability stress but can also result in very different stress and flow relationships. There is a definite need to investigate the fracture and fault response to mechanical stress and fluid injection in similar rock types at different scales (Zang et al., 2021).
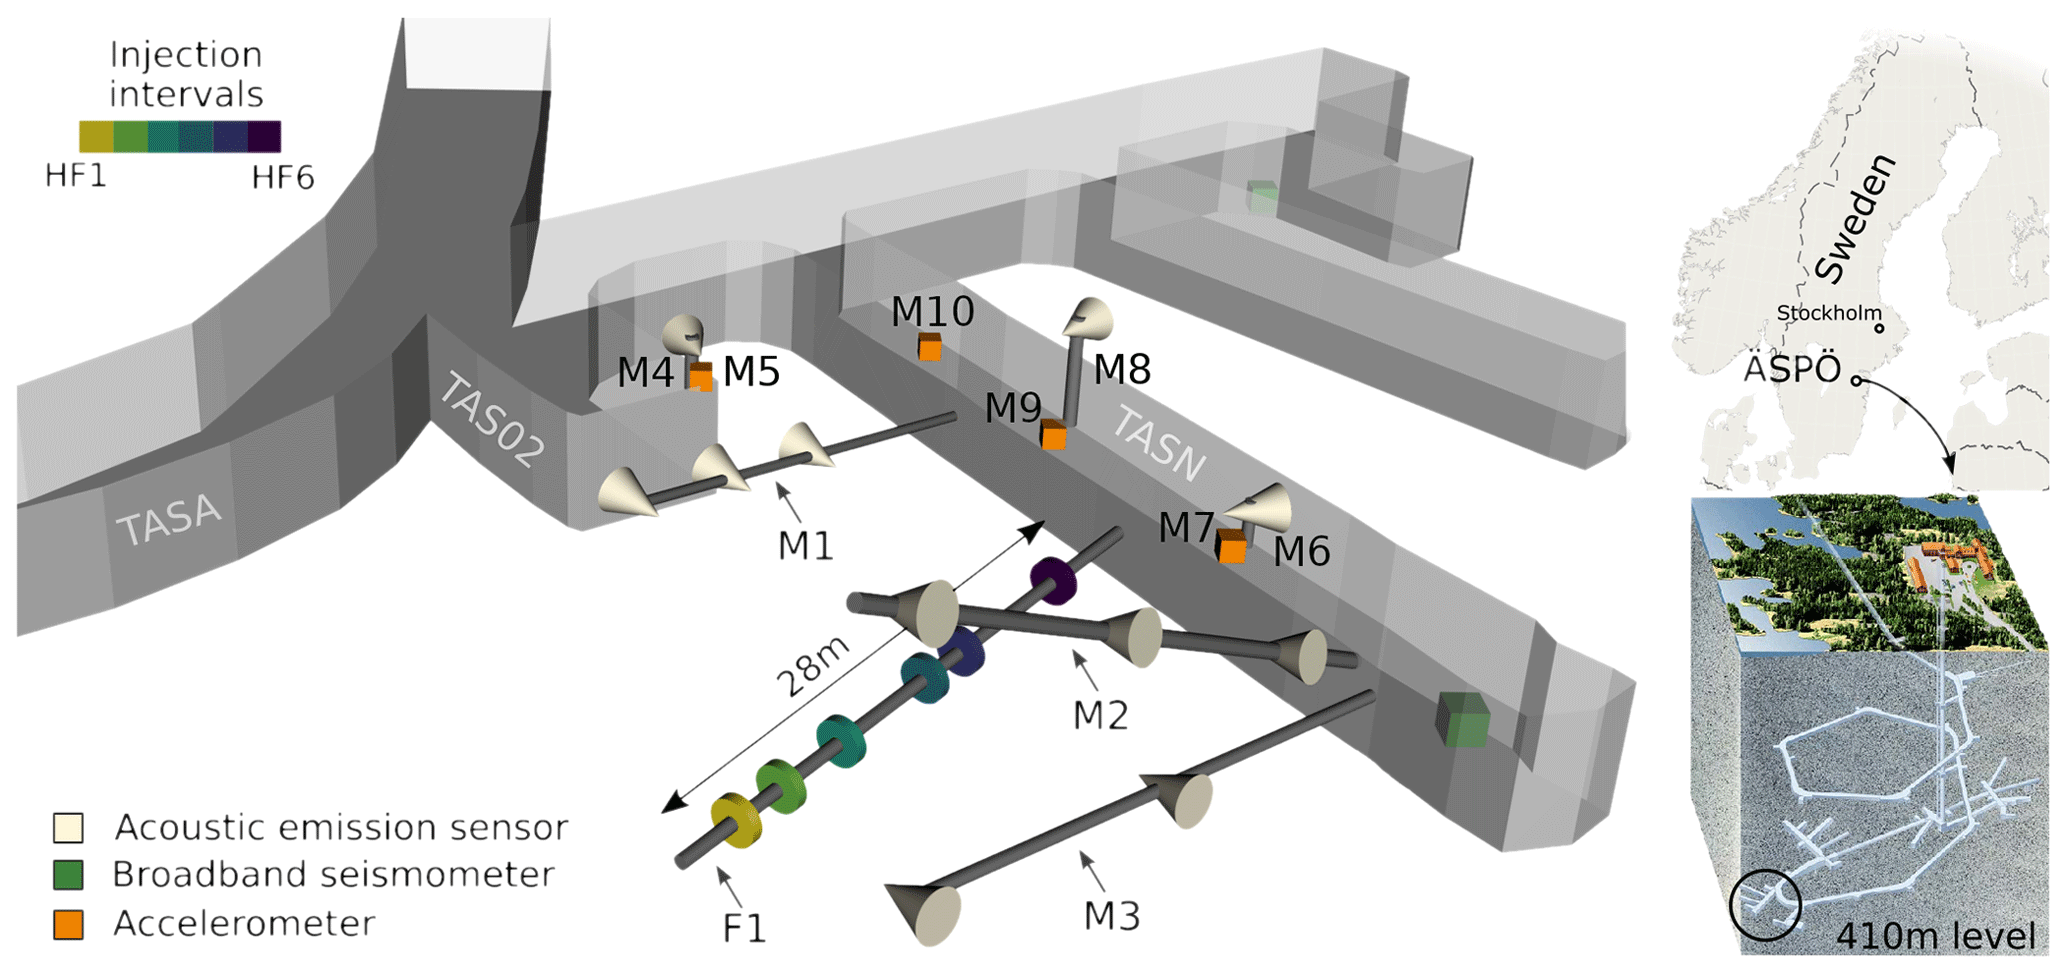
Figure 1Location (top right) and overview (bottom right) of Äspö Hard Rock Laboratory with the test site at 410 m depth (left). Access tunnels are shown in lighter gray. The test borehole F1 with six hydraulic tests indicated by color and the monitoring boreholes M1–M10 with sensors (cones and cubes) are described in the following sections.
In the framework of a decameter-scale in situ stimulation experiment, a naturally fractured granitic rock mass was selected at Äspö Hard Rock Laboratory (HRL) on Äspö Island, Sweden, at 410 m depth. The site was chosen for its well-known setting in terms of geologic parameters, hydraulic properties, and in situ stress magnitudes (Zang et al., 2017b). The Äspö HRL is owned by the Swedish Nuclear Fuel and Waste Management CO (SKB) and has been in operation since 1995 for nuclear waste disposal research. In close cooperation with the municipality of Oskarshamn, SKB has supported the formation of Nova FoU (R&D) with the aim of using the facilities at Äspö HRL for research and development in other fields. Here, we present a comprehensive data set of the geothermal project Nova 54-14-1 carried out at Äspö HRL. The site hosts 1.8 Gyr old intrusive rocks ranging from granite, syenite, and diorite to gabbro. These rock types can be assumed to be representatives for a deep crystalline basement, which is generally the target rock of deep geothermal energy systems.
In this work, we present a comprehensive data set consisting of geologic data from four ∼ 30 m long boreholes (one horizontal stimulation borehole and three inclined monitoring boreholes) and seismic waveform data recorded by acoustic emission sensors, accelerometers, and broadband seismometers. The seismic data set was obtained during six hydraulic fracturing tests with three different fluid injection protocols (conventional constant flow rate, cyclic progressive water injection, and cyclic plus hydraulic hammer fatigue testing). The seismic and hydraulic rock response was recorded, and subsequent data analysis provides insights into the evolution of permeability and fracture development. The data accompanying this article include waveforms recorded by acoustic emission sensors and accelerometers (operating in triggered and continuous mode), as well as broadband seismometers in the near-field of six hydraulic tests (labeled HF1 to HF6), each with multi-stage hydraulic fracturing. Hydraulic tests were performed at six injection intervals (test intervals). In each hydraulic test interval, a fracturing and several re-fracturing stages were performed, with stage labels – e.g., HF1-F, HF1-RF1, HF1-RF2 – for the fracturing and the multiple refracturing stages of the first test HF1. In total, 29 treatments (stages) of the granitic rock mass at six locations (test intervals) in the horizontal injection borehole were performed underground. Furthermore, the data set covers seismic and hydraulic properties of the host rock during water injection and back flow. After the tests, the fractured rock mass was characterized using impression packer results, combined with analyses of acoustic emission and broadband sensor tilt signals observed. Subsequent data compilations include acoustic emission catalogues and seismic magnitude estimates, among others. Laboratory experiments on cores from the stimulation borehole complement the comprehensive mine-scale data presentation.
In May 2015, the Äspö experiment started by diamond-drilling fresh boreholes into naturally fractured rock at 410 m depth. The rock mass was characterized using geologic, geophysical, and hydraulic methods. Dry and wet cores from the injection borehole (diameter 102 mm) and three upwards-inclined monitoring boreholes (diameter 76 mm) were analyzed. An optical borehole televiewer (BIPS tool) was used to map the injection borehole wall before and after the stimulation treatment. Geophysical techniques include a borehole tomography with an ultrasonic emitter sensor inserted in the injection borehole before and after propagating six hydraulic fractures. The hydraulic techniques include a Lugeon test at borehole scale and the computation of rock permeability with time. Cores from the injection borehole (diameter 86 mm) taken from the fluid injection borehole at respective packer intervals of the six hydraulic stimulations were investigated in the laboratory.
2.1 Geological methods
2.1.1 Test site and geologic background
The island of Äspö and its surroundings are located in the Transscandinavian Igneous Belt (TIB) of the svecofennian orogen, which forms the core of the Fennoscandian shield in northern Europe (Stanfors et al., 1999). The bedrock in the TIB is dominated by well-preserved, approximately 1.8 Gyr old intrusive rocks varying in composition between granite, syenite, diorite, and gabbro. The most prominent ductile structure on Äspö intersects the island in an NE–SW direction (deformation zone NE2; e.g., Ask, 2006). Subsequently, the rock mass is subjected to repeated phases of brittle deformations under varying regional stress regimes, followed by reactivation along earlier-generated structures. With few exceptions, the deformation zones in Äspö HRL are of a brittle type, are complex, and involve several reactivation events. The complexity of the fracture system at the test site is illustrated by the presented drill cores from the central part of the hydraulic-testing borehole and selected borehole images (see Sect. 2.1.2).
Table 1Borehole naming conventions and sensor installation with orientation (H – horizontal, V – vertical).
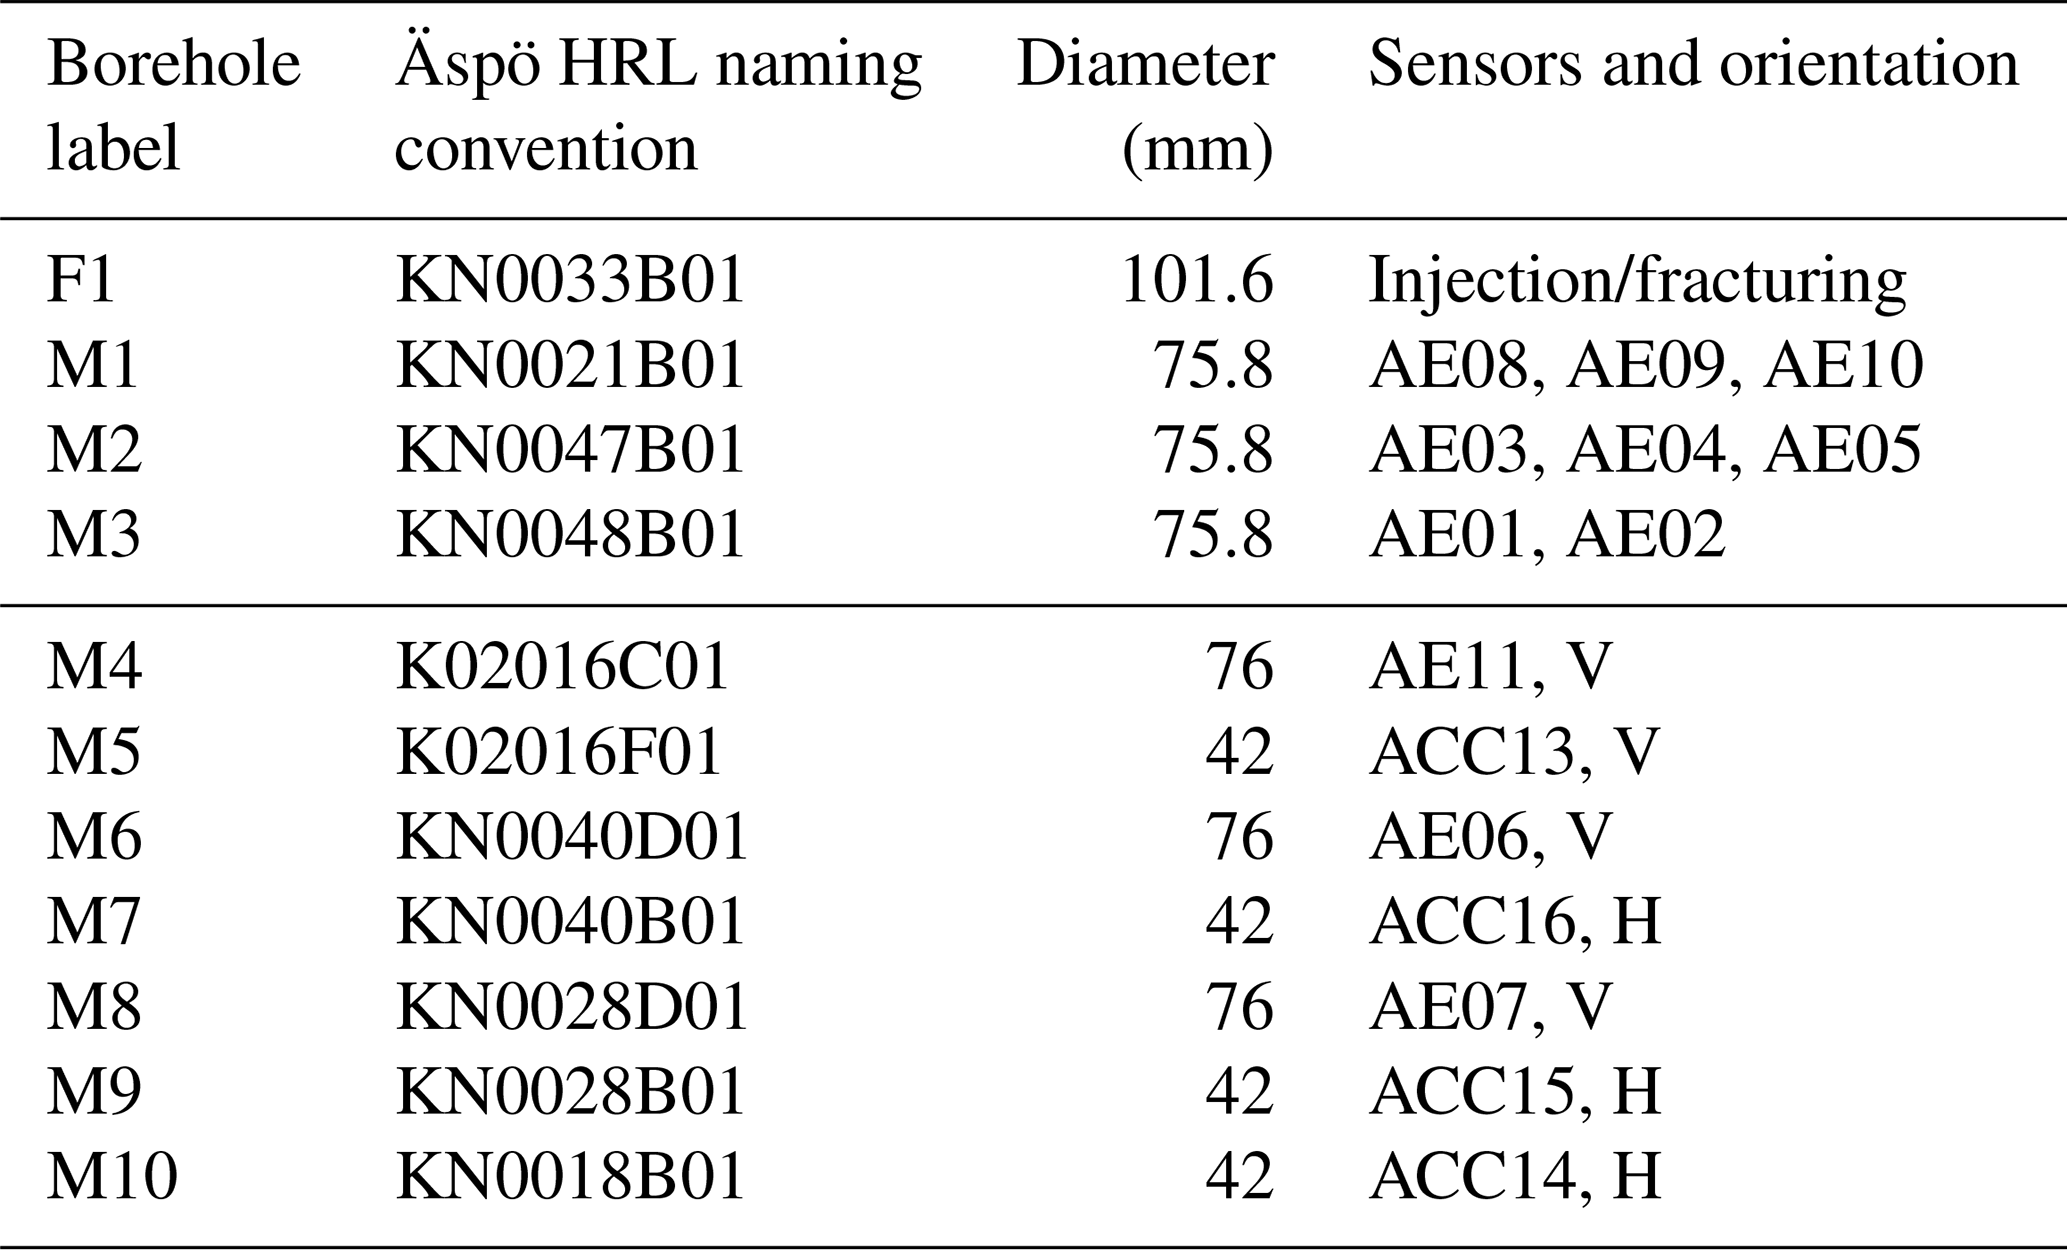
The underground test site is located in the Äspö extension area for the period 2011–2012 at a depth level of 410 m below surface (Stenberg, 2015). Based on the geological and hydrological description of Stenberg (2015), a borehole geometry was conceptualized with one injection and several monitoring boreholes. Figure 1 (left) provides an overview of the test site and its surroundings. The experiment was set up in access tunnel, TASN, from which four long (≈ 30 m) and seven short (≈ 1 m) boreholes were drilled (Fig. 1 left). The central borehole (F1) serves as an injection borehole and was drilled to a total length of 28.40 m subparallel to the orientation of the minimum horizontal compressive stress, inclined downwards by 4∘. The monitoring boreholes (M1–M3) were drilled with an upward inclination. Owing to the presence of a hydrological conductor producing up to 75 mL s−1 outflow of water, sensor installation in this way optimized the array signal sensitivity and coverage. The shorter monitoring boreholes (M4–M10) comprise three pairs of boreholes, except M10. Each pair consists of a horizontal borehole with an accelerometer and a vertical borehole with an AE sensor (Table 1).
Geospatial data at Äspö HRL are provided in a site-specific coordinate system, ASPO96. All infrastructure coordinates (tunnels, boreholes, etc.) are given in this coordinate system, and we adopted its usage due to the lack of access to any other geospatial reference system underground. Conversion from (X,Y) coordinates of ASPO96 (in m) to the universal transverse mercator (UTM) projection on the WGS84 reference ellipsoid with easting and northing (E,N) in UTM zone 33 (in m) as follows:
with α = −11.823∘, X0 = 2368.614, Y0 = 7404.361, E0 = 599947, and N0 = 6366968.
2.1.2 Analysis of drill cores and boreholes
The extracted cores from the boreholes were photographed in dry and wet conditions (Fig. 2a and b). We consider mechanical discontinuities to be fractures regardless of whether they are secondarily mineralized or not. This allows us to determine the fracture density per meter in each borehole. Combining the core logs with borehole televiewer logs (Fig. 2c) yields a detailed description of fracture density for the injection borehole. Borehole images are obtained with a borehole camera observation tool (BIPS, Döse et al., 2008).
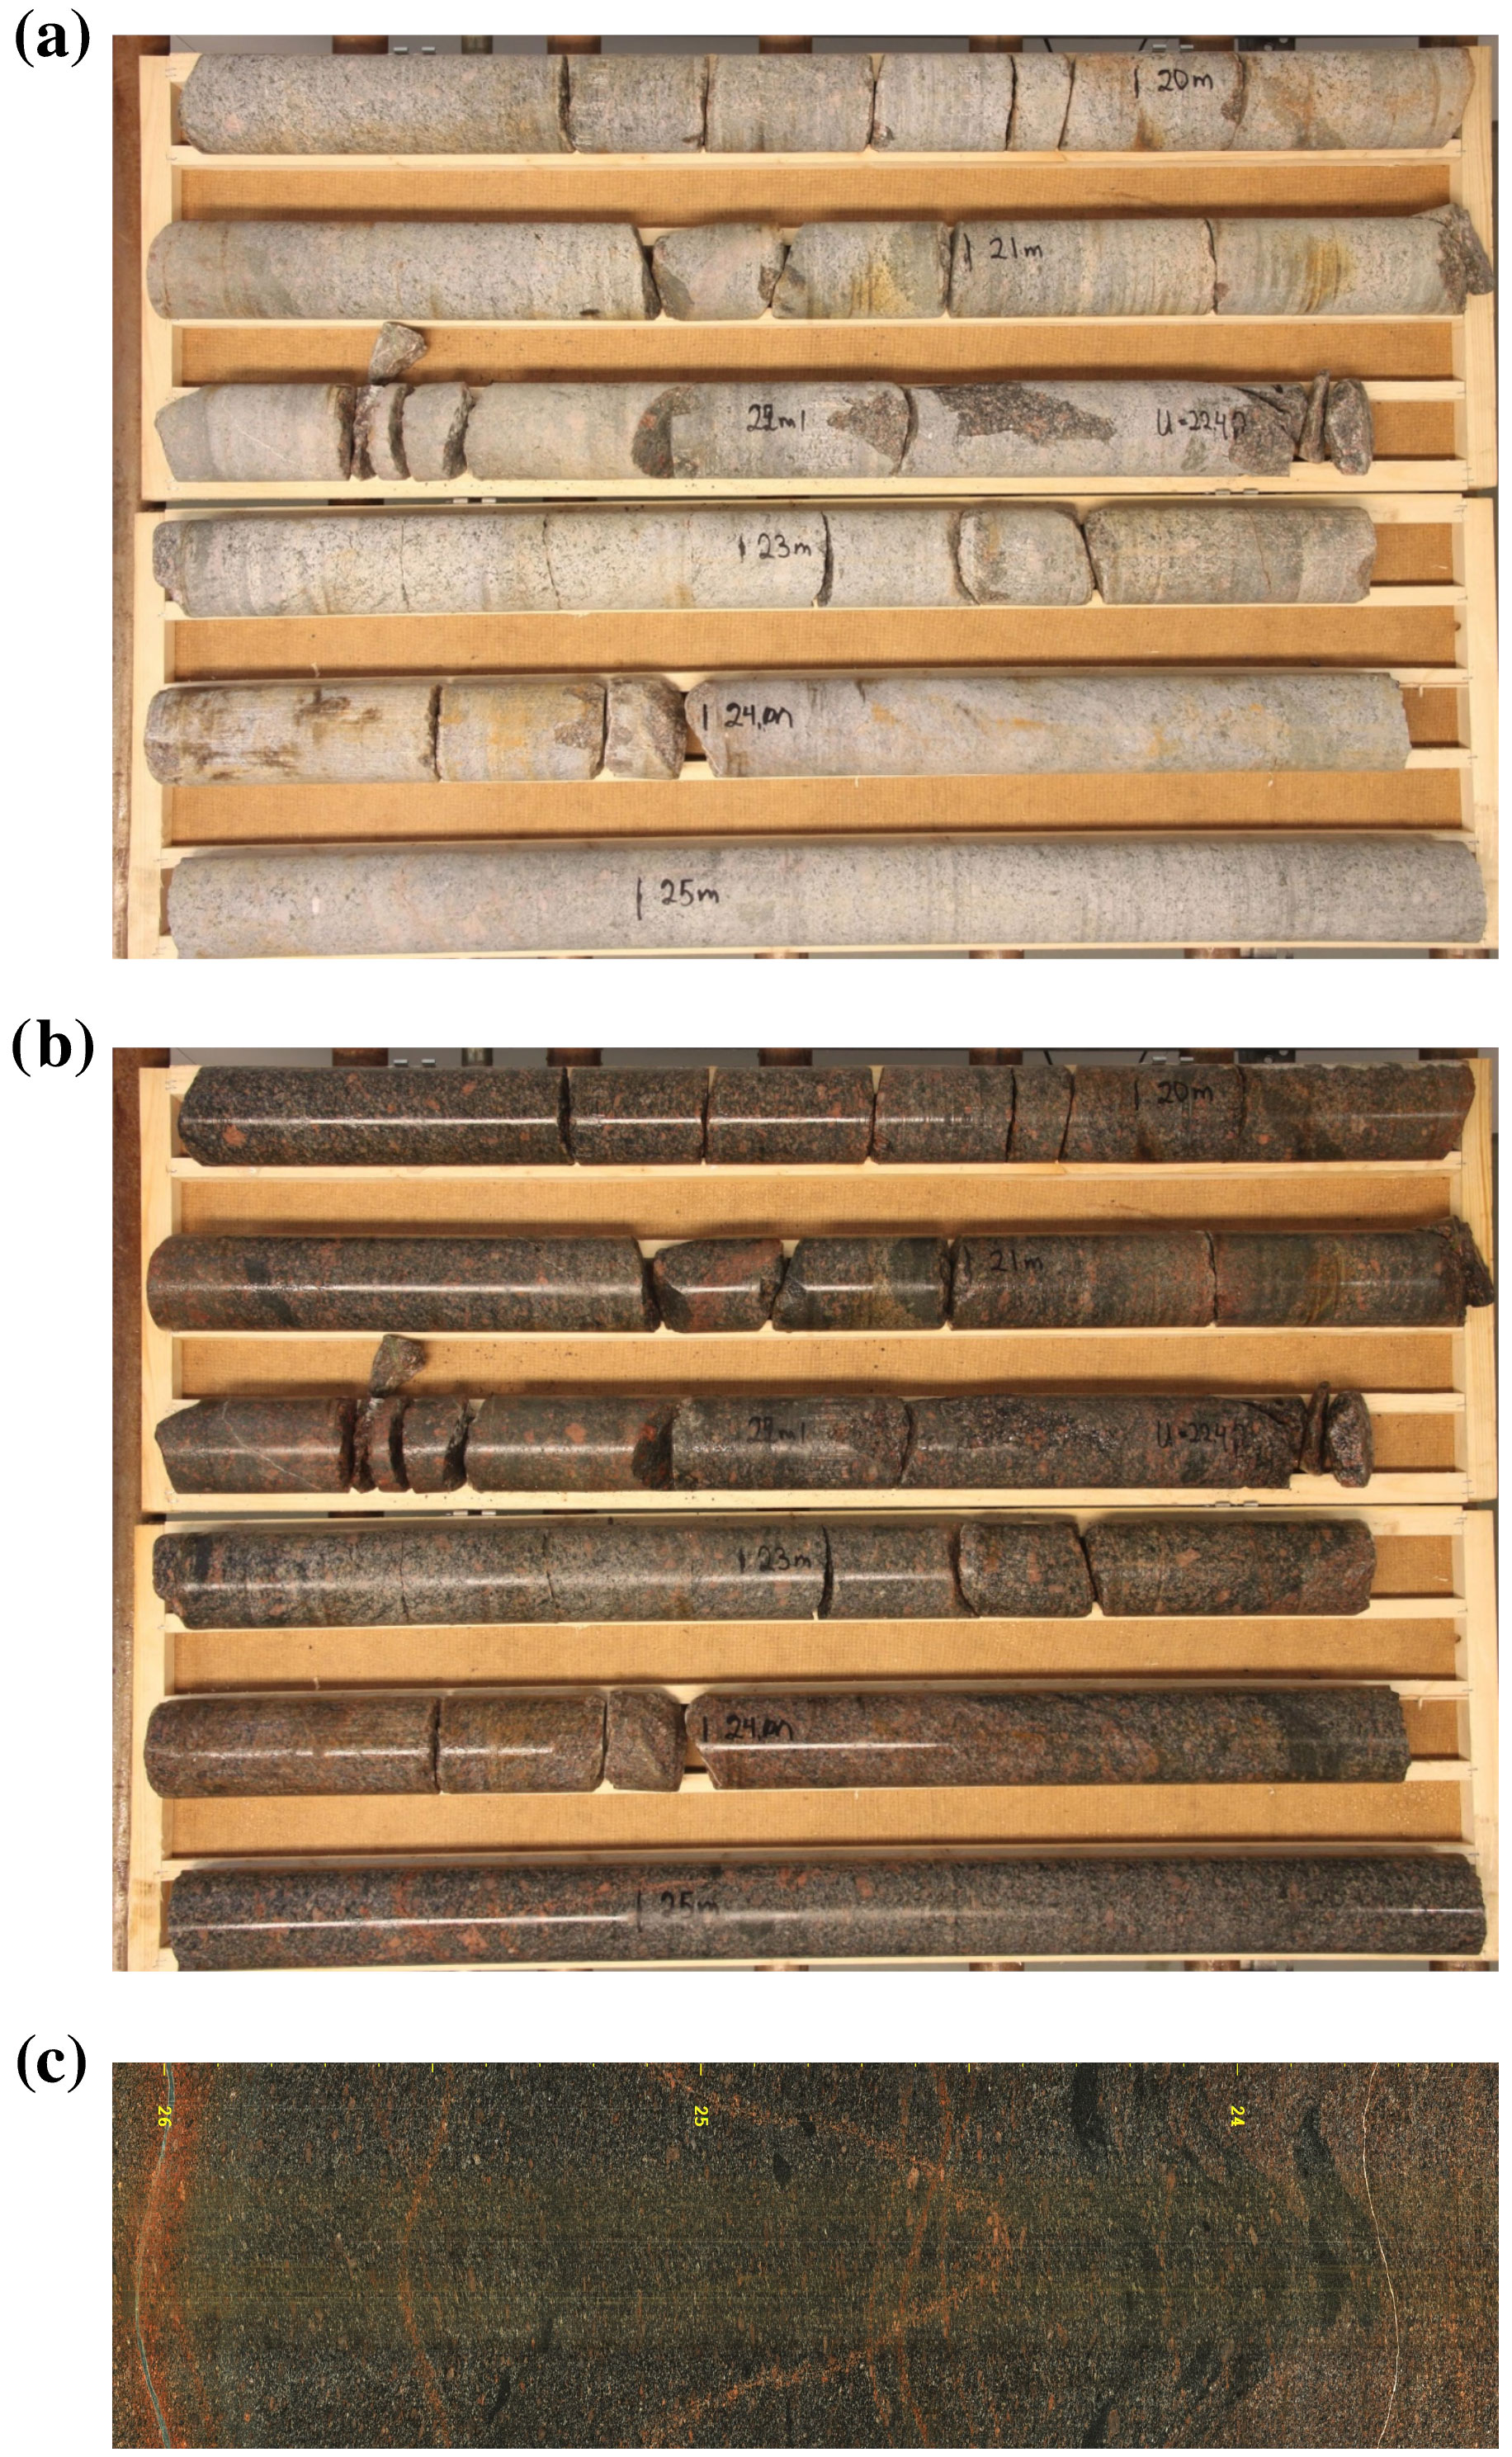
Figure 2Fracture inspection from drill cores (section from 19–26 m): (a) dry, (b) wet. (c) Image from borehole televiewer BIPS tool before the experiment in the section where test HF1 was conducted (24–26 m).
On average, we observe four fractures per meter in the 86 mm diameter drill core of the horizontal injection borehole. Our selection of test sections for hydraulic fracturing is based on the borehole images. We identified four different rock types in the injection well. Close to the access tunnel TASN (section 0–6 m), the injection borehole consists of Äspö diorite and fine-grained granite (fgG). The following sections (6–17 and 17–28 m, at the end of the borehole) consist of fine-grained diorite–gabbro (fgDG) and Ävrö granodiorite (AG), respectively. Figure 2c shows some of the geology along the borehole in the range of 24–26 m and the fractures intersecting the drill cores.
2.2 Borehole geophysical methods
2.2.1 Ultrasonic pulse transmission tests
An ultrasonic pulse transmission test was performed before the fracturing experiments on 2 June 2015. For the measurements, the ultrasonic transmitter GMuG-Tr40 (main frequency range of 1 to 50 kHz) was installed inside fracturing borehole F1 using a pneumatic system to couple the source to the borehole side wall. The ultrasonic transmitter was installed inside the fracturing borehole at positions with 1 m spacing between 1.36 and 24.36 m borehole depth. The sensor was facing upwards (12 o'clock orientation). At 6.36, at 12.36, at 18.36, and at 24.36 m borehole depth, the sensor was additionally installed in 3 o'clock and 9 o'clock orientations when seen from the access tunnel (TASN) wall. At each position, 1000 pulse signals were emitted and automatically stacked by the recording system. The stacked waveform was stored (window length 32 ms). The ultrasonic pulse transmission data were used to estimate P-wave velocity (5810 ± 120 m s−1) and S-wave velocity (3400 ± 200 m s−1) within the experimental rock volume (Zang et al., 2017a).
2.2.2 Hammer seismics
Before and after the experiment, hammer seismics with a sledge hammer were conducted along the walls every 2 m in the access tunnel TASN and the neighboring tunnels TASA and TAS02. The hammer strikes are among the strongest recorded signals and are of much higher amplitude on all sensors. Exact localization and timing – usually recorded during hammer seismic experiments – of the hammer points have not been determined as the idea is to perform hammer seismics that originated on site. Nonetheless, this data subset can be of value if a joint inversion of hypocenter determination and seismic tomography is performed.
2.3 Hydraulic methods
This section gives an overview of the three different injection schemes. We describe the hydraulic well test analysis and the Lugeon test for the determination of the rock permeability and discuss results from the impression packer to determine hydraulic fracture orientations.
2.3.1 Fluid injection schemes
In the experiment, three different hydraulic-testing procedures were applied. The first test design is a conventional procedure with constant flow rate (Fig. 3a). For the second testing procedure, the flow rate is progressively increased, starting with a pressure of 20 % of the expected breakdown pressure and increasing the pressure by another 20 % in the subsequent steps until the breakdown pressure is reached (Fig. 3b). The third testing procedure is based on the second test procedure with an added periodic pressure pulse on top of the progressively increasing pressure levels (Fig. 3c; details in Zimmermann et al., 2019). Further details on test intervals, injection schemes, and rock types for each experiment are given in Zang et al. (2017a).
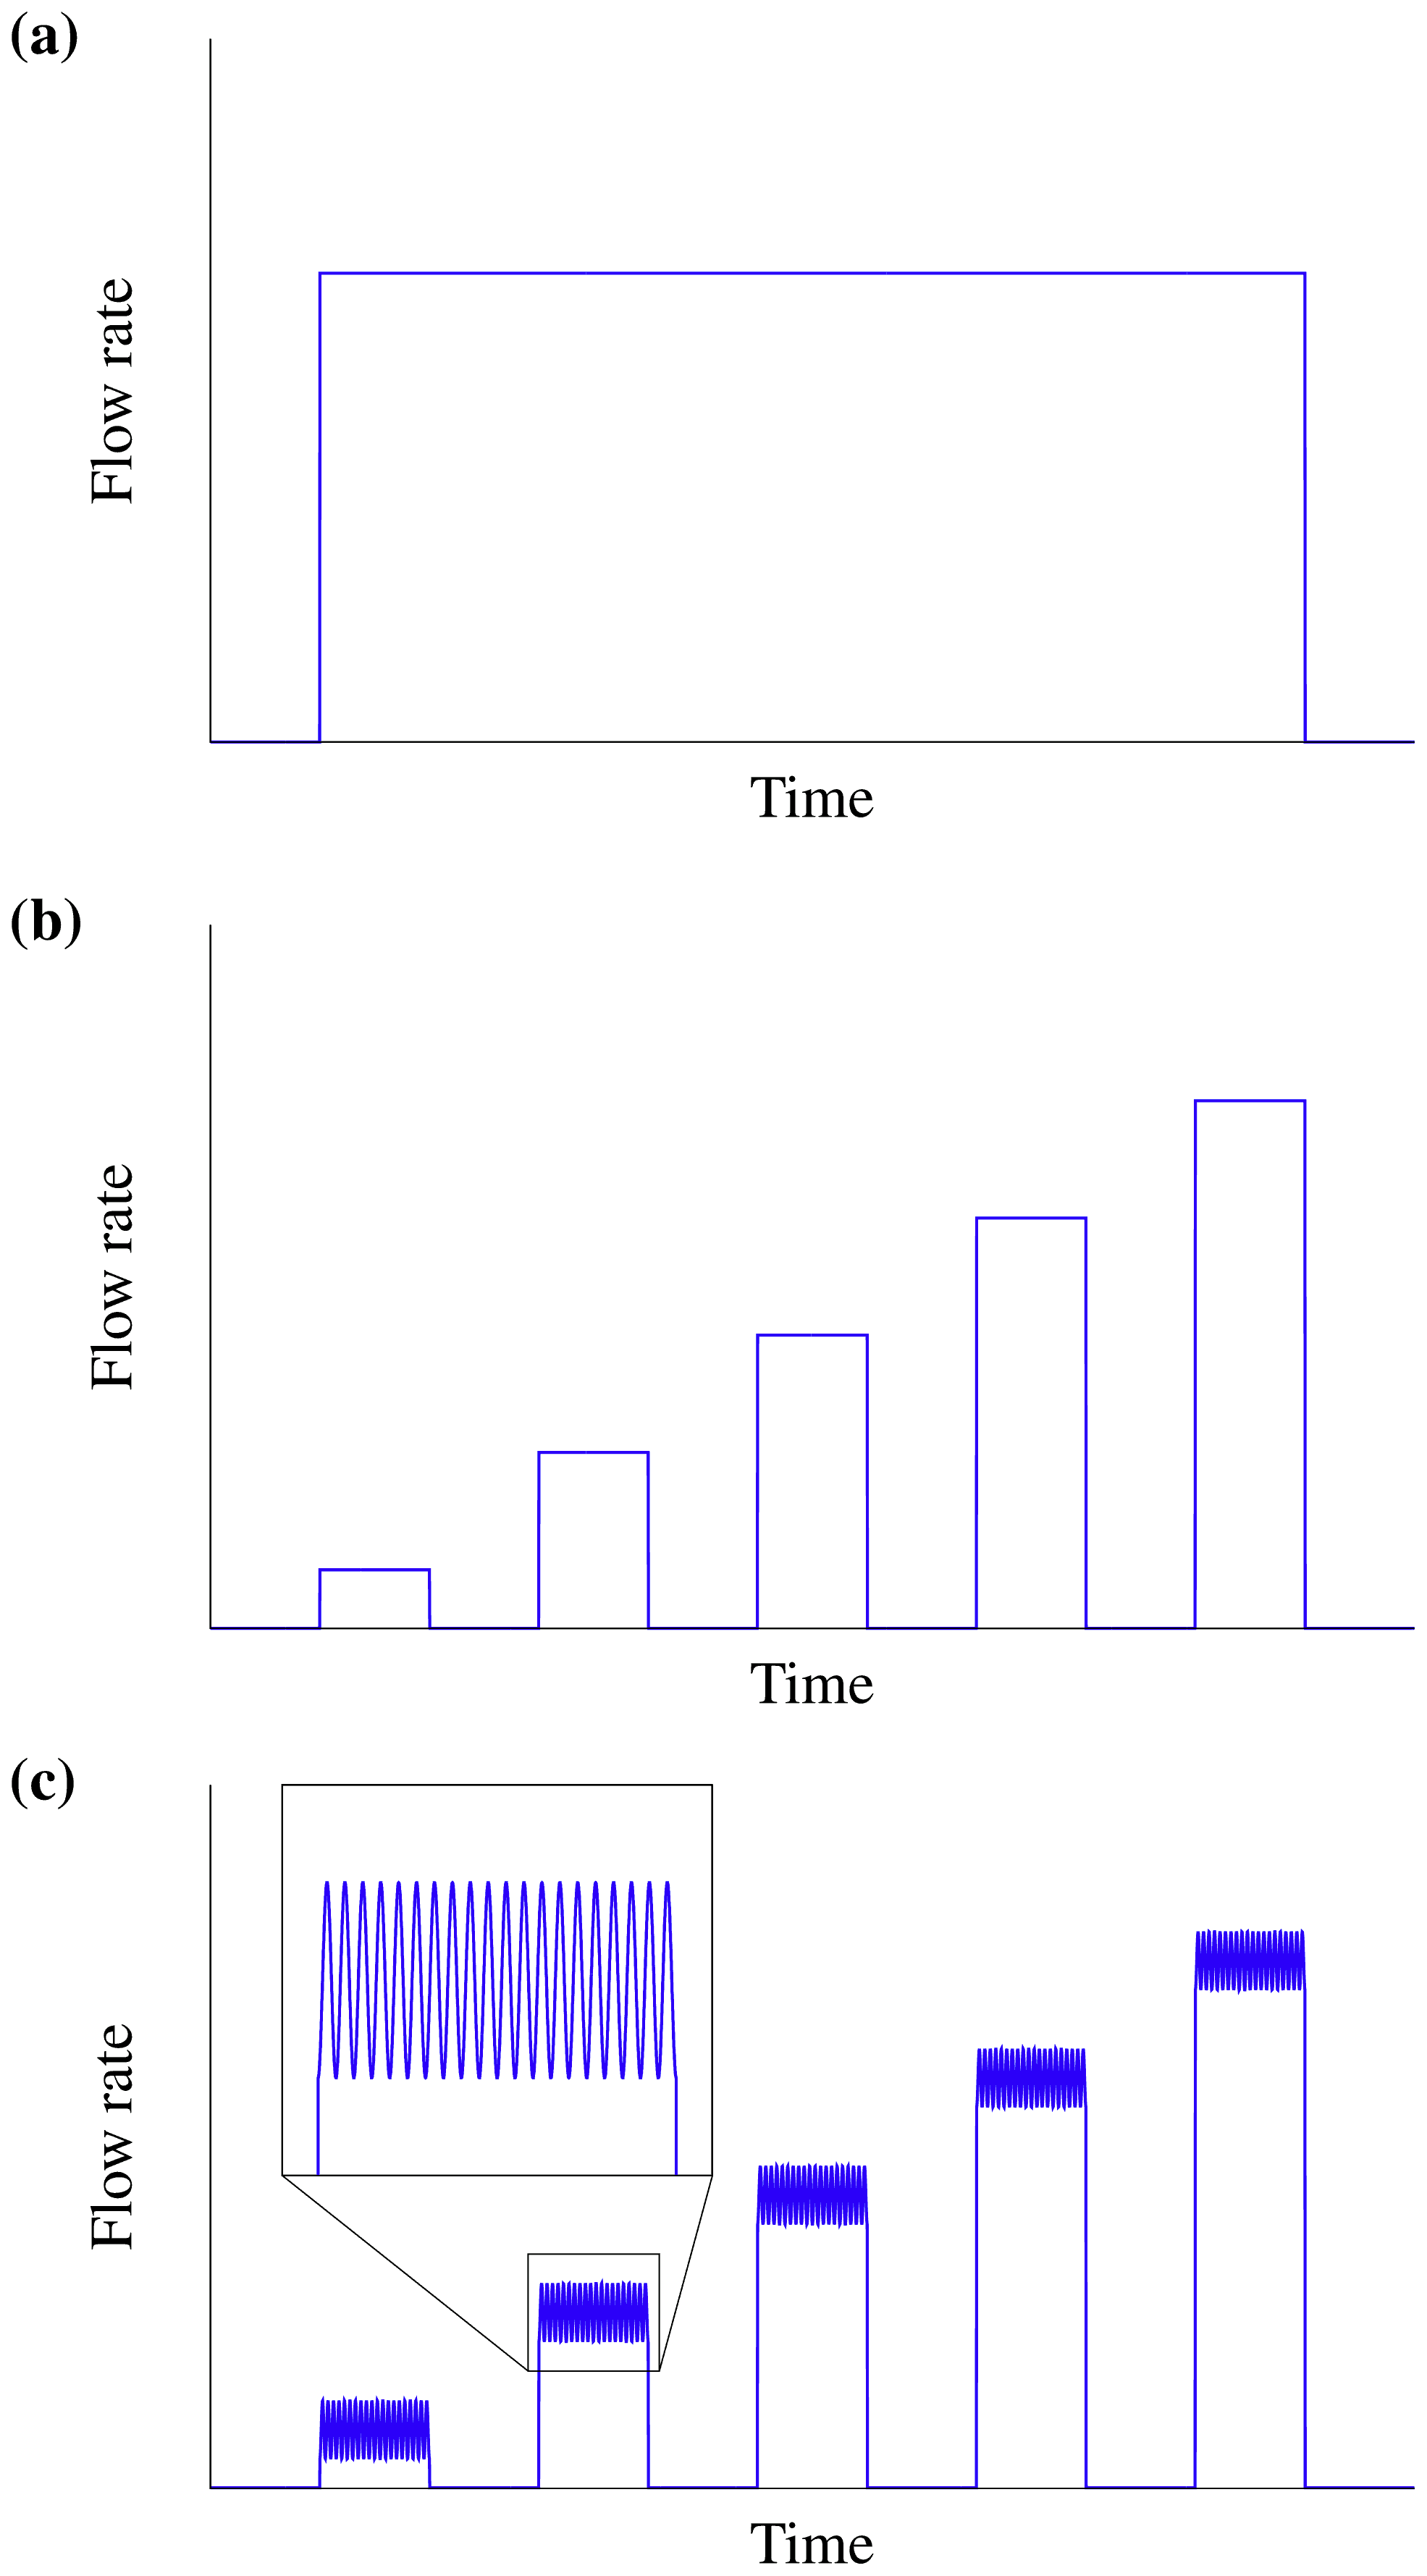
Figure 3Schematics of the different testing procedures showing flow rates. (a) Conventional hydraulic fracturing procedure with constant flow. (b) Progressively increasing flow rate with a shut-in between cycles. The pressure is increased in steps of approximately 20 % of the expected breakdown pressure estimated from the previous conventional test in the same rock type. (c) Progressively increasing flow rate with pressure pulses from a second pump system in addition to the progressively increasing pressure levels.
2.3.2 Hydraulic well test analysis
The evolution of permeability k and transmissivity kh is calculated from fall-off sequences (shut-in periods) of the declining pressure curves after each injection stage according to classical well test analysis (e.g., Horne, 1995). Hence, permeability is calculated, taking into account the superposition principle and assuming infinite acting radial flow:
where h is the interval length, q is the flow rate, μ is the dynamic viscosity of the injection fluid, t0 is the injection end time, Δt is the shut-in time, and the differential pressure Δp is between the initial pressure at shut-in and actual pressure.
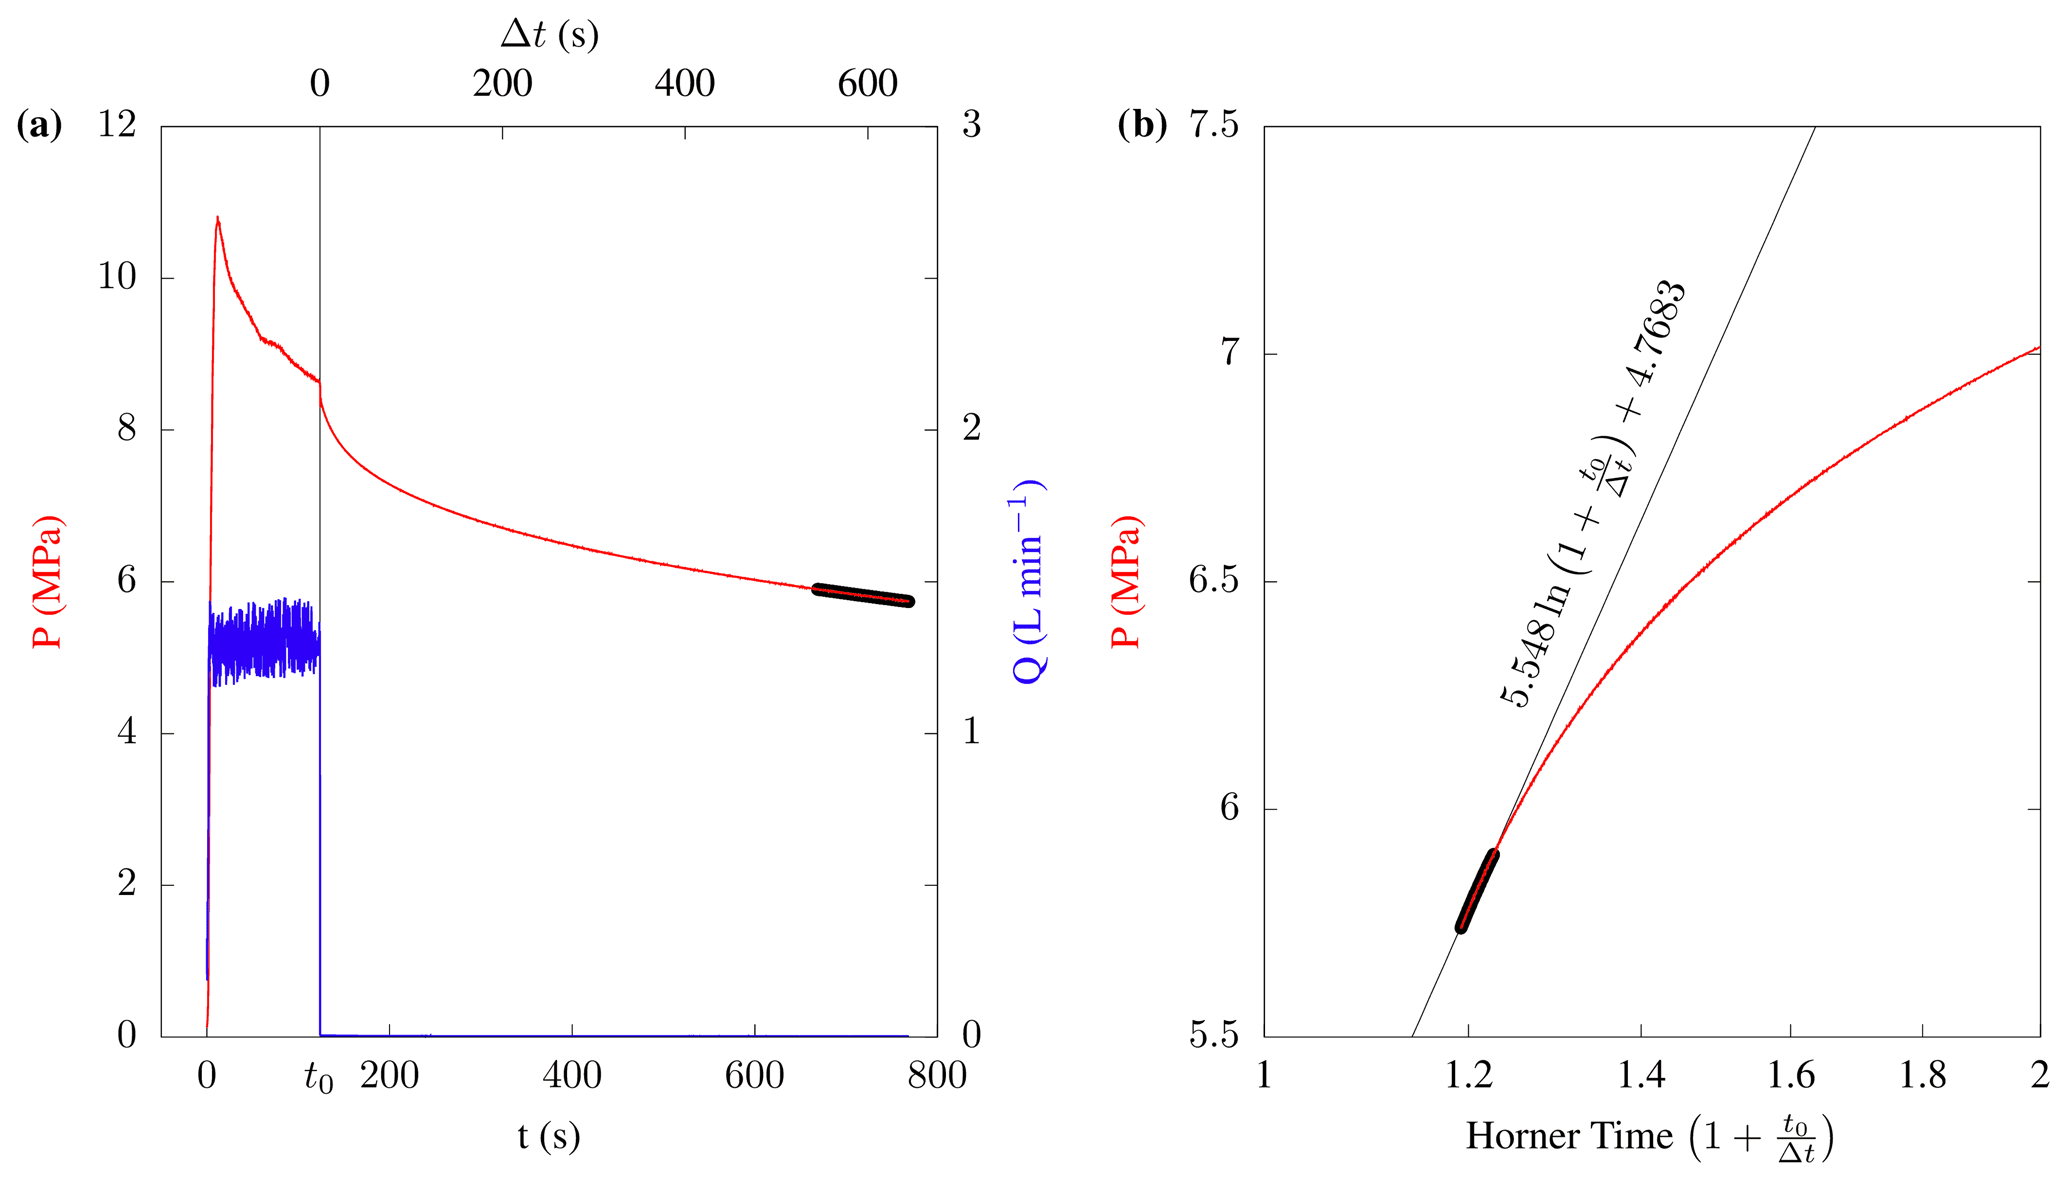
Figure 4Determination of permeability. (a) Example of pressure and flow rate with time of the conventional fracturing procedure (Fig. 3a) from test stage HF1-RF1 with constant flow rate (blue). Permeability is related to the slope of the pressure decline curve (red) after shut-in at time t0 and is estimated from the last 100 s (thick black line) of the shut-in period Δt. (b) Same as (a) with time represented as Horner time to estimate the slope (thin black line) from the data highlighted by the thick black line according to Eq. (2).
The calculations (details in Zimmermann et al., 2019) are based on the slope of the declining pressure curves after shut-in and are performed for the last 100 s of each shut-in period for the conventional treatment with constant flow rates and for the last 40 s for the cyclic stages (Fig. 4). This ensures that stable and comparable radial flow conditions for each stage are obtained. The time differences are based on the shut-in time and are for the conventional treatments in the range of 300–700 s and for the cyclic stages in the range of 120–130 s.
2.3.3 Lugeon tests
The Lugeon test is a pressure test carried out with a straddle packer in an isolated borehole interval (e.g., Lancaster-Jones, 1975, and references therein). Pressures and flow rates are recorded until quasi-steady-state conditions are reached. Typical Lugeon tests consist of several pressure levels in a step rate way of increasing and decreasing pressure levels. In the case of low-permeability rocks, often, only single-stage Lugeon tests are performed since it might be difficult to obtain quasi-steady-state conditions in a short time. Interval permeability is then obtained according to semi-empirical formulas by Hvorslev (1951) and Moye (1967) or according to the steady-state flow solution by Dagan (1978). A comparison of the aforementioned approaches with numerical solutions is given by Braester and Thunvik (1984).
2.3.4 Impression packer tests
We performed impression packer tests to obtain an imprint of the borehole wall to image the generated fracture traces after the hydraulic fracturing tests. The impression packer tool is able to measure the orientation of induced or stimulated fractures and consists of a single packer element with a soft rubber sleeve in conjunction with a magnetic single-shot orientation device. The packer preserves the imprint from the borehole wall and the fracture traces when it is pressurized to a pressure level higher than the fracture re-opening pressure for a duration of about 10 min.
Images of fracture traces were obtained for all six hydraulic fracturing tests performed at Äspö HRL. The circumference of the packer is about 310 mm, and the length of the pressurized interval is approximately 1 m. The images of all impression packer tests are available in Zimmermann et al. (2019, Appendix B).
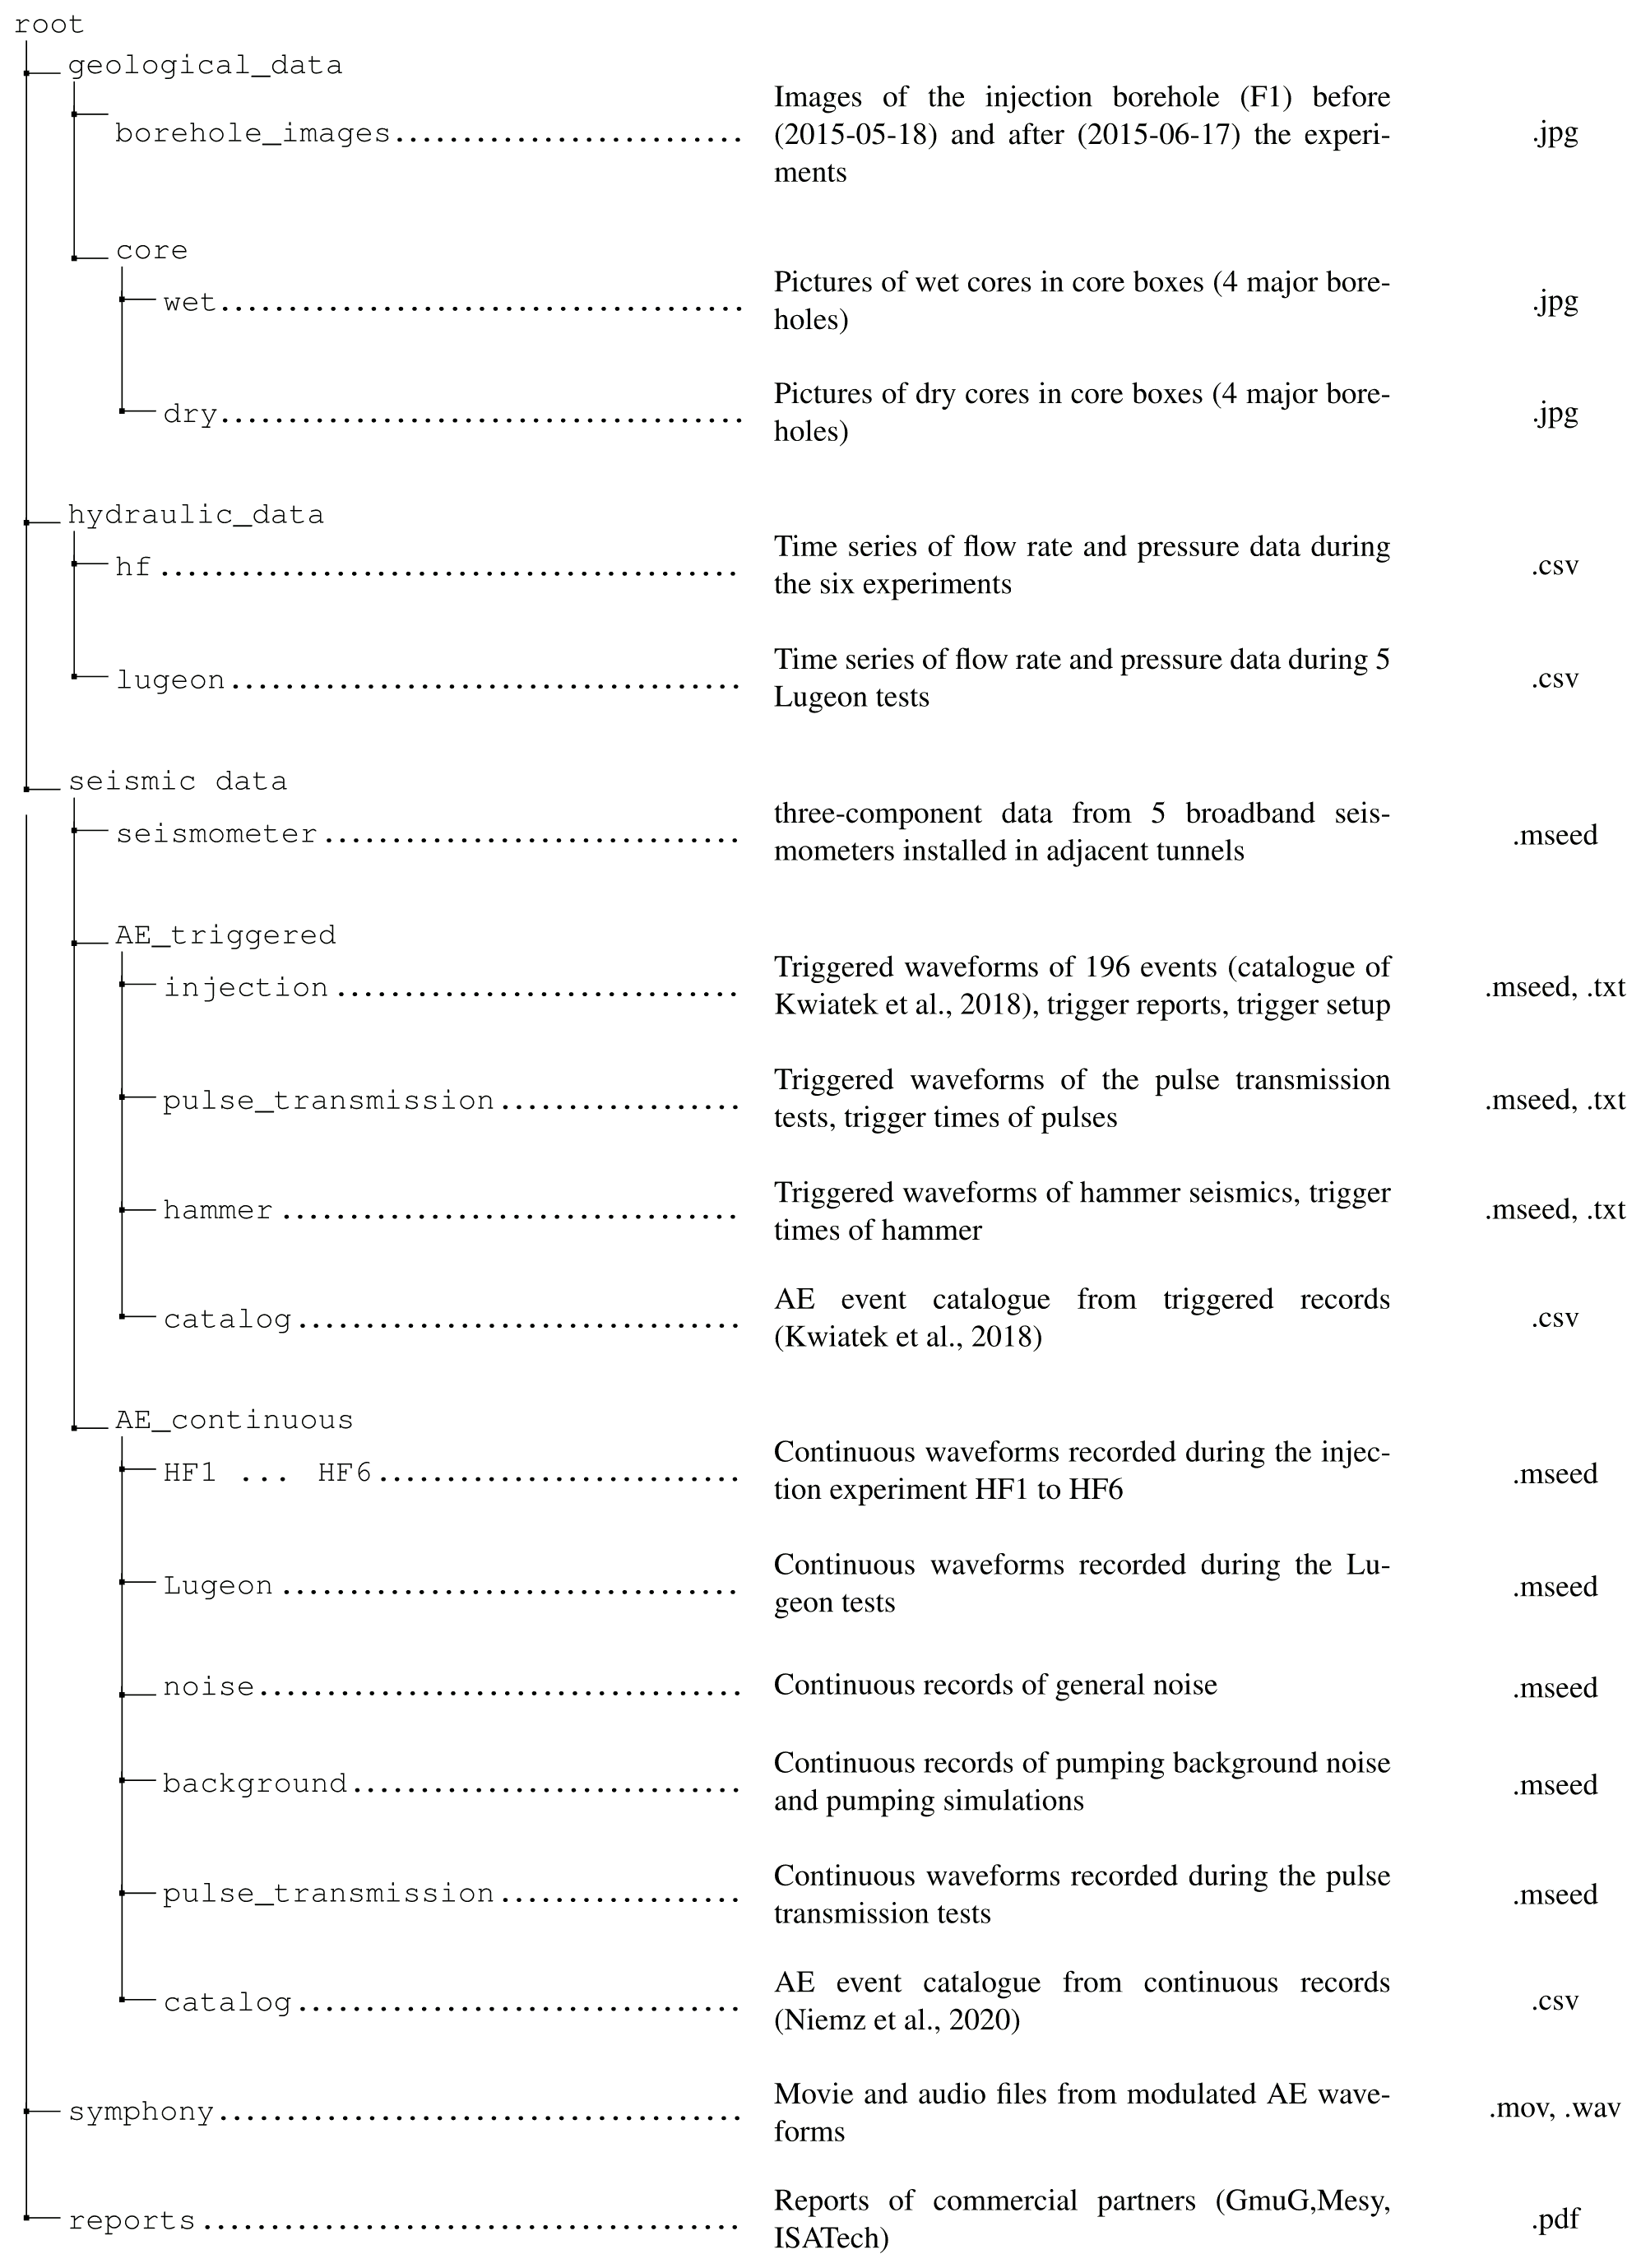
The experimental setup with the central injection borehole F1 is surrounded by three inclined monitoring boreholes (Fig. 1). Sensors are implemented in boreholes and adjacent tunnels at the depth level of 410 m in Äspö HRL. The summary and structure of all data published are summarized in Fig. 5.
3.1 Metadata
We provide geographical or location metadata of the Äspö experiments in comma-separated value (csv) files, accessible with any text editor or spreadsheet application. Additionally, we include a text file containing the work protocol of the experiments (timeline). All location information is given in the ASPO96 coordinate system as described in Sect. 2.1.1 and Eq. (1). The geographical data comprise 2D coordinates of the tunnel system at the 410 m level (as seen in Fig. 1), borehole coordinates, and sensor locations. The four major boreholes F1, M1, M2, and M3 are described by coordinates measured every meter during the drilling and by the rock type at the given position. The other short boreholes (both horizontal and vertical) are described by a single coordinate due to their proximity of 0.5–1 m (Table 1).
The acoustic emission sensors (AE, GMuG MA BLw-7-70-75) and the accelerometers (ACC, Wilcoxon 736T) were installed within the boreholes mentioned above (Table 1). ACC sensors were oriented horizontally, measuring in the direction of the borehole. Apart from the location, we provide the exact orientation of the AE sensors described by azimuth (clockwise from the y axis seen from the access tunnel, TASN) and inclination (clockwise from upward). The absolute instrument response function of the AE sensors is missing, and instead, AE sensor manufactures typically provide information about some aspects of the sensor response, e.g., dominant resonance frequencies or the excitation response, but this alone does not allow us to obtain the full information on absolute ground motion (Plenkers et al., 2022). The frequency response of the AE sensors deployed at Äspö HRL is expected to be flat between 10 and 10 kHz (see GmuG report in the data archive). Broadband seismometers (BB, Trillium Compact 120s) were installed in adjacent tunnels with unknown instrument orientation (Niemz et al., 2021). The orientation of the sensors can be estimated using teleseismic or regional earthquakes (Petersen et al., 2019; Niemz et al., 2021). We provide a text file (.paz) with poles and zeros (e.g., IRIS, https://ds.iris.edu/ds/nodes/dmc/data/formats/resp/, last access: 19 December 2023) for the response of the instrument and the used digitizer.
Table 2Rock properties compiled from Staub et al. (2002, 2004), Nordlund et al. (1999), and Stille and Olsson (1989, 1990). Percentage of rock types was inferred from tunnels KAS02, KA2511, and KA2598 and is assumed to be representative for the whole Äspö rock volume.
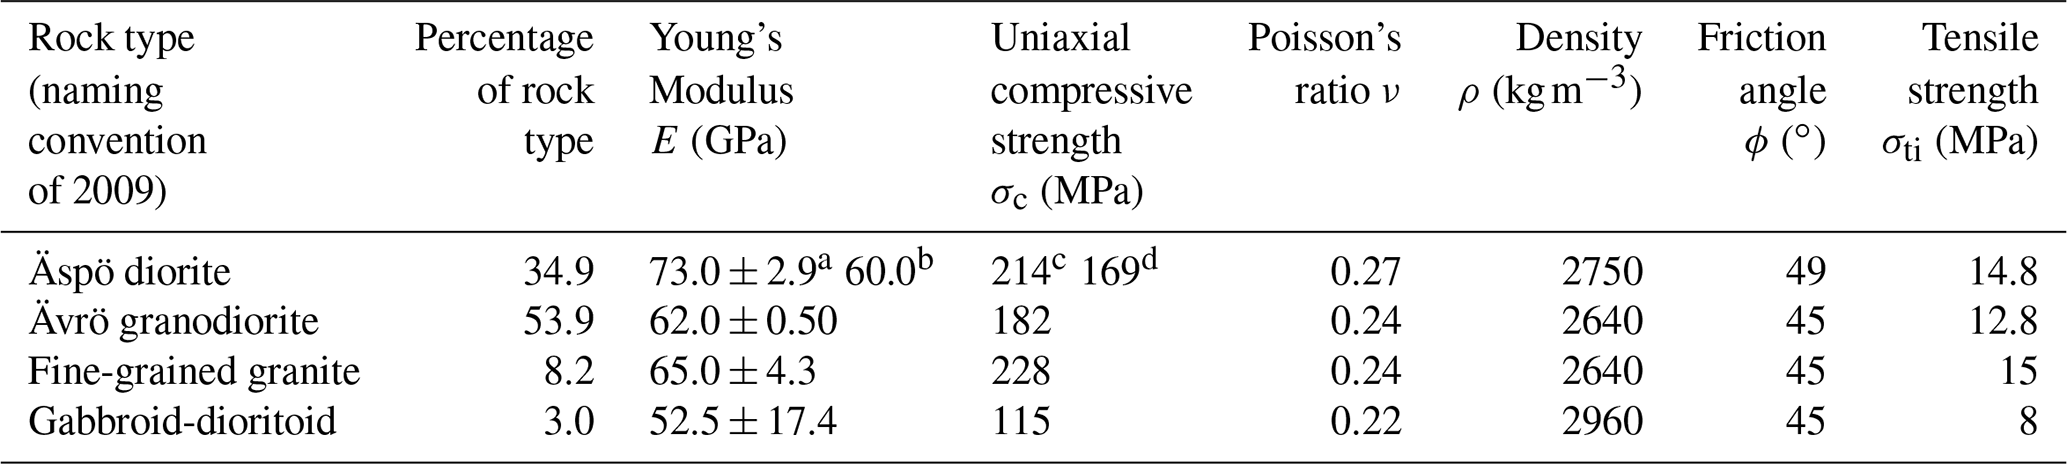
a After Nordlund et al. (1999); b after Stille and Olsson (1989); c after Nordlund et al. (1999); d after Stille and Olsson (1989).
3.2 Geological data
We provide photos of the cores in core boxes in wet and dry conditions for each of the four major boreholes (Fig. 2). For the injection borehole (F1), we provide additional imagery of the borehole wall taken with a borehole camera system. The rock types can be matched with the information given in the borehole metadata (precision 1 m). Average rock mechanical properties are listed in Table 2.
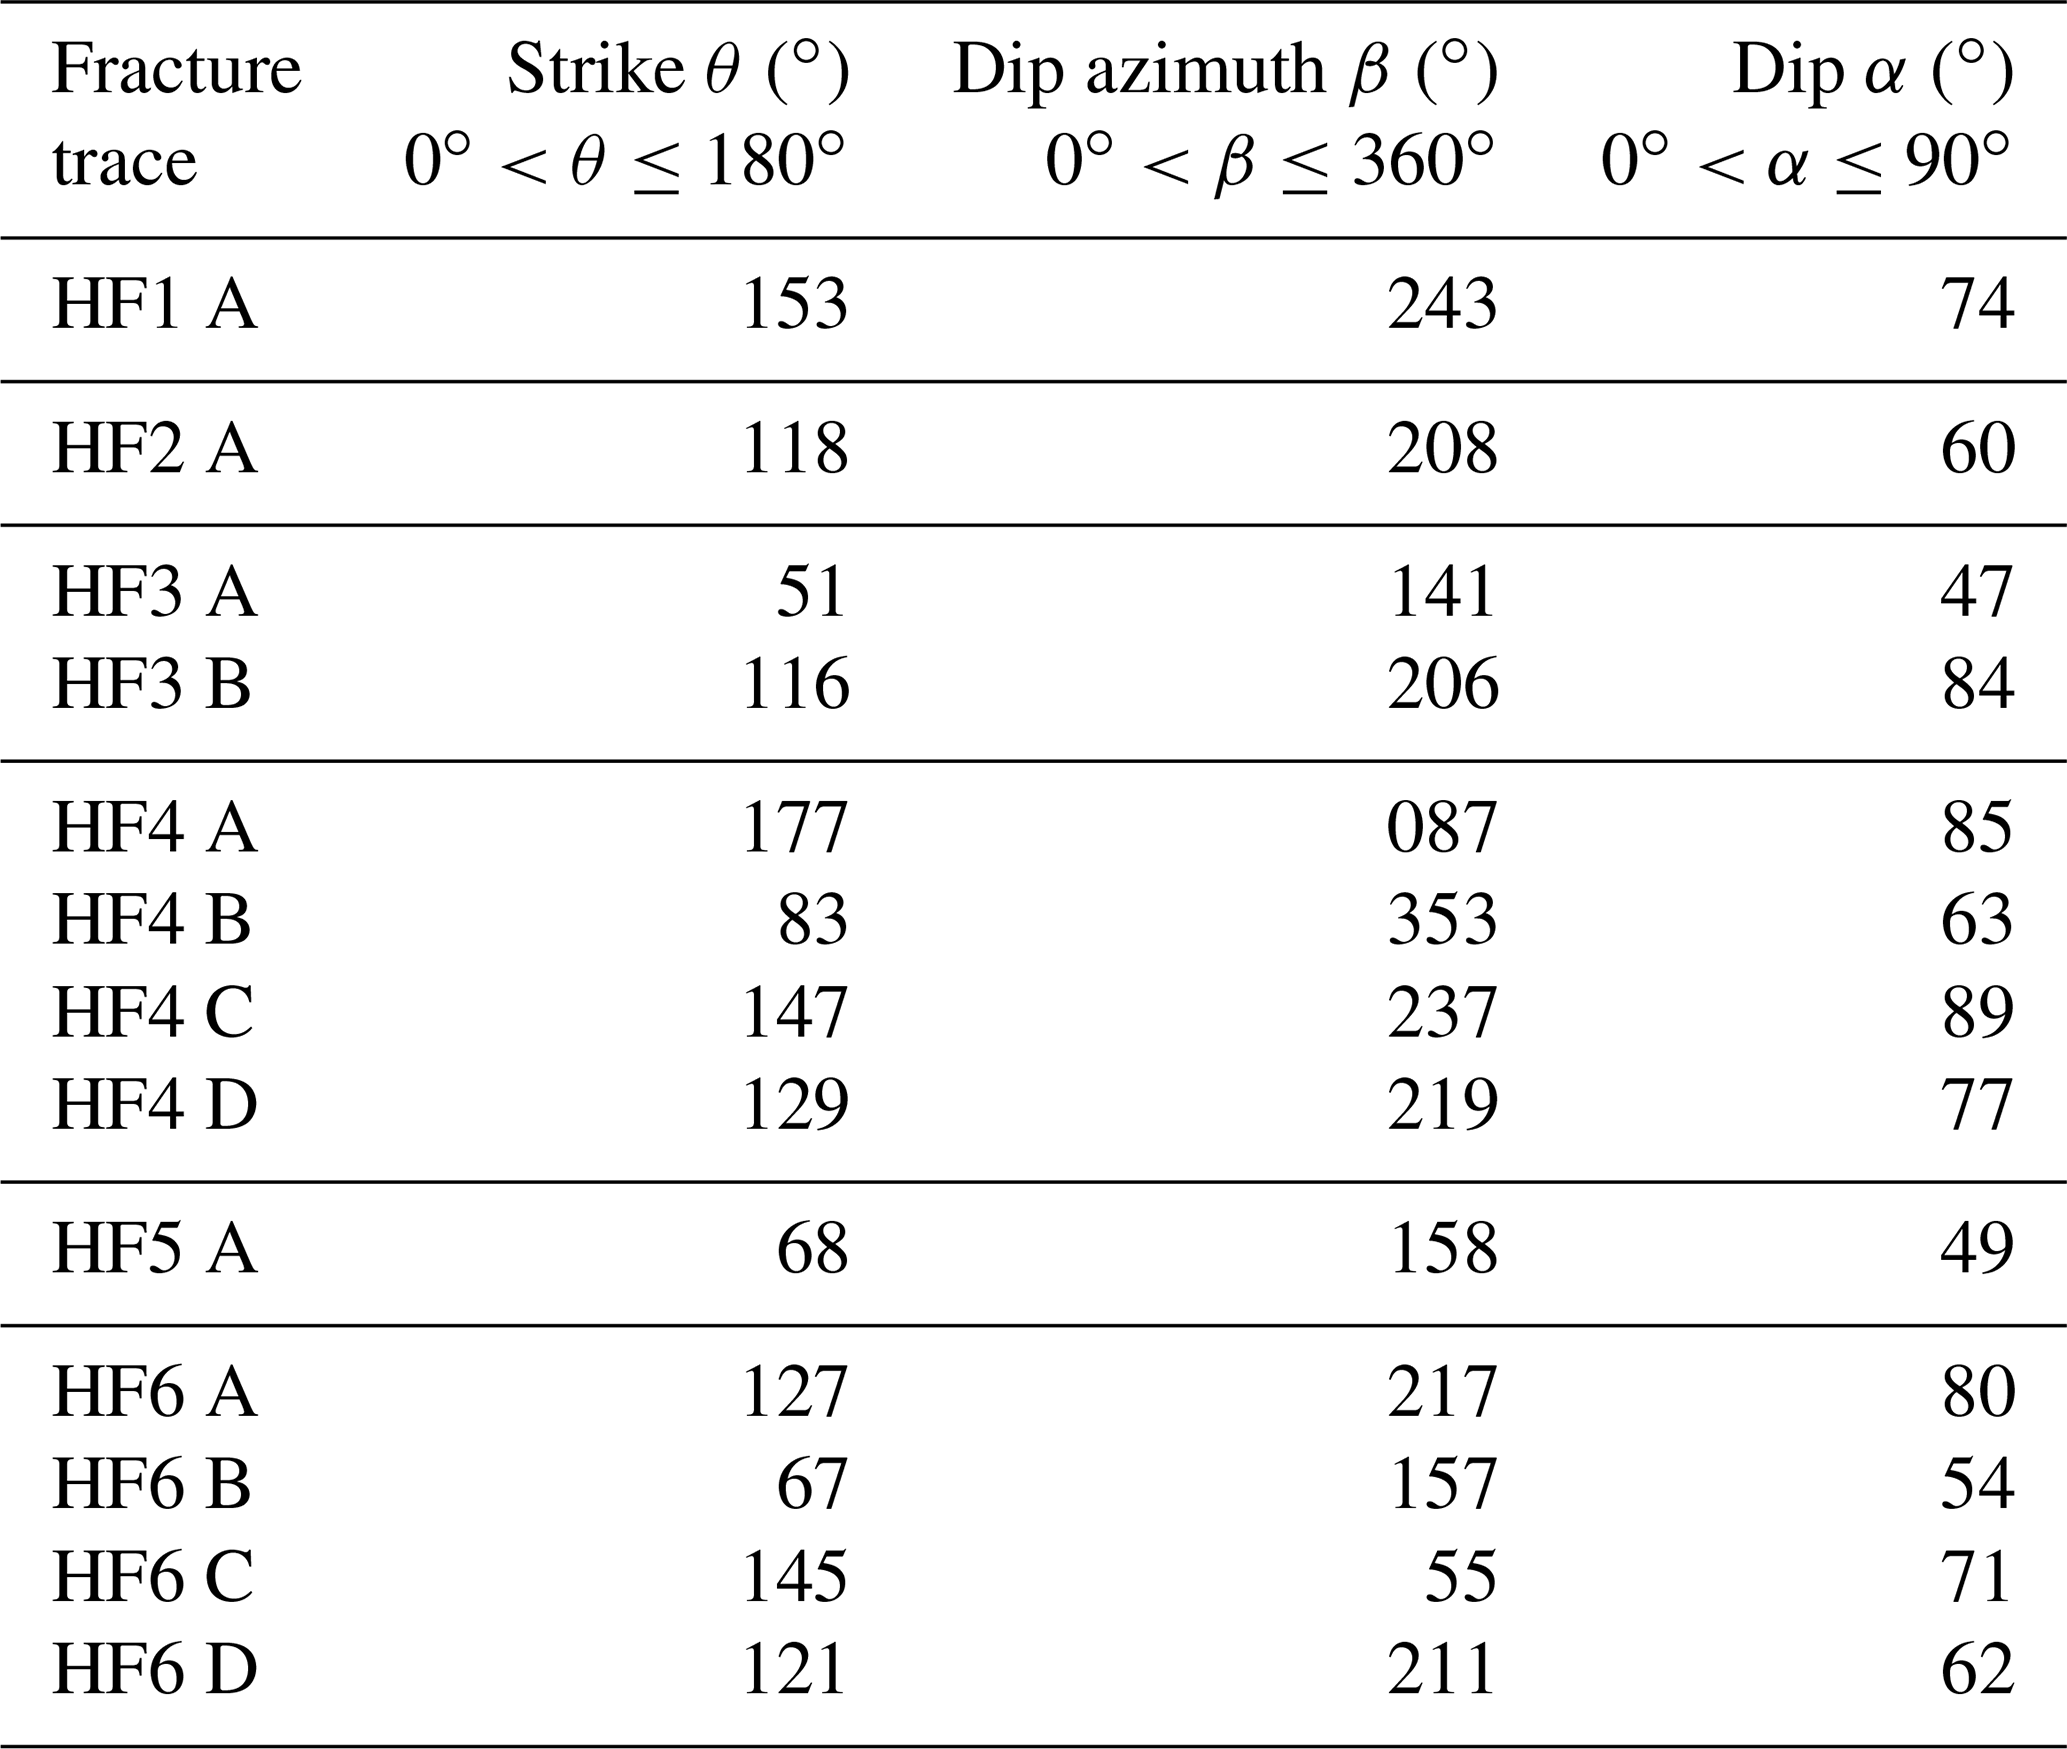
Table 3Fracture orientation from impression packer tests. Angle θ indicates fracture strike direction (east of north), angle β indicates the dip direction (east of north), and angle α indicates the dip with respect to horizontal direction.
3.3 Hydraulic data
Hydraulic data are provided as time series of flow rate and interval pressure as csv files. For the experiments HF1 to HF3, the files also include the packer pressure. In Table 3, the orientations of the fracture traces from the impression packer results are summarized. The hydraulic data define the start and stop of injections, shut-in phases, and bleed-off phases. The relative timing difference between the AE waveforms and the hydraulic time series is expected to be smaller than 1 s for HF1 to HF3. For HF4 to HF6, the relative timing could only be reconstructed by comparing the timing between the hydraulic data, the AE activity, and the pumping signal in the continuous AE records.
3.4 Seismological data
We provide three different data sets with seismological waveform data: continuous broadband seismometer waveforms (Sect. 3.4.1); triggered, high-frequency waveforms of the AE sensors and the accelerometers (Sect. 3.4.2); and continuous, high-frequency waveforms of the AE sensors and the accelerometers (Sect. 3.4.3). The waveforms are provided in miniSEED format; miniSEED is a standard seismological format that can be opened with any seismological tool box, such as Obspy (available at https://obspy.org, last access: 19 December 2023) or Pyrocko (available at https://pyrocko.org, last access: 19 December 2023). The sampling rate of the seismic traces differs depending on the instrument type. The seismometer data are sampled at 100 Hz, while ACC and AE data are sampled at 500 kHz. The high-precision sampling of 2 ms of the AE and ACC sensors is handled correctly by the two applications mentioned before; other applications were not tested. Using 64-bit floating-point numbers can lead to rounding errors in the millisecond range. Using 128 bit floats is recommended if rounding errors become a problem in some applications. Waveform data are provided as station-wise archives for the seismometers and the continuous AE waveforms. The triggered records are combined in a single archive.
3.4.1 Broadband seismometers
The three-component data recorded by the five broadband seismometers (Trillium Compact 120s) cover approx. 2 weeks along with the Äspö experiment. The output unit is counts (see Metadata section for instrument response information).
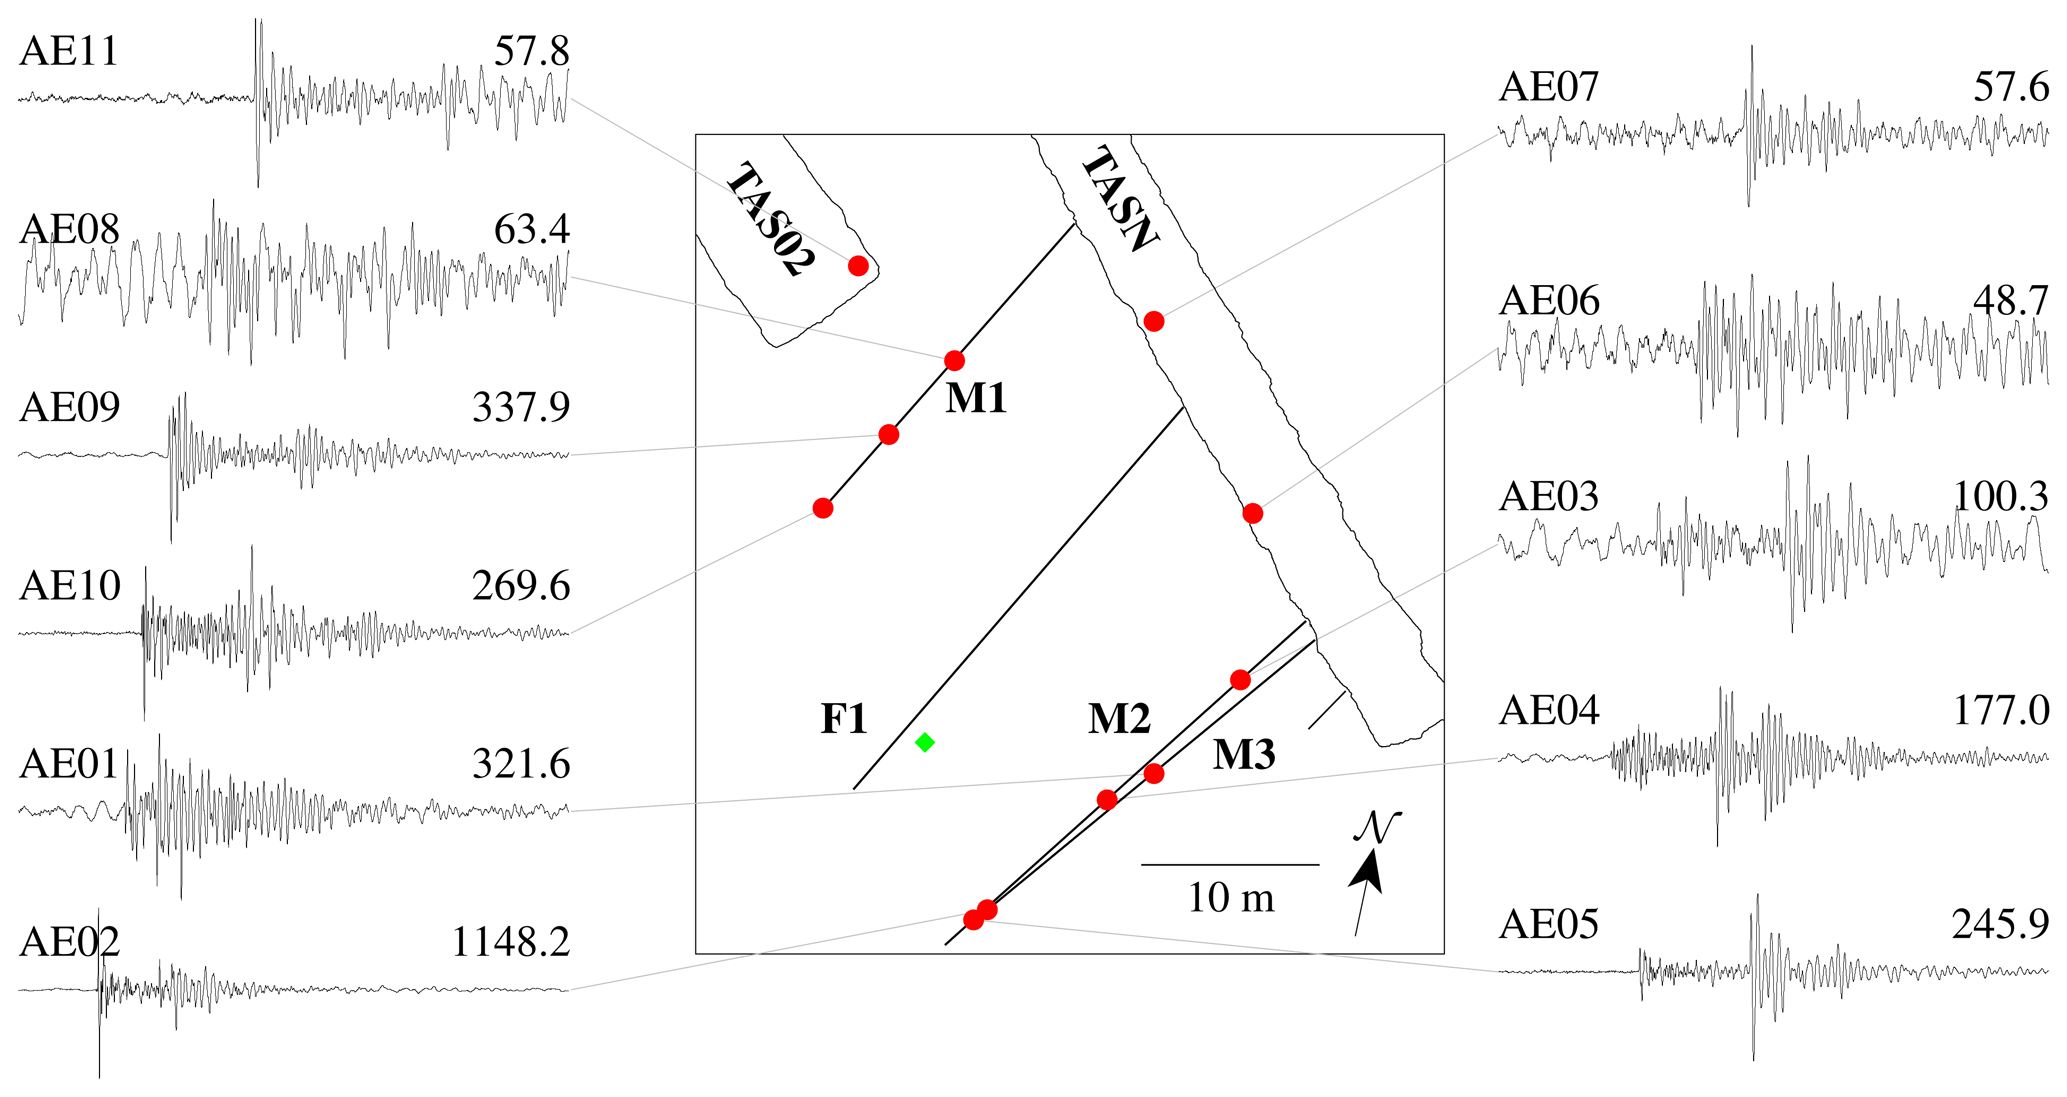
Figure 6Waveforms of acoustic emission sensors for the first event recorded in trigger mode during test HF1-RF1 (green diamond). The sensors corresponding to the waveforms are shown as red dots in map view. The three long monitoring holes M1–M3 are indicated as black lines. Sensors in short boreholes (AE06, AE07, AE08) were installed in the tunnel ceilings. Note that holes M2 and M3 have different inclinations (compare with Fig. 1), and thus the vertical coordinates of the sensors differ. This explains the arrival time difference for AE02 and AE05 despite similar (x,y) coordinates. Waveforms are normalized with scale factors (in mV) given at the end of each trace. Time window length of the records is 10.3 ms.
3.4.2 Acoustic emission and accelerometer data: triggered records
The triggered recording system was active during the whole period of the experiments with 15 single-component sensors (11 AE and 4 ACC sensors). When the given threshold is reached, the system saves 32.768 ms of data from each sensor (AE and ACC). The low trigger level resulted in many false detections originating from noise signals. Therefore, we do not include all triggered records but provide only a subset of manually double-checked data from three phases of the experiments. If needed, the triggering can be simulated using the continuous records and the setup of the triggering system, which is provided with the triggered waveforms of the injection experiments. One example of waveforms from HF1-RF1 is shown in Fig. 6.
-
Hammer seismics. This data set comprises the hammer tests on 1 June, 3 June (before the stimulations), and 15 June (after the stimulations).
-
Pulse transmission. The data comprise waveforms of multiple pulse transmission tests on 2 June and a single test on 1 June (before the stimulations) and on 15 June (after the stimulations). The signal on ACC13 does represent acceleration data during the pulse transmission test. During pulse transmission, this channel was used to record the pulse signal.
-
Injection experiments HF1–HF6. The data contain the waveforms of the preliminary AE catalogue (196 events) from Kwiatek et al. (2018). Additionally, we provide the trigger reports and a csv file with event matches between the triggered AE catalogues of Kwiatek et al. (2018), and the continuous catalogue of Niemz et al. (2020).
3.4.3 Continuous records
Due to the high sampling rate of the ACC and AE sensors, the continuous recording system was only activated during tests and experiments and for noise recordings on the 15 channels. The continuous and the triggered recording systems are not synchronized. Timings can differ by up to a few seconds, but waveforms are identical. For information on the activities during the continuous recordings, we also refer to the work protocol within the metadata. We provide waveforms for the following experiments and tests:
-
Injection experiments HF1–HF6. The continuous waveforms begin a few minutes before the injection and end several minutes (up to 30 min possible) after the bleed-off phase.
-
Lugeon test. The data comprise continuous waveforms during the Lugeon test.
-
Pulse transmission. The data comprise the continuous waveforms of the pulse transmission tests on 2 June. As for the triggered data, ACC13 represent the pulse signal itself.
-
Ventilation noise. Noise was recorded with active tunnel ventilation (4 June 2015, around 14:39 UTC) and inactive tunnel ventilation (4 June 2015, around 14:55 UTC). Tunnel ventilation was always operating during the experiments, and this is the only recording without ventilation noise. A third noise measurement was done on 10 June, around 11:29 UTC. See also the work protocol within the metadata.
-
Background noise. Records of pumping equipment tests can help to evaluate the background noise conditions during the injection.
We provide continuous waveforms from a test of the hydraulic hammer only (5 June, around 14:05 UTC), a test of the pump only (around 14:34 UTC), and a test of both (around 14:58 UTC). Additionally, there are continuous records from a repeated simulation of the fatigue fracturing technique using the hydraulic hammer on 10 June, around 12:09 UTC. See also the work protocol.
3.5 Hydraulic fracture symphony
Here, we provide audio files produced from the waveforms of the AE sensors. The AE sensors cover completely the human-audible range but are of course much more sensitive than human hearing. When the waveform data are converted to sound files, various events during the tests become audible. For the actual fracking, the onset of the first refrac of the first test (HF1-RF1) is made audible. In the real-time version, the injection pump is noticeable as a metallic hum. When the injection process is continuous, more and more crackling sounds (like fire or plastic wrap) appear over time; these are tiny cracks in the rock mass, continuously fracturing. A second version of HF1-RF1 replays the sound at th the original speed. The pump is now a clear monotonous signal, and the fracturing process sounds like random knocking sounds from some distance away. The background noise is mostly due to the ventilation system in the access tunnels. Another example is a single hammer strike recorded at various sensors. As the strikes are the strongest signal recorded during the experiment, their corresponding sound is clear on almost all sensors. The sledgehammer sound file is played at th of the original speed. Another constant acoustic source is water dripping into the boreholes through pre-existing fractures, connected to the Baltic Sea above Äspö HRL. From various cracks, water dripped into the boreholes (water sound file), where it accumulated and then spilled into the access tunnels (water outflow movie).
3.6 Reports of commercial partners
We provide the reports of the commercial partners of the Äspö experiments, containing additional information on the timeline of the experiments and the first results.
Data quality follows established standards; however, given the underground location of the experiment, absolute timing issues did arise. Relative timing, especially for the borehole monitoring network, on the other hand, is of high precision.
Packer and interval pressure were measured in borehole F1 with high-precision electric pressure transducers (KELLER, type PAA-33X, 0–40 MPa). The pressure values and injection rate (RCI flowmeter, type QPT04) were recorded by a digital data acquisition system (Solex-perts SCI-A, 16 channels, 16 bit resolution, sampling rate: 5 Hz). As part of the quality assurance, the pressure transducers and the flowmeter were calibrated prior to in situ testing.
The output unit of the broadband records is in counts and can be converted to velocity using the instrument response information provided with this data set. The data set contains a few gaps of up to 10 min (mostly one or two gaps over a range of 3 weeks). These gaps may arise from temporary instrument malfunctions. The location of the seismometers within the tunnel should be considered as approximate with respect to locations in the tunnels since there is inherently no GPS signal within the mine. Consequently, the seismometer clocks were also not automatically corrected via GPS, resulting in potential clock drifting. Additionally, the seismometers were not rigorously synchronized with the AE and ACC instruments, and time offsets of a few seconds between AE data and broadband data are possible. The seismometers were oriented arbitrarily (see channel names 1 and 2 instead of N and E), with one horizontal component being approximately parallel to the closest tunnel wall.
The AE sensors used in this experiment were not calibrated. The absolute sensor response in terms of velocity or acceleration is unknown and influenced by the incidence-angle-dependent response of the piezoelectric sensor to incoming waves and the varying coupling of the sensors to the borehole wall. The continuous recording of AE and/or ACC data was only active during times of injection experiments. Due to a miscommunication, there are only partial data for the initial fracturing stage of the injection experiment HF2. The absolute timing between the data of different injection experiments or stages if the experiment was split up is only correct to 1 or 2 s since the system was started manually each time. In contrast, the relative timing between all AE and ACC sensors can be considered to be as precise as the sampling interval as it was synchronized via the recording system. The high-precision sampling of 2 ms of the AE and ACC sensors is handled correctly by Obspy (available at https://obspy.org, last access: 19 December 2023) or Pyrocko (available at https://pyrocko.org, last access: 19 December 2023). Other applications were not tested. The record time data should be treated as 128 bit floats. Otherwise, rounding errors may become a problem.
The triggered waveforms represent a subset of the continuous data set, with 32 768 samples around a manually revised, in situ detected event. The waveforms of the continuous and triggered data sets are identical, but the record times between them may vary by several seconds. The different data sets can be matched using waveform cross-correlations.
The data described in this article (Zang et al., 2023) are published under the Creative Commons Attribution 4.0 International License (CC BY 4.0) via GFZ Data Services and are available at https://doi.org/10.5880/GFZ.2.6.2023.004. The data repository is structured in directories (Fig. 5) and is available as a compressed archive using gzip (file format tar.gz; Windows and Mac users may need additional software to open the archive, e.g., winzip or 7zip).
In an overview, Zang et al. (2017a) describe the experimental setup of sensors and injection schemes in the geologic context of Äspö HRL. A preliminary catalogue of the strongest and most reliably recorded events was compiled (196 events) with origin times and hypocenters of the acoustic emissions in six hydraulic in situ tests with 29 fracturing stages. In two tests, acoustic emission, hydraulic pressure, and flow rate time charts are analyzed and discussed in light of the stress state and the fracture orientations from impression packer results.
López-Comino et al. (2017) apply a robust, accurate, and automated detection and location algorithm of acoustic emissions to characterize the nucleation and growth process of hydraulic fractures. Here, full waveform recordings monitored during one test were selected. Waveform stacking and coherence analysis techniques are applied using large data sets with 1 MHz sampling from the continuous water injection test. A catalogue of 4000 acoustic events is generated with a high Gutenberg–Richter b value of 2.4. Fracture growth is mapped by the spatiotemporal evolution of acoustic emission locations revealing upwards migration from −414 to −404 m depth.
Zang et al. (2017b) introduced the concept of fatigue hydraulic fracturing as a possible explanation for the above-mentioned observations. This concept is based on alternating phases of pressurization and depressurization, allowing crack tip stresses to periodically relax. Treating fracture walls with a hydraulic hammer moves rock chips to the fracture tip, as described in the Kiel process (Kiel, 1977). This makes the fracture process zone become larger in the fatigue test as compared to the conventional treatment. The multiple-pump, variable-flow-rate approach allows for efficient rock fragmentation.
Kwiatek et al. (2018) analyzed triggered recordings of 11 acoustic emission sensors and determined moment magnitudes ranging from −4 to −3.5 using acoustic emission and accelerometer data from the preliminary catalogue. Events have been relocated with the double-difference technique and investigated in combination with the source parameters in the context of stimulation parameters. Migration of the events away and toward the injection intervals was observed in direct correlation with changes in hydraulic energy. Total radiated seismic energy is identified to be very low with respect to the hydraulic energy and correlates well with the hydraulic energy rate. Source parameter analysis signifies the reactivation of pre-existing rock defects.
Zimmermann et al. (2019) used hydraulic test data to compute permeability for the six hydraulic tests with 29 (re)fracturing stages. The evolution of permeability with time is compared to the number of triggered acoustic emission recordings from Kwiatek et al. (2018). Compared to conventional injection tests with constant flow rates and monotonic increases in the fracturing pressure, the cyclic injection leads to a lower activity of acoustic emissions.
Zang et al. (2019) compare laboratory cyclic-injection tests in granitic rock with mine-scale data from the Äspö HRL in situ tests. General findings independent of scale are (a) a lower breakdown pressure in fatigue testing; (b) a reduction in the magnitude of the largest induced seismic event by cyclic injection; (c) a wider process zone in the cyclic fracture patterns; and (d) an increase in permeability during cyclic injection, although this increase is less compared to that in continuous injection.
Stephansson et al. (2019) tested cores obtained from the injection borehole used for the in situ tests performed at Äspö HRL. The testing procedure is designed with a linear pressure increase for both conventional and pulse fracturing. For each pair of samples of present rock types, testing starts with continuous hydraulic fracturing until linear breakdown. The loading steps of the pulse-fracturing test are given as percentages (25 %, 50 %, and 75 %) of the linear breakdown pressure. The pulse frequency for each loading step is set to 1 Hz. The axial pressure is set to 8.5 MPa and gives a stress ratio between confinement and axial stress of 1.4. The applied stress ratio value is adapted to in situ values (maximum horizontal 22 MPa, vertical 12 MPa, and minimum horizontal stress 11 MPa at a depth of 410 m).
Niemz et al. (2020) developed a semi-automated work flow with full-waveform-based detection, classification, and localization procedures for six hydraulic in situ tests to extract and characterize the intense activity of induced, high-frequency acoustic emissions from continuous recordings. The approach extends the AE catalogue from 196 events of the preliminary catalogue to more than 19 600 located acoustic emissions. While the conventional tests lead to hypocenters clustered in planar regions, indicating the generation of a single main fracture plane, the cyclic progressive injection scheme results in a more diffuse hypocenter distribution, indicating the activation of a more complex fracture network. In terms of hydraulic energy, the cyclic progressive scheme is characterized by a lower rate of seismicity, lower maximum magnitudes, and larger b values, with the last implying an increased number of small events relative to larger ones. The magnitude distributions of the catalogues by Kwiatek et al. (2018) with moment magnitudes and by Niemz et al. (2020) with acoustic emission magnitudes are shown in Fig. 7.
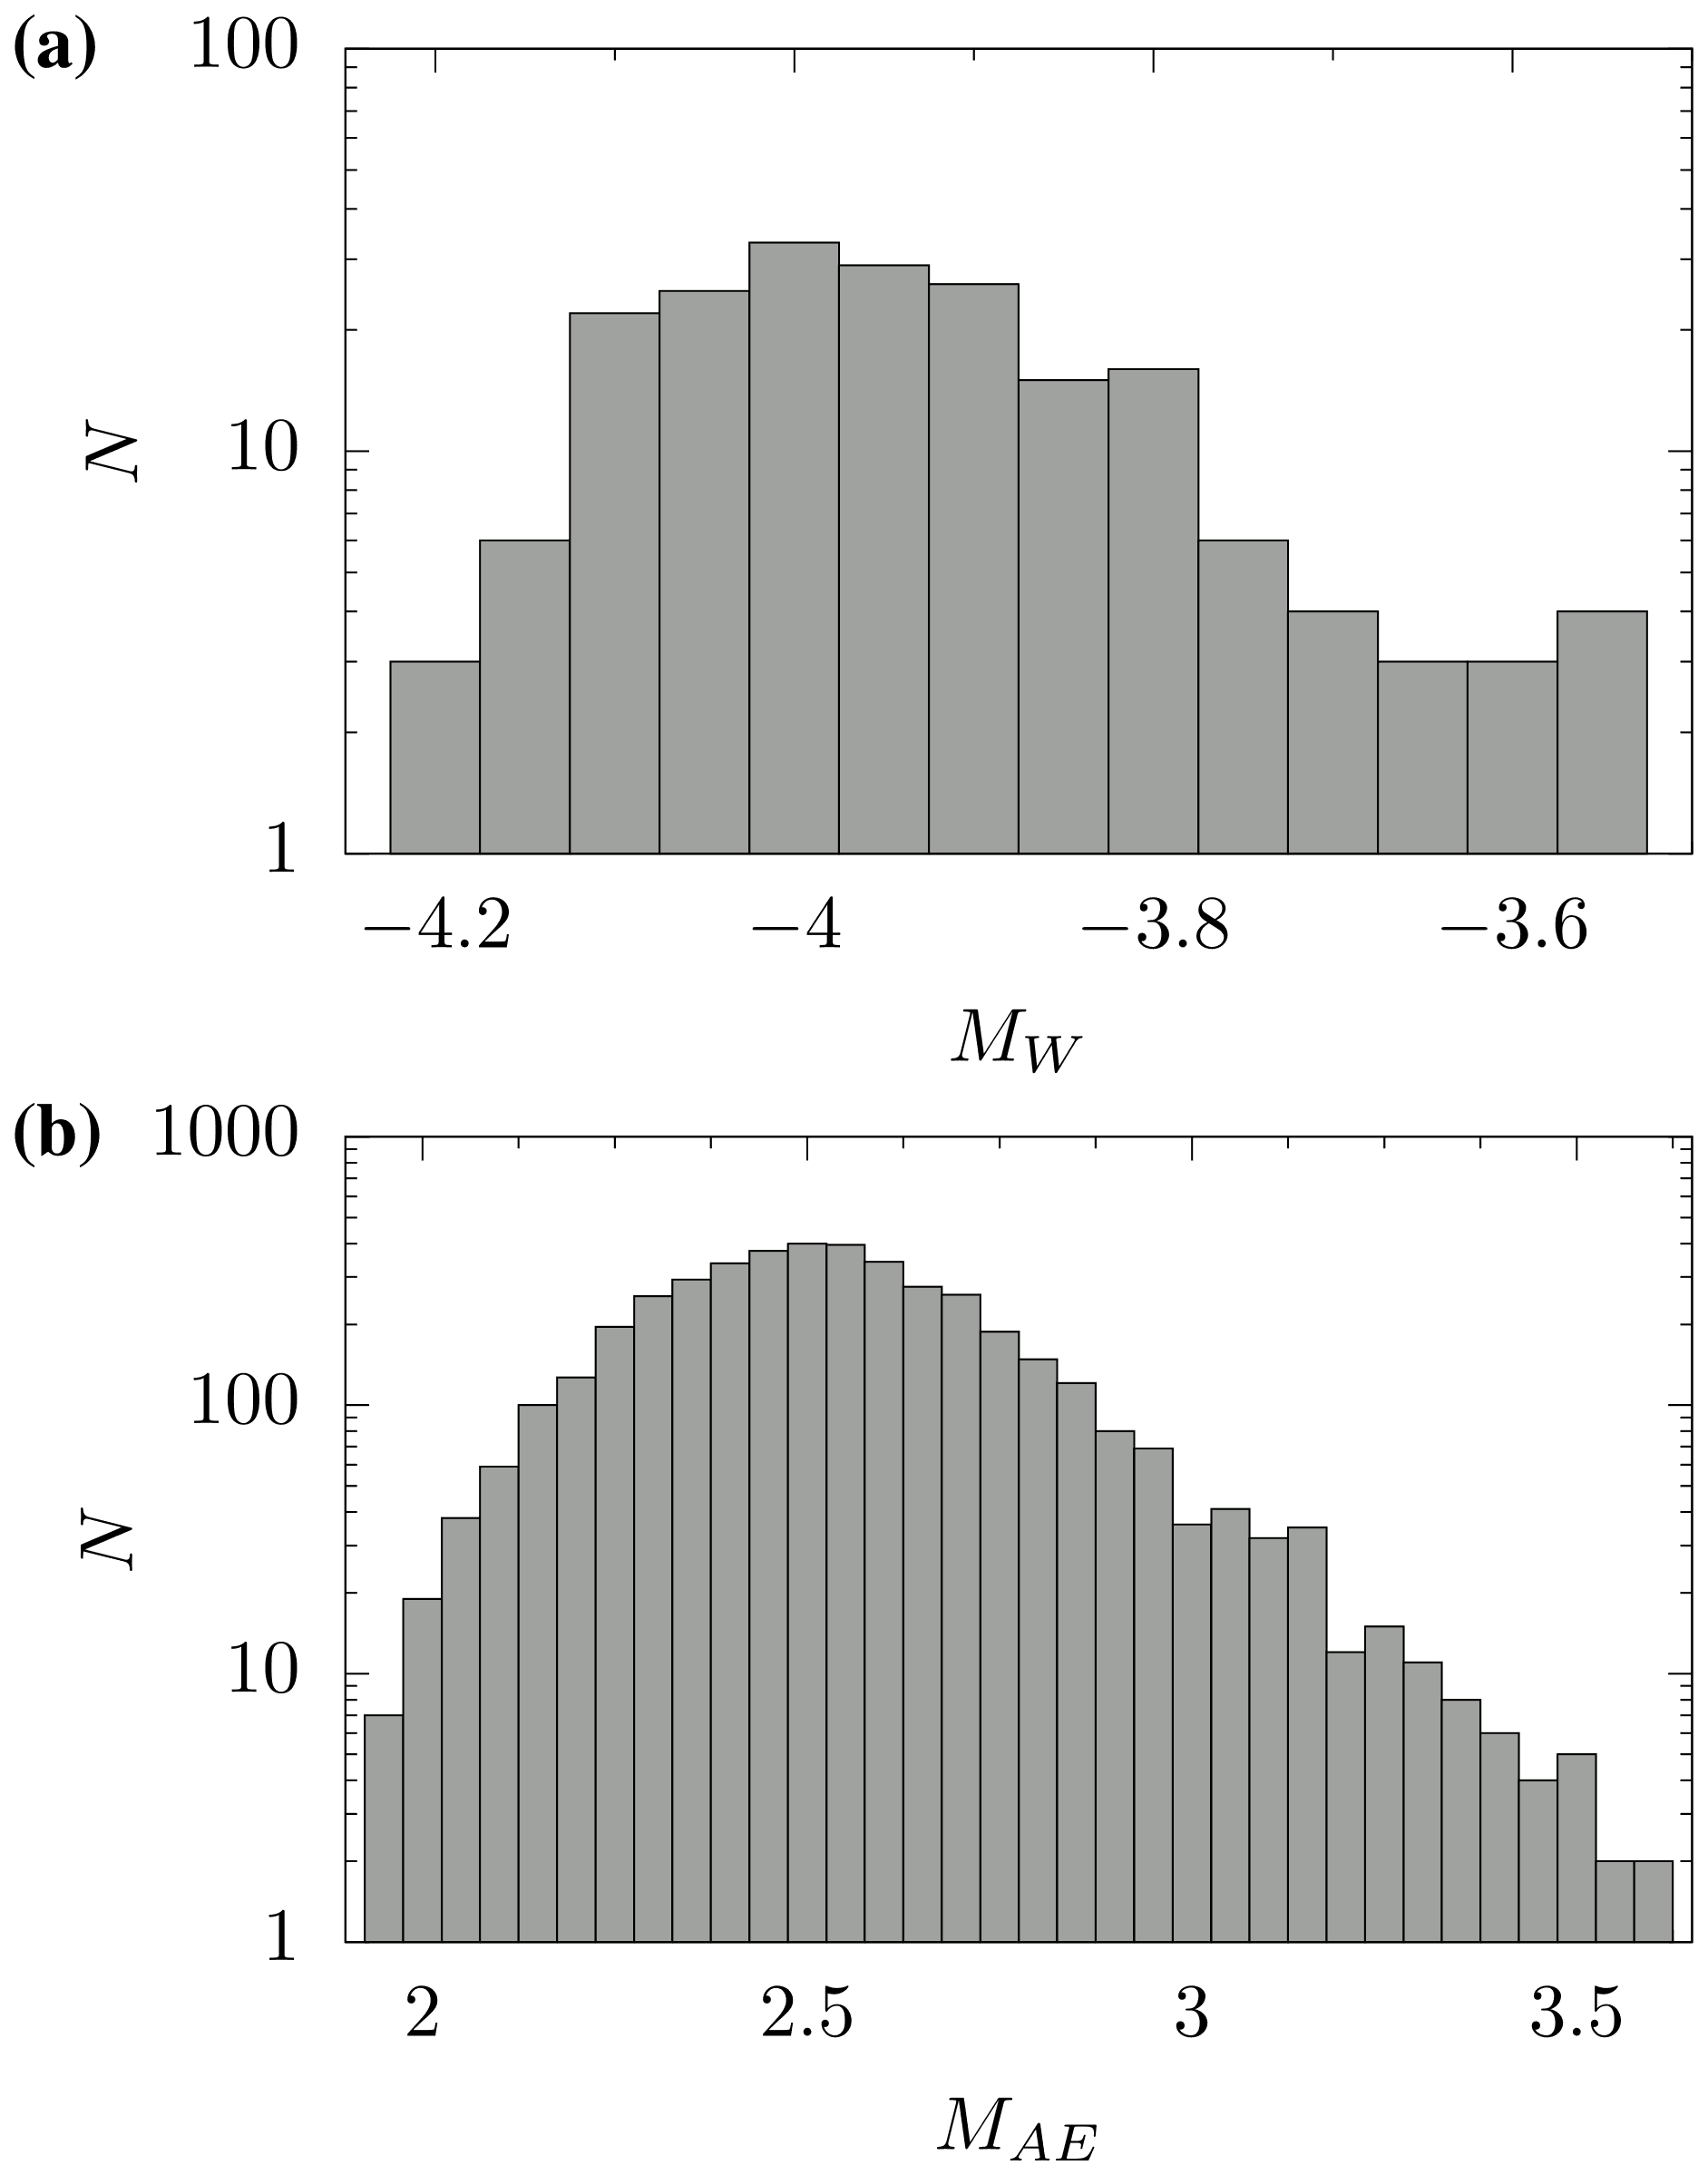
Figure 7Magnitude–frequency plots of (a) the catalogue of Kwiatek et al. (2018) and (b) the catalogue of Niemz et al. (2020).
Zang et al. (2021) propose a new approach that optimizes the trade-off between the unavoidable radiated seismicity during fracture propagation and the inserted hydraulic energy during fluid injection by using cyclic- and pulse-pumping schemes. Their concept aims at the ability to control induced seismicity in energy technologies such as geothermal heat and shale gas, conclusively improving the safety by reducing the seismic hazard of reservoirs. They use data from laboratory-scale, mine-scale, and field-scale injection experiments performed in granitic rock and observe that both the seismic energy and the permeability enhancement process strongly depend on the injection style and rock type.
Niemz et al. (2021) analyze tilt signals that appear as long-period transients on two broadband seismometers installed in proximity to newly formed, meter-scale hydraulic fractures. The tracking of increased permeability and the fracturing extent is often based on the distribution of accompanying microseismic events within the stimulated rock volume, but it is debated whether microseismic activity adequately depicts fracture formation. The analysis combines a catalogue of previously analyzed acoustic emissions, indirectly mapping the fractures, with tilt signals providing an independent and direct insight into rock deformation. The analysis allows us to identify different phases of the fracturing process, including the (re)opening, growth, and after-growth of fractures.
López-Comino et al. (2021) used Äspö HRL strong acoustic events to estimate the rupture directivity of the hydraulic fractures. High-quality waveforms recorded from the largest, decimeter-scale acoustic emissions during the in situ experiment allow us to resolve the apparent durations observed at each sensor to analyze 3D directivity effects. Unilateral and (asymmetric) bilateral ruptures are then characterized by the introduction of a parameter κ, representing the angle between the directivity vector and the station vector. While the cloud of acoustic emission activity indicates the planes of the hydraulic fractures, the resolved directivity vectors show off-plane orientations, indicating that rupture planes of micro-fractures on a scale of centimeters have different geometries. The results reveal a general alignment of the rupture directivity with the orientation of the minimum horizontal stress, implying that not only the slip direction but also the fracture growth produced by the fluid injections is controlled by the near-field, local stress conditions.
Zang et al. (2019) and Zhuang et al. (2019) analyzed the energy budget during hydraulic fracturing with the goal of controlling the energy partition in the fracture growth process. The hydraulic energy in the underground tests were estimated to be 0.2 MJ, while hydraulic energy in the cyclic laboratory tests varies between 10 J and 10 kJ, increasing the number of cycles from 1 to 839. The reported findings can improve the efficiency of heat production in granitic rock or shale gas production with an environment-friendly approach which (a) reduces the fracture breakdown pressure of high-strength rocks (smaller pumps required); (b) reduces induced seismicity (expanding the operating time of the project); and (c) generates a larger stimulated reservoir volume with natural proppants from the fracture walls by rock hydraulic fatigue, labeled as soft-stimulation or fatigue-hydraulic-fracturing techniques.
There are many data sets which call for further analysis (Fig. 5; e.g., the ultrasonic pulse transmission data and the noise data before and after in situ experiments were not investigated yet).
AZ, PN, and GZ conceptualized this study. AZ wrote the first draft of this paper and was the principal investigator of the 2015 mine-scale hydraulic stimulation experiments at Äspö Hard Rock Laboratory. AZ, CM, SvS, KP, and GK were members of the team collecting all data underground. PN structured the database and prepared the data files and formats for data hosting. SvS edited the draft and designed Figs. 2–7; PN designed Fig. 1. All the authors read, revised, and approved the final version of the paper.
The contact author has declared that none of the authors has any competing interests.
The data described in this article and accessible at https://doi.org/10.5880/GFZ.2.6.2023.004 (Zang et al., 2023) are provided on an “as is” and “as available” basis without warranty of any kind.
Publisher's note: Copernicus Publications remains neutral with regard to jurisdictional claims made in the text, published maps, institutional affiliations, or any other geographical representation in this paper. While Copernicus Publications makes every effort to include appropriate place names, the final responsibility lies with the authors.
The in situ experiment at Äspö Hard Rock Laboratory (HRL) was supported by the GFZ German Research Center for Geosciences (75 %), the KIT Karlsruhe Institute of Technology (15 %), and the Nova Center for University Studies, Research and Development Oskarshamn (10 %). We thank Hana Semíková and Ondřej Vaněček at ISATech s.r.o. (Prague, Czech Republic) for the hydraulic stimulation of tests HF4–HF6. An additional in-kind contribution of the Swedish Nuclear Fuel and Waste Management Co (SKB) for using the Äspö HRL as test site for geothermal research is highly appreciated. This work was supported by funding received from the European Union's Horizon 2020 research and innovation program under grant agreement no. 691728 (DESTRESS).
This research has been supported by the Horizon 2020 (grant no. 691728).
The article processing charges for this open-access publication were covered by the Helmholtz Centre Potsdam – GFZ German Research Centre for Geosciences.
This paper was edited by Andrea Rovida and reviewed by two anonymous referees.
Amann, F., Gischig, V., Evans, K., Doetsch, J., Jalali, R., Valley, B., Krietsch, H., Dutler, N., Villiger, L., Brixel, B., Klepikova, M., Kittilä, A., Madonna, C., Wiemer, S., Saar, M. O., Loew, S., Driesner, T., Maurer, H., and Giardini, D.: The seismo-hydromechanical behavior during deep geothermal reservoir stimulations: open questions tackled in a decameter-scale in situ stimulation experiment, Solid Earth, 9, 115–137, https://doi.org/10.5194/se-9-115-2018, 2018. a, b
Ask, D.: Measurement-Related Uncertainties in Overcoring Data at the Äspö HRL, Sweden. Part 2: Biaxial Tests of CSIRO HI Overcore Samples, Int. J. Rock Mech. Min., 43, 127–138, https://doi.org/10.1016/j.ijrmms.2005.05.012, 2006. a
Baisch, S., Koch, C., and Muntendam-Bos, A.: Traffic Light Systems: To What Extent Can Induced Seismicity Be Controlled?, Seismol. Res. Lett., 90, 1145–1154, https://doi.org/10.1785/0220180337, 2019. a
Boese, C. M., Kwiatek, G., Fischer, T., Plenkers, K., Starke, J., Blümle, F., Janssen, C., and Dresen, G.: Seismic monitoring of the STIMTEC hydraulic stimulation experiment in anisotropic metamorphic gneiss, Solid Earth, 13, 323–346, https://doi.org/10.5194/se-13-323-2022, 2022. a
Bommer, J. J.: Earthquake Hazard and Risk Analysis for Natural and Induced Seismicity: Towards Objective Assessments in the Face of Uncertainty, B. Earthq. Eng., 20, 2825–3069, https://doi.org/10.1007/s10518-022-01357-4, 2022. a
Bommer, J. J., Oates, S., Cepeda, J. M., Lindholm, C., Bird, J., Torres, R., Marroquín, G., and Rivas, J.: Control of Hazard Due to Seismicity Induced by a Hot Fractured Rock Geothermal Project, Eng. Geol., 83, 287–306, https://doi.org/10.1016/j.enggeo.2005.11.002, 2006. a
Braester, C. and Thunvik, R.: Determination of Formation Permeability by Double-Packer Tests, J. Hydrol., 72, 375–389, https://doi.org/10.1016/0022-1694(84)90090-8, 1984. a
Buijze, L., van Bijsterveldt, L., Cremer, H., Paap, B., Veldkamp, H., Wassing, B. B., van Wees, J.-D., van Yperen, G. C., ter Heege, J. H., and Jaarsma, B.: Review of Induced Seismicity in Geothermal Systems Worldwide and Implications for Geothermal Systems in the Netherlands, Neth. J. Geosci., 98, e13, https://doi.org/10.1017/njg.2019.6, 2019. a
Dagan, G.: A Note on Packer, Slug, and Recovery Tests in Unconfined Aquifers, Water Resour. Res., 14, 929–934, https://doi.org/10.1029/WR014i005p00929, 1978. a
Döse, C., Strahle, A., Rauseus, G., Samuelsson, E., and Olsson, O.: Revision of BIPS-orientations for Geological Objects in Boreholes from Forsmark and Laxemar, Technical Report SKB-Report P-08-37, Swedish Nuclear Fuel and Waste Management Co., Stockholm, Sweden, 2008. a
Fleckenstein, W., Miskimins, J., Kazemi, H., Eustes, A., Abdimaulen, D., Mindygaliyeva, B., Uzun, O., Amini, K., Hill, T., Mailand, J., Henschel, R., King, G., Ortiz, S., and Keyes, C.: Development of Multi-Stage Fracturing System and Wellbore Tractor to Enable Zonal Isolation During Stimulation and EGS Operations in Horizontal Wellbores, in: Day 3 Wed, October 05, 2022, p. D031S056R001, SPE, Houston, Texas, USA, https://doi.org/10.2118/210210-MS, 2022. a
Giardini, D.: Geothermal Quake Risks Must Be Faced, Nature, 462, 848–849, https://doi.org/10.1038/462848a, 2009. a
Glauser, W., McLennan, J., and Walto, I.: Do Perforated Completions Have Value for Engineered Geothermal Systems, in: Effective and Sustainable Hydraulic Fracturing, edited by: Jeffrey, R., InTech, Rijeka, Croatia, https://doi.org/10.5772/56211, 2013. a
Grünthal, G.: Induced Seismicity Related to Geothermal Projects versus Natural Tectonic Earthquakes and Other Types of Induced Seismic Events in Central Europe, Geothermics, 52, 22–35, https://doi.org/10.1016/j.geothermics.2013.09.009, 2014. a
Häring, M. O., Schanz, U., Ladner, F., and Dyer, B. C.: Characterisation of the Basel 1 Enhanced Geothermal System, Geothermics, 37, 469–495, https://doi.org/10.1016/j.geothermics.2008.06.002, 2008. a
Horne, R. N.: Modern Well Test Analysis: A Computer-Aided Approach, 2nd ed edn., Petroway, Palo Alto, CA, 1995. a
Hvorslev, M. J.: Time Lag and Soil Permeability in Groundwater Observations, Bulletin 36, U. S. Army Corps Eng., Waterways Exp. Stn., Vicksburg, Mississippi, USA, 1951. a
Kiel, O. M.: Kiel Process - Reservoir Stimulation by Dendritic Fracturing, Soc. Pet. Eng. AIME, Pap., United States, SPE-6984, 1977. a
Kneafsey, T. J., Dobson, P., Blankenship, D., Morris, J., Knox, H., Schwering, P., White, M., Doe, T., Roggenthen, W., Mattson, E., Podgorney, R., Johnson, T., Ajo-Franklin, J., Valladao, C., and the EGS Collab team: An Overview of the EGS Collab Project: Field Validation of Coupled Process Modeling of Fracturing and Fluid Flow at the Sanford Underground Research Facility, Lead, SD, in: 43rd Workshop on Geothermal Reservoir Engineering, Stanford University, Stanford, California, 12–14 February 2018, vol. 2018, SGP-TR-213, 2018. a
Kwiatek, G., Martínez-Garzón, P., Plenkers, K., Leonhardt, M., Zang, A., von Specht, S., Dresen, G., and Bohnhoff, M.: Insights Into Complex Subdecimeter Fracturing Processes Occurring During a Water Injection Experiment at Depth in Äspö Hard Rock Laboratory, Sweden, J. Geophys. Res.-Sol. Ea., 123, 6616–6635, https://doi.org/10.1029/2017JB014715, 2018. a, b, c, d, e, f
Lancaster-Jones, P. F. F.: The Interpretation of the Lugeon Water-Test, Q. J. Eng. Geol., 8, 151–154, https://doi.org/10.1144/GSL.QJEG.1975.008.02.05, 1975. a
López-Comino, J. A., Cesca, S., Heimann, S., Grigoli, F., Milkereit, C., Dahm, T., and Zang, A.: Characterization of Hydraulic Fractures Growth During the Äspö Hard Rock Laboratory Experiment (Sweden), Rock Mech. Rock Eng., 50, 2985–3001, https://doi.org/10.1007/s00603-017-1285-0, 2017. a
López-Comino, J. Á., Cesca, S., Niemz, P., Dahm, T., and Zang, A.: Rupture Directivity in 3D Inferred From Acoustic Emissions Events in a Mine-Scale Hydraulic Fracturing Experiment, Frontiers in Earth Science, 9, 670757, https://doi.org/10.3389/feart.2021.670757, 2021. a
Ma, X., Hertrich, M., Amann, F., Bröker, K., Gholizadeh Doonechaly, N., Gischig, V., Hochreutener, R., Kästli, P., Krietsch, H., Marti, M., Nägeli, B., Nejati, M., Obermann, A., Plenkers, K., Rinaldi, A. P., Shakas, A., Villiger, L., Wenning, Q., Zappone, A., Bethmann, F., Castilla, R., Seberto, F., Meier, P., Driesner, T., Loew, S., Maurer, H., Saar, M. O., Wiemer, S., and Giardini, D.: Multi-disciplinary characterizations of the BedrettoLab – a new underground geoscience research facility, Solid Earth, 13, 301–322, https://doi.org/10.5194/se-13-301-2022, 2022. a
Majer, E., Nelson, J., Robertson-Tait, A., Savy, J., and Wong, I.: Protocol for Addressing Induced Seismicity Associated with Enhanced Geothermal Systems, Tech. Rep. DOE/EE–0662, 1219482, Office of Energy Efficiency and Renewable Energy (EERE), Washington, DC, United States, https://doi.org/10.2172/1219482, 2012. a
Meier, P. M., Rodríguez, A., and Bethmann, F.: Lessons Learned from Basel: New EGS Projects in Switzerland Using Multistage Stimulation and a Probabilistic Traffic Light System for the Reduction of Seismic Risk, in: Proceedings World Geothermal Congress 2015, Melbourne, Australia, 19–25 April 2015. a
Moye, D.: Diamond Drilling for Foundation Exploration, Inst Engrs Civil Eng Trans/Australia/, in: Proceedings Paper No. 2150, The Institution's Site Investigation Symposium, Sydney, Australia, 1 and 2 September, 1966, 1967. a
Niemz, P., Cesca, S., Heimann, S., Grigoli, F., von Specht, S., Hammer, C., Zang, A., and Dahm, T.: Full-Waveform-Based Characterization of Acoustic Emission Activity in a Mine-Scale Experiment: A Comparison of Conventional and Advanced Hydraulic Fracturing Schemes, Geophys. J. Int., 222, 189–206, https://doi.org/10.1093/gji/ggaa127, 2020. a, b, c, d
Niemz, P., Dahm, T., Milkereit, C., Cesca, S., Petersen, G., and Zang, A.: Insights Into Hydraulic Fracture Growth Gained From a Joint Analysis of Seismometer-Derived Tilt Signals and Acoustic Emissions, J. Geophys. Res.-Sol. Ea., 126, e2021JB023057, https://doi.org/10.1029/2021JB023057, 2021. a, b, c
Nordlund, E., L, C., and Carlsson, B.: Äspö Hard Rock Laboratory Prototype Repository – Mechanical Properties of the Diorite in the Prototype Repository at Äspö HRL, Tech. Rep. IPR-99-25, Swedish Nuclear Fuel and Waste Management Co, Stockholm, Sweden, 1999. a, b, c
Petersen, G. M., Cesca, S., Kriegerowski, M., and the AlpArray Working Group: Automated Quality Control for Large Seismic Networks: Implementation and Application to the AlpArray Seismic Network, Seismol. Res. Lett., 90, 1177–1190, https://doi.org/10.1785/0220180342, 2019. a
Plenkers, K., Manthei, G., and Kwiatek, G.: Underground In-situ Acoustic Emission in Study of Rock Stability and Earthquake Physics, in: Acoustic Emission Testing, edited by Grosse, C. U., Ohtsu, M., Aggelis, D. G., and Shiotani, T., Springer International Publishing, Cham, https://doi.org/10.1007/978-3-030-67936-1_16, pp. 403–476, 2022. a
Plenkers, K., Reinicke, A., Obermann, A., Gholizadeh, A., Krietsch, H., Fechner, T., Hertrich, M., Kontar, K., Maurer, H., Philipp, J., Rinderknecht, B., Volksdorf, M., Giardini, D., and Wiemer, S.: Multi-Disciplinary Monitoring Networks for Mesoscale Underground Experiments: Advances in the Bedretto Reservoir Project, Sensors, submitted, 2023. a
Stanfors, R., Rhén, I., Tullborg, E.-L., and Wikberg, P.: Overview of Geological and Hydrogeological Conditions of the Äspö Hard Rock Laboratory Site, Appl. Geochem., 14, 819–834, https://doi.org/10.1016/S0883-2927(99)00022-0, 1999. a
Staub, I., Fredriksson, A., and Outters, N.: Strategy for a Rock Mechanics Site Descriptive Model – Development and Testing of the Theoretical Approach, Tech. Rep. R-02-02, Swedish Nuclear Fuel and Waste Management Co, Stockholm, Sweden, 2002. a
Staub, I., Andersson, J. C., and Magnor, B.: Aspo Pillar Stability Experiment – Geology and Mechanical Properties of the Rock in TASQ, Tech. Rep. R-04-01, Swedish Nuclear Fuel and Waste Management Co, Stockholm, Sweden, 2004. a
Stenberg, L.: Geological and Hydrogeological Description of the Aspo Extension Area, Tech. rep., Swedish Nuclear Fuel and Waste Management Co, Stockholm, 2015. a, b
Stephansson, O., Semikova, H., Zimmermann, G., and Zang, A.: Laboratory Pulse Test of Hydraulic Fracturing on Granitic Sample Cores from Äspö HRL, Sweden, Rock Mech. Rock Eng., 52, 629–633, https://doi.org/10.1007/s00603-018-1421-5, 2019. a
Stille, H. and Olsson, P.: First Evaluation of Rock Mechanics, SKB Progress Report 25-89-07, Swedish Nuclear Fuel and Waste Management Co, Stockholm, Sweden, 1989. a, b, c
Stille, H. and Olsson, P.: Evaluation of Rock Mechanics, SKB Progress Report PR-25-90-08, Swedish Nuclear Fuel and Waste Management Co, Stockholm, Sweden, 1990. a
Zang, A. and Stephansson, O.: Special Issue “Hydraulic Fracturing in Hard Rock”, Rock Mech. Rock Eng., 52, 471–473, https://doi.org/10.1007/s00603-019-1740-1, 2019. a
Zang, A., Oye, V., Jousset, P., Deichmann, N., Gritto, R., McGarr, A., Majer, E., and Bruhn, D.: Analysis of Induced Seismicity in Geothermal Reservoirs — An Overview, Geothermics, 52, 6–21, https://doi.org/10.1016/j.geothermics.2014.06.005, 2014. a
Zang, A., Stephansson, O., Stenberg, L., Plenkers, K., Specht, S., Milkereit, C., Schill, E., Kwiatek, G., Dresen, G., Zimmermann, G., Dahm, T., and Weber, M.: Hydraulic Fracture Monitoring in Hard Rock at 410 m Depth with an Advanced Fluid-Injection Protocol and Extensive Sensor Array, Geophys. J. Int., 208, 790–813, https://doi.org/10.1093/gji/ggw430, 2017a. a, b, c
Zang, A., Stephansson, O., and Zimmermann, G.: Keynote: Fatigue Hydraulic Fracturing, Procedia Engineer., 191, 1126–1134, https://doi.org/10.1016/j.proeng.2017.05.287, 2017b. a, b
Zang, A., Zimmermann, G., Hofmann, H., Stephansson, O., Min, K.-B., and Kim, K. Y.: How to Reduce Fluid-Injection-Induced Seismicity, Rock Mech. Rock Eng., 52, 475–493, https://doi.org/10.1007/s00603-018-1467-4, 2019. a, b
Zang, A., Zimmermann, G., Hofmann, H., Niemz, P., Kim, K. Y., Diaz, M., Zhuang, L., and Yoon, J. S.: Relaxation Damage Control via Fatigue-Hydraulic Fracturing in Granitic Rock as Inferred from Laboratory-, Mine-, and Field-Scale Experiments, Sci. Rep.-UK, 11, 6780, https://doi.org/10.1038/s41598-021-86094-5, 2021. a, b
Zang, A., Niemz, P., von Specht, S., Zimmermann, G., Milkereit, C., Plenkers, K., and Klee, G.: Comprehensive Data Set of In-Situ Hydraulic Stimulation Experiments for Geothermal Purposes at the Äspö Hard Rock Laboratory (Sweden), GFZ Data Services [data set], https://doi.org/10.5880/GFZ.2.6.2023.004, 2023. a, b, c
Zhuang, L., Kim, K. Y., Jung, S. G., Diaz, M., Min, K.-B., Zang, A., Stephansson, O., Zimmermann, G., Yoon, J.-S., and Hofmann, H.: Cyclic Hydraulic Fracturing of Pocheon Granite Cores and Its Impact on Breakdown Pressure, Acoustic Emission Amplitudes and Injectivity, Int. J. Rock Mech. Min., 122, 104065, https://doi.org/10.1016/j.ijrmms.2019.104065, 2019. a
Zimmermann, G., Zang, A., Stephansson, O., Klee, G., and Semiková, H.: Permeability Enhancement and Fracture Development of Hydraulic In Situ Experiments in the Äspö Hard Rock Laboratory, Sweden, Rock Mech. Rock Eng., 52, 495–515, https://doi.org/10.1007/s00603-018-1499-9, 2019. a, b, c, d