the Creative Commons Attribution 4.0 License.
the Creative Commons Attribution 4.0 License.
 | 29 May 2024
MODIS daily cloud-gap-filled fractional snow cover dataset of the Asian Water Tower region (2000–2022)
Fangbo Pan
Gongxue Wang
Jinmei Pan
Jinyu Huang
Cheng Zhang
Huizhen Cui
Jianwei Yang
Zhaojun Zheng
Shengli Wu
Jiancheng Shi
Accurate long-term daily cloud-gap-filled fractional snow cover products are essential for climate change and snow hydrological studies in the Asian Water Tower (AWT) region, but existing Moderate Resolution Imaging Spectroradiometer (MODIS) snow cover products are not sufficient. In this study, the multiple-endmember spectral mixture analysis algorithm based on automatic endmember extraction (MESMA-AGE) and the multistep spatiotemporal interpolation algorithm (MSTI) are used to produce the MODIS daily cloud-gap-filled fractional snow cover product over the AWT region (AWT MODIS FSC). The AWT MODIS FSC products have a spatial resolution of 0.005° and span from 2000 to 2022. The 2745 scenes of Landsat-8 images are used for the areal-scale accuracy assessment. The fractional snow cover accuracy metrics, including the coefficient of determination (R2), root mean squared error (RMSE) and mean absolute error (MAE), are 0.80, 0.16 and 0.10, respectively. The binarized identification accuracy metrics, including overall accuracy (OA), producer's accuracy (PA) and user's accuracy (UA), are 95.17 %, 97.34 % and 97.59 %, respectively. Snow depth data observed at 175 meteorological stations are used to evaluate accuracy at the point scale, yielding the following accuracy metrics: an OA of 93.26 %, a PA of 84.41 %, a UA of 82.14 % and a Cohen kappa (CK) value of 0.79. Snow depth observations from meteorological stations are also used to assess the fractional snow cover resulting from different weather conditions, with an OA of 95.36 % (88.96 %), a PA of 87.75 % (82.26 %), a UA of 86.86 % (78.86 %) and a CK of 0.84 (0.72) under the MODIS clear-sky observations (spatiotemporal reconstruction based on the MSTI algorithm). The AWT MODIS FSC product can provide quantitative spatial distribution information on snowpacks for mountain hydrological models, land surface models and numerical weather prediction in the Asian Water Tower region. This dataset is freely available from the National Tibetan Plateau Data Center at https://doi.org/10.11888/Cryos.tpdc.272503 (Jiang et al., 2022) or from the Zenodo platform at https://doi.org/10.5281/zenodo.10005826 (Jiang et al., 2023a).
- Article
(9609 KB) - Full-text XML
- BibTeX
- EndNote


Snow cover has the characteristics of high albedo, low emissivity and strong water-holding energy (Yang et al., 2014; Wang et al., 2022; Pan et al., 2023; Wang et al., 2023). The extent and variability of snow cover have profound implications for global and regional water and energy cycles (Elguindi et al., 2005; Senan et al., 2016) and climate change (Barnett et al., 2005; Li et al., 2018). The Asian Water Tower region centered on the Tibetan Plateau is the region with the largest snow accumulation outside the North Pole and South Pole (Immerzeel et al., 2020). In recent years, this region has been in a state of imbalance, which is mainly reflected in the massive conversion of snow (one of the two forms of solid water) into liquid water (Yao et al., 2022). Furthermore, since 2008, the snow cover in the Asian Water Tower region has surpassed the tipping point and has become unstable (Liu et al., 2023), which has a strong and stable relationship with the changes in the Amazon rainforest ecosystem. Therefore, it is important to produce long-term series and high-spatiotemporal-resolution cloud-gap-filled fractional snow cover datasets in the Asian Water Tower region.
Remote sensing technology has become an essential tool for monitoring snow cover globally. Polar orbit satellites such as NOAA/AVHRR, the Terra and Aqua Moderate Resolution Imaging Spectroradiometer (MODIS), Landsat and Sentinel-2, which are often used to monitor snow cover, have spatial resolutions ranging from meters to kilometers. Toward the requirement of daily, large-scale and long-term series of fractional snow cover monitoring, only moderate- to coarse-resolution sensors such as AVHRR and MODIS are currently available. However, multispectral images at moderate and coarse spatial resolution have mixed pixels near the snow line, the edge zone of snow patches and the forest area covered by snow (Painter et al., 2009; Pan et al., 2022; Wang et al., 2022). The classification of snow and non-snow alone will lead to significant overestimation or underestimation. Classification errors will be further transferred to subsequent applications in various fields (Wang et al., 2013; Niittynen et al., 2020; Notarnicola, 2020). The existing optical remote sensing snow cover mapping methods mainly include the reflectivity linear interpolation method (Metsämäki et al., 2012; Metsamaki et al., 2005; Wang et al., 2017), snow index empirical relationship method (Hall et al., 1995; Salomonson and Appel, 2004; Wang et al., 2021; Salomonson and Appel, 2006; Wang et al., 2020), machine learning method (Dobreva and Klein, 2011; Czyzowska-Wisniewski et al., 2015; Kuter, 2021; Xiao et al., 2022) and spectral mixture analysis method (Painter et al., 2003, 2009; Bair et al., 2021). The accuracy of the first three methods depends on the training data, and the methods need to be retrained when used in different regions and on different dates. The MEAMA-AGE algorithm is a kind of automatic extraction of pure snow and non-snow endmembers based on the single-band reflectance of MODIS multispectral images and the normalized differential snow index (NDSI), normalized differential vegetation index (NDVI) and normalized differential water index (NDWI), and then the fractional snow cover is retrieved by the MESMA-AGE algorithm (Shi, 2012; Zhu and Shi, 2018). This algorithm can ensure the representativeness of the endmember, improve the computational efficiency and effectively adapt to the characteristics of strong topographic heterogeneity and thin and broken snow, with better accuracy and robustness than other algorithms (Hao et al., 2019; Pan et al., 2022).
Terra and Aqua MODIS provides two daily daytime observations, but the MODIS annual average cloud cover in the Asian Water Tower region is approximately 50 % (Wang et al., 2019; Huang et al., 2022a). Snow cover observations can be obscured by clouds, resulting in many data gaps in daily snow cover products, which greatly limits the application of daily snow cover products. To improve the spatiotemporal continuity of snow cover products, researchers have proposed various spatiotemporal reconstruction algorithms, such as temporal methods (Dozier et al., 2008; Tang et al., 2017; Tran et al., 2019), spatial methods (López-Burgos et al., 2013; Shea et al., 2013; Hou et al., 2019), spatiotemporal methods (Li et al., 2017; Huang et al., 2018; Li et al., 2020; Xing et al., 2022) and multisource data fusion methods (Yang et al., 2014; Yu et al., 2016; Dai et al., 2017). Most existing algorithms were developed for binary snow cover products, and although they have good accuracy, they are difficult to apply to continuous values such as fractional snow cover. The multistep grouping algorithm used in this study is an improved spatiotemporal method that combines spatial and temporal methods through multistep implementations (Parajka and BlöSchl, 2008; Gafurov and Bárdossy, 2009; López-Burgos et al., 2013). These simple multistep combinations have been shown to be effective and efficient in cloud removal and agree very well with in situ observations (Paudel and Andersen, 2011).
Currently, there are various snow cover datasets for the Asian Water Tower region, such as the Interactive Multi-sensor Snow and Ice Mapping System (IMS) (Mazari et al., 2013), MODIS/Terra Snow Cover Daily L3 Global 500 m SIN Grid product (MOD10A1/MOD10A1F) (Hall and Riggs, 2016), MODIS Snow-Covered Area and Grain size product (MODSCAG) (Painter et al., 2009), Japan Aerospace Exploration Agency (JAXA) long-term snow cover extent dataset (JASMES) (Hori et al., 2017), Northwest Institute of Eco-Environment and Resources (NIEER), Chinese Academy of Sciences AVHRR/MODIS snow cover extent product (NIEER AVHRR/MODIS SCE) (Hao et al., 2021, 2022), Tibetan Plateau long-term daily gap-free snow cover product based on the Hidden Markov Random Field model (HMRFS-TP) (Huang et al., 2022a), the European Space Agency (ESA) Snow Climate Change Initiative (Snow CCI: MODIS (Nagler et al., 2022) and AVHRR (Naegeli et al., 2022. The IMS, JASMES and NIEER AVHRR SCE products are binary products and have relatively coarse resolutions. The NIEER AVHRR/MODIS SCE and HMRFS-TP products are binary, and their range cannot fully cover the Asian Water Tower area. The MODSCAG product has better accuracy, but it is not freely available. The MOD10A1 product is the most widely used, but it has data gaps, and the linear relationship between the NDSI and FSC is not always valid. The MOD10A1F product is based on the MOD10A1 product, which only replaces cloud gaps with the previous most-recent clear-sky observation, resulting in limited product accuracy (Hao et al., 2022; Stillinger et al., 2023). Compared to MODSCAG and MOD10A1, the AWT MODIS FSC product has overall better accuracy in the AWT region (Hao et al., 2019). Although Snow CCI is a fractional snow cover product, the key parameter for retrieving canopy transmittance is calculated using static forest data from the early 2000s, which makes it difficult to capture the dynamic changes in snow cover in forest areas, and it has data gaps. Therefore, there is an urgent need for a high-precision, high-spatiotemporal-resolution and long-term-series cloud-gap-filled fractional snow cover dataset to meet the growing demand for snow monitoring in the Asian Water Tower region.
This study used the MESMA-AGE algorithm and the MSTI algorithm to produce a MODIS long-term-series daily fractional snow cover dataset for the Asian Water Tower region from 2000 to 2022. This work is organized as follows: first, the study area and datasets are presented. Then, the MESMA-AGE algorithm framework, the MSTI algorithm framework and the data processing process are introduced. The two algorithms are used to produce a daily cloud-gap-filled fractional snow cover dataset for the Asian Water Tower region. Finally, the accuracy of this product is evaluated using high-spatial-resolution Landsat-8 images and meteorological station snow depth data from the China Meteorological Administration (CMA).
2.1 Study area
The Asian Water Tower region consists mainly of the Pamir Plateau, Xinjiang and the Qinghai–Tibet Plateau in China (Fig. 1). The latitude and longitude ranges are 24–54° N and 60–106° E, respectively, with an average elevation of over 4000 m. The Asian Water Tower region is the birthplace of more than 10 major rivers in Asia, sustaining nearly 2 billion people in its vicinity (Immerzeel et al., 2020; Li et al., 2022). In the Asian Water Tower region, the monthly average snowmelt runoff ratio is greater than 30 % in more than half of the months, far exceeding the surrounding area (Yang et al., 2022). Over the past 50 years, the temperature in the Asian Water Tower region has increased by an average of 0.3 to 0.4 °C per 10 years, which is twice the global average rate (Barnett et al., 2005; Kraaijenbrink et al., 2017). As one of the most important climate response factors (Liu and Chen, 2000; Immerzeel et al., 2010), the distribution and change in snow cover are of great importance for the study of climatic and ecological changes across the region. Meanwhile, fractional snow cover data are important input for the Snowmelt Runoff Model (SRM) (Martinec, 1975) and can also be used for snow water equivalent reconstruction and optimization (Rittger et al., 2016). Therefore, a set of high-precision fractional snow cover products is necessary for hydrological simulation and hydrological applications in the Asian Water Tower region.
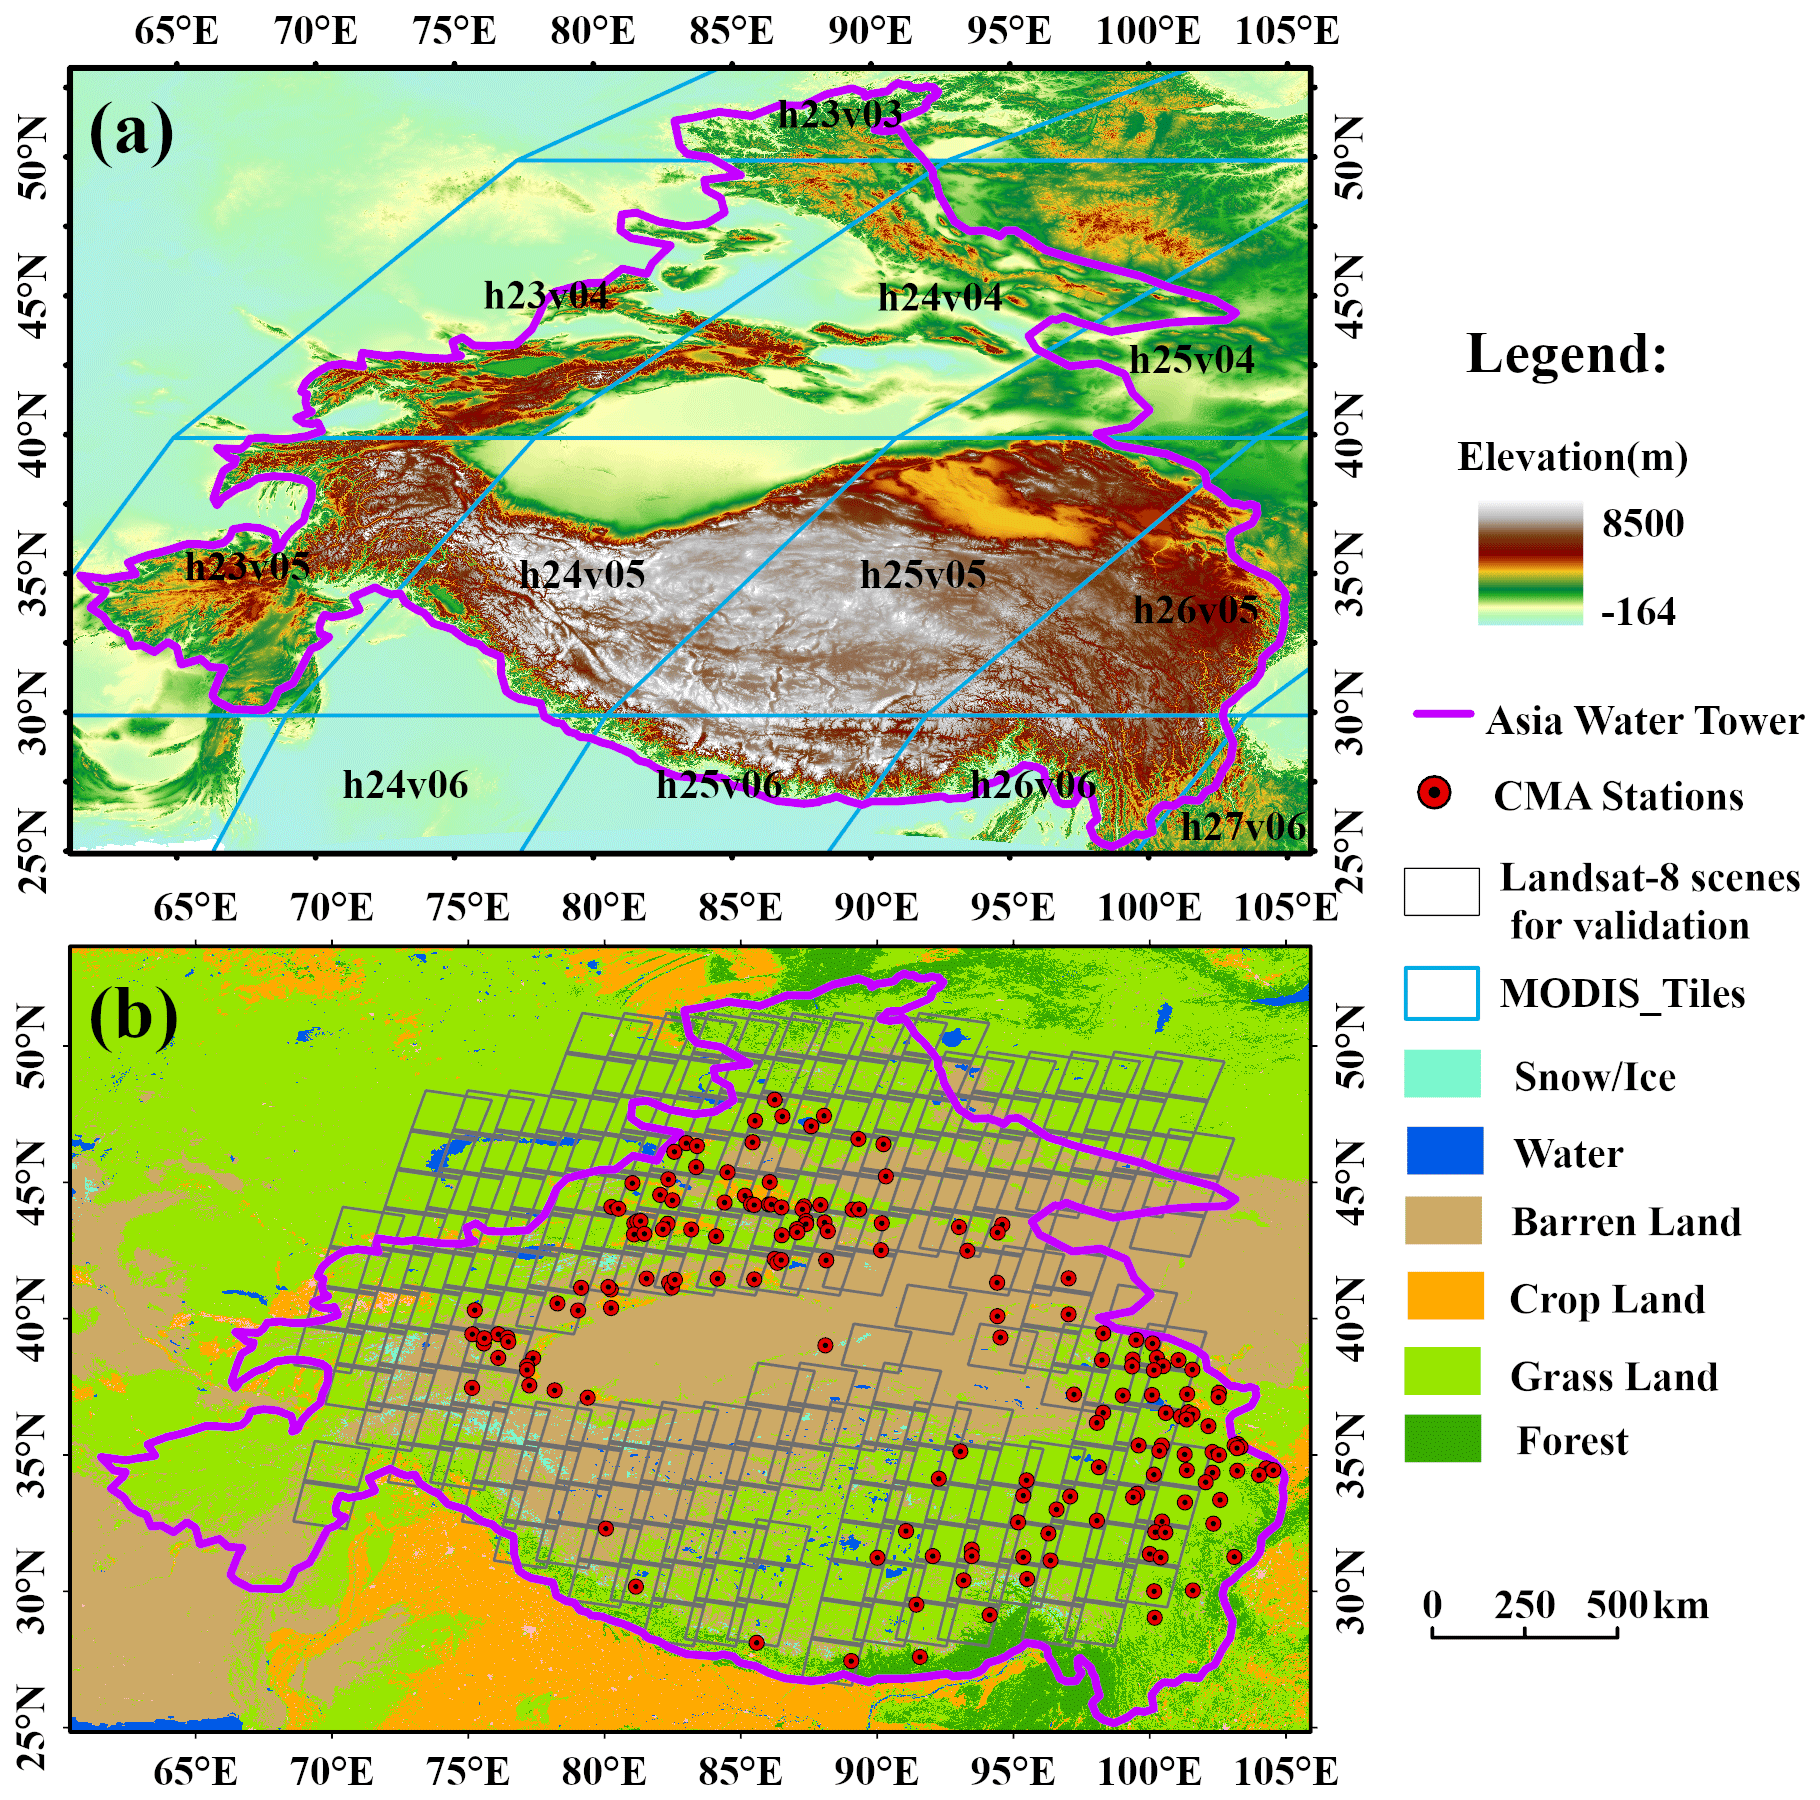
Figure 1DEM (a) and land cover (b) maps of the AWT with the positions of the MODIS tiles, Landsat scenes and CMA stations used in the validation.
2.2 MODIS surface reflectance data
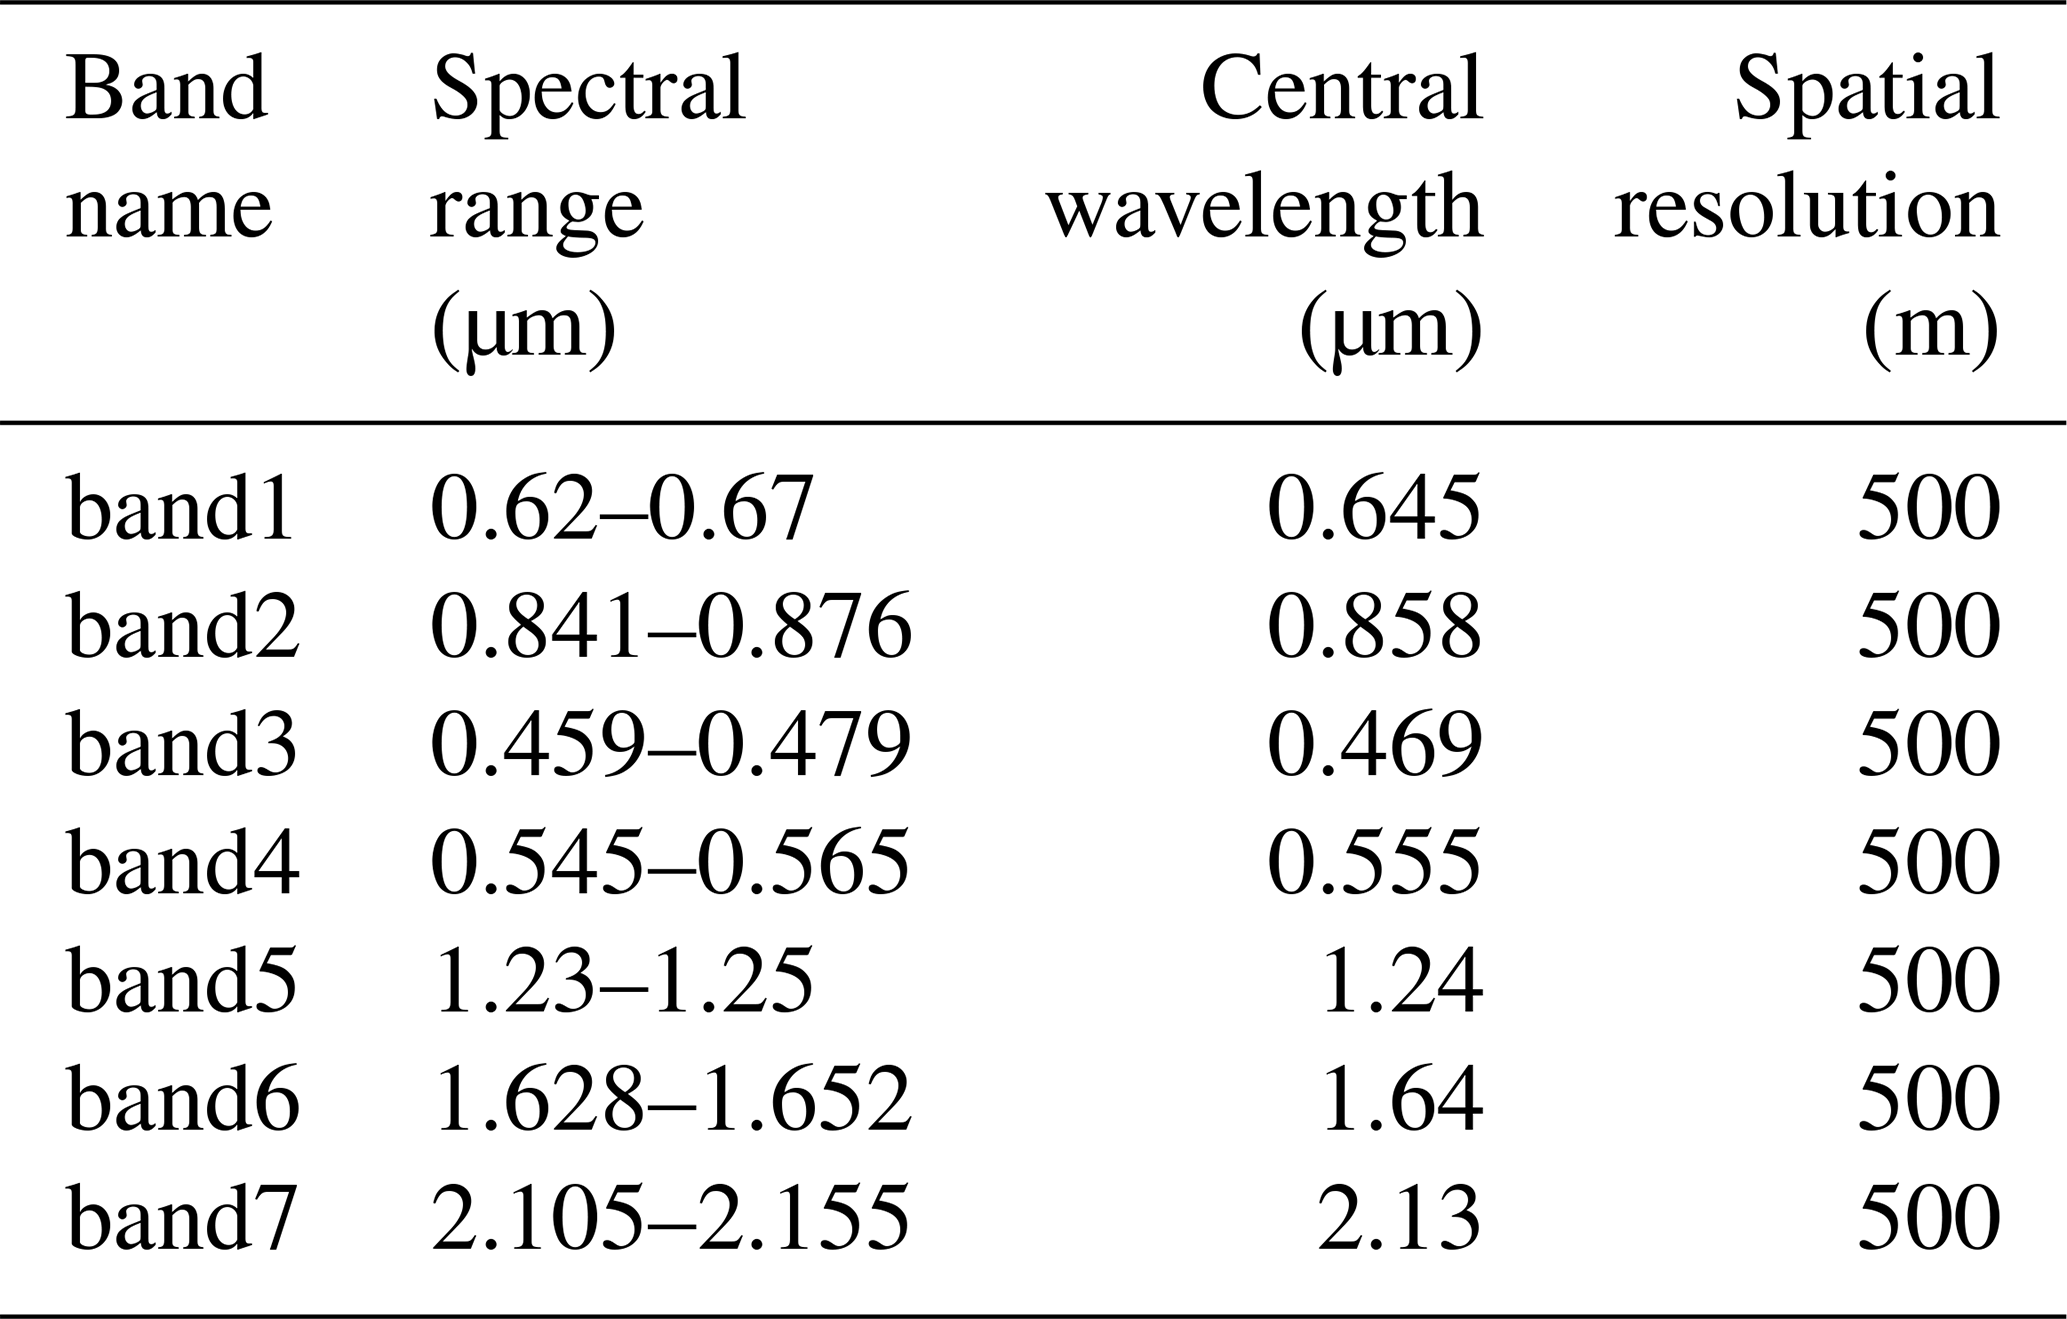
This study used MODIS surface reflectance products MOD09GA and MYD09GA in Collection 6 spanning from 2000 to 2022. These surface reflectance products have two data layers. The 500 m reflectance data layer provides reflectance, quality assessment level, observation area, observation number and 250 m scan information for bands 1–7. The 1 km geographic information data layer provides additional information, such as observation times, quality assessment levels, sensor azimuth zenith angles, solar azimuth altitude angles and orbit pointers. In addition, it also includes metadata information of the file (production information, geographical scope, etc.). The characteristics of MODIS solar reflective bands are shown in Table 1. The cloud information used in this study was obtained from the “state_1km” layer, which includes “cloud state” not being a clear and “cirrus detected” being a high. Moreover, 12 MODIS tiles (“h23v03”, “h23v04”, “h23v05”, “h24v04”, “h24v05”, “h24v06”, “h25v04”, “h25v05”, “h25v06”, “h26v05”, “h26v06” and “h27v06”) with sinusoidal projection were used in this study, as shown in Fig. 1a.
2.3 Landsat-8 images
This study used the Google Earth Engine (GEE) cloud platform to select a total of 2745 scenes of Landsat-8 images from 2013 to 2021 that met the cloud coverage ratio of less than 10 % and the snow coverage ratio of more than 30 % as “ground truth” to validate our fractional snow cover product. Landsat-5 Thematic Mapper (TM) has obvious attenuation since 2000, and the Landsat-7 Enhanced Thematic Mapper Plus (ETM+) sensor has been affected by striping in 25 % of the image area due to scanner failure since June 2003. Therefore, this study mainly focused on Landsat-8 images to evaluate the accuracy of the AWT MODIS FSC dataset. To better evaluate the MESMA-AGE algorithm and the AWT MODIS FSC product, this study also applied the MESMA-AGE algorithm to retrieve Landsat-8 fractional snow cover, which has been demonstrated to have good accuracy on Landsat-8 using higher-resolution Gaofen-2 imagery with an OA of 94.46 % and an RMSE of 0.094 (Hao et al., 2019). The Landsat-8 fractional snow cover results at 30 m were resampled to the resolution of the AWT MODIS FSC product (0.005°) through aggregation and averaging. Subsequently, the Landsat fractional snow cover results at 0.005° resolution were used to assess the accuracy of the MODIS clear-sky retrieval results in the AWT MODIS FSC product.
2.4 Ground snow depth measurements
As Landsat images can only assess accuracy under a clear sky, this study chose to use snow depth data from meteorological stations to support the validation of the accuracy of the spatiotemporal reconstruction results under cloud cover. This study used a total of 175 in situ stations provided by the China Meteorological Administration in the Asian Water Tower region from 26 February 2000 to 30 April 2019, as shown in Fig. 1b. Figure 1b shows that the in situ stations are more evenly distributed in the southeast of the Qinghai–Tibet Plateau, Tianshan Mountains and Altay Mountains, where seasonal snow is prevalent. Snow depth data are measured in an open field at 08:00 UTC/GMT + 8 (Beijing time). using a professional meter ruler. If the fractional snow cover is greater than 50 % and the snow depth is greater than 1 cm, it is considered snow and recorded. The geographical coordinates, time of observation and snow pressure are also recorded. Snow depth data can only be used to evaluate binarized snow products, whereas the AWT MODIS FSC products are binarized by re-classifying the image pixels with small fractional snow cover as no snow, and smaller snow depths tend to have greater uncertainty (Ault et al., 2006; Ke et al., 2016; Zhang et al., 2019; Wang et al., 2022). Therefore, this study refers to previous studies to binarize the snow depth data with a threshold of 3 cm in the AWT region (Yang et al., 2015; Zhang et al., 2019; Huang et al., 2022a, b); i.e., snow depths less than 3 cm are classified as no snow and those greater than 3 cm are classified as snow. To further illustrate the accuracy of snow identification, this study excluded stations with snow depths greater than 1 cm but snow cover days less than 20 (Zhang et al., 2020; Hao et al., 2021).
2.5 Auxiliary data
To better evaluate the accuracy of the MESMA-AGE algorithm and the AWT MODIS FSC product, auxiliary information, such as elevation and the land cover type of the Asian Water Tower region, was used. The GEE cloud platform provided the MCD12Q1 V6.1 annual International Geosphere-Biosphere Programme (IGBP) classification data (Sulla-Menashe et al., 2019). The surface types were further divided into four categories: bare land, grassland, forest and plateau mountain. The GEE cloud platform was utilized to obtain Shuttle Radar Topography Mission (STRM) digital elevation model (DEM) data. The DEM data were then resampled from 90 m to the 0.005° resolution of the AWT MODIS FSC product (Reuter et al., 2007).
Figure 2 shows the flowchart of the AWT MODIS FSC production. According to the accuracy evaluation of the MOD10A1, MODSCAG and MODAGE fractional snow cover products in the Qinghai–Tibet Plateau region, the MODAGE product had the highest accuracy (Hao et al., 2019). Therefore, the MODAGE fractional snow cover retrieval algorithm (MESMA-AGE algorithm) was selected for the fractional snow cover retrieval of Terra and Aqua MODIS surface reflectance version 6 data in the Asian Water Tower region. Second, based on the Terra/MODIS fractional snow cover retrieval results, the Aqua/MODIS fractional snow cover retrieval results were used to fill in data gaps due to clouds and missing observations (Li et al., 2014). Third, the Geospatial Data Abstraction Library (GDAL) was used to re-project and mosaic the fractional snow cover retrieval results of 12 MODIS tiles (Rouault et al., 2024). Fourth, the MSTI algorithm was developed to perform spatiotemporal interpolation on pixels with cloud cover or missing data, enabling the generation of a daily cloud-gap-filled fractional snow cover product. Finally, accuracy evaluation and algorithm optimization of the MESMA-AGE algorithm and the AWT MODIS FSC product were performed using snow depth data from meteorological stations and Landsat-8 imagery.
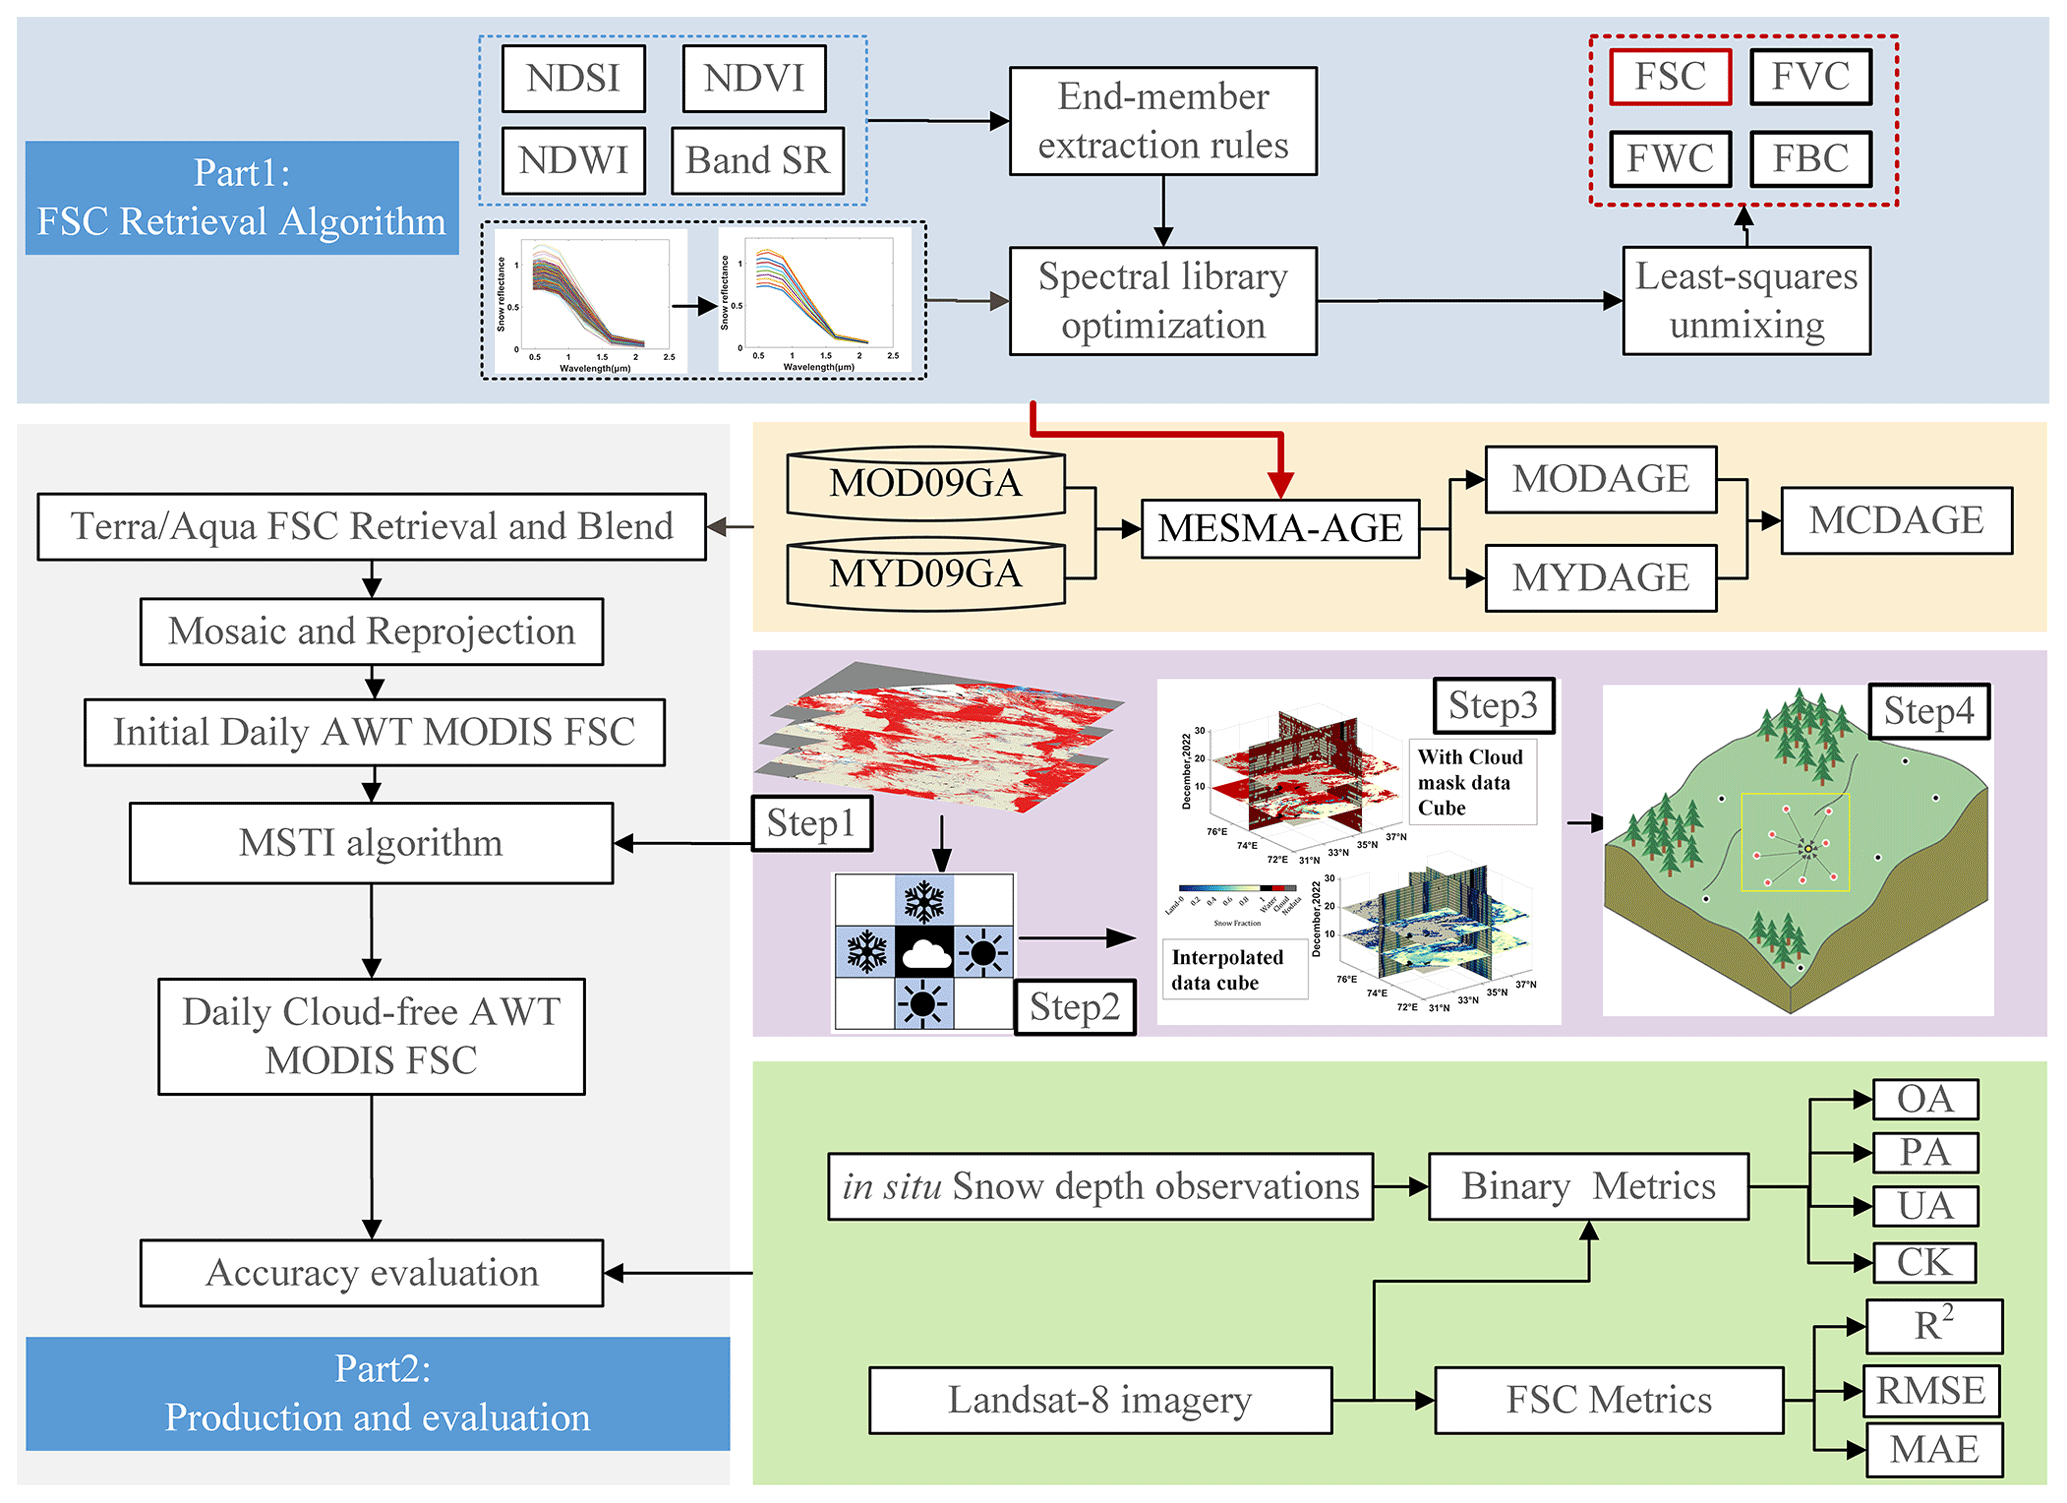
Figure 2Overall flowchart of the AWT MODIS FSC product.
3.1 MESMA-AGE algorithm
When a pixel contains information from multiple surface types, it is called a mixed pixel, whereas a pixel containing only one type of ground object can be called an endmember of that surface type. The algorithm for unmixing mixed pixels is mainly based on the linear combination of the spectral information of the endmember (Roberts et al., 1998). To analyze the spectral information combination of a pixel, a linear spectral mixing analysis model can be used, which assumes that different endmember energies only undergo single scattering mixing and that there is no nonlinear mixing process (Painter et al., 2003). The linear spectral mixing analysis expression and constraints can be expressed as Eqs. (1)–(3).
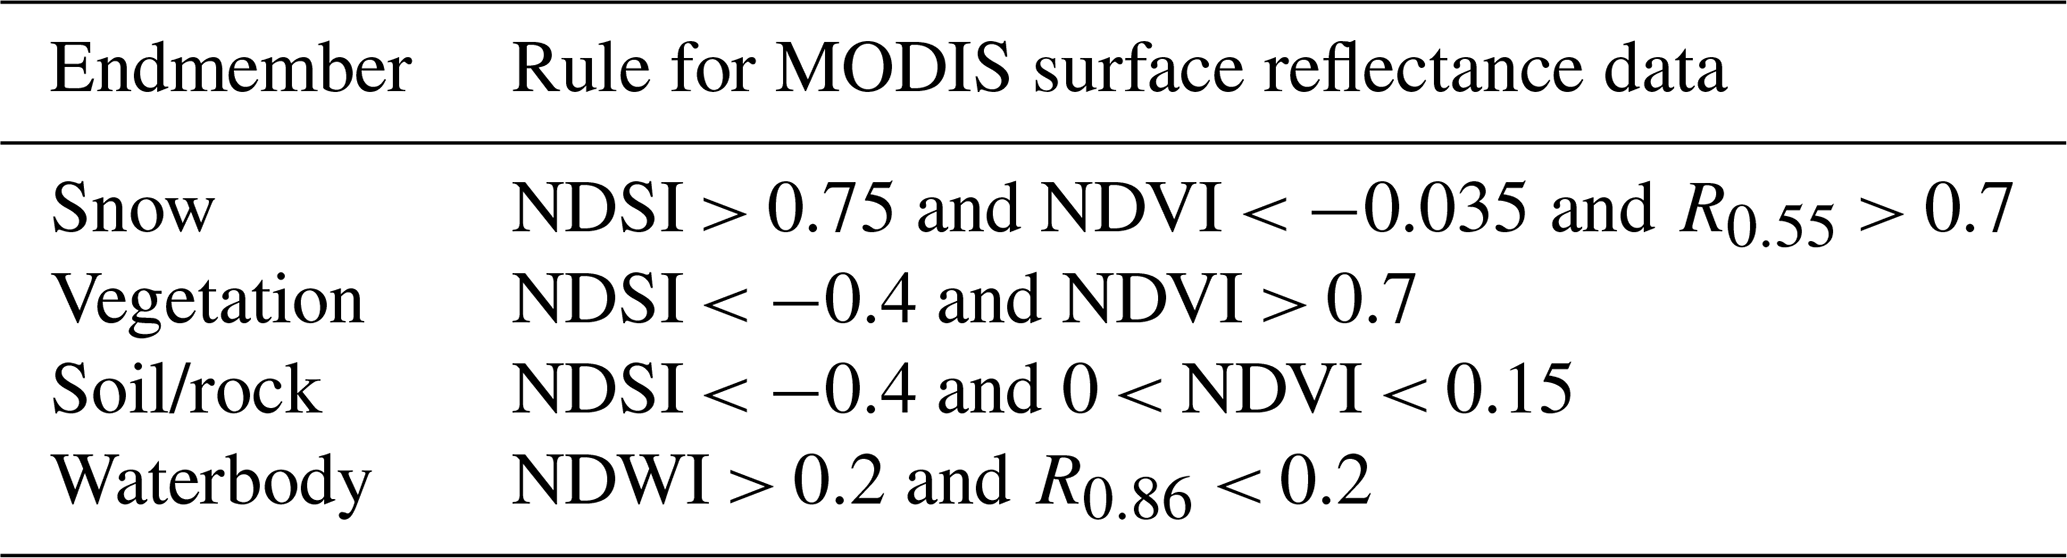
Painter et al. (2003) established an endmember spectral library by collecting spectra of various types of vegetation, rocks, soils and lake ice from the field and lab and optimized the endmember metadata of the snow cover of different grain sizes using radiative transfer models. They then used this spectral library with MODIS images to produce MODSCAG (Painter et al., 2009). Due to the phenomenon of “the same object with different spectra”, spectra from limited observation conditions in the field and lab have difficulty representing the actual complex surface. Meanwhile, the spectrum simulated by the Mie/DISORT model can represent the reflection characteristics of snow under different snow property and observation conditions, but it is also susceptible to the simulation errors of the model itself. In this study, the MEAMA-AGE algorithm was used to retrieve the fractional snow cover in the Asian Water Tower region, which combines an image-based automatic endmember extraction algorithm (Shi, 2012) with a spectral library optimization method (Xu et al., 2015). The MESMA-AGE algorithm can improve the computational efficiency while ensuring the representativeness of the endmembers (Hao et al., 2019). Considering that if the image area is too large, the representativeness will be limited if only one set of endmember libraries is used, this study performs the FSC retrieval independently for each MODIS tile during the retrieval process. The rules for extracting snow and non-snow endmembers are shown in Table 2.
Table 2Endmember extraction rule of the MESMA-AGE algorithm (Shi, 2012; Hao et al., 2019).
For this study, 42 033 samples were selected from the MODIS data in January, November and December of 2001, 2005, 2010, 2015 and 2020. The sample types include snow (14 756 samples), vegetation (6968 samples) and soil (20 309 samples). The samples were used to create the ground object feature map (Fig. 3). The x axis in Fig. 3 is the NDSI value, and the y axis is the NDVI. The endmember extraction rules outlined in Table 2 effectively identify and isolate regions located at the geometric vertices within the two-dimensional scatter plots in Fig. 3.
3.2 Multistep spatiotemporal interpolation algorithm
This study developed a multistep cloud removal algorithm that combines temporal and spatial information. The MSTI algorithm prioritizes the use of nearby spatiotemporal information based on the characteristics of snow cover and achieves complete cloud removal for still-cloudy pixels by further expanding their spatiotemporal range. This algorithm is mainly divided into four steps: temporal filtering with a 3 × 3 temporal window, 4 × 4 spatial interpolation, a piecewise cubic Hermite interpolating polynomial (PCHIP) for the 19 d period, and further spatial interpolation using a 11 × 11 window. The process is shown in the MSTI algorithm flowchart in Fig. 2.
-
The temporal filtering algorithm assumes that FSC does not change during a short period (Hou et al., 2019). In previous studies, the size window of the adjacent time filter ranged from 1 to 8 d. Due to the unique climate conditions and terrain conditions of the Asian Water Tower (high wind speeds can easily redistribute snow, and thin layers of snow can melt and sublime quickly), the snow cover changes rapidly. Therefore, choosing a longer time window may introduce errors. In this study, the time window of the adjacent time filtering algorithm was set to 3 d (the day of cloud cover and the day before and after cloud cover). If a given pixel is covered by clouds and there are no clouds before and after 2 d, the FSC value of the cloud pixel can be calculated using the following formula:
where is the predicted FSC value of cloud pixels (x,y) at time T, is the observed FSC value of cloud-free pixel (x,y) at time T−1, and is the observed FSC value of cloud-free pixel (x,y) at time T+1.
-
Based on the continuity of snow cover in spatial continuity, snow cover can be interpolated based on information from non-cloud pixels around a cloud pixel (Gafurov and Bárdossy, 2009; Paudel and Andersen, 2011; Lindsay et al., 2015). Considering the situation where there are at least 3 identical pixels in the 4 pixels adjacent to a cloud pixel, the cloud pixel discrimination rule is as follows: if at least 3 of the 4 pixels above, below, left and right of a cloud pixel are covered with snow, the central cloud pixel is assigned the mean FSC of the snow pixels in the adjacent 8 pixels. If at least 3 out of the 4 pixels above, below, left and right of a cloud pixel are land, the central cloud pixel is assigned as land. In other cases, the pixels retain their cloud pixel values.
-
For the remaining cloud pixels after the previous two steps, the PCHIP algorithm is used to interpolate the time series of the missing data. Compared with the spline curve used in previous studies (Dozier et al., 2008; Z. Tang et al., 2013, 2022), which uses the whole sequence information to fit an equation, the PCHIP algorithm (Fritsch and Carlson, 1980) divides the time series into several sub-intervals, and the fitting equation for this sub-interval can be obtained only by using the two endpoints of the sub-intervals and their derivative values. This can also make the results more conformal since the adjacent sub-intervals share an endpoint and a derivative. Therefore, the PCHIP algorithm can adaptively select a suitable time window for interpolation according to the cloud persistence days (CPDs), which ensures the monotonicity of the interpolation result and allows it to achieve spatiotemporally continuous fractional snow cover while suppressing the effects of noise. Through statistical analysis of the CPDs in the Asian Water Tower region over the past approximately 20 years, 96.58 % has less than 19 d of cloud cover. Therefore, the time window selected for this study was set to 9 d before and after the presence of cloud cover pixels.
The PCHIP algorithm assumes that the known function f(x) satisfies f(xi)=fi and at n+1 distinct nodes on the interpolation interval [a, b]. A segmented cubic Hermite interpolation function G(x) can be constructed to satisfy Eqs. (5), (6) and (7).
The expression of G(x) between cells can be directly obtained from the above conditions:
where xk and xk+1 are the positions of two adjacent time points to be interpolated, yk and yk+1 are the FSC corresponding to the two observations before and after the corresponding interpolation point, and and are the corresponding derivatives.
-
After the first three steps of spatiotemporal interpolation, there are still a few cloud pixels left. In this study, the observation information from the 11×11 interpolation window centered on the cloud pixel was used based on the inverse distance weight (IDW) interpolation algorithm, which considers elevation information for spatial interpolation. The IDW interpolation algorithm is an important application of the first law of geography, which uses the distance between the interpolation point and the sample point as the weight for weighted averaging (Zhao et al., 2022). The closer the interpolation point, the greater the weight assigned to the sample point. According to existing studies, elevation is important for the distribution of fractional snow cover (Li et al., 2017), but traditional IDW algorithms only consider spatial distance. Therefore, this study incorporated the influence of elevation on fractional snow cover on this basis. The SNOWL method is a commonly used algorithm for spatiotemporal interpolation of snow cover, and scholars often use 100 m as the interval (Huang et al., 2016; Li et al., 2017). Therefore, this study mainly used clear-sky pixel information within the range of elevation differences less than 100 m around the pixels. The process of the IDW interpolation algorithm considering elevation information is described in Eqs. (9), (10) and (11):
where (x,y) is the position of the cloud pixel, (xi,yi) are the observing pixel positions for the surrounding clear-sky pixels, di is the distance between the sample point and the position to be interpolated, ΔEi is the weight of the ith sample point obtained based on elevation, ΔElevi is the elevation difference, wi is the weight of the ith sample point, FSC(xi,yi) is the fractional snow cover for clear-sky pixels, and FSC(x,y) is the interpolated fractional snow cover for the cloud pixel.
Figure 3The NDSI and NDVI pattern of vegetation, soil/rock and snow endmembers from MODIS images.
3.3 Evaluation metrics
Selected metrics for validation of the AWT MODIS FSC product included the OA, PA, UA, Cohen kappa (CK), R2, RMSE and MAE, which are defined below:
where TP indicates true positive, TN indicates true negative, FP indicates false positive, FN indicates false negative, fest indicates fractional snow cover estimation derived from MODIS, and, similarly, fref indicates the reference fractional snow cover derived from Landsat-8. To calculate the overall accuracy, binary snow cover was labeled for pixels with fractional snow cover ≥ 15 %, as the error for FSC less than 15 % would probably be larger because the spectral signal from snow is diminished with mixing from other land covers and cloud or snow misjudgments are more severe in areas with less snow (Painter et al., 2009; Rittger et al., 2013, 2021; Selkowitz et al., 2017; Key et al., 2020; Hall and Riggs, 2007; B.-H. Tang et al., 2013).
In this study, a comprehensive evaluation of the accuracy of the AWT MODIS FSC product in two dimensions, i.e., binary and fractional snow cover, was conducted. The binary and fractional snow cover accuracies of the AWT MODIS FSC product were quantitatively assessed under three different conditions: overall, different surface types and altitudes. This evaluation was conducted using 2745 Landsat-8 images. Additionally, the binary accuracies of the AWT MODIS FSC product were specifically evaluated under three different conditions, i.e., overall (including clear and cloudy conditions), clear sky and cloud cover, utilizing snow depth data from 175 meteorological stations.
4.1 Validation with Landsat-8 images
4.1.1 Overall results
In this study, the 2745 Landsat-8 scenes were used as ground truth to quantitatively evaluate the AWT MODIS FSC product obtained from clear sky in two dimensions: binary (OA, PA and UA) and fractional snow cover (R2, MAE and RMSE). Figure 4 shows violin charts of the accuracy evaluation metrics, and the violin charts of each accuracy metric are composed of two parts: the outer violin chart and the inner box plot. The left side of the outer violin chart is the kernel density map. The larger the area of a certain range, the greater the probability of the distribution near a certain value, and the horizontal line in the left area is where the median is located. To the right of the violin plot is a histogram of the frequency of a value; i.e., the longer the line is, the more points there are for that value. The internal box plot contains a gray rectangle consisting of the upper and lower quartiles, with the mean position represented by the white point. From Fig. 4, the minimum OA value of the AWT MODIS FSC product is 80.38 %, and the average value is 95.17 %. The minimum PA value is 58.71 %, and the average value is 97.34 %; i.e., the average omission error of this product is 2.66 %. The minimum UA value is 67.02 %, and the average value is 97.59 %; i.e., the average commission error is 2.41 %. The R2 value distribution range is 0.40–0.97, and the average value is 0.80. The MAE ranges from 0.01 to 0.23, with an average of 0.10. The RMSE ranges from 0.02 to 0.26, with an average of 0.16. The above results provide a good illustration of the consistency of the AWT MODIS FSC product with the ground truth data.
Figure 4Violin charts for the accuracy evaluation metrics of the AWT MODIS FSC product validated by Landsat images.
To better explore the interannual differences in each accuracy metric, this study divided the 2745 Landsat-8 scenes by year. Figure 5 shows the interannual distribution of each accuracy metric, and Table 3 shows the number of Landsat images and the interannual average of each accuracy metric. Figure 5 and Table 3 show that the interannual means of the OA range from 92.41 % to 96.22 %, PA from 94.77 % to 97.88 %, UA from 95.35 % to 98.55 %, R2 from 0.76 to 0.81, MAE from 0.09 to 0.11 and RMSE from 0.15 to 0.17. The accuracy metrics perform better except for 2013, where the poor accuracy indicators are mainly due to the overall low number of validation data and the fact that a significantly larger proportion of the validation data are located at high altitudes in mountainous areas than in other years. The results of this part of the retrieval are strongly influenced by topographical effects.
Table 3The number of Landsat images and the interannual average of each accuracy metric.
4.1.2 Evaluation for different land surface types
Spectra of the snow-covered surface also encounter the impacts of land cover type. In particular, in forested areas, snow below the forest canopy is difficult to observe with spaceborne sensors because the forest blocks the visible, near-infrared and shortwave infrared bands (Wang et al., 2021, 2023). Therefore, in this study, 2745 scenes of Landsat-8 images were divided into four categories according to land surface types, i.e., the grassland area (1500 scenes), bare land area (264 scenes), forest area (410 scenes) and mountain area of the Himalayas and Pamir Plateau (571 scenes). The accuracy evaluation metrics under the two dimensions of binary value and fractional snow cover of the four land surface types are shown in Fig. 6. Regarding the accuracy metrics of binarization, the accuracy of the grassland area is better than that of other land surface types, and its average OA is 95.99 %, while the bare land area is the worst but also reaches 93.69 %. This is because the bare land area is mainly the hinterland of the Asian Water Tower region, which is mainly desert (Gobi) with little vegetation growth, and there are also many large and small lakes distributed in this area. The bright land and the winter water surface lead to deviations in the retrieval algorithm. In addition, the snow in this region is relatively broken, and the observation scales of MODIS and Landsat are quite different, making it difficult for MODIS to capture the broken snow information as effectively as Landsat. These two reasons lead to many errors in the results. The UA also illustrates this problem well. Figure 6 shows that the average UA of bare land is only 94.06 %, approximately 4 % lower than that of the other surface types. From the perspective of fractional snow cover accuracy metrics, grassland and forest are slightly worse, mainly because it is difficult to observe the snow signal shielded by the vegetation canopy at the MODIS scale. Previous studies have demonstrated that canopy adjustment using fractional vegetation cover (FVC) can enhance the accuracy of observations in such areas (Raleigh et al., 2013; Rittger et al., 2020; Xiao et al., 2022). Therefore, future relevant studies can utilize mature FVC products for canopy adjustment to fulfill research requirements. For snow mapping in areas with high forest cover, we recommend using URSI (Wang et al., 2021) or NDFSI (Wang et al., 2020), which are more sensitive indicators, to replace NDSI to ensure accuracy.
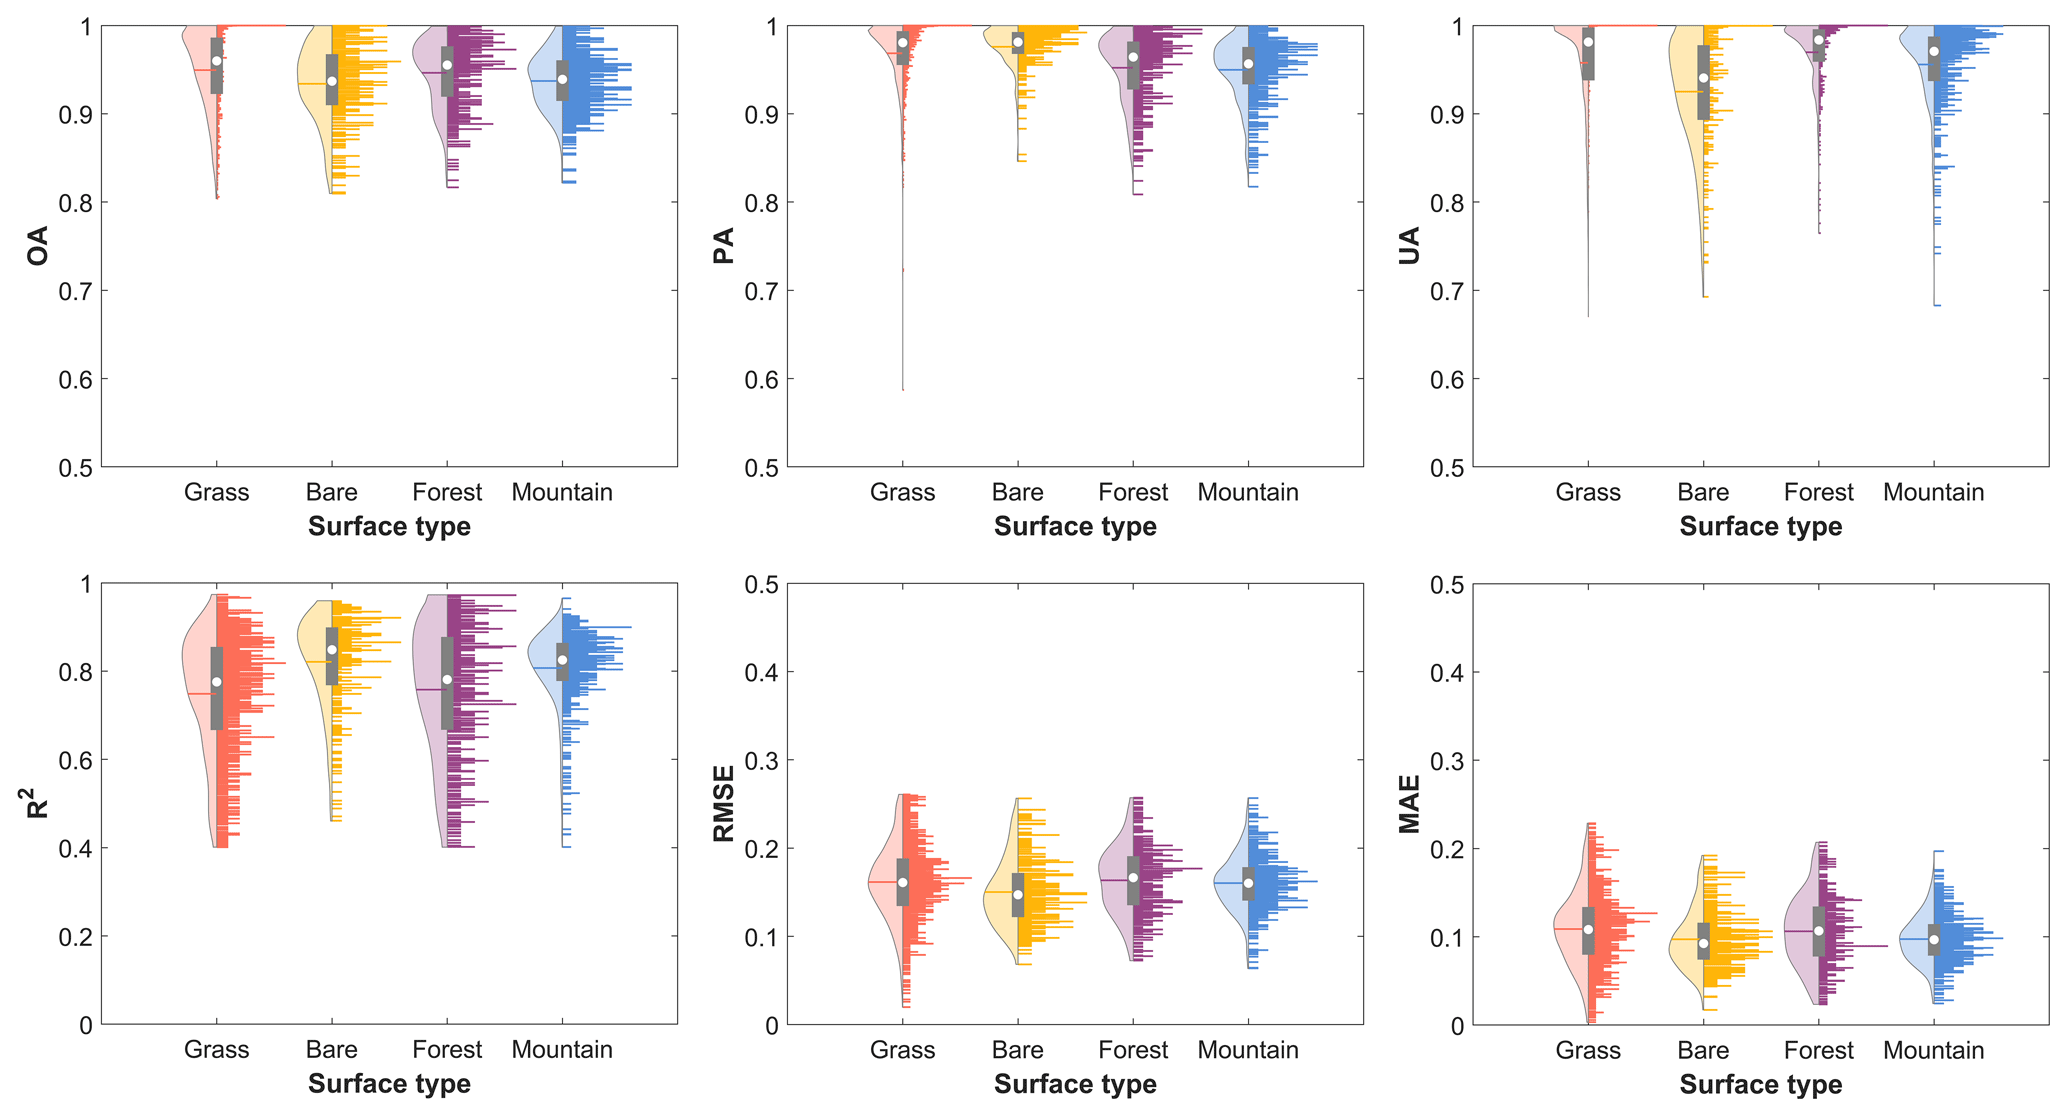
Figure 6Violin charts for accuracy evaluation metrics of the AWT MODIS FSC product validated by Landsat images under different surface types.
4.1.3 Evaluation for different altitudes
Topographic effects challenge accurate snow cover mapping with optical imagery as well. The snow cover products such as MOD10A1 have reported uncertainties related to altitudes (Zhang et al., 2020; Wu et al., 2021; Huang et al., 2022a). Therefore, the 2745 Landsat-8 images are divided into four sections according to altitude, i.e., < 3 km (1603 scenes), 3–4 km (395 scenes), 4–5 km (355 scenes) and > 5 km (392 scenes). The results of the accuracy evaluation metrics according to different heights are shown in Fig. 7. As shown in Fig. 7, both binary and fractional snow cover accuracy metrics show a decreasing trend with increasing altitude. The areas smaller than 3 km are mostly distributed in northern Xinjiang, China, i.e., the area north of 40° N, where the snow distribution is relatively concentrated, and the surface type is mostly grassland with a small amount of forest, so the accuracy is highest. The three elevation regions greater than 3 km are mainly distributed in the Tianshan Mountains, the Pamir Plateau and the Tibetan Plateau. Snow fragmentation and topographic heterogeneity in these regions increase with altitude. This results in a slight reduction in the accuracy of the AWT MODIS FSC product.
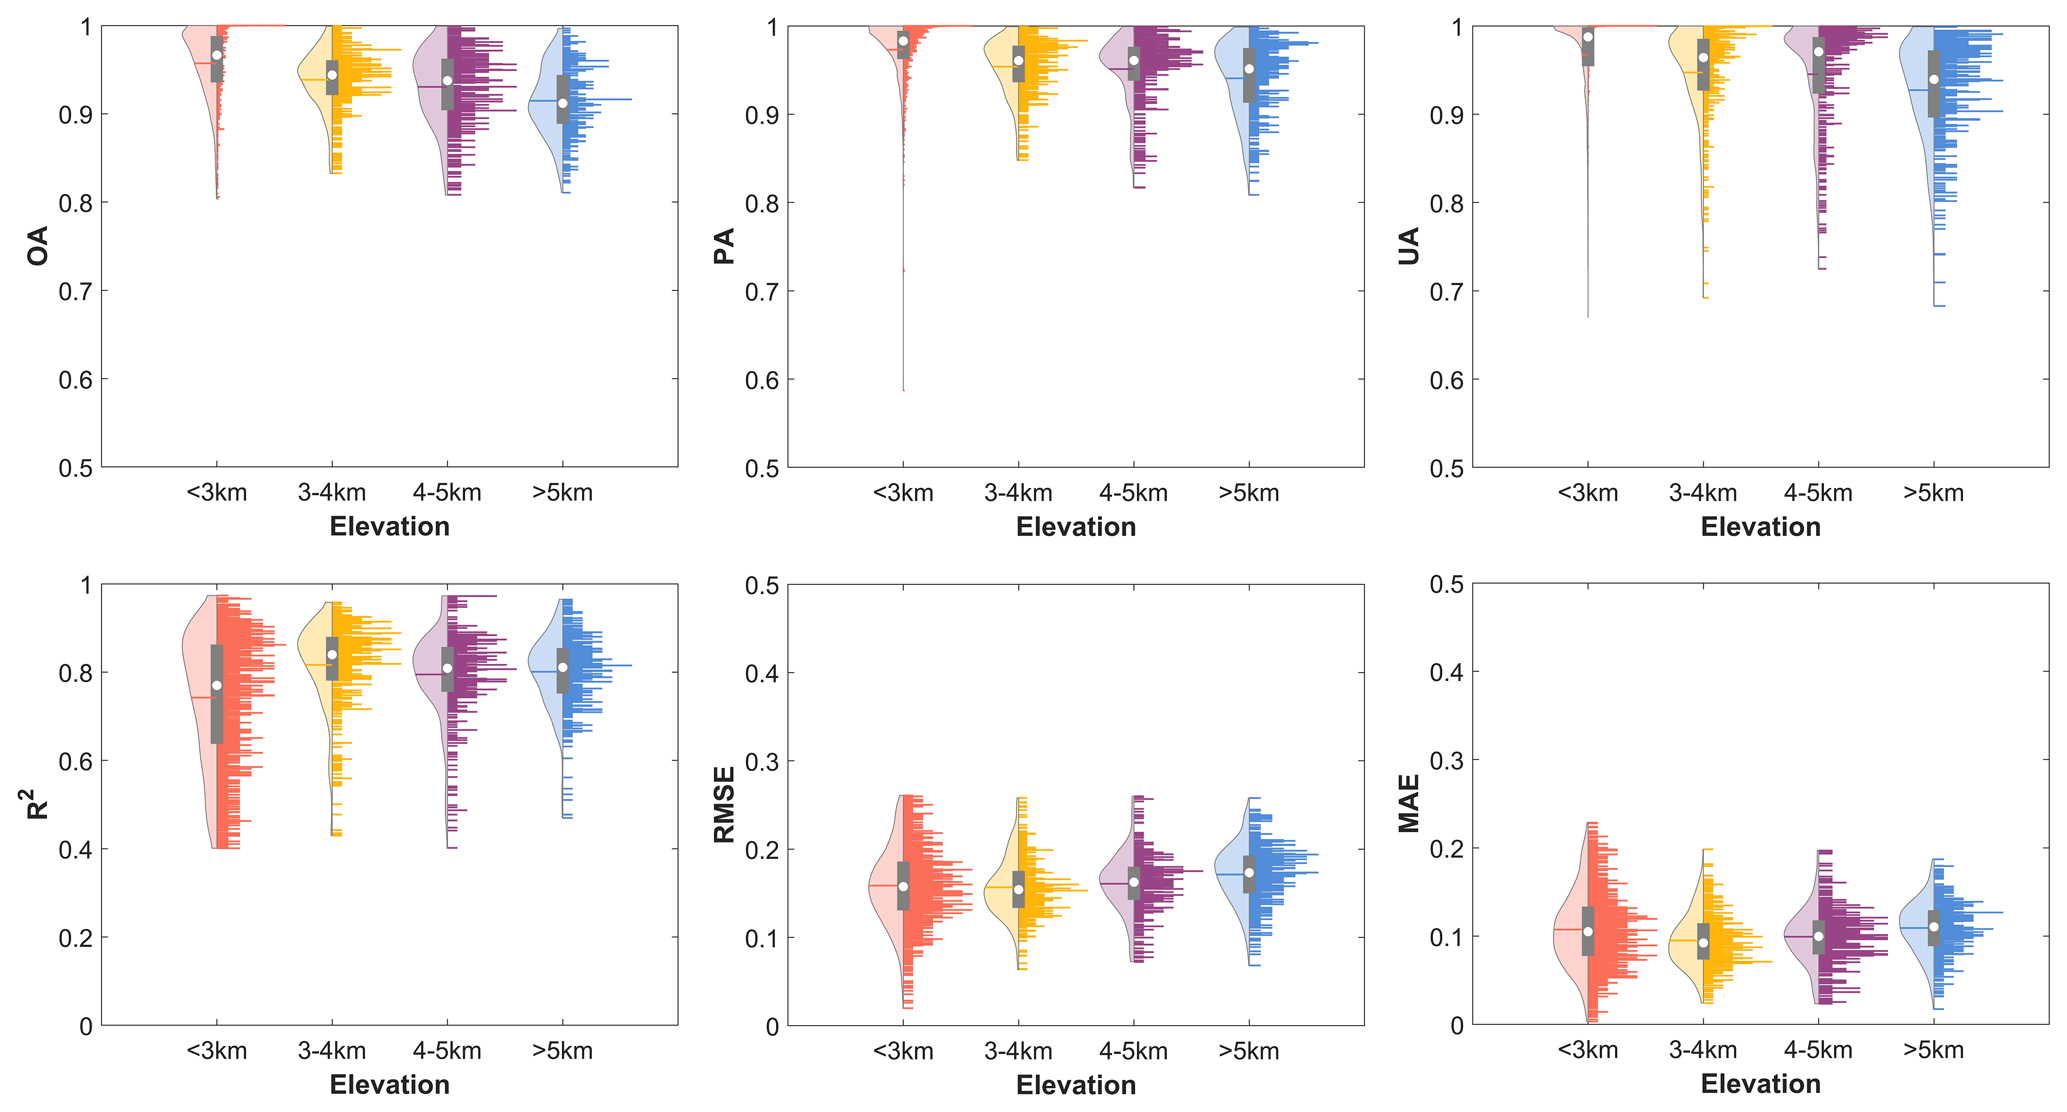
Figure 7Violin chart for accuracy evaluation metrics of the AWT MODIS FSC product validated by Landsat at different altitudes.
4.2 Validation with in situ snow depth measurements
Landsat images can only be used to evaluate the accuracy of the fractional snow cover retrieval algorithm and FSC product under clear-sky conditions, and the fractional snow cover information reconstructed by the MSTI algorithm needs to be verified by snow depth observations at meteorological stations. Therefore, this study used a total of nearly 1 million observations collected from 175 in situ stations during the period from 26 February 2000 to 30 April 2019 to evaluate the accuracy under different weather conditions. The number of meteorological stations and SD observations obtained each year are shown in Fig. 8. The number of stations fluctuates to some extent each year, and the number of snow depth observations available after 2014 has nearly tripled compared with before 2014.
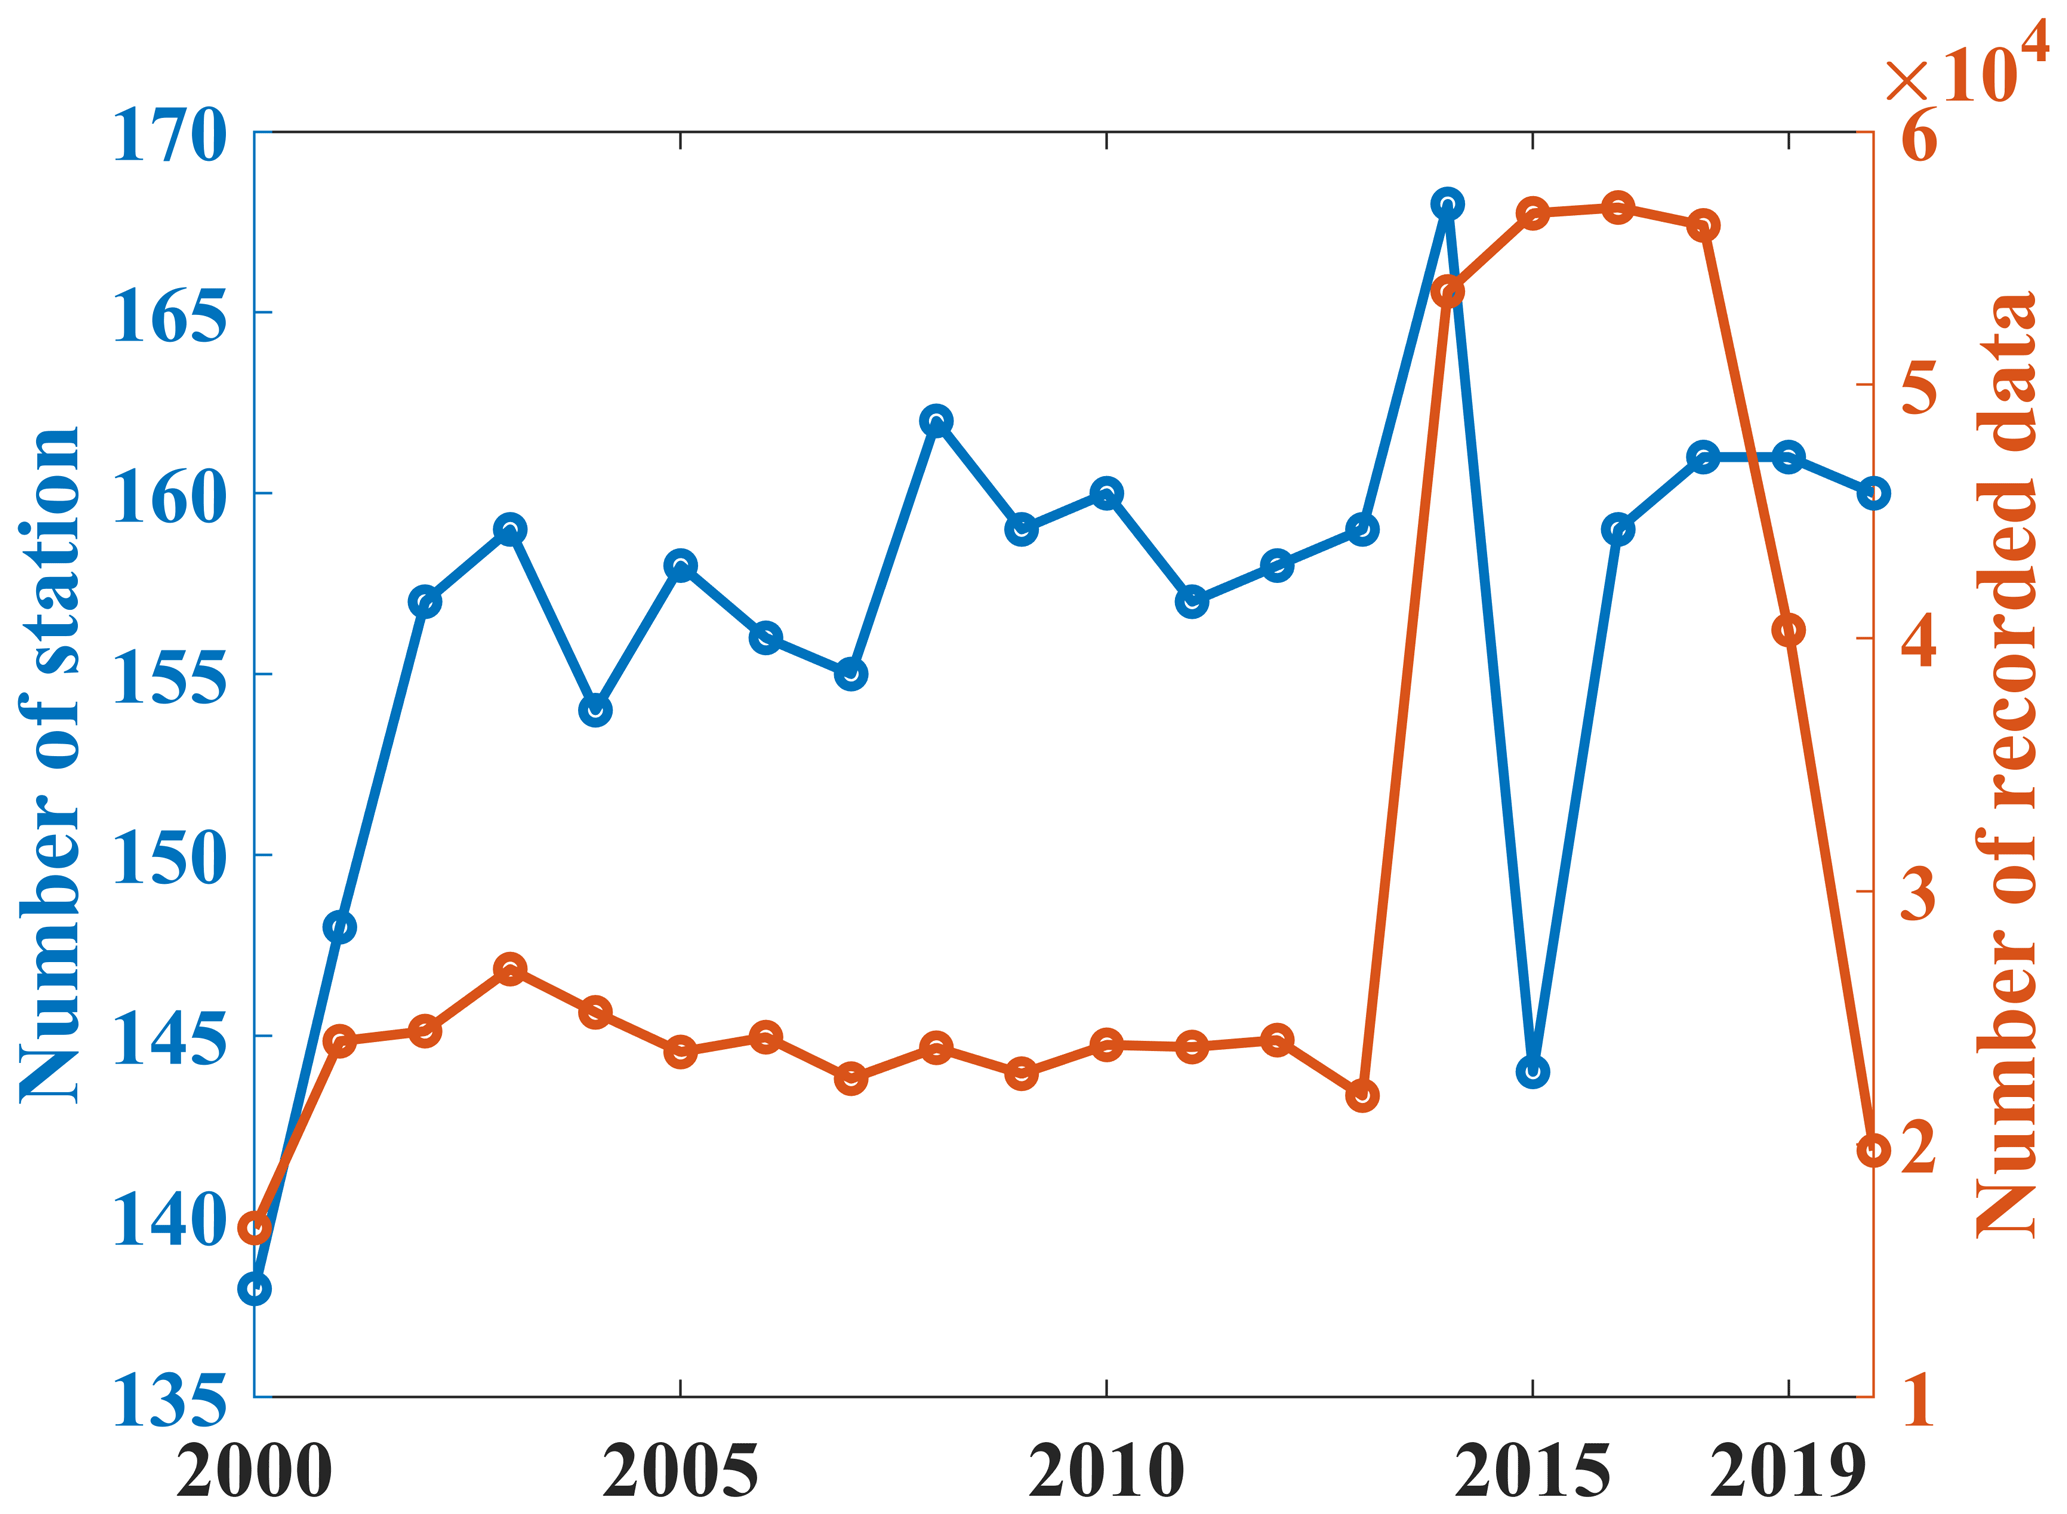
Figure 8The number of in situ stations and the observed data volume per year (26 February 2000–30 April 2019).
4.2.1 Overall results
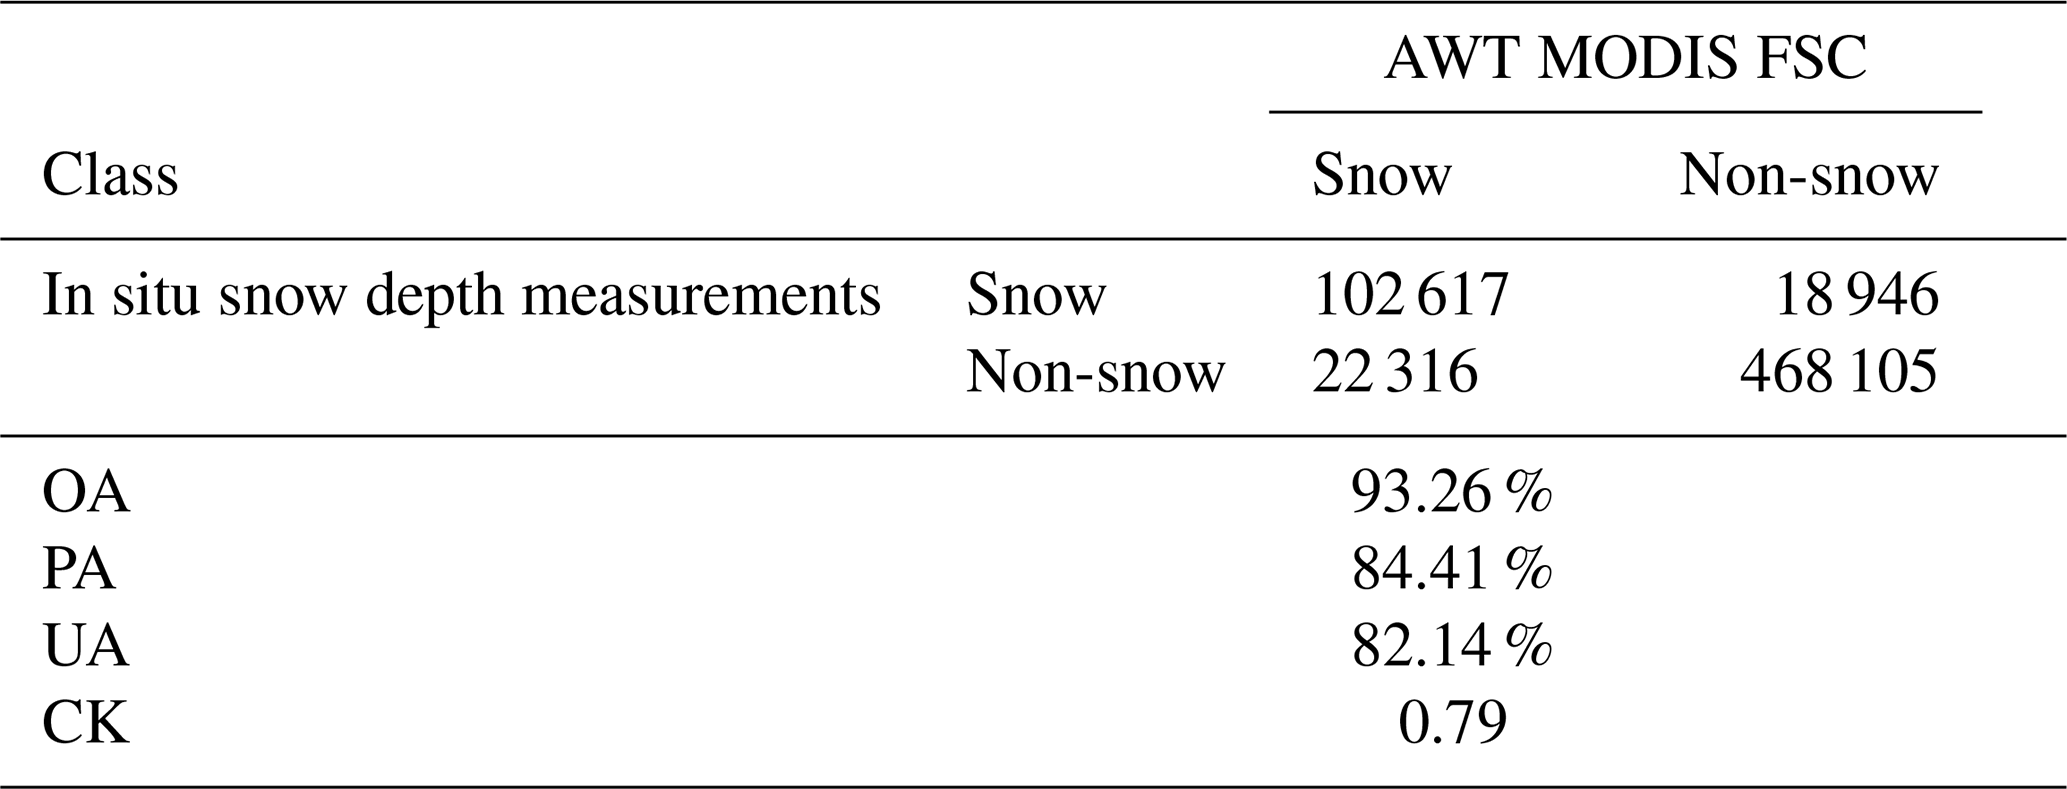
To better assess the accuracy of snow identification, only in situ stations with more than 20 d of snow observations per year were selected for evaluation (Zhang et al., 2020; Hao et al., 2021). This reduced the number of in situ stations and the total observation data by approximately half. In this study, snow depth observations from 175 in situ stations were used to perform a binary evaluation of the AWT MODIS FSC product. Table 4 shows the results of the overall accuracy evaluation. It can be seen from the results that the OA of the product reaches 93.26 %, PA can reach 84.41 %, and UA can reach 82.14 %; i.e., the omission error is 15.59 %, and the commission error is 17.86 %. In addition, CK reaches 0.79. The results of the above accuracy metrics exclude the stations without snow observations, which indicates that the AWT MODIS FSC product has good accuracy and good consistency with the snow depth observation data of meteorological stations.
Table 4Confusion matrix and accuracy results of the AWT MODIS FSC product based on snow depth measurements from the CMA: OA, PA, UA and CK.
To verify the stability of the product accuracy over time, this study performed a binary accuracy assessment of the snow depth observations at each station by year. The overall results of each accuracy metric over the last 20 years are shown in Fig. 9. Each accuracy metric is relatively stable before and after 2014, but there is a large fluctuation in 2014. The OA metric exhibits the most significant temporal variation. Before 2014, the fluctuation range of OA is 88.69 %–92.96 %, and after 2014, the fluctuation range of OA is 95.05 %–97.54 %. Meanwhile, CK and PA increase significantly after 2014. This also indicates that the consistency between the AWT MODIS FSC product and the snow depth observations from meteorological stations has improved significantly since 2014. The fluctuation in the above accuracy indicators is mainly due to the significant increase in the number of meteorological station observations used in this study after 2014 and the improvement in the accuracy of snow identification, which ultimately leads to a significant increase in OA. The percentage of cloud cover in different years is also shown in Fig. 9 below. Combined with Figs. 8 and 9, the decrease in cloud and snow cover (Tang et al., 2022; Yao et al., 2022) leads to an increase in the proportion of clear-sky and non-snow observations at stations. This will result in fewer omission errors (PA increases), ultimately leading to better station-based assessment accuracy.
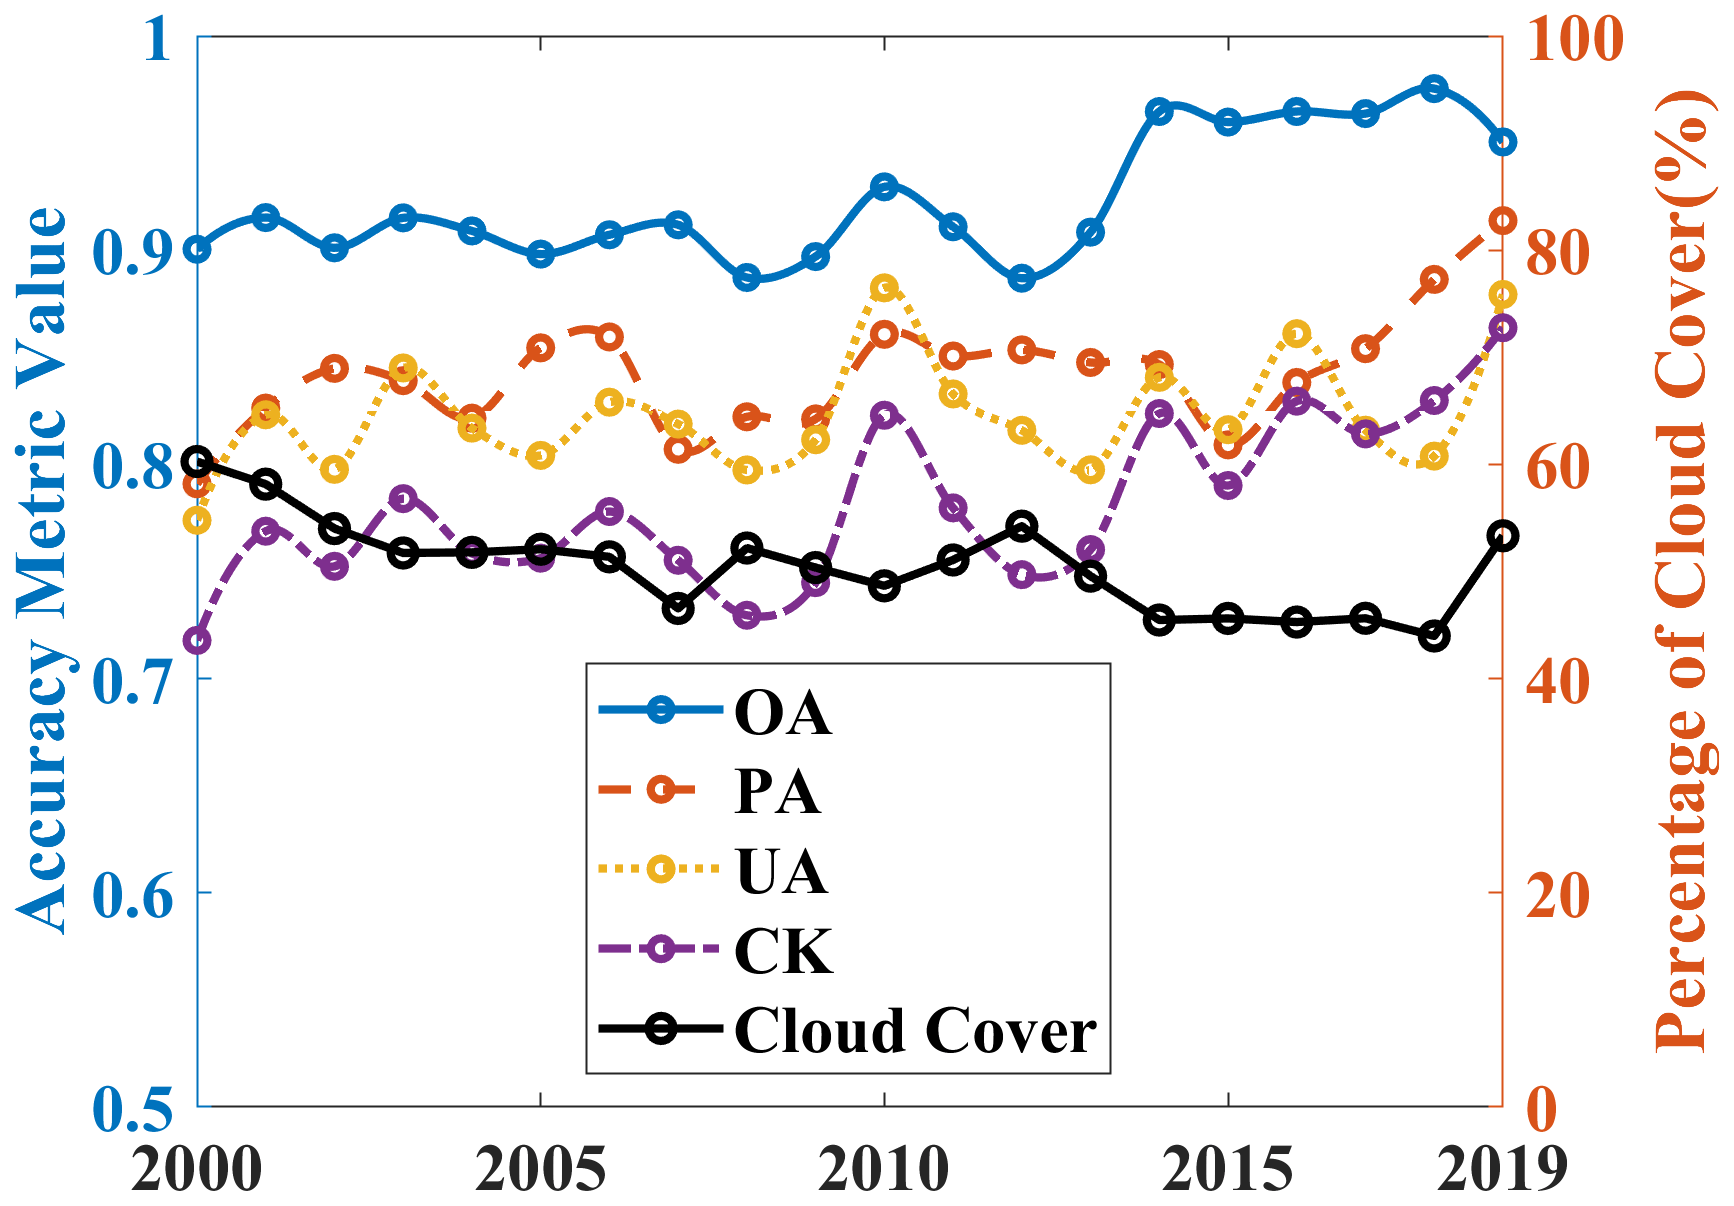
Figure 9Accuracy fluctuations of the AWT MODIS FSC product based on in situ snow depth measurements and the percentage of cloud cover in the past 20 years.
4.2.2 Accuracy metrics at each in situ station
Figure 10 shows the detailed results of the accuracy metrics of the AWT MODIS FSC product verified by the snow depth data of the stations. As shown in Fig. 10, the OA of most in situ stations is above 90 %, with only one in situ station below 70 %. However, the figure shows that, unlike the OA, the accuracy of the entire Asian Water Tower region is relatively consistent. PA, UA and CK are severely affected by the region. The PA and UA metrics at stations in northern Xinjiang, China, are generally greater than 90 %, and CK is also greater than 0.8. This is mainly due to the stable snow cover in the region. The spatiotemporal reconstruction algorithm of snow cover developed in this research can grasp the spatiotemporal variation characteristics of snow cover in this region well, so that high-precision spatiotemporal reconstruction of snow cover information can be achieved. However, the snow cover in the eastern part of the Asian Water Tower region and the northwestern edge of the Tarim Basin is relatively broken, and the MODIS resolution is coarse. These areas are seriously affected by clouds, so the PA, UA and CK metrics in these areas are generally not high.
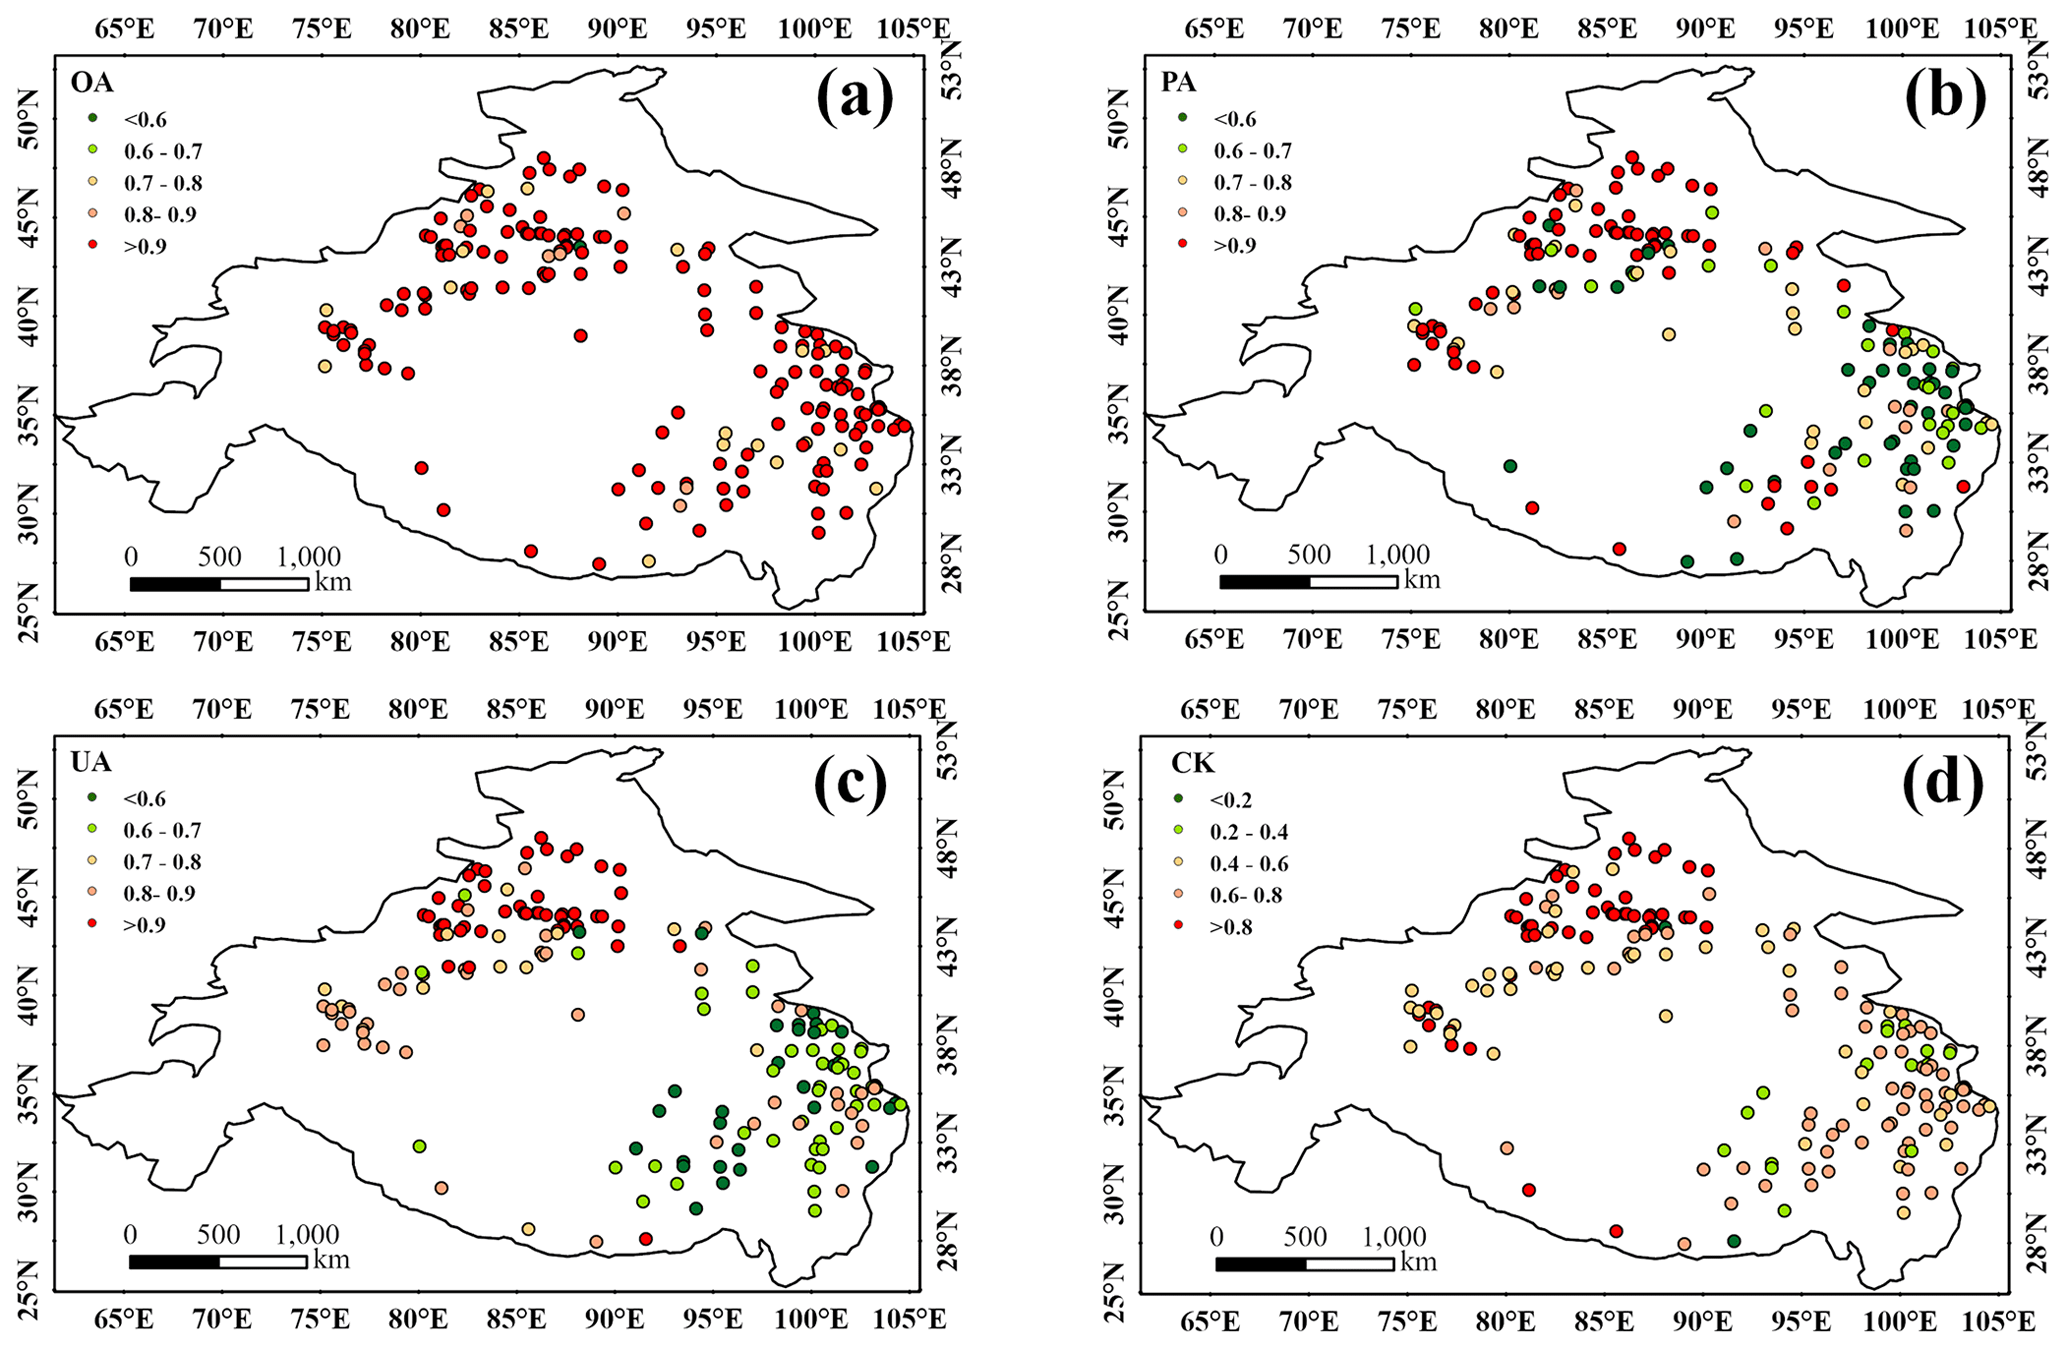
Figure 10Point-based accuracy results of the AWT MODIS FSC product: (a) OA; (b) PA; (c) UA; (d) CK.
4.2.3 Performance of the spatiotemporal reconstruction algorithm
The above two sections presented the overall accuracy of the AWT MODIS FSC product using snow depth data from meteorological stations. The AWT MODIS FSC product is derived from the composition of two parts: the real MODIS observation under clear sky and the spatiotemporal reconstruction with the MSTI algorithm for cloudy conditions. To further explore the accuracy of the fractional snow cover results of these two parts, the snow depth observation data of the meteorological stations are divided into two categories based on MODIS clear-sky and cloudy conditions. First, the stability of the accuracy evaluation metric under clear-sky and cloudy conditions, respectively, is evaluated, and the results are shown in Fig. 11. Comparison of Fig. 9 shows that there is an increase in accuracy in years with lower cloud cover. Figure 11a presents the interannual variation results of the accuracy metrics of fractional snow cover obtained from MODIS clear-sky observations using snow depth observations at the selected meteorological stations. OA, PA, UA and CK all exhibit good stability, and the range of variation in OA is 92.80 %–99.01 %. The range of UA is 82.39 %–90.26 %. After 2014, the two indices of PA and CK improved, with the maximum of PA reaching 95.46 % and CK reaching 0.91. Figure 11b shows the interannual variation results of the accuracy metrics of the fractional snow cover result obtained by the spatiotemporal reconstruction of the MSTI algorithm using the snow depth observations at the selected meteorological stations. All accuracy metrics decrease to some extent compared to the clear-sky condition. Influenced by the amount of in situ station data used, the spatiotemporal reconstruction results show a relatively obvious jump in 2014. The variation range of OA before 2014 is 84.51 %–90.00 %, but the variation range of OA after 2014 is 92.76 %–95.60 %. PA and CK have interannual variations in the years before 2014, but the value of the years after 2014 has a large increase, with the maximum PA reaching 89.61 % and CK reaching 0.83. UA has only a large interannual variation, and there is no significant jump in 2014. The results show that the accuracy of the fractional snow cover based on clear-sky observations is significantly better than that of the spatiotemporal reconstruction. This is mainly due to the presence of clouds over a long period of time and over a large area in most of the Asian Water Tower region; the interpolation of this part of the area relies heavily on the last two steps of the MSTI algorithm. The last two steps of the MSTI algorithm require a larger space–time window to complete the interpolation. However, a larger space–time window introduces more error, especially for snow cover, which has strong spatial heterogeneity and changes rapidly over time.
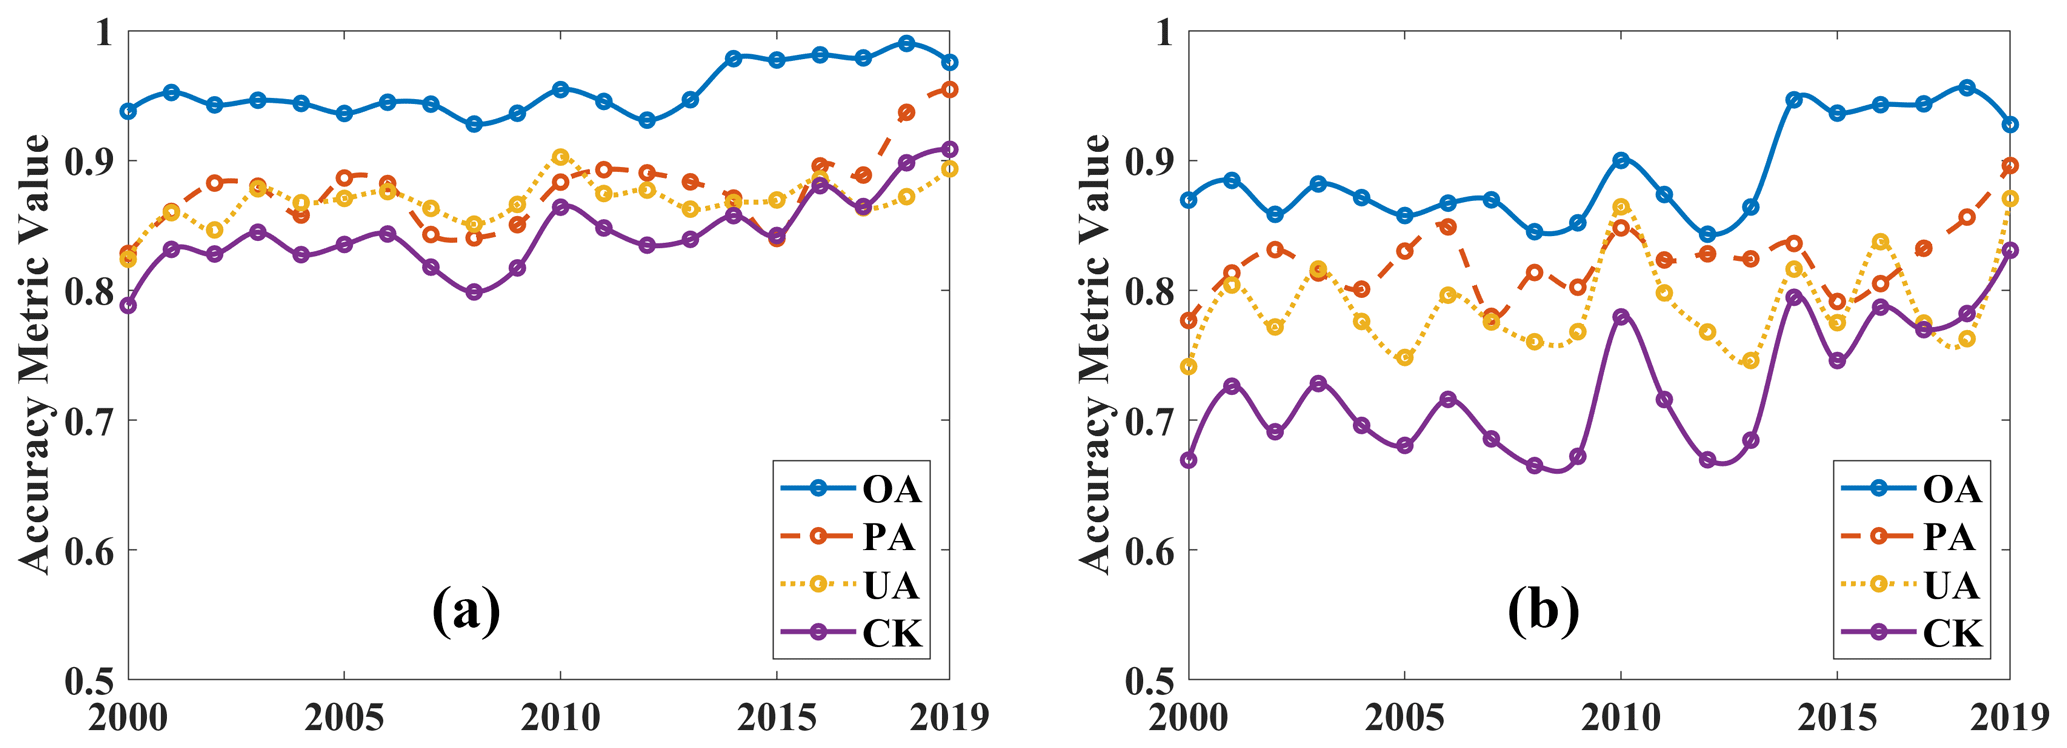
Figure 11Point-based accuracy results of the AWT MODIS FSC product: (a) clear-sky observations; (b) spatiotemporal reconstruction.
This study further analyzed the accuracy of the AWT MODIS FSC product obtained from MODIS clear-sky and cloud cover observations at each station, and the results of the binarization accuracy metrics are shown in Fig. 12. It can be seen from the figure that the accuracy of fractional snow cover obtained by the clear-sky retrievals is significantly better than that obtained by the MSTI algorithm. According to the OA in Fig. 12a and e, the accuracy of the verification results of fractional snow cover based on MODIS clear-sky observations is good at all the stations, and only a few stations are less than 90 %. However, the OA of the fractional snow cover reconstructed by the MSTI algorithm shows some regional differences. When comparing the accuracy metrics (PA, UA and CK) of fractional snow cover between the real MODIS observations and the spatiotemporal reconstruction results achieved through the MSTI algorithm, notable regional variations are observed in all three metrics. In other words, the accuracy of the stable snow cover area in northern Xinjiang, China, is obviously better than that in the central and eastern parts of the Asian Water Tower region and the northwestern edge of the Tarim Basin, where the snow cover is relatively fragmented and rapidly changing.
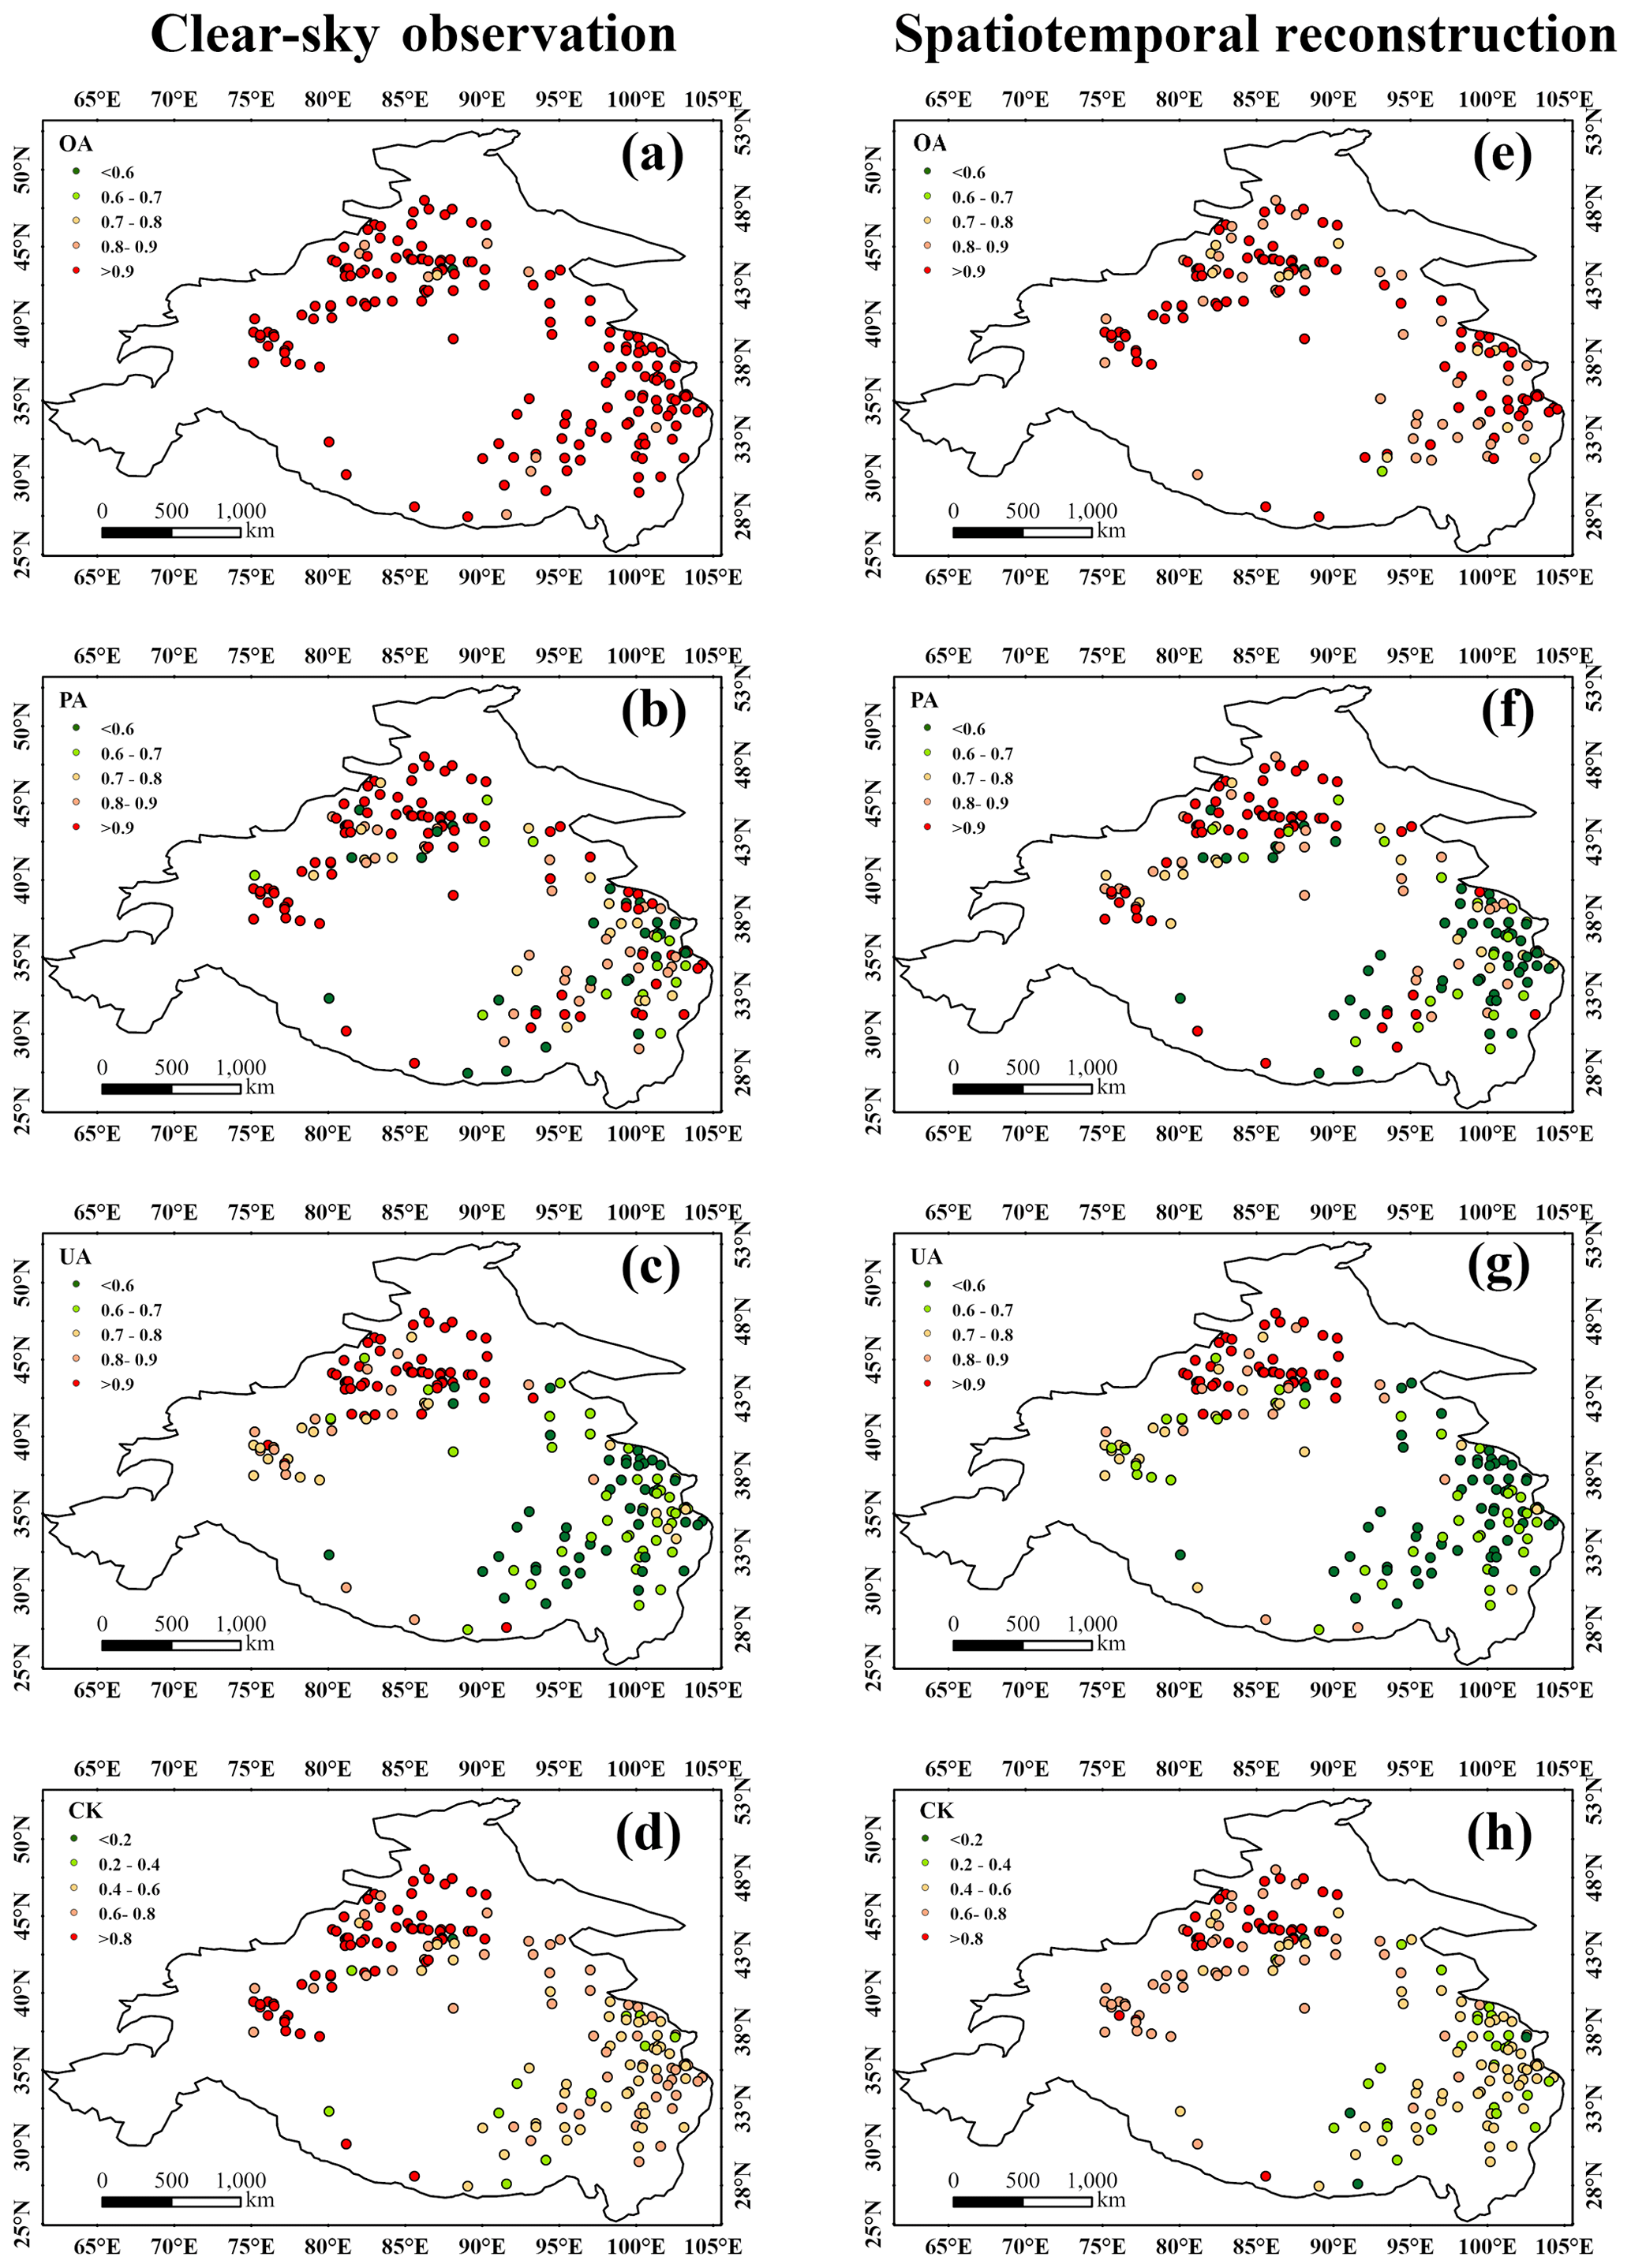
Figure 12Point-based accuracy results of the AWT MODIS FSC product under clear-sky conditions ((a) OA, (b) PA, (c) UA and (d) CK) and spatiotemporal reconstruction ((e) OA, (f) PA, (g) UA and (h) CK).
5.1 Comparing the AWT MODIS FSC with the Snow CCI(MODIS), MOD10A1 and HMRFS-TP products
In order to evaluate the accuracy of AWT MODIS FSC products more objectively, the Snow CCI(MODIS) (Nagler et al., 2022), MOD10A1 (Hall and Riggs, 2016) and HMRFS-TP (Huang et al., 2022a) products are selected as benchmarks for this study using Landsat-8 imagery. The Snow CCI(MODIS) product has a spatial resolution of 1 km and a time span of 2001–2020, which is used to compare the accuracy difference with the AWT MODIS FSC product under the clear-sky scenario. MOD10A1 is the most widely used MODIS snow product, which has a long time series (since 2000) and high spatial and temporal resolutions (i.e., 500 m and daily). This study is based on the GEE platform to obtain the MOD10A1 (Collection 61) data from 2013 to 2022 for the Asian Water Tower region and uses this product to evaluate the accuracy difference with the AWT MODIS FSC product under the clear-sky scenario. The HMRFS-TP product is a continuous spatiotemporal binary snow product based on the MOD10A1 product and the HMRFS spatiotemporal interpolation algorithm covering the Tibetan Plateau region within China and is used in this study to compare the accuracy of the two sets of continuous spatiotemporal products.
The Snow CCI(MODIS) product is a fractional snow cover product generated by the SCAmod algorithm (Metsämäki et al., 2012; Metsamaki et al., 2005). In this study, 877 Landsat images were used to compare the differences in the continuous-value accuracy evaluation metrics between the Snow CCI(MODIS) product and the AWT MODIS FSC product under clear-sky conditions, and the results are shown in Fig. 13 below. As shown in Fig. 13, the R2, RMSE and MAE of the AWT MODIS FSC product are 0.831, 0.148 and 0.084. The R2, RMSE and MAE of the Snow CCI(MODIS) product are 0.780, 0.159 and 0.094, respectively. From the results, it can be concluded that the AWT MODIS FSC product is overall better than the Snow CCI(MODIS) on the 1 km scale, and the subsequent dynamic canopy transmittance for different regions will help to realize high-precision snow cover monitoring.
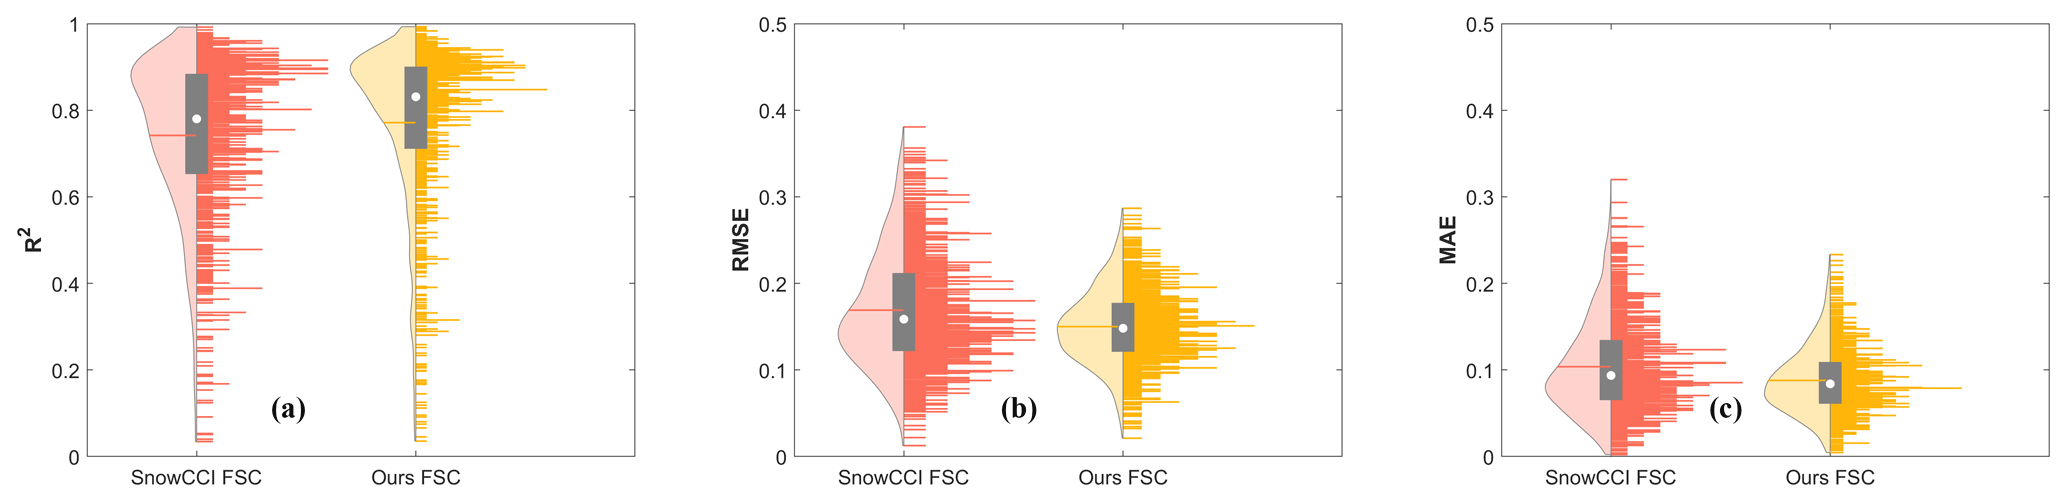
Figure 13Violin charts for the accuracy evaluation metrics of the AWT MODIS FSC and Snow CCI(MODIS) products validated by Landsat images.
The accuracy of the MOD10A1 product depends on the threshold value of the NDSI, and the commonly used thresholds are 0.1 (Zhang et al., 2019), 0.29 (Zhang et al., 2021; Tang et al., 2022) and 0.4 (Riggs et al., 2017). Since no spatiotemporal interpolation is performed for the MOD10A1 product, in order to make a comprehensive and objective comparative assessment, this study uses 1805 Landsat images to compare the clear-sky pixels of the two products, and the results are shown in Fig. 14 below. The OA, PA and UA of the AWT MODIS FSC product are 97.69 %, 98.73 % and 98.83 %, respectively. The NDSI threshold is 0.1, and the OA, PA and UA of the MOD10A1 products are 94.51 %, 95.70 % and 99.04 %. The NDSI threshold is 0.29, and the OA, PA and UA of the MOD10A1 product are 94. 75 %, 98.49 % and 96.52 %. The NDSI threshold is 0.4, and the OA, PA and UA of the MOD10A1 product are 91.86 %, 98.96 % and 90.82 %. As the NDSI threshold increases, Fig. 14 shows that the PA of the MOD10A1 product gradually increases and the UA gradually decreases. This also means that the percentage of omission error is decreasing and the percentage of commission error is increasing. This is because the larger the NDSI, the higher the probability that the image pixel is snow and the probability of correctly judging snow increases accordingly, which also leads to a lower probability of correctly judging non-snow, resulting in a decrease in the overall accuracy. From the results in Fig. 14, the MOD10A1 product has the best accuracy when the NDSI is 0.29, but its accuracy is still lower than that of the AWT MODIS FSC product.
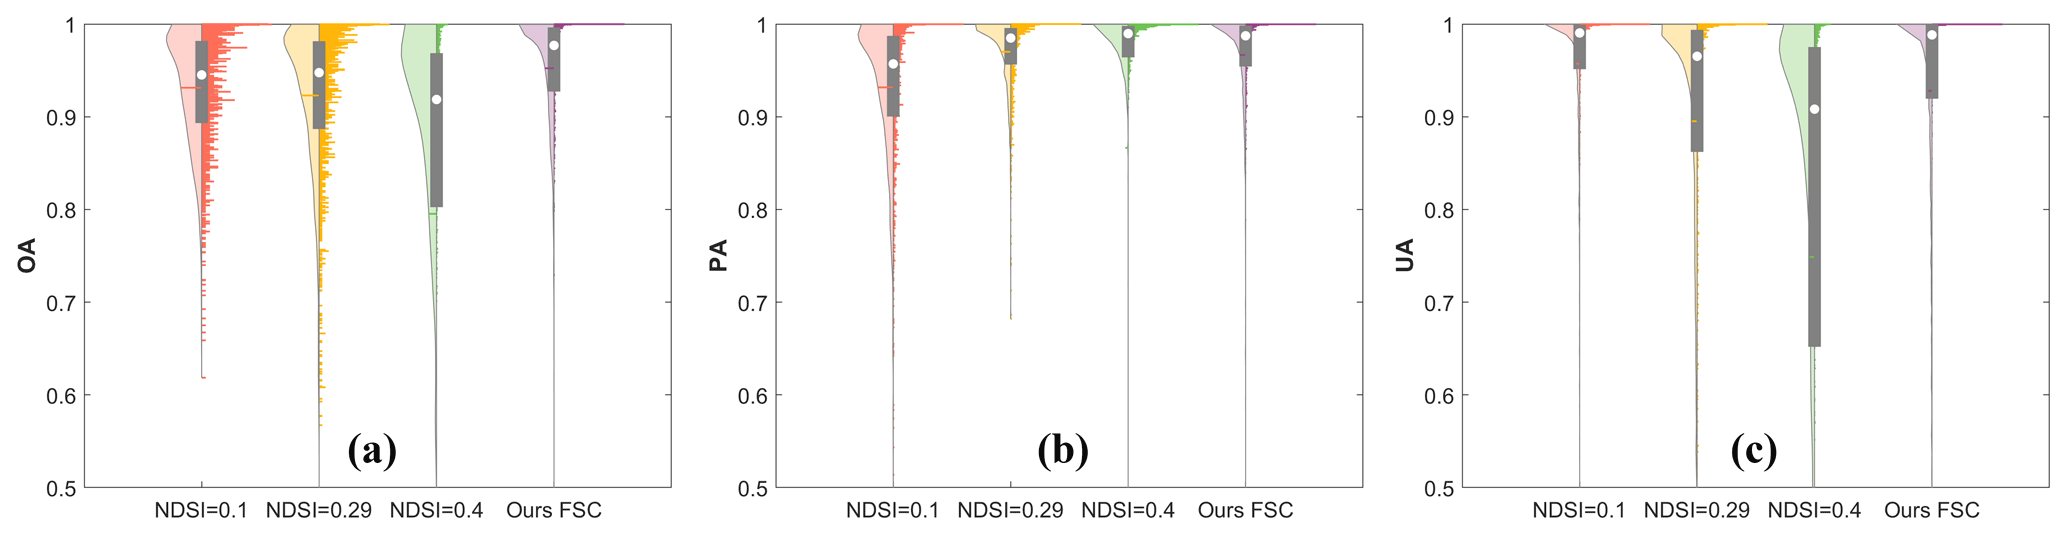
Figure 14Violin charts for the accuracy evaluation metrics of the AWT MODIS FSC and MOD10A1 products validated by Landsat images.
The NDSI of the HMRFS-TP product is 0.4 as the threshold for snow identification of MOD10A1, and the spatiotemporal continuous product is obtained by the HMRFS spatiotemporal interpolation algorithm. In this study, 372 Landsat images were used to quantitatively evaluate and compare two sets of spatiotemporal continuous snow products, and the results are shown in Fig. 15 below. As shown in Fig. 15, the OA, PA and UA of the AWT MODIS FSC product are 89.71 %, 94.29 % and 86.21 %. The OA, PA and UA of the HMRFS-TP product are 79.45 %, 99.20 % and 66.82 %, respectively. Comparing the accuracy indices of the two sets of products, AWT MODIS FSC products are significantly better than HMRFS-TP products, and various accuracy evaluation indices are around 90 %. The poor accuracy of the HMRFS-TP products is mainly due to the value of the NDSI. Combined with Fig. 14, the threshold of 0.4 will lead to serious misclassification of products and is not applicable to the Tibetan Plateau region.
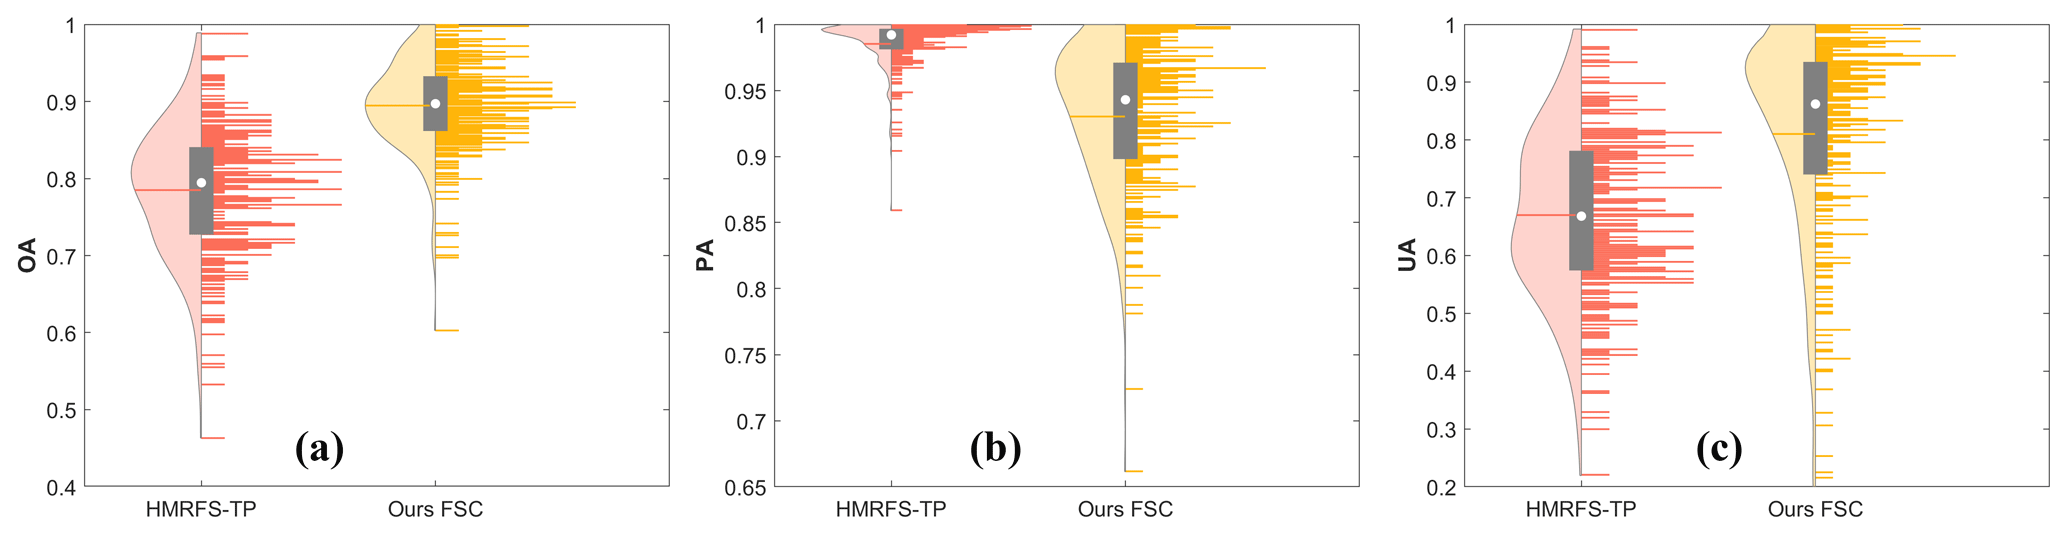
Figure 15Violin charts for the accuracy evaluation metrics of the AWT MODIS FSC and HMRFS-TP products validated by Landsat images.
5.2 Area differences in fractional snow cover and binary snow cover
Long-term-series and high-precision fractional snow cover products are of great importance for snow hydrology research in the Asian Water Tower region. However, most of the existing snow cover products are binary products or space–time gap-filled fractional snow cover products. In this study, the clear-sky fractional snow cover was retrieved by the MESMA-AGE algorithm based on MODIS observations. The missing fractional snow cover information caused by cloud cover was reconstructed by the MSTI algorithm, and finally the spatiotemporally continuous long-term-series AWT MODIS FSC product was obtained. The actual snow distribution, which is difficult to capture, was identified with binary values, especially in scenarios with mixed pixels at medium and coarse resolutions, and the subsequent direct application of binary products will introduce large errors. Therefore, the AWT MODIS FSC product produced in this study was used to quantitatively analyze the actual difference between the binary snow cover product and the fractional snow cover product, and the results are shown in Fig. 16. In this study, pixels with FSC > 15 % were identified as the binary snow product (Rittger et al., 2013; Wang et al., 2019). Figure 16a shows the difference between the total snow cover area obtained by the binary snow product and that obtained by the fractional snow cover product in the Asian Water Tower region. There is a significant overestimation of the binary snow product, with an average difference of 39 400 km2 and a maximum difference of 102 000 km2, which is very large for the Asian Water Tower region with a total area of only 623 000 km2. Figure 16b shows the proportion of the difference in the total snow area obtained by the two snow cover products in the total snow area obtained by the binary snow product. The average difference is 34.53 %, and the maximum difference is 59.52 %. Comparing Fig. 16a and b, the smaller the total snow cover area, the greater the difference between the two sets of products, indicating that greater errors in the binary snow cover product occur for more broken and smaller areas.
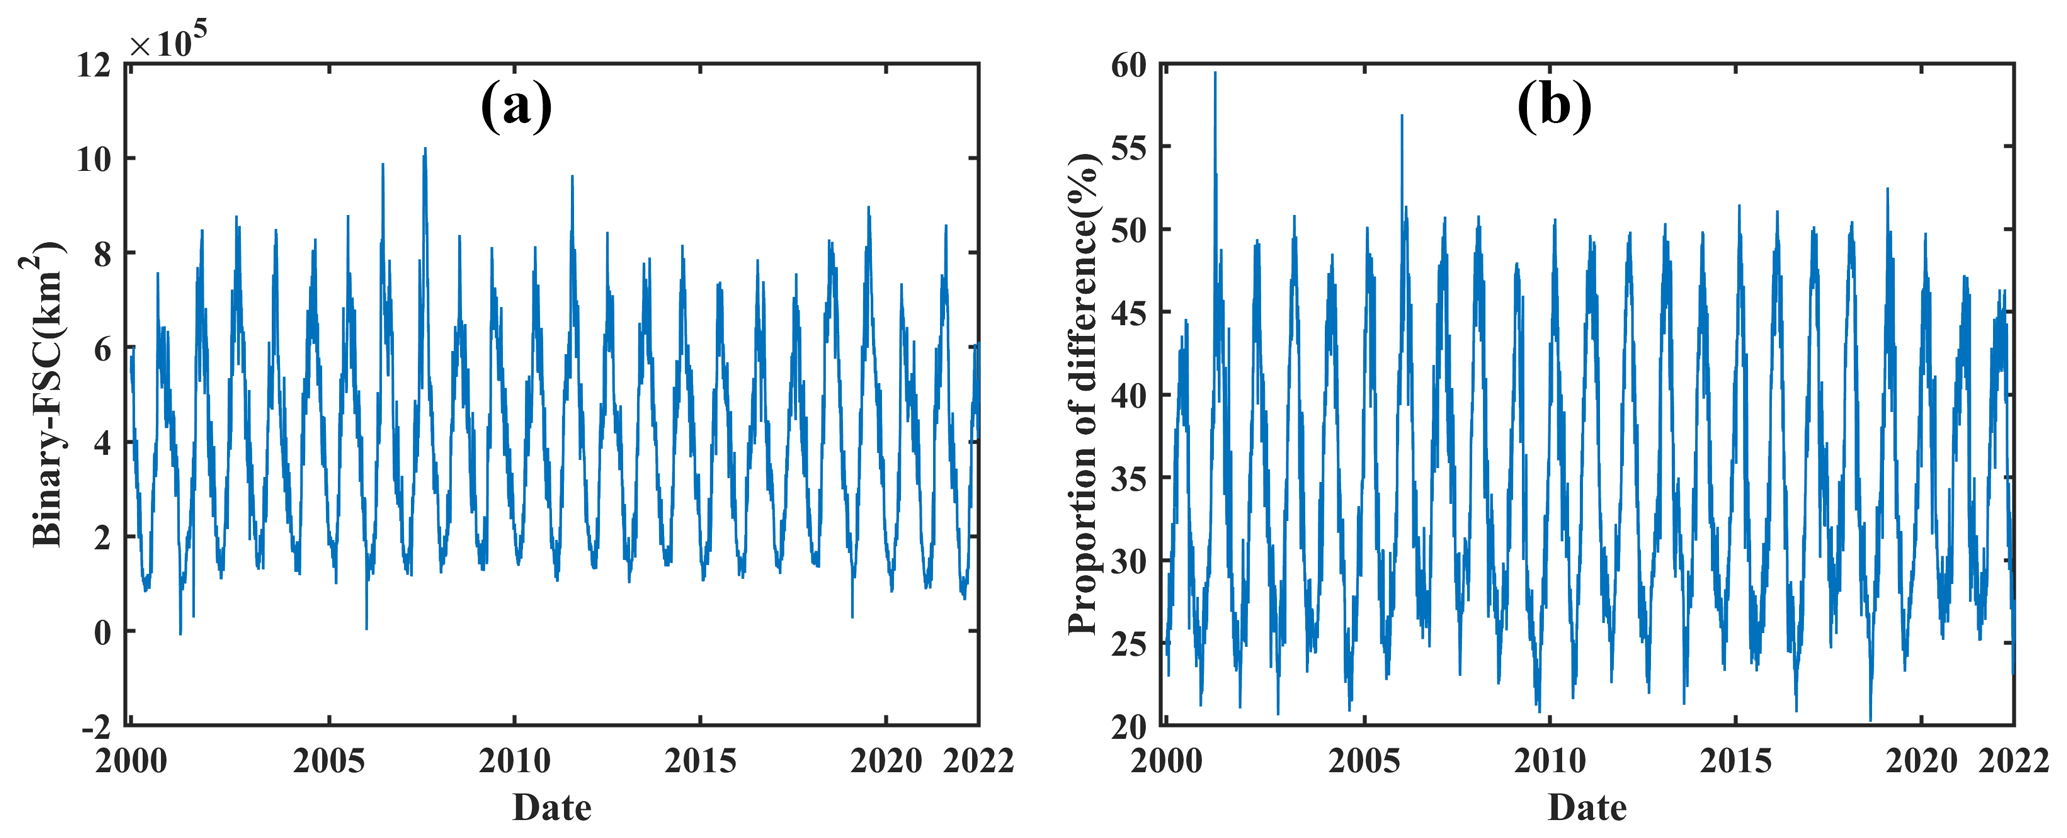
Figure 16Difference between the binary snow cover product and the fractional snow cover product in the Asian Water Tower region: (a) difference in the total snow cover area between the binary snow cover product and the fractional snow cover product; (b) proportion of the total snow area difference between the two snow products compared with the total snow area obtained by the binary snow product.
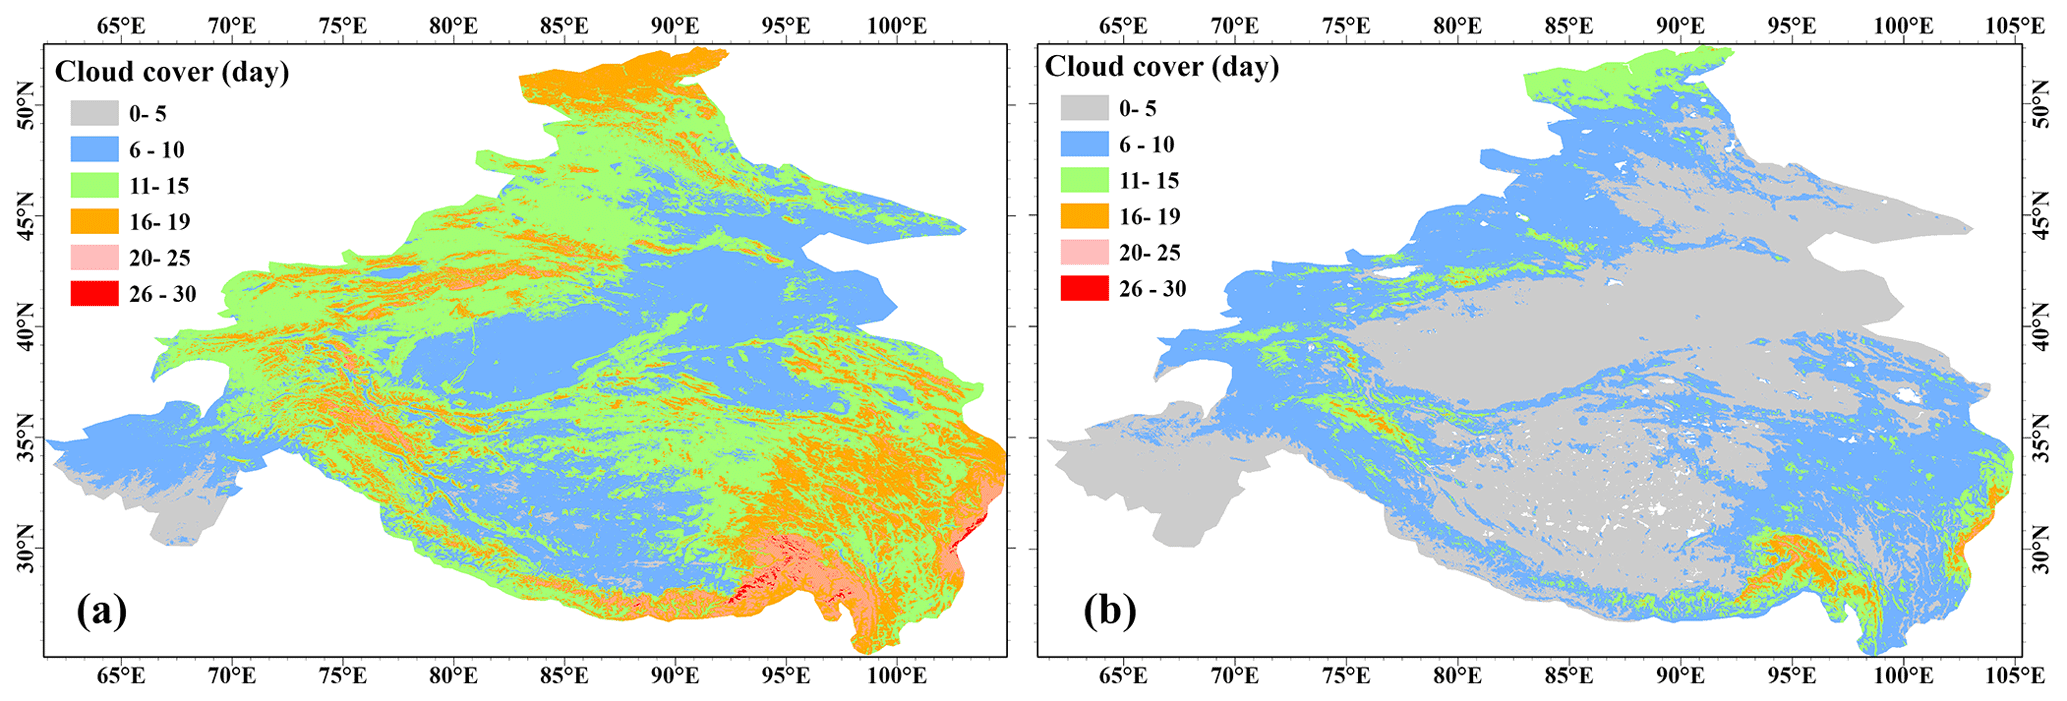
Figure 17Monthly average cloud cover over the Asian Water Tower region (April 2018–March 2022) from (a) MODIS and (b) FY-4A.
5.3 Limitations of the AWT MODIS FSC product
Clouds in most of the Asian Water Tower region have the characteristics of wide coverage and long duration. If clouds exist for a long time, relying only on MODIS data will lead to a serious data gap, and the accuracy of snow cover monitoring will be reduced, regardless of any spatiotemporal reconstruction algorithm. With the launch of a new generation of geostationary satellites (FY-4A/B, GOES-17/18, Himawari-8/9 and MSG/MTG), their sensor performance can be comparable to that of MODIS sensors, and at the same time the observation can be realized once every 5–15 min. Combined with geostationary sensors, these platforms are expected to provide the highest-precision fractional snow cover monitoring. At the same time, problems with MODIS cloud products, such as overestimation and confusion error between clouds and snow, can be effectively improved by combining station observations (Dong and Menzel, 2016a, b), but this requires enough dense stations in the study area. The applicability of this method is limited due to terrain constraints in the AWT region, and subsequent studies in specific small areas may be cited to further improve product quality. Large-scale synchronous and high-frequency observations from geostationary meteorological satellites can overcome the shortcomings of the above methods and meet the needs of large-scale applications. In this study, the monthly average cloud cover MODIS and FY-4A data during the period April 2018–March 2022 were collected, and the results are shown in Fig. 17. Figure 17a shows the average monthly cloud cover statistics from MODIS. It can be seen from the figure that the average monthly cloud cover in areas with more snow cover, such as the Pamir Plateau, Tianshan Mountains and Altai Mountains, is generally more than 15 d, and some areas of the Hengduan Mountains range can reach more than 25 d. As shown in Fig. 17b, the average monthly cloud cover in most regions based on the FY-4A data is generally less than 10 d, and the average monthly cloud cover in the Hengduan Mountains region is also less than 19 d, which will provide strong data support for the subsequent high-precision spatiotemporal reconstruction of fractional snow cover information. However, the large amount of multitemporal observation data from geostationary satellites, the lack of necessary preprocessing steps, such as atmospheric correction, angle correction and geometric registration, and the serious misjudgment of cloud snow in existing cloud products will limit its further application.
The AWT MODIS FSC product is the daily cloud-gap-filled snow cover data for the Asian Water Tower region. It has a spatial resolution of 0.005° and a daily temporal resolution. This dataset is freely available from the National Tibetan Plateau Data Center at https://doi.org/10.11888/Cryos.tpdc.272503 (Jiang et al., 2022) or from the Zenodo platform at https://doi.org/10.5281/zenodo.10005826 (Jiang et al., 2023a). It contains 8347 daily data files from 26 February 2000 to 31 December 2022 in NetCDF format. The filename rule is “AWT_MODIS_FSC_yyyymmdd.NC”, where AWT_ MODIS_FSC represents the daily cloud-gap-filled MODIS fractional snow cover product over the Asian Water Tower region, and yyyymmdd indicates the year, month and day of the data. The dataset contains two layers, the “fSCA” layer: fractional snow cover (non-snow (0), snow (1–100), water (237), cloud (250) and filling value (255)), and the “QA” layer: cloud mask (0: clear sky, 1: cloud mask and 2: invalid value).
The Landsat-8 fractional snow cover dataset for verification is available on the Zenodo platform: https://doi.org/10.5281/zenodo.10008227 (Jiang et al., 2023b). The binary value (snow–no-snow) snow depth dataset based on ground stations is available on the GitHub platform (https://github.com/FangboPan/AWT_Site_SD, last access: 18 October 2023) and Zenodo (https://doi.org/10.5281/zenodo.11367913, Pan, 2024a). The code is available on the GitHub platform (https://github.com/FangboPan/AWT_MODIS_DailyFSC_Product_code_v1, last access: 16 November 2023) and Zenodo (https://doi.org/10.5281/zenodo.11367978, Pan, 2024b).
In this study, based on the MESMA-AGE algorithm and the MSTI spatiotemporal reconstruction algorithm, the daily AWT MODIS FSC product was produced with long-term-series, high-precision and spatiotemporal continuity in the Asian Water Tower region. The spatial resolution of the product is 0.005° from 2000 to 2022. The new AWT MODIS FSC product was quantitatively evaluated in two dimensions: binary value and fractional snow cover using snow depth observations from meteorological stations and high-spatial-resolution Landsat-8 images. Based on the results of the Landsat-8 image accuracy evaluation, the binarized identification accuracy metrics OA, PA and UA are 95.17 %, 97.34 % and 97.59 %, respectively. The fractional snow cover accuracy metrics R2, RMSE and MAE are 0.80, 0.16 and 0.10, respectively, compared with 2745 Landsat-8 images. All these results indicate that the AWT MODIS FSC product has good consistency with the high-spatial-resolution Landsat-8 images and has high accuracy. Based on the accuracy evaluation results after excluding the stations that cannot observe snow at all, the OA, PA, UA and CK of the AWT MODIS FSC product can reach 93.26 %, 84.41 %, 82.14 % and 0.79, respectively. The AWT MODIS FSC product consists of two parts: the retrieval results of MODIS clear-sky observations and the spatiotemporal reconstruction results based on the MSTI algorithm. Snow depth observations from meteorological stations are also used to evaluate these two parts. The binary precision metrics of fractional snow cover based on MODIS clear-sky observations are as follows: OA (95.36 %), PA (87.75 %), UA (86.86 %) and CK (0.84). The binarization accuracy metrics of the fractional snow cover based on the spatiotemporal reconstruction of the MSTI algorithm are as follows: OA (88.96 %), PA (82.26 %), UA (78.86 %) and CK (0.72). Therefore, it can be shown that both the binarized identification and fractional snow cover metrics are excellent at both the point scale and the areal scale, which further indicates that this AWT MODIS FSC product has relatively high precision (Wu et al., 2021; Huang et al., 2022a; Hao et al., 2022). The AWT MODIS FSC product is expected to offer robust and highly accurate data support for future snow hydrology studies.
FP performed the study and wrote the manuscript. LJ conceived the study and supervised the manuscript construction and revision. GW, JP, JH, CZ, HC and JY helped in algorithm development and data processing. ZZ provided the meteorological station data. SW and JS provided many meaningful suggestions. All the authors have read and agreed to the published version of the manuscript.
The contact author has declared that none of the authors has any competing interests.
Publisher’s note: Copernicus Publications remains neutral with regard to jurisdictional claims made in the text, published maps, institutional affiliations, or any other geographical representation in this paper. While Copernicus Publications makes every effort to include appropriate place names, the final responsibility lies with the authors.
The authors would like to thank the National Meteorological Information Center (NMIC) for the weather station data. We also acknowledge that Google Earth Engine dramatically facilitated the work on image reprocessing.
This research was funded by the Second Tibetan Plateau Scientific Expedition and Research Program (STEP) under grant no. 2019QZKK0206, the Strategic Priority Research Program of the Chinese Academy of Sciences (grant no. XDA20100300) and the National Natural Science Foundation of China (grant nos. 42171317 and 42090014).
This paper was edited by Heming Liao and reviewed by two anonymous referees.
Ault, T. W., Czajkowski, K. P., Benko, T., Coss, J., Struble, J., Spongberg, A., Templin, M., and Gross, C.: Validation of the MODIS snow product and cloud mask using student and NWS cooperative station observations in the Lower Great Lakes Region, Remote Sens. Environ., 105, 341–353, https://doi.org/10.1016/j.rse.2006.07.004, 2006.
Bair, E. H., Stillinger, T., and Dozier, J.: Snow Property Inversion From Remote Sensing (SPIReS): A Generalized Multispectral Unmixing Approach With Examples From MODIS and Landsat 8 OLI, IEEE T. Geosci. Remote, 59, 7270–7284, https://doi.org/10.1109/TGRS.2020.3040328, 2021.
Barnett, T. P., Adam, J. C., and Lettenmaier, D. P.: Potential impacts of a warming climate on water availability in snow-dominated regions, Nature, 438, 303–309, https://doi.org/10.1038/nature04141, 2005.
Czyzowska-Wisniewski, E. H., van Leeuwen, W. J. D., Hirschboeck, K. K., Marsh, S. E., and Wisniewski, W. T.: Fractional snow cover estimation in complex alpine-forested environments using an artificial neural network, Remote Sens. Environ., 156, 403–417, https://doi.org/10.1016/j.rse.2014.09.026, 2015.
Dai, L., Che, T., Ding, Y., and Hao, X.: Evaluation of snow cover and snow depth on the Qinghai–Tibetan Plateau derived from passive microwave remote sensing, The Cryosphere, 11, 1933–1948, https://doi.org/10.5194/tc-11-1933-2017, 2017.
Dobreva, I. D. and Klein, A. G.: Fractional snow cover mapping through artificial neural network analysis of MODIS surface reflectance, Remote Sens. Environ., 115, 3355–3366, https://doi.org/10.1016/j.rse.2011.07.018, 2011.
Dong, C. and Menzel, L.: Improving the accuracy of MODIS 8-day snow products with in situ temperature and precipitation data, J. Hydrol., 534, 466–477, https://doi.org/10.1016/j.jhydrol.2015.12.065, 2016a.
Dong, C. and Menzel, L.: Producing cloud-free MODIS snow cover products with conditional probability interpolation and meteorological data, Remote Sens. Environ., 186, 439–451, https://doi.org/10.1016/j.rse.2016.09.019, 2016b.
Dozier, J., Painter, T. H., Rittger, K., and Frew, J. E.: Time–space continuity of daily maps of fractional snow cover and albedo from MODIS, Adv. Water Resour., 31, 1515–1526, https://doi.org/10.1016/j.advwatres.2008.08.011, 2008.
Elguindi, N., Hanson, B., and Leathers, D.: The Effects of Snow Cover on Midlatitude Cyclones in the Great Plains, J. Hydrometeorol., 6, 263–279, https://doi.org/10.1175/JHM415.1, 2005.
Fritsch, F. N. and Carlson, R. E.: Monotone Piecewise Cubic Interpolation, SIAM J. Numer. Anal., 17, 238–246, https://doi.org/10.1137/0717021, 1980.
Gafurov, A. and Bárdossy, A.: Cloud removal methodology from MODIS snow cover product, Hydrol. Earth Syst. Sci., 13, 1361–1373, https://doi.org/10.5194/hess-13-1361-2009, 2009.
Hall, D. K. and Riggs, G. A.: Accuracy assessment of the MODIS snow products, Hydrol. Process., 21, 1534–1547, https://doi.org/10.1002/hyp.6715, 2007.
Hall, D. K. and Riggs, G. A.: MODIS/Terra Snow Cover Daily L3 Global 500m SIN Grid, Version 6, Boulder, Colorado USA. NASA National Snow and Ice Data Center Distributed Active Archive Center [data set], https://doi.org/10.5067/MODIS/MOD10A1.006, 2016.
Hall, D. K., Riggs, G. A., and Salomonson, V. V.: Development of Methods for Mapping Global Snow Cover Using Moderate Resolution Imaging Spectroradiometer Data, Remote Sens. Environ., 54, 127–140, https://doi.org/10.1016/0034-4257(95)00137-P, 1995.
Hao, S., Jiang, L., Shi, J., Wang, G., and Liu, X.: Assessment of MODIS-Based Fractional Snow Cover Products Over the Tibetan Plateau, IEEE J. Sel. Top. Appl., 12, 533–548, https://doi.org/10.1109/JSTARS.2018.2879666, 2019.
Hao, X., Huang, G., Che, T., Ji, W., Sun, X., Zhao, Q., Zhao, H., Wang, J., Li, H., and Yang, Q.: The NIEER AVHRR snow cover extent product over China – a long-term daily snow record for regional climate research, Earth Syst. Sci. Data, 13, 4711–4726, https://doi.org/10.5194/essd-13-4711-2021, 2021.
Hao, X., Huang, G., Zheng, Z., Sun, X., Ji, W., Zhao, H., Wang, J., Li, H., and Wang, X.: Development and validation of a new MODIS snow-cover-extent product over China, Hydrol. Earth Syst. Sci., 26, 1937–1952, https://doi.org/10.5194/hess-26-1937-2022, 2022.
Hori, M., Sugiura, K., Kobayashi, K., Aoki, T., Tanikawa, T., Kuchiki, K., Niwano, M., and Enomoto, H.: A 38-year (1978–2015) Northern Hemisphere daily snow cover extent product derived using consistent objective criteria from satellite-borne optical sensors, Remote Sens. Environ., 191, 402–418, https://doi.org/10.1016/j.rse.2017.01.023, 2017.
Hou, J., Huang, C., Zhang, Y., Guo, J., and Gu, J.: Gap-Filling of MODIS Fractional Snow Cover Products via Non-Local Spatio-Temporal Filtering Based on Machine Learning Techniques, Remote Sens., 11, 90, https://doi.org/10.3390/rs11010090, 2019.
Huang, X., Deng, J., Ma, X., Wang, Y., Feng, Q., Hao, X., and Liang, T.: Spatiotemporal dynamics of snow cover based on multi-source remote sensing data in China, The Cryosphere, 10, 2453–2463, https://doi.org/10.5194/tc-10-2453-2016, 2016.
Huang, Y., Liu, H., Yu, B., Wu, J., Kang, E. L., Xu, M., Wang, S., Klein, A., and Chen, Y.: Improving MODIS snow products with a HMRF-based spatio-temporal modeling technique in the Upper Rio Grande Basin, Remote Sens. Environ., 204, 568–582, https://doi.org/10.1016/j.rse.2017.10.001, 2018.
Huang, Y., Xu, J., Xu, J., Zhao, Y., Yu, B., Liu, H., Wang, S., Xu, W., Wu, J., and Zheng, Z.: HMRFS–TP: long-term daily gap-free snow cover products over the Tibetan Plateau from 2002 to 2021 based on hidden Markov random field model, Earth Syst. Sci. Data, 14, 4445–4462, https://doi.org/10.5194/essd-14-4445-2022, 2022a.
Huang, Y., Song, Z., Yang, H., Yu, B., Liu, H., Che, T., Chen, J., Wu, J., Shu, S., Peng, X., Zheng, Z., and Xu, J.: Snow cover detection in mid-latitude mountainous and polar regions using nighttime light data, Remote Sens. Environ., 268, 112766, https://doi.org/10.1016/j.rse.2021.112766, 2022b.
Immerzeel, W. W., van Beek, L. P. H., and Bierkens, M. F. P.: Climate Change Will Affect the Asian Water Towers, Science, 328, 1382–1385, https://doi.org/10.1126/science.1183188, 2010.
Immerzeel, W. W., Lutz, A. F., Andrade, M., Bahl, A., Biemans, H., Bolch, T., Hyde, S., Brumby, S., Davies, B. J., Elmore, A. C., Emmer, A., Feng, M., Fernández, A., Haritashya, U., Kargel, J. S., Koppes, M., Kraaijenbrink, P. D. A., Kulkarni, A. V., Mayewski, P. A., Nepal, S., Pacheco, P., Painter, T. H., Pellicciotti, F., Rajaram, H., Rupper, S., Sinisalo, A., Shrestha, A. B., Viviroli, D., Wada, Y., Xiao, C., Yao, T., and Baillie, J. E. M.: Importance and vulnerability of the world's water towers, Nature, 577, 364–369, https://doi.org/10.1038/s41586-019-1822-y, 2020.
Jiang, L., Pan, F., Wang, G., Pan, J., Shi, J., and Zhang, C.: MODIS daily cloud-free factional snow cover data set for Asian water tower area (2000–2022), National Snow and Ice Data Center [data set], https://doi.org/10.11888/Cryos.tpdc.272503, 2022.
Jiang, L., Pan, F., Wang, G., Pan, J., Shi, J., Zhang, C., Huang, and jinyu: MODIS Daily Cloud-gap-filled Fractional Snow Cover Dataset of the Asian Water Tower Region (2000–2022) (V1.0), Zenodo [data set], https://doi.org/10.5281/zenodo.10005827, 2023a.
Jiang, L., Pan, F., Wang, G., Huang, J., Zhang, C., and Shi, J.: Validation dataset of 30 m resolution Landsat-8 fractional snow cover in the Asian Water Tower region (2013–2022) (V1.0), Zenodo [data set], https://doi.org/10.5281/zenodo.10008227, 2023b.
Ke, C.-Q., Li, X.-C., Xie, H., Ma, D.-H., Liu, X., and Kou, C.: Variability in snow cover phenology in China from 1952 to 2010, Hydrol. Earth Syst. Sci., 20, 755–770, https://doi.org/10.5194/hess-20-755-2016, 2016.
Key, J., Liu, Y., Wang, X., Letterly, A., and Painter, T.: Snow and Ice Products from ABI on the GOES-R Series, in: A New Generation of Geostationary Environmental Satellites, 165–177, https://doi.org/10.1016/B978-0-12-814327-8.00014-7, 2020.
Kraaijenbrink, P. D. A., Bierkens, M. F. P., Lutz, A. F., and Immerzeel, W. W.: Impact of a global temperature rise of 1.5 degrees Celsius on Asia's glaciers, Nature, 549, 257–260, https://doi.org/10.1038/nature23878, 2017.
Kuter, S.: Completing the machine learning saga in fractional snow cover estimation from MODIS Terra reflectance data: Random forests versus support vector regression, Remote Sens. Environ., 255, 112294, https://doi.org/10.1016/j.rse.2021.112294, 2021.
Li, M., Zhu, X., Li, N., and Pan, Y.: Gap-Filling of a MODIS Normalized Difference Snow Index Product Based on the Similar Pixel Selecting Algorithm: A Case Study on the Qinghai–Tibetan Plateau, Remote Sens., 12, 1077, https://doi.org/10.3390/rs12071077, 2020.
Li, W., Guo, W., Qiu, B., Xue, Y., Hsu, P.-C., and Wei, J.: Influence of Tibetan Plateau snow cover on East Asian atmospheric circulation at medium-range time scales, Nat. Commun., 9, 4243, https://doi.org/10.1038/s41467-018-06762-5, 2018.
Li, X., Shen, H., Zhang, L., Zhang, H., and Yuan, Q.: Dead Pixel Completion of Aqua MODIS Band 6 Using a Robust M-Estimator Multiregression, IEEE Geosci. Remote Sens. Lett., 11, 768–772, https://doi.org/10.1109/LGRS.2013.2278626, 2014.
Li, X., Fu, W., Shen, H., Huang, C., and Zhang, L.: Monitoring snow cover variability (2000–2014) in the Hengduan Mountains based on cloud-removed MODIS products with an adaptive spatio-temporal weighted method, J. Hydrol., 551, 314–327, https://doi.org/10.1016/j.jhydrol.2017.05.049, 2017.
Li, X., Long, D., Scanlon, B. R., Mann, M. E., Li, X., Tian, F., Sun, Z., and Wang, G.: Climate change threatens terrestrial water storage over the Tibetan Plateau, Nat. Clim. Change, 12, 801–807, https://doi.org/10.1038/s41558-022-01443-0, 2022.
Lindsay, C., Zhu, J., Miller, A., Kirchner, P., and Wilson, T.: Deriving snow cover metrics for Alaska from MODIS, Remote Sens., 7, 12961–12985, https://doi.org/10.3390/rs71012961, 2015.
Liu, T., Chen, D., Yang, L., Meng, J., Wang, Z., Ludescher, J., Fan, J., Yang, S., Chen, D., Kurths, J., Chen, X., Havlin, S., and Schellnhuber, H. J.: Teleconnections among tipping elements in the Earth system, Nat. Clim. Change, 13, 67–74, https://doi.org/10.1038/s41558-022-01558-4, 2023.
Liu, X. and Chen, B.: Climatic warming in the Tibetan Plateau during recent decades, Int. J. Climatol., 20, 1729–1742, https://doi.org/10.1002/1097-0088(20001130)20:14<1729::AID-JOC556>3.0.CO;2-Y, 2000.
López-Burgos, V., Gupta, H. V., and Clark, M.: Reducing cloud obscuration of MODIS snow cover area products by combining spatio-temporal techniques with a probability of snow approach, Hydrol. Earth Syst. Sci., 17, 1809–1823, https://doi.org/10.5194/hess-17-1809-2013, 2013.
Martinec, J.: Snowmelt – runoff model for stream flow forecasts, Hydrol. Res., 6, 145–154, https://doi.org/10.2166/nh.1975.0010, 1975.
Mazari, N., Tekeli, A. E., Xie, H., Sharif, H. I., and Hassan, A. A. E.: Assessment of ice mapping system and moderate resolution imaging spectroradiometer snow cover maps over Colorado Plateau, J. Appl. Remote Sens., 7, 073540, https://doi.org/10.1117/1.JRS.7.073540, 2013.
Metsamaki, S. J., Anttila, S. T., Markus, H. J., and Vepsalainen, J. M.: A feasible method for fractional snow cover mapping in boreal zone based on a reflectance model, Remote Sens. Environ., 95, 77–95, https://doi.org/10.1016/j.rse.2004.11.013, 2005.
Metsämäki, S., Mattila, O.-P., Pulliainen, J., Niemi, K., Luojus, K., and Böttcher, K.: An optical reflectance model-based method for fractional snow cover mapping applicable to continental scale, Remote Sens. Environ., 123, 508–521, https://doi.org/10.1016/j.rse.2012.04.010, 2012.
Naegeli, K., Neuhaus, C., Salberg, A.-B., Schwaizer, G., Weber, H., Wiesmann, A., Wunderle, S., and Nagler, T.: ESA Snow Climate Change Initiative (Snow_cci): Daily global Snow Cover Fraction – snow on ground (SCFG) from AVHRR (1982–2018), version 2.0, NERC EDS Centre for Environmental Data Analysis [data set], https://doi.org/10.5285/3f034f4a08854eb59d58e1fa92d207b6, 2022.
Nagler, T., Schwaizer, G., Molg, N., Keuris, L., Hetzenecker, M., and Metsämäki, S.: ESA Snow Climate Change Initiative (Snow_cci): Daily global Snow Cover Fraction – snow on ground (SCFG) from MODIS (2000–2020), version 2.0, NERC EDS Centre for Environmental Data Analysis [data set], https://doi.org/10.5285/8847a05eeda646a29da58b42bdf2a87c, 2022.
Niittynen, P., Heikkinen, R. K., and Luoto, M.: Decreasing snow cover alters functional composition and diversity of Arctic tundra, P. Natl. Acad. Sci. USA, 117, 21480–21487, https://doi.org/10.1073/pnas.2001254117, 2020.
Notarnicola, C.: Hotspots of snow cover changes in global mountain regions over 2000–2018, Remote Sens. Environ., 243, 111781, https://doi.org/10.1016/j.rse.2020.111781, 2020.
Painter, T. H., Dozier, J., Roberts, D. A., Davis, R. E., and Green, R. O.: Retrieval of subpixel snow-covered area and grain size from imaging spectrometer data, Remote Sens. Environ., 85, 64–77, https://doi.org/10.1016/S0034-4257(02)00187-6, 2003.
Painter, T. H., Rittger, K., McKenzie, C., Slaughter, P., Davis, R. E., and Dozier, J.: Retrieval of subpixel snow covered area, grain size, and albedo from MODIS, Remote Sens. Environ., 113, 868–879, https://doi.org/10.1016/j.rse.2009.01.001, 2009.
Pan, F.: AWT_Site_SD (v1.0.0), Zenodo [data set], https://doi.org/10.5281/zenodo.11367913, 2024a.
Pan, F.: AWT_MODIS_Daily FSC_Product_code (v1.0.0), Zenodo [code], https://doi.org/10.5281/zenodo.11367978, 2024b.
Pan, F., Jiang, L., Zheng, Z., Wang, G., Cui, H., Zhou, X., and Huang, J.: Retrieval of Fractional Snow Cover over High Mountain Asia Using 1 km and 5 km AVHRR/2 with Simulated Mid-Infrared Reflective Band, Remote Sens., 14, 3303, https://doi.org/10.3390/rs14143303, 2022.
Pan, J., Yang, J., Jiang, L., Xiong, C., Pan, F., Gao, X., Shi, J., and Chang, S.: Combination of Snow Process Model Priors and Site Representativeness Evaluation to Improve the Global Snow Depth Retrieval Based on Passive Microwaves, IEEE T. Geosci. Remote, 61, 1–20, https://doi.org/10.1109/TGRS.2023.3276651, 2023.
Parajka, J. and Blöschl, G.: Spatio-temporal combination of MODIS images – potential for snow cover mapping, Water Resour. Res., 44, W03406, https://doi.org/10.1029/2007WR006204, 2008.
Paudel, K. P. and Andersen, P.: Monitoring snow cover variability in an agropastoral area in the Trans Himalayan region of Nepal using MODIS data with improved cloud removal methodology, Remote Sens. Environ., 115, 1234–1246, https://doi.org/10.1016/j.rse.2011.01.006, 2011.
Raleigh, M. S., Rittger, K., Moore, C. E., Henn, B., Lutz, J. A., and Lundquist, J. D.: Ground-based testing of MODIS fractional snow cover in subalpine meadows and forests of the Sierra Nevada, Remote Sens. Environ., 128, 44–57, https://doi.org/10.1016/j.rse.2012.09.016, 2013.
Reuter, H. I., Nelson, A., and Jarvis, A.: An evaluation of void-filling interpolation methods for SRTM data, Int. J. Geogr. Inf. Sci., 21, 983–1008, https://doi.org/10.1080/13658810601169899, 2007.
Riggs, G. A., Hall, D. K., and Román, M. O.: Overview of NASA's MODIS and Visible Infrared Imaging Radiometer Suite (VIIRS) snow-cover Earth System Data Records, Earth Syst. Sci. Data, 9, 765–777, https://doi.org/10.5194/essd-9-765-2017, 2017.
Rittger, K., Painter, T. H., and Dozier, J.: Assessment of methods for mapping snow cover from MODIS, Adv. Water Resour., 51, 367–380, https://doi.org/10.1016/j.advwatres.2012.03.002, 2013.
Rittger, K., Bair, E. H., Kahl, A., and Dozier, J.: Spatial estimates of snow water equivalent from reconstruction, Adv. Water Resour., 94, 345–363, https://doi.org/10.1016/j.advwatres.2016.05.015, 2016.
Rittger, K., Raleigh, M. S., Dozier, J., Hill, A. F., Lutz, J. A., and Painter, T. H.: Canopy Adjustment and Improved Cloud Detection for Remotely Sensed Snow Cover Mapping, Water Resour. Res., 56, e2019WR024914, https://doi.org/10.1029/2019WR024914, 2020.
Rittger, K., Bormann, K. J., Bair, E. H., Dozier, J., and Painter, T. H.: Evaluation of VIIRS and MODIS Snow Cover Fraction in High-Mountain Asia Using Landsat 8 OLI, Front. Remote Sens., 2, 1–15, https://doi.org/10.3389/frsen.2021.647154, 2021.
Roberts, D. A., Gardner, M., Church, R., Ustin, S., Scheer, G., and Green, R. O.: Mapping Chaparral in the Santa Monica Mountains Using Multiple Endmember Spectral Mixture Models, Remote Sens. Environ., 65, 267–279, https://doi.org/10.1016/S0034-4257(98)00037-6, 1998.
Rouault, E., Warmerdam, F., Schwehr, K., Kiselev, A., Butler, H., Łoskot, M., Szekeres, T., Tourigny, E., Landa, M., Miara, I., Elliston, B., Chaitanya, K., Plesea, L., Morissette, D., Jolma, A., Dawson, N., Baston, D., de Stigter, C., and Miura, H.: GDAL (v3.9.0), Zenodo [code], https://doi.org/10.5281/zenodo.11175199, 2024.
Salomonson, V. V. and Appel, I.: Estimating fractional snow cover from MODIS using the normalized difference snow index, Remote Sens. Environ., 89, 351–360, https://doi.org/10.1016/j.rse.2003.10.016, 2004.
Salomonson, V. V. and Appel, I.: Development of the Aqua MODIS NDSI fractional snow cover algorithm and validation results, IEEE T. Geosci. Remote Sens., 44, 1747–1756, https://doi.org/10.1109/Tgrs.2006.876029, 2006.
Selkowitz, D. J., Painter, T. H., Rittger, K. E., Schmidt, G., and Forster, R.: The USGS landsat snow covered area products: methods and preliminary validation, in: Automated Approaches for Snow and Ice Cover Monitoring Using Optical Remote Sensing, edited by: Selkowitz, D. J., The University of Utah, Salt Lake City, Utah, 76–119, https://doi.org/10.13140/RG.2.2.10347.59683, 2017.
Senan, R., Orsolini, Y. J., Weisheimer, A., Vitart, F., Balsamo, G., Stockdale, T. N., Dutra, E., Doblas-Reyes, F. J., and Basang, D.: Impact of springtime Himalayan–Tibetan Plateau snowpack on the onset of the Indian summer monsoon in coupled seasonal forecasts, Clim. Dynan., 47, 2709–2725, https://doi.org/10.1007/s00382-016-2993-y, 2016.
Shea, J. M., Menounos, B., Moore, R. D., and Tennant, C.: An approach to derive regional snow lines and glacier mass change from MODIS imagery, western North America, The Cryosphere, 7, 667–680, https://doi.org/10.5194/tc-7-667-2013, 2013.
Shi, J.: An Automatic Algorithm on Estimating Sub-Pixel Snow Cover from MODIS, Quatern. Sci., 32, 6–15, 2012.
Stillinger, T., Rittger, K., Raleigh, M. S., Michell, A., Davis, R. E., and Bair, E. H.: Landsat, MODIS, and VIIRS snow cover mapping algorithm performance as validated by airborne lidar datasets, The Cryosphere, 17, 567–590, https://doi.org/10.5194/tc-17-567-2023, 2023.
Sulla-Menashe, D., Gray, J. M., Abercrombie, S. P., and Friedl, M. A.: Hierarchical mapping of annual global land cover 2001 to present: The MODIS Collection 6 Land Cover product, Remote Sens. Environ., 222, 183–194, https://doi.org/10.1016/j.rse.2018.12.013, 2019.
Tang, B.-H., Shrestha, B., Li, Z.-L., Liu, G., Ouyang, H., Gurung, D. R., Giriraj, A., and Aung, K. S.: Determination of snow cover from MODIS data for the Tibetan Plateau region, Int. J. Appl. Earth Obs., 21, 356–365, https://doi.org/10.1016/j.jag.2012.07.014, 2013.
Tang, Z., Wang, J., Li, H., and Yan, L.: Spatiotemporal changes of snow cover over the Tibetan plateau based on cloud-removed moderate resolution imaging spectroradiometer fractional snow cover product from 2001 to 2011, J. Appl. Remote Sens., 7, 073582, https://doi.org/10.1117/1.JRS.7.073582, 2013.
Tang, Z., Wang, X., Wang, J., Wang, X., Li, H., and Jiang, Z.: Spatiotemporal Variation of Snow Cover in Tianshan Mountains, Central Asia, Based on Cloud-Free MODIS Fractional Snow Cover Product, 2001–2015, Remote Sens., 9, 1045, https://doi.org/10.3390/rs9101045, 2017.
Tang, Z., Deng, G., Hu, G., Zhang, H., Pan, H., and Sang, G.: Satellite observed spatiotemporal variability of snow cover and snow phenology over high mountain Asia from 2002 to 2021, J. Hydrol., 613, 128438, https://doi.org/10.1016/j.jhydrol.2022.128438, 2022.
Tran, H., Nguyen, P., Ombadi, M., Hsu, K., Sorooshian, S., and Qing, X.: A cloud-free MODIS snow cover dataset for the contiguous United States from 2000 to 2017, Sci. Data, 6, 180300, https://doi.org/10.1038/sdata.2018.300, 2019.
Wang, G., Jiang, L., Wu, S., Shi, J., Hao, S., and Liu, X.: Fractional Snow Cover Mapping from FY-2 VISSR Imagery of China, Remote Sens., 9, 983, https://doi.org/10.3390/rs9100983, 2017.
Wang, G., Jiang, L., Shi, J., Liu, X., Yang, J., and Cui, H.: Snow-Covered Area Retrieval from Himawari–8 AHI Imagery of the Tibetan Plateau, Remote Sens., 11, 2391, https://doi.org/10.3390/rs11202391, 2019.
Wang, G., Jiang, L., Shi, J., and Su, X.: A Universal Ratio Snow Index for Fractional Snow Cover Estimation, IEEE Geosci. Remote Sens. Lett., 18, 721–725, https://doi.org/10.1109/LGRS.2020.2982053, 2021.
Wang, G., Jiang, L., Xiong, C., and Zhang, Y.: Characterization of NDSI Variation: Implications for Snow Cover Mapping, IEEE T. Geosci. Remote, 60, 1–18, https://doi.org/10.1109/TGRS.2022.3165986, 2022.
Wang, G., Jiang, L., Pan, F., Weng, H., and Zhang, Y.: Sensitivity of Snow NDSI to Simulated Snow Grain Shape Characteristics, IEEE Geosci. Remote Sens. Lett., 20, 1–5, https://doi.org/10.1109/LGRS.2022.3233379, 2023.
Wang, T., Peng, S., Lin, X., and Chang, J.: Declining snow cover may affect spring phenological trend on the Tibetan Plateau, P. Natl. Acad. Sci. USA, 110, E2854–E2855, https://doi.org/10.1073/pnas.1306157110, 2013.
Wang, X., Chen, S., and Wang, J.: An Adaptive Snow Identification Algorithm in the Forests of Northeast China, IEEE J. Sel. Top. Appl., 13, 5211–5222, https://doi.org/10.1109/JSTARS.2020.3020168, 2020.
Wu, X., Naegeli, K., Premier, V., Marin, C., Ma, D., Wang, J., and Wunderle, S.: Evaluation of snow extent time series derived from Advanced Very High Resolution Radiometer global area coverage data (1982–2018) in the Hindu Kush Himalayas, The Cryosphere, 15, 4261–4279, https://doi.org/10.5194/tc-15-4261-2021, 2021.
Xiao, X., He, T., Liang, S., Liu, X., Ma, Y., Liang, S., and Chen, X.: Estimating fractional snow cover in vegetated environments using MODIS surface reflectance data, Int. J. Appl. Earth Obs., 114, 103030, https://doi.org/10.1016/j.jag.2022.103030, 2022.
Xing, D., Hou, J., Huang, C., and Zhang, W.: Spatiotemporal Reconstruction of MODIS Normalized Difference Snow Index Products Using U-Net with Partial Convolutions, Remote Sens., 14, 1795, https://doi.org/10.3390/rs14081795, 2022.
Xu, Y., Shi, J., and Du, J.: An Improved Endmember Selection Method Based on Vector Length for MODIS Reflectance Channels, Remote Sens., 7, 6280–6295, https://doi.org/10.3390/rs70506280, 2015.
Yang, J., Jiang, L., Shi, J., Wu, S., Sun, R., and Yang, H.: Monitoring snow cover using Chinese meteorological satellite data over China, Remote Sens. Environ., 143, 192–203, https://doi.org/10.1016/j.rse.2013.12.022, 2014.
Yang, J., Jiang, L., Menard, C., Luojus, K., Lemmetyinen, J., and Pulliainen, J.: Evaluation of snow products over the Tibetan Plateau, Hydrol. Process., 29, 3247–3260, https://doi.org/10.1002/hyp.10427, 2015.
Yang, Y., Chen, R., Liu, G., Liu, Z., and Wang, X.: Trends and variability in snowmelt in China under climate change, Hydrol. Earth Syst. Sci., 26, 305–329, https://doi.org/10.5194/hess-26-305-2022, 2022.
Yao, T., Bolch, T., Chen, D., Gao, J., Immerzeel, W., Piao, S., Su, F., Thompson, L., Wada, Y., Wang, L., Wang, T., Wu, G., Xu, B., Yang, W., Zhang, G., and Zhao, P.: The imbalance of the Asian water tower, Nat. Rev. Earth Environ., 3, 618–632, https://doi.org/10.1038/s43017-022-00299-4, 2022.
Yu, J., Zhang, G., Yao, T., Xie, H., Zhang, H., Ke, C., and Yao, R.: Developing Daily Cloud-Free Snow Composite Products From MODIS Terra–Aqua and IMS for the Tibetan Plateau, IEEE T. Geosci. Remote, 54, 2171–2180, https://doi.org/10.1109/TGRS.2015.2496950, 2016.
Zhang, H., Zhang, F., Zhang, G., Che, T., Yan, W., Ye, M., and Ma, N.: Ground-based evaluation of MODIS snow cover product V6 across China: Implications for the selection of NDSI threshold, Sci. Total Environ., 651, 2712–2726, https://doi.org/10.1016/j.scitotenv.2018.10.128, 2019.
Zhang, H., Zhang, F., Che, T., and Wang, S.: Comparative evaluation of VIIRS daily snow cover product with MODIS for snow detection in China based on ground observations, Sci. Total Environ., 724, 138156, https://doi.org/10.1016/j.scitotenv.2020.138156, 2020.
Zhang, H., Zhang, F., Zhang, G., Yan, W., and Li, S.: Enhanced scaling effects significantly lower the ability of MODIS normalized difference snow index to estimate fractional and binary snow cover on the Tibetan Plateau, J. Hydrol., 592, 125795, https://doi.org/10.1016/j.jhydrol.2020.125795, 2021.
Zhao, K., Peng, D., Gu, Y., Luo, X., Pang, B., and Zhu, Z.: Temperature lapse rate estimation and snowmelt runoff simulation in a high-altitude basin, Sci. Rep., 12, 13638, https://doi.org/10.1038/s41598-022-18047-5, 2022.
Zhu, J. and Shi, J.: An Algorithm for Subpixel Snow Mapping: Extraction of a Fractional Snow-Covered Area Based on Ten-Day Composited AVHRR/2 Data of the Qinghai-Tibet Plateau, IEEE Geosci. Remote Sens. Mag., 6, 86–98, https://doi.org/10.1109/mgrs.2018.2850963, 2018.