the Creative Commons Attribution 4.0 License.
the Creative Commons Attribution 4.0 License.
 | 24 May 2024
National forest carbon harvesting and allocation dataset for the period 2003 to 2018
Daju Wang
Peiyang Ren
Xiaosheng Xia
Zhangcai Qin
Xiuzhi Chen
Wenping Yuan
Forest harvesting is one of the anthropogenic activities that most significantly affect the carbon budget of forests. However, the absence of explicit spatial information on harvested carbon poses a huge challenge in assessing forest-harvesting impacts, as well as the forest carbon budget. This study utilized provincial-level statistical data on wood harvest, the tree cover loss (TCL) dataset, and a satellite-based vegetation index to develop a Long-term harvEst and Allocation of Forest Biomass (LEAF) dataset. The aim was to provide the spatial location of forest harvesting with a spatial resolution of 30 m and to quantify the post-harvest carbon dynamics. The validations against the surveyed forest harvesting in 133 cities and counties indicated a good performance of the LEAF dataset in capturing the spatial variation of harvested carbon, with a coefficient of determination (R2) of 0.83 between the identified and surveyed harvested carbon. The linear regression slope was up to 0.99. Averaged from 2003 to 2018, forest harvesting removed 68.3 ± 9.3 Mt C yr−1, of which more than 80 % was from selective logging. Of the harvested carbon, 19.6 ± 4.0 %, 2.1 ± 1.1 %, 35.5 ± 12.6 % 6.2 ± 0.3 %, 17.5 ± 0.9 %, and 19.1 ± 9.8 % entered the fuelwood, paper and paperboard, wood-based panels, solid wooden furniture, structural constructions, and residue pools, respectively. Direct combustion of fuelwood was the primary source of carbon emissions after wood harvest. However, carbon can be stored in wood products for a long time, and by 2100, almost 40 % of the carbon harvested during the study period will still be retained. This dataset is expected to provide a foundation and reference for estimating the forestry and national carbon budgets. The 30 m × 30 m harvested-carbon dataset from forests in China can be downloaded at https://doi.org/10.6084/m9.figshare.23641164.v2 (Wang et al., 2023).
- Article
(7485 KB) - Full-text XML
-
Supplement
(2527 KB) - BibTeX
- EndNote


As a critical terrestrial ecosystem type, forests play a pivotal role in regulating the global carbon cycle (Dixon et al., 1994). Over the period 2001 to 2019, global forests sequestrated 2.07 Gt C yr−1 from the atmosphere (Harris et al., 2021), contributing more than 70 % of the global terrestrial carbon sinks (Friedlingstein et al., 2022). Forests also provide numerous important ecosystem services to society (Costanza et al., 1997), which may substantially impact the forests carbon sink (Lal et al., 2013). One of the most important services is the provision of wood products (Deal and White, 2012), which results in the transference of carbon from forest ecosystems into the social system. The carbon harvested from forests is typically transferred into the pools of harvested wood products (HWPs) (the full names and abbreviations of terminologies are listed in Table S1 in the Supplement) through the usage of wood for constructions, furniture, and fine papers, among others. These products are eventually decomposed and emitted into the atmosphere with different turnover times (IPCC, 2014, 2019a). For example, when harvested wood is used to make paper, the carbon within the paper decomposes and returns to the atmosphere within several years (Brunet-Navarro et al., 2017). On the contrary, the harvested carbon entering the wood used for constructions has a slow turnover rate and can be stored for many years (Brunet-Navarro et al., 2017). Previous studies have highlighted the large uncertainties in estimating carbon emissions of wood post-harvest due to a lack of information about the proportion of wood entering various wood pools (Skog et al., 2004).
In China, forests are playing an increasingly important role in terrestrial carbon sinks benefiting from long-term afforestation projects (Liu et al., 2014). A recent study based on satellite data revealed that China is one of the few countries that has experienced persistent greening over the past decades (Chen et al., 2019; Yuan et al., 2019). Unlike India, where croplands dominate greening, nearly half of China's greening comes from forests (Chen et al., 2019). However, despite these positive trends, China ranks as the second-largest timber consumer and the largest wood importer globally (Research and Market, 2019). In 2017, the consumption of wood in China reached 1.925×10⁸ m3, with 43.6 % of that consumption being supplied by domestic harvests (Research and Market, 2019). A previous study has highlighted that harvesting is the primary cause of forest disturbance in China, accounting for 85 % of the average annual forest loss (Curtis et al., 2018). However, the impacts of forest harvesting on the terrestrial carbon cycle have not been estimated yet due to a lack of available data on harvested carbon. Accurate forest-harvesting data are crucial for measuring the national carbon sink–source balance, an important component of national carbon budget analysis related to forest resources and wood utilization (Winjum, et al., 1998).
Although some efforts have been made, there are still large uncertainties in estimating harvested carbon in forest ecosystems (Hurtt et al., 2011, 2020). For example, the Land-Use Harmonization 2 (LUH2) dataset provides annual harvested biomass carbon data from primary and secondary forests (Hurtt et al., 2011, 2020). However, the spatial resolution of the LUH2 dataset (0.25° × 0.25°) is too coarse to analyze the dynamics of forest ecosystems at the regional or local scales, and its performance in assessing carbon harvest has not been examined in China. In addition, to our knowledge, no studies have been conducted to quantify the proportion of harvested wood or carbon entering various wood pools, which is crucial for estimating carbon emissions returning to the atmosphere (Skog et al., 2004; Johnston and Radeloff, 2019). Over the past decades, constructions, paper-making, and furniture manufacturing have shown substantial changes in China (Zhang et al., 2019; FAO, 2020), largely influencing the proportion of harvested carbon among various wood pools and the magnitude of emissions.
In this study, we developed the Long-term harvEst and Allocation of Forest Biomass (LEAF) dataset to provide (1) the spatial location of harvested carbon with a high resolution of 30 m, (2) the proportion of harvested carbon allocated into various wood pools, and (3) the lagged carbon emissions of harvested carbon from the aforementioned wood pools. The tree cover loss (TCL) dataset developed by Hansen et al. (2013) and the interannual variation of a satellite-based vegetation index were used to determine the location of harvested carbon, and the provincial statistical biomass storage provided by the China Forestry and Grassland Statistical Yearbook was used to quantify the magnitude of harvested carbon. Post-harvest carbon dynamics were estimated based on a first-order decay (FOD) function according to the post-harvest wood use provided by the statistical data (IPCC, 2014, 2019a).
This study aimed to generate the LEAF dataset, which is a component of the Terrestrial Ecosystem Disturbance (TED) dataset, referred to as TED-LEAF. The LEAF dataset includes the location and magnitude of forest harvesting and the estimates of post-harvest carbon dynamics. The identification of forest harvesting was based on the detection of changes in multi-temporal vegetation indices. Combined with statistical harvest data, the forest harvesting and other disturbances causing such changes could be separated. Utilizing the classification of HWPs provided by statistical data, we estimated the delayed carbon emissions up to 2100 from HWPs based on IPCC methodologies with China-specific activity data.
2.1 Method of calculating harvested carbon
We aimed to identify two types of forest harvesting: clear-cutting and selective logging (Fig. 1). In this study, clear-cutting is the harvesting of an entire stand at once on a scale of 30 m × 30 m, while selective logging is the harvesting of a portion of the stand within that area that is suitable and should be harvested.
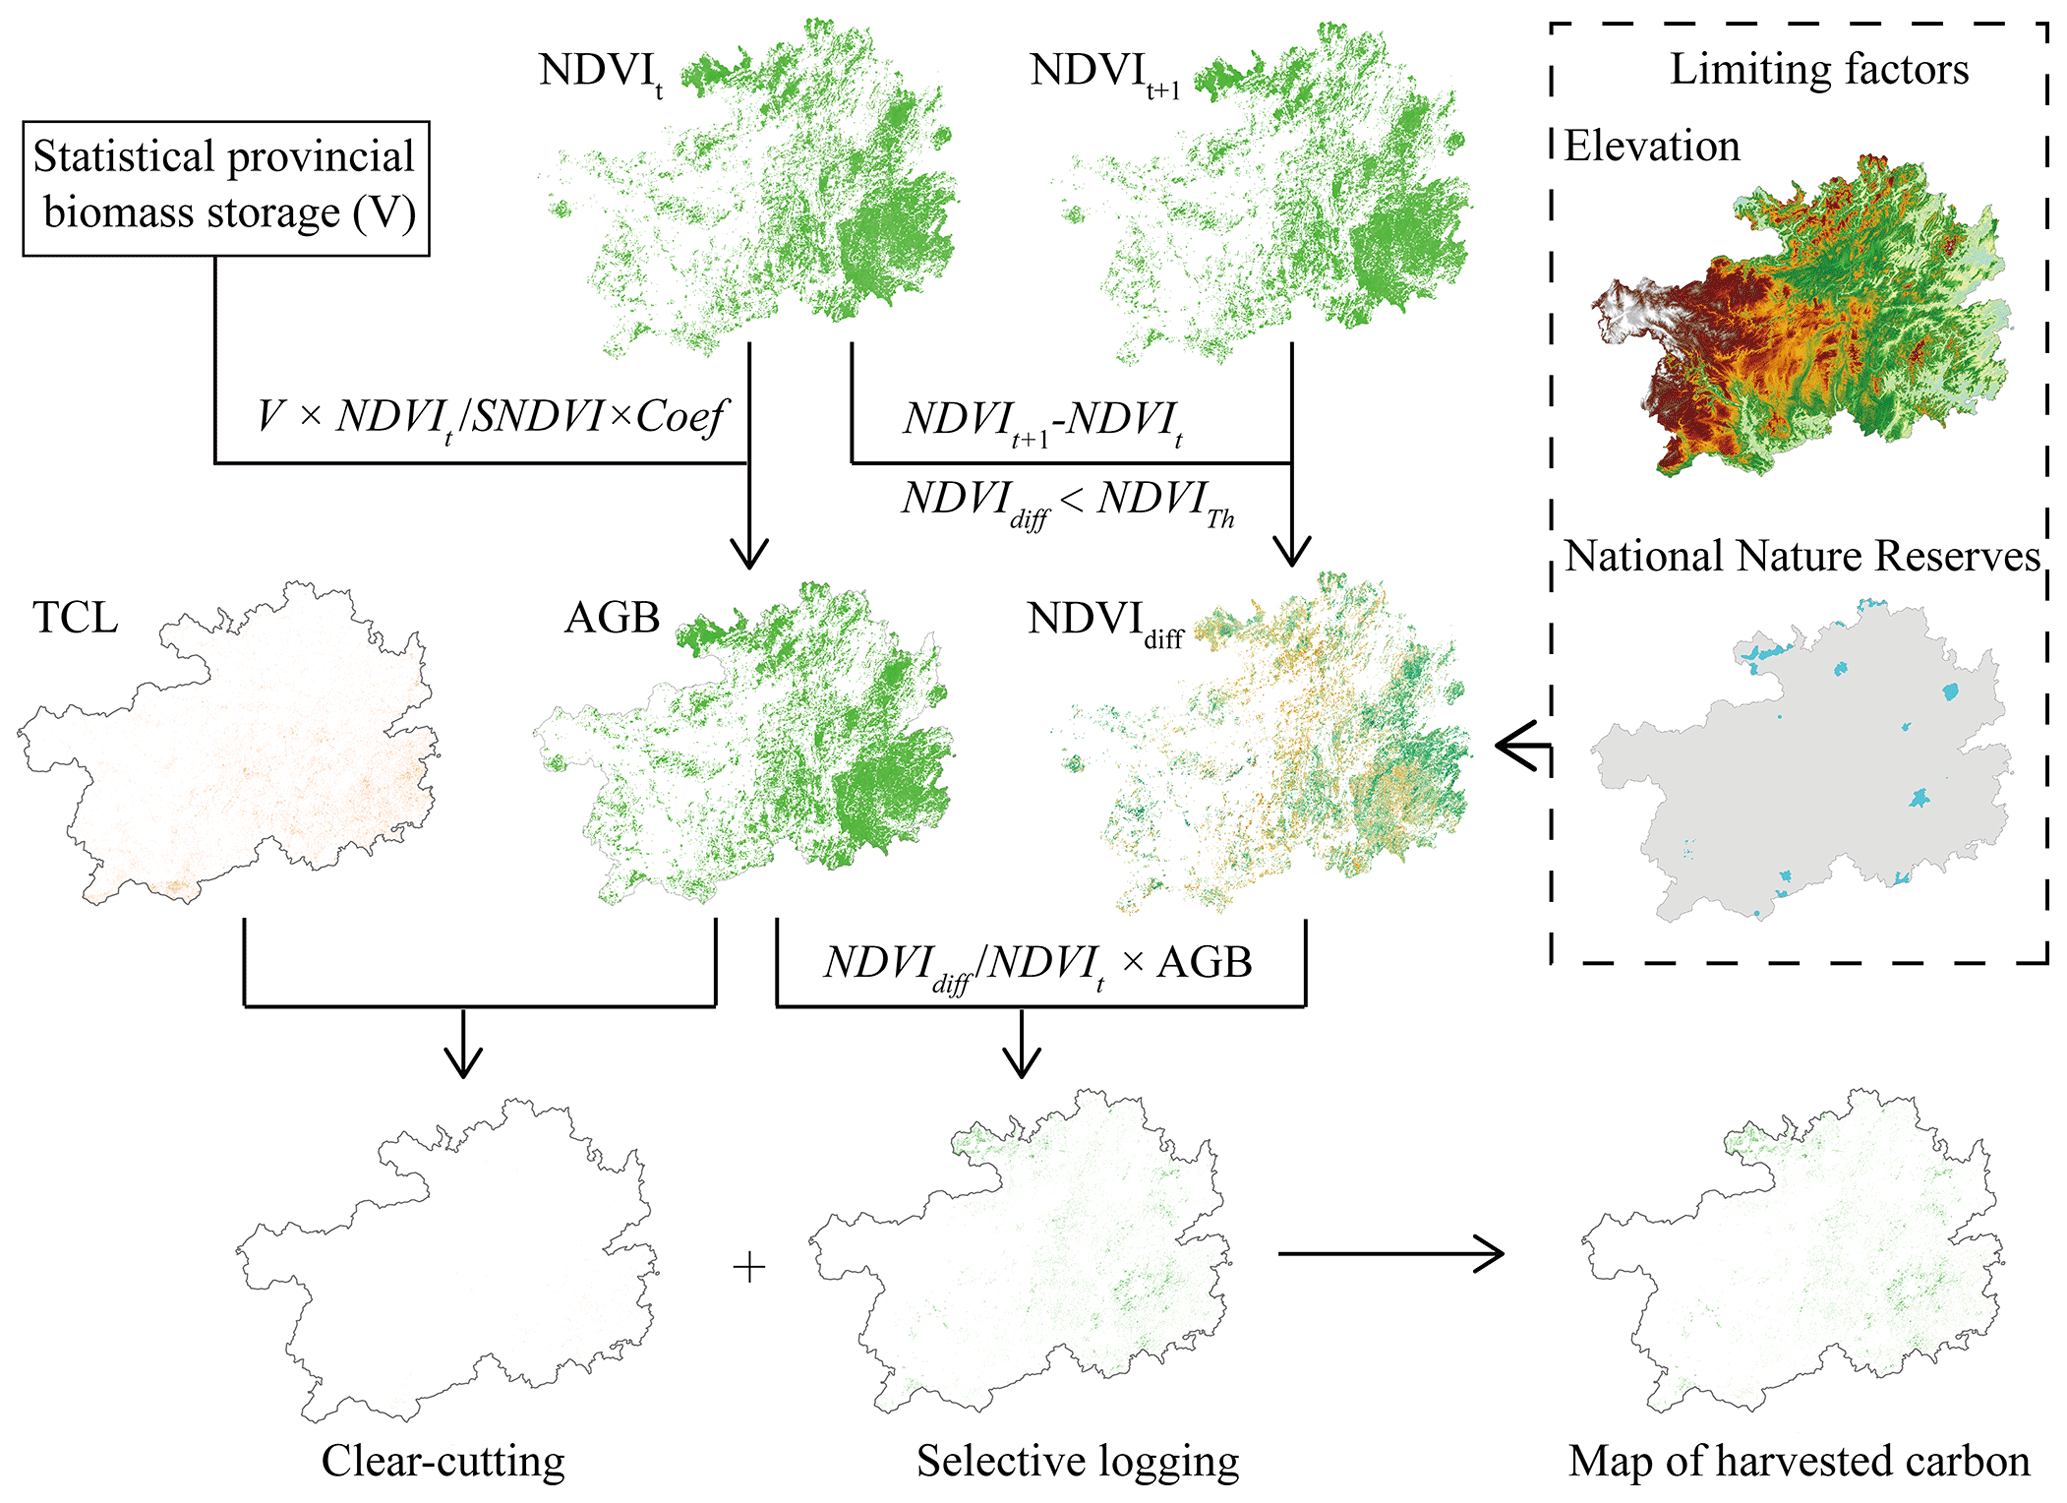
Figure 1Flowchart for mapping forest carbon harvesting.
For clear-cutting, the location was determined using the TCL dataset produced by Hansen et al. (2013). The TCL dataset indicates stand replacement disturbance or the complete removal of tree cover canopy at a scale of 30 m × 30 m. It has been widely used to identify deforestation globally or in multiple regions (Hansen et al., 2013; Curtis et al., 2018). To calculate the harvested carbon from clear-cutting, it was necessary to determine the aboveground biomass carbon (AGB, t C) storage for each pixel. Only the ninth National Forest Inventory (NFI) provided both provincial forest AGB density (CD, t C ha−1) and forest area (S, ha). Then, we calculated pixel-level (30 m × 30 m) AGB storage for 2014 to 2018 as follows:
where AGBj indicates the AGB of the jth forest pixel in a given province and year, NDVIj denotes the normalized difference vegetation index (NDVI) of the jth forest pixel in that province for that year, and SNDVI is the sum of the NDVI of all forest pixels in that province for that year. According to the province-level biomass storage (V, m3) provided by the sixth to eighth NFIs covering 1998 to 2013 at 5-year intervals, this study used the following method to calculate pixel-level (30 m × 30 m) AGB storage for 2003 to 2013:
where Coef (t C m−3) is the coefficient that converts biomass storage (V) to biomass carbon (AGB). Combining the provincial forest biomass storage (V9, m3) from the ninth NFI, we calculated the provincial Coef (Table S2) as follows:
Then, the harvested carbon was calculated for all pixels corresponding to clear-cutting derived from the TCL dataset. The total harvested carbon from clear-cutting (HCC, t C) in a given province can be calculated by aggregating all pixels occurring tree cover loss. For selective logging, we developed a satellite-based method to identify the location and magnitude of selective logging. The method was based on the principle of multitemporal satellite-based vegetation index analysis and detected the changes of NDVI between 2 adjacent years. This approach relied on two fundamental assumptions. First, we assumed that NDVI values decreased as a result of selective logging. Therefore, we calculated the NDVI difference (NDVIdiff) between the current year (NDVIt) and the subsequent year (NDVIt+1) for all pixels (Eq. 4) and determined the possible logging locations with decreased NDVIdiff, where NDVIdiff<0 indicated potential selective logging.
Second, we assumed that the reductions in NDVI values resulting from selective logging would be more significant compared to the decreases caused by other factors such as droughts, heatwaves, ice storms, and insect outbreaks (Yuan et al., 2014); note that we did not consider fires due to their low frequency in China (Curtis et al., 2018). Changes in vegetation coverage caused by logging activities were expected to have a drastic and rapid impact on ecosystems compared to other environmental changes and disturbances. Therefore, the decreased magnitude of NDVI values due to selective logging was assumed to be the largest. Based on this assumption, we can identify selective-logging areas by focusing on pixels exhibiting larger NDVIdiff. For a specific province, all pixels with negative NDVIdiff values were sorted by ascending order in NDVIdiff. The pixels at the front of the sorted list had more negative NDVIdiff values and a larger likelihood of being logging locations. Thereby, a threshold of NDVIdiff (NDVITh) was needed to distinguish selective logging from other disturbed pixels. Selective logging was considered to have occurred only when NDVIdiff<NDVITh. Then, the harvested carbon (HCS, tC) was calculated in all pixels corresponding to selective logging according to Eq. (5):
Therefore, the province-level statistical harvested carbon (SHC) was used to determine the NDVITh of each province, which made the sum of HCC and HCS equal to SHC. Theoretically, the determined NDVITh should be less than 0. However, in several provinces, when NDVITh was set to 0, the sum of HCC and HCS (identified harvested carbon) was still lower than SHC (e.g., Anhui), implying that the identified harvested carbon was underestimated. Then we assigned the unidentified harvested carbon (SHC–HCC–HCS) to pixels where selective logging occurred:
where HCS1 j is the harvested carbon added by the jth pixel where selective logging occurred, NDVIdiff j indicates the NDVIdiff of the jth pixel, and SNDVIdiff is the sum of the NDVIdiff of all pixels where selective logging occurred in that province. This approach increased the harvested carbon for all pixels where selective logging occurred; thus, we also examined whether the harvested carbon exceeded their AGB at the pixel scale. If so, we counted these pixels as clear-cutting. To assess the accuracy and validity of the dataset, we additionally quantified the proportion of pixels with harvested carbon exceeding their AGB compared to the total number of harvested pixels at the province level.
In addition, this study assumed that forest harvesting did not occur in the national nature reserves and high-altitude regions because of high transport costs and harvesting expenses. For the Tibetan Plateau and Yunnan Province, we assumed no harvesting at elevations higher than 2500 m. In the other provinces, harvesting was assumed to be absent at elevations higher than 1500 m, in accordance with Nabuurs et al. (2019).
2.2 Annual carbon changes from in-use and end-use HWPs
The harvested wood was allocated into six wood pools (Fig. 2): (1) fuelwood pool, which is the sum of commercial fuelwood and non-commercial fuelwood (i.e., farmers' fuelwood), where the wood is burned as fuel, resulting in immediate carbon emissions through combustion; (2) paper and paperboard pool, including household paper, printing paper, packaging paper, etc.; (3) wood-based panel pool, including plywood, fiberboard, particle board, and other wood-based panels made from roundwood, wood residues (such as bark, branches, sawdust), or small stems bonded with adhesives – these are commonly used as decorative panels for various applications like wall cladding and ceiling finishes; (4) solid wooden furniture pool, referring to solid wooden household items such as tables, chairs, wooden beds, etc.; (5) structural constructions pool, referring to the structural components used to support buildings, such as beams, columns, and trusses; and (6) residue pool, including leaves, killed understory vegetation, and unutilized wood residues, which are typically left on the logging site or are treated as fuel (Lippke et al., 2011; Stockmann et al., 2012) and which were assumed to be fuel in this study. The wood pools of (2), (3), (4), and (5) belong to the HWP pool, where the carbon will remain stored until the products are retired from use or reach the end of their service life (Table S3) and are consequently discarded. Subsequently, these discarded products are then sent directly to landfills, where they decompose (Stockmann et al., 2012; IPCC, 2019a).
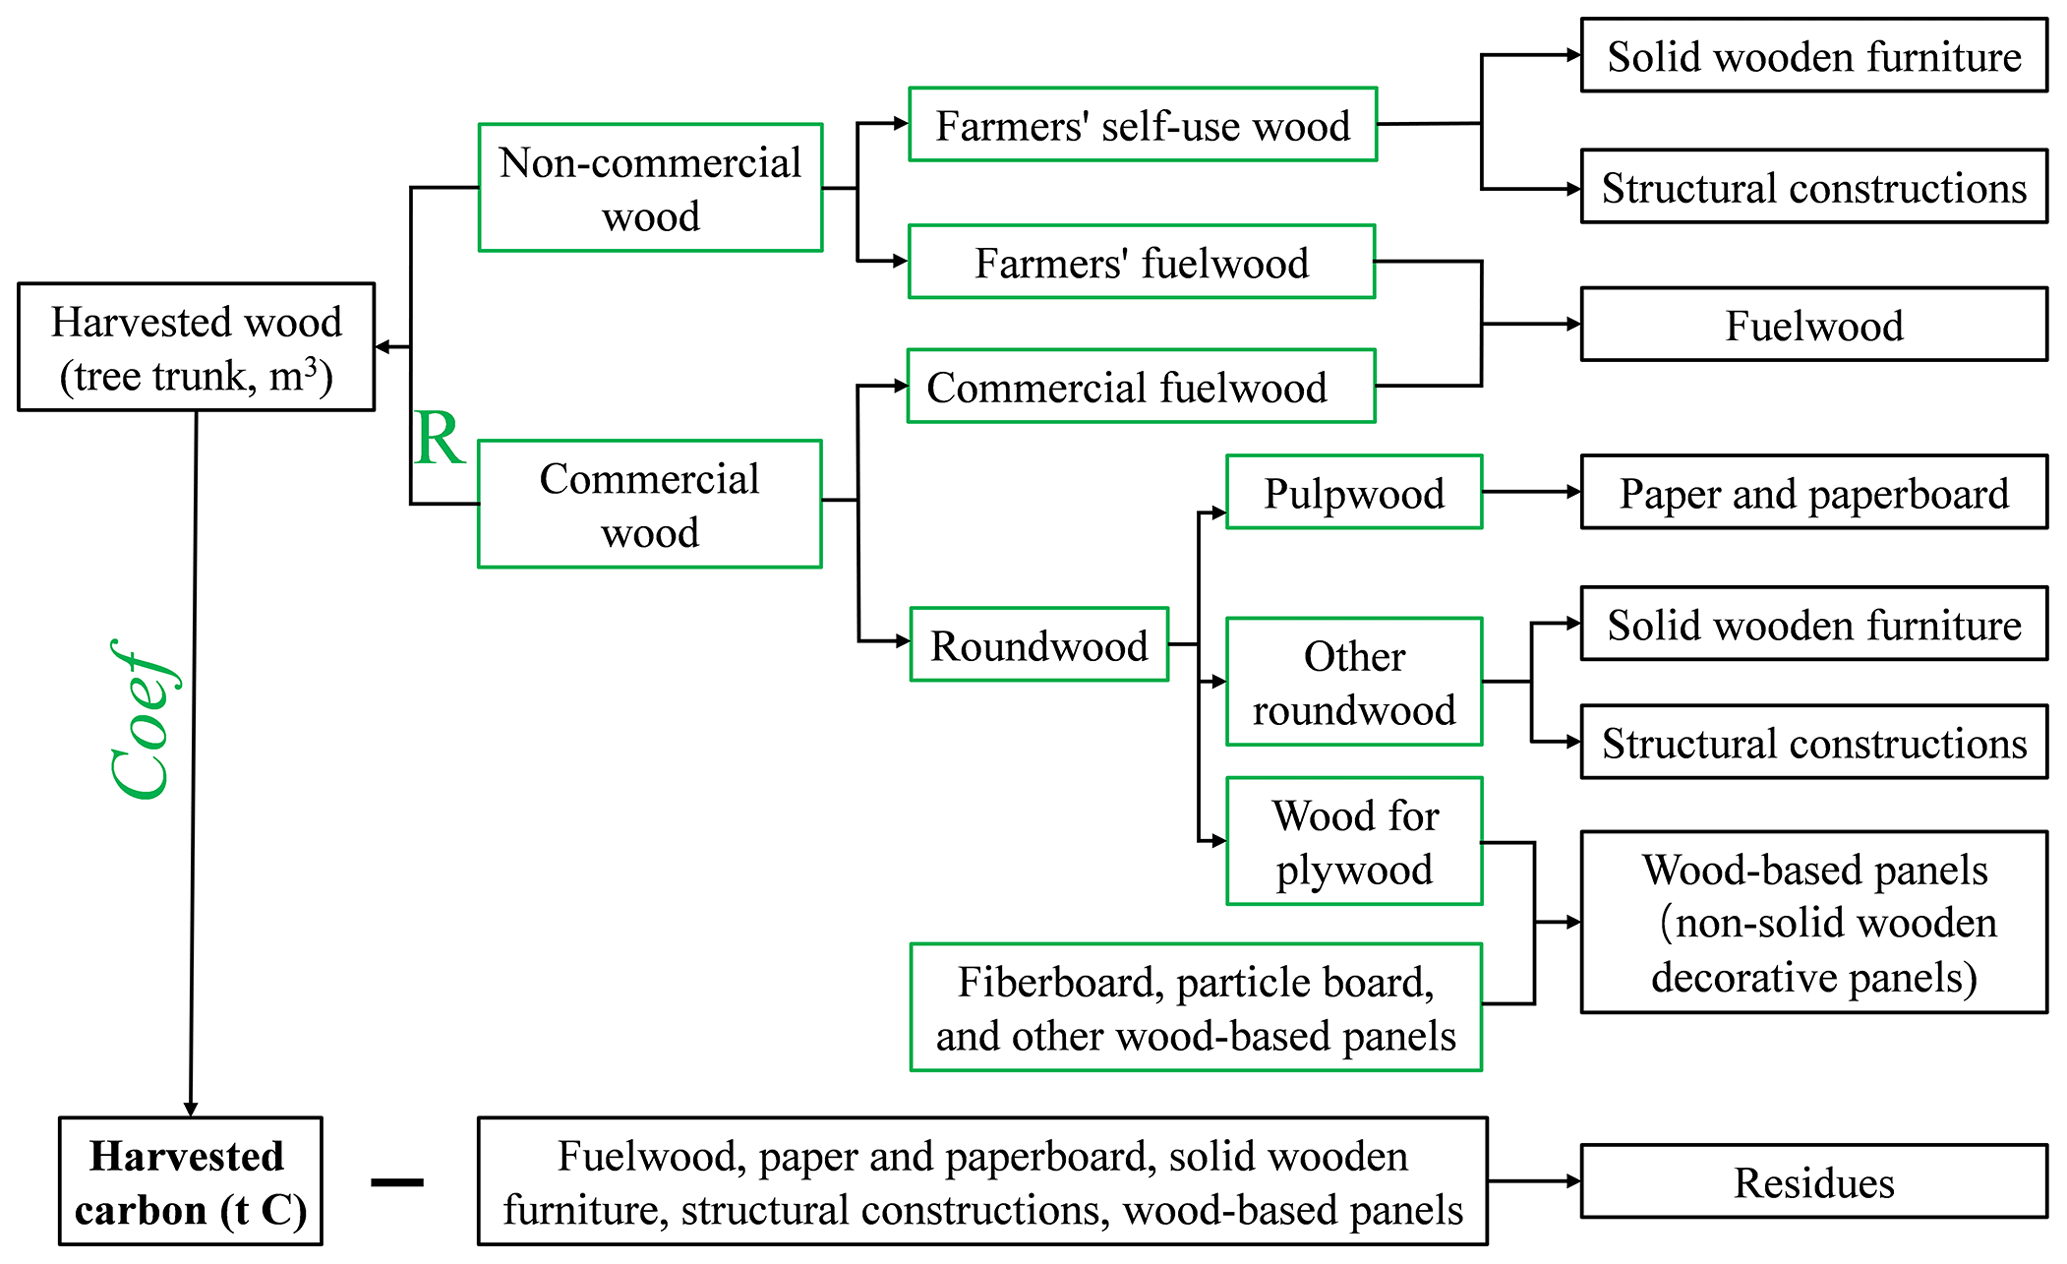
Figure 2The allocation of post-harvest wood to the six wood pools. The green boxes indicate the variables that are available from the China Forestry and Grassland Statistics Yearbook. R is wood output rate of commercial wood, and Coef (t C m−3) is the coefficient that converts harvested wood (m3) to harvested carbon (t C) (i.e., biomass carbon of trunks, branches, leaves, and understory vegetation).
In this study, the volume (m3) of fuelwood, pulpwood (wood for paper and paperboard), and wood-based panels and the sum volume (m3) of wood for solid wooden furniture and structural constructions can be obtained directly from the China Forestry Statistical Yearbook. The structural constructions and solid wooden furniture pools were allocated as the percentages of 74.6 ± 6.2 % and 25.4 ± 6.2 % of their sum, respectively, according to the China Timber and Wood Products Distribution Industry Yearbook. The wood in pools (1) to (5) was converted into carbon, with a conversion factor of 0.229 for fuelwood and roundwood and 0.269 for wood-based panels. Then, the carbon entering the residue pool (ResidueC) can be calculated by subtracting the carbon in pools (1) to (5) from the total harvested carbon (SHC in Eq. (21) of Sect. 2.3.2), as in Eq. (7):
where SHC (Eq. (21) is the total harvested carbon for a given province, Woutput represents the volume of commercial wood output, and Flog represents the volume of non-commercial wood. Unlike commercial wood, the actual logging volume of non-commercial wood can be used effectively by farmers (Sect. 2.3.2). The sum of Woutput and Flog is the total volume of pools (1) to (4), and, here, wood-based panels do not include plywood (Fig. 2).
2.2.1 Annual carbon changes in in-use HWPs
Carbon stocks and decays from in-use HWPs were calculated using the methodologies for estimating carbon removal from HWPs described in the 2006 IPCC Guidelines for National Greenhouse Gas Inventories (IPCC, 2006a) and the 2013 Revised Supplementary Methods and Good Practice Guidance Arising from the Kyoto Protocol (IPCC, 2014). “Decay” in this paper refers to the discarding of HWPs from end uses (sent to landfills) and not biological decay. Moreover, here, we focused on the carbon fate of wood harvested in China; the imports and exports were not considered. The FOD method (Pingoud and Wagner, 2006) was used to estimate the carbon change in the HWPs pool as follows:
where i denotes the year, C(i) is the carbon stock in the HWP pool at the beginning of year i, and k () is the decay constant (yr−1). HL is the number of years it takes to lose half of the existing material in the pool, which is a function of the country-specific service life of particular HWPs (HL = service life × ln(2)) (IPCC, 2019b); k values for paper and paperboard, wood-based panels, solid wooden furniture, and structural constructions were calculated to be 0.333, 0.125, 0.067, and 0.025, respectively. Inflow(i) is the inflow to the HWP pool during year i, and ΔC(i) represents the carbon stock change of the HWP pool during year i. Next, the amount of discarded organic carbon (DOC) deposited in the landfills as the HWPs go out of use in year i was calculated using Eq. (10):
2.2.2 Annual carbon changes in landfills
The DOC deposited in landfills was divided into three parts: (1) DOC for aerobic decomposition (DOCar), producing CO2 until all available oxygen has been used up; (2) DOC for anaerobic decomposition (DOCan), producing both CH4 and CO2; (3) DOC that will not be decomposed but stored long-term in the landfill (DOCls).
The DOCar was calculated as follows:
where far denotes the proportion of DOC undergoing aerobic decomposition. Based on the landfill situation in China, the far was assumed to be 0.28 ± 0.15 (Table S4). The DOC undergoes aerobic decomposition and is released as CO2 in year i:
The DOCan is calculated with Eq. (13) as follows:
where DOCf indicates the fraction of DOC that can be decomposed under anaerobic conditions (Table S5). The annual carbon change in DOCan in the landfill was calculated according to the FOD method (Pingoud and Wagner, 2006):
where DOC represents the DOCan accumulated in the landfill at the end of year i, and DOC denotes DOCan decomposed in the landfill in year i. The anaerobic decomposition generally occurs in the following year of deposition. Furthermore, k is the decay constant (yr−1), estimated based on the environmental conditions of landfill in China (Table S5). Then, the potentials to generate CH4 and CO2 from the anaerobic decomposition of DOCan were calculated as follows:
where CH and CO are CH4 and CO2 produced by anaerobic decomposition in landfills in year i. F denotes the volume fraction of CH4 in the generated landfill gas, with a value of 0.5 ± 0.1 (Cai et al., 2018). RT and OXT are the recovery rate and oxidation rate of CH4 in China (Table S4). The total CO2 decomposed from DOC in year i was the sum of CO and CO. The CH4 emissions were transformed to CO2 equivalents (CO2e) to harmonize calculations of the overall global warming potential (IPCC, 2023).
The DOCls can be calculated as follows:
Then, the carbon stock in the landfill at the end of year i was calculated as follows:
2.3 Datasets
2.3.1 National Forest Inventories
The NFIs provided nine periods of provincial biomass storage for 1973–1976, 1977–1981, 1984–1988, 1989–1993, 1994–1998, 1999–2003, 2004–2008, 2009–2013, and 2014–2018 (National Forestry and Grassland Administration, 2019). We used the biomass storage data during the sixth–ninth NFIs to generate the distribution of AGB for 2003–2018.
2.3.2 Statistical forest-harvesting data
The annual provincial wood output (m3), extracted from the China Forestry and Grassland Statistical Yearbook, was categorized into two main types: commercial and non-commercial wood. Commercial wood includes fuelwood and roundwood, and roundwood was further divided into pulpwood, wood for plywood, and other roundwood (roundwood for direct use, internally processed roundwood, etc.). Non-commercial wood included farmers' fuelwood (i.e., the volume of wood logged by farmers for burning) and farmers' self-use wood (i.e., the volume of wood logged by farmers for their personal consumption). Non-commercial wood refers to the actual logged volume, which can be totally used by farmers. Commercial wood refers to the wood output volume of peeled wood that meets the national wood standards and not the actual logging volume. After wood logging, preliminary processing (such as peeling, sawing, etc.) is carried out, and some unusable or poor-quality wood is eliminated. Therefore, the commercial wood output is generally less than the actual logged wood (National Forestry Administration, 2000). Based on the provincial wood output rate (R, i.e., the ratio of commercial wood output to wood logged) provided by China's timber production plan from the National Bureau of Statistics (Table S2), we calculated the actual annual wood logged for each province as follows:
where Wlog is the actual annual wood logged for producing commercial wood, and Woutput is the volume of commercial wood output. Then, the total harvested carbon (i.e., the SHC in Sect. 2.1) for a given province was calculated as follows:
where Flog is the volume of non-commercial wood, and Coef (t C m−3) is the coefficient that converts harvested wood (m3) to harvested carbon (t C) (i.e., biomass carbon of trunks, branches, leaves, and understory vegetation) (Table S2).
2.3.3 Surveyed forest-harvesting data
The surveyed forest-harvesting data, i.e., the harvested volume at the city and county level, were retrieved from the official website of each provincial Forestry Bureau. To ensure the effective implementation of the forest-harvesting quota system, the provincial Forestry Bureau randomly selects several cities and/or counties, conducting comprehensive field inspections of the annual forest harvesting. The actual annual harvest volume of a specific city or county is determined through comprehensive cross-validation of multiple methods, including declaration and approval record reviewing, on-site measurements, remote sensing monitoring, etc. These techniques are employed to ensure the accuracy and reliability of the obtained harvest data. There were 133 records nationwide, available from 2006 to 2018, concentrated in the provinces of Guizhou, Yunnan, Zhejiang, and Sichuan (Fig. S1 in the Supplement).
2.3.4 Forest cover map
The Chinese Forest Cover Dataset, reconstructed by fusing the NFIs and 20 land use and land cover datasets, was used as the forest cover base map. This forest cover accurately depicts the historical changes in China's forest cover in the period of 1980–2015, with overall accuracy from 76.9 % to 99.4 % (Xia et al., 2023).
2.3.5 Satellite-based vegetation index
The NDVI dataset from 2000 to 2020 calculated by Dong et al. (2021) was applied to allocate AGB and identify selective logging. This NDVI dataset was calculated using all Landsat 5,7, and 8 remote sensing data for the whole year; the NDVI maxima in each image year were obtained by data pre-processing and data smoothing (Dong et al., 2021).
2.3.6 Mask data
This study used the elevation and national nature reserves to exclude the regions where harvesting rarely occurs. The elevation dataset was obtained from the Resource and Environment Science and Data Center of the Chinese Academy of Sciences (https://www.resdc.cn/, last access: 1 August 2022), and the distribution of national nature reserves was provided by the National Earth System Science Data Center of the National Science and Technology Infrastructure of China (http://www.geodata.cn, last access: 1 August 2022).
2.4 Accuracy assessment
The surveyed forest-harvesting data at the city and county level were employed to validate the accuracy of the LEAF dataset by conducting a comparison with the estimated harvested carbon. The relationships between the estimated harvested carbon and the corresponding surveyed harvested carbon were assessed by linear regression. Following this, the coefficient of determination (R2) and the slope of linear regression can be calculated, and the closer these two values are to 1, the better the estimates are.
3.1 Accuracy evaluation of the LEAF dataset
Accuracy evaluation of the LEAF dataset generated from this study showed good performance in indicating spatial variations of harvested carbon in China. This study used province-level statistical harvested carbon to determine the threshold for identifying selective logging and used city- and county-level surveyed harvested carbon ranging from 2006 to 2018 to examine the performance. The estimated harvested carbon showed high consistency with surveyed harvested carbon, with R2 of 0.83 and a linear regression slope of 0.99 (Fig. 3).
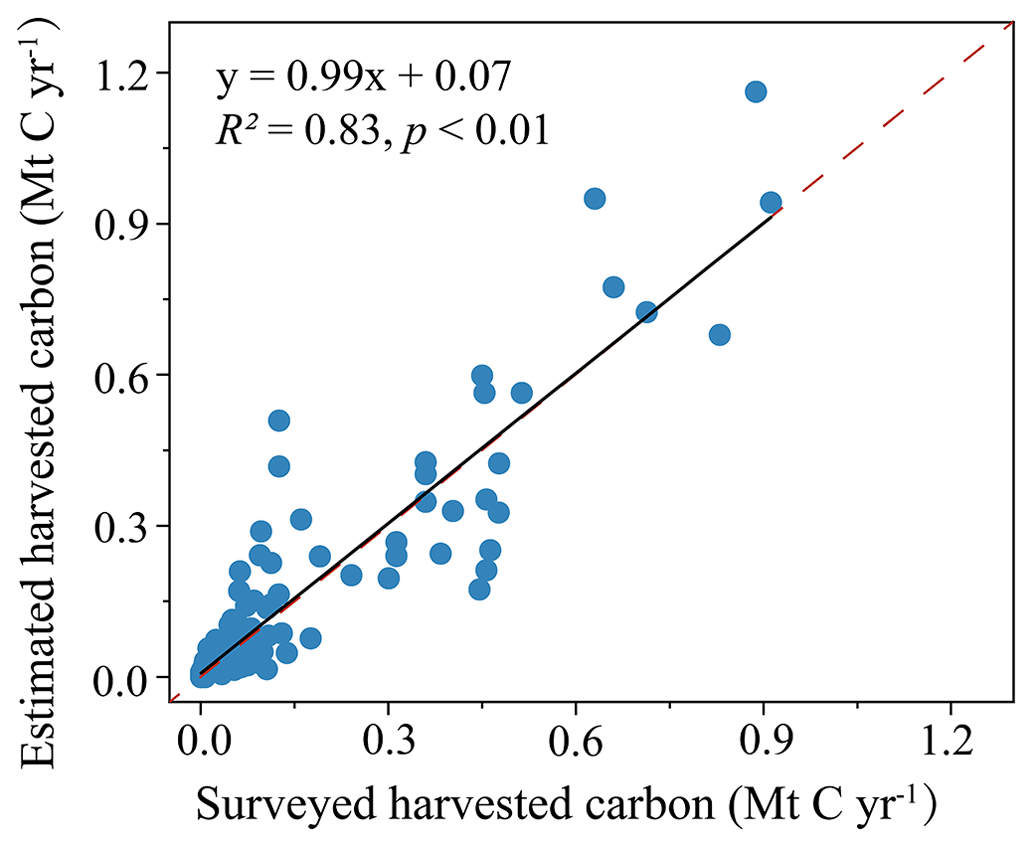
Figure 3Comparison of estimated and surveyed harvested carbon from the official website of each provincial forestry bureau at the city and county levels across all investigated provinces. The solid line indicates the regression line, and the dashed red line indicates the 1:1 line.
The validation also showed the performance of the LEAF dataset across various provinces and periods. The dataset exhibited excellent skill in simulating the spatial variation of harvested carbon across all surveyed provinces, with R2 between estimates and surveyed data ranging from 0.24 to 0.96 (Fig. S2). Zhejiang performed the best (Fig. S2e), while Sichuan's performance was relatively low, with R2 less than 0.5 (Fig. S2c). The LEAF dataset also effectively reproduced the spatial variations of harvested carbon across different periods, with R2 values ranging from 0.31 to 0.99 (Fig. S3). The estimates for 2013 and 2017 demonstrated superior performance, with both linear regression slopes approximating 1 (Fig. S3c and g). However, except for 2016, estimates from other periods displayed varying degrees of underestimation or overestimation (Fig. S3).
3.2 Spatial and temporal patterns of harvested carbon in China
There was large heterogeneity in harvested carbon over the regional scale. Harvesting mainly occurred in eastern and southern China and rarely occurred in northwestern China (Fig. 4a and b). Guangxi Province recorded the highest harvested carbon, constituting approximately 30 % of China's annual total harvested carbon. This volume is 2.5 times larger than that of Fujian, the province with the second highest harvested carbon (Fig. 4c). In terms of harvesting methods, over 80 % of the nationwide clear-cutting-harvested carbon originated from Guangxi, Guangdong, Fujian, Yunnan, and Jiangxi (Fig. 4c). Forest harvesting in Jiangxi, Guangdong, Yunnan, and Hainan was dominated by clear-cutting; in these provinces, harvested carbon from clear-cutting comprised more than 50 % of the total harvested carbon (Figs. 4c, 5a). For other provinces, selective logging was the main method of forest harvesting (Fig. 5b).
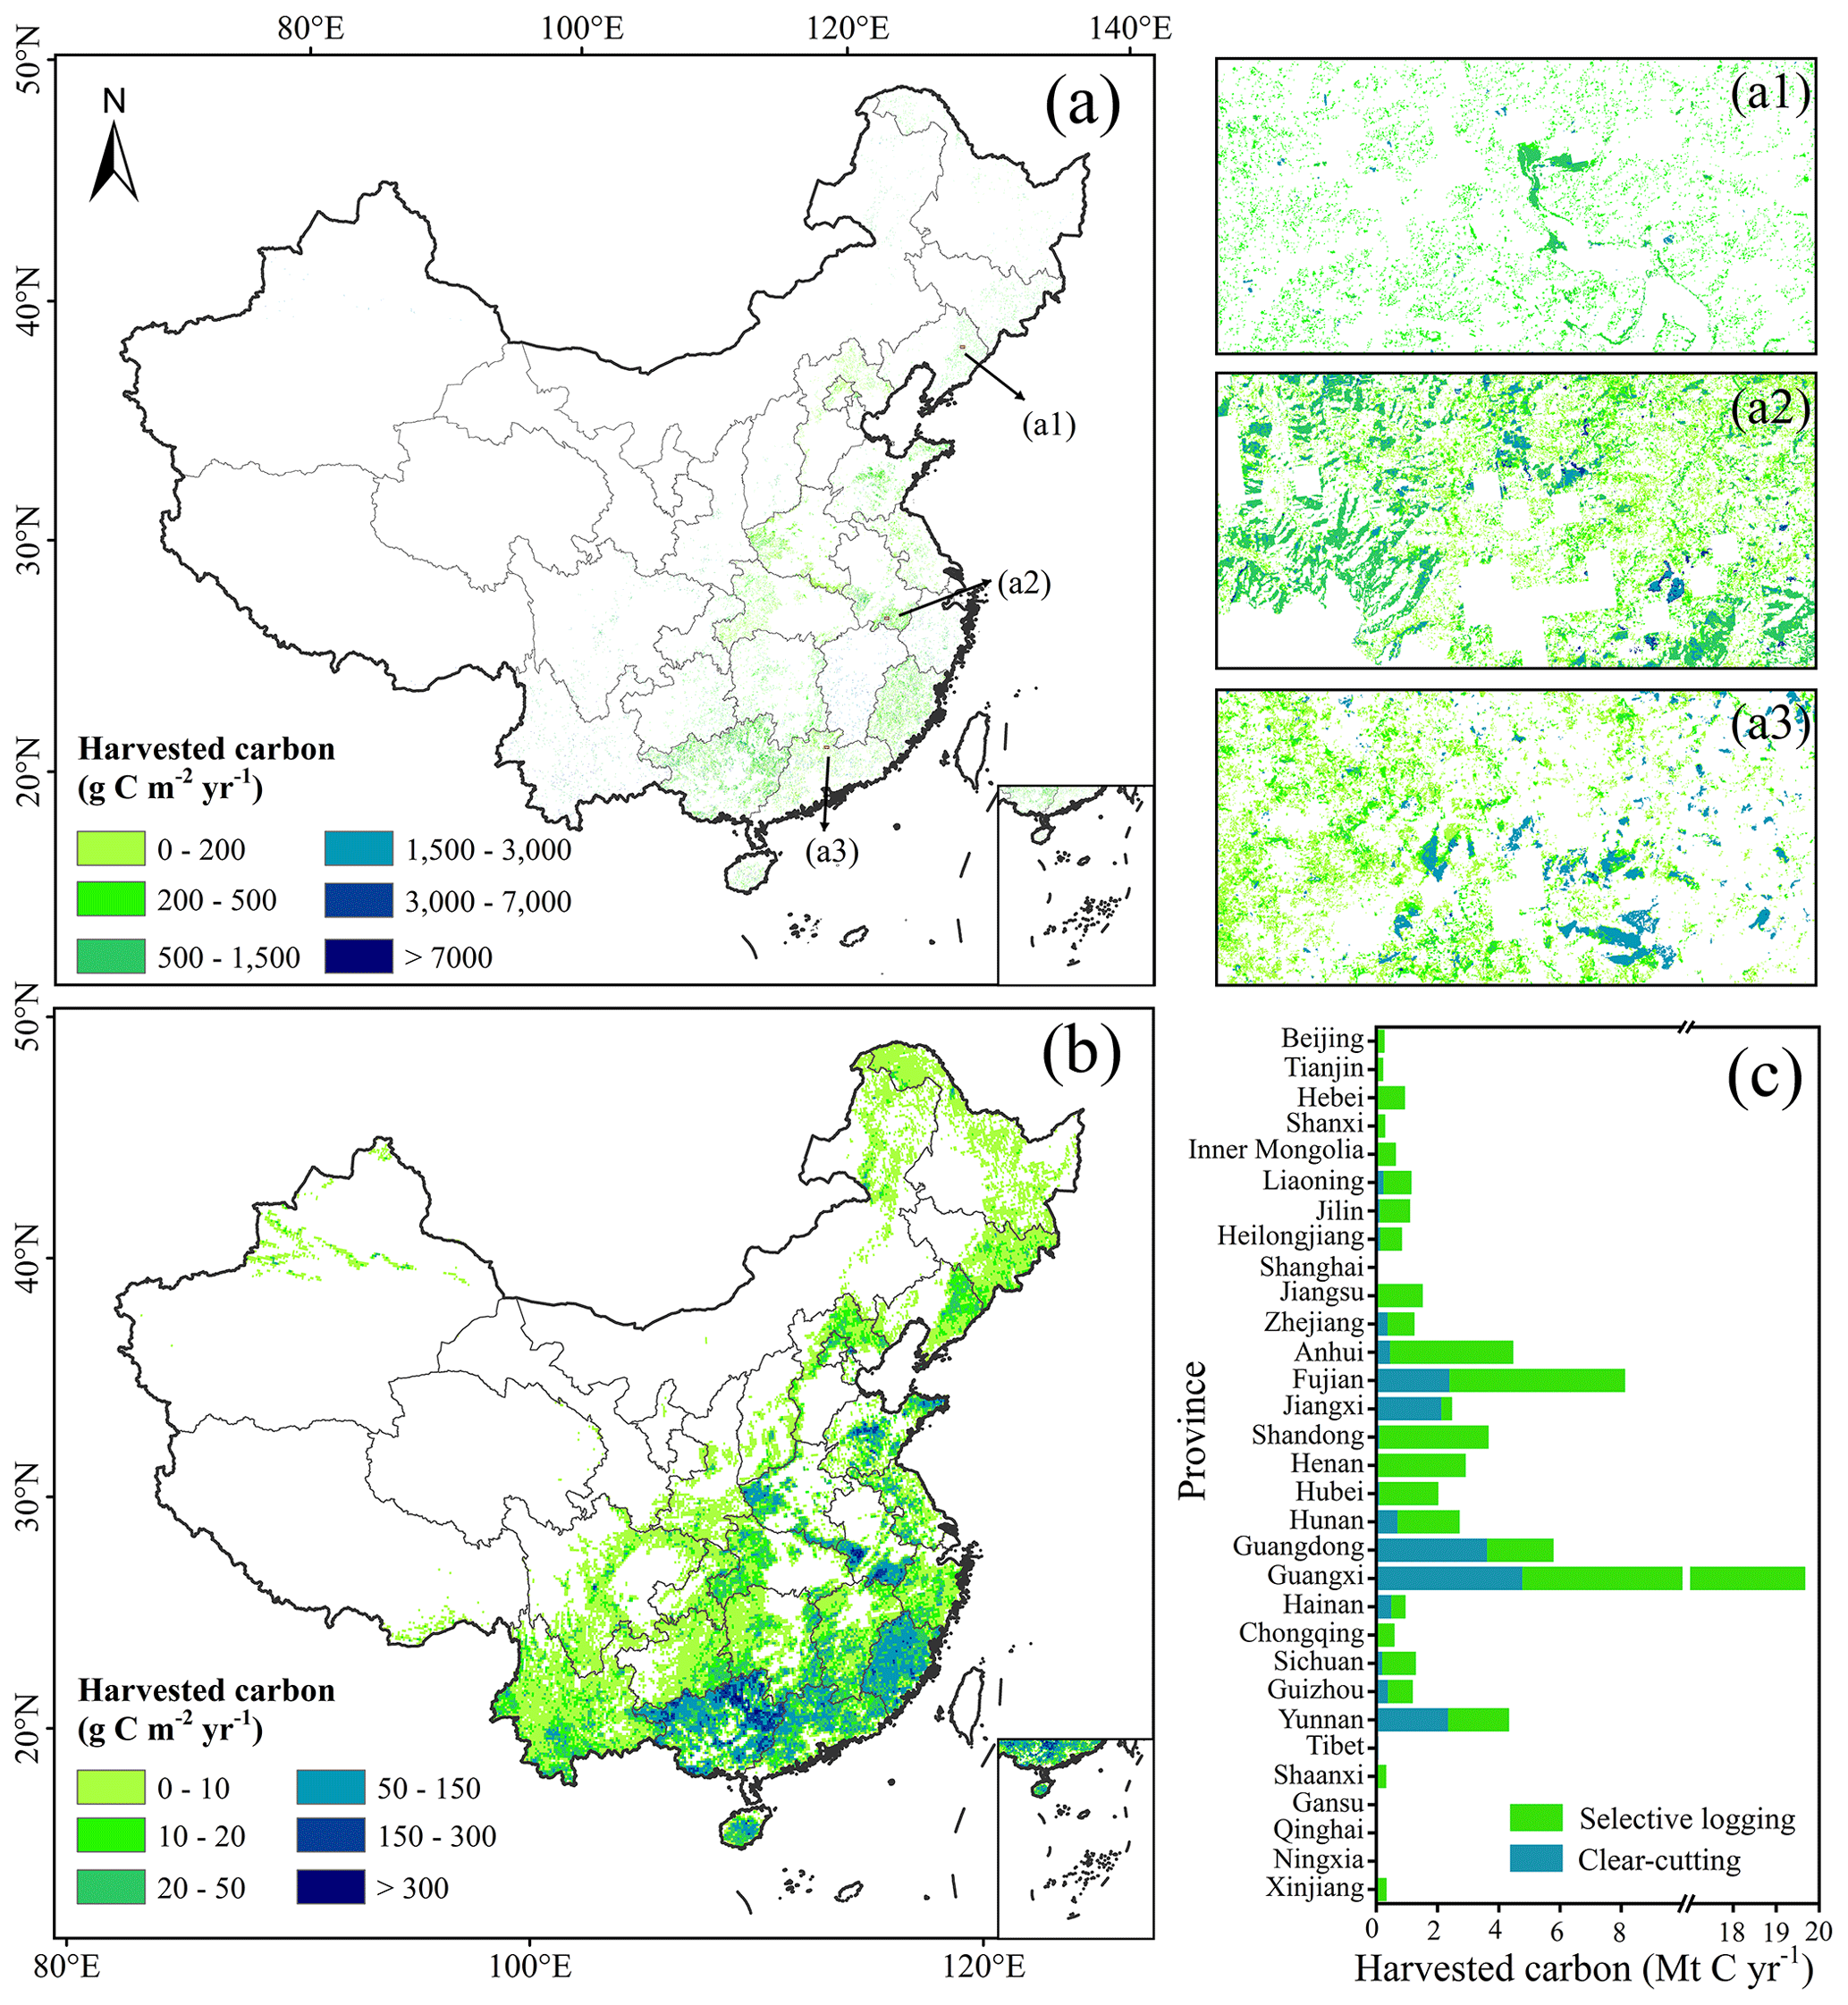
Figure 4Map of forest harvested carbon for China in 2016 at (a) 30 m and (b) 0.1° resolution and the zoomed-in view of the example areas of (a) (a1, a2, and a3); the map at 0.1° was derived from a 30 m data upscaling, and (c) shows the harvested carbon from clear-cutting and selective logging by province in 2016.
China experienced an overall upward trend in forest carbon harvesting, with average harvesting of 68.3 ± 9.3 Mt C yr−1 from 2003 to 2018 (Fig. 6). The most substantial growth in harvested carbon was observed from 2003 to 2008, increasing approximately 1.6 times from 49.8 Mt C yr−1 in 2003 to 79.5 Mt C yr−1 in 2008 (Fig. 6). Among all surveyed years, the harvested carbon peaked in 2008, primarily driven by an uptick in fuelwood harvest (Fig. 7). In subsequent years, the harvested carbon generally plateaued, with minor fluctuations. Selective logging was the main method of forest harvesting (Fig. 6). Averaged from 2003 to 2018, there was 55.6 ± 7.2 Mt C yr−1 from selective logging, accounting for around 82 % of the total harvested carbon (Fig. 6). Nevertheless, the proportion of harvested carbon from clear-cutting was overall on the rise, reaching its peak in 2012 when it constituted 30 % of the total harvested carbon for that year (Fig. 6).
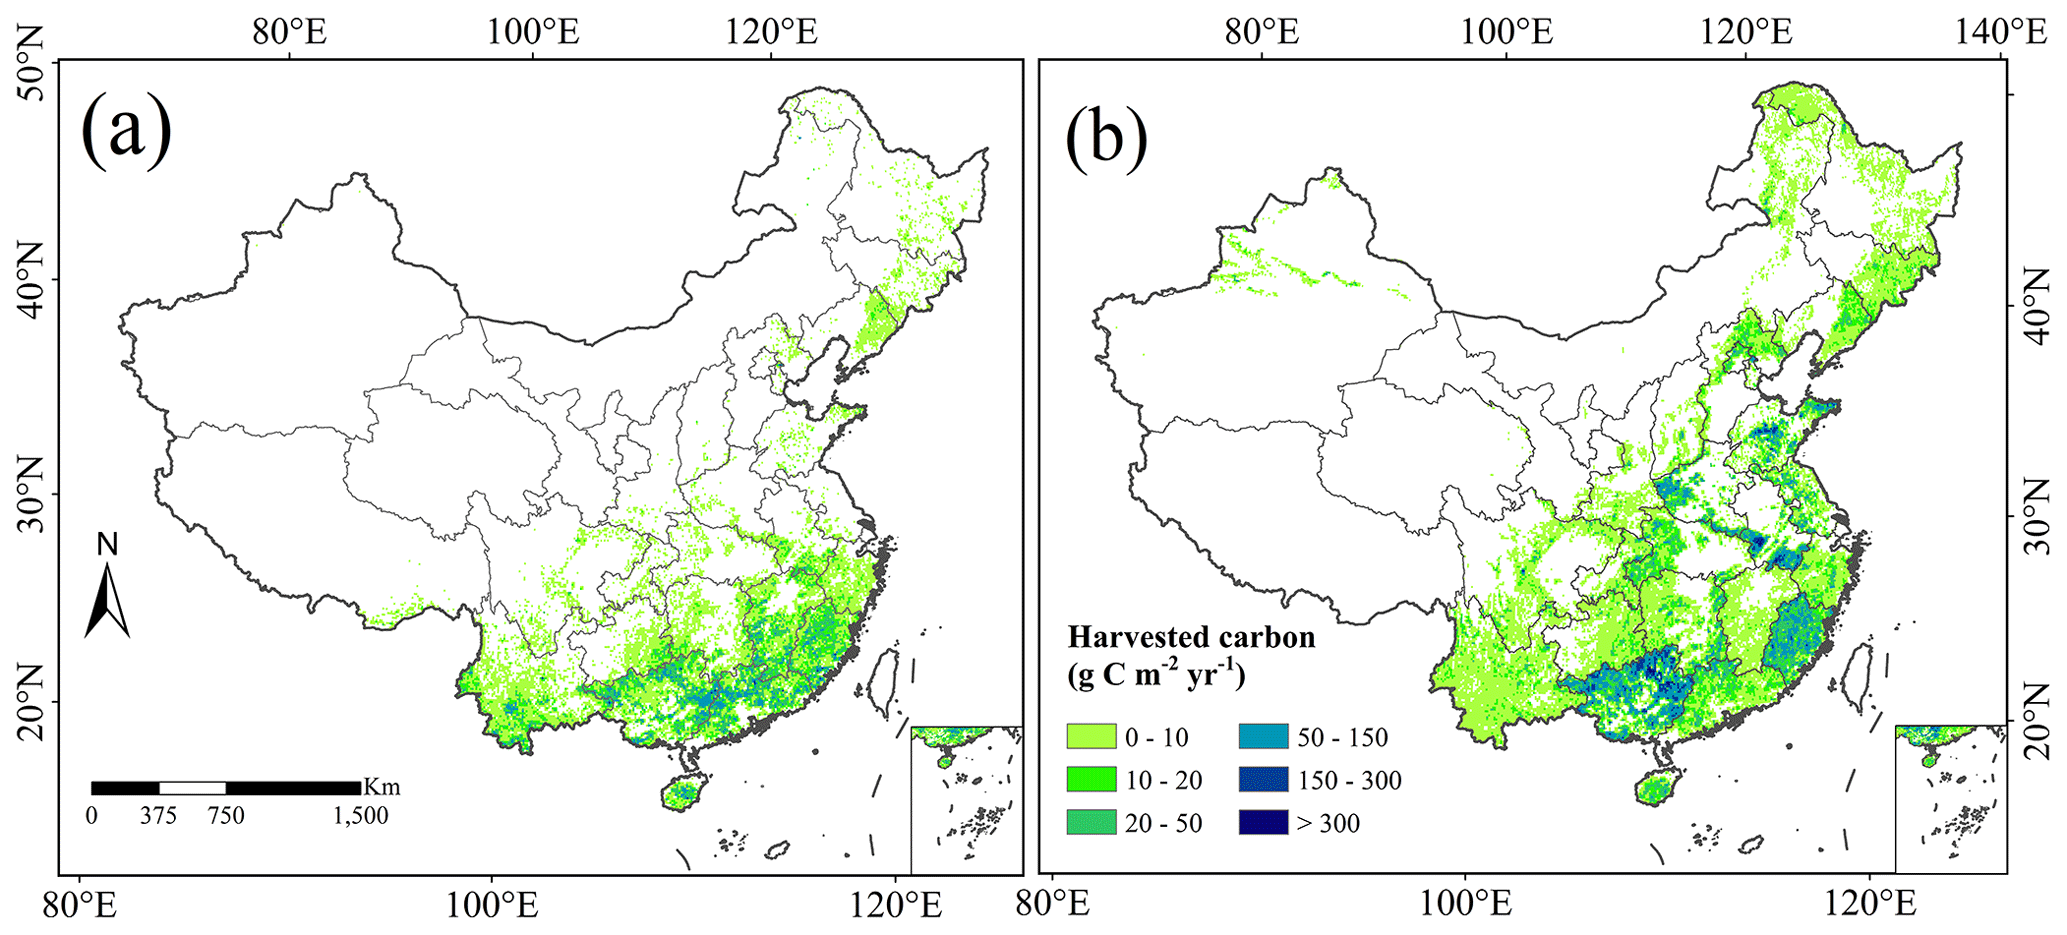
Figure 5Map of forest harvested carbon from (a) clear-cutting and (b) selective logging for China in 2016 at 0.1° resolution.
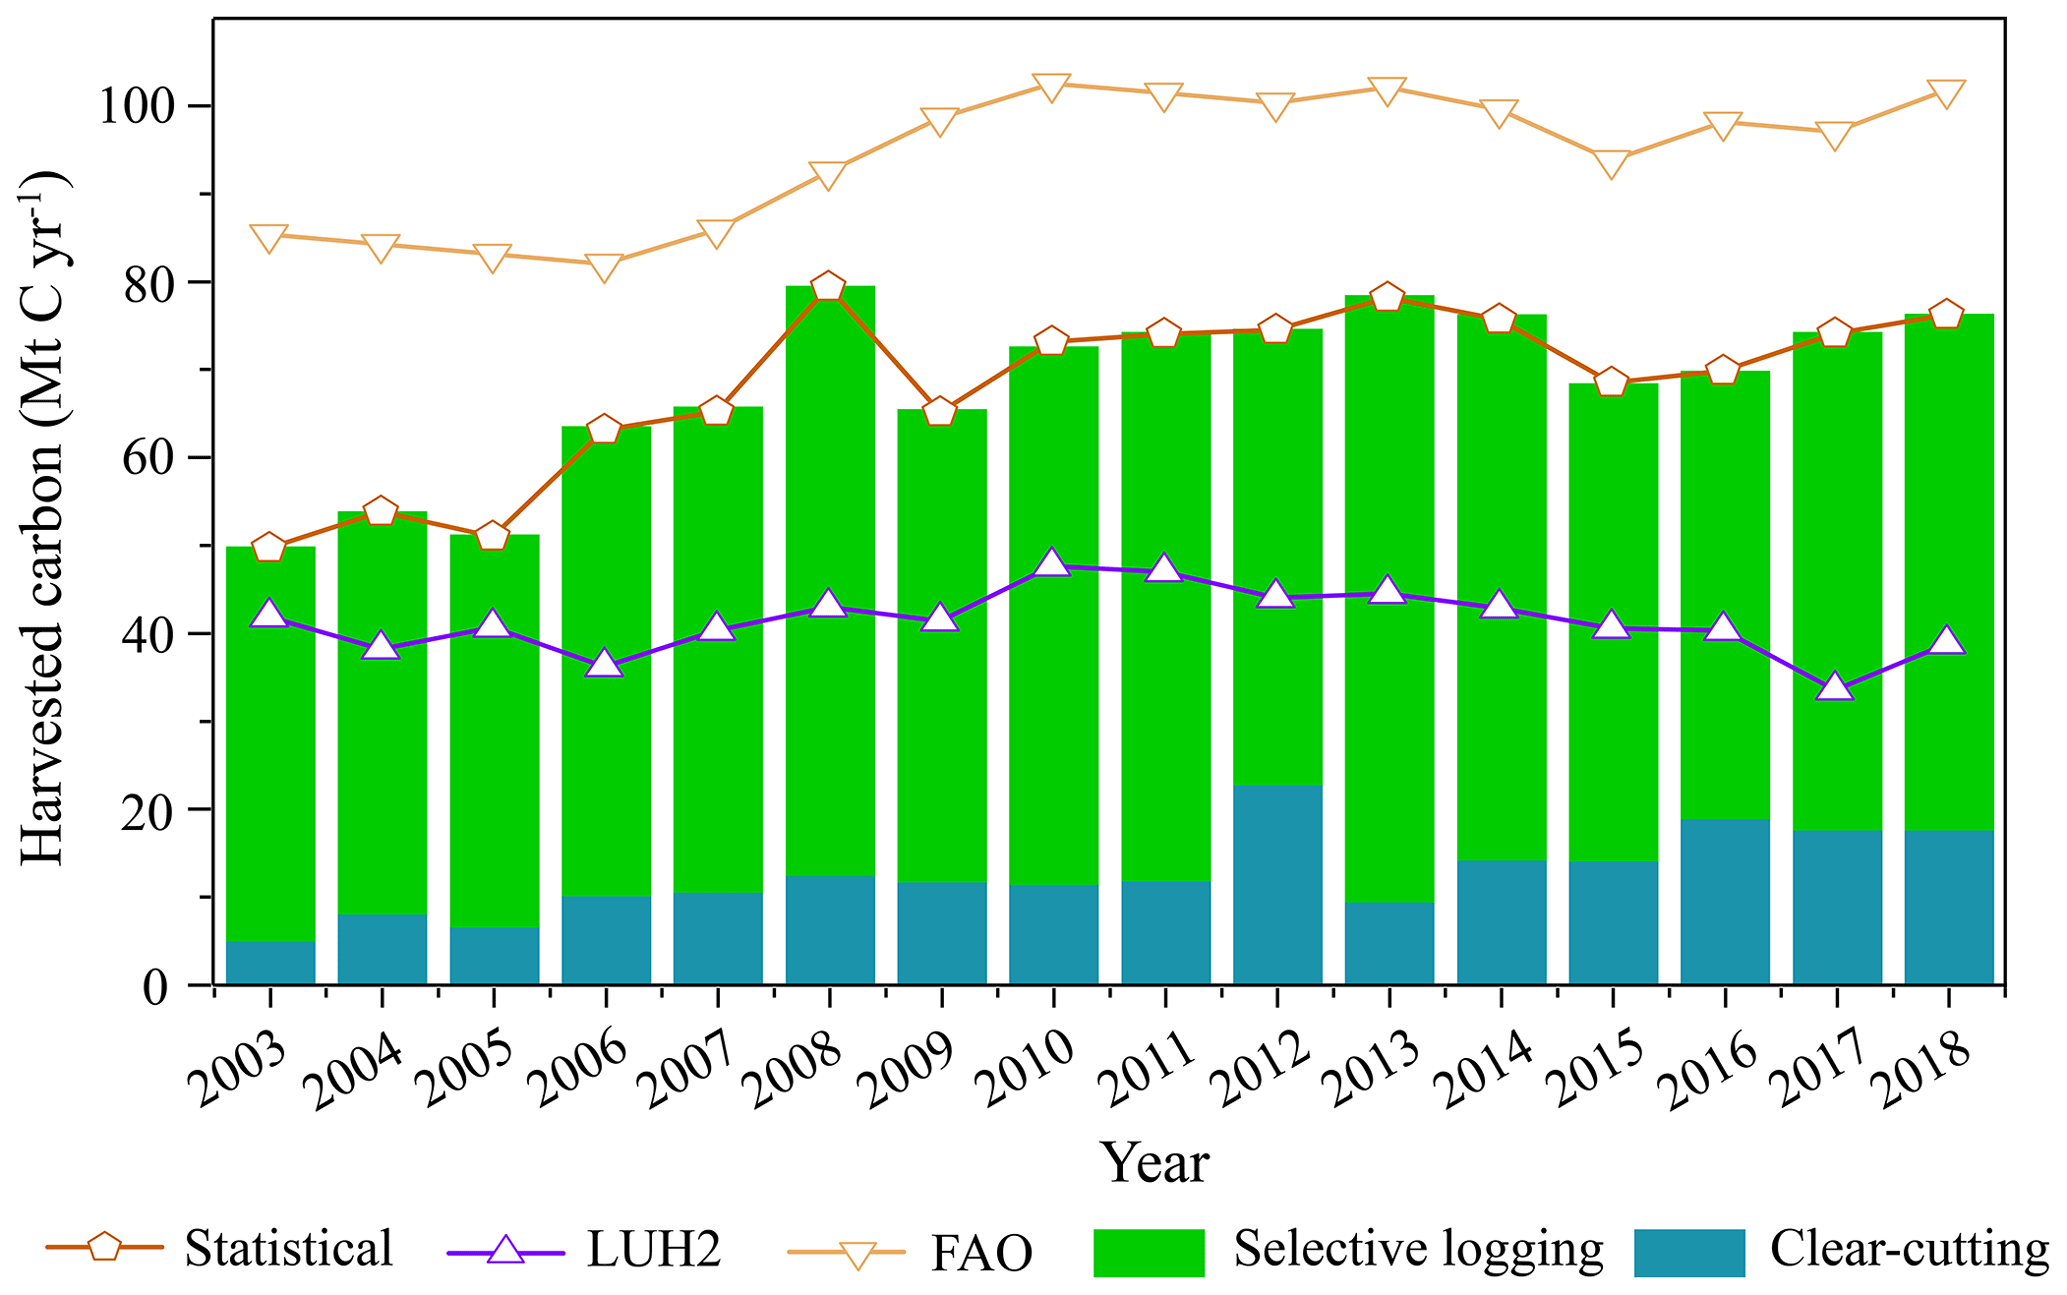
Figure 6Long-term changes in harvested carbon in China between 2003 and 2018 from statistical, LUH2, FAO, and LEAF datasets.
3.3 Allocation of harvested carbon into the various wood pools
This study also provides the allocation of harvested carbon into the various wood pools with different lifetimes, including the fuelwood pool, the paper and paperboard pool, the wood-based panel pool, the solid wooden furniture pool, the structural constructions pool, and the residue pool (Sect. 2.2). Averaged from 2003 to 2018, over the entirety of China, harvested carbon was allocated into six pools with 19.6 ± 4.0 %, 2.1 ± 1.1 %, 35.5 ± 12.6 %, 6.2 ± 0.3 %, 17.5 ± 0.9 %, and 19.1 ± 9.8 %, respectively (Fig. 7). Wood for HWPs mainly came from southern China, with Guangxi contributing more than 20 % of the national wood for HWPs annually, followed by Fujian (7.5 %). Meanwhile, Guangxi also contributed up to 45.5 % of the wood used for paper production (Fig. 8). Over 50 % of the wood in Fujian was used for fuelwood, contributing nearly 30 % of the national fuelwood. Similarly to Fujian, more than 50 % of the wood in Yunnan was used for fuelwood, making Yunnan the second-largest province in terms of wood supply for fuelwood (Fig. 8). From 2003 to 2018, wood harvesting increased, while wood for fuel decreased, with its share decreasing from 29 % to 13 %. More wood was used for HWP production. The wood residues decreased from 2003 to 2018 (Fig. 7).
We further quantified the delayed emissions of harvested carbon in various pools. Combustion of fuelwood resulted in major carbon emissions, and wood-based panels contributed a major share of the carbon stock (Fig. 9). Fuelwood was typically burned for a short period of time (1 year), resulting in average emissions of 48.1 ± 7.4 Mt CO2e yr−1 from 2003 to 2018 (Fig. 9c). Additionally, discarded HWPs that enter landfills undergo gradual decomposition, releasing an average of 3.1 ± 3.0, 14.4 ± 12.2, 2.5 ± 1.8, and 6.5 ± 3.3 Mt CO2e yr−1 for paper and paperboard, wood-based panels, solid wooden furniture, and structural constructions, respectively, from 2003 to 2100 (Fig. 9d). The total carbon stock sustained an upward trend, peaking at 2126.9 ± 244.9 Mt CO2e in 2018 (Fig. 9a, b). As products were discarded and/or retired, the carbon stock in currently used products persistently declines without ongoing wood inputs (Fig. 9a). Furthermore, most of the waste products that enter landfills do not decompose and become a permanent carbon sink (Fig. 9b). About 39.2 % ± 10.0 % of carbon harvested during 2003–2018 will still be stored in the HWPs by 2100 (Fig. 9b).
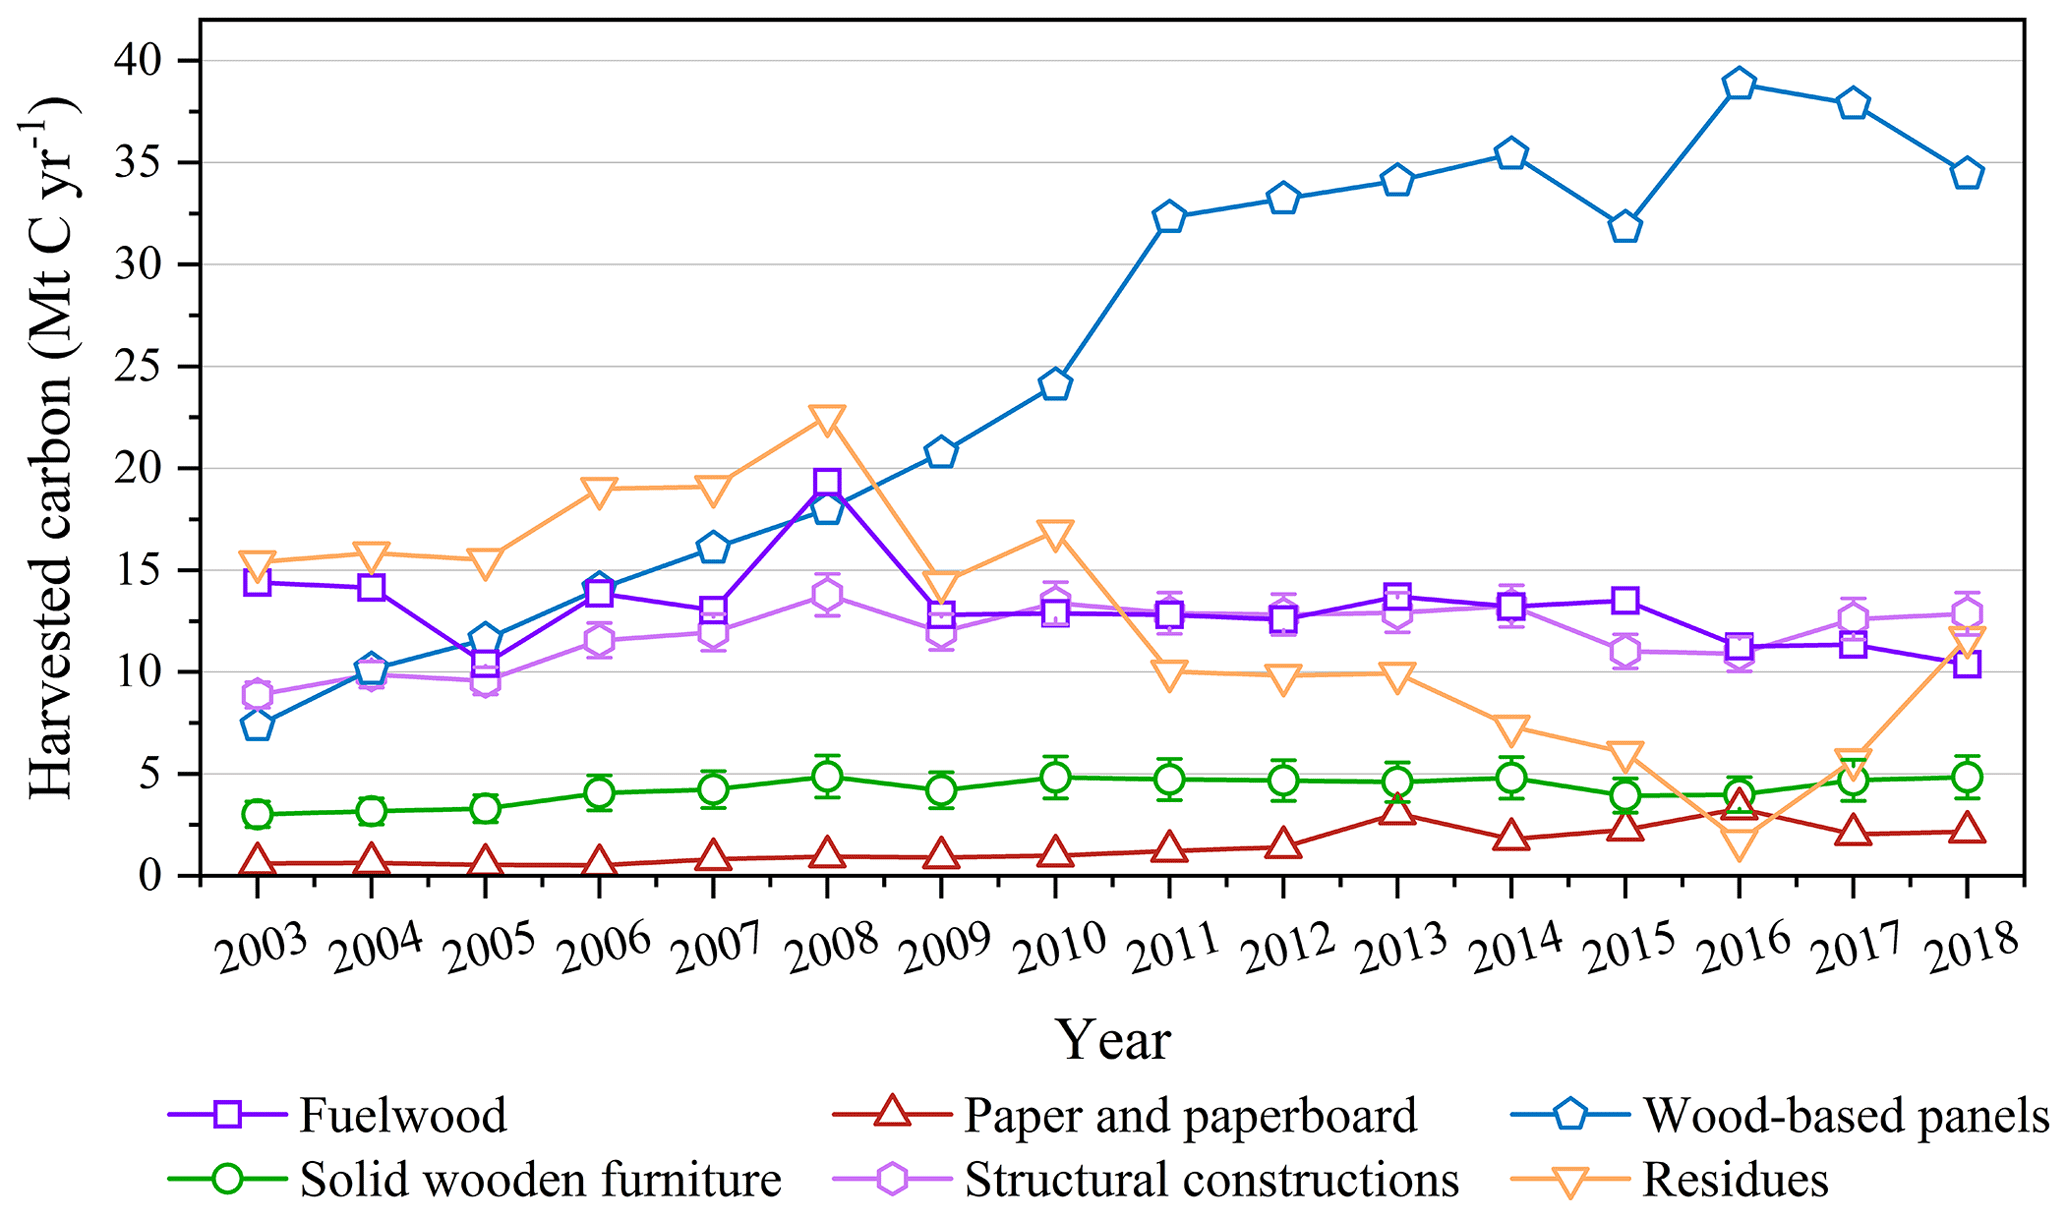
Figure 7Long-term changes in different pools of harvested carbon from 2003 to 2018 in China.
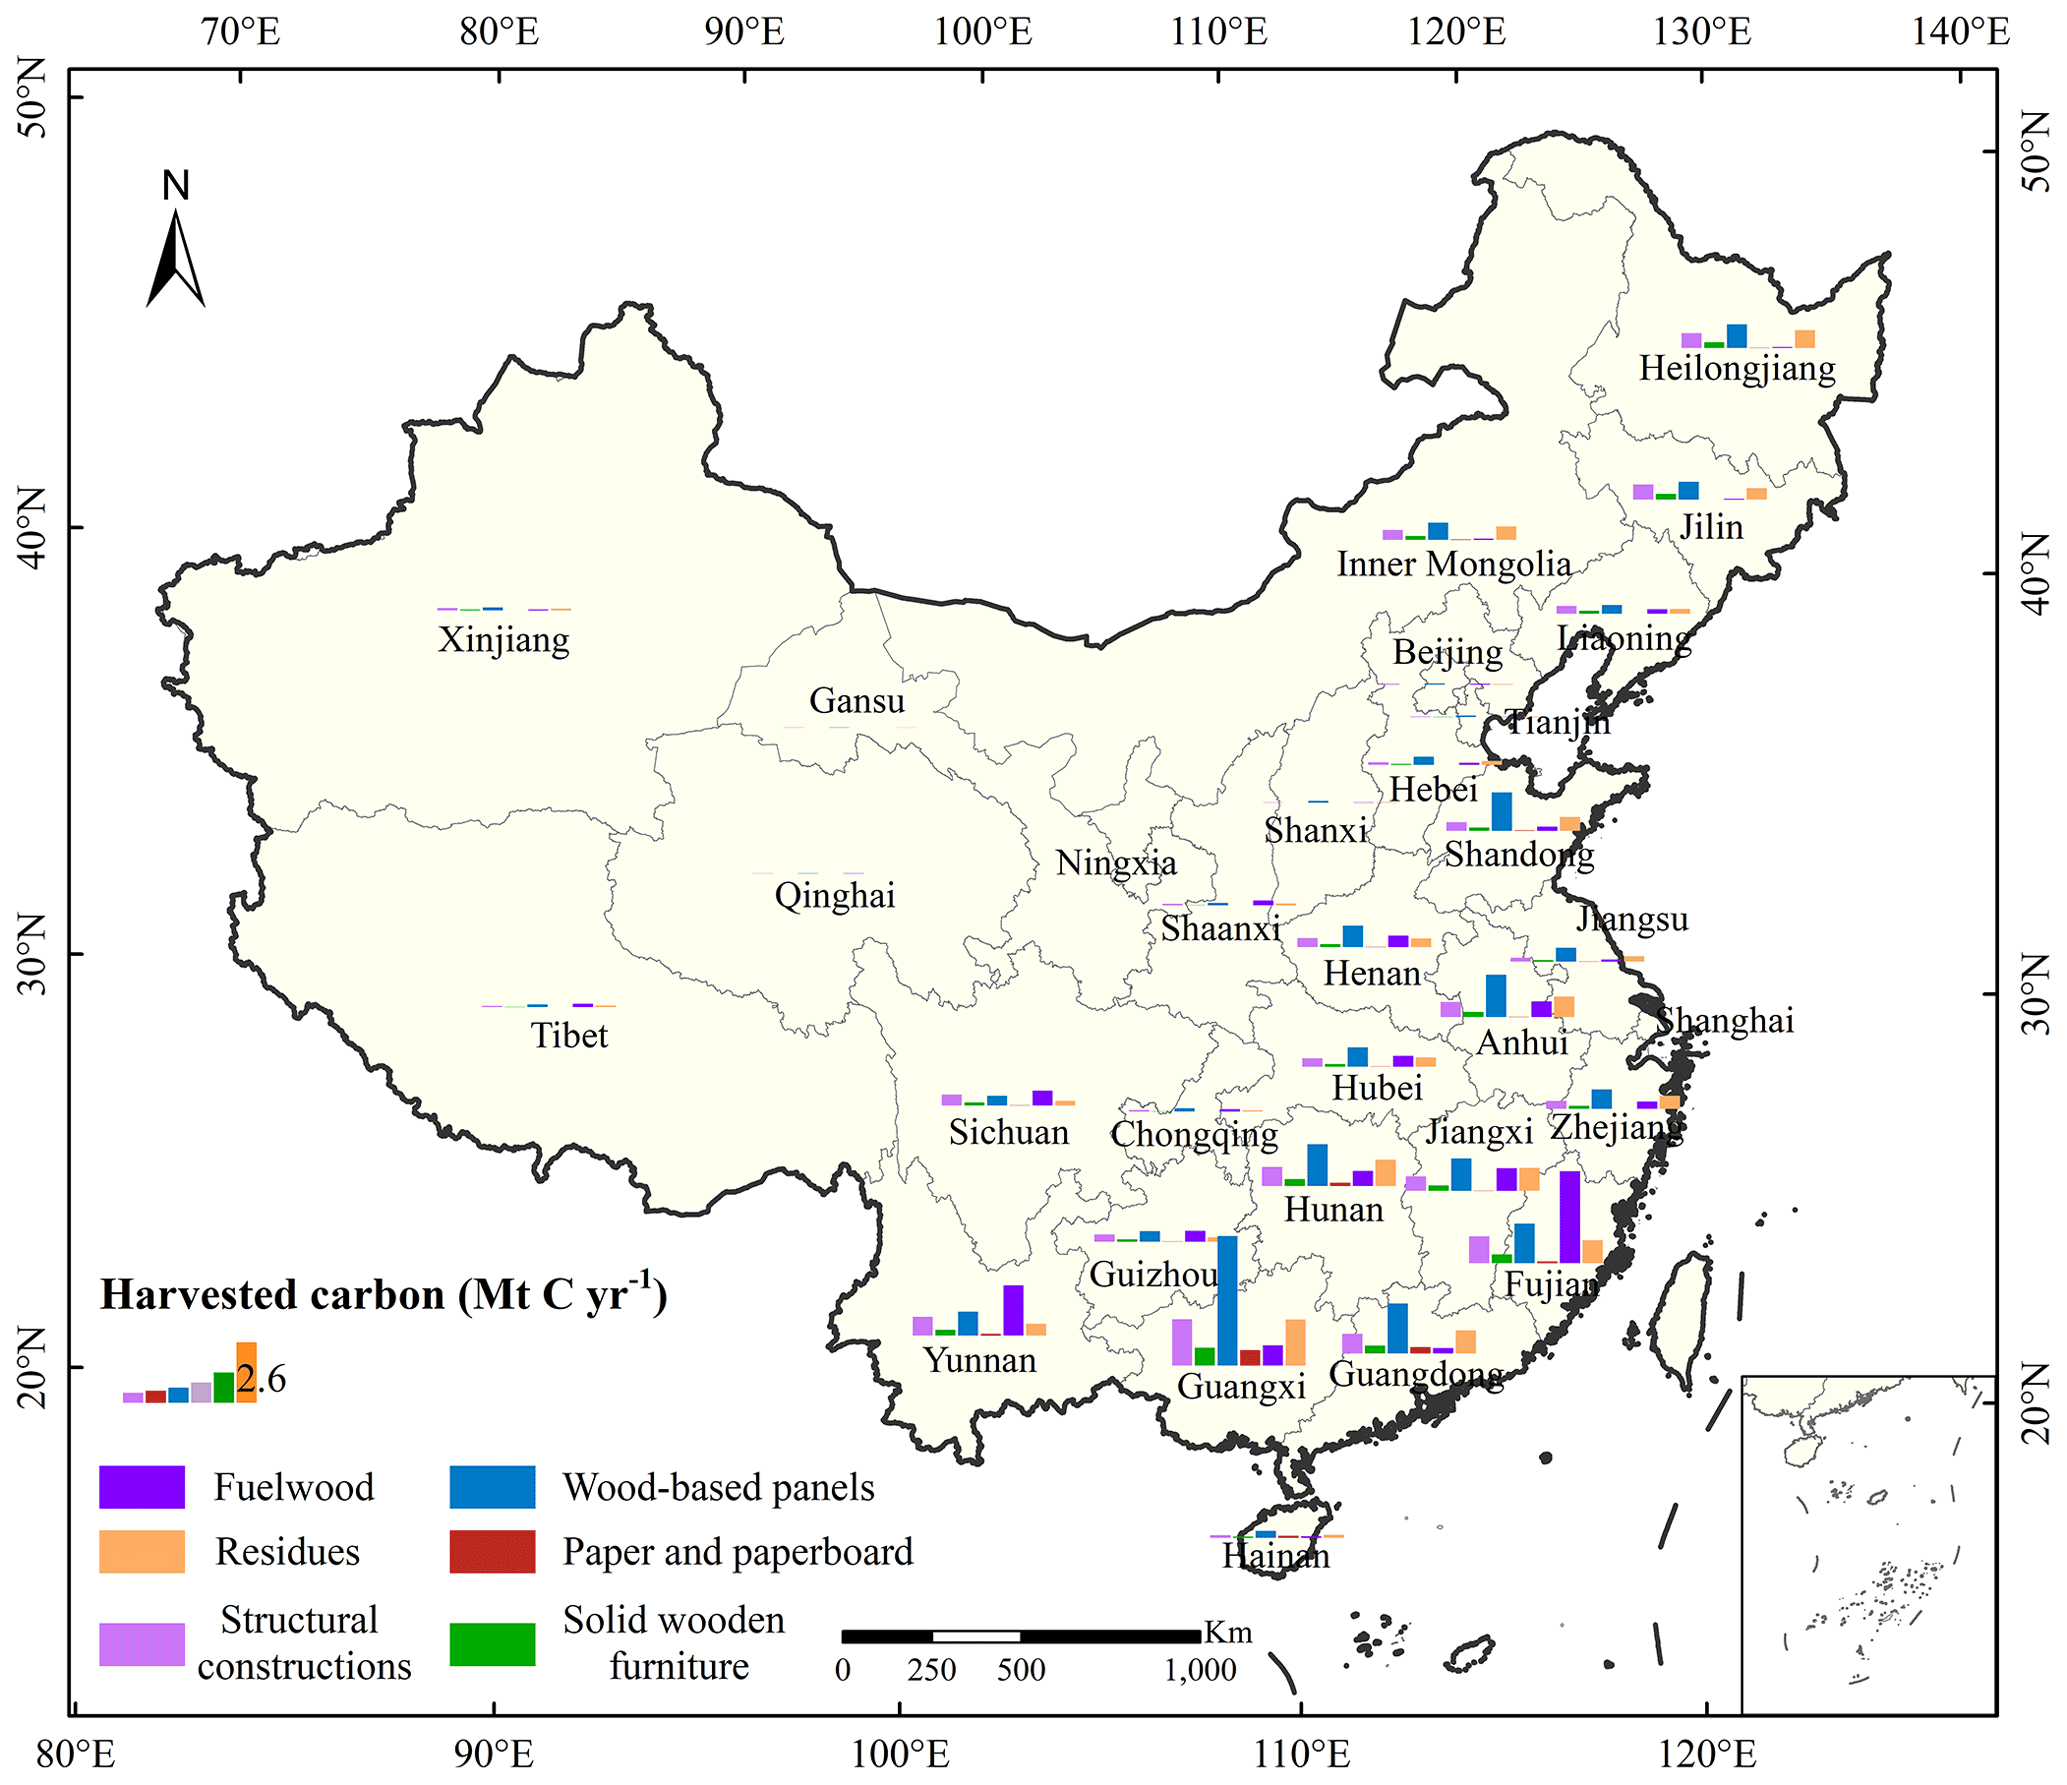
Figure 8Pools of provincial harvested carbon averaged from 2003 to 2018.
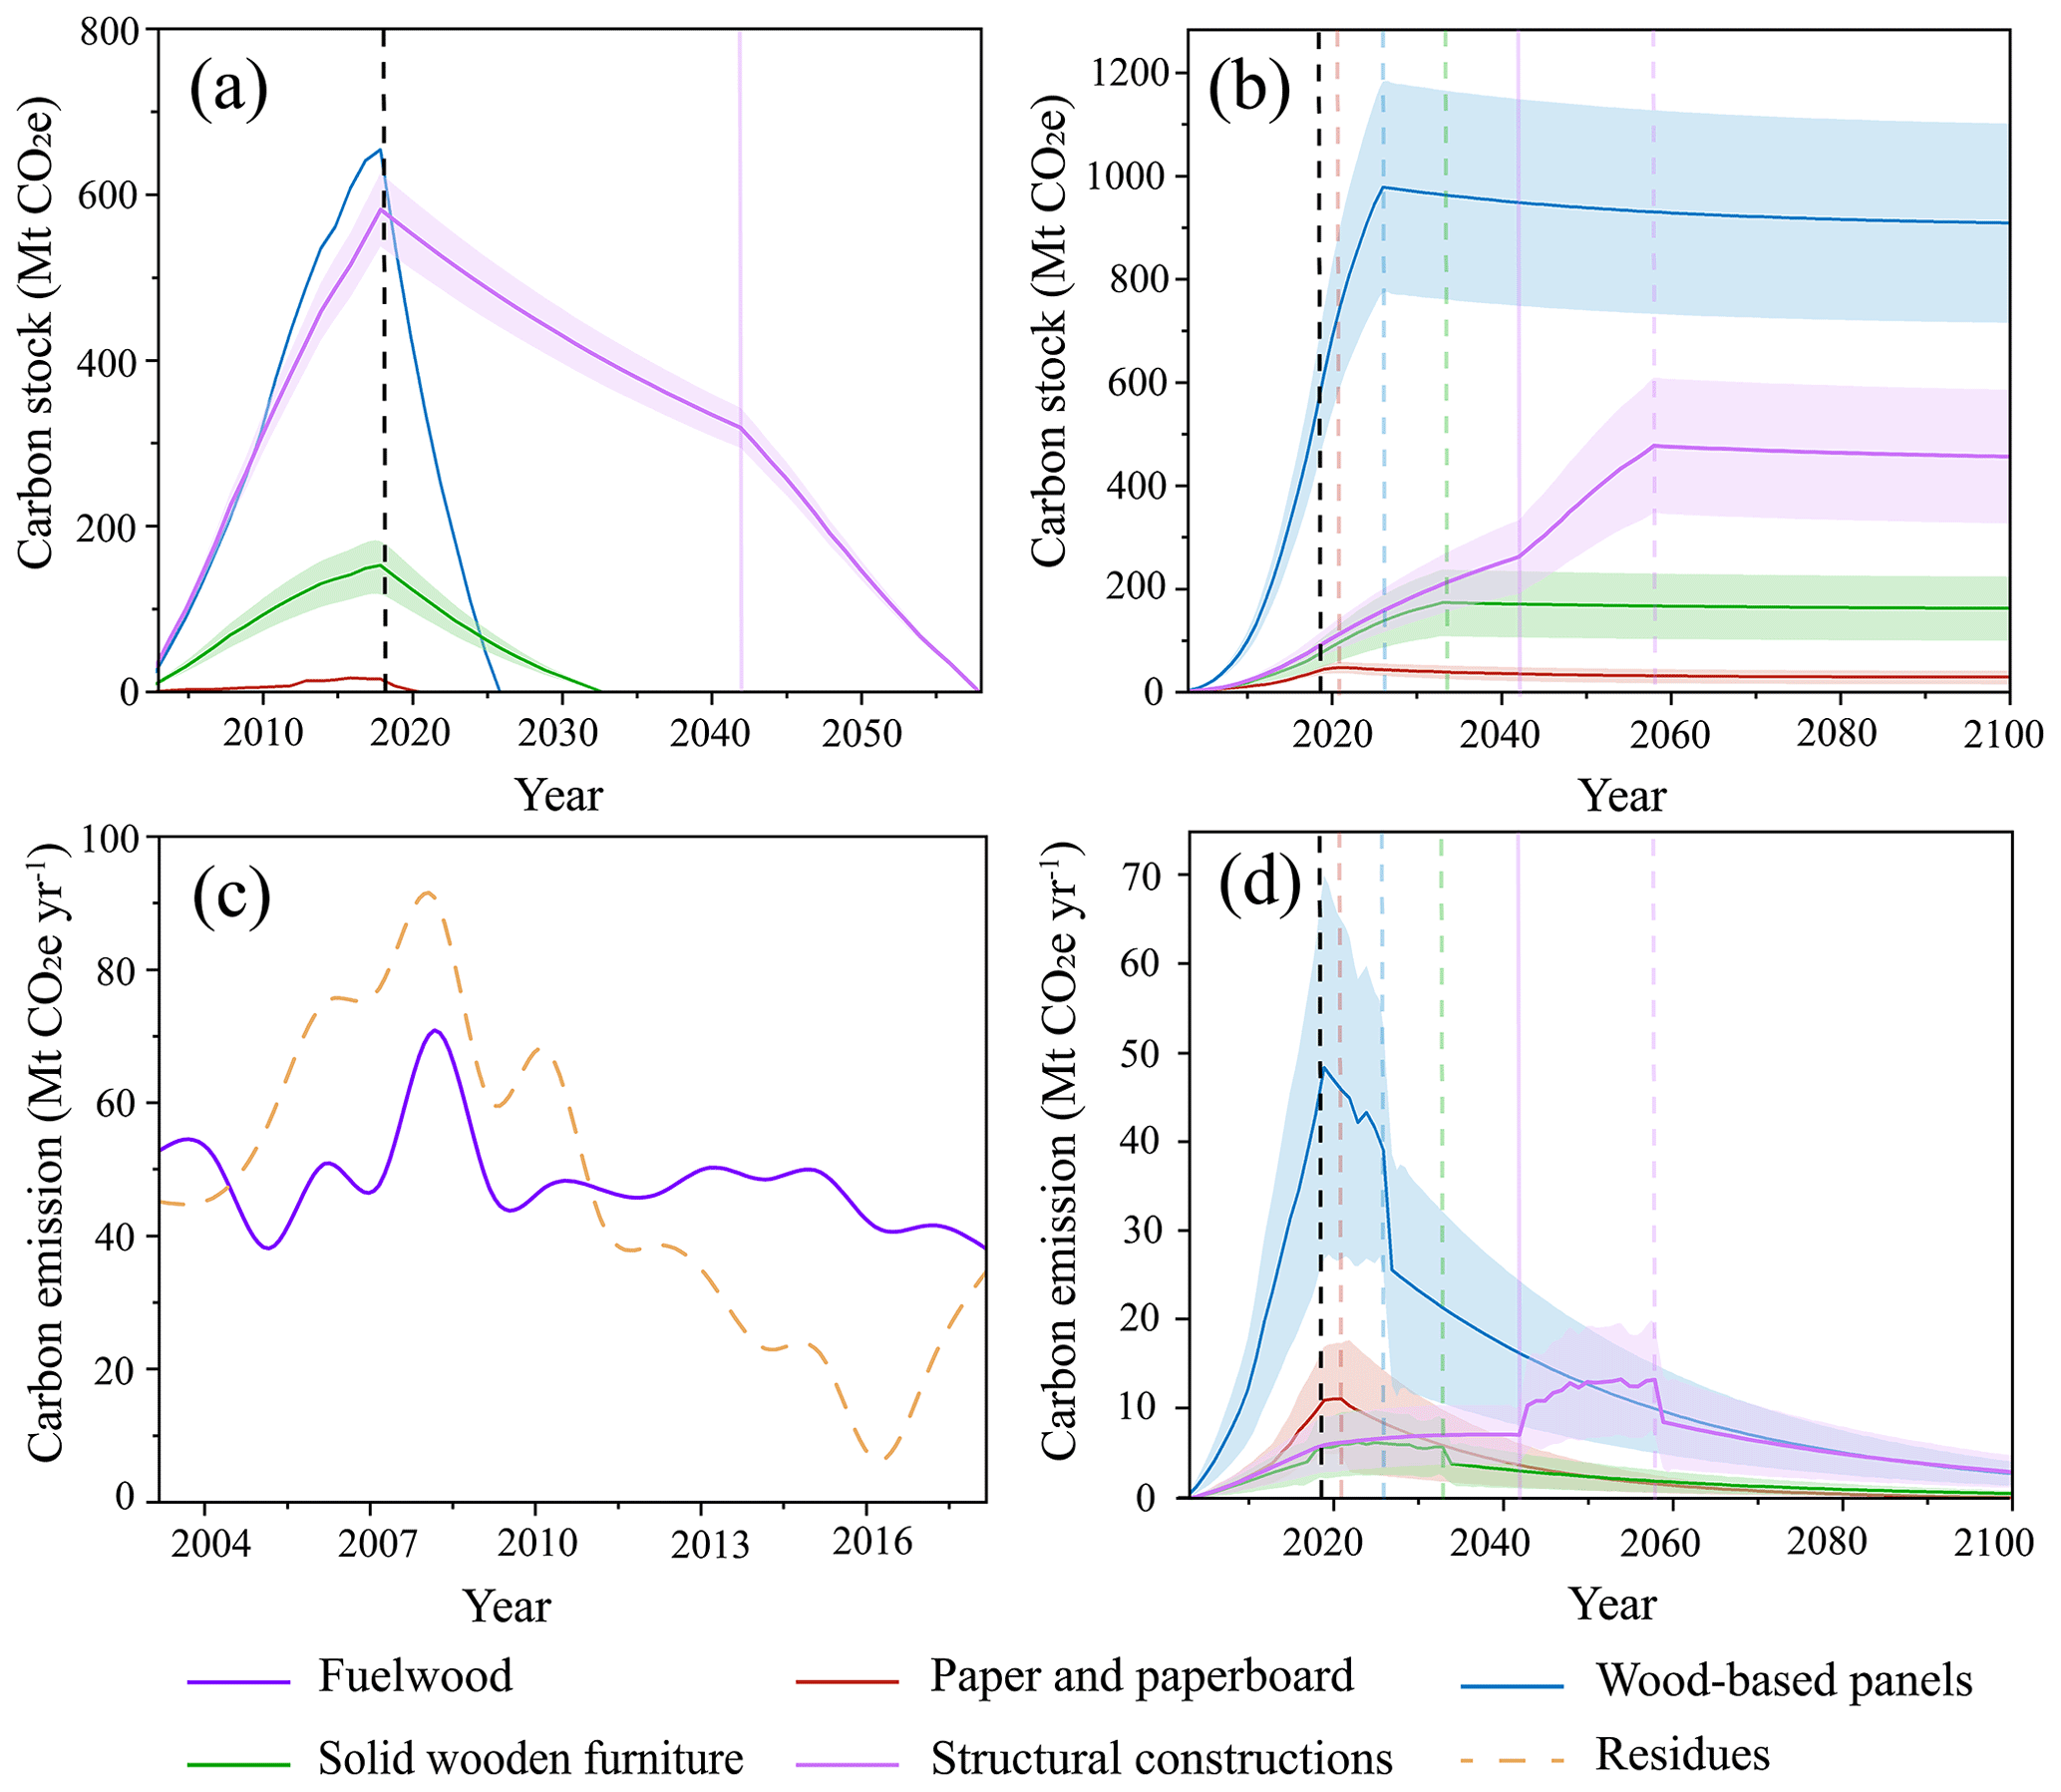
Figure 9The post-harvest carbon dynamics: (a) the accumulated carbon stock of in-use HWPs; (b) the accumulated carbon stock in landfills; (c) annual carbon emissions of fuelwood and residues – since the burning of residues is not a definite fact, we represented it using dashed lines; and (d) annual carbon emissions in landfills. The dashed black line indicates the year of 2018, when there is no new wood inflow in the HWPs, the other dashed lines in (b) and (d) indicate the year when the corresponding products were all discarded, and the solid purple line indicates the year when the first construction wood reached its service life. Since paper and paperboard, wood-based panels, and solid wooden furniture have a service life of less than 16 years, carbon stock of emissions has no sharp changes before and after the year that the service life was reached. The shaded area represents the variation range.
4.1 Implications for simulating the carbon sink in China
Forest harvesting is one of the most important human activities determining the terrestrial ecosystem carbon budget (Liu et al., 2011; Pan et al., 2011). Forest harvesting largely decreases the leaf area index, increases litter biomass, and alters stand temperature and moisture, strongly impacting the structure and function of ecosystems (Nepstad et al., 1999; Liu et al., 2011; Jian et al., 2022). Harvesting causes damage to the forest canopy and soils, leading to temporary increases in litter carbon stock. It ultimately results in a net loss of soil carbon due to the damages inflicted on the forest canopy and soil. Following a disturbance, soil carbon loss can exceed carbon gain in aboveground biomass (Kowalski et al., 2004). Pennock and van Kessel (1997) found that soil carbon decreased by 5 to 20 t C ha−1 over a 20-year period following clear-cutting, a significant loss compared to the carbon accumulated in a maturing forest's biomass (Pennock and Van Kessel, 1997).
Forest harvesting is a type of human activity that cannot be simulated by ecosystem modeling. Therefore, the development of regional and global datasets is necessary for quantifying the impacts of forest harvesting. The LUH2 dataset is an important source of data for indicating global forest harvesting and has been widely used to simulate the impacts of forest harvesting on the terrestrial carbon sink (Harper et al., 2018; Hurtt et al., 2020; Friedlingstein et al., 2022). However, our results showed that the LUH2 dataset underestimated harvested carbon by about 38.5 % on average for China compared with the statistical data (Fig. 5, Fig. S4). The LUH2 dataset used national wood volume harvest data from the Food and Agriculture Organization (FAO, 2020). Across all of China, the harvested carbon data from FAO were approximately 40 % higher compared to the statistical data averaged from 2003 to 2018, caused by the different statistical methodologies and data sources used in FAO and China's statistical data. Nevertheless, in LUH2, the wood from agricultural expansion was subtracted, and the remaining national wood was then explicitly harvested (Hurtt et al., 2020). However, according to LUH2, the cropland area has increased by 4.1×10⁷ ha since 1980 in China, which significantly deviates from the actual situation (i.e., decreased by 1.4×10⁷ ha) (Yu et al., 2022). Therefore, LUH2 has overestimated wood harvests due to agricultural expansion, leading to the underestimation of wood from forest harvesting. Furthermore, after 2000, the spatial pattern of forest harvesting was constrained using the Landsat forest loss data (i.e., TCL) (Hansen et al., 2013) by verifying whether the annualized gridded forest loss derived from the Landsat data matched the forest-harvesting information in the LUH2 dataset. However, the TCL dataset only indicates clear-cutting and does not include selective logging. Our result showed that there was a large proportion of selective logging (Fig. 6), indicating that the LUH2 dataset largely underestimates the harvest area.
This study not only represents the temporal and spatial patterns of harvested carbon but also provides the allocation of harvested carbon among the pools. Unlike harvested crop carbon, which will emit into the atmosphere at a faster rate, harvested forest carbon is stored in various HWP pools and emits back into the atmosphere with different lifetimes (Skog, 2008; IPCC, 2019a). As an extension of forest resources, the carbon dynamics of HWPs in use and after use have multiple impacts on national greenhouse gas (GHG) inventories (Johnston and Radeloff, 2019). Clarifying the proportion of post-harvest carbon allocated to different pools is the key to accurately assessing carbon dynamics. In addition, previous studies focused more on the carbon stored in HWPs (Stockmann et al., 2012; Matsumoto et al., 2022; Wei et al., 2023). However, the assessment of the global potential of HWPs as a carbon sink is subject to the balance between carbon inflows and outflows (Johnston and Radeloff, 2019). In particular, waste products emit non-CO2 GHGs such as CH4, contributing to climate change (Cai et al., 2018). Moreover, the carbon emissions from harvested wood exhibit delayed and long-term effects. Tracking the long-term dynamics of carbon and assessing the future climate mitigation potential can provide a better foundation for GHG management in the forestry sector.
4.2 Spatiotemporal changes in harvested carbon and allocation in China
The spatial heterogeneity of forest harvesting is influenced by the distribution of forest resources in China (Fig. 4). Intensive harvesting in southern China (e.g., Guangxi and Fujian) indicates a demand for specific tree species, such as Eucalyptus and Cunninghamia lanceolata (Yu et al., 2020). As the total harvesting increased, both clear-cutting and selective logging exhibited a general upward trend (Fig. 6), mirroring the dynamic equilibrium in the allocation of harvesting methods across China's forests. The rate of increase in clear-cutting significantly outpaced that of selective logging (Fig. 6). A growing demand for wood is driving an upward trend in large-scale forest harvesting. Nevertheless, selective logging has remained the principal method of forest harvesting in China. For the entirety of China, the number of pixels in which selective logging occurred is about 50 times the number of pixels in which clear-cutting occurred (Fig. S5), and the mean harvested biomass in a pixel from selective logging is 8 % of that from clear-cutting (Figs. S5, 6). The occurrence of such a small percentage of biomass removal at the pixel level suggests the ability of the LEAF dataset to capture minor disturbances. Moreover, selective logging is a widely employed silvicultural practice that plays a central role in forest management worldwide (Liu et al., 2011). In the United States, the area covered by selective logging is approximately 61 % of that occupied by clear-cutting (Masek et al., 2011). In Brazil, selective logging doubles the previous estimates of the total forest degraded by human activities (Asner et al., 2005). Selective logging is a more diffuse disturbance than forest clearance (Fisher et al., 2014) and is mostly invisible to satellites (Asner et al., 2005; Matricardi et al., 2010; Hethcoat et al., 2019). Despite many efforts to address the challenge of estimating selective logging using satellite data through image classification, it is still difficult to monitor low-intensity selective logging due to the coarse resolution of satellite imagery (Asner et al., 2005; Matricardi et al., 2010; Hethcoat et al., 2019). Objective spatially explicit reporting on selective logging is the basis for model-based assessment of the impact of forest harvesting on the carbon budget.
Forest harvesting in China continued to increase during the study period. However, the wood for fuel declined by nearly 23 %; in particular, the harvesting for burning by farmers, contributing an average of nearly 70 % of burned timber annually, decreased by nearly 35 % (Fig. S6). This rapid decline in rural areas indicates that China is successful in the rural energy transition, benefiting the mitigation of air pollution and climate change (Chen et al., 2016; Tao et al., 2018). Production of wood and paper products in China was on the rise (Fig. 7), constituting a carbon pool that delays carbon release (Fig. 9). HWPs in use rarely emit carbon if there is no decay or combustion (e.g., building fire), being a stable carbon sink during their lifespan, especially wood used for constructions (Profft et al., 2009; Churkina et al., 2020). Although the CO2 emitted in landfills is considered to be carbon neutral (Van Ewijk et al., 2020), CH4 emissions from landfills are detrimental to climate due to their higher global warming potential (IPCC, 2023). Promoting an increase in carbon storage and a reduction in carbon emissions can be achieved by extending the lifespan and improving the recycling rate of HWPs (Brunet-Navarro et al., 2017). However, this approach may not be as effective for paper products as they often have low or even negative recycling benefits (Van Ewijk et al., 2020). Therefore, recommendations in the wood sector prioritize allocating harvested wood to long-lasting products (Fortin et al., 2012; Smyth et al., 2014) and products with high recycling rates (Brunet-Navarro et al., 2016; Werner et al., 2010). Improving the efficiency of wood harvesting and processing processes, as well as enhancing forest ecological management, is also necessary for the reduction of carbon emissions.
4.3 Uncertainties of the LEAF dataset
Although the LEAF dataset demonstrated a good performance in capturing the spatial variability of harvested carbon in China, several potential uncertainties exist. First, currently, the use of forest wood was majorly extracted from the aboveground components. Typically, roots of logged trees will be disposed of in several ways, including decay stimulation, sprout regeneration, combustion, and the production of small boards (Li et al., 2012). There is no detailed information regarding roots due to large differences over the regions and species. Therefore, this study did not include the root biomass in the entire estimate, which may result in underestimation of HWPs and their subsequent emissions.
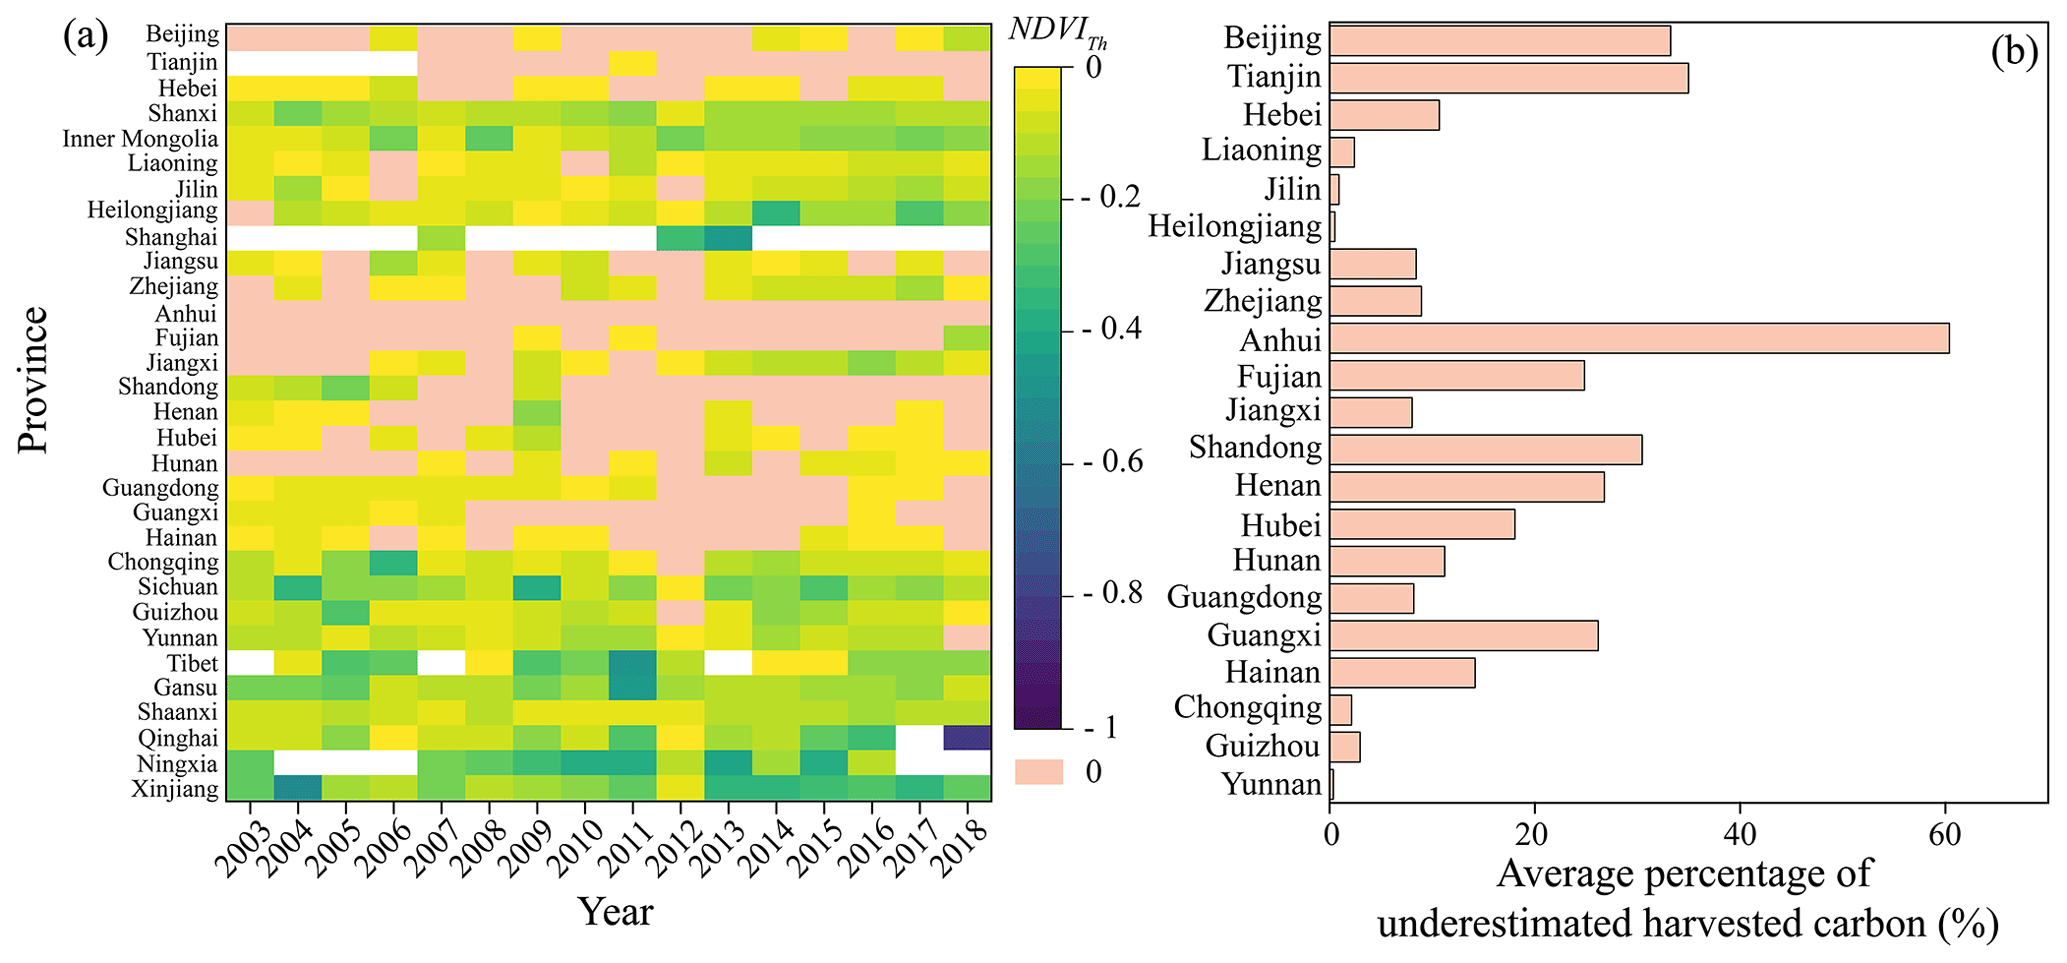
Figure 10(a) Annual NDVIdiff thresholds (NDVITh) for each province. An NDVITh of 0 indicates that the province's harvested carbon was underestimated that year, and a blank NDVITh denotes that there was no harvesting in that province that year according to the statistics. (b) Average percentage of underestimated harvested carbon in the provinces where underestimation occurred from 2003 to 2018.
Second, the harvested carbon was found to be underestimated in several provinces over several years. Among the estimates covering a span of 16 years across 31 provinces, approximately 28 % of them were underestimated, with the highest frequency of underestimation occurring in southern provinces (Fig. 10a). Compared to statistical values, the harvested carbon was underestimated by an average of 0.4 %–60.4 % from 2003 to 2018 across these investigated provinces (Fig. 10b). Anhui Province had the highest degree of underestimation, with underestimation occurring in all years (Fig. 10). To avoid this underestimation, we assigned the unidentified harvested carbon to the pixels where selective logging occurred, increasing the harvested carbon of these pixels (Sect. 2.1, Eq. 6) and resulting in an estimation of more harvested carbon than the actual AGB at several pixels. We examined the number of pixels where the harvested carbon exceeded its AGB at the province level. The results showed that the number of pixels where harvested carbon exceeded its AGB was less than 2 % of the number of pixels where harvesting occurred for each province annually (Fig. S7).
The underestimation of harvested carbon is closely related to the accuracy of identifying both selective logging and clear-cutting. (1) Wood output rate (R) is a key parameter for calculating the total wood harvest at the provincial level. Its value varies depending on factors such as tree species, wood quality, and processing methods (Jiang et al., 2022). Even within the same province, R can vary significantly. However, due to the lack of R data at the sub-provincial level, this study utilized the provincial R values for 2009 obtained from the official website of the National Bureau of Statistics (Table S2). Using provincial-level R for a single year overlooked the intra-provincial and inter-annual variations in R, potentially leading to bias in estimating the total wood harvest. (2) AGB is another important potential cause. After forest harvesting, tree regeneration would form new biomass. This study used the National Forest Inventory datasets to estimate AGB, conducted at 5-year intervals. Within this 5-year period, the forest inventory cannot include the increased biomass due to tree regeneration, which will lead to an underestimation of AGB. (3) The conversion of biomass storage to AGB (Coef) exhibited significant variations among provinces, possibly due to different dominant vegetation types and growing stock levels across provinces. The default biomass conversion and expansion factors (BCEFs, equivalent to Coef in this study) provided by the IPCC also confirmed the significant differences in Coef across vegetation types and growing stock levels (IPCC, 2006b). However, compared to the IPCC's coarse regional classification, the provincial-level Coef we utilized in this study is more detailed. (4) The quality of selective logging identification largely depends on the quality and performance of NDVI. The accuracy is largely impacted by low data quality in cloudy and rainy southern areas. In addition, NDVI is sensitive to green vegetation cover but not dense vegetation (Huete et al., 2002) and begins to saturate over dense vegetation with AGB values higher than 25 t C ha−1 (Chang et al., 2023), contributing to the underestimation of AGB. Overlooking the continued growth after harvesting within a pixel and the regional-scale climate impacts led to an underestimation of NDVIdiff. Consequently, the harvested carbon may be underestimated at regional scales, particularly in provinces with substantial forest coverage (e.g., Guangxi). (5) The estimation of clear-cutting was primarily limited by the performance of the TCL dataset generated by Hansen et al. (2013). In subtropical and temperate regions, the producer's accuracy and user's accuracy of TCL are both approximately 80 %, indicating that the dataset can identify tree cover loss with relatively high accuracy. However, there is still a 20 % level of uncertainty (Hansen et al., 2013), and further efforts are needed to improve the identification of clear-cutting.
Third, we compared our estimates of carbon stocks of HWPs with previous studies. Zhang et al. (2019) estimated the carbon stock of HWPs to be 1.7 Gt CO2e for the period of 2003–2016, which is 1.3 times higher than our estimates for the same period (Fig. 8b). Zhang et al. (2019) used statistical data of HWPs provided by FAO, which show a significant disparity compared to China's official figures (Fig. 6). Zhang et al. (2018) estimated carbon stocks of HWPs from 1950 to 2015 using China's official data, but these also included the imported HWPs. As China's wood imports are considerable, the estimates of Zhang et al. (2018) for 2003–2015 are nearly 1.8 times our estimates. This study aims to quantity the contribution of harvested wood to national CO2 emission in China; therefore, we excluded the imported wood according to the IPCC standard. Moreover, these previous estimates depended on default factors recommend by the IPCC inventory method to calculate CO2 emissions and stocks in HWPs, and these showed large differences with specific factors in China used by this study. In addition, this study also provides estimates of stocks and CO2 emission dynamics, which is quite important for understanding their long-term contributions. Nevertheless, information on the end products of harvested wood (i.e., bathroom tissue, tableware, types of furniture, columns) is unavailable (Profft et al., 2009), leading to rough estimates of wood destination and product service life. In this study, all residual wood was assumed to be burned as fuelwood, which would induce an overestimation of carbon emissions. Meanwhile, this study ignored recycled wood products, which may extend the carbon storage in products (Brunet-Navarro et al., 2017), causing an underestimation of carbon stock in products in use. More efforts are needed to track the production and end use of the harvested wood as they play a key role in the estimation of the effects on national GHG inventories (White et al., 2005; Johnston and Radeloff, 2019).
The 30 m × 30 m Long-term harvEst and Allocation of Forest Biomass (LEAF) dataset is available at https://doi.org/10.6084/m9.figshare.23641164.v2 (Wang et al., 2023).
The file format of the product is GeoTIFF, with the spatial reference of WGS84 (EPSG:4326). Each GeoTIFF file represents annual harvested forest carbon (unit: g C m−2 yr−1), and the absolute harvested carbon per pixel is obtained by multiplying by the corresponding pixel area.
This study produced the LEAF dataset, which provides spatial information on forest harvesting at a resolution of 30 m. The validation results demonstrated the accuracy and reliability of the LEAF dataset in capturing the spatial variations of harvested carbon. From 2003 to 2018, harvested carbon showed an increasing trend. Additionally, our dataset showed that selective logging resulted in more than 80 % of the total harvested carbon. The carbon taken away from forest harvesting was allocated to six wood pools, with the direct combustion of fuelwood as the primary source of carbon emissions after harvesting. However, it is important to highlight that the carbon stored in wooden products has the potential for long-term retention. In summary, the development of the LEAF dataset enhances our understanding of the spatial patterns of forest harvesting and post-harvest carbon dynamics in China. The LEAF dataset generated by this study is an important data source for estimating the carbon budget of forest ecosystems in China, which can also provide essential insights for sustainable forest management and climate change mitigation efforts.
The supplement related to this article is available online at: https://doi.org/10.5194/essd-16-2465-2024-supplement.
WY and DW designed the research, performed the analysis, and wrote the paper; PR and XX performed the analysis; LF, ZQ, and XC edited and revised the paper.
The contact author has declared that none of the authors has any competing interests.
Publisher’s note: Copernicus Publications remains neutral with regard to jurisdictional claims made in the text, published maps, institutional affiliations, or any other geographical representation in this paper. While Copernicus Publications makes every effort to include appropriate place names, the final responsibility lies with the authors. Regarding the maps used in this paper, please note that Figs. 4, 5 and 8 contain disputed territories.
We acknowledge the data on the distribution of national nature reserve support from the National Earth System Data Center, National Science and Technology Infrastructure of China (http://www.geodata.cn, last access: 1 August 2022).
This research was supported by the key project of the National Natural Science Foundation of China (grant no. 42141020).
This paper was edited by Zhen Yu and reviewed by three anonymous referees.
Asner, G. P., Knapp, D. E., Broadbent, E. N., Oliveira, P. J. C., Keller, M., and Silva, J. N.: Selective logging in the Brazilian Amazon, Science, 310, 480–482, https://doi.org/10.1126/science.1118051, 2005.
Brunet-Navarro, P., Jochheim, H., and Muys, B.: Modelling carbon stocks and fluxes in the wood product sector: a comparative review, Glob. Change Biol., 22, 2555–2569, https://doi.org/10.1111/gcb.13235, 2016.
Brunet-Navarro, P., Jochheim, H., and Muys, B.: The effect of increasing lifespan and recycling rate on carbon storage in wood products from theoretical model to application for the European wood sector, Mitig. Adapt. Strateg. Glob. Change, 22, 1193–1205, https://doi.org/10.1007/s11027-016-9722-z, 2017.
Cai, B., Lou, Z., Wang, J., Geng, Y., Sarkis, J., Liu, J., and Gao, Q.: CH4 mitigation potentials from China landfills and related environmental co-benefits, Sci. Adv., 4, eaar8400, https://doi.org/10.1126/sciadv.aar8400, 2018.
Chang, Z., Fan, L., Wigneron, J.-P., Wang, Y.-P., Ciais, P., Chave, J., Fensholt, R., Chen, J. M., Yuan, W., Ju, W., Li, X., Jiang, F., Wu, M., Chen, X., Qin, Y., Frappart, F., Li, X., Wang, M., Liu, X., Tang, X., Hobeichi, S., Yu, M., Ma, M., Wen, J., Xiao, Q., Shi, W., Liu, D., and Yan, J.: Estimating aboveground carbon dynamic of China using optical and microwave remote sensing datasets from 2013 to 2019, J. Remote Sens., 3, 0005, https://doi.org/10.34133/remotesensing.0005, 2023.
Chen, C., Park, T., Wang, X., Piao, S., Xu, B., Chaturvedi, R. K., Fuchs, R., Brovkin, V., Ciais, P., Fensholt, R., Tømmervik, H., Bala, G., Zhu, Z., Nemani, R. R., and Myneni, R. B.: China and India lead in greening of the world through land-use management, Nat. Sustain., 2, 122–129, https://doi.org/10.1038/s41893-019-0220-7, 2019.
Chen, Y., Shen, H., Zhong, Q., Chen, H., Huang, T., Liu, J., Cheng, H., Zeng, E. Y., Smith, K. R., and Tao, S.: Transition of household cookfuels in China from 2010 to 2012, Appl. Energ., 184, 800–809, https://doi.org/10.1016/j.apenergy.2016.07.136, 2016.
Churkina, G., Organschi, A., Reyer, C. P. O., Ruff, A., Vinke, K., Liu, Z., Reck, B. K., Graedel, T. E., and Schellnhuber, H. J.: Buildings as a global carbon sink, Nat. Sustain., 3, 269–276, https://doi.org/10.1038/s41893-019-0462-4, 2020.
Costanza, R., d'Arge, R., de Groot, R., Farberl, S., Grasso, M., Hannon, B., Limburg, K., Naeem, S., O'Neil, R. V., Paruelo, J., Raskin, R. G., Suttonl, P., and van den Belt, M.: The value of the world's ecosystem services and natural capital, Nature, 387, 253–260, https://doi.org/10.1016/S0921-8009(98)00020-2, 1997.
Curtis, P. G., Slay, C. M., Harris, N. L., Tyukavina, A., and Hansen, M. C.: Classifying drivers of global forest loss, Science, 361, 1108–1111, https://doi.org/10.1126/science.aau3445, 2018.
Deal, R. L. and White, R.: Integrating forest products with ecosystem services: A global perspective, For. Policy Econ., 17, 1–2, https://doi.org/10.1016/j.forpol.2012.02.014, 2012.
Dixon, R. K., Solomon, A. M., Brown, S., Houghton, R. A., Trexier, M. C., and Wisniewski, J.: Carbon pools and flux of global forest ecosystems, Science, 263, 185–190, https://doi.org/10.1126/science.263.5144.185, 1994.
Dong, J., Zhou, Y., and You, N.: A 30 m annual maximum NDVI dataset for China from 2000 to 2020 [DB/OL], National Ecosystem Science Data Center [data set], https://doi.org/10.12199/nesdc.ecodb.rs.2021.012, 2021.
FAO: Forestry data, FAOSTAT Database, Food and Agriculture Organization of the United Nations, Rome, Italy, https://www.fao.org/faostat/en/#data/FO (last access: 25 June 2023), 2020.
Fisher, B., Edwards, D. P., and Wilcove, D. S.: Logging and conservation: Economic impacts of the stocking rates and prices of commercial timber species, For. Policy Econ., 38, 65–71, https://doi.org/10.1016/j.forpol.2013.05.006, 2014.
Fortin, M., Ningre, F., Robert, N., and Mothe, F.: Quantifying the impact of forest management on the carbon balance of the forest-wood product chain: A case study applied to even-aged oak stands in France, Forest Ecol. Manag., 279, 176–188, https://doi.org/10.1016/j.foreco.2012.05.031, 2012.
Friedlingstein, P., O'Sullivan, M., Jones, M. W., Andrew, R. M., Gregor, L., Hauck, J., Le Quéré, C., Luijkx, I. T., Olsen, A., Peters, G. P., Peters, W., Pongratz, J., Schwingshackl, C., Sitch, S., Canadell, J. G., Ciais, P., Jackson, R. B., Alin, S. R., Alkama, R., Arneth, A., Arora, V. K., Bates, N. R., Becker, M., Bellouin, N., Bittig, H. C., Bopp, L., Chevallier, F., Chini, L. P., Cronin, M., Evans, W., Falk, S., Feely, R. A., Gasser, T., Gehlen, M., Gkritzalis, T., Gloege, L., Grassi, G., Gruber, N., Gürses, Ö., Harris, I., Hefner, M., Houghton, R. A., Hurtt, G. C., Iida, Y., Ilyina, T., Jain, A. K., Jersild, A., Kadono, K., Kato, E., Kennedy, D., Klein Goldewijk, K., Knauer, J., Korsbakken, J. I., Landschützer, P., Lefèvre, N., Lindsay, K., Liu, J., Liu, Z., Marland, G., Mayot, N., McGrath, M. J., Metzl, N., Monacci, N. M., Munro, D. R., Nakaoka, S.-I., Niwa, Y., O'Brien, K., Ono, T., Palmer, P. I., Pan, N., Pierrot, D., Pocock, K., Poulter, B., Resplandy, L., Robertson, E., Rödenbeck, C., Rodriguez, C., Rosan, T. M., Schwinger, J., Séférian, R., Shutler, J. D., Skjelvan, I., Steinhoff, T., Sun, Q., Sutton, A. J., Sweeney, C., Takao, S., Tanhua, T., Tans, P. P., Tian, X., Tian, H., Tilbrook, B., Tsujino, H., Tubiello, F., van der Werf, G. R., Walker, A. P., Wanninkhof, R., Whitehead, C., Willstrand Wranne, A., Wright, R., Yuan, W., Yue, C., Yue, X., Zaehle, S., Zeng, J., and Zheng, B.: Global Carbon Budget 2022, Earth Syst. Sci. Data, 14, 4811–4900, https://doi.org/10.5194/essd-14-4811-2022, 2022.
Hansen, M. C., Potapov, P. V., Moore, R., Hancher, M., Turubanova, S. A., Tyukavina, A., Thau, D., Stehman, S. V., Goetz, S. J., Loveland, T. R., Kommareddy, A., Egorov, A., Chini, L., Justice, C. O., and Townshend, J. R. G.: High-resolution global maps of 21st-century forest cover change, Science, 342, 850–853, https://doi.org/10.1126/science.1244693, 2013.
Harper, A. B., Powell, T., Cox, P. M., House, J., Huntingford, C., Lenton, T. M., Sitch, S., Burke, E., Chadburn, S. E., Collins, W. J., Comyn-Platt, E., Daioglou, V., Doelman, J. C., Hayman, G., Robertson, E., Van Vuuren, D., Wiltshire, A., Webber, C. P., Bastos, A., Boysen, L., Ciais, P., Devaraju, N., Jain, A. K., Krause, A., Poulter, B., and Shu, S.: Land-use emissions play a critical role in landbased mitigation for Paris climate targets, Nat. Commun., 9, 2938, https://doi.org/10.1038/s41467-018-05340-z, 2018.
Harris, N. L., Gibbs, D. A., Baccini, A., Birdsey, R. A., De Bruin, S., Farina, M., Fatoyinbo, L., Hansen, M. C., Herold, M., Houghton, R. A., Potapov, P. V., Suarez, D. R., Roman-Cuesta, R. M., Saatchi, S. S., Slay, C. M., Turubanova, S. A., and Tyukavina, A.: Global maps of twenty-first century forest carbon fluxes, Nat. Clim. Change, 11, 234–240, https://doi.org/10.1038/s41558-020-00976-6, 2021.
Hethcoat, M. G., Edwards, D. P., Carreiras, J. M. B., Bryant, R. G., França, F. M., and Quegan, S.: A machine learning approach to map tropical selective logging, Remote Sens. Environ., 221, 569–582, https://doi.org/10.1016/j.rse.2018.11.044, 2019.
Huete, A., Didan, K., Miura, T., Rodriguez, E. P., Gao, X., and Ferreira, L. G.: Overview of the radiometric and biophysical performance of the MODIS vegetation indices, Remote Sens. Environ., 83, 195–213, https://doi.org/10.1016/S0034-4257(02)00096-2, 2002.
Hurtt, G. C., Chini, L. P., Frolking, S., Betts, R. A., Feddema, J., Fischer, G., Fisk, J. P., Hibbard, K., Houghton, R. A., Janetos, A., Jones, C. D., Kindermann, G., Kinoshita, T., Klein Goldewijk, K., Riahi, K., Shevliakova, E., Smith, S., Stehfest, E., Thomson, A., Thornton, P., Van Vuuren, D. P., and Wang, Y. P.: Harmonization of land-use scenarios for the period 1500–2100: 600 years of global gridded annual land-use transitions, wood harvest, and resulting secondary lands, Climatic Change, 109, 117–161, https://doi.org/10.1007/s10584-011-0153-2, 2011.
Hurtt, G. C., Chini, L., Sahajpal, R., Frolking, S., Bodirsky, B. L., Calvin, K., Doelman, J. C., Fisk, J., Fujimori, S., Klein Goldewijk, K., Hasegawa, T., Havlik, P., Heinimann, A., Humpenöder, F., Jungclaus, J., Kaplan, J. O., Kennedy, J., Krisztin, T., Lawrence, D., Lawrence, P., Ma, L., Mertz, O., Pongratz, J., Popp, A., Poulter, B., Riahi, K., Shevliakova, E., Stehfest, E., Thornton, P., Tubiello, F. N., van Vuuren, D. P., and Zhang, X.: Harmonization of global land use change and management for the period 850–2100 (LUH2) for CMIP6, Geosci. Model Dev., 13, 5425–5464, https://doi.org/10.5194/gmd-13-5425-2020, 2020.
IPCC: 2006 IPCC Guidelines for National Greenhouse Gas Inventories, Volume 4: Agriculture, Forestry and Other Land Use, Chap. 12: Harvested Wood Products, https://www.ipcc-nggip.iges.or.jp/support/Primer_2006GLs.pdf (last access: 25 June 2023), 2006a.
IPCC: 2006 IPCC Guidelines for National Greenhouse Gas Inventories, Volume 4: Agriculture, Forestry and Other Land Use, Chap. 4: Forest Land, https://www.ipcc-nggip.iges.or.jp/public/2006gl/pdf/4_Volume4/V4_04_Ch4_Forest_Land.pdf (last access: 27 December 2023), 2006b.
IPCC: 2013 revised supplementary methods and good practice guidance arising from the Kyoto Protocol, Intergovernmental Panel on Climate Change, Geneva, Switzerland, https://www.ipcc-nggip.iges.or.jp/public/kpsg/pdf/KP_Supplement_Entire_Report.pdf (last access: 24 June 2023), 2014.
IPCC: Refinement to the 2006 IPCC Guidelines for National Greenhouse Gas Inventories. Volume 5: Waste, Chap. 3: Solid Waste Disposal, https://www.ipcc-nggip.iges.or.jp/public/2019rf/pdf/5_Volume5/19R_V5_3_Ch03_SWDS.pdf (last access: 25 June 2023), 2019a.
IPCC: Refinement to the 2006 IPCC Guidelines for National Greenhouse Gas Inventories. Volume 4: Agriculture, Forestry and Other Land Use, Chap. 12: Harvested Wood Products, https://www.ipcc-nggip.iges.or.jp/public/2019rf/pdf/4_Volume4/19R_V4_Ch12_HarvestedWoodProducts.pdf (last access: 27 December 2023), 2019b.
IPCC: Climate Change 2021 – The Physical Science Basis: Working Group I Contribution to the Sixth Assessment Report of the Intergovernmental Panel on Climate Change, 1st Edn., Cambridge University Press, https://doi.org/10.1017/9781009157896, 2023.
Jian, X., Zhang, X., Liu, Y., Liu, X., Chen, K., Wang, L., Li, J., Zhao, Y., Luo, J., Zhugu, R., and Ma, J.: The response of radiative forcing to high spatiotemporally resolved land-use change and transition from 1982 to 2010 in China, Geophys. Res. Lett., 49, e2022GL099003, https://doi.org/10.1029/2022GL099003, 2022.
Jiang, X., Li, K., and Jiang, B.: Analysis on influencing factors of wood products blank outturn rate, Sci. Technol. Eng., 22, 10930–10938, 2022.
Johnston, C. M. T. and Radeloff, V. C.: Global mitigation potential of carbon stored in harvested wood products, P. Natl. Acad. Sci. USA, 116, 14526–14531, https://doi.org/10.1073/pnas.1904231116, 2019.
Kowalski, A. S., Loustau, D., Berbigier, P., Manca, G., Tedeschi, V., Borghetti, M., Valentini, R., Kolari, P., Berninger, F., Rannik, Ü., Hari, P., Rayment, M., Mencuccini, M., Moncrieff, J., and Grace, J.: Paired comparisons of carbon exchange between undisturbed and regenerating stands in four managed forests in Europe: Carbon exchange in mature and regenerating forest, Glob. Change Biol., 10, 1707–1723, https://doi.org/10.1111/j.1365-2486.2004.00846.x, 2004.
Lal, R., Lorenz, K., Hüttl, R. F., Schneider, B. U., and Von Braun, J. (Eds.): Ecosystem services and the global carbon cycle, in: Ecosystem services and carbon sequestration in the biosphere, Springer Netherlands, Dordrecht, 151–181, https://doi.org/10.1007/978-94-007-6455-2, 2013.
Li, F., He, B., and Yang, Z.: Progress of research on tree felling root treatment and application technology, Pract. For. Technol., 8, 9–11, https://doi.org/10.13456/j.cnki.lykt.2012.08.017, 2012.
Lippke, B., Oneil, E., Harrison, R., Skog, K., Gustavsson, L., and Sathre, R.: Life cycle impacts of forest management and wood utilization on carbon mitigation: knowns and unknowns, Carbon Manag., 2, 303–333, https://doi.org/10.4155/cmt.11.24, 2011.
Liu, D., Chen, Y., Cai, W., Dong, W., Xiao, J., Chen, J., Zhang, H., Xia, J., and Yuan, W.: The contribution of China's Grain to Green Program to carbon sequestration, Landsc. Ecol., 29, 1675–1688, https://doi.org/10.1007/s10980-014-0081-4, 2014.
Liu, S., Bond-Lamberty, B., Hicke, J. A., Vargas, R., Zhao, S., Chen, J., Edburg, S. L., Hu, Y., Liu, J., McGuire, A. D., Xiao, J., Keane, R., Yuan, W., Tang, J., Luo, Y., Potter, C., and Oeding, J.: Simulating the impacts of disturbances on forest carbon cycling in North America: Processes, data, models, and challenges, J. Geophys. Res., 116, G00K08, https://doi.org/10.1029/2010JG001585, 2011.
Masek, J. G., Cohen, W. B., Leckie, D., Wulder, M. A., Vargas, R., De Jong, B., Healey, S., Law, B., Birdsey, R., Houghton, R. A., Mildrexler, D., Goward, S., and Smith, W. B.: Recent rates of forest harvest and conversion in North America, J. Geophys. Res., 116, G00K03, https://doi.org/10.1029/2010JG001471, 2011.
Matricardi, E. A. T., Skole, D. L., Pedlowski, M. A., Chomentowski, W., and Fernandes, L. C.: Assessment of tropical forest degradation by selective logging and fire using Landsat imagery, Remote Sens. Environ., 114, 1117–1129, https://doi.org/10.1016/j.rse.2010.01.001, 2010.
Matsumoto, R., Kayo, C., Kita, S., Nakamura, K., Lauk, C., and Funada, R.: Estimation of carbon stocks in wood products for private building companies, Sci. Rep., 12, 18112, https://doi.org/10.1038/s41598-022-23112-0, 2022.
Nabuurs, G.-J., Verweij, P., Van Eupen, M., Pérez-Soba, M., Pülzl, H., and Hendriks, K.: Next-generation information to support a sustainable course for European forests, Nat. Sustain., 2, 815–818, https://doi.org/10.1038/s41893-019-0374-3, 2019.
National Forestry Administration: The definition of China forestry statistic indicators, China Forestry Press, Beijing, 117–137, https://www.stats.gov.cn/zt_18555/ztsj/hjtjzl/2013/202303/t20230302_1920915.html (last access: 12 January 2024), 2000.
National Forestry and Grassland Administration: China Forest Resources Report in 2014–2018, China Forestry Publishing, ISBN 978-7-5038-9982-9, 2019.
Nepstad, D. C., Nobre, C., Lima, E., Lefebvre, P., Schlesinger, P., Potter, C., Mendoza, E., Cochrane, M., and Brooks, V.: Large-scale impoverishment of Amazonian forests by logging and fire, 398, 505–508, https://doi.org/10.1038/19066, 1999.
Pan, Y., Birdsey, R. A., Fang, J., Houghton, R., Kauppi, P. E., Kurz, W. A., Phillips, O. L., Shvidenko, A., Lewis, S. L., Canadell, J. G., Ciais, P., Jackson, R. B., Pacala, S. W., McGuire, A. D., Piao, S., Rautiainen, A., Sitch, S., and Hayes, D.: A large and persistent carbon sink in the world's forests, Science, 333, 988–993, https://doi.org/10.1126/science.1201609, 2011.
Pennock, D. J. and Van Kessel, C.: Clear-cut forest harvest impacts on soil quality indicators in the mixedwood forest of Saskatchewan, Canada, Geoderma, 75, 13–32, https://doi.org/10.1016/S0016-7061(96)00075-4, 1997.
Pingoud, K. and Wagner, F.: Methane emissions from landfills and carbon dynamics of harvested wood products: The First-Order Decay revisited, Mitig. Adapt. Strateg. Glob. Change, 11, 961–978, https://doi.org/10.1007/s11027-006-9029-6, 2006.
Profft, I., Mund, M., Weber, G.-E., Weller, E., and Schulze, E.-D.: Forest management and carbon sequestration in wood products, Eur. J. For. Res., 128, 399–413, https://doi.org/10.1007/s10342-009-0283-5, 2009.
Research and Market: Research report on timber import in China, 2019–2023, China Research & Intelligence, https://www.researchandmarkets.com/reports/4744796 (last access: 27 July 2023), 2019.
Skog, K. E.: Sequestration of carbon in harvested wood products for the United States, For. Prod. J., 58, 56–72, 2008.
Skog, K. E., Pingoud, K., and Smith, J. E.: A method countries can use to estimate changes in carbon stored in harvested wood products and the uncertainty of such estimates, Environ. Manage., 33, https://doi.org/10.1007/s00267-003-9118-1, 2004.
Smyth, C. E., Stinson, G., Neilson, E., Lemprière, T. C., Hafer, M., Rampley, G. J., and Kurz, W. A.: Quantifying the biophysical climate change mitigation potential of Canada's forest sector, Biogeosciences, 11, 3515–3529, https://doi.org/10.5194/bg-11-3515-2014, 2014.
Stockmann, K. D., Anderson, N. M., Skog, K. E., Healey, S. P., Loeffler, D. R., Jones, G., and Morrison, J. F.: Estimates of carbon stored in harvested wood products from the United States forest service northern region, 1906–2010, Carbon Balance Manag., 7, 1, https://doi.org/10.1186/1750-0680-7-1, 2012.
Tao, S., Ru, M. Y., Du, W., Zhu, X., Zhong, Q. R., Li, B. G., Shen, G. F., Pan, X. L., Meng, W. J., Chen, Y. L., Shen, H. Z., Lin, N., Su, S., Zhuo, S. J., Huang, T. B., Xu, Y., Yun, X., Liu, J. F., Wang, X. L., Liu, W. X., Cheng, H. F., and Zhu, D. Q.: Quantifying the rural residential energy transition in China from 1992 to 2012 through a representative national survey, Nat. Energy, 3, 567–573, https://doi.org/10.1038/s41560-018-0158-4, 2018.
Van Ewijk, S., Stegemann, J. A., and Ekins, P.: Limited climate benefits of global recycling of pulp and paper, Nat. Sustain., 4, 180–187, https://doi.org/10.1038/s41893-020-00624-z, 2020.
Wang, D., Ren, P., Xia, X., Fan, L., Qin, Z., Chen, X., and Yuan, W.: National forest carbon harvesting and allocation dataset for the period 2003 to 2018. figshare [data set], https://doi.org/10.6084/m9.figshare.23641164.v2, 2023.
Wei, X., Zhao, J., Hayes, D. J., Daigneault, A., and Zhu, H.: A life cycle and product type based estimator for quantifying the carbon stored in wood products, Carbon Balance Manag., 18, 1, https://doi.org/10.1186/s13021-022-00220-y, 2023.
Werner, F., Taverna, R., Hofer, P., Thürig, E., and Kaufmann, E.: National and global greenhouse gas dynamics of different forest management and wood use scenarios: a model-based assessment, Environ. Sci. Policy, 13, 72–85, https://doi.org/10.1016/j.envsci.2009.10.004, 2010.
White, M. K., Gower, S. T., and Ahl, D. E.: Life cycle inventories of roundwood production in northern Wisconsin: Inputs into an industrial forest carbon budget, Forest Ecol. Manag., 219, 13–28, https://doi.org/10.1016/j.foreco.2005.08.039, 2005.
Winjum, J. K., Brown, S., and Schlamadinger, B.: Forest harvests and wood products: Sources and sinks of atmospheric carbon dioxide, For. Sci., 44, 272–284, https://doi.org/10.1093/forestscience/44.2.272, 1998.
Xia, X., Xia, J., Chen, X., Fan, L., Liu, S., Qin, Y., Qin, Z., Xiao, X., Xu, W., Yue, C., Yue, X., and Yuan, W.: Reconstructing long-term forest cover in China by fusing national forest inventory and 20 land use and land cover data sets, J. Geophys. Res.-Biogeo., 128, e2022JG007101, https://doi.org/10.1029/2022JG007101, 2023.
Yu, Z., Zhao, H., Liu, S., Zhou, G., Fang, J., Yu, G., Tang, X., Wang, W., Yan, J., Wang, G., Ma, K., Li, S., Du, S., Han, S., Ma, Y., Zhang, D., Liu, J., Liu, S., Chu, G., Zhang, Q., and Li, Y.: Mapping forest type and age in China's plantations, Sci. Total Environ., 744, 140790, https://doi.org/10.1016/j.scitotenv.2020.140790, 2020.
Yu, Z., Ciais, P., Piao, S., Houghton, R. A., Lu, C., Tian, H., Agathokleous, E., Kattel, G. R., Sitch, S., Goll, D., Yue, X., Walker, A., Friedlingstein, P., Jain, A. K., Liu, S., and Zhou, G.: Forest expansion dominates China's land carbon sink since 1980, Nat. Commun., 13, 5374, https://doi.org/10.1038/s41467-022-32961-2, 2022.
Yuan, W., Li, X., Liang, S., Cui, X., Dong, W., Liu, S., Xia, J., Chen, Y., Liu, D., and Zhu, W.: Characterization of locations and extents of afforestation from the Grain for Green Project in China, Remote Sens. Lett., 5, 221–229, https://doi.org/10.1080/2150704X.2014.894655, 2014.
Yuan, W., Zheng, Y., Piao, S., Ciais, P., Lombardozzi, D., Wang, Y., Ryu, Y., Chen, G., Dong, W., Hu, Z., Jain, A. K., Jiang, C., Kato, E., Li, S., Lienert, S., Liu, S., Nabel, J. E. M. S., Qin, Z., Quine, T., Sitch, S., Smith, W. K., Wang, F., Wu, C., Xiao, Z., and Yang, S.: Increased atmospheric vapor pressure deficit reduces global vegetation growth, Sci. Adv., 5, eaax1396, https://doi.org/10.1126/sciadv.aax1396, 2019.
Zhang, L., Sun, Y., Song, T., and Xu, J.: Harvested wood products as a carbon sink in China, 1900–2016, Int. J. Environ. Res. Pub. He., 16, 445, https://doi.org/10.3390/ijerph16030445, 2019.
Zhang, X., Yang, H., and Chen, J.: Life-cycle carbon budget of China's harvested wood products in 1900–2015, For. Policy Econ., 92, 181–192, https://doi.org/10.1016/j.forpol.2018.05.005, 2018.