the Creative Commons Attribution 4.0 License.
the Creative Commons Attribution 4.0 License.
 | 06 May 2024
A 30 m annual cropland dataset of China from 1986 to 2021
Shengbiao Wu
Qihao Weng
Yuqi Bai
Jun Yang
Bing Xu
Accurate, detailed, and up-to-date information on cropland extent is crucial for provisioning food security and environmental sustainability. However, because of the complexity of agricultural landscapes and lack of sufficient training samples, it remains challenging to monitor cropland dynamics at high spatial and temporal resolutions across large geographical extents, especially for regions where agricultural land use is changing dramatically. Here we developed a cost-effective annual cropland mapping framework that integrated time-series Landsat satellite imagery, automated training sample generation, as well as machine learning and change detection techniques. We implemented the proposed scheme to a cloud computing platform of Google Earth Engine and generated a novel dataset of China's annual cropland at a 30 m spatial resolution (namely CACD). Results demonstrated that our approach was capable of tracking dynamic cropland changes in different agricultural zones. The pixel-wise F1 scores for annual maps and change maps of CACD were 0.79 ± 0.02 and 0.81, respectively. Further cross-product comparisons, including accuracy assessment, correlations with statistics, and spatial details, highlighted the precision and robustness of CACD compared with other datasets. According to our estimation, from 1986 to 2021, China's total cropland area expanded by 30 300 km2 (1.79 %), which underwent an increase before 2002 but a general decline between 2002 and 2015, and a slight recovery afterward. Cropland expansion was concentrated in the northwest while the eastern, central, and southern regions experienced substantial cropland loss. In addition, we observed 419 342 km2 (17.57 %) of croplands that were abandoned at least once during the study period. The consistent, high-resolution data of CACD can support progress toward sustainable agricultural use and food production in various research applications. The full archive of CACD is freely available at https://doi.org/10.5281/zenodo.7936885 (Tu et al., 2023a).
- Article
(12901 KB) - Full-text XML
-
Supplement
(5384 KB) - BibTeX
- EndNote


The global population has jumped significantly during the past century – from less than 2 billion people in 1920 to 7.8 billion in 2020 – and is expected to reach 9.7 billion by 2050 (Roberts, 2011). Feeding this growing population, as well as coping with increasing food demand from shifting diets, has become a major challenge for global food security and environmental sustainability (Godfray et al., 2010; Searchinger et al., 2008; Tilman et al., 2011). The United Nations has specified the need for realizing “no poverty and zero hunger” and “balancing increasing agricultural production with the maintenance of ecosystem services” in its sustainable development goals (SDGs) (United Nations, 2015). Knowledge of where farmlands locate and how they change over time not only facilitates people's understanding of crop area and yield but also supports early warnings and adaptation initiatives of the agriculture system (See et al., 2015). In this context, detailed, timely, and accurate mapping of cropland extent appears as a critical prerequisite for food market stability, land and water resource management, and the assessment of environmental impacts of agriculture (Waldner et al., 2015b).
As one of the world's most populous countries, China boasts a farming heritage dating back over 8000 years (Bryan et al., 2018). Today, China feeds about 20 % of the global population with only 7 % of the total farmland (Cui and Shoemaker, 2018). This has inevitably placed huge pressure on the country's food security and agricultural sustainability. During the past few decades, extensive croplands have been lost in China because of rapid urbanization (Liu et al., 2019; Tu et al., 2021, 2023b). To compensate for the loss, substantial cropland expansion and intensification has taken place in the meantime (Zuo et al., 2018), which seriously threatens ecosystem functioning and biodiversity (Tang et al., 2021; Zabel et al., 2019). It is therefore of great importance to track spatial–temporal dynamics of croplands in China to propose more adaptive policies and strategies in the face of dramatically changing agricultural land use.
Earth observations provide a reliable and cost-effective way of long-term, large-scale, and up-to-date cropland information gathering. The Moderate Resolution Imaging Spectroradiometer (MODIS) imagery, for example, provides a unique capability to map cropland extent at 250–500 m spatial resolutions (Gumma et al., 2014; Wardlow and Egbert, 2008; Xiong et al., 2017; Zhang et al., 2022a, 2015). However, such kinds of data may fail to detect small field patches (< 2.56 ha) (Fritz et al., 2015), especially for heterogeneous agricultural landscapes. In recent years, higher-resolution remote sensing data like Landsat and Sentinel-2 have been well used in global cropland mapping initiatives at levels of tens of meters, including Finer Resolution Observation and Monitoring-Global Cropland (FROM-GC) (Yu et al., 2013), Global Food Security-Support Analysis Data (GFSAD30) (Thenkabail et al., 2021), and Global Land Analysis & Discovery Cropland Data (GLAD) (Potapov et al., 2022). These are often one-phase or multi-year cropland data products. In some developed countries and regions, more detailed cropland maps, such as the United States National Agricultural Statistics Service Cropland Data Layer (NASS-CDL) (Boryan et al., 2011) and the European Union 10 m crop type map (D'Andrimont et al., 2021), have been produced. However, as of now, no fine-resolution annual cropland dataset for China has been established.
Monitoring cropland dynamics is demanding given the high inter- and intra-annual spectral variabilities of cropland (Prishchepov et al., 2012; Yin et al., 2014). From the perspective of mapping schemes, current approaches undergo a shift from multi-year cropland classification with traditional machine learning to annual cropland mapping that combines change detection techniques. In the former strategy, cropland is usually considered to be a general land use category of which classifications are performed individually for each year using in situ data and supervised classifiers such as decision tree (Boryan et al., 2011; Pittman et al., 2010; Potapov et al., 2022), random forest (Li et al., 2022; Yang and Huang, 2021; Yin et al., 2020), and support vector machine (Lambert et al., 2016; Shao and Lunetta, 2012; Traoré et al., 2019). However, the accuracy of classification maps is highly dependent on data quality, and errors present in each of the maps are compounded in the final change map, which may impair its ability in capturing real cropland use transitions (Zhu, 2017). To overcome this issue, post-classification processing methods, such as consistency checking (Li et al., 2015) or spatial–temporal filtering (Liu and Cai, 2012), have been employed to increase mapping accuracy. The latter strategy leverages all time-series information of remote sensing imagery into a change detection model and has become increasingly popular. Normally, temporal features of spectral bands or indices are used to fit temporal trajectories to identify both abrupt changes and continuous trends (Zhu, 2017). Representative change detection algorithms include Landsat-based detection of Trends in Disturbance and Recovery (LandTrendr) (Kennedy et al., 2010), Breaks for Additive Season and Trend (BFAST) (Verbesselt et al., 2010), and Continuous Change Detection and Classification (CCDC) (Zhu and Woodcock, 2014), for which trials have been given to characterize cropland patterns (Schneibel et al., 2017; Zhu et al., 2019). Nevertheless, since most of these algorithms are not originally developed for cropland change detection, the result can be highly variable and is often mixed with other vegetation types such as forest and grassland (Pasquarella et al., 2022).
One possible solution to deal with the shortcomings mentioned above is to capitalize on the advantages of both strategies, that is, to first perform supervised classifications to generate multi-epoch land cover maps or cropland probabilities and then apply this intermediate information as inputs for change detection. While a few efforts have been made in this manner so far, certain challenges remain, including the following:
- –
limited exploration of the time-series sequence. Change detection analyses are simply used as a final step for updating the year of change (Dara et al., 2018; Xu et al., 2020, 2018), while the rich information stored in fitted trajectories of temporal segmentation is not well incorporated in distinguishing of croplands.
- –
unreasonable settings of land use conversion rules. Xu et al. (2020), for instance, assumed there was a low probability of frequent land use changes and therefore only detected a single change during each 5-year interval. Yet this is often not the case with croplands.
- –
relatively poor robustness and generality of the algorithm. Most studies are conducted for specific types of cropland use change (e.g., cropland abandonment) and tested in small areas (Dara et al., 2018; Yin et al., 2018; Xu et al., 2021), raising questions about the scalability of the mapping scheme for monitoring large-scale cropland dynamics.
Training samples are another essential issue in effective cropland classification. Existing studies rely extensively on in situ data or human interpretation of spectral signatures, making the classification process resource intensive, time-consuming, and difficult to repeat over space and time (Zhong et al., 2014). To cope with the constraints, recent initiatives have been made to extract labeling or training data from existing land cover information (often referred to as “baseline maps”) (Huang et al., 2020; Radoux et al., 2014; Waldner et al., 2015a; Xie et al., 2019; Zhang and Roy, 2017). Zhang and Roy (2017) derived training samples of classifications from previous 500 m MODIS land cover products. Huang et al. (2020) proposed an automatic training sample migration method by measuring the spectral similarity and spectral distance between the reference spectra and image spectra. These achievements have paved a new way for cost-effective mapping of annual croplands.
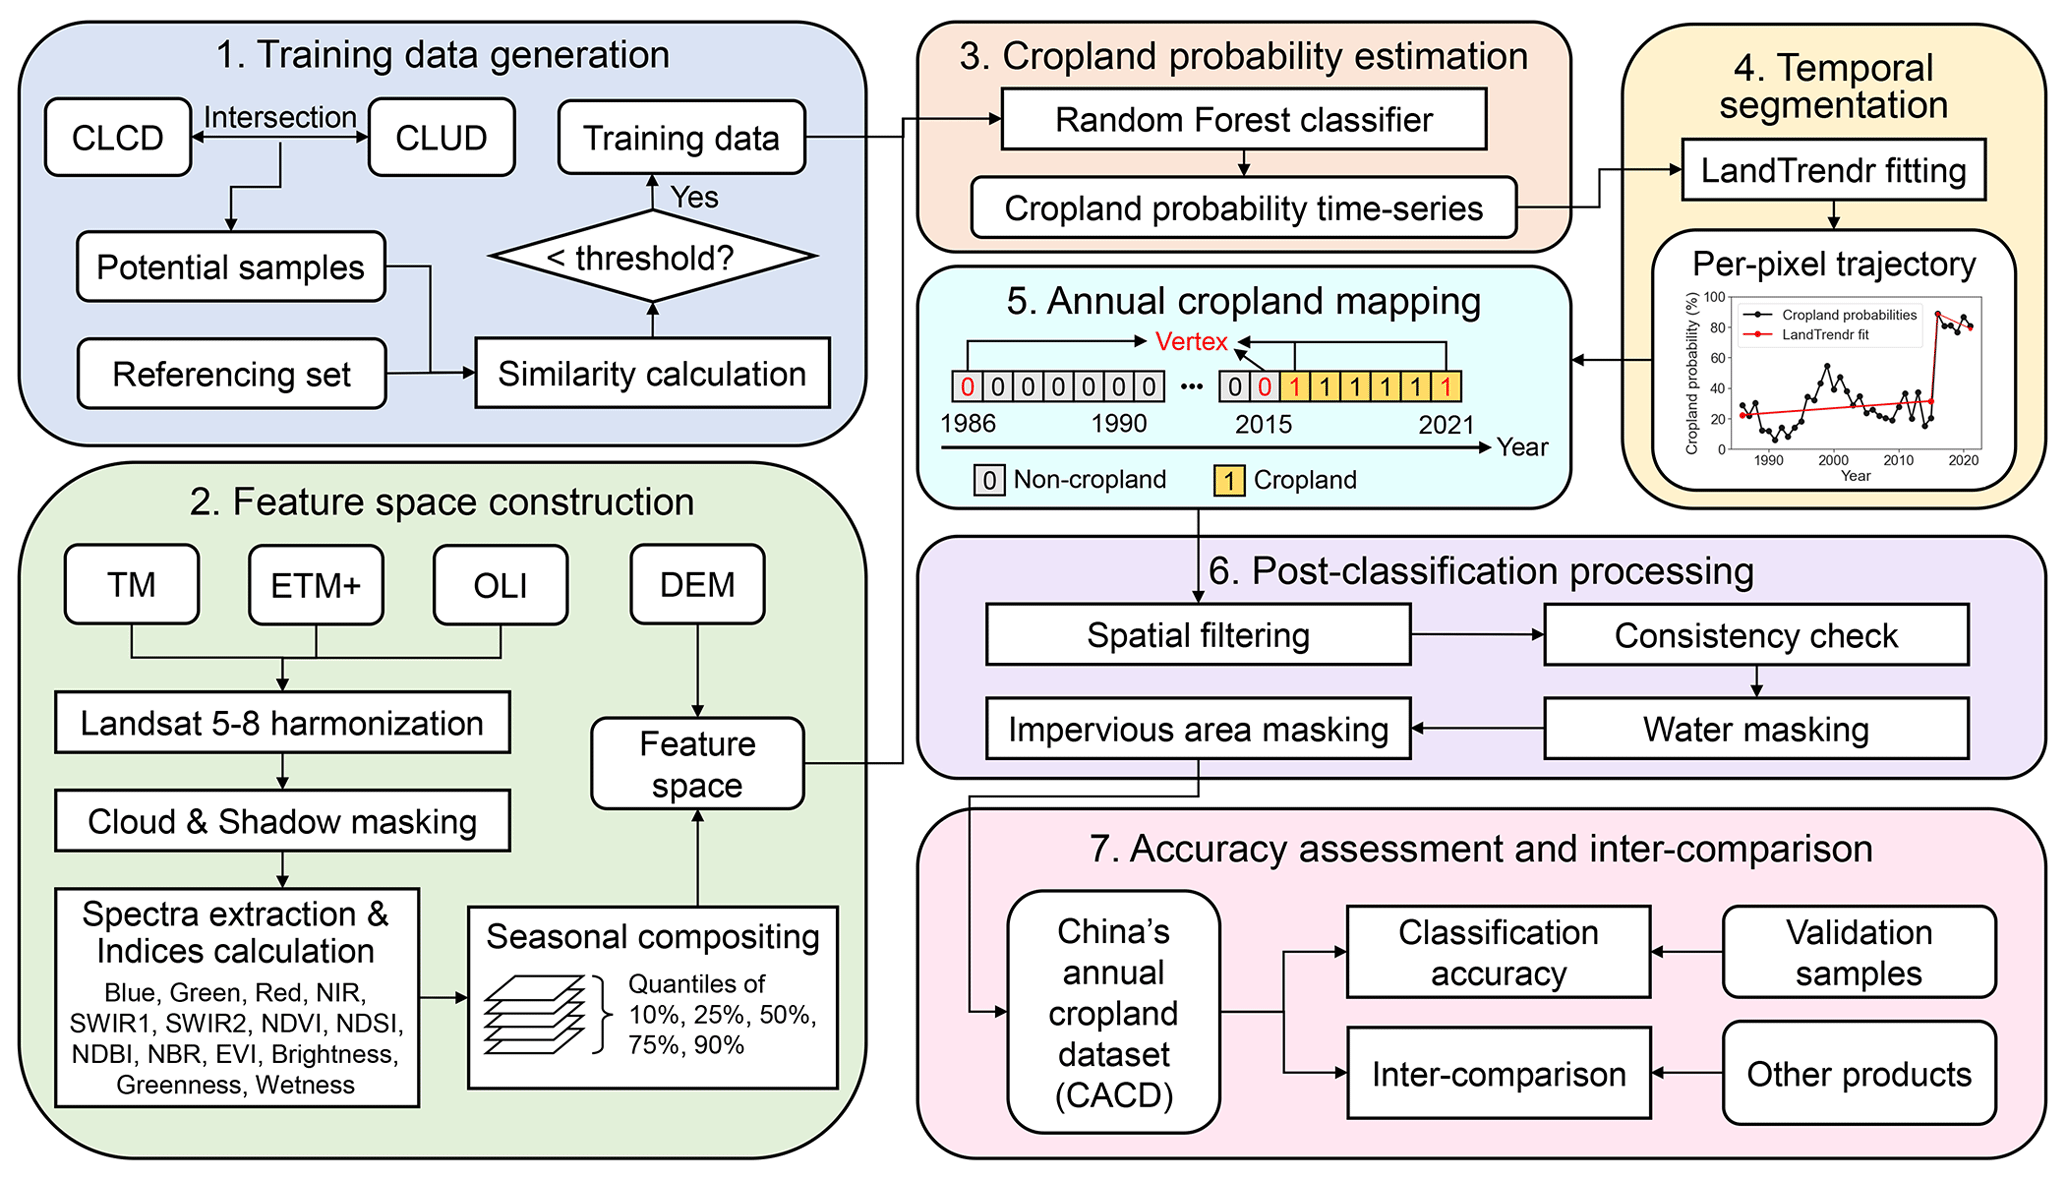
The aim of this study is to propose an incorporated paradigm for large-scale, fine-resolution cropland dynamics monitoring. We began by automatically generating training samples based on prerequisite knowledge, existing land cover baseline maps, and a time-weighted dynamic time warping method. Subsequently, we inputted multi-temporal features derived from time-series Landsat satellite imagery into a random forest classifier to obtain per-pixel annual cropland probabilities. By further applying the LandTrendr change detection algorithm, we classified the cropland probability time series into several segments in which breakpoints and corresponding years of changes were recorded. Here we inspected cropland changes as a continuous dynamic process that consisted of several trajectories including no change, cropland gain, or cropland loss. We established a set of rules to discriminate annual cropland types from the LandTrendr segmentation results. Based on the proposed framework, we produced the annual cropland dataset of China (CACD) for 1986–2021 at a 30 m spatial resolution. We examined the accuracy of CACD using independent validation sample sets and compared the results with existing cropland maps. Finally, we assessed spatial and temporal changes in croplands in China since the 1980s with CACD.
As the framework shows in Fig. 1, we have proposed a trajectory-based approach that combines machine learning and change detection techniques for mapping annual cropland dynamics. Annual cropland in this study is defined as a piece of land of 0.25 ha at minimum (minimum width of 30 m) that is sowed/planted and harvestable at least once within the 12 months after the sowing or planting date. This definition aligns with the criteria established by the Joint Experiment of Crop Assessment and Monitoring (JECAM) network (Defourny et al., 2014) and adopts a shared scope of cropland that meets FAO's Land Cover Meta Language (Di Gregorio, 2005). One crucial criterion for discerning annual cropland in this study is that its vegetation signals in remote sensing imagery must demonstrate noticeable variations over a 12-month period, reflecting the planting and harvesting activities (Fig. S1a in the Supplement). Consequently, certain exceptions are excluded in the definition of annual cropland:
- –
perennial crops like sugarcane and cassava, which have longer vegetation cycles and are not planted annually (Fig. S1b and c); however, if they are planted and harvested within a 12-month time frame, we would consider them as croplands for that specific year;
- –
fruit, tea, and coffee plantations, as their vegetation signals more closely resemble those of trees (Fig. S1d, e, and f);
- –
greenhouse crops, as they exhibit distinct remote sensing characteristics compared with other cropland types (Fig. S1g);
- –
small plots, such as legumes, that do not meet the minimum size criteria of cropland.
China, a traditional agricultural nation in East Asia, is chosen as the study area for testing and verifying the proposed approach under large scales and dynamic climates. The country shares a total area of 9 600 000 km2, including mainland China, Hong Kong, Macau, and Taiwan. According to the national comprehensive agricultural zoning promulgated by the Chinese government, our study area consists of nine agricultural zones in general (Fig. S2). Their geographical and climatic conditions, growing seasons, cropping patterns, and major crops are provided in Table S1 in the Supplement. Considering local differences and computation capacity, we divided the study area into around 1700 subregions with a size of 0.8° × 0.8° (Fig. S2). Within each subregion, we performed annual cropland classifications individually on Google Earth Engine (GEE; https://earthengine.google.com/, last access: 1 May 2024) based on the proposed methods in Fig. 1, of which details are described in Sects. 2.1–2.7.
2.1 Training data generation
Training samples emerged as a key component in supervised classification. Here we developed an effective approach for automated training sample generation using existing land cover maps and the time-weighted dynamic time warping (TWDTW) method. First, we built a cropland inspector tool on GEE that depicted time-series NDVI profiles and corresponding Landsat imagery for a given point of interest. An illustration of the interpretation process of annual cropland types is given in Fig. S3. Based on the tool, we manually interpreted 100 stable cropland points and 100 non-cropland (including forests, water ponds, and impervious areas) points within each agricultural zone as the referencing set. Second, we overlapped two annual land cover datasets in China, CLCD (Yang and Huang, 2021) and CLUD (Xu et al., 2020), to extract cropland and non-cropland masks for each year, respectively. For each subregion, we produced thousands of potential cropland and non-cropland points randomly and compared their monthly NDVI sequences with those of the referencing set using TWDTW, an algorithm that had been developed for distinguishing between different types of land use and land cover (Maus et al., 2016). TWDTW works by comparing the similarity between two temporal sequences and finds their optimal alignment, resulting in a dissimilarity measure (Belgiu and Csillik, 2018). Based on the discrimination results, we retained 20 % invariant samples that had the lowest dissimilarity value compared with the referencing set. The threshold value was set following recommendations by Ghorbanian et al. (2020). To determine how many training samples were least required for a robust classification, we conducted multiple experiments with different training sizes. As shown in Fig. S4, the F1 score of cropland classification increased as the number of training samples grew in the initial stage but became rather stable after reaching 800. Consequently, we generated ∼ 800 training samples within each subregion.
In practice, we employed the widely adopted areal-proportional sampling strategy (Huang et al., 2002; Jin et al., 2014) for allocating both cropland and non-cropland samples. However, one limitation of this approach is that it can result in extremely small sample sizes for rare land cover types in homogeneous landscapes. When these types are underrepresented in the samples, it may lead to subpar classification performance. To address this concern, Zhu et al. (2016) recommended a minimum sample size of 600 for rare land cover types. A recent study also applied this parameter for sample balancing in global annual land cover mapping within each 5° × 5° geographical tile (Zhang et al., 2024). Given that the subregion size in our research (0.8° × 0.8°) is significantly smaller than that in Zhang's study (5° × 5°), we established the minimum sample size as 100. This means that we initially generated 800 samples for each 0.8° × 0.8° subregion, encompassing both cropland and non-cropland categories. If either category fell below the specified threshold, we increased it to a minimum of 100 samples.
2.2 Feature space construction
We used all available Landsat TM/ETM+/OLI (Landsat 5/7/8) tier-1 surface reflectance imagery from 1986 to 2021 covering our study area as of March 2022. The data had been atmospherically corrected by USGS using the LEDAPS (Masek et al., 2006) and LaSRC (Vermote et al., 2016) algorithms. We further masked out all the clouds, cloud shadows, and snow/ice contained in the Landsat imagery using the FMASK approach (Zhu and Woodcock, 2012). Considering the differences between sensors, we applied the coefficients suggested by Roy et al. (2016) to normalize Landsat 8 reflectance to that of Landsat 5 and 7. This enabled multi-temporal images to be consistent and comparable across years. Next, we calculated spectral indices of NDVI, NDSI, NDBI, NBR, and EVI based on the formulas provided in Table S2. To improve classification performance, we finally carried out the tasseled cap transformation to include brightness, greenness, and wetness indices using the coefficients provided by Crist (1985).
Multi-temporal metrics have been widely used for capturing the spatial–temporal features of different land covers, such as forests, croplands, and urban areas (Potapov et al., 2012; Yin et al., 2020). Due to the nature of crop growth, spectral signals of the croplands exhibit phenological patterns periodically. An example is shown in Fig. S5, where NDVI is high during the growing season and low during sowing. Accordingly, based on the processed Landsat data, we extracted a series of multi-temporal metrics each year as input features for annual cropland classification. These metrics included the 10th, 25th, 50th, 75th, and 90th percent quantiles of both growing and non-growing seasons for the spectral bands and indices listed in Table S2. In addition, we augmented elevation information into feature space using the Shuttle Radar Topography Mission (SRTM) digital elevation dataset (Jarvis et al., 2008). This resulted in a total of 141 input features for each year.
2.3 Cropland probability estimation
We estimated pixel-wise cropland probabilities for each year between 1986 and 2021 using the random forest algorithm. Random forest is a bagging ensemble learning approach that constructs a multitude of decision trees at the training time (Ho, 1995). The final class (classification) or prediction (regression) is assigned based on the majority “vote” of all trees (Breiman, 2001). The algorithm has been widely used in land cover and land use classifications, given its accuracy and efficiency in dealing with high-dimensional data (Gong et al., 2019; Tu et al., 2020). In this study, the parameter for the number of trees (numberOfTrees) was set to 500, the number of variables per split (variablesPerSplit) was set to the square root of numberOfTrees, and other parameters were set to the same default as those on GEE. During implementation, we constructed a random forest model for each 0.8° × 0.8° subregion (Fig. S2) using these parameter settings.
2.4 Temporal segmentation
We employed the trajectory-based spectral–temporal segmentation algorithm, LandTrendr, to decompose the pixel-wise annual cropland probability time series into different cropland use segments. The overarching goal of LandTrendr is to characterize a temporal trajectory of data values using a sequence of connected linear segments bounded by breakpoints known as “vertex” (Kennedy et al., 2018). By fitting a series of linear segments, LandTrendr reduces inter-annual signal noise while capturing both long-term gradual and short-term drastic changes (Kennedy et al., 2010). The fitting result of LandTrendr is a series of segments composed of breakpoints that separate periods of durable change or stability in spectral trajectory (Fig. 2). In this way, the magnitude of changes as well as years when changes occur can be recorded. LandTrendr was originally developed for detecting forest disturbances, but recent applications also demonstrated its potential in monitoring cropland dynamics (Dara et al., 2018; Yin et al., 2018).

Figure 2Schematic diagram of the segmentation results of annual cropland probability time series based on LandTrendr.
The implementation of LandTrendr requires a series of control parameters and filtering steps designed to reduce overfitting while still capturing the desired features of trajectories. Nevertheless, when leveraging LandTrendr to monitor cropland dynamics, we found few experiences with parameter settings in the literature. In addition, differences in climatic, geographic, and cropping conditions across regions would also affect algorithm performance. Accounting for these issues, we defined one test region for each agricultural zone with a size of 100 × 100 km (Fig. S2). Within each test region, we interpreted 100 cropland and non-cropland samples likewise and compared classification results under different LandTrendr arguments using the developed approach (Table S3). Detailed statistics on the classification performance of different LandTrendr parameter settings for each test region are given in Table S4. Practically, we assigned LandTrendr parameter settings with the highest classification accuracy of F1 score as the input for annual cropland mapping in the corresponding agricultural zone.
2.5 Annual cropland mapping
We have established a set of rules that automatically discriminate cropland transition types based on the LandTrendr segmentation results of annual cropland probability time series. Suppose each segment represents a specific cropland use status or change, the key is to determine its transition type characterized by the fitting breakpoints in the beginning and end, and then to reverse cropland types for each year within the segment. Take the pixel in Fig. 2 as an example: LandTrendr has divided its time series of cropland probabilities into three end-to-end segments (s) and four breakpoints (p), where t and v represent the year in which cropland use changes occur and the fitted cropland probability. First, land use conditions for all breakpoints p(t,v) are identified based on the fitted value: cropland if v>0.5 and non-cropland if v≤0.5. Since each segment si is delineated by a starting breakpoint pis and an ending breakpoint pie, this results in four scenarios for the transition type of si (Table 1). If both pis and pie have the same category, land use types of the pixel during si remain unchanged and should always be consistent: when pis and pie are both cropland, it is assigned as cropland for each year during tis-tie, whereas when pis and pie are both non-cropland, it is assigned as non-cropland for each year during tis-tie. If vis>0.5 and vie≤0.5, it means cropland loss takes place during the period. In this case, the pixel will be recognized as cropland in tis and non-cropland from tis+1 to tie. Conversely, under the scenario where pis is non-cropland and pie is cropland, land use types of the pixel are assigned as cropland in all years of si except for tis (which is non-cropland). More examples on discerning dynamic cropland changes with our proposed annual cropland framework can be found in Figs. S6–S9.
Table 1Rules for annual cropland transition discrimination based on the LandTrendr segmentation results. pis(tis, vis) and pie(tie, vie) are the starting and ending breakpoints of the ith segment si, respectively, where t is the year and v is the fitted cropland probability.

2.6 Post-classification processing
In post-classification processing, we initially applied a 2-D Gaussian low pass filter to the classified cropland maps. The Gaussian filter is one of the most widely used and effective window-based filtering methods for reducing noise and blurring regions of an image (Canny, 1986). Weights for each pixel in the filtering window are determined by a Gaussian function:
where x and y are the coordinates of the pixels in the filtering window. The coordinate of the center pixel of the window is (0,0). The standard deviation of the Gaussian filter is σ, which controls the degree of blurring spectral information. The filtering window is also controlled by a kernel, which determines the neighborhood extent that can be computed on the central pixel (usually odd numbers). In this study, a 3 × 3 px Gaussian filter was performed using the OpenCV package in Python.
Furthermore, we implemented a spatial–temporal consistency check approach, modified based on the method proposed by Li et al. (2015), to refine the annual cropland maps. Specifically, for each pixel i in year t, we calculated its spatial–temporal consistency probability Probi,t within the surrounding 3 × 3 × 3 px window:
where Li,t denotes the label of the target pixel i in year t and Lj denotes the label of pixels in the neighborhood window. N signifies the total number of pixels (i.e., N=27), and x and y indicate the coordinates of pixel i within the window. The crux of this approach lies in the consistency check function Con, which equals 1 if , and 0 otherwise. Here we followed the threshold of 0.5, as suggested by Li et al. (2015), to discern the label transition between cropland (1) and non-cropland (0): if Probi,t is less than 0.5, then the label of pixel i in year t is altered to the opposite category.
Lastly, we used the JRC global surface water (Pekel et al., 2016) and global artificial impervious area (GAIA) (Gong et al., 2020) datasets to mask out permanent water and impervious areas in each corresponding year, respectively.
2.7 Accuracy assessment and intercomparison
Map confidence is a key reflection of classification performance and data quality. In this study, three independent sample sets were used to evaluate the accuracy of CACD comprehensively. The first one was the annual validation sample set generated by the research team. Specifically, we divided the study area into nearly 1000 hexagons and randomly created five points within each hexagon, following the work by Gong et al. (2013) on sample design. For each random point, land cover status and changes were interpreted manually. This was realized based on the cropland inspector tool and historical high-resolution images from Google Earth. Six well-trained researchers were involved in the interpretation task. Each validation point was identified by at least two researchers, and the yearly land cover types between 1986 and 2021 (cropland or non-cropland), as well as confidence level (low or high), were filled in the result sheet. If there was a disagreement between the interpretation results, a final judgment would be made through discussions among the research team. We discarded points with low confidence and retrieved a total of 4972 validation samples by the end (Fig. 3).
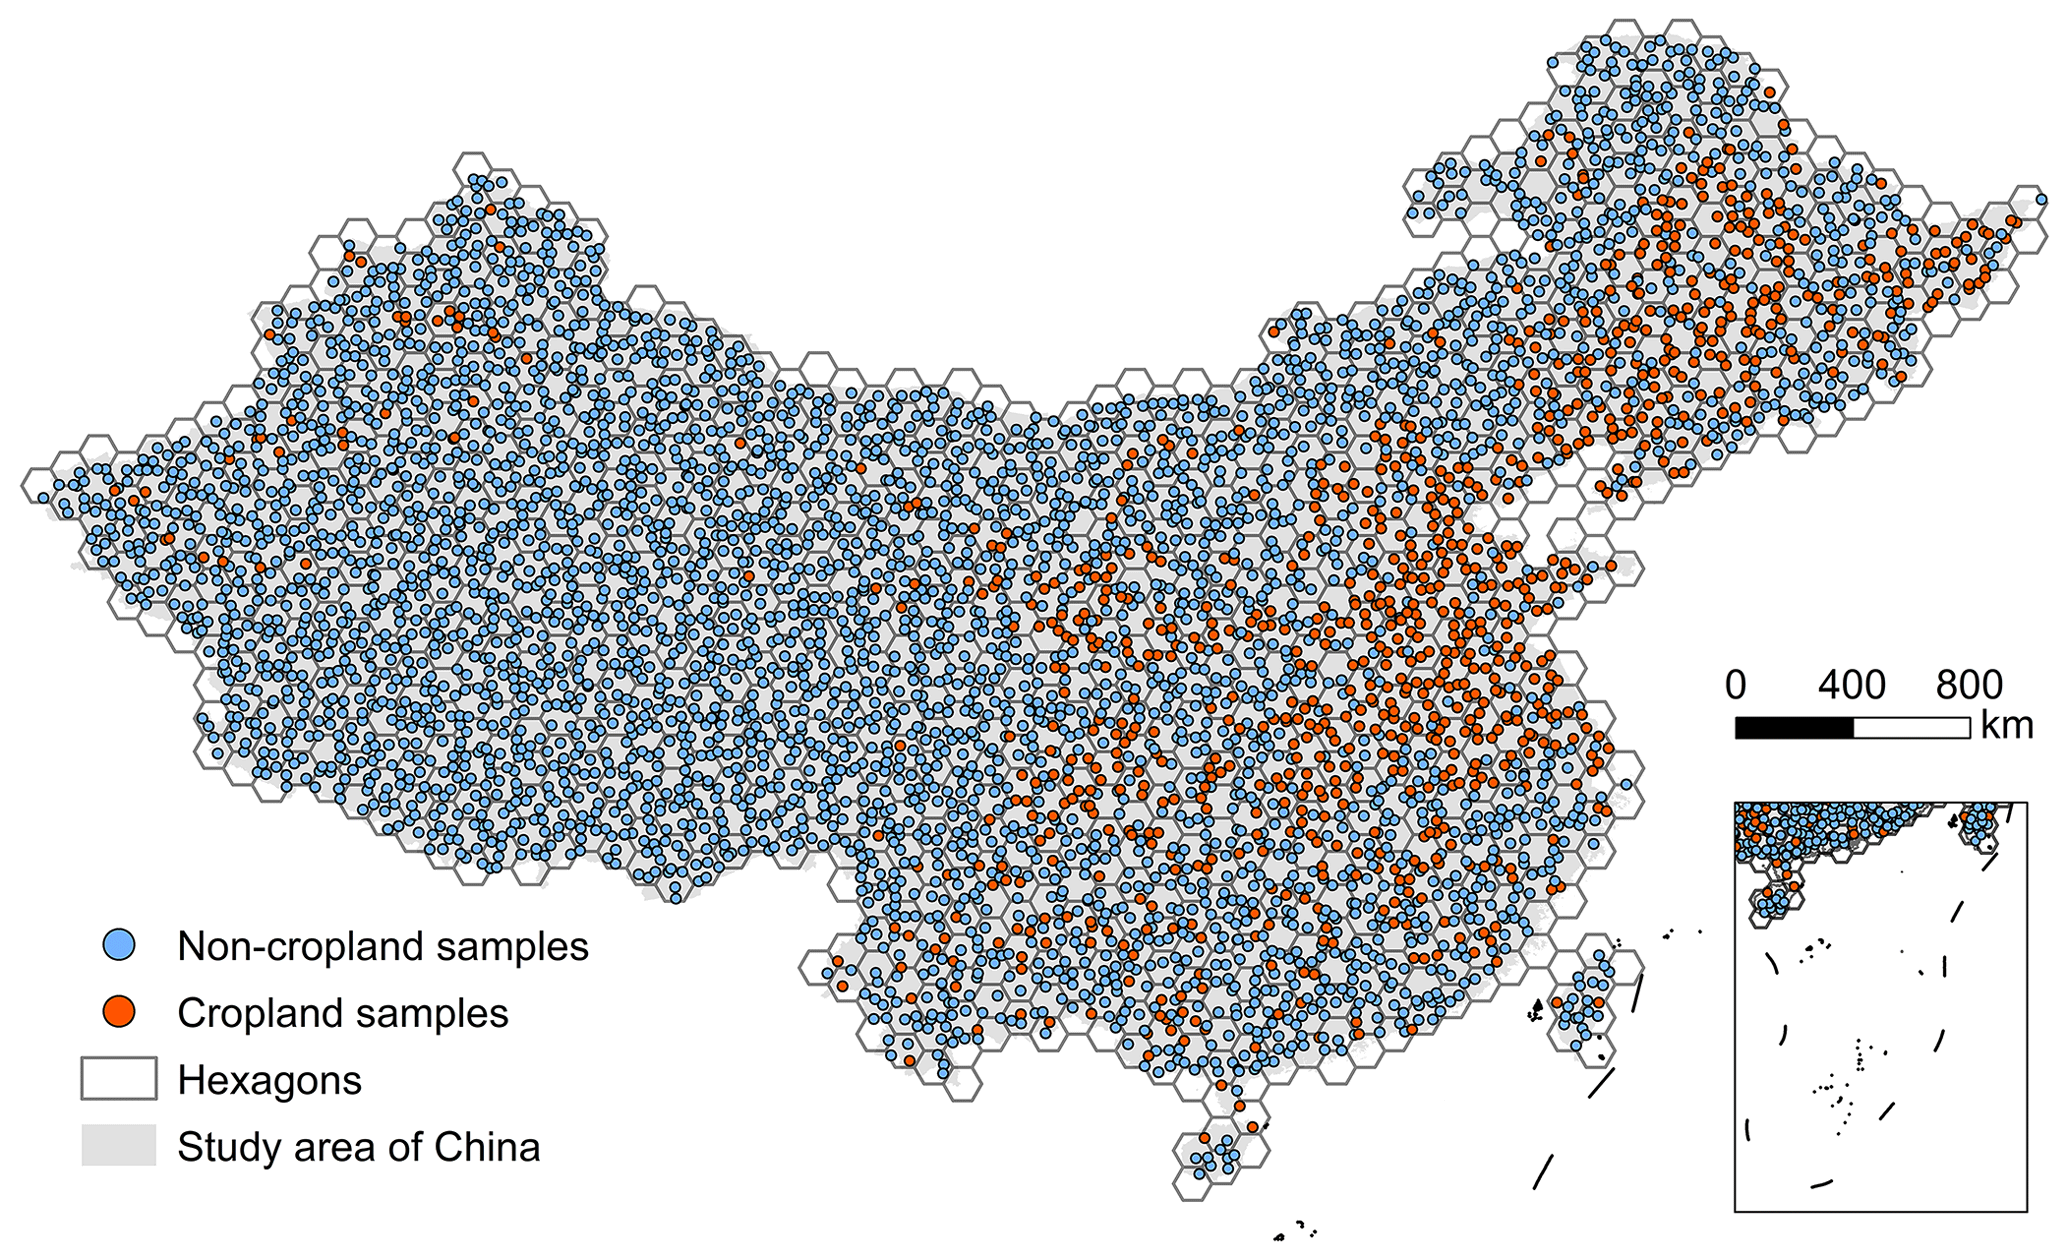
Figure 3Spatial distribution of validation samples collected in this study (taking the year 1986 as an example).
Moreover, we leveraged two third-party sample sets (namely GLCVSS and Geo-Wiki) for the accuracy assessment of CACD. The global land cover validation sample set (GLCVSS) was the first all-season validation sample set generated for global land cover mapping (Li et al., 2017). It contained ∼ 35 000 validation samples interpreted on Landsat 8 data with records of the date of image acquisition (interpreted from 2013 to 2015), spectral reflectance for each season, and level of interpretation uncertainty as well as sample sizes (3 × 3, 9 × 9, 17 × 17, 33 × 33, 1 unit = 30 m). The classification system of GLCVSS was the same as FROM-GLC. We selected all GLCVSS points in China with high confidence and a sample size of 30 × 30 m (Fig. S10). The other sample set, Geo-Wiki, was a global cropland reference dataset collected through a crowdsourcing campaign, which involved 80 participants from around the world to review almost 36 000 sample units during September 2016 (Laso Bayas et al., 2017). Each record in the Geo-Wiki dataset represents a cropland site identified by different participants. Likewise, we extracted all the cropland points located in China from Geo-Wiki (Fig. S11). In summary, there were 2018 GLCVSS and 1674 Geo-Wiki samples included in the research.
A group of accuracy metrics were calculated based on the confusion matrix, including F1 score, overall accuracy (OA), producer's accuracy (PA), user's accuracy (UA), and Kappa coefficient. The F1 score was used as a major indicator of accuracy as it conveyed the balance between UA and PA, which reached its best value at 1 and worst value at 0 (Chen et al., 2021). Accuracy metrics of both yearly maps and change maps of CACD were calculated based on the annual validation sample set while GLCVSS was used for assessing the accuracy of CACD in 2015. In terms of Geo-Wiki, because it only contained cropland samples, we calculated the agreement level between Geo-Wiki and CACD in 2016, that is, how many points of Geo-Wiki were classified as cropland in CACD.
In addition, we compared CACD with other publicly available land cover or cropland datasets (i.e., CLCD, CLUD, GLAD, and GFSAD). Both CLCD (Yang and Huang, 2021) and CLUD (Xu et al., 2020) were 30 m annual land cover datasets in China with a long time span. For each year in CLCD and CLUD, we extracted cropland extent (1) and grouped other land cover types as “non-cropland” (0). GLAD represented a globally consistent cropland extent time series at 30 m spatial resolution and was mapped in 4-year intervals (2000–2003, 2004–2007, 2008–2011, 2012–2015, and 2016–2019) (Potapov et al., 2022). GFSAD was a 30 m global cropland dataset for 2015 (Thenkabail et al., 2021). We calculated accuracies of CLCD, CLUD, GLAD, and GFSAD using the three validation sample sets. In addition, we estimated the total area of croplands at the provincial scale and compared it with statistics. It is noteworthy that while all these products delineate cropland extents at a 30 m spatial resolution, they adopt inconsistent definitions of cropland (as detailed in Table S5). As a consequence, the cross-product results could potentially be biased, and we discuss this uncertainty in the limitations and prospects sections (refer to Sect. 4.3).
3.1 Accuracy assessment of CACD
We performed pixel-wise accuracy assessment of CACD based on the annual validation sample set. The F1 score, OA, UA, PA, and Kappa coefficient of annual maps on average were 0.79 ± 0.02, 0.93 ± 0.01, 0.79 ± 0.01, 0.79 ± 0.02, and 0.75 ± 0.02, respectively. Temporally, mapping accuracy after 2000 was generally higher than that before (Table S6), probably due to the improvement in data quantity and quality of Landsat images in the later period. Besides, we estimated mapping accuracy of CACD at hexagon and province levels using the annual validation samples set. Spatially, except for parts of the western and southeastern coastal areas, the mean F1 score for most of the study area was above 0.8, with omission and commission errors less than 0.25 (Fig. 4a, b, and c). When it comes to provincial performance, the mean F1 score for the Northeast Plain, North China Plain, Jiangsu, Zhejiang, Jiangxi, and Yunan reached up to 0.8, whereas a lower value was found in inland provinces such as Inner Mongolia and Xinjiang (Fig. 4d). The relatively high omission error in Qinghai and Fujian (Fig. 4e) demonstrated an underestimation of cropland in these regions. In contrast, Guangdong had the highest commission error on average (Fig. 4f), indicating that croplands were somewhat overestimated in the province.
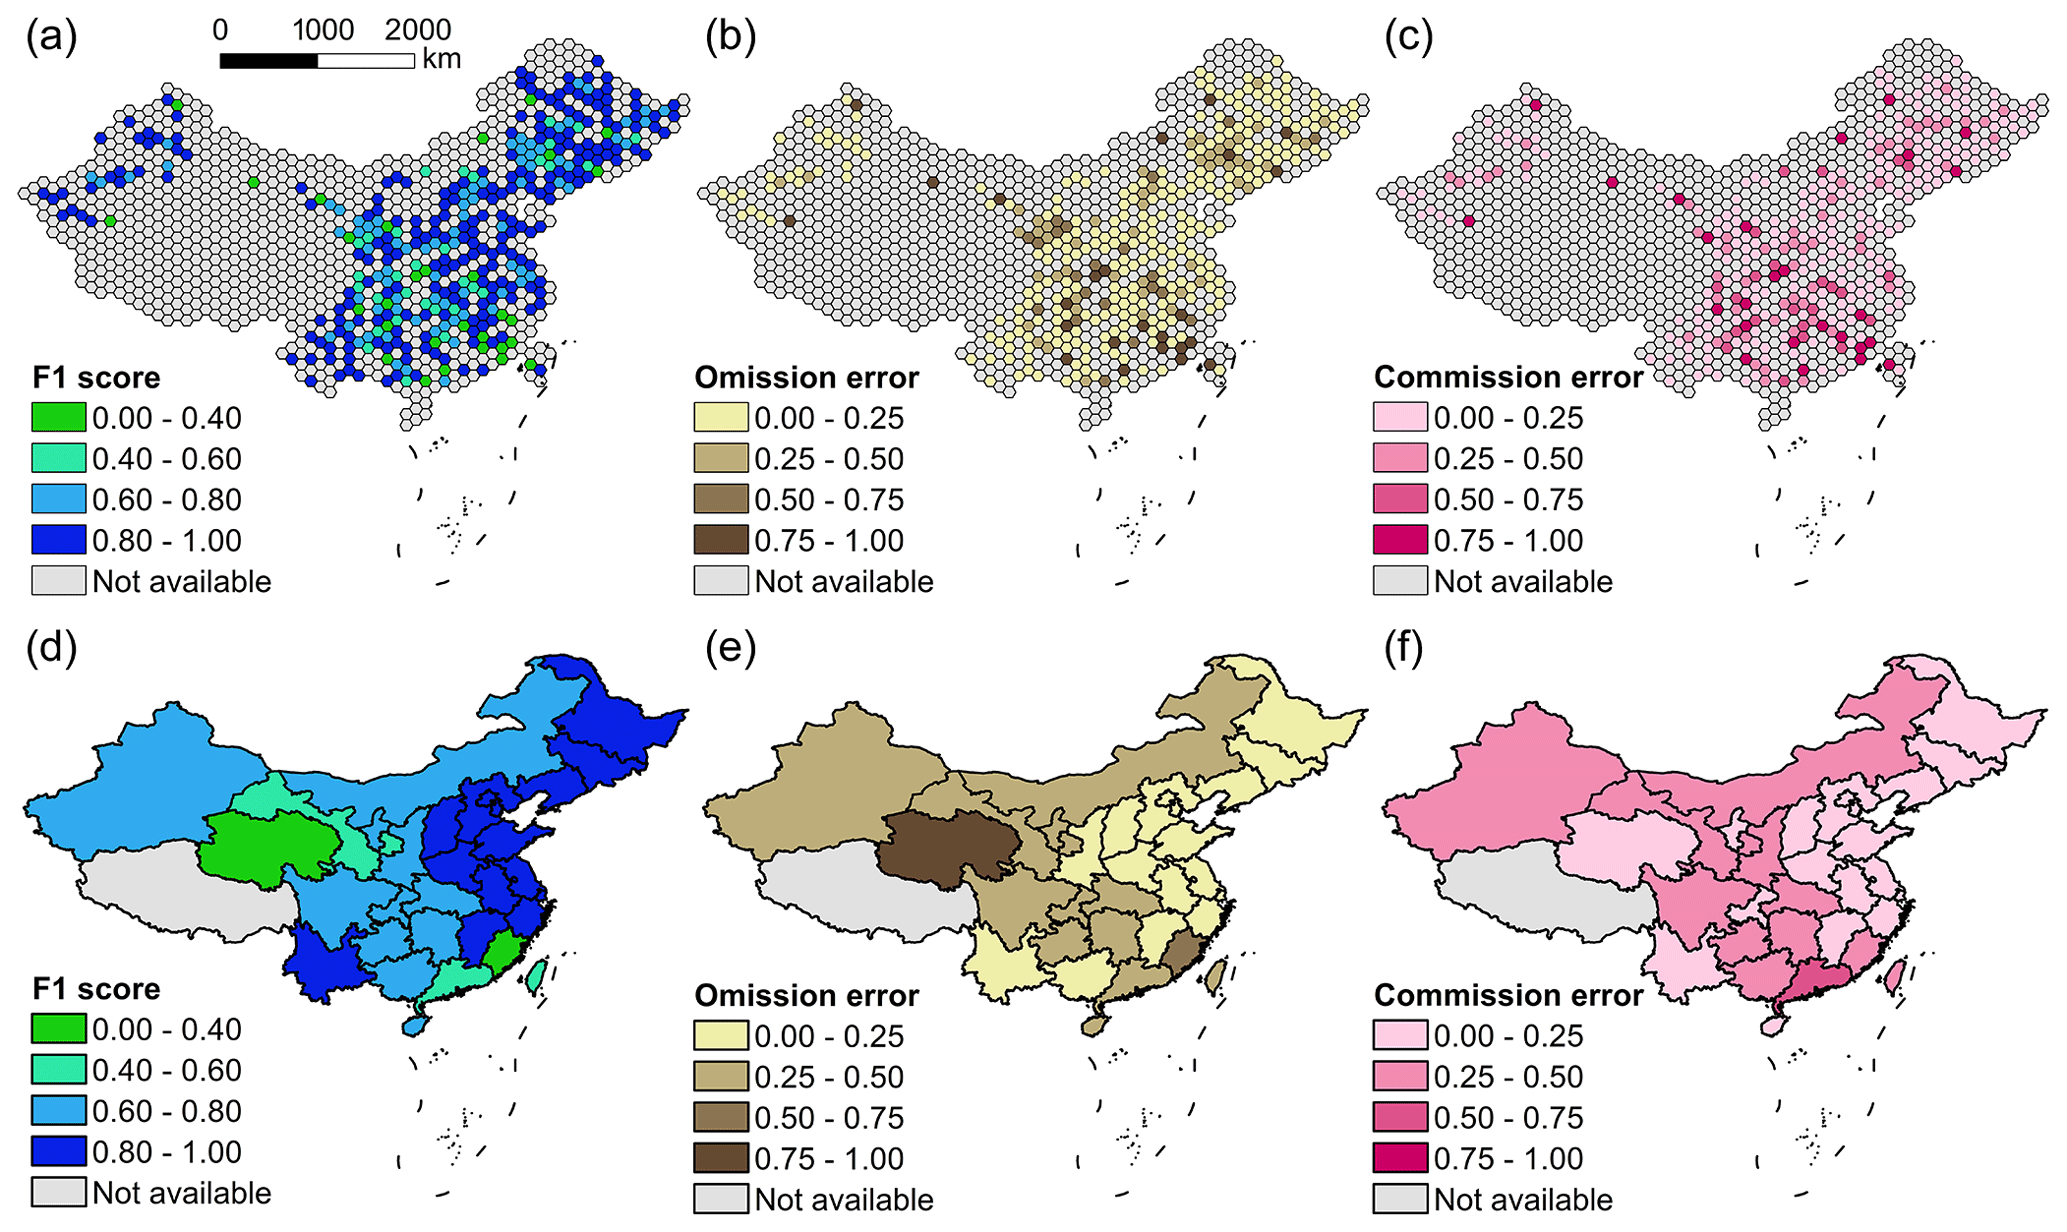
Figure 4Spatial variation of mean accuracy of CACD for 1986–2020. Omission error = 100 % – producer's accuracy. Commission error = 100 % – user's accuracy. (a–c) Hexagon level. Note that only hexagons containing both cropland and non-cropland samples were calculated. (d–f) Province level. Noted Xizang, Hong Kong, and Macau were excluded from the analysis due to small numbers of cropland samples.
In terms of change accuracy, we reclassified the annual validation sample set as changed if any cropland use conversion was identified between 1986 and 2021, and vice versa. Since the number of non-changed samples (98 %) was substantially greater than that of changed samples (2 %), we randomly subset 100 non-changed samples and combined them with changed samples for further evaluation. Results demonstrated that the F1 score, OA, and Kappa coefficient of CACD change maps could be as high as 0.81, 0.84, and 0.68 (Table 2). Accuracy for the year of change ranged between 0.76 and 0.87 as the tolerance years increased from 0 to ±5 years (Table S7).
Table 2Change accuracy of CACD based on the annual validation samples. Change is defined as any cropland use conversion identified between 1986 and 2021. UA: user's accuracy; PA: producer's accuracy.
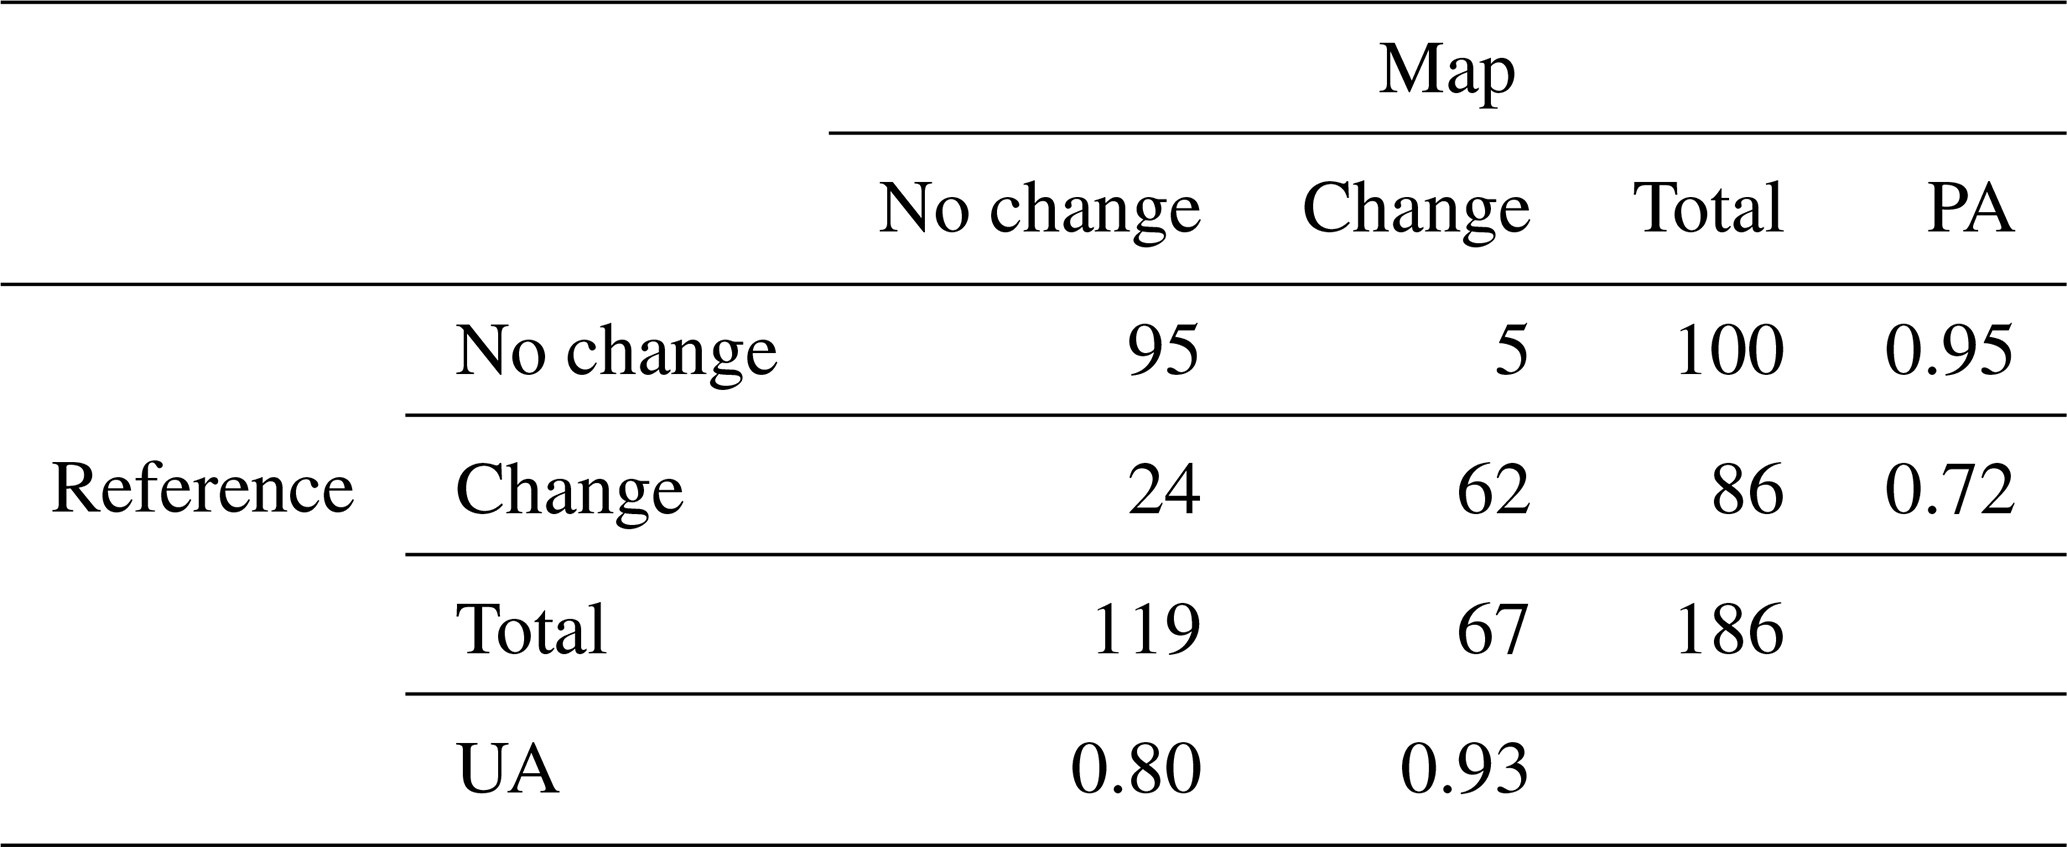
F1 score: 0.81; overall accuracy: 0.84; Kappa coefficient: 0.68.
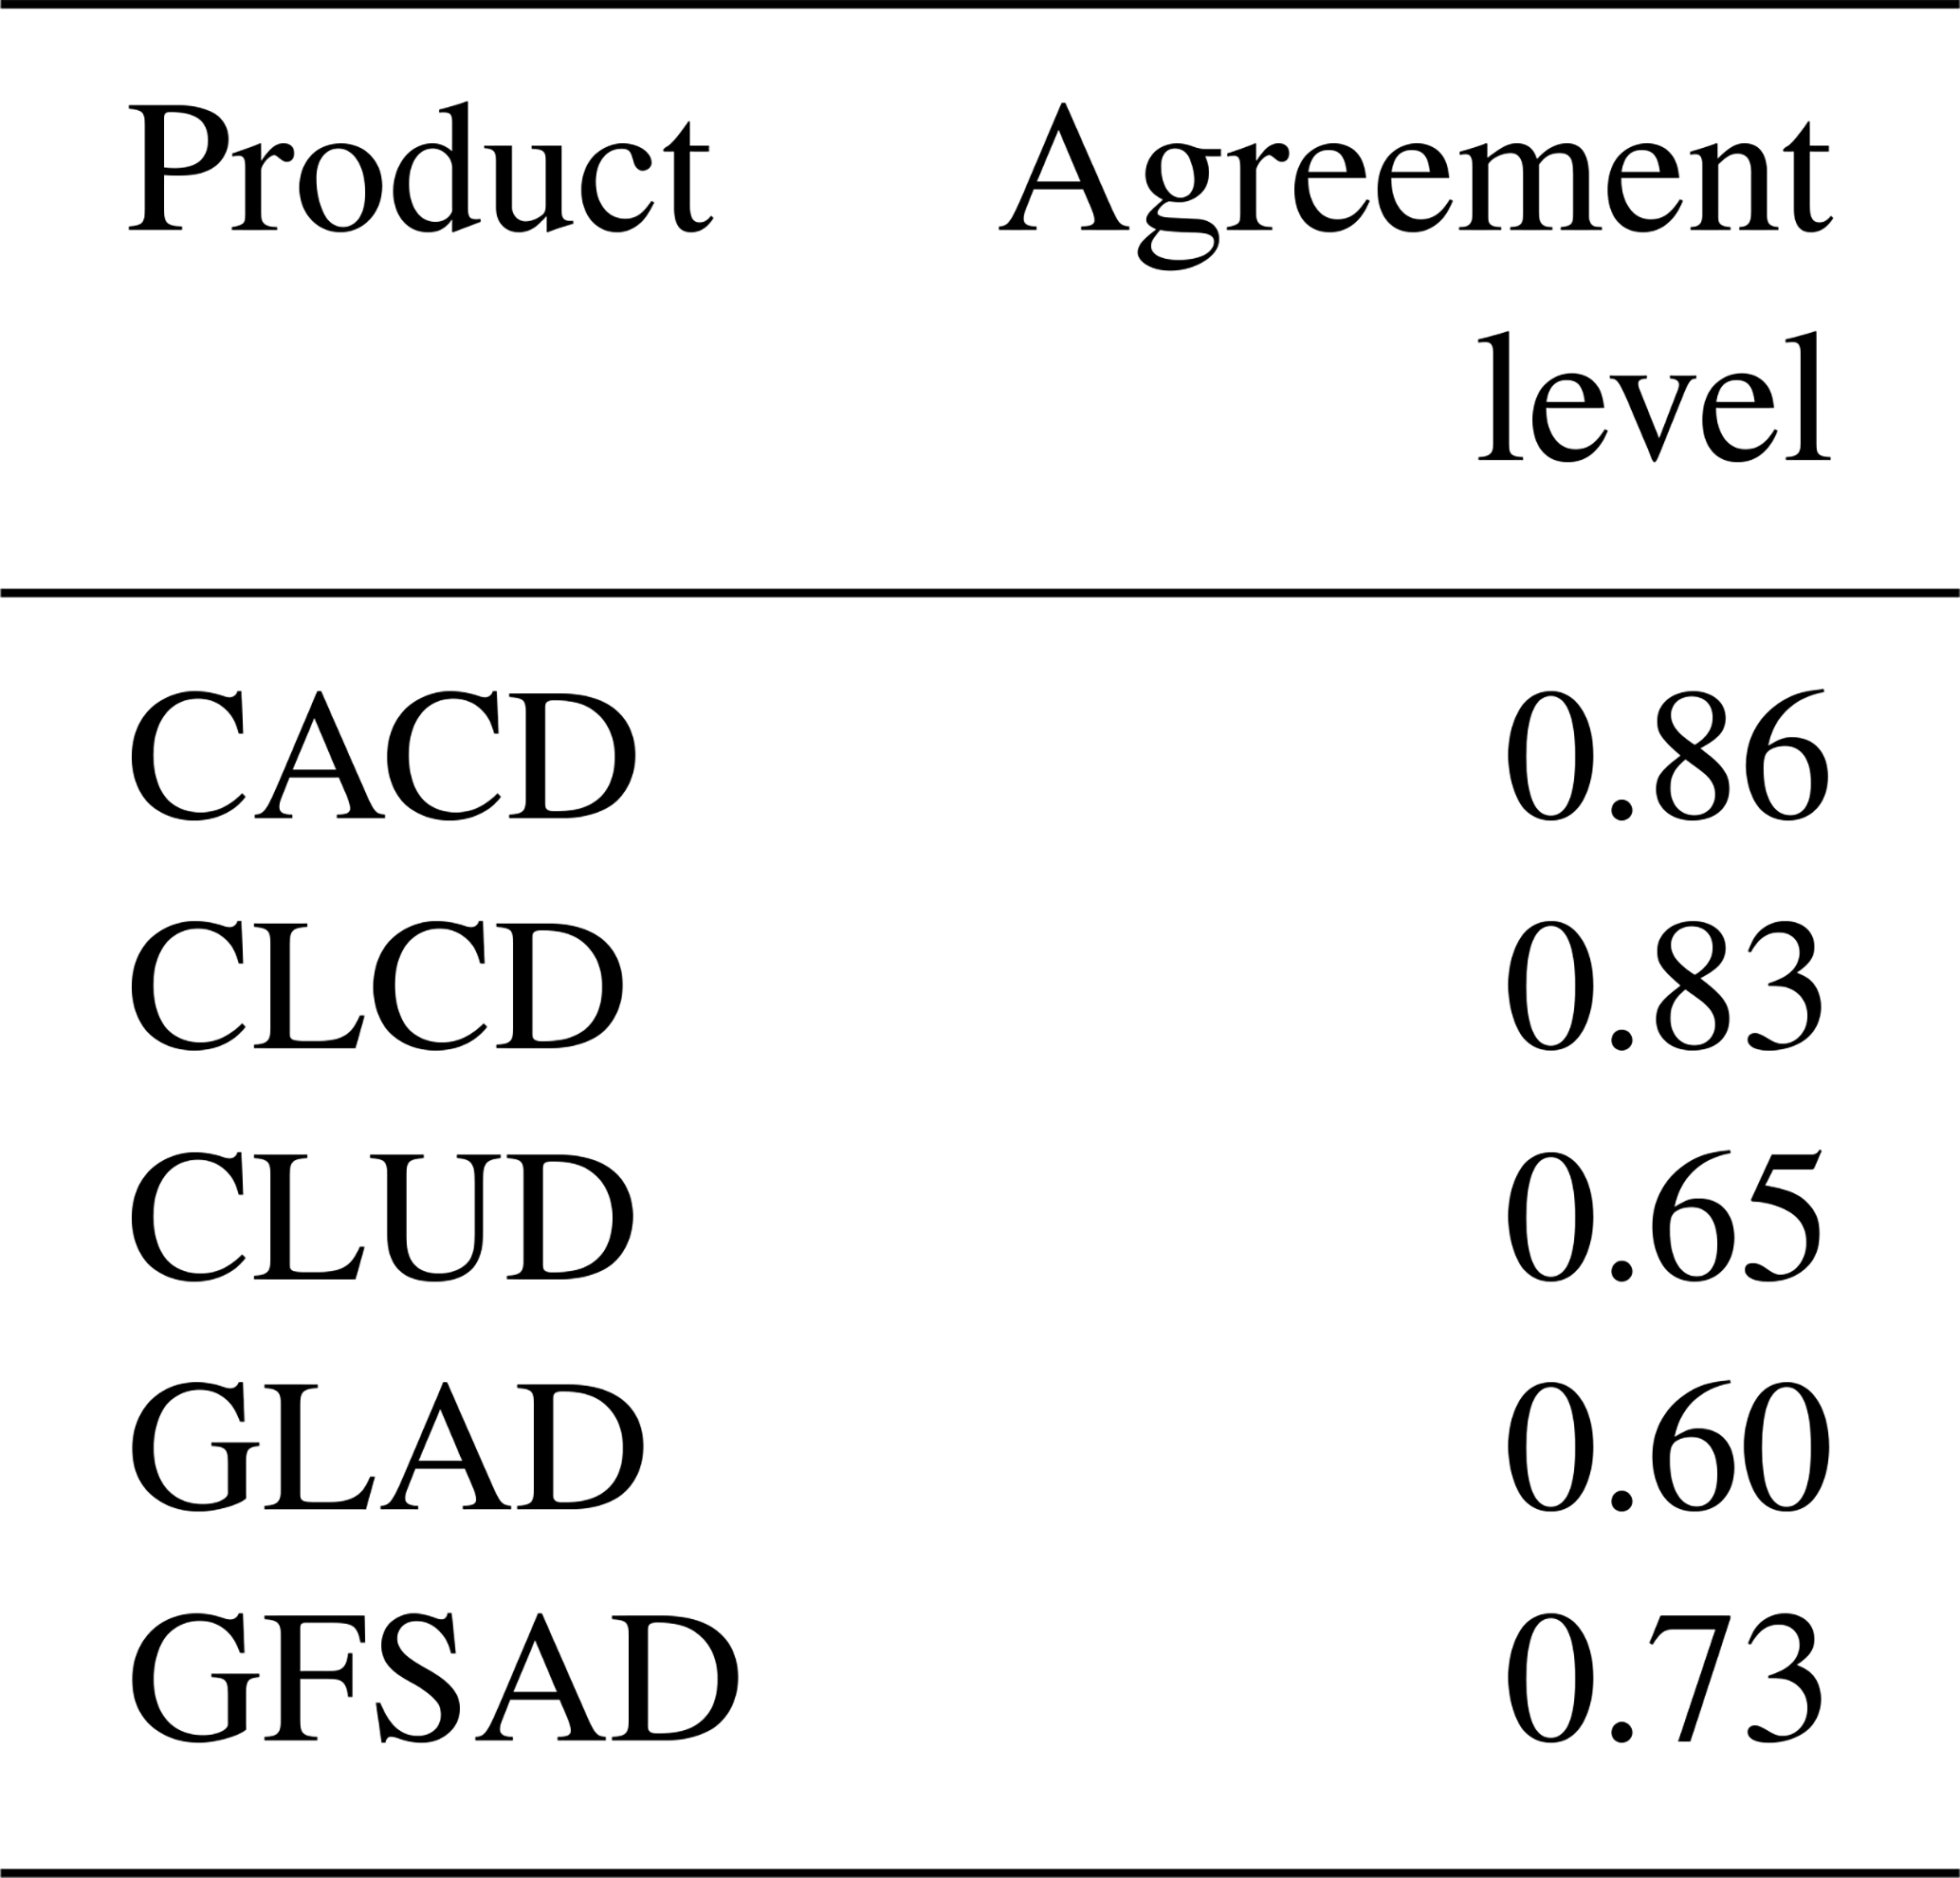
Furthermore, using two third-party sample sets, the F1 score of CACD in 2015 was verified as 0.82 based on the GLCVSS sample set (Table 3), while 86 % of the sample points in Geo-Wiki were correctly classified as cropland in CACD (Table 4). Evaluation results of third-party sample sets complemented the accuracy of CACD.
Table 3Comparison of mapping accuracy of CACD, CLUD, CLCD, GLAD, and GFSAD in 2015 based on GLCVSS. F1: F1 score; OA: overall accuracy; Kappa: Kappa coefficient; UA: user's accuracy; PA: producer's accuracy.
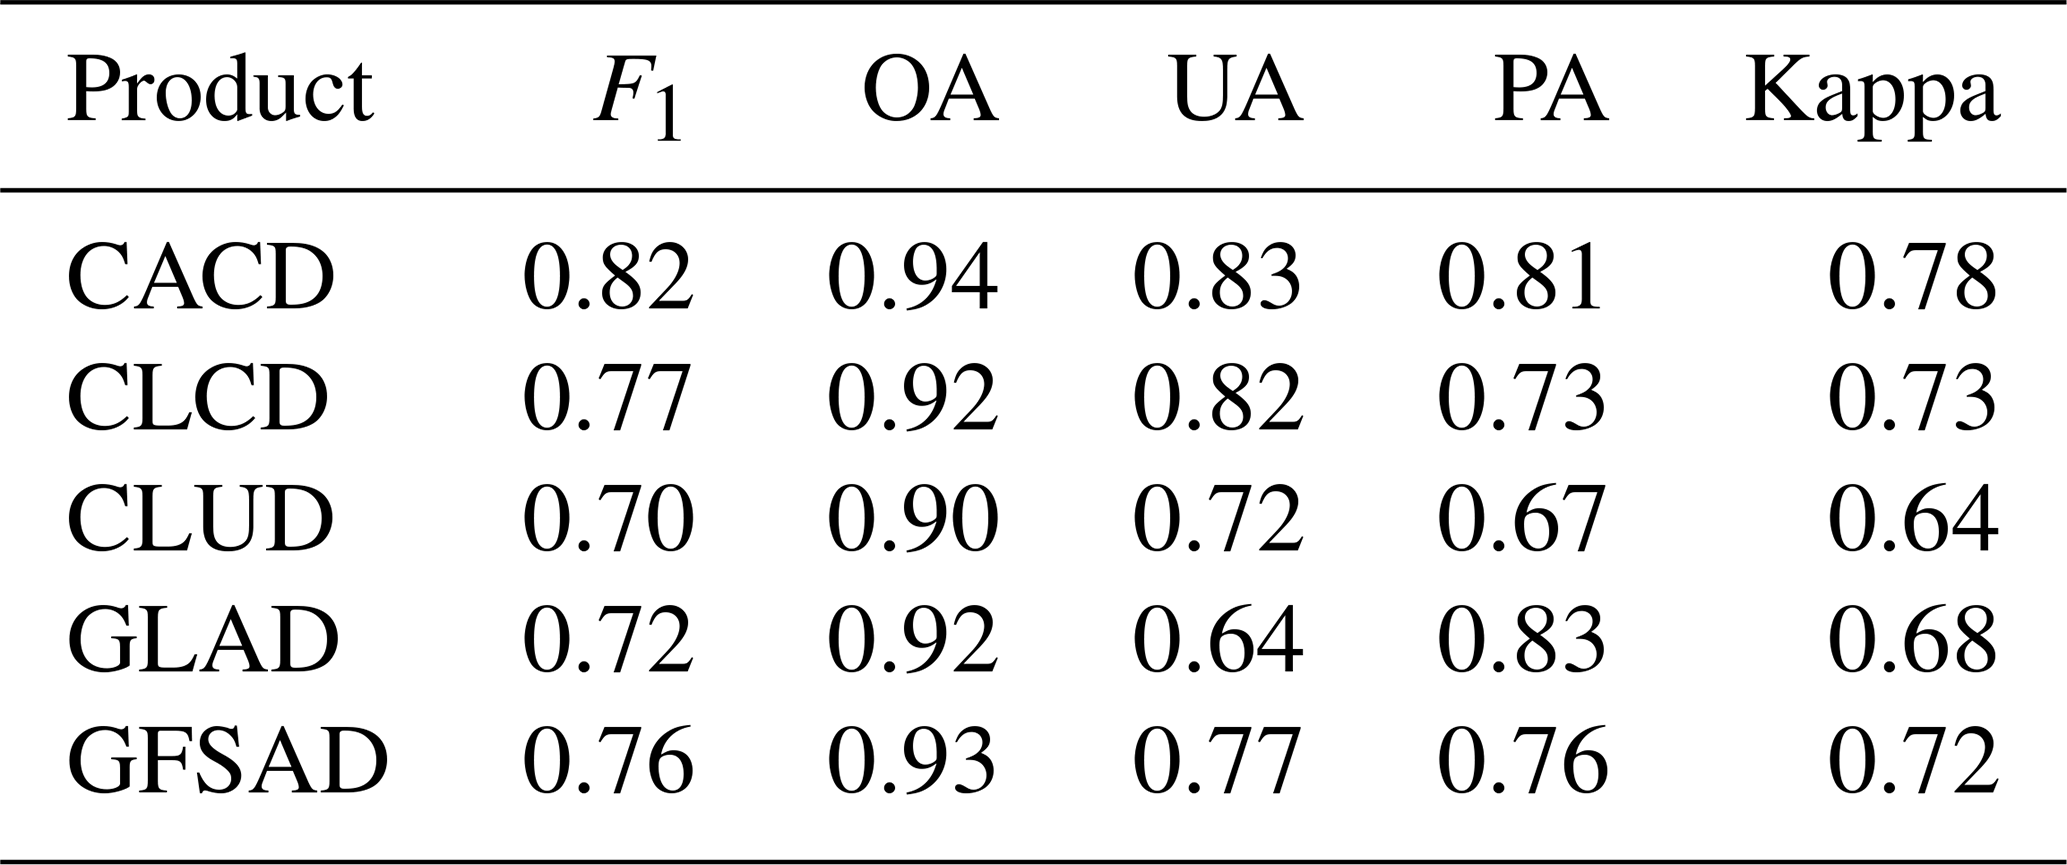
Table 4Comparison of agreement level of CACD, CLUD, CLCD, GLAD, and GFSAD with Geo-Wiki sample set. Noted CACD, CLUD, and CLCD in 2016 are used, while GLAD and GFSAD are from 2015.
3.2 Comparison with other products
We compared CACD with four existing land cover or cropland datasets (CLCD, CLUD, GLAD, and GFSAD) at 30 m spatial resolutions from multiple aspects. CACD was superior to other products in all comparison years in terms of mapping accuracy (Fig. 5). In 2015, for example, the F1 score of CACD was 0.85, followed by GFSAD (0.77), GLAD (0.76), CLCD (0.76), and CLUD (0.69). Similar results were observed in the accuracy assessment results of GLCVSS and Geo-Wiki sample sets (Tables 3 and 4). Spatially, the five products were consistent in delineating cropland distributions in major production areas including the Northeast Plain, North China Plain, Sichuan Basin, and Xinjiang (Fig. 6). However, differences occurred in the Loess Plateau, Yunan–Guinan Plateau, and the vast hilly regions along the southeast coast. Overall, according to the frequency of how often pixels were identified as cropland, 65.62 % of the study area was labeled as croplands at least three times out of the five products (matched level > = 3; Fig. 6).
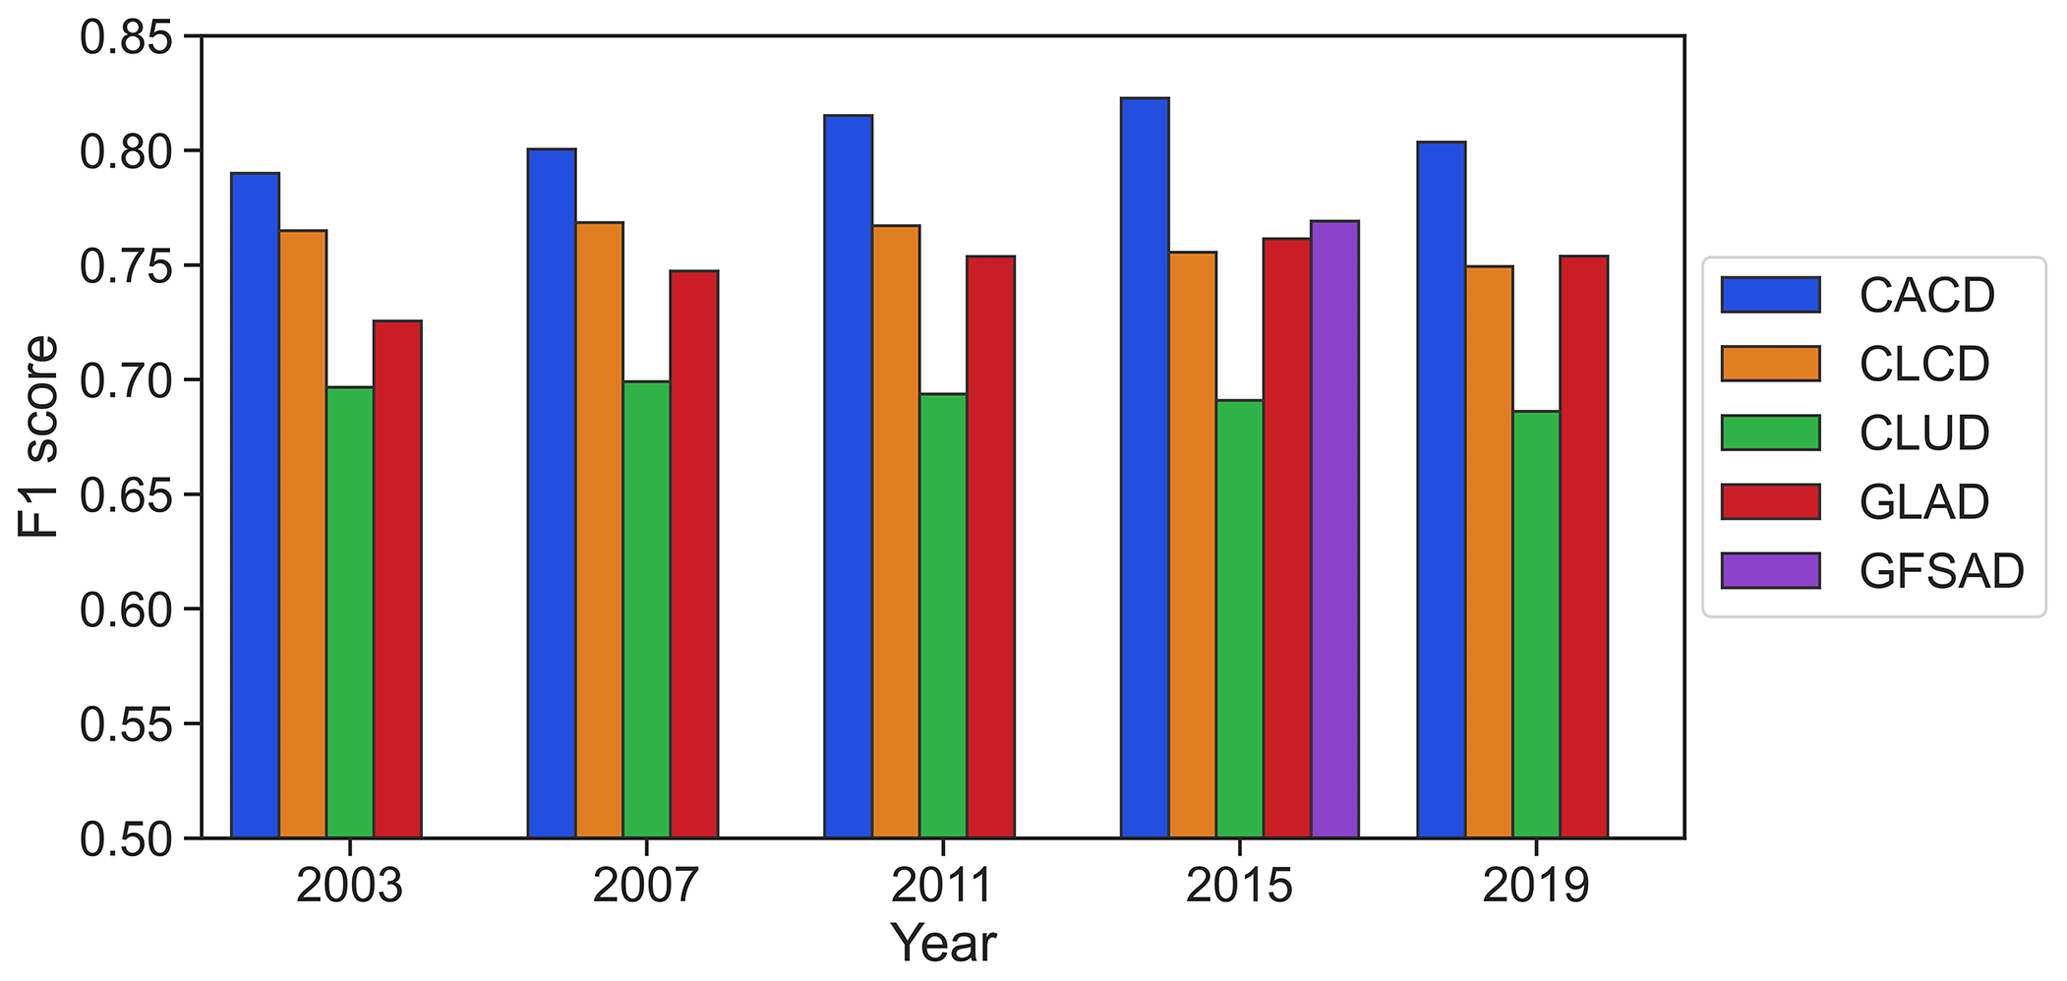
Figure 5Comparisons of the pixel-wise accuracy of F1 score between the five products based on the annual validation samples.
Figure 7 compares spatial details of cropland distribution of the five products in six selected regions. In the Northeast Plain (region A), CACD, GLAD, and GFSAD depicted the extent of cropland well, while CLCD slightly overestimated and CLUD severely underestimated croplands. In Xinjiang and the North China Plain (regions B and C), high spatial consistency was observed between the five products, with CACD and GLAD displaying more details (like the road network). Classification differences mainly appeared in the southern hilly areas (regions D–F). In general, CACD, CLCD, and CLUD were more consistent and closer to the actual cropland distribution. For instance, region D was a terracing land in Sichuan Province, southwestern China. The region was mainly used for rice cultivation, yet those croplands were massively underestimated in GLAD and GFSAD. Further illustrations of the multi-year cropland distributions among different products can be found in Figs. S12–S16.
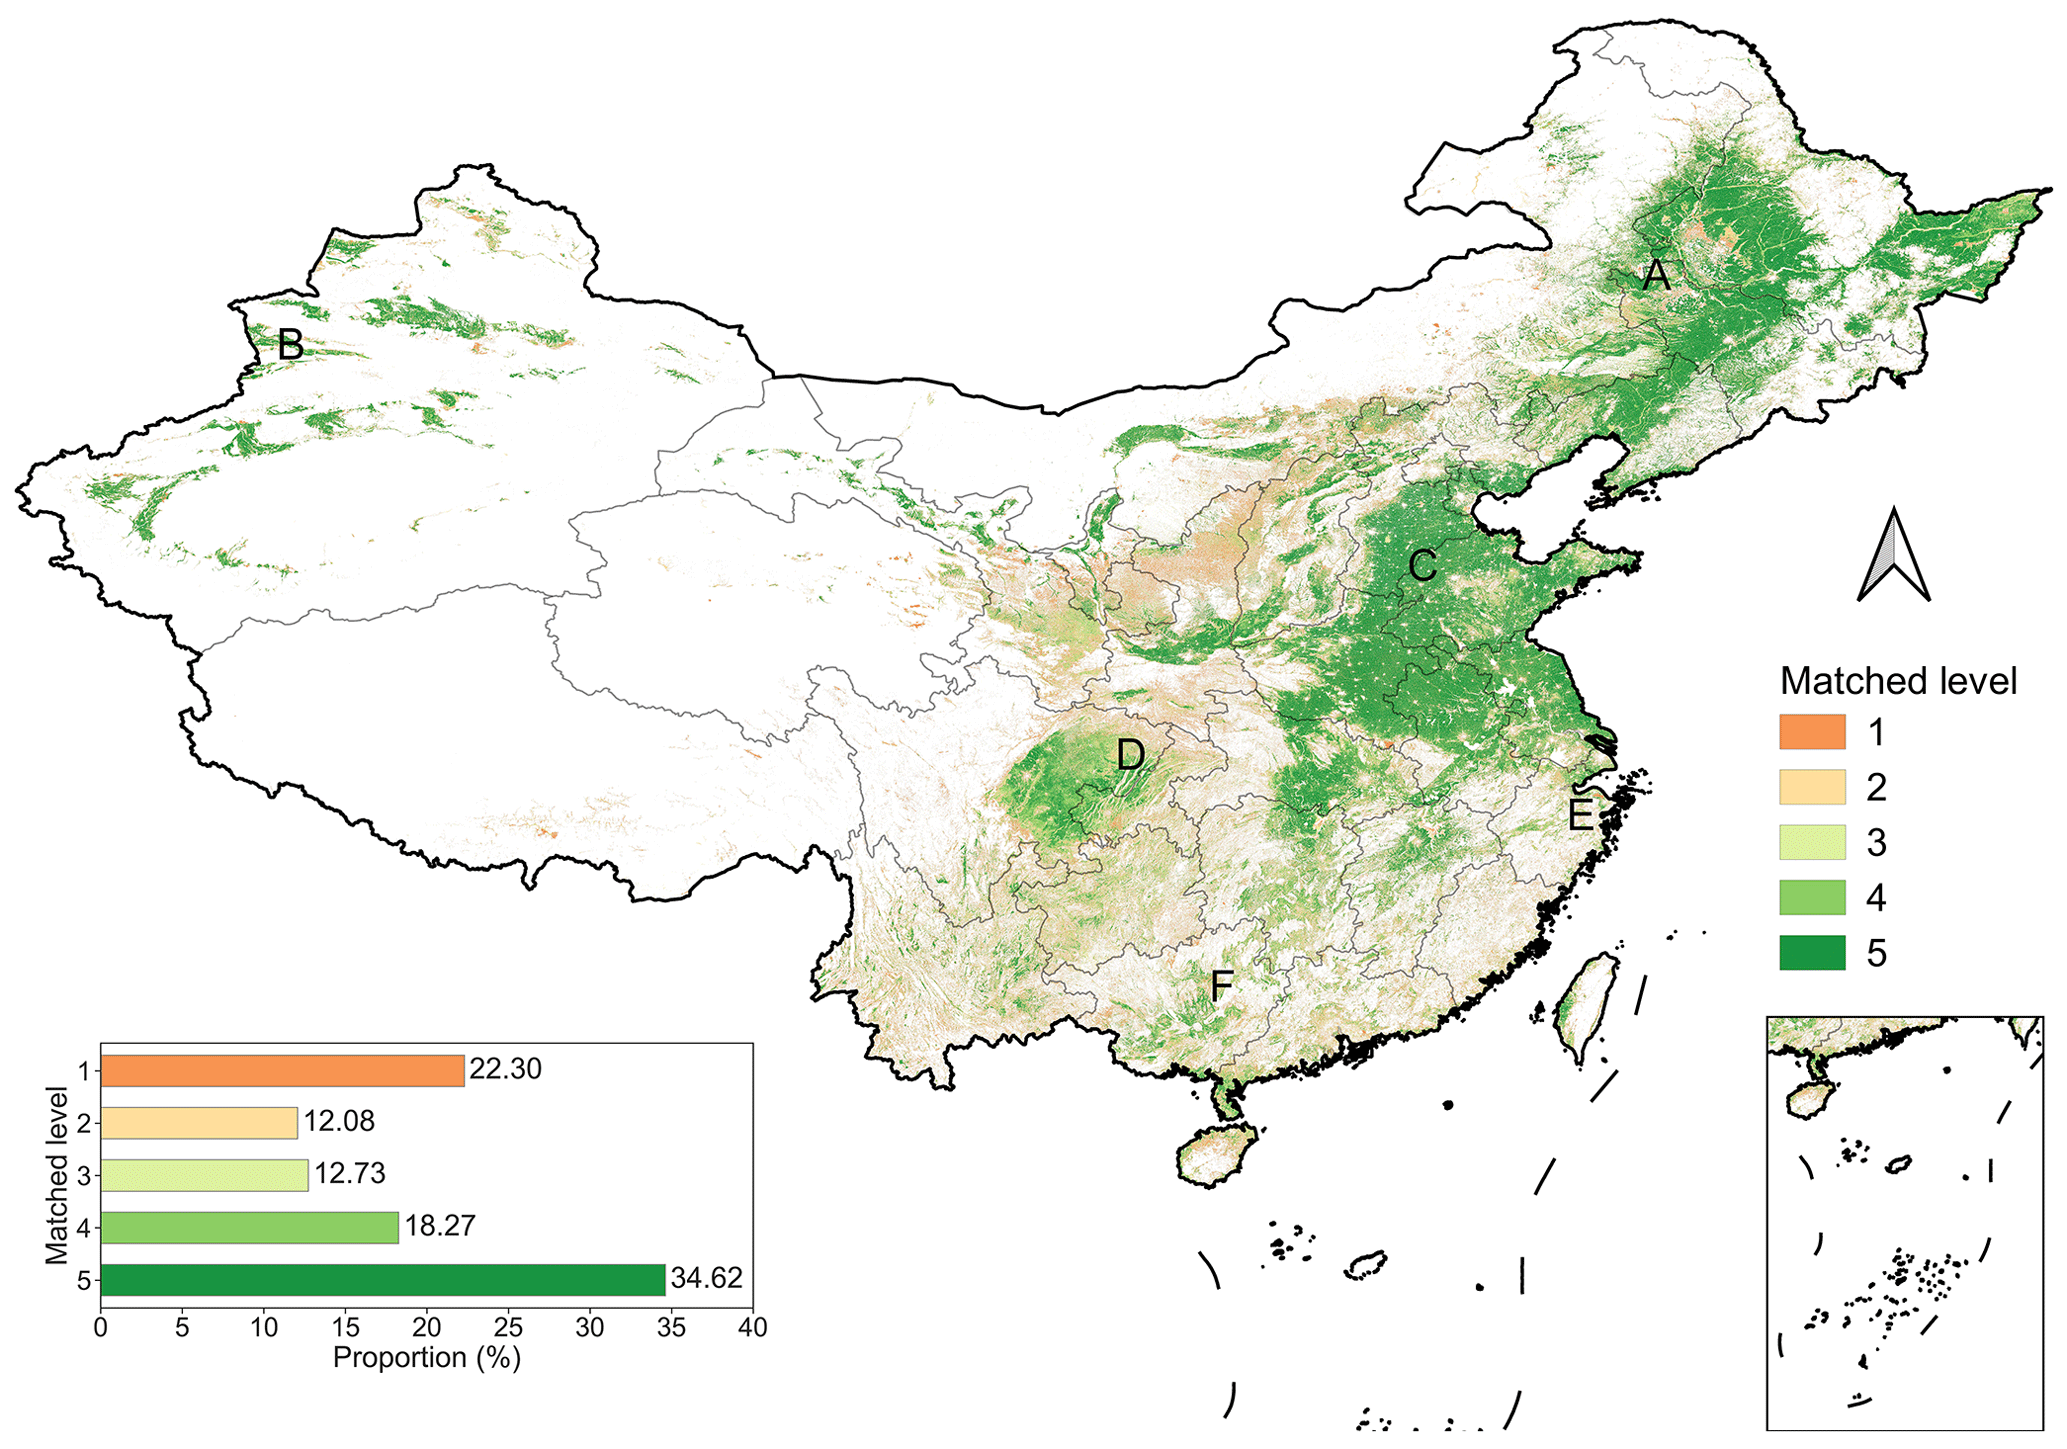
Figure 6Spatial agreement of cropland extent of the five products (CACD, CLCD, CLUD, GLAD, and GFSAD) in 2015. Matched level indicates how often a pixel is identified as cropland. For example, “4” means four out of the five products recognize it as cropland. The bar chart in the lower-left corner denotes the area proportion of different matched levels (1–5). Locations A–F respectively correspond to zoomed areas in Fig. 7.
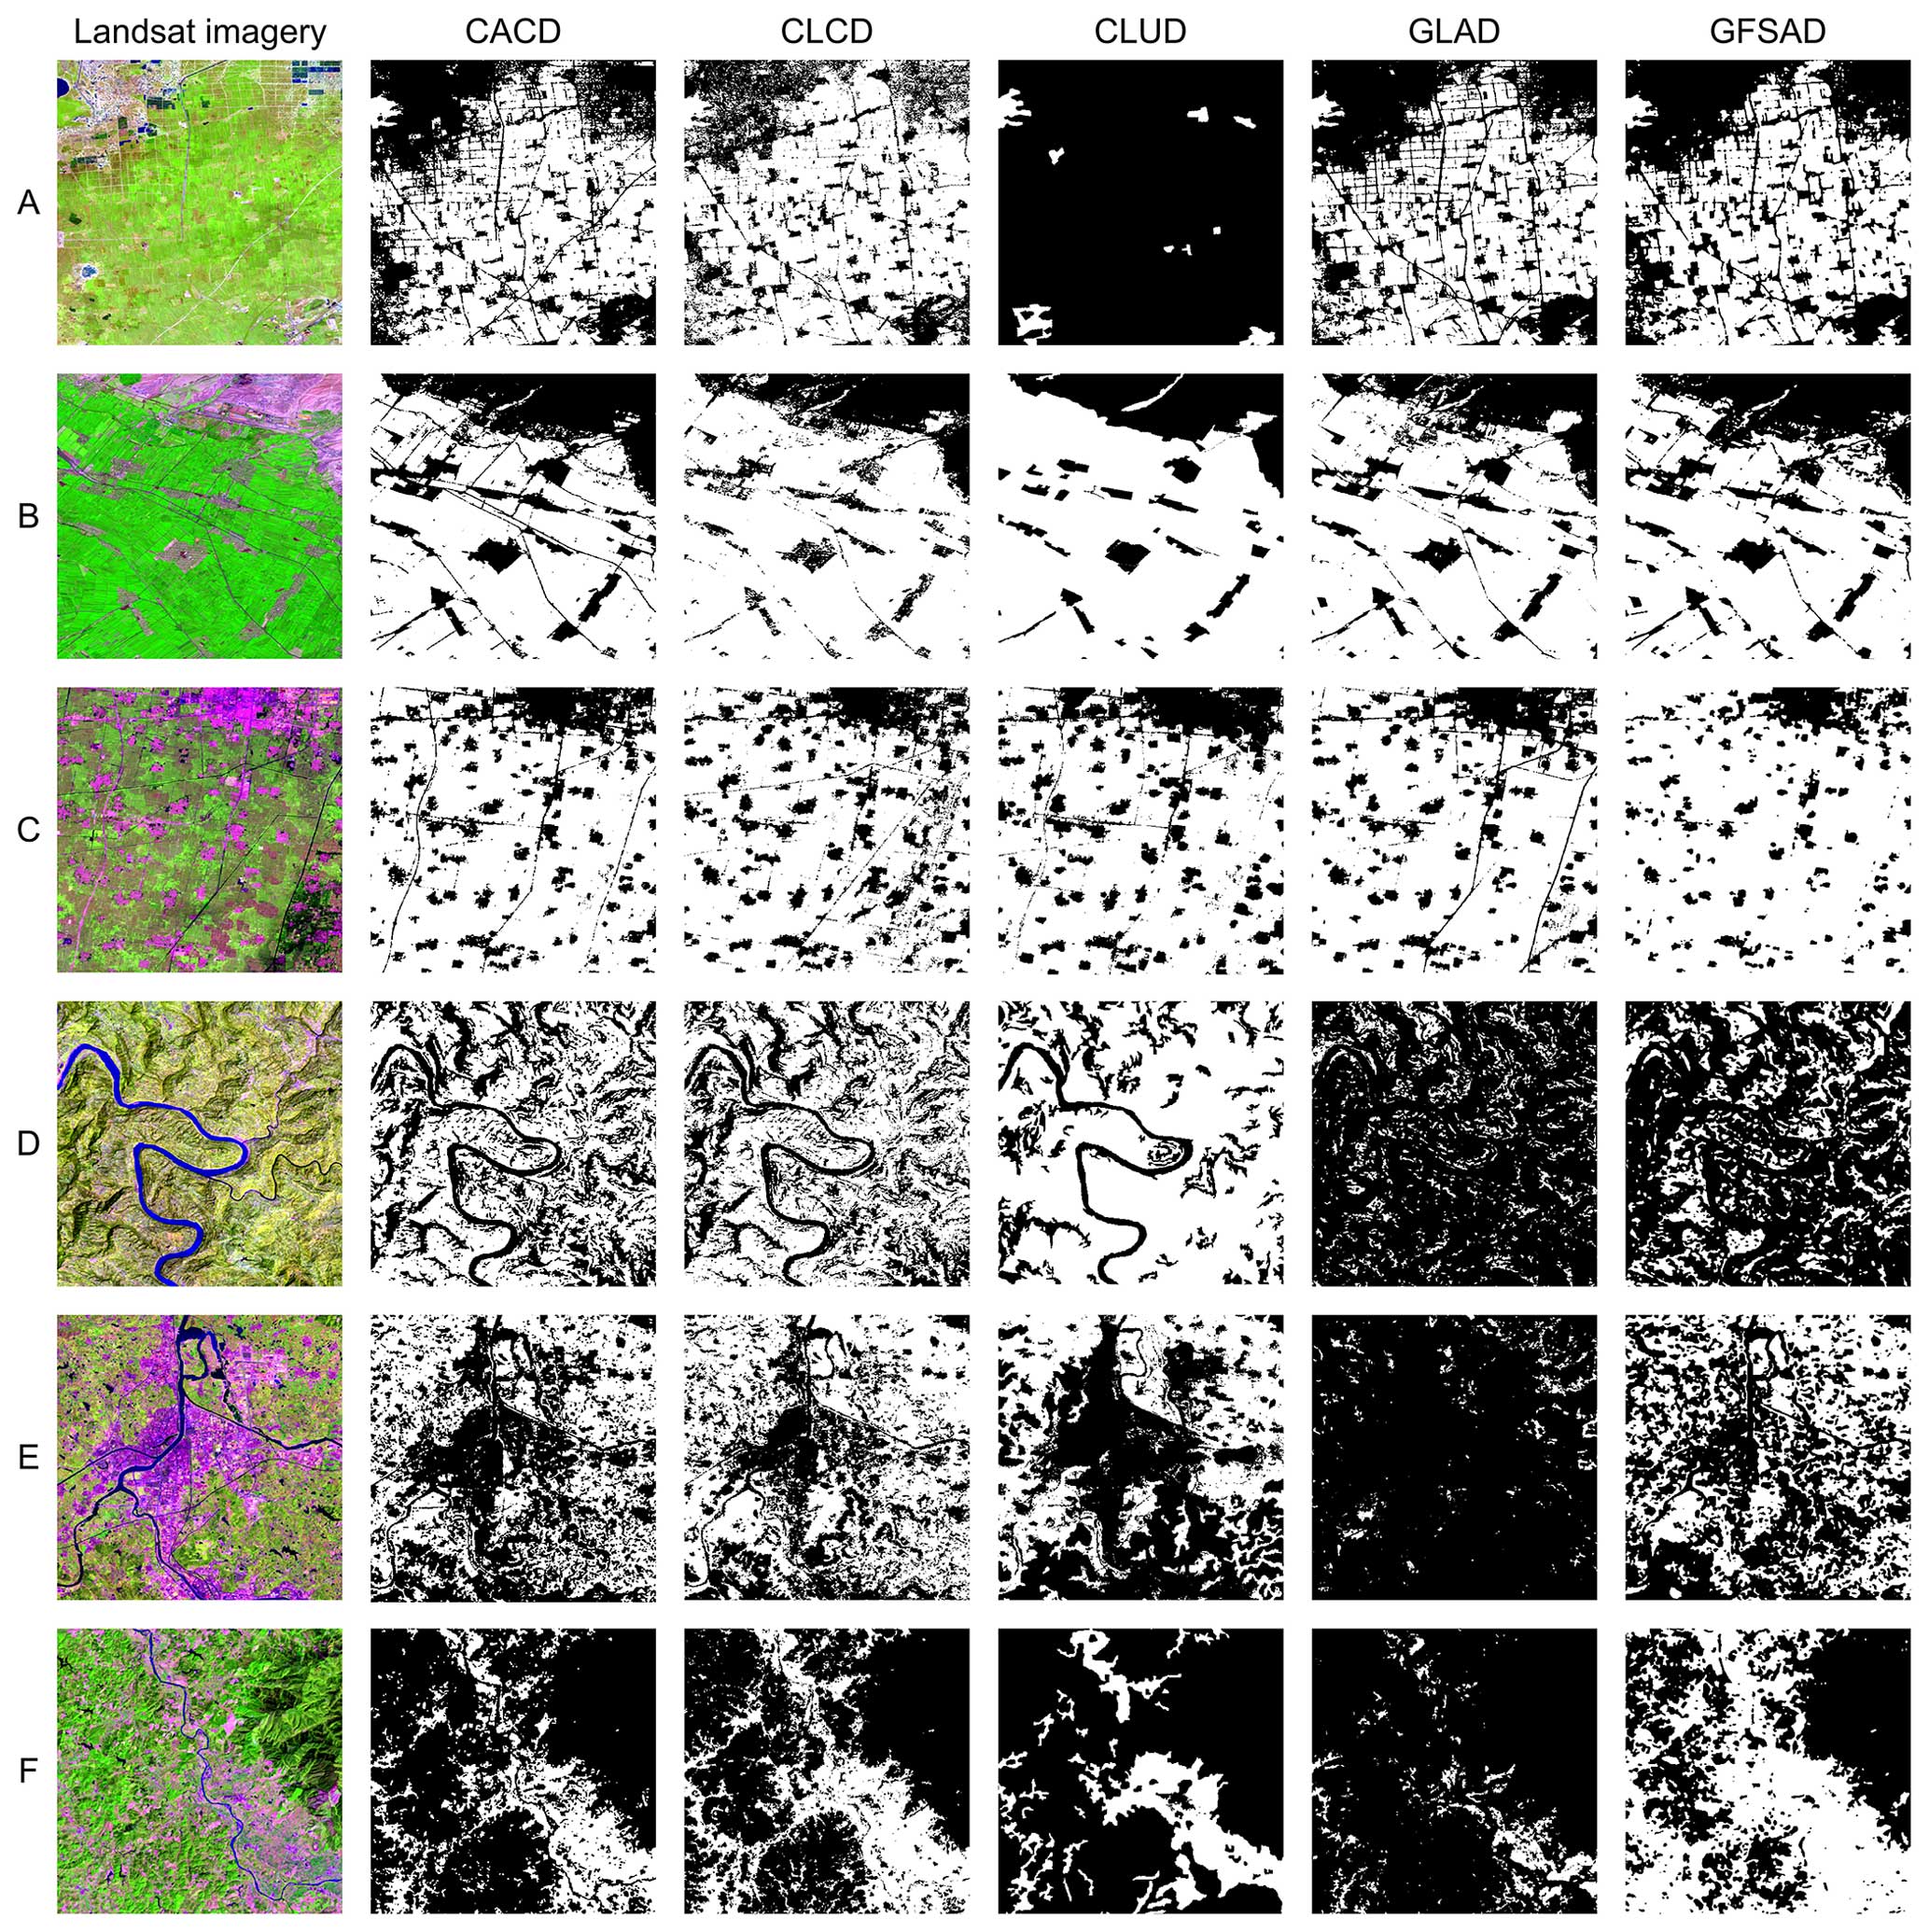
Figure 7Regional comparisons of the five products in 2015. Referencing Landsat imagery in the first column is composited by SWIR-1, near-infrared, and red bands in RGB channels. Columns two to six display the spatial distribution of the five products, with cropland shown in white and non-cropland shown in black. All maps have a scale of 1:100 000. Locations of A–F are shown in Fig. 6.
Using the five products, we counted cropland area at the provincial scale separately and compared it with statistical data in 2015. As shown in Fig. 8, CACD showed the best agreement with statistics (R2=0.93), followed by CLUD (R2=0.91), CLCD (R2=0.89), GFSAD (R2=0.87), and GLAD (R2=0.74). The scattered points between CLCD and statistics were basically above the 1:1 diagonal, indicating an overestimation of cropland area. On the contrary, GLAD had an underestimated cropland area as more scattered points were located below the 1:1 diagonal. This was mainly caused by GLAD's misclassification in southern China. Taking together, the comparison results between different products demonstrated the accuracy of our annual cropland datasets.
4.1 Cropland dynamics in China
Based on the produced CACD, we calculated provincial net changes in cropland area between 1986 and 2021, and we plotted annual cropland area dynamics at the national scale. We also employed the annual validation samples to an error-adjusted stratified estimation approach following Olofsson et al. (2014) to estimate sample-based cropland area and its 95 % confidence interval. Overall, China's total cropland area grew from 1 694 900 ± 193 700 km2 in 1986 to 1 725 200 ± 212 400 km2 in 2021, a net increase of 30 300 km2 (1.79 %). Temporally, it underwent an escalation before 2002 but gradually declined until 2015, after which a recovery phase occurred (Fig. 9b). Spatially, cropland gain mainly occurred in northern and western China, including Xinjiang, Inner Mongolia, and Heilongjiang (Fig. 9a). In Xinjiang, for example, 44 635 km2 of the land area (∼ 3 %) has been developed as cropland during the past 36 years, a figure that is equivalent to 1.3 times the area of Hainan Province. In contrast, most provinces in eastern, central, and southern China have experienced massive cropland loss (Fig. 9a). The top five provinces with the largest area of cropland loss are Sichuan (12 739 km2), Jiangsu (10 865 km2), Shaanxi (10 700 km2), Hebei (8566 km2), and Shandong (8407 km2). In the capital city of Beijing, more than 2000 km2 croplands were occupied during the study period, accounting for 12 % of the city's total area. Moreover, cropland areas in some inland provinces (such as Guizhou) were observed to remain relatively stable (Fig. 9a). These findings on spatial–temporal dynamics of croplands in China are generally consistent with those reported in previous empirical studies (J. Liu et al., 2014; Gao et al., 2019).

Figure 8Scatterplots of the provincial cropland area in 2015 between the five products and the statistical data. The dashed red line represents the 1:1 diagonal.
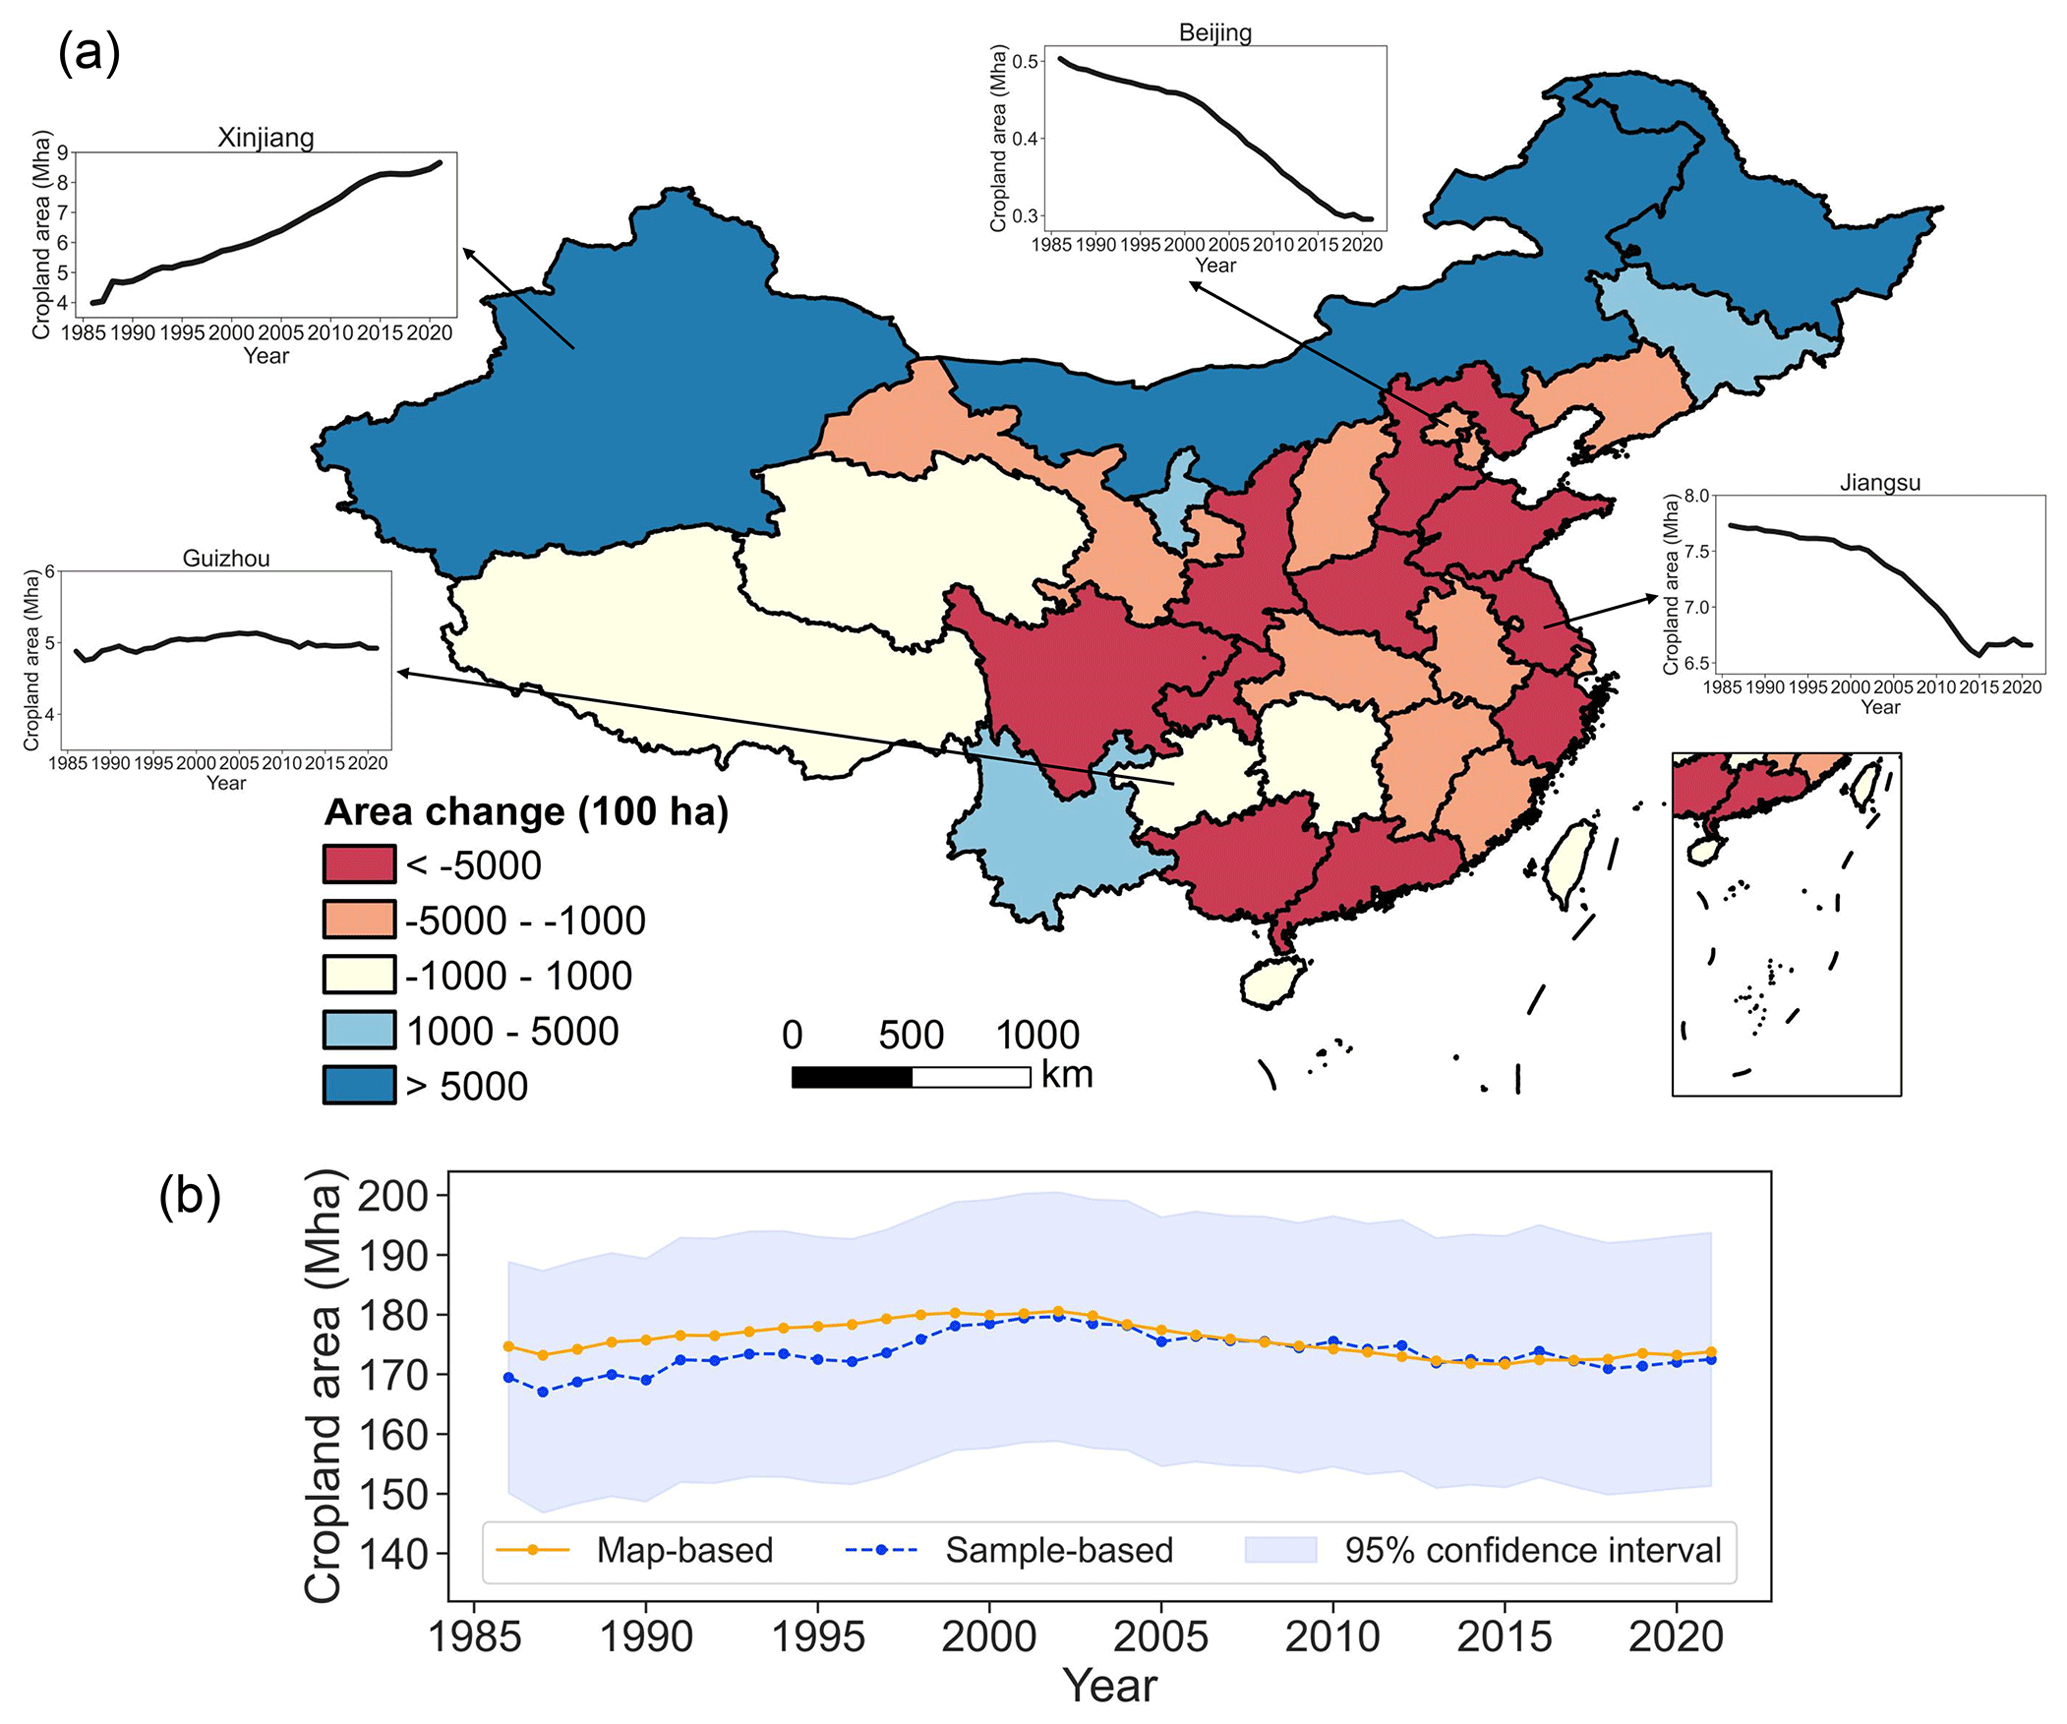
Figure 9Cropland area changes in China between 1986 and 2021. (a) Provincial cropland change area derived from the CACD data. (b) Annual dynamics of the map-based and the sample-based cropland area at the national scale.
Rapid urbanization in China since the 1980s has caused significant losses of cropland, particularly in large cities and the eastern coastal region (Qiu et al., 2020; Tu et al., 2021, 2023b). In response to the increasing demand for food, the Chinese government has implemented a series of farmland protection policies, including the Requisition–Compensation Balance of Farmland (RCBF) policy, which mandates that any lost cropland must be offset by the expansion of cropland elsewhere (Liang et al., 2015; Y. Liu et al., 2014). Despite these efforts, croplands in China have undergone dramatic and unbalanced changes over the past few decades. While the net change in cropland area has been relatively small, the spatial–temporal variance is noteworthy (Gao et al., 2019; J. Liu et al., 2014; Yu et al., 2018). Figure 10 shows four typical types of cropland dynamics change in China with CACD. In the Ar Horqin Banner of Chifeng city, Inner Mongolia, large-scale croplands have been developed for the reclamation and cultivation of crops during the past decades (Fig. 10a). Similarly, as shown in Fig. 10b, vast agricultural land parcels have sprung up in Aksu, Xinjiang, for cotton cultivation (Li et al., 2021; Liu, 2022). In Shanghai, China's most significant metropolitan, remarkable socioeconomic development since the reform and opening up in the 1980s has led to extensive urban sprawl, encroaching on substantial areas of pre-existing croplands (Fig. 10c). In the mountainous area of Tongren, Guizhou, some croplands have been abandoned in recent years as a result of urban–rural migration and declining marginal benefits of arable land (Fig. 10d). In summary, these specific examples have demonstrated that CACD is capable of capturing fine-resolution cropland dynamics across different landscapes.
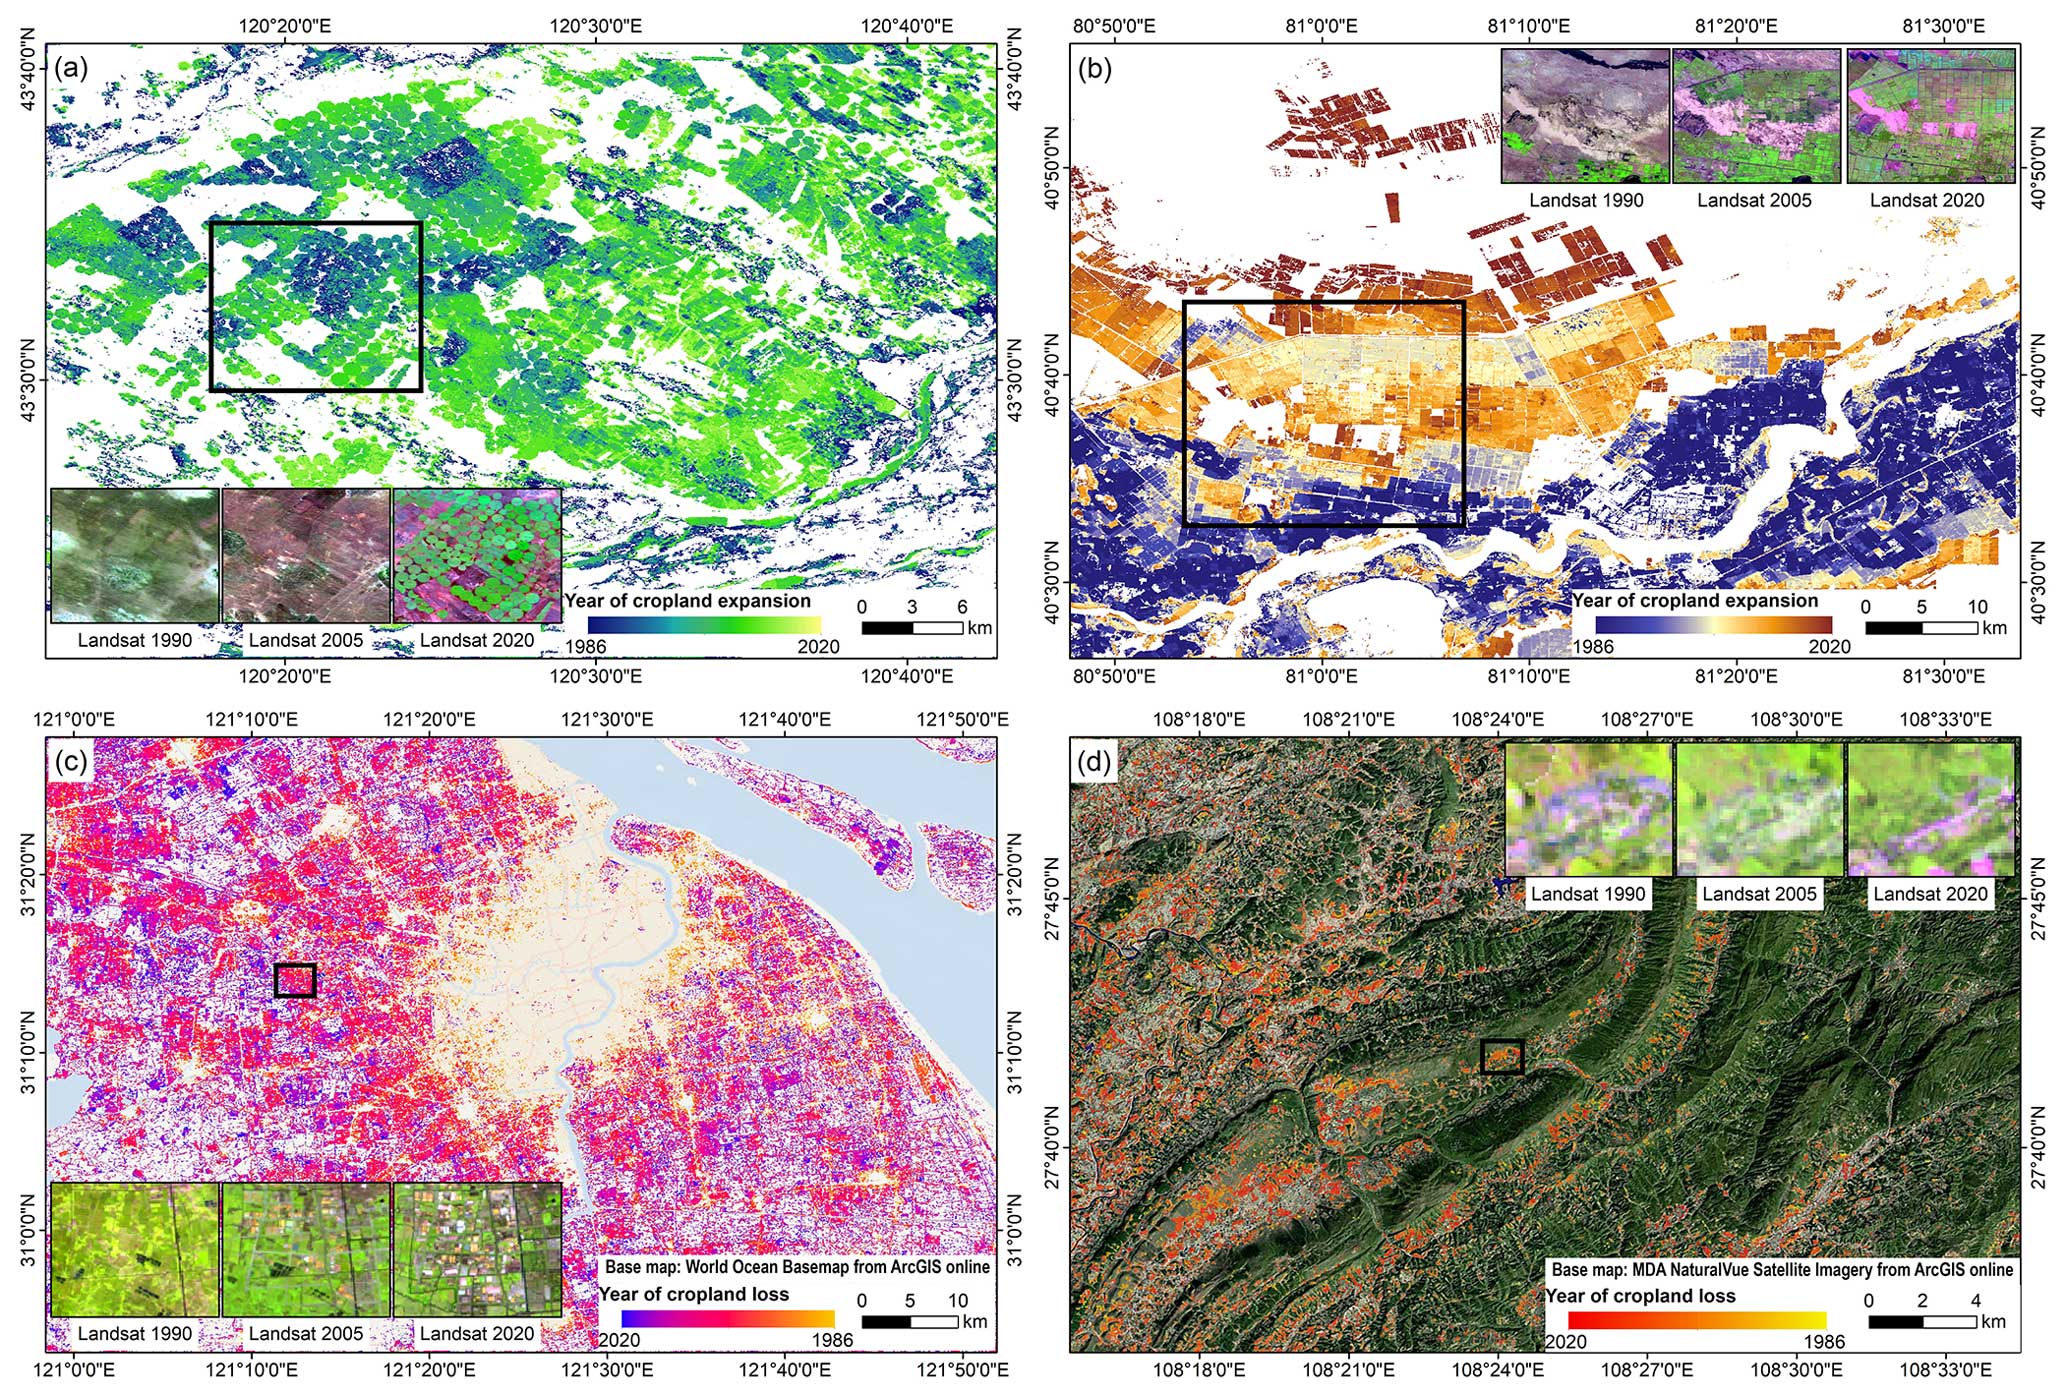
Figure 10Examples of cropland expansion and loss between 1986 and 2021 in four selected regions in China: (a) Chifeng, Inner Mongolia, where large-scale cropland expansion occurred after 2006 for pasture cultivation; (b) Aksu, Xinjiang, which was mainly dominated by cotton cultivation; (c) Shanghai, where rapid urbanization induced extensive cropland loss; and (d) Tongren, Guizhou, where some croplands in the mountainous area had been abandoned due to soil infertile and rural out-migration. All the Landsat images are freely provided by USGS. Both base maps in (c) and (d) are open-source web maps provided by Esri.
Cropland abandonment is a widespread and rapidly increasing phenomenon worldwide (Queiroz et al., 2014) as a result of land marginalization caused by unsatisfactory land suitability and reduced economic viability (MacDonald et al., 2000). It has wide-ranging effects on the environment and social economy, such as biodiversity conservation (Isbell et al., 2019), carbon storage (Vuichard et al., 2008), and land economics (Ito et al., 2016). However, knowledge of the extent and timing of cropland abandonment in China is lacking. According to FAO, cropland abandonment refers to land that has not been cultivated for at least 5 consecutive years (FAO, 2016). Following this definition, we identified a pixel of CACD as abandoned if it was classified as cropland in the initial year but changed to non-cropland for the following 5 years. Also, we were conservative and included only those croplands as abandoned that converted to natural cover, not those to built-up lands. To do so, we masked out cropland conversions to impervious areas based on the GAIA data. When abandonment occurred, we labeled its timing as the first year in which cropland was no longer active (starting from 1990 to 2015).
Our results revealed that 419 342 km2 (17.57 %) of the croplands in China have been abandoned at least once during the past decades. Most abandoned croplands have been distributed in the central and the western regions (from 100 to 125° E and from 20 to 50° N; Fig. 11a), particularly in Inner Mongolia, Gansu, Shaanxi, and Yunan provinces (Fig. S17). This spatial pattern is consistent with that of Li et al. (2018), who estimated the extent of cropland abandonment in China's mountainous regions using multiple regression models. The average altitude of abandoned cropland is 860 m, 81 % of which is in regions below 1500 m (Fig. 11b). Temporally, the annual cropland abandonment area in China showed an upward trend from 1990 to 2015, i.e., it increased from 7516 to 14 823 km2 (Fig. 11c).
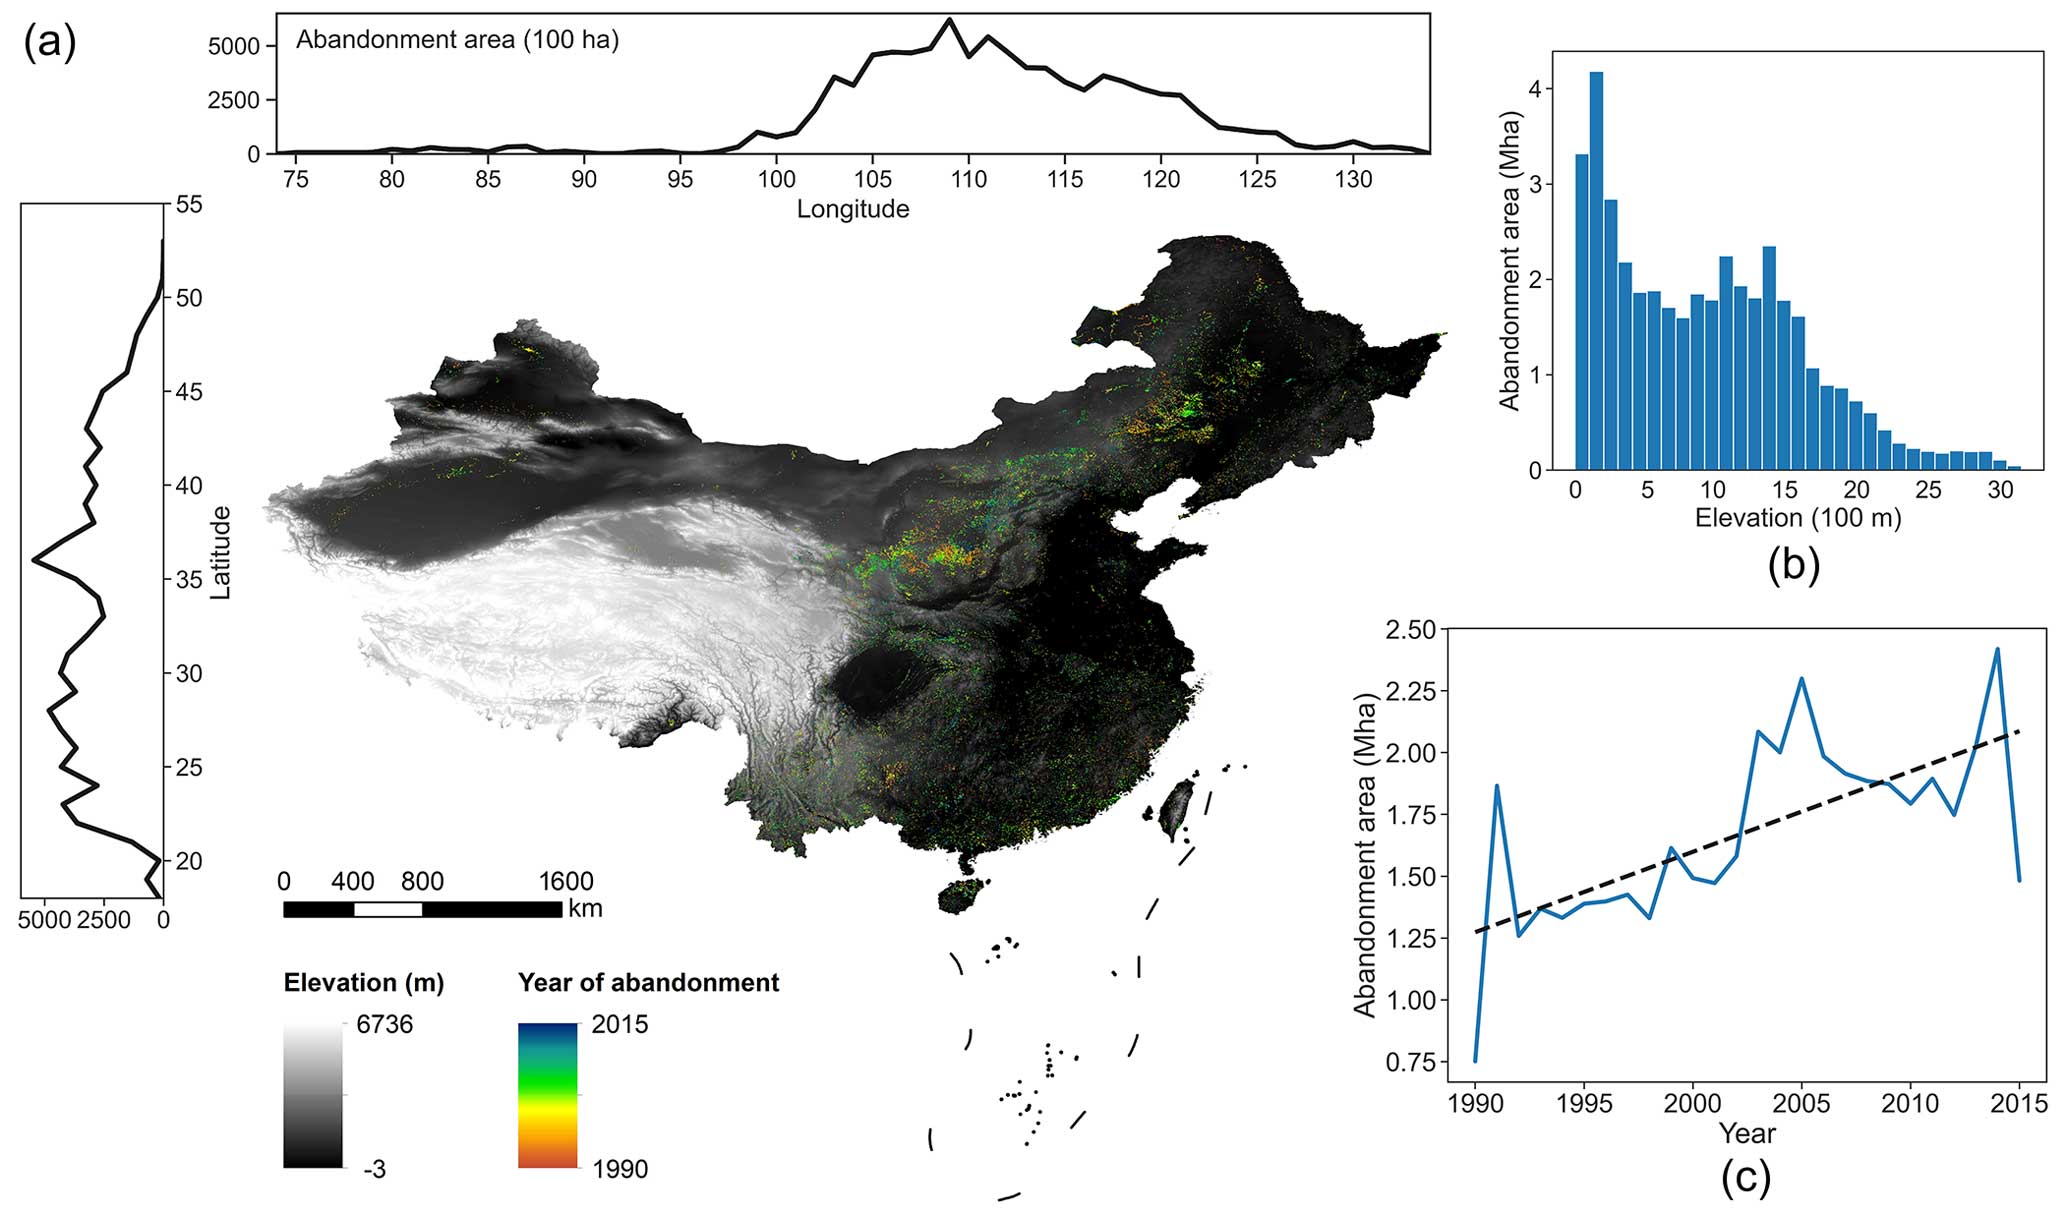
Figure 11Cropland abandonment in China between 1990 and 2015. (a) Spatial distribution of abandonment time. (b) Histogram distribution within different elevation ranges. (c) Annual trends of abandonment area. The elevation information is derived from the SRTM digital elevation dataset (Jarvis et al., 2008).
4.2 Strengths and potential implications
This research introduces an integrated framework for monitoring annual cropland dynamics at the 30 m spatial resolution. Our methods offer several contributions to the existing literature. First, we leverage baseline land cover maps and the TWDTW discrimination algorithm to realize automated training sample generation. This eliminates the time-consuming and labor-expensive process of traditional training sample collection, enabling cost-effective cropland mapping at large scales. Second, we adopt the random forest classifier for estimating pixel-wise annual cropland probabilities. These probabilities are then integrated as spectral metrics into LandTrendr for cropland trajectory modeling. The incorporation of machine learning and change detection techniques not only increases accuracy but also improves the spatial–temporal consistency of classification results. Third, we establish a set of transition rules to convert the LandTrendr fitting results to pixel-wise annual cropland types, which are capable of capturing various cropland use changes. This cropland transition discrimination strategy is distinct from existing initiatives (Potapov et al., 2022; Dara et al., 2018; Xu et al., 2018; Yin et al., 2020). Our results highlight the potential of change detection algorithms like LandTrendr to complement traditional classification processes in identifying dynamic land cover changes effectively.
In practice, we partitioned the study area into nine agricultural zones and conducted localized annual cropland classification within each 0.8° × 0.8° subregion. We also evaluated the impacts of training sample size and LandTrendr parameter settings on classification performance. Localized classifications may greatly improve accuracy, particularly in heterogeneous regions like southern China. These experiments yield valuable insights for future land cover and land use mapping endeavors. Moreover, we took advantage of the powerful data storage, computing, and analysis capabilities of GEE to build an end-to-end framework, which enables fast annual cropland mapping in any designated area of interest worldwide. Theoretically, the proposed framework is highly adaptable and can be flexibly extended to discern other land use types.
Building upon the proposed mapping scheme, we spearheaded the production of the 30 m annual cropland maps of China for the period 1986–2021. The accuracy of the dataset was validated through three independent validation sample sets and multi-perspective comparisons with other products. The CACD dataset is a valuable contribution to the realms of agriculture and land use management in China. Its accuracy and high-resolution information provide insights into the changing dynamics of cropland use over time, helping inform policymakers and stakeholders in developing sustainable land use practices. Our subsequent analyses with CACD revealed a dramatic but heterogeneous change in cropland dynamics in China, with over a third of croplands experiencing at least one change of land use during the study period. We also identified a total of 419 342 km2 (17.57 %) of abandoned croplands that occurred between 1990 and 2015, mostly located in the central and western mountainous areas. Previous studies have underscored that rural–urban migration, reductions in agricultural labor forces, and rural population aging are key drivers of cropland abandonment in China (Zhang et al., 2014; Yan et al., 2016; Ren et al., 2023). With the ability to detect cropland abandonment patterns, targeted interventions can be implemented to bring abandoned land back into use, promoting food security and protecting arable land resources. Further efforts can also be directed towards scrutinizing the underlying mechanisms of cropland abandonment as well as assessing its impacts on ecosystem service and biodiversity. Additionally, CACD can be utilized to conduct agriculture-related studies, such as analyzing crop yield and productivity, assessing the impact of climate change on crop growth, and monitoring land use changes over time. In summary, CACD represents a powerful tool for promoting sustainable agriculture practices and ensuring the long-term availability of arable land resources in China.
4.3 Limitations and prospects
Our study includes several limitations regarding methodology and data. First, we track cropland dynamics on an annual basis but do not account for intra-annual variations in crops, such as different crop calendars and cropping intensity. Consequently, our results may not be effective in identifying perennial crops. Second, we depict the general extent of croplands but do not differentiate specific types. This becomes essential when evaluating yields or climate responses of different crops. Future work needs to explore advanced methods for fine-resolution crop type mapping. Third, despite the high accuracy, CACD is subject to several levels of uncertainty. Temporally, CACD has a relatively low accuracy before 2000, possibly given the uneven coverage of Landsat 5 data. Spatially, mapping accuracy varied across different regions where the western and southeastern coastal areas have comparatively high error compared with others. Accurately classifying cropland in these regions has consistently been challenging, with recent research highlighting significant discrepancies between products (Lu et al., 2016; Zhang et al., 2022b; Xue et al., 2023). This challenge stems from characteristics of local topography and landscapes, including factors like elevation, slope, field size, and farmland fragmentation (Lu et al., 2016; Zhang et al., 2022b; Xue et al., 2023). In addition, the low quality of Landsat data (e.g., unmasked clouds) as well as the sensitivity of LandTrendr parameters further constitute the influence on mapping outcomes. Looking ahead, it is crucial to embark on comprehensive investigations and formulate targeted adaptation strategies to enhance the accuracy of cropland classification in these specific areas. Lastly, it should be acknowledged that the datasets compared in this study utilize diverse definitions of cropland (Table S5), potentially leading to discrepancies in cross-product comparisons. For instance, the cropland definition employed in this study excludes perennial crops, while GLAD includes perennial herbaceous crops. Additionally, CLCD, CLUD, and GFSAD may encompass lands cropped with plantations, such as fruits, coffee, and tea, which are excluded in this study (Fig. S1). Moreover, GLAD and GFSAD incorporate fallow land. (GLAD limits the fallow length to 4 years, as it operates cropland mapping on a 4-year interval, whereas GFSAD was only mapped for 2015 and did not specify the duration of fallow.) These variations in definitions may result in certain overestimation or underestimation of cropland extent across different products.
The atlas of CACD generated in this study can be accessed at https://doi.org/10.5281/zenodo.7936885 (Tu et al., 2023a). All maps are at the 30 m (∼ 0.00027°) spatial resolution under the EPSG:4326 (WGS84) spatial reference system.
Timely and dependable cropland distribution maps appear as key variables for crop yield estimation, agricultural sustainability assessment, and climate modeling. This research puts forward a cost-effective, fine-resolution cropland dynamics monitoring scheme by combining automated training sample generation, random forest supervised classification, and the LandTrendr temporal segmentation algorithm. We showed how labor on training sample collection can be substantially reduced by making full use of existing land cover datasets. We also demonstrated how state-of-the-art machine learning and change detection approaches can be synthesized to characterize cropland dynamics. Leveraging the full archive of Landsat imagery and the GEE cloud computing platform, we innovatively mapped the annual cropland distributions in China at a 30 m resolution from 1986 to 2021. The resulting annual maps of CACD reached a promising accuracy of F1 score of 0.79 ± 0.02, which was superior to other products including CLCD, CLUD, GLAD, and GFSAD. Furthermore, validations of third-party sample sets, regressions with provincial statistics, as well as comparisons of spatial details between multiple products indicated the rationality of CACD in delineating spatial distributions and temporal trends of cropland dynamics. The total cropland area of China in 2021 was 1 725 200 ± 212 400 km2, representing an increase of 30 300 km2 (1.79 %) compared with 1986. Cropland expansion mainly took place in northwestern China, while the eastern, central, and southern regions withstood substantial cropland loss. The annual cropland abandonment area was 16 128 km2 on average and showed an increasing trend from 1990 to 2015. The fine-resolution annual cropland data of this study are expected to serve as the basis for a wide spectrum of applications and decision-making processes in the future, for example, facilitating crop condition monitoring and early warning, promoting progress towards sustainable food production, and assessing the environmental impacts of agricultural expansion and intensification.
BX and YT conceived the research idea. YT designed the study, created the dataset, carried out the analysis, and wrote the first draft of the manuscript, under the supervision of other authors. All authors participated in the review and editing of the manuscript.
The contact author has declared that none of the authors has any competing interests.
Publisher’s note: Copernicus Publications remains neutral with regard to jurisdictional claims made in the text, published maps, institutional affiliations, or any other geographical representation in this paper. While Copernicus Publications makes every effort to include appropriate place names, the final responsibility lies with the authors. Regarding the maps used in this paper, please note that Figs. 3, 4, 6, 9, and 11 contain disputed territories.
The authors express their great gratitude to the following organizations for their contributions to this research: USGS for providing free access to Landsat imagery and GFSAD data, Wuhan University for providing CLCD data, Tsinghua University for providing CLUD and GLCVSS data, the University of Maryland for providing GLAD data, and Geo-Wiki for sharing the third-party validation samples. We thank Jian Xu and students from Jiangxi Normal University for their efforts in sample collection. We also thank Jinwei Dong and Li Wang from the Chinese Academy of Sciences for their valuable comments on the manuscript.
This study was supported by the Open Research Program of the International Research Center of Big Data for Sustainable Development Goals (grant no. CBAS2022ORP02), National Natural Science Foundation of China (grant no. 42090015), National Key Research and Development Program of China (grant nos. 2022YFE0209300 and 2022YFB3903703), Science and Technology Commission of Shanghai Municipality (grant no. 22dz1209602), and the University of Hong Kong Faculty of Business and Economics and Shenzhen Research Institutes (grant no. SZRI2023-CRF-04).
This paper was edited by Hanqin Tian and reviewed by Chong Liu and one anonymous referee.
Belgiu, M. and Csillik, O.: Sentinel-2 cropland mapping using pixel-based and object-based time-weighted dynamic time warping analysis, Remote Sens. Environ, 204, 509–523, https://doi.org/10.1016/j.rse.2017.10.005, 2018.
Boryan, C., Yang, Z., Mueller, R., and Craig, M.: Monitoring US agriculture: the US Department of Agriculture, National Agricultural Statistics Service, Cropland Data Layer Program, Geocarto Int., 26, 341–358, https://doi.org/10.1080/10106049.2011.562309, 2011.
Breiman, L.: Random forests, Mach. Learn., 45, 5–32, 2001.
Bryan, B. A., Gao, L., Ye, Y., Sun, X., Connor, J. D., Crossman, N. D., Stafford-Smith, M., Wu, J., He, C., Yu, D., Liu, Z., Li, A., Huang, Q., Ren, H., Deng, X., Zheng, H., Niu, J., Han, G., and Hou, X.: China's response to a national land-system sustainability emergency, Nature, 559, 193–204, https://doi.org/10.1038/s41586-018-0280-2, 2018.
Canny, J.: A Computational Approach to Edge Detection, IEEE Transactions on Pattern Analysis and Machine Intelligence, PAMI-8, 679–698, https://doi.org/10.1109/TPAMI.1986.4767851, 1986.
Chen, B., Tu, Y., Song, Y., Theobald, D. M., Zhang, T., Ren, Z., Li, X., Yang, J., Wang, J., Wang, X., Gong, P., Bai, Y., and Xu, B.: Mapping essential urban land use categories with open big data: Results for five metropolitan areas in the United States of America, ISPRS J. Photogramm., 178, 203–218, https://doi.org/10.1016/j.isprsjprs.2021.06.010, 2021.
Crist, E. P.: A TM Tasseled Cap equivalent transformation for reflectance factor data, Remote Sens. Environ., 17, 301–306, https://doi.org/10.1016/0034-4257(85)90102-6, 1985.
Cui, K. and Shoemaker, S. P.: A look at food security in China, npj Sci. Food, 2, 4, https://doi.org/10.1038/s41538-018-0012-x, 2018.
d'Andrimont, R., Verhegghen, A., Lemoine, G., Kempeneers, P., Meroni, M., and van der Velde, M.: From parcel to continental scale – A first European crop type map based on Sentinel-1 and LUCAS Copernicus in-situ observations, Remote Sens. Environ., 266, 112708, https://doi.org/10.1016/j.rse.2021.112708, 2021.
Dara, A., Baumann, M., Kuemmerle, T., Pflugmacher, D., Rabe, A., Griffiths, P., Hölzel, N., Kamp, J., Freitag, M., and Hostert, P.: Mapping the timing of cropland abandonment and recultivation in northern Kazakhstan using annual Landsat time series, Remote Sens. Environ., 213, 49–60, https://doi.org/10.1016/j.rse.2018.05.005, 2018.
Defourny, P., Jarvis, I., and Blaes, X.: JECAM Guidelines for cropland and crop type definition and field data collection, JECAM, https://jecam.org/wp-content/uploads/2018/10/JECAM_Guidelines_for_Field_Data_Collection_v1_0.pdf (last access: 1 May 2024), 2014.
Di Gregorio, A.: Land cover classification system: classification concepts and user manual: LCCS, Food & Agriculture Org, https://www.fao.org/4/x0596e/x0596e00.htm (last access: 1 May 2024), 2005.
FAO: FAOSTAT, Methods & Standards, https://www.fao.org/statistics/methods-and-standards/general/en (last access: 1 May 2024), 2016.
Fritz, S., See, L., McCallum, I., You, L., Bun, A., Moltchanova, E., Duerauer, M., Albrecht, F., Schill, C., Perger, C., Havlik, P., Mosnier, A., Thornton, P., Wood-Sichra, U., Herrero, M., Becker-Reshef, I., Justice, C., Hansen, M., Gong, P., Abdel Aziz, S., Cipriani, A., Cumani, R., Cecchi, G., Conchedda, G., Ferreira, S., Gomez, A., Haffani, M., Kayitakire, F., Malanding, J., Mueller, R., Newby, T., Nonguierma, A., Olusegun, A., Ortner, S., Rajak, D. R., Rocha, J., Schepaschenko, D., Schepaschenko, M., Terekhov, A., Tiangwa, A., Vancutsem, C., Vintrou, E., Wenbin, W., van der Velde, M., Dunwoody, A., Kraxner, F., and Obersteiner, M.: Mapping global cropland and field size, Glob. Change Biol., 21, 1980–1992, https://doi.org/10.1111/gcb.12838, 2015.
Gao, X., Cheng, W., Wang, N., Liu, Q., Ma, T., Chen, Y., and Zhou, C.: Spatio-temporal distribution and transformation of cropland in geomorphologic regions of China during 1990–2015, J. Geograph. Sci., 29, 180–196, https://doi.org/10.1007/s11442-019-1591-4, 2019.
Ghorbanian, A., Kakooei, M., Amani, M., Mahdavi, S., Mohammadzadeh, A., and Hasanlou, M.: Improved land cover map of Iran using Sentinel imagery within Google Earth Engine and a novel automatic workflow for land cover classification using migrated training samples, ISPRS J. Photogramm., 167, 276–288, https://doi.org/10.1016/j.isprsjprs.2020.07.013, 2020.
Godfray, H. C. J., Beddington, J. R., Crute, I. R., Haddad, L., Lawrence, D., Muir, J. F., Pretty, J., Robinson, S., Thomas, S. M., and Toulmin, C.: Food Security: The Challenge of Feeding 9 Billion People, Science, 327, 812–818, https://doi.org/10.1126/science.1185383, 2010.
Gong, P., Wang, J., Yu, L., Zhao, Y., Zhao, Y., Liang, L., Niu, Z., Huang, X., Fu, H., Liu, S., Li, C., Li, X., Fu, W., Liu, C., Xu, Y., Wang, X., Cheng, Q., Hu, L., Yao, W., Zhang, H., Zhu, P., Zhao, Z., Zhang, H., Zheng, Y., Ji, L., Zhang, Y., Chen, H., Yan, A., Guo, J., Yu, L., Wang, L., Liu, X., Shi, T., Zhu, M., Chen, Y., Yang, G., Tang, P., Xu, B., Giri, C., Clinton, N., Zhu, Z., Chen, J., and Chen, J.: Finer resolution observation and monitoring of global land cover: first mapping results with Landsat TM and ETM+ data, Int. J. Remote Sens., 34, 2607–2654, https://doi.org/10.1080/01431161.2012.748992, 2013.
Gong, P., Liu, H., Zhang, M., Li, C., Wang, J., Huang, H., Clinton, N., Ji, L., Li, W., Bai, Y., Chen, B., Xu, B., Zhu, Z., Yuan, C., Ping Suen, H., Guo, J., Xu, N., Li, W., Zhao, Y., Yang, J., Yu, C., Wang, X., Fu, H., Yu, L., Dronova, I., Hui, F., Cheng, X., Shi, X., Xiao, F., Liu, Q., and Song, L.: Stable classification with limited sample: transferring a 30-m resolution sample set collected in 2015 to mapping 10-m resolution global land cover in 2017, Sci. Bull., 64, 370–373, https://doi.org/10.1016/j.scib.2019.03.002, 2019.
Gong, P., Li, X., Wang, J., Bai, Y., Chen, B., Hu, T., Liu, X., Xu, B., Yang, J., Zhang, W., and Zhou, Y.: Annual maps of global artificial impervious area (GAIA) between 1985 and 2018, Remote Sens. Environ., 236, 111510, https://doi.org/10.1016/j.rse.2019.111510, 2020.
Gumma, M. K., Thenkabail, P. S., Maunahan, A., Islam, S., and Nelson, A.: Mapping seasonal rice cropland extent and area in the high cropping intensity environment of Bangladesh using MODIS 500m data for the year 2010, ISPRS J. Photogramm., 91, 98–113, https://doi.org/10.1016/j.isprsjprs.2014.02.007, 2014.
Ho, T. K.: Random decision forests, Proceedings of 3rd international conference on document analysis and recognition, 278–282, https://doi.org/10.1109/ICDAR.1995.598994, 1995.
Huang, C., Davis, L. S., and Townshend, J. R. G.: An assessment of support vector machines for land cover classification, Int. J. Remote Sens., 23, 725–749, https://doi.org/10.1080/01431160110040323, 2002.
Huang, H., Wang, J., Liu, C., Liang, L., Li, C., and Gong, P.: The migration of training samples towards dynamic global land cover mapping, ISPRS J. Photogramm., 161, 27–36, https://doi.org/10.1016/j.isprsjprs.2020.01.010, 2020.
Isbell, F., Tilman, D., Reich, P. B., and Clark, A. T.: Deficits of biodiversity and productivity linger a century after agricultural abandonment, Nature Ecol. Evol., 3, 1533–1538, https://doi.org/10.1038/s41559-019-1012-1, 2019.
Ito, J., Nishikori, M., Toyoshi, M., and Feuer, H. N.: The contribution of land exchange institutions and markets in countering farmland abandonment in Japan, Land Use Policy, 57, 582–593, https://doi.org/10.1016/j.landusepol.2016.06.020, 2016.
Jarvis, A., Reuter, H. I., Nelson, A., and Guevara, E.: Hole-filled SRTM for the globe Version 4, available from the CGIAR-CSI SRTM 90m Database, http://srtm.csi.cgiar.org (last access: 1 May 2024), 2008.
Jin, H., Stehman, S. V., and Mountrakis, G.: Assessing the impact of training sample selection on accuracy of an urban classification: a case study in Denver, Colorado, Int. J. Remote Sens., 35, 2067–2081, https://doi.org/10.1080/01431161.2014.885152, 2014.
Kennedy, R. E., Yang, Z., and Cohen, W. B.: Detecting trends in forest disturbance and recovery using yearly Landsat time series: 1. LandTrendr – Temporal segmentation algorithms, Remote Sens. Environ., 114, 2897–2910, https://doi.org/10.1016/j.rse.2010.07.008, 2010.
Kennedy, R. E., Yang, Z., Gorelick, N., Braaten, J., Cavalcante, L., Cohen, W. B., and Healey, S.: Implementation of the LandTrendr Algorithm on Google Earth Engine, Remote Sens., 10, 691, https://doi.org/10.3390/rs10050691, 2018.
Lambert, M.-J., Waldner, F., and Defourny, P.: Cropland Mapping over Sahelian and Sudanian Agrosystems: A Knowledge-Based Approach Using PROBA-V Time Series at 100-m, Remote Sens., 8, 232, https://doi.org/10.3390/rs8030232, 2016.
Laso Bayas, J. C., Lesiv, M., Waldner, F., Schucknecht, A., Duerauer, M., See, L., Fritz, S., Fraisl, D., Moorthy, I., McCallum, I., Perger, C., Danylo, O., Defourny, P., Gallego, J., Gilliams, S., Akhtar, I. u. H., Baishya, S. J., Baruah, M., Bungnamei, K., Campos, A., Changkakati, T., Cipriani, A., Das, K., Das, K., Das, I., Davis, K. F., Hazarika, P., Johnson, B. A., Malek, Z., Molinari, M. E., Panging, K., Pawe, C. K., Pérez-Hoyos, A., Sahariah, P. K., Sahariah, D., Saikia, A., Saikia, M., Schlesinger, P., Seidacaru, E., Singha, K., and Wilson, J. W.: A global reference database of crowdsourced cropland data collected using the Geo-Wiki platform, Sci. Data, 4, 170136, https://doi.org/10.1038/sdata.2017.136, 2017.
Li, C., Gong, P., Wang, J., Zhu, Z., Biging, G. S., Yuan, C., Hu, T., Zhang, H., Wang, Q., Li, X., Liu, X., Xu, Y., Guo, J., Liu, C., Hackman, K. O., Zhang, M., Cheng, Y., Yu, L., Yang, J., Huang, H., and Clinton, N.: The first all-season sample set for mapping global land cover with Landsat-8 data, Sci. Bull., 62, 508–515, https://doi.org/10.1016/j.scib.2017.03.011, 2017.
Li, Q., Liu, G., and Chen, W.: Toward a Simple and Generic Approach for Identifying Multi-Year Cotton Cropping Patterns Using Landsat and Sentinel-2 Time Series, Remote Sens., 13, 5183, https://doi.org/10.3390/rs13245183, 2021.
Li, S., Li, X., Sun, L., Cao, G., Fischer, G., and Tramberend, S.: An estimation of the extent of cropland abandonment in mountainous regions of China, Land Degrad. Develop., 29, 1327–1342, https://doi.org/10.1002/ldr.2924, 2018.
Li, X., Gong, P., and Liang, L.: A 30-year (1984–2013) record of annual urban dynamics of Beijing City derived from Landsat data, Remote Sens. Environ., 166, 78–90, https://doi.org/10.1016/j.rse.2015.06.007, 2015.
Li, X.-Y., Li, X., Fan, Z., Mi, L., Kandakji, T., Song, Z., Li, D., and Song, X.-P.: Civil war hinders crop production and threatens food security in Syria, Nature Food, 3, 38–46, https://doi.org/10.1038/s43016-021-00432-4, 2022.
Liang, C., Penghui, J., wei, C., Manchun, L., Liyan, W., Yuan, G., Yuzhe, P., Nan, X., Yuewei, D., and Qiuhao, H.: Farmland protection policies and rapid urbanization in China: A case study for Changzhou City, Land Use Policy, 48, 552–566, https://doi.org/10.1016/j.landusepol.2015.06.014, 2015.
Liu, D. and Cai, S.: A Spatial-Temporal Modeling Approach to Reconstructing Land-Cover Change Trajectories from Multi-temporal Satellite Imagery, Ann. Assoc. Am. Geogr., 102, 1329–1347, https://doi.org/10.1080/00045608.2011.596357, 2012.
Liu, F., Zhang, Z., Zhao, X., Wang, X., Zuo, L., Wen, Q., Yi, L., Xu, J., Hu, S., and Liu, B.: Chinese cropland losses due to urban expansion in the past four decades, Sci. Total Environ., 650, 847–857, https://doi.org/10.1016/j.scitotenv.2018.09.091, 2019.
Liu, G.: Understanding cotton cultivation dynamics in Aksu Oases (NW China) by reconstructing change trajectories using multi-temporal Landsat and Sentinel-2 data, Geocarto Int., 37, 4406–4424, https://doi.org/10.1080/10106049.2021.1886337, 2022.
Liu, J., Kuang, W., Zhang, Z., Xu, X., Qin, Y., Ning, J., Zhou, W., Zhang, S., Li, R., Yan, C., Wu, S., Shi, X., Jiang, N., Yu, D., Pan, X., and Chi, W.: Spatiotemporal characteristics, patterns, and causes of land-use changes in China since the late 1980s, J. Geograph. Sci., 24, 195–210, https://doi.org/10.1007/s11442-014-1082-6, 2014.
Liu, Y., Fang, F., and Li, Y.: Key issues of land use in China and implications for policy making, Land Use Policy, 40, 6–12, https://doi.org/10.1016/j.landusepol.2013.03.013, 2014.
Lu, M., Wu, W., Zhang, L., Liao, A., Peng, S., and Tang, H.: A comparative analysis of five global cropland datasets in China, Sci. China Earth Sci., 59, 2307–2317, https://doi.org/10.1007/s11430-016-5327-3, 2016.
MacDonald, D., Crabtree, J. R., Wiesinger, G., Dax, T., Stamou, N., Fleury, P., Gutierrez Lazpita, J., and Gibon, A.: Agricultural abandonment in mountain areas of Europe: Environmental consequences and policy response, J. Environ. Manage., 59, 47–69, https://doi.org/10.1006/jema.1999.0335, 2000.
Masek, J. G., Vermote, E. F., Saleous, N. E., Wolfe, R., Hall, F. G., Huemmrich, K. F., Feng, G., Kutler, J., and Teng-Kui, L.: A Landsat surface reflectance dataset for North America, 1990–2000, IEEE Geosci. Remote Sens. Lett., 3, 68–72, https://doi.org/10.1109/LGRS.2005.857030, 2006.
Maus, V., Câmara, G., Cartaxo, R., Sanchez, A., Ramos, F. M., and Queiroz, G. R. D.: A Time-Weighted Dynamic Time Warping Method for Land-Use and Land-Cover Mapping, IEEE J. Sel. Top. Appl., 9, 3729–3739, https://doi.org/10.1109/JSTARS.2016.2517118, 2016.
Olofsson, P., Foody, G. M., Herold, M., Stehman, S. V., Woodcock, C. E., and Wulder, M. A.: Good practices for estimating area and assessing accuracy of land change, Remote Sens. Environ., 148, 42–57, https://doi.org/10.1016/j.rse.2014.02.015, 2014.
Pasquarella, V. J., Arévalo, P., Bratley, K. H., Bullock, E. L., Gorelick, N., Yang, Z., and Kennedy, R. E.: Demystifying LandTrendr and CCDC temporal segmentation, Int. J. Appl. Earth Obs., 110, 102806, https://doi.org/10.1016/j.jag.2022.102806, 2022.
Pekel, J.-F., Cottam, A., Gorelick, N., and Belward, A. S.: High-resolution mapping of global surface water and its long-term changes, Nature, 540, 418–422, https://doi.org/10.1038/nature20584, 2016.
Pittman, K., Hansen, M. C., Becker-Reshef, I., Potapov, P. V., and Justice, C. O.: Estimating Global Cropland Extent with Multi-year MODIS Data, Remote Sens., 2, 1844–1863, https://doi.org/10.3390/rs2071844, 2010.
Potapov, P., Turubanova, S., Hansen, M. C., Tyukavina, A., Zalles, V., Khan, A., Song, X.-P., Pickens, A., Shen, Q., and Cortez, J.: Global maps of cropland extent and change show accelerated cropland expansion in the twenty-first century, Nature Food, 3, 19–28, 2022.
Potapov, P. V., Turubanova, S. A., Hansen, M. C., Adusei, B., Broich, M., Altstatt, A., Mane, L., and Justice, C. O.: Quantifying forest cover loss in Democratic Republic of the Congo, 2000–2010, with Landsat ETM+ data, Remote Sens. Environ., 122, 106–116, https://doi.org/10.1016/j.rse.2011.08.027, 2012.
Prishchepov, A. V., Radeloff, V. C., Dubinin, M., and Alcantara, C.: The effect of Landsat ETM/ETM+ image acquisition dates on the detection of agricultural land abandonment in Eastern Europe, Remote Sens. Environ., 126, 195–209, https://doi.org/10.1016/j.rse.2012.08.017, 2012.
Qiu, B., Li, H., Tang, Z., Chen, C., and Berry, J.: How cropland losses shaped by unbalanced urbanization process?, Land Use Policy, 96, 104715, https://doi.org/10.1016/j.landusepol.2020.104715, 2020.
Queiroz, C., Beilin, R., Folke, C., and Lindborg, R.: Farmland abandonment: threat or opportunity for biodiversity conservation? A global review, Front. Ecol. Environ., 12, 288–296, https://doi.org/10.1890/120348, 2014.
Radoux, J., Lamarche, C., Van Bogaert, E., Bontemps, S., Brockmann, C., and Defourny, P.: Automated Training Sample Extraction for Global Land Cover Mapping, Remote Sens., 6, 3965–3987, https://doi.org/10.3390/rs6053965, 2014.
Ren, C., Zhou, X., Wang, C., Guo, Y., Diao, Y., Shen, S., Reis, S., Li, W., Xu, J., and Gu, B.: Ageing threatens sustainability of smallholder farming in China, Nature, 616, 96–103, https://doi.org/10.1038/s41586-023-05738-w, 2023.
Roberts, L.: 9 Billion?, Science, 333, 540–543, https://doi.org/10.1126/science.333.6042.540, 2011.
Roy, D. P., Kovalskyy, V., Zhang, H. K., Vermote, E. F., Yan, L., Kumar, S. S., and Egorov, A.: Characterization of Landsat-7 to Landsat-8 reflective wavelength and normalized difference vegetation index continuity, Remote Sens. Environ., 185, 57–70, https://doi.org/10.1016/j.rse.2015.12.024, 2016.
Schneibel, A., Stellmes, M., Röder, A., Frantz, D., Kowalski, B., Haß, E., and Hill, J.: Assessment of spatio-temporal changes of smallholder cultivation patterns in the Angolan Miombo belt using segmentation of Landsat time series, Remote Sens. Environ., 195, 118–129, https://doi.org/10.1016/j.rse.2017.04.012, 2017.
Searchinger, T., Heimlich, R., Houghton, R. A., Dong, F., Elobeid, A., Fabiosa, J., Tokgoz, S., Hayes, D., and Yu, T.-H.: Use of U.S. Croplands for Biofuels Increases Greenhouse Gases Through Emissions from Land-Use Change, Science, 319, 1238–1240, https://doi.org/10.1126/science.1151861, 2008.
See, L., Fritz, S., You, L., Ramankutty, N., Herrero, M., Justice, C., Becker-Reshef, I., Thornton, P., Erb, K., Gong, P., Tang, H., van der Velde, M., Ericksen, P., McCallum, I., Kraxner, F., and Obersteiner, M.: Improved global cropland data as an essential ingredient for food security, Global Food Security, 4, 37–45, https://doi.org/10.1016/j.gfs.2014.10.004, 2015.
Shao, Y. and Lunetta, R. S.: Comparison of support vector machine, neural network, and CART algorithms for the land-cover classification using limited training data points, ISPRS J. Photogramm., 70, 78–87, https://doi.org/10.1016/j.isprsjprs.2012.04.001, 2012.
Tang, L., Ke, X., Chen, Y., Wang, L., Zhou, Q., Zheng, W., and Xiao, B.: Which impacts more seriously on natural habitat loss and degradation? Cropland expansion or urban expansion?, Land Degrad. Dev., 32, 946–964, https://doi.org/10.1002/ldr.3768, 2021.
Thenkabail, P. S., Teluguntla, P. G., Xiong, J., Oliphant, A., Congalton, R. G., Ozdogan, M., Gumma, M. K., Tilton, J. C., Giri, C., Milesi, C., Phalke, A., Massey, R., Yadav, K., Sankey, T., Zhong, Y., Aneece, I., and Foley, D.: Global cropland-extent product at 30-m resolution (GCEP30) derived from Landsat satellite time-series data for the year 2015 using multiple machine-learning algorithms on Google Earth Engine cloud, Reston, VA, Report 1868, 63, https://doi.org/10.3133/pp1868, 2021.
Tilman, D., Balzer, C., Hill, J., and Befort, B. L.: Global food demand and the sustainable intensification of agriculture, P. Natl. Acad. Sci. USA, 108, 20260–20264, https://doi.org/10.1073/pnas.1116437108, 2011.
Traoré, F., Bonkoungou, J., Compaoré, J., Kouadio, L., Wellens, J., Hallot, E., and Tychon, B.: Using Multi-Temporal Landsat Images and Support Vector Machine to Assess the Changes in Agricultural Irrigated Areas in the Mogtedo Region, Burkina Faso, Remote Sens., 11, 1442, https://doi.org/10.3390/rs11121442, 2019.
Tu, Y., Chen, B., Zhang, T., and Xu, B.: Regional Mapping of Essential Urban Land Use Categories in China: A Segmentation-Based Approach, Remote Sens., 12, 1058, https://doi.org/10.3390/rs12071058, 2020.
Tu, Y., Chen, B., Yu, L., Xin, Q., Gong, P., and Xu, B.: How does urban expansion interact with cropland loss? A comparison of 14 Chinese cities from 1980 to 2015, Landscape Ecol., 36, 243–263, https://doi.org/10.1007/s10980-020-01137-y, 2021.
Tu, Y., Wu, S., Chen, B., Weng, Q., Bai, Y., Yang, J., Yu, L., and Xu, B.: A 30 m annual cropland dataset of China from 1986 to 2021, Zenodo [data set], https://doi.org/10.5281/zenodo.7936884, 2023a.
Tu, Y., Chen, B., Yu, L., Song, Y., Wu, S., Li, M., Wei, H., Chen, T., Lang, W., Gong, P., and Xu, B.: Raveling the nexus between urban expansion and cropland loss in China, Landscape Ecol., 38, 1869–1884, https://doi.org/10.1007/s10980-023-01653-7, 2023b.
United Nations: United Nations Transforming Our World: The 2030 Agenda for Sustainable Development, Division for Sustainable Development Goals: New York, NY, USA, https://sustainabledevelopment.un.org/content/documents/21252030%20Agenda%20for%20Sustainable%20Development%20web.pdf (last access: 1 May 2024), 2015.
Verbesselt, J., Hyndman, R., Newnham, G., and Culvenor, D.: Detecting trend and seasonal changes in satellite image time series, Remote Sens. Environ., 114, 106–115, https://doi.org/10.1016/j.rse.2009.08.014, 2010.
Vermote, E., Justice, C., Claverie, M., and Franch, B.: Preliminary analysis of the performance of the Landsat 8/OLI land surface reflectance product, Remote Sens. Environ., 185, 46–56, https://doi.org/10.1016/j.rse.2016.04.008, 2016.
Vuichard, N., Ciais, P., Belelli, L., Smith, P., and Valentini, R.: Carbon sequestration due to the abandonment of agriculture in the former USSR since 1990, Global Biogeochem. Cy., 22, GB4018, https://doi.org/10.1029/2008GB003212, 2008.
Waldner, F., Canto, G. S., and Defourny, P.: Automated annual cropland mapping using knowledge-based temporal features, ISPRS J. Photogramm., 110, 1–13, https://doi.org/10.1016/j.isprsjprs.2015.09.013, 2015a.
Waldner, F., Fritz, S., Di Gregorio, A., and Defourny, P.: Mapping Priorities to Focus Cropland Mapping Activities: Fitness Assessment of Existing Global, Regional and National Cropland Maps, Remote Sens., 7, 7959–7986, https://doi.org/10.3390/rs70607959, 2015b.
Wardlow, B. D. and Egbert, S. L.: Large-area crop mapping using time-series MODIS 250 m NDVI data: An assessment for the U.S. Central Great Plains, Remote Sens. Environ., 112, 1096–1116, https://doi.org/10.1016/j.rse.2007.07.019, 2008.
Xie, Y., Lark, T. J., Brown, J. F., and Gibbs, H. K.: Mapping irrigated cropland extent across the conterminous United States at 30 m resolution using a semi-automatic training approach on Google Earth Engine, ISPRS J. Photogramm., 155, 136–149, https://doi.org/10.1016/j.isprsjprs.2019.07.005, 2019.
Xiong, J., Thenkabail, P. S., Gumma, M. K., Teluguntla, P., Poehnelt, J., Congalton, R. G., Yadav, K., and Thau, D.: Automated cropland mapping of continental Africa using Google Earth Engine cloud computing, ISPRS J. Photogramm., 126, 225–244, https://doi.org/10.1016/j.isprsjprs.2017.01.019, 2017.
Xu, H., Qi, S., Li, X., Gao, C., Wei, Y., and Liu, C.: Monitoring three-decade dynamics of citrus planting in Southeastern China using dense Landsat records, Int. J. Appl. Earth Obs., 103, 102518, https://doi.org/10.1016/j.jag.2021.102518, 2021.
Xu, Y., Yu, L., Zhao, F. R., Cai, X., Zhao, J., Lu, H., and Gong, P.: Tracking annual cropland changes from 1984 to 2016 using time-series Landsat images with a change-detection and post-classification approach: Experiments from three sites in Africa, Remote Sens. Environ., 218, 13–31, https://doi.org/10.1016/j.rse.2018.09.008, 2018.
Xu, Y., Yu, L., Peng, D., Zhao, J., Cheng, Y., Liu, X., Li, W., Meng, R., Xu, X., and Gong, P.: Annual 30-m land use/land cover maps of China for 1980–2015 from the integration of AVHRR, MODIS and Landsat data using the BFAST algorithm, Sci. China Earth Sci., 63, 1390–1407, https://doi.org/10.1007/s11430-019-9606-4, 2020.
Xue, J., Zhang, X.-l., Chen, S.-C., Hu, B.-f., Wang, N., and Shi, Z.: Quantifying the agreement and accuracy characteristics of four satellite-based LULC products for cropland classification in China, J. Integr. Agr., 23, 283–297, https://doi.org/10.1016/j.jia.2023.06.005, 2023.
Yan, J., Yang, Z., Li, Z., Li, X., Xin, L., and Sun, L.: Drivers of cropland abandonment in mountainous areas: A household decision model on farming scale in Southwest China, Land Use Policy, 57, 459–469, https://doi.org/10.1016/j.landusepol.2016.06.014, 2016.
Yang, J. and Huang, X.: The 30 m annual land cover dataset and its dynamics in China from 1990 to 2019, Earth Syst. Sci. Data, 13, 3907–3925, https://doi.org/10.5194/essd-13-3907-2021, 2021.
Yin, H., Pflugmacher, D., Kennedy, R. E., Sulla-Menashe, D., and Hostert, P.: Mapping Annual Land Use and Land Cover Changes Using MODIS Time Series, IEEE J. Sel. Top. Appl., 7, 3421–3427, https://doi.org/10.1109/JSTARS.2014.2348411, 2014.
Yin, H., Prishchepov, A. V., Kuemmerle, T., Bleyhl, B., Buchner, J., and Radeloff, V. C.: Mapping agricultural land abandonment from spatial and temporal segmentation of Landsat time series, Remote Sens. Environ., 210, 12–24, https://doi.org/10.1016/j.rse.2018.02.050, 2018.
Yin, H., Brandão, A., Buchner, J., Helmers, D., Iuliano, B. G., Kimambo, N. E., Lewińska, K. E., Razenkova, E., Rizayeva, A., Rogova, N., Spawn, S. A., Xie, Y., and Radeloff, V. C.: Monitoring cropland abandonment with Landsat time series, Remote Sens. Environ., 246, 111873, https://doi.org/10.1016/j.rse.2020.111873, 2020.
Yu, L., Wang, J., Clinton, N., Xin, Q., Zhong, L., Chen, Y., and Gong, P.: FROM-GC: 30 m global cropland extent derived through multisource data integration, Int. J. Digit. Earth, 6, 521–533, 2013.
Yu, Q., Hu, Q., van Vliet, J., Verburg, P. H., and Wu, W.: GlobeLand30 shows little cropland area loss but greater fragmentation in China, Int. J. Appl. Earth Obs., 66, 37–45, https://doi.org/10.1016/j.jag.2017.11.002, 2018.
Zabel, F., Delzeit, R., Schneider, J. M., Seppelt, R., Mauser, W., and Václavík, T.: Global impacts of future cropland expansion and intensification on agricultural markets and biodiversity, Nat. Commun., 10, 2844, https://doi.org/10.1038/s41467-019-10775-z, 2019.
Zhang, C., Dong, J., and Ge, Q.: Mapping 20 years of irrigated croplands in China using MODIS and statistics and existing irrigation products, Sci. Data, 9, 407, https://doi.org/10.1038/s41597-022-01522-z, 2022a.
Zhang, C., Dong, J., and Ge, Q.: Quantifying the accuracies of six 30-m cropland datasets over China: A comparison and evaluation analysis, Comput. Electron. Agr., 197, 106946, https://doi.org/10.1016/j.compag.2022.106946, 2022b.
Zhang, G., Xiao, X., Dong, J., Kou, W., Jin, C., Qin, Y., Zhou, Y., Wang, J., Menarguez, M. A., and Biradar, C.: Mapping paddy rice planting areas through time series analysis of MODIS land surface temperature and vegetation index data, ISPRS J. Photogramm, 106, 157–171, https://doi.org/10.1016/j.isprsjprs.2015.05.011, 2015.
Zhang, H. K. and Roy, D. P.: Using the 500m MODIS land cover product to derive a consistent continental scale 30m Landsat land cover classification, Remote Sens. Environ., 197, 15–34, https://doi.org/10.1016/j.rse.2017.05.024, 2017.
Zhang, X., Zhao, T., Xu, H., Liu, W., Wang, J., Chen, X., and Liu, L.: GLC_FCS30D: the first global 30 m land-cover dynamics monitoring product with a fine classification system for the period from 1985 to 2022 generated using dense-time-series Landsat imagery and the continuous change-detection method, Earth Syst. Sci. Data, 16, 1353–1381, https://doi.org/10.5194/essd-16-1353-2024, 2024.
Zhang, Y., Li, X., and Song, W.: Determinants of cropland abandonment at the parcel, household and village levels in mountain areas of China: A multi-level analysis, Land Use Policy, 41, 186–192, https://doi.org/10.1016/j.landusepol.2014.05.011, 2014.
Zhong, L., Gong, P., and Biging, G. S.: Efficient corn and soybean mapping with temporal extendability: A multi-year experiment using Landsat imagery, Remote Sens. Environ., 140, 1–13, https://doi.org/10.1016/j.rse.2013.08.023, 2014.
Zhu, L., Liu, X., Wu, L., Tang, Y., and Meng, Y.: Long-Term Monitoring of Cropland Change near Dongting Lake, China, Using the LandTrendr Algorithm with Landsat Imagery, Remote Sens., 11, 1234, https://doi.org/10.3390/rs11101234, 2019.
Zhu, Z.: Change detection using landsat time series: A review of frequencies, preprocessing, algorithms, and applications, ISPRS J. Photogramm., 130, 370–384, https://doi.org/10.1016/j.isprsjprs.2017.06.013, 2017.
Zhu, Z. and Woodcock, C. E.: Object-based cloud and cloud shadow detection in Landsat imagery, Remote Sens. Environ., 118, 83–94, https://doi.org/10.1016/j.rse.2011.10.028, 2012.
Zhu, Z. and Woodcock, C. E.: Continuous change detection and classification of land cover using all available Landsat data, Remote Sens. Environ., 144, 152–171, https://doi.org/10.1016/j.rse.2014.01.011, 2014.
Zhu, Z., Gallant, A. L., Woodcock, C. E., Pengra, B., Olofsson, P., Loveland, T. R., Jin, S., Dahal, D., Yang, L., and Auch, R. F.: Optimizing selection of training and auxiliary data for operational land cover classification for the LCMAP initiative, ISPRS J. Photogramm., 122, 206–221, https://doi.org/10.1016/j.isprsjprs.2016.11.004, 2016.
Zuo, L., Zhang, Z., Carlson, K. M., MacDonald, G. K., Brauman, K. A., Liu, Y., Zhang, W., Zhang, H., Wu, W., Zhao, X., Wang, X., Liu, B., Yi, L., Wen, Q., Liu, F., Xu, J., Hu, S., Sun, F., Gerber, J. S., and West, P. C.: Progress towards sustainable intensification in China challenged by land-use change, Nat. Sustain., 1, 304–313, https://doi.org/10.1038/s41893-018-0076-2, 2018.