the Creative Commons Attribution 4.0 License.
the Creative Commons Attribution 4.0 License.
 | 08 Apr 2024
Introduction to the NJIAS Himawari-8/9 Cloud Feature Dataset for climate and typhoon research
Xiaoyong Zhuge
Xiaolei Zou
Lu Yu
Mingjian Zeng
Yilun Chen
Bing Zhang
Bin Yao
Fei Tang
Fengjiao Chen
Wanlin Kan
The use of remote sensing methods to accurately measure cloud properties and their spatiotemporal changes has been widely welcomed in many fields of atmospheric research. The Nanjing Joint Institute for Atmospheric Sciences (NJIAS) Himawari-8/9 Cloud Feature Dataset (HCFD) provides a comprehensive description of cloud features over the East Asia and west North Pacific regions for the 7-year period from April 2016 to December 2022. Multiple cloud variables, such as cloud mask, phase/type, top height, optical thickness, and particle effective radius, as well as snow, dust, and haze masks, were generated from the visible and infrared measurements of the Advanced Himawari Imager (AHI) on board the Japanese geostationary satellites Himawari-8 and Himawari-9 using a series of recently developed cloud retrieval algorithms. Verifications with the Cloud–Aerosol Lidar with Orthogonal Polarization (CALIOP) 1 km cloud layer product and the Moderate Resolution Imaging Spectroradiometer (MODIS) Level-2 cloud product (MYD06) demonstrate that the NJIAS HCFD gives higher skill scores than the Japanese Himawari-8/9 operational cloud product for all cloud variables except for cloud particle effective radius. The NJIAS HCFD even outperforms the MYD06 in nighttime cloud detection; cloud-top height, pressure, and temperature estimation; and infrared-only cloud-top phase determination. All evaluations are performed at the nominal 2 km scale, not including the effects of sub-pixel cloudiness or very thin cirrus. Two examples are presented to demonstrate applications of the NJIAS HCFD for climate and typhoon research. The NJIAS HCFD has been published in the Science Data Bank (https://doi.org/10.57760/sciencedb.09950, Zhuge 2023a; https://doi.org/10.57760/sciencedb.09953, Zhuge 2023b; https://doi.org/10.57760/sciencedb.09954, Zhuge 2023c; https://doi.org/10.57760/sciencedb.10158, Zhuge 2023d; https://doi.org/10.57760/sciencedb.09945, Zhuge 2023e).
- Article
(8854 KB) - Full-text XML
- BibTeX
- EndNote


Clouds play a crucial role in severe weather systems. The formation, development, and dissipation of convective storms are closely related to cloud microphysical processes (Zhuge and Zou, 2018; Liu et al., 2020). The intensity and size of tropical cyclones are also indicated by the states of clouds (Zhuge et al., 2015; Sun et al., 2021). In addition, clouds modulate the planetary radiation budget by reflecting incoming solar radiation and absorbing outgoing longwave radiation in Earth's climate system (Stephens, 2005; Yang et al., 2015) and they affect Earth's hydrological cycle by altering the water distribution through precipitation (Rosenfeld et al., 2014; Stevens and Bony, 2013). However, cloud processes are not yet well understood or accurately predicted by current weather and climate models. Obtaining global cloud properties and their spatiotemporal changes has always been of great interest to the weather and climate community at large.
Satellite remote sensing is an approach to observing and retrieving cloud properties on a global scale. There are two types of satellite sensors: active and passive sensors. Active sensors, such as the Cloud–Aerosol Lidar with Orthogonal Polarization (CALIOP) on board the Cloud–Aerosol Lidar and Infrared Pathfinder Satellite Observation (CALIPSO) satellite (Winker et al., 2007) and the Cloud Profiling Radar (CPR) on board the CloudSat satellite (Stephens et al., 2002), can provide cloud profile information at a high spatial resolution with high accuracy. However, these sensors have limited spatial coverage due to their nadir-only sampling mode. By contrast, the passive sensors provide measurements of wide swaths and multiple channels, which allows cloud-top properties to be retrieved over a large coverage area. For example, the Moderate Resolution Imaging Spectroradiometer (MODIS) on board the Earth Observing System Aqua and Terra platforms provides observations that are highly sensitive to clouds. It has 36 channels ranging from visible (Vis) to infrared (IR) at a nadir spatial resolution of 0.25–1 km (Platnick et al., 2003). The unique spectral and spatial capabilities have resulted in the generation of MODIS Level-2 cloud products (known as MOD06 for Terra and MYD06 for Aqua), which have been proven to have high accuracy and are widely used within the Earth system science research community. Due to the safety concerns arising from the MODIS extended service life, the National Aeronautics and Space Administration (NASA) is promoting a migration project to apply the MYD06 algorithms to the Visible Infrared Imaging Radiometer Suite (VIIRS) on board the US polar-orbiting operational environmental satellites (Platnick et al., 2021). However, both MODIS and VIIRS have a revisit interval of 1–2 d, which means that the temporal evolution of clouds cannot be captured by these instruments.
The new generation of geostationary satellite imagers, such as the Advanced Himawari Imager (AHI) on board the Japanese Himawari-8 and Himawari-9 satellites (Bessho et al., 2016), the Advanced Baseline Imager (ABI) on board the US Geostationary Operational Environmental Satellite (GOES)-R series (Schmit et al., 2017), the Advanced Geostationary Radiation Imager (AGRI) on board the Chinese Fengyun-4 satellites (Yang et al., 2017), and the Flexible Combined Imager (FCI) on board the European Meteosat Third Generation (MTG; Holmlund et al., 2021), can continuously observe large-scale regions at a high spatiotemporal resolution. This capability enables a comprehensive remote sensing of various cloud properties.
The GOES-R Algorithm Working Group has developed a series of retrieval algorithms for ABI cloud (Heidinger and Straka, 2013) and fog (Calvert and Pavolonis, 2010) masks, cloud height (Heidinger, 2012), cloud phase and type (Pavolonis, 2010), and daytime (Walther et al., 2013) and nighttime (Minnis and Heck, 2012) optical and microphysical parameters. For AHI operational cloud algorithms, the techniques developed by Imai and Yoshida (2016) and Mouri et al. (2016a, b) are used for the AHI cloud mask, cloud height, and cloud phase determinations, and a multifunctional algorithm called the Comprehensive Analysis Program for Cloud Optical Measurement (CAPCOM) is employed to retrieve the optical and microphysical parameters for liquid-water (Nakajima and Nakajma, 1995; Kawamoto et al., 2001) and ice (Letu et al., 2019, 2020) clouds. The AHI Level-2 operational cloud product from September 2015 to the present at a low spatial resolution of 0.05° × 0.05° is archived on the P-Tree System of the Japan Aerospace Exploration Agency (JAXA). All cloud variables are available only during the daytime at solar zenith angles below 80°. As a result, only the semi-diurnal variation of cloud cover (e.g., Shang et al., 2018; Yu et al., 2022) or convective activity (e.g., Li et al., 2021) during the daytime can be obtained from the AHI Level-2 operational cloud product.
To supplement the JAXA operational cloud algorithms and products, starting from 2016 the authors have successively developed multiple algorithms for AHI cloud mask (Zhuge and Zou, 2016; Zhuge et al., 2017), cloud-top phase (Zhuge et al., 2021a), cloud type (Zhang et al., 2019; Sun et al., 2019), and daytime cloud optical and microphysical parameters (DCOMPs; Zhuge et al., 2021b). They are now collectively referred to as the Nanjing Joint Institute for Atmospheric Sciences (NJIAS) cloud retrieval algorithms. Over the past 3 years, it has been discovered that the NJIAS cloud retrieval algorithms have several shortcomings and weaknesses, such as inadequate detection of low-level clouds at high solar zenith angles or over snow-covered surfaces and insufficient masks of dust, haze, and fog. Accordingly, a number of enhancements to the NJIAS cloud retrieval algorithms have been implemented. Finally, 30 variables are generated at the 0.5 h interval in the 7-year period from April 2016 to December 2022 using these algorithms. They are named the NJIAS Himawari-8/9 Cloud Feature Dataset (HCFD). The objectives of this article are twofold: (1) to give an in-depth overview of the NJIAS HCFD, including the updates made to NJIAS cloud retrieval algorithms since 2021, and (2) to objectively evaluate the accuracy of the NJIAS HCFD, particularly its comparative performance with existing datasets.
The remaining parts of this article are organized as follows. Section 2 gives a detailed overview of the NJIAS HCFD. Section 3 presents results of an evaluation of the NJIAS HCFD accuracy against the CALIOP and Collection 6.1 MYD06 datasets. Section 4 presents two application examples: one on cloud climatology in southwestern China and the other on cloud and precipitation features of landfalling typhoons. After a description of data availability (Sect. 5), a summary and the conclusions are given in Sect. 6.
2.1 Input data
The primary sensor data employed by the NJIAS HCFD are the multispectral observations of the AHI on board Himawari-8/9. Himawari-8 became operational on 7 July 2015 and was replaced by its successor, Himawari-9, on 13 December 2022. The AHI provides a full-disk scan every 10 min with a spatial resolution of 0.5–2 km at the sub-satellite point around 140.7° E. During the data dissemination step, the AHI full-disk imagery is divided into 10 segments from north to south by the Japan Meteorological Agency. The NJIAS HCFD only focuses on Segments 2–4, covering the vast majority of the East Asia and western North Pacific (WNP) regions. Given that the AHI IR channels have coarser spatial resolutions (nominal 2 km) than the Vis and shortwave IR (SWIR) resolutions (nominal 0.5–1 km), data from finer-resolution channels are each aggregated to nominal 2 km resolution.
Clear-sky brightness temperatures (BTs) and transmission profiles for AHI 10 IR channels are simulated by using the Community Radiative Transfer Model (CRTM) version 2.2.3 (Han et al., 2007) with the vertical profiles of pressure, temperature, water vapor, and composition, as well as surface variables of surface skin temperature and 10 m wind, from the US National Centers for Environmental Prediction (NCEP) final operational global (FNL) analyses (Kalnay et al., 1996) as the input. The NCEP FNL analysis, which has a 0.25° × 0.25° horizontal resolution and a 6 h interval, is remapped to AHI observation times and pixels using a linear interpolation method. Other ancillary data including surface type, terrestrial elevation, and land surface emissivity are extracted from the 1 min land ecosystem classification product (http://modis-atmos.gsfc.nasa.gov/ECOSYSTEM/index.html, last access: 11 March 2016), the global 30 arcsec elevation dataset (http://webmap.ornl.gov/ogcdown/dataset.jsp?ds_id510003, last access: 18 November 2015), and the University of Wisconsin–Madison High Spectral Resolution Emissivity dataset (http://cimss.ssec.wisc.edu/iremis, last access: 8 January 2017), respectively.
Table 1List of output variables.
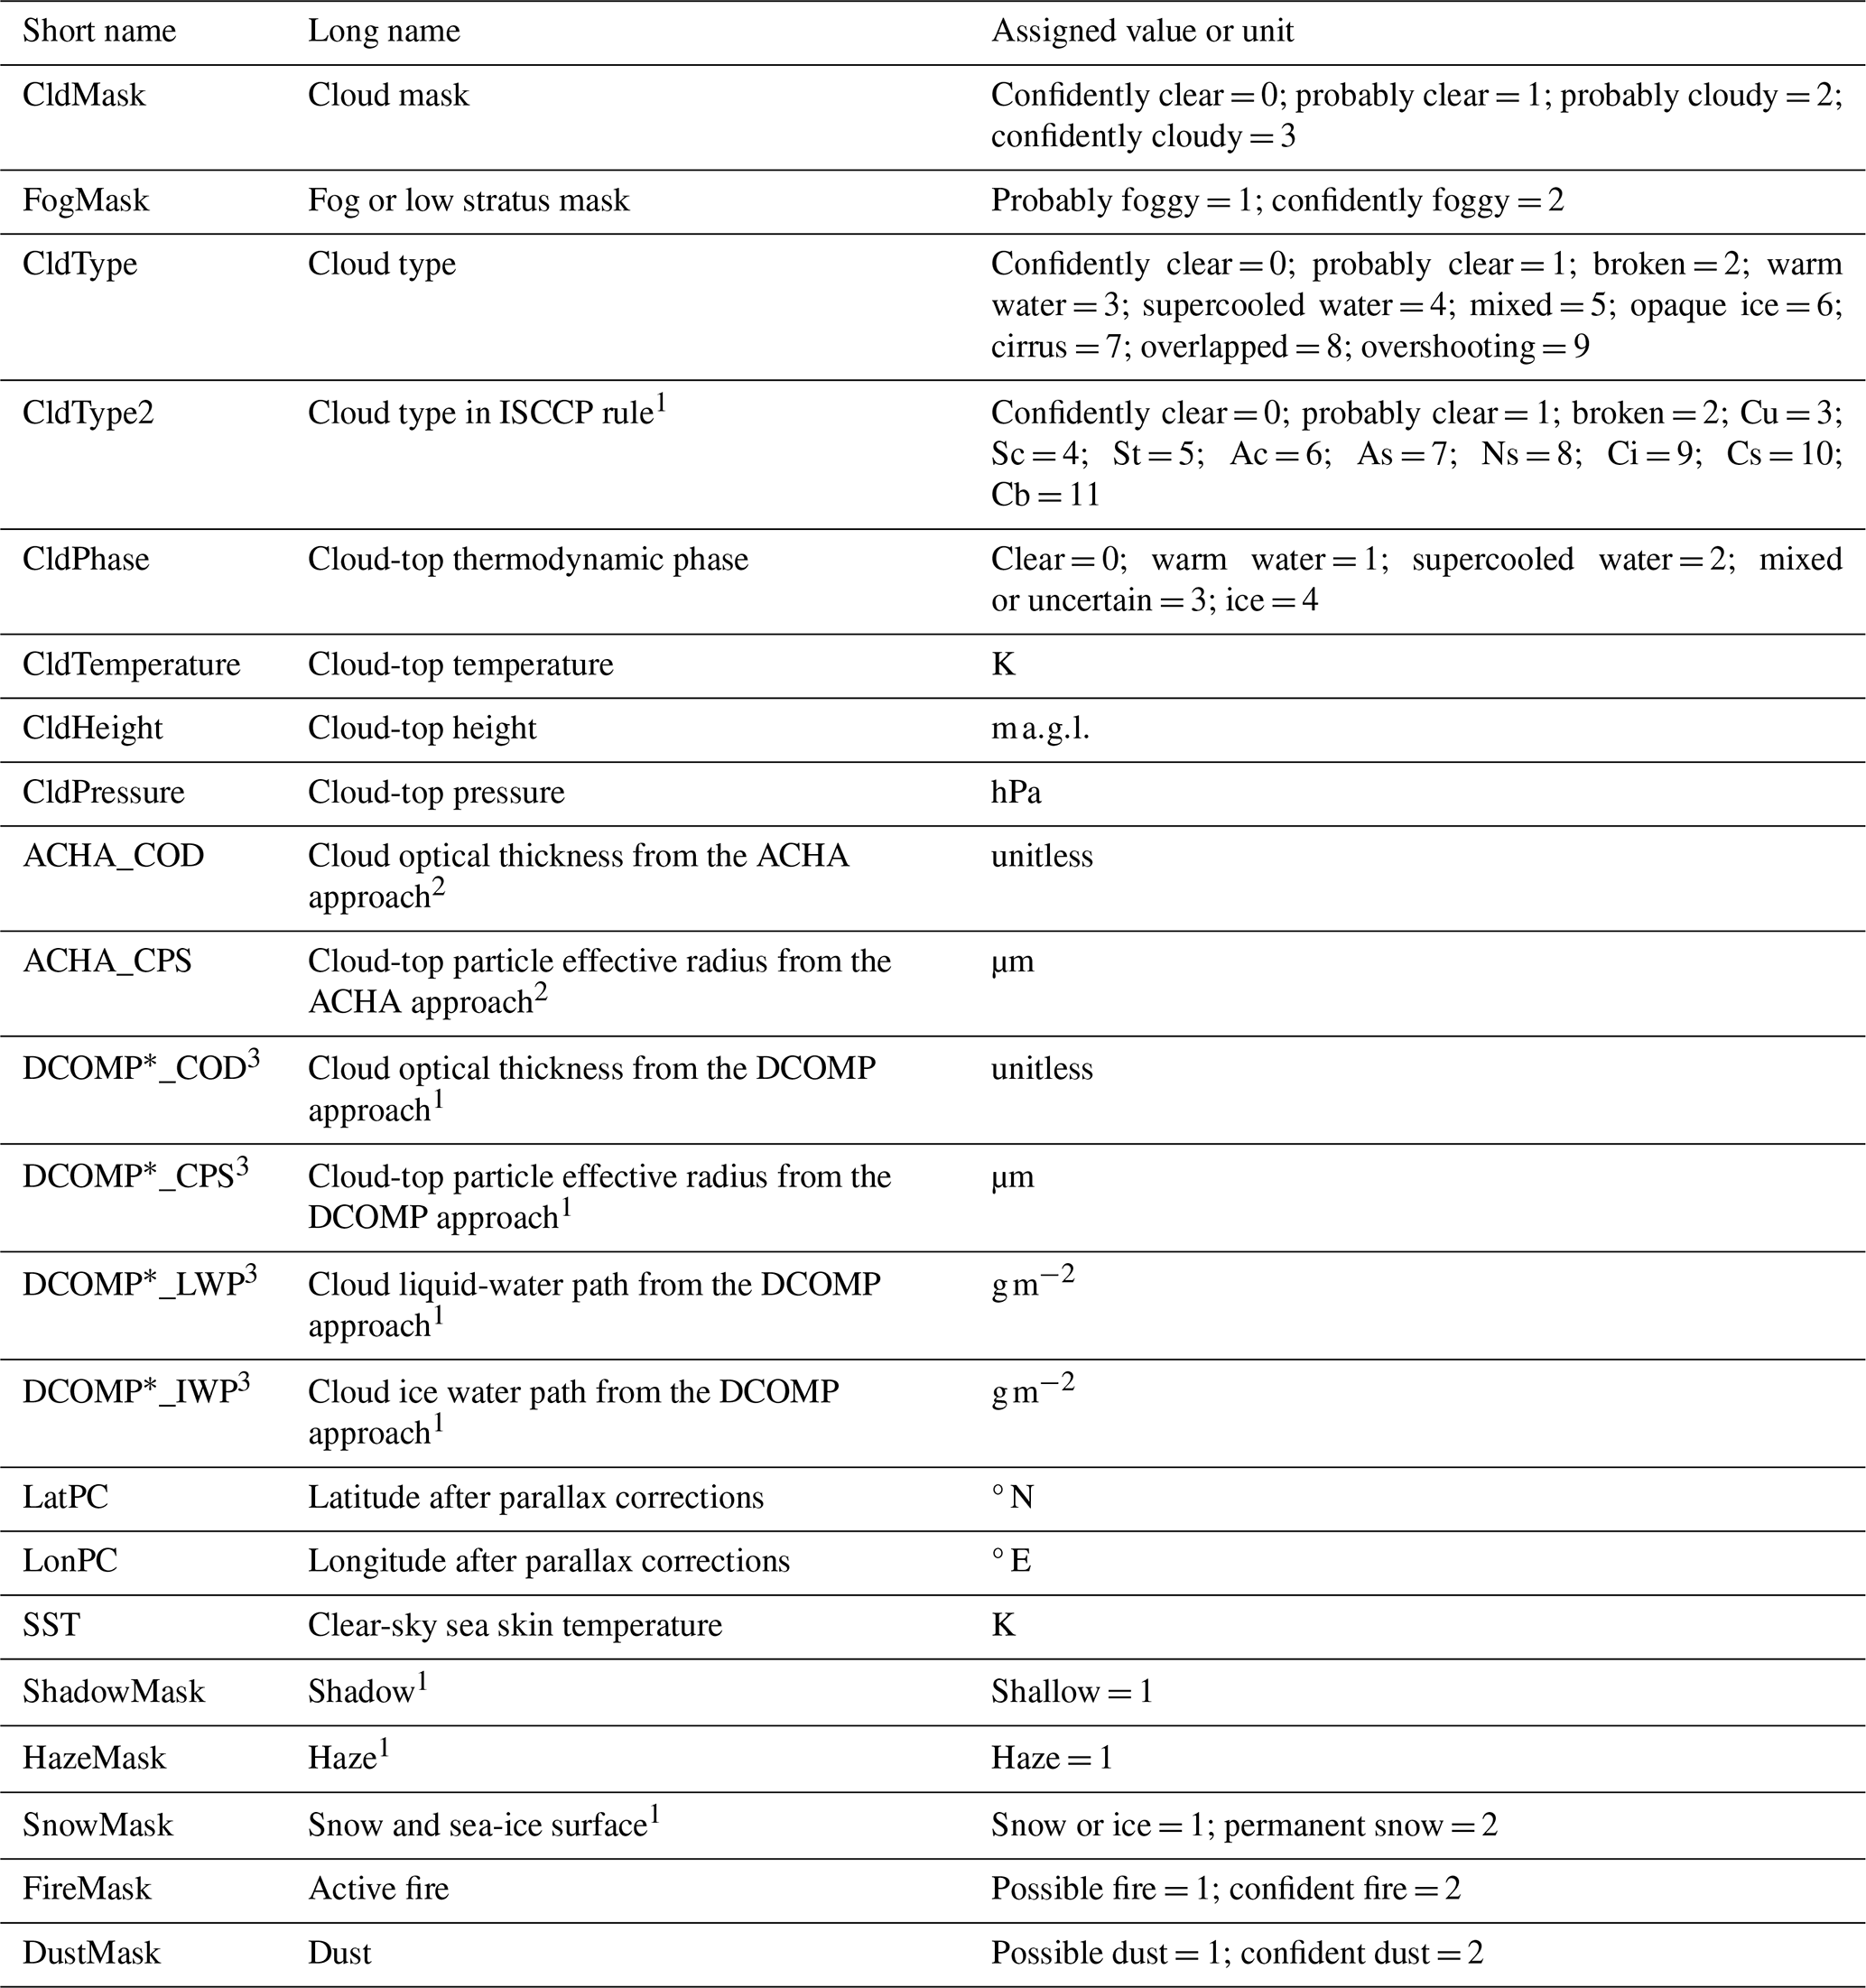
1 Daytime only. 2 Only reliable for cirrus clouds. 3 DCOMP∗ represents DCOMP35, DCOMP36, and DCOMP37, meaning the variables are derived using 0.64 µm and 1.6, 2.3, or 3.9 µm channels, respectively.
2.2 Output variables
The NJIAS HCFD provides a comprehensive description of cloud features over the East Asia and WNP regions. It includes 30 variables, such as cloud mask, cloud optical thickness (τ), cloud-top thermodynamic phase, cloud-top height (CTH), and cloud-top particle effective radius (Re), as well as snow, dust, and haze masks. The 30 output variables are briefly described in Table 1.
2.3 NJIAS cloud retrieval algorithms
During the past 3 years, a number of improvements to the NJIAS cloud retrieval algorithms have been incorporated, which are presented in the following subsections.
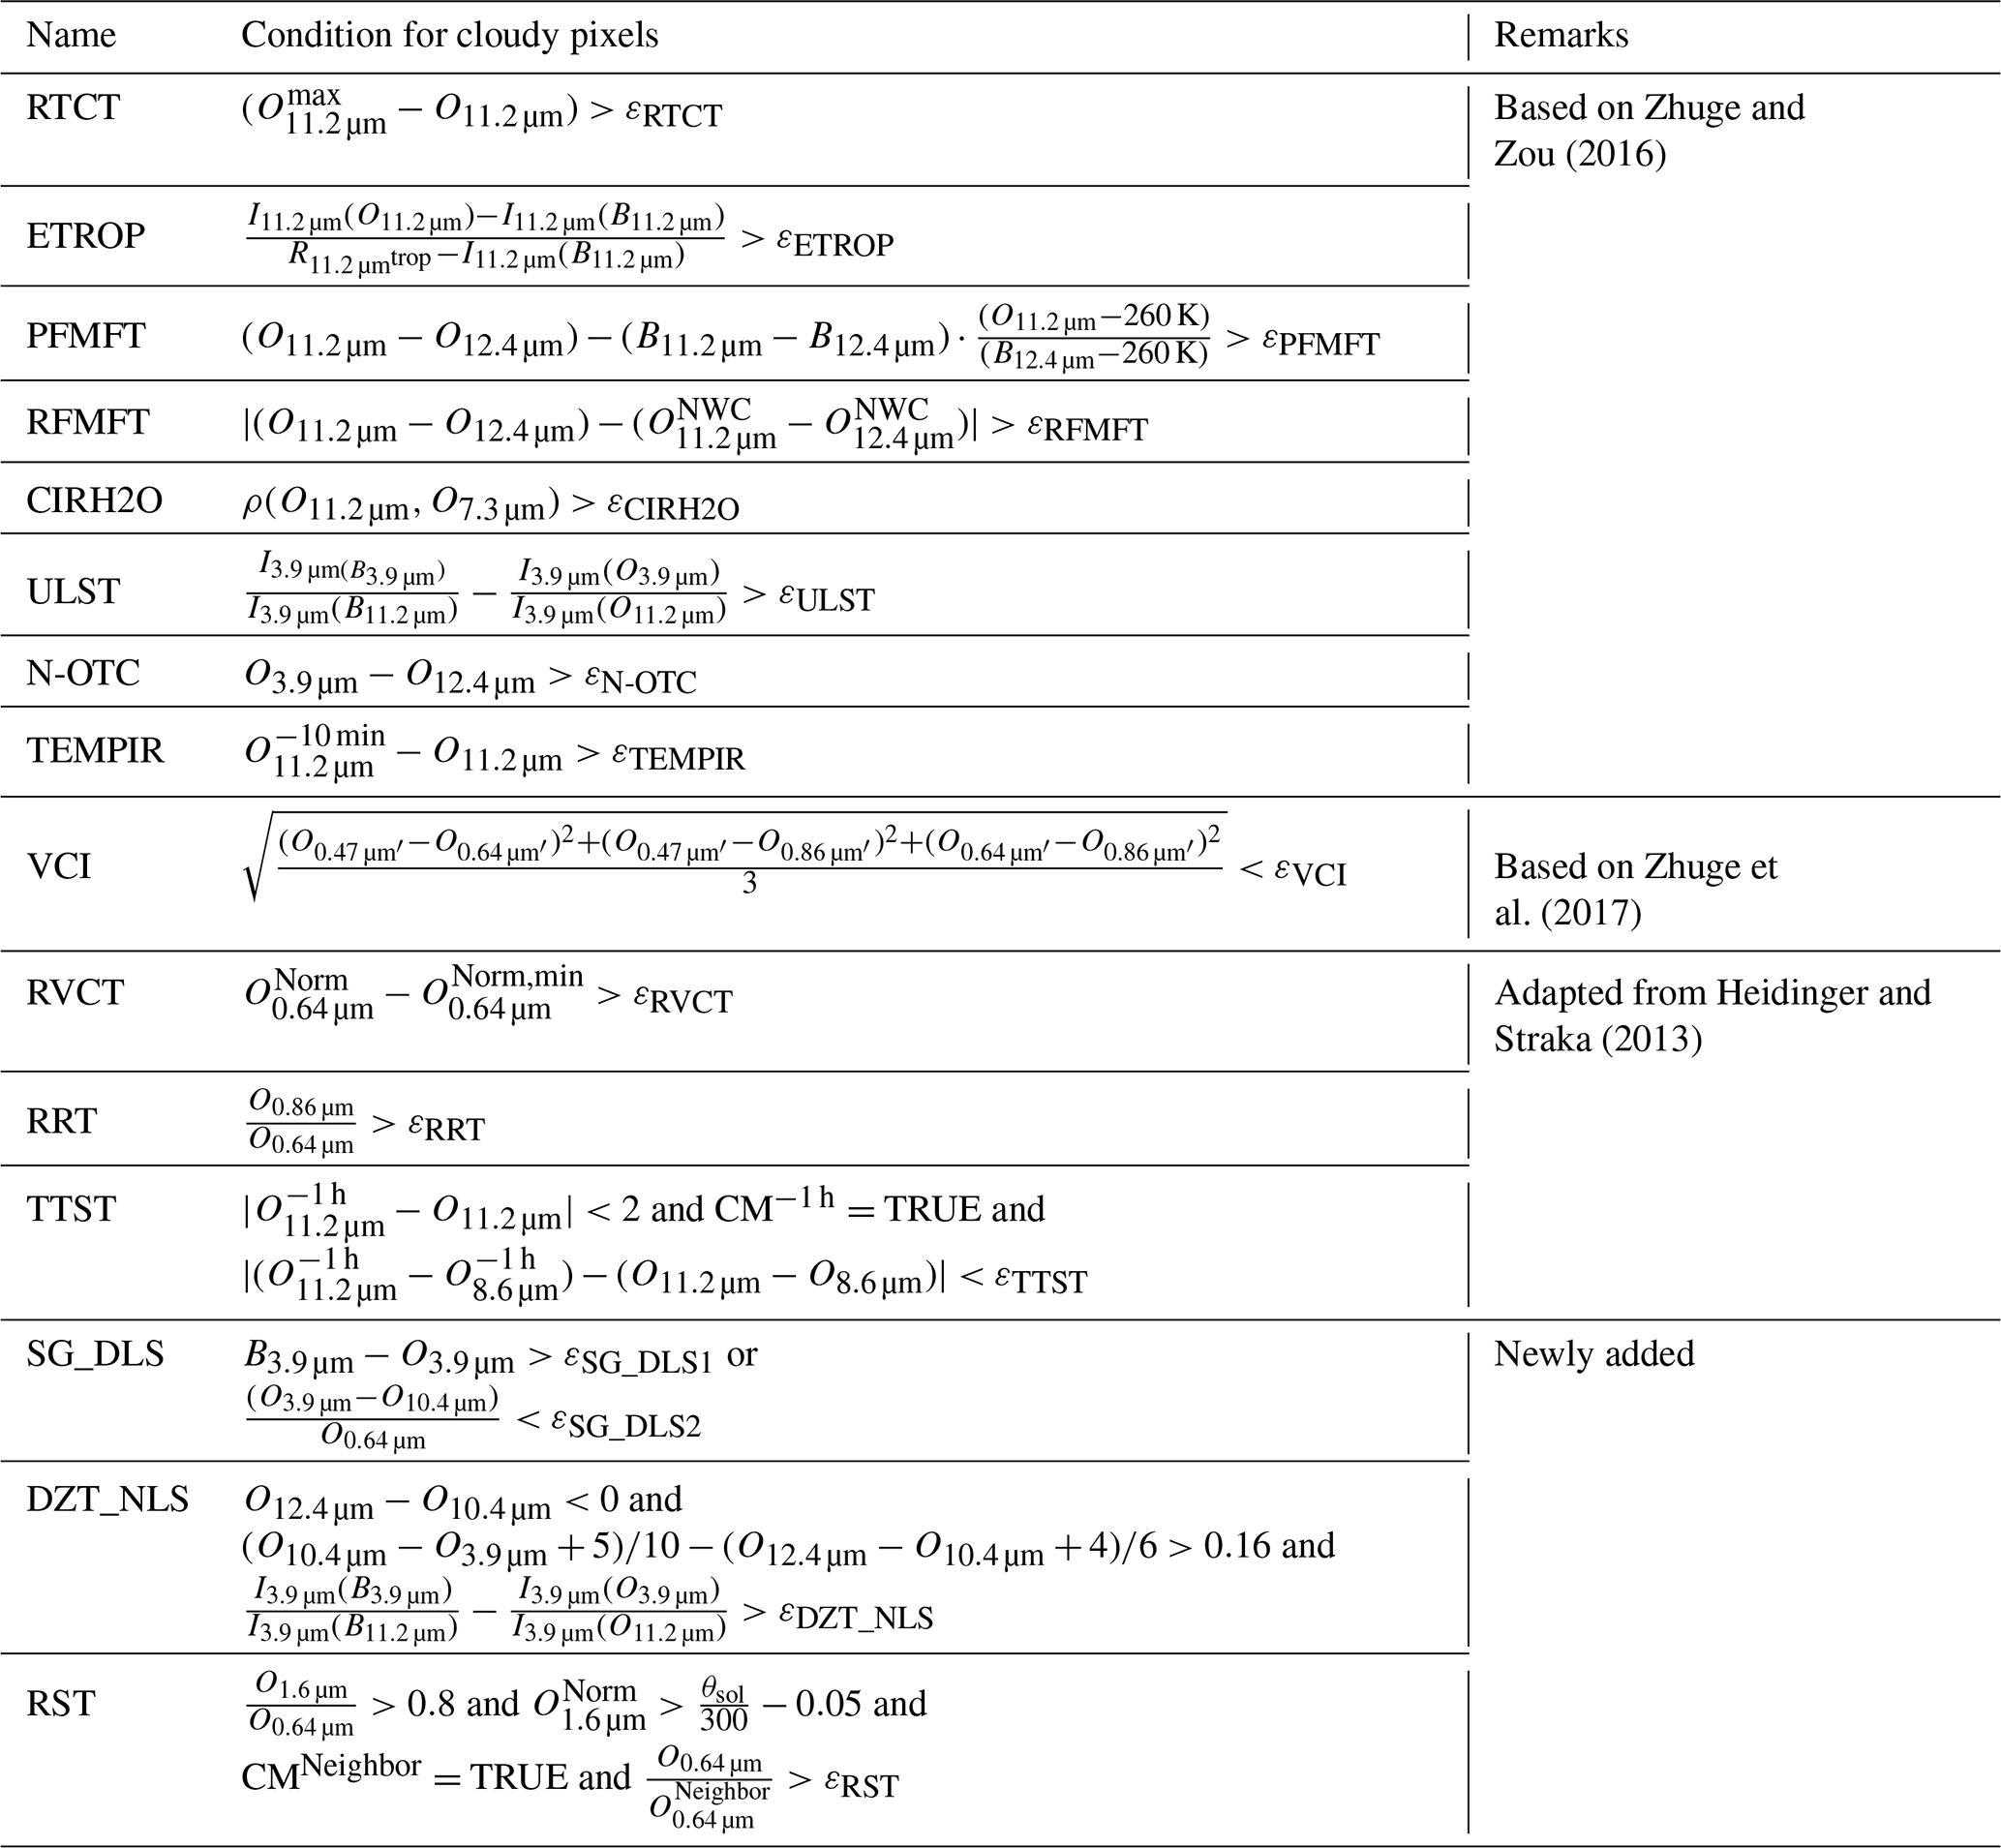
Table 2Names and mathematical formulas for the 15 tests employed by the NJIAS cloud mask algorithm.
2.3.1 Cloud mask algorithm refinements
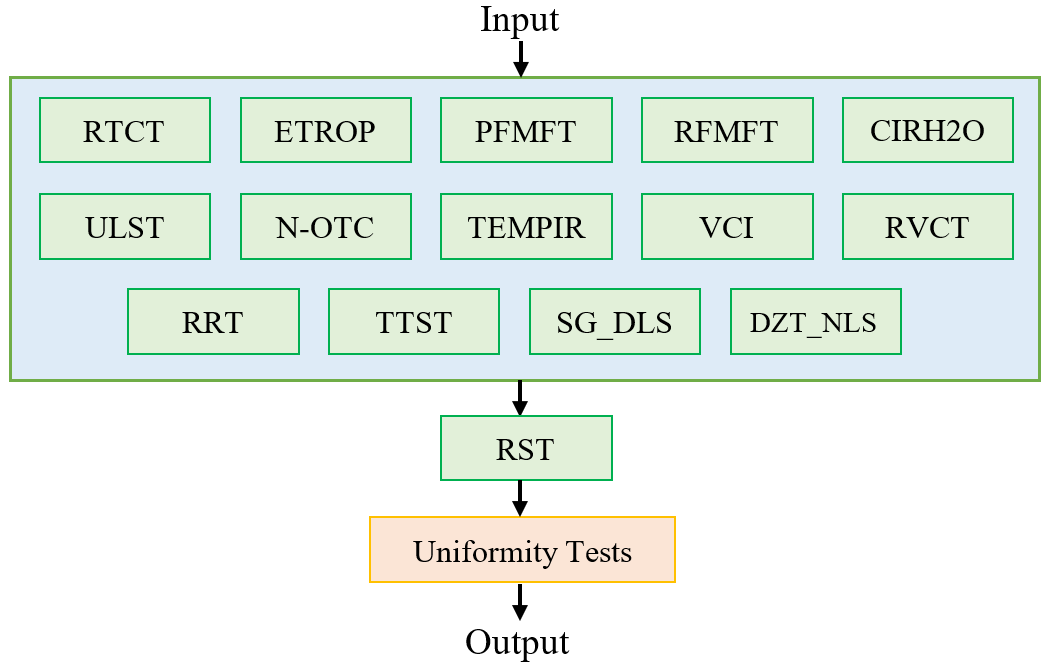
The NJIAS cloud mask algorithm is developed on the basis of two previous works (Zhuge and Zou, 2016; Zhuge et al., 2017). Eight of 10 cloud mask tests used in Zhuge and Zou (2016) and one test used in Zhuge et al. (2017) are inherited. These nine cloud mask tests are called “relative thermal contrast test” (RTCT), “emissivity at tropopause test” (ETROP), “positive channel 14 minus 15 test” (PFMFT), “relative channel 14 minus 15 test” (RFMFT), “cirrus water vapor test” (CIRH2O), “uniform low stratus test” (ULST), “new optically thin cloud test” (N-OTC), “temporal IR test” (TEMPIR), and “Vis-based cloud index test” (VCI). To enhance the detection of low-level clouds, six additional cloud mask tests are employed by the NJIAS algorithm: that is, relative Vis contrast test (RVCT), reflectance ratio test (RRT), terminator thermal stability test (TTST), nighttime low stratus test over desert (DZT_NLS), daytime low stratus test over sunglint regions (SG_DLS), and reflectance similarity test (RST). The mathematical formulas for the aforementioned 15 cloud mask tests are listed in Table 2. Note that Ox µm is the observed BT or reflectance at x µm wavelength, Bx µm is the simulated x µm BT under clear-sky conditions, and Ix µm(T) represents the radiance at temperature T and x µm wavelength that is computed by the Planck function. The threshold (ε) for a certain test is generally derived via a comparison of co-located AHI or ABI with CALIOP data (Zhuge and Zou, 2016; Zhuge et al., 2017). The flowchart of the NJIAS cloud mask algorithm is shown in Fig. 1.
For cloud detection over sunglint regions, SG_DLS assumes that sea surface reflectance is greater than that of clouds. Thus, the 3.9 µm BTs over cloudy areas should be lower than those of model simulations under clear-sky conditions. SG_DLS also compares the reflectance between 3.9 and 0.64 µm channels by simply using the formula , and marks those pixels as cloudy where the reflectance in the 3.9 µm channel is significantly weaker compared to that in the 0.64 µm channel. During nighttime, the low-level clouds and clear-sky desert have very similar characteristics of 3.9 µm emissivity. Relative to ULST, DZT_NLS employs two extra criteria ( and ) so that the clear-sky desert pixels would not be falsely flagged as cloudy.
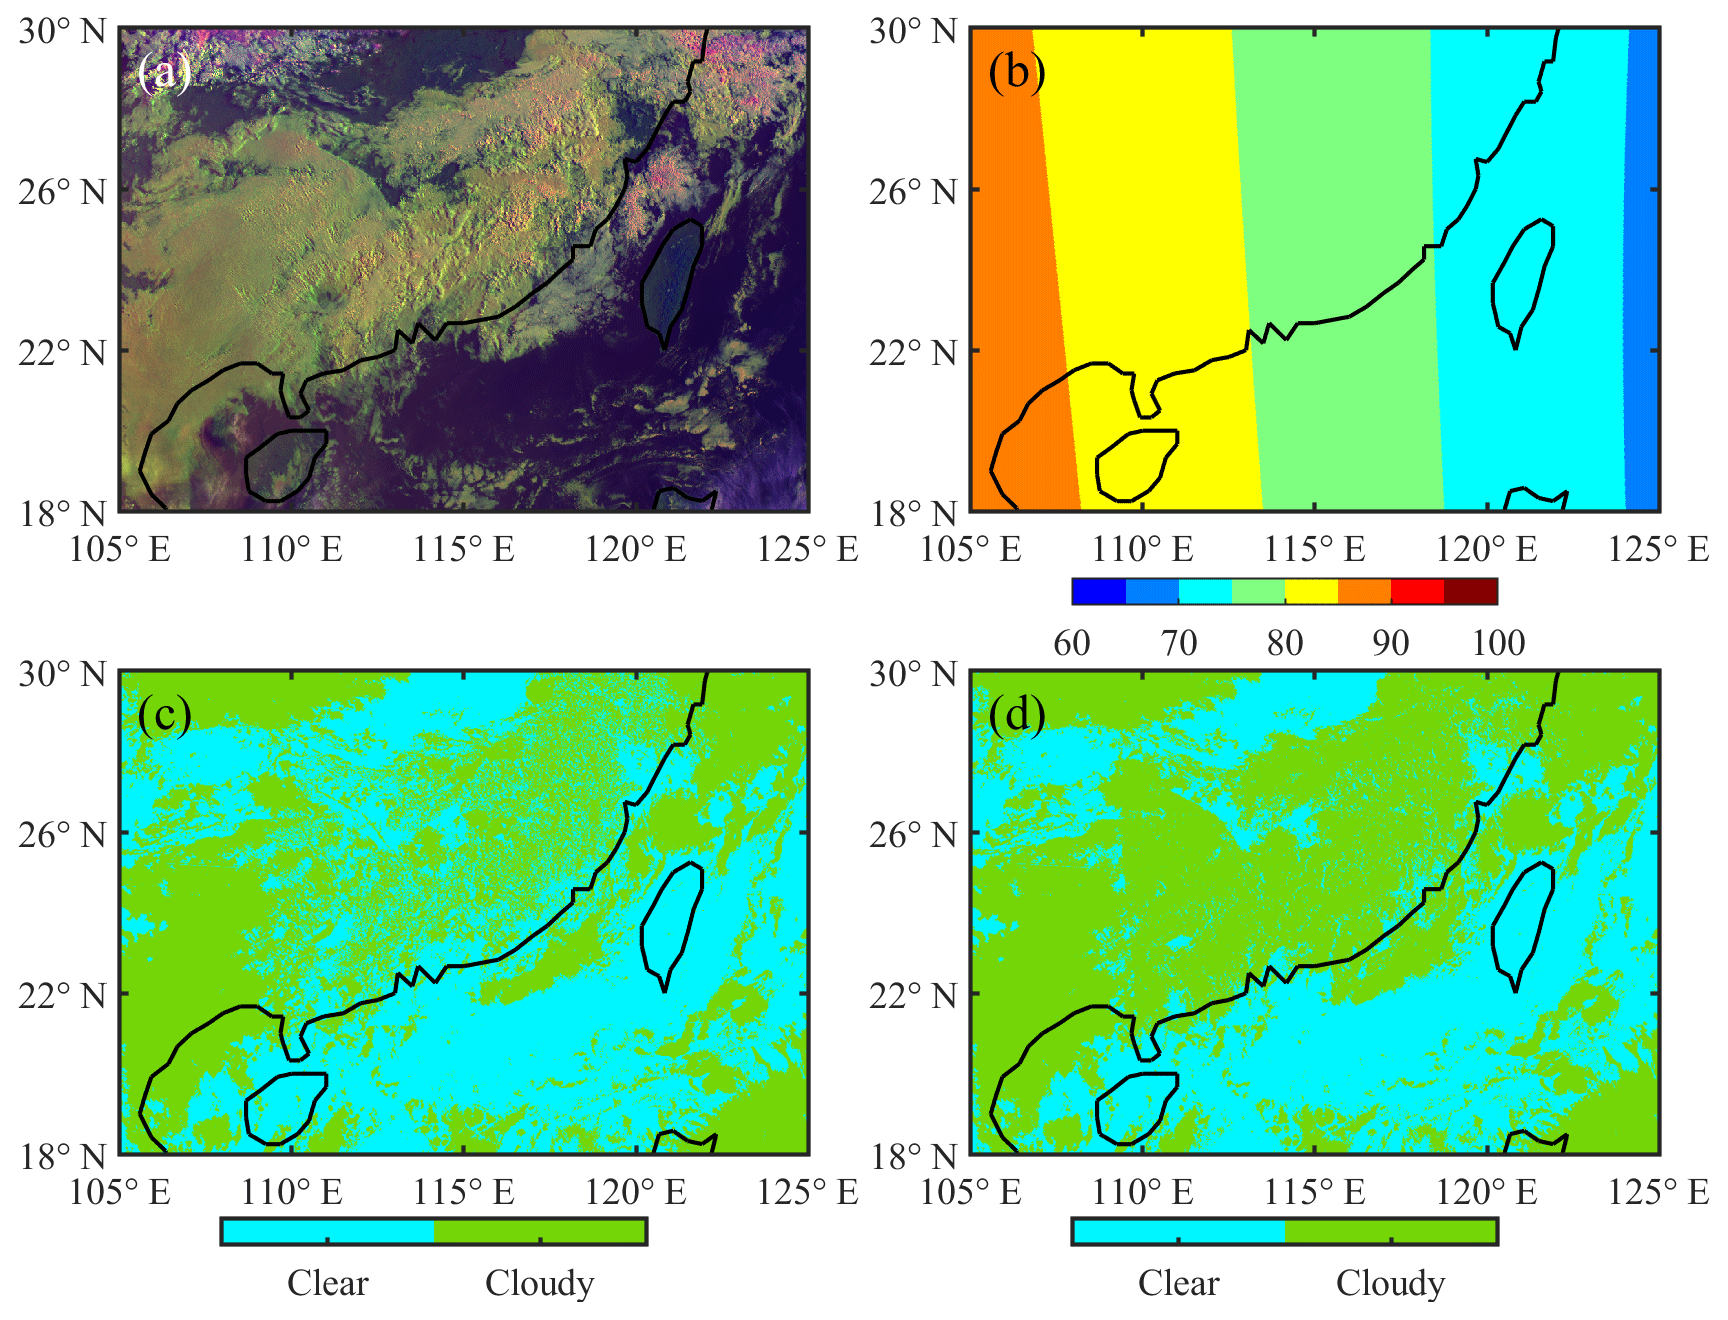
Figure 2(a) AHI false-color image (red, 0.64 µm; green, 1.6 µm; blue, 11.2 µm reversed) showing land or ocean in black, thick ice clouds in magenta, cirrus in blue, and low clouds in yellow or white. (b) Solar zenith angle (unit: degree). (c, d) Cloud mask results (c) without and (d) with RST at 23:00 UTC on 10 April 2023.
Detection of low-level clouds at high solar zenith angles is challenging since the Vis reflectance becomes very sensitive to aerosol and noise. To mitigate the labeling of haze pixels as cloudy, VCI and RRT were slightly modified. The pixels should first satisfy two basic conditions ( and ) before they can proceed to the next step. Here, θsol is the solar zenith angle in degrees and is the 1.6 µm reflectance normalized by the cosine of θsol. Moreover, given that the three existing reflectance-based tests (i.e., VCI, RVCT, and RRT) are not as effective as at noon, TTST and RST are incorporated into the NJIAS cloud mask algorithm to improve cloud detection at high solar zenith angles. As described by Heidinger and Straka (2013), TTST classifies a pixel as cloudy if its IR spectral signatures are similar to those of a cloudy pixel that was detected at the same location 1 h ago. RST is a completely new cloud mask test, being specifically utilized for pixels with a solar zenith angle between 60 and 83°. The RST is implemented subsequent to the preliminary cloud mask determination derived from the other 14 tests. The objective of RST is to spatially extend the initial cloud “seeds” to their neighboring pixels that exhibit similar reflectance characteristics. Again, these candidate cloudy pixels should first satisfy non-haze conditions ( and ). Figure 2 illustrates the utility of incorporating the RST for low-level cloud detection in the early morning. The scene occurred at 23:00 UTC on 10 April 2023, when a vast expanse of quasi-stationary cloud belts was located over southern China. When detecting clouds without RST, a lot of foggy and/or stratus pixels were missed, and thus the identified cloud belts were fragmented (Fig. 2c). Cloud mask results with RST are much more reasonable (Fig. 2d).
Like other cloud mask algorithms, the NJIAS algorithm also generates a four-level mask whose categories are confidently clear, probably clear, probably cloudy, and confidently cloudy. Probably clear pixels are defined as those failing the uniformity tests, and probably cloudy pixels are those located at cloud edges.
2.3.2 Newly added snow, dust, and haze mask algorithms
The snow mask is an important procedure implemented before the cloud mask. In the NJIAS algorithm, pixels that satisfy one of the following three conditions are first identified as snow candidates: (1) they are over oceans with surface temperature analyses being lower than 263 K; (2) the underlying surface type is “permanent snow”; and (3) both the normalized differential snow index (NDSI; ) and the enhanced NDSI () are larger than 0.1, while the normalized differential vegetation index () is larger than −0.1. A series of strict tests are then performed to rule out the candidates presenting unique spectral characteristics of ice clouds (e.g., mobile, more apparent on the water vapor images, much colder than the surface). However, the pixels that have an NDSI value greater than 0.1 and were classified as snow 1 h ago would be restored to snow again.
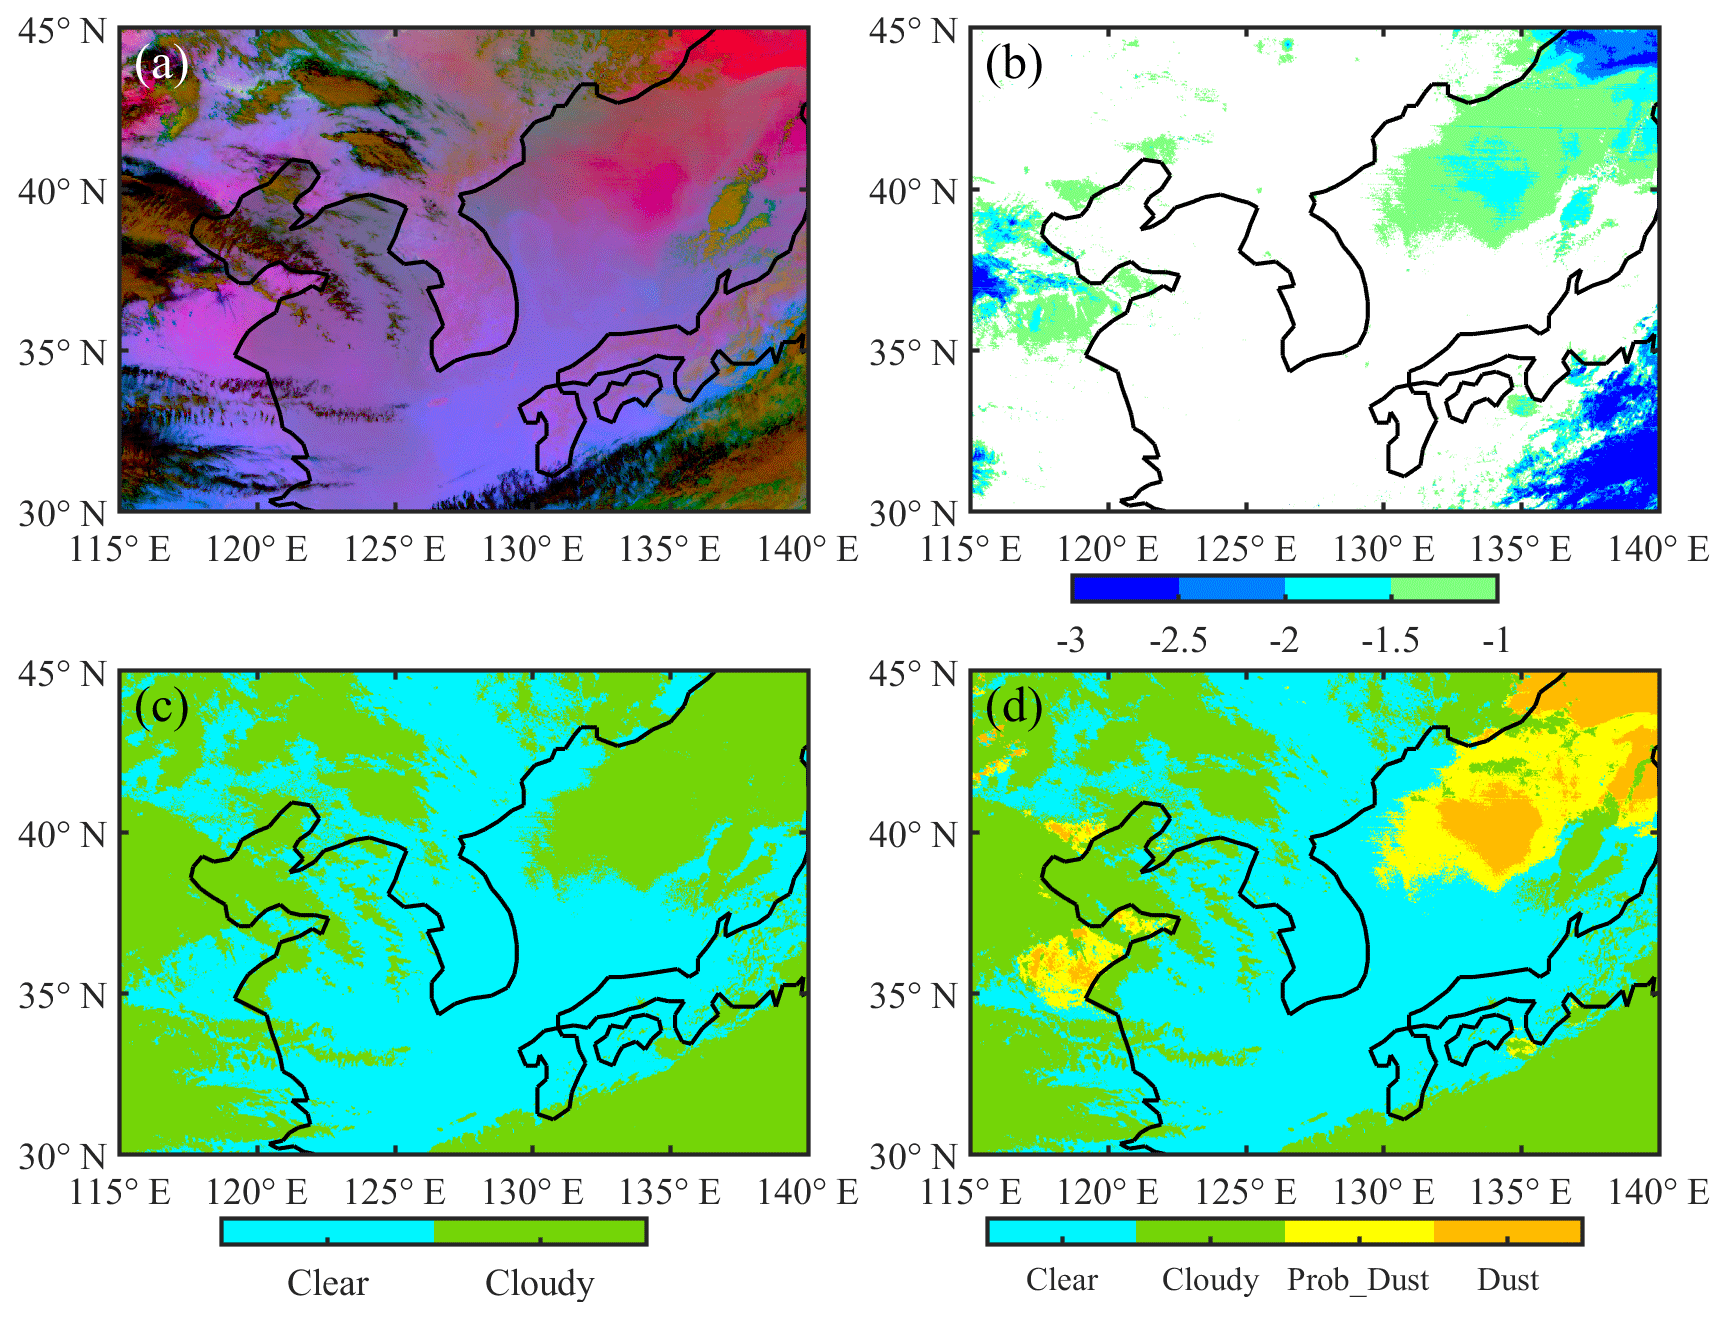
Figure 3(a) AHI “dust” RGB composite image (dust in pinkish color) and (b) NFMFT value (unit: K), with (c, d) cloud mask results derived from (c) old and (d) new versions of the NJIAS cloud algorithms at 09:00 UTC on 12 April 2023.
In the old version of the NJIAS cloud mask algorithm, dust was often identified as cloudy, especially when transported over oceans. A remarkable example of this occurred at 09:00 UTC on 12 April 2023 (Fig. 3). The poor performance is primarily a result of using the negative channel 14 minus 15 test (NFMFT) that was originally applied to detect opaque clouds. In fact, the dust can generate an NFMFT value () as great as the opaque clouds, as shown in Fig. 3b. Now, NFMFT is removed from the NJIAS cloud mask algorithm but added to the NJIAS dust mask algorithm, which originally included an empirically developed dust mask test based on the principle used by the “dust” RGB composite images (Lensky and Rosenfeld, 2008). The dust mask is implemented after the cloud mask. Accordingly, cloud mask results derived from the NJIAS cloud algorithms are improved (Fig. 3d).
Similar consideration is applied to haze detection. The reflectance gross contrast test (RGCT) that was employed by various cloud mask algorithms is added to the haze mask algorithm. RGCT works on the assumption that clouds have larger 0.64 µm reflectance than clear sky, which is also true for haze. The original haze mask algorithm only included a heavy aerosol test – Test 1 in Hutchison et al. (2008), assuming that haze is transparent at the 2.3 µm wavelength but more reflective at the 0.64 µm wavelength.
2.3.3 Updates to the cloud-top property algorithm
The NJIAS cloud height algorithm mainly follows the architecture of the ABI Cloud Height Algorithm (ACHA; Heidinger, 2012). It derives cloud-top temperature (CTT), CTH, cloud-top pressure (CTP), τ, and Re with a consistent accuracy for day and night. Note that τ and Re from the ACHA approach are only reliable for cirrus clouds because the longwave IR observations cannot provide the desired sensitivity to cloud microphysics for optically thick clouds. Besides, the CTH in the NJIAS algorithm is measured above ground level (), i.e., true altitude minus terrain elevation, which is different from the definition used in the MYD06 algorithm and the ACHA.
The NJIAS IR cloud-top phase algorithm is developed based on Zhuge et al. (2021a). It categorizes cloudy tops into liquid-water, ice, and mixed or uncertain phases by employing the IR window and IR water vapor channels as well as several spectral and spatial tests. The liquid-water phase is further refined into being either supercooled water or warm water, depending on whether the CTT is below 0 °C or not. Ice-phase cloud tops are further divided into opaque-ice, cirrus, overlapped, and overshooting tops according to the results of the BT-based cirrus test, a beta-parameter-based overlap test, and a cloud-emissivity-based overshooting test (Platnick et al., 2019). In addition, a new cloud type named “broken” is defined for cirrus pixels which are located at cloud edges (i.e., cloud mask value of 2).
A pixel will be identified as probably foggy if it is in liquid-water phase and the spatial uniformity (i.e., the standard deviation of 11.2 µm BTs) over a 3 pixel × 3 pixel array is below 0.5 K. At the same time, the 11.2 µm BT difference between satellite observations and model simulations (OMB) should be less negative than −10 (−15) K over land during daytime (nighttime) or −6 K over oceans all day. Subsequently, confidently foggy pixels are distinguished from probably foggy pixels if they have been classified as confidently cloudy and their spatial uniformity is below 0.3 K.
2.3.4 Updates to the DCOMP algorithm
Like Zhuge et al. (2021b), the NJIAS DCOMP algorithm uses the bispectral method described by Nakajima and King (1990) in the daytime τ and Re retrievals. Three pairs of non-absorption and water-absorption channels at Vis, SWIR, and mid-wave IR wavelengths are employed to separately derive three DCOMP products (designated as DCOMP35, DCOMP36, and DCOMP37, meaning a combination of 0.64 µm and 1.6 , 2.3, or 3.9 µm channels, respectively). The NJIAS DCOMP algorithm utilizes parameterization schemes and retrieval procedures that are nearly consistent with those used in Zhuge et al. (2021b) except for the lookup tables (LUTs).
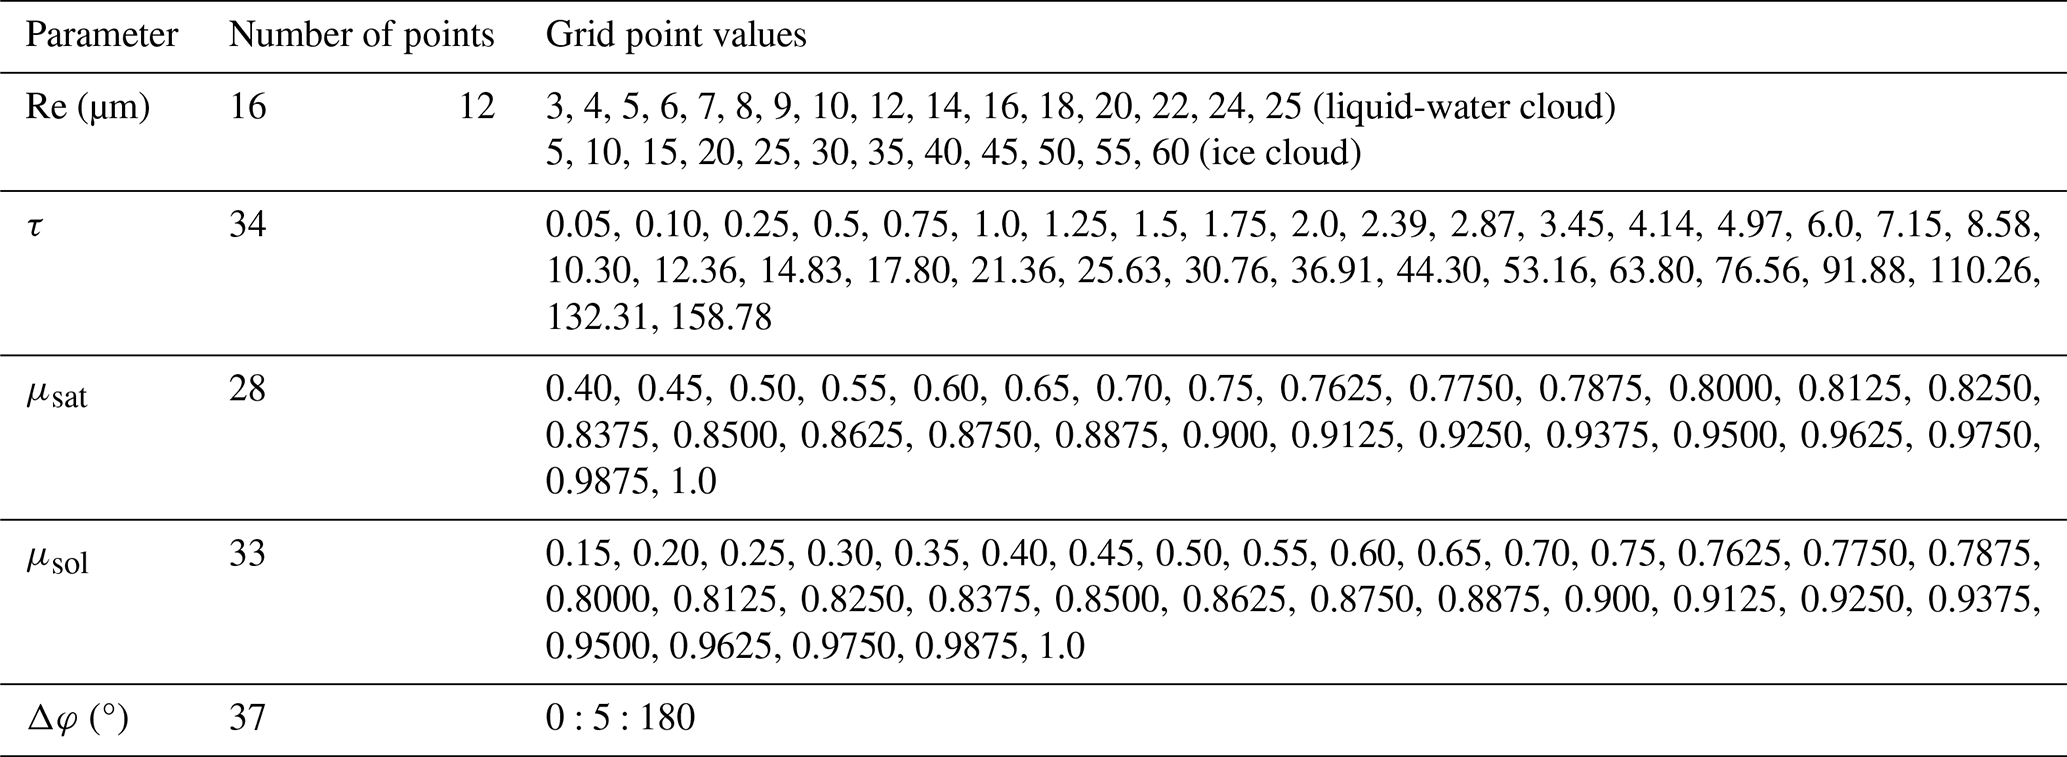
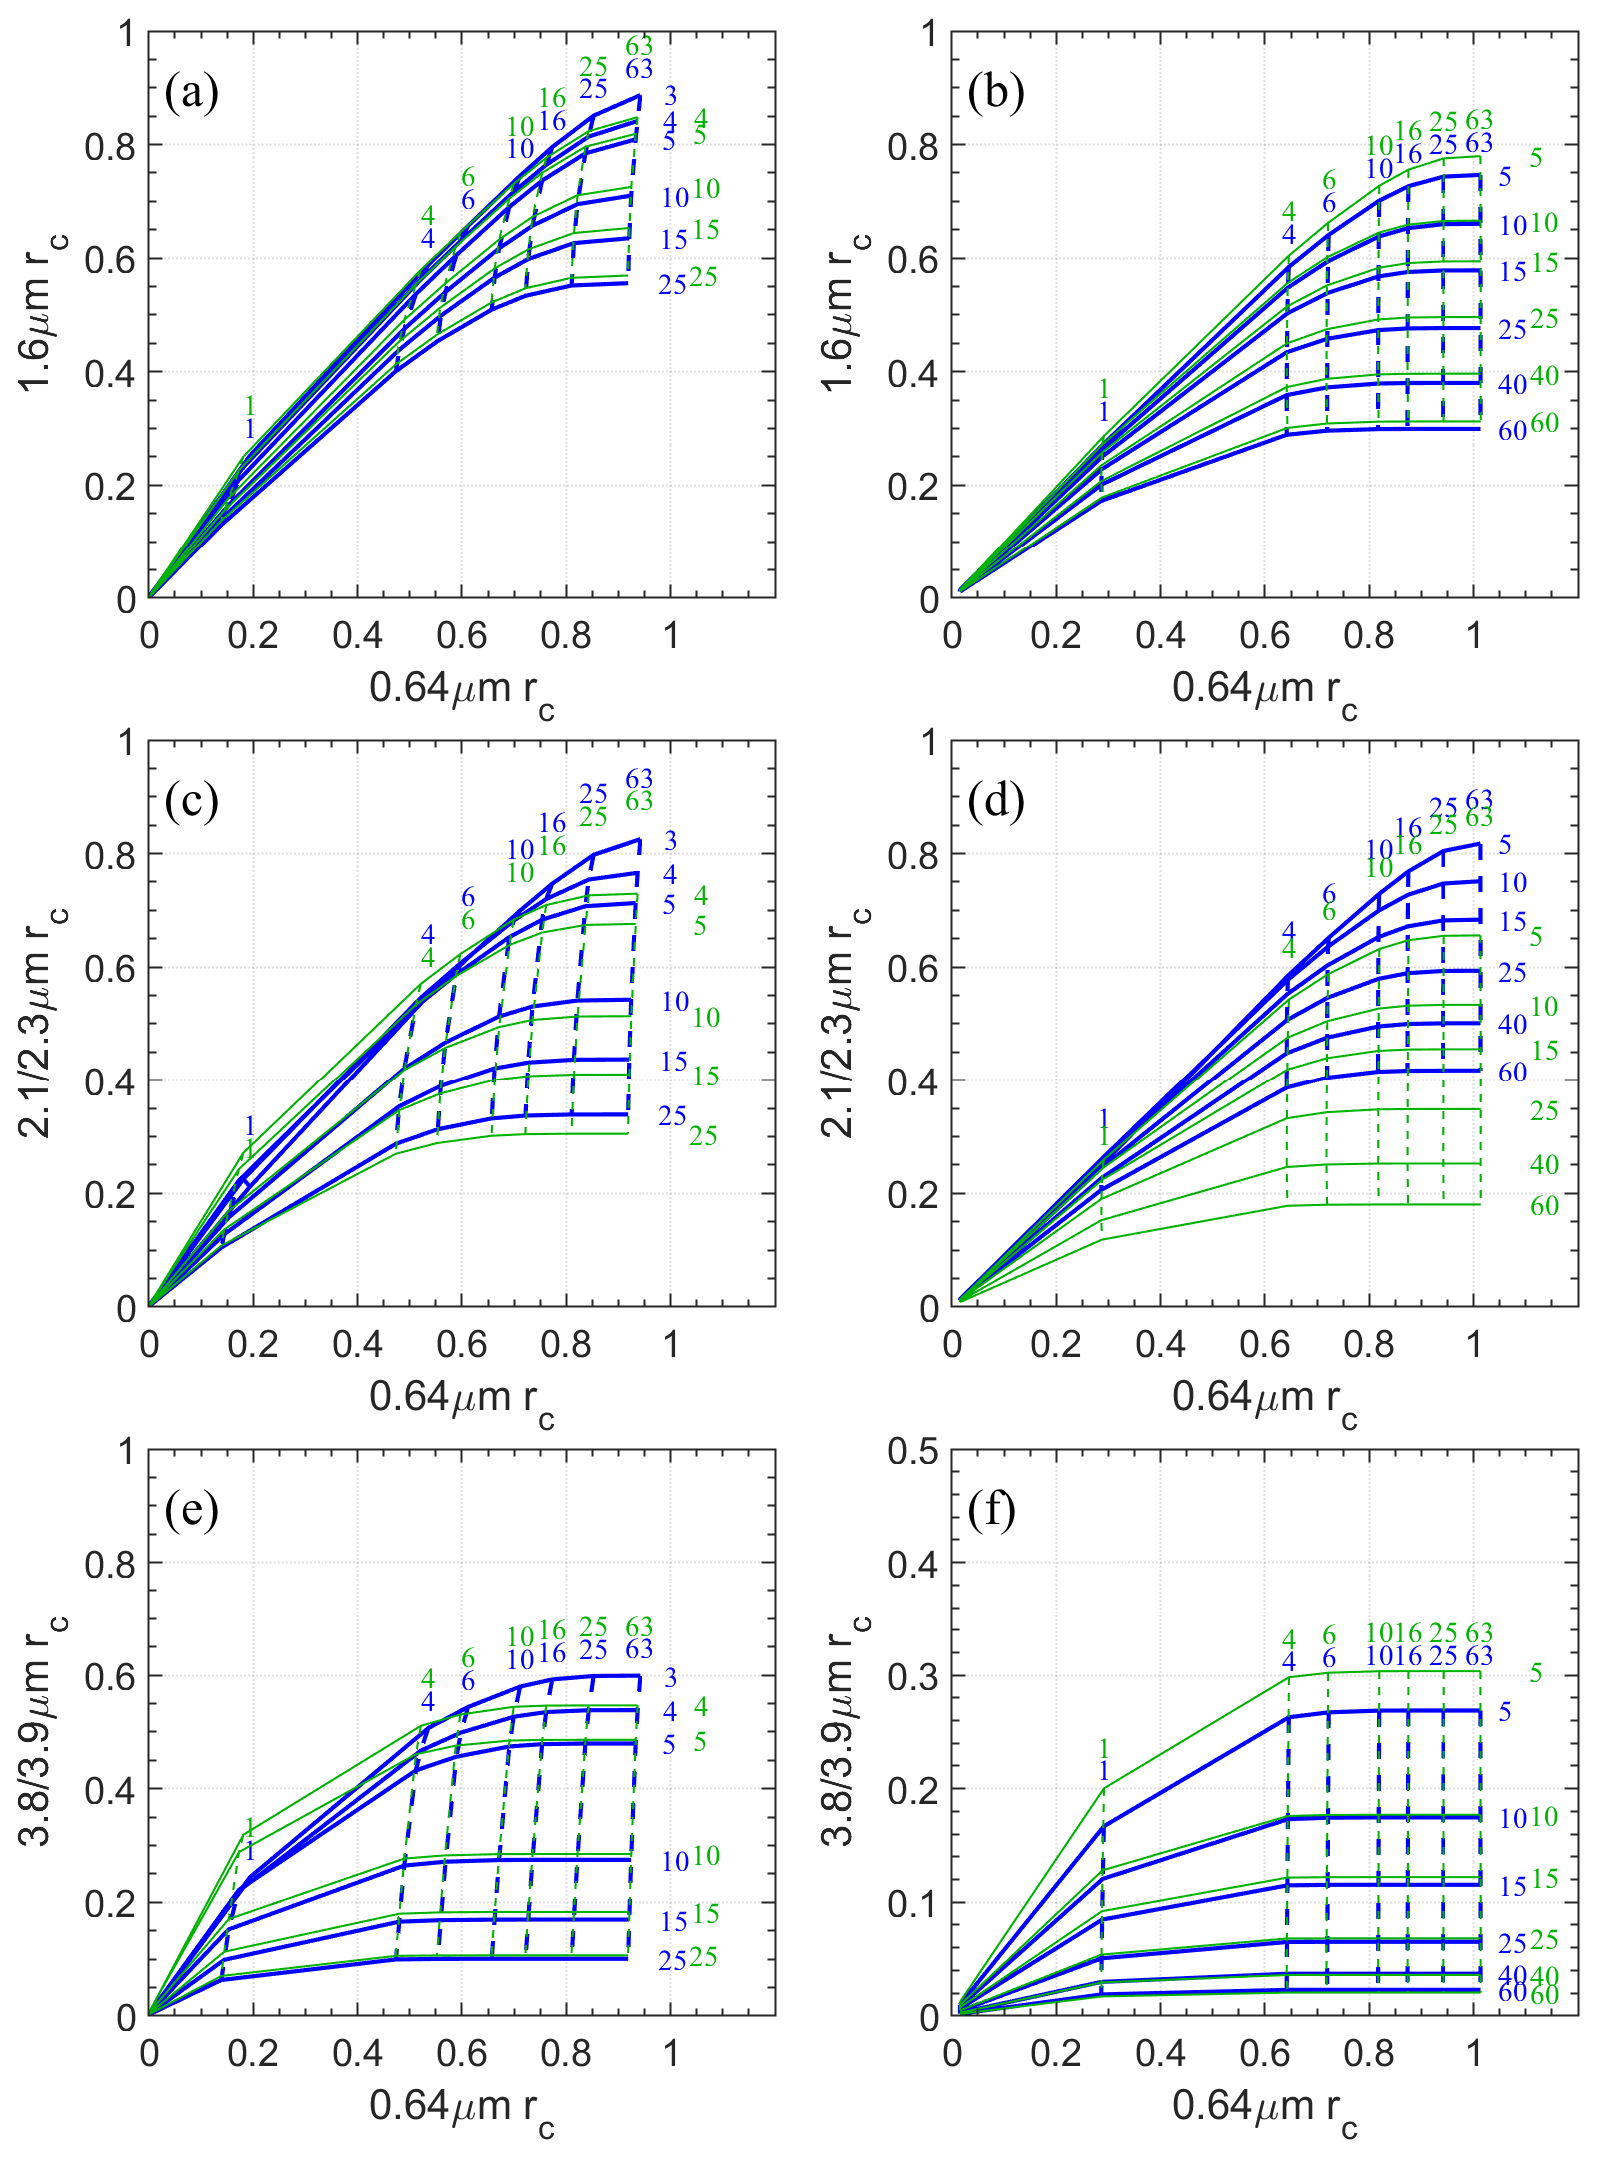
Figure 4Variations of rc at 0.64 µm and 1.6 (a, b), ∼ 2.2 (c, d), or ∼ 3.8 µm (e, f) for Re = 3, 4, 5, 10, 15, and 25 µm (solid curve) and τ = 1, 4, 6, 10, 16, 25, and 63 (dashed curve) for liquid-water phase (a, c, e) as well as for Re = 5, 10, 15, 25, 40, and 60 µm (solid curve) and τ = 1, 4, 6, 10, 16, 25, and 63 (dashed curve) for ice phase (b, d, f) from Collection 6.1 MYD06 (green) and NJIAS (blue) datasets when μsol=μsat = 0.5 and Δφ = 60°.
Forward radiative transfer calculations for the LUTs were performed with the discrete ordinate radiative transfer (DISORT) model implemented in libRadTran 2.0.3 (Mayer and Kylling, 2005; Emde et al., 2016). The atmospheric temperature and humidity profile is the US Standard Atmosphere, and the absorption or scattering by air molecules or aerosols is neglected. The cloud layer is assumed to be 1 km thick and placed at an altitude of 5 km above a non-reflecting surface. The bulk single-scattering properties of clouds are considered separately for liquid-water and ice clouds. For liquid-water clouds, the scattering properties of water droplets are computed from the Lorenz–Mie theory, assuming a gamma size distribution. For ice clouds, a scattering parameterization named “Baum_v36” (Heymsfield et al., 2013; Yang et al., 2013; Baum et al., 2014) with an ice crystal habit of a severely roughened aggregated column is used. The water droplet and ice crystal assumptions are identical to those in the Collection 6.1 MYD06 algorithm. The final LUTs of cloud emissivity, reflectance, and transmissions as well as the spherical albedo are functions of Re, τ, the cosine of satellite zenith angle (μsat), the cosine of solar zenith angle (μsol), and the relative azimuth angle (Δφ). Table 3 summarizes the grid point values for Re, τ, μsat, μsol, and Δφ used in constructing the LUTs. Figure 4 shows visualizations of cloud reflectance (rc) at 0.64 µm and 1.6, ∼ 2.2, or ∼ 3.8 µm for liquid-water and ice clouds for an arbitrarily chosen solar-viewing geometry. Green and blue curves are the LUTs used by the Collection 6.1 MYD06 and NJIAS algorithms, respectively. Relative to the pairs of 0.64 and 1.6 µm channels and 0.64 and ∼ 3.8 µm channels, the pair of 0.64 and ∼ 2.2 µm channels has a noticeable difference in the LUTs of rc between the MYD06 and NJIAS algorithms. The 2.3 µm rc values of the NJIAS LUTs are systematically larger than the 2.1 µm rc values of the MYD06 LUTs when the τ, Re, and solar-viewing geometry are the same. This characteristic is especially significant for ice clouds.
Once τ and Re are determined, these two retrievals are used to calculate the total mass of water in a cloud column, known as “liquid-water path” (LWP) and “ice water path” (IWP) for liquid-water and ice clouds, respectively. Assuming a vertical homogeneity of cloud, the LWP (IWP) is derived using (Stephens, 1978; Khanal and Wang, 2018), where ρ is the density of liquid water (ice) and Qe is the liquid-water (ice) extinction efficiency. The CTP and τ retrievals are applied to determine cloud types based on the International Satellite Cloud Climatology Project (ISCCP) rule (Rossow and Schiffer, 1999).
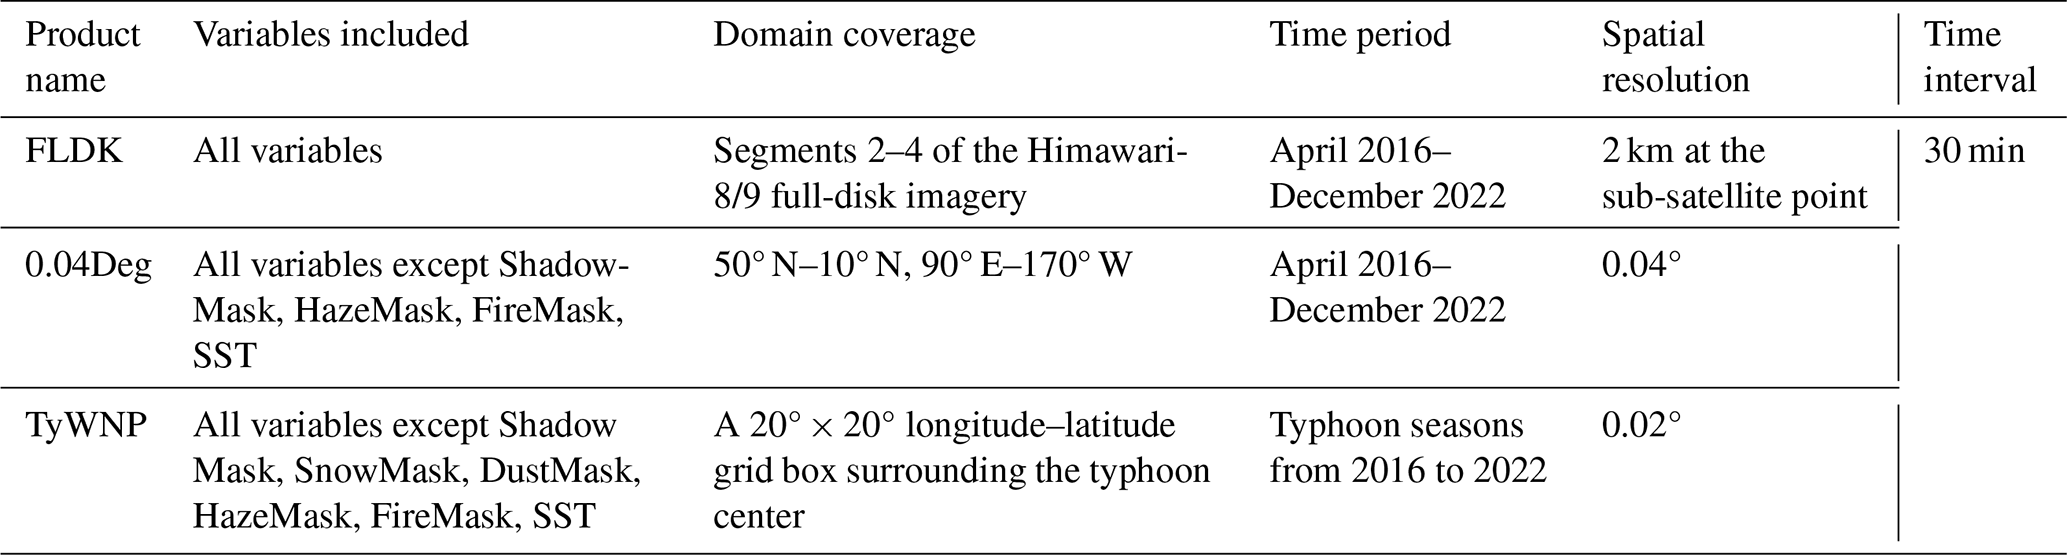
Table 4Brief descriptions of three products of the NJIAS HCFD.
2.4 Cloud products
Currently, the NJIAS HCFD has three cloud products, namely, FLDK (for Segments 2–4 of the full-disk imagery), 0.04 Deg (on regular latitude–longitude grids at 0.04° × 0.04° resolution), and TyWNP (for WNP Typhoons). The 0.04 Deg and TyWNP products can be directly derived from the FLDK product via projection conversion using the nearest-neighbor approach. For the TyWNP product, the typhoon center positions are determined by the tropical cyclone red–green–blue (TC-RGB) composites, as introduced in Chen et al. (2022). Table 4 lists the coverage and resolution in space and time for two products. A finer resolution would retain more clouds of ∼ 2 km size. Users can select any of the three cloud products appropriate for their purpose.
In this section, results obtained by the NJIAS cloud mask and cloud-top property algorithms are objectively evaluated at the nominal 2 km pixel level against the CALIOP 1 km cloud layer products of version 4.20 (Avery et al., 2020) for the whole year of 2017. Because the CALIOP and AHI operate under different sampling schemes, only those AHI pixels with which the CALIOP cloud identification results are in complete agreement are retained. The temporal difference between CALIOP and AHI observations is limited to ± 5 min. The Collection 6.1 MYD06 and JAXA cloud products are also evaluated against CALIOP data to compare the performance of NJIAS HCFD with these two existing cloud feature datasets. The values at the MYD06 or JAXA grids that are spatiotemporally nearest to the CALIOP columns are used.
The Collection 6.1 MYD06 dataset is employed to evaluate the NJIAS DCOMP retrievals. Similar to the co-location between the CALIOP and AHI pixels, all of the MODIS pixels within one AHI pixel shall have a consistent phase; otherwise, this MODIS-AHI data pair will not be included. For those pairs that are retained, the retrievals of MODIS pixels within each matched AHI pixel are averaged first before the comparison with the AHI retrievals.
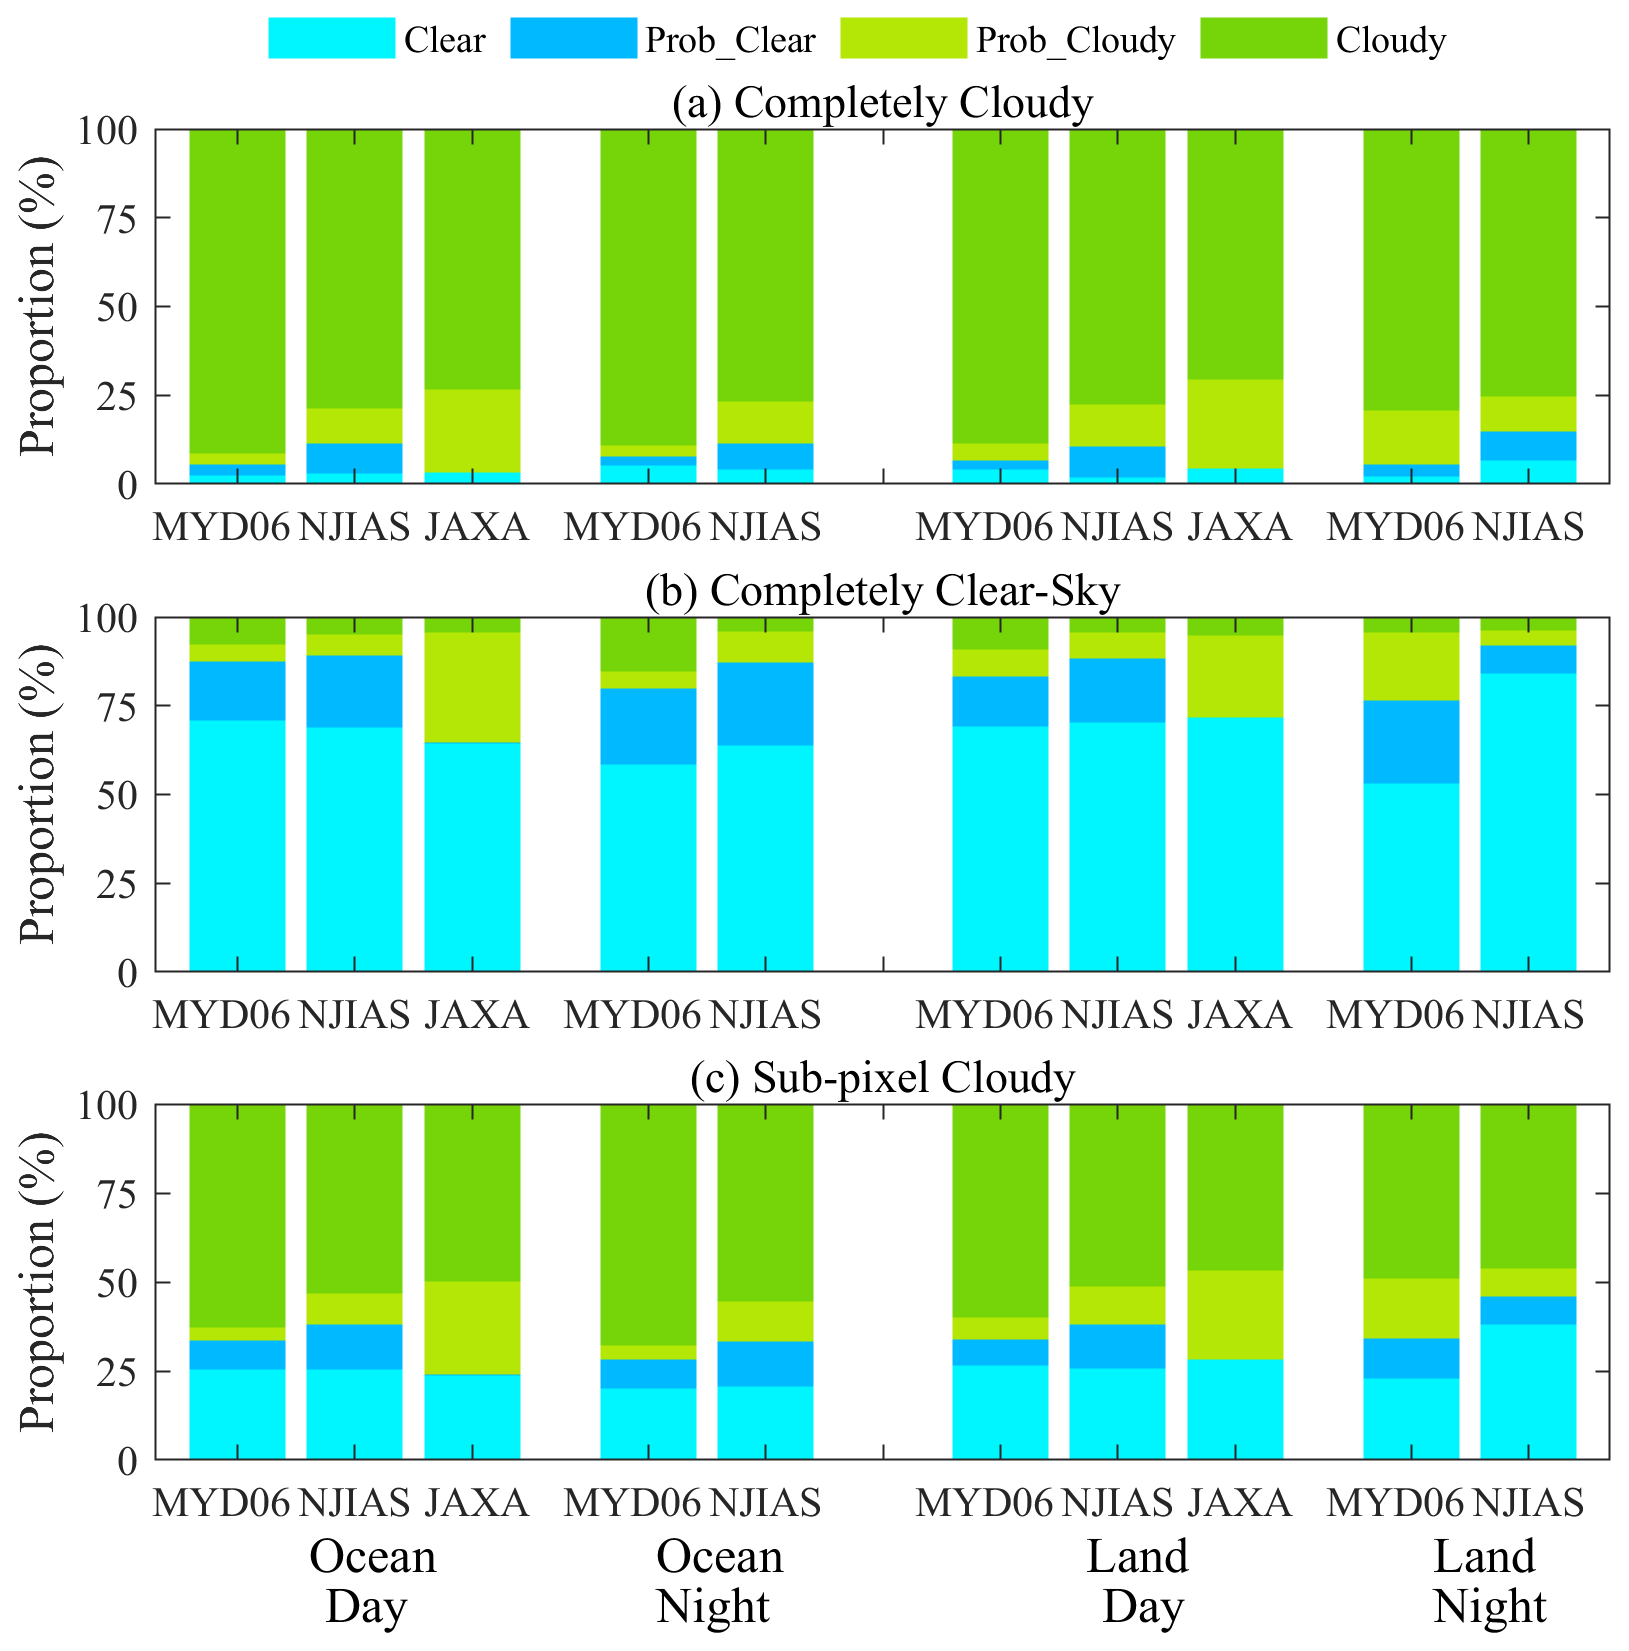
Figure 5Proportions of confidently clear, probably clear, probably cloudy, and confidently cloudy pixels in the MYD06, NJIAS, and JAXA cloud mask results for CALIOP-observed (a) completely cloudy, (b) completely clear-sky, and (c) sub-pixel cloudy cases in 2017.
3.1 Cloud mask results
The CALIOP columns with zero cloud layer are assigned to the clear-sky category, and those with at least one cloud layer are assigned to the cloudy category. The CALIOP columns are then aggregated to completely cloudy, completely clear-sky, and sub-pixel cloudy cases at nominal 2 km scales. Figure 5 shows the proportions of confidently clear, probably clear, probably cloudy, and confidently cloudy pixels in the MYD06, NJIAS, and JAXA cloud mask results for three types of CALIOP cases. It is noted that the JAXA product has the largest proportion of probably cloudy and the smallest proportion of probably clear pixels among three cloud products. Overall, the MYD06 classifications are in best agreement with those of CALIOP, with higher confidence during daytime. The NJIAS classification results are similar to the MODIS results with fractional differences of less than 10 %. Three products (MYD06, NJIAS, and JAXA) have a probability of 25 %–35 % of classifying sub-pixel cloudy cases as confidently clear or probably clear over ocean or during daytime. This probability increases to approximately 47 % for the NJIAS product over continental areas at night.
Table 5Sample sizes and POD, FAR, HSS, and ETS sores for cloud mask retrievals of the MYD06, NJIAS, and JAXA datasets over ocean and land and during daytime and nighttime when validated with CALIOP products for the whole year of 2017. The highest skill scores for each scenario are shown in boldface.
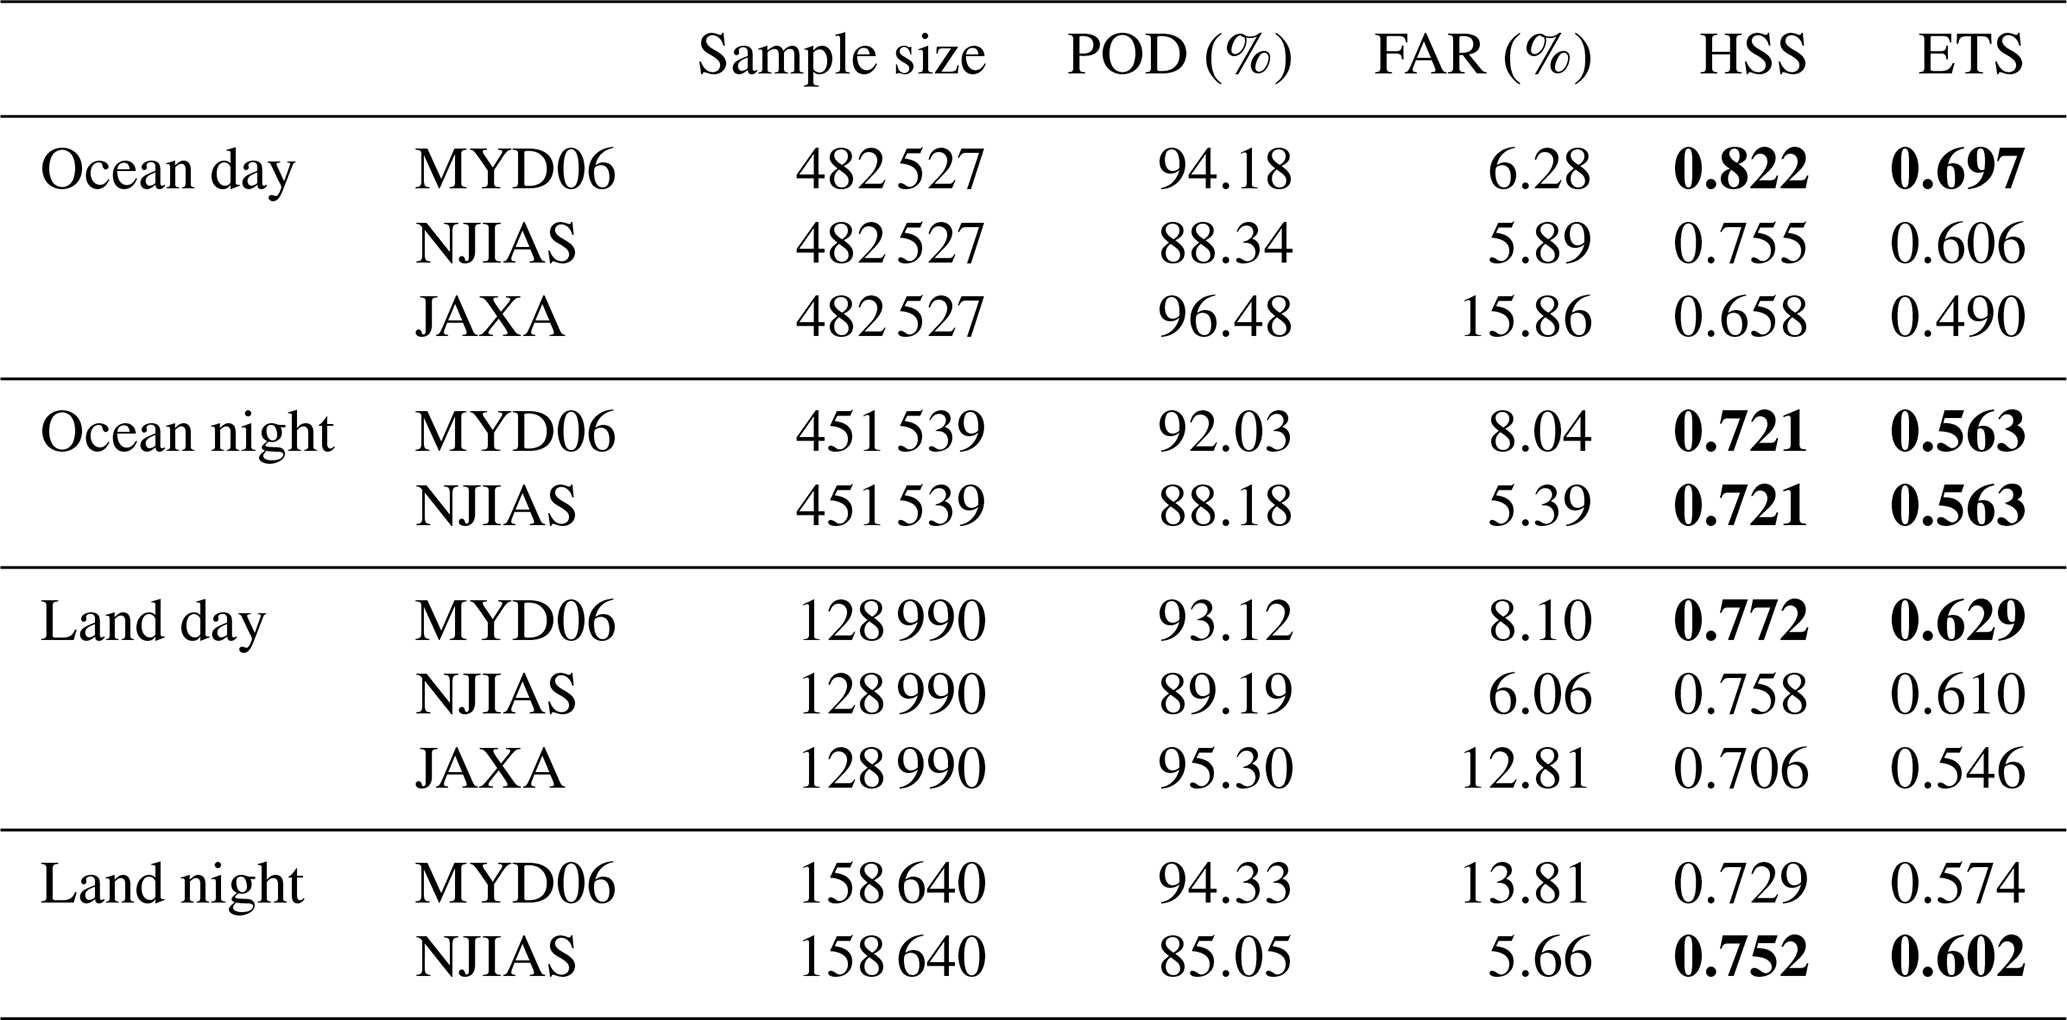
To quantitatively evaluate the cloud mask retrievals, the following four indices are introduced: probability of detection (POD), false-alarm rate (FAR), Heidke skill score (HSS), and equitable threat score (ETS). The definitions of the POD, FAR, HSS, and ETS are described in Zhuge et al. (2011). Table 5 lists the scores of POD, FAR, HSS, and ETS for cloud mask retrievals of three datasets. Here, confidently cloudy and probably cloudy are grouped as “cloudy”, while confidently clear and probably clear are grouped as “clear”. It can be seen that the MYD06 and JAXA datasets always have a POD greater than 92 %, regardless of whether it is over ocean or land. The MYD06 also has a low FAR for all scenarios except for nighttime over land. By contrast, the JAXA dataset has high FARs of more than 12 % over ocean and land. The PODs and FARs for the NJIAS algorithm are ∼ 88 % and ∼ 6 %, respectively. Consequently, the NJIAS HCFD achieves an HSS of 0.75 and an ETS of 0.60 during nighttime over land, surpassing the MYD06 dataset, which has an HSS of 0.73 and an ETS of 0.57. The NJIAS HCFD and MYD06 datasets have the same skill scores for HSS (0.72) and ETS (0.56) during nighttime over ocean. In daytime scenarios, the NJIAS HCFD outperforms the JAXA dataset but does not surpass the MYD06. Note that the aforementioned statistical analysis excluded all cases with sub-pixel cloudiness or very thin cirrus (Karlsson and Håkansson, 2018; Karlsson et al., 2023). If the sub-pixel cloudy cases were misinterpreted as either completely clear-sky or completely cloudy, the estimation of all the scores would be biased unpredictably.
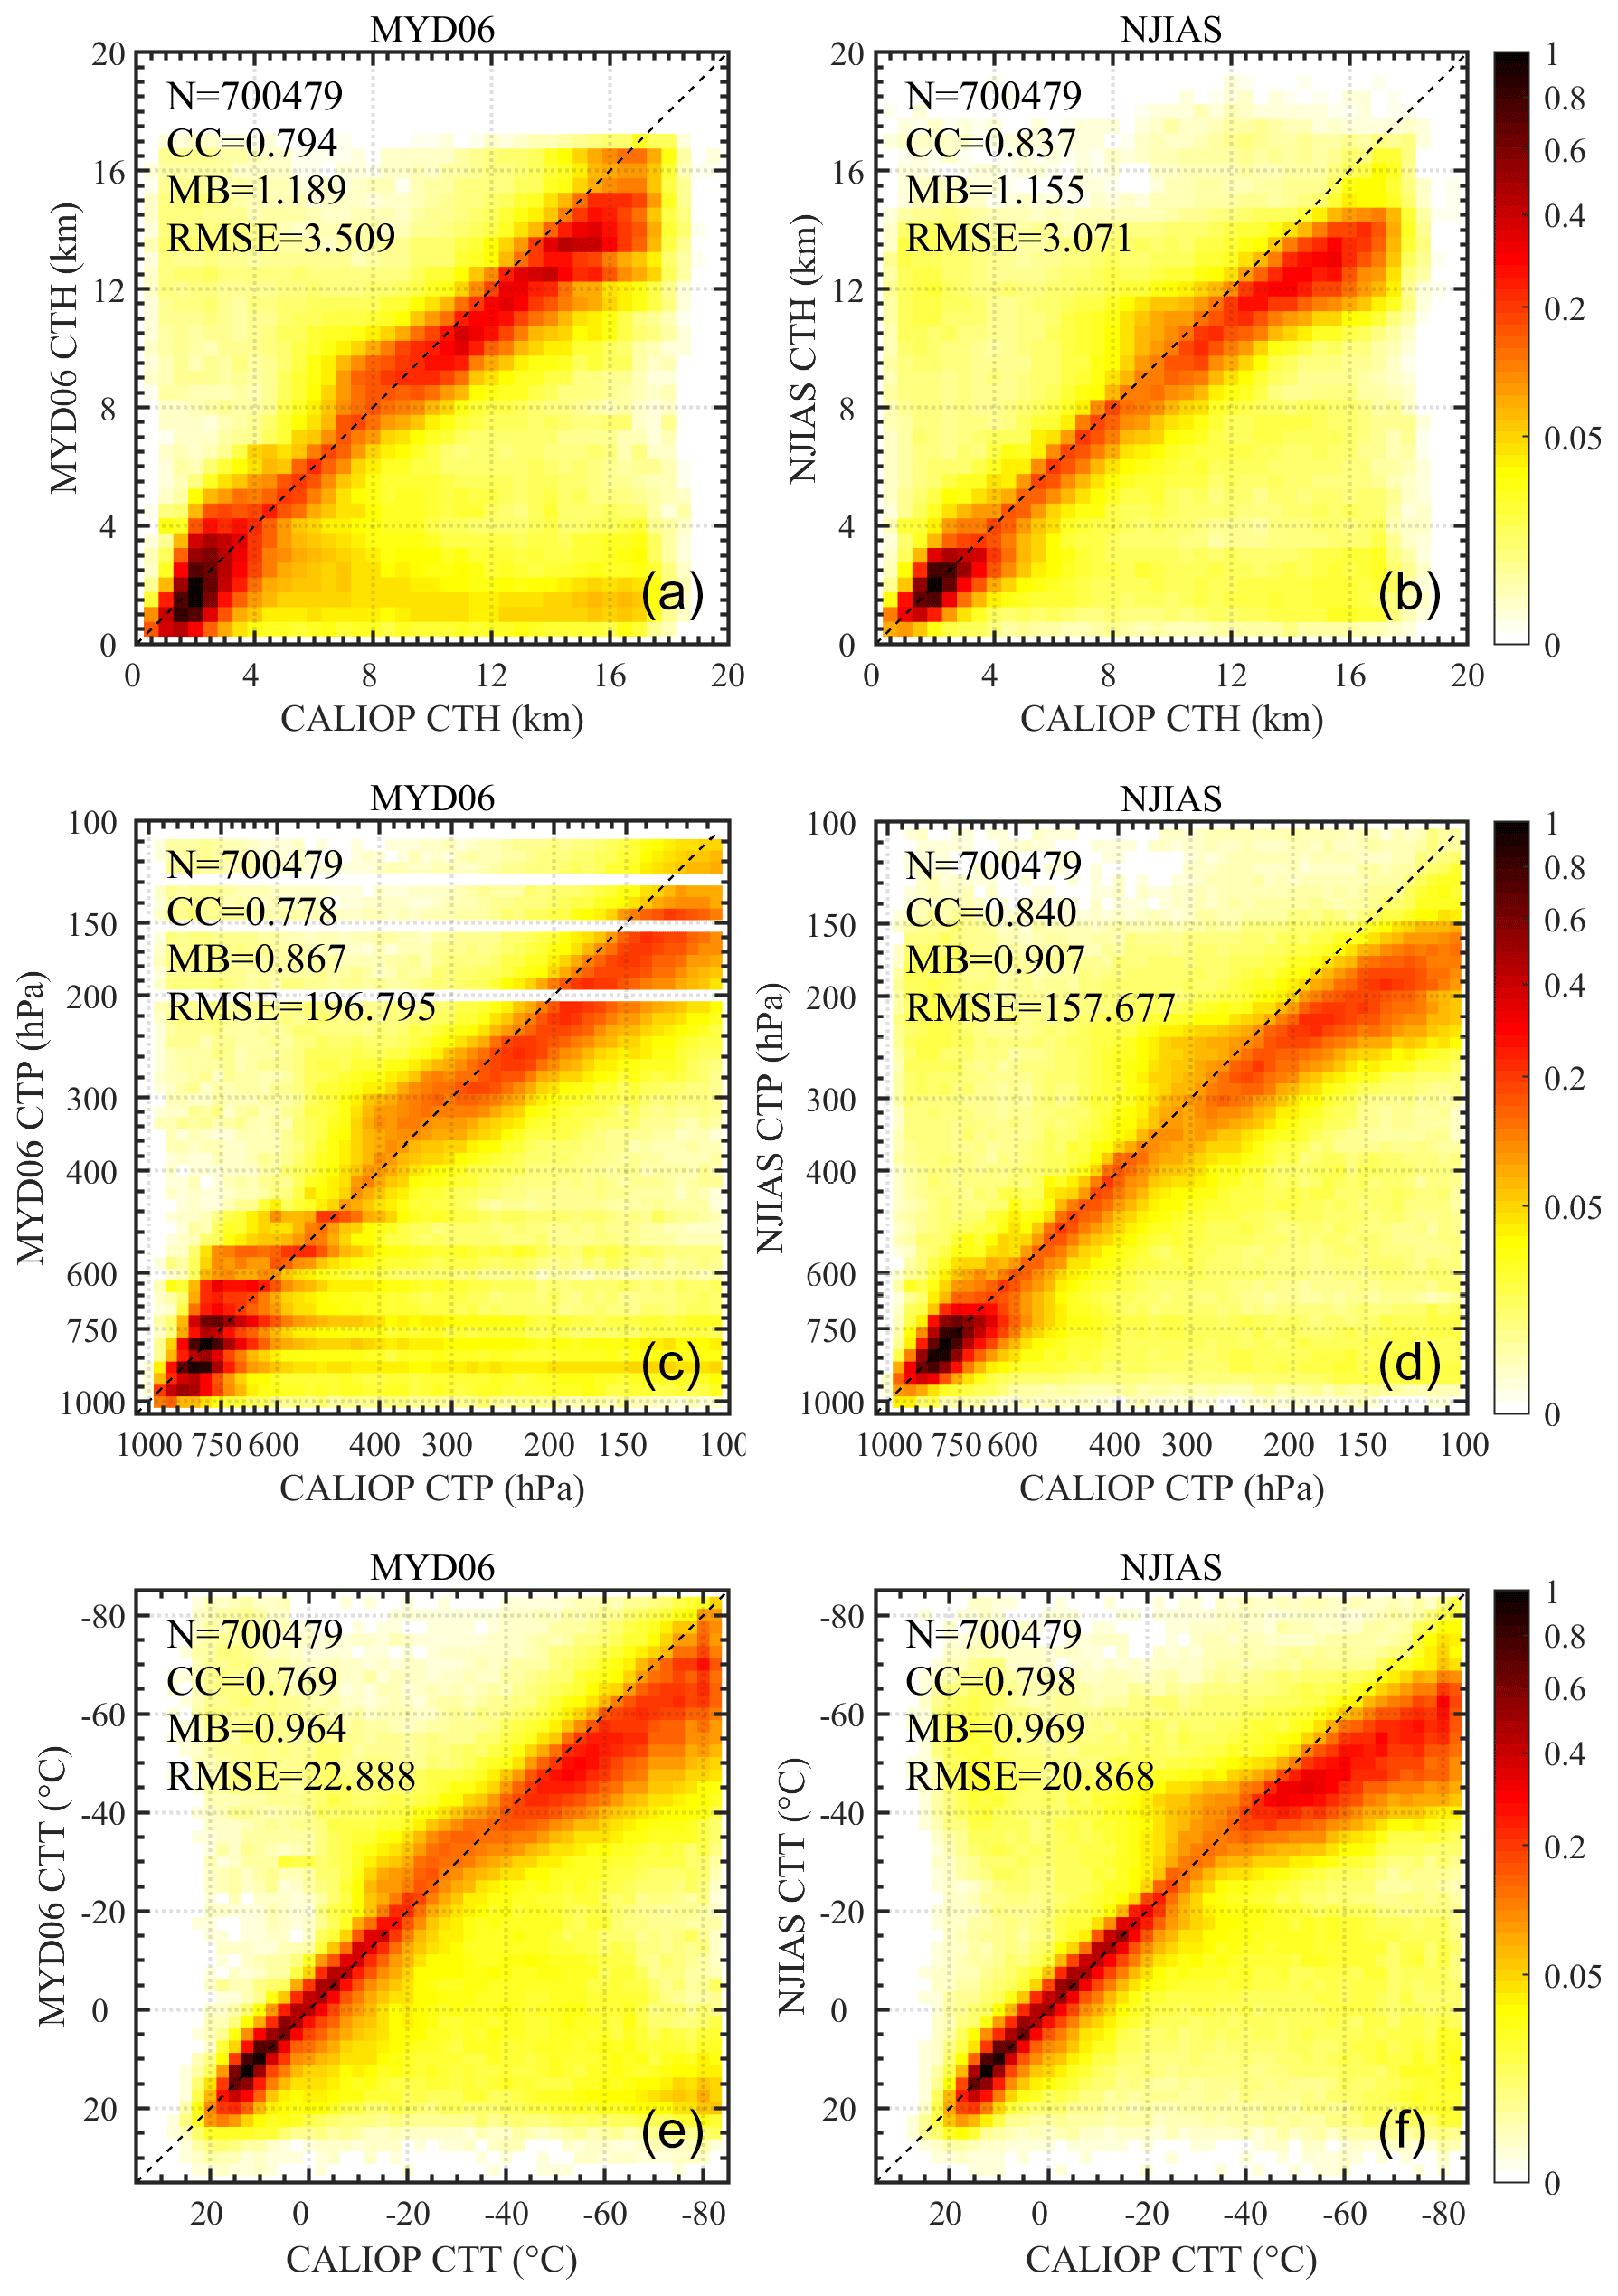
Figure 6Joint probability density histograms of CTH (km; a and b), CTP (hPa; c and d), and CTT (°; e and f) between CALIOP and MYD06 (a, c, and e) and between CALIOP and NJIAS (b, d, and f) datasets in 2017. Also indicated in each panel are sample size (N), correlation coefficient (CC), multiplicative bias (MB), and root mean square error (RMSE). Clear pixels identified by either MYD06 or NJIAS are excluded from the statistics.
3.2 Cloud height results
The cloud height retrievals are evaluated against the CALIOP 1 km cloud layer products. The CALIOP CTH is interpreted as the top altitude of the uppermost CALIOP cloud layer. The CALIOP CTP and CTT are from the Modern Era-Retrospective Analysis for Research and Applications, Version 2 (MERRA-2) and are interpolated into the CALIOP CTH altitude (Avery et al., 2020). Figure 6 shows the joint probability histograms of three cloud height parameters (CTT, CTH, and CTP) between the CALIOP and MYD06 datasets and between the CALIOP and NJIAS datasets in 2017. To facilitate comparisons, CTH is expressed in kilometers above sea level. Overall, the NJIAS cloud height retrieval algorithm outperforms its MYD06 counterpart. The correlation coefficients (CCs) of CTH, CTP, and CTT between the NJIAS and CALIOP products are 0.84, 0.84, and 0.80, respectively – each surpassing the corresponding values obtained from MYD06 retrievals. It is noteworthy that the NJIAS retrievals tend to slightly underestimate CTH and overestimate both CTP and CTT for high clouds, possibly due to the fact that only a single channel centered at 13.3 µm is allocated within the broad carbon dioxide absorption region for the AHI. Consequently, the multiplicative biases (MBs; Zhuge et al., 2021b) associated with these three cloud height parameters stand at 1.16, 0.91, and 0.97, respectively. Incorporating additional carbon dioxide absorption channels would enhance the inference of cloud-top pressure and effective cloud amount for high-level clouds, especially semi-transparent clouds such as cirrus (Platnick et al., 2019). The MYD06 algorithm also has limitations. There is a significant proportion of instances in which the MYD06 algorithm mistakes mid- and high-level clouds for boundary layer clouds. The root mean square errors (RMSEs) for MYD06 CTH, CTP, and CTT retrievals are 3.51 km, 196.80 hPa, and 22.89 K, respectively, substantially larger than those reported for the NJIAS retrievals.
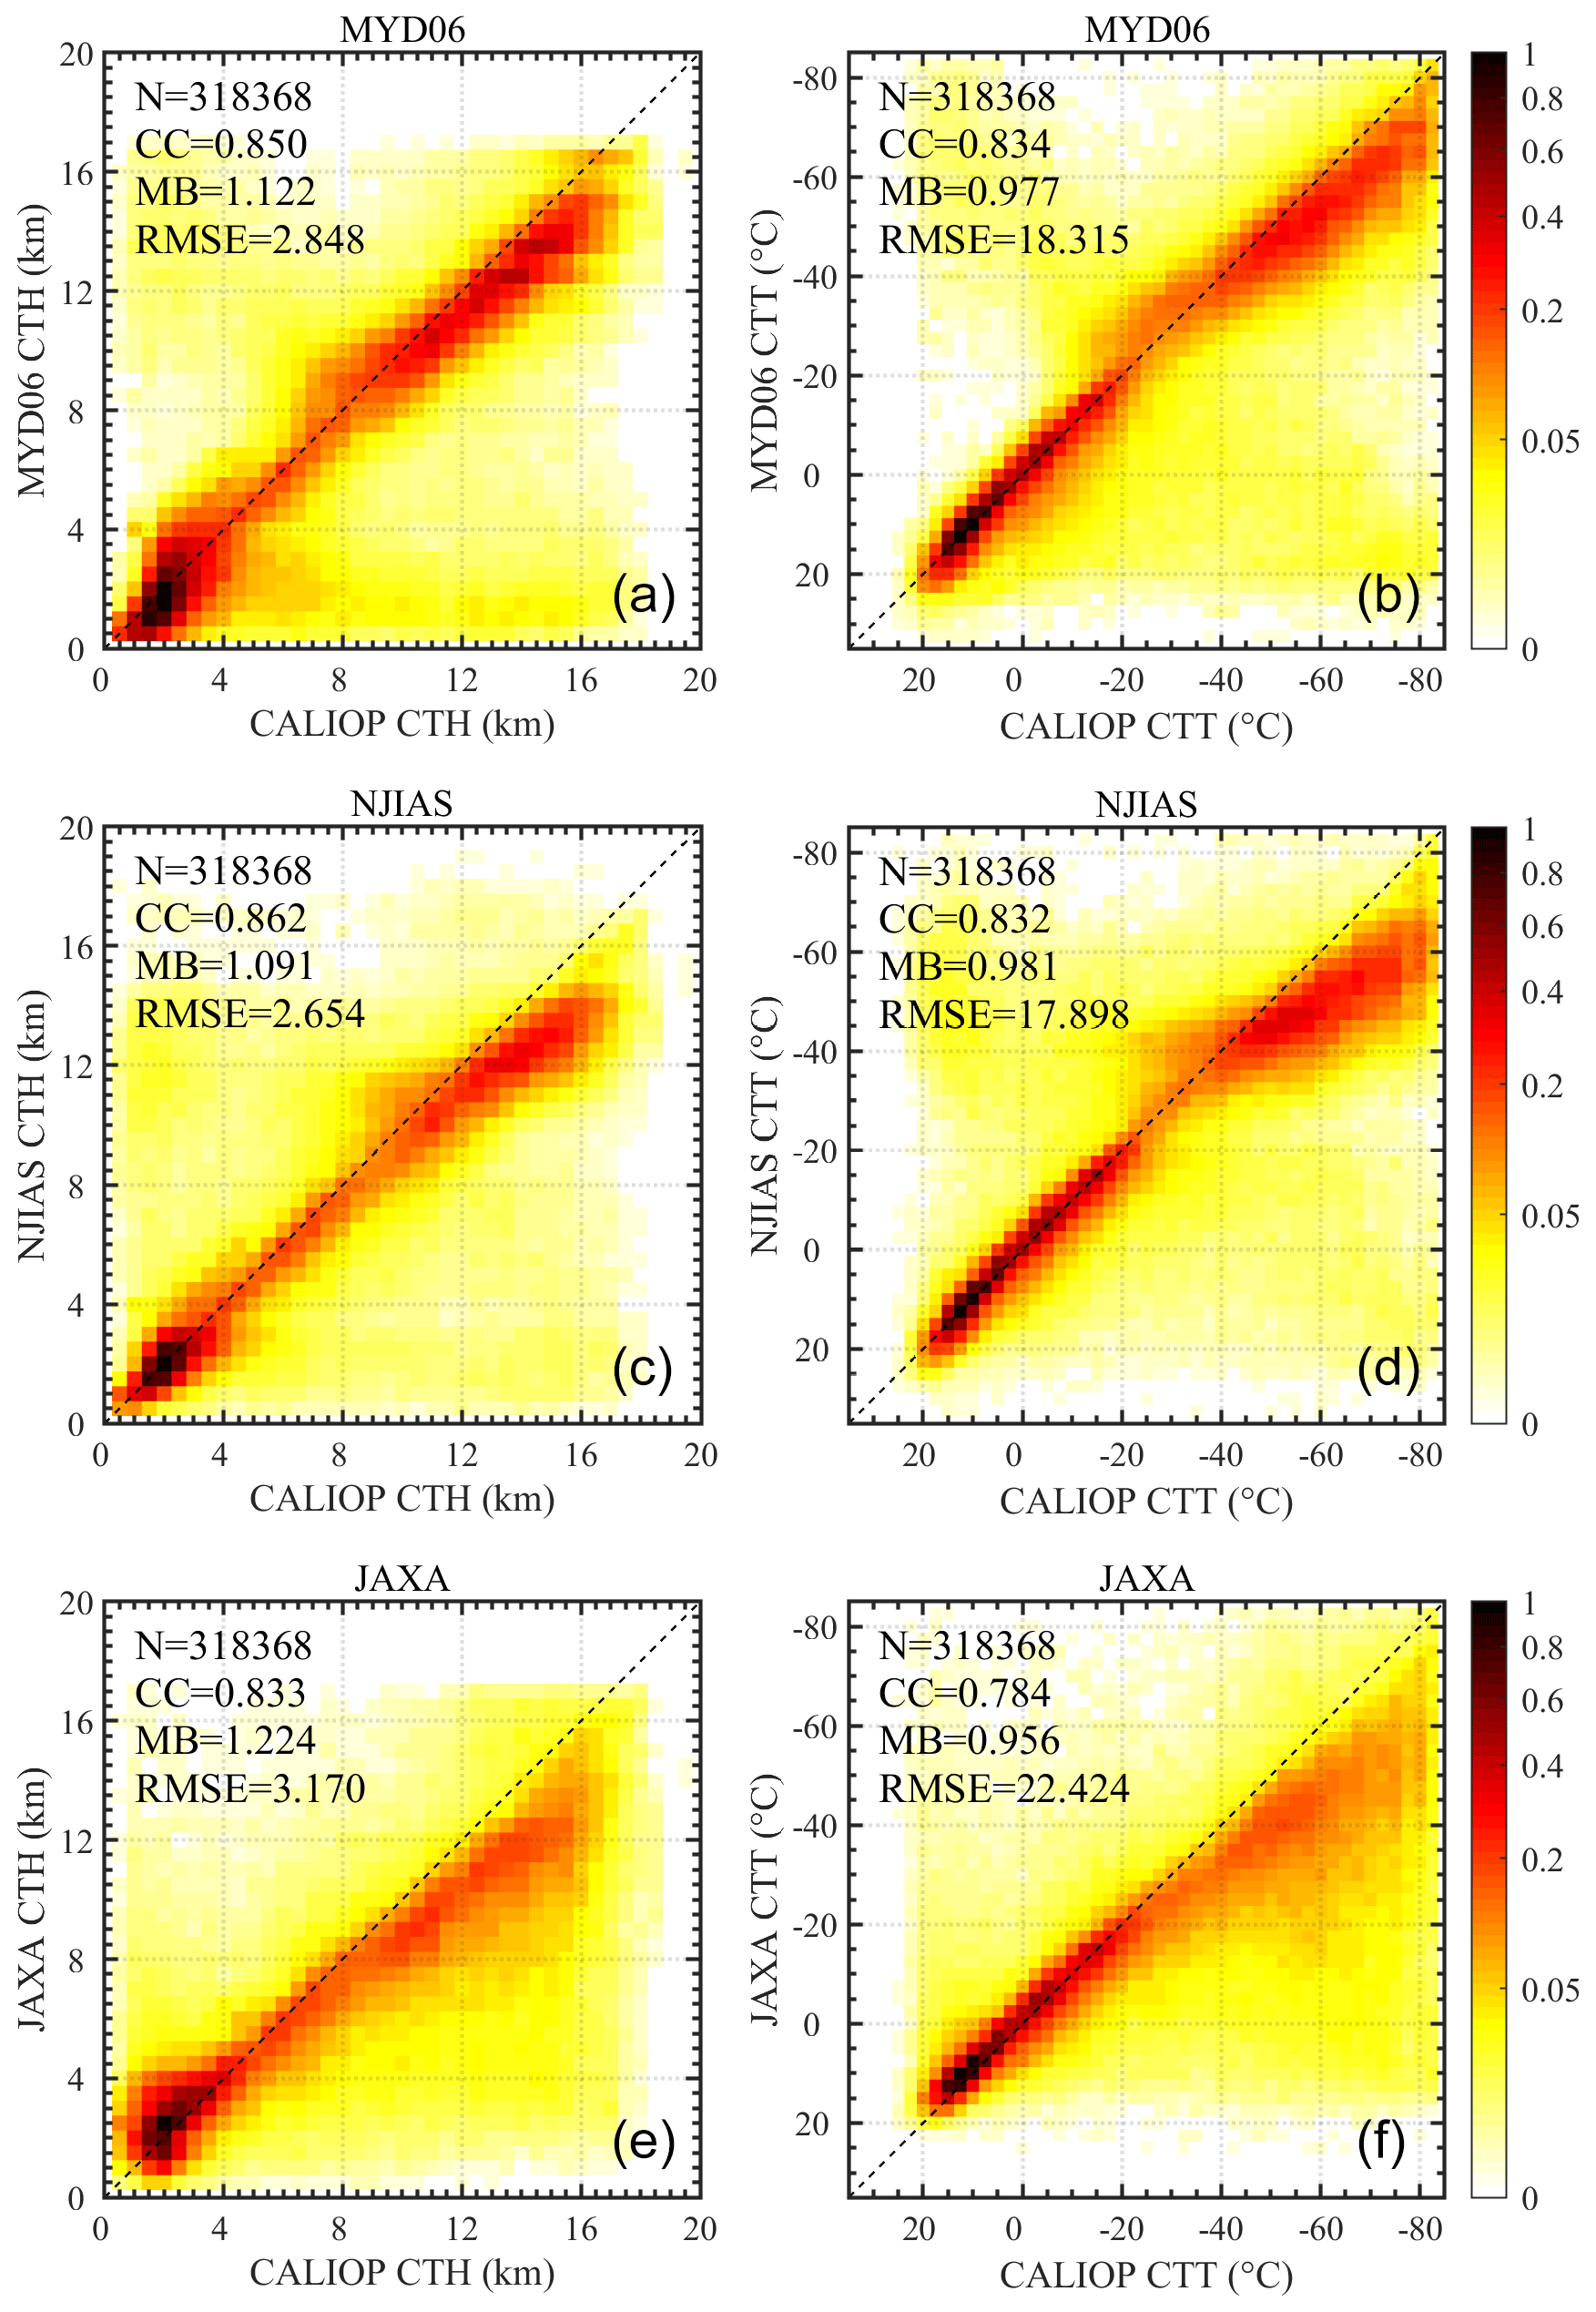
Figure 7Joint probability density histograms of CTH (km; a, c, and e) and CTT (°; b, d, and f) between CALIOP and MYD06 (a, b), between CALIOP and NJIAS (c, d), and between CALIOP and JAXA (e, f) datasets for daytime in 2017. Clear pixels identified by MYD06, NJIAS, or JAXA are excluded from the statistics. Only daytime data are retained.
The JAXA operational cloud height algorithm incorporates the IR window technique, the radiance rationing technique, and the IR water vapor intercept technique and chooses one of them contingent upon the result of cloud type classifications (Mouri et al., 2016b). This conventional methodology is different from the maximum likelihood estimation algorithms, such as the ACHA. The JAXA dataset includes two cloud height parameters, CTH and CTT, which are available only in daytime. By comparing the NJIAS daytime CTH and CTT retrievals with the JAXA results, Fig. 7 confirms the remarkable improvement in the accuracy of these two cloud height parameters achieved by the NJIAS. The JAXA retrievals exhibit a more obvious tendency to underestimate the CTH and overestimate the CTT of mid- to high-level clouds than the NJIAS retrievals. Moreover, there is poor agreement between the CALIOP and JAXA CTH retrievals for low-level clouds, with most samples straying away from the 1-to-1 ratio lines. As a result, the RMSE values for the JAXA CTH and CTT retrievals are 3.17 km and 22.42 K, respectively, which are much larger than the metrics of 2.65 km and 17.90 K for the NJIAS retrievals.
3.3 Cloud-top phase results
The CALIOP cloud-top phase is defined as the CALIOP cloud phase of the uppermost cloud layer, which will serve as the truth in the following evaluations. The CALIOP classification currently provides four categories of phases: that is, liquid water, randomly oriented ice (ROI), horizontally oriented ice, and unknown (Hu et al., 2009). The last two categories are not considered in this study because of their low percentage of occurrence (less than 1.0 %) (Zhuge et al., 2021a). In addition, the Collection 6 MYD06 dataset provides two independent cloud-top phase retrievals. One is an IR-only result available all day, and the other is derived from a combination of SWIR and IR tests that runs during daytime only (Baum et al., 2012).
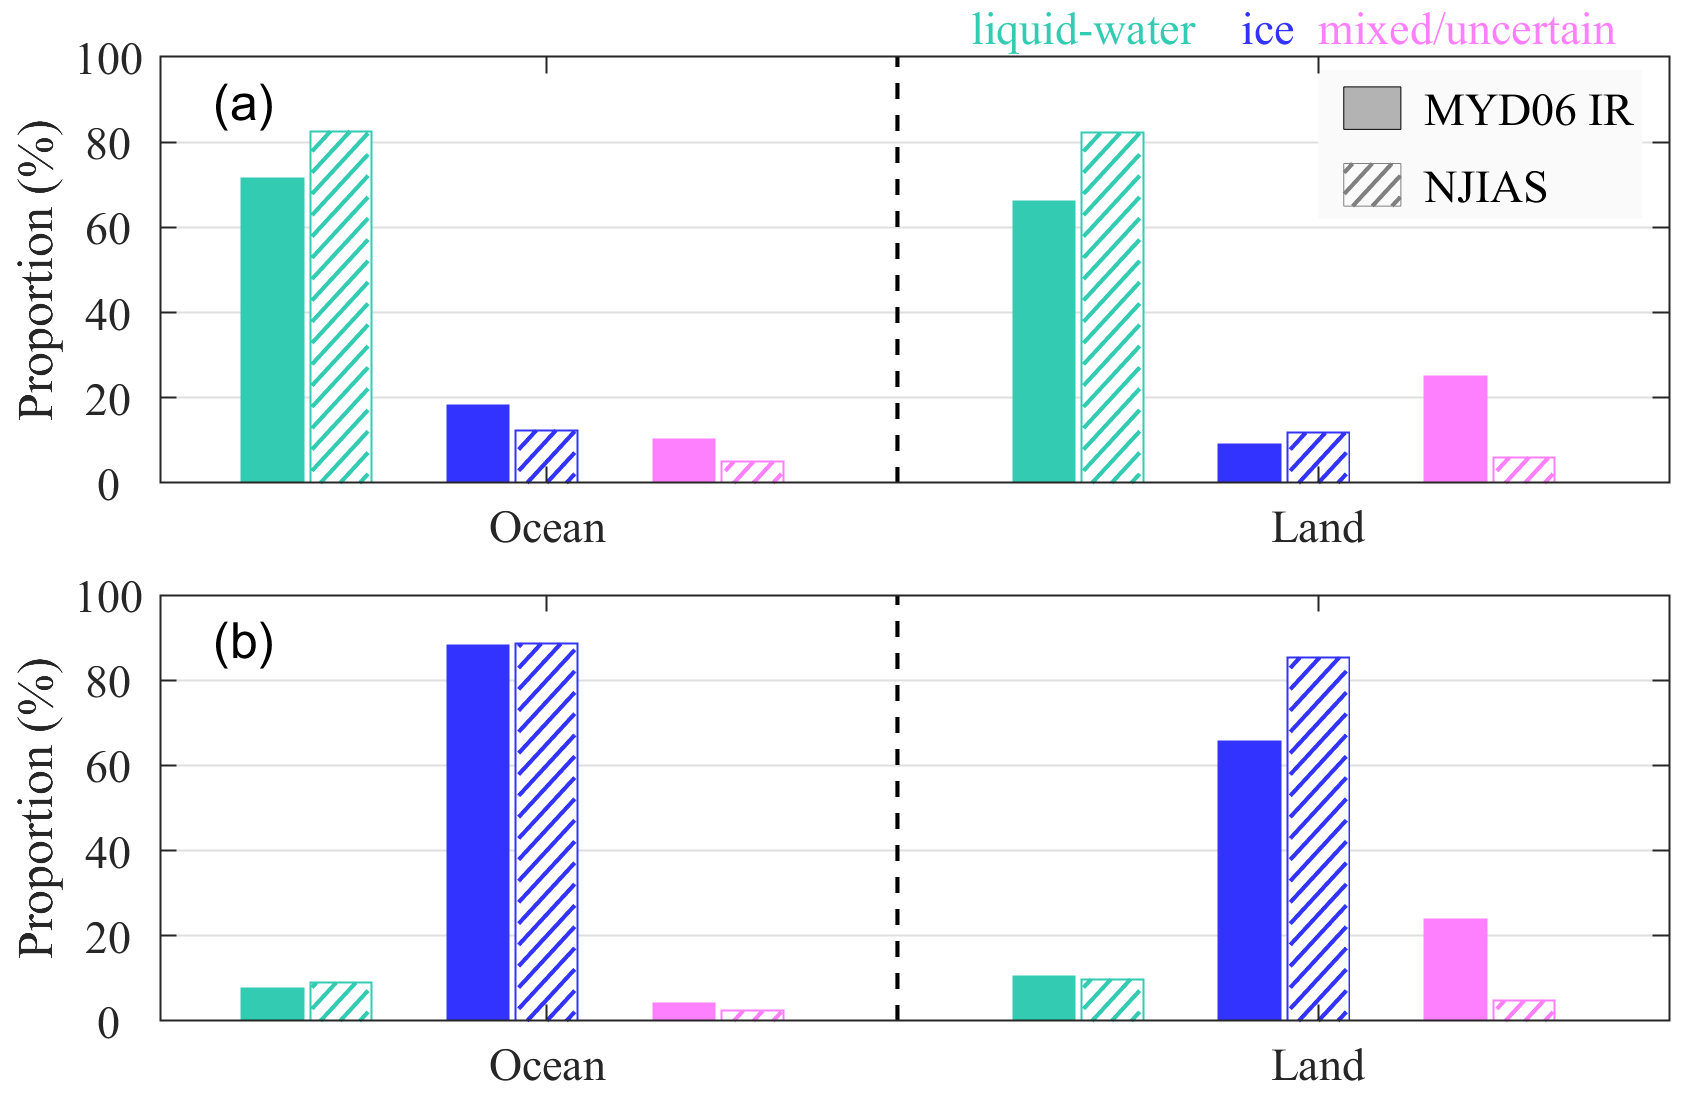
Figure 8Proportions of liquid-water (turquoise), ice (blue), and mixed or uncertain (magenta) phases identified by MYD06 IR-only (solid bars) and NJIAS (hatched bars) for CALIOP pixels with (a) liquid-water and (b) ROI-phase cloud tops in 2017 over ocean and land. Clear pixels identified by either MYD06 or NJIAS are excluded from the statistics.
Figure 8 demonstrates that the NJIAS cloud-top phase retrievals perform better than the MYD06 IR-only retrievals. For CALIOP liquid-water and ROI cloud tops over ocean, the PODs of NJIAS retrievals are 82.60 % and 88.59 %, respectively. These two metrics slightly decrease to 82.17 % and 85.35 % over land. Over oceans, the MYD06 IR-only and NJIAS datasets exhibit similar behavior for CALIOP ROI cloud-top phases. However, compared to NJIAS HCFD, the MYD06 IR-only dataset tends to classify more CALIOP liquid-water phases as ice or uncertain phases, resulting in a POD of 71.59 %. Over land, the MYD06 IR-only dataset classifies many CALIOP cloud tops as having an uncertain phase, resulting in low PODs of only 66.03 % and 65.63 % for CALIOP liquid-water and ROI cloud tops, respectively.
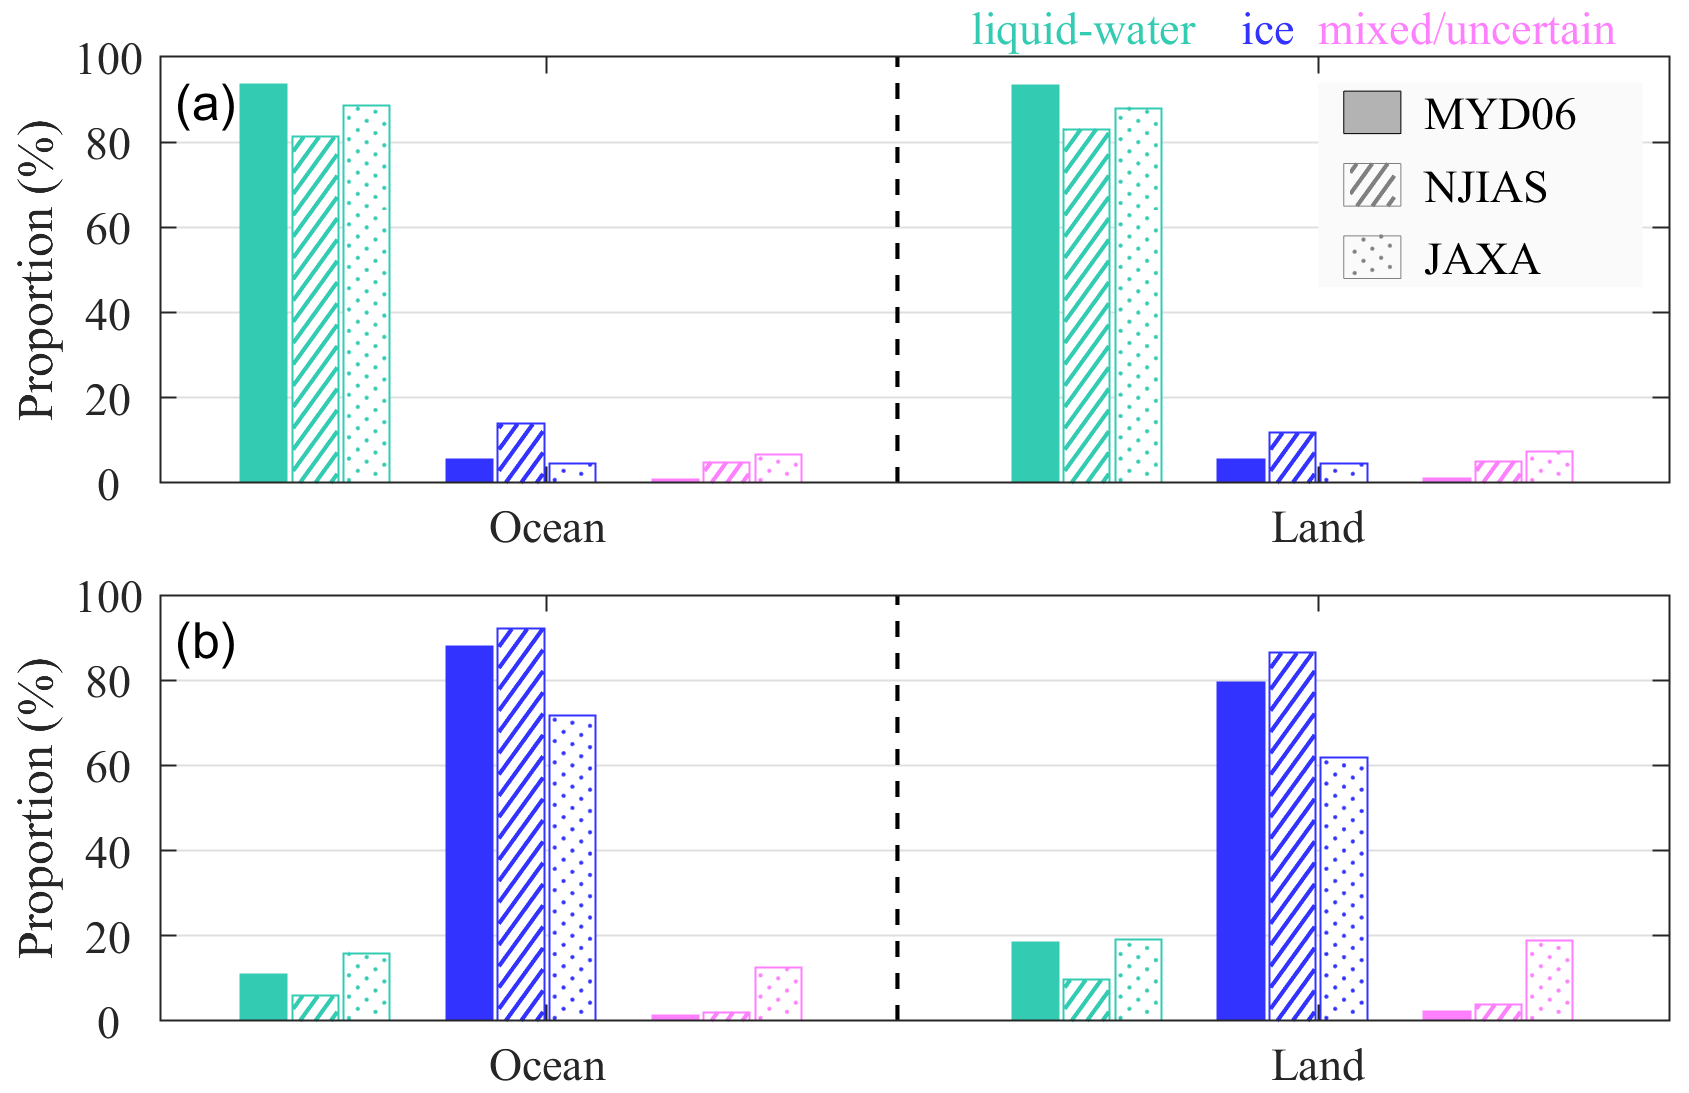
Figure 9Proportions of liquid-water (turquoise), ice (blue), and mixed or uncertain (magenta) phases identified by MYD06 SWIR + IR (solid bars), NJIAS (hatched bars), and JAXA (dotted bars) for CALIOP pixels with (a) liquid-water and (b) ROI-phase cloud tops for daytime in 2017 over ocean and land. Clear pixels identified by MYD06, NJIAS, or JAXA are excluded from the statistics. Only daytime data are retained.
Intercomparisons of cloud-top phase retrievals are also made among the MYD06 SWIR + IR, the NJIAS, and the JAXA datasets during daytime only (Fig. 9). It can be seen that the NJIAS cloud-top phase retrievals exhibit a consistent accuracy for both day and night. The MYD06 SWIR + IR retrievals (Fig. 9) show a significant improvement over the IR-only retrievals (Fig. 8) by supplementing the IR tests with those from solar channels. Figure 9 also reveals a deficiency of the JAXA retrievals in identifying ice phases. The PODs of the JAXA dataset for the CALIOP ROI phases are as low as 71.69 % over ocean and 61.84 % over land, which are significantly worse than those for CALIOP liquid-water phases.
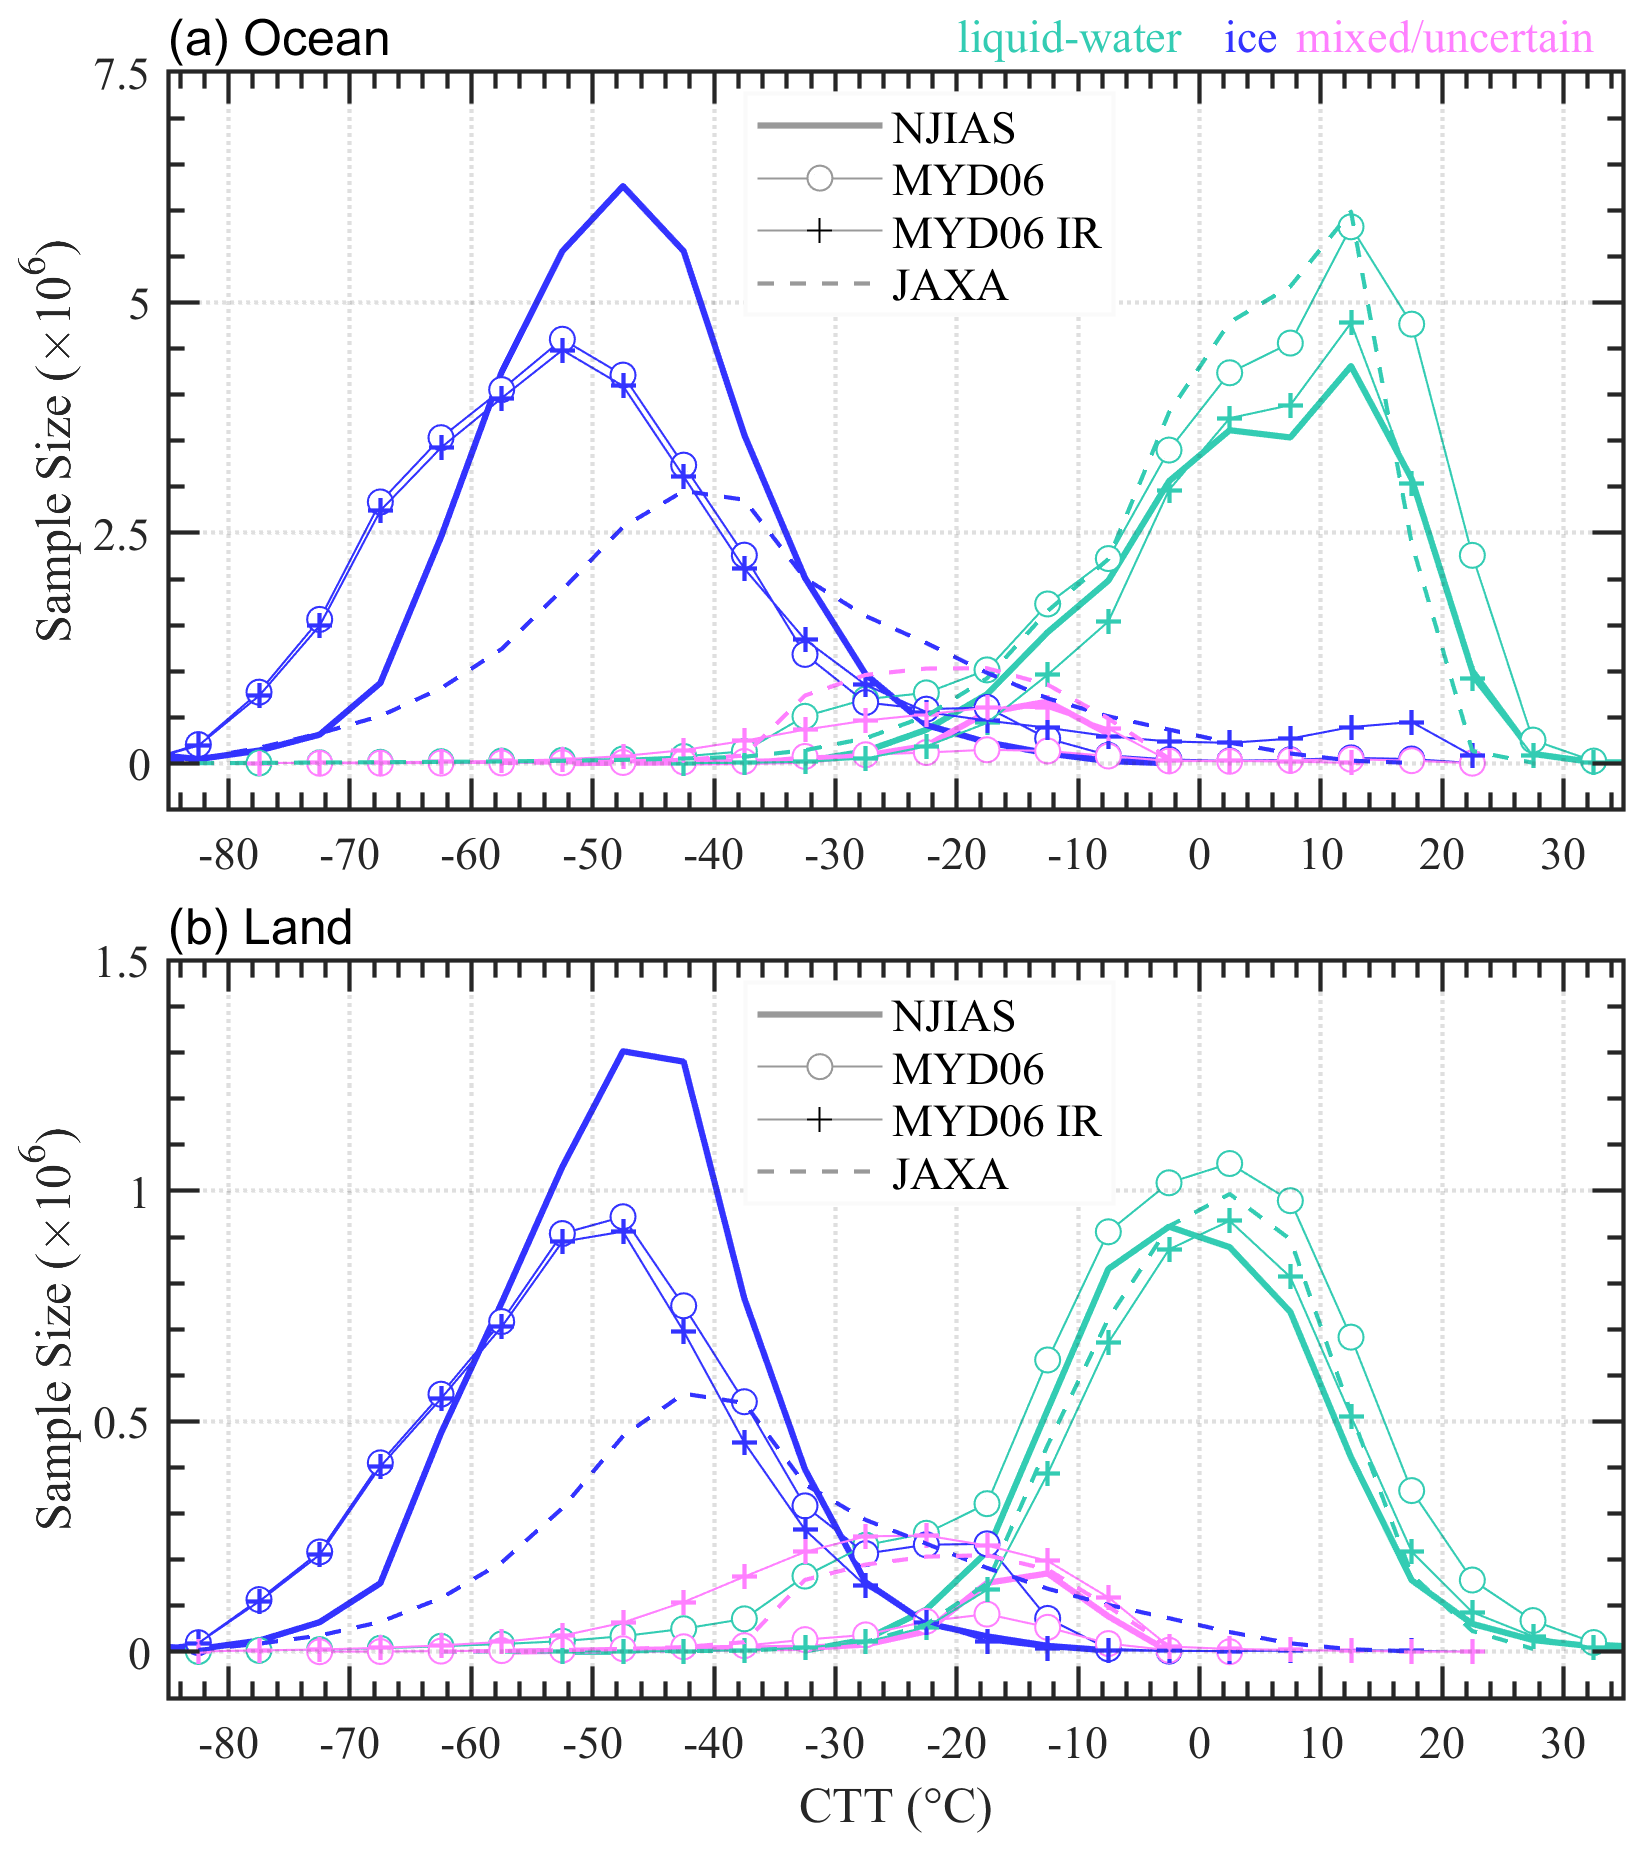
Figure 10Sample size variations of cloud-top phases identified by MYD06 IR-only (crosses connected by thin lines), MYD06 SWIR + IR (open circles connected by thin lines), NJIAS (thick solid curves), and JAXA (dashed curves) with respect to the CTT values during daytime in June and December 2017 over (a) ocean and (b) land.
It is worthwhile to examine the distributions of the cloud-top phases identified by MYD06 IR-only, MYD06 SWIR + IR, NJIAS, and JAXA with respect to the CTT values (Fig. 10). The NJIAS HCFD tends to classify cloudy pixels with CTT above 0 °C as liquid water and those with CTT below −30 °C as ice. When CTT is between −30 and 0 °C, the NJIAS-identified cloud-top phase could be liquid water, ice, or a mixture of both. However, there are cases where the MYD06 IR-only or the JAXA classified cloud tops with a CTT greater than 0 °C as ice phase, revealing a limitation of these two products. Continent cloud tops with uncertain (liquid-water) phase are also found in the MYD06 IR-only (SWIR + IR) retrievals when CTT is below −40 °C. Considering that in situ observations have not revealed the presence of a mixed or supercooled water phase at temperatures below −40 °C (Korolev et al., 2017), it is necessary to reexamine the two MYD06 cloud-top phase classifications over land.
3.4 DCOMP results
The NJIAS DCOMP retrievals are evaluated using the Collection 6.1 MYD06 products in June, July, and August 2017. Note that both the NJIAS and the MYD06 have three τ retrievals. In most cases these three τ retrievals are nearly identical. Accordingly, the DCOMP35 τ is selected as a representative in this study. Besides, since all current bispectral-based DCOMP algorithms have large uncertainties or errors in the Re retrievals of thin clouds, samples with τ less than 5 are removed during the Re valuations.
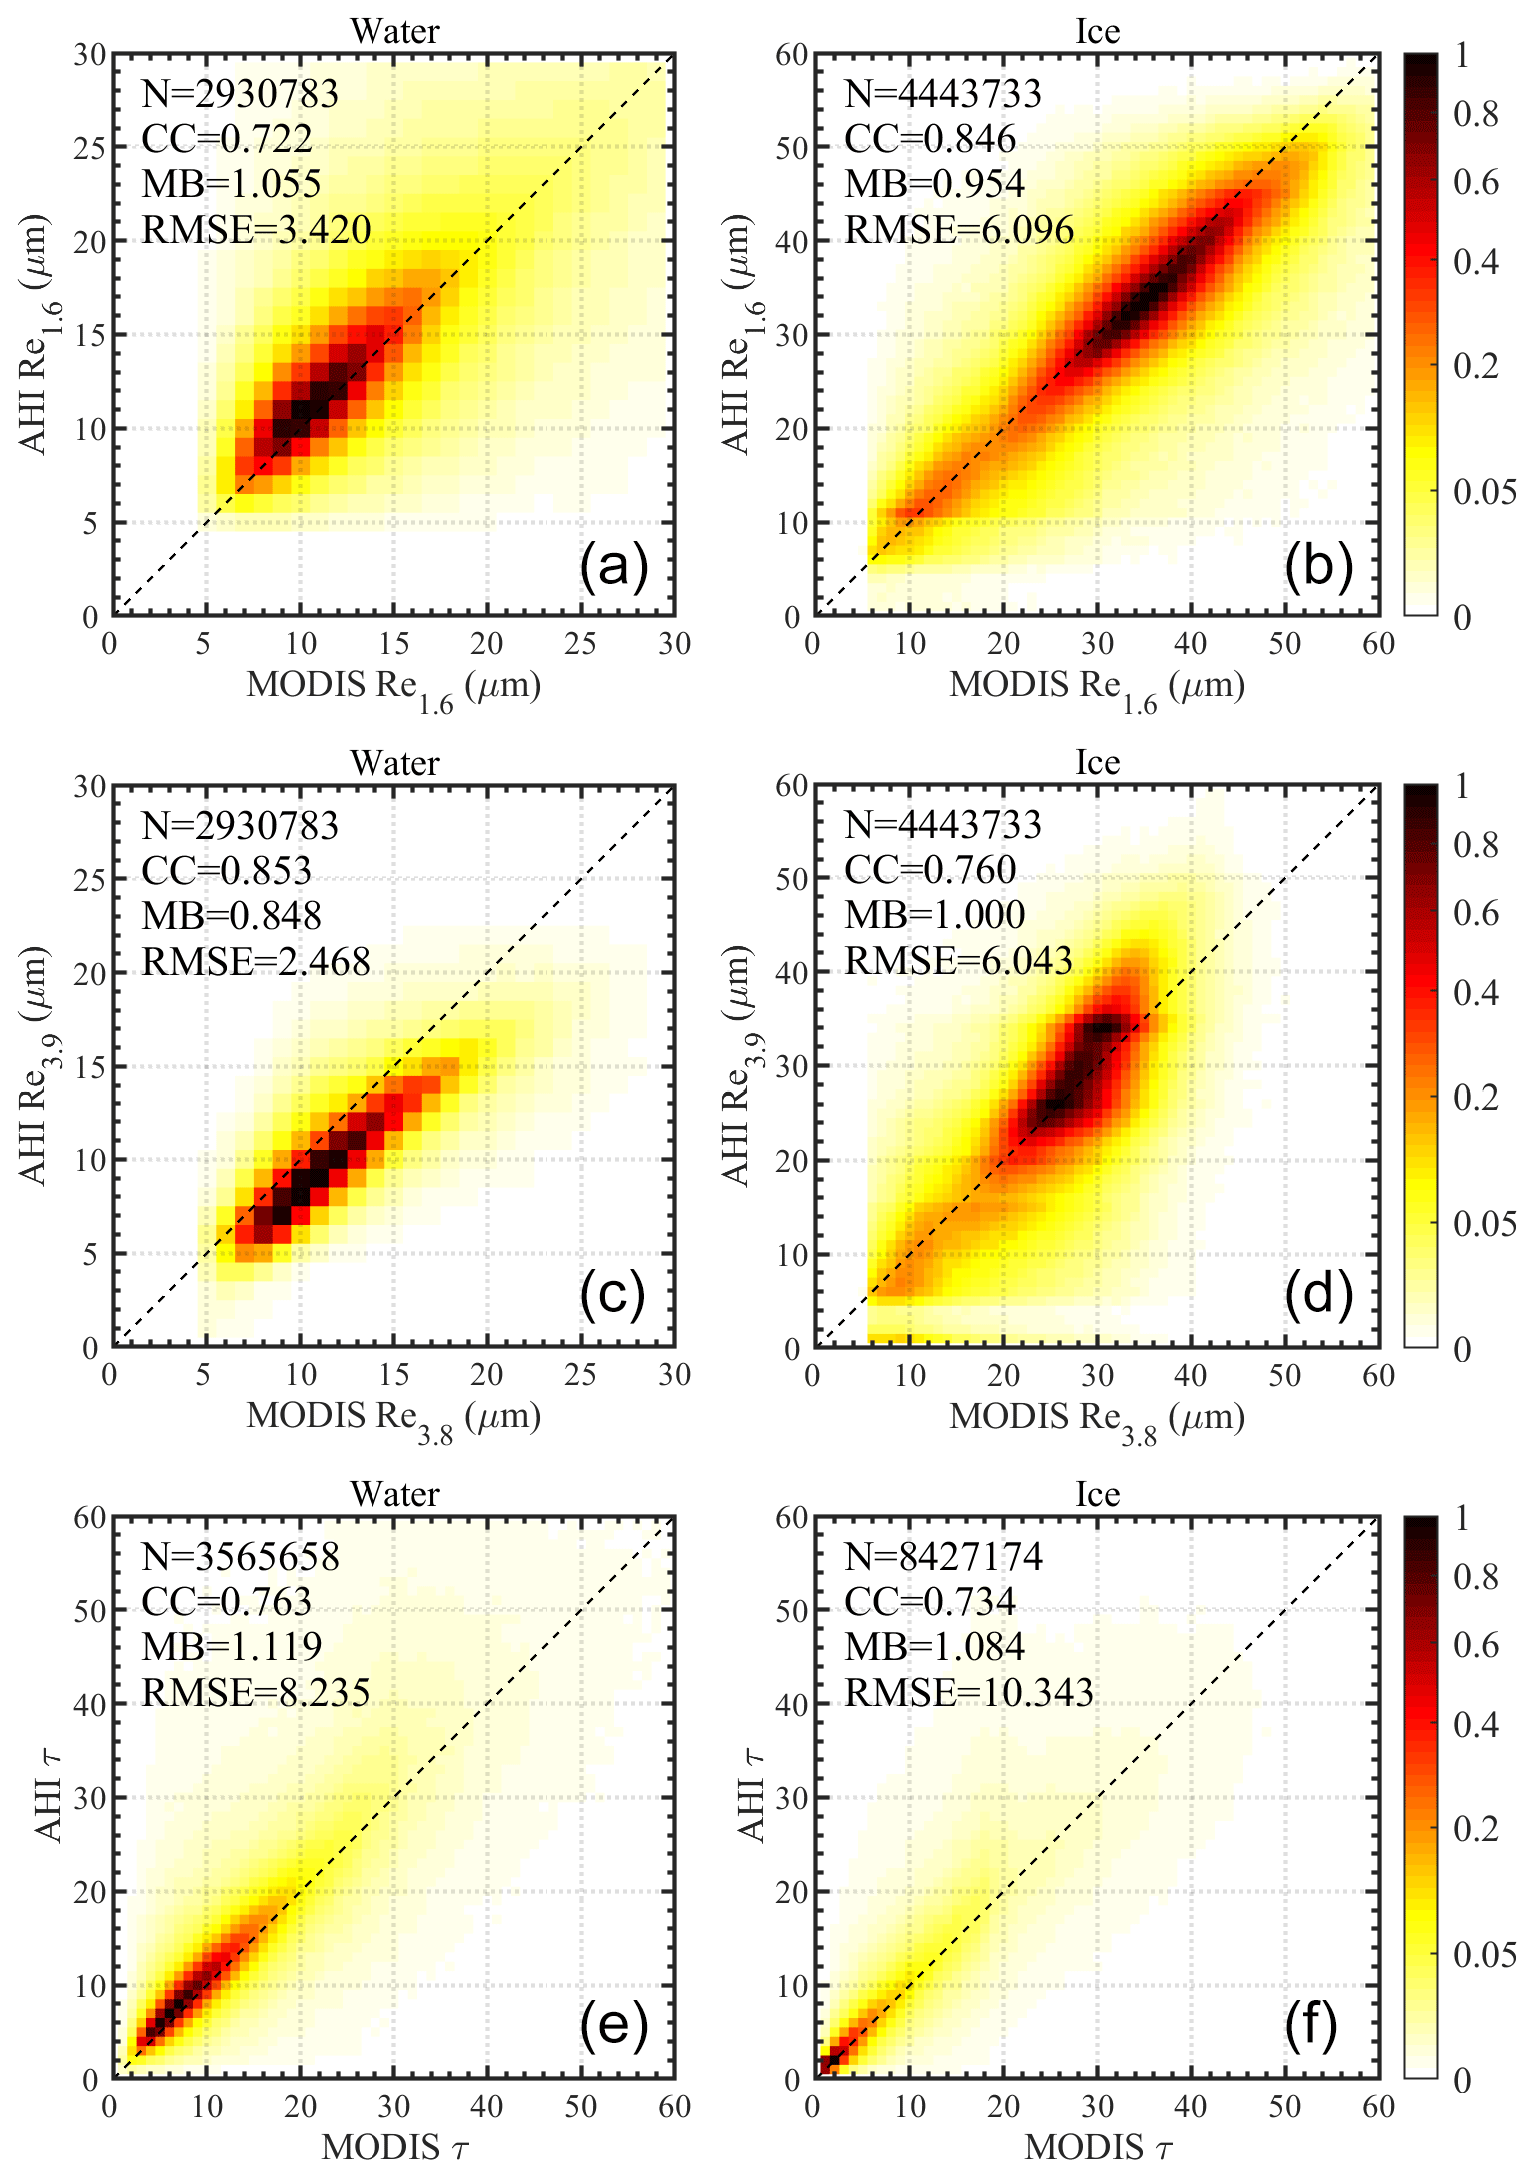
Figure 11Joint probability density histograms of Re1.6 (a, b), Re3.8 [Re3.9] (c, d), and τ (e, f) between MYD06 and NJIAS datasets for liquid-water (a, c, and e) and ice (b, d, and f) clouds during daytime in June, July, and August 2017.
Figure 11 illustrates pixel-to-pixel comparisons of Re and τ between the MYD06 and NJIAS retrievals. The NJIAS Re1.6 retrievals are generally consistent with the MYD06 Re1.6 values for both liquid-water and ice clouds. Most samples are distributed evenly around the 1-to-1 ratio lines. The CC of the NJIAS Re1.6 retrievals for liquid-water (ice) clouds is 0.72 (0.85), and the corresponding MB and RMSE values are 1.06 (0.95) and 3.42 µm (6.10 µm), respectively. The NJIAS Re3.9 retrievals for liquid-water clouds are systematically smaller than their MYD06 counterparts that have an MB of 0.85 and a CC of 0.85. However, such an underestimation is not found in the NJIAS Re3.9 retrievals for ice clouds, which yielded an MB of 1.00, a CC of 0.76, and an RMSE of 6.04 µm. Overall, the NJIAS τ retrievals agree well with the MYD06 τ values for both liquid-water and ice clouds. The MB ranges from 1.08 to 1.12, and the CC ranges from 0.73 to 0.76.
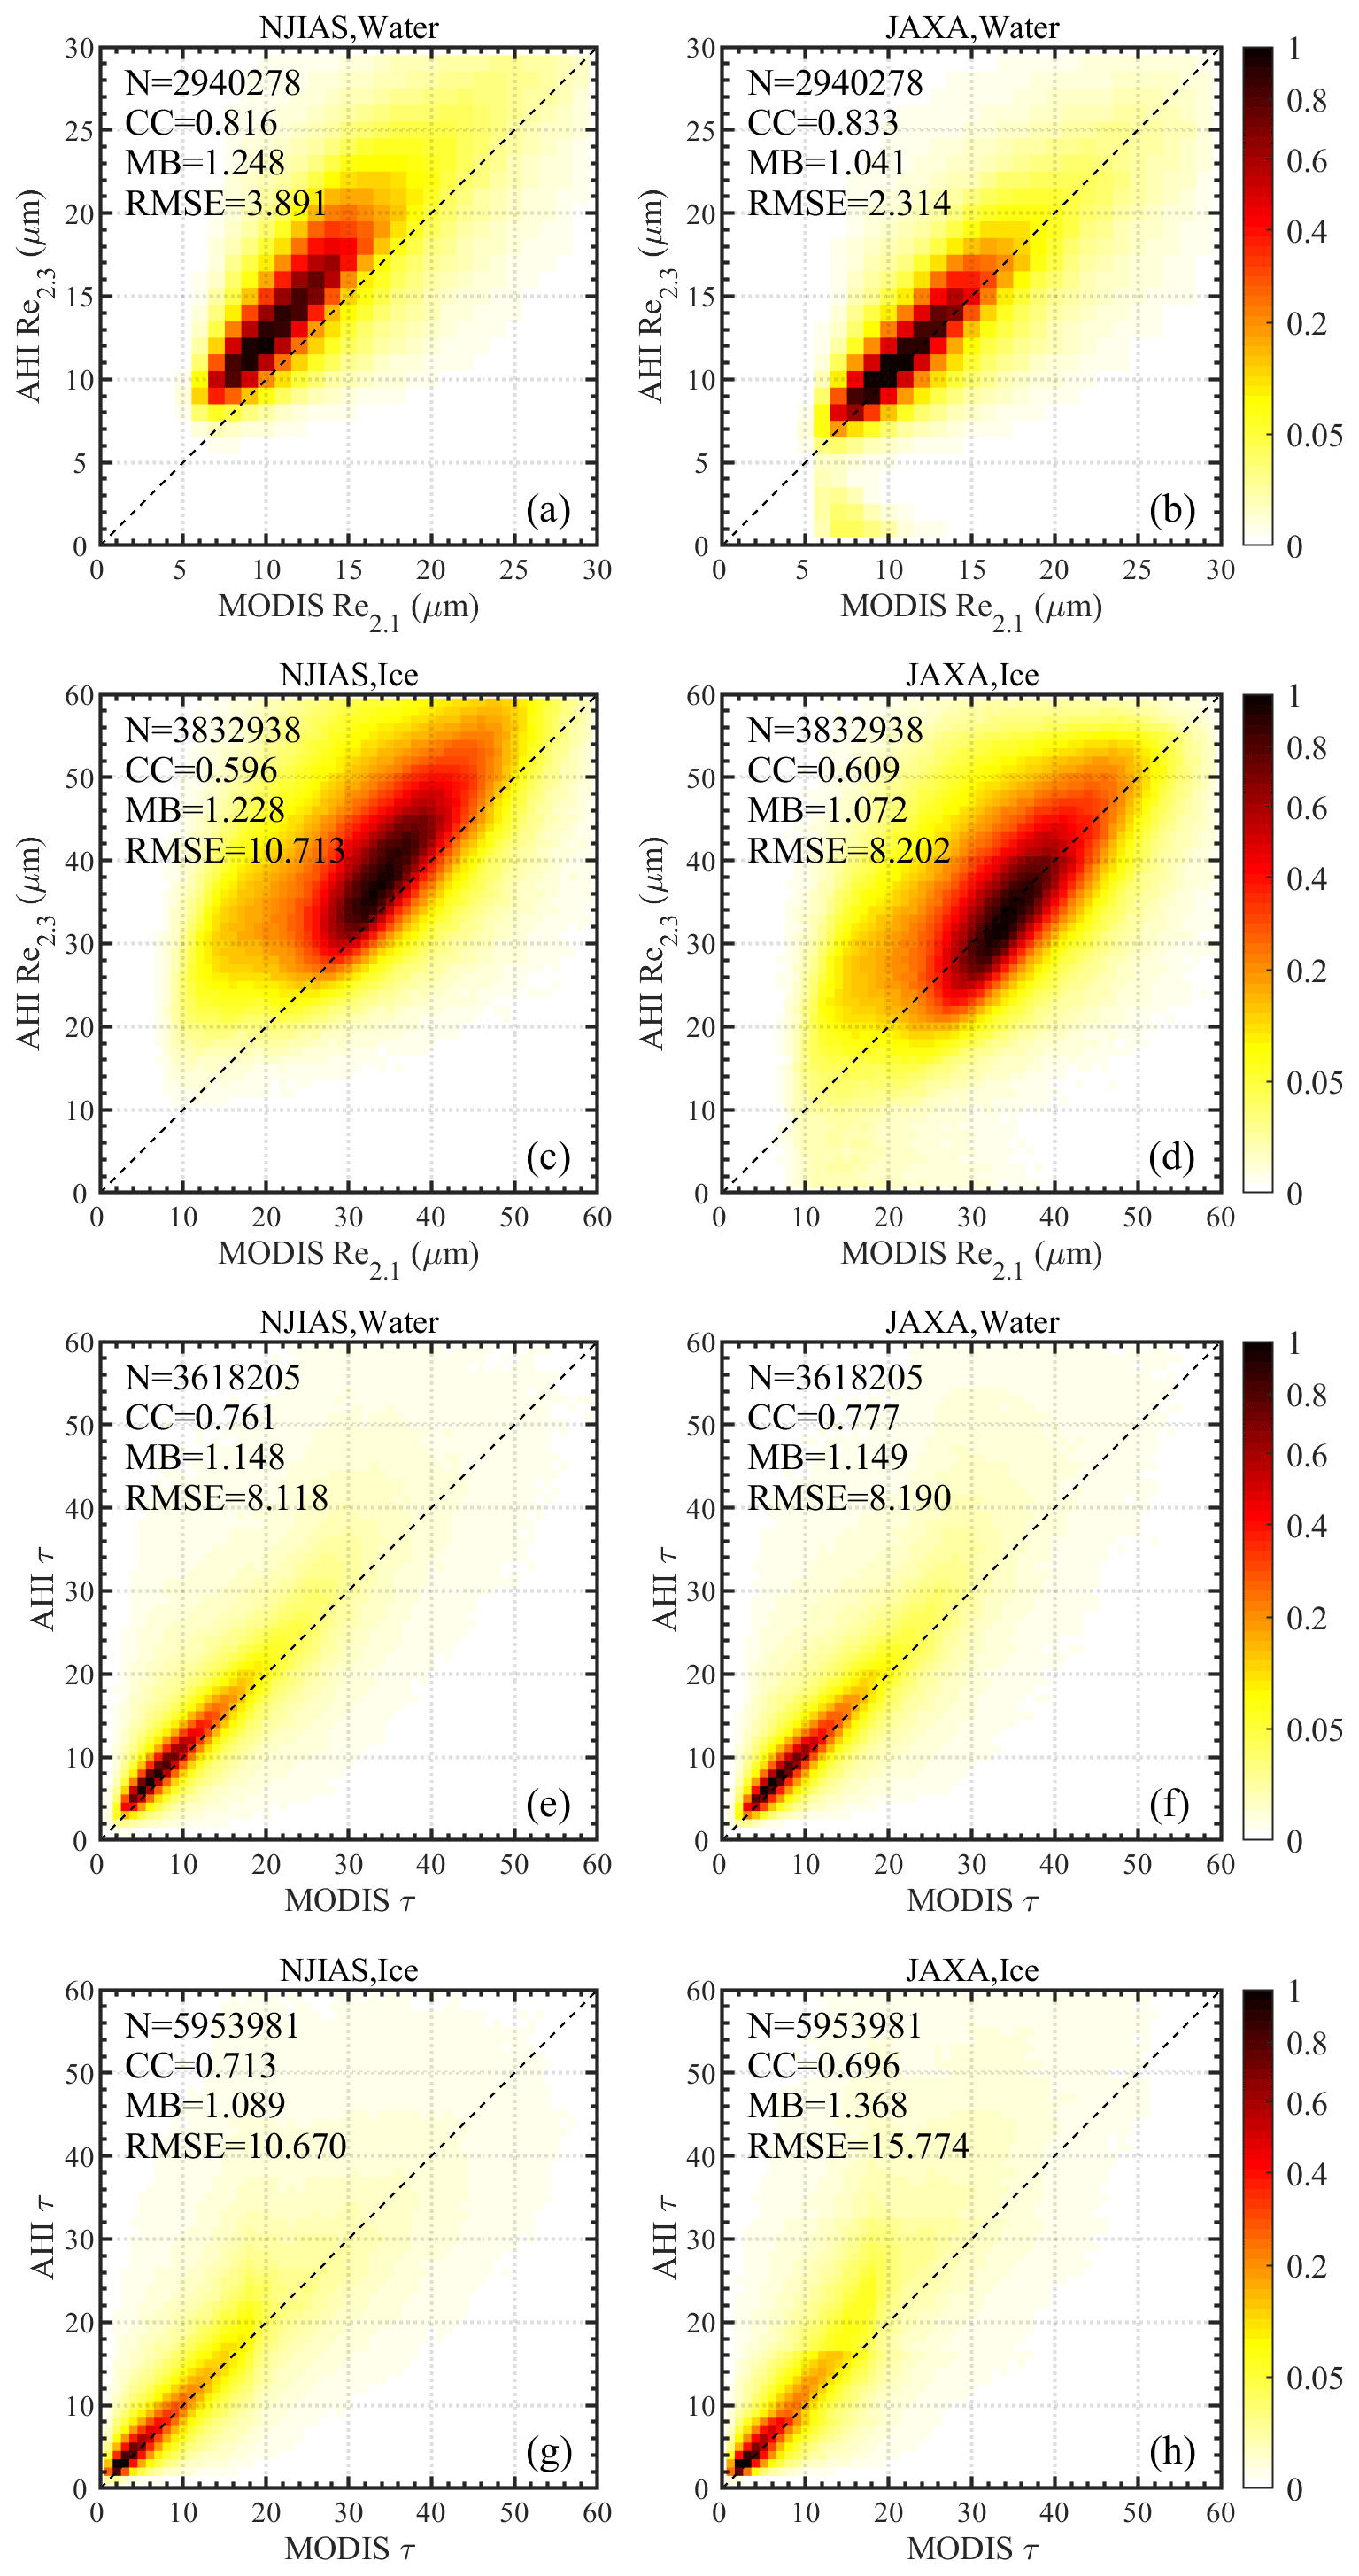
Figure 12Joint probability density histograms of (a–d) Re2.1 [Re2.3] and (e–h) τ between MYD06 and NJIAS (a, c, e, and g) and between MYD06 and JAXA (b, d, f, and h) datasets for (a, b, e, f) liquid-water and (c, d, g, h) ice clouds during daytime in June, July, and August 2017.
The JAXA dataset only provides one pair of Re and τ derived using 0.64 and 2.3 µm channels. Figure 12 compares the results between the NJIAS and JAXA retrievals. Note that the sample sizes are less than those in Fig. 11 due to a large number of retrieval failures in the JAXA algorithm. The NJIAS Re2.3 retrievals in both liquid-water and ice clouds show a systematic overestimation (∼ 2 µm) when MYD06 Re2.1 retrievals are regarded as the “truth”. The overestimations are likely due to a discrepancy in the sensor central wavelengths, which will affect the reflectance observations and the DCOMP LUTs (Wang et al., 2018). Interestingly, the overestimations are not found in the JAXA retrievals. A detailed comparison of the LUTs used by the NJIAS and the JAXA is essential. The performances of the τ retrievals from NJIAS and JAXA are similar in general, except for a slight overestimation of ice clouds in the JAXA products.
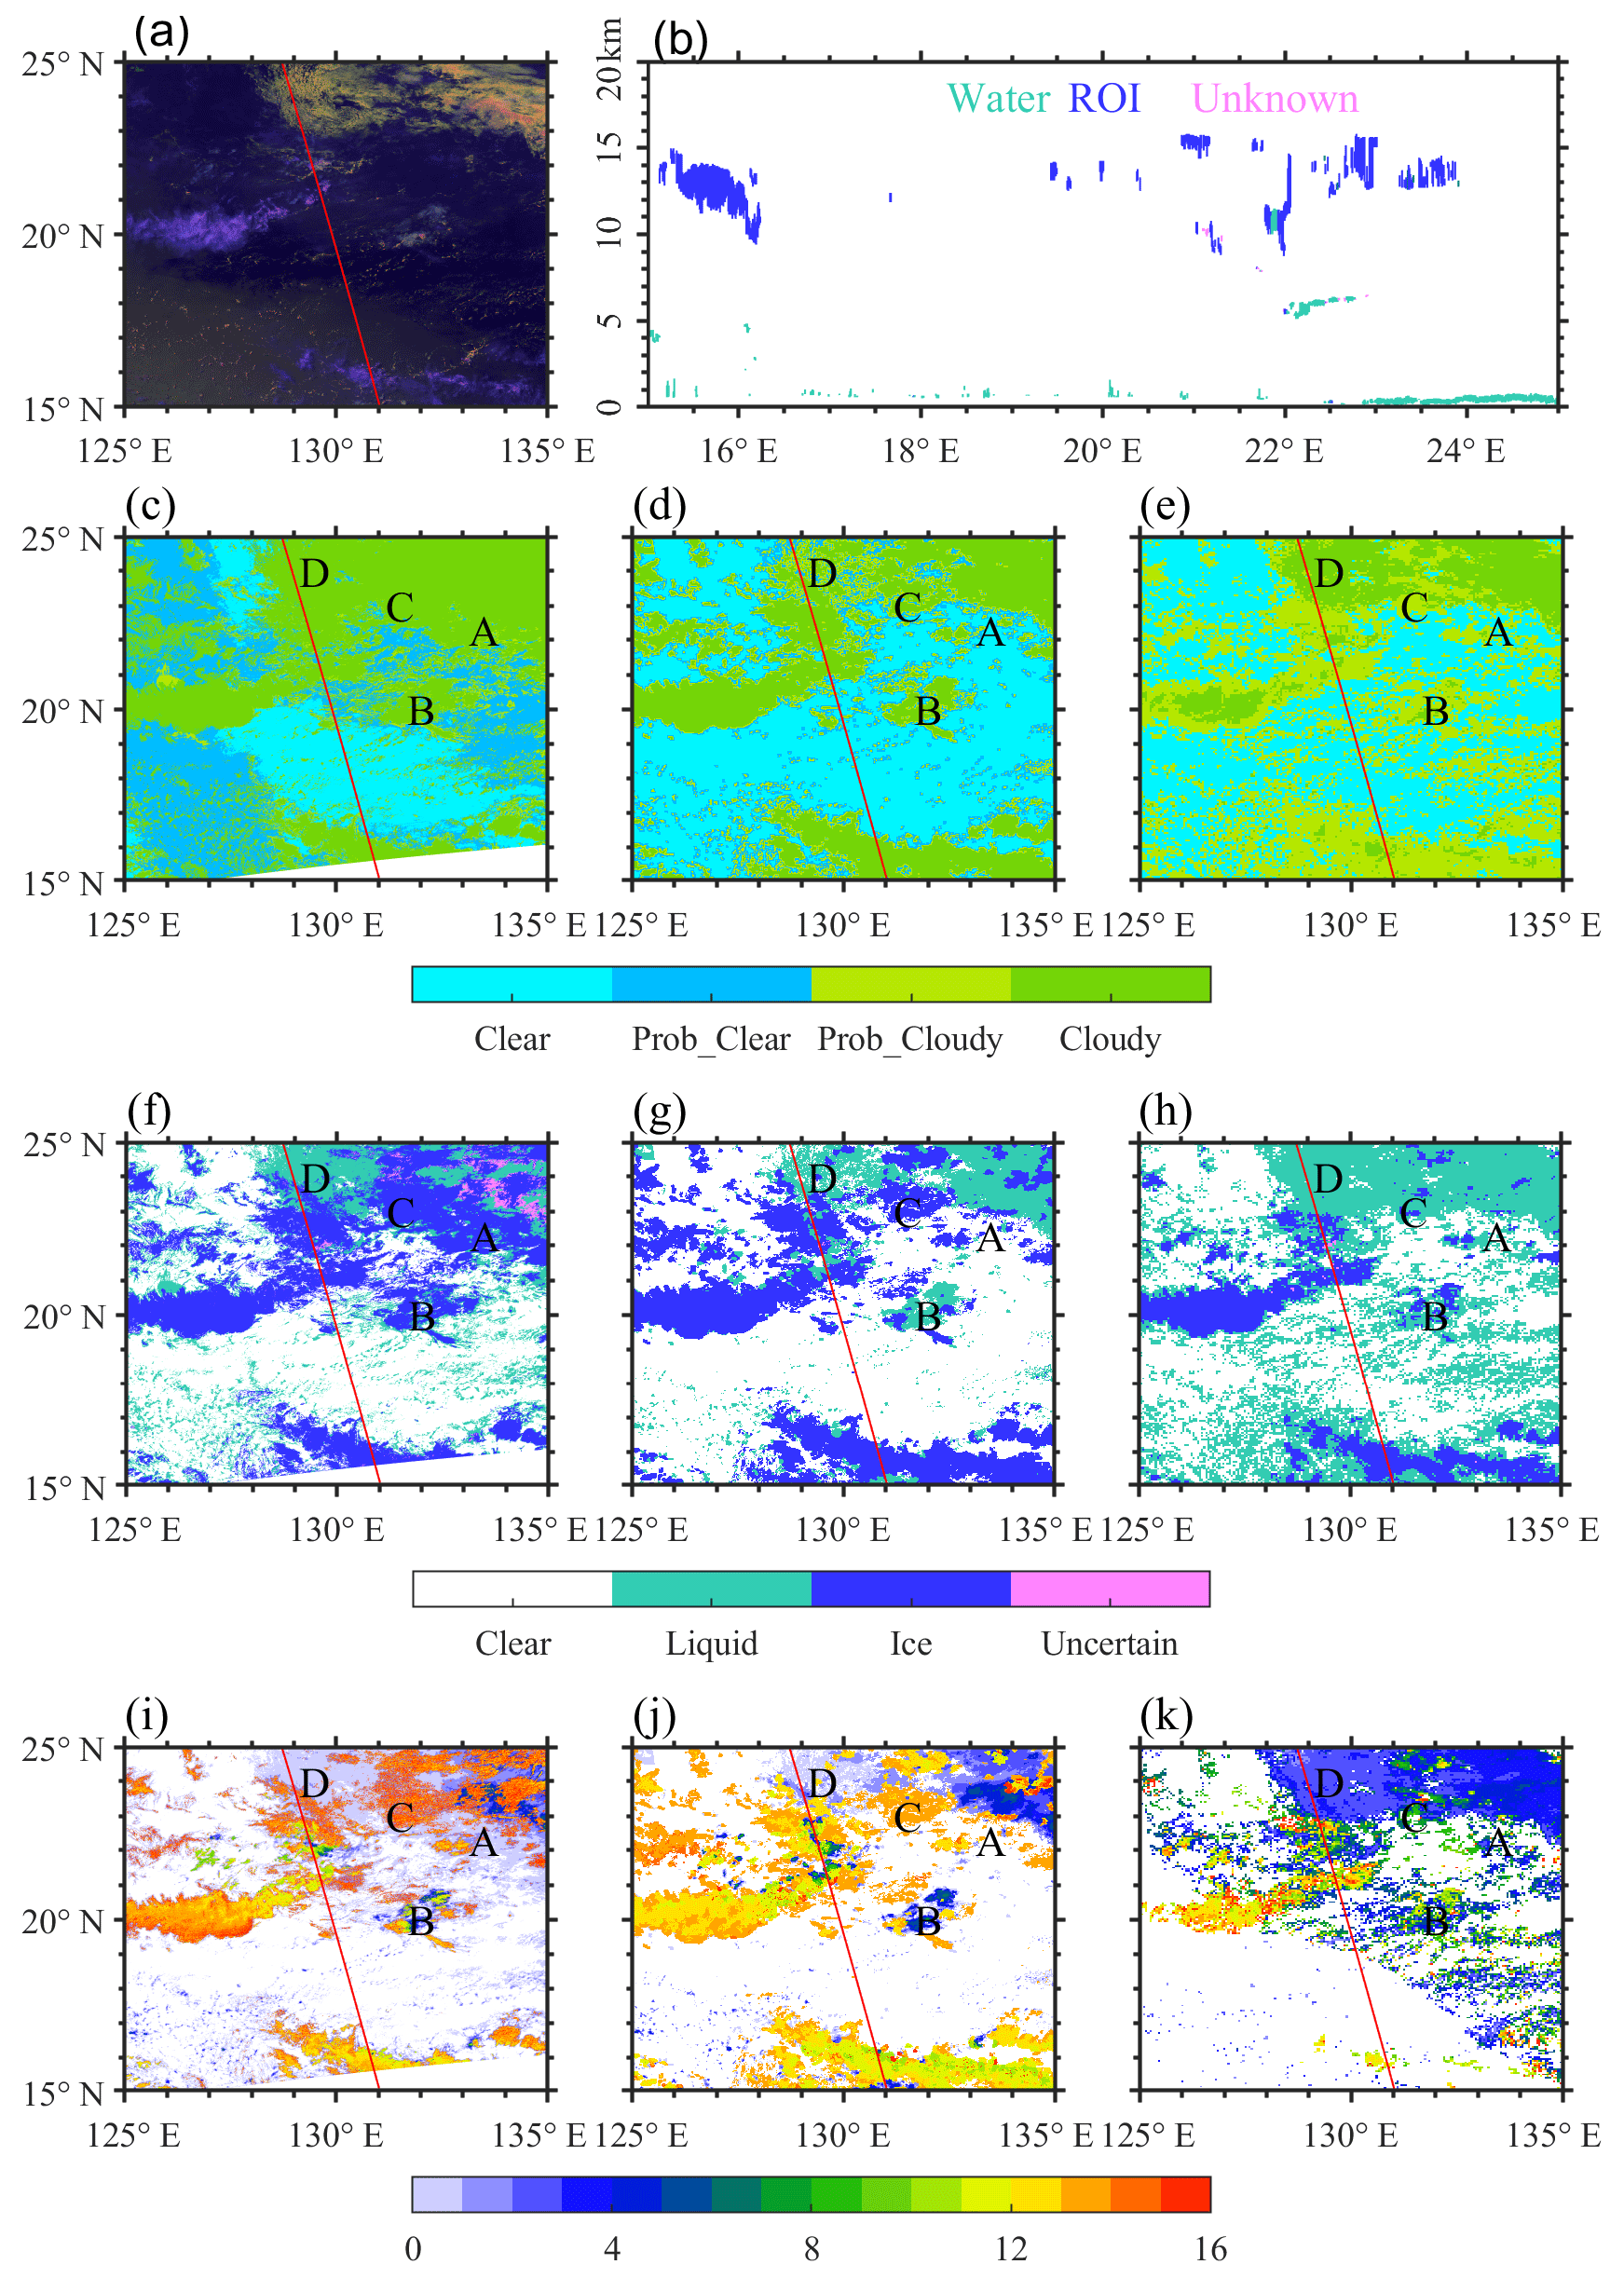
Figure 13A case at 04:50 UTC on 7 June 2017 illustrating the differences in cloud retrievals among three datasets. (a) AHI false-color image (red, 0.64 µm; green, 1.6 µm; blue, 11.2 µm reversed), (b) CALIOP cloud phase profile, and (c–e) cloud mask, (f–h) cloud-top phase, and (i–k) CTH (unit: ) results from the MYD06 (c, f, i), NJIAS (d, g, j), and JAXA (e, h, k) datasets. The red line in (a) and (c–k) indicates the CALIOP track.
3.5 Case study
To better illustrate the differences in cloud retrievals among three datasets, a case occurring over the WNP at 04:50 UTC on 7 June 2017 is presented (Fig. 13). At this time, the lower-right parts of the AHI Vis and SWIR images were contaminated by sunglint (Fig. 13a).
Cloud mask results in the three datasets exhibit significant discrepancies in region A, where MYD06 indicates cloudiness (Fig. 13c), while NJIAS and JAXA indicate clear conditions (Fig. 13d and e). It can been inferred that the MYD06 identifies region A as cirrus because the cloud-top phase derived by the MYD06 was ice (Fig. 13f). Besides, the JAXA product classifies some clear-sky pixels and a majority of cloudy pixels as probably cloudy over the sunglint areas (Fig. 13e). This is the reason why the JAXA dataset has high PODs but also high FARs.
The MYD06 misclassifies water clouds in region B (which appear white on the false-color image) as ice clouds. However, both the MYD06 and NJIAS products demonstrate good performances in multilayer cloud cases. Both datasets report an ice phase in region C where thin cirrus clouds were overlying low-level water clouds (Fig. 13f and g). By contrast, the JAXA product gives a liquid-water phase in region C (Fig. 13h), suggesting that the JAXA cloud-top phase algorithm requires further enhancement.
The NJIAS dataset underestimates the CTH of high-level clouds by 0.5–1 km when compared to the MYD06 product. Nevertheless, the MYD06 has obvious limitations in the CTH estimations for thin cirrus. For example, the ice-phase clouds (i.e., cirrus) in region A have a CTH of less than 1 km, which is not reasonable. The JAXA dataset fails in the CTH retrievals over the sunglint areas. According to the CALIOP observations (Fig. 13b), region D was covered by fog, with a CTH of less than 1 km. However, the JAXA CTH values in region D are ∼ 3 km, higher than those reported by both MYD06 and NJIAS. JAXA also tends to underestimate the CTH of multilayer clouds by ∼ 5 km. All of the above reveal some shortcomings of the JAXA CTH algorithm.
4.1 Cloud climatology in southwestern China
The climate in southwestern China is controlled by the East Asian and South Asian monsoons in combination with the complex terrain. During the cold season (November–April), a quasi-stationary front frequently occurs over the Yunnan–Guizhou Plateau (Cai et al., 2022), resulting in a sharp contrast of weather conditions on its two sides: cloudy or rainy sky in Guizhou province (24–29° N, 103–109° E) but clear sky in Yunnan province (21–29° N, 97–106° E). Meanwhile, the moist environment and calm winds provide favorable conditions for the frequent foggy weather over the Sichuan Basin (28–32° N, 103–108° E).
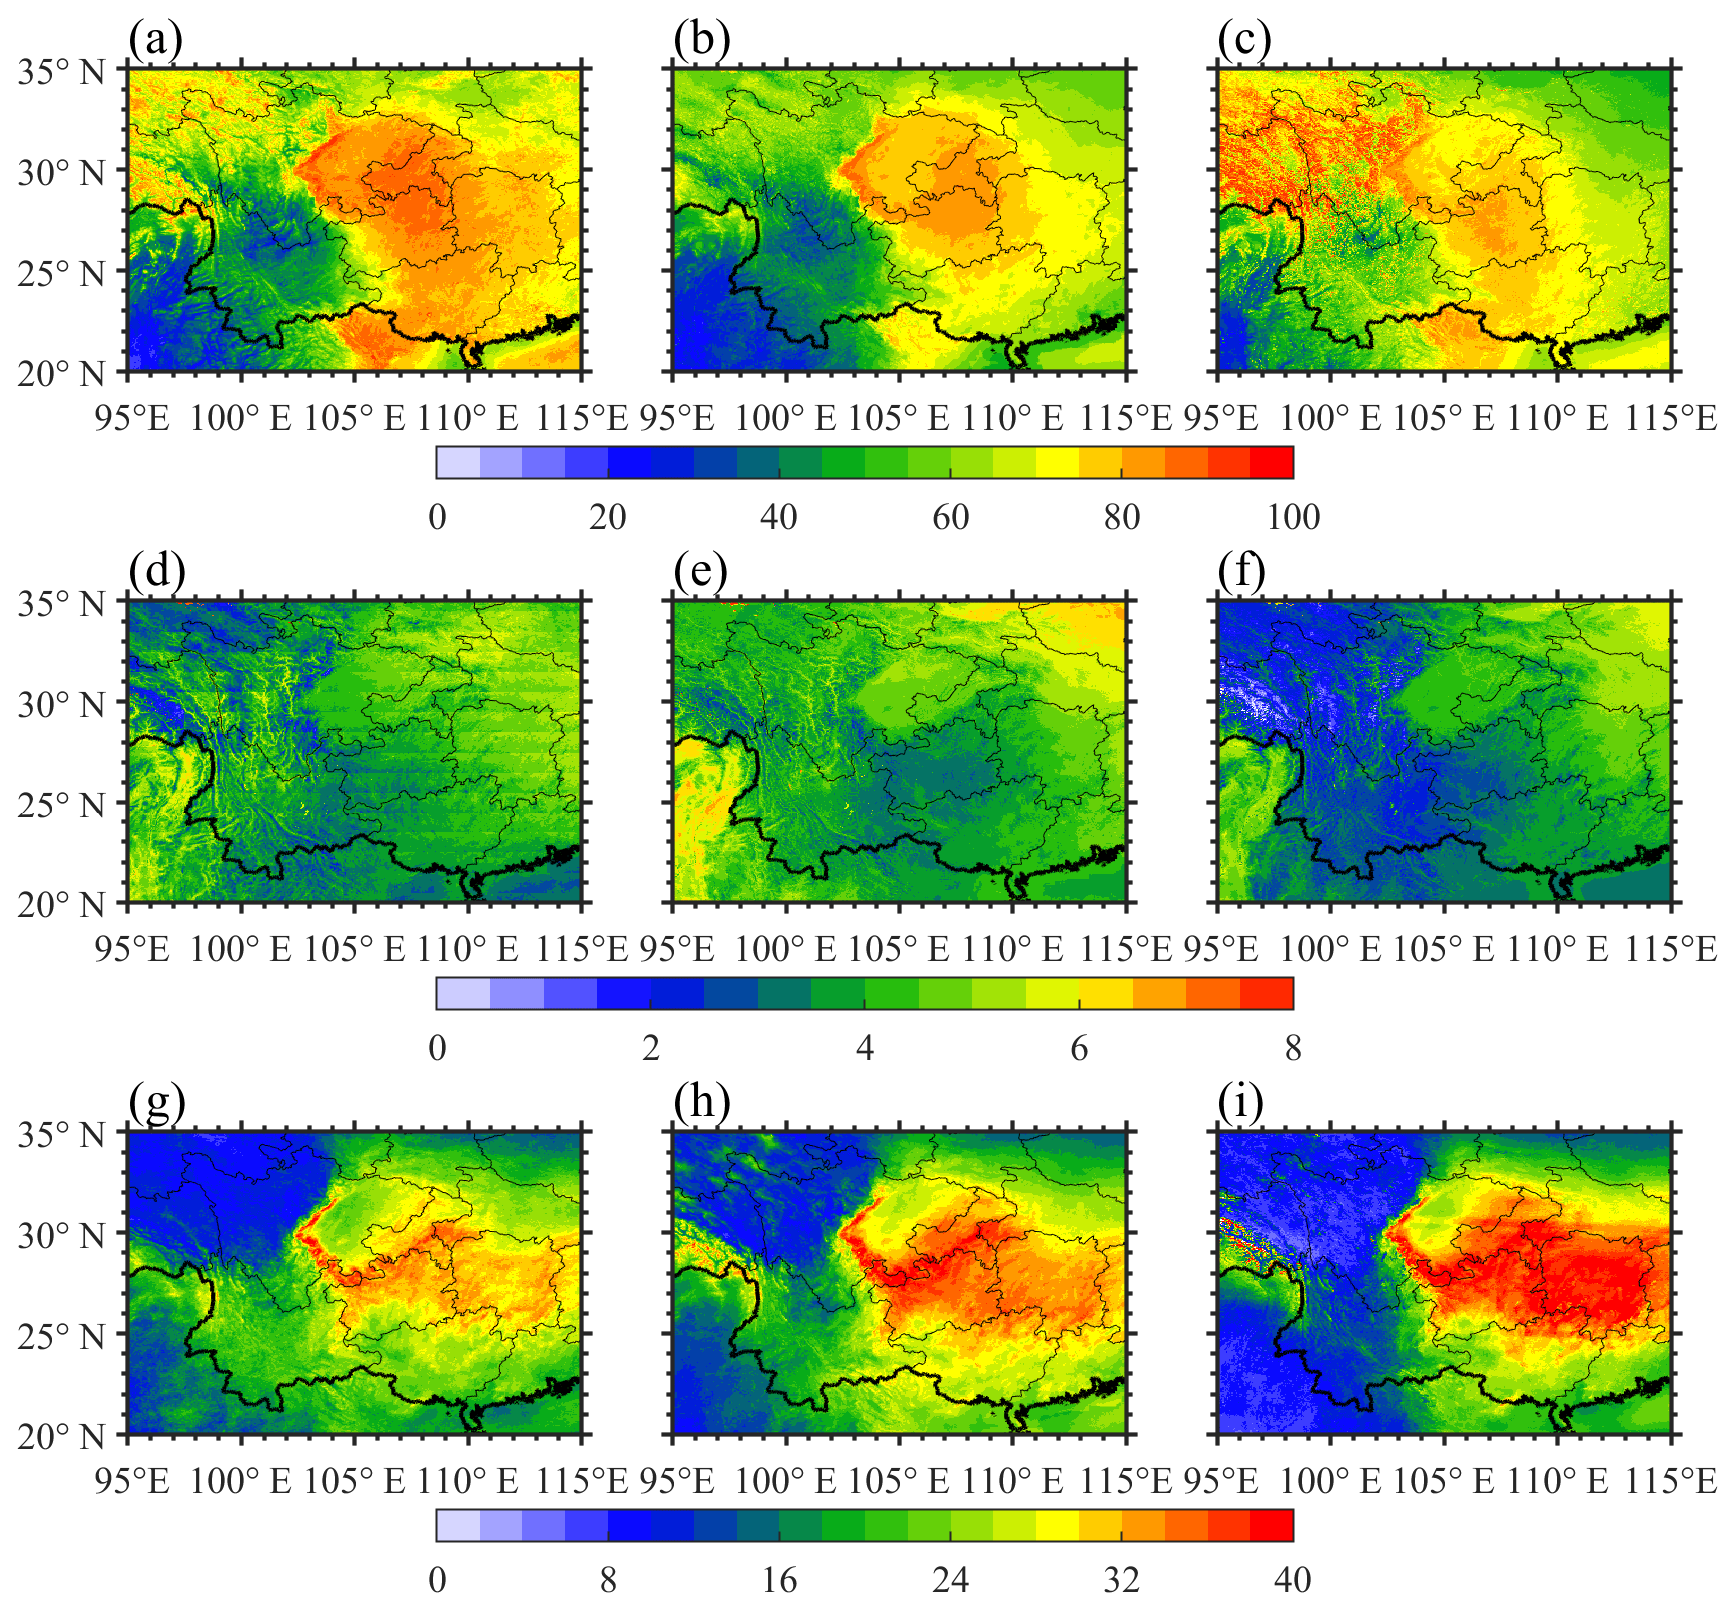
Figure 14Spatial distributions of (a–c) cloud occurrence frequency (unit: %), (d–f) averaged CTH (unit: ), and (g–i) τ (unitless) within 0.05° × 0.05° grid boxes over southwestern China using 5-year boreal cold-season cloud products of MYD06 (a, d, and g), NJIAS (b, e, and h), and JAXA (c, f, and i) datasets. Only daytime data are retained.
Figure 14 presents a simple analysis of the cloud climatology over southwestern China based on the cloud products in the cold seasons during the period 2016–2020. Three daytime variables including cloud mask, CTH, and τ are employed. The MODIS/Aqua provides daytime observations at most once per day at ∼ 13:30 LST (local solar time). Therefore, results from the MYD06 are for reference only. It can be seen that the NJIAS HCFD provides a reasonable description of the spatial distribution of cloud covers over southwestern China in the cold season. The cloud occurrence frequencies are ∼ 30 % over Yunnan and ∼ 80 % over Guizhou. However, the JAXA dataset presents a weaker contrast of cloud occurrence frequencies on the two sides of the quasi-stationary front. The cloud occurrence frequencies are as high as ∼ 50 % over Yunnan, which is only 30 % less than those over Guizhou. Moreover, the JAXA returns a factitious high frequency of greater than 90 % cloud occurrences in the eastern part of the Tibetan Plateau (26–35° N, 95–103° E), which is likely a result of mislabeling glacier or snow-covered areas as clouds (figures omitted). The spatial distributions of averaged CTH also exhibit large differences between the NJIAS and JAXA datasets. The JAXA tends to underestimate the CTH, especially in the areas where cloud cover is obviously overestimated. For the spatial pattern of the averaged τ, there is a distinct regional difference between the eastern and western parts of southwestern China. Thick clouds often occur over the eastern part of southwestern China while thin clouds often occur over the western part, which are revealed by both the NJIAS and JAXA datasets. Nonetheless, the thick (thin) clouds tend to have a greater (smaller) τ in the JAXA dataset than those in NJIAS dataset.
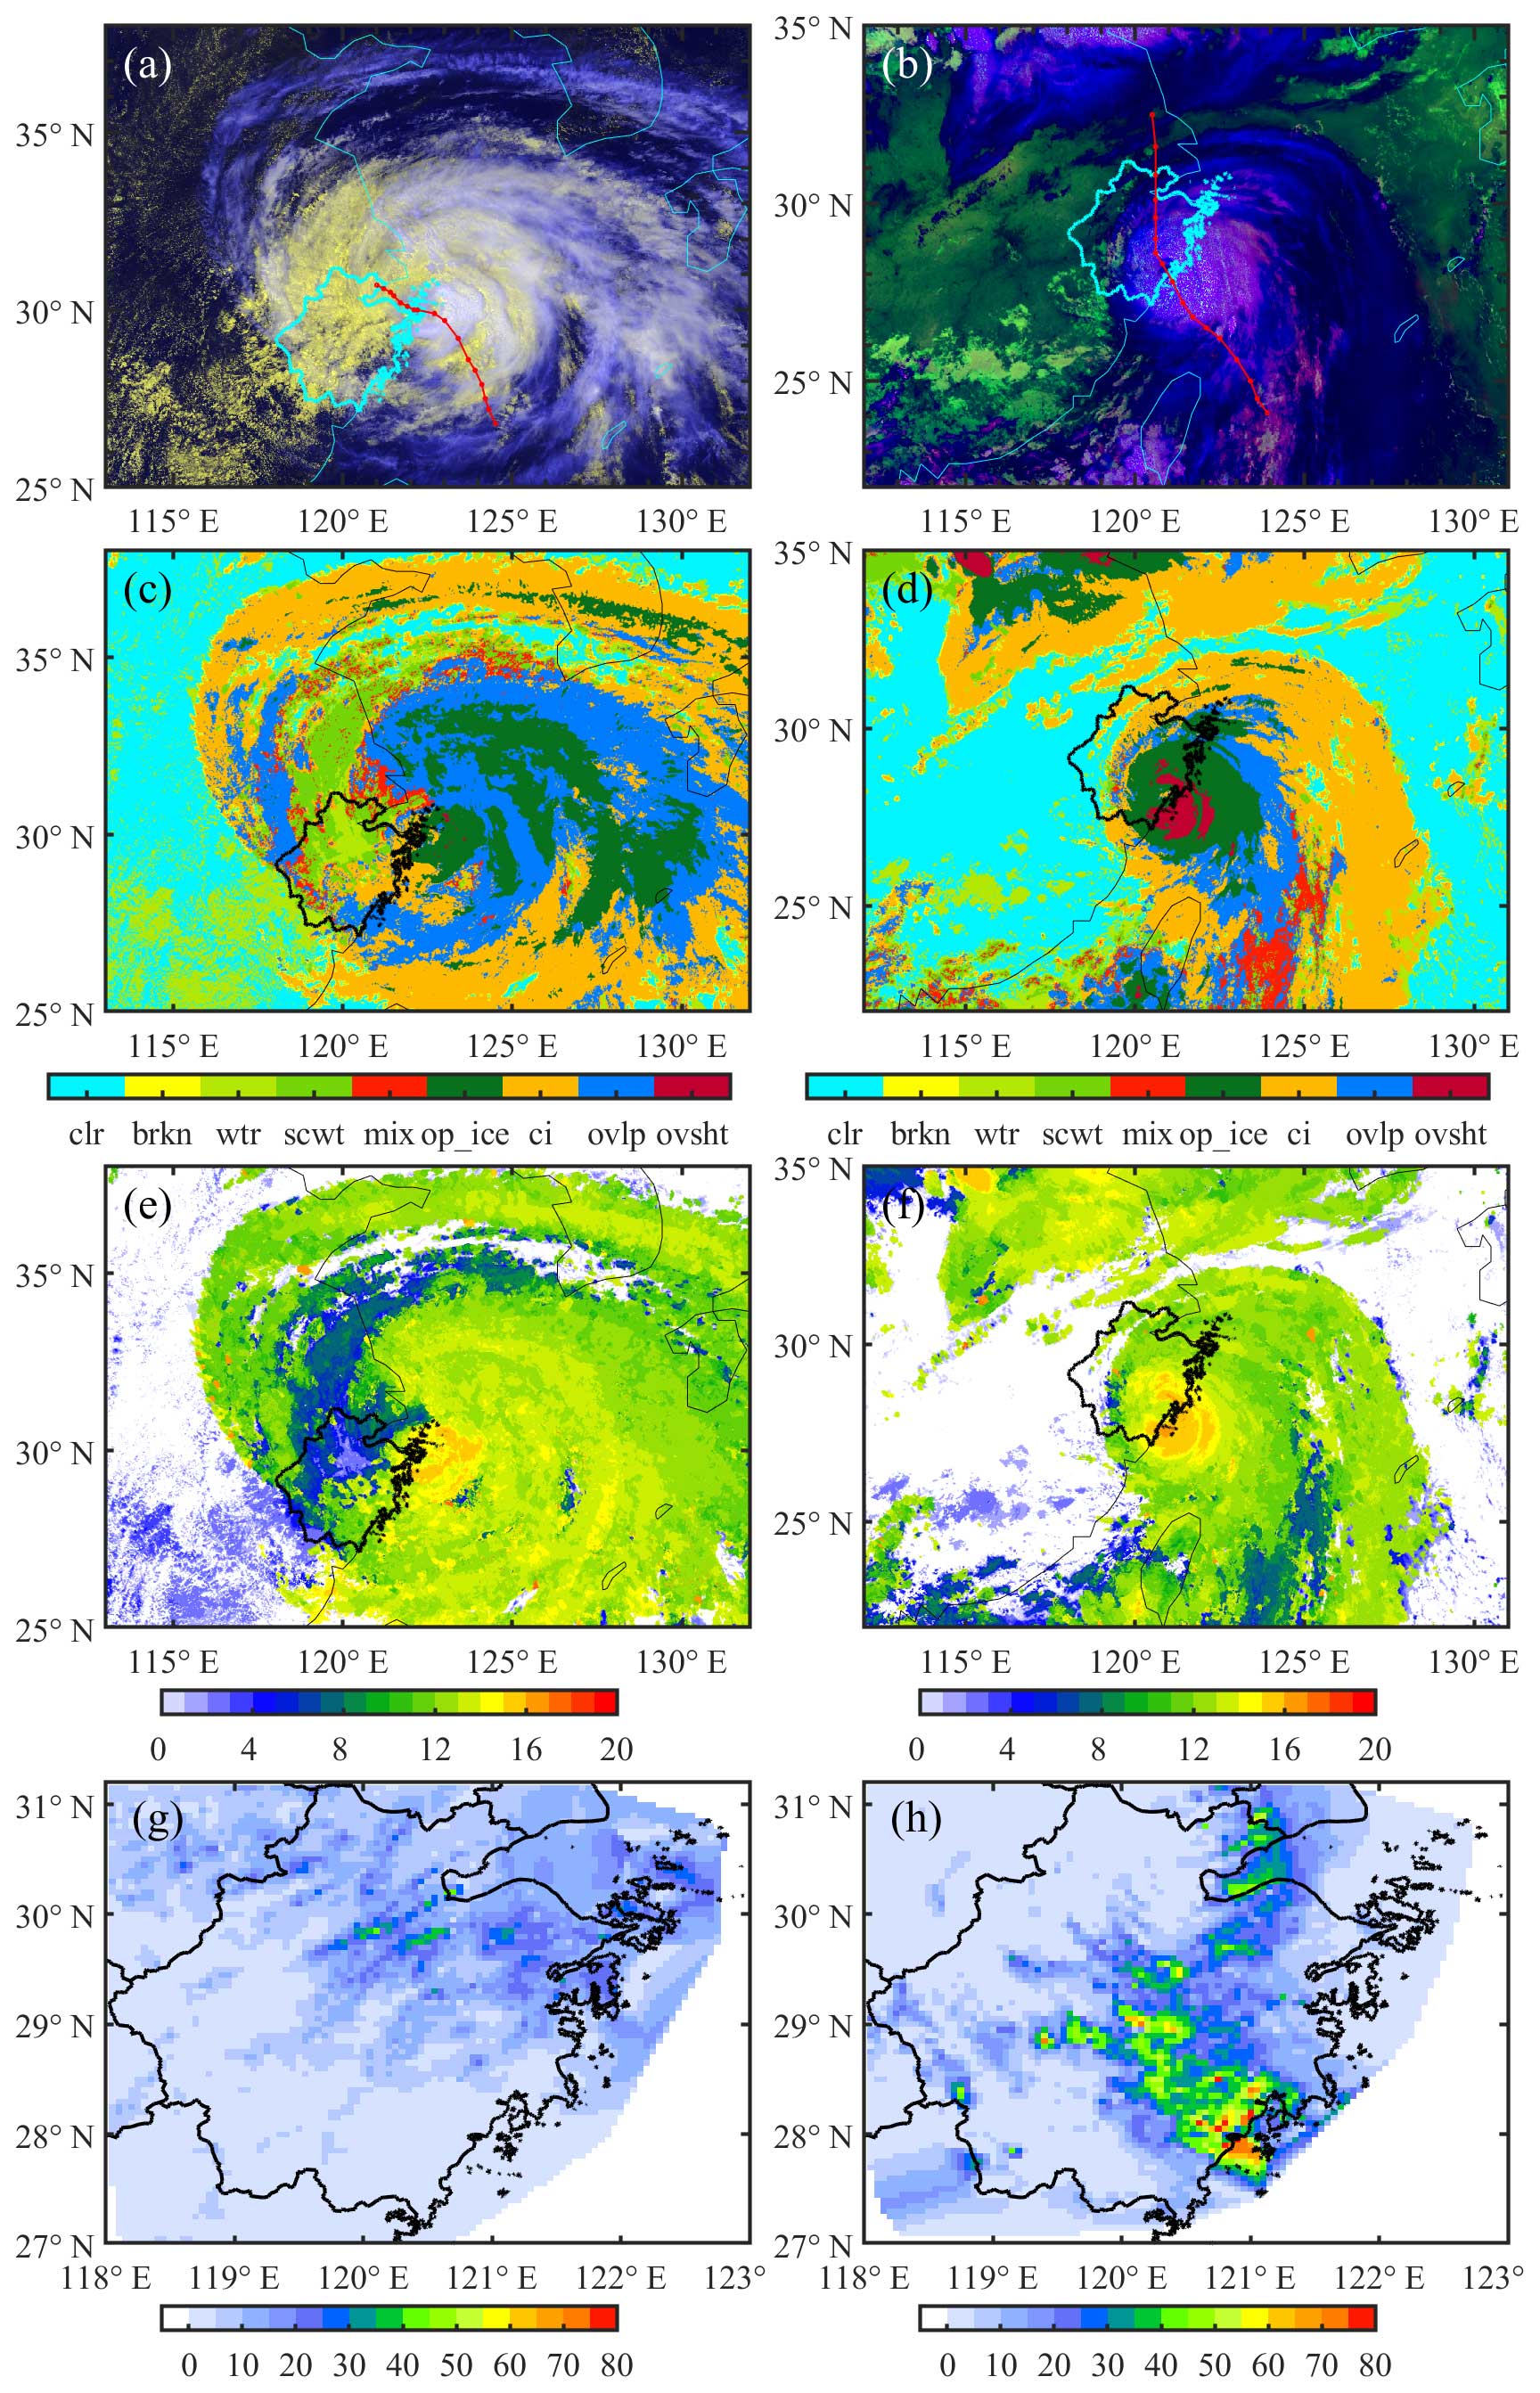
Figure 15Panels (a) and (b) show AHI TC-RGB composite images, as outlined in Chen et al. (2022), featuring two modes with distinct color representations: (a) for the day mode (red, 0.64 µm; green, 0.64 µm; blue, 11.2 µm reversed), cirrus appears blue, convective clouds appear white, and low clouds appear yellow. (b) For the night mode (red, 12.3–10.4 µm; green, 10.4–3.9 µm; blue, 11.2 µm reversed), cirrus appears blue, low clouds appear bright green, and convective clouds appear dark violet. (c, d) Cloud types including clear (clr), broken (brkn), warm water (wtr), supercooled water (scwt), mixed (mix), opaque-ice (op_ice), cirrus (ci), overlapped (ovlp), and overshooting (ovsht). (e, f) CTH (unit: ) at the landfalling time tlf as well as (g, h) maximum gauge rain rate within the tlf ± 24 h time window (unit: mm h−1) for typhoons In-Fa (2021) (a, c, e, g) and Hagupit (2020) (b, d, f, h). The thick lines denote the boundaries of Zhejiang province. The red curve denotes the typhoon track at a 3 h interval during the tlf ± 24 h time window.
4.2 Cloud and precipitation features of landfalling typhoons
The NJIAS HCFD–TyWNP provides a comprehensive description of cloud macrophysical and microphysical characteristics within a 20° × 20° longitude–latitude grid box surrounding the center of WNP typhoons. This product is useful for understanding cloud and precipitation features of typhoons. Figure 15 illustrates the utility of the NJIAS HCFD–TyWNP for analyzing the intensity of rainfall in typhoons In-Fa (2021) and Hagupit (2020). Typhoon In-Fa (2021) brought record-breaking hourly rainfall to Henan province on 21 July 2021 when it was still positioned offshore (Wei et al., 2023). In-Fa made its first landfall at 04:30 UTC on 25 July on the Zhoushan islands on the northern coast of Zhejiang province with a minimum central pressure of 970 hPa according to the best track records (Lu et al., 2021). Prior to its first landfall in Zhejiang, the central dense overcast (CDO) of In-Fa gradually disintegrated and the convection weakened. The eastern half of the CDO was characterized by extensive cumulonimbus clouds with a CTH of 14 km. Due to land effects, the western half of the CDO was dominated by liquid-water clouds, with a significantly low CTH and very weak vertical motion. As a result, 24 h before and after In-Fa made the first landfall, most areas of Zhejiang province experienced stable stratiform precipitation. The rain rates measured by rain gauges were generally weak, mainly 5–20 mm h−1, and the local maximum rain rate was only 49.0 mm h−1. The rain rate at the landing site was only 29 mm h−1. Typhoon Hagupit (2020), by contrast, made its landfall at 19:30 UTC on 3 August 2020 in southeastern Zhejiang, with a minimum central pressure of 965 hPa, similar to the intensity of In-Fa (2021) when making landfall. However, during the landfall of Hagupit, the CDO distribution was complete and compact. As a result, rainstorms were produced along the track of Hagupit. The maximum rain rate measured by rain gauges in Zhejiang during the 24 h before and after the landfalling time of Hagupit was 98.7 mm h−1.
The NJIAS HCFD described in this article was released to the general public. Since the Science Data Bank accepts up to 1 TB per data publication, the NJIAS HCFD–0.04 Deg was divided into four parts and published at https://doi.org/10.57760/sciencedb.09950 (Zhuge, 2023a), https://doi.org/10.57760/sciencedb.09953 (Zhuge, 2023b), https://doi.org/10.57760/sciencedb.09954 (Zhuge, 2023c), and https://doi.org/10.57760/sciencedb.10158 (Zhuge, 2023d). The NJIAS HCFD–TyWNP is published at https://doi.org/10.57760/sciencedb.09945 (Zhuge, 2023e).
To supplement the JAXA Himawari-8/9 operational cloud products, which are daytime only, a dataset named NJIAS HCFD was constructed. The NJIAS HCFD dataset provides 30 variables (e.g., cloud mask, cloud-top phase, CTH, τ, and Re as well as snow, dust, and haze masks) and covers a vast majority of the East Asia and WNP regions over the 7-year period from April 2016 to December 2022. In this study, the NJIAS HCFD data quality was evaluated against the CALIOP 1 km cloud layer product and the Collection 6.1 MYD06 dataset. The evaluation results are summarized as follows.
-
The POD and FAR of the NJIAS HCFD for cloud detections are ∼ 88 % and ∼ 6 %, respectively. The NJIAS HCFD gives higher skill scores than the MYD06 during nighttime. For daytime scenarios, the NJIAS HCFD lags behind the MYD06 but outperforms the JAXA dataset. Note that in the statistical analysis, CALIOP cases with sub-pixel cloudiness or very thin cirrus (Karlsson and Håkansson, 2018; Karlsson et al., 2023) were excluded.
-
The three cloud height parameters (CTT, CTH, and CTP) derived from the NJIAS HCFD show better agreement with the CALIOP data than those obtained from the MYD06. The NJIAS retrievals tend to slightly underestimate CTH and overestimate both CTP and CTT for high clouds. The JAXA product has a more pronounced tendency to underestimate the CTH and overestimate the CTT of mid- to high-level clouds.
-
The PODs of the NJIAS phase determinations for the CALIOP liquid-water and ROI cloud tops are 82.60 % (82.17 %) and 88.59 % (85.35) over ocean (land), respectively. Problems are found for the MYD06 and JAXA retrievals, such as misclassifying pixels with a CTT greater than 0 °C as ice phase over ocean and misclassifying pixels with a CTT below −40 °C as non-ice phase over land.
-
Overall, the NJIAS DCOMP retrievals have high correlations with the Collection 6.1 MYD06 results, with CCs ranging from 0.722 to 0.853. The JAXA dataset only provides Re values retrieved from the AHI 2.3 µm channel. However, the overestimation in the NJIAS Re2.3 retrieval is not found in the JAXA retrievals.
The NJIAS HCFD is subject to uncertainties. For example, the NCEP FNL analysis with a 6 h temporal resolution, although having been interpolated to align with AHI observation times, is insufficient for capturing the rapid changes in land surface temperatures observed in certain regions and during specific times of the day, such as early morning hours. The accuracy of the fog and snow masks, which heavily depend on land surface temperature observations, could be compromised due to an inability to imprecisely represent diurnal temperature variations. Furthermore, given the systematic overestimation found in the NJIAS Re2.3 retrieval, an in-depth inter-sensor radiometric analysis is crucial. A radiometric adjustment factor, which excludes the effect of central wavelength shift, can be employed for aligning the AHI relative radiometric calibration more closely with that of the MODIS. The quantitative assessment of the uncertainties associated with the NJIAS HCFD will be the focus of future investigations.
Despite the issues addressed above, it is anticipated that the NJIAS HCFD will play an important role in monitoring the evolutions of convection and weather systems, studying aerosol–cloud–precipitation–climate interactions, and evaluating cloud parameterization schemes in weather and climate models. Two examples presented in this article demonstrate the use of the NJIAS HCFD for climate and typhoon research. In the future, the time period of the dataset will be extended continuously. More cloud variables, such as cloud-base height and nighttime optical and microphysical parameters, may be added to the dataset by using the deep-learning-based cloud retrieval algorithms recently developed by Wang et al. (2022, 2023).
XZh conceived the idea and prepared the data. XZh, XZo, and LY drafted the manuscript. All authors contributed to manuscript revisions.
The contact author has declared that none of the authors has any competing interests.
Publisher's note: Copernicus Publications remains neutral with regard to jurisdictional claims made in the text, published maps, institutional affiliations, or any other geographical representation in this paper. While Copernicus Publications makes every effort to include appropriate place names, the final responsibility lies with the authors.
JAXA distributes the Himawari-8/9 raw data and level-2 cloud products (https://www.eorc.jaxa.jp/ptree/, last access: 8 March 2023). NASA's official website (https://earthdata.nasa.gov/, last access: 31 March 2021) provides the MYD06 and CALIOP cloud products. The authors also thank the editors and anonymous reviewers for their helpful comments and valuable suggestions, which improved the paper.
This work was financially supported by the National Natural Science Foundation of China (grant no. 42175006), Jiangsu Youth Talent Promotion Project (grant no. 2021-084), CMA Scientific and Technological Innovation Team Construction Project (grant no. CMA2023ZD06), the Fengyun Application Pioneering Project (grant no. FY-APP-2021.0101), and the Basic Research Fund of Chinese Academy of Meteorological Sciences (grant nos. 2020R002, 2021Z002, 2021Y013, 2021Y014).
This paper was edited by Qingxiang Li and reviewed by two anonymous referees.
Avery, M. A., Ryan, R. A., Getzewich, B. J., Vaughan, M. A., Winker, D. M., Hu, Y., Garnier, A., Pelon, J., and Verhappen, C. A.: CALIOP V4 cloud thermodynamic phase assignment and the impact of near-nadir viewing angles, Atmos. Meas. Tech., 13, 4539–4563, https://doi.org/10.5194/amt-13-4539-2020, 2020.
Baum, B. A., Menzel, W., Frey, R., Tobin, D., Holz, R., Ackerman, S., Heidinger, A., and Yang, P.: MODIS Cloud-Top Property Refinements for Collection 6, J. Appl. Meteorol. Clim., 1145–1163, https://doi.org/10.1175/JAMC-D-11-0203.1, 2012.
Baum, B. A., Yang, P., Heymsfield, A. J., Bansemer, A., Merrelli, A., Schmitt, C., and Wang, C.: Ice cloud bulk single-scattering property models with the full phase matrix at wavelengths from 0.2 to 100 µm, J. Quant. Spectrosc. Ra., 146, 123–139, https://doi.org/10.1016/j.jqsrt.2014.02.029, 2014.
Bessho, K., Date, K., Hayashi, M., Ikeda, A., Imai, T., Inoue, H., Kumagai, Y., Miyakawa, T., Murata, H., Ohno, T., Okuyama, A., Oyama, R., Sasaki, Y., Shimazu, Y., Shimoji, K., Sumida, Y., Suzuki, M., Taniguchi, H., Tsuchiyama, H., Uesawa, D., Yokota, H., and Yoshida, R.: An Introduction to Himawari-8/9 – Japan's New-Generation Geostationary Meteorological Satellites, J. Meteorol. Soc. Jpn., 94, 151–183, https://doi.org/10.2151/jmsj.2016-009, 2016.
Cai, D., Tao, L., Yang, X., Sang, X., Fang, J., Sun, X., Wang, W., and Yan H.: A climate perspective of the quasi-stationary front in southwestern China: structure, variation and impact, Clim. Dynam., 59, 547–560, https://doi.org/10.1007/s00382-022-06151-1, 2022.
Calvert, C. and Pavolonis, M. J.: GOES-R Advanced Baseline Imager (ABI) Algorithm Theoretical Basis Document for Low Cloud and Fog (Version 1.0), 78 pp., NOAA/NESDIS/STAR, https://www.star.nesdis.noaa.gov/goesr/documents/ATBDs/Baseline/ATBD_GOES-R_Fog_v1.0_Sep2010.pdf (last access: 30 September 2023), 201.
Chen, L., Zhuge, X., Tang, X., Song, J., and Wang, Y.: A new type of red-green-blue composite and its application in tropical cyclone center positioning, Remote Sens.-Basel, 14, 539, https://doi.org/10.3390/rs14030539, 2022.
Emde, C., Buras-Schnell, R., Kylling, A., Mayer, B., Gasteiger, J., Hamann, U., Kylling, J., Richter, B., Pause, C., Dowling, T., and Bugliaro, L.: The libRadtran software package for radiative transfer calculations (version 2.0.1), Geosci. Model Dev., 9, 1647–1672, https://doi.org/10.5194/gmd-9-1647-2016, 2016.
Han, Y., Weng, F., Liu, Q., and van Delst, P.: A fast radiative transfer model for SSMIS upper atmosphere sounding channels, J. Geophys. Res., 112, D11121, https://doi.org/10.1029/2006JD008208, 2007.
Heidinger, A. K.: GOES-R Advanced Baseline Imager (ABI) Algorithm Theoretical Basis Document for Cloud Height (Version 3.0), 79 pp., NOAA/NESDIS/STAR, https://www.star.nesdis.noaa.gov/goesr/documents/ATBDs/Baseline/ATBD_GOES-R_Cloud_Height_v3.0_Jul2012.pdf (last access: 30 September 2023), 2012.
Heidinger, A. K. and Straka III, W. C.: GOES-R Advanced Baseline Imager (ABI) Algorithm Theoretical Basis Document for Cloud Mask (Version 3.0), 104 pp., NOAA/NESDIS/STAR, https://www.star.nesdis.noaa.gov/goesr/documents/ATBDs/Baseline/ATBD_GOES-R_Cloud_Mask_v3.0_Jul2012.pdf (last access: 30 September 2023), 2013.
Heymsfield, A. J., Schmitt, C., and Bansemer, A.: Ice cloud particle size distributions and pressure dependent terminal velocities from in situ observations at temperatures from 0° to −86 °C, J. Atmos. Sci., 70, 4123–4154, https://doi.org/10.1175/JAS-D-12-0124.1, 2013.
Holmlund, K., Grandell, J., Schmetz, J., Stuhlmann, R., Bojkov, B., Munro, R., Lekouara, M., Coppens, D., Viticchie, B., August, T., Theodore, B., Watts, P., Dobber, M., Fowler, G., Bojinski, S., Schmid, A., Salonen, K., Tjemkes, S., Aminou, D., and Blythe, P.: Meteosat Third Generation (MTG): Continuation and Innovation of Observations from Geostationary Orbit, B. Am. Meteorol. Soc., 102, E990–E1015, https://doi.org/10.1175/BAMS-D-19-0304.1, 2021.
Hu, Y., Winker, D., Vaughan, M., Lin, B., Omar, A., Trepte, C., Flittner, D., Yang, P., Nasiri, S., Baum, B., Holz, R., Sun, W., Liu, Z., Wang, Z., Young, S., Stamnes, K., Huang, J., and Kuehn, R.: CALIPSO/CALIOP cloud phase discrimination algorithm, J. Atmos. Ocean. Tech., 26, 2293–2309, https://doi.org/10.1175/2009JTECHA1280.1, 2009.
Hutchison, K. D., Iisager, B. D., Kopp, T. J., and Jackson, J. M.: Distinguishing Aerosols from Clouds in Global, Multispectral Satellite Data with Automated Cloud Classification Algorithms, J. Atmos. Ocean. Tech., 25, 501–518, https://doi.org/10.1175/2007JTECHA1004.1, 2008.
Imai, T. and Yoshida, R.: Algorithm Theoretical Basis for Himawari-8 Cloud Mask Product, Meteorological Satellite Center Technical Note, 61, 1–17, JMA/MSC, https://www.data.jma.go.jp/mscweb/technotes/msctechrep61-1.pdf (last access: 9 November 2023), 2016.
Kalnay, E., Kanamitsu, M., Kistler, R., Collins, W., Deaven, D., Gandin, L., Iredell, M., Saha, S., White, G., Woollen, J., Zhu, Y., Chelliah, M., Ebisuzaki, W., Higgins, W., Janowiak, J., Mo, K. C., Ropelewski, C., Wang, J., Leetmaa, A., Reynolds, R., Jenne, R., and Joseph, D.: The NCEP/NCAR 40-year reanalysis project, B. Am. Meteorol. Soc., 77, 437–470, https://doi.org/10.1175/1520-0477(1996)077<0437:TNYRP>2.0.CO;2, 1996.
Karlsson, K.-G. and Håkansson, N.: Characterization of AVHRR global cloud detection sensitivity based on CALIPSO-CALIOP cloud optical thickness information: demonstration of results based on the CM SAF CLARA-A2 climate data record, Atmos. Meas. Tech., 11, 633–649, https://doi.org/10.5194/amt-11-633-2018, 2018.
Karlsson, K.-G., Devasthale, A.,and Eliasson, S: Global Cloudiness and Cloud Top Information from AVHRR in the 42-Year CLARA-A3 Climate Data Record Covering the Period 1979–2020, Remote Sens.-Basel, 15, 3044, https://doi.org/10.3390/rs15123044, 2023.
Kawamoto, K., Nakajima, T., and Nakajima, T. Y.: A global determination of cloud microphysics with AVHRR remote sensing, J. Climate, 14, 2054–2068, https://doi.org/10.1175/1520-0442(2001)014<2054:AGDOCM>2.0.CO;2, 2001.
Khanal, S. and Wang, Z.: Uncertainties in MODIS-based cloud liquid water path retrievals at high latitudes due to mixed-phase clouds and cloud top height inhomogeneity, J. Geophy. Res.-Atmos., 123, 11154–11172. https://doi.org/10.1029/2018JD028558, 2018.
Korolev, A., McFarquhar, G., Field, P. R., Franklin, C., Lawson, P., Wang, Z., Williams, E., Abel, S. J., Axisa, D., Borrmann, S., Crosier, J., Fugal, J., Krämer, M., Lohmann, U., Schlenczek, O., Schnaiter, M., and Wendisch, M.: Mixed-Phase Clouds: Progress and Challenges, Meteor. Mon., 58, 5.1–5.50, https://doi.org/10.1175/amsmonographs-d-17-0001.1, 2017.
Lensky, I. M. and Rosenfeld, D.: Clouds-Aerosols-Precipitation Satellite Analysis Tool (CAPSAT), Atmos. Chem. Phys., 8, 6739–6753, https://doi.org/10.5194/acp-8-6739-2008, 2008.
Letu, H., Nagao, T. K., Nakajima, T. Y., Riedi, J., Ishimoto, H., Baran, A. J., Shang, H., Sekiguchi, M., and Kikuchi, M.: Ice cloud properties from Himawari-8/AHI next-generation geostationary satellite: Capability of the AHI to monitor the DC cloud generation process, IEEE T. Geosci. Remote, 57, 3229–3239, https://doi.org/10.1109/TGRS.2018.2882803, 2019.
Letu, H., Yang, K., Nakajima, T. Y., Ishimoto, H., Nagao, T. M., Riedi, J., Baran., A. J., Ma, R., Wang, T., Shang, H., Khatri, P., Chen, L., Shi, C., and Shi, J.: High-resolution retrieval of cloud microphysical properties and surface solar radiation using Himawari-8/AHI next-generation geostationary satellite, Remote Sens. Environ., 239, 111583, https://doi.org/10.1016/j.rse.2019.111583, 2020.
Li, W., Zhang, F., Yu, Y., Iwabuchi, H., Shen, Z., Wang, G., and Zhang, Y.: The semi-diurnal cycle of deep convective systems over Eastern China and its surrounding seas in summer based on an automatic tracking algorithm, Clim. Dynam., 56, 357–379, https://doi.org/10.1007/s00382-020-05474-1, 2021.
Liu, C.-Y., Chiu, C.-H., Lin, P.-H., and Min, M.: Comparison of cloud-top property retrievals from Advanced Himawari Imager, MODIS, CloudSat/CPR, CALIPSO/CALIOP, and radiosonde, J. Geophys. Res.-Atmos., 125, e2020JD032683, https://doi.org/10.1029/2020JD032683, 2020.
Lu, X., Yu, H., Ying, M., Zhao, B., Zhang, S., Lin, L., Bai, L., and Wan, R.: Western North Pacific tropical cyclone database created by the China Meteorological Administration, Adv. Atmos. Sci., 38, 690−699, https://doi.org/10.1007/s00376-020-0211-7, 2021.
Mayer, B. and Kylling, A.: Technical note: The libRadtran software package for radiative transfer calculations – description and examples of use, Atmos. Chem. Phys., 5, 1855–1877, https://doi.org/10.5194/acp-5-1855-2005, 2005.
Minnis, P. and Heck, P.: GOES-R Advanced Baseline Imager (ABI) Algorithm Theoretical Basis Document for Nighttime Cloud Optical Depth, Cloud Particle Size, Cloud Ice Water Path, and Cloud Liquid Water Path (Version 3.0), 85 pp., NOAA/NESDIS/STAR, https://www.star.nesdis.noaa.gov/goesr/documents/ATBDs/Baseline/ATBD_GOES-R_Cloud_NCOMP_v3.0_Jul2012.pdf (last access: 30 September 2023), 2012.
Mouri, K., Izumi, T., Suzue, H., and Yoshida, R.: Algorithm Theoretical Basis Document of Cloud Type/Phase Product, Meteorological Satellite Center Technical Note, 61, 19–31, JMA/MSC, https://www.data.jma.go.jp/mscweb/technotes/msctechrep61-2.pdf (last access: 9 November 2023), 2016a.
Mouri, K., Suzue, H., Yoshida, R., and Izumi, T.: Algorithm Theoretical Basis Document of Cloud Top Height Product, Meteorological Satellite Center Technical Note, 61, 33–42, JMA/MSC, https://www.data.jma.go.jp/mscweb/technotes/msctechrep61-3.pdf (last access: 9 November 2023), 2016b.
Nakajima, T. and King, M. D.: Determination of the Optical Thickness and Effective Particle Radius of Clouds from Reflected Solar Radiation Measurements. Part I: Theory, J. Atmos. Sci., 47, 1878–1893. https://doi.org/10.1175/1520-0469(1990)047<1878:DOTOTA>2.0.CO;2, 1990.
Nakajima, T. Y. and Nakajma, T.: Wide-Area Determination of Cloud Microphysical Properties from NOAA AVHRR Measurements for FIRE and ASTEX Regions, J. Atmos. Sci., 52, 4043–4059, https://doi.org/10.1175/1520-0469(1995)052<4043:WADOCM>2.0.CO;2, 1995.
Pavolonis, M. J.: GOES-R Advanced Baseline Imager (ABI) Algorithm Theoretical Basis Document for Cloud Type and Cloud Phase (Version 2.0), 85 pp., NOAA/NESDIS/STAR, https://www.star.nesdis.noaa.gov/goesr/documents/ATBDs/Baseline/ATBD_GOES-R_Cloud_Phase_Type_v2.0_Sep2010.pdf (last access: 30 September 2023), 2010.
Platnick, S., King, M. D., Ackerman, S. A., Menzel, W. P., Baum, B. A., Riedi, J. C., and Frey, R. A.: The MODIS cloud products: algorithms and examples from Terra, IEEE Trans. Geosci. Remote Sens.-Basel, 41, 459–473, https://doi.org/10.1109/TGRS.2002.808301, 2003.
Platnick, S., Meyer, K. G., Wind, G., Amarasinghe, N., Wang, C., and Marchant, B.: EOS MODIS and SNPP VIIRS Cloud Properties: User Guide for the Climate Data Record Continuity Level-2 Cloud Top and Optical Properties Product (CLDPROP) (Version 1.0), 65 pp., NOAA/NESDIS/STAR, https://atmosphere-imager.gsfc.nasa.gov/sites/default/files/ModAtmo/EOSSNPPCloudOpticalPropertyContinuityProductUserGuidev1.pdf (last access: 30 September 2023), 2019.
Platnick, S., Meyer, K., Wind, G., Holz, R. E., Amarasinghe, N., Hubanks, P. A., Marchant, B., Dutcher, S., and Veglio, P.: The NASA MODIS-VIIRS Continuity Cloud Optical Properties Products, Remote Sens.-Basel, 13, 2, https://doi.org/10.3390/rs13010002, 2021.
Rosenfeld, D., Andreae, M. O., Asmi, A., Chin, M., de Leeuw, G., Donovan D. P., Kahn, R., Kinne, S., Kivekäs, N., Kulmala, M., Lau, W., Schmidt, K. S., Suni, T., Wagner, T., Wild, M., and Quaas, J.: Global observations of aerosol-cloud-precipitation-climate interactions, Rev. Geophys., 52, 750–808, https://doi.org/10.1002/2013RG000441, 2014.
Rossow, W. B. and Schiffer R. A.: Advances in understanding clouds from ISCCP, B. Am. Meteorol. Soc., 80, 2261–2288, https://doi.org/10.1175/1520-0477(1999)080<2261:AIUCFI>2.0.CO;2, 1999.
Schmit, T., Griffith, P., Gunshor, M., Daniels, J., Goodman, S., and Lebair, W.: A Closer Look at the ABI on the GOES-R Series, B. Am. Meteorol. Soc., 98, 681–698, https://doi.org/10.1175/BAMS-D-15-00230.1, 2017.
Shang H., Letu, H., Nakajima, T. Y., Wang, Z., Ma, R., Wang, T., Lei, Y., Ji, D., Li, S., and Shi, J.: Diurnal cycle and seasonal variation of cloud cover over the Tibetan Plateau as determined from Himawari-8 new-generation geostationary satellite data, Sci. Rep.-UK, 8, 1105, https://doi.org/10.1038/s41598-018-19431-w, 2018.
Stephens, G.: Radiation profiles in extended water clouds, II: Parameterization schemes, J. Atmos. Sci., 35, 2123–2132, https://doi.org/10.1175/1520-0469(1978)035<2123:RPIEWC>2.0.CO;2, 1978.
Stephens, G.: Cloud feedbacks in the climate system: A critical review, J. Climate, 18, 237–273, https://doi.org/10.1175/JCLI-3243.1, 2005.
Stephens, G., Vane, D., Boain, R., Mace, G., Sassen, K., Wang, Z., Illingworth, A., O'connor, E., Rossow, W., Durden, S., Miller, S., Austin, R., Benedetti, A., Mitrescu, C., and the CloudSat Science Team: The CloudSat mission and the A-train: A new dimension of space-based observations of clouds and precipitation, B. Am. Meteorol. Soc., 83, 1771–1790, https://doi.org/10.1175/BAMS-83-12-1771, 2002.
Stevens, B. and Bony, S.: What Are Climate Models Missing?, Science, 340, 1053–1054, https://doi.org/10.1126/science.1237554, 2013.
Sun, L., Zhuge, X., and Wang, Y.: A Contour-based algorithm for automated detection of overshooting tops using satellite infrared imagery, IEEE T. Geosci. Remote, 57, 497–508, https://doi.org/10.1109/TGRS.2018.2857486, 2019.
Sun, L., Tang, X., Zhuge, X., Tan, Z., and Fang, J.: Diurnal variation of overshooting tops in typhoons detected by Himawari-8 satellite, Geophys. Res. Lett., 48, e2021GL095565, https://doi.org/10.1029/2021GL095565, 2021.
Walther, A., Straka, W., Heidinger, A. K.: GOES-R Advanced Baseline Imager (ABI) Algorithm Theoretical Basis Document for Daytime Cloud Optical and Microphysical Properties (DCOMP) (Version 3.0), 66 pp., NOAA/NESDIS/STAR, https://www.star.nesdis.noaa.gov/goesr/documents/ATBDs/Baseline/ATBD_GOES-R_Cloud_DCOMP_v3.0_Jun2013.pdf (last access: 30 September 2023), 2013.
Wang, J., Liu, C., Min, M., Hu, X., Lu, Q., and Husi, L.: Effects and applications of satellite radiometer 2.25 µm channel on cloud property retrievals, IEEE T. Geosci. Remote, 56, 5207–5216, https://doi.org/10.1109/TGRS.2018.2812082, 2018.
Wang, Q., Zhou, C., Zhuge, X., Liu, C., Weng, F., and Wang, M.: Retrieval of cloud properties from thermal infrared radiometry using convolutional neural network, Remote Sens. Environ., 278, 113079, https://doi.org/10.1016/j.rse.2022.113079, 2022.
Wang, Q., Zhou, C., Letu, H., Zhu, Y., Zhuge, X., Liu, C., Weng, F., and Wang, M.: Obtaining Cloud Base Height and Phase From Thermal Infrared Radiometry Using a Deep Learning Algorithm, IEEE T. Geosci. Remote, 61, 4105914, https://doi.org/10.1109/TGRS.2023.3317532, 2023.
Wei, P., Xu, X., Xue, M., Zhang, C., Wang, Y., Zhao, K., Zhou, A., Zhang, S., and Zhu, K.: On Key Dynamical Processes Supporting the 21.7 Zhengzhou Record-Breaking Hourly Rainfall in China, Adv. Atmos. Sci., 40, 337–349, https://doi.org/10.1007/s00376-022-2061-y, 2023.
Winker, D. M., Hunt, W. H., and McGill, M. J.: Initial performance assessment of CALIOP, Geophys. Res. Lett., 34, L19803, https://doi.org/10.1029/2007GL030135, 2007.
Yang, J., Zhang, Z., Wei, C., Lu, F., and Guo, Q.: Introducing the New Generation of Chinese Geostationary Weather Satellites, Fengyun-4, B. Am. Meteorol. Soc., 98, 1637–1658, https://doi.org/10.1175/BAMS-D-16-0065.1, 2017.
Yang, P., Bi, L., Baum, B. A., Liou, K.-N., Kattawar, G., and Mishchenko, M.: Spectrally consistent scattering, absorption, and polarization properties of atmospheric ice crystals at wavelengths from 0.2 to 100 µm, J. Atmos. Sci., 70, 330–347, https://doi.org/10.1175/JAS-D-12-039.1, 2013.
Yang, P., Liou, K. N., Bi, L., Liu, C., Yi, B., and Baum, B. A.: On the radiative properties of ice clouds: Light scattering, remote sensing, and radiation parameterization, Adv. Atmos. Sci., 32, 32–63, https://doi.org/10.1007/s00376-014-0011-z, 2015.
Yu, L., Fu, Y., Zhuge, X., Yao, B., Tang, F., Chen, F., and Pan, X.: Seasonal and semi-diurnal variations in cloud-phase characteristics over the southern Himalayas and adjacent regions as observed by the Himawari-8 satellite, J. Geophys. Res.-Atmos., 127, e2022JD036525, https://doi.org/10.1029/2022JD036525, 2022.
Zhang, C., Zhuge, X., and Yu, F.: Development of a high spatiotemporal resolution cloud-type classification approach using Himawari-8 and CloudSat, Int. J. Remote Sens., 40, 6464–6481, https://doi.org/10.1080/01431161.2019.1594438, 2019.
Zhuge, X.: NJIAS Himawari-8/9 Cloud Feature Dataset (HCFD)–0.04 Deg. Part I: 2016–2017 (Version 4), Science Data Bank [data set], https://doi.org/10.57760/sciencedb.09950, 2023a.
Zhuge, X.: NJIAS Himawari-8/9 Cloud Feature Dataset (HCFD)–0.04 Deg. Part II: 2018–2019 (Version 4), Science Data Bank [data set], https://doi.org/10.57760/sciencedb.09953, 2023b.
Zhuge, X.: NJIAS Himawari-8/9 Cloud Feature Dataset (HCFD)–0.04 Deg. Part III: 2020–2021 (Version 4), Science Data Bank [data set], https://doi.org/10.57760/sciencedb.09954, 2023c.
Zhuge, X.: NJIAS Himawari-8/9 Cloud Feature Dataset (HCFD)–0.04 Deg. Part IV: 2022–2023 (Version 4), Science Data Bank [data set], https://doi.org/10.57760/sciencedb.10158, 2023d.
Zhuge, X.: NJIAS Himawari-8/9 Cloud Feature Dataset (HCFD)–TyWNP (Version 4), Science Data Bank [data set], https://doi.org/10.57760/sciencedb.09945, 2023e.
Zhuge, X. and Zou, X.: Test of a Modified Infrared-Only ABI Cloud Mask Algorithm for AHI Radiance Observations, J. Appl. Meteorol. Clim., 55, 2529–2546, https://doi.org/10.1175/JAMC-D-16-0254.1, 2016.
Zhuge, X. and Zou, X.: Summertime Convective Initiation Nowcasting over Southeastern China Based on Advanced Himawari Imager Observations, J. Meteorol. Soc. Jpn., 96, 337–353, https://doi.org/10.2151/jmsj.2018-041, 2018.
Zhuge, X., Yu, F., and Zhang, C.: Rainfall retrieval and nowcasting based on multispectral satellite images. Part I. Retrieval study on daytime 10-minute rain rate, J. Hydrometeorol., 12, 1255–1270, https://doi.org/10.1175/2011JHM1373.1, 2011.
Zhuge, X., Guan, J., Yu, F., and Wang, Y.: A New Satellite-based Indicator for Estimation of the Western North Pacific Tropical Cyclone Current Intensity, IEEE T. Geosci. Remote, 53, 5661–5676, https://doi.org/10.1109/TGRS.2015.2427035, 2015.
Zhuge, X., Zou, X., and Wang, Y.: A Fast Cloud Detection Algorithm Applicable to Monitoring and Nowcasting of Daytime Cloud Systems, IEEE T. Geosci. Remote, 55, 6111–6119, https://doi.org/10.1109/TGRS.2017.2720664, 2017.
Zhuge, X., Zou, X., and Wang, Y.: Determining AHI Cloud-Top Phase and Intercomparisons with MODIS Products over North Pacific, IEEE T. Geosci. Remote, 59, 436–448, https://doi.org/10.1109/TGRS.2020.2990955, 2021a.
Zhuge, X., Zou, X., and Wang, Y.: AHI-derived Daytime Cloud Optical/Microphysical Properties and Their Evaluations with the Collection-6.1 MOD06 Product, IEEE T. Geosci. Remote, 59, 6431–6450, https://doi.org/10.1109/TGRS.2020.3027017, 2021b.