the Creative Commons Attribution 4.0 License.
the Creative Commons Attribution 4.0 License.
 | 13 Mar 2024
Global datasets of hourly carbon and water fluxes simulated using a satellite-based process model with dynamic parameterizations
Jiye Leng
Jing M. Chen
Wenyu Li
Xiangzhong Luo
Mingzhu Xu
Rong Wang
Cheryl Rogers
Bolun Li
Yulin Yan
Diagnostic terrestrial biosphere models (TBMs) forced by remote sensing observations have been a principal tool for providing benchmarks on global gross primary productivity (GPP) and evapotranspiration (ET). However, these models often estimate GPP and ET at coarse daily or monthly steps, hindering analysis of ecosystem dynamics at the diurnal (hourly) scales, and prescribe some essential parameters (i.e., the Ball–Berry slope (m) and the maximum carboxylation rate at 25 °C ()) as constant, inducing uncertainties in the estimates of GPP and ET. In this study, we present hourly estimations of global GPP and ET datasets at a 0.25° resolution from 2001 to 2020 simulated with a widely used diagnostic TBM – the Biosphere–atmosphere Exchange Process Simulator (BEPS). We employed eddy covariance observations and machine learning approaches to derive and upscale the seasonally varied m and for carbon and water fluxes. The estimated hourly GPP and ET are validated against flux observations, remote sensing, and machine learning-based estimates across multiple spatial and temporal scales. The correlation coefficients (R2) and slopes between hourly tower-measured and modeled fluxes are R2=0.83, regression slope =0.92 for GPP, and R2=0.72, regression slope =1.04 for ET. At the global scale, we estimated a global mean GPP of 137.78±3.22 Pg C yr−1 (mean ± 1 SD) with a positive trend of 0.53 Pg C yr−2 (p<0.001), and an ET of km3 yr−1 with a slight positive trend of 0.10×10³ km3 yr−2 (p<0.001) from 2001 to 2020. The spatial pattern of our estimates agrees well with other products, with R2=0.77–0.85 and R2=0.74–0.90 for GPP and ET, respectively. Overall, this new global hourly dataset serves as a “handshake” among process-based models, remote sensing, and the eddy covariance flux network, providing a reliable long-term estimate of global GPP and ET with diurnal patterns and facilitating studies related to ecosystem functional properties, global carbon, and water cycles. The hourly GPP and ET estimates are available at https://doi.org/10.57760/sciencedb.ecodb.00163 (Leng et al., 2023a) and the accumulated daily datasets are available at https://doi.org/10.57760/sciencedb.ecodb.00165 (Leng et al., 2023b).
- Article
(6577 KB) - Full-text XML
-
Supplement
(974 KB) - BibTeX
- EndNote


Terrestrial photosynthesis (gross primary productivity, GPP) and evapotranspiration (ET) play pivotal roles in the intricate dynamics of the global carbon and hydrological cycles (Piao et al., 2020; Liu et al., 2003; Jasechko et al., 2013). Enhancing our understanding of the exchanges of carbon and water between terrestrial ecosystems and the atmosphere holds paramount importance for understanding and monitoring the Earth system (Ryu et al., 2019; Chen et al., 2019; Jung et al., 2010). However, large discrepancies exist in the estimation of global GPP and ET fluxes by various models varied from 92.7 to 168.7 Pg C yr−1 (Zheng et al., 2020) and from 63.3 to 105.4×10³ km3 yr−1 (Li et al., 2023; Yu et al., 2022), respectively. The present uncertainties predominantly arise from multiple constraining factors, encompassing, although not exclusively, oversimplified model structure (Yuan et al., 2010; Liang et al., 2013; Wang et al., 2020; Tagesson et al., 2021; Moreno et al., 2012; Luo et al., 2018), inadequate representation of plant functional traits (Chen et al., 2013, 2022; Bonan et al., 2011; Wilson et al., 2000; Wang et al., 2007; Franks et al., 2018), coarse resolution of climate forcing, and also inconsistency of global land cover maps (Bonan, 2019; Gamon et al., 2004; Bonan et al., 2002). As a consequence, the precise quantification of global carbon and water fluxes remains an enduring challenge.
State-of-the-art terrestrial biosphere process-based models (TBMs), coupling the biogeochemical and biogeophysical processes in the soil–vegetation–atmosphere continuum, have been developed to estimate global carbon and water fluxes (Cao and Woodward, 1998; Sitch et al., 2003). Differing from the prognostic TBMs (i.e., TRENDY), diagnostic TBMs offer a heightened level of reliability as benchmarks for GPP and ET, because of their alignment with remote sensing-derived appraisals of plant structural conditions (Liu et al., 1997, 2003; Chen et al., 1999, 2012; Luo et al., 2018). The diagnostic TBMs often adopt the scheme by integrating an enzyme-kinetic biochemical photosynthesis model by Farquhar et al. (1980) with the Ball–Woodrow–Berry (BWB) stomatal conductance model (Ball et al., 1987). The maximum carboxylation rate (Vcmax) quantifies the leaf photosynthetic capacity, and its normalized form at 25 °C () is an essential parameter used to estimate carbon fluxes in TBMs. Besides, the Ball–Berry slope, m, serves as the parameter that balances the rate of carbon gain and water loss of plants by controlling the modeled stomatal conductance in simulating the photosynthetic process. In regional and global ecosystem modeling, current TBMs tend to assign as a fixed parameter varied by plant functional types (PFTs), which were typically estimated from a measurement-based database (Kattge et al., 2009), and to assign m as a constant. However, in recent studies, and m have been found to vary across PFTs (Chen et al., 2022; Smith et al., 2019; Lin et al., 2015; Bauerle et al., 2014; Miner et al., 2017) and seasonally (Miner and Bauerle, 2017; Misson et al., 2004; Wolz et al., 2017; Luo et al., 2021; Croft et al., 2017; Liu et al., 2023; Leng et al., 2024a). Therefore, incorporating prescribed constant and m in TBMs may induce uncertainties in modeling global GPP and ET (Ryu et al., 2019; Miner and Bauerle, 2017).
Process-based models necessitate the inclusion of parameters, yet several of those parameters are challenging to determine through empirical data alone. Machine learning techniques can be employed to acquire parameterizations that effectively depict the observed ground truth. This results in a model that combines the benefits of physical modeling, leveraging its theoretical foundations, with the adaptive capabilities of machine learning techniques. These data-driven adjustments and optimizations enhance the modeling of spatiotemporal patterns in carbon and water cycles (Reichstein et al., 2019). Recent studies have utilized models with data-driven parameterizations to estimate global GPP and ET (Zhao et al., 2019; Koppa et al., 2022; Hu et al., 2021; Ma et al., 2022). Employing data-driven parameterization not only improves the estimation of carbon and water fluxes, but also enables a deeper understanding of the dynamics and mechanisms governing ecosystem functions.
Refining GPP and ET estimations from daily to hourly scales provides valuable insights into the diurnal patterns of plant–atmosphere interactions, particularly in relation to extreme climate events (Hashimoto et al., 2020; Bodesheim et al., 2018; Duarte Rocha et al., 2022). Air temperature and vapor pressure deficit are higher in the morning than in the afternoon (Goulden et al., 2004; Lin et al., 2019), and leaf water potential decreases from morning to afternoon due to the water loss from transpiration (Neumann and Cardon, 2012; Lee et al., 2005). These processes can lead to different responses of photosynthesis and transpiration to the environment, which only the datasets with diurnal variations can track (Zhang et al., 2023b). Besides, on the diurnal scale, the temporal patterns of GPP and ET are influenced mostly by radiation and the structural characteristics of plant canopies, specifically by the variable contributions of sunlit and shaded leaves (Chen et al., 1999; Ryu et al., 2011; Nelson et al., 2020; Luo et al., 2018). Sunlit leaves simultaneously absorb both direct and diffuse radiation, making their photosynthesis primarily limited by RuBisCO. By contrast, shaded leaves solely absorb diffuse radiation, making their photosynthesis constrained by incoming solar energy (Ju et al., 2006; Wang and Leuning, 1998; Urban et al., 2007; Luo et al., 2018). Therefore, differentiating hourly water and carbon fluxes into sunlit and shaded proportions would further untangle the complex interactions between plant physiological and canopy structural components and the ambient environment.
Here we provide the first dataset of global hourly carbon and water fluxes using a two-leaf satellite-based TBM with dynamic parameterizations. We developed the model by (1) inversing seasonally variable m and from measured eddy covariance data, (2) upscaling derived m and to modeling grids with machine learning algorithms, and (3) estimating hourly carbon and water fluxes in a two-leaf hourly process-based model with seasonally and spatially variable m and . We evaluated the effectiveness of the dataset in capturing the spatial, temporal, and interannual patterns in GPP and ET from the eddy covariance sites. We also intercompared the dataset with other global GPP and ET datasets to assess their spatial and interannual variations.
2.1 Data from the eddy covariance towers
The FLUXNET2015 (http://www.fluxdata.org, last access: 1 October 2020) dataset includes the measured and postprocessed carbon fluxes, energy fluxes, and meteorological variables over more than 200 sites around the globe in a standard format (Pastorello et al., 2020). In this study, we selected 136 sites (809 site-years) (Table S1 in the Supplement) based on the availability and quality of the measured fluxes and meteorological conditions (the quality control flag for fluxes smaller than 2 and data gaps less than 20 % for a site-year). For the independent validation, we randomly selected 20 % of the total sites to evaluate the accuracy and applicability of the process model with dynamic parameterizations.
Half-hourly meteorological records in the FLUXNET2015 dataset were aggregated into hourly records and used to drive the Biosphere-atmosphere Exchange Process Simulator (BEPS). Gap-filled incoming shortwave radiation (SW_IN_F), air temperature (TA_F), vapor pressure deficit (VPD_F), precipitation (P_F), and wind speed (WS_F) were selected as the forcing meteorological variables to derive monthly variable m and at each site. We chose to use GPP partitioned from the net ecosystem exchange (NEE) based on a nighttime method with a variable friction velocity (u*) threshold (GPP_NT_VUT) and the gap-filled latent heat flux (LE_F_MDS) for each site-year as the targeted fluxes for m and estimation. In the validation, we only chose to use GPP and latent heat flux with quality control flags smaller than 2 to compare with the modeled GPP and ET at the hourly, daily, and annual scales.
2.2 Gridded data for the globe
The global datasets used in this study are shown in Table 1. The meteorological variables were collected from the fifth-generation European Center for Medium-range Weather Forecasts (ECMWF) reanalysis (ERA-5) with hourly records and a spatial resolution of 0.25°. In this study, we obtained the hourly incoming shortwave radiation (SW, W m−2), air temperature at 2 m (Ta, °C), dew point temperature (Td, °C), precipitation (mm h−1), 10 m u- and v-components of wind (u10 and v10, m s−1), soil water content (SWC, m3 m−3), and snow depth (SWD, m). The relative humidity (RH) was calculated from air temperature and dew point temperature as
The wind speed (WS) was calculated as the root-square of (u) and the vertical (v) component of wind measured at a height of 10 m as
The 8 d GLOBMAP leaf area index (LAI) dataset at 8 km resolution was used to drive the BEPS model. The LAI dataset was produced by quantitative fusion of Moderate Resolution Imaging Spectroradiometer (MODIS) and historical Advanced Very High Resolution Radiometer (AVHRR) data (Liu et al., 2012). In this study, we smoothed and interpolated the 8 d LAI data into continuous daily LAI series using the locally adjusted cubic-spline capping (LACC) algorithm (Chen et al., 2006). To account for the nonrandomness of the leaf distribution within a canopy (Chen et al., 1997), we collected the global clumping index map retrieved from the MODIS Bidirectional Reflectance Distribution Function (BRDF) products (He et al., 2012) at a spatial resolution of 500 m.
We also used a leaf chlorophyll content (LCC) dataset to represent the leaf physiological status from 2001 to 2020. It was derived based on MODIS data by coupling a leaf optical properties model and a canopy bidirectional reflectance model (Xu et al., 2022). We also used the LACC algorithm to interpolate the 8 d LCC into the daily LCC series.
In addition, we obtained the yearly global land cover map with the IGBP classification scheme from the MCD12C1 product (Friedl and Sulla-Menashe, 2015). We collected the soil texture, fraction of clay, soil, and sand from the Harmonized World Soil Database (HWSD) v1.2 to parameterize the soil properties in BEPS. We also acquired the monthly CO2 concentration measurements from the NOAA Earth System Research Laboratory (ESRL). We resampled the LAI, CI, LCC, soil properties, and land cover maps into a spatial resolution of 0.25°.
Table 1Global datasets used in the BEPS model with dynamic parameterizations.
2.3 The process-based model with dynamic parameterizations
2.3.1 Parameter optimization for BEPS
The schematic overview of the methodology and data sources is shown in Fig. 1. The TBM used in this study is the Biosphere-atmosphere Exchange Process Simulator (BEPS), renamed from the Boreal Ecosystem Productivity Simulator. BEPS is a two-leaf diagnostic enzyme-kinetic model and has been intensively adopted for quantifying carbon and water fluxes over various biomes and over the globe (Luo et al., 2019; Liu et al., 2003; Chen et al., 1999, 2019, 2012). The newly revised BEPS v4.10 adopts hourly meteorological variables (i.e., incoming shortwave radiation, air temperature, vapor pressure deficit, precipitation, and wind speed) to model hourly carbon and water fluxes. The shortwave radiation and leaf temperature are calculated separately for sunlit and shaded leaf groups (Chen et al., 1999). The leaf-level photosynthetic rate and stomatal conductance are obtained through the coupling of the Farquhar scheme (Farquhar et al., 1980) and Ball–Woodrow–Berry stomatal conductance model (Ball et al., 1987) using a cubic analytical solution (Baldocchi, 1994). The leaf-level transpiration is then obtained based on the Penman–Monteith equation. The canopy-level GPP and ET are calculated as
where LAIsunlit and LAIshaded are the LAI for sunlit and shaded leaf groups, respectively. A detailed description of the main modules in BEPS is provided in the Supplement.
We recently developed a new parameter optimization algorithm (Leng et al., 2024a) for BEPS, using measured GPP and ET fluxes to constrain the simulations from BEPS by optimizing key photosynthesis and stomatal conductance model parameters (i.e., and m). The Bayesian parameter optimization with the carbon–water coupling cost function (Eq. S14 in the Supplement) has been validated to efficiently and accurately estimate m and and to improve the modeling of carbon and water fluxes. We updated m and in each iteration to allow BEPS to model carbon and water fluxes as close as possible to the measured fluxes. A detailed description of the algorithm is provided in the Supplement. In this study, we adopted the parameter optimization algorithm to estimate monthly m and for each site-year of flux sites.
2.3.2 Dynamic parameterizations for BEPS using machine learning
Two separate random forest regressors were trained using the combinations of the plant properties (functional types, LAI, LCC) and environmental conditions (meteorological variables, soil types, soil water content) with the optimized m and , respectively. The plant functional types and soil types were encoded with the one-hot encoder. The meteorological variables and soil water content were collected according to the time and location of each m and retrieval. Overall, 80 % of the data were randomly selected to train the random forest regressors with a 5-fold cross-validation to determine the hyperparameters, and 20 % of the data were used to evaluate the performance of the trained regressors in each round of calibration. All sites were used in the training process for upscaling m and for the site level to gridded maps. The global monthly m and time series were generated separately for 2001–2020 using the gridded feature data in the random forest regressors. Then, BEPS adopted the monthly m and trained from machine learning models based on the FLUXNET2015 dataset, hereafter referred to as the “BEPS with dynamic parameterizations” (BEPS-DP).
BEPS-DP used the meteorological variables from ERA-5 as climate forcing and the LAI from GLOBMAP to model the GPP and ET for sunlit and shaded leaf groups at an hourly step. The simulations of photosynthetic rate and ET were iterated 10 times for each hour to obtain the final hourly estimate. Then the hourly estimates of GPP were aggregated to daily and annual time steps for model validations and evaluations.
Figure 1Schematic overview of the methodology and data products of the BEPS model with dynamic parameterizations (BEPS-DP). The flow diagrams show the methodological steps (left) and the details (right) for the BEPS-DP datasets of global hourly two-leaf carbon and water fluxes. SW, shortwave radiation (W m−2); TA, air temperature (°C); RH, relative humidity (%); P, precipitation (mm h−1); WS, wind speed (m s−1); GPP, gross primary productivity (g C m−2 h−1); LE, latent heat (W m−2).
2.4 Model validation and evaluation
We validated the efficacy, accuracy, and applicability of the BEPS-DP using the fluxes of 136 sites (809 site-years), as shown in Fig. 2. Three metrics, the coefficient of determination (R2), the root mean square error (RMSE), and the slope between the observations and simulations, were adopted to evaluate the performance of BEPS-DP. In the model-training process, a 5-fold cross-validation method was adopted to tune the hyperparameters in the random forest regressors. After the training, the features in the independent validation set were used as input in the random forest regressors to generate monthly m and . The BEPS model was run with the predicted m and and other driving force data at the site level to simulate hourly GPP and ET in each site-year in the independent validation set. Then the simulated GPP and ET were compared with the GPP and ET estimated from the eddy covariance at hourly, daily, and annual scales.
Figure 2Flowchart for the validation of the BEPS model with dynamic parameterizations at the site level.
In addition, at the global level, we compared the modeled carbon and water fluxes from BEPS-DP with five other gridded flux products (one using machine learning methods, two from process-based models, one from light use efficiency (LUE) models, and one from remote sensing data), from the perspectives of global total values, gridded values, and mean annual sum patterns. The FLUXCOM ensemble datasets are widely used as the reference data in global long-term carbon and water cycle studies (Ryu et al., 2019; Tagesson et al., 2021). FLUXCOM datasets include the ensemble GPP and ET fluxes derived from three machine learning methods, at 0.5° spatial resolution and daily temporal resolution since 1979 (RS+METEO setup, i.e., remote sensing and meteorological data driven) and at 0.0833° spatial resolution and 8 d temporal resolution since 2001 (RS setup, i.e., remote sensing driven only) (Jung et al., 2019, 2020). We used the RS+METEO product to intercompare the global long-term GPP and ET estimates. Process-based global GPP estimates were obtained from the Breathing Earth System Simulator (BESS) v2.0, which generates global carbon and water fluxes at 0.05° resolution at a daily time step (Ryu et al., 2011; Li et al., 2023). Process-based global ET estimates were adopted from BESS and the Global Land Evaporation Amsterdam Model (GLEAM) (Martens et al., 2017; Miralles et al., 2011). LUE-based GPP and ET estimates were collected from the Global LAnd Surface Satellite (GLASS) datasets (Liang et al., 2021). We also used the GOSIF GPP derived from remote-sensing solar-induced fluorescence (SIF) to intercompare the long-term GPP trends (Li and Xiao, 2019). All comparisons were conducted at an annual time step and 0.25° resolution for the overlapped years during 2001–2020 of each flux product in this study.
Figure 3Comparisons between fluxes measured at eddy covariance towers and simulated from the BEPS model with dynamic parameterizations in the independent validation set (site-year, n=152): annual summed (a) GPP and (c) ET in all the site-years; the average annual summed (b) GPP and (d) ET for each biome. The red lines are the regression lines and the gray dotted lines are the 1:1 lines. The equations at the bottom right of each panel are the regression equations derived from all the site-years and from all the biomes, respectively.
3.1 Evaluation of the BEPS model with dynamic parameterizations
In general, BEPS-DP could effectively reproduce the temporal variations (hourly, daily, and annual) as well as the spatial differences in the tower-based GPP and ET across the majority of sites in the independent validation set (Figs. 3 and 4). BEPS-DP demonstrated efficacy in explaining approximately 83 % and 72 % of the spatiotemporal variations in GPP and ET across all validation sites and site-years (Fig. 3). For all the site-years, the regression slopes are 0.92 and 1.04 and the RMSE values are 368.212 g C m−2 yr−1 and 209.095 mm yr−1 for annual-scale GPP and ET comparisons, respectively. For all PFTs in the independent validation set, BEPS-DP also showed a good performance in simulating the GPP and ET at most sites (Fig. 3). BEPS-DP can explain 87 % of the average annual summed GPP and ET per biome, with the RMSE of 314.125 g C m−2 yr−1 and 146.18 mm yr−1 for GPP and ET, respectively. Although the average annual summed ET was slightly overestimated for the evergreen broadleaf forests (EBF) and the average annual summed GPP was overestimated for the wetland ecosystems in the comparisons, the regression slopes are 0.99 and 0.11 between simulated GPP and ET and the GPP and ET estimated from eddy covariance measurements.
At the hourly scale, the coefficients of determination (R2) of GPP varied from 0.57 to 0.96 with 82.9 % of them over 0.80 and all of them being statistically significant (P<0.001). The regression slopes between simulated GPP and GPP estimated from eddy covariance ranged from 0.43 to 1.58. The highest regression slopes were found in croplands (CRO) and grasslands (GRA). The R2 of ET varied from 0.45 to 0.95 with 70.4 % of them over 0.80. The regression slope between simulated ET and measured ET ranged from 0.44 to 1.08. At the daily scale, the R2 of GPP and ET were slightly lower than the R2 of hourly GPP and ET in the comparison but still with R2 over 0.75 for both GPP and ET in most of the site-years. However, smaller slopes were found in the comparisons of daily fluxes due to the larger intercepts in the regression. We also compared the distribution of R2 and the regression slope of GPP and ET across all PFTs. At the hourly scale, the R2 and regression slopes of GPP and ET were close to 1.0 in the forest ecosystems (ENF, evergreen needleleaf forest; EBF, evergreen broadleaf forest; DBF, deciduous broadleaf forests; and MF, mixed forests). But the regression slopes were low in CRO, savannas (SAV), and woody savannas (WSA), although the R2 in such biomes exhibited the range of 0.6–0.8. At the daily scale, the regression slopes were much smaller than the regression slopes of hourly fluxes because the regression intercepts were close to 0 in the hourly fluxes but high in the comparisons of daily fluxes. Overall, the R2 of both hourly and daily fluxes exhibited exponential distributions with a peak close to 1.0 (Fig. 4a, c, i, and k) while the regression slopes of fluxes exhibited normal distributions (Fig. 4b, d, j, and l).
Figure 4Evaluation of modeled hourly and daily fluxes against the eddy covariance data in the independent validation set: site-year percentage of R2 in (a) hourly GPP; (c) hourly ET; (i) daily GPP; (k) daily ET; site-year percentage of regression slopes in (b) hourly GPP; (d) hourly ET; (j) daily GPP; (l) daily ET; the mean and standard deviation (SD) of R2 in each PFT in (e) hourly GPP; (g) hourly ET; (m) daily GPP; (o) daily ET; the mean and standard deviation of regression slopes in each PFT in (f) hourly GPP; (h) hourly ET; (n) daily GPP; (p) daily ET. The gray lines indicate 1.0 in R2 and regression slopes as a reference of good fitting. The dashed gray lines in (e–h) and (m–p) indicate the mean of R2 and regression slopes for all PFTs in GPP and ET.
Figure 5The spatial patterns of retrieved global key ecosystem parameters during 2001–2020: (a) gridded m; (b) averaged m in each PFT; (c) gridded Vcmax; (d) averaged Vcmax in each PFT. Courtesy of Leng et al. (2024b).
3.2 Retrieval of the global key ecosystem parameters
The global distributions of retrieved m and Vcmax are shown in Fig. 5a and c and PFT-dependent patterns are presented in Fig. 5b and d, courtesy of Leng et al. (2024b). The monthly spatial patterns of global m and Vcmax during 2001–2020, and the validation of retrieved global m and Vcmax, can be found in Sect. S3 in the Supplement. Strong seasonal variations in m and Vcmax were observed in boreal regions, while m and Vcmax in subtropical and tropical regions are fairly constant within a year (Figs. S1 and S2 in the Supplement). The retrieved global m and Vcmax showed good agreement with the field measurements (Fig. S3 in the Supplement).
Figure 6Spatial patterns of global GPP and ET by the BEPS model with dynamic parameterizations during 2001–2020: (a) annual mean total GPP; (b) annual mean GPP of sunlit leaves; (c) annual mean GPP of shaded leaves; (d) annual mean total ET; (e) annual mean T of sunlit leaves; (f) annual mean T of shaded leaves.
3.3 Spatial and temporal patterns of global carbon and water fluxes
A global hourly GPP and ET dataset at a spatial resolution of 0.25° was generated from 2001 to 2020 using BEPS-DP with gridded driving forces (Fig. 6). The 20-year averaged global GPP across the vegetated area was 137.78±3.22 Pg C yr−1 (Fig. 6a), in which the global GPP of sunlit leaves was 73.44±1.46 Pg C yr−1 (Fig. 6b) and the global GPP of shaded leaves was 64.34±1.79 Pg C yr−1 (Fig. 6c). The 20-year averaged global ET across the vegetated area was km3 yr−1 (Fig. 6d), in which the global T of sunlit leaves was 2 km3 yr−1 (Fig. 6e) and the global T of shaded leaves was km3 yr−1 (Fig. 6f). At the global scale, the spatial distributions of 20-year GPP and ET coupled well. Both GPP and ET were high over the tropical and subtropical areas, such as the Amazon, Central Africa, and Southeast Asia, where the water and temperature conditions allow for intensive photosynthesis and transpiration. Moderate levels of GPP and ET were observed in temperate and subhumid regions, while the lowest GPP and ET values were typically found in arid or cold regions with limited precipitation or low temperatures. In addition, the global hourly GPP and ET dataset can also track the diurnal changes from dawn to dusk at UTC time (Fig. 7). At 06:00 UTC, high GPP and ET were observed in Southeast Asian areas while at 18:00 UTC, high GPP and ET were found in American regions.
Figure 7Spatial diurnal patterns of global GPP and ET by the BEPS model with dynamic parameterizations during 2001–2020: (a–h) averaged hourly GPP at UTC time with 3 h intervals; (i–p) averaged hourly ET at UTC time with 3 h intervals.
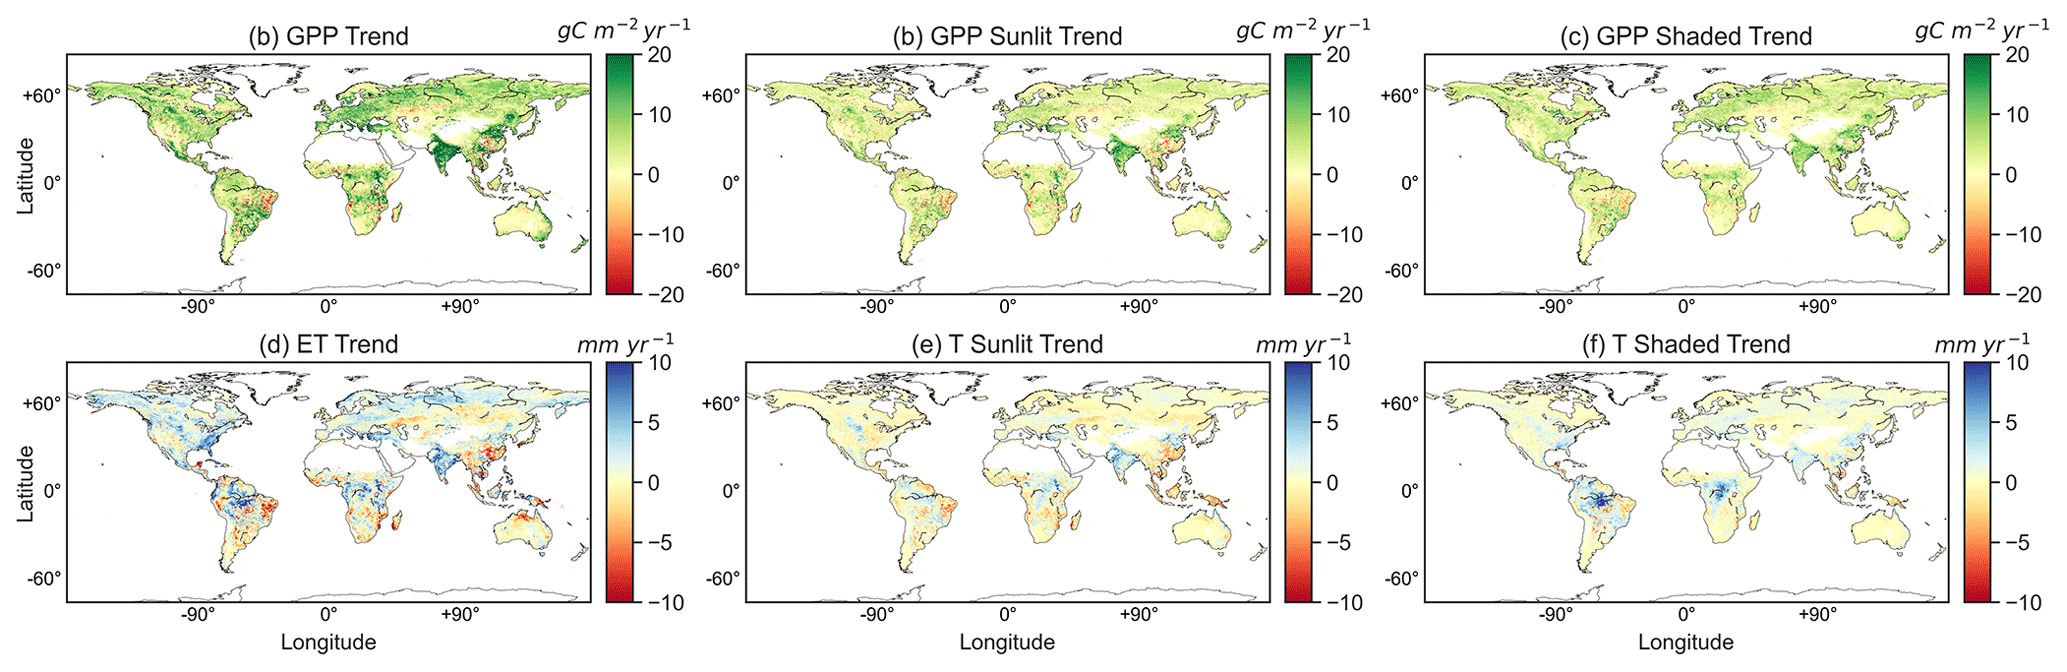
Figure 8Spatial patterns of global GPP and ET trends by the BEPS model with dynamic parameterizations during 2001–2020: (a) trend of annual total GPP; (b) trend of annual GPP of sunlit leaves; (c) trend of annual GPP of shaded leaves; (d) trend of annual total ET; (e) trend of annual T of sunlit leaves; (f) trend of annual T of shaded leaves.
The long-term trends of GPP and ET from 2001 to 2020 were determined with a linear regression analysis per pixel (Fig. 8). Both coupling and decoupling spatial patterns between GPP and ET were observed at the global scale. Approximately 83.3 % of the vegetated area showed increased GPP trends, in which 46.8 % of the vegetated area showed increased GPP trends with more than 5 g C m−2 yr−2 from 2001 to 2020. Approximately 70.1 % of the vegetated area showed increased ET trends, and 7.8 % of the vegetated area showed increased ET trends with more than 5 mm yr−2. The decreased GPP trend was found in the tropical areas, specifically in the Amazon area. The decreased ET trend was found in the Amazon Forest, coupled with the trend of GPP, but also found in South Africa, Southwest Asia, and north Australia, showing opposite trends to GPP. More decreased patterns were observed in GPP and T of sunlit leaves (Fig. 8a and d) than in shaded leaves (Fig. 8c and f), contributing the decreased trends of total GPP and ET. By incorporating measured fluxes in model parameterizations, BEPS-DP combines the benefits of ground measurements and the sophisticated structure of process-based models. We believe that the integration in this study makes it possible to combine the strengths of both approaches, resulting in improved accuracy in estimating carbon and water fluxes at the global scale and finer temporal resolution based on point-to-point comparisons (Figs. 3 and 4).
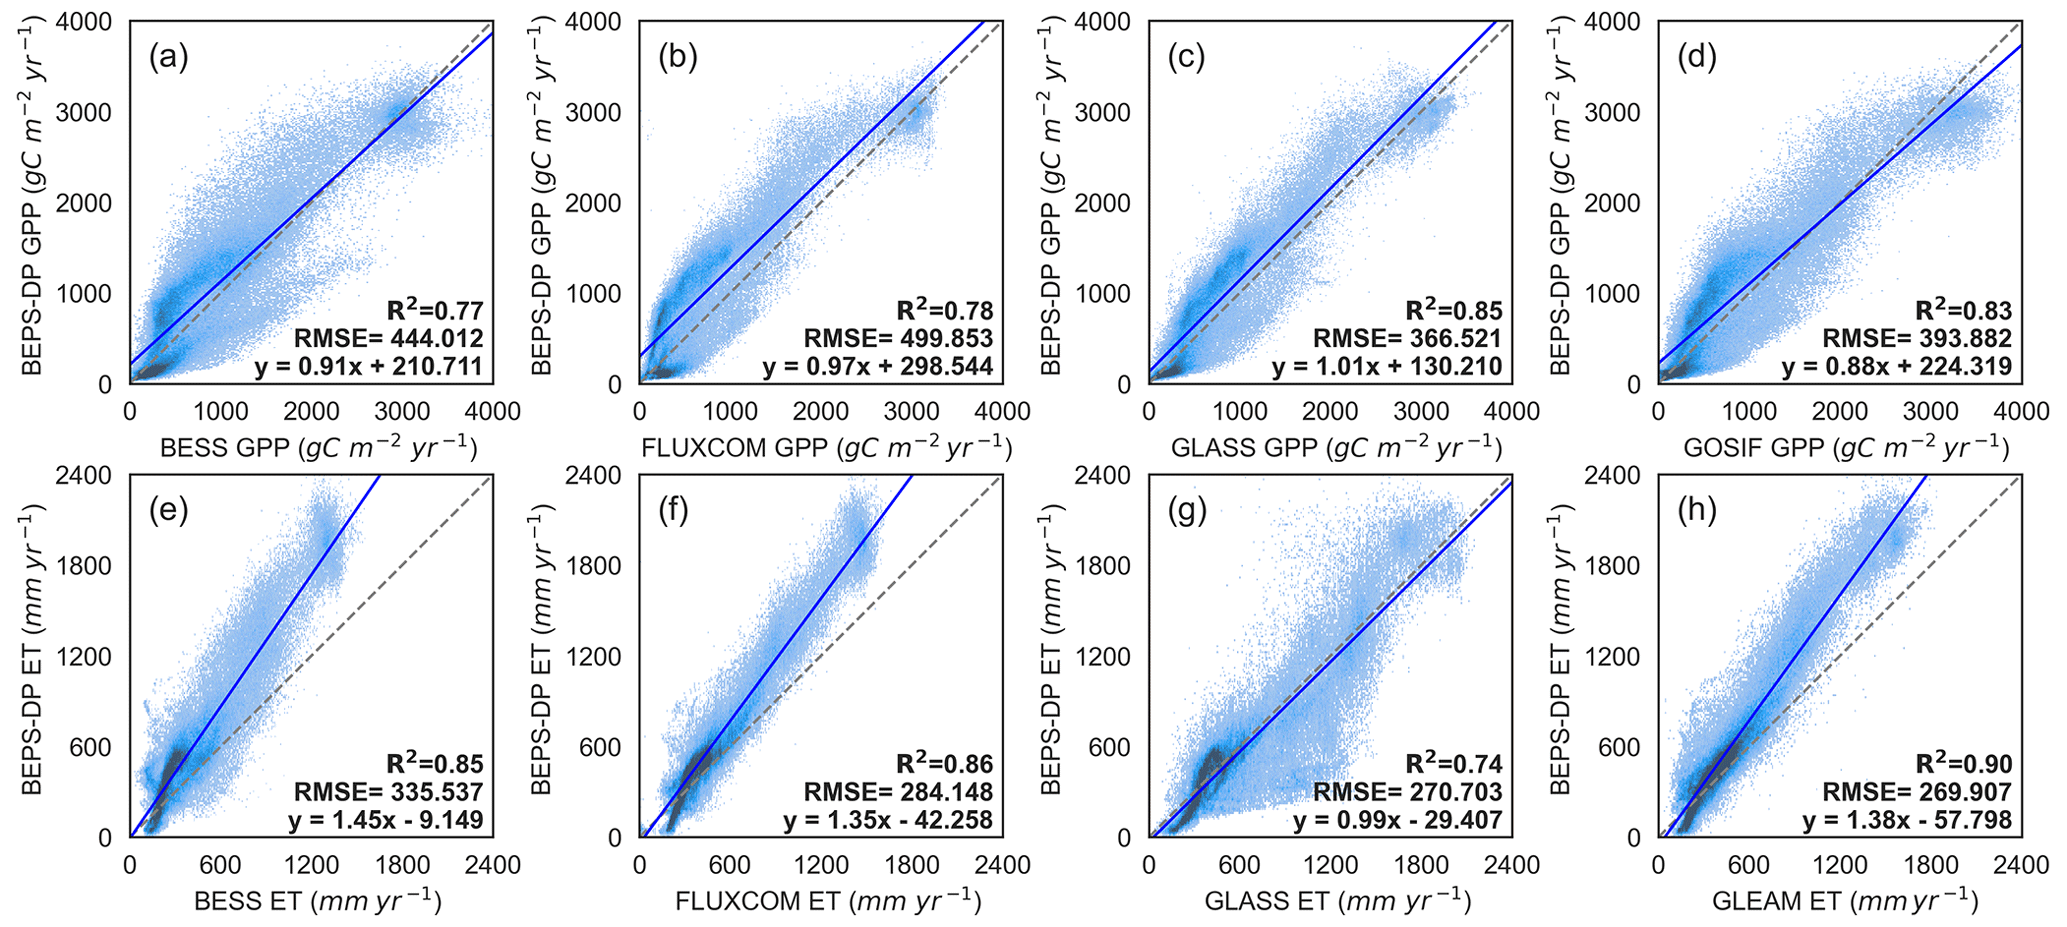
Figure 9Comparisons of pixel-to-pixel long-term (2001–2020) averaged annual GPP and ET between the BEPS model with dynamic parameterizations (BEPS-DP) and other models: (a–d) GPP comparisons between BEPS-DP and BESS (Li et al., 2023), FLUXCOM (Jung et al., 2020), GLASS (Liang et al., 2021), and GOSIF (Li and Xiao, 2019) GPP products, respectively; (e–f) ET comparisons between BEPS-DP and BESS, FLUXCOM, GLASS, and GLEAM (Martens et al., 2017) ET products.
3.4 Comparisons with other global GPP and ET products
Despite significant advancements in remote sensing technology, ground observations, and the theoretical modeling of carbon and water fluxes, a considerable level of uncertainty persists in global and regional estimates of GPP and ET (Zheng et al., 2020; Ryu et al., 2019; Li et al., 2023). To investigate the spatial correlations between BEPS-DP and other models, we compared the pixel-to-pixel averaged annual GPP and ET of all available years of each dataset (Fig. 9). The spatial pattern of GPP estimated from BEPS-DP correlates well with all other GPP datasets, with R2 ranging from 0.77 to 0.85. The spatial distribution of ET obtained from BEPS-DP also exhibits strong correlations with all other ET datasets, with R2 ranging from 0.74 to 0.90. The high spatial correlations observed between GPP and ET derived from the BEPS-DP and other existing datasets underscore the consistency of this new hourly dataset with respect to spatial patterns observed in other datasets. Differing from the close magnitudes of GPP estimates between BEPS-DP and other GPP datasets (slope ranging from 0.88 to 1.01), it shows big discrepancies in the magnitudes of ET estimates between BEPS-DP and other ET datasets (slope ranging from 0.99 to 1.45). BEPS-DP overall produced larger ET than other ET products. Nevertheless, our confidence is substantiated not only by the spatial pattern but also by the absolute magnitude of ET derived from BEPS-DP. This assurance stems from the training of key parameters using ground flux measurements, and the modeled summed ET values align closely with flux data, exhibiting a disparity of less than 9.6 % (Fig. 3).
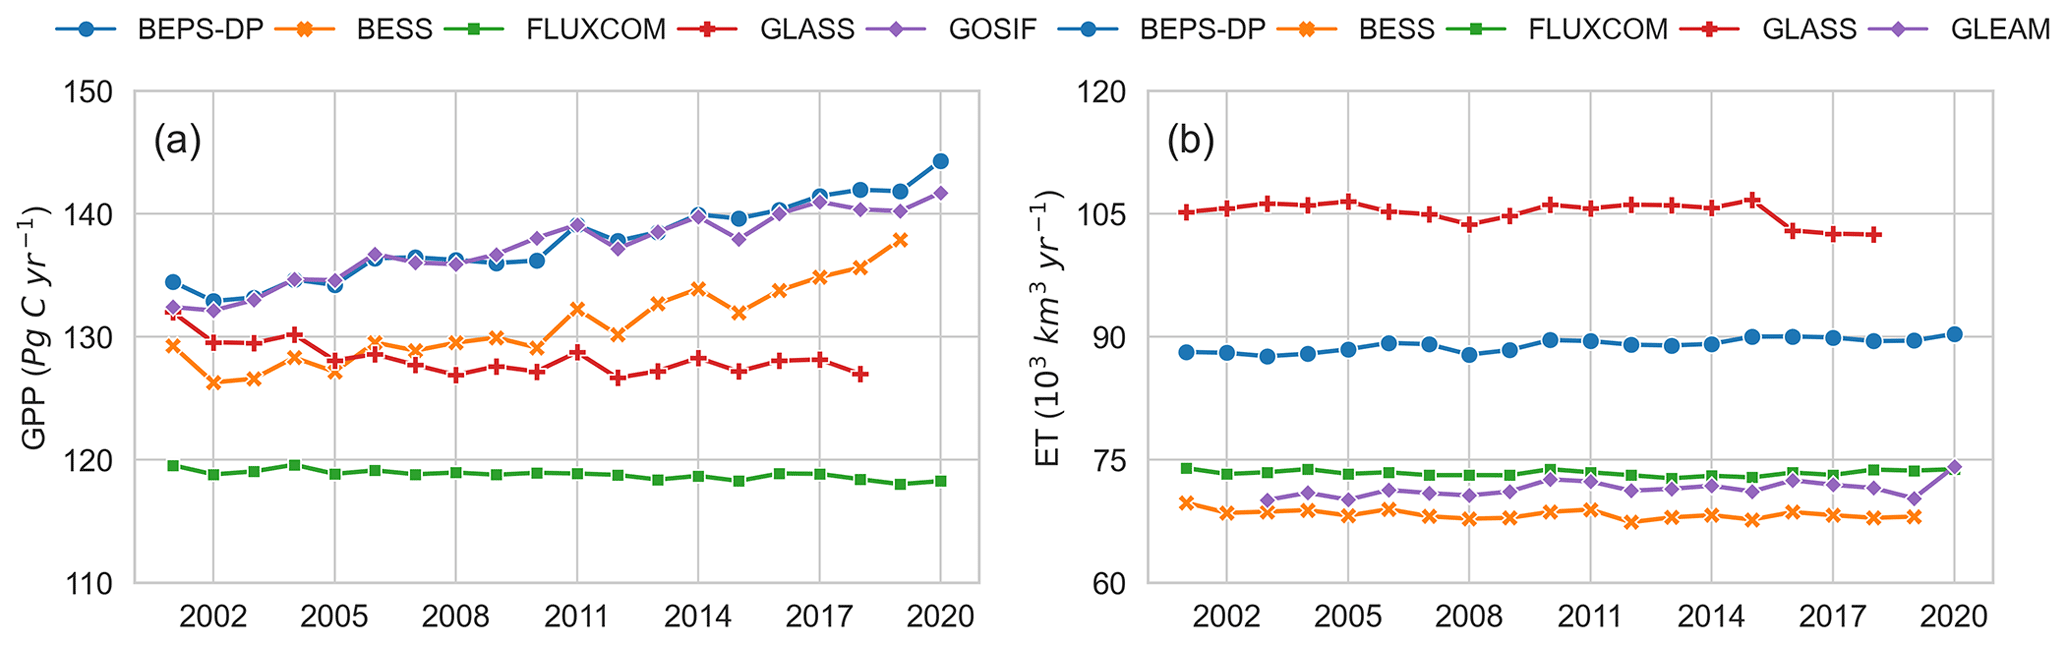
Figure 10Comparisons of annual global GPP and ET estimates during 2001–2020: (a) annual summed GPP between the BEPS model with dynamic parameterizations (BEPS-DP) and BESS, FLUXCOM, GLASS, and GOSIF GPP products; (b) annual summed ET between BEPS-DP and BESS, FLUXCOM, GLASS, and GLEAM ET products.
There is a substantial discrepancy in the interannual variability and trend of GPP among different datasets, while consistent trends of ET with varying magnitudes were observed in different datasets (Fig. 10). The interannual variability (standard deviation) of GPP ranges from 0.39 (FLUXCOM), 1.32 (GLASS), 2.81 (GOSIF), 3.13 (BESS), to 3.14 (BEPS-DP) Pg C yr−1, with trends varying from −0.005 (FLUXCOM), −0.17 (GLASS), 0.47 (GOSIF), 0.53 (BEPS-DP), to 0.53 (BESS) Pg C yr−2. The GPP estimated from machine learning methods, FLUXCOM and GLASS, exhibits no discernible trend during 2001–2020, which can have resulted from a lack of consideration of the CO2 fertilization effect. BEPS-DP exhibits average annual summed GPP that closely aligns with the GOSIF dataset but demonstrates the highest degree of similarity in terms of interannual variability and trends when compared with BESS. SIF, as the proxy of photosynthetic activity, has been used to quantify GPP at the global scale (Frankenberg et al., 2011; Mohammed et al., 2019) from the plant physiological perspective. BEPS-DP not only provides GPP estimates close to the GPP inferred from SIF but also possesses the capability to elucidate the underlying mechanisms involved in the carbon cycles as a process-based model.
The interannual variability (standard deviation) of ET ranges from 0.35 (FLUXCOM), 0.54 (BESS), 0.80 (BEPS-DP), 0.98 (GLEAM), to 1.30 (GLASS) ×103 km3 yr−1, with trends varying from −0.12 (GLASS), −0.05 (FLUXCOM), −0.05 (BESS), 0.10 (BEPS-DP), to 0.10 (GLEAM) ×103 km3 yr−2. BEPS-DP demonstrates a close correspondence in terms of not only the average annual summed ET but also the interannual variability and trends with the GLEAM dataset, although a discrepancy in the magnitude of ET exists between the two datasets. GLEAM estimates global ET by employing data assimilation techniques that integrate remote sensing data with ground measurements (Martens et al., 2017; Miralles et al., 2011), while BEPS-DP incorporates plant physiological processes on the basis of remote sensing and measured fluxes. Incorporating ground measured data contributes to comparable interannual variability and trends in ET estimates between GLEAM and BEPS-DP. However, accounting for the photosynthesis process can lead to improved quantification of transpiration within the ET estimates (Chen and Liu, 2020), which results in the different magnitudes of ET estimates from GLEAM and BEPS-DP.
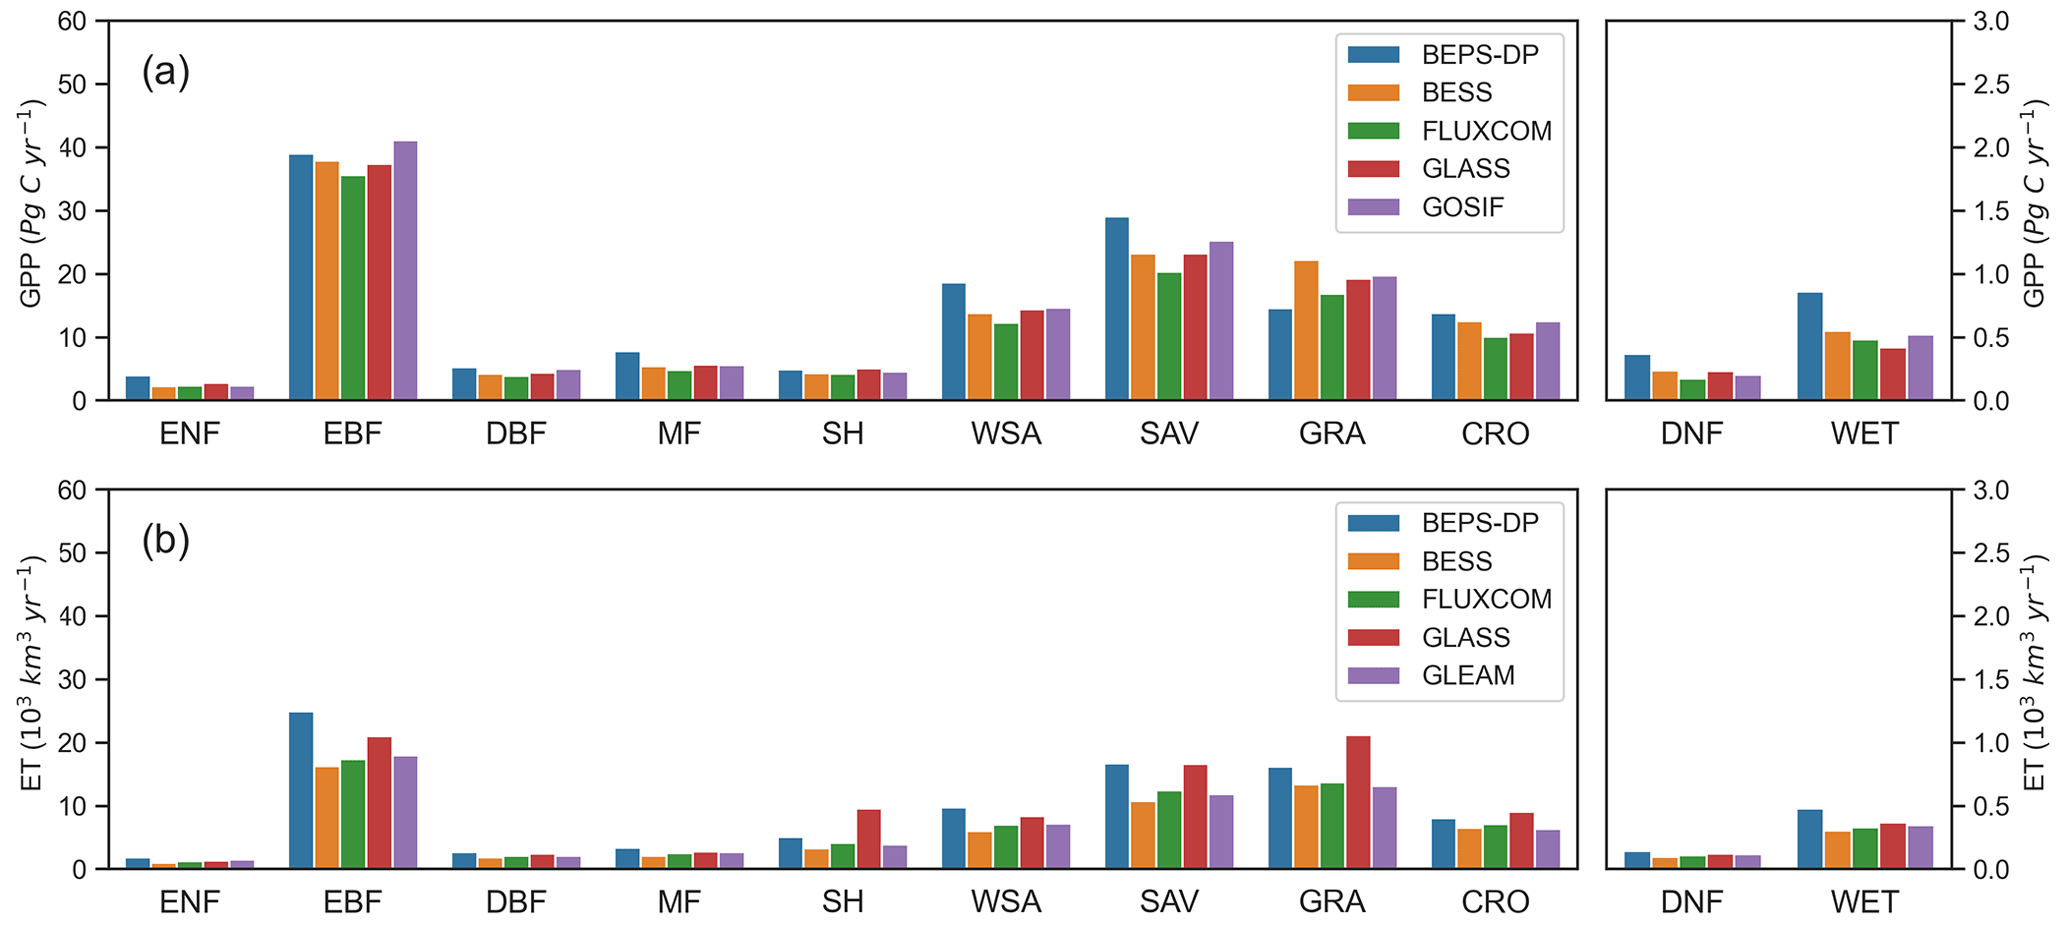
Figure 11Comparisons of long-term (2001–2020) averaged annual GPP and ET between the BEPS model with dynamic parameterizations (BEPS-DP) and other models across plant functional types (PFTs): (a) GPP comparison between BEPS-DP and BESS, FLUXCOM, GLASS, and GOSIF GPP products; (b) ET comparison between BEPS-DP and BESS, FLUXCOM, GLASS, and GLEAM ET products. ENF, evergreen needleleaf forests; EBF, evergreen broadleaf forests; DBF, deciduous broadleaf forests; MF, mixed forests; SH, shrublands; WSA, woody savannas; SAV, savannas; GRA, grasslands; CRO, croplands; DNF, deciduous needleleaf forests; WET, wetlands.
We also compared the long-term averaged annual GPP and ET between BEPS-DP and other datasets across PFTs (Fig. 11). The magnitude of GPP estimated from BEPS-DP is generally close to that from other products in forest ecosystems, while small discrepancies are exhibited in savannas and grasslands (Fig. 11a). The potential overestimates of GPP in savannas may stem from the scarcity of measured fluxes available for those particular ecosystems. Therefore, BEPS-DP has limited access to the necessary information for accurate parameterization, thus contributing to the challenge of achieving precise estimates in this context. The underestimation of GPP in grassland ecosystems may be attributed to the lack of adequate accounting for the C4 plants in BEPS-DP. BEPS-DP generates ET estimates close to the GLASS ET dataset in terms of magnitude but tends to yield higher ET values compared to the FLUXCOM, BESS, and GLEAM datasets. The disparity arises because BEPS-DP optimized the key parameters using the measured fluxes but the FLUXCOM, BESS, and GLEAM datasets tend to underestimate the ET when compared with ground measured water fluxes.
4.1 Advantages of this new dataset
The convergence of unparalleled data sources, enhanced computational capabilities, and recent advancements in statistical modeling and machine learning presents promising prospects for expanding our understanding of terrestrial ecosystems through data-driven approaches (Reichstein et al., 2019). This confluence of factors offers exciting opportunities to unlock new insights and uncover hidden patterns in terrestrial ecosystem processes. In this study, we proposed a novel model that integrates diagnostic process-based models with dynamic parameterizations using machine learning based on measured carbon and water fluxes, which may be regarded as a “handshake” among remote sensing data, a TBM, and the eddy covariance flux network (Baldocchi, 2020). By combining the advantages, we aimed to enhance the accuracy and reliability of BEPS-DP in capturing the long-term complex dynamics of global carbon and water fluxes.
The diurnal cycling of plant carbon uptake and water use, as well as their responses to water and heat stresses, offers valuable insights for evaluating ecosystem productivity, agricultural production and management practices, carbon and water cycles, and their interactions with the climate system (Xiao et al., 2021). The hourly timescale of estimated carbon and water fluxes from the diagnostic model with dynamic parameterizations in this study can promote further research on the comprehension and monitoring of extreme climate events, such as the occurrence of flash droughts (Christian et al., 2021) and heat waves (Bastos et al., 2020), and can facilitate deep insights into the diurnal ecosystem functionality, such as the diurnal hysteresis between carbon and water fluxes (Lin et al., 2019) and the impact of physiological drought stress on ecosystems (Zhang et al., 2023a). With the emergence of geostationary satellites and other satellites with high temporal resolutions, this hourly dataset can help elucidate how terrestrial ecosystems respond to diurnal environment conditions in the context of climate change (Xiao et al., 2021; Yamamoto et al., 2023; Jeong et al., 2023).
To make full advances of the two-leaf BEPS model, the hourly GPP and ET dataset produced in this study also includes hourly GPP and ET from sunlit and shaded leaves separately. These GPP and ET components would also be useful for investigating their distinct responses to meteorological conditions and the coupling between carbon and water fluxes over the diurnal cycle, among many possible uses of this unprecedentedly detailed dataset.
4.2 Uncertainties and limitations
Although BEPS-DP can effectively simulate the hourly carbon and water fluxes for most areas of the globe, it may be subject to uncertainties resulting from the lack of representation of eddy covariance fluxes for savannas and tropical forest ecosystems. The allocation of sites is uneven between the Northern Hemisphere and Southern Hemisphere, characterized by a larger number of sites situated in the Northern Hemisphere (Baldocchi et al., 2001; Baldocchi, 2020), which may also induce some uncertainties in BEPS-DP. The key parameters in stomatal conductance and photosynthesis models, m and , were optimized from eddy covariance fluxes in BEPS-DP. Then the optimized m and in the ∼1 km footprint (Chu et al., 2021) were upscaled to the pixel level during 2001–2020. However, it should be noted that in areas with a limited number of sites, the pixel-level values of m and may not sufficiently capture the vegetation physiological status. For example, only one deciduous needleleaf forest site was included in this study. This limitation arises from the fact that the machine learning algorithm did not incorporate knowledge specifically for such situations. Further work should focus on the enhancement of the machine learning algorithm to improve the reliability of optimized m and particularly in regions with scarce training data. Furthermore, limited training data for the C4 plants in BEPS-DP may result in uncertainties in quantifying GPP and ET in savannas, woody savannas, and crop ecosystems. Efforts will also be made to improve the scheme for simulating the carbon and water fluxes in the C4 plants in BEPS-DP.
Additionally, although the dataset in this study captures the spatial distributions of global GPP and ET at an hourly scale, this dataset only has a spatial resolution of 0.25°×0.25° due to the climate forcing data resolution and computational capacity. Due to surface heterogeneity and the nonlinear algorithm in BEPS-DP, the estimated GPP and ET fluxes in 0.25°×0.25° pixels would be biased to some extent even if the simulated values at the site level are unbiased (Chen, 1999; Chen et al., 2013). With the advancement and evolution of computational capacity and techniques, such as cloud computing and supercomputing, future research can refine the spatial resolution of the hourly dataset from the current 0.25° degree to higher resolutions, in order to eliminate the scale mismatch between the flux tower footprints and the hourly datasets and thoroughly comprehend the intrinsic processes in global carbon and water cycles (Li et al., 2008; Kong et al., 2022).
The 0.25°×0.25° global hourly two-leaf GPP and ET datasets for 2001–2020 are available at https://doi.org/10.57760/sciencedb.ecodb.00163 (Leng et al., 2023a). The datasets are provided in NetCDF4 format. The GPP datasets include two components, the hourly GPP of sunlit and shaded leaves. The ET datasets include three components, the hourly ET and the transpiration of sunlit and shaded leaves. Each hourly NetCDF4 file represents the GPP/ET in a year at an hourly scale (g C m−2 h−1/mm h−1). The accumulated daily GPP and ET datasets for 2001–2020 are available at https://doi.org/10.57760/sciencedb.ecodb.00165 (Leng et al., 2023b). Each daily NetCDF4 file represents the GPP/ET in a year at a daily scale (g C m−2 d−1/mm d−1).
The code for single-pixel hourly Biosphere-atmosphere Exchange Process Simulator (BEPS) v4.10 can be found at https://doi.org/10.5281/zenodo.10804468 (Leng et al., 2024c). The detailed descriptions of each module and the user guide for using the hourly BEPS are also included.
For any questions on the dataset and the BEPS model, please contact Jing M. Chen, jing.chen@utoronto.ca.
In this study, we produced a long-term global two-leaf GPP and ET dataset at the hourly time step by integrating a diagnostic TBM (i.e., BEPS) with dynamic parameterizations. We optimized the key photosynthetic parameters using the flux observations and upscaled the optimized parameters to the global scale for large-scale simulation. The BEPS model with dynamic parameterizations is able to simulate the diurnal, seasonal, and interannual variations of the GPP and ET fluxes at 0.25° resolution. The new hourly datasets of GPP and ET were comprehensively evaluated against flux observations and other remote sensing and machine learning-based estimates over the various temporal and spatial scales. The new dataset provides us with a unique opportunity to study carbon and water fluxes at sub-daily time scales and to advance our understanding of ecosystem functions in response to transient environmental changes.
The supplement related to this article is available online at: https://doi.org/10.5194/essd-16-1283-2024-supplement.
JL and JMC devised the conceptual ideas. JL, WL, MX, BL, and YY provided and processed the data. JL conducted the investigation and performed formal analysis. JMC acquired the funding. JL, WL, and XL developed the methodology. JMC supervised the findings of this work. WL, XL, MX, JL, RW, CR, and YY verified the results. JL created the figures and drafted the original manuscript. JMC, WL, XL, MX, JL, RW, CR, BL, and YY reviewed and commented on the manuscript.
The contact author has declared that none of the authors has any competing interests.
Publisher's note: Copernicus Publications remains neutral with regard to jurisdictional claims made in the text, published maps, institutional affiliations, or any other geographical representation in this paper. While Copernicus Publications makes every effort to include appropriate place names, the final responsibility lies with the authors.
This work used the eddy covariance data acquired and shared by the FLUXNET community, including the following networks: AmeriFlux, AfriFlux, AsiaFlux, CarboAfrica, CarboEuropeIP, CarboItaly, CarboMont, ChinaFlux, Fluxnet-Canada, GreenGrass, ICOS, KoFlux, LBA, NECC, OzFlux-TERN, TCOS-Siberia, and USCCC. The ERA-Interim reanalysis data are provided by ECMWF and processed by LSCE. The FLUXNET eddy covariance data processing and harmonization were carried out by the European Fluxes Database Cluster, AmeriFlux Management Project and Fluxdata project of FLUXNET, with the support of CDIAC and ICOS Ecosystem Thematic Center, and the OzFlux, ChinaFlux and AsiaFlux offices. The authors thank the U.S. Geological Survey (USGS) for providing the MODIS data and thank the National Oceanic and Atmospheric Administration for providing the CO2 concentration records.
This research has been supported by the Natural Science and Engineering Council of Canada (grant no. RGPIN-2020-05163).
This paper was edited by Yuyu Zhou and reviewed by two anonymous referees.
Baldocchi, D.: An analytical solution for coupled leaf photosynthesis and stomatal conductance models, Tree Physiol., 14, 1069–1079, https://doi.org/10.1093/treephys/14.7-8-9.1069, 1994.
Baldocchi, D., Falge, E., Gu, L., Olson, R., Hollinger, D., Running, S., Anthoni, P., Bernhofer, C., Davis, K., Evans, R., Fuentes, J., Goldstein, A., Katul, G., Law, B., Lee, X., Malhi, Y., Meyers, T., Munger, W., Oechel, W., Paw U, K. T., Pilegaard, K., Schmid, H. P., Valentini, R., Verma, S., Vesala, T., Wilson, K., and Wofsy, S.: FLUXNET: A New Tool to Study the Temporal and Spatial Variability of Ecosystem-Scale Carbon Dioxide, Water Vapor, and Energy Flux Densities, B. Am. Meteor. Soc., 82, 2415–2434, https://doi.org/10.1175/1520-0477(2001)082<2415:FANTTS>2.3.CO;2, 2001.
Baldocchi, D. D.: How eddy covariance flux measurements have contributed to our understanding of Global Change Biology, Glob. Change Biol., 26, 242–260, https://doi.org/10.1111/gcb.14807, 2020.
Ball, J. T., Woodrow, I. E., and Berry, J. A.: A Model Predicting Stomatal Conductance and its Contribution to the Control of Photosynthesis under Different Environmental Conditions, in: Progress in Photosynthesis Research: Volume 4 Proceedings of the VIIth International Congress on Photosynthesis Providence, Rhode Island, USA, 10–15 August 1986, edited by: Biggins, J., Springer Netherlands, Dordrecht, 221–224, https://doi.org/10.1007/978-94-017-0519-6_48, 1987.
Bastos, A., Ciais, P., Friedlingstein, P., Sitch, S., Pongratz, J., Fan, L., Wigneron, J. P., Weber, U., Reichstein, M., Fu, Z., Anthoni, P., Arneth, A., Haverd, V., Jain, A. K., Joetzjer, E., Knauer, J., Lienert, S., Loughran, T., McGuire, P. C., Tian, H., Viovy, N., and Zaehle, S.: Direct and seasonal legacy effects of the 2018 heat wave and drought on European ecosystem productivity, Sci. Adv., 6, eaba2724, https://doi.org/10.1126/sciadv.aba2724, 2020.
Bauerle, W. L., Daniels, A. B., and Barnard, D. M.: Carbon and water flux responses to physiology by environment interactions: a sensitivity analysis of variation in climate on photosynthetic and stomatal parameters, Clim. Dynam., 42, 2539–2554, https://doi.org/10.1007/s00382-013-1894-6, 2014.
Bodesheim, P., Jung, M., Gans, F., Mahecha, M. D., and Reichstein, M.: Upscaled diurnal cycles of land–atmosphere fluxes: a new global half-hourly data product, Earth Syst. Sci. Data, 10, 1327–1365, https://doi.org/10.5194/essd-10-1327-2018, 2018.
Bonan, G.: Climate Change and Terrestrial Ecosystem Modeling, Cambridge University Press, Cambridge, https://doi.org/10.1017/9781107339217, 2019.
Bonan, G. B., Levis, S., Kergoat, L., and Oleson, K. W.: Landscapes as patches of plant functional types: An integrating concept for climate and ecosystem models, Global Biogeochem. Cy., 16, 5-1–5-23, 10.1029/2000GB001360, 2002.
Bonan, G. B., Lawrence, P. J., Oleson, K. W., Levis, S., Jung, M., Reichstein, M., Lawrence, D. M., and Swenson, S. C.: Improving canopy processes in the Community Land Model version 4 (CLM4) using global flux fields empirically inferred from FLUXNET data, J. Geophys. Res., 116, G02014, https://doi.org/10.1029/2010jg001593, 2011.
Cao, M. and Woodward, F. I.: Dynamic responses of terrestrial ecosystem carbon cycling to global climate change, Nature, 393, 249–252, https://doi.org/10.1038/30460, 1998.
Chen, J. M.: Spatial Scaling of a Remotely Sensed Surface Parameter by Contexture, Remote Sens. Environ., 69, 30–42, https://doi.org/10.1016/S0034-4257(99)00006-1, 1999.
Chen, J. M. and Liu, J.: Evolution of evapotranspiration models using thermal and shortwave remote sensing data, Remote Sens. Environ., 237, 111594, https://doi.org/10.1016/j.rse.2019.111594, 2020.
Chen, J. M., Rich, P. M., Gower, S. T., Norman, J. M., and Plummer, S.: Leaf area index of boreal forests: Theory, techniques, and measurements, J. Geophys. Res.-Atmos., 102, 29429–29443, https://doi.org/10.1029/97JD01107, 1997.
Chen, J. M., Liu, J., Cihlar, J., and Goulden, M. L.: Daily canopy photosynthesis model through temporal and spatial scaling for remote sensing applications, Ecol. Model., 124, 99–119, https://doi.org/10.1016/S0304-3800(99)00156-8, 1999.
Chen, J. M., Deng, F., and Chen, M.: Locally adjusted cubic-spline capping for reconstructing seasonal trajectories of a satellite-derived surface parameter, IEEE T. Geosci. Remote, 44, 2230–2238, https://doi.org/10.1109/TGRS.2006.872089, 2006.
Chen, J. M., Mo, G., Pisek, J., Liu, J., Deng, F., Ishizawa, M., and Chan, D.: Effects of foliage clumping on the estimation of global terrestrial gross primary productivity, Global Biogeochem. Cy., 26, GB1019, https://doi.org/10.1029/2010GB003996, 2012.
Chen, J. M., Chen, X., and Ju, W.: Effects of vegetation heterogeneity and surface topography on spatial scaling of net primary productivity, Biogeosciences, 10, 4879–4896, https://doi.org/10.5194/bg-10-4879-2013, 2013.
Chen, J. M., Ju, W., Ciais, P., Viovy, N., Liu, R., Liu, Y., and Lu, X.: Vegetation structural change since 1981 significantly enhanced the terrestrial carbon sink, Nat. Commun., 10, 4259, https://doi.org/10.1038/s41467-019-12257-8, 2019.
Chen, J. M., Wang, R., Liu, Y., He, L., Croft, H., Luo, X., Wang, H., Smith, N. G., Keenan, T. F., Prentice, I. C., Zhang, Y., Ju, W., and Dong, N.: Global datasets of leaf photosynthetic capacity for ecological and earth system research, Earth Syst. Sci. Data, 14, 4077–4093, https://doi.org/10.5194/essd-14-4077-2022, 2022.
Christian, J. I., Basara, J. B., Hunt, E. D., Otkin, J. A., Furtado, J. C., Mishra, V., Xiao, X., and Randall, R. M.: Global distribution, trends, and drivers of flash drought occurrence, Nat. Commun., 12, 6330, https://doi.org/10.1038/s41467-021-26692-z, 2021.
Chu, H., Luo, X., Ouyang, Z., Chan, W. S., Dengel, S., Biraud, S. C., Torn, M. S., Metzger, S., Kumar, J., Arain, M. A., Arkebauer, T. J., Baldocchi, D., Bernacchi, C., Billesbach, D., Black, T. A., Blanken, P. D., Bohrer, G., Bracho, R., Brown, S., Brunsell, N. A., Chen, J., Chen, X., Clark, K., Desai, A. R., Duman, T., Durden, D., Fares, S., Forbrich, I., Gamon, J. A., Gough, C. M., Griffis, T., Helbig, M., Hollinger, D., Humphreys, E., Ikawa, H., Iwata, H., Ju, Y., Knowles, J. F., Knox, S. H., Kobayashi, H., Kolb, T., Law, B., Lee, X., Litvak, M., Liu, H., Munger, J. W., Noormets, A., Novick, K., Oberbauer, S. F., Oechel, W., Oikawa, P., Papuga, S. A., Pendall, E., Prajapati, P., Prueger, J., Quinton, W. L., Richardson, A. D., Russell, E. S., Scott, R. L., Starr, G., Staebler, R., Stoy, P. C., Stuart-Haëntjens, E., Sonnentag, O., Sullivan, R. C., Suyker, A., Ueyama, M., Vargas, R., Wood, J. D., and Zona, D.: Representativeness of Eddy-Covariance flux footprints for areas surrounding AmeriFlux sites, Agr. Forest Meteorol., 301–302, 108350, https://doi.org/10.1016/j.agrformet.2021.108350, 2021.
Croft, H., Chen, J. M., Luo, X., Bartlett, P., Chen, B., and Staebler, R. M.: Leaf chlorophyll content as a proxy for leaf photosynthetic capacity, Glob. Change Biol., 23, 3513–3524, https://doi.org/10.1111/gcb.13599, 2017.
Duarte Rocha, A., Vulova, S., van der Tol, C., Förster, M., and Kleinschmit, B.: Modelling hourly evapotranspiration in urban environments with SCOPE using open remote sensing and meteorological data, Hydrol. Earth Syst. Sci., 26, 1111–1129, https://doi.org/10.5194/hess-26-1111-2022, 2022.
Farquhar, G. D., von Caemmerer, S., and Berry, J. A.: A biochemical model of photosynthetic CO2 assimilation in leaves of C3 species, Planta, 149, 78–90, https://doi.org/10.1007/BF00386231, 1980.
Frankenberg, C., Fisher, J. B., Worden, J., Badgley, G., Saatchi, S. S., Lee, J.-E., Toon, G. C., Butz, A., Jung, M., Kuze, A., and Yokota, T.: New global observations of the terrestrial carbon cycle from GOSAT: Patterns of plant fluorescence with gross primary productivity, Geophys. Res. Lett., 38, L17706, https://doi.org/10.1029/2011GL048738, 2011.
Franks, P. J., Bonan, G. B., Berry, J. A., Lombardozzi, D. L., Holbrook, N. M., Herold, N., and Oleson, K. W.: Comparing optimal and empirical stomatal conductance models for application in Earth system models, Glob. Change Biol., 24, 5708–5723, https://doi.org/10.1111/gcb.14445, 2018.
Friedl, M. and Sulla-Menashe, D.: MCD12C1 MODIS/Terra+Aqua Land Cover Type Yearly L3 Global 0.05Deg CMG V006, NASA EOSDIS Land Processes Distributed Active Archive Center [data set], https://doi.org/10.5067/MODIS/MCD12C1.006, 2015.
Gamon, J. A., Huemmrich, K. F., Peddle, D. R., Chen, J., Fuentes, D., Hall, F. G., Kimball, J. S., Goetz, S., Gu, J., McDonald, K. C., Miller, J. R., Moghaddam, M., Rahman, A. F., Roujean, J. L., Smith, E. A., Walthall, C. L., Zarco-Tejada, P., Hu, B., Fernandes, R., and Cihlar, J.: Remote sensing in BOREAS: Lessons learned, Remote Sens. Environ., 89, 139–162, https://doi.org/10.1016/j.rse.2003.08.017, 2004.
Goulden, M. L., Miller, S. D., da Rocha, H. R., Menton, M. C., de Freitas, H. C., e Silva Figueira, A. M., and de Sousa, C. A. D.: Diel and seasonal patterns of tropical forest CO2 exchange, Ecol. Appl., 14, 42–54, https://doi.org/10.1890/02-6008, 2004.
Hashimoto, H., Wang, W., Michaelis, A., Takenaka, H., Higuchi, A., and Nemani, R. R.: Hourly GPP Estimation in Australia Using Himawari-8 AHI Products, IGARSS 2020 – 2020 IEEE International Geoscience and Remote Sensing Symposium, Hawaii, USA, 26 September–2 October 2020, 4513–4515, https://doi.org/10.1109/IGARSS39084.2020.9323462, 2020.
He, L., Chen, J. M., Pisek, J., Schaaf, C. B., and Strahler, A. H.: Global clumping index map derived from the MODIS BRDF product, Remote Sens. Environ., 119, 118–130, https://doi.org/10.1016/j.rse.2011.12.008, 2012.
Hersbach, H., Bell, B., Berrisford, P., Biavati, G., Horányi, A., Muñoz Sabater, J., Nicolas, J., Peubey, C., Radu, R., Rozum, I., Schepers, D., Simmons, A., Soci, C., Dee, D., and Thépaut, J.-N.: ERA5 hourly data on single levels from 1940 to present, Copernicus Climate Change Service (C3S) Climate Data Store (CDS), https://doi.org/10.24381/cds.adbb2d47, 2023.
Hu, X., Shi, L., Lin, G., and Lin, L.: Comparison of physical-based, data-driven and hybrid modeling approaches for evapotranspiration estimation, J. Hydrol., 601, 126592, https://doi.org/10.1016/j.jhydrol.2021.126592, 2021.
Jasechko, S., Sharp, Z. D., Gibson, J. J., Birks, S. J., Yi, Y., and Fawcett, P. J.: Terrestrial water fluxes dominated by transpiration, Nature, 496, 347–350, https://doi.org/10.1038/nature11983, 2013.
Jeong, S., Ryu, Y., Dechant, B., Li, X., Kong, J., Choi, W., Kang, M., Yeom, J., Lim, J., Jang, K., and Chun, J.: Tracking diurnal to seasonal variations of gross primary productivity using a geostationary satellite, GK-2A advanced meteorological imager, Remote Sens. Environ., 284, 113365, https://doi.org/10.1016/j.rse.2022.113365, 2023.
Ju, W., Chen, J. M., Black, T. A., Barr, A. G., Liu, J., and Chen, B.: Modelling multi-year coupled carbon and water fluxes in a boreal aspen forest, Agr. Forest Meteorol., 140, 136–151, https://doi.org/10.1016/j.agrformet.2006.08.008, 2006.
Jung, M., Reichstein, M., Ciais, P., Seneviratne, S. I., Sheffield, J., Goulden, M. L., Bonan, G., Cescatti, A., Chen, J., de Jeu, R., Dolman, A. J., Eugster, W., Gerten, D., Gianelle, D., Gobron, N., Heinke, J., Kimball, J., Law, B. E., Montagnani, L., Mu, Q., Mueller, B., Oleson, K., Papale, D., Richardson, A. D., Roupsard, O., Running, S., Tomelleri, E., Viovy, N., Weber, U., Williams, C., Wood, E., Zaehle, S., and Zhang, K.: Recent decline in the global land evapotranspiration trend due to limited moisture supply, Nature, 467, 951–954, https://doi.org/10.1038/nature09396, 2010.
Jung, M., Koirala, S., Weber, U., Ichii, K., Gans, F., Camps-Valls, G., Papale, D., Schwalm, C., Tramontana, G., and Reichstein, M.: The FLUXCOM ensemble of global land-atmosphere energy fluxes, Sci. Data, 6, 1–14, https://doi.org/10.1038/s41597-019-0076-8, 2019.
Jung, M., Schwalm, C., Migliavacca, M., Walther, S., Camps-Valls, G., Koirala, S., Anthoni, P., Besnard, S., Bodesheim, P., Carvalhais, N., Chevallier, F., Gans, F., Goll, D. S., Haverd, V., Köhler, P., Ichii, K., Jain, A. K., Liu, J., Lombardozzi, D., Nabel, J. E. M. S., Nelson, J. A., O'Sullivan, M., Pallandt, M., Papale, D., Peters, W., Pongratz, J., Rödenbeck, C., Sitch, S., Tramontana, G., Walker, A., Weber, U., and Reichstein, M.: Scaling carbon fluxes from eddy covariance sites to globe: synthesis and evaluation of the FLUXCOM approach, Biogeosciences, 17, 1343–1365, https://doi.org/10.5194/bg-17-1343-2020, 2020.
Kattge, J., Knorr, W., Raddatz, T., and Wirth, C.: Quantifying photosynthetic capacity and its relationship to leaf nitrogen content for global-scale terrestrial biosphere models, Glob. Change Biol., 15, 976–991, https://doi.org/10.1111/j.1365-2486.2008.01744.x, 2009.
Kong, J., Ryu, Y., Liu, J., Dechant, B., Rey-Sanchez, C., Shortt, R., Szutu, D., Verfaillie, J., Houborg, R., and Baldocchi, D. D.: Matching high resolution satellite data and flux tower footprints improves their agreement in photosynthesis estimates, Agr. Forest Meteorol., 316, 108878, https://doi.org/10.1016/j.agrformet.2022.108878, 2022.
Koppa, A., Rains, D., Hulsman, P., Poyatos, R., and Miralles, D. G.: A deep learning-based hybrid model of global terrestrial evaporation, Nat. Commun., 13, 1912, https://doi.org/10.1038/s41467-022-29543-7, 2022.
Lee, J.-E., Oliveira, R. S., Dawson, T. E., and Fung, I.: Root functioning modifies seasonal climate, P. Natl. Acad. Sci. USA, 102, 17576–17581, https://doi.org/10.1073/pnas.0508785102, 2005.
Li, B., Ryu, Y., Jiang, C., Dechant, B., Liu, J., Yan, Y., and Li, X.: BESSv2.0: A satellite-based and coupled-process model for quantifying long-term global land–atmosphere fluxes, Remote Sens. Environ., 295, 113696, https://doi.org/10.1016/j.rse.2023.113696, 2023.
Leng, J., Chen, J. M., Li, W., Luo, X., Xu, M., Liu, J., Wang, R., Rogers, C., Li, B., and Yan, Y.: Global Datasets of Hourly Carbon and Water Fluxes Simulated Using a Satellite-based Process Model with Dynamic Parameterizations [DS/OL], V1, Science Data Bank, https://doi.org/10.57760/sciencedb.ecodb.00163, 2023a.
Leng, J., Chen, J. M., Li, W., Luo, X., Xu, M., Liu, J., Wang, R., Rogers, C., Li, B., and Yan, Y.: Global Datasets of Daily Carbon and Water Fluxes Simulated Using a Satellite-based Process Model with Dynamic Parameterizations [DS/OL], V1, Science Data Bank, https://doi.org/10.57760/sciencedb.ecodb.00165, 2023b.
Leng, J., Chen, J. M., Li, W., Luo, X., Rogers, C., Croft, H., Xie, X., and Staebler, R. M.: Optimizing seasonally variable photosynthetic parameters based on joint carbon and water flux constraints, Research Square [preprint], https://doi.org/10.21203/rs.3.rs-3832505/v1, 2024a.
Leng, J., Chen, J. M., Li, W., Luo, X., Xu, M., Rogers, C., and Yan, Y.: Declining global sensitivity of stomatal conductance to photosynthesis, Research Square [preprint], https://doi.org/10.21203/rs.3.rs-3832529/v1, 2024b.
Leng, J., Chen, J. M., Luo, X., and Liu, J.: Biosphere-atmosphere Exchange Process Simulator (BEPS) (4.10), Zenodo [code], https://doi.org/10.5281/zenodo.10804469, 2024.
Li, B., Ryu, Y., Jiang, C., Dechant, B., Liu, J., Yan, Y., and Li, X.: BESSv2.0: A satellite-based and coupled-process model for quantifying long-term global land–atmosphere fluxes, Remote Sens. Environ., 295, 113696, https://doi.org/10.1016/j.rse.2023.113696, 2023.
Li, F., Kustas, W. P., Anderson, M. C., Prueger, J. H., and Scott, R. L.: Effect of remote sensing spatial resolution on interpreting tower-based flux observations, Remote Sens. Environ., 112, 337–349, https://doi.org/10.1016/j.rse.2006.11.032, 2008.
Li, X. and Xiao, J.: Mapping Photosynthesis Solely from Solar-Induced Chlorophyll Fluorescence: A Global, Fine-Resolution Dataset of Gross Primary Production Derived from OCO-2, Remote Sens., 11, 2563, https://doi.org/10.3390/rs11212563, 2019.
Liang, S., Zhao, X., Liu, S., Yuan, W., Cheng, X., Xiao, Z., Zhang, X., Liu, Q., Cheng, J., Tang, H., Qu, Y., Bo, Y., Qu, Y., Ren, H., Yu, K., and Townshend, J.: A long-term Global LAnd Surface Satellite (GLASS) data-set for environmental studies, Int. J. Digit. Earth, 6, 5–33, https://doi.org/10.1080/17538947.2013.805262, 2013.
Liang, S., Cheng, J., Jia, K., Jiang, B., Liu, Q., Xiao, Z., Yao, Y., Yuan, W., Zhang, X., Zhao, X., and Zhou, J.: The Global Land Surface Satellite (GLASS) Product Suite, B. Am. Meteor. Soc., 102, E323–E337, https://doi.org/10.1175/BAMS-D-18-0341.1, 2021.
Lin, C., Gentine, P., Frankenberg, C., Zhou, S., Kennedy, D., and Li, X.: Evaluation and mechanism exploration of the diurnal hysteresis of ecosystem fluxes, Agr. Forest Meteorol., 278, 107642, https://doi.org/10.1016/j.agrformet.2019.107642, 2019.
Lin, Y.-S., Medlyn, B. E., Duursma, R. A., Prentice, I. C., Wang, H., Baig, S., Eamus, D., de Dios, Victor R., Mitchell, P., Ellsworth, D. S., de Beeck, M. O., Wallin, G., Uddling, J., Tarvainen, L., Linderson, M.-L., Cernusak, L. A., Nippert, J. B., Ocheltree, T. W., Tissue, D. T., Martin-StPaul, N. K., Rogers, A., Warren, J. M., De Angelis, P., Hikosaka, K., Han, Q., Onoda, Y., Gimeno, T. E., Barton, C. V. M., Bennie, J., Bonal, D., Bosc, A., Löw, M., Macinins-Ng, C., Rey, A., Rowland, L., Setterfield, S. A., Tausz-Posch, S., Zaragoza-Castells, J., Broadmeadow, M. S. J., Drake, J. E., Freeman, M., Ghannoum, O., Hutley, Lindsay B., Kelly, J. W., Kikuzawa, K., Kolari, P., Koyama, K., Limousin, J.-M., Meir, P., Lola da Costa, A. C., Mikkelsen, T. N., Salinas, N., Sun, W., and Wingate, L.: Optimal stomatal behaviour around the world, Nat. Clim. Change, 5, 459–464, https://doi.org/10.1038/nclimate2550, 2015.
Liu, J., Chen, J. M., Cihlar, J., and Park, W. M.: A process-based boreal ecosystem productivity simulator using remote sensing inputs, Remote Sens. Environ., 62, 158–175, https://doi.org/10.1016/S0034-4257(97)00089-8, 1997.
Liu, J., Chen, J. M., and Cihlar, J.: Mapping evapotranspiration based on remote sensing: An application to Canada's landmass, Water Resour. Res., 39, 1189, https://doi.org/10.1029/2002WR001680, 2003.
Liu, Y., Liu, R., and Chen, J. M.: Retrospective retrieval of long-term consistent global leaf area index (1981–2011) from combined AVHRR and MODIS data, J. Geophys. Res.-Biogeo., 117, G04003, https://doi.org/10.1029/2012JG002084, 2012.
Liu, Y., Chen, J. M., He, L., Wang, R., Smith, N. G., Keenan, T. F., Rogers, C., Li, W., and Leng, J.: Global photosynthetic capacity of C3 biomes retrieved from solar-induced chlorophyll fluorescence and leaf chlorophyll content, Remote Sens. Environ., 287, 113457, https://doi.org/10.1016/j.rse.2023.113457, 2023.
Luo, X., Chen, J. M., Liu, J., Black, T. A., Croft, H., Staebler, R., He, L., Arain, M. A., Chen, B., Mo, G., Gonsamo, A., and McCaughey, H.: Comparison of Big-Leaf, Two-Big-Leaf, and Two-Leaf Upscaling Schemes for Evapotranspiration Estimation Using Coupled Carbon-Water Modeling, J. Geophys. Res.-Biogeo., 123, 207–225, https://doi.org/10.1002/2017JG003978, 2018.
Luo, X., Croft, H., Chen, J. M., He, L., and Keenan, T. F.: Improved estimates of global terrestrial photosynthesis using information on leaf chlorophyll content, Glob. Change Biol., 25, 2499–2514, https://doi.org/10.1111/gcb.14624, 2019.
Luo, X., Keenan, T. F., Chen, J. M., Croft, H., Colin Prentice, I., Smith, N. G., Walker, A. P., Wang, H., Wang, R., Xu, C., and Zhang, Y.: Global variation in the fraction of leaf nitrogen allocated to photosynthesis, Nat. Commun., 12, 4866, https://doi.org/10.1038/s41467-021-25163-9, 2021.
Ma, R., Xiao, J., Liang, S., Ma, H., He, T., Guo, D., Liu, X., and Lu, H.: Pixel-level parameter optimization of a terrestrial biosphere model for improving estimation of carbon fluxes with an efficient model–data fusion method and satellite-derived LAI and GPP data, Geosci. Model Dev., 15, 6637–6657, https://doi.org/10.5194/gmd-15-6637-2022, 2022.
Martens, B., Miralles, D. G., Lievens, H., van der Schalie, R., de Jeu, R. A. M., Fernández-Prieto, D., Beck, H. E., Dorigo, W. A., and Verhoest, N. E. C.: GLEAM v3: satellite-based land evaporation and root-zone soil moisture, Geosci. Model Dev., 10, 1903–1925, https://doi.org/10.5194/gmd-10-1903-2017, 2017.
Miner, G. L. and Bauerle, W. L.: Seasonal variability of the parameters of the Ball–Berry model of stomatal conductance in maize (Zea mays L.) and sunflower (Helianthus annuus L.) under well-watered and water-stressed conditions, Plant Cell Environ., 40, 1874–1886, https://doi.org/10.1111/pce.12990, 2017.
Miner, G. L., Bauerle, W. L., and Baldocchi, D. D.: Estimating the sensitivity of stomatal conductance to photosynthesis: a review, Plant, Cell Environ., 40, 1214–1238, https://doi.org/10.1111/pce.12871, 2017.
Miralles, D. G., De Jeu, R. A. M., Gash, J. H., Holmes, T. R. H., and Dolman, A. J.: Magnitude and variability of land evaporation and its components at the global scale, Hydrol. Earth Syst. Sci., 15, 967–981, https://doi.org/10.5194/hess-15-967-2011, 2011.
Misson, L., Panek, J. A., and Goldstein, A. H.: A comparison of three approaches to modeling leaf gas exchange in annually drought-stressed ponderosa pine forests, Tree Physiol., 24, 529–541, https://doi.org/10.1093/treephys/24.5.529, 2004.
Mohammed, G. H., Colombo, R., Middleton, E. M., Rascher, U., van der Tol, C., Nedbal, L., Goulas, Y., Pérez-Priego, O., Damm, A., Meroni, M., Joiner, J., Cogliati, S., Verhoef, W., Malenovský, Z., Gastellu-Etchegorry, J.-P., Miller, J. R., Guanter, L., Moreno, J., Moya, I., Berry, J. A., Frankenberg, C., and Zarco-Tejada, P. J.: Remote sensing of solar-induced chlorophyll fluorescence (SIF) in vegetation: 50 years of progress, Remote Sens. Environ., 231, 111177, https://doi.org/10.1016/j.rse.2019.04.030, 2019.
Moreno, A., Maselli, F., Gilabert, M. A., Chiesi, M., Martínez, B., and Seufert, G.: Assessment of MODIS imagery to track light-use efficiency in a water-limited Mediterranean pine forest, Remote Sens. Environ., 123, 359–367, https://doi.org/10.1016/j.rse.2012.04.003, 2012.
Nelson, J. A., Pérez-Priego, O., Zhou, S., Poyatos, R., Zhang, Y., Blanken, P. D., Gimeno, T. E., Wohlfahrt, G., Desai, A. R., Gioli, B., Limousin, J.-M., Bonal, D., Paul-Limoges, E., Scott, R. L., Varlagin, A., Fuchs, K., Montagnani, L., Wolf, S., Delpierre, N., Berveiller, D., Gharun, M., Belelli Marchesini, L., Gianelle, D., Šigut, L., Mammarella, I., Siebicke, L., Andrew Black, T., Knohl, A., Hörtnagl, L., Magliulo, V., Besnard, S., Weber, U., Carvalhais, N., Migliavacca, M., Reichstein, M., and Jung, M.: Ecosystem transpiration and evaporation: Insights from three water flux partitioning methods across FLUXNET sites, Glob. Change Biol., 26, 6916–6930, https://doi.org/10.1111/gcb.15314, 2020.
Neumann, R. B. and Cardon, Z. G.: The magnitude of hydraulic redistribution by plant roots: a review and synthesis of empirical and modeling studies, New Phytol., 194, 337–352, https://doi.org/10.1111/j.1469-8137.2012.04088.x, 2012.
Pastorello, G., Trotta, C., Canfora, E., Chu, H., Christianson, D., Cheah, Y.-W., Poindexter, C., Chen, J., Elbashandy, A., Humphrey, M., Isaac, P., Polidori, D., Reichstein, M., Ribeca, A., van Ingen, C., Vuichard, N., Zhang, L., Amiro, B., Ammann, C., Arain, M. A., Ardö, J., Arkebauer, T., Arndt, S. K., Arriga, N., Aubinet, M., Aurela, M., Baldocchi, D., Barr, A., Beamesderfer, E., Marchesini, L. B., Bergeron, O., Beringer, J., Bernhofer, C., Berveiller, D., Billesbach, D., Black, T. A., Blanken, P. D., Bohrer, G., Boike, J., Bolstad, P. V., Bonal, D., Bonnefond, J.-M., Bowling, D. R., Bracho, R., Brodeur, J., Brümmer, C., Buchmann, N., Burban, B., Burns, S. P., Buysse, P., Cale, P., Cavagna, M., Cellier, P., Chen, S., Chini, I., Christensen, T. R., Cleverly, J., Collalti, A., Consalvo, C., Cook, B. D., Cook, D., Coursolle, C., Cremonese, E., Curtis, P. S., D'Andrea, E., da Rocha, H., Dai, X., Davis, K. J., Cinti, B. D., Grandcourt, A. d., Ligne, A. D., De Oliveira, R. C., Delpierre, N., Desai, A. R., Di Bella, C. M., Tommasi, P. d., Dolman, H., Domingo, F., Dong, G., Dore, S., Duce, P., Dufrêne, E., Dunn, A., Dušek, J., Eamus, D., Eichelmann, U., ElKhidir, H. A. M., Eugster, W., Ewenz, C. M., Ewers, B., Famulari, D., Fares, S., Feigenwinter, I., Feitz, A., Fensholt, R., Filippa, G., Fischer, M., Frank, J., Galvagno, M., Gharun, M., Gianelle, D., Gielen, B., Gioli, B., Gitelson, A., Goded, I., Goeckede, M., Goldstein, A. H., Gough, C. M., Goulden, M. L., Graf, A., Griebel, A., Gruening, C., Grünwald, T., Hammerle, A., Han, S., Han, X., Hansen, B. U., Hanson, C., Hatakka, J., He, Y., Hehn, M., Heinesch, B., Hinko-Najera, N., Hörtnagl, L., Hutley, L., Ibrom, A., Ikawa, H., Jackowicz-Korczynski, M., Janouš, D., Jans, W., Jassal, R., Jiang, S., Kato, T., Khomik, M., Klatt, J., Knohl, A., Knox, S., Kobayashi, H., Koerber, G., Kolle, O., Kosugi, Y., Kotani, A., Kowalski, A., Kruijt, B., Kurbatova, J., Kutsch, W. L., Kwon, H., Launiainen, S., Laurila, T., Law, B., Leuning, R., Li, Y., Liddell, M., Limousin, J.-M., Lion, M., Liska, A. J., Lohila, A., López-Ballesteros, A., López-Blanco, E., Loubet, B., Loustau, D., Lucas-Moffat, A., Lüers, J., Ma, S., Macfarlane, C., Magliulo, V., Maier, R., Mammarella, I., Manca, G., Marcolla, B., Margolis, H. A., Marras, S., Massman, W., Mastepanov, M., Matamala, R., Matthes, J. H., Mazzenga, F., McCaughey, H., McHugh, I., McMillan, A. M. S., Merbold, L., Meyer, W., Meyers, T., Miller, S. D., Minerbi, S., Moderow, U., Monson, R. K., Montagnani, L., Moore, C. E., Moors, E., Moreaux, V., Moureaux, C., Munger, J. W., Nakai, T., Neirynck, J., Nesic, Z., Nicolini, G., Noormets, A., Northwood, M., Nosetto, M., Nouvellon, Y., Novick, K., Oechel, W., Olesen, J. E., Ourcival, J.-M., Papuga, S. A., Parmentier, F.-J., Paul-Limoges, E., Pavelka, M., Peichl, M., Pendall, E., Phillips, R. P., Pilegaard, K., Pirk, N., Posse, G., Powell, T., Prasse, H., Prober, S. M., Rambal, S., Rannik, Ü., Raz-Yaseef, N., Rebmann, C., Reed, D., Dios, V. R. D., Restrepo-Coupe, N., Reverter, B. R., Roland, M., Sabbatini, S., Sachs, T., Saleska, S. R., Sánchez-Cañete, E. P., Sanchez-Mejia, Z. M., Schmid, H. P., Schmidt, M., Schneider, K., Schrader, F., Schroder, I., Scott, R. L., Sedlák, P., Serrano-Ortíz, P., Shao, C., Shi, P., Shironya, I., Siebicke, L., Šigut, L., Silberstein, R., Sirca, C., Spano, D., Steinbrecher, R., Stevens, R. M., Sturtevant, C., Suyker, A., Tagesson, T., Takanashi, S., Tang, Y., Tapper, N., Thom, J., Tomassucci, M., Tuovinen, J.-P., Urbanski, S., Valentini, R., van der Molen, M., van Gorsel, E., van Huissteden, K., Varlagin, A., Verfaillie, J., Vesala, T., Vincke, C., Vitale, D., Vygodskaya, N., Walker, J. P., Walter-Shea, E., Wang, H., Weber, R., Westermann, S., Wille, C., Wofsy, S., Wohlfahrt, G., Wolf, S., Woodgate, W., Li, Y., Zampedri, R., Zhang, J., Zhou, G., Zona, D., Agarwal, D., Biraud, S., Torn, M., and Papale, D.: The FLUXNET2015 dataset and the ONEFlux processing pipeline for eddy covariance data, Sci. Data, 7, 225, https://doi.org/10.1038/s41597-020-0534-3, 2020.
Piao, S., Wang, X., Wang, K., Li, X., Bastos, A., Canadell, J. G., Ciais, P., Friedlingstein, P., and Sitch, S.: Interannual variation of terrestrial carbon cycle: Issues and perspectives, Glob. Change Biol., 26, 300–318, https://doi.org/10.1111/gcb.14884, 2020.
Reichstein, M., Camps-Valls, G., Stevens, B., Jung, M., Denzler, J., Carvalhais, N., and Prabhat: Deep learning and process understanding for data-driven Earth system science, Nature, 566, 195–204, https://doi.org/10.1038/s41586-019-0912-1, 2019.
Ryu, Y., Baldocchi, D. D., Kobayashi, H., van Ingen, C., Li, J., Black, T. A., Beringer, J., van Gorsel, E., Knohl, A., Law, B. E., and Roupsard, O.: Integration of MODIS land and atmosphere products with a coupled-process model to estimate gross primary productivity and evapotranspiration from 1 km to global scales, Global Biogeochem. Cy., 25, GB4017, https://doi.org/10.1029/2011GB004053, 2011.
Ryu, Y., Berry, J. A., and Baldocchi, D. D.: What is global photosynthesis? History, uncertainties and opportunities, Remote Sens. Environ., 223, 95–114, https://doi.org/10.1016/j.rse.2019.01.016, 2019.
Sitch, S., Smith, B., Prentice, I. C., Arneth, A., Bondeau, A., Cramer, W., Kaplan, J. O., Levis, S., Lucht, W., Sykes, M. T., Thonicke, K., and Venevsky, S.: Evaluation of ecosystem dynamics, plant geography and terrestrial carbon cycling in the LPJ dynamic global vegetation model, Glob. Change Biol., 9, 161–185, https://doi.org/10.1046/j.1365-2486.2003.00569.x, 2003.
Smith, N. G., Keenan, T. F., Colin Prentice, I., Wang, H., Wright, I. J., Niinemets, U., Crous, K. Y., Domingues, T. F., Guerrieri, R., Yoko Ishida, F., Kattge, J., Kruger, E. L., Maire, V., Rogers, A., Serbin, S. P., Tarvainen, L., Togashi, H. F., Townsend, P. A., Wang, M., Weerasinghe, L. K., and Zhou, S. X.: Global photosynthetic capacity is optimized to the environment, Ecol. Lett., 22, 506–517, https://doi.org/10.1111/ele.13210, 2019.
Tagesson, T., Tian, F., Schurgers, G., Horion, S., Scholes, R., Ahlström, A., Ardö, J., Moreno, A., Madani, N., Olin, S., and Fensholt, R.: A physiology-based Earth observation model indicates stagnation in the global gross primary production during recent decades, Glob. Change Biol., 27, 836–854, https://doi.org/10.1111/gcb.15424, 2021.
Urban, O., JanouŠ, D., Acosta, M., CzernÝ, R., MarkovÁ, I., NavrÁTil, M., Pavelka, M., PokornÝ, R., ŠPrtovÁ, M., Zhang, R. U. I., ŠPunda, V., Grace, J., and Marek, M. V.: Ecophysiological controls over the net ecosystem exchange of mountain spruce stand. Comparison of the response in direct vs. diffuse solar radiation, Glob. Change Biol., 13, 157–168, https://doi.org/10.1111/j.1365-2486.2006.01265.x, 2007.
Wang, H., Guan, H., Liu, N., Soulsby, C., Tetzlaff, D., and Zhang, X.: Improving the Jarvis-type model with modified temperature and radiation functions for sap flow simulations, J. Hydrol., 587, 124981, https://doi.org/10.1016/j.jhydrol.2020.124981, 2020.
Wang, Y. P. and Leuning, R.: A two-leaf model for canopy conductance, photosynthesis and partitioning of available energy I:: Model description and comparison with a multi-layered model, Agr. Forest Meteorol., 91, 89–111, https://doi.org/10.1016/S0168-1923(98)00061-6, 1998.
Wang, Y. P., Baldocchi, D., Leuning, R. A. Y., Falge, E. V. A., and Vesala, T.: Estimating parameters in a land-surface model by applying nonlinear inversion to eddy covariance flux measurements from eight FLUXNET sites, Glob. Change Biol., 13, 652–670, https://doi.org/10.1111/j.1365-2486.2006.01225.x, 2007.
Wilson, K. B., Baldocchi, D. D., and Hanson, P. J.: Spatial and seasonal variability of photosynthetic parameters and their relationship to leaf nitrogen in a deciduous forest, Tree Physiol., 20, 565–578, https://doi.org/10.1093/treephys/20.9.565, 2000.
Wolz, K. J., Wertin, T. M., Abordo, M., Wang, D., and Leakey, A. D. B.: Diversity in stomatal function is integral to modelling plant carbon and water fluxes, Nat. Ecol. Evol., 1, 1292–1298, https://doi.org/10.1038/s41559-017-0238-z, 2017.
Xiao, J., Fisher, J. B., Hashimoto, H., Ichii, K., and Parazoo, N. C.: Emerging satellite observations for diurnal cycling of ecosystem processes, Nat. Plants, 7, 877–887, https://doi.org/10.1038/s41477-021-00952-8, 2021.
Xu, M., Liu, R., Chen, J. M., Liu, Y., Wolanin, A., Croft, H., He, L., Shang, R., Ju, W., Zhang, Y., He, Y., and Wang, R.: A 21-Year Time Series of Global Leaf Chlorophyll Content Maps From MODIS Imagery, IEEE T. Geosci. Remote, 60, 1–13, https://doi.org/10.1109/TGRS.2022.3204185, 2022.
Yamamoto, Y., Ichii, K., Ryu, Y., Kang, M., Murayama, S., Kim, S.-J., and Cleverly, J. R.: Detection of vegetation drying signals using diurnal variation of land surface temperature: Application to the 2018 East Asia heatwave, Remote Sens. Environ., 291, 113572, https://doi.org/10.1016/j.rse.2023.113572, 2023.
Yu, L., Qiu, G. Y., Yan, C., Zhao, W., Zou, Z., Ding, J., Qin, L., and Xiong, Y.: A global terrestrial evapotranspiration product based on the three-temperature model with fewer input parameters and no calibration requirement, Earth Syst. Sci. Data, 14, 3673–3693, https://doi.org/10.5194/essd-14-3673-2022, 2022.
Yuan, W., Liu, S., Yu, G., Bonnefond, J.-M., Chen, J., Davis, K., Desai, A. R., Goldstein, A. H., Gianelle, D., Rossi, F., Suyker, A. E., and Verma, S. B.: Global estimates of evapotranspiration and gross primary production based on MODIS and global meteorology data, Remote Sens. Environ., 114, 1416–1431, https://doi.org/10.1016/j.rse.2010.01.022, 2010.
Zhang, Y., Fang, J., Smith, W. K., Wang, X., Gentine, P., Scott, R. L., Migliavacca, M., Jeong, S., Litvak, M., and Zhou, S.: Satellite solar-induced chlorophyll fluorescence tracks physiological drought stress development during 2020 southwest US drought, Glob. Change Biol., 29, 3395–3408, https://doi.org/10.1111/gcb.16683, 2023a.
Zhang, Z., Cescatti, A., Wang, Y.-P., Gentine, P., Xiao, J., Guanter, L., Huete, A. R., Wu, J., Chen, J. M., Ju, W., Peñuelas, J., and Zhang, Y.: Large diurnal compensatory effects mitigate the response of Amazonian forests to atmospheric warming and drying, Sci. Adv., 9, eabq4974, https://doi.org/10.1126/sciadv.abq4974, 2023b.
Zhao, W. L., Gentine, P., Reichstein, M., Zhang, Y., Zhou, S., Wen, Y., Lin, C., Li, X., and Qiu, G. Y.: Physics-Constrained Machine Learning of Evapotranspiration, Geophys. Res. Lett., 46, 14496–14507, https://doi.org/10.1029/2019GL085291, 2019.
Zheng, Y., Shen, R., Wang, Y., Li, X., Liu, S., Liang, S., Chen, J. M., Ju, W., Zhang, L., and Yuan, W.: Improved estimate of global gross primary production for reproducing its long-term variation, 1982–2017, Earth Syst. Sci. Data, 12, 2725–2746, https://doi.org/10.5194/essd-12-2725-2020, 2020.