the Creative Commons Attribution 4.0 License.
the Creative Commons Attribution 4.0 License.
 | 23 Feb 2023
Mammals in the Chornobyl Exclusion Zone's Red Forest: a motion-activated camera trap study
Sergii Gashchak
Michael D. Wood
Catherine L. Barnett
Since the accident at the Chornobyl Nuclear Power Plant in 1986, there have been few studies published on medium and large mammals inhabiting the area from which the human population was removed (now referred to as the Chornobyl Exclusion Zone, CEZ). The dataset presented in this paper describes a motion-activated camera trap study (n=21 cameras) conducted from September 2016 to September 2017 in the Red Forest located within the Chornobyl Exclusion Zone. The Red Forest, which is likely the most anthropogenically contaminated radioactive terrestrial ecosystem on earth, suffered a severe wildfire in July 2016. The motion-activated trap cameras were therefore in place as the Red Forest recovered from the wildfire. A total of 45 859 images were captured, and of these 19 391 contained identifiable species or organism types (e.g. insects). A total of 14 mammal species were positively identified together with 23 species of birds (though birds were not a focus of the study).
Weighted absorbed radiation dose rates were estimated for mammals across the different camera trap locations; the number of species observed did not vary with estimated dose rate. We also observed no relationship between estimated weighted absorbed radiation dose rates and the number of triggering events for the four main species observed during the study (brown hare, Eurasian elk, red deer, roe deer).
The data presented will be of value to those studying wildlife within the CEZ from the perspectives of the potential effects of radiation on wildlife and also rewilding in this large, abandoned area. They may also have value in any future studies investigating the impacts of the recent Russian military action in the CEZ.
The data and supporting documentation are freely available from the Environmental Information Data Centre (EIDC) under the terms and conditions of a Creative Commons Attribution (CC BY) license: https://doi.org/10.5285/bf82cec2-5f8a-407c-bf74-f8689ca35e83 (Barnett et al., 2022a).
- Article
(2875 KB) - Full-text XML
- BibTeX
- EndNote


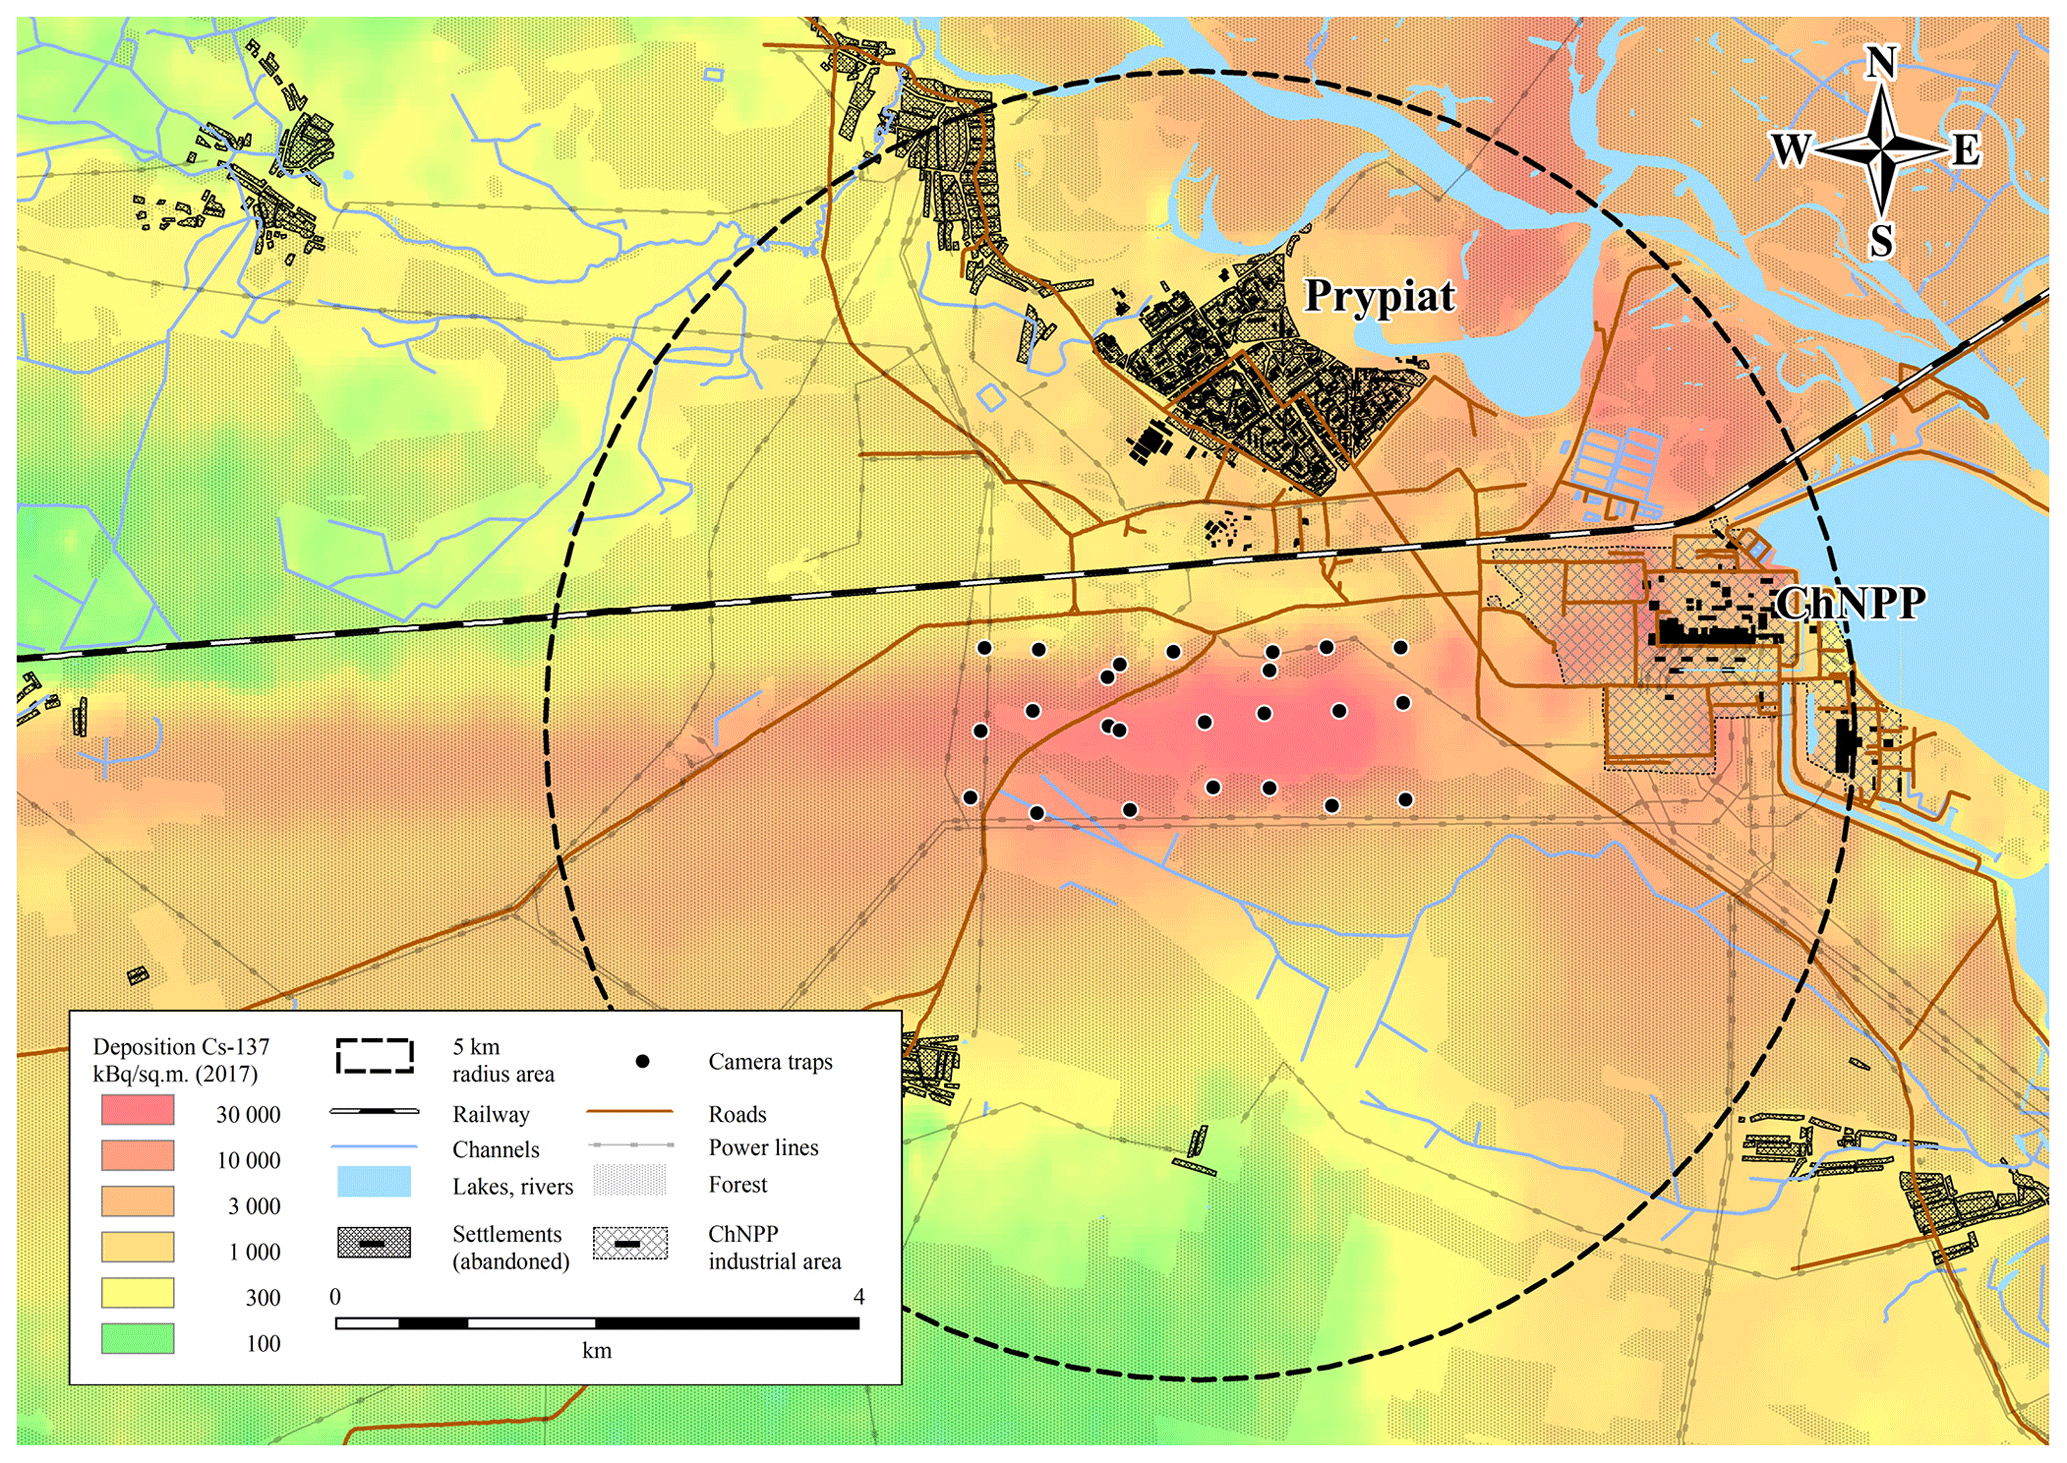
Figure 1Map showing the location of the study cameras overlaid on a 137Cs deposition surface (decay corrected to 2017). The large circle is the 5 km radius area over which absorbed weighted dose rates were calculated. Figure produced by and published with the permission of the Chornobyl Center.
Following the 1986 Chornobyl Nuclear Power Plant accident, coniferous trees up to 4 km to the west of the reactor were killed by radiation over an area of approximately 4–6 km2 (coniferous trees covered approximately 40 % of this area in 1986; Kyiv Politech Institute's Museum, 2022). The area is now known as the Red Forest, and it is likely the most anthropogenically contaminated radioactive terrestrial ecosystem on earth. It has subsequently regenerated with understorey vegetation and, to some extent, with deciduous trees. Whilst over the years many studies have been conducted within the Red Forest (e.g. Geras'kin et al., 2008; Møller and Mousseau, 2013; Møller et al., 2016; Lavrinienko et al., 2018a, b; Antwis et al., 2021; Beresford et al., 2022), none have studied utilisation of the area by medium and large mammals. However, from the study site map within the original paper of Møller and Mousseau (2013), their mammal snow track study did include some sites in the Red Forest, as well as other sites in the Chornobyl Exclusion Zone (CEZ); this study concluded that the abundance of mammals decreased with increasing radiation across the CEZ as a whole. Other studies across the wider CEZ have found no evidence of an influence of radiation on the distribution or abundance/diversity of small-to-large mammals (Baker et al., 1996; Deryabina et al., 2015; Webster et al., 2016).
In July 2016 there was a severe fire within the Red Forest with approximately 80 % of the forest being burnt (Beresford et al., 2021). In September 2016 as one of a number of studies (e.g. Antwis et al., 2021; Beresford et al., 2021) considering the effects of and recovery from the fire, we set up a network of 21 motion-activated camera traps across the Red Forest, which were left in place to record primarily medium and large mammals for a period of approximately 1 year. This paper describes and discusses this study; all the photographs are freely available from https://doi.org/10.5285/bf82cec2-5f8a-407c-bf74-f8689ca35e83 (Barnett et al., 2022a).
2.1 Motion-activated digital trap camera deployment
Twenty-one Little Acorn 6210MC motion-activated digital trap cameras, fitted with 8 GB memory card to record images, were installed across the Red Forest in early September 2016; the cameras were operated for approximately a year until September 2017. The cameras were deployed using an approximate grid pattern with three rows of seven cameras (see Fig. 1). No bait was used to attract animals.
When deploying each camera for the first time, approximately 20 poles (1 m high with markings at every 20 cm) were positioned in front of the camera in three parallel rows 1 m apart; each row began 3 m in front of the camera and ended 8 m away from the camera. The camera was then activated to capture an image of the poles in situ, and the poles were then removed (an image of the pole positions at sites where these were recorded has been included within the dataset associated with this study (Barnett et al., 2022a); some of these images contain images of co-authors with their permission). The images of the poles can be used to estimate animal height and distance from the camera should this be desired. Tree branches, tall grasses and bushes that were likely to obscure the camera or cause false activation by their movement were cleared from an area of about 40–60 m2 in front of the camera at the initial setup and, when necessary, throughout the study.
Each camera was mounted at a height of approximately 0.7 m (typically attached to trees) to principally record images of medium and large mammals, although images of small mammals, birds and occasional insects were also captured. The cameras were positioned such that they mostly faced north to shelter them from false activation caused by direct sunlight. When triggered by movement, all the cameras were preset to take a three-image burst; the interval between these three images was <1 s. The time delay between one three-burst cycle and any immediate subsequent cycle was approximately 2–4 s; it was therefore possible that some animals may not have been captured if they were moving rapidly across the field of view during this time. All the cameras were capable of capturing images both day and night (and during the transition period in between) by using an infrared sensor and invisible infrared flash (850 or 940 nm, capable of lighting an area of up to 10 m in front of the camera); the appropriate day/night/transition setting is subjective as the camera automatically chooses the appropriate day/night/transition setting based on light level. All the cameras were inspected, and the data (images and image metadata) downloaded from the memory cards on three occasions during the study (March, June and September 2017). These are referred to as setups 1–3 in the accompanying dataset; the cameras were also randomly inspected throughout the year to check functionality (and to ensure they had not been stolen). The images and image metadata were supplied to the UK Centre for Ecology & Hydrology (UKCEH) by Chornobyl Center as *.jpeg, *.avi and *.xlsx files. The image catalogue described in Sect. 2.3 was then populated by UKCEH using these files.
Information related to each camera and each deployment period has been provided in file “REDFIRE_Trap_Camera_Details_And_Image_Summary”, which is included within the dataset associated with this study (Barnett et al., 2022a). The information provided includes the following: location (site number); numerical camera identifier; setup number (1, 2 or 3; see above); start date and time and end date; time of each deployment period (most cameras were set to record at eastern European summer time throughout with the exception of cameras 155 and 156 during setup 2, which were set to record at eastern European winter time in error, and cameras 161 and 174 from setup 1, where the time shown on the image was recorded incorrectly; the data related to date and time has therefore been manually corrected within the image catalogue to eastern European summer time for these four cameras); the total number of days each camera was in use during each deployment period; and any notes relevant to the cameras or their operation.
At sites 163, 168 and 169, the trap cameras were stolen during setup 1; therefore, no images from these cameras were recovered for that setup. The cameras were replaced at the start of setup 2 with new cameras located at nearby sites 362, 364 and 365, respectively. During setup 2, cameras from sites 157, 164, 170, 175 and 362 were stolen and not replaced, and the memory cards from cameras 158 and 171 were changed part way through; during setup 3, camera 158 did not operate. In total, images were recovered from 18 cameras for setup 1, from 16 cameras for setup 2 and from 15 cameras for setup 3. The camera located at site 172 was set to record video in error during setup 1 at a service visit in late October (photographs were recorded September to October as for the other cameras); the videos (20 s each) are included in the image catalogue and have been analysed in the same way as the photographs (see Sect. 2.3).
2.2 Study site and site characteristics
The site descriptive parameters, recorded by the same person for every site in early September 2016, include the following: numerical site identifier and location (latitude and longitude, WGS84); ambient dose rate measured at a height of 1 m above soil surface; an evaluation of the fire damage as visible in September 2016 (“none”, “low”, “medium” or “high”) together with an estimate of the percentage of the area within 100 m of the site affected by the fire; an estimation of the density of grassy vegetation and undergrowth over a 20 m radius of the camera location; notes on habitat within a 100 m radius of the camera location; the dominant (>80 %) tree species present and the approximate age of trees within a 100 m radius of the site; and the presence (or absence) of animal trails/tracks or water sources within 20 m of the site. The dataset also contains an estimate of the 137Cs and 90Sr soil activity concentrations (kBq m−2) averaged over a 500 m radius centred on the camera site estimated from a spatial dataset (Shestopalov, 1996) and decay corrected to 1 March 2017. The Shestopalov (1996) data are presented as becquerel per square metre (Bq m−2); to convert to becquerel per kilogram (Bq kg−1), we assumed a soil bulk density of 1.14 g cm−3 dry mass estimated from data for the Red Forest (Barnett et al., 2021b), assuming a 10 cm soil depth as required for the subsequent estimation of estimated weighted absorbed dose rates (see below). This information is provided in the file “REDFIRE_Trap_Camera_Site_Descriptions” within the dataset associated with this study (Barnett et al., 2022a).
2.3 Image catalogue
The image catalogue contains a description of information related to each image. The majority of the images obtained have been included within the dataset associated with this study (Barnett et al., 2022a). However, to protect privacy, any images containing people have not been included, although observations of people (other than members of the research team setting up and servicing the cameras) have been recorded in the catalogue. For cataloguing the images, a triggering event was assumed to begin when the camera motion sensor was triggered by an animal. A new triggering event was not assumed until at least 90 s had elapsed since an animal was last observed. However, there may be longer time periods between triggering events where images are obviously part of the same sequence (e.g. an animal lays down for a period of time).
Within the dataset associated with this study (Barnett et al., 2022a), all the images (including those which did not capture any animal) are located within three sub-folders called REDFIRE_Setup_1, REDFIRE_Setup_2 and REDFIRE_Setup_3, and within each of these folders are multiple sub-folders (with the format “Setup1_Site155_2317”), which correspond to the “Image_Location_Folder_Name” column within the image catalogue described below. Within each of these sub-folders are further sub-folders entitled the common species names of animals observed. The individual images of each animal are located within these folders and are supplied as *.jpg files and have the format IMAG0016. As noted in Sect. 2.2, at site 172 the camera was set, at a service visit in October, to record videos in error; the text “Video” has been used within the notes column of the image catalogue to identify where video rather than photographs was recorded (camera 172 setup 1 only); the videos have been provided within the dataset.
In the file “REDFIRE_Trap_Camera_Image_Catalogue”, which is included within the dataset associated with this study (Barnett et al., 2022a), each image record (row) within the catalogue gives details of the following: setup number (1, 2 or 3; see Sect. 2.2); location (site number); numerical camera identifier; image location folder name (see above, e.g. Setup1_Site155_2317); image filename (e.g. IMAG0127); date, time and period of the day (day, night, transition) related to when the image was captured; the common name of species captured in the image; the number of animals visible in the image; the number of animals seen per triggering event (cumulative; the triggering event number is recorded as “n/a” for observations of people); triggering event number (sequential); the temperature when image was captured (∘C, recorded by the camera at the start of each new triggering event (note this measurement is indicative only and not an absolute value (e.g. direct sun on the camera affects the temperature recorded)); a marker (“Y”) identifying the start of each new triggering event; a marker (“Y”) identifying if an obviously young animal is present within the image (this is subjective and may not always have been noted); and notes relating to the image (e.g. two species present within the image (where this occurs the data for the image is entered twice, once for the first species and again for the second species; the second species is allocated a new triggering event number)). If the image was too poor to definitely identify the animal, the species common name was recorded as “Unidentifiable”. Occasionally for such images, the potential species/animal type was entered into the notes column. Images containing no images of animals are included within the dataset associated with this study; these are catalogued separately.
2.4 Quality control
Data were entered into the image catalogue by UKCEH staff (who were not aware of the comparative contamination levels at the different camera sites), these data were then compared to a second set of data entered into a second catalogue by staff at the Chornobyl Center; any disparities were investigated and amended manually where necessary. Once this check was completed a final check was conducted by further UKCEH staff to ensure the information within the catalogue matched the images included within the dataset.
2.5 Estimation of total weighted absorbed dose rate
Indicative total weighted absorbed dose rates (i.e. internal plus external exposures) have been estimated for example mammals in the study area using the ERICA Tool (v2.0; Brown et al., 2016). As inputs to the dose estimation, the 137Cs and 90Sr soil activity concentrations estimated for a 500 m radius around each camera site (see above) were used. This area equates to the potential home range of brown hare, which is likely the species with the smallest home range of the most commonly observed mammals (Schai-Braun and Hackländer, 2014; CABI, 2013). However, it is unlikely that the majority of mammal species observed would spend all of their time within the relatively small area of the Red Forest. Therefore, 137Cs and 90Sr soil activity concentrations were estimated over an area with a radius of 5 km, centred on the middle of the Red Forest, which may be appropriate for the larger species observed (e.g. Okarma et al., 1998; Ofstad et al., 2016). All soil radionuclide activity concentrations were decay corrected to 1 March 2017 (approximately the midpoint of the study). The ERICA Tool contains a default terrestrial organism “Mammal – large” with dimensions equating to a large deer species (mass 245 kg) and total dose rates were estimated for this default organism. For comparison, an organism was created in the ERICA Tool equating to a red fox, a regularly observed smaller species which may spend part of its time underground (assumed dimensions for the red fox were m with a mass of 6.6 kg; Pröhl, 2003). The large mammal geometry was assumed to spend 100 % of its time on the ground surface, and the red fox 10 % of time underground (Brown et al., 2003). The probabilistic “Tier 3” of the ERICA Tool was used for inputting mean and standard deviation soil activity concentrations. Soil dry matter was assumed to be 100 %; this assumption seems reasonable given that measured soil dry matter percentages from other studies give typical values for the Red Forest of circa 90 %, ranging from approximately 70 %–100 % (see Barnett et al., 2021a, b). The default mammal concentration ratios (and associated probability distribution functions) in the ERICA Tool were used to estimate whole-body radionuclide activity concentrations of the animals and consequently the internal dose rate; default radiation weighting factors of 3 for low-energy beta emissions and 1 for other beta and gamma emissions were used. The resultant mean, variance and median estimates of total weighted absorbed dose rates were recorded for each of 137Cs and 90Sr (all estimates are presented in micrograys per hour (µGy h−1) in Barnett et al., 2022a).
A total of 45 857 images were captured (not including photographs recorded during camera setup and servicing); of these, 19 391 contained identifiable species or organism types (e.g. insects), 565 recorded people, 349 were of poor quality such that the species could not be determined and 25 552 images recorded no animals (i.e. predominantly false triggers due to vegetation movement, light or potentially a triggering by an animal that was not captured). A total of 14 mammal species were positively identified together with 23 species of birds (Table 1).
Table 1Species captured on the motion-activated digital trap cameras.
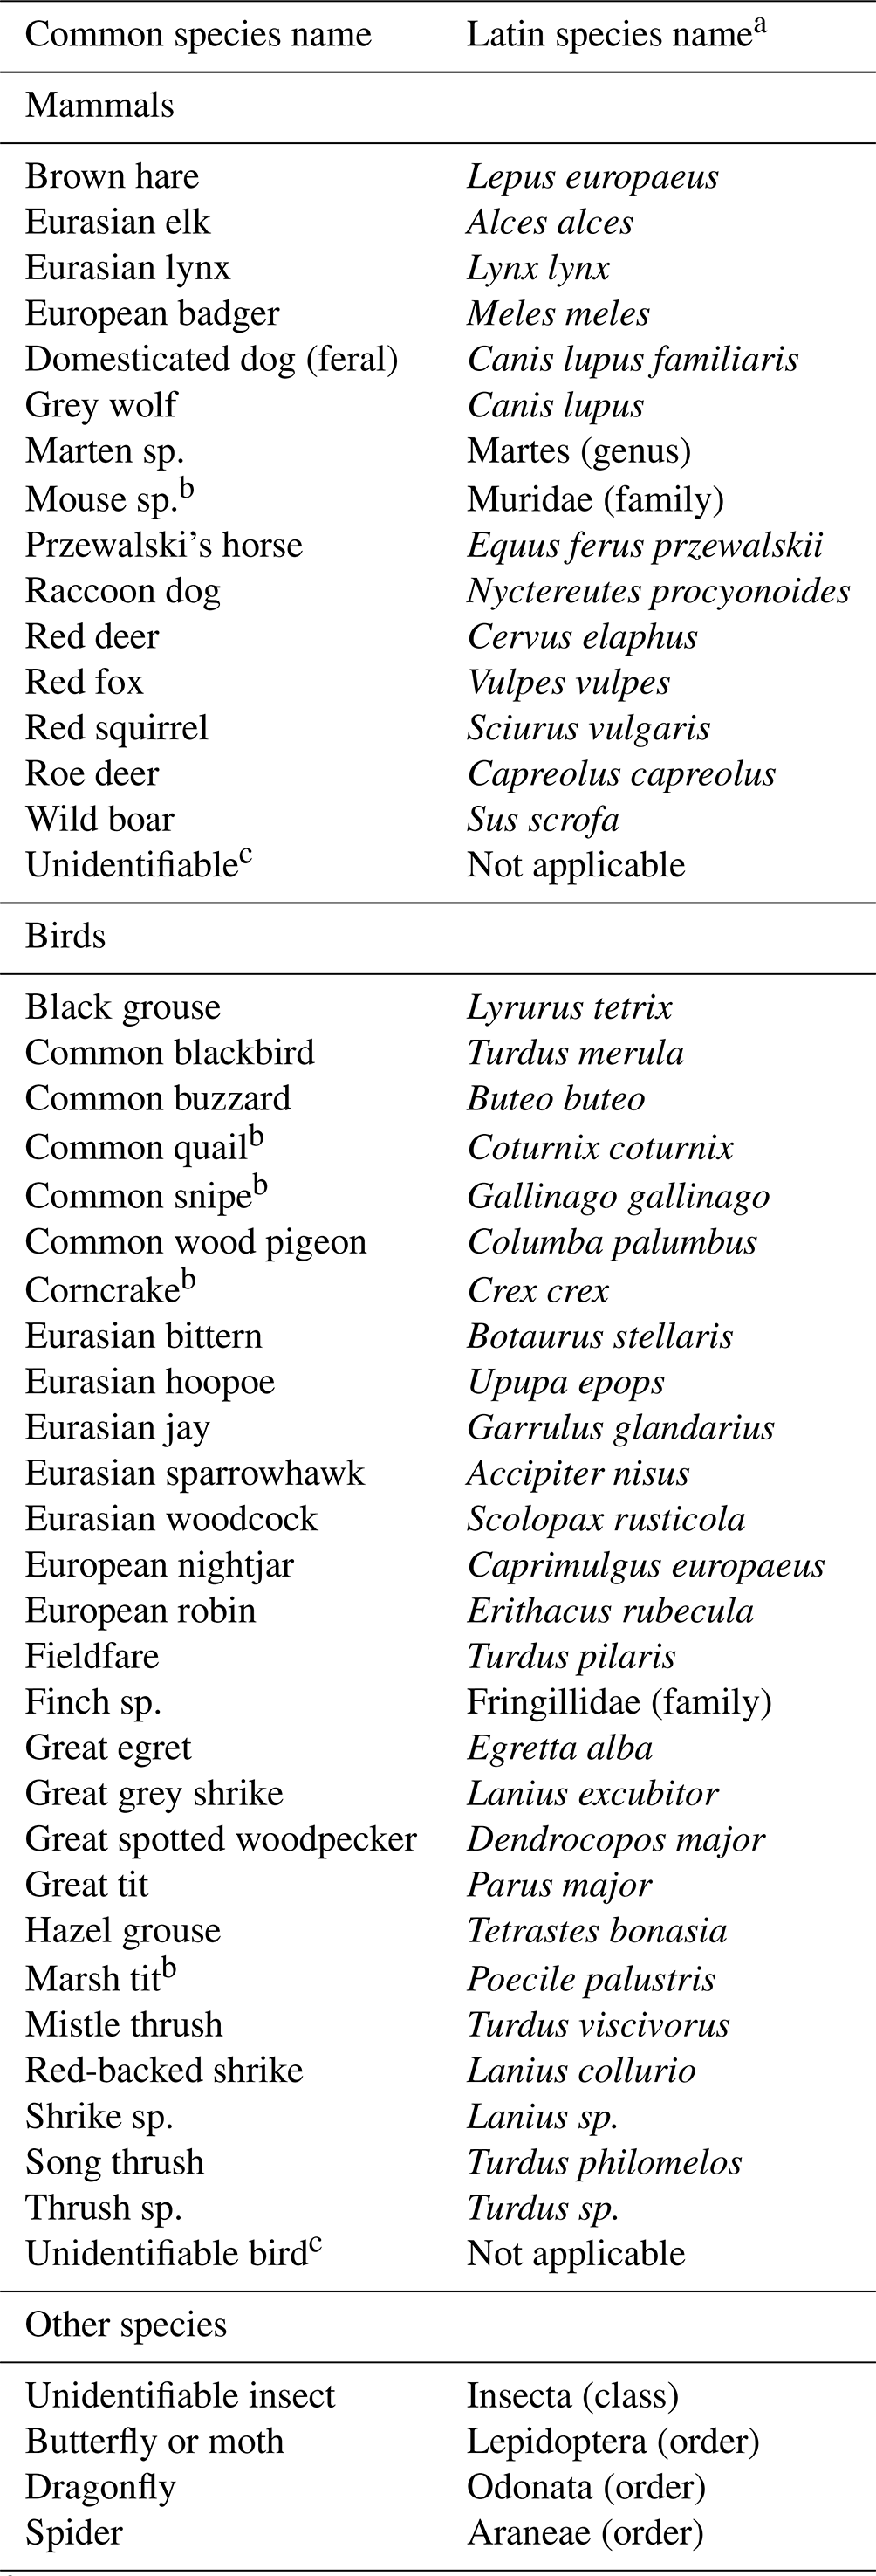
a In some instances, animals are identified at the class, order, family level only. bSpecies is only mentioned within the notes column of the image catalogue (i.e. as a potential but not definitive observation). c Mammal or bird which could not be positively identified at species/genus level.
Table 2Summary of medium and large mammal observations by setup.
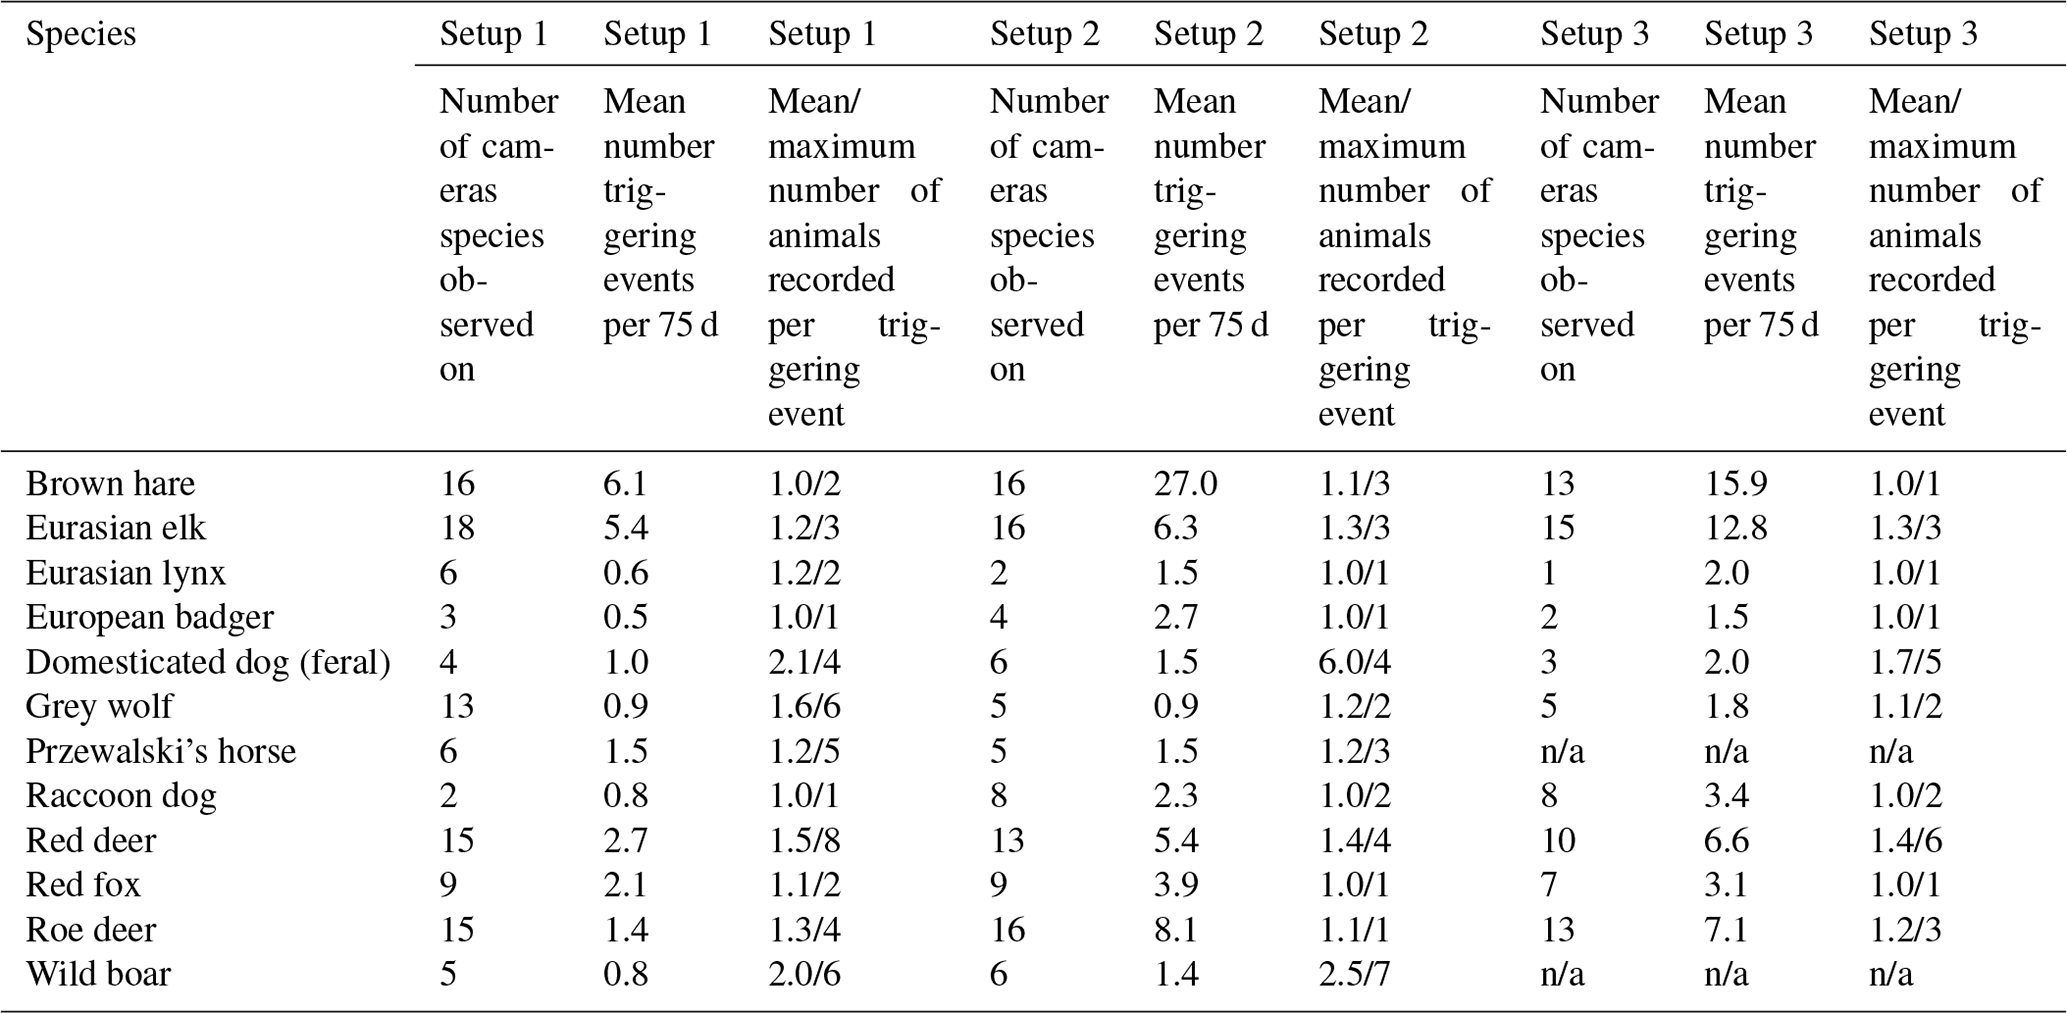
Deployment periods were the following: setup 1: September 2016 to March 2017; setup 2: March–June 2017; setup 3: June–September 2017. The total number of cameras operating in setups 1, 2 and 3 were 18, 16 and 15, respectively. n/a: not applicable, species not observed.
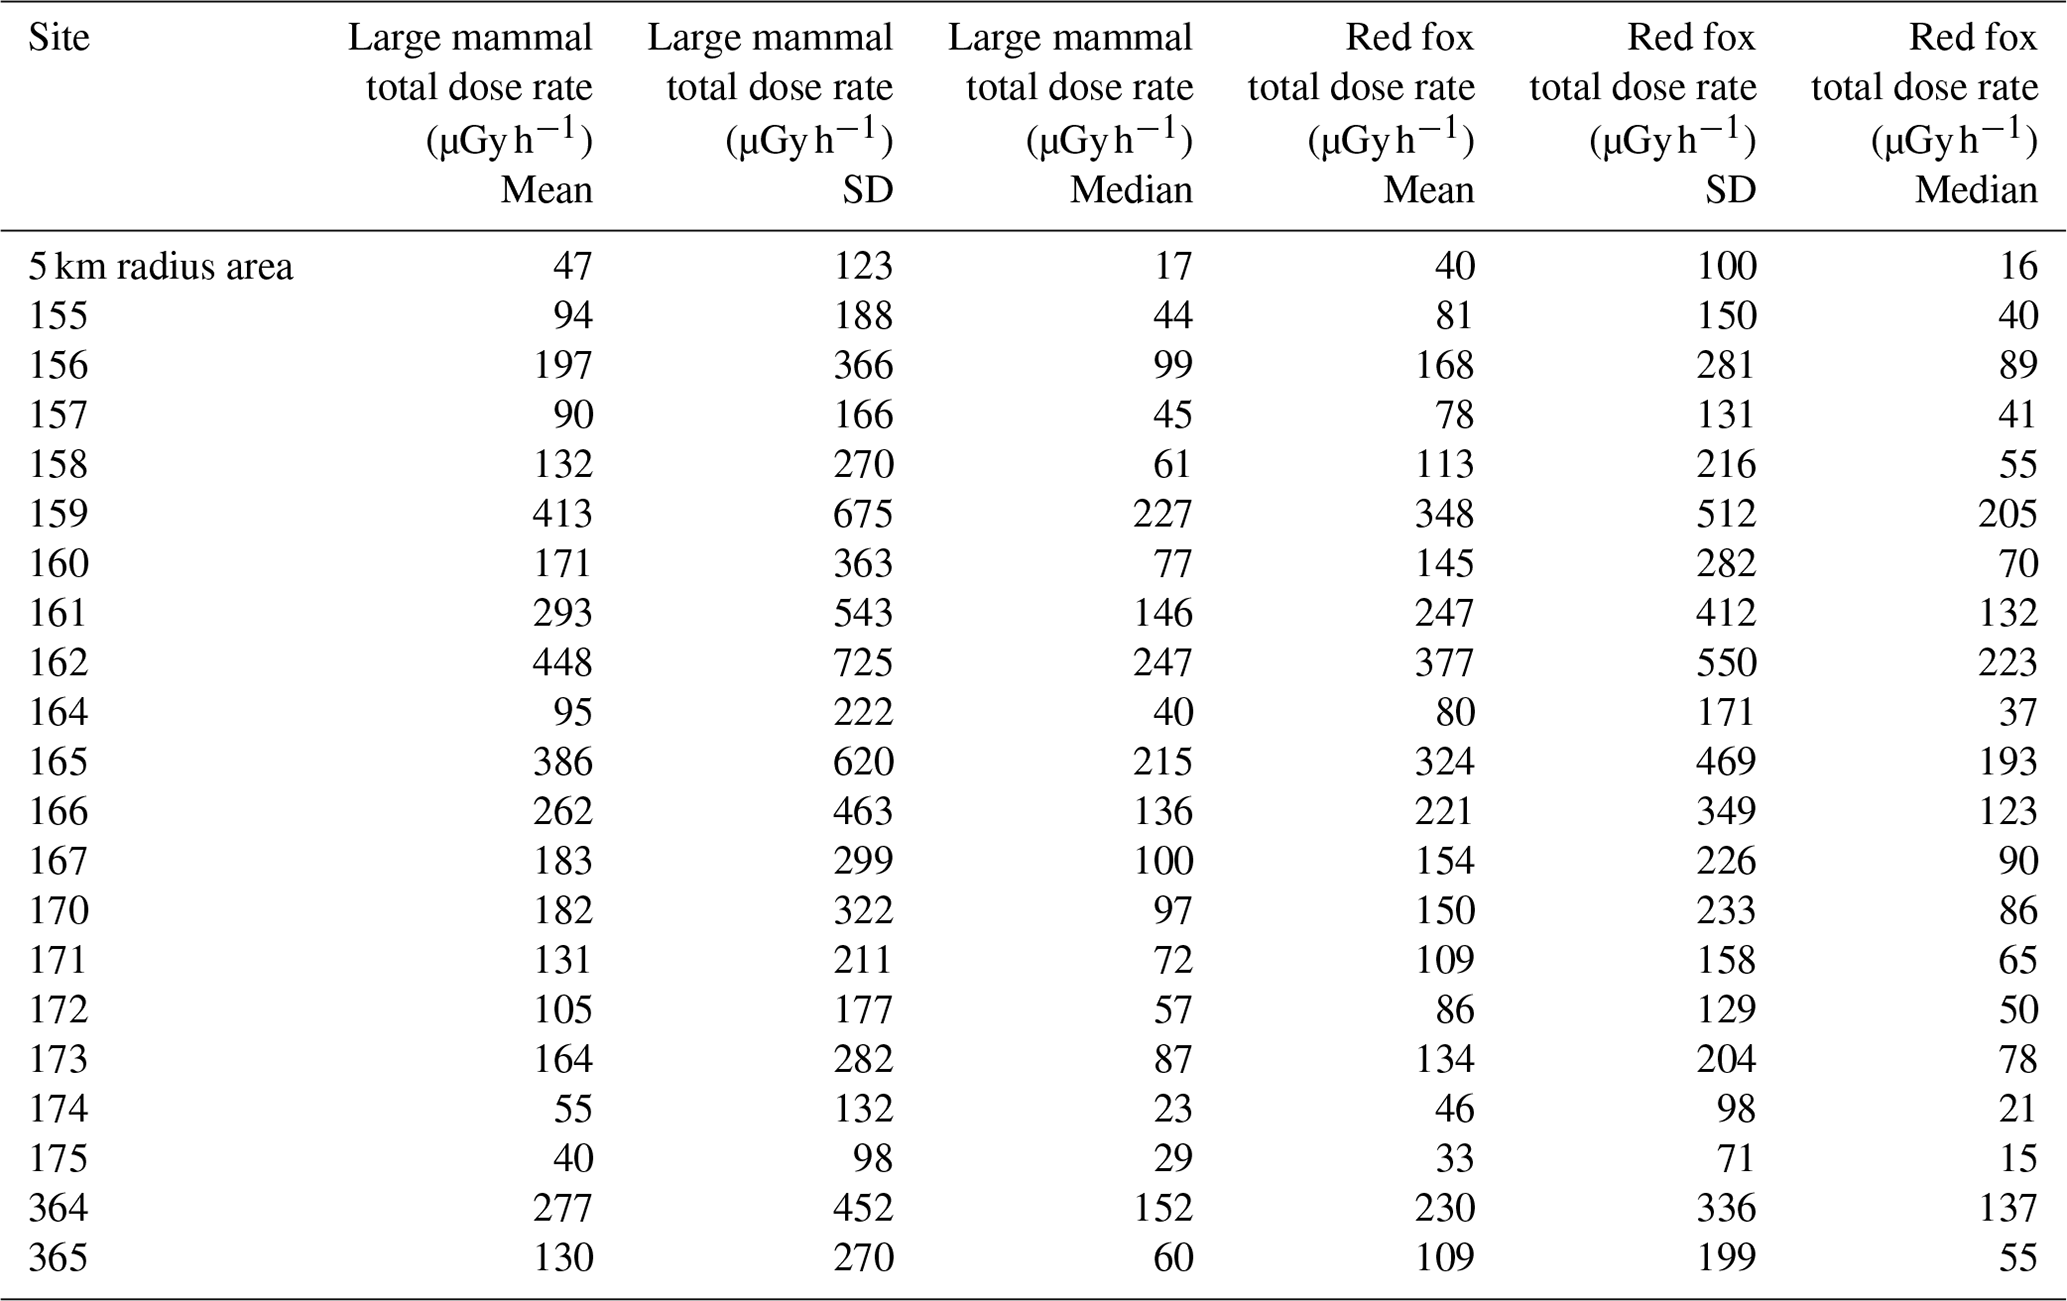
Table 3Estimated weighted absorbed dose rates to mammals comparing those estimated for a large mammal (a deer) and a relatively small mammal spending some time underground (red fox). Estimates are presented for an area of 5 km radius centred on the Red Forest and also for an area of 0.5 km radius centred on each camera site.
A summary of the images within the catalogue (e.g. number of images with mammals, birds, or insects; number of images with nothing; number of images with people in) and the total number of triggering events recorded (by setup, by site, by camera) has been provided in the file “REDFIRE_Trap_Camera_Details_And_Image_Summary” within the dataset associated with this study (Barnett et al., 2022a). The dataset also provides a summary for mammals (filename: “REDFIRE_Trap_Camera_Summary_Mammals”), by species, by camera and by setup of the number of triggering events and the mean, minimum and maximum of the number of individuals recorded per triggering event. For ease of comparing across setups, triggering events are presented as events per 75 camera trap days; 75 d was the shortest deployment period (setup 3). A similar summary for birds (which were not the target of this study) can also be found in Barnett et al. (2022a) (filename: “REDFIRE_Trap_Camera_Summary_Birds_And_Other”).

Figure 2Number of species observed by estimated weighted absorbed dose rate (note the estimated weighted absorbed dose rates presented are those estimated for the geometry approximating to a red fox).
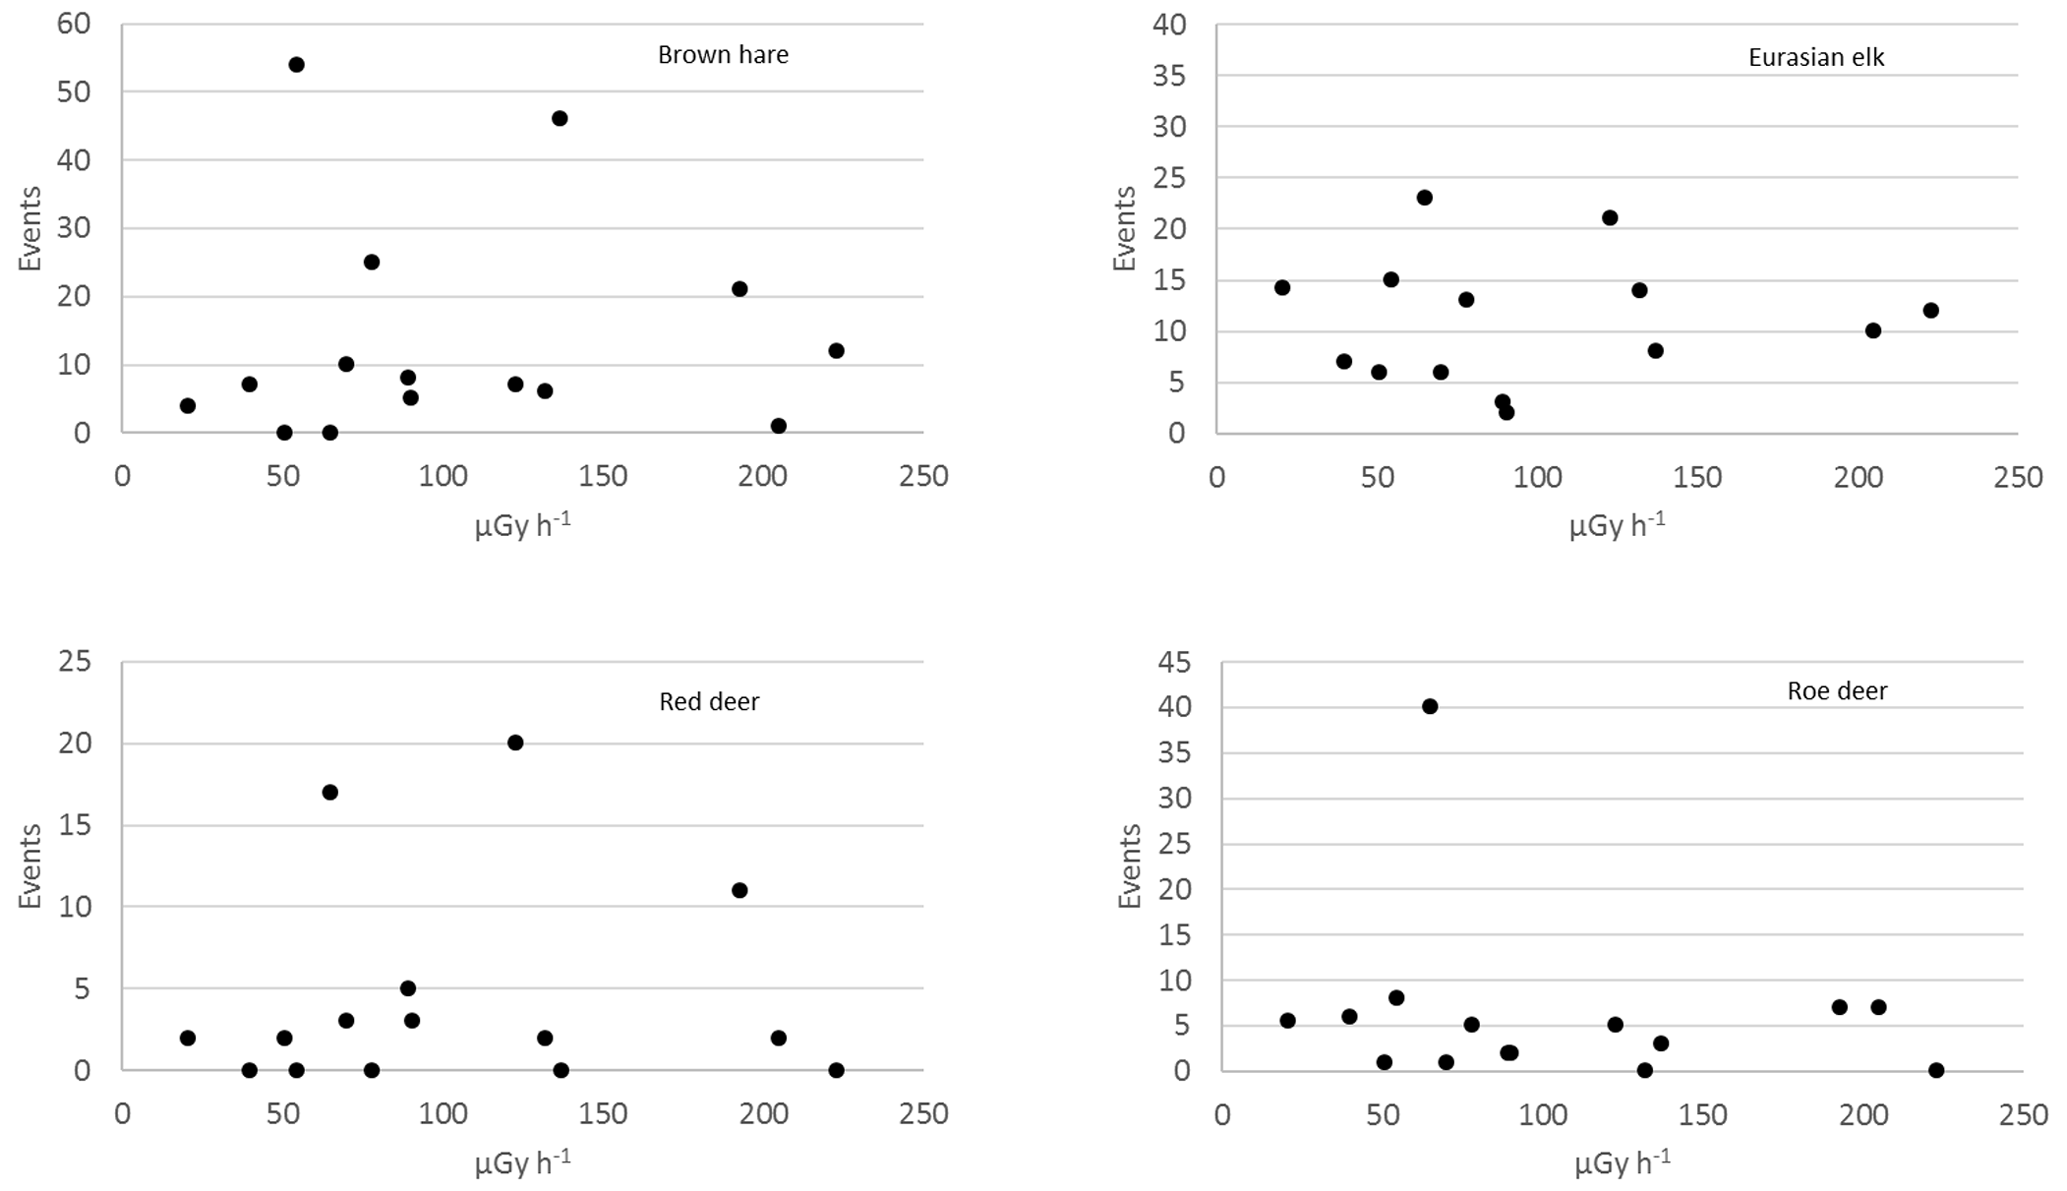
Figure 3Relationship between number of triggering events and estimated absorbed weighted dose rates (using that calculated for the red fox geometry as an example); data presented are from setup 3.
The mammalian species observed in the Red Forest (Table 1) included most of those observed in our other camera trapping studies across the CEZ (Wood and Beresford, 2016). Exceptions were that we did not observe brown bear (Ursus arctos), European bison (Bison bonasus) or Eurasian beaver (Castor fiber). The lack of these species in the Red Forest is to be expected:
-
The Red Forest did not contain suitable habitat for beaver during the study period.
-
Photographic evidence of European bison in the Ukrainian CEZ was first recorded in 2015 at a site close to the Belarusian border (the species having been introduced into the Belarusian CEZ in 1996) (Gashchak et al., 2017); only one individual bull was recorded by camera traps 2015–2016 in the Ukrainian CEZ.
-
The numbers of brown bear in the Ukrainian CEZ are low with no recorded sightings in the vicinity of the Red Forest at the time of this study (Gashchak et al., 2016).
A number of images recorded small groups of feral (domesticated) dogs which we have not observed elsewhere in the CEZ. It is likely that these are animals fed by workers at the nearby nuclear power plant complex. Images of so-called “stalkers” (illegal tourists) were also captured; these are not included in the dataset though they are identified in the image catalogue.
For mammals, Table 2 presents a summary by species and setup. For a number of species (brown hare, roe deer, red deer), the number of triggering events was higher in setups 2 and 3; for Eurasian elk, triggering events were highest during setup 3 (Table 2). Whilst wild boar and Przewalski's horse were observed during setups 1 and 2, none were recorded during setup 3. Observations of Eurasian lynx, European badger and Raccoon dog were lowest during setup 1. Young (newborn) Eurasian elk started to be observed in April/May 2017, with young red deer and roe deer being observed from June. Przewalski's horse were only observed in areas that had been burnt, potentially attracted by the new growth of grassy vegetation.
Table 3 presents a summary of estimated total (internal plus external) weighted absorbed radiation dose rates for the example large mammal and red fox for each camera location, assuming a home range of 0.5 km radius and also over a radius of 5 km centred on the middle of our study area as estimated using the ERICA Tool. All mean, and most median, estimated dose rates are above the lower end of the International Commission on Radiological Protections (ICRP) Derived Consideration Reference Level (DCRL) for mammals of 1 mGy d−1 (approximately 40 µGy h−1) (International Commission on Radiological Protection, 2008). The DCRLs are 1 order of magnitude dose rate bands, for mammals 1–10 mGy d−1, within which radiation effects may be expected to occur.
Our results do not support the low mammal abundance at Red Forest sites reported from the 2009 snow track study of Møller and Mousseau (2013). Furthermore, we observed no reduction in the abundance of mammals with increasing total weighted dose rate (which ranged over circa 1 order of magnitude). The number of species observed at camera locations was relatively consistent with estimated median weighted absorbed radiation dose rate (Fig. 2). We also observed no relationship between estimated median weighted absorbed radiation dose and the number of triggering events for the main species observed (brown hare, Eurasian elk, red deer, roe deer) (see examples from setup 3 in Fig. 3).
The data described here (https://doi.org/10.5285/bf82cec2-5f8a-407c-bf74-f8689ca35e83; Barnett et al., 2022a) are freely available from the Environmental Information Data Centre (https://eidc.ac.uk/, last access: 16 January 2023) under a Creative Commons Attribution (CC BY) licence.
The data presented will be of value to those studying wildlife within the CEZ from the perspectives of the potential effects of radiation on wildlife and also rewilding in this large, abandoned area. Together with other trap camera datasets being published (e.g. Barnett et al., 2022b; Gashchak et al., 2022), the data will help in establishing a picture of wildlife across the CEZ. The data may also have value in any future studies investigating the impacts of recent Russian military action in the CEZ.
NAB and MDW secured funding for the study; NAB, MDW and SG defined the study protocols; SG conducted the fieldwork maintaining cameras and making field notes; CLB and SG, with input from NAB and QC'd, compiled the image catalogue and accompanying documentation (Barnett et al., 2022a); NAB and CLB drafted the paper to which SG contributed and MDW reviewed.
The contact author has declared that none of the authors has any competing interests.
Publisher's note: Copernicus Publications remains neutral with regard to jurisdictional claims in published maps and institutional affiliations.
The authors are grateful to the following people for their assistance during the project: Eugene Guliaichenko (Chornobyl Center) for assistance during fieldwork and Claire Wells (UKCEH) for assistance with data entry. We also thank Jacky Chaplow (UKCEH) for proofreading the article.
This study was funded by the Natural Environment Research Council (NERC) as part of the RED FIRE project (Radioactive Environment Damaged by Fire: a Forest in Recovery, https://www.ceh.ac.uk/our-science/projects/red-fire-radioactive-environment-damaged-fire, last access: 26 March 2022; grant no. NE/P015212/1).
This paper was edited by David Carlson and reviewed by two anonymous referees.
Antwis, R. E., Beresford, N. A., Jackson, J. A., Fawkes, R., Barnett, C. L., Potter, E., Walker, L., Gaschak, S., and Wood, M. D.: Impacts of radiation on the bacterial and fungal microbiome of small mammals in the Chernobyl Exclusion Zone, J. Anim. Ecol., 90, 2172–2187, https://doi.org/10.1111/1365-2656.13507, 2021.
Baker, R. J., Hamilton, M. J., Van Den Bussche, R. A., Wiggins, L. E., Sugg, D. W., Smith, M. H., Lomakin, M. D., Gaschak, S. P., Bundova, E. G., Rudenskaya, G. A., and Chesser, R. K.: Small mammals from the most radioactive sites near the Chernobyl nuclear power plant, J. Mamm., 77, 155–170, https://doi.org/10.2307/1382717, 1996.
Barnett, C. L., Gashchak, S., Maksimenko, A., Chaplow, J. S., Wood, M. D., and Beresford, N. A.: Soil and vegetation radionuclide activity concentrations and calculated dose rates from the Red Forest, Chernobyl, Ukraine, 2016–2017, NERC Environmental Information Data Centre [data set], https://doi.org/10.5285/60782622-7bfa-4615-a9e3-0a802a9f4674, 2021a.
Barnett, C. L., Gashchak, S., Wells, C., Maksimenko, A., Chaplow, J., Wood, M. D., Parekh, N. R., and Beresford, N. A.: Soil biological activity in the Chernobyl Exclusion Zone, Ukraine, September 2005 and spring 2016, NERC EDS Environmental Information Data Centre [data set], https://doi.org/10.5285/19babe1c-b3a3-488c-b4fe-ebb4ab9237d8, 2021b.
Barnett, C. L., Gashchak, S., Wells, C., Guliaichenko, E., Wood, M. D., and Beresford, N. A.: Motion-activated camera trap images of wildlife from the Red Forest, Chornobyl, Ukraine, 2016–2017, NERC EDS Environmental Information Data Centre [data set], https://doi.org/10.5285/bf82cec2-5f8a-407c-bf74-f8689ca35e83, 2022a.
Barnett, C. L., Gashchak, S., Wood, M. D., and Beresford, N. A.: Wildlife camera trap photographs from the Chornobyl Exclusion Zone, Ukraine (June 2020–November 2020) following extensive wildfires, NERC EDS Environmental Information Data Centre [data set], https://doi.org/10.5285/9bd7754d-ea87-4b35-bec1-f39d5cc76db6, 2022b.
Beresford, N. A., Barnett, C. L., Gashchak, S., Kashparov, V., Kireev, S., Levchuk, S., Morozova, V., Smith, J. T., and Wood, M. D.: Wildfires in the Chernobyl Exclusion Zone – risks, consequences and management, Integr. Environ. Assess. Manag., 17, 1141–1150, https://doi.org/10.1002/ieam.4424, 2021.
Beresford, N. A., Wood, M. D., Gashchak, S., and Barnett, C. L.: Current ionising radiation doses in the Chernobyl Exclusion Zone do not directly impact on soil biological activity, PLoS ONE, 17, e0263600, https://doi.org/10.1371/journal.pone.0263600, 2022.
Brown, J., Strand, P., Hosseini, A., and Børretzen, P.: Handbook for assessment of the exposure of biota to ionising radiation from radionuclides in the environment, Framework for Assessment of Environmental Impact (FASSET), Deliverable 3, Contract No FIGE-CT-2000-00102, https://wiki.ceh.ac.uk/download/attachments/115802176/fasset_d5.pdf?version=1&modificationDate=1263905014000&api=v2 (last access: 17 February 2023), 2003.
Brown, J. E., Alfonso, B., Avila, R., Beresford, N. A., Copplestone, D., and Hosseini, A.: A new version of the ERICA tool to facilitate impact assessments of radioactivity on wild plants and animals, J. Environ. Radioact., 153, 141–148, https://doi.org/10.1016/j.jenvrad.2015.12.011, 2016.
CABI: Invasive Species Compendium, Lepus europaeus (European hare), https://www.cabi.org/isc/datasheet/77227 (last access: 16 January 2023), 2013.
Deryabina, T. G., Kuchmel, S. V., Nagorskaya, L. L., Hinton, T. G., Beasley, J. C., Lerebours, A., and Smith, J. T.: Long-term census data reveal abundant wildlife populations at Chernobyl, Curr. Biol., 25, R811–R826, https://doi.org/10.1016/j.cub.2015.08.017, 2015.
Gashchak, S., Gulyaichenko, Y., Beresford, N. A., and Wood, M. D.: Brown bear (Ursus arctos L.) in Chornobyl exclusion zone, Proceedings of the Theriological School, 14, 71–84, 2016.
Gashchak, S., Gulyaichenko, Y., Beresford, N. A., and Wood, M. D.: European bison (Bison bonasus) in the Chornobyl exclusion zone (Ukraine) and prospects for its revival, Proceedings of the Theriological School, 15, 58–66, 2017.
Gashchak, S., Paskevych, S., Gulyaichenko, E., Vishnevskyi, D., Barnett, C. L., and Beresford, N. A.: Motion-activated camera trap images of Eurasian Lynx in the Ukrainian Chornobyl Exclusion Zone, 2012–2018, NERC Environmental Information Data Centre [data set], https://doi.org/10.5285/c099d04e-72e0-4ee9-ac72-11dc004ec1f6, 2022.
Geras'kin, S. A., Fesenko, S. V., and Alexakhin, R. M.: Effects of non-human species irradiation after the Chernobyl NPP accident, Environ. Int., 34, 880–897, https://doi.org/10.1016/j.envint.2007.12.012, 2008.
International Commission on Radiological Protection (ICRP): Environmental Protection – the Concept and Use of Reference Animals and Plants, ICRP Publication 108, Ann. ICRP 38, 4–6, 2008.
Kyiv Politech Institute's Museum: https://museum.kpi.ua/map/?d=chornobyl&l1=1972-01-24.US.KH.1202-1.47.F14&l2=&z=15&lon=30.103800&lat=51.389000 (last access: 16 January 2023), 2022.
Lavrinienko, A., Mappes, T., Tukalenko, E., Mousseau, T. A., Møller, A. P., Knight, R., Morton, J. T., Thompson, L. R., and Watts, P. C.: Environmental radiation alters the gut microbiome of the bank vole Myodes glareolus, ISME Journal, 12, 2801–2806, https://doi.org/10.1038/s41396-018-0214-x, 2018a.
Lavrinienko, A., Tukalenko, E., Mappes, T., and Watts, P. C.: Skin and gut microbiomes of a wild mammal respond to different environmental cues, Microbiome, 6, 1–16, https://doi.org/10.1186/s40168-018-0595-0, 2018b.
Møller, A. P. and Mousseau, T. A.: Assessing effects of radiation on abundance of mammals and predator–prey interactions in Chernobyl using tracks in the snow, Ecol. Indicat., 26, 112–116, https://doi.org/10.1016/j.ecolind.2012.10.025, 2013.
Møller, A. P., Morelli, F., Mousseau, T. A., and Tryjanowski, P.: The number of syllables in Chernobyl cuckoo calls reliably indicate habitat, soil and radiation levels, Ecol. Indicat., 66, 592–597, https://doi.org/10.1016/j.ecolind.2016.02.037, 2016.
Ofstad, E. G., Herfindal I., Solberg, J. E., and Sæther, B.-E.: Home ranges, habitat and body mass: simple correlates of home range size in ungulates, P. Roy. Soc. B., 283, 2832016123420161234, https://doi.org/10.1098/rspb.2016.1234, 2016.
Okarma, H., Jędrzejewski, W., Schmidt, K., Śnieżko, S., Bunevich, A. N., and Jędrzejewska, B.: Home ranges of wolves in Białowieża primeval forest, Poland, compared with other Eurasian populations, J. Mamm., 79, 842–852, https://doi.org/10.2307/1383092, 1998.
Pröhl, G. (Ed.): Dosimetric models and data for assessing radiation exposures to biota. Framework for Assessment of Environmental Impact (FASSET), Deliverable 3, Contract No FIGE-CT-2000-00102, https://wiki.ceh.ac.uk/download/attachments/115802176/fasset_d3.pdf?version=1&modificationDate=1263905014000&api=v2 (last access: 17 February 2023), 2003.
Schai-Braun, S. C. and Hackländer, K.: Home range use by the European hare (Lepus europaeus) in a structurally diverse agricultural landscape analysed at a fine temporal scale, Acta. Theriol., 59, 277–287, https://doi.org/10.1007/s13364-013-0162-9, 2014.
Shestopalov, V. M.: Atlas of Chernobyl exclusion zone, Ukrainian Academy of Science, Kyiv, 1996 (in Russian/English).
Webster, S. C., Byrne, M. E., Lance, S. L., Lovel, C. N., Hinton, T. G., Shamovich, D., and Beasley, J. C.: Where the wild things are: influence of radiation on the distribution of four mammalian species within the Chernobyl Exclusion Zone, Front. Ecol. Environ., 14, 1–6, https://doi.org/10.1002/fee.1227, 2016.
Wood, M. D. and Beresford, N. A.: The wildlife of Chernobyl: 30 years without man, The Biologist, 63, 16–19, 2016.