the Creative Commons Attribution 4.0 License.
the Creative Commons Attribution 4.0 License.
 | 18 Dec 2023
The Western Channel Observatory: a century of physical, chemical and biological data compiled from pelagic and benthic habitats in the western English Channel
Angus Atkinson
Ruth L. Airs
Rachel Brittain
Ian Brown
Elaine S. Fileman
Helen S. Findlay
Caroline L. McNeill
Clare Ostle
Tim J. Smyth
Paul J. Somerfield
Karen Tait
Glen A. Tarran
Simon Thomas
Claire E. Widdicombe
E. Malcolm S. Woodward
Amanda Beesley
David V. P. Conway
James Fishwick
Hannah Haines
Carolyn Harris
Roger Harris
Pierre Hélaouët
David Johns
Penelope K. Lindeque
Thomas Mesher
Abigail McQuatters-Gollop
Joana Nunes
Frances Perry
Ana M. Queiros
Andrew Rees
Saskia Rühl
David Sims
Ricardo Torres
Stephen Widdicombe
The Western Channel Observatory (WCO) comprises a series of pelagic, benthic and atmospheric sampling sites within 40 km of Plymouth, UK, that have been sampled by the Plymouth institutes on a regular basis since 1903. This longevity of recording and the high frequency of observations provide a unique combination of data; for example temperature data were first collected in 1903, and the reference station L4, where nearly 400 planktonic taxa have been enumerated, has been sampled on a weekly basis since 1988. While the component datasets have been archived, here we provide the first summary database bringing together a wide suite of the observations. This provides monthly average values of some of the key pelagic and benthic measurements for the inshore site L4 (50∘15.00′ N, 4∘13.02′ W; approx. depth 55 m), the offshore site E1 (50∘02.00′ N, 4∘22.00′ W; approx. depth 75 m) and the intermediate L5 site (50∘10.80′ N, 4∘18.00′ W; approx. depth 58 m). In brief, these data include the following: water temperature (from 1903); macronutrients (from 1934); dissolved inorganic carbon and total alkalinity (from 2008); methane and nitrous oxide (from 2011); chlorophyll a (from 1992); high-performance liquid chromatography (HPLC)-derived pigments (from 1999); <20 µm plankton by flow cytometry, including bacteria (8 functional groups from 2007); phytoplankton by microscopy (6 functional groups from 1992); microplankton and mesozooplankton from FlowCam (6 groups from 2012); Noctiluca sp. dinoflagellate (from 1997); mesozooplankton by microscopy (8 groups from 1988); Calanus helgolandicus egg production rates (from 1992); fish larvae from the Young Fish Trawl survey (4 groups from 1924); benthic macrofauna (4 groups from 2008); demersal fish (19 families from 2008); blue shark, Prionace glauca (from 1958); and 16S alpha diversity for sediment and water column (from 2012). These data have varying coverage with respect to time and depth resolution. The metadata tables describe each dataset and provide pointers to the source data and other related Western Channel Observatory datasets and outputs not compiled here. We provide summaries of the main trends in seasonality and some major climate-related shifts that have been revealed over the last century. The data are available from the Data Archive for Seabed Species and Habitats (DASSH): https://doi.org/10.17031/645110fb81749 (McEvoy and Atkinson, 2023). Making these data fully accessible and including units of both abundance and biomass will stimulate a variety of uptakes. These may include uses as an educational resource for projects, for models and budgets, for the analysis of seasonality and long-term change in a coupled benthic–pelagic system, or for supporting UK and north-eastern Atlantic policy and management.
- Article
(10246 KB) - Full-text XML
- BibTeX
- EndNote


Sustained observations of the marine environment are vital to understand marine ecosystem functioning and climate change responses (O'Brien et al., 2017; Richardson, 2008). Over seasonal timescales, high-resolution observations allow one to develop an understanding of community succession and seasonality (Smyth et al., 2010, 2014); moreover, over multiple decades, they allow us to tease out the effects of local variability and anthropogenic stressors from the longer-term signal of climate change (Edwards and Richardson, 2004; Ratnarajah et al., 2023). Paradoxically, however, many sampling programmes are funded for only 3–4 years and, despite the urgency of understanding climate change responses, time series are threatened at a global scale (Vucetich et al., 2020). This makes it even more important to make data from existing long time series findable, reusable and as well documented as possible.
The Western Channel Observatory (WCO) data contain an unprecedented collection of parameters both in terms of longevity and variety. Investigation of the marine environment in the western English Channel off Plymouth began with the opening of the Marine Biological Association (MBA) laboratory in 1888. Given the importance of the area for the pelagic fishery, the remit focused strongly on research in applied fisheries. Initial studies centred on the eggs and larvae of commercially important fish. With the advent of the International Council for the Exploration of the Sea (ICES) and a growing realization that hydrography had an influence on biological communities, plankton surveys and hydrographical measurements were soon added (Southward et al., 2005; Southward and Roberts, 1987). In the decades that followed, observations were expanded with the creation of stations E1 (50∘02.00′ N, 4∘22.00′ W) and L5 (50∘10.80′ N, 4∘18.00' W). Sampling was interrupted during both World War I (1914–1918) and World War II (1939–1945). Funding priorities and organizational changes in the 1970s and 1980s threatened the future of long-term time series, and sampling at L5 and E1 was consequently stopped until 2002. However, in 1988 Plymouth Marine Laboratory (PML) established weekly zooplankton sampling at station L4 (50∘15.00′ N, 4∘13.02′ W), with ad hoc funding and no formal support. Sampling for phytoplankton community composition and abundance, egg production, and environmental variables followed from 1992 onwards. The WCO was founded in 2005 to bring these valuable time series together. The WCO provided a platform for a wider array of parameters to be initiated – for example, the benthic survey from 2007, in situ automated buoys at L4 and E1 (initially supported by Natural Environmental Research Council, NERC, and then the Met Office), the Penlee Point Atmospheric Observatory (PPAO) from 2014, and Smart Sound Plymouth from 2021 (Fig. 1).
The stations around Plymouth, now known as the Western Channel Observatory, have supported major innovative work – for example, pioneering work on plankton as indicators (Russell, 1935), the measurement of nutrients and primary production (Boalch et al., 1978), early work on fatty acids and the importance of food quality for zooplankton (Conover and Corner, 1968; Pond et al., 1996), and the use of molecular biology tools to provide insight into the seasonal dynamics of viral and bacterial plankton (Lindeque, 2023; Gilbert et al., 2009; Schroeder et al., 2003). These works, including the development of intertidal research and data not covered here, can be found in the historical review of Southward et al. (2005). Later special journal issues cover the 20th and 25th anniversaries of regular sampling at L4 and are described in Harris (2010) and Smyth et al. (2015), respectively. We refer the reader to these for the historical context of the observations that we summarize here.
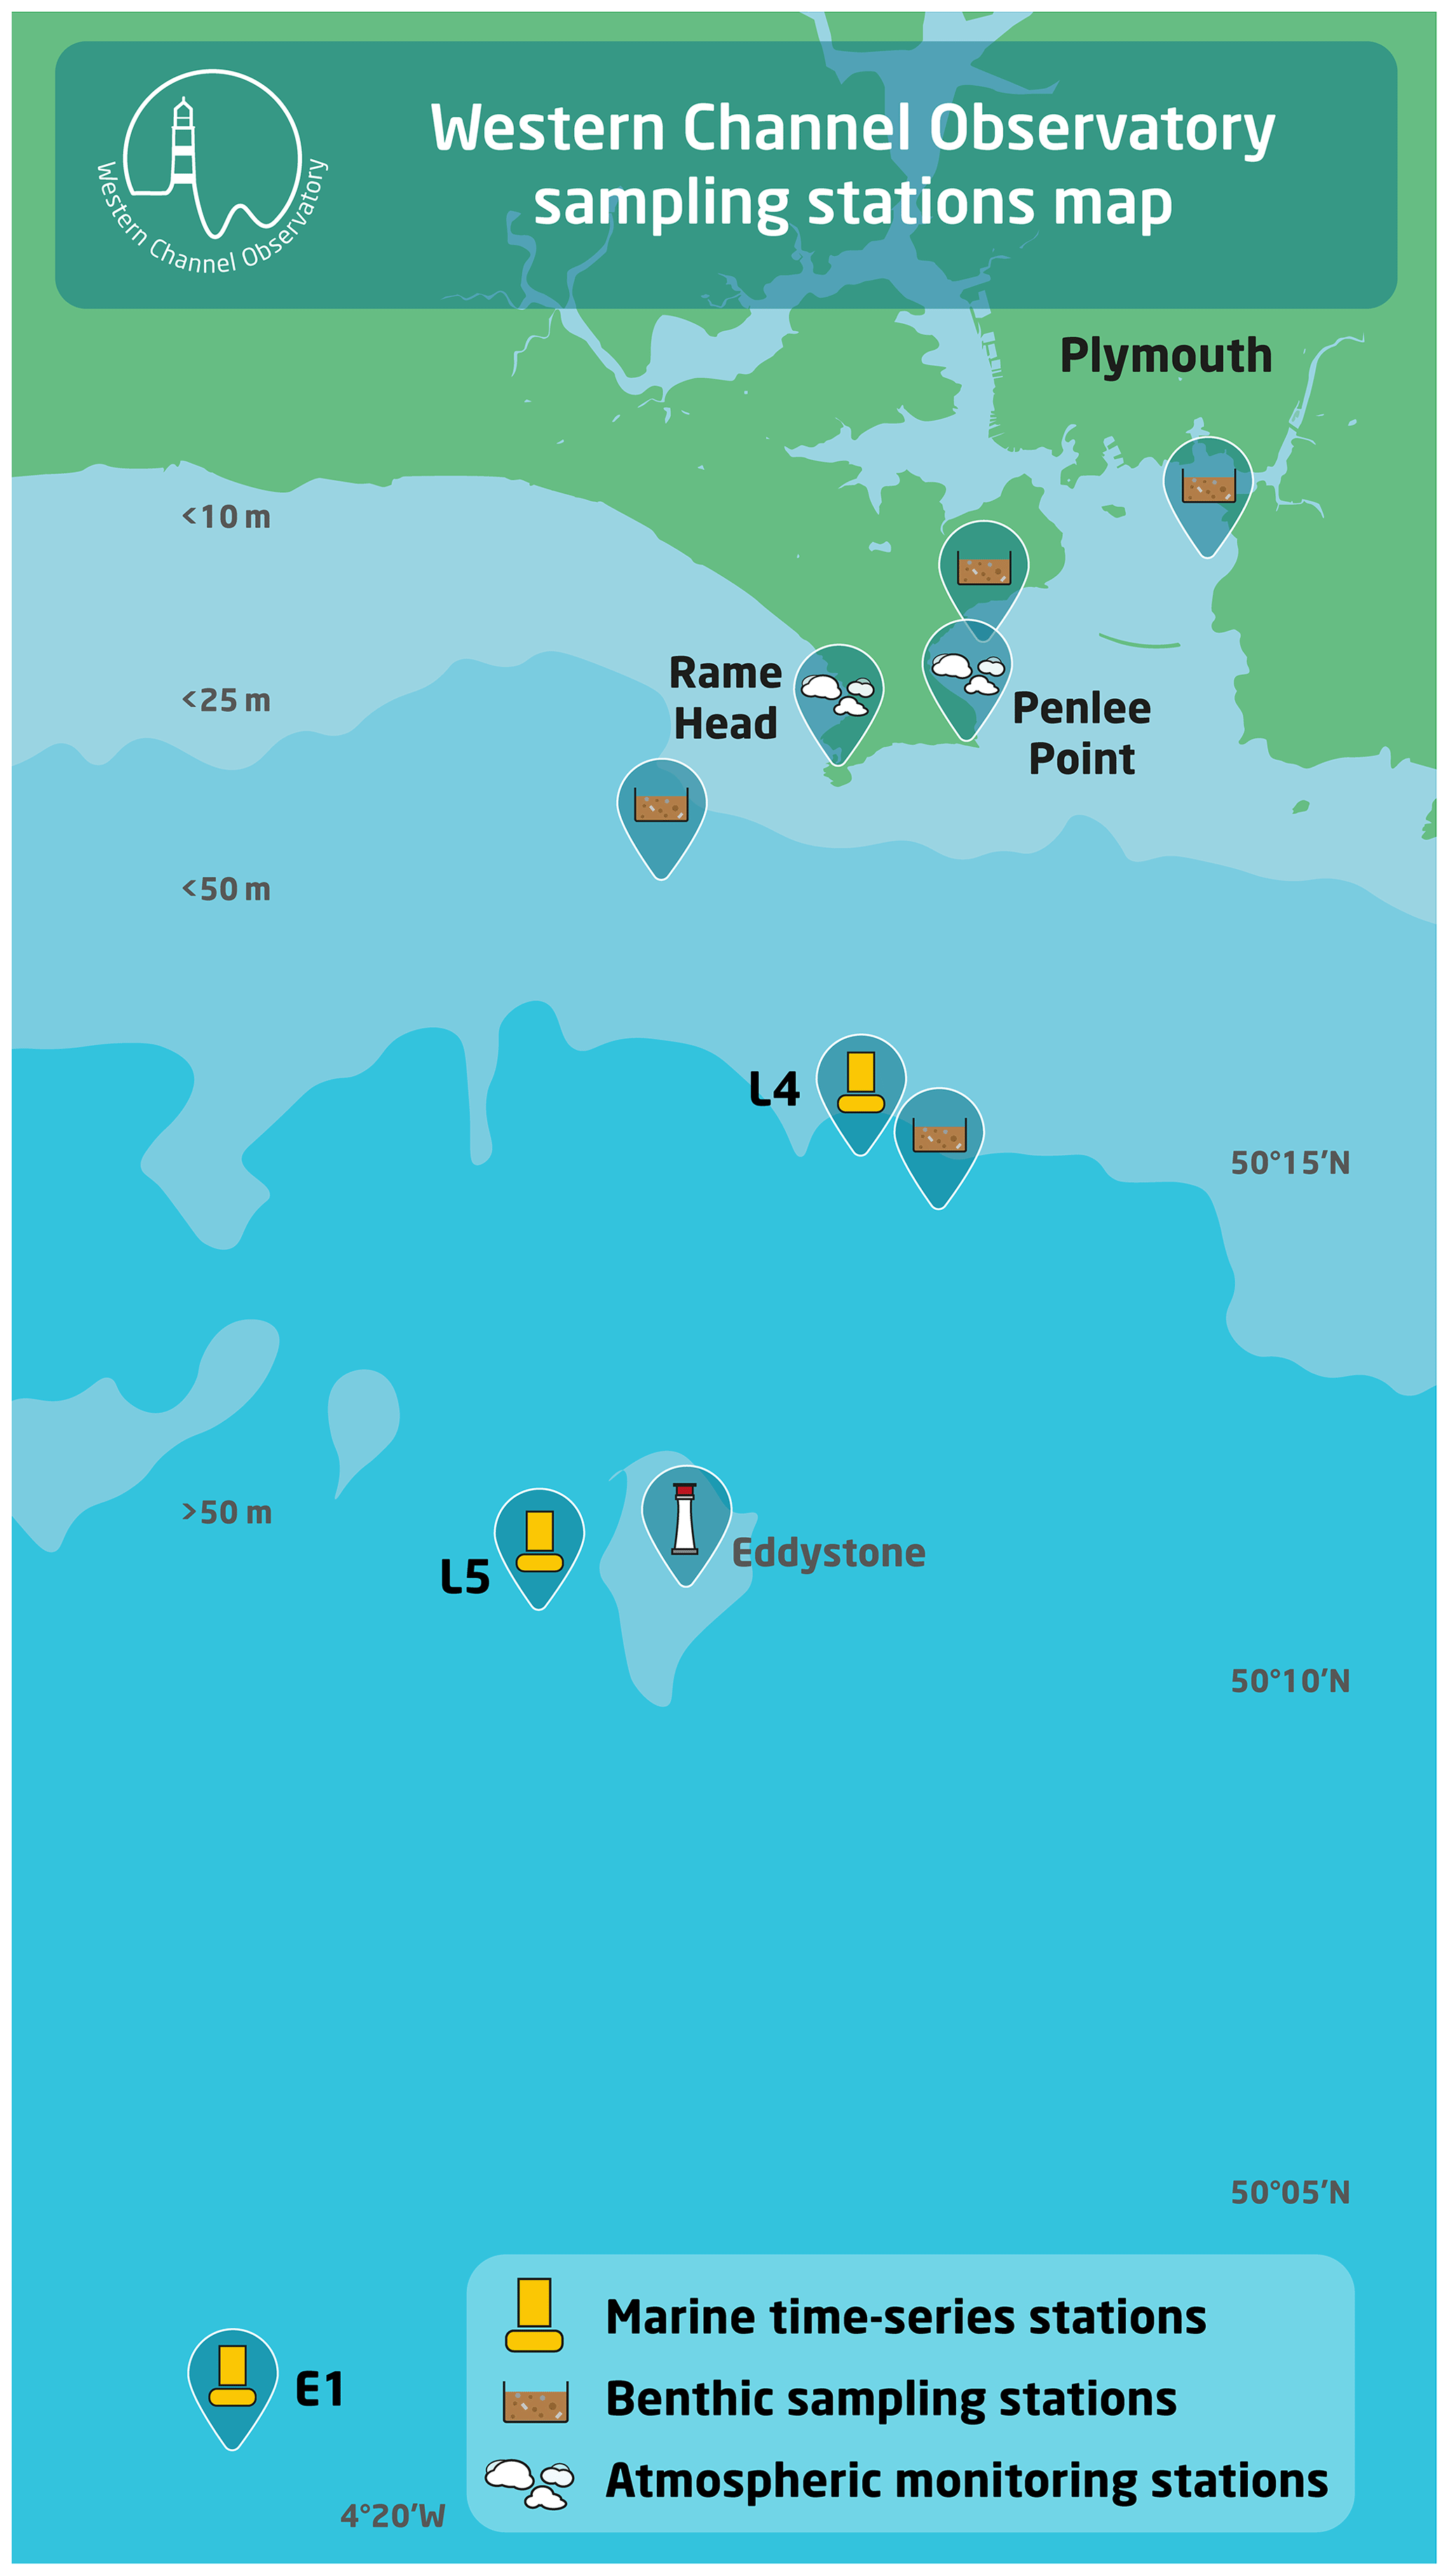
Figure 1Location of Western Channel Observatory (WCO) sampling stations.
The two main marine stations of L4 and E1 both exhibit strong seasonal signals and are tidally influenced (Smyth et al., 2015). Both become stratified typically after April, continuing through the summer months and lasting until late September. Station L4 is classified as a coastal site and is periodically influenced by flood water discharge from the Tamar and Plym rivers (Rees et al., 2009). However, at a depth of approx. 55 m and 13 km offshore, it is not as prone to localized inshore effects and is classified as “transitionally stratified” (Pingree, 1980). The deeper station E1, 40 km offshore and approx. 75 m deep, is less influenced by coastal water influx and is classified as an open shelf station that is seasonally stratified. The intermediate station, L5, was much sampled in early years and is just west of Eddystone reef. These stations experience classic, albeit highly variable, seasonal production cycles with spring and autumn phytoplankton blooms. Figure 2 compares the key WCO sites in relation to the wider summer pattern of stratification (Fig. 2a) and to the longer trend of climatic cycles across the North Atlantic (Bode, 2023), highlighting a recent phase of intense warming over the last 4 decades (Fig. 2b). These environmental changes and the response of the biota are described more fully in Sect. 5 using plots derived from our summary database.
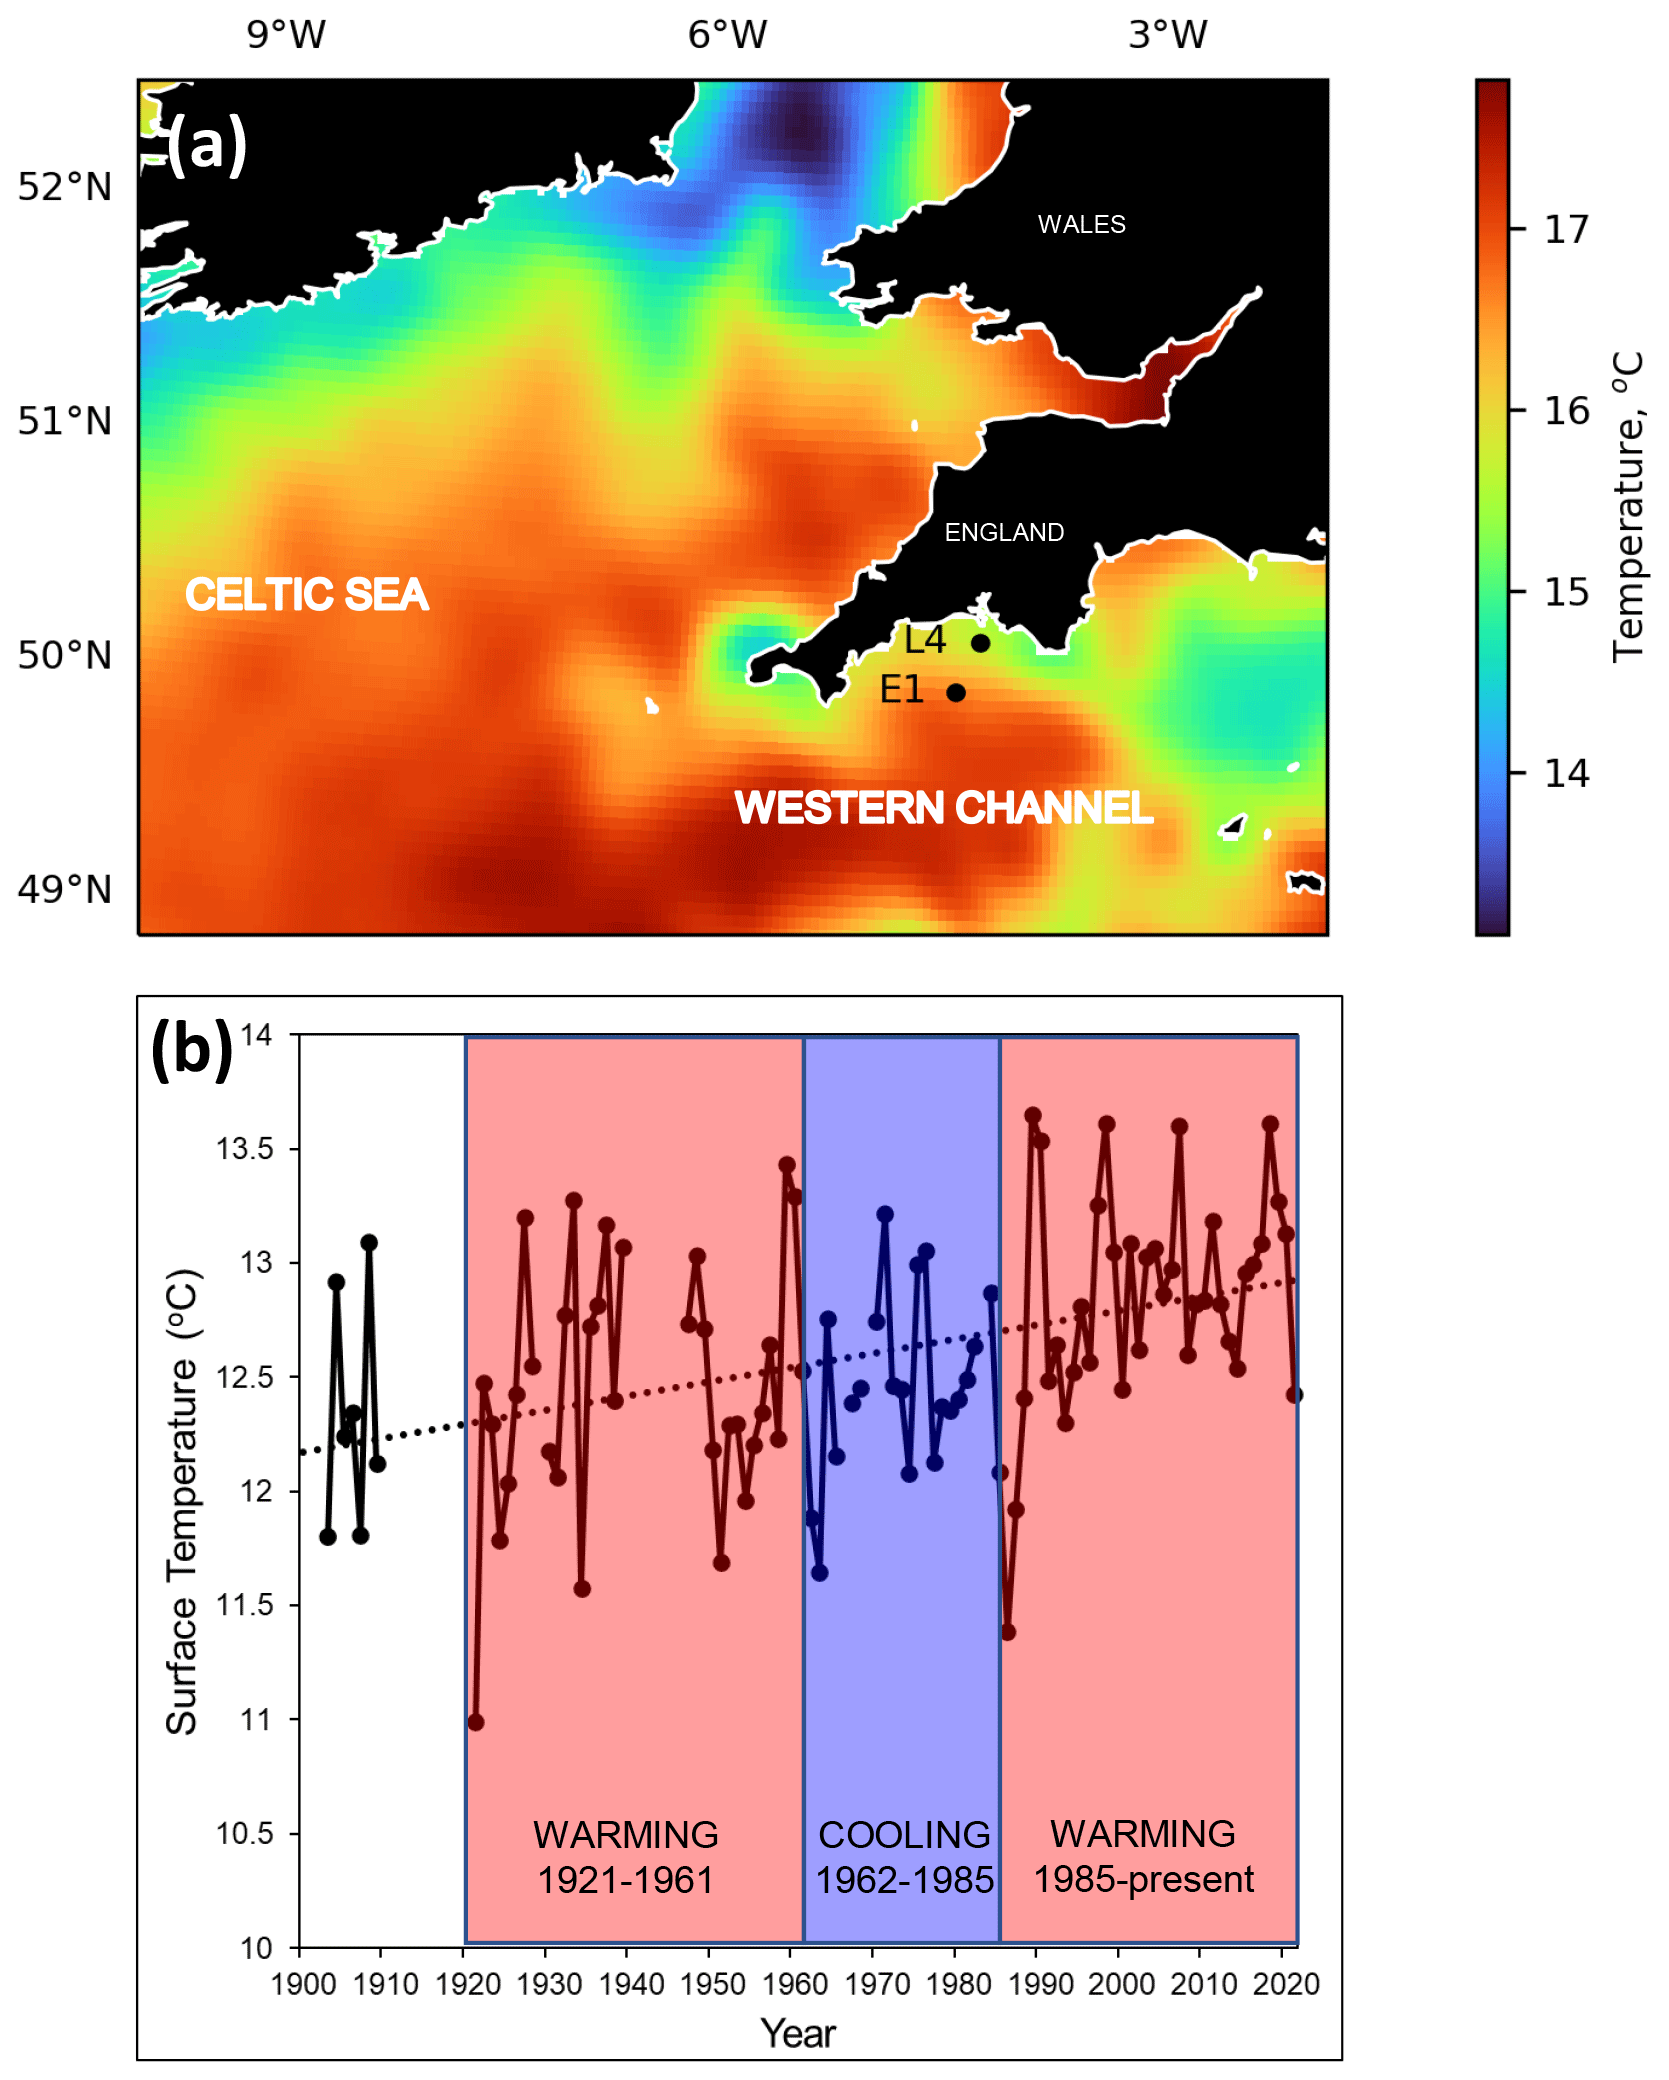
Figure 2Wider-scale spatial and temporal context for the Western Channel Observatory. Panel (a) displays the wider setting of the L4 and E1 stations in the western English Channel, in relation to summer sea surface temperature July 2016 (Merchant et al., 2019): cold colours represent tidally mixed areas, whereas warm colours represent summer stratified areas with a seasonal summer thermocline. L4 stratifies in summer and is defined as transitionally stratified, whereas E1 is an open shelf and is defined as seasonally stratified (Pingree, 1980). Panel (b) shows the annual surface temperature records at station E1 spanning 1903–2021. Due to missing data in some months of the early years, annual means were calculated here as averages of February, May, August and November. Missing months were interpolated as the mean respective month over the whole time span. Years with more than 2 of the 4 missing months are not plotted here. The dotted line is the least squares linear regression over the whole time span. Three thermal epochs are coloured here based on the interpretation of Southward et al. (2005). They defined periods of warming from 1921 to 1961, followed by a cooling era from 1962 to 1985 and then a warming period from 1986 onwards.
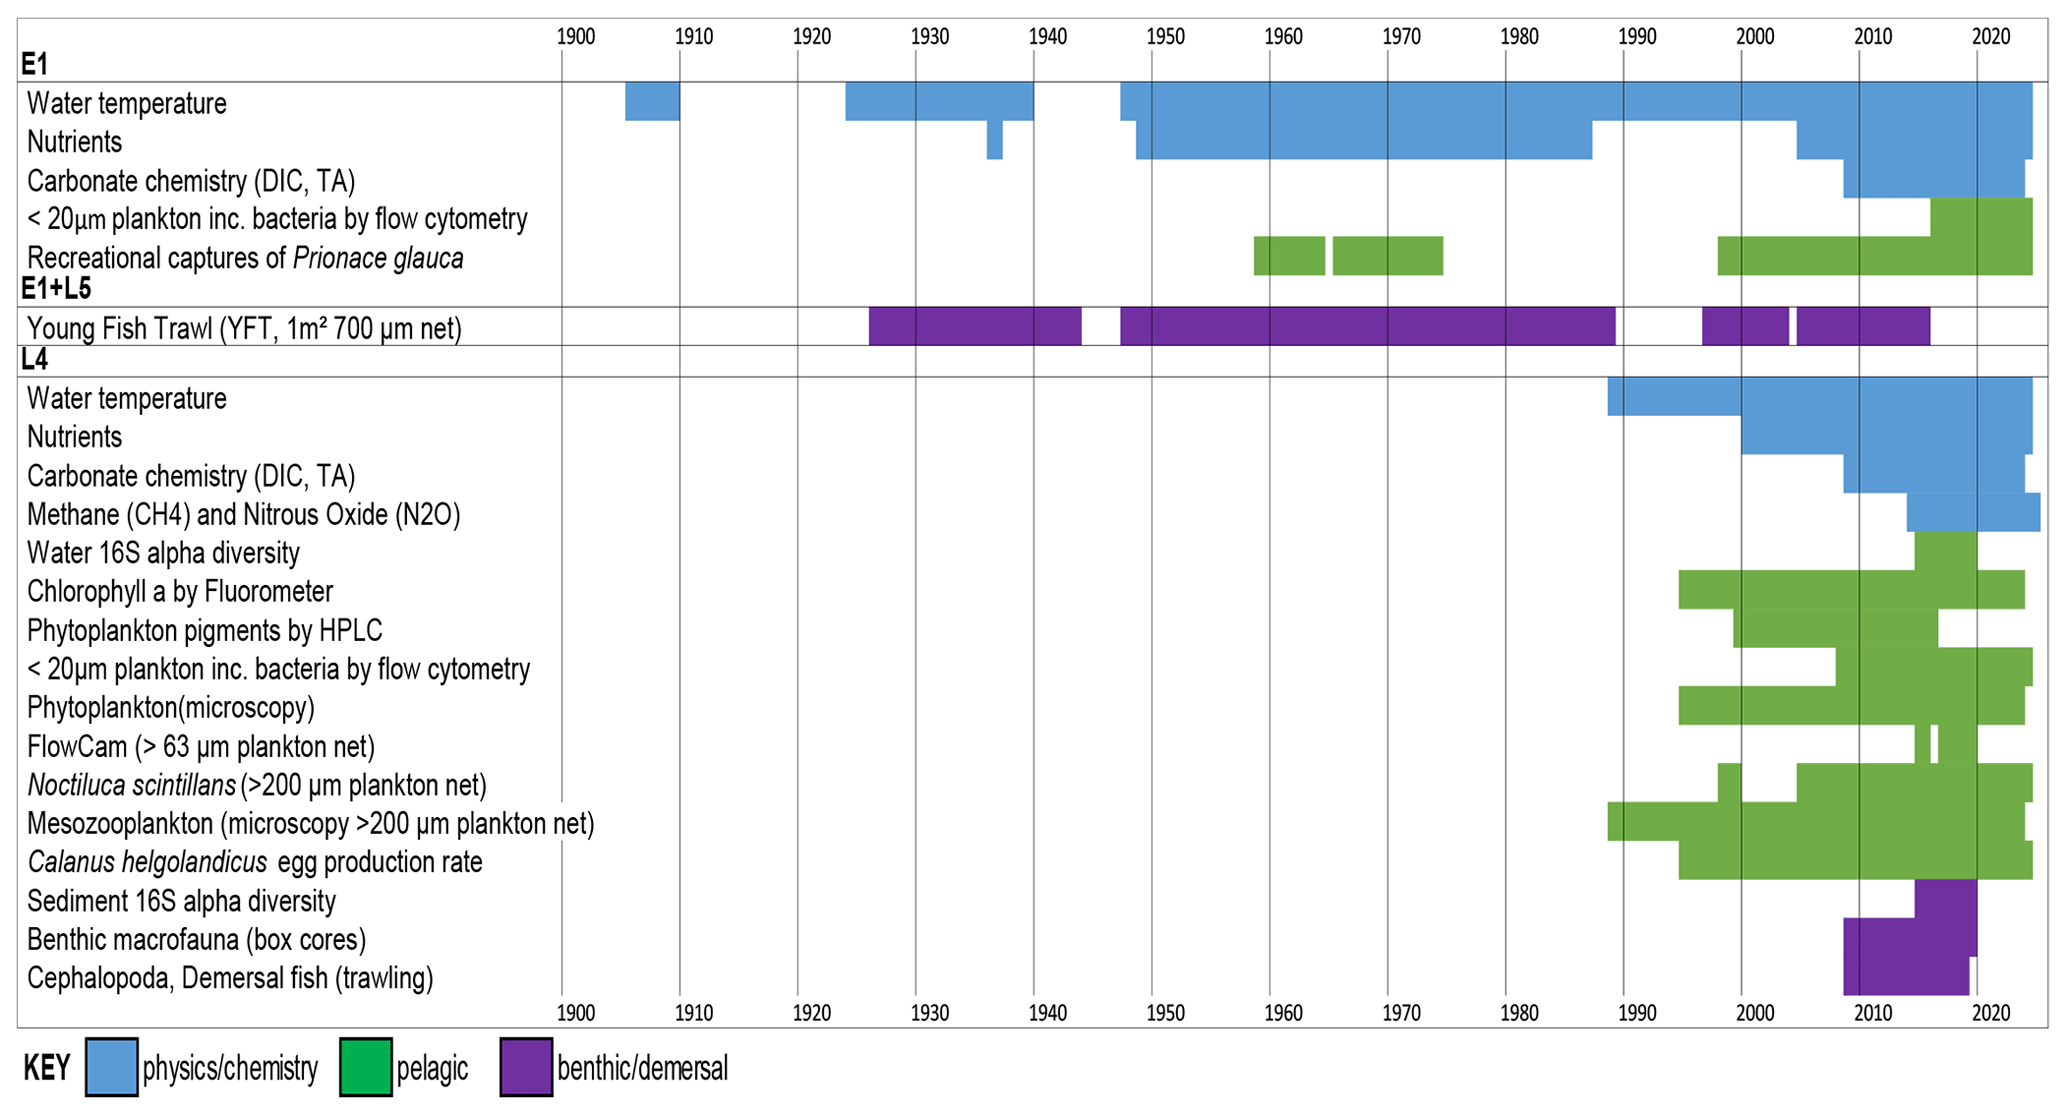
The individual datasets of the WCO are valuable, but differing levels of reporting and formatting hamper their use and prevent integration. Many are currently available through data repositories such as the British Oceanographic Data Centre, https://www.bodc.ac.uk/data/ (last access: 29 November 2023) and the Data Archive for Seabed Species and Habitats, https://www.dassh.ac.uk/ (last access: 29 November 2023); however, some are lodged with individual scientists. To improve their overall utility, the various component datasets need to be brought together into a single format. We have done this here for the first time; however, to make this project tractable, we have summarized the core datasets as monthly averages, as well as for broad functional groups. This level of resolution (coarser than some of the measurements, which can be weekly and for individual species) was chosen as a first step to allow timely completion of this initiative and to provide a summary database that combines many diverse data sources. This data paper combines most of the key variables that have good seasonal or longer-term coverage in a single spreadsheet (Fig. 3). Specialists who wish to access the underlying high-resolution observations, who wish to access data for individual species, who require the most recent data available, or who require other datasets not summarized here are directed to our WCO data catalogue: https://www.westernchannelobservatory.org.uk/data.php. (last access: 29 November 2023). This catalogue provides sampling details, DOIs of the most recent versions and points of contact for specific datasets. Additional information is also available in Tables A1 and A2.
This data paper is aimed towards scientists who may not need weekly resolution or species-specific data but who wish to compare the monthly averaged physical, chemical and biological data. Biological data are provided in units of both abundance and biomass in order to enhance their utility for modelling. We have also made the spreadsheets as user-friendly and simple as possible to be of help as an educational resource at the undergraduate level. This data paper describes the database (Sect. 4); illustrates its utility to examine seasonality and longer-term trends while also summarizing previous work on these topics (Sect. 5); provides a broader-scale context for the WCO (Sect. 6); and finally provides practical advice on the strengths, limitations, and how to use and cite this database (Sects. 7 and 8).
This paper consolidates 22 individual and diverse datasets using monthly averages. Data with comprehensive seasonal coverage that span at least 2 years are included. Detailed information on sampling and analysis protocols as well as data coverage can be found in Tables A1 and A2. It is essential to read the appendices before extracting data to avoid errors, for example, in distinguishing between zeros and absent data. A zero represents a parameter that was either looked for and not found (for plankton data) or was below the detection limit (nutrient data). A blank cell, by contrast, indicates there are no data available for that particular month. Most biotic data are reported both in units of abundance and biomass. The smallest plankton (<20 µm) measured by flow cytometry are an exception. These use fixed conversion factors for the whole functional group, and they have multiple groups and depths. Therefore to remove the complexity of having many data fields that are simple multiples of others, these are reported only as abundance per millilitre. Median cell diameters are provided, thereby enabling the estimation of biomass based on the volume of a sphere and carbon values from the literature (Table 1). Median cell diameters were derived by collecting seawater samples, filtering them sequentially through a series of membrane filters, analysing the filtrates by flow cytometry, and plotting the percentage of cells remaining as a percentage of unfiltered seawater against filter pore size (Burkill et al., 1993). The FlowCam analysis of the 63 µm mesh plankton net reports biomass only. Here, along with the microscopy analysis of phytoplankton preserved in Lugol's solution and formalin, the biomass estimation is based on mean cell dimensions and taxon-specific biovolumes (Table A1). Biomass calculations for the mesozooplankton are based on measured body lengths of material from L4 and applied literature values of length–mass regressions to convert values to individual biomass. These were then multiplied by numerical abundances to derive biomass densities (McEvoy et al., 2022b). The benthic fauna biomass data are derived from blotted wet weight measured in the lab, and Cephalopoda and demersal fish families' biomass are derived by wet weight on board.
Table 1Median cell diameters for plankton groups quantified by flow cytometry.
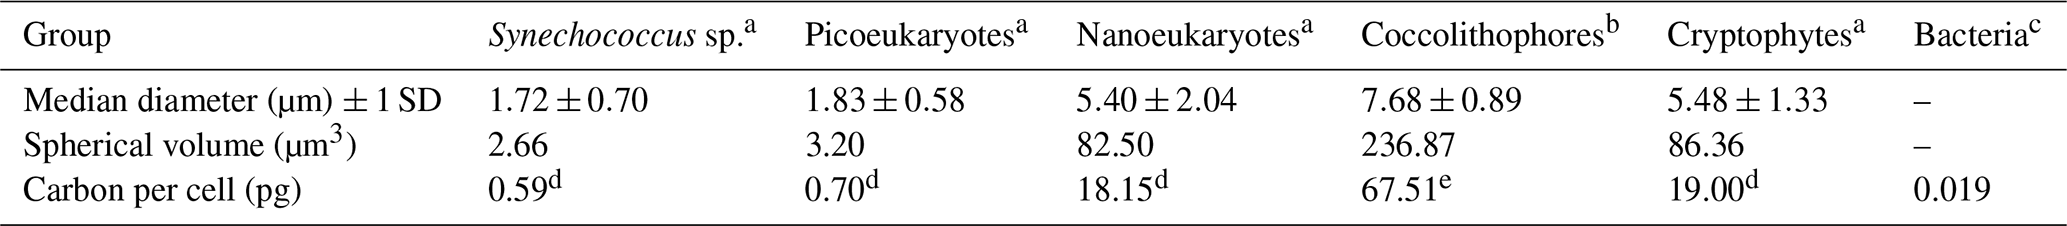
a Information from Station L4, approximately monthly over an annual cycle from 2013 to 2014 (unpublished). b Information from the Celtic Sea, April 2002 (unpublished). Information from c Heywood et al. (2006). d Carbon conversion factor of 0.22 pg C µm−3 (Booth, 1988), e Carbon conversion factor 0.285 pg C µm−3 (unpublished).
In this section, we briefly showcase some of the key datasets, by outlining the seasonality and environmental variability, illustrating the coverage of all of the component data series at L4 (Fig. 4) and at E1 and L5 (Fig. 5). We then show selected examples of the data time series' coverage, including longer-term trends at L4 (Fig. 6) and at E1 and L5 (Fig. 7). A few other key example results are shown, including the Calanus spp. egg production experiments (Fig. 8) and the time–depth resolution of sampling for carbonate chemistry (Fig. 9).
5.1 Overall seasonality: L4 pelagic system
The high-resolution sampling of multiple parameters at L4 makes it an ideal site for improving the understanding of the drivers of seasonality. Figure 4 summarizes some of the key aspects of this seasonality. Briefly, L4 is a transitionally stratified site (Pingree, 1980) that is typically stratified from around May to September with surface temperatures ranging from about 9 ∘C in March to around 16 ∘C in August. This stratification cycle drives much of the pelagic dynamics with nutrient (especially nitrate) depletion to near-limiting levels in the upper water column during the stratified period as well as progressive reductions in dissolved inorganic carbon (DIC), methane and nitrous oxide typically until about August (Kitidis et al., 2012).
The combination of nutrients, light and grazing causes the conditions for a “classic” temperate shelf sea production cycle (Irigoien et al., 2005). Thus, there is typically a spring bloom around April–May dominated by diatoms and the prymnesiophyte Phaeocystis, followed by a dinoflagellate bloom in late summer and often diatoms in autumn. Importantly, however, the monthly mean values of the phytoplankton functional groups in Fig. 4 disguise the substantial interannual variability in their magnitude or floristic composition over the time series (Widdicombe et al., 2010). The pico- and nano-fractions follow slightly different dynamics, with the highest biomass values building up in the summer stratified period with maxima often in August–September (Tarran and Bruun, 2015). The FlowCam biomass estimates based on 63 µm mesh, full-depth net hauls show the contributions of copepod nauplii and the larger diatoms, dinoflagellates and ciliates, some of which are not statistically quantified in the counts based on samples preserved with Lugol's solution due to their rarity. Conversely, the copepod nauplii are too small to be quantitatively retained by the 200 µm mesozooplankton WP2 net. Rare seasonal profile data of the copepod Oithona spp. based on bottle sampling are provided by Cornwell et al. (2020).
The mesozooplankton grazers from the full-depth 200 µm net hauls tend to increase substantially as early as March, before the spring bloom (Atkinson et al., 2015). The peak is typically in the early summer, dominated by copepods, both numerically (Eloire et al., 2010) and in terms of biomass, with a substantial contribution from meroplankton in spring (Highfield et al., 2010). More predatory taxa (often gelatinous or semi-gelatinous forms such as chaetognaths) then become important later in summer. The egg production rate of Calanus helgolandicus has, for most of the time series, been highest in the April–June spring bloom months (Irigoien and Harris, 2003; Maud et al., 2015, 2018), although (as described in Sect. 5.6) this is changing. This copepod species, alongside other zooplankton such as appendicularians (López-Urrutia et al., 2003), decapods (Fileman et al., 2014), bivalve larvae (Lindeque et al., 2015) and Oithona similis (Castellani et al., 2016; Cornwell et al., 2018, 2020), has been the focus of a series of detailed studies at L4 (Bonnet et al., 2005; Hirst et al., 2007; Irigoien and Harris, 2003).
While Fig. 4 describes a classic textbook shelf sea production cycle (Kiørboe, 2009), a wide suite of alternative mechanisms have been proposed to drive plankton seasonality (Atkinson et al., 2018). These include the following: the roles of phytoplankton photophysiology (Edwards et al., 2013; Polimene et al., 2014); net heat flux (Smyth et al., 2014); variable temperature dependence of phenology (Mackas et al., 2012; Atkinson et al., 2015); mortality-controlled zooplankton phenology (Irigoien and Harris, 2003; Cornwell et al., 2018); and various predator–prey dynamic models invoking stoichiometry (Polimene et al., 2015), grazing loopholes (Irigoien et al., 2005), grazer traits (Sailley et al., 2015), and the coupling of predator and prey traits (Kenitz et al., 2017). While these mechanisms are not necessarily mutually exclusive, the high-resolution sampling of the whole food web over multiple years provides a good test bed for numerical and conceptual models of the factors driving seasonality.
5.2 Overall seasonality: L4 benthic system
In contrast to the plankton, the benthic and demersal taxa have more varied seasonal dynamics. Macrofauna biomass is dominated by suspension feeders at L4 with similar biomass for most of the year (Fig. 4) except for low values in early winter. Potentially reflecting seasonal variation in water column food supply, species richness of infauna peaks throughout the summer in surface sediments and is lowest in late autumn. Higher numbers of species are also found in deeper sediment layers during warmer months, with the community seemingly shallowing over winter (Queirós et al., 2019). An assessment of particulate carbon sources to the seabed at L4 (Queirós et al., 2019) also suggested that fauna in shallow sediment layers exhibit strong signals of suspension and deposit feeding reliant on planktonic food sources, with carnivory increasing with sediment depth and reliance on water column food diminishing in tandem. Demersal fish are dominated by gadoids with seasonal minima in both December and March–April. In the benthos, there is no distinguishable seasonal signature to prokaryote diversity, in contrast to the water column, where it is lowest in the summer months.
While the detail of the seasonality of L4's pelagic and benthic component differs, there is strong connectivity between the pelagic and benthic systems, even during stratified periods. This is illustrated in the peaks and troughs of diversity linked to the availability of food sources (see seasonal productivity peaks in Fig. 4e–j; Queirós et al., 2019; Tait et al., 2015; Talbot et al., 2019) and is also reflected by pigment data and stable isotopic signatures of both DIC and particulate organic carbon and nitrogen (Queirós et al., 2019; Tait et al., 2015). Benthic–pelagic connectivity has been found to be seasonally variable in terms of the origin of the suspended and dissolved matter fluctuating between the two ecospheres as well as in terms of the dominant flux directions (Queirós et al., 2015; Rühl et al., 2020; Tait et al., 2015). Strong seasonality is also observed in the dynamics of ecosystem processes mediated by macrofauna in L4 sediments, i.e. bioturbation and bio irrigation (Kristensen et al., 2012), which have strong mediation effects on the rates of biogeochemical processes at the sediment–water interface, such as community respiration, and net carbon sequestration (Queirós et al., 2015, 2019).
Broader analyses of the seafloor time series at L4 have also demonstrated that these dynamics are highly variable on an interannual basis, with the effects of extreme events being particularly important (Rühl et al., 2021). Net vertical flux directions of suspended and particulate matter vary throughout the year, switching in direction and respective importance for the overall flow of matter throughout the system. In summary, the benthic system at L4 has not been as intensively sampled as the pelagic, but the site still provides an excellent opportunity to better understand benthic–pelagic coupling in a shallow shelf sea.
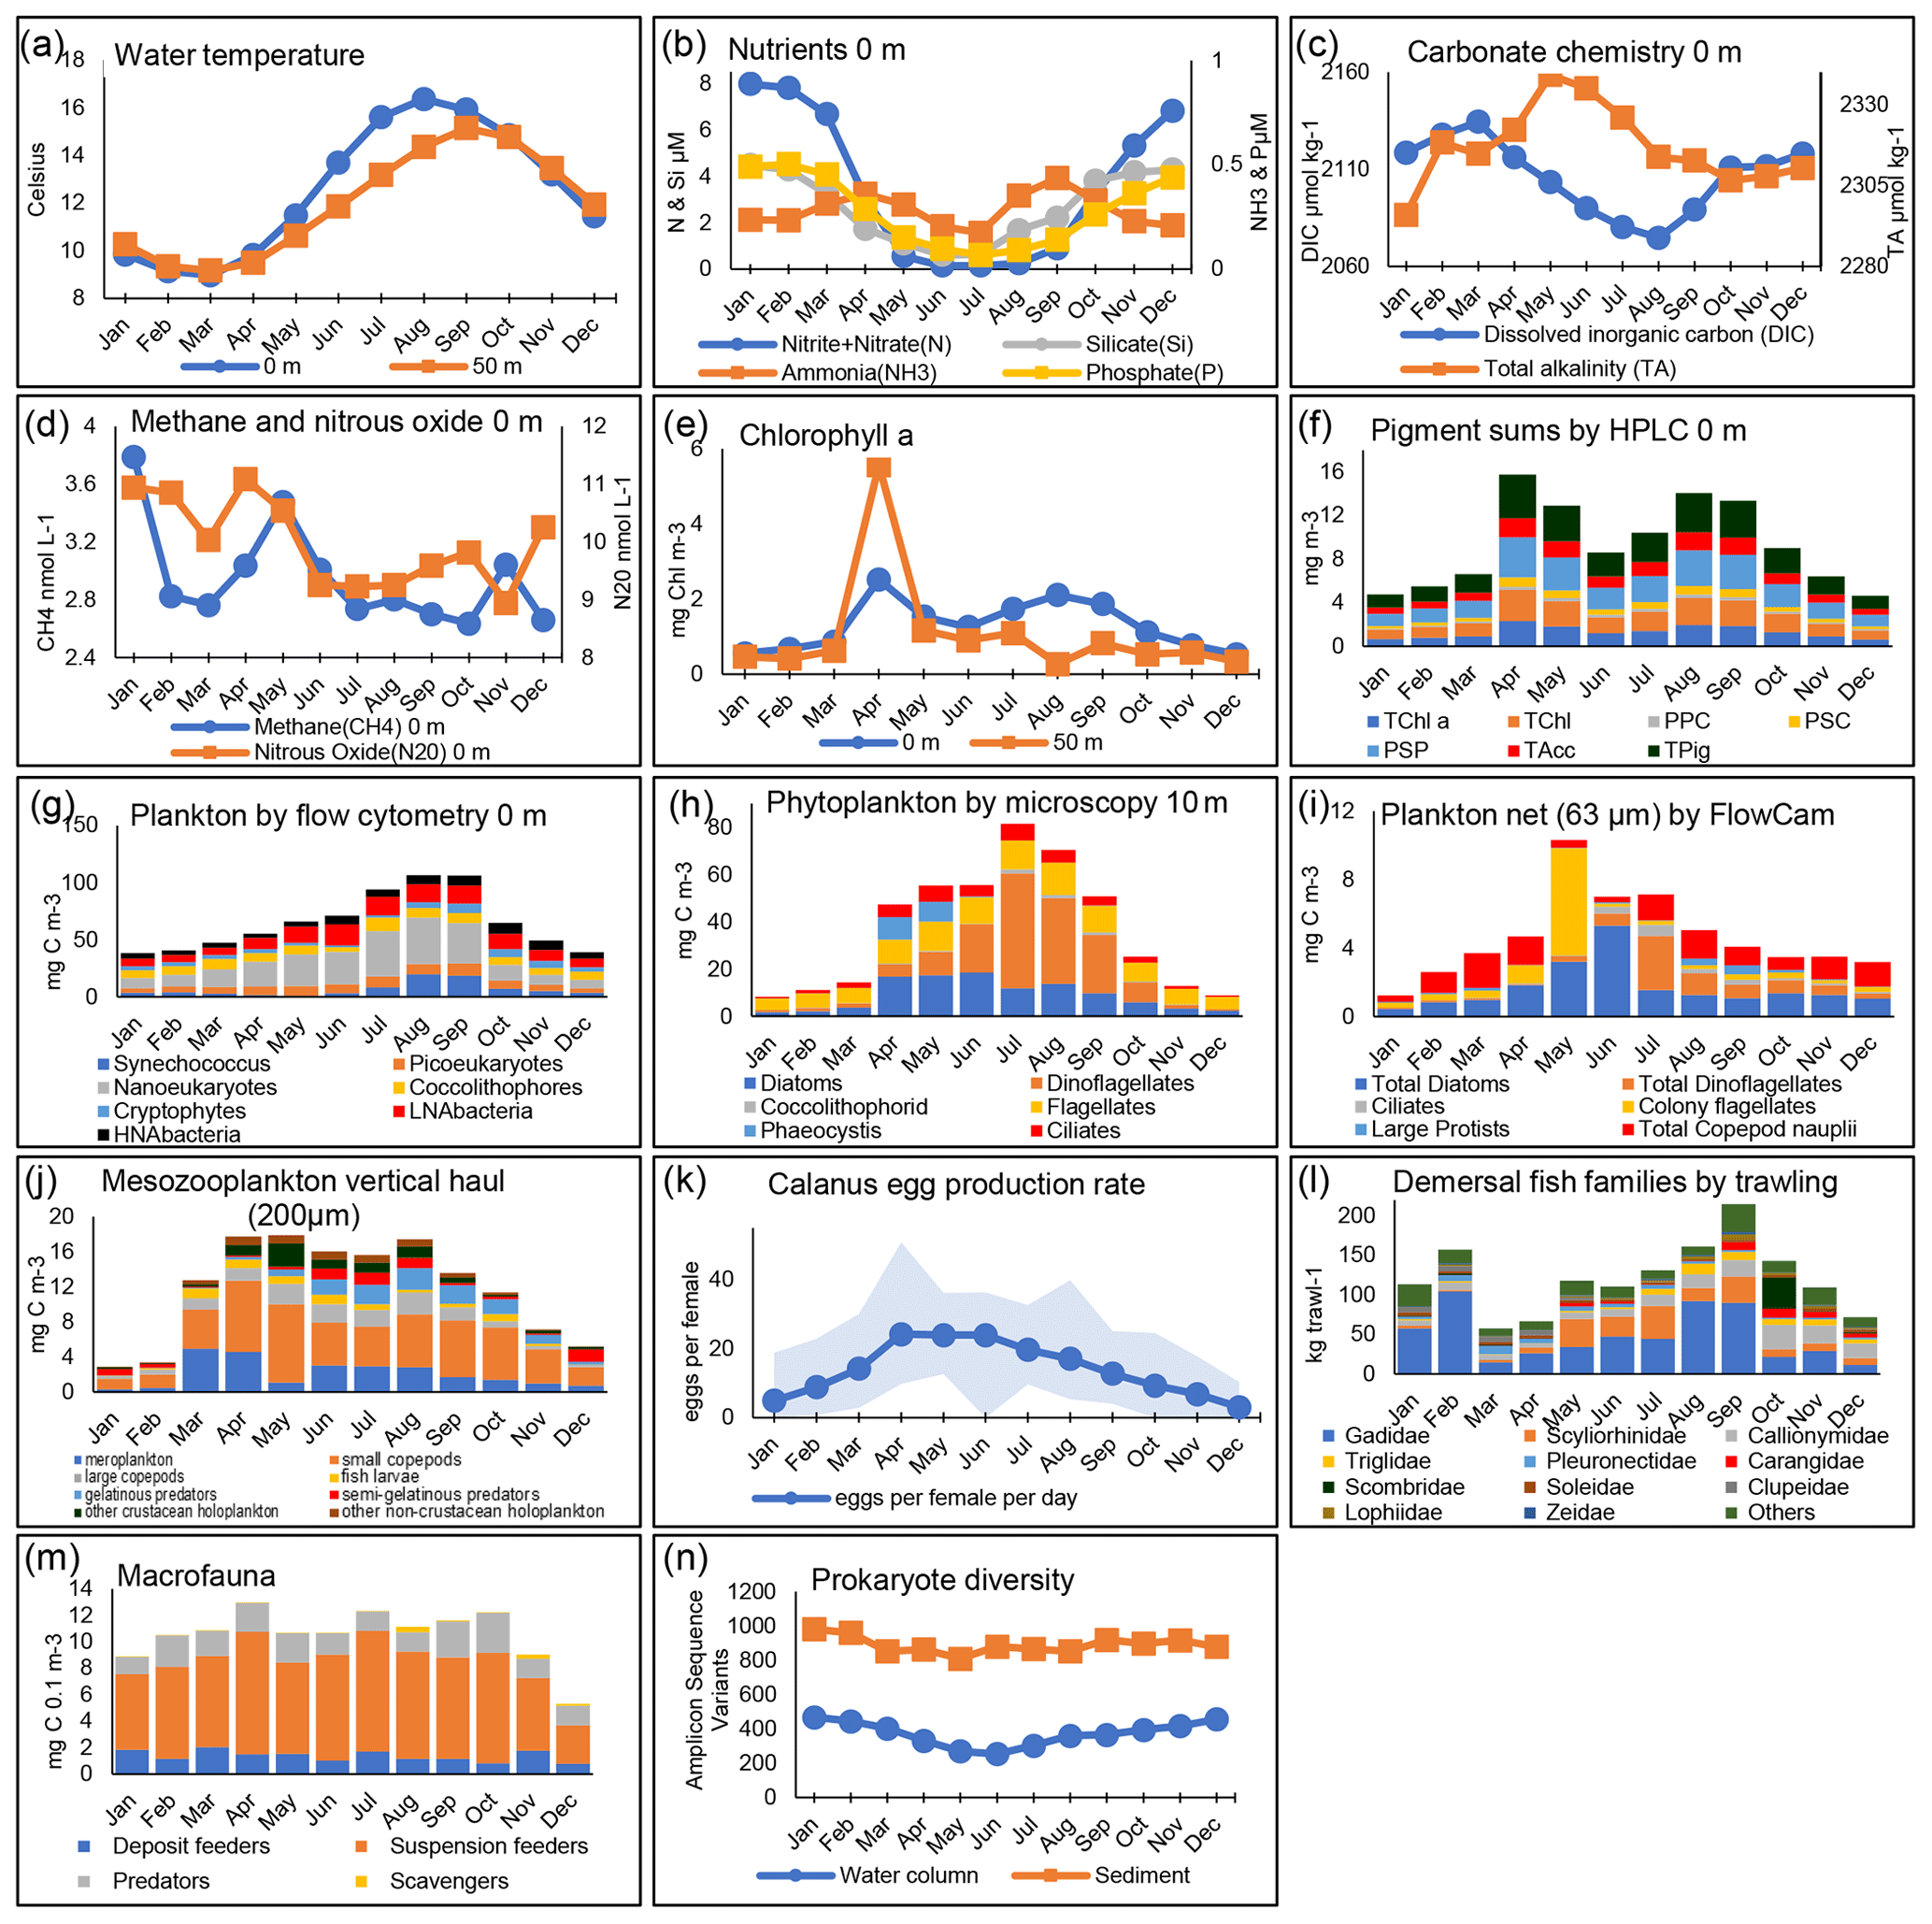
Figure 4Seasonal patterns at station L4. The panels show monthly mean values calculated across all years of available data, presented for the surface (0 m) unless otherwise stated. For explanations of all data fields, see Table A1. In panel (f), the categories show different pigment sums (see Table A1). Panel (g) presents the biomass of plankton using flow cytometry derived using conversion factors from Table 1. In panel (k), the Calanus spp. females are collected from net samples. In panel (l), the fish families plotted here are for the 11 top-ranking groups based on annual mean biomass, with remaining groups (including Cephalopoda) summed here as “others”.
5.3 Overall seasonality: E1 and L5 in comparison to L4
Figure 5 summarizes the data available for the E1 and L5, which are sites located further offshore than L4. All measurements except those from the Young Fish Trawl and the shark catch data pertain to the E1 site. The Young Fish Trawl data are from site E1 and L5 combined. The shark data are from angling vessels from Looe and within 10 nmi of E1.
The E1 site is more strongly stratified than L4, as evidenced by slightly higher surface temperatures and a larger summer temperature difference between the surface and depth. As the site is further offshore than L4 and receives less riverine nutrient input from the Tamar and Plym rivers, macronutrient concentrations are more severely limiting in summer and, indeed, iron stress has been suggested in some seasons (Schmidt et al., 2020). This is also reflected in the stronger reduction in dissolved inorganic carbon (DIC) during the stratified period, resulting in an average seasonal amplitude of 83 µmol kg−1 at E1 compared with around 55 µmol kg−1 at L4. Total alkalinity (TA), in contrast, shows little seasonal cycle at E1 (average seasonal amplitude of 29 µmol kg−1), compared with a slight increase in spring at L4 (average seasonal amplitude of 40 µmol kg−1). Both L4 and E1 show a seasonal pattern of seawater CO2 undersaturation between January and August, followed by supersaturation in September and October, returning to near equilibrium with the atmosphere for the remainder of the year (Kitidis et al., 2012). The subsurface chlorophyll-a maxima has been shown to be important for controlling carbon fluxes at these sites as well as for the mixing of freshwater, which is evidenced by the difference between L4 and E1 conditions (Kitidis et al., 2012). The flow cytometry data reflect this (Fig. 5), with an increased contribution of coccolithophores compared with L4, albeit with pronounced interannual variability and large blooms in some years but not others.
Although phytoplankton and zooplankton samples are currently collected at E1, we have not summarized them in this paper because the available time series of data do not cover as long a period as L4. However, a summary of phyto- and zooplankton seasonality at E1 is presented and compared with that of L4 by Djeghri et al. (2018). These authors showed that mesozooplankton biomass at E1 is lower than at L4 and at deeper, offshore sites in the Celtic Sea (Giering et al., 2019). Also, in the context of these Celtic sea stations, Schmidt et al. (2020) examined nutrient dynamics at E1 in relation to pico- and nanoplankton and found that late-season dominance of the picocyanobacteria Synechococcus (including intense blooms in some years) tended to follow summers of particularly severe nitrate stress.
Data compiled here from the Young Fish Trawl (Fig. 5d) show strong summer and autumn increases in sardine (hereafter called by their more locally common name “pilchard”) eggs. The later autumn spawning period has become more dominant in recent years (Coombs et al., 2010). Fish eggs of other species, by contrast, are more abundant in early spring. Calanus spp. are not quantitatively sampled by the 700 µm mesh of the Young Fish Trawl, but Fig. 5d shows an increase in mid-summer, which is in line with Fig. 4j, where the biomass of the large-copepod fraction is dominated by Calanus spp. This genus comprises mainly C. helgolandicus in this area (Lindeque et al., 2013; Maud et al., 2015, 2018), which are important food for pelagic fish. Success in catching blue sharks (Prionace glauca) increases rapidly until late summer.
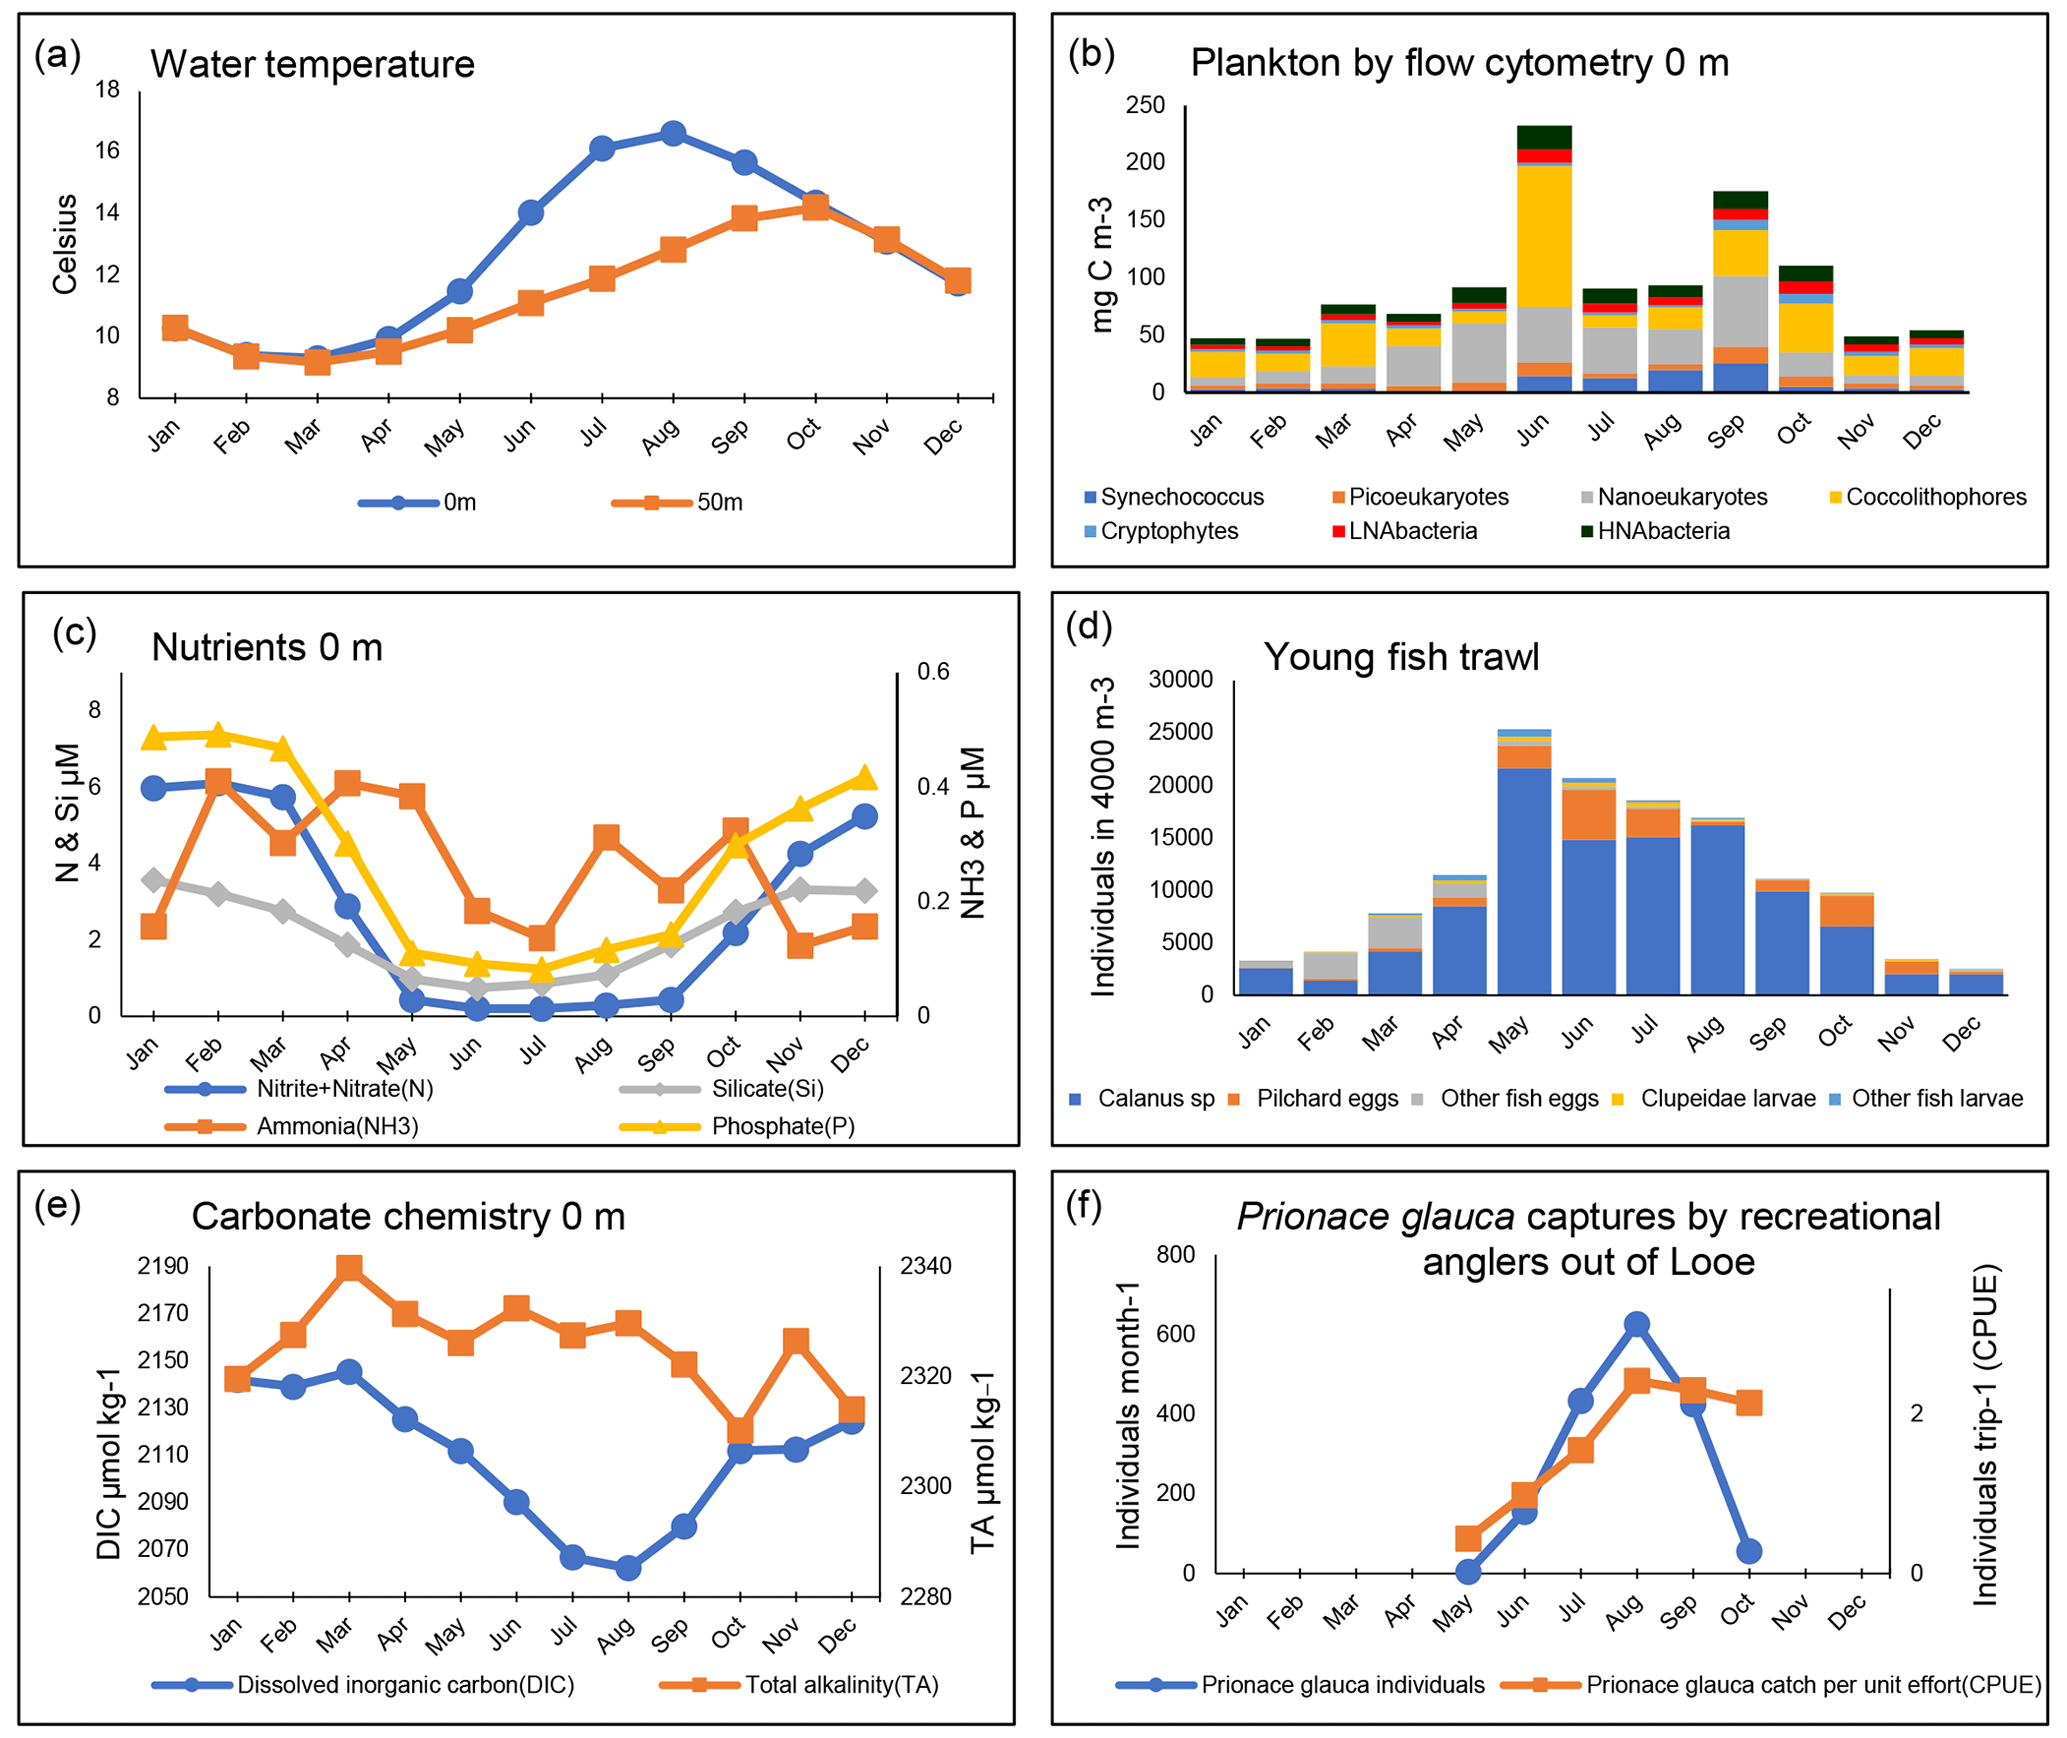
Figure 5Seasonal patterns at station E1 and L5 (1903–2021): monthly mean values calculated across all years of available data. Illustration shows surface (0 m) data unless stated. For explanations of all data fields, see Table A2. Panel (b) shows the biomass of plankton by flow cytometry derived using conversion factors from Table 1. Panel (d) presents a Young Fish Trawl oblique tow to a depth of 5 m above the seabed.
5.4 Annual time trends: L4
The regular weekly resolution measurements at L4 cover the most recent era of rapid warming (Fig. 2), and both the sampling intensity and the number of planktonic taxa measured allow observation of systematic change and its driving factors. We cannot review all of the literature on change here; therefore, instead, Fig. 6 illustrates some of the key trends.
Because stratification is such a major factor driving seasonality at the WCO, Fig. 6 compares trends separately between the most stratified quarter of the year with the lowest average nutrient concentrations (May–August) and the rest of the year. The temperature increase during the warm, stratified period over the last 30 years is more pronounced than in the other months and is well over 1 ∘C. The sharp rise in temperature at this time of year coincides with a major decline in nitrate concentrations and DIC, pointing to the effects of enhanced stratification retarding nutrient and carbon supply (Fig. 6a).
Figure 6b compares the trends for surface chlorophyll-a concentrations and the biomass-dominant functional groups of phytoplankton, which together dominate the estimated biomass of cells counted in water samples from 10 m depth preserved in Lugol's solution, namely, diatoms, dinoflagellates and nanoflagellates (ca. 15 µm). Flagellates (ca. 2–15 µm) are also counted more quantitatively and with full-water-column resolution by flow cytometry (since 2007), and the component fluorescing and non-fluorescing groups (termed nanoflagellates and heterotrophic flagellates, respectively) are major contributors to community dynamics (Atkinson et al., 2021; Tarran and Bruun, 2015). The larger phytoplankton, namely, diatoms, dinoflagellates and the subset of larger nanoflagellates, decline strongly during the summer stratified period, with the chlorophyll-a concentration declining by about 50 % overall over 30 years.
In parallel with these summer declines in phytoplankton, there have been declines at the same time of year in the crustacean mesozooplankton functional groups, namely, large and small copepods, other crustacean holoplankton (dominated by Podon spp. and Evadne spp.) and fish larvae (Fig. 6c). The large-copepod category (defined here as an adult total body length over 2 mm) is strongly dominated by Calanus helgolandicus. From 1988 to around 2015, annual abundances of C. helgolandicus were fairly stable, only oscillating about 4-fold between years (Atkinson et al., 2015; Maud et al., 2015). However, in recent years, numbers in summer have started to decline substantially, making it hard to obtain sufficient individuals for egg production experiments. This sudden shift supports the concept of abrupt step changes that “reorganize” assemblages both at this site (Reygondeau et al., 2015) and more widely (Bode, 2023).
Outside of summer, these declines in the crustacean groups were not seen or were not so prevalent in other months, and there was only a weak phenological shift observed at L4 (Atkinson et al., 2015; Uriarte et al., 2021), which does not explain the differential trends between the summer and the rest of the year.
Other taxa, by contrast, have tended to increase at L4. Only a minority of major crustaceans have shown signs of an increase, notably the more carnivorous, late-summer copepod Centropages typicus (Corona et al., 2021). The main increases are among meroplankton taxa, fine-mesh filter feeders such as appendicularians (which dominate the “other non-crustacean zooplankton” category) as well as the gelatinous predators (dominated by cnidarians) and semi-gelatinous predators (dominated by chaetognaths). Together, this suggests a shift in the balance of the mesozooplankton, from copepod domination towards a diversity of mero- and holoplankton that are fine-particle feeders, more gelatinous or more carnivorous.
These trends seen at L4 conform to much wider-scale, long-term trends that are coherent across the north-eastern Atlantic and north-western European shelf. They are even broadly similar to those at the Naples Bay monitoring site over a similar timescale (Mazzocchi et al., 2023). As an example, the meroplankton increase is widespread across the north-western European shelf and north-eastern Atlantic (Bedford et al., 2020; Holland et al., 2023), and the trends seen at L4 in summer generally resemble the wider trends seen, particularly to the west of the UK (Schmidt et al., 2020; Holland et al., 2023). As a cause, one recent hypothesis involves a bottom-up mechanism whereby increased summer nutrient stress favours pico-size cells and cyanobacteria such as Synechococcus which have a low polyunsaturated fatty acid (PUFA) content and poor nutritional quality. This was suggested to cause a mismatch with the energy demands of crustacean zooplankton grazers at the warmest time of year when their metabolic rates are highest (Schmidt et al., 2020). However, this does not explain the increasing abundance of carnivores or meroplankton, and to fully understand the causes of these trends, time series such as these need to be networked with those from other sites (O'Brien et al., 2017).
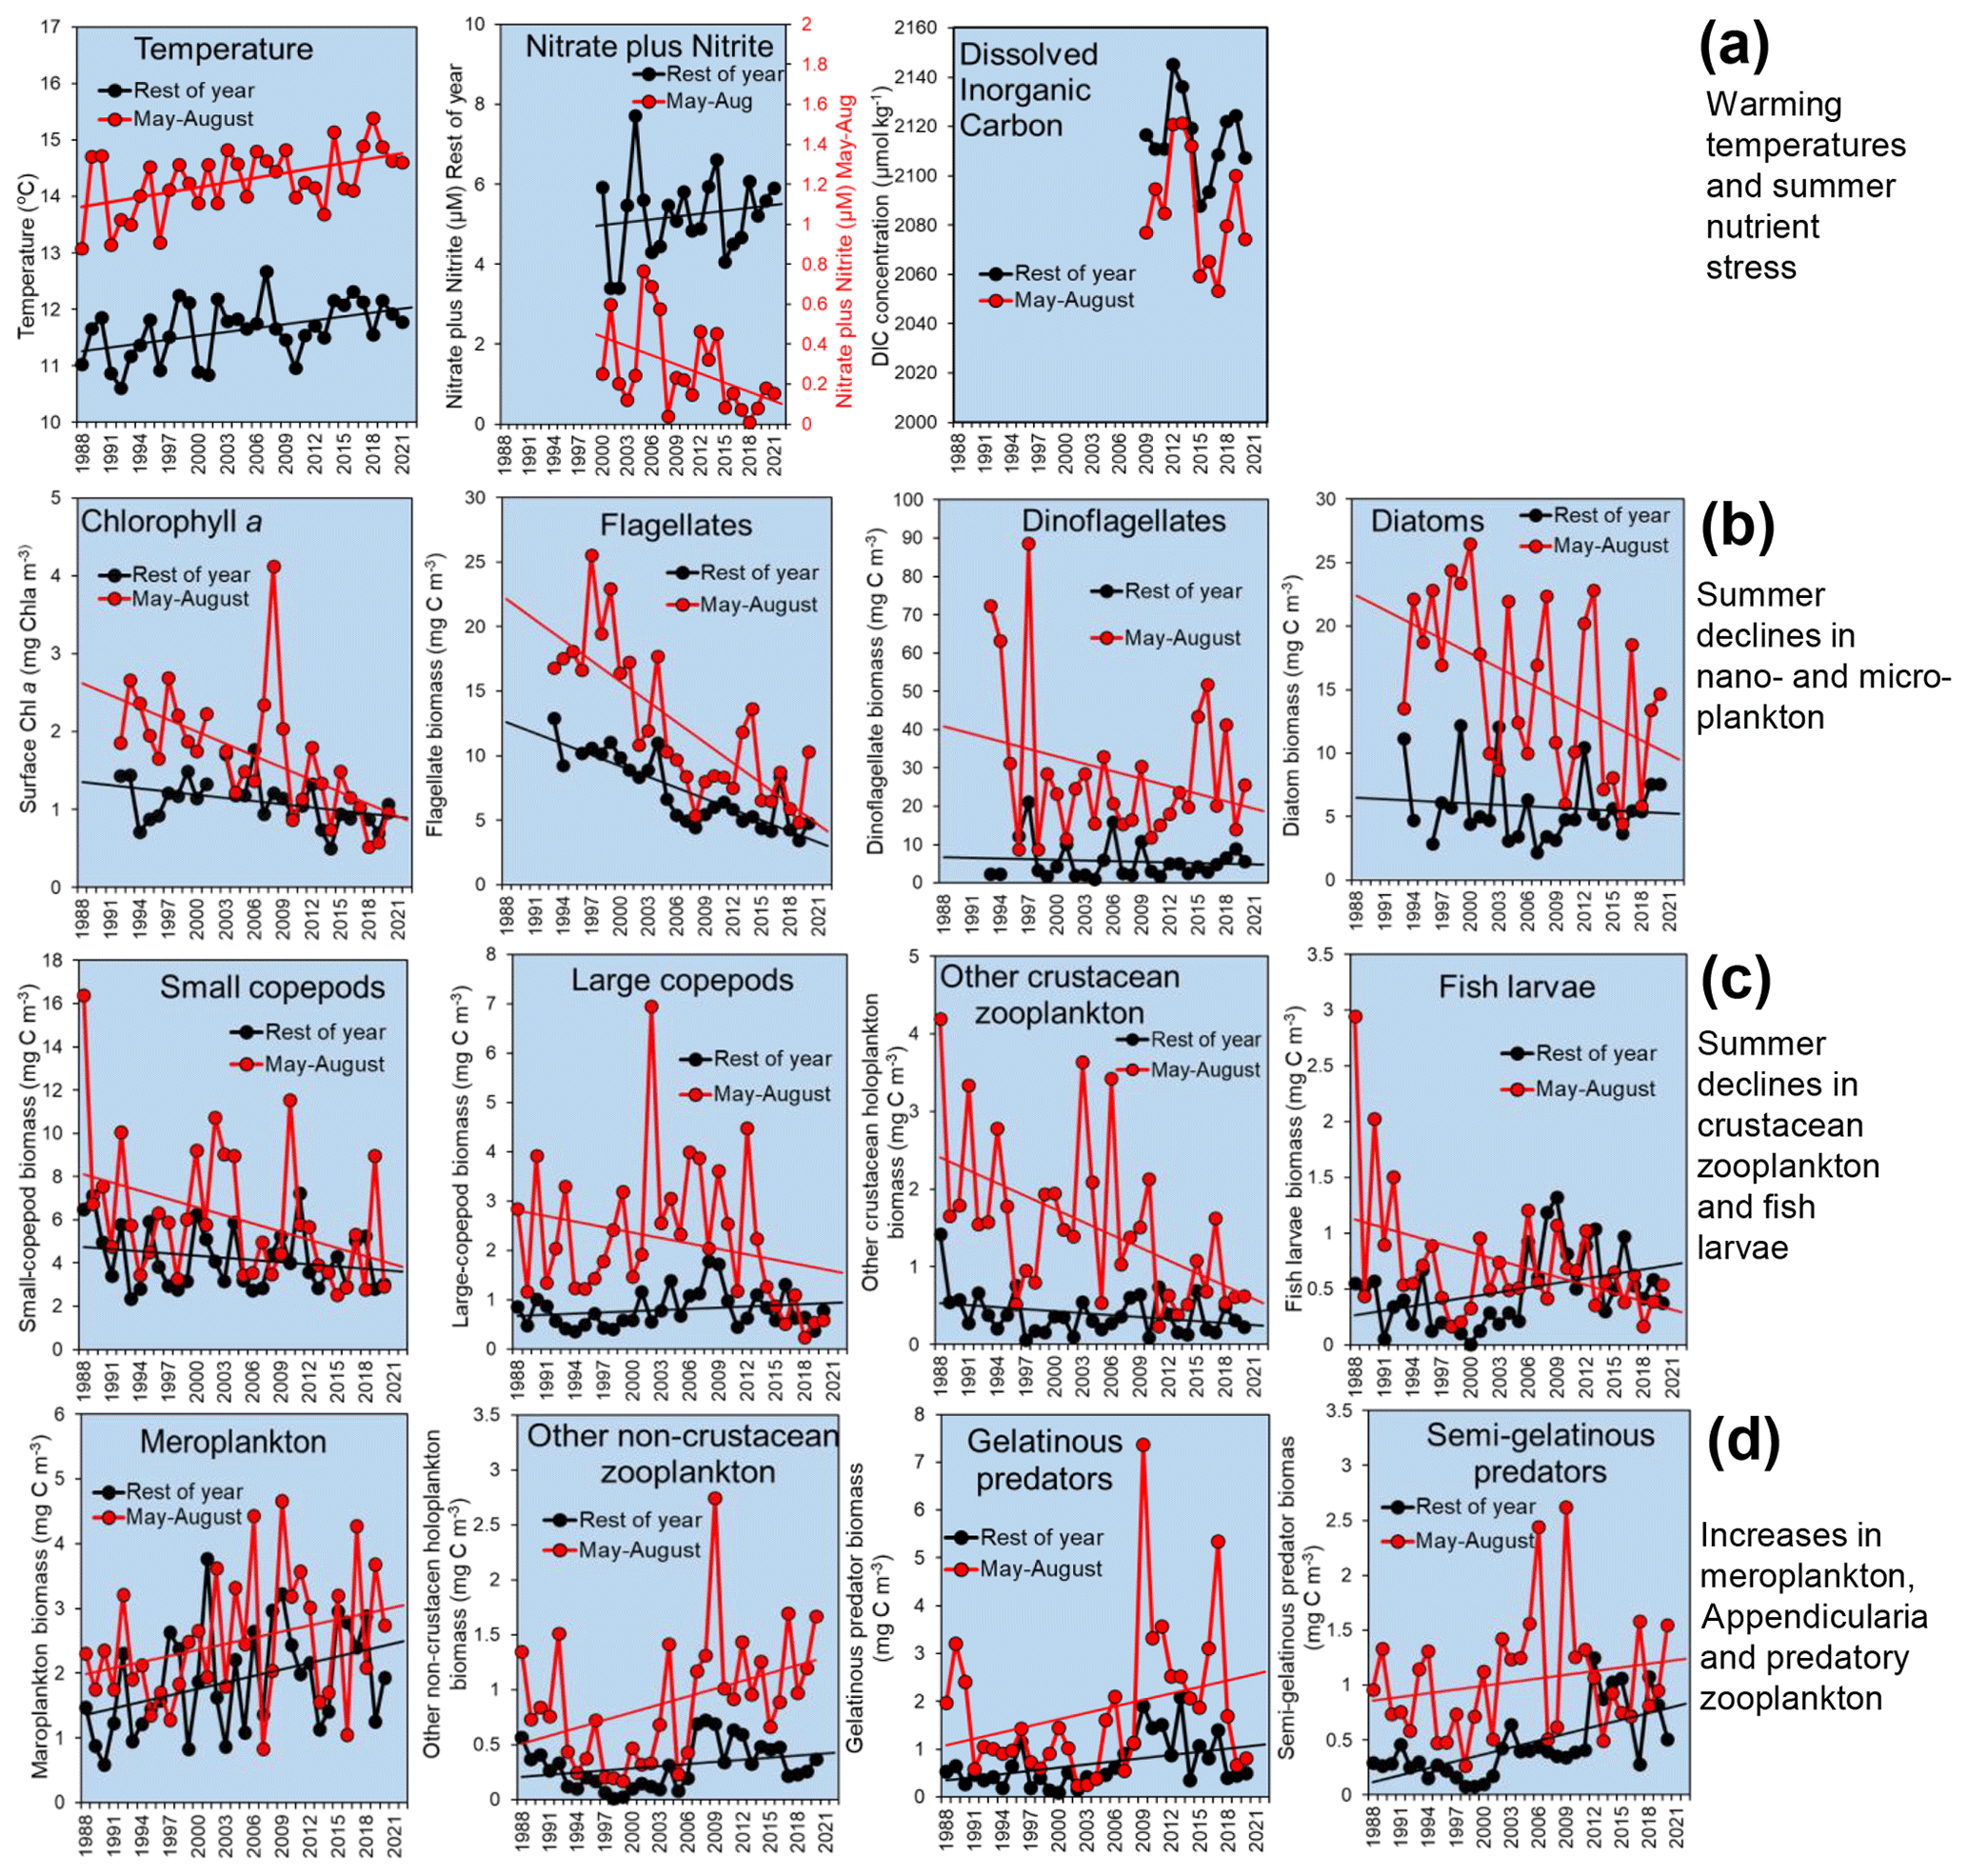
Figure 6Example plots of L4 time series showing major changes. Each data point represents an annual mean of the monthly values, averaging the main summer stratified period (May–August, red) and the rest of the year (black): (a) temperature, surface nitrate and nitrite, and DIC; (b) phytoplankton, including surface chlorophyll-a (Chl-a) concentrations and biomass of the dominant phytoplankton functional groups counted in water samples from 10 m depth preserved in Lugol's solution; (c) mesozooplankton of the “classical food web” that have declined in summer, namely, crustaceans (dominated by Copepoda) and fish larvae; and (d) biomass of key taxa that have increased, including meroplankton, other holoplankton (dominated by Appendicularia), semi-gelatinous predators (dominated by Chaetognatha) and gelatinous predators (dominated by Cnidaria). Missing months within these time series have been replaced by overall long-term mean values for the missing month. Trend lines (drawn for data with >20-year time spans) are illustrative linear regressions and do not necessarily imply statistical significance.
5.5 Overall time trends: E1
The E1 site has the longest history of measurements at the WCO and has exemplified progressive technological advances in measuring macronutrients and primary production (Southward et al., 2005). It has also been a testing ground for theories on how climatic variability impacts nutrients and, thus, phytoplankton, cascading up to fish. The “Russell cycle” (Cushing, 1976) was a good example of these progressive ideas which suggested that reduced Atlantic inflows of limiting nutrients (Kemp, 1938) reduced primary production and caused a shift from a herring-dominated ecosystem in the first few decades of last century to one dominated by pilchards in the mid-1930s. Some of these ideas about the mechanism of the Russell cycle have since been revised (Southward et al., 2005); nevertheless, a degree of cyclicity in temperature and nutrients is clear in Fig. 7a, and this is manifested in major cycles of higher trophic levels (Fig. 7b, c).
A major problem when interpreting these long time series is the attribution of cause from correlative-type analyses (Bedford et al., 2020). However, the rapid rise in pilchards after the collapse of the herring fishery may be due to a combination of overfishing and climatic factors (Southward et al., 2005). Similarly, the intensive industrialized pelagic fishing for mackerel and pilchards in the 1970s and its sudden collapse due to overfishing in the 1980s has unknown effects on the trajectories of fish illustrated in Fig. 7c.
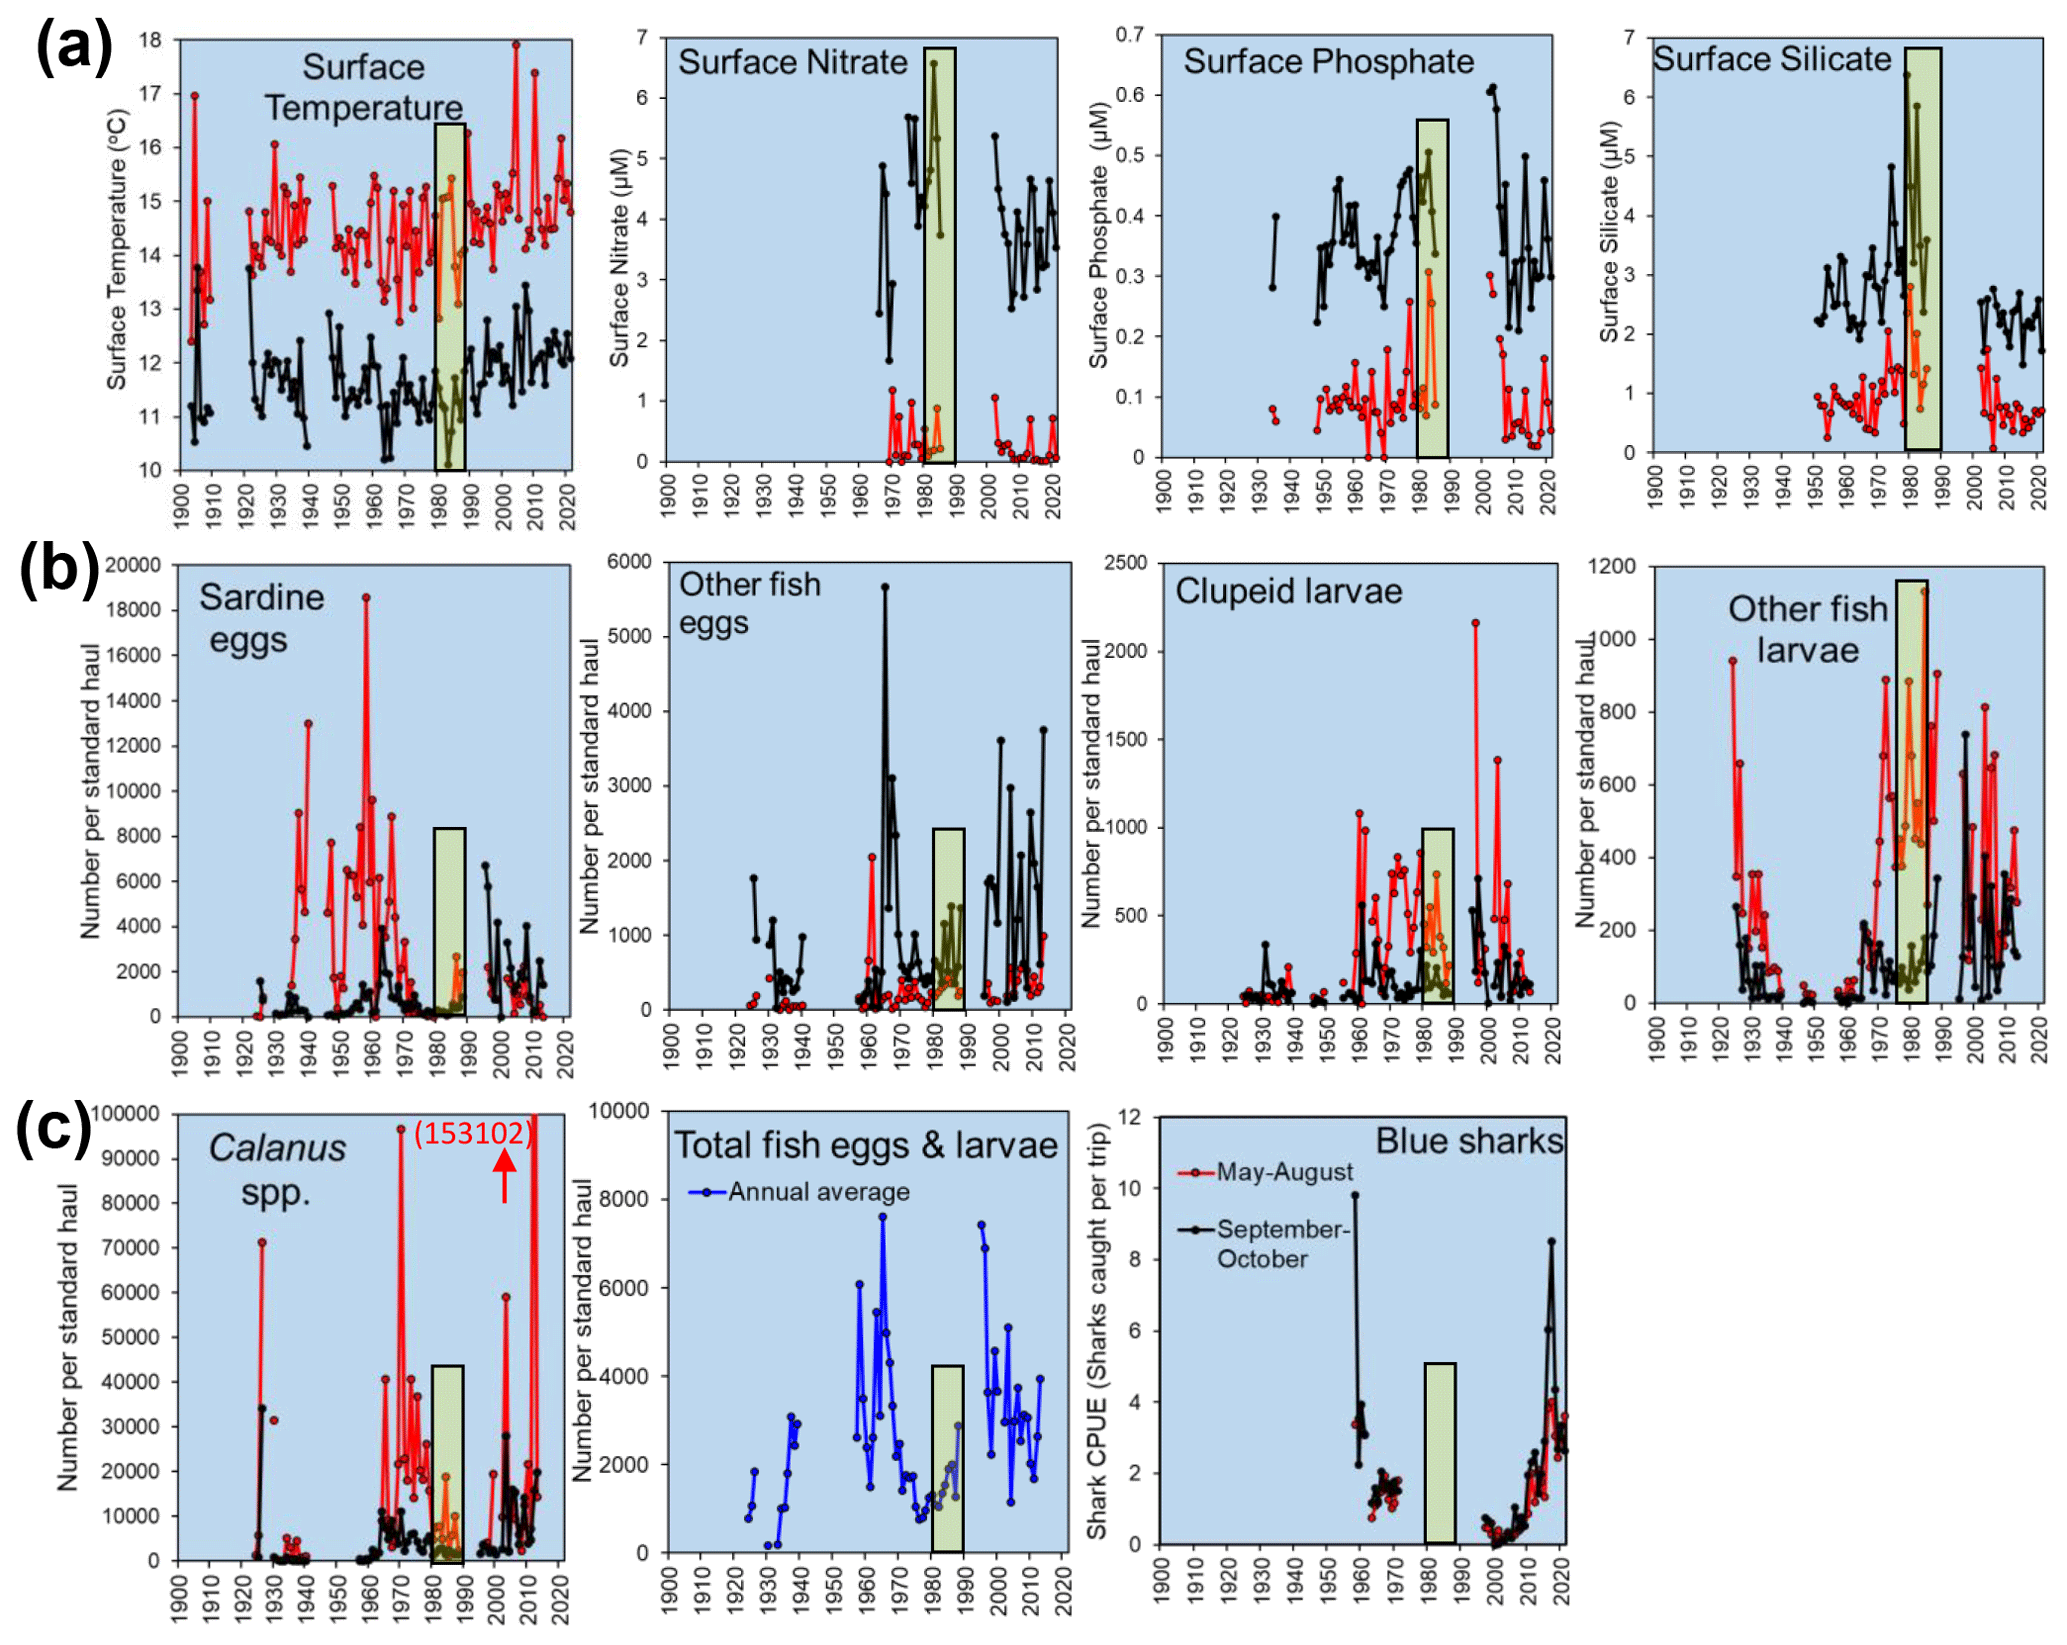
Figure 7Examples of long time series from stations L5 and E1 from the Western Channel Observatory. Points represent averages of monthly values from the main stratified months (May–August, red) and the rest of the year (black): (a) temperature and nutrients; (b) catches per “standard haul” of the Young Fish Trawl, showing four categories of fish eggs and larvae with standard haul volumes, standardized to a filtration volume of 4000 m3; and (c) respective panels showing the catches of Calanus spp. from the Young Fish Trawl, the annual mean values for total fish caught in the Young Fish Trawl (all four categories in panel (b) but screened such that records with absent data for any of the four categories were removed) and annual means calculated based on a mean of all available monthly data, and the Blue shark (Prionace glauca) catch per unit effort (mean catch per trip from angling boats from Looe fishing within 10 nmi of E1). Yellow bars mark the 1980s for ease of cross-referencing between plots. The 1980s marked major changes, including the onset of rapid warming, the end of a period of intense pelagic trawling off Plymouth and the cessation of funding for many monitoring programmes (including the WCO).
5.6 Calanus spp. egg production experiments at L4
Although rate measurements have periodically been made at the WCO, such as primary production (Barnes et al., 2015) and grazing (Bautista and Harris, 1992; Fileman et al., 2010), measurements of the Calanus spp. egg production rate have been made fairly consistently since 1992 (Fig. 8). This makes it one of the longest zooplankton production time series of its kind (Harris, 2010) and offers valuable insight into both food quantity and quality for grazers and the population dynamics of Calanus helgolandicus (Green et al., 1993; Irigoien et al., 2000). While the original weekly data are archived at the British Oceanographic Data Centre (BODC), the monthly values averaged here (i.e. a mean of the weekly average rates) provide a good seasonal and long-term comparison with the respective monthly average water temperature and functional groups of phytoplankton.
A series of publications have used these Calanus spp. egg production data and have supplied extra supporting information. Examples include the importance of nutrition in Calanus spp. reproduction (Pond et al., 1996); the role of stratification, egg sinking and mortality (Irigoien and Harris, 2003); and the interaction among temperature, food and predators on population dynamics (Bonnet et al., 2005; Cornwell et al., 2018; Maud et al., 2015, 2018). Long-term changes in the phenology and rates of Calanus helgolandicus egg production have not been studied recently, but these show some interesting patterns (Fig. 8). Until roughly 2006, there was a clear maximum in the egg production per female during the spring bloom months, but this moved later into the summer and autumn months over the following 15 years, with a general decline in the maximum rates. In the last couple of years, however, there have been suggestions that a pattern of high egg output in spring may be reasserting itself.
Figure 8Heatmap of the mean egg production rate of Calanus helgolandicus. Pending suitable weather conditions for L4 sampling and enough adult females to incubate, experiments were run weekly: 25 female Calanus helgolandicus were incubated for 1 d in egg production chambers, and eggs were then counted. Red cells represent the highest egg production, blue cells represent the lowest egg production, and cells with crosses denote that no data were available.
5.7 Carbonate chemistry measurements
Over a decade's worth of data are now available for the carbonate chemistry at both L4 and E1, which have been used to provide evidence for a number of assessments relating to ocean acidification, including the Convention for the Protection of the Marine Environment of the North-East Atlantic (OSPAR) QSR2023 Ocean Acidification assessment (McGovern et al., 2023) and the recent Marine Climatic Change Impacts Partnership (MCCIP) 2022 Status on Ocean Acidification around the UK and Ireland (Findlay et al., 2022). The data series are one of just two stations' time series that record carbonate chemistry parameters in the UK at this frequency and are submitted as part of the UK's contribution to the UN Sustainable Development Goal Indicator 14.3.1 for ocean acidification.
Over the full time series for L4, there has been an overall decline in both total alkalinity (TA) and dissolved inorganic carbon (DIC), which has resulted in an increase in CO2 fugacity (fCO2) of 6.4 µatm yr−1 and a decrease in pH of yr−1. If the 2021 data are excluded, the decrease in pH is slightly slower at −0.006 yr−1 (Findlay et al., 2022), demonstrating a significant lowering of pH in 2021, a result of a decrease in alkalinity and a large reduction in salinity (monthly analysis from same sampling points as carbonate chemistry gives a decline over the time series of psu yr−1; Gonzalez-Pola et al., 2022). This rate of pH decline is faster than rates observed in the open ocean but is similar to rates found in other near-shore locations off the French coast in the western English Channel and Bay of Biscay (McGovern et al., 2023). Interestingly, the aragonite saturation state shows no significant trend at L4, most likely resulting from the concomitant decline in both DIC and TA as well as the high level of variability in TA caused by organic alkalinity inputs from local rivers. At station E1, there has been a greater decline in DIC, a similar decline in TA and a slightly slower decline in pH (when including 2021 data, this value is yr−1).
Since autumn 2017, additional water column measurements have been taken at L4, providing a profile view of the carbon dynamics. As a case study, we show the profiles between 2018 and 2020 here, including both 2018 and 2020 (Fig. 9). There is a clear relationship between the in situ density anomaly (σt) and both DIC (DIC (µmol kg−1) , r=0.7184, n=144, p<0.0001) and TA (TA (µmol kg−1) , r=0.4118, n=144, p<0.0001). The in situ density anomaly at L4 is primarily driven by temperature, although salinity is important for the dilution of carbonate parameters at this site. The σt represents the seasonal cycle of winter mixing followed by stratification through the spring and summer and breakdown of stratification again in the autumn. Both DIC and TA are generally at similar concentrations throughout the water column, with DIC being reduced in the upper mixed layer during stratification and corresponding to the subsurface chlorophyll blooms (Fig. 9). TA has much higher variability as a result of organic alkalinity contributions.
Data on suspended matter and particulate carbon compounds have also been collected at the WCO during different times over the years. As shown in Rühl et al. (2021), the concentration of particulate organic carbon (POC) at a depth of 10 m at L4, measured between 2013 and 2017, is highly seasonally variable but decreases overall over the 4-year period. It is unclear whether this is part of a more long-term cyclical pattern or a true temporal trend in the data. Variability in the particulate suspended matter concentration in general is less seasonal and does not conform to any clear trend throughout the same time period (Rühl et al., 2021).
Figure 9Depth profiles of (a) chlorophyll, (b) density, (c) dissolved inorganic carbon (DIC) and (d) total alkalinity (TA) at station L4 between 2018 and 2021.
6.1 Numerical modelling
Long-term time series like the ones reported here have been paramount in shaping our understanding of biogeochemical cycling and plankton dynamics (Benway et al., 2019). Not only have they provided the necessary data consistency to generate hypotheses to progress our understanding of marine ecosystems, but they have also been critical to the advancement of our capacity to model the complex interactions between environmental and plankton dynamics. The breadth of ecosystem components that are measured routinely at the WCO has enabled a form of digital hypothesis testing using biogeochemical and plankton models (Polimene et al., 2014) comparable to the more traditional approach to hypothesis testing through experimental work under controlled laboratory conditions. The WCO time series have contributed to a broad range of developments of the European Regional Seas Ecosystem Model (ERSEM) originating from testable hypotheses. These include the photophysiological control of plankton succession (Atkinson et al., 2018), the role of food quality on plankton blooms (Polimene et al., 2015), the bacterial carbon pump (Polimene et al., 2017) or the role of mixoplankton in plankton succession dynamics (Leles et al., 2021). Models can also represent a key source of information (a concept generally referred to as data augmentation) for the interpretation of time series. For example, operational models, such as the Western Channel Observatory Operational Forecast (WCOOF) model (Torres and Uncles, 2011), can be used to reconstruct back trajectories of plankton samples to explain community variations or assist in the evaluation of carbon sequestration estimates (Queirós et al., 2023). Models like WCOOF can also be used to interpolate environmental conditions to explain observed plankton shifts (e.g. rapid changes to weak stratification not captured by the time series' sampling frequency) or to interpolate sparse measurements (Sims et al., 2022). Ultimately, models can also inform and optimize observational approaches, e.g. primary production estimation from oxygen / argon ratios and oxygen isotopes.
6.2 The WCO contribution to wider observing networks to report on ocean health
Marine time series such as those provided by the WCO form an important component to a series of wider networks for reporting on pelagic and benthic ecosystem status, and these networks span a range of scales. At the smallest scale of the south-western UK, the Western Channel Observatory observations form important contributions to the annual Southwest Marine Ecosystems Annual Reports (Smyth, 2022; Atkinson et al., 2022). At the UK scale, WCO data inform on regional-scale trends in plankton as part of the Marine Climate Change Impacts Partnership (Edwards et al., 2020; Findlay et al., 2022) and the plankton data contribute to Indicator C5 within the UK's 25 Year Environment Plan. At a slightly wider scale (north-western European shelf and north-eastern Atlantic), the WCO data form part of the policy reporting to meet statutory UK policy obligations under the UK Marine Strategy and OSPAR, for example in relation to carbonate chemistry (McGovern et al., 2023) or pelagic habitats (Ostle et al., 2021; Holland et al., 2023).
One advantage of the WCO plankton data is that they are both relatively complete in terms of taxonomic resolution and that they span multiple decades, which has enabled their use as a test bed dataset for developing indicators (McQuatters-Gollop et al., 2019), to examine how representative single sampling stations are of wider areas (Ostle et al., 2017) and to develop indicators that include the full suite of plankton, including major groups such as gelatinous species and picoplankton, which are not included as indicators from other longer-term monitoring programmes (such as the Continuous Plankton Recorder). At wider ocean basin scales, the Western Channel Observatory data contribute to a series of reporting networks, for example oceanography, through ICES Report on Ocean Climate (IROC; Gonzalez-Pola et al., 2022) publications, or plankton, through the International Group of Marine Ecological Time series (IGMETS; O'Brien et al., 2017). Because the WCO spans a small area, building these wider networks of time series is a vital tool to understand the spatial–temporal imprint of climate change amid other, more acute and localized stressors (Ratnarajah et al., 2023).
6.3 The future: melding new technological developments with existing long time series
Most of the longer time series of data that we provide here have been collected with traditional techniques that require direct collection of samples, their transport to the laboratory, and subsequent expert chemical or taxonomic analysis. These methods are expensive and time-consuming; for this reason, time series worldwide are under threat from funding cuts and loss of expert taxonomists (Vucetich et al., 2020). Concurrent with this, new techniques are being developed for time series, for example, underway autonomous vehicles or remote collection of data with acoustic methods or data from moorings are processed by automated particle imaging using machine learning particle classification. Likewise, there is much interest in the development of molecular (e.g. eDNA) approaches to observing plankton.
Some of these newer “big-data” approaches are now being developed at the WCO. The NERC-funded “Automated in situ Plankton Imaging and Classification System” (APICS) project represents the first in situ co-deployment of an Imaging FlowCytobot (McLANE Research Laboratories, Inc.) and a plankton imager (Pi-10; Plankton Analytics Ltd.) in the world. APICS will generate abundance and diversity data for organisms spanning 3–4 orders of magnitude in size, i.e. 5 µm–20 mm, on hourly timescales, which will allow a ca. 100-fold increase in phyto- and zooplankton sampling frequency at station L4 in 2024. APICS will allow critical plankton data to be collected at the same temporal resolution as physical and chemical variables. The establishment of an in situ imaging time series of plankton and particles at station L4 will also facilitate the collection of highly temporally resolved pelagic suspended particulate matter/particulate organic carbon (POC) concentration data, using image-based POC estimation methods that are currently being refined (Giering et al., 2020; Saskia Rühl, unpublished data). Likewise, molecular metabarcoding approaches are being developed and tested alongside traditional techniques (Lindeque et al., 2013; Parry et al., 2021), with eDNA time series being run alongside conventional sampling (Karen Tait, unpublished data).
The WCO's rich background of contextual data, relative ease of accessibility and concurrent exposure to large wave amplitudes from the south-western weather systems also make it an ideal testing ground for new technology, and this development is currently highly active, with Smart Sound Plymouth (https://www.smartsoundplymouth.co.uk, last access: 29 November 2023) providing ambitious new directions in this area.
A common conception of funders and policy-makers is that new moored and autonomous instrumentation will provide a substitute for traditional monitoring that involves the collection of samples and analysis by skilled humans in a land-based laboratory. This may seem like an attractive way of reducing a whole suite of costs, including those for staff time, training of taxonomic skills, and ship time and fuel, as well as the carbon footprint. These new methods, however, produce fundamentally different types of data to traditional approaches. This presents difficulties when melding the data together. This is a key detail, because the detection of climate change responses usually requires multiple decades of data collected in consistent fashion to have sufficient statistical power to detect change. Instead, the new approaches provide novel insights, often at much higher temporal and spatial resolution than traditional methods, better suited to capturing delicate organisms (Cross et al., 2015), vertical structure (Cornwell et al., 2020) or revealing the “hidden” diversity of assemblages through molecular metabarcoding (Lindeque et al., 2013; Parry et al., 2021). This is complementary, rather than alternative, information with respect to ongoing monitoring and provides fresh views on how these ecosystems function. These new technologies provide far more data than can be processed manually, and traditional methods are currently essential for ground-truthing the new data. We hope that sustained observations such as the WCO will embrace the strengths of both traditional and new approaches in the following decades.
The full data and metadata are stored in a reputable UK repository known as DASSH (The Data Archive for Marine Species and Habitats) at the Marine Biological Association, Plymouth: https://www.dassh.ac.uk (last access: 29 November 2023). The data are available via the following link: https://doi.org/10.17031/645110fb81749 (McEvoy and Atkinson, 2023). Upon using this particular version, we kindly request that both McEvoy and Atkinson (2023) and this paper in Earth System Science Data are cited. This paper gives a full description of the methods and, via citations, due credit to the authors who contributed the datasets. Citing the present paper when the data are used also allows standard literature searches to reveal data usage, and this provides valuable evidence to warrant continued funding of the WCO.
In future, we aim to produce more WCO data papers with updated, persistently identified (using DOIs) time series, corrections of any errors and extended data fields. Importantly, some of the older (pre-1988) datasets' time series and metadata held by the MBA were not available for this data paper. We anticipate that later persistently identified versions of the data will be able to include more complete historical data as well as their metadata.
The dataset that we provide here has both strengths and limitations. Its main strength is that it combines, for the first time, data that span from oceanography to sharks and from microbial diversity up to benthic macrofauna and fish. We hope that this is particularly valuable for education purposes – for example, student projects in which the student can spend less time trying to hunt down scattered datasets and melding them together and more time analysing datasets. We have also, if possible, presented the data in units of mass as well as abundance, as this is particularly amenable to carbon budgets (Queirós et al., 2019), biogeochemical studies (Barnes et al., 2015) or models (Kenitz et al., 2017; Polimene et al., 2014). This study also represents the first attempt to put benthic and pelagic datasets together, and we hope that this helps to make the WCO a natural laboratory to study benthic–pelagic coupling. Another advantage of this summary version of the dataset is that it spans over 100 years, with over 3 decades of high-quality data from multiple trophic levels. Because the WCO has witnessed substantial warming and broadly responded in a manner similar to the wider north-western European shelf (Bedford et al., 2020; Schmidt et al., 2020), our summary dataset provides a test bed to study the mechanisms that control seasonality and climate change response across multiple trophic levels.
Our data summary also has a series of key limitations, the first one being its taxonomic resolution. To make our database manageable in size, we have condensed a large species lists (over 400 planktonic taxa alone) into a just a few dozen functional groups. Users wishing to estimate diversity changes or responses of individual key species will need to source the original datasets via the points of contact listed on the WCO data catalogue: https://westernchannelobservatory.org.uk/pelagic_TS.php (last access: 29 November 2023). Likewise, those studying short-term dynamics or “events”, for instance phenology shifts, bloom dynamics or extreme weather, may prefer to access the individual time points, which are typically weekly at L4. Despite this proviso and recommendations that <20 d resolution are needed to reveal phenology shifts (Henson et al., 2018), long-term studies of such phenomena have tended to take the pragmatic approach by averaging irregularly spaced time points into monthly blocks to improve precision, data coverage and to fill data gaps (Atkinson et al., 2021; Barton et al., 2020; Edwards and Richardson, 2004; Fanjul et al., 2018; Uriarte et al., 2021).
A final three requests to users, in addition to correct citation, are as follows: (1) please let us know if you find any errors, (2) please suggest any improvements for the next version, and (3) please let us know if you want to incorporate this dataset into a wider data networking or databasing initiative. This is to ensure that data do not become separated from metadata and that old, outdated legacy versions of the data do not linger on data portals.
Table A1L4 metadata for WCO monthly time series (1988–2022). The information includes sampling and analysis protocols as well as data coverage and links with respect to the availability of the full datasets. Column numbers reference the data sheet available from https://doi.org/10.17031/645110fb81749 (McEvoy and Atkinson, 2023).

Table A2E1 metadata for WCO monthly time series (1903–2021). The information includes sampling and analysis protocols as well as data coverage and links with respect to the availability of full datasets. Column numbers reference the data sheet available from https://doi.org/10.17031/645110fb81749 (McEvoy and Atkinson, 2023).
AJM and AA co-ordinated the project. AJM compiled the monthly database from the component datasets. AA, RLA, RB, IB, ESF, HSF, CLM, AJM, CO, PJS, TJS, GAT, KT, ST and CEW submitted the individual datasets. AJM and AA prepared the manuscript with contributions from HSF, GAT, CEW, SR, RT, AMQ, RLA, RB, ESF, TJS, KT and CO. All authors are either current or previous producers of the component datasets.
The contact author has declared that none of the authors has any competing interests.
Publisher's note: Copernicus Publications remains neutral with regard to jurisdictional claims made in the text, published maps, institutional affiliations, or any other geographical representation in this paper. While Copernicus Publications makes every effort to include appropriate place names, the final responsibility lies with the authors.
We are extremely grateful to the ship's crews for their dedication with respect to sample collection and to the many analysts and taxonomic experts for their help with sample processing; there would be no data without them. The authors wish to thank Jon White for producing the WCO map (Fig. 1). We are also grateful to Emma Sullivan for providing Fig. 2a, containing data sourced from the European Space Agency (ESA) Climate Change Initiative (CCI) project and NERC Earth Observation Data Acquisition and Analysis Service (NEODAAS).
The Western Channel Observatory is funded by the UK Natural Environment Research Council through its National Capability Long-term Single Centre Science Programme, Climate Linked Atlantic Sector Science (grant no. NE/R015953/1). Angus Atkinson and Abigail McQuatters-Gollop were also funded by the Department for Environment, Food and Rural Affairs (Defra) as part of its marine Natural Capital and Ecosystem Assessment (NCEA) pelagic programme: NC34 – PelCap.
This paper was edited by François G. Schmitt and reviewed by two anonymous referees.
Álvarez, E., Lopez-Urrutia, A., and Nogueira, E.: Improvement of plankton biovolume estimates derived from image-based automatic sampling devices: application to FlowCAM, J. Plankton Res., 34, 454–469, 2012.
Atkinson, A., Harmer, R. A., Widdicombe, C. E., McEvoy, A. J., Smyth, T. J., Cummings, D. G., Somerfield, P. J., Maud, J. L., and McConville, K.: Questioning the role of phenology shifts and trophic mismatching in a planktonic food web, Prog. Oceanogr., 137, 498–512, 2015.
Atkinson, A., Polimene, L., Fileman, E. S., Widdicombe, C. E., McEvoy, A. J., Smyth, T. J., Djeghri, N., Sailley, S. F., and Cornwell, L. E.: Comment. What drives plankton seasonality in a stratifying shelf sea? Some competing and complementary theories, Limnol. Oceanogr., 63, 2877–2884, 2018.
Atkinson, A., Lilley, M. K., Hirst, A. G., McEvoy, A. J., Tarran, G. A., Widdicombe, C., Fileman, E. S., Woodward, E. M. S., Schmidt, K., and Smyth, T. J.: Increasing nutrient stress reduces the efficiency of energy transfer through planktonic size spectra, Limnol. Oceanogr., 66, 422–437, 2021.
Atkinson, A., McEvoy, A., Widdicombe, C., Beesley, A., Sanders, J., and Hiscock, K.: Chapter 5 – plankton observations 2021. South-west Marine Ecosystems Report for 2021, in: Marine Biological Association of the UK, Plymouth, edited by: Hiscock, K. and Earll, R., https://doi.org/10.17031/t98y-1806, 2022.
Barlow, R., Cummings, D., and Gibb, S.: Improved resolution of mono-and divinyl chlorophylls a and b and zeaxanthin and lutein in phytoplankton extracts using reverse phase C-8 HPLC, Marine Ecol. Prog. Ser., 161, 303–307, 1997.
Barnes, M. K., Tilstone, G. H., Suggett, D. J., Widdicombe, C. E., Bruun, J., Martinez-Vicente, V., and Smyth, T. J.: Temporal variability in total, micro-and nano-phytoplankton primary production at a coastal site in the Western English Channel, Prog. Oceanogr., 137, 470–483, 2015.
Barton, A. D., Taboada, F. G., Atkinson, A., Widdicombe, C. E., and Stock, C. A.: Integration of temporal environmental variation by the marine plankton community, Marine Ecol. Prog. Ser., 647, 1–16, 2020.
Bautista, B. and Harris, R.: Copepod gut contents, ingestion rates and grazing impact on phytoplankton in relation to size structure of zooplankton and phytoplankton during a spring bloom, Marine Ecol. Prog. Ser., 41–50, 1992.
Bedford, J., Ostle, C., Johns, D. G., Atkinson, A., Best, M., Bresnan, E., Machairopoulou, M., Graves, C. A., Devlin, M., and Milligan, A.: Lifeform indicators reveal large-scale shifts in plankton across the North-West European shelf, Global Change Biol., 26, 3482–3497, 2020.
Benway, H. M., Lorenzoni, L., White, A. E., Fiedler, B., Levine, N. M., Nicholson, D. P., DeGrandpre, M. D., Sosik, H. M., Church, M. J., and O'brien, T. D.: Ocean time series observations of changing marine ecosystems: an era of integration, synthesis, and societal applications, Front. Marine Sci., 6, 393, https://doi.org/10.3389/fmars.2019.00393, 2019.
Boalch, G., Harbour, D., and Butler, E.: Seasonal phytoplankton production in the western English Channel 1964–1974, J. Mar. Biol. Assoc. UK, 58, 943–953, 1978.
Bode, A.: Synchronized multidecadal trends and regime shifts in North Atlantic plankton populations, ICES J. Marine Sci., https://doi.org/10.1093/icesjms/fsad095, fsad095, 2023.
Bonnet, D., Richardson, A., Harris, R., Hirst, A., Beaugrand, G., Edwards, M., Ceballos, S., Diekman, R., López-Urrutia, A., and Valdes, L.: An overview of Calanus helgolandicus ecology in European waters, Prog. Oceanogr., 65, 1–53, 2005.
Booth, B.: Size classes and major taxonomic groups of phytoplankton at two locations in the subarctic Pacific Ocean in May and August, 1984, Marine Biol., 97, 275–286, 1988.
Børsheim, K. Y. and Bratbak, G.: Cell volume to cell carbon conversion factors for a bacterivorous Monas sp. enriched from seawater, Marine Ecol. Prog. Ser., 171–175, 1987.
Brittain, R.: 2015–2018 Marine Biological Association of the United Kingdom (MBA) Western English Channel standard haul demersal fish survey data, DASSH [dataset], https://doi.org/10.17031/1802, 2021.
Burkill, P., Leakey, R., Owens, N., and Mantoura, R.: Synechococcus and its importance to the microbial foodweb of the northwestern Indian Ocean, Deep-Sea Res. Pt. II, 40, 773–782, 1993.
Castellani, C., Licandro, P., Fileman, E., Di Capua, I., and Mazzocchi, M. G.: Oithona similis likes it cool: evidence from two long-term time series, J. Plankton Res., 38, 703–717, 2016.
Conover, R. and Corner, E.: Respiration and nitrogen excretion by some marine zooplankton in relation to their life cycles1, J. Mar. Biol. Assoc. UK, 48, 49–75, 1968.
Coombs, S., Halliday, N., Conway, D., and Smyth, T.: Sardine (Sardina pilchardus) egg abundance at station L4, Western English Channel, 1988–2008, J. Plankton Res., 32, 693–697, 2010.
Cornwell, L., Findlay, H., Fileman, E., Smyth, T., Hirst, A. G., Bruun, J., McEvoy, A., Widdicombe, C., Castellani, C., and Lewis, C.: Seasonality of Oithona similis and Calanus helgolandicus reproduction and abundance: contrasting responses to environmental variation at a shelf site, J. Plankton Res., 40, 295–310, 2018.
Cornwell, L. E., Fileman, E. S., Bruun, J. T., Hirst, A. G., Tarran, G. A., Findlay, H. S., Lewis, C., Smyth, T. J., McEvoy, A., and Atkinson, A.: Resilience of the copepod Oithona similis to climatic variability: egg production, mortality, and vertical habitat partitioning, Front. Marine Sci., 7, 29, https://doi.org/10.3389/fmars.2020.00029, 2020.
Corona, S., Hirst, A., Atkinson, D., and Atkinson, A.: Density-dependent modulation of copepod body size and temperature–size responses in a shelf sea, Limnol. Oceanogr., 66, 3916–3927, 2021.
Cross, J., Nimmo-Smith, W. A. M., Hosegood, P. J., and Torres, R.: The role of advection in the distribution of plankton populations at a moored 1-D coastal observatory, Prog. Oceanogr., 137, 342–359, 2015.
Cummings, D., Dashfield, S., Nunes, J., Brown, I. J., Fishwick, J., and Findlay, H. S.: Inorganic carbon and total alkalinity at the Western Channel Observatory from the L4 site from 2008 to 2014, British Oceanographic Data Centre – Natural Environment Research Council, UK [dataset], https://doi.org/10.5285/1ec0cae5-071d-16e1-e053-6c86abc07d47, 2015.
Cushing, D.: The biological response in the sea to climate change, Adv. Mar. Biol., 99, 271–281, 1976.
Dickson, A. G., Sabine, C. L., and Christian, J. R. (Eds.): Guide to best practices for ocean CO2 measurement, Sidney, British Columbia, North Pacific Marine Science Organization, 191 pp., PICES Special Publication 3, IOCCP Report 8, https://doi.org/10.25607/OBP-1342, 2007.
Djeghri, N., Atkinson, A., Fileman, E. S., Harmer, R. A., Widdicombe, C. E., McEvoy, A. J., Cornwell, L., and Mayor, D. J.: High prey-predator size ratios and unselective feeding in copepods: A seasonal comparison of five species with contrasting feeding modes, Prog. Oceanogr., 165, 63–74, 2018.
Edwards, M. and Richardson, A. J.: Impact of climate change on marine pelagic phenology and trophic mismatch, Nature, 430, 881–884, 2004.
Edwards, K. F., Litchman, E., and Klausmeier, C. A.: Functional traits explain phytoplankton community structure and seasonal dynamics in a marine ecosystem, Ecol. Lett., 16, 56–63, 2013.
Edwards, M., Atkinson, A., Bresnan, E., Helaouet, P., McQuatters-Gollup, A., Ostle, C., Pitois, S., and Widdicombe, C.: Plankton, jellyfish and climate in the North-East Atlantic, MCCIP Science Review, 2020, 322–353, https://doi.org/10.14465/2020.arc15.plk, 2020.
Eloire, D., Somerfield, P. J., Conway, D. V., Halsband-Lenk, C., Harris, R., and Bonnet, D.: Temporal variability and community composition of zooplankton at station L4 in the Western Channel: 20 years of sampling, J. Plankton Res., 32, 657–679, 2010.
Fanjul, A., Iriarte, A., Villate, F., Uriarte, I., Atkinson, A., and Cook, K.: Zooplankton seasonality across a latitudinal gradient in the Northeast Atlantic Shelves Province, Cont. Shelf Res., 160, 49–62, 2018.
Fileman, E., Petropavlovsky, A., and Harris, R.: Grazing by the copepods Calanus helgolandicus and Acartia clausi on the protozooplankton community at station L4 in the Western English Channel, J. Plankton Res., 32, 709–724, 2010.
Fileman, E. S., Lindeque, P. K., Harmer, R. A., Halsband, C., and Atkinson, A.: Feeding rates and prey selectivity of planktonic decapod larvae in the Western English Channel, Marine Biol., 161, 2479–2494, 2014.
Findlay, H., Artoli, Y., Birchenough, S., Hartman, S., León, P., and Stiasny, M.: Climate change impacts on ocean acidification relevant to the UK and Ireland, MCCIP Sci. Rev., 2, 24, https://doi.org/10.14465/2022.reu03.oac, 2022.
Findlay, H. S., Cummings, D., Dashfield, S., Nunes, J., Brown, I. J., Fishwick, J.: Inorganic carbon and total alkalinity at Western Channel Observatory station E1 (2010–2014), British Oceanographic Data Centre – Natural Environment Research Council, UK [dataset], https://doi.org/10.5285/50bb1181-960e-58b4-e053-6c86abc0e44f, 2017.
Giering, S. L., Wells, S. R., Mayers, K. M., Schuster, H., Cornwell, L., Fileman, E. S., Atkinson, A., Cook, K. B., Preece, C., and Mayor, D. J.: Seasonal variation of zooplankton community structure and trophic position in the Celtic Sea: A stable isotope and biovolume spectrum approach, Prog. Oceanogr., 177, 101943, https://doi.org/10.1016/j.pocean.2018.03.012, 2019.
Giering, S. L. C., Cavan, E. L., Basedow, S. L., Briggs, N., Burd, A. B., Darroch, L. J., Guidi, L., Irisson, J.-O., Iversen, M. H., Kiko, R., Lindsay, D., Marcolin, C. R., McDonnell, A. M. P., Möller, K. O., Passow, U., Thomalla, S., Trull, T. W., and Waite, A. M.: Sinking Organic Particles in the Ocean – Flux Estimates From in situ Optical Devices, Front. Marine Sci., 6, 834, https://doi.org/10.3389/fmars.2019.00834, 2020.
Gilbert, J. A., Field, D., Swift, P., Newbold, L., Oliver, A., Smyth, T., Somerfield, P. J., Huse, S., and Joint, I.: The seasonal structure of microbial communities in the Western English Channel, Environ. Microbiol., 11, 3132–3139, 2009.
González-Pola, C., Larsen, K. M. H., Fratantoni, P., and Beszczynska-Möller, A. (Eds.).: ICES Report on ocean climate 2020, ICES Cooperative Research Reports, 356, 121 pp., https://doi.org/10.17895/ices.pub.19248602, 2022.
Green, E., Harris, R., and Duncan, A.: The seasonal abundance of the copepodite stages of Calanus helgolandicus and Pseudocalanus elongatus off Plymouth, J. Mar. Biol. Assoc. UK, 73, 109–122, 1993.
Harris, R.: The L4 time-series: the first 20 years, J. Plankton Res., 32, 577–583, 2010.
Henson, S. A., Cole, H. S., Hopkins, J., Martin, A. P., and Yool, A.: Detection of climate change-driven trends in phytoplankton phenology, Global Change Biol., 24, e101–e111, 2018.
Heywood, J., Zubkov, M., Tarran, G., Fuchs, B., and Holligan, P.: Prokaryoplankton standing stocks in oligotrophic gyre and equatorial provinces of the Atlantic Ocean: evaluation of inter-annual variability, Deep-Sea Res. Pt. II, 53, 1530–1547, 2006.
Highfield, J. M., Eloire, D., Conway, D. V., Lindeque, P. K., Attrill, M. J., and Somerfield, P. J.: Seasonal dynamics of meroplankton assemblages at station L4, J. Plankton Res., 32, 681–691, 2010.
Hirst, A. G., Bonnet, D., and Harris, R.: Seasonal dynamics and mortality rates of Calanus helgolandicus over two years at a station in the English Channel, Marine Ecol. Prog. Ser., 340, 189–205, 2007.
Holland, M. M., Louchart, A., Artigas, L. F., Ostle, C., Atkinson, A., Rombouts, I., Graves, C. A., Devlin, M., Heyden, B., and Machairopoulou, M.: Major declines in NE Atlantic plankton contrast with more stable populations in the rapidly warming North Sea, Sci. Total Environ., 898, 165505, https://doi.org/10.1016/j.scitotenv.2023.165505, 2023.
Irigoien, X. and Harris, R. P.: Interannual variability of Calanus helgolandicus in the English Channel, Fish. Oceanogr., 12, 317–326, 2003.
Irigoien, X., Head, R., Harris, R., Cummings, D., Harbour, D., and Meyer-Harms, B.: Feeding selectivity and egg production of Calanus helgolandicus in the English Channel, Limnol. Oceanogr., 45, 44–54, 2000.
Irigoien, X., Flynn, K., and Harris, R.: Phytoplankton blooms: a “loophole” in microzooplankton grazing impact?, J. Plankton Res., 27, 313–321, 2005.
Kemp, S.: Oceanography and the Fluctuations in the Abundance of Marine Animals, Nature, 142, 817–820, https://doi.org/10.1038/142817a0, 1938.
Kenitz, K. M., Visser, A. W., Mariani, P., and Andersen, K. H.: Seasonal succession in zooplankton feeding traits reveals trophic trait coupling, Limnol. Oceanogr., 62, 1184–1197, 2017.
Kiørboe, T.: A Mechanistic Approach to Plankton Ecology, ASLO Web Lectures, 1, 1–91, 2009.
Kitidis, V., Hardman-Mountford, N. J., Litt, E., Brown, I., Cummings, D., Hartman, S., Hydes, D., Fishwick, J. R., Harris, C., and Martinez-Vicente, V.: Seasonal dynamics of the carbonate system in the Western English Channel, Cont. Shelf Res., 42, 30–40, 2012.
Kristensen, E., Penha-Lopes, G., Delefosse, M., Valdemarsen, T., Quintana, C. O., and Banta, G. T.: What is bioturbation? The need for a precise definition for fauna in aquatic sciences, Marine Ecol. Prog. Ser., 446, 285–302, 2012.
Leles, S. G., Bruggeman, J., Polimene, L., Blackford, J., Flynn, K. J., and Mitra, A.: Differences in physiology explain succession of mixoplankton functional types and affect carbon fluxes in temperate seas, Prog. Oceanogr., 190, 102481, https://doi.org/10.1016/j.pocean.2020.102481, 2021.
Lindeque, P.: A molecular approach to Calanus (Copepoda: calanoida) development and systematics, University of Plymouth, 282 pp., https://doi.org/10.24382/4825, 2023.
Lindeque, P. K., Parry, H. E., Harmer, R. A., Somerfield, P. J., and Atkinson, A.: Next generation sequencing reveals the hidden diversity of zooplankton assemblages, PloS one, 8, e81327, https://doi.org/10.1371/journal.pone.0081327, 2013.
Lindeque, P. K., Dimond, A., Harmer, R. A., Parry, H. E., Pemberton, K. L., and Fileman, E. S.: Feeding selectivity of bivalve larvae on natural plankton assemblages in the Western English Channel, Marine Biol., 162, 291–308, 2015.
López-Urrutia, Á., Irigoien, X., Acuña, J. L., and Harris, R.: In situ feeding physiology and grazing impact of the appendicularian community in temperate waters, Marine Ecol. Prog. Ser., 252, 125–141, 2003.
Mackas, D. L., Greve, W., Edwards, M., Chiba, S., Tadokoro, K., Eloire, D., Mazzocchi, M. G., Batten, S., Richardson, A. J., Johnson, C., and Head, E.: Changing zooplankton seasonality in a changing ocean: Comparing time series of zooplankton phenology, Prog. Oceanogr., 97, 31–62, 2012.
Marine Biological Association: 1924–2013 MBA L4 and E1 Young Fish Survey, DASSH [dataset], https://doi.org/10.17031/1636, 2019.
Maud, J. L., Atkinson, A., Hirst, A. G., Lindeque, P. K., Widdicombe, C. E., Harmer, R. A., McEvoy, A. J., and Cummings, D. G.: How does Calanus helgolandicus maintain its population in a variable environment? Analysis of a 25-year time series from the English Channel, Prog. Oceanogr., 137, 513–523, 2015.
Maud, J. L., Hirst, A. G., Atkinson, A., Lindeque, P. K., and McEvoy, A. J.: Mortality of Calanus helgolandicus: sources, differences between the sexes and consumptive and nonconsumptive processes, Limnol. Oceanogr., 63, 1741–1761, 2018.
Mazzocchi, M. G., Di Capua, I., Kokoszka, F., Margiotta, F., d'Alcalà, M. R., Sarno, D., Zingone, A., and Licandro, P.: Coastal mesozooplankton respond to decadal environmental changes via community restructuring, Marine Ecol., , e12746, https://doi.org/10.1111/maec.12746, 2023.
McEvoy, A. and Atkinson, A.: The Western Channel Observatory: a century of oceanographic, chemical and biological data compiled from pelagic and benthic habitats in the Western English Channel 1903–2022, NERC EDS British Oceanographic Data Centre NOC [dataset], https://doi.org/10.17031/645110fb81749, 2023.
McEvoy, A., Atkinson, A., and Beesley, A.: Zooplankton abundance time series from net hauls at site L4 off Plymouth, UK between 1988–2021, NERC EDS British Oceanographic Data Centre NOC [dataset], https://doi.org/10.5285/e785f2f7-05d5-2f47-e053-6c86abc08bee, 2022a.
McEvoy, A., Beesley, A., and Atkinson, A.: Subset of zooplankton abundance and biomass time series from net hauls at site L4 off Plymouth, UK between 1988–2020 (Version 1), NERC EDS British Oceanographic Data Centre NOC [dataset], https://doi.org/10.5285/D7FB6CE3-7BC9-307B-E053-6C86ABC0671B, 2022b.
McEvoy, A., Beesley, A., and Atkinson, A.: Calanus helgolandicus weekly egg production time series between 1992–2021, using females from the Western English Channel site L4, NERC EDS British Oceanographic Data Centre NOC [dataset], https://doi.org/10.5285/e28496a4-0c72-0e7a-e053-6c86abc0d7c7, 2022c.
McGovern, E., Schilder, J., Artioli, Y., Birchenough, S., Dupont, S., Findlay, H., Skjelvan, I., Skogen, M., Álvarez, M., Büsher, J., Chierici, M., Christensen, J., León, P., Grage, A., Gregor, L., Humphreys, M., Järnegren, J., Knockaert, M., Krakau, M., and Moffat, C.: Ocean Acidification, in: OSPAR, 2023: The 2023 35 Quality Status Report for the North-East Atlantic, https://oap.ospar.org/en/ospar-assessments/quality-status-reports/qsr-2023/other-assessments/ocean-acidification/#2-2-ospar-and-ocean-acidification (last access: 11 December 2023), 2023.
McQuatters-Gollop, A., Atkinson, A., Aubert, A., Bedford, J., Best, M., Bresnan, E., Cook, K., Devlin, M., Gowen, R., and Johns, D. G.: Plankton lifeforms as a biodiversity indicator for regional-scale assessment of pelagic habitats for policy, Ecological Indicators, 101, 913–925, 2019.
Menden-Deuer, S. and Lessard, E. J.: Carbon to volume relationships for dinoflagellates, diatoms, and other protist plankton, Limnol. Oceanogr., 45, 569–579, https://doi.org/10.4319/lo.2000.45.3.0569, 2000.
Merchant, C. J., Embury, O., Bulgin, C. E., Block, T., Corlett, G. K., Fiedler, E., Good, S. A., Mittaz, J., Rayner, N. A., and Berry, D.: Satellite-based time-series of sea-surface temperature since 1981 for climate applications, Sci. Data, 6, 223, https://doi.org/10.1038/s41597-019-0236-x, 2019.
Mesher, T. and McNeill, C. L.: Benthic Survey Macrofauna Abundance and Biomass Data, as part of the Western Channel Observatory, UK, between 2008 and 2019, NERC EDS British Oceanographic Data Centre, NOC [dataset], https://doi.org/10.5285/d9f44202-b0d4-646c-e053-6c86abc018c6, 2022.
Michaels, A. F., Caron, D. A., Swanberg, N. R., Howse, F. A., and Michaels, C. M.: Planktonic sarcodines (Acantharia, Radiolaria, Foraminifera) in surface waters near Bermuda: abundance, biomass and vertical flux, J. Plankton Res., 17, 131–163, 1995.
O'Brien, T. D., Lorenzoni, L., Isensee, K., and Valdés, L.: What are Marine Ecological Time Series telling us about the ocean, A status report, IOC Tech. Ser, 129, 1–297, 2017.
Ostle, C., Artigas, L. F., Atkinson, A., Aubert, A., Budria, A., Graham, G., Helaouet, P., Johansen, M., Johns, D., Padegimas, B., Rombouts, I., and McQuatters-Gollop, A.: WP1 Pelagic Habitats – Deliverable 1.3 “Representativeness of plankton indicators”, OSPAR Commission, 2017.
Ostle, C., Paxman, K., Graves, C. A., Arnold, M., Artigas, L. F., Atkinson, A., Aubert, A., Baptie, M., Bear, B., Bedford, J., Best, M., Bresnan, E., Brittain, R., Broughton, D., Budria, A., Cook, K., Devlin, M., Graham, G., Halliday, N., Hélaouët, P., Johansen, M., Johns, D. G., Lear, D., Machairopoulou, M., McKinney, A., Mellor, A., Milligan, A., Pitois, S., Rombouts, I., Scherer, C., Tett, P., Widdicombe, C., and McQuatters-Gollop, A.: The Plankton Lifeform Extraction Tool: a digital tool to increase the discoverability and usability of plankton time-series data, Earth Syst. Sci. Data, 13, 5617–5642, https://doi.org/10.5194/essd-13-5617-2021, 2021.
Parry, H., Atkinson, A., Somerfield, P., and Lindeque, P.: A metabarcoding comparison of taxonomic richness and composition between the water column and the benthic boundary layer, ICES J. Marine Sci., 78, 3333–3341, 2021.
Pingree, R.: Physical oceanography of the Celtic sea and English channel, in: Elsevier oceanography series, Elsevier, 415–465, 1980.
Polimene, L., Brunet, C., Butenschön, M., Martinez-Vicente, V., Widdicombe, C., Torres, R., and Allen, J.: Modelling a light-driven phytoplankton succession, J. Plankton Res., 36, 214–229, 2014.
Polimene, L., Mitra, A., Sailley, S., Ciavatta, S., Widdicombe, C., Atkinson, A., and Allen, J.: Decrease in diatom palatability contributes to bloom formation in the Western English Channel, Prog. Oceanogr., 137, 484–497, 2015.
Polimene, L., Clark, D., Kimmance, S., and McCormack, P.: A substantial fraction of phytoplankton-derived DON is resistant to degradation by a metabolically versatile, widely distributed marine bacterium, Plos one, 12, e0171391, https://doi.org/10.1371/journal.pone.0171391, 2017.
Pond, D., Harris, R., Head, R., and Harbour, D.: Environmental and nutritional factors determining seasonal variability in the fecundity and egg viability of Calanus helgolandicus in coastal waters off Plymouth, UK, Marine Ecol. Prog. Ser., 143, 45–63, 1996.
Queirós, A. M., Stephens, N., Cook, R., Ravaglioli, C., Nunes, J., Dashfield, S., Harris, C., Tilstone, G. H., Fishwick, J., and Braeckman, U.: Can benthic community structure be used to predict the process of bioturbation in real ecosystems?, Prog. Oceanogr., 137, 559–569, 2015.
Queirós, A. M., Stephens, N., Widdicombe, S., Tait, K., McCoy, S. J., Ingels, J., Rühl, S., Airs, R., Beesley, A., and Carnovale, G.: Connected macroalgal-sediment systems: blue carbon and food webs in the deep coastal ocean, Ecol. Monogr., 89, e01366, https://doi.org/10.1002/ecm.1366, 2019.
Queirós, A. M., Tait, K., Clark, J. R., Bedington, M., Pascoe, C., Torres, R., Somerfield, P. J., and Smale, D. A.: Identifying and protecting macroalgae detritus sinks toward climate change mitigation, Ecol. Appl., 33, e2798, https://doi.org/10.1002/eap.2798, 2023.
Ratnarajah, L., Abu-Alhaija, R., Atkinson, A., Batten, S., Bax, N. J., Bernard, K. S., Canonico, G., Cornils, A., Everett, J. D., and Grigoratou, M.: Monitoring and modelling marine zooplankton in a changing climate, Nat. Commun., 14, 564, https://doi.org/10.1038/s41467-023-36241-5, 2023.
Rees, A. P., Hope, S. B., Widdicombe, C. E., Dixon, J. L., Woodward, E. M. S., and Fitzsimons, M. F.: Alkaline phosphatase activity in the western English Channel: elevations induced by high summertime rainfall, Estuar. Coast. Shelf Sci., 81, 569–574, 2009.
Reygondeau, G., Molinero, J. C., Coombs, S., MacKenzie, B. R., and Bonnet, D.: Progressive changes in the Western English Channel foster a reorganization in the plankton food web, Prog. Oceanogr., 137, 524–532, 2015.
Richardson, A. J.: In hot water: zooplankton and climate change, ICES J. Marine Sci., 65, 279–295, 2008.
Rühl, S., Thompson, C. E., Queirós, A. M., and Widdicombe, S.: Intra-Annual Patterns in the Benthic-Pelagic Fluxes of Dissolved and Particulate Matter, Front. Marine Sci., 7, 567193, https://doi.org/10.3389/fmars.2020.567193, 2020.
Rühl, S., Thompson, C. E., Queirós, A. M., and Widdicombe, S.: Decadal patterns and trends in benthic-pelagic exchange processes, J. Marine Syst., 222, 103595, https://doi.org/10.1016/j.jmarsys.2021.103595, 2021.
Russell, F.: On the value of certain plankton animals as indicators of water movements in the English Channel and North Sea, J. Mar. Biol. Assoc. UK, 20, 309–332, 1935.
Sailley, S. F., Polimene, L., Mitra, A., Atkinson, A., and Allen, J. I.: Impact of zooplankton food selectivity on plankton dynamics and nutrient cycling, J. Plankton Res., 37, 519–529, 2015.
Schmidt, K., Birchill, A. J., Atkinson, A., Brewin, R. J., Clark, J. R., Hickman, A. E., Johns, D. G., Lohan, M. C., Milne, A., and Pardo, S.: Increasing picocyanobacteria success in shelf waters contributes to long-term food web degradation, Global Change Biol., 26, 5574–5587, 2020.
Schroeder, D. C., Oke, J., Hall, M., Malin, G., and Wilson, W. H.: Virus succession observed during an Emiliania huxleyi bloom, Appl. Environ. Microbiol., 69, 2484–2490, 2003.
Sims, R. P., Bedington, M., Schuster, U., Watson, A. J., Kitidis, V., Torres, R., Findlay, H. S., Fishwick, J. R., Brown, I., and Bell, T. G.: Tidal mixing of estuarine and coastal waters in the western English Channel is a control on spatial and temporal variability in seawater CO2, Biogeosciences, 19, 1657–1674, https://doi.org/10.5194/bg-19-1657-2022, 2022.
Smyth, T.: Chapter 4. Oceanography background conditions - Western Channel Observatory, in: South-west Marine Ecosystems Report for 2021, edited by: Hiscock, K. and Earll, R., Marine Biological Association of the UK, Plymouth, https://doi.org/10.17031/t98y-1806, 2022.
Smyth, T. J., Fishwick, J. R., Al-Moosawi, L., Cummings, D. G., Harris, C., Kitidis, V., Rees, A., Martinez-Vicente, V., and Woodward, E. M.: A broad spatio-temporal view of the Western English Channel observatory, J. Plankton Res., 32, 585–601, 2010.
Smyth, T. J., Allen, I., Atkinson, A., Bruun, J. T., Harmer, R. A., Pingree, R. D., Widdicombe, C. E., and Somerfield, P. J.: Ocean net heat flux influences seasonal to interannual patterns of plankton abundance, PloS one, 9, e98709, https://doi.org/10.1371/journal.pone.0098709, 2014.
Smyth, T., Atkinson, A., Widdicombe, S., Frost, M., Allen, I., Fishwick, J., Queiros, A., Sims, D., and Barange, M.: The Western channel observatory, Prog. Oceanogr., 137, 335–341, 2015.
Southward, A. J. and Roberts, E. K.: One hundred years of marine research at Plymouth, J. Mar. Biol. Assoc. UK, 67, 465–506, 1987.
Southward, A. J., Langmead, O., Hardman-Mountford, N. J., Aiken, J., Boalch, G. T., Dando, P. R., Genner, M. J., Joint, I., Kendall, M. A., and Halliday, N. C.: Long-term oceanographic and ecological research in the Western English Channel, Adv. Marine Biol., 47, 1–105, 2005.
Tait, K., Airs, R. L., Widdicombe, C. E., Tarran, G. A., Jones, M. R., and Widdicombe, S.: Dynamic responses of the benthic bacterial community at the Western English Channel observatory site L4 are driven by deposition of fresh phytodetritus, Prog. Oceanogr., 137, 546–558, 2015.
Talbot, E., Bruggeman, J., Hauton, C., and Widdicombe, S.: Uncovering the environmental drivers of short-term temporal dynamics in an epibenthic community from the Western English Channel, J. Mar. Biol. Assoc. UK, 99, 1467–1479, 2019.
Tarran, G. A. and Bruun, J. T.: Nanoplankton and picoplankton in the Western English Channel: abundance and seasonality from 2007–2013, Prog. Oceanogr., 137, 446–455, 2015.
Torres, R. and Uncles, R.: Modelling of Estuarine and Coastal Waters, in: Treatise on Estuarine and Coastal Sciences, edited by: Wolanski, E. and McLusky, D. S., Waltham, Academic Press, 2, 395–427, 2011.
UNESCO: Monographs on Oceanographic Methodology: Zooplankton Sampling, edited by: Tranter D. J., United Nations Educational Scientific and Cultural Organization, 153–157, ISBN 92-3-101194-4, 1968.
Upstill-Goddard, R. C., Rees, A. P., and Owens, N. J. P.: Simultaneous high-precision measurements of methane and nitrous oxide in water and seawater by single phase equilibration gas chromatography, Deep-Sea Res. Pt. I, 43, 1669–1682, 1996.
Uriarte, I., Villate, F., Iriarte, A., Fanjul, Á., Atkinson, A., and Cook, K.: Opposite phenological responses of zooplankton to climate along a latitudinal gradient through the European Shelf, ICES J. Marine Sci., 78, 1090–1107, 2021.
Utermohl, H.: Zur Vervollkommung der quantitativen phytoplankton-methodik, Mitteilung Internationale Vereinigung Fuer Theoretische und Angewandte Limnologie, 9, 39, 1958.
Uye, S.-i., Nagano, N., and Tamaki, H.: Geographical and seasonal variations in abundance, biomass and estimated production rates of microzooplankton in the Inland Sea of Japan, J. Oceanogr., 52, 689–703, 1996.
Vucetich, J. A., Nelson, M. P., and Bruskotter, J. T.: What drives declining support for long-term ecological research?, BioScience, 70, 168–173, 2020.
Weiss, R. F. and Price, B. A.: Nitrous oxide solubility in water and seawater, Marine Chem., 8, 347–359, 1980.
Welschmeyer, N. A.: Fluorometric analysis of chlorophyll a in the presence of chlorophyll b and pheopigments, Limnol. Oceanogr., 39, 1985–1992, 1994.
Widdicombe, C. E. and Harbour, D.: Phytoplankton taxonomic abundance and biomass time-series at Plymouth Station L4 in the Western English Channel, 1992-2020. NERC EDS British Oceanographic Data Centre NOC [dataset], https://doi.org/10.5285/c9386b5c-b459-782f-e053-6c86abc0d129, 2021.
Widdicombe, C. E., Eloire, D., Harbour, D., Harris, R. P., and Somerfield, P. J.: Long-term phytoplankton community dynamics in the Western English Channel, J. Plankton Res., 32, 643–655, 2010.
Zapata, M., Rodríguez, F., and Garrido, J. L.: Separation of chlorophylls and carotenoids from marine phytoplankton: a new HPLC method using a reversed phase C8 column and pyridine-containing mobile phases, Marine Ecol. Prog. Ser., 195, 29–45, 2000.