the Creative Commons Attribution 4.0 License.
the Creative Commons Attribution 4.0 License.
 | 08 Dec 2023
High-resolution digital elevation models and orthomosaics generated from historical aerial photographs (since the 1960s) of the Bale Mountains in Ethiopia
Mohammed Ahmed Muhammed
Binyam Tesfaw Hailu
Georg Miehe
Luise Wraase
Thomas Nauss
Dirk Zeuss
The natural resources of Ethiopian high-altitude ecosystems are commonly perceived as increasingly threatened by devastating land-use practices owing to decreasing lowland resources. Quantified time-series data of the course of land-use cover changes are still needed. Very-high-resolution digital data on the historical landscape over recent decades are needed to determine the impacts of changes in afro-alpine ecosystems. However, digital elevation models (DEMs) and orthomosaics do not exist for most afro-alpine ecosystems of Africa. We processed the only available and oldest historical aerial photographs for Ethiopia and any afro-alpine ecosystem. Here, we provide a DEM and an orthomosaic image for the years 1967 and 1984 for the Bale Mountains in Ethiopia, which comprise the largest afro-alpine ecosystem in Africa. We used 298 historical aerial photographs captured in 1967 and 1984 for generating DEMs and orthomosaics with a structure-from-motion multi-view stereo photogrammetry workflow along an elevation gradient from 977 to 4377 m above sea level (a.s.l.) at very high spatial resolutions of 0.84 m and 0.98 m for the years 1967 and 1984, respectively. The structure-from-motion multi-view stereo photogrammetry workflow, employed with Agisoft Metashape, represents a modern approach that combines computer vision and photogrammetry. This method proves useful for reconstructing DEMs and orthomosaics from historical aerial photographs, with a focus on high spatial resolution. To validate the accuracy of the reconstructed DEMs, ground control points gathered through GPS measurements were used, resulting in root mean square error (RMSE) values of 3.55 m for the year 1967 and 3.44 m for the year 1984. Our datasets can be used by researchers and policymakers for watershed management, as the area provides water for more than 30 million people, landscape management, detailed mapping, and analysis of geological and archaeological features as well as natural resources, analyses of geomorphological processes, and biodiversity research. All the datasets are available online at https://doi.org/10.5281/zenodo.7271617 (Muhammed et al., 2022a) for all the inputs used and at https://doi.org/10.5281/zenodo.7269999 (Muhammed et al., 2022b) for the results obtained (very-high-resolution DEMs and orthomosaics) for both the years 1967 and 1984.
- Article
(13840 KB) - Full-text XML
-
Supplement
(1817 KB) - BibTeX
- EndNote


Landscapes worldwide are increasingly affected by anthropogenic influences and natural factors such as land use and climate change (Bendix et al., 2021; He et al., 2021; Huggel et al., 2012; Peters et al., 2019; Slaymaker and Embleton-Hamann, 2018; Turner and Gardner, 2015). Afro-alpine ecosystems are particularly threatened due to population growth and expansion of human settlements, overgrazing, recurrent fire, deforestation, agricultural expansion (Gehrke and Linder, 2014; Gil-Romera et al., 2019; Kidane et al., 2012; Mezgebu and Workineh, 2017; Muhammed and Elias, 2021; Nyssen et al., 2014), and climate change (Colwell et al., 2008; Diaz and Bradley, 1997; Jacob et al., 2020; Kidane et al., 2022; Palomo, 2017). These impacts are of particular importance in afro-alpine ecosystems because they are hotspots of biodiversity and endemism (Gehrke and Linder, 2014; Merckx et al., 2015) and are thus prominent for their ecological significance and considerable economic, recreational, aesthetic, and scientific value (Muhammed and Elias, 2021; Rahbek et al., 2019). They also constitute important freshwater sources for mountain and lowland ecosystems as well as for millions of people living in adjacent areas. In the year 2015, > 30 % of the global population lived in mountain areas (Thornton et al., 2022).
To analyse the effects of land use and climate change on afro-alpine ecosystems, digital data on the historical landscape at very high spatial resolution are needed. Detailed digital elevation models (DEMs) and orthomosaics are important data sources for quantifying the impacts of anthropogenic and natural changes. For instance, DEMs and orthomosaics can be used for research in structural geology (da Costa and Starkey, 2001), earthquake impacts (Lu et al., 2021), archaeology (Risbøl et al., 2015), geomorphology (van Westen and Lulie Getahun, 2003), water resource management (Chignell et al., 2019), and land-use and land-cover dynamics (Jacob et al., 2016). However, most studies have used satellite images with 10–60 m resolution (Kidane et al., 2012; Mezgebu and Workineh, 2017; Muhammed and Elias, 2021), freely available DEMs of 30 m or coarser resolution (Chignell et al., 2019; Farr et al., 2007; Friss et al., 2010; Kidane et al., 2022), and georeferenced aerial photographs with a small spatial extent (< 225 km2; Carta et al., 2018; Jacob et al., 2016; Johansson et al., 2019). However, no openly accessible historical DEMs and orthomosaics at high spatial resolution (< 5 m) and with a large spatial extent (> 127 km2) exist for any afro-alpine ecosystems. Currently, DEMs and orthomosaics generated with uncrewed aerial vehicles or helicopters reach spatial resolutions of 0.1 to 0.5 m, with an extent ranging from 1.6 to 127 km2 only in urban regions (Benoit et al., 2019; Bühler et al., 2012; Immerzeel et al., 2014).
Globally, very-high-resolution satellite programmes started from 1960, e.g. the CORONA satellites, which were the first spy series with very high spatial resolution (1.8–7.5 m) to capture stereo photographs for military purposes from 1960 to 1972 (Altmaier and Kany, 2002; Day et al., 1998). These images were declassified for civilian use in 1995 (Dashora et al., 2007). However, invisibility of film reference data, low texture and film saturation, inconsistent overlap, and scanning artefacts are their limitations (Ghuffar et al., 2022). Later, commercial satellites emerged, e.g. the Indian Remote Sensing Satellites (IRS; since 1995) at 5 m, IKONOS (since 1999) at 0.8 m, QuickBird (since 2001) at 0.65 m, Worldview 1–4 (since 2007) at 0.3 m, Pléiades 1A and 1B (since 2007) at 0.5 m, and Satellite Pour l'Observation de la Terre (SPOT 6/7; since 2012) at 1.5 m spatial resolution. Our scanned aerial photographs of the years 1967 and 1984 spatially align and could be used as a snapshot of data continuity for the global coverage (Turner et al., 2015) between the times of CORONA satellites in the 1960s and the start of the IRS and IKONOS satellites in the early 1990s.
To reconstruct detailed DEMs and orthophotos, traditional aerial triangulations were employed. This involved determining the optimal initial values for camera poses and 3D points alongside the utilization of vertically captured aerial photographs, a practice that remained prevalent until the mid-1990s. The traditional aerial triangulation method consumes more time during the pre-processing stage (Schenk, 1997). Then, automatic aerial triangulation was created. However, the well-established technique and algorithm known as structure from motion (SfM) in conjunction with a multi-view stereo (MVS) photogrammetry workflow simplifies the process. It allows for the automatic and simultaneous recovery of all unknown parameters related to camera poses and 3D points from overlapping images (Snavely et al., 2008) and whether they are captured with digital or non-digital cameras. SfM–MVS photogrammetry is a low-cost and efficient method that selects high-quality images, offering an accurate and effective approach. This recently emerged algorithm is user-friendly and particularly well-suited to generating high-resolution topographic reconstructions, especially when working with scanned historical aerial photographs (AgiSoft LLC, 2021; Nyssen et al., 2022; Sevara et al., 2018; Westoby et al., 2012).
In this study, we aim to present DEMs and orthomosaics for the years 1967 and 1984 at very high spatial resolutions (0.84 and 0.98 m, respectively) for the remote Bale Mountains in Ethiopia, which comprise the largest afro-alpine ecosystem in Africa (Chignell et al., 2019). The quality of both the 1967 and 1984 DEMs was assessed based on ground control points (GCPs) collected from the field. In addition, comparison between the generated DEMs and the five readily available global DEMs was done. Our data can be used by researchers and policymakers for watershed management; analyses of historical landscape change; detailed mapping and analyses of geological and archaeological features as well as natural resources; analyses of geomorphological processes, socio-ecological patterns, and dynamics, modelling and planning for telecommunications; and biodiversity research. Owing to its high spatial resolution and spatiotemporal coverage, our data will foster studies on the drivers of landscape change and its quantification.
2.1 Study area
The study area lies between and N and between and E (approximately 5730 km2), located 400 km south-east of Addis Ababa in the Oromia region of Ethiopia (Fig. 1). The area lies within the Bale Mountains and covers 25 % of the afro-alpine ecosystems of Africa (de Deus Vidal and Clark, 2020; Carbutt, 2020; Gehrke and Linder, 2014). The Bale Mountains were formed by lava outpourings of the Trappean series, which created a vast lava plateau considerably eroded and flattened by later glaciations (Berhe et al., 1987; Groos et al., 2021; Williams, 2017). The soils in the area tend to be shallow, gravelly, and fertile silty loams of reddish-brown to black colour, as the parent rock is mainly basaltic and trachytic (Miehe and Miehe, 1994). The study area provides a water source for over 30 million people in Ethiopia, Somalia, and Kenya and contributes to five major perennial rivers (Fig. 1).
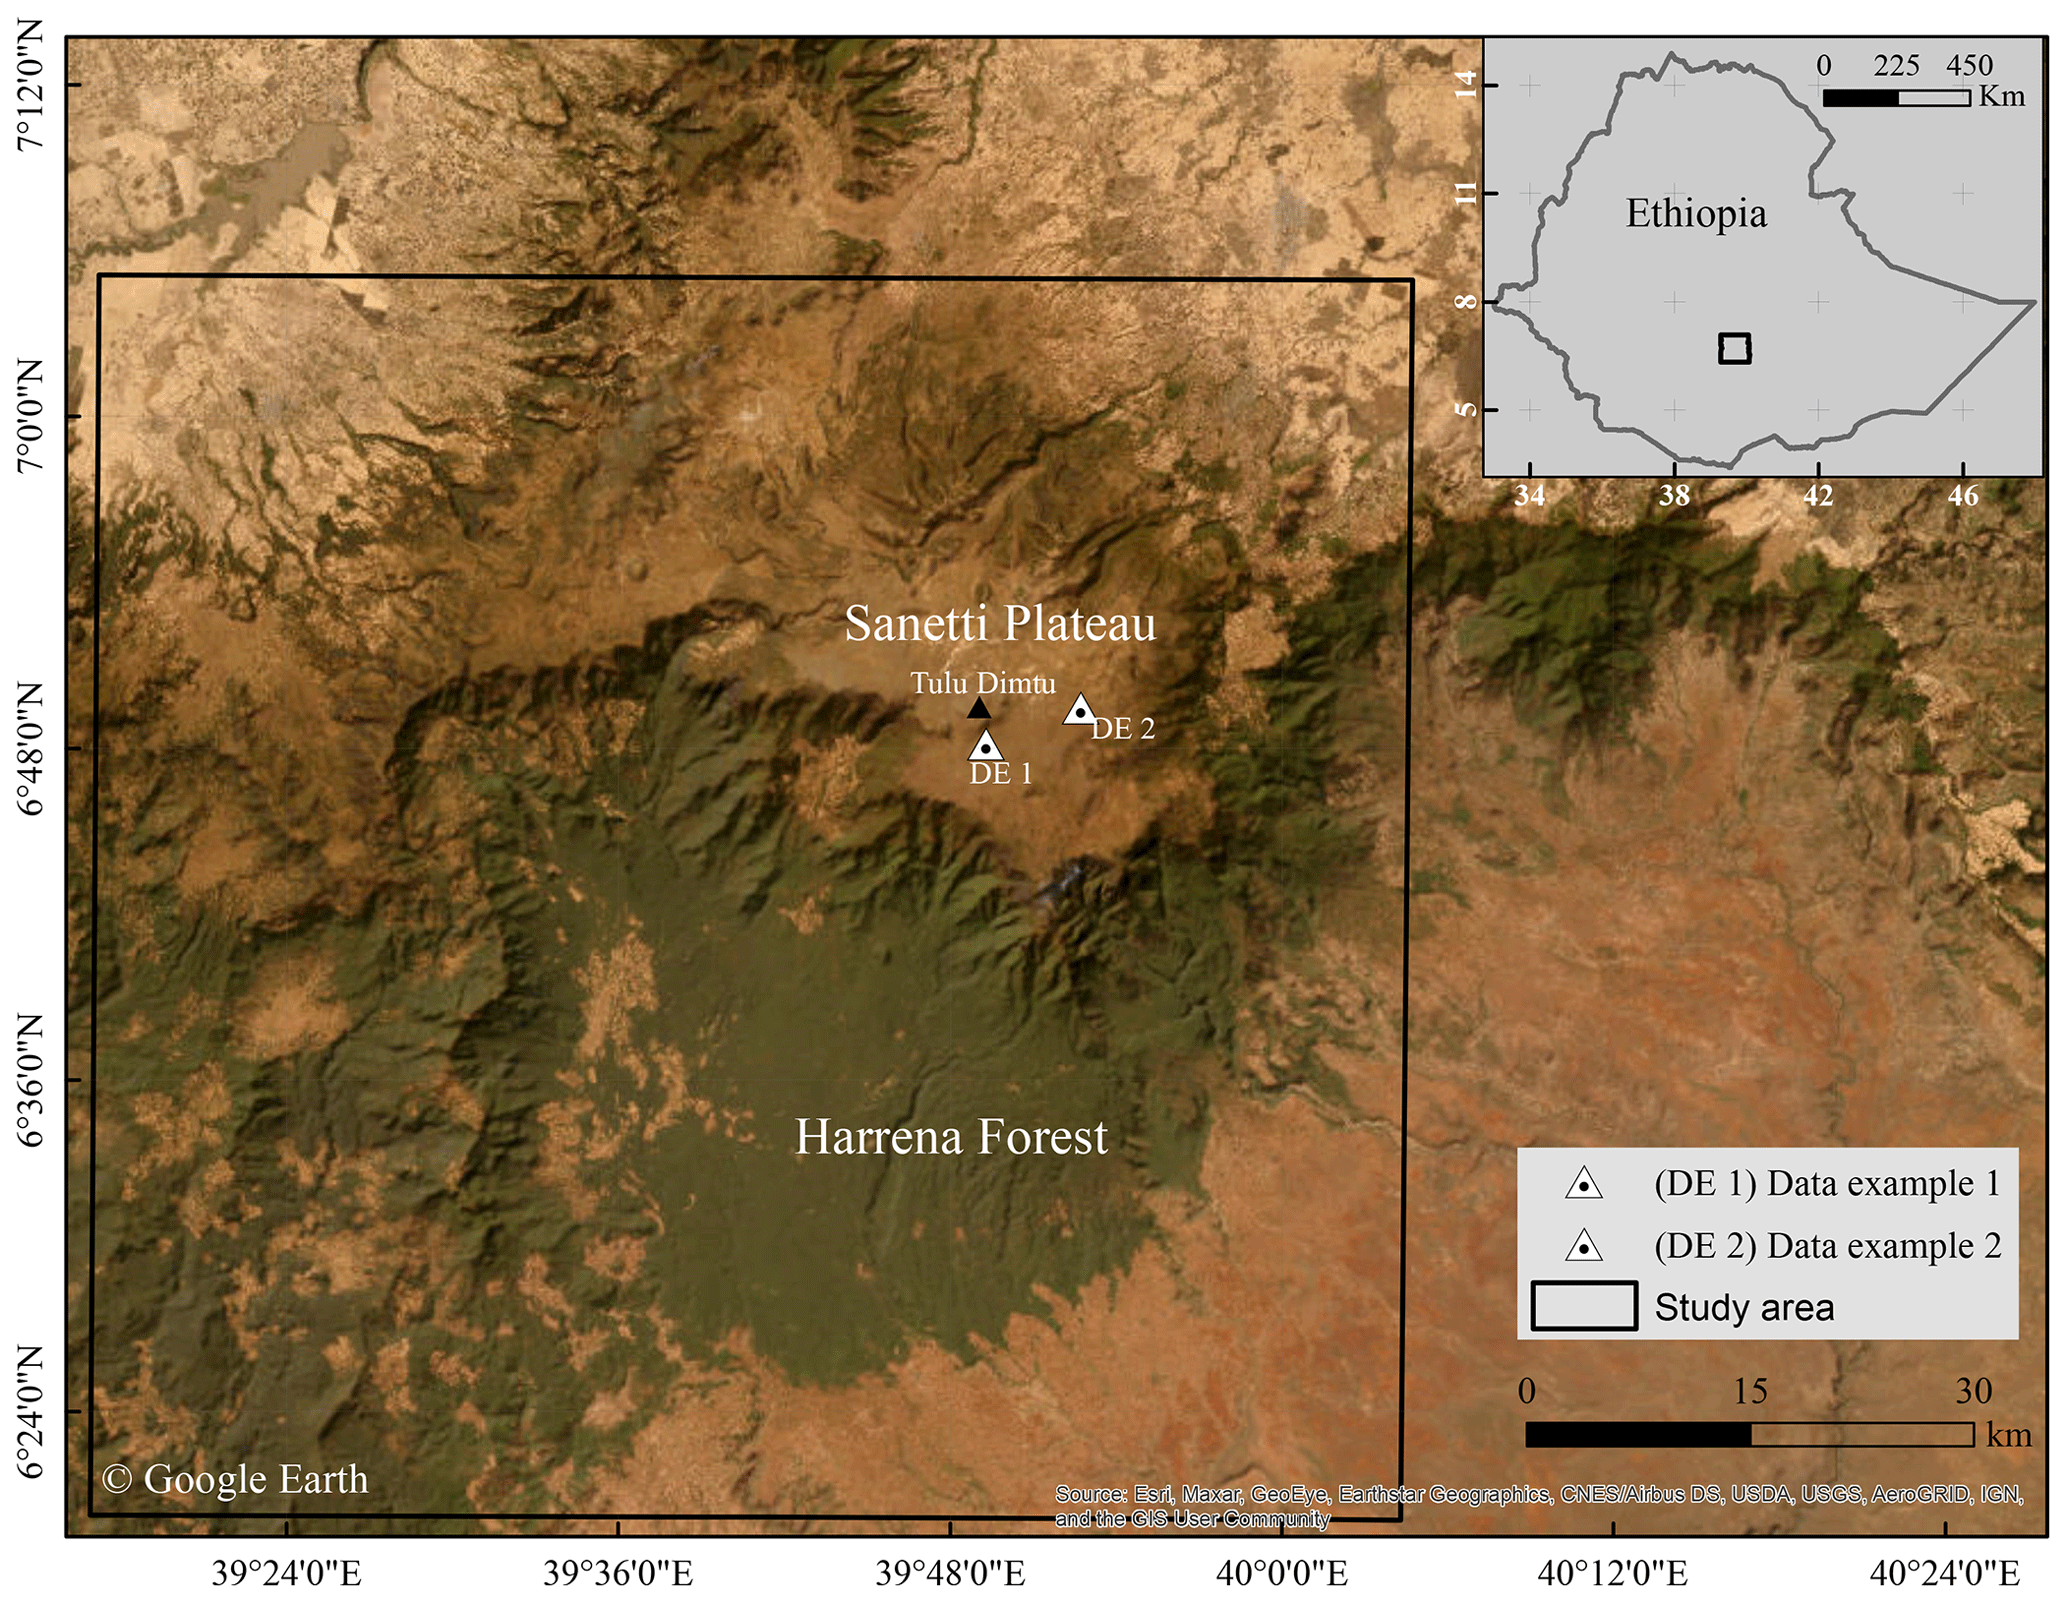
Figure 1Study area of the Bale Mountains in the southern Ethiopian Highlands, eastern Africa (source: Esri, Maxar, GeoEye, Earthstar Geographics, CNES/Airbus DS, USDA, USGS, AeroGRID, IGN, and the GIS User Community).
The climate in the study area varies from north to south, owing mainly to differences in elevation, aspect, and the influence of lowland hot air masses, which also influence the annual migration of the Inter-Tropical Convergence Zone and the Indian Ocean Monsoon (Miehe and Miehe, 1994). The mean monthly minimum and maximum temperatures are 5.6 and 21.4 ∘C, respectively, for an altitudinal range of 2700 to 4377 m above sea level (a.s.l.). The mean annual ground temperature ranges from 7 to 11 ∘C (Groos et al., 2022). The lowest and highest temperatures recorded on the Sanetti Plateau were −15 and 26 ∘C, respectively (Hillman, 1988), where frosts occur during all clear nights throughout the year (Groos et al., 2022). Rainfall is variable throughout the study area and ranges from 800 to 1500 mm annually (Woldu et al., 1989).
The study area is known for plenty of vascular plant species ranging from tropical rainforests to the afro-alpine ecosystem. It is classified into five vegetation zones: (1) Gaysay Valley grasslands covered by a small grassland situated within a broad flat valley at an altitude of 2600–3000 m a.s.l. in the northern part of the study area; (2) dry evergreen montane forest ranging from 2600 to 3200 m a.s.l. dominated by Juniperus procera and Hagenia abyssinica; (3) afro-alpine in the central part of the study area, including the Sanetti Plateau between about 3200 and 4377 m a.s.l. characterized by short, herbaceous plant communities dominated by Alchemilla, Helichrysum, and Artemisia shrubs; (4) an Ericaceous belt spanning most of the escarpment areas between 3100 and 3800 m a.s.l. and forming a belt between the high-altitude afro-alpine plateau and the lower Harenna Forest (the vegetation in this belt is dominated by Erica arborea and Erica trimera species scattered up to 4276 m a.s.l.; and (5) the Harenna moist montane forest: this forest is one of the most extensive and largely natural forests remaining in Ethiopia. It covers the southern slope of the mountains, extending between 1450 and 3200 m a.s.l. (Asefa et al., 2020; Kidane et al., 2019; Miehe and Miehe, 1994; Fig. 1). Topographically, the study area has a maximum slope of 58.63∘. Almost 50 % of the area is exposed to east-, south-east- and south-facing slopes.
2.2 Data
We used and processed historical aerial photographs (HAPs) taken in 1967 and 1984. They have a forward overlap of approximately 60 % and a side overlap of approximately 30 % and were captured using an aerial 23×23 cm film frame camera, which scanned at a resolution of 1200 dots per inch. The qualities of all the scanned HAPs were excellent enough for processing with an image quality value above 0.5 units. Worldview-1 satellite imagery (DigitalGlobe Foundation) was used for the extraction of on-image selected GCPs and applied for pre-processing (Groos et al., 2021). A subset of the GCPs was used for internal accuracy assessment. To assess the external accuracy of our generated DEMs and orthomosaics, we used GCPs collected in the field and additionally from five sources of data: (1) Advanced Spaceborne Thermal Emission and Reflection Radiometer Global Digital Elevation Model (ASTER GDEM) data with a spatial resolution of 15 m, (2) data from the Shuttle Radar Topography Mission (SRTM) with a spatial resolution of 30 m, (3) Advanced Land Observing Satellite Phased Array Type L band Synthetic Aperture Radar data (ALOS PALSAR) with a spatial resolution of 12.5 m, (4) TanDEM-X with a spatial resolution of 90 m from Rizzoli et al. (2017), and (5) the Copernicus DEM (COP-DEM) with a spatial resolution of 30 m (European Space Agency and Airbus, 2022). Each of the five downloaded DEMs was projected onto the Adindan UTM coordinate system zone 37 N (EPSG: 20137) using ArcGIS Desktop (Version 10.8.2) (ESRI Inc., 2021).
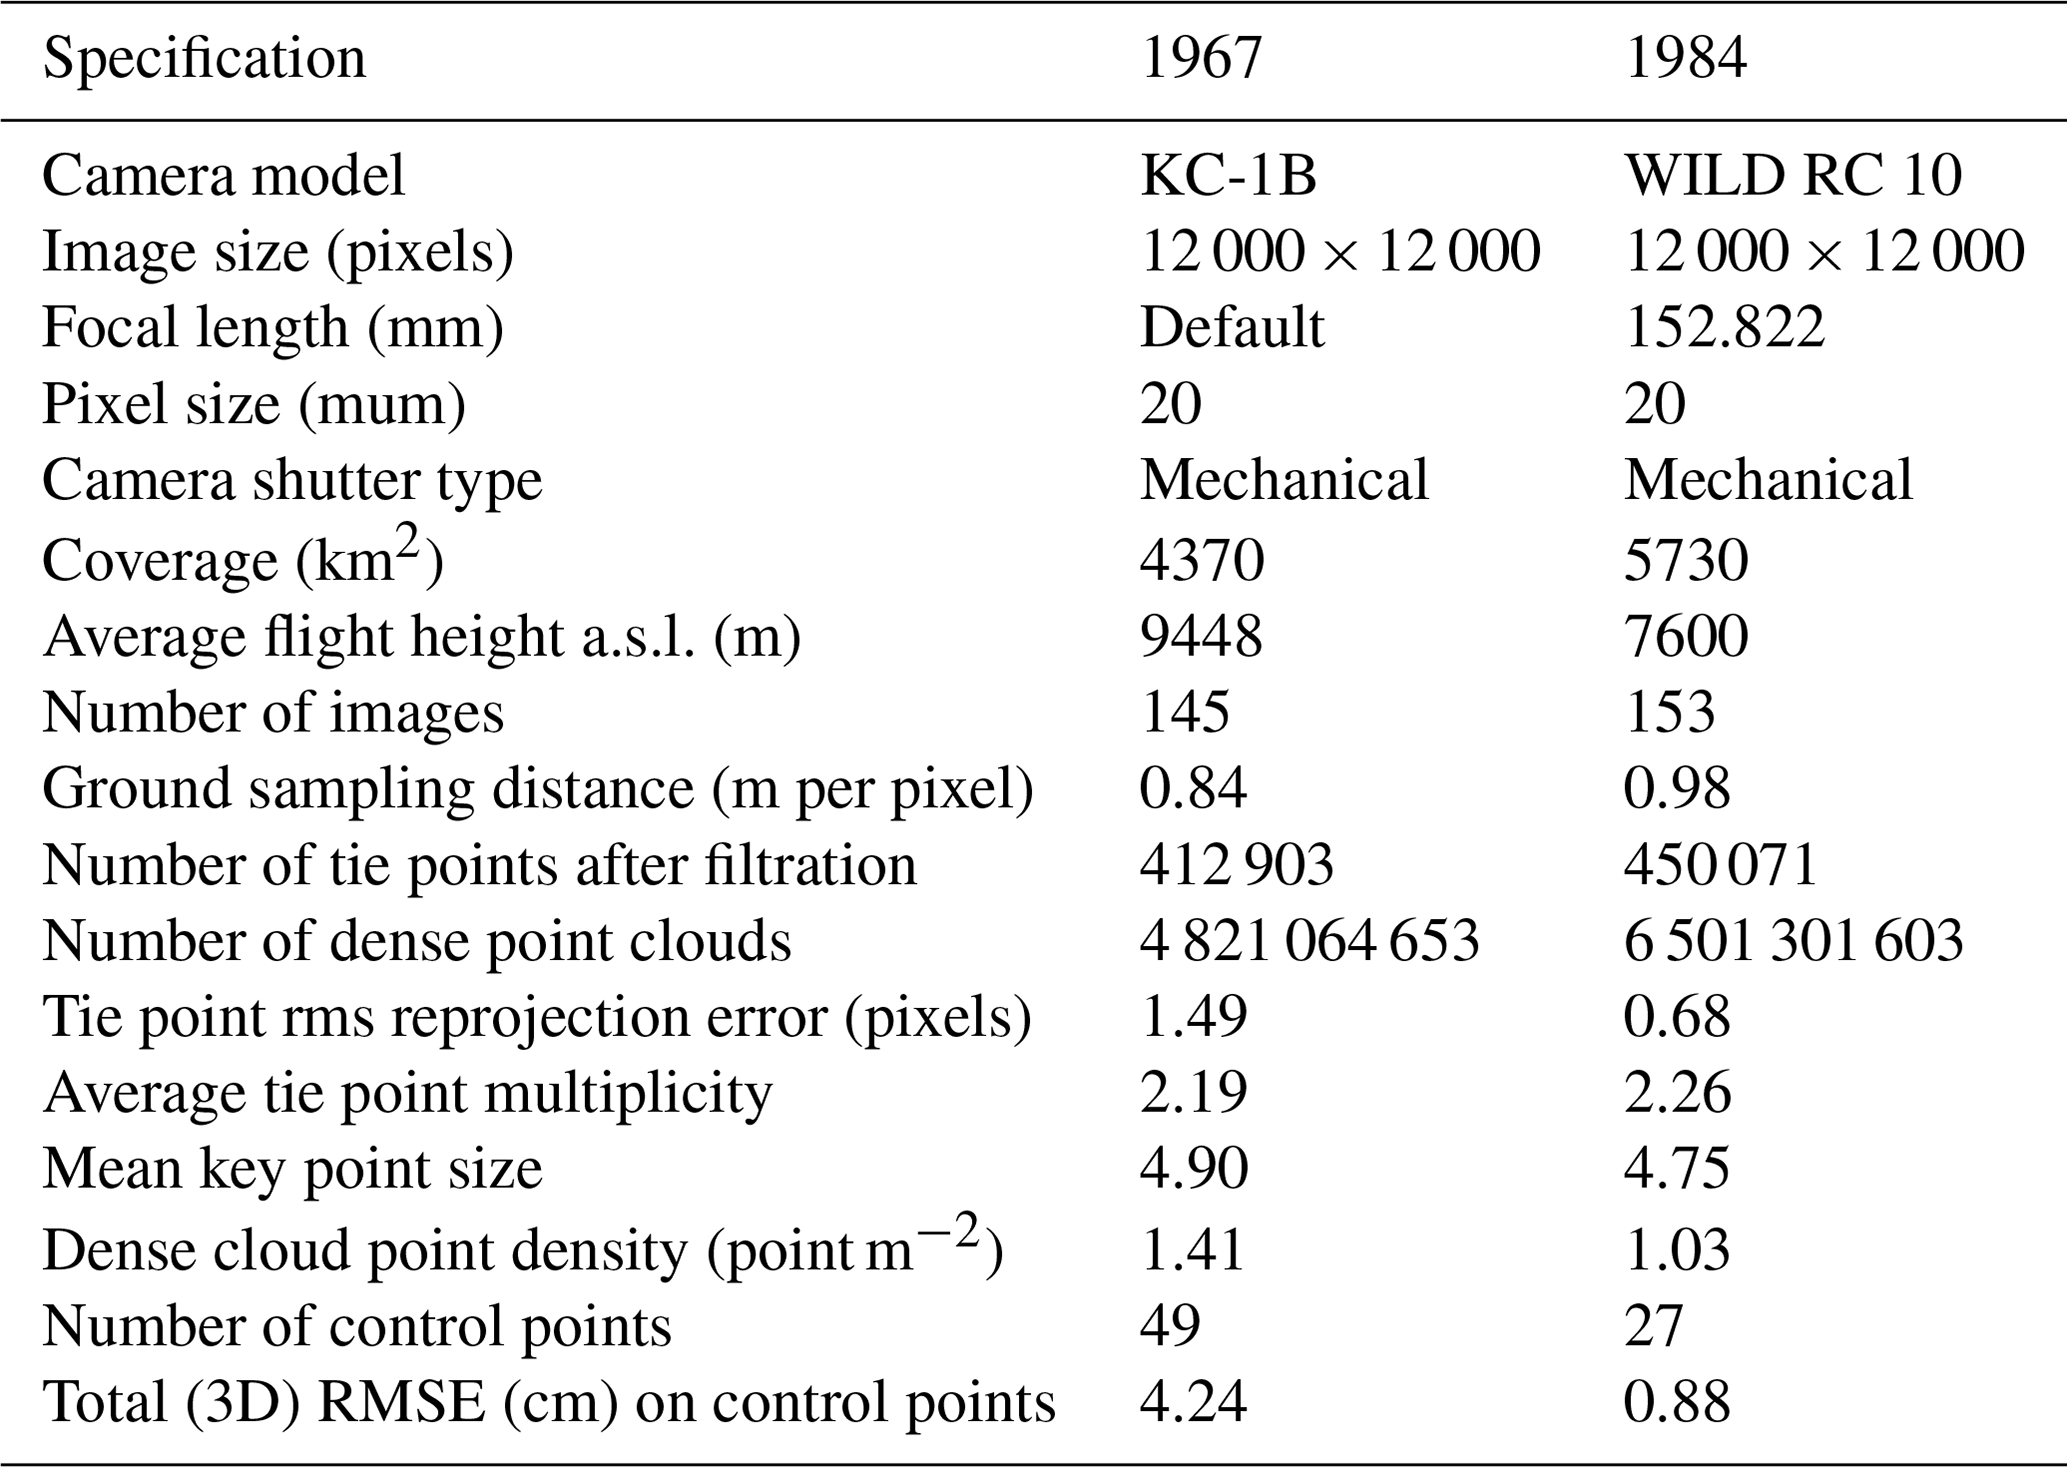
The 1967 HAPs were acquired by the United States Air Force under project number AF 58-3 using a four-engine RC-130A aircraft flying at an altitude of 9448.8 m a.s.l. equipped with a KC-1(B) PLANIGON camera. For detailed information about the camera and lens number, calibrated focal length, magazine serial number, roll number, exact acquisition dates, and flight index map, refer to Supplement Fig. S1 and Table S1. The shutter speed and aperture were s and F-8, respectively, resulting in a scale of approximately 1:62 000.
The 1984 HAPs were obtained by the SWEDSURVEY company under project number ET 1:5 using a Wild RC 10 camera (Wild Universal Aviogon II lens type, camera serial number 3045) with a calibrated focal length of 152.822 mm and a maximum aperture of F/4.0. The flight campaign had an average altitude of 7600 m a.s.l. and was conducted from 15 to 17 January 1984. For more details on the roll number, strip number, photo number, acquisition date, and flight index map, see Supplement Fig. S2 and Table S2.
2.3 Data preparation
The data preparation step included extraction of the calibrated focal length, camera principal point coordinates, camera exposure stations, fiducial marks, and ground control points. All the data preparation steps were performed with Agisoft Metashape Professional (Version 1.8.0.13794) (AgiSoft LLC, 2021), Google Earth, and ArcGIS Desktop (Version 10.8.2) (ESRI Inc., 2021).
2.3.1 Calibrated focal length
The calibrated focal length is a numerical best-balanced value used to determine the scale of the photograph. It is computed from the equivalent focal length to obtain the minimum distortion and to match the lens distortion (Clarke and Fryer, 1998). However, the structure-from-motion multi-view stereo workflow does not require the principal distance of the camera or lens at the time of exposure for the reconstruction workflow, and inputting the calibrated focal length of the different blocks of HAPs will solve the geometry, calculate the camera positions, and create 3D coordinate points. Alternatively, the method employs a default focal length value of 35 mm (AgiSoft LLC, 2021). The calibrated focal lengths were extracted from meta-information on the HAPs of the film and from Spriggs (1966).
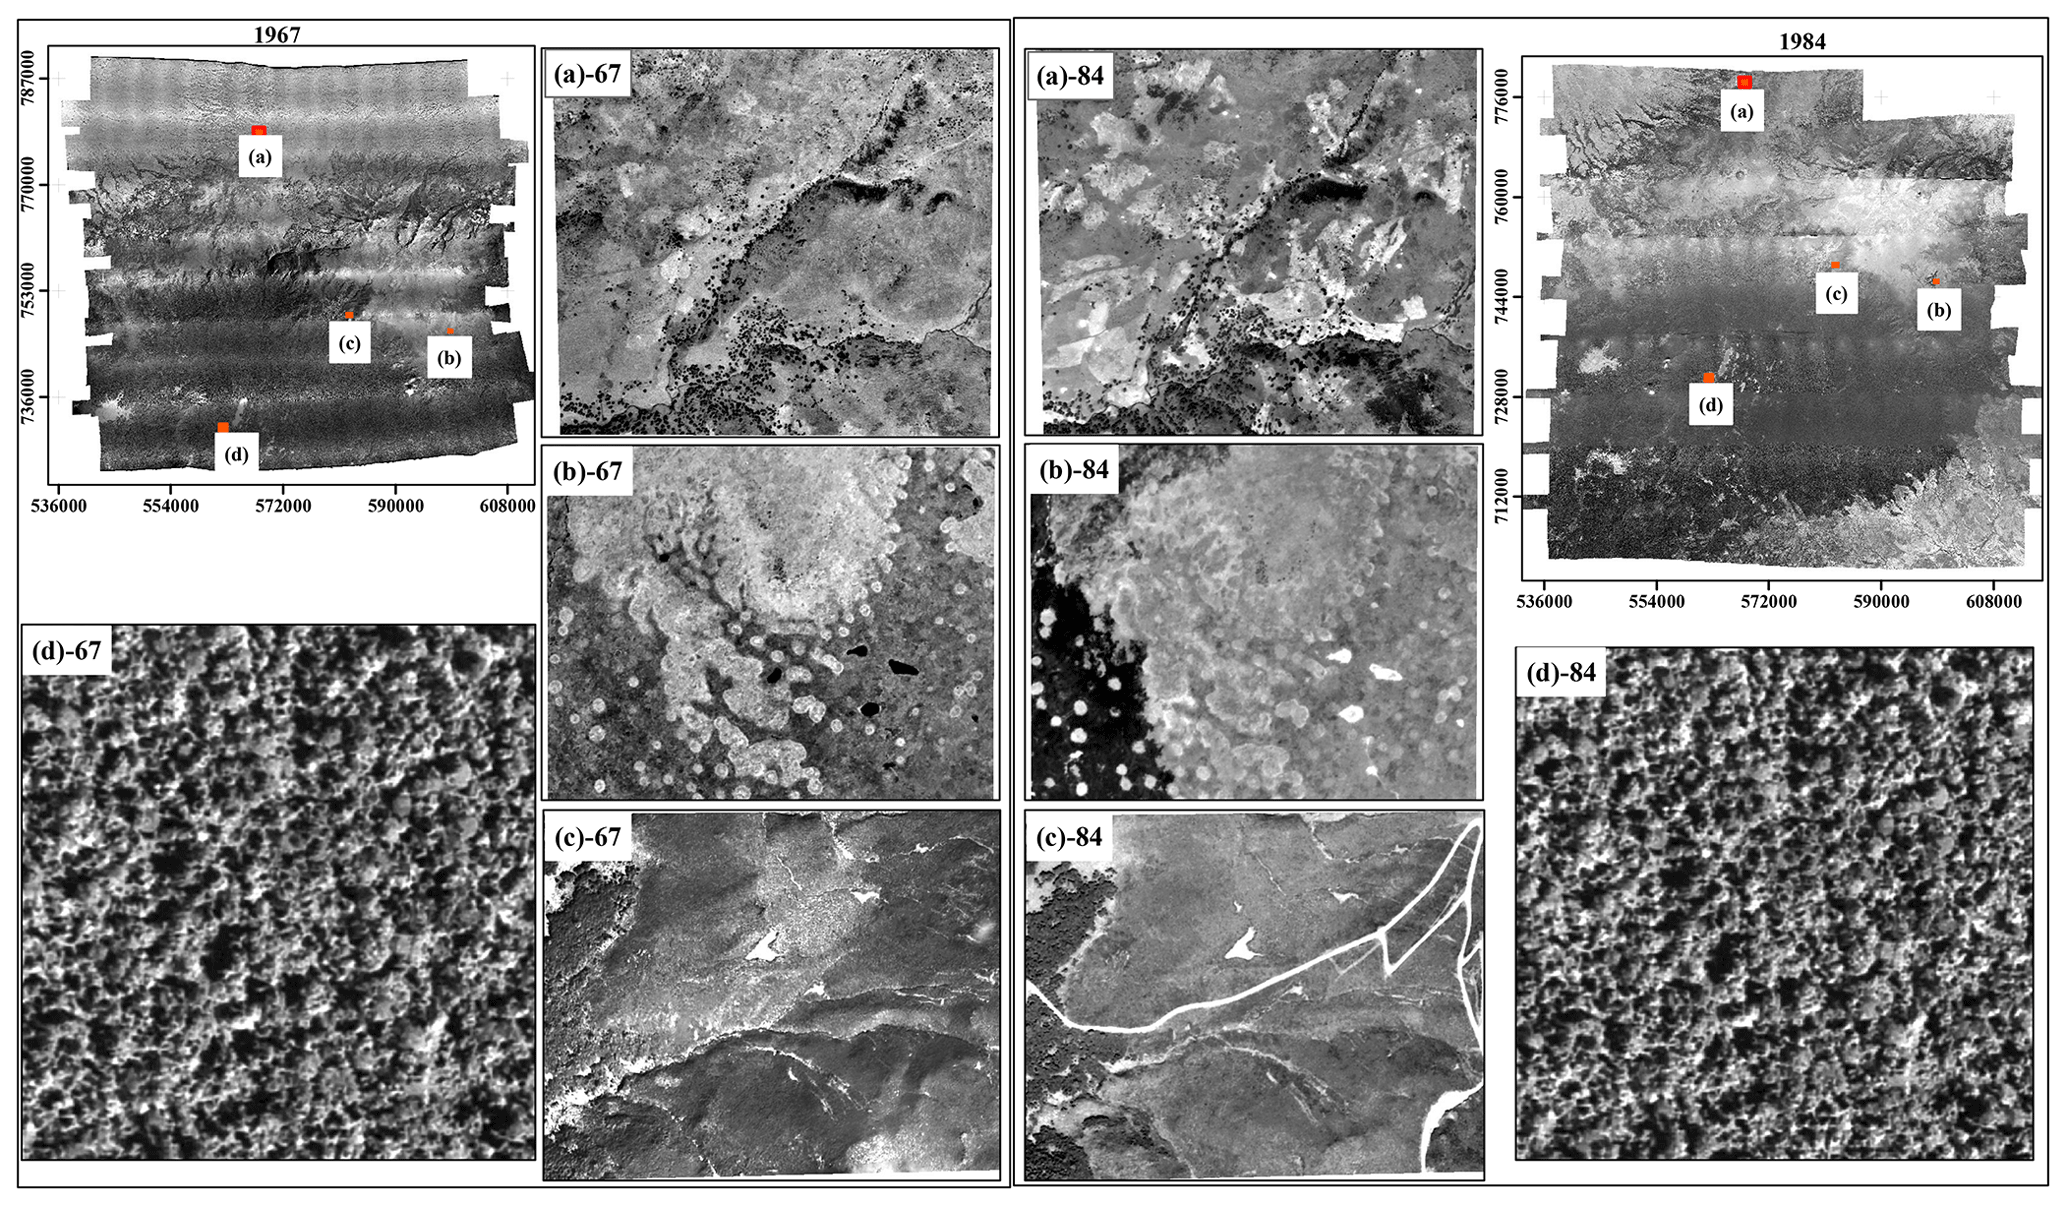
Figure 2Orthomosaics generated for 1967 (a) -67 to (d) -67 and 1984 (a) -84 to (d) -84 showing encroachment and cultivation of land in the north-western portion of the study area. (a) -67 and (a) -84; forested area. (d) -67 and (d) -84; wetland area with earth mounds of ground-dwelling small mammals. (b) -67 and (b) -84; gravel road construction in 1984. (c) -84; no visible road constructed in 1967. (c) -67.
2.3.2 Principal points
A principal point is a point in the precise centre of a photograph. Its coordinates indicate the perpendicular interception of the optical axis of the lens with the sensor plane (Tables S5 and S6 in the Supplement). For the year 1967, easting and northing of the principal points (camera positions) were digitized from the scanned and georeferenced topographic flight index map, which included points of camera positions and polygons of consecutive aerial photograph coverage. Elevation data of the principal points were extracted using Google Earth. For the 1984 HAPs, the principal points were extracted from aero-triangulation documents at the Geospatial Information Institute of Ethiopia. However, the camera pose is estimated in a structure-from-motion multi-view stereo workflow and is not necessarily needed. Both the film principal points and camera positions play vital roles in the workflow by enhancing the quality of the image alignment step in the reconstruction process. For more details, see Supplement Tables S3 and S4.
2.3.3 Fiducial marks
Fiducial marks are markers rigidly connected to the centre or corners of the camera body. When the film is exposed, these marks appear on the film negative. Fiducial marks and their coordinates were used as input for the processing of scanned HAPs during the camera calibration workflow stage. Fiducial marks present in the scanned images were utilized to rectify film shrinkage and linear deformation. This incorporation enhanced the robustness of the reconstruction process. They were used for the calculation of internal camera calibration parameters. For more details, see Supplement Figs. S3 and S4 along with Tables S5 and S6.
2.3.4 Ground control points
GCPs are locations on the ground localized by a spatial coordinate reference system. GCPs have a dual purpose as they can be used to reconstruct the digital terrain model and/or to determine the accuracy and impact of processing parameters. Without the use of GCPs, the reconstruction from the imagery could have errors in scale and orientation as well as incorrect absolute position information. Thus, they were used to georeference the aerial camera data; 76 on-image selected GCPs were extracted from Worldview-1 satellite imagery (DigitalGlobe Foundation) from Groos et al. (2021) and Google Earth. These included 49 and 27 GCPs used to georeference the 1967 and 1984 HAPs, respectively, as their acquisition and flight index differed. For more details, see Supplement Table S7.
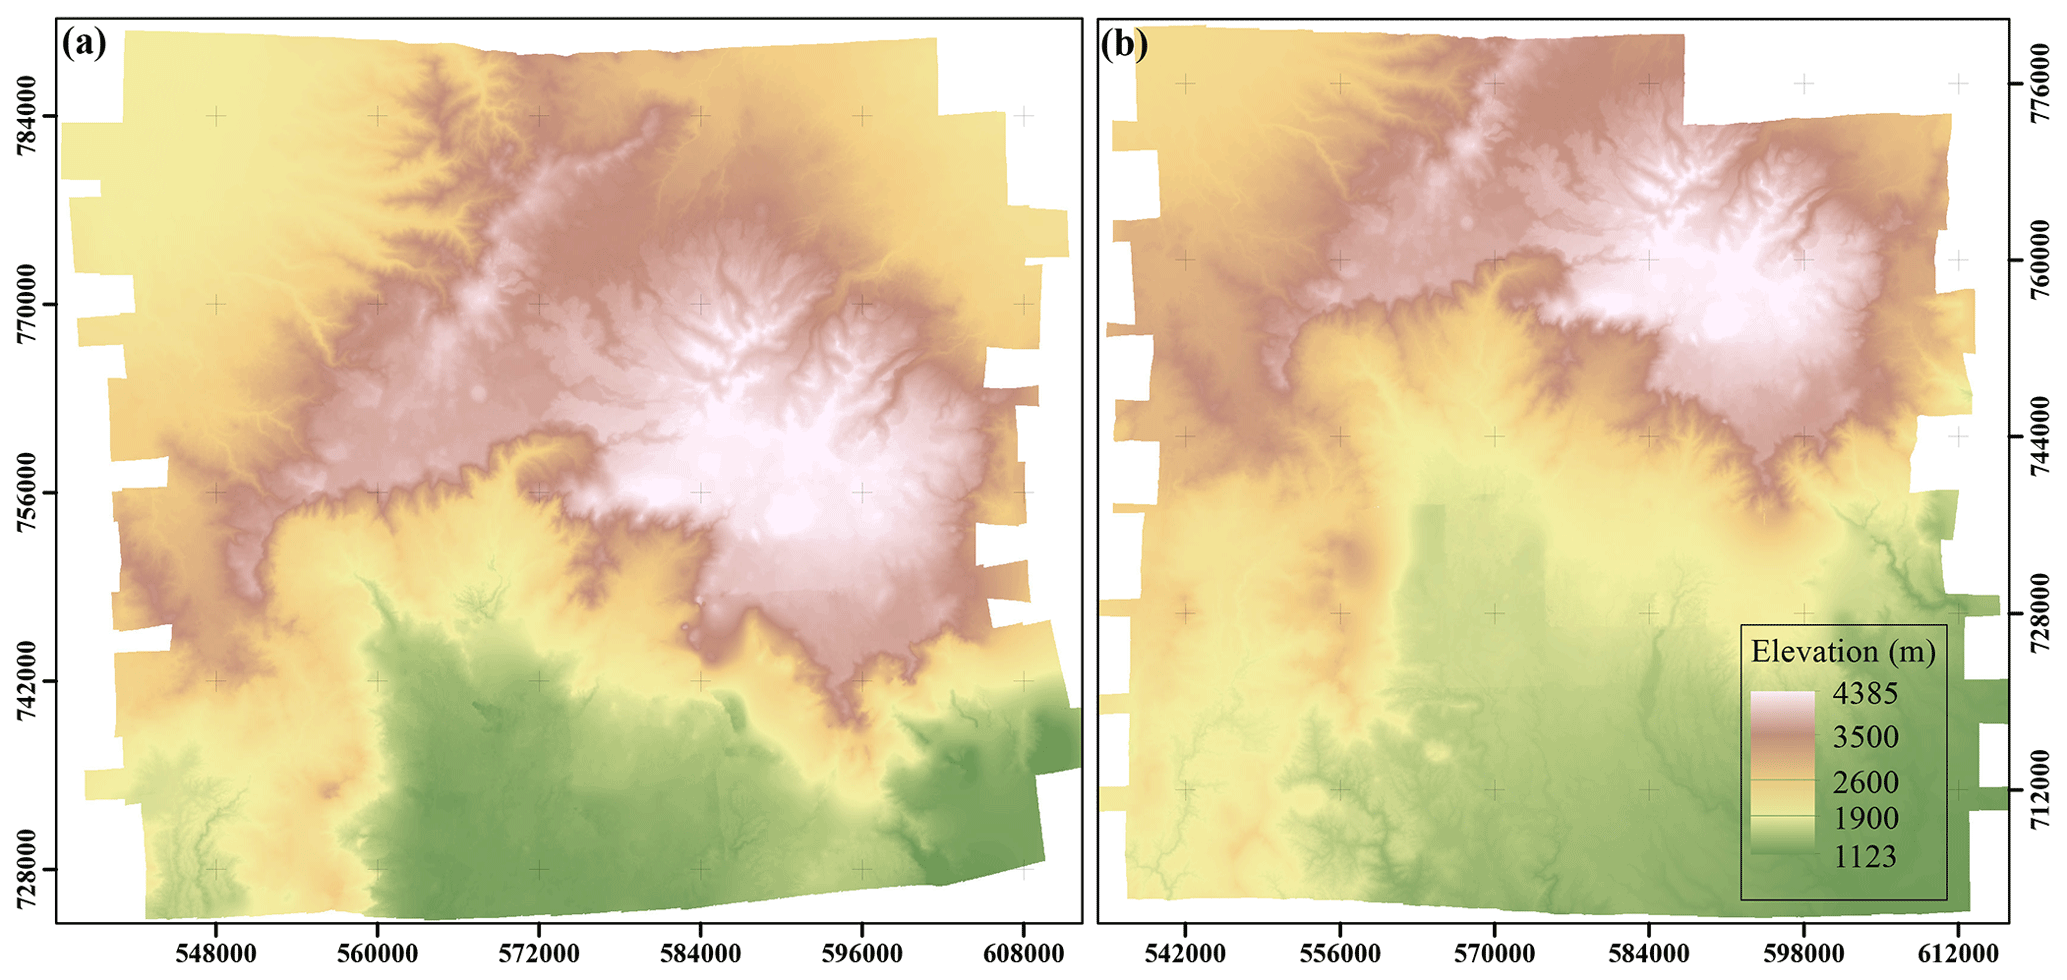
Figure 3Digital elevation models generated for the afro-alpine ecosystem of the Bale Mountains in Ethiopia based on scanned historical aerial photographs for the years 1967 (a) and 1984 (b).
Data processing was performed using the structure-from-motion multi-view stereo photogrammetry methodology by assigning appropriate values and settings in the main steps of loading the aerial photographs; aligning the cameras; building a dense point cloud, mesh, digital elevation model, and orthomosaic; and lastly exporting all the results (Fig. 14).
3.1 Structure-from-motion multi-view stereo photogrammetry
Traditional digital photogrammetry requires the 3D position and camera poses or the 3D position of a series of control points to be known to reconstruct a 3D structure from 2D overlapping photographs. SfM is the process of estimating the 3D structure of a scene from a series of 2D images with the absence or presence of camera exposure locations and GCPs. SfM uses the scale-invariant feature transform algorithm (Lowe, 2004) and Hessian-based detectors (Lindeberg, 1998) to address the problem of identification of features in the individual images used for image correspondence, especially for the reconstruction of DEMs and orthomosaics using scanned historical aerial photographs. In this step camera pose and scene geometry are reconstructed in the automatic identification of matching features in multiple images. In our workflow SfM is a specific step that provides camera parameters and a sparse point cloud (Daniotti et al., 2020). Then, dense image-matching algorithms, such as MVS, are used in a subsequent step to densify the point cloud. MVS will capture more angles in between instead of taking two photos from two different viewpoints to increase durability, for example for image noise or surface texture (Wu et al., 2018). The MVS algorithm handles images with more different perspectives, such as sets of images that surround objects, and can also handle very large numbers of images (Fig. 13).
The whole above-mentioned process is referred to as SfM–MVS photogrammetry, with a workflow methodology including multiple different algorithms, computer vision, photogrammetry, and more conventional survey techniques (Eltner and Sofia, 2020). It is applicable for soil erosion, volcanology, glaciology, coastal morphology, mass movements, and fluvial morphology. It was used in at least 65 scientific studies from 2012 to 2015 (Eltner et al., 2016) and also recently (Grottoli et al., 2020; Nyssen et al., 2022; Tomczyk and Ewertowski, 2021). The advantages of SfM–MVS photogrammetry are that it can be applied fully automated (Eltner et al., 2016); is flexible, efficient, and inexpensive; and requires little training (Iglhaut et al., 2019; Westoby et al., 2012). The following steps were sequentially applied for generating DEMs and orthomosaics with SfM–MVS photogrammetry. The whole process is also shown in Fig. 14.
Table 1Parameters, processing errors, and final product characteristics used and obtained in this study.
3.1.1 Aligning
This was the first step in the model generation process after data acquisition to generate tie points and match corresponding features using the scale-invariant feature transform algorithm (Lowe, 1999). It identifies and extracts the important points present in the photographs by interest operators using different characteristics like lighting, colour, and rotation. Once identified, the exact same points are coupled using the concept of Euclidean distance.
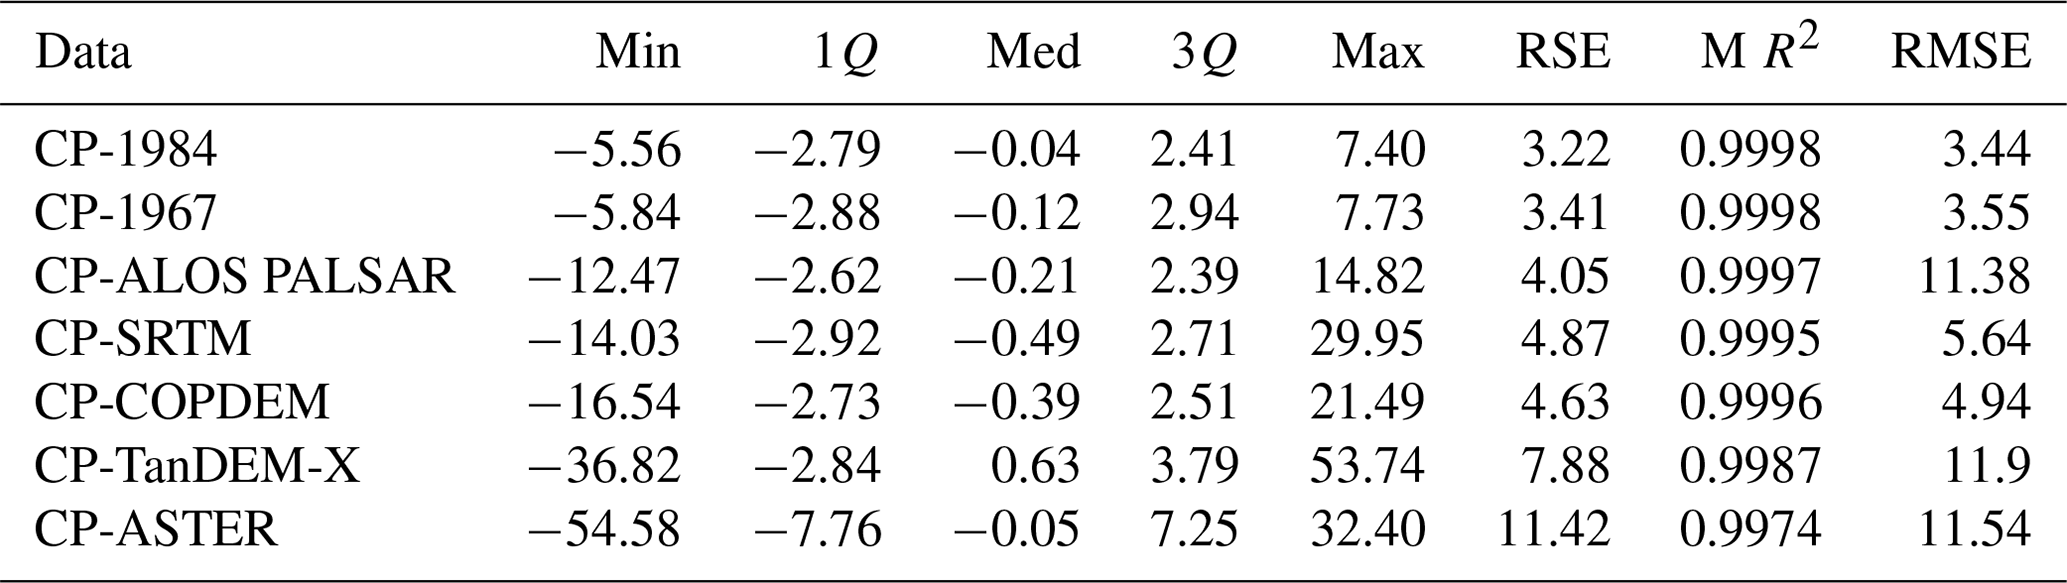
Table 2External altitude (elevation) accuracy assessment showing statistical differences between the control points and the respective points in the seven DEMs (Min: minimum elevation difference from the field control points, 1Q: first quantile, Med: median, 3Q: third quantile, Max: maximum elevation difference from the control points, RSE: residual standard error, M R2: multiple R-squared, and RMSE: root mean square error).
3.1.2 Bundle adjustment
Bundle adjustment was used to calculate individual camera positions and the relative positions of corresponding features (Triggs et al., 2000). It is an approach in the SfM workflow that simultaneously recovers 3D structures, camera poses, and even intrinsic camera parameters. Thus, bundles of rays connecting the camera centres to 3D scene points and an iterative adjustment minimize the reprojection error. A least-squares approach was used to estimate the camera poses and 3D points presented by Eq. (1).
Assume that n 3D points are m seen views and let Xij be the projection of the ith point onto image j, where Q(aj,bi) is the predicted projection of point i onto image j and d (x, y) denotes the Euclidean distance between the image points represented by the inhomogeneous vectors x and y.
3.1.3 Multi-view stereo matching
Dense point clouds (multi-view stereo) and 3D surfaces (build mesh) were calculated using known camera parameters (camera focal length, coordinates of the image principal point, lens distortion coefficients, omega, phi, and kappa) and with the SfM points as ground controls. The Agisoft Metashape professional software uses a combination of area-based matching and feature-based matching algorithms to reconstruct the dense image. All pixels in all images were used, so the resulting dense model was similar in resolution to the raw photographs. The dense point clouds were classified using the parameters maximum angle, maximum distance, and cell size for automatic division of all the points.
3.1.4 Georectification
In this stage, the point cloud from an internal, arbitrary coordinate system was projected onto a geographical coordinate system. The 3D point clouds that were generated through SfM–MVS photogrammetry are in a relative image–space coordinate system and need to be aligned to a real-world object–space coordinate system. This transformation can be achieved using a 3D similarity transform based on either known camera poses, a small number of GCPs with known object–space coordinates, or a combination of the two. For the 1984 HAPs, the georectification process was completed by using the camera positions and focal lengths and for the 1967 HAPs by incorporating on-image selected GCPs with known coordinates.
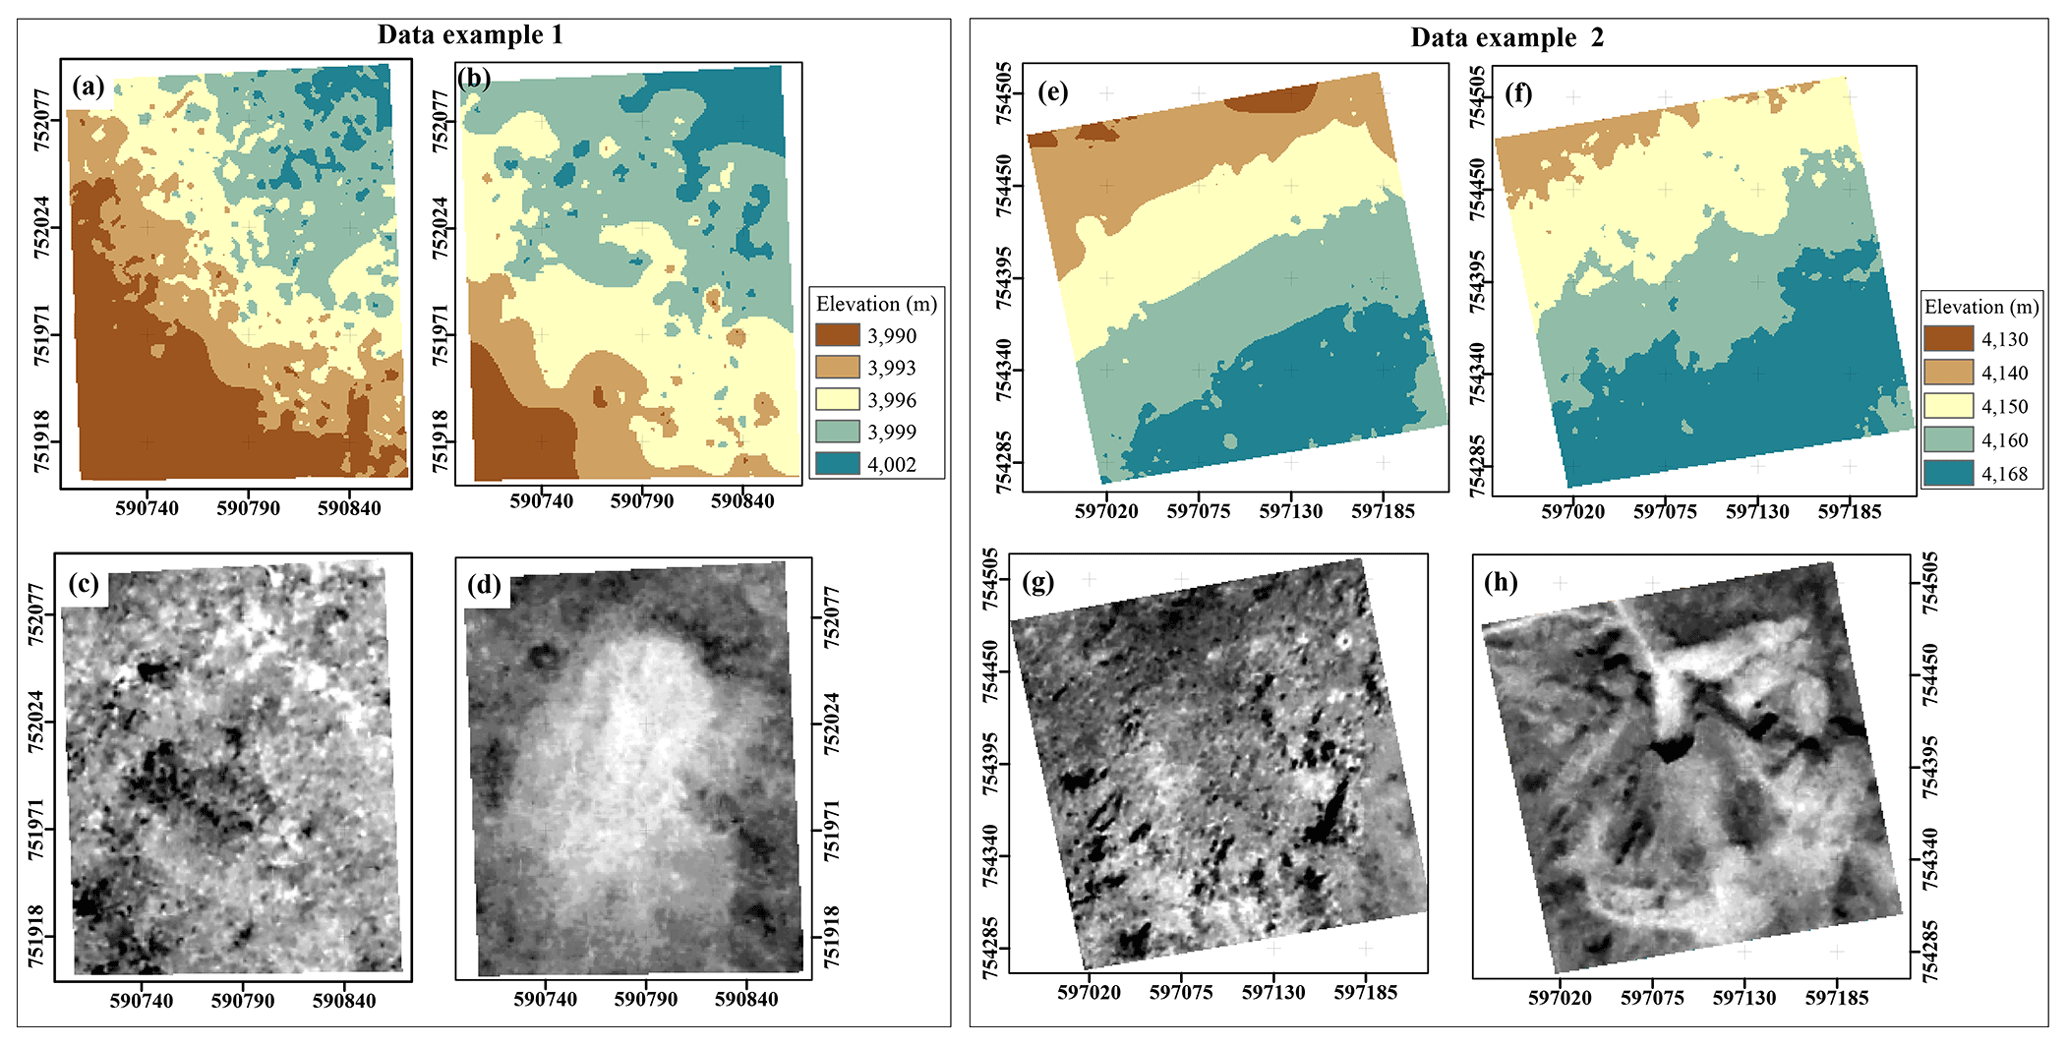
Figure 4Digital elevation model extent used to calculate the volumetric change in the study area for two example sites between the years 1967 and 1984: (a), (b), (e), and (f) for data examples 1 and 2 (see Fig. 1). Orthomosaics showing the planimetric extent of the extracted selected material: (c), (d), (g), and (h) at the centre of the study area, the Sanetti Plateau. The 1967 orthomosaics (c) and (g) depict no excavation. The 1984 orthomosaics (d) and (h) show the excavation on the Sanetti Plateau. See also Fig. 1.
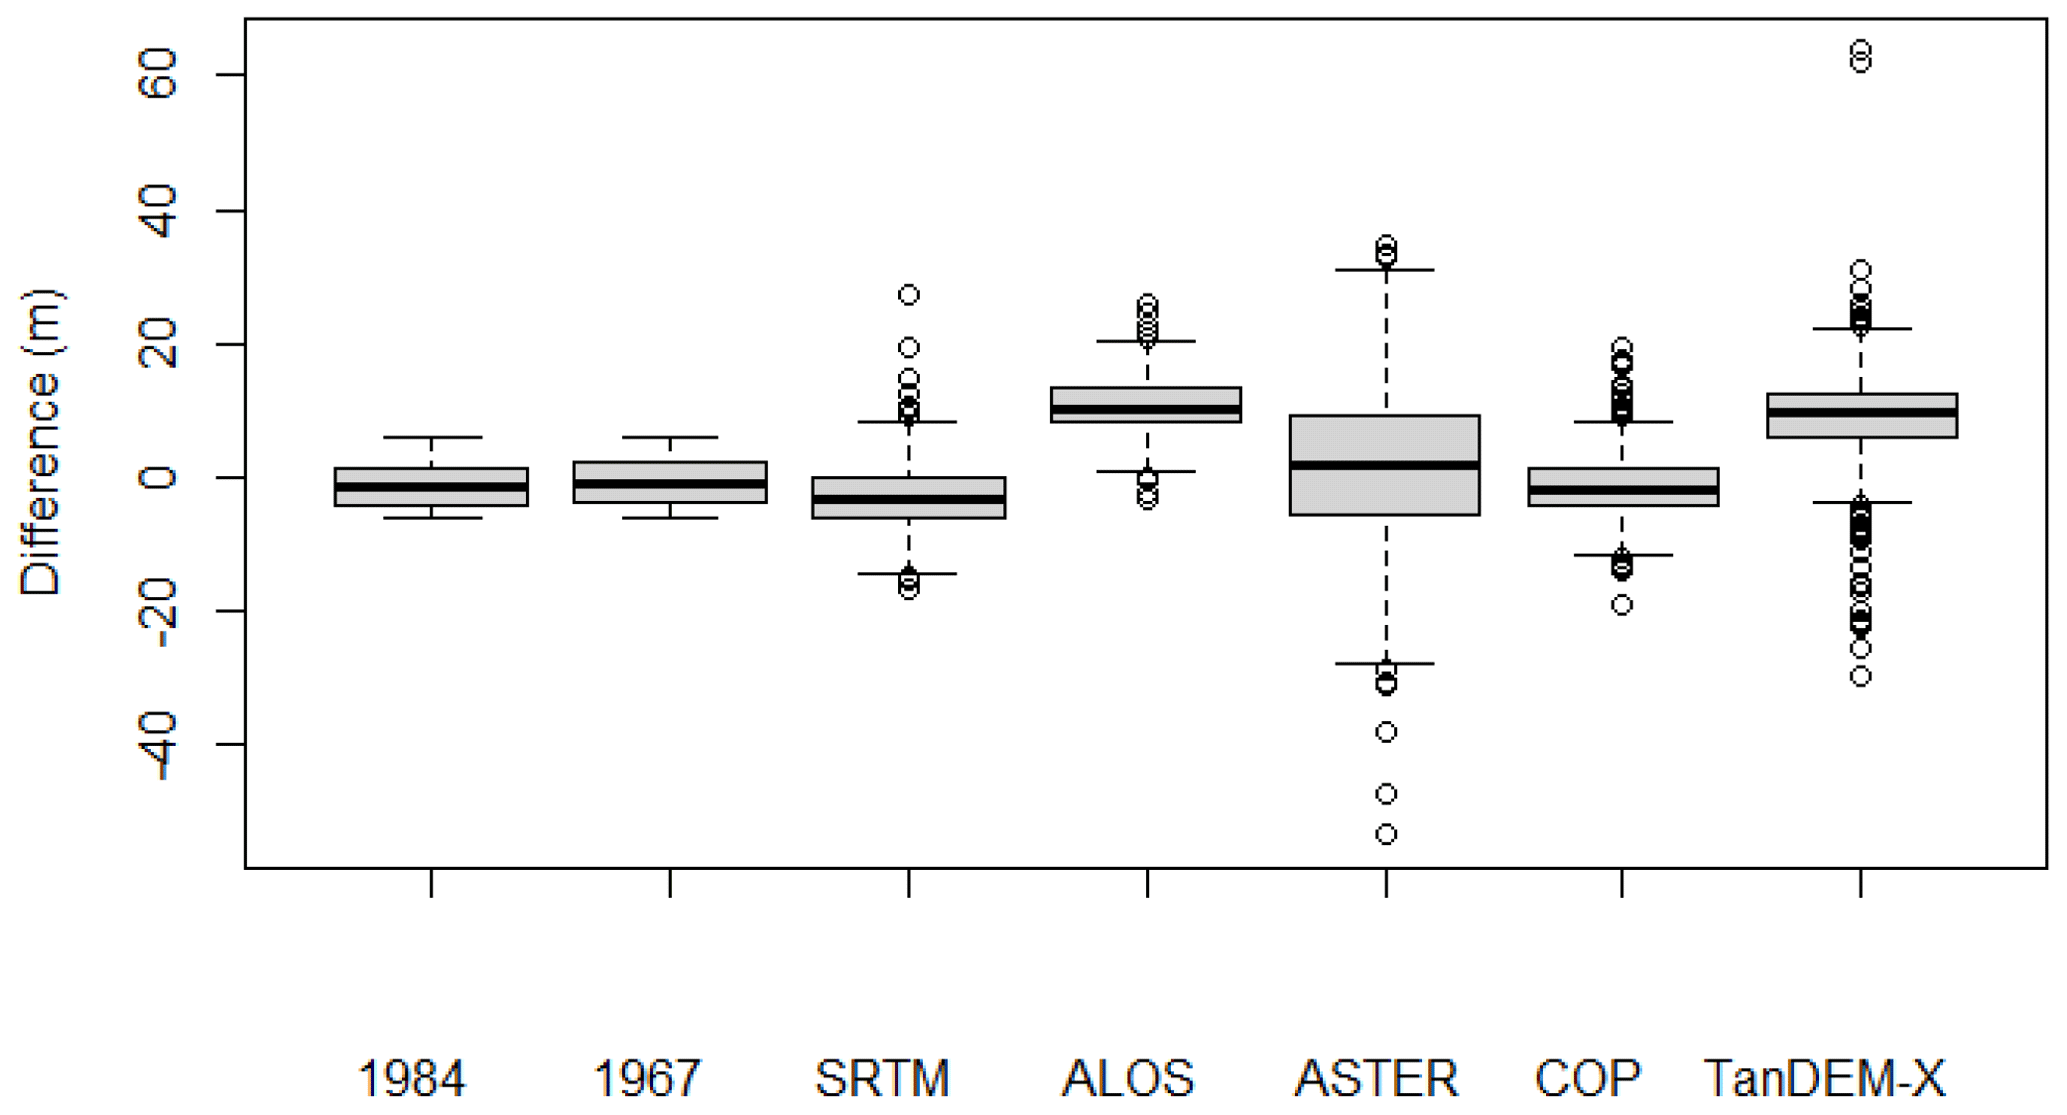
Figure 5Comparison of the distribution of the error in elevation value differences between each GPS control point collected in the field and the DEMs generated for the years 1984 and 1967 and the readily available DEMs: ALOS PALSAR, SRTM, ASTER, Copernicus (COP), and TanDEM-X.
3.1.5 Derivative product generation
In this step, the final DEMs and orthomosaics were created from the dense point clouds and 3D surfaces. The DEMs were generated from classified ground dense point clouds used as input, whereas the orthomosaics were generated using a mesh as input. For more details on the inputs and values used, see Supplement Table S9.
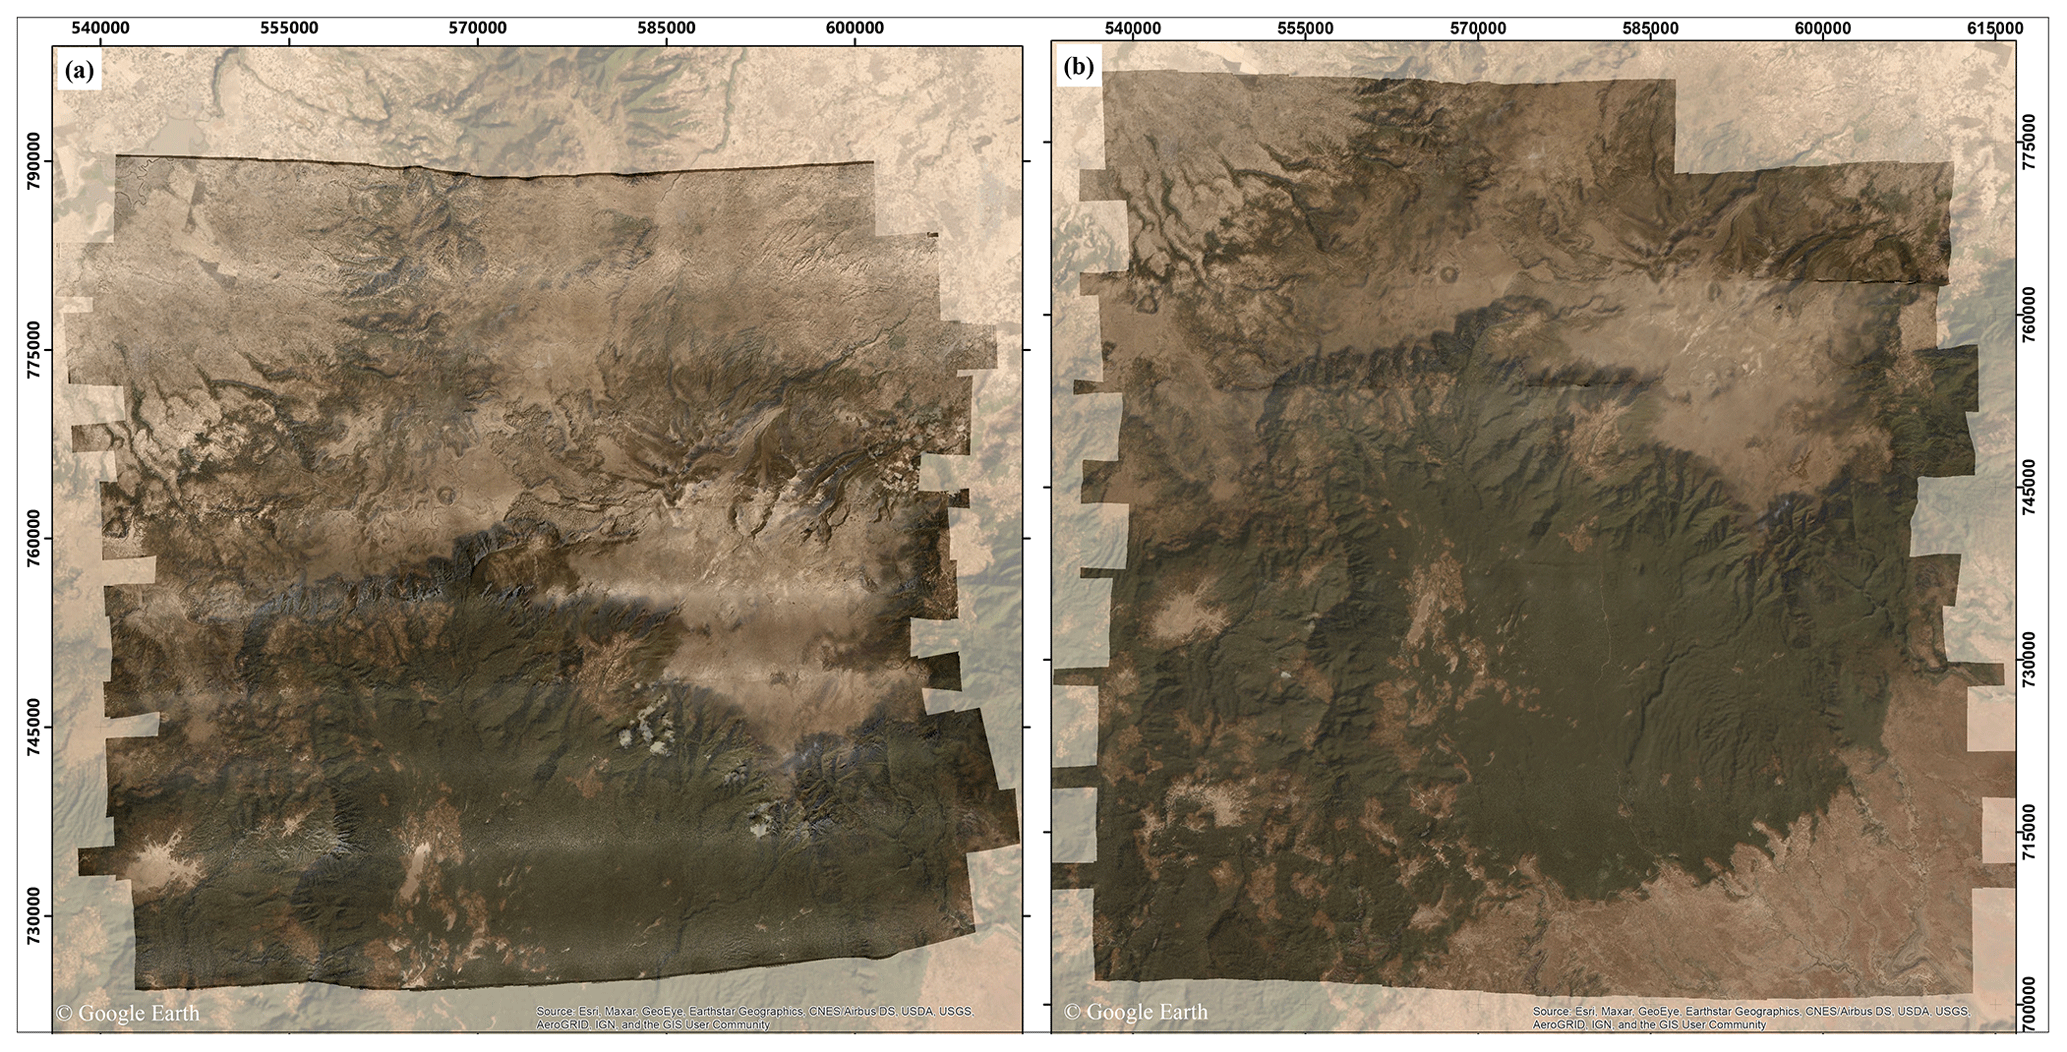
Figure 6Overlay snapshots of the orthomosaics for the years 1967 (a) and 1984 (b) over global © Google Earth images as a background (background data source: Esri, Maxar, GeoEye, Earthstar Geographics, CNES/Airbus DS, USDA, USGS, AeroGRID, IGN, and the GIS User Community).
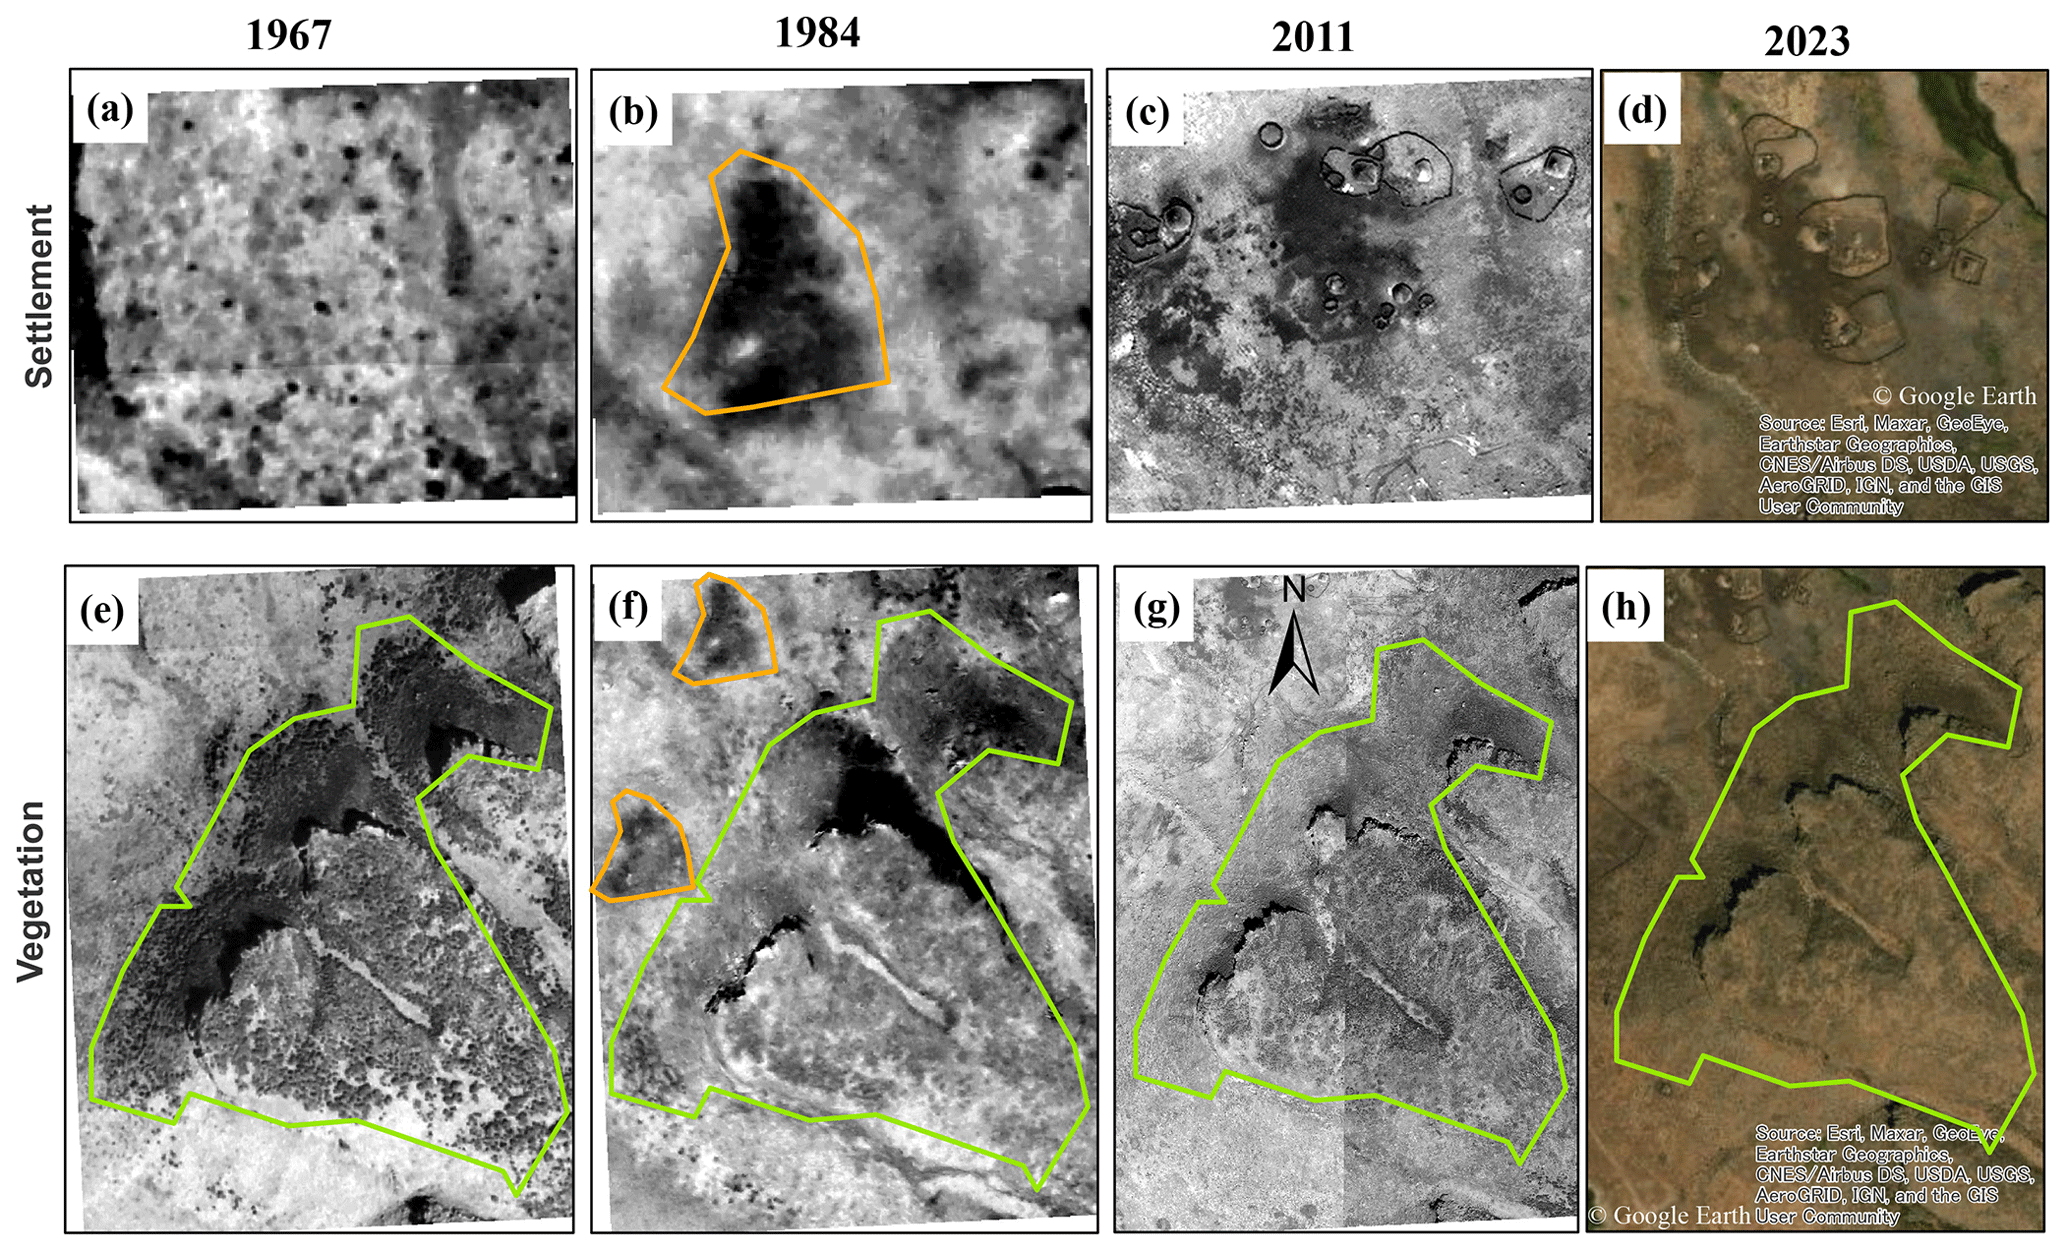
Figure 7Settler encroachment (top row) in Bale Mountains National Park, Ethiopia (encircled in yellow colour), and the associated vegetation deforestation (bottom row, encircled in green colour). Worldview-1 satellite image at 0.5 m resolution acquired in January 2011 (data sources for 1967 and 1984: own data; data source for 2011: Groos et al. (2021); data sources for 2023: Esri, Maxar, GeoEye, Earthstar Geographics, CNES/Airbus DS, USDA, USGS, AeroGRID, IGN, and the GIS User Community).
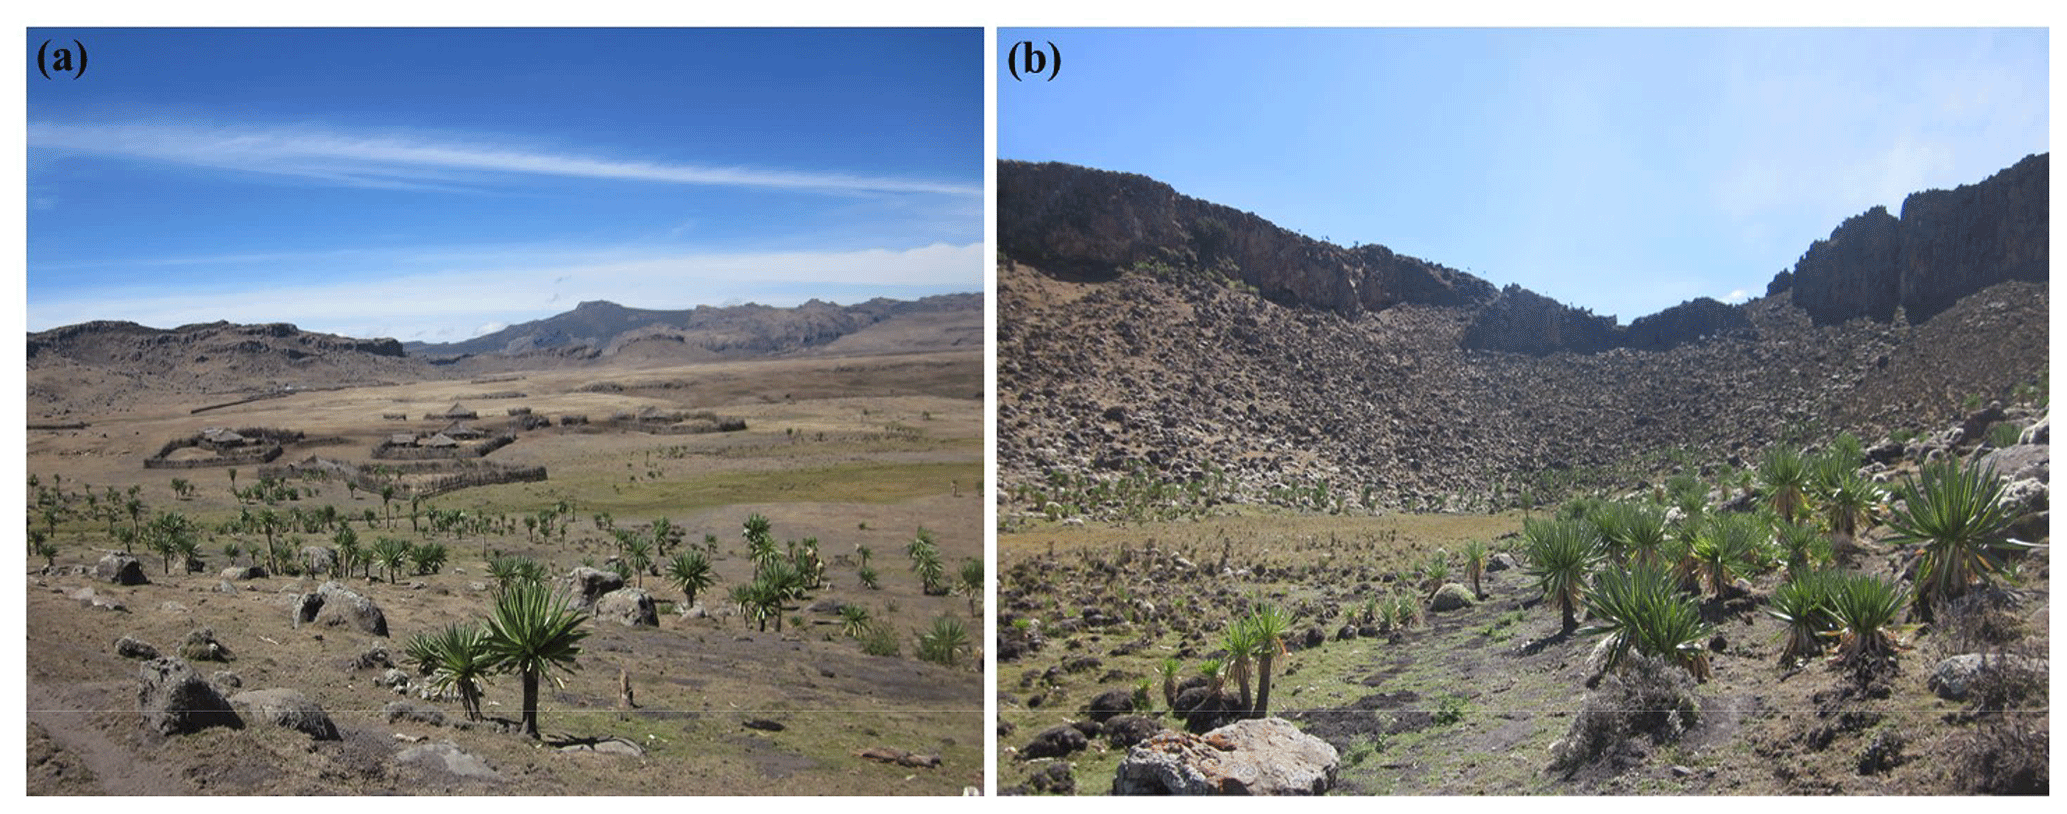
Figure 8Photograph taken in the field on 24 January 2020 showing (a) settlements and (b) Erica vegetation corresponding to the sites shown in Fig. 7. Location (a): ( N, E). Location (b): ( N, E).
The produced tie points resulting from the “align” step consisted of 412 903 (1967) and 450 071 (1984) filtered points, with low tie point reprojection errors ranging from 1.49 to 0.57 pixels, demonstrating the high quality of the image geometry network (Table 1). The dense point clouds consisted of 4 821 064 653 points for the 1967 HAPs and 6 501 301 603 points for the 1984 HAPs. These points were classified into ground points using the classification parameters maximum angle, maximum distance, and cell size of 37.5∘, 0.5, and 30 m, respectively. This approach takes the ruggedness of the topography and the different coverage of vegetation of the study area into consideration and improves the accuracy. The classified ground dense point clouds and the mesh were used to obtain a DEM and orthomosaic, respectively, with spatial resolutions of 0.84 and 0.98 m for 1967 and 1984 data (Figs. 2, 3, and 12). The resulting very-high-resolution DEMs showed the terrain and ruggedness clearly compared to other freely available low-resolution DEMs used for comparison and assessment (Fig. 12).
In a previous study, Frankl et al. (2015) processed 27 HAPs (both vertical and oblique) acquired in 1935 in the Suluh River Valley, Ethiopia, using SfM–MVS and produced orthomosaics with planimetric and elevation root mean square error (RMSE) accuracies of 30 and 50.7 m, respectively. However, the accuracy of our DEMs produced for the years 1967 and 1984 was higher, with RMSEs of 3.55 and 3.44 m, respectively (Table 2). This is due to the effects of different types of vegetation cover and terrain morphology (Aguilar et al., 2005; Spaete et al., 2011). Considering that the SfM–MVS method yields accuracies of one-thousandth of the viewing distance, the elevations above the ground surface at which our HAPs were collected (8300 m for 1967 and 5068 m for 1984) yield acceptable error values of 8.3 and 5 m, respectively, which were achieved with our data products.
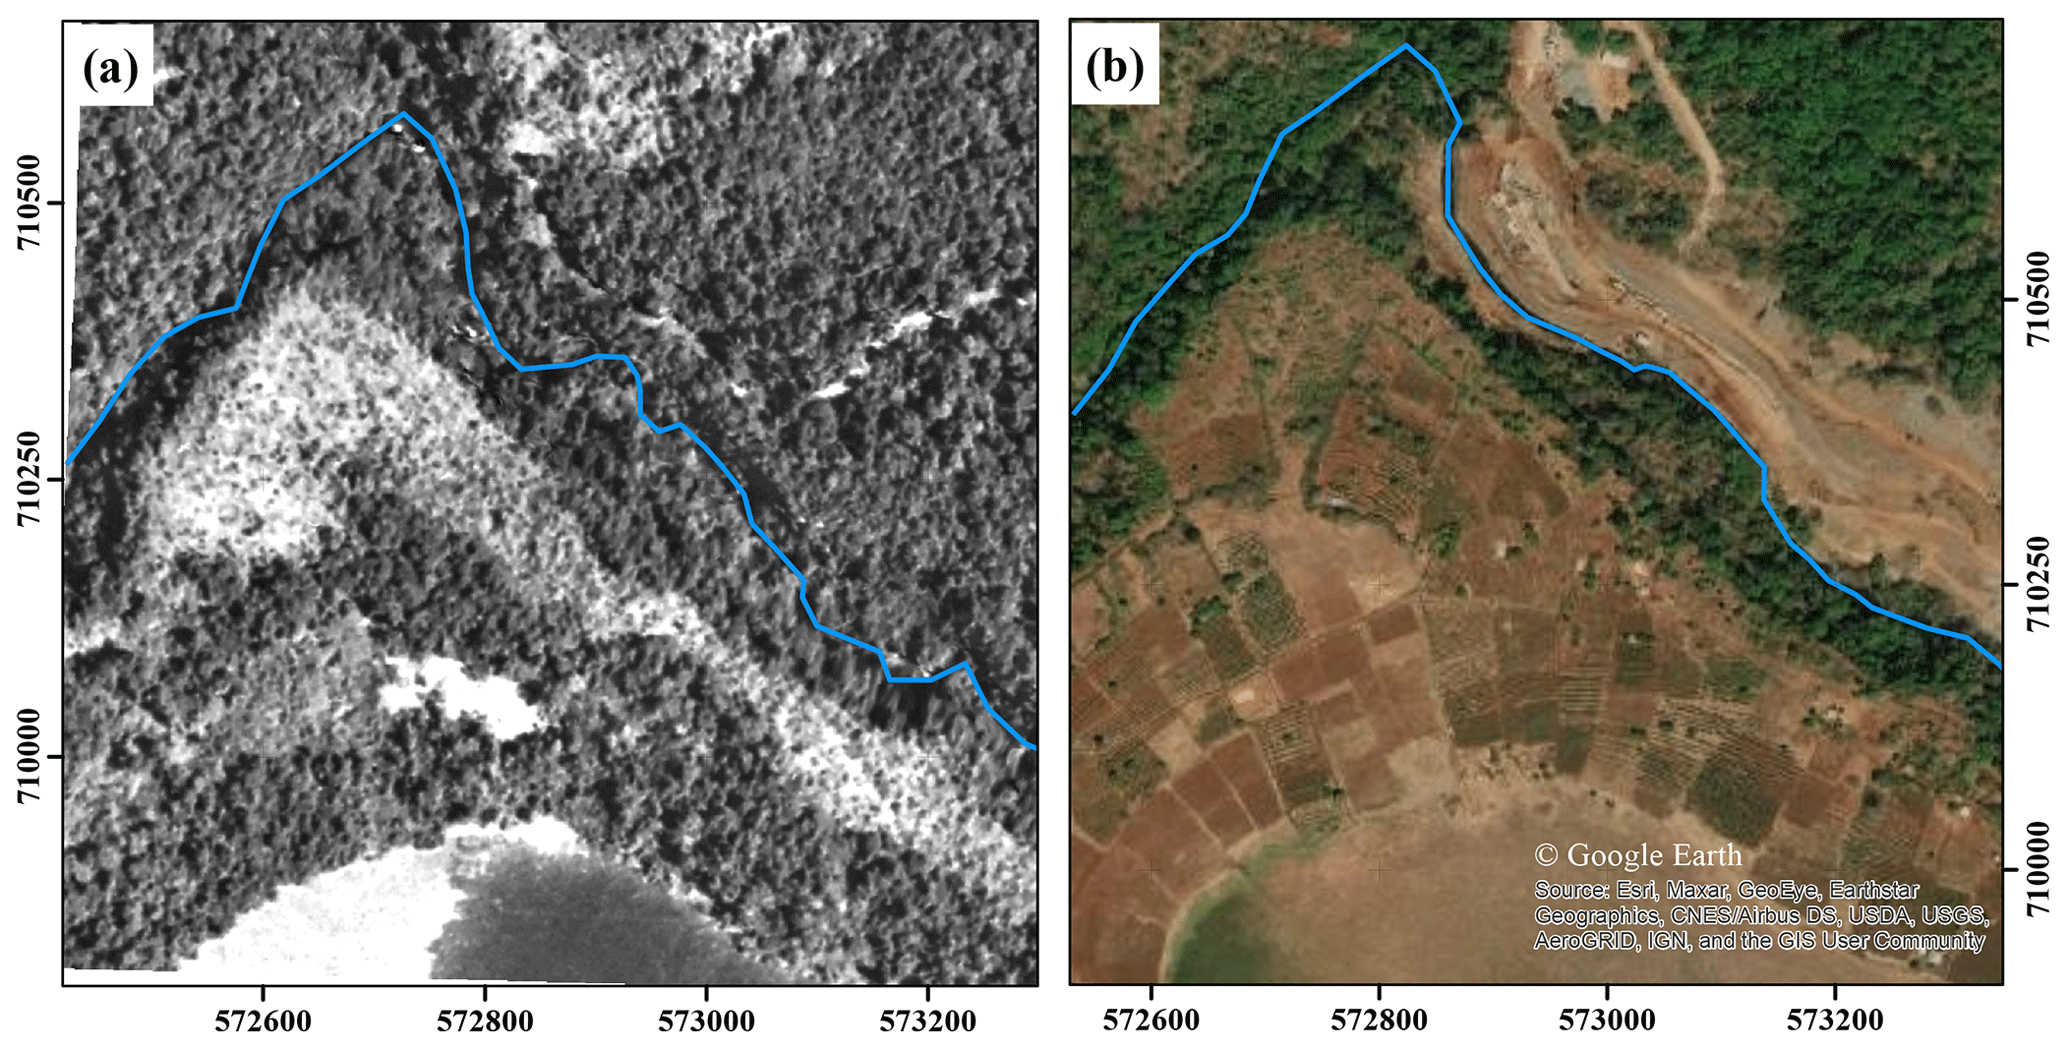
Figure 9The river course and riverside elevation have undergone significant changes since 1984, transforming from a forested river in that year (a) to their current appearance as seen in the © Google Earth image in panel (b). This specific location is situated in the southern part of the study area, approximately 21 km west of Delo Menna. The imagery source includes contributions from Esri, Maxar, GeoEye, Earthstar Geographics, CNES/Airbus DS, USDA, USGS, AeroGRID, IGN, and the GIS User Community. The provided image was captured on 15 December 2020.
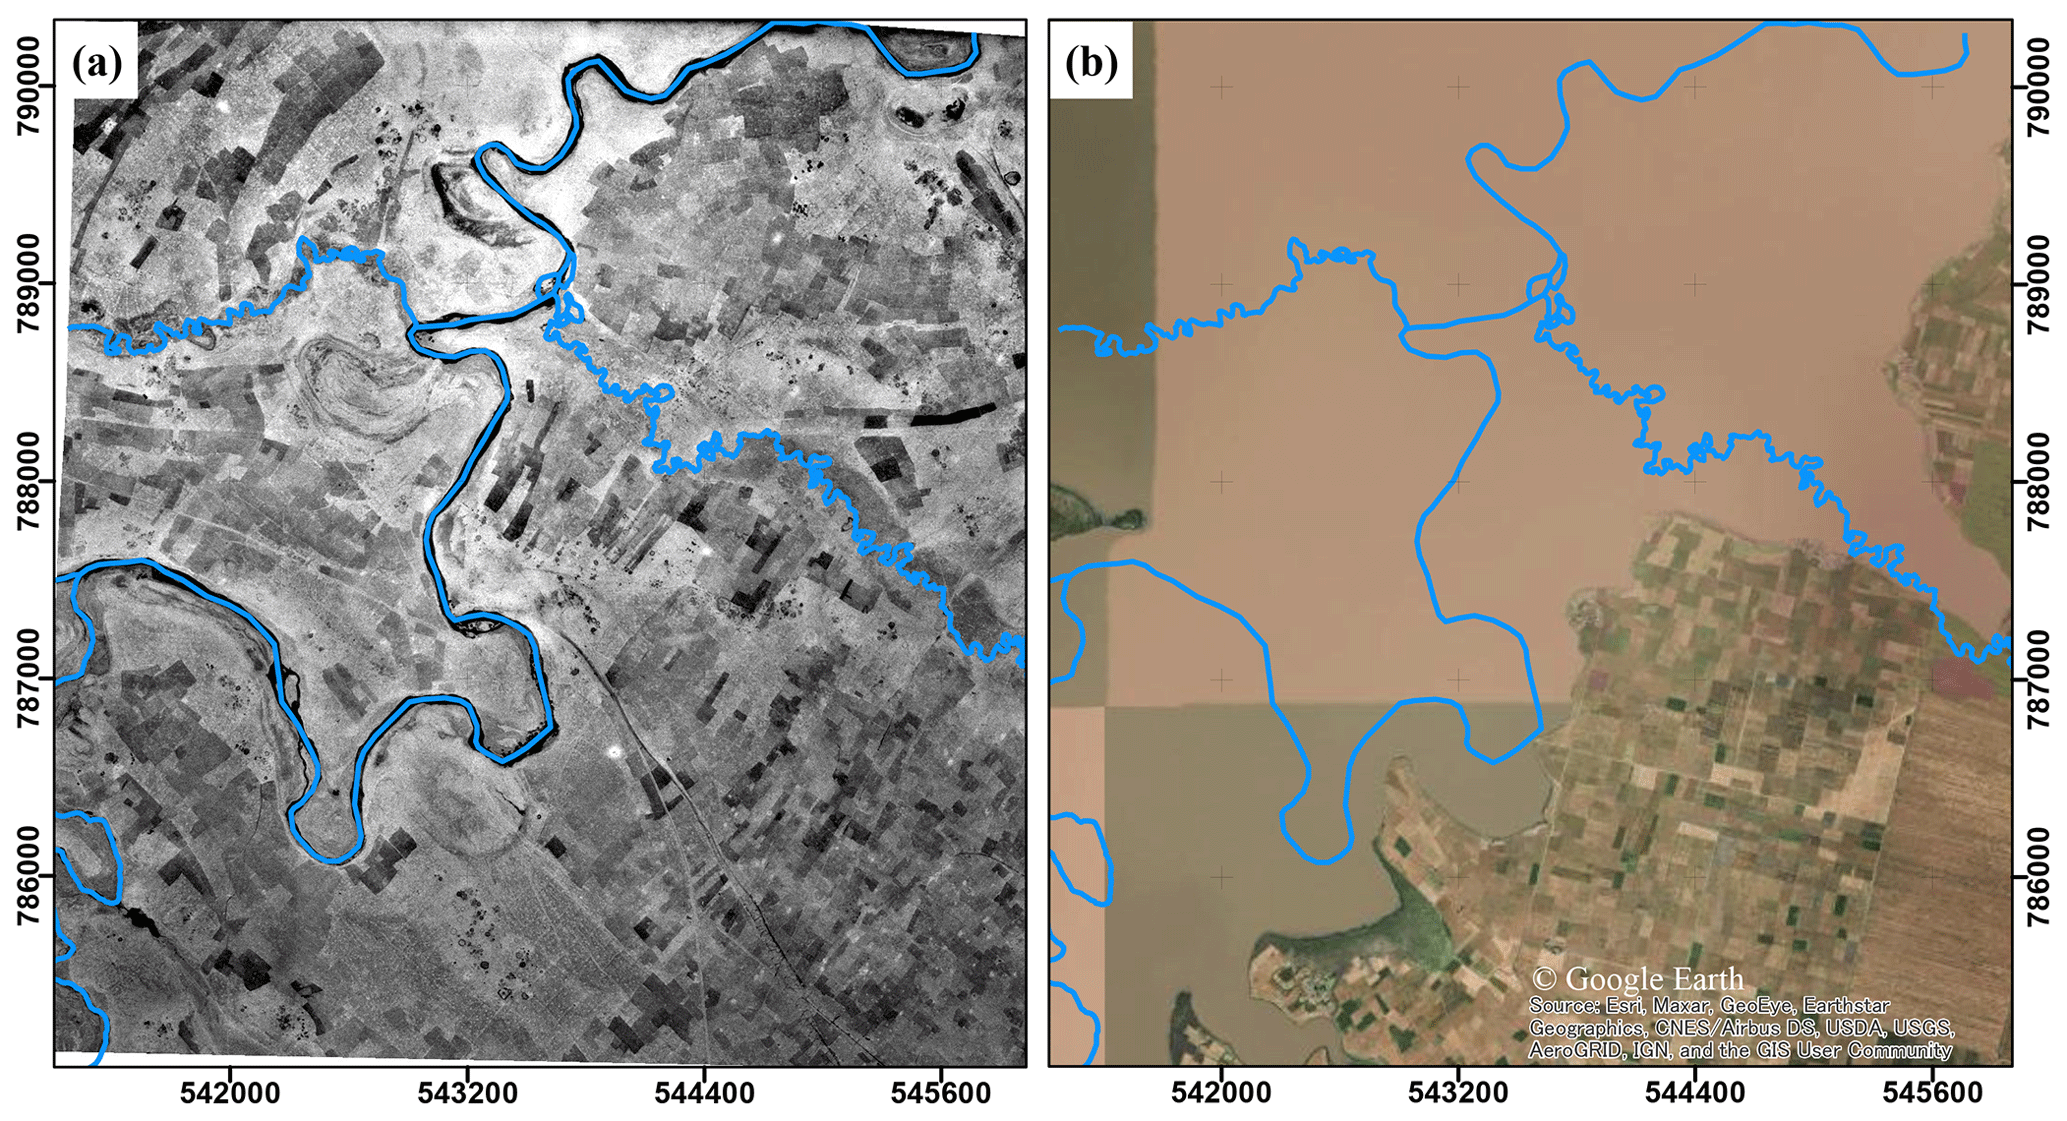
Figure 10A former river course (blue line) and agricultural area in 1967 (a) in the north-western corner of the study area changed to (b) an artificial lake dam for a hydroelectric power station currently viewed from a global © Google Earth image (sources: Esri, Maxar, GeoEye, Earthstar Geographics, CNES/Airbus DS, USDA, USGS, AeroGRID, IGN, and the GIS User Community) taken on 30 November 2021.
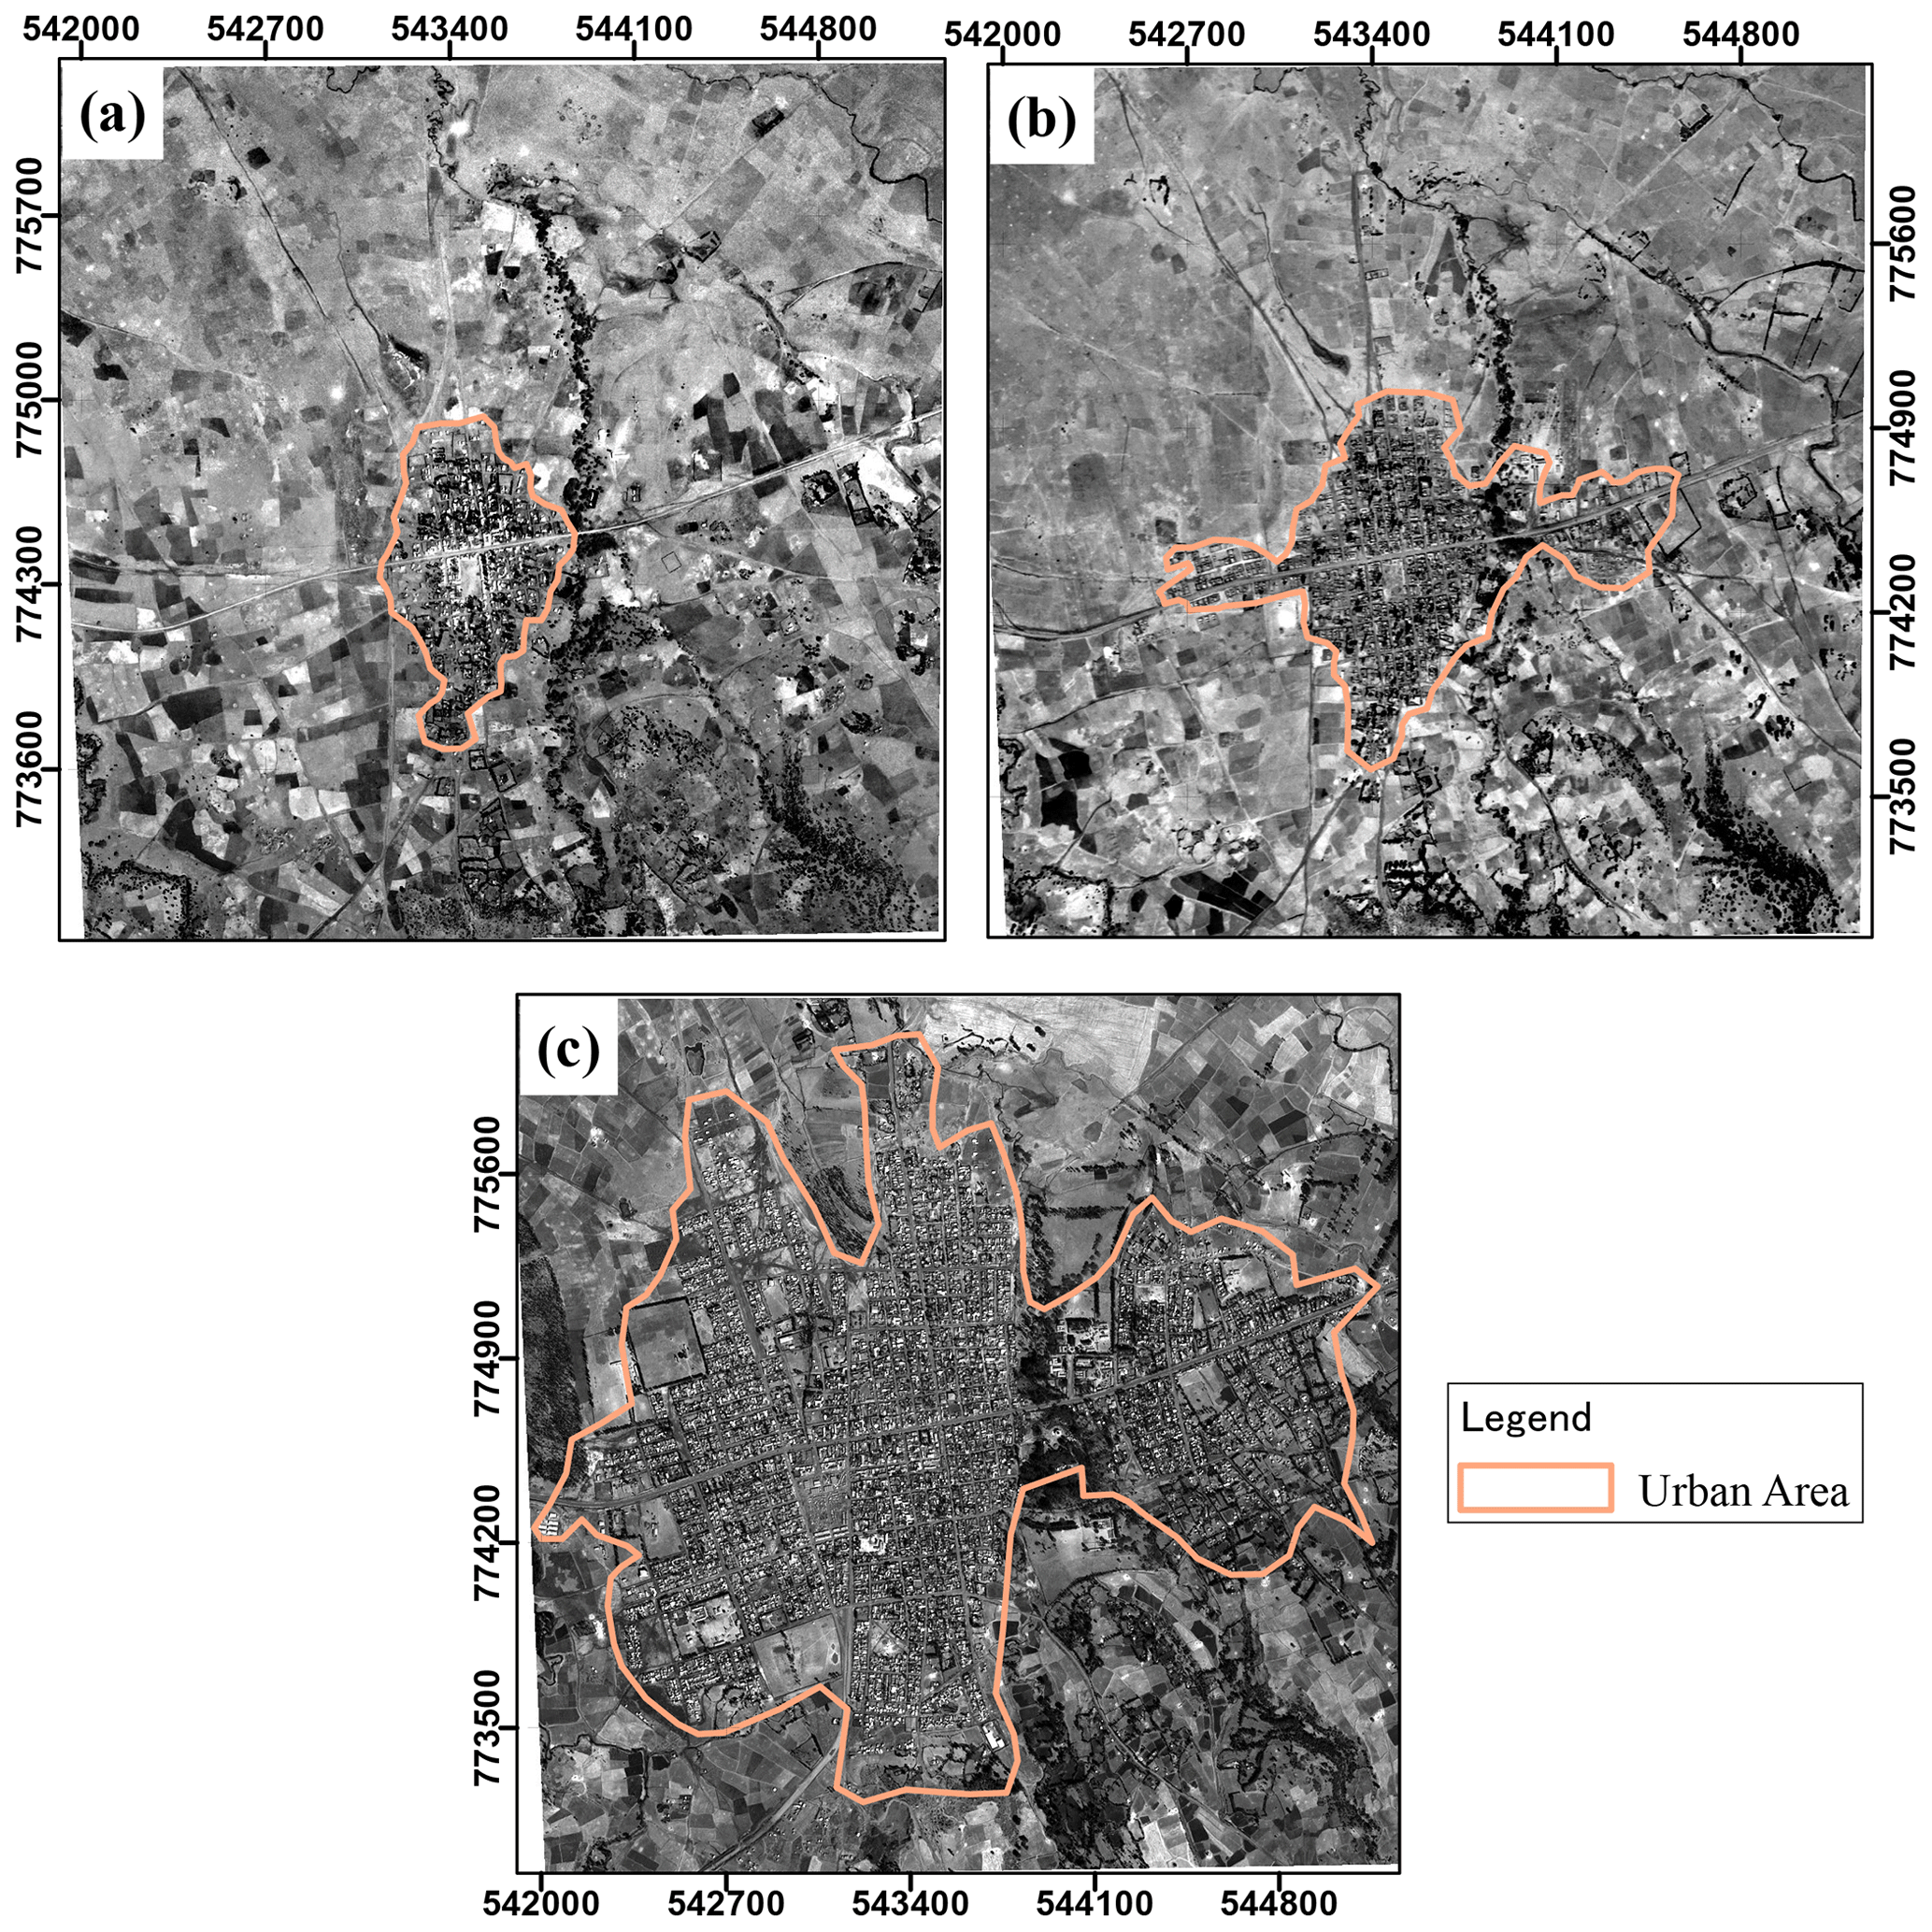
Figure 11Extent of the urban area of Adaba in 1967 (a), 1984 (b), and 2017 (c) situated on the north-western extent of the study area (sources: 1967 and 1984 are presented here for an orthomosaic and, for 2017, a SPOT-7 panchromatic image from the Geospatial Information Institute of Ethiopia).
The orthomosaics and DEMs provided here will help to identify areas where changes in environmental characteristics occurred (e.g. encroachment of humans or deforestation of the ericaceous vegetation in the north-western part of the study area). For example, it became clear from our data that there was no severe human interference or deforestation before 1967. However, the 1984 orthomosaics provide evidence that people began intruding into Bale Mountains National Park and degrading the land by clearing vegetation near the settlements (Figs. 7 and 8).
4.1 Use case studies
The generated datasets can be used for different applications, and we give some brief examples of five use cases here. Firstly, within our study area, in two locations soil material was excavated and used for constructing and repairing a gravel road (Fig. 4). An example volumetric analysis was done with Agisoft Metashape Professional Edition software (AgiSoft LLC, 2021) for the selected sites. The volumetric change calculated from the 1967 and 1984 DEMs revealed that the removed soil was 14 728.9 m3 for data example 1 (Fig. 4a, b) and 97 352 m3 for data example 2 (Fig. 4e, f).
Secondly, the number of settlements in the afro-alpine ecosystem and central parts of Bale Mountains National Park increased (Fig. 7). There was not much human interference and deforestation until 1967. However, encroachment by humans and degradation of the vegetation were visible from 1984 onwards (Figs. 7 and 8). This is complemented by Reber et al. (2018), who found 870 settlements and 331 rock shelters in only the afro-alpine ecosystem of Bale Mountains National Park.
Thirdly, the resulting orthomosaic datasets could be used as an input to compare the historical distribution of ericaceous species to today's recent distribution in the Bale Mountains and in particular to detect the historical development of the Erica patches scattered across the Sanetti Plateau given the detailed resolution of our datasets. In addition, Mekonnen et al. (2023) examined potential factors responsible for the now fragmented occurrence of Erica on the Sanetti Plateau, which is possibly also due to the topography of the area (Mekonnen et al., 2023). The distribution of the giant root rat over the Sanetti Plateau and the adjacent valleys in the north-western parts of the study area was predicted by Wraase et al. (2023). However, this study could be extended in the future by analysing the historical distribution shift of the giant root rat and further explaining its effect on the landscape and its ability to change landscapes.
Fourthly, the very-high-resolution information from the 1984 orthomosaic can be employed for river and riverside altimeter change assessments (Fig. 9). Already visible by using the orthomosaics is that the river named Welmel Tika and its side changed in both width and altitude, thereby reducing previously forested area.
Lastly, our generated datasets are useful for studying changes in surface geomorphology and urban areas. Currently, in the north-western corner of the study area above Adaba, there is an artificial lake dam called Melka Wakena that was built for hydroelectric power generation. Back in 1967 the area was cultivated land and had a river course inside today's dam (Fig. 10). The urban area of Adaba in the north-western part of the study area, for example, also expanded from 53.83 ha in 1967 to 107.09 ha in 1984 and to 475.79 ha in 2011 (Fig. 11).
4.2 Quality assessment
The quality of our generated DEM dataset was assessed based on external and internal accuracy assessment. For external accuracy assessment, the quality of the resulting DEM dataset was assessed by using external sources, i.e. 509 GPS control points (CPs) collected in the field as reference points as well as ASTER GDEM (30 m), SRTM DEM (30 m), COP-DEM (30 m), TanDEM-X DEM (90 m), and ALOS PALSAR (12.5 m) points for both 1967 and 1984. The values of elevation (in metres) for each CP from each of the DEMs were extracted, and then accuracy assessment was done using linear regression models by comparing the descriptive statistics of the elevation, minimum elevation difference with field control points, first quantile, median, third quantile, maximum elevation difference from CPs, residual standard error, multiple R-squared correlation coefficient, and root mean square error. Comparing the 1967 and 1984 DEMs with external globally freely available DEMs is beneficial and gives additional information regarding the accuracy of DEMs with complex topography like the present in our study area.
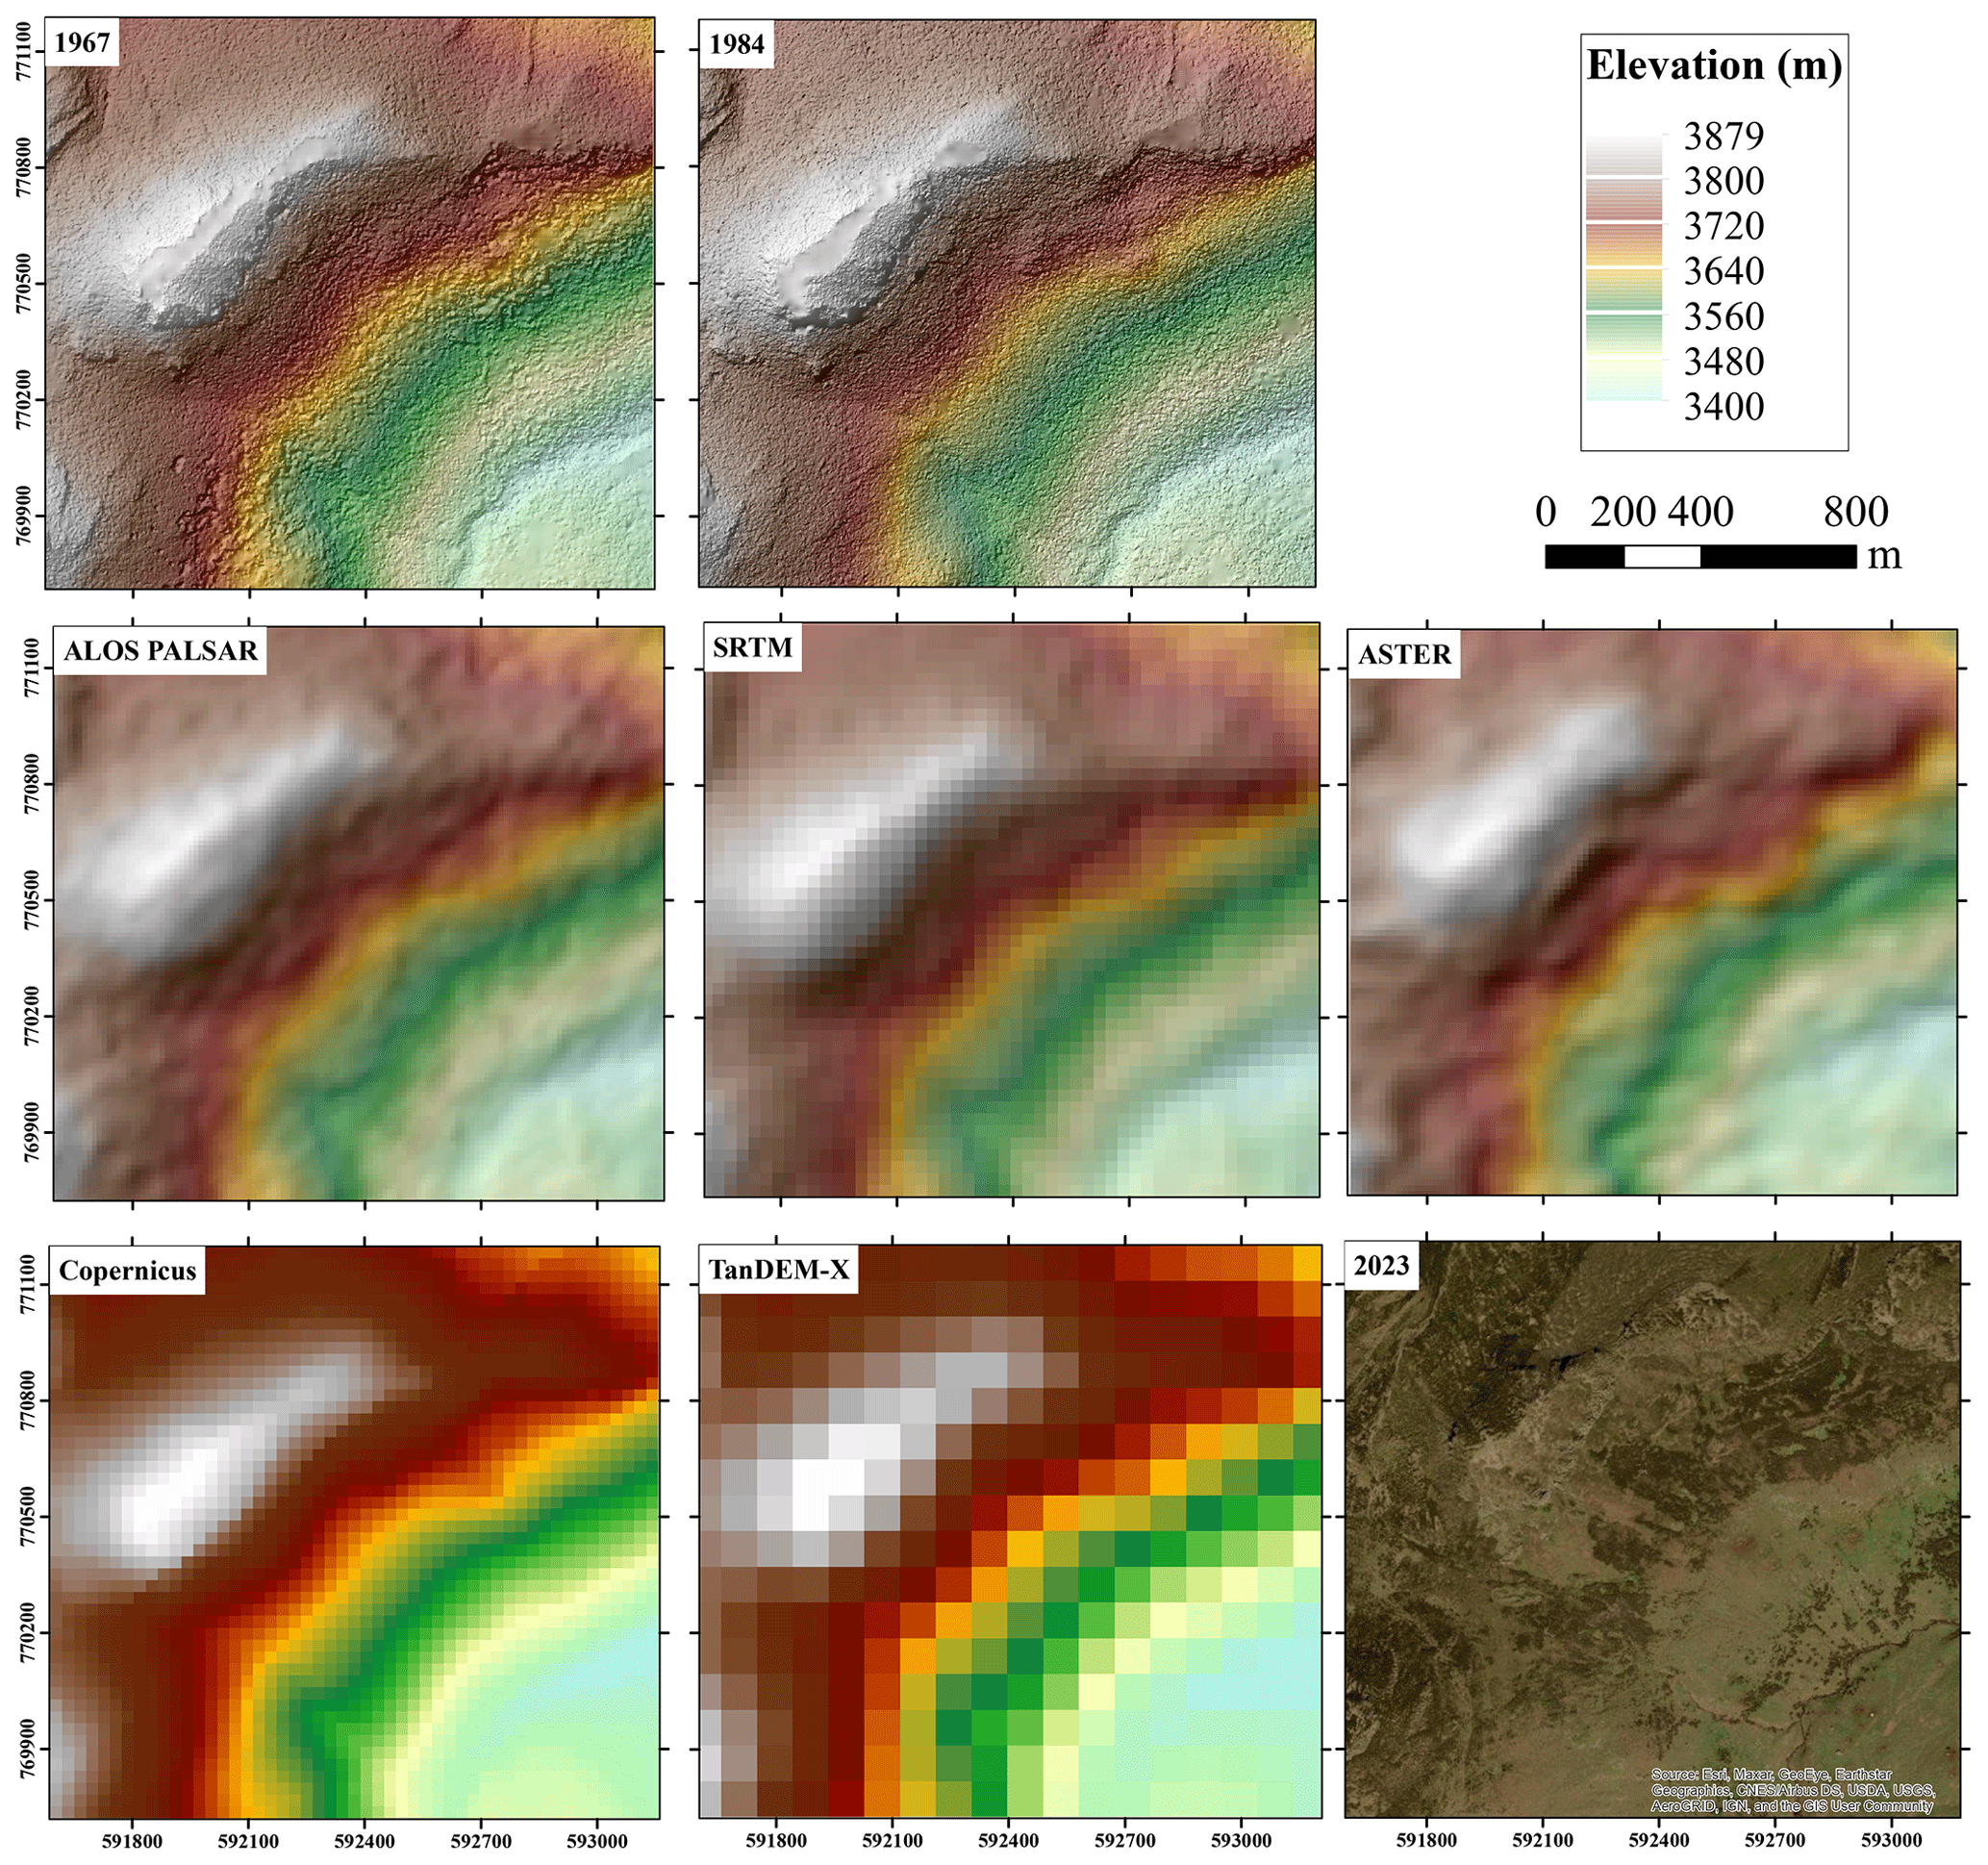
Figure 12Comparison of digital elevation model (DEM) results in the north-eastern study area, centred around Shaya Tika ( N, E) in the AJIDA region. The first row showcases DEMs from 1967 (0.84 m resolution) and 1984 (0.98 m resolution) (left to right). The second row presents data from ALOS PALSAR (12.5 m resolution), SRTM (30 m resolution), and ASTER (15 m resolution) (left to right). The third row features the Copernicus DEM (30 m resolution), the TanDEM-X DEM (90 m resolution), and the corresponding 2023 Google Earth image (left to right). © Google Earth image sources: Esri, Maxar, GeoEye, Earthstar Geographics, CNES/Airbus DS, USDA, USGS, AeroGRID, IGN, and the GIS User Community.
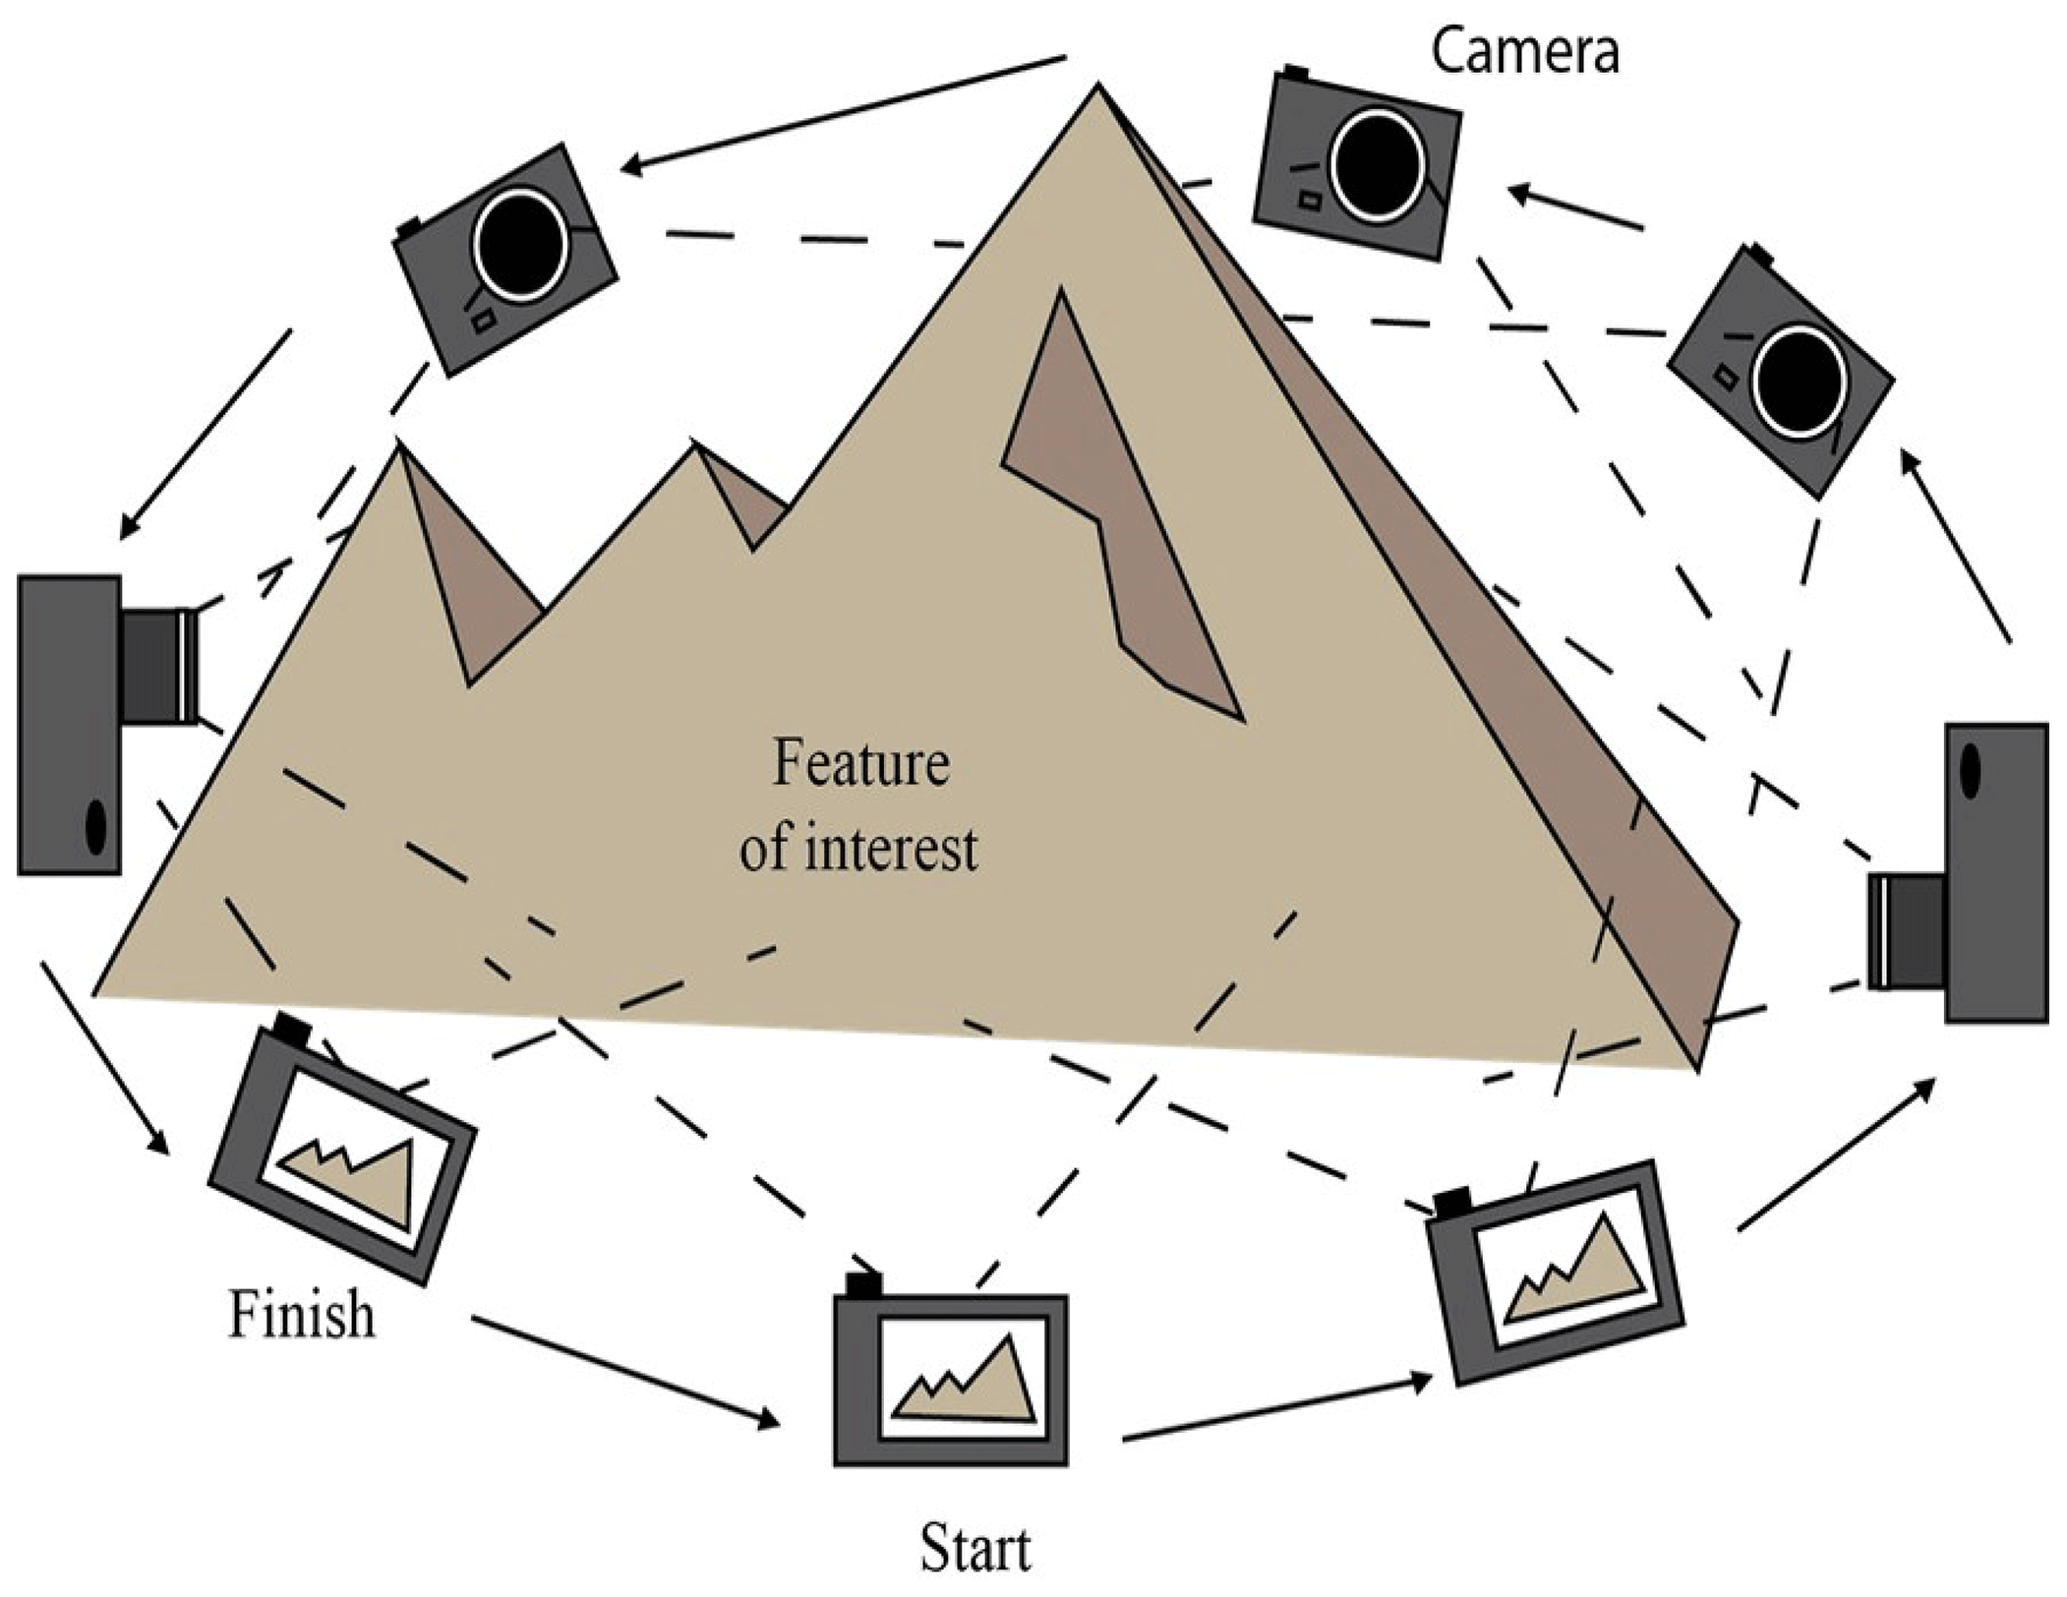
Figure 13Multi-view stereo model scheme: the process starts by capturing multiple angles of the feature of interest, such as the topography of a landscape. Subsequently, these images are integrated using structure-from-motion techniques and algorithms through 3D software (e.g. Agisoft Metashape) on a computer, as outlined in the methods in Sect. 3 (scheme by Haileyesus Nega).
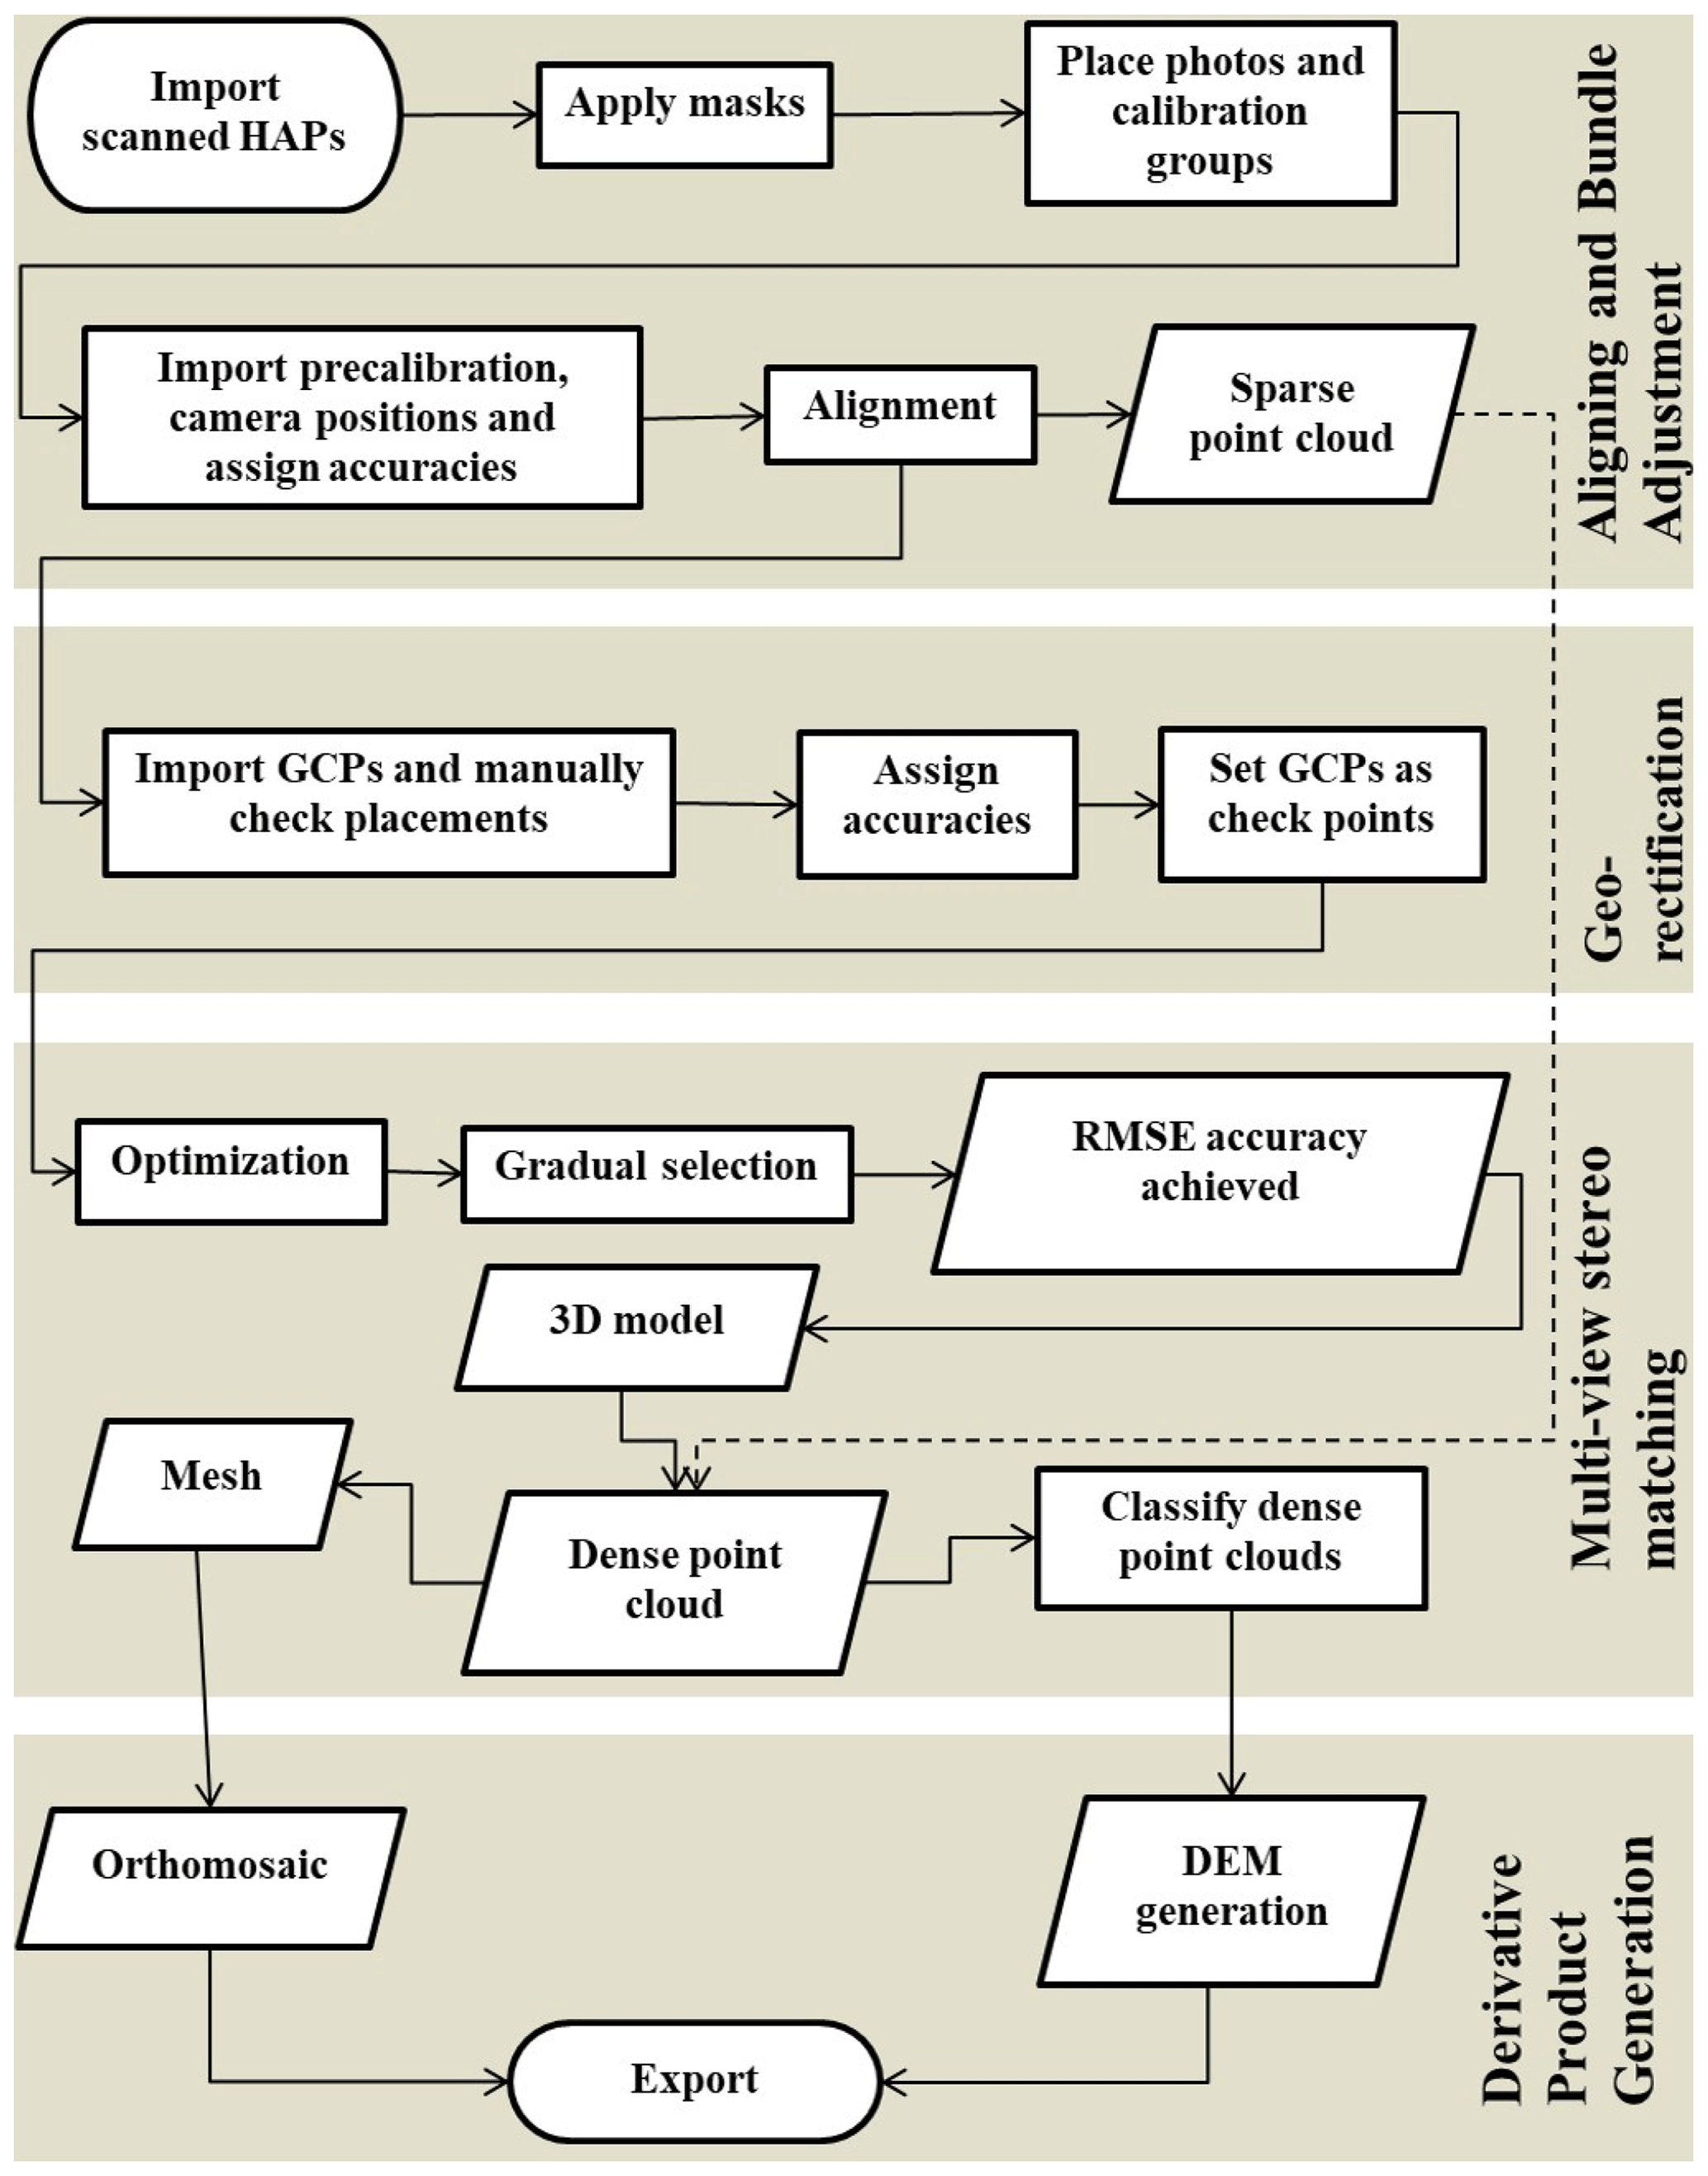
Figure 14Schematic workflow for the structure-from-motion (SfM) multi-view stereo (MVS) photogrammetry employed in the reconstruction of DEMs and orthomosaics from historical aerial photographs (HAPs). Key terms: DEM – digital elevation model, 3D – three-dimensional, RMSE – root mean square error, GCPs – ground control points. The workflow encompasses five principal stages: alignment, bundle block adjustment, multi-view stereo matching, georectification, and derivative product generation. Each stage involves a sequence of processes, inputs, and parameters crucial for software configuration. The alignment input parameters include accuracy (highest), generic pre-selection (yes), reference pre-selection (source), key point limit (100 000), and tie point limit (10 000) and exclude stationary tie points (yes). For dense point clouds they are quality (ultra high), depth filtering (moderate), reuse depth maps (yes), calculate point colours (yes), and calculate point confidence (yes). Mesh specifications comprise the source (depth maps), quality (high), face count (medium), interpolation (enabled), reuse depth maps (yes), and calculate vertex colours (yes). Classify dense point cloud: max angle (∘) 37.5, max distance (m) 0.5, and cell size (m) 30. For the DEMs they are source data (classified dense point cloud), interpolation (disabled), quality (very high), depth filtering (aggressive), and reuse depth maps (yes). Orthomosaic settings encompass resolution (m) 0 maximum, surface (mesh), blending mode (mosaic), hole-filling (yes), enable culling (no), and refine seamline (no).
Our generated DEMs have higher accuracies than previous DEMs (Fig. 5 and Table 2). As demonstrated by its RMSE value of 3.44, the DEM generated from the 1984 HAPs had the best quality. The 1967 DEM also had a very good quality, as indicated by an RMSE value of 3.55. The multiple R-squared value was 0.9998 (equal to the 1984 DEM), and there was no significant difference between the 1967 and 1984 DEMs (Table 2). Our datasets are accurate for doing an in-depth analysis as the spatial resolution is very high (0.84 and 0.98 m for 1967 and 1984, respectively) compared to hitherto freely available DEMs and satellite images. In addition, our datasets are spatially aligned with other global images and relate to external reference systems too (Fig. 6).
In addition, the resulting DEM dataset was also assessed by using on-image selected GCPs for internal accuracy assessment (12 out of 49 GCPs and 7 out of 27 GCPs for the 1967 and 1984 HAPs, respectively; Table 1). It indicates a high quality of internal image network geometry as huge dense point clouds for historical aerial photographs. This was illustrated by the low sub-pixel values of tie point reprojection errors of 1.49 and 0.68 pixels and the RMSEs of 4.24 and 0.88 cm on the control points for the years 1967 and 1984, respectively.
Among the five readily available DEMs used for comparison, the Copernicus DEM (30 m) had the highest accuracy (RMSE value of 4.9) complemented by the validation maximum RMSE value of 5 (European Space Agency and Airbus, 2022). In similar high mountain areas, carried out to evaluate the performance of DEMs for tectonogeomorphic analysis in the South American Andes, the Copernicus DEM (30 m) also performed best (Del Rosario González-Moradas et al., 2023). Thus, complementing the comparison made for freely available DEMs for our study area, and it showed the best accuracy (Fig. 5 and Table 2). However, the SRTM DEM was the next most accurate (RMSE value of 5.64) in our study area, which has a complex topography and a huge elevation difference of 3800 m. These results agree with Sena et al. (2020). The SRTM DEM showed better precision (Fig. 5 and Table 2). However, others (Shebl and Csámer, 2021; Chowdhuri et al., 2021; Jalal et al., 2020) concluded that ALOS PALSAR is more accurate than the SRTM and ASTER DEMs and obtained different results for our study area. The ALOS PALSAR DEM (Fig. 5 and Table 2) was the third-most accurate DEM, with an RMSE vertical accuracy of 11.38. The ASTER GDEM was the fourth-most accurate in the area as the residual standard error value was 11.42 with an RMSE value of 11.54, indicating that there is a gap in elevation values compared to the field GPS control points (Fig. 5). Thomas et al. (2014) also attested to a higher accuracy of the SRTM compared to the ASTER GDEM. The TanDEM-X 90 m (Rizzoli et al., 2017) DEM was the least accurate, with an RMSE value of 11.9. However, TanDEM-X 90 is more accurate compared to the Multi-Error-Removed Improved-Terrain DEM and SRTM 90 m resolution accuracy assessment checked within six continents at 32 floodplain locations using high-resolution lidar DEMs as a reference (Hawker et al., 2019).
All the described datasets are available in the Zenodo link repository at https://doi.org/10.5281/zenodo.7271617 (Muhammed et al., 2022a) for the inputs and at https://doi.org/10.5281/zenodo.7269999 (Muhammed et al., 2022b) for the results obtained. For more details on the structure and list of filenames for the corresponding years and content descriptions, see Supplement Table S8.
In our study area, we analysed the sole available and earliest historical aerial photographs for Ethiopia, which, to the best of our knowledge, encompass not only our specific study area but also the entire afro-alpine ecosystem. We decided to use Agisoft Metashape and SfM–MVS photogrammetry because the method is based on a newly developed algorithm and photogrammetry. We generated the first historical very-high-resolution DEMs and orthomosaics for the years 1967 and 1984 at a larger spatial extent (5730 km2) and at very high spatial resolutions (0.84 and 0.98 m, respectively). The accuracy of the reconstructed datasets was assessed using a linear regression model with RMSE values of 3.55 and 3.44 m for the years 1967 and 1984, respectively. Our results show that SfM–MVS photogrammetry is effective in capturing complex and rugged topography from historical aerial photographs and at elevations ranging from the lowlands of the Delo Menna to the highest peak of the Bale Mountains of the afro-alpine ecosystem of the Tulu Dimtu. Our datasets will help the scientific community address various research questions related to the Bale Mountains and afro-alpine ecosystems in general.
The supplement related to this article is available online at: https://doi.org/10.5194/essd-15-5535-2023-supplement.
MAM, BTH, GM, and TN created the research concept. MAM performed the photogrammetric processing and created the figures. MAM, LW, and GM conducted the field work. MAM and DZ drafted the manuscript, and MAM, LW, DZ, and BTH edited it. All the authors contributed to the final version of the manuscript.
The contact author has declared that none of the authors has any competing interests.
Publisher's note: Copernicus Publications remains neutral with regard to jurisdictional claims made in the text, published maps, institutional affiliations, or any other geographical representation in this paper. While Copernicus Publications makes every effort to include appropriate place names, the final responsibility lies with the authors.
This research was funded by the German Research Council (DFG) in the framework of the joint Ethio-European Research Unit 2358 “The Mountain Exile Hypothesis: how humans benefited from and re-shaped African high-altitude ecosystems during Quaternary climatic changes”.
We thank the Geospatial Information Institute of Ethiopia for providing us with the necessary data and documents and the Ethiopian Wildlife Conservation Authority, Philipps University of Marburg, the Ethiopian Wolf Project, and Bale Mountains National Park for their cooperation and permission to conduct field work. We also very much appreciate the support of Mohammed Kedir, Hussein, Gash Kasim, Awol Assefa, Sofia, Wege Abebe, and Katinka Thielsen, without whom it would not have been possible to do the field work in the Bale Mountains. We thank Haileyesus Nega for his support in improving the figures. We thank Spaska Forteva for her help in arranging lab facilities. We would also like to acknowledge the anonymous reviewers.
This work was supported by Deutsche Forschungsgemeinschaft (DFG) award no. NA 783/12-1, AOBJ 628803 through a project entitled “The mountain exile hypothesis: how humans benefited from and re-shaped African high-altitude ecosystems during Quaternary climatic changes” within the framework of Research Unit 2358.
This paper was edited by Kirsten Elger and reviewed by two anonymous referees.
AgiSoft LLC: Agisoft Metashape Professional: Version 1.8.0.13794 [software], St. Petersburg, https://www.agisoft.com/downloads/installer/ (last access: 7 December 2023), 2021.
Aguilar, F. J., Agüera, F., Aguilar, M. A., and Carvajal, F.: Effects of Terrain Morphology, Sampling Density, and Interpolation Methods on Grid DEM Accuracy, Photogramm. Eng. Remote Sens., 71, 805–816, https://doi.org/10.14358/PERS.71.7.805, 2005.
Altmaier, A. and Kany, C.: Digital surface model generation from CORONA satellite images, ISPRS J. Photogramm. Remote, 56, 221–235, https://doi.org/10.1016/S0924-2716(02)00046-1, 2002.
Asefa, M., Cao, M., He, Y., Mekonnen, E., Song, X., and Yang, J.: Ethiopian vegetation types, climate and topography, Plant Diversity, 42, 302311, https://doi.org/10.1016/j.pld.2020.04.004, 2020.
Bendix, J., Aguire, N., Beck, E., Bräuning, A., Brandl, R., Breuer, L., Böhning-Gaese, K., de Paula, M. D., Hickler, T., Homeier, J., Inclan, D., Leuschner, C., Neuschulz, E. L., Schleuning, M., Suarez, J. P., Trachte, K., Wilcke, W., Windhorst, D., and Farwig, N.: A research framework for projecting ecosystem change in highly diverse tropical mountain ecosystems, Oecologia, 195, 589–600, https://doi.org/10.1007/s00442-021-04852-8, 2021.
Benoit, L., Gourdon, A., Vallat, R., Irarrazaval, I., Gravey, M., Lehmann, B., Prasicek, G., Gräff, D., Herman, F., and Mariethoz, G.: A high-resolution image time series of the Gorner Glacier – Swiss Alps – derived from repeated unmanned aerial vehicle surveys, Earth Syst. Sci. Data, 11, 579–588, https://doi.org/10.5194/essd-11-579-2019, 2019.
Berhe, S. M., Desta, B., Nicoletti, M., and Teferra, M.: Geology, geochronology and geodynamic implications of the Cenozoic magmatic province in W and SE Ethiopia, J. Geol. Soc., 144, 213–226, https://doi.org/10.1144/gsjgs.144.2.0213, 1987.
Bühler, Y., Marty, M., and Ginzler, C.: High resolution DEM generation in high-alpine terrain using airborne remote sensing techniques: high resolution DEM generation in high-alpine terrain, T. GIS, 16, 635–647, https://doi.org/10.1111/j.1467-9671.2012.01331.x, 2012.
Carbutt, C.: Nature of alpine ecosystems in tropical mountains of Africa, in: Enc. World's Biomes, Els., 292–299, https://doi.org/10.1016/B978-0-12-409548-9.11753-1, 2020.
Carta, A., Taboada, T., and Müller, J. V.: Diachronic analysis using aerial photographs across fifty years reveals significant land use and vegetation changes on a Mediterranean island, Appl. Geogr., 98, 78–86, https://doi.org/10.1016/j.apgeog.2018.07.010, 2018.
Chignell, S. M., Laituri, M. J., Young, N. E., and Evangelista, P. H.: Afroalpine wetlands of the Bale Mountains, Ethiopia: Distribution, dynamics, and conceptual Flow Model, Ann. Am. Assoc. Geogr., 109, 791–811, https://doi.org/10.1080/24694452.2018.1500439, 2019.
Chowdhuri, I., Pal, S. C., Saha, A., Chakrabortty, R., and Roy, P.: Evaluation of different DEMs for gully erosion susceptibility mapping using in-situ field measurement and validation, Ecol. Inform., 65, 101425, https://doi.org/10.1016/j.ecoinf.2021.101425, 2021.
Clarke, T. A. and Fryer, J. G.: The development of camera calibration methods and models, Photogramm. Rec., 16, 51–66, https://doi.org/10.1111/0031-868X.00113, 1998.
Colwell, R. K., Brehm, G., Cardelús, C. L., Gilman, A. C., and Longino, J. T.: Global Warming, Elevational Range Shifts, and Lowland Biotic Attrition in the Wet Tropics, Science, 322, 258–261, https://doi.org/10.1126/science.1162547, 2008.
da Costa, R. D. and Starkey, J.: PhotoLin: A program to identify and analyze linear structures in aerial photographs, satellite images and maps, Comput. Geosci., 27, 527–534, https://doi.org/10.1016/S0098-3004(00)00146-1, 2001.
Daniotti, B., Gianinetto, M., and Della Torre, S. (Eds.): Digital transformation of the design, construction and management processes of the built environment, Springer Open, Cham, 400 pp., ISBN 978-3-030-33569-4, 2020.
Dashora, A., Lohani, B., and Malik, J. N.: A Repository of Earth Resource Information-CORONA Satellite Programme, Curr. Sci., 92, 926–932, 2007.
Day, D. A., Logsdon, J. M., and Latell, B. (Eds.): Eye in the sky: the story of the Corona spy satellites, Smithsonian Institution Press, Washington, D.C., 303 pp., ISBN 978-1-56098-830-4, 1998.
de Deus Vidal, J., and Clark, V. R.: Afro-alpine plant diversity in the tropical mountains of Africa, in: Enc. World's Biomes, Elsevier, 373–394, https://doi.org/10.1016/B978-0-12-409548-9.11885-8, 2020.
Del Rosario González-Moradas, M., Viveen, W., Andrés Vidal-Villalobos, R., and Carlos Villegas-Lanza, J.: A performance comparison of SRTM v. 3.0, AW3D30, ASTER GDEM3, Copernicus and TanDEM-X for tectonogeomorphic analysis in the South American Andes, Catena, 228, 107160, https://doi.org/10.1016/j.catena.2023.107160, 2023.
Diaz, H. F. and Bradley, R. S.: Temperature Variations During the Last Century at High Elevation Sites, in: Climatic Change at High Elevation Sites, edited by: Diaz, H. F., Beniston, M., and Bradley, R. S., Springer Netherlands, Dordrecht, 21–47, https://doi.org/10.1007/978-94-015-8905-5_2, 1997.
Eltner, A. and Sofia, G.: Structure from motion photogrammetric technique, in: Developments in Earth Surface Processes, Elsevier, 23, 1–24, https://doi.org/10.1016/B978-0-444-64177-9.00001-1, 2020.
Eltner, A., Kaiser, A., Castillo, C., Rock, G., Neugirg, F., and Abellán, A.: Image-based surface reconstruction in geomorphometry – merits, limits and developments, Earth Surf. Dynam., 4, 359–389, https://doi.org/10.5194/esurf-4-359-2016, 2016.
ESRI Inc.: ArcGIS Desktop, Release 10, Environmental Systems Research Institute [software], Redlands, C.A., 2021.
European Space Agency and Airbus: Copernicus DEM, https://doi.org/10.5270/ESA-c5d3d65, 2022.
Farr, T. G., Rosen, P. A., Caro, E., Crippen, R., Duren, R., Hensley, S., Kobrick, M., Paller, M., Rodriguez, E., Roth, L., Seal, D., Shaffer, S., Shimada, J., Umland, J., Werner, M., Oskin, M., Burbank, D., and Alsdorf, D.: The shuttle radar topography mission, Rev. Geophys., 45, RG2004, https://doi.org/10.1029/2005RG000183, 2007.
Frankl, A., Seghers, V., Stal, C., De Maeyer, P., Petrie, G., and Nyssen, J.: Using image-based modelling (SfM–MVS) to produce a 1935 ortho-mosaic of the Ethiopian highlands, Int. J. Digit. Earth, 8, 421–430, https://doi.org/10.1080/17538947.2014.942715, 2015.
Friss, I., Demissew, S., and van Breugel, P.: Atlas of the potential vegetation of Ethiopia, Det Kongelige Danske Videnskabernes Selskab, Copenhagen, Denmark, 307 pp., ISBN 978-87-7304-347-9, 2010.
Gehrke, B. and Linder, H. P.: Species richness, endemism and species composition in the tropical Afroalpine flora, Alpine Bot., 124, 165–177, https://doi.org/10.1007/s00035-014-0132-0, 2014.
Ghuffar, S., Bolch, T., Rupnik, E., and Bhattacharya, A.: A Pipeline for Automated Processing of Declassified Corona KH-4 (1962–1972) Stereo Imagery, IEEE T. Geosci. Remote, 60, 1–14, https://doi.org/10.1109/TGRS.2022.3200151, 2022.
Gil-Romera, G., Adolf, C., Benito, B. M., Bittner, L., Johansson, M. U., Grady, D. A., Lamb, H. F., Lemma, B., Fekadu, M., Glaser, B., Mekonnen, B., Sevilla-Callejo, M., Zech, M., Zech, W., and Miehe, G.: Long-term fire resilience of the Ericaceous Belt, Bale Mountains, Ethiopia, Biol. Lett., 15, 20190357, https://doi.org/10.1098/rsbl.2019.0357, 2019.
Groos, A. R., Niederhauser, J., Wraase, L., Hänsel, F., Nauss, T., Akçar, N., and Veit, H.: The enigma of relict large sorted stone stripes in the tropical Ethiopian Highlands, Earth Surf. Dynam., 9, 145–166, https://doi.org/10.5194/esurf-9-145-2021, 2021.
Groos, A. R., Niederhauser, J., Lemma, B., Fekadu, M., Zech, W., Hänsel, F., Wraase, L., Akçar, N., and Veit, H.: An hourly ground temperature dataset for 16 high-elevation sites (3493–4377 m a.s.l.) in the Bale Mountains, Ethiopia (2017–2020), Earth Syst. Sci. Data, 14, 1043–1062, https://doi.org/10.5194/essd-14-1043-2022, 2022.
Grottoli, E., Biausque, M., Rogers, D., Jackson, D. W. T., and Cooper, J. A. G.: Structure-from-motion-derived digital surface models from historical aerial photographs: A New 3D Application for Coastal Dune Monitoring, Remote Sens., 13, 95, https://doi.org/10.3390/rs13010095, 2020.
Hawker, L., Neal, J., and Bates, P.: Accuracy assessment of the TanDEM-X 90 Digital Elevation Model for selected floodplain sites, Remote Sens. Environ., 232, 111319, https://doi.org/10.1016/j.rse.2019.111319, 2019.
He, G., Zhao, X., and Yu, M.: Exploring the multiple disturbances of karst landscape in Guilin World Heritage Site, China, Catena, 203, 105349, https://doi.org/10.1016/j.catena.2021.105349, 2021.
Hillman, J. C.: The Bale Mountains national park area, Southeast Ethiopia, and its management, Mt. Res. Dev., 8, 253, https://doi.org/10.2307/3673456, 1988.
Huggel, C., Clague, J. J., and Korup, O.: Is climate change responsible for changing landslide activity in high mountains?: Climate change and landslides in high mountains, Earth Surf. Proc. Land., 37, 77–91, https://doi.org/10.1002/esp.2223, 2012.
Iglhaut, J., Cabo, C., Puliti, S., Piermattei, L., O'Connor, J., and Rosette, J.: Structure from Motion Photogrammetry in Forestry: a Review, Curr. Forestry Rep., 5, 155–168, https://doi.org/10.1007/s40725-019-00094-3, 2019.
Immerzeel, W. W., Kraaijenbrink, P. D. A., Shea, J. M., Shrestha, A. B., Pellicciotti, F., Bierkens, M. F. P., and de Jong, S. M.: High-resolution monitoring of Himalayan glacier dynamics using unmanned aerial vehicles, Remote Sens. Environ., 150, 93–103, https://doi.org/10.1016/j.rse.2014.04.025, 2014.
Jacob, M., Romeyns, L., Frankl, A., Asfaha, T., Beeckman, H., and Nyssen, J.: Land use and cover dynamics since 1964 in the Afro-alpine vegetation belt: Lib Amba Mountain in North Ethiopia, Land Degrad. Dev., 27, 641–653, https://doi.org/10.1002/ldr.2396, 2016.
Jacob, M., De Ridder, M., Vandenabeele, M., Asfaha, T., Nyssen, J., and Beeckman, H.: The Response of Erica arborea L. Tree Growth to Climate Variability at the Afro-alpine Tropical Highlands of North Ethiopia, Forests, 11, 310, https://doi.org/10.3390/f11030310, 2020.
Jalal, S. J., Musa, T. A., Ameen, T. H., Din, A. H. M., Aris, W. A. W., and Ebrahim, J. M.: Optimizing the Global Digital Elevation Models (GDEMs) and accuracy of derived DEMs from GPS points for Iraq's mountainous areas, Geodesy and Geodynamics, 11, 338–349, https://doi.org/10.1016/j.geog.2020.06.004, 2020.
Johansson, M. U., Senay, S. D., Creathorn, E., Kassa, H., and Hylander, K.: Change in heathland fire sizes inside vs. outside the Bale Mountains National Park, Ethiopia, over 50 years of fire-exclusion policy: lessons for REDD+, Ecol. Soc., 24, 26, https://doi.org/10.5751/ES-11260-240426, 2019.
Kidane, Y., Stahlmann, R., and Beierkuhnlein, C.: Vegetation dynamics, and land use and land cover change in the Bale Mountains, Ethiopia, Environ. Monit. Assess., 184, 7473–7489, https://doi.org/10.1007/s10661-011-2514-8, 2012.
Kidane, Y. O., Hoffmann, S., Jaeschke, A., Beloiu, M., and Beierkuhnlein, C.: Ericaceous vegetation of the Bale Mountains of Ethiopia will prevail in the face of climate change, Sci. Rep., 12, 1858, https://doi.org/10.1038/s41598-022-05846-z, 2022.
Lindeberg, T.: Feature Detection with Automatic Scale Selection, Int. J. Comput. Vision, 30, 79–116, https://doi.org/10.1023/A:1008045108935, 1998.
Lowe, D. G.: Object recognition from local scale-invariant features, in: Proceedings of the Seventh IEEE International Conference on Computer Vision, Kerkyra, Greece, vol. 2, 1150–1157, https://doi.org/10.1109/ICCV.1999.790410, 1999.
Lowe, D. G.: Distinctive Image Features from Scale-Invariant Keypoints, Int. J. Comput. Vision, 60, 91–110, https://doi.org/10.1023/B:VISI.0000029664.99615.94, 2004.
Lu, L., Zhou, Y., and Walker, R. T.: Using historical aerial photographs to measure earthquake deformation: Testing the effects of scan resolution, Remote Sens. Environ., 252, 112118, https://doi.org/10.1016/j.rse.2020.112118, 2021.
Mekonnen, B., Glaser, B., Zech, M., Bromm, T., Nemmomisa, S., Bekele, T., and Zech, W.: Factors determining the distribution of Erica patches on the Sanetti Plateau, Bale Mountains, Ethiopia, Alp Botany, 133, 135147, https://doi.org/10.1007/s00035-023-00295-4, 2023.
Merckx, V. S. F. T., Hendriks, K. P., Beentjes, K. K., Mennes, C. B., Becking, L. E., Peijnenburg, K. T. C. A., Afendy, A., Arumugam, N., de Boer, H., Biun, A., Buang, M. M., Chen, P.-P., Chung, A. Y. C., Dow, R., Feijen, F. A. A., Feijen, H., Soest, C. F., Geml, J., Geurts, R., Gravendeel, B., Hovenkamp, P., Imbun, P., Ipor, I., Janssens, S. B., Jocqué, M., Kappes, H., Khoo, E., Koomen, P., Lens, F., Majapun, R. J., Morgado, L. N., Neupane, S., Nieser, N., Pereira, J. T., Rahman, H., Sabran, S., Sawang, A., Schwallier, R. M., Shim, P.-S., Smit, H., Sol, N., Spait, M., Stech, M., Stokvis, F., Sugau, J. B., Sulei-man, M., Sumail, S., Thomas, D. C., van Tol, J., Tuh, F. Y. Y., Yahya, B. E., Nais, J., Repin, R., Lakim, M., and Schilthuizen, M.: Evolution of endemism on a young tropical mountain, Nature, 524, 347–350, https://doi.org/10.1038/nature14949, 2015.
Mezgebu, A. and Workineh, G.: Changes and drivers of afro-alpine forest ecosystem: future trajectories and management strategies in Bale eco-region, Ethiopia, Ecol. Process, 6, 1–13, https://doi.org/10.1186/s13717-017-0108-2, 2017.
Miehe, S. and Miehe, G.: Ericaceous Forests and Heathlands in the Bale Mountains of South Ethiopia Ecology and Man's Impact, Traute Warnke Verlag, Reinbek, Hamburg, Germany, 161 pp., ISBN 3-9801591-4-0, 1994.
Muhammed, A. and Elias, E.: The effects of landscape change on plant diversity and structure in the Bale Mountains National Park, Southeastern Ethiopia, Int. J. Ecol., 2021, 1–13, https://doi.org/10.1155/2021/6628282, 2021.
Muhammed, M. A., Hailu, B. T., Miehe, G., Nauss, T., and Zeuss, D.: High-resolution digital elevation models and orthomosaics generated from historical aerial photographs (since the 1960s) of the Bale Mountains in Ethiopia, Zenodo [data set], https://doi.org/10.5281/zenodo.7271617, 2022a.
Muhammed, M. A., Hailu, B. T., Miehe, G., Nauss, T., and Zeuss, D.: High-resolution digital elevation models and orthomosaics generated from historical aerial photographs (since the 1960s) of the Bale Mountains in Ethiopia, Zenodo [data set], https://doi.org/10.5281/zenodo.7269999, 2022b.
Nyssen, J., Frankl, A., Haile, M., Hurni, H., Descheemaeker, K., Crummey, D., Ritler, A., Portner, B., Nievergelt, B., Moeyersons, J., Munro, N., Deckers, J., Billi, P., and Poesen, J.: Environmental conditions and human drivers for changes to north Ethiopian mountain landscapes over 145 years, Sci. Total Environ., 485–486, 164–179, https://doi.org/10.1016/j.scitotenv.2014.03.052, 2014.
Nyssen, J., Debever, M., Gebremeskel, G., De Wit, B., Hadgu, K. M., De Vriese, S., Verbeurgt, J., Frankl, A., Besha, T., Kropáček, J., Forceville, A., and Demissie, B.: Online digital archive of aerial photographs (1935–1941) of Ethiopia, Geosci. Data J., 9, 3–36, https://doi.org/10.1002/gdj3.115, 2022.
Palomo, I.: Climate Change Impacts on Ecosystem Services in High Mountain Areas: A Literature Review, Mt. Res. Dev., 37, 179–187, https://doi.org/10.1659/MRD-JOURNAL-D-16-00110.1, 2017.
Peters, M. K., Hemp, A., Appelhans, T., Becker, J. N., Behler, C., Classen, A., Detsch, F., Ensslin, A., Ferger, S. W., Frederiksen, S. B., Gebert, F., Gerschlauer, F., Gütlein, A., Helbig-Bonitz, M., Hemp, C., Kindeketa, W. J., Kühnel, A., Mayr, A. V., Mwangomo, E., Ngereza, C., Njovu, H. K., Otte, I., Pabst, H., Renner, M., Röder, J., Rutten, G., Schellenberger Costa, D., Sierra-Cornejo, N., Vollstädt, M. G. R., Dulle, H. I., Eardley, C. D., Howell, K. M., Keller, A., Peters, R. S., Ssymank, A., Kakengi, V., Zhang, J., Bogner, C., Böhning-Gaese, K., Brandl, R., Hertel, D., Huwe, B., Kiese, R., Kleyer, M., Kuzyakov, Y., Nauss, T., Schleuning, M., Tschapka, M., Fischer, M., and Steffan-Dewenter, I.: Climate–land-use interactions shape tropical mountain biodiversity and ecosystem functions, Nature, 568, 88–92, https://doi.org/10.1038/s41586-019-1048-z, 2019.
Rahbek, C., Borregaard, M. K., Colwell, R. K., Dalsgaard, B., Holt, B. G., Morueta-Holme, N., Nogues-Bravo, D., Whittaker, R. J., and Fjeldså, J.: Humboldt's enigma: What causes global patterns of mountain biodiversity?, Science, 365, 1108–1113, https://doi.org/10.1126/science.aax0149, 2019.
Reber, D., Fekadu, M., Detsch, F., Vogelsang, R., Bekele, T., Nauss, T., and Miehe, G.: High-Altitude Rock Shelters and Settlements in an African Alpine Ecosystem: The Bale Mountains National Park, Ethiopia, Hum. Ecol., 46, 587–600, https://doi.org/10.1007/s10745-018-9999-5, 2018.
Risbøl, O., Briese, C., Doneus, M., and Nesbakken, A.: Monitoring cultural heritage by comparing DEMs derived from historical aerial photographs and airborne laser scanning, J. Cult. Herit., 16, 202–209, https://doi.org/10.1016/j.culher.2014.04.002, 2015.
Rizzoli, P., Martone, M., Gonzalez, C., Wecklich, C., Borla Tridon, D., Bräutigam, B., Bachmann, M., Schulze, D., Fritz, T., Huber, M., Wessel, B., Krieger, G., Zink, M., and Moreira, A.: Generation and performance assessment of the global TanDEM-X digital elevation model, ISPRS J. Photogramm., 132, 119–139, https://doi.org/10.1016/j.isprsjprs.2017.08.008, 2017.
Schenk, T.: Towards automatic aerial triangulation, ISPRS J. of Photogramm., 52, 110–121, https://doi.org/10.1016/S0924-2716(97)00007-5, 1997.
Sena, N. C., Veloso, G. V., Fernandes-Filho, E. I., Francelino, M. R., and Schaefer, C. E. G. R.: Analysis of terrain attributes in different spatial resolutions for digital soil mapping application in south eastern Brazil, Geoderma. Reg., 21, e00268, https://doi.org/10.1016/j.geodrs.2020.e00268, 2020.
Sevara, C., Verhoeven, G., Doneus, M., and Draganits, E.: Surfaces from the Visual Past: Recovering High-Resolution Terrain Data from Historic Aerial Imagery for Multitemporal Landscape Analysis, J. Archaeol. Method. Theory, 25, 611642, https://doi.org/10.1007/s10816-017-9348-9, 2018.
Shebl, A. and Csámer, Á.: Reappraisal of DEMs, Radar and optical datasets in lineaments extraction with emphasis on the spatial context, Remote Sens. Appl., 24, 100617, https://doi.org/10.1016/j.rsase.2021.100617, 2021.
Slaymaker, O. and Embleton-Hamann, C.: Advances in global mountain geomorphology, Geomorphology, 308, 230–264, https://doi.org/10.1016/j.geomorph.2018.02.016, 2018.
Snavely, N., Seitz, S. M., and Szeliski, R.: Modeling the World from Internet Photo Collections, Int. J. Comput. Vis., 80, 189210, https://doi.org/10.1007/s11263-007-0107-3, 2008.
Spaete, L. P., Glenn, N. F., Derryberry, D. R., Sankey, T. T., Mitchell, J. J., and Hardegree, S. P.: Vegetation and slope effects on accuracy of a LiDAR-derived DEM in the sagebrush steppe, Remote Sens. Lett., 2, 317–326, https://doi.org/10.1080/01431161.2010.515267, 2011.
Spriggs, R. M.: The Calibration of Military Cartography Cameras, Technical Note 66-2, AFLC-WPAFB-MAR 66 500, US Army Engineer Geodesy, Intelligence and Mapping R. & D. Agency Division, Wright-Patterson Air Force Base, Ohio, USA, 1966.
Thomas, J., Joseph, S., Thrivikramji, K. P., and Arunkumar, K. S.: Sensitivity of digital elevation models: The scenario from two tropical mountain river basins of the Western Ghats, India, Geosci. Front., 5, 893–909, https://doi.org/10.1016/j.gsf.2013.12.008, 2014.
Thornton, J. M., Snethlage, M. A., Sayre, R., Urbach, D. R., Viviroli, D., Ehrlich, D., Muccione, V., Wester, P., Insarov, G., and Adler, C.: Human populations in the world's mountains: Spatio-temporal patterns and potential controls, PLoS ONE, 17, e0271466, https://doi.org/10.1371/journal.pone.0271466, 2022.
Tomczyk, A. M. and Ewertowski, M. W.: Baseline data for monitoring geomorphological effects of glacier lake outburst flood: a very-high-resolution image and GIS datasets of the distal part of the Zackenberg River, northeast Greenland, Earth Syst. Sci. Data, 13, 5293–5309, https://doi.org/10.5194/essd-13-5293-2021, 2021.
Triggs, B., Zisserman, A., and Szeliski, R. (Eds.): Vision algorithms: theory and practice: International Workshop on Vision Algorithms, Corfu, Greece, 21–22 September 1999, proceedings, Springer, Berlin, New York, 382 pp., ISBN 978-3-540-67973-8, 2000.
Turner, M. G. and Gardner, R. H.: Landscape Dynamics in a Rapidly Changing World, in: Landscape Ecology in Theory and Practice, Springer New York, New York, NY, 333–381, https://doi.org/10.1007/978-1-4939-2794-4_9, 2015.
Turner, W., Rondinini, C., Pettorelli, N., Mora, B., Leidner, A. K., Szantoi, Z., Buchanan, G., Dech, S., Dwyer, J., Herold, M., Koh, L. P., Leimgruber, P., Taubenboeck, H., Wegmann, M., Wikelski, M., and Woodcock, C.: Free and open-access satellite data are key to biodiversity conservation, Biol. Conserv., 182, 173–176, https://doi.org/10.1016/j.biocon.2014.11.048, 2015.
van Westen, C. J. and Lulie Getahun, F.: Analyzing the evolution of the Tessina landslide using aerial photographs and digital elevation models, Geomorphology, 54, 77–89, https://doi.org/10.1016/S0169-555X(03)00057-6, 2003.
Westoby, M. J., Brasington, J., Glasser, N. F., Hambrey, M. J., and Reynolds, J. M.: “Structure-from-Motion” photogrammetry: A low-cost, effective tool for geoscience applications, Geomorphology, 179, 300–314, https://doi.org/10.1016/j.geomorph.2012.08.021, 2012.
Williams, P. W.: Glaciations and Climate Change, in: New Zealand Landscape, Els, 301–335, https://doi.org/10.1016/B978-0-12-812493-2.00007-4, 2017.
Woldu, Z., Feoli, E., and Nigatu, L.: Partitioning an elevation gradient of vegetation from south eastern Ethiopia by probabilistic methods, Vegetation, 81, 189–198, https://doi.org/10.1007/BF00045524, 1989.
Wraase, L., Reuber, V. M., Kurth, P., Fekadu, M., Demissew, S., Miehe, G., Opgenoorth, L., Selig, U., Woldu, Z., Zeuss, D., Schabo, D. G., Farwig, N., and Nauss, T.: Remote sensing‐supported mapping of the activity of a subterranean landscape engineer across an afro‐alpine ecosystem, Remote Sens. Ecol. Conserv., 9, 195209, https://doi.org/10.1002/rse2.303, 2023.
Wu, Y., Tang, F., and Li, H.: Image-based camera localization: an overview, Vis. Comput. Ind. Biomed. Art, 1, 8, https://doi.org/10.1186/s42492-018-0008-z, 2018.