the Creative Commons Attribution 4.0 License.
the Creative Commons Attribution 4.0 License.
 | 02 Feb 2023
The pan-Arctic catchment database (ARCADE)
Niek Jesse Speetjens
Gustaf Hugelius
Thomas Gumbricht
Hugues Lantuit
Wouter R. Berghuijs
Philip A. Pika
Amanda Poste
Jorien E. Vonk
The Arctic is rapidly changing. Outside the Arctic, large-sample catchment databases have transformed catchment science from focusing on local case studies to more systematic studies of watershed functioning. Here we present an integrated pan-ARctic CAtchments summary DatabasE (ARCADE) of > 40 000 catchments that drain into the Arctic Ocean and range in size from 1 to 3.1 × 10⁶ km2. These watersheds, delineated at a 90 m resolution, are provided with 103 geospatial, environmental, climatic, and physiographic catchment properties. ARCADE is the first aggregated database of pan-Arctic river catchments that also includes numerous small watersheds at a high resolution. These small catchments are experiencing the greatest climatic warming while also storing large quantities of soil carbon in landscapes that are especially prone to degradation of permafrost (i.e., ice wedge polygon terrain) and associated hydrological regime shifts. ARCADE is a key step toward monitoring the pan-Arctic across scales and is publicly available: https://doi.org/10.34894/U9HSPV (Speetjens et al., 2022).
- Article
(3822 KB) - Full-text XML
- BibTeX
- EndNote


Earth's rapidly changing climate is particularly evident in the Arctic. Decreasing sea ice extent has amplified Arctic warming, which has led to an increase in mean land-surface air temperature of 3.1 ∘C (3 times the global average of ∼ 1 ∘C) over the period 1979–2019 (Lenssen et al., 2019; AMAP, 2021; GISTEMP Team, 2021). Under all IPCC (Intergovernmental Panel on Climate Change) climate scenarios, the Arctic will be substantially different by the mid-century (e.g., less snow and sea ice, degraded permafrost, and altered ecosystems) (Overland et al., 2019). The Arctic is important in regulating the global climate system (IPCC, 2021; Meredith et al., 2019) and global biogeochemical cycles (Parmentier et al., 2017). Ongoing changes in the Arctic and their consequential impacts are both local (e.g., ecosystem changes, changing food web interactions, and potential loss of biodiversity) (Vincent, 2019) and global (e.g., changing atmospheric circulation, ocean acidification, and an altered carbon cycle) (Box et al., 2019; Yamanouchi and Takata, 2020), which raises the urgency to understand this intricate system better.
In the Arctic, marine and terrestrial systems are tightly coupled. More than 10 % of global river discharge flows into the Arctic Ocean (AO), which only contains about 1 % of the global ocean volume (Aagaard and Carmack, 1989; McClelland et al., 2012). In addition, river discharge transports sediment, (organic) carbon, nutrients, and contaminants (Terhaar et al., 2021) into the AO. Arctic rivers integrate over local to regional scales and are therefore useful for studying the impacts of environmental and climatic change at various scales (Holmes et al., 2012).
Permanently frozen soils (permafrost) that are rich in organic carbon (OC) (Hugelius et al., 2014; Mishra et al., 2021) underlie about 60 %–80 % of the AO watershed (Zhang et al., 2000, 2005; Obu et al., 2019). Permafrost conditions have long stabilized the subsurface, but ground temperatures are now warming across the Northern Hemisphere (Biskaborn et al., 2019). Permafrost degradation occurs slowly through deepening of the active layer (the layer that thaws during summer and refreezes during winter) (Ran et al., 2022) or more quickly through abrupt thaw of permafrost with high ground ice contents. Both types of thaw expose soil OC to degradation, which transforms it into greenhouse gases. Thus, the thawing of permafrost can accelerate global warming but also impacts hydrological, biogeochemical, and ecological processes in Arctic ecosystems, with complex consequences for lateral transport of terrestrial material to downstream freshwater and marine systems (Vonk and Gustafsson, 2013).
Investigations of Arctic change (e.g., Schuur et al., 2015; Walvoord and Kurylyk, 2016; Liljedahl et al., 2016; Lafrenière and Lamoureux, 2019; Bruhwiler et al., 2021) critically rely on data. The “Arctic Great Rivers Observatory” initiative, which has run since 2003, is a unique dataset covering the six largest Arctic rivers (McClelland et al., 2008, http://www.arcticgreatrivers.org, last access: 5 August 2022). While data on these large river systems can provide important insights into Arctic change (e.g., Wild et al., 2019; Terhaar et al., 2021; Behnke et al., 2021), they do not reveal the changes that occur at finer scales. Revealing such insights requires data from smaller pan-Arctic watersheds.
Small and medium-sized watersheds drain roughly a third of the circumpolar landmass (Holmes et al., 2012). In contrast to the watersheds of the six largest Arctic rivers (Ob', Yenisey, Lena, Kolyma, Mackenzie, Yukon), the smaller watersheds are almost exclusively underlain by continuous permafrost (Holmes et al., 2012) and are often directly located at the coast. This makes these small watersheds fundamentally different from “The Big Six” because large rivers drain to a few coastal locations (Mann et al., 2022), while the cumulative inputs of small watersheds are spread over a much larger coastal area. In addition, given their size and proximity to the AO, the changes in these watersheds could be more rapidly transferred and substantial to the Arctic coastal ecosystem.
Outside of the Arctic, the emergence of large-sample catchment databases (e.g., Hartmann et al., 2014; Newman et al., 2015; Alvarez-Garreton et al., 2018), which combine data from many watersheds, have transformed the field from placing emphasis on local case studies towards more systematic insights into drivers of watershed functioning. For example, large-sample watershed studies allow one to reveal regional differences (and similarities) in hydrological response, make space-for-time transformations, and systematically test hypotheses. This has proven critical in, for example, understanding the impacts of climate change (e.g., Berghuijs et al., 2014) and testing modeling implications (e.g., Knoben et al., 2020). Such developments have not yet been possible in the Arctic, as large-sample databases of smaller watersheds are not yet available.
Here, we present an integrated pan-ARctic CAtchments summary DatabasE (ARCADE) of > 40 000 catchments, including small and medium-sized watersheds, draining into the Arctic Ocean. These watersheds, delineated at a high resolution (90 m), are coupled with comprehensive information from various geospatial, environmental, climatic, and physiographic datasets with pan-Arctic coverage. This publication aims to provide a high-resolution geographical register, relevant to those studying environmental and climatic changes in relation to Arctic catchment hydrology and biogeochemistry.
2.1 Spatial extent and projection
The ARCADE database encompasses all major and minor drainage basins that are considered part of the pan-Arctic watershed, with their outlets draining into the Arctic Ocean and surrounding seas. More specifically, this includes all watersheds with a Strahler order of 5 (i.e. at least five hierarchical branching orders) or larger that drain into the Arctic Ocean, as well as basins that drain into the Bering Sea and north of the Yukon River outlet, with inclusion of the Yukon River. This follows the pan-Arctic watershed definition as defined by McGuire et al. (2009), with an area of 20.4 × 10⁶ km2, including the Canadian Archipelago, Greenland, and Hudson Bay (Fig. 1). The data presented here have been transformed and re-projected to the WGS84/NSIDC EASE-Grid 2.0 North (EPSG:6931) projection, an equal-area projection system designed for gridding and small-scale digital mapping for environmental sciences in the Northern Hemisphere (Brodzik et al., 2014).
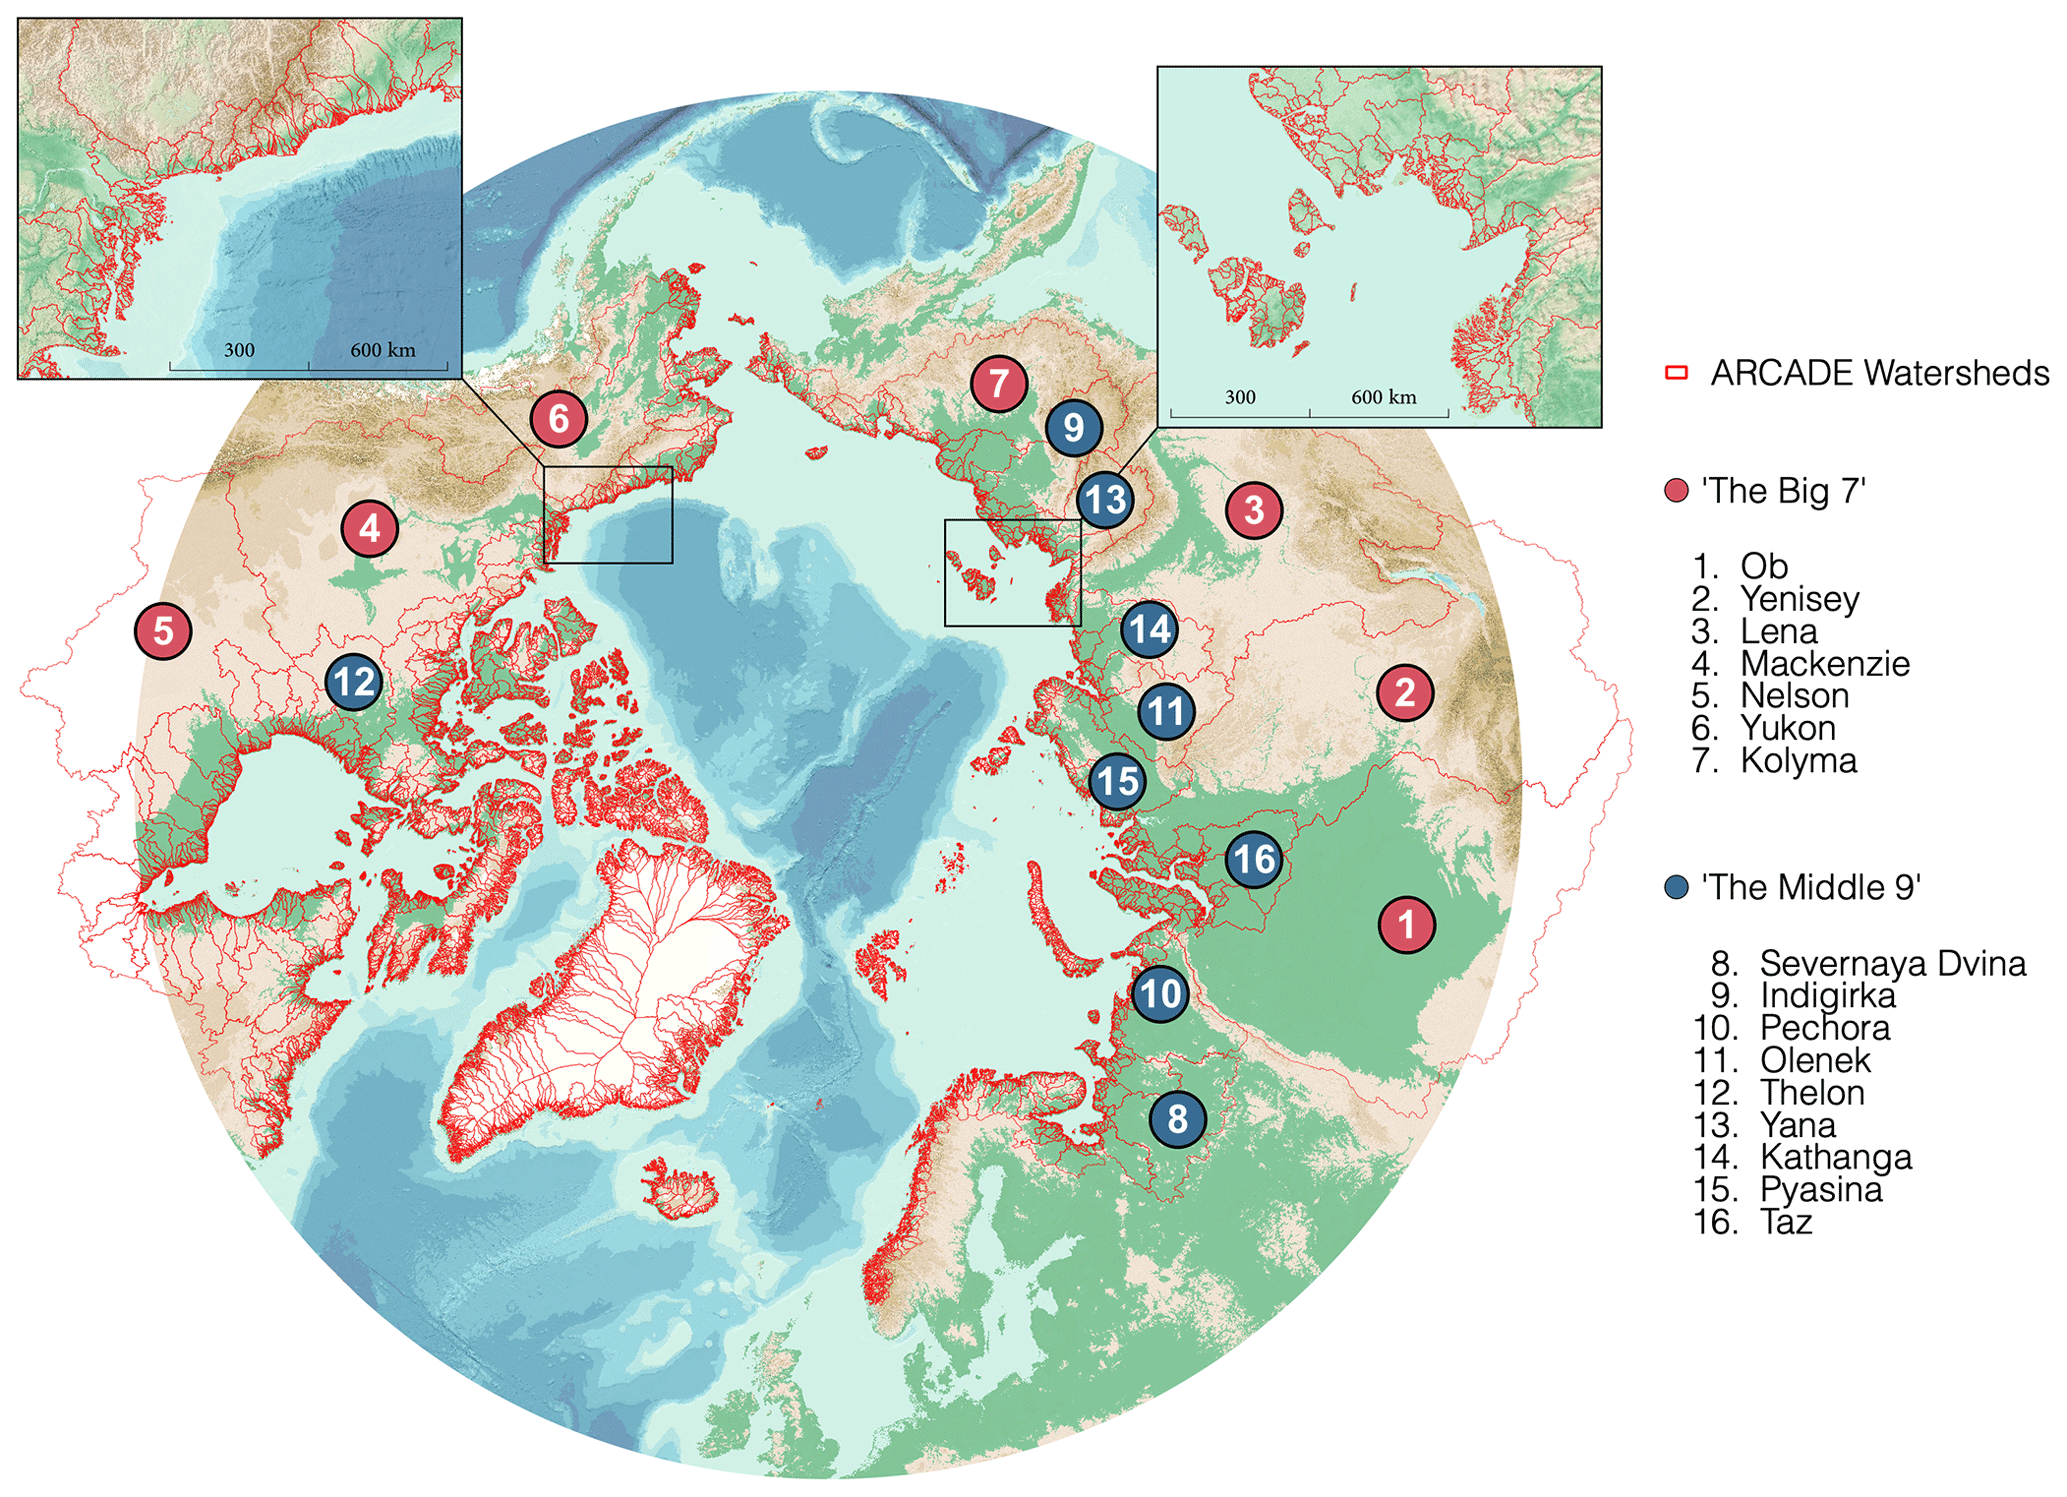
Figure 1Circumpolar map of all ARCADE watersheds, 1 km2 and larger, Strahler order 5 and higher, at 90 m resolution with insets of the Southern Beaufort Sea region (upper left) and the Laptev Sea coast, including the New Siberian Islands (upper right). (Background map: International Bathymetric Chart of the Arctic Ocean V4.0 (IBCAO) (Jakobsson et al., 2020)).
2.2 Watershed delineation
2.2.1 Digital elevation model (DEM)
Terrain parameters such as altitude, slope, aspect, topographic position index, and slope length and steepness factor (LS-factor) (Renard et al., 2017) were derived and calculated from Copernicus DEM GLO-90, a high-quality global 90 m resolution digital elevation model provided by the European Space Agency (ESA, 2021). The Copernicus DEM was accessed on 10 September 2021. For computational practicality, we chose the 90 m resolution product rather than the 30 m resolution product. The latter could be used for future version updates of the ARCADE database. However, we deem the 90 m resolution sufficiently detailed for our purposes (gaining insights into drainage areas on a pan-Arctic scale). We constrain the number of catchments in the database by using Strahler order 5 as the minimum outlet order and 1 km2 catchment area as a lower threshold value (see next paragraph). A higher-resolution DEM would not necessarily make for a better delineation. Moreover, most of the datasets used to link to the catchment areas have resolutions lower than 90 m. We are aware that, at any given resolution, the relative error regarding catchment delineation increases when looking at smaller watersheds. Yet, at our chosen resolution, we conclude there to be a reasonable tradeoff between efficiency and error.
2.2.2 Hydrological DEM conditioning and watershed extraction
The DEM was hydrologically conditioned (a.k.a. pit filling) before deriving flow direction, flow accumulation, Strahler order, watershed delineations, and topographic wetness index. This was done using the “r.hydrodem” module (Lindsay and Creed, 2005) in GRASS GIS (Neteler et al., 2012).
We delineated the watersheds at 90 m resolution for subdivisions of the pan-Arctic landmass using the hydrologically conditioned DEM. This subdivision was necessary because processing the DEM in one piece was computationally too intensive. Delineation was done using SAGA GIS (Conrad et al., 2015) using the module “Channel Network and Drainage Basins”. A lower threshold of Strahler order 5 was chosen to constrain watershed generation, i.e., only watersheds of streams with Strahler order 5 or higher at the outlet were delineated. This threshold was necessary to limit the number of watersheds in the final product and to ensure that only watersheds with actual streams were included. Another consideration was that, as the watershed area approaches the DEM's source resolution, the relative accuracy decreases. Subdivisions of the pan-Arctic watersheds were combined into one dataset of all watersheds that drain into the AO (i.e., upstream areas of outlets at the AO). A known limitation of DEM-derived watershed delineation is that the algorithm struggles to find the channels and ridges in flat terrain. Since we are mostly interested in the drainage area rather than channel location, errors in channels were tolerated more than errors in catchment boundaries. Small, flat catchments (area ≲ 10 km2 and slope ≲ 0.1∘, mainly in fluvial deltas) are most prone to error, which is why we advise users to be critical when using these delineations for local purposes. Another limitation and source of uncertainty lies with watershed delineation on the Greenland ice sheet. Here, we simply proceeded delineating catchments using the surface and ice topography as captured in the DEM.
2.3 Environmental data
All variables are described in file S1 in https://doi.org/10.34894/U9HSPV (Speetjens et al., 2022). Elaborated explanations are provided below.
2.3.1 Climatological data
Climatological data were extracted from the ERA5-Land monthly averaged – ECMWF climate reanalysis dataset (Muñoz-Sabater et al., 2021) using Google Earth Engine (“Planetary-scale geospatial analysis for everyone”; Gorelick et al., 2017). This dataset has a spatial resolution of 11 132 m and consists of 50 bands containing climatological variables related to temperature, precipitation, evaporation, heat fluxes, wind, and vegetation. Minimum, maximum, mean, standard deviation, and median annual values of a subset of these variables (a complete overview of all variables is available in file S1) were calculated for each watershed from 1 January 1990 to 31 December 2019. In the case of pixels falling partly within the geometry of a watershed, the value is weighted by the fraction of each pixel that falls within the geometry. Precipitation, evaporation, and runoff totals were accumulated and averaged over the 30-year period (i.e., the mean annual total of each of these variables was calculated). For snow statistics, we calculated the 30-year average maximum snow depth (m), snow cover (%), snowmelt (m d−1), and snowfall (m d−1) based on the month with the highest value of each year. In the case of snowmelt, this is an indicator of the intensity of snowmelt during the melting season.
We also tested for trends using Sen's slope estimator for the same period. Sen (1968) calculates the slope as
where xj and xi are records at time j and i (j > i). With n data records in a time series, the number of slope estimates equals . Qi then follows by calculating the median of all the slope estimators. We chose to calculate these statistics on monthly data for temperature variables, while for snow-related variables, we only selected the winter months (November–April), and for evaporation-related variables, we only selected the summer months (June–September).
2.3.2 Physiographic data
Catchment properties
Basic catchment properties include minimum, maximum, mean, standard deviation, and median of elevation (meters), slope (degrees), and aspect (degrees). Furthermore, we included centroid latitude (degrees), Gravelius index (watershed perimeter divided by the perimeter of a circle that has the same area; unitless), watershed perimeter (kilometers), and watershed area (square kilometers).
Soil properties
SoilGrids is a globally consistent dataset that contains soil properties (soil organic carbon, SOC, content – dg kg−1; organic carbon density – dg dm−3; nitrogen content – cg kg−1; coarse fragments volumetric content – per 10 000; sand, silt, and clay content – g kg−1; soil bulk density – cg cm−3 – for six depth intervals: 0–5, 5–15, 15–30, 40–60, 60–100, 100–200 cm; and organic carbon stock, OCS – t ha−1 – for the upper 30 cm of the soil) and classes (the most the likely soil class according to the World Reference Base (WRB) classification system, IUSS Working Group WRB, 2015) at 250 m resolution (Poggio et al., 2021). The ARCADE database aggregates soil property data from SoilGrids into watershed minimum, maximum, mean, and standard deviation. OCS was also summarized into total watershed OCS (Gt) in the upper 30 cm of the soil. Soil class data from SoilGrids were summarized by calculating the fractional coverage of each class for each watershed. All watershed statistics were calculated using the “image.reduceRegion()” function in Google Earth Engine (Gorelick et al., 2017). We note that estimates of soil properties, especially for deeper soils, are often uncertain due to data scarcity in the permafrost region. We refer to Poggio et al. (2021) for more detailed discussions of uncertainties in the soil property projections.
Land cover class fractional coverage
Watershed land cover fractional coverage was obtained from ESA WorldCover 10m v100 (Zanaga et al., 2021). This classifies the land surface at 10 m resolution into 11 classes: trees, shrubland, grassland, cropland, built-up areas, barren or sparse vegetation, snow and ice, open water, herbaceous wetland, mangroves, and moss and lichen.
Landform class fractional coverage
Another useful characterization parameter for watersheds is the fractional coverage of landforms. We chose to use a landform classification scheme proposed by Theobald et al. (2015). Their classification scheme maps ecologically relevant landforms (see tables included in dataset file S1 in https://doi.org/10.34894/U9HSPV, Speetjens et al., 2022), which we deem of particular interest in characterizing a catchment, for instance to indicate sensitivity to the occurrence of abrupt permafrost thaw.
2.3.3 Burned area fraction coverage
The burned-area fraction for each watershed over the period 2012–2022 was calculated from MODIS FireCCI5, a monthly global 250 m spatial resolution burn scar classification product (Padilla Parelada, 2018). We selected and summarized recent (< 10 years) annual fire scars, as they are most likely to have an ongoing and lasting effect on watershed biogeochemistry.
Permafrost extent
Permafrost fraction pixel cover was taken from the permafrost extent by Obu et al. (2019) and converted into watershed area fractional coverage per permafrost coverage type. The used product has a spatial resolution of 1 km and a temporal range from 2000–2016. Continuous permafrost is classified as a pixel area coverage of 90 %–100 %, discontinuous permafrost as 50 %–90 %, sporadic permafrost as 10 %–50 %, and isolated patches of permafrost as 0 %–10 %.
Active-layer thickness
Recently published high-resolution estimates of active-layer thickness (ALT) (Ran et al., 2022) were summarized for each watershed. The source dataset has a 1 km resolution for the period of 2000–2016. The authors generated the data by combining large amounts of field data and multisource geospatial remote sensing data into a statistical learning model. It has bias = 2.71 ± 16.46 cm and RMSE = 86.93 ± 19.61 cm for ALT.
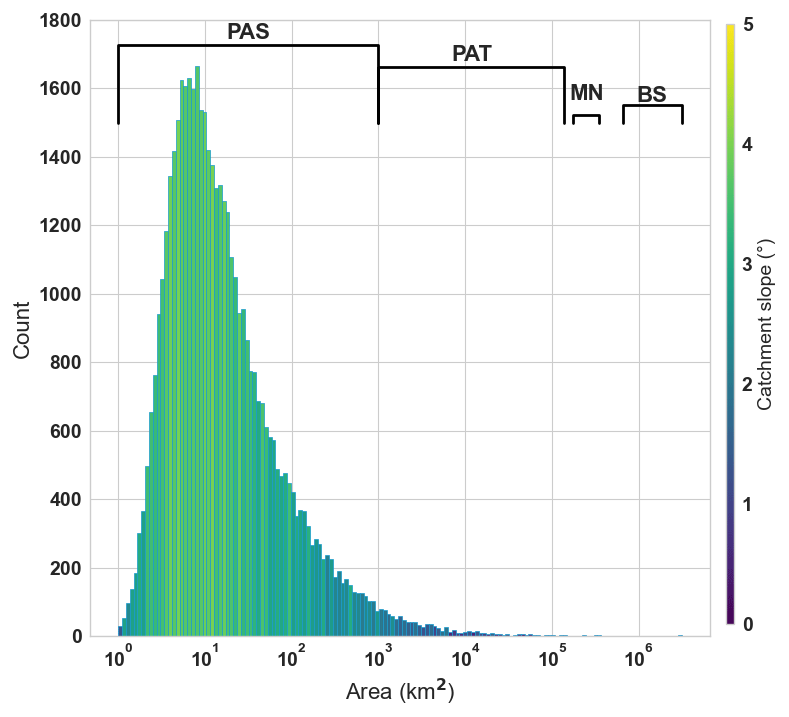
Figure 2The distribution of watershed areas in the pan-Arctic watersheds database and the range of the four groups that are classified based on watershed area. “BS” stands for “Big Seven”, “MN” for “Middle Nine”, “PAT” for “Pan-Arctic Thousands”, and PAS for “Pan-Arctic Small watersheds”. Note that the x axis has a logarithmic scale. The colors represent the mean catchment slope of the bin.
Glacial fractional coverage
Glacial coverage was calculated by combining two datasets: Global Land Ice Measurements from Space (GLIMS), from which we used the latest available snapshot as of 14 September 2021 for the glacial extent (Kargel et al., 2014), and the Greenland ice and ocean mask from the Greenland Mapping Project (GIMP), which contains a 15 m resolution land ice mask for the Greenland ice sheet (Howat et al., 2014). We resampled the combined datasets to a 250 m resolution grid to calculate fractional glacial coverage for each watershed.
Surface water fractional coverage
A high-resolution water mask, JRC Global Surface Water Mapping Layers, v1.3 (30 m) (Pekel et al., 2016), was used to calculate fractional watershed area coverage. The conditions for the presence of water were determined by the occurrence of water in each cell for at least 50 % of the time between 1984 and 2020.
Vegetation index
The summarized statistics of the normalized difference vegetation index (NDVI) and the Sen slope of NDVI were calculated using MOD13A1.006 Terra Vegetation Indices 16-Day Global 500m (Didan, 2015). This dataset is MODIS derived and has a 500 m resolution. We used the annual maximum NDVI of each year from 2000 to 2021.
Topographic wetness index
As an indicator of terrain wetness, we used SAGA wetness index (Böhner and Selige, 2006), a modified topographic wetness index that is based on Moore et al. (1993). The indicator uses topography to differentiate catchments dominated by wetland terrain versus more well-drained terrain.
LS-factor
Slope length and steepness factor (LS-factor) is a factor used in the Universal Soil Loss Equation (USLE) (Renard et al., 2017) that serves as a predictor of soil loss ratio as a function of slope length and steepness. The LS-factor was calculated using the SAGA GIS tool module “LS-factor”, which uses specific catchment area (SCA) as a substitute of slope length (Böhner and Selige, 2006).
Tasseled-cap trend index of visible spectra
As an indicator for changes in wetness (TCW), greenness (TCG), and brightness (TCB) (indicative of bare soil), we included tasseled-cap indices derived from Landsat visible-spectra images, as provided by Nitze et al. (2018). The minima, maxima, and average of these pixel-based slopes were calculated for each watershed.
3.1 Database inventory
The database consists of 47 054 watersheds ranging in size from 1 to 3.1 × 10⁶ km2 (Ob' watershed). We will refer to four groups of watersheds based on size (Fig. 1, Tables 1–5) because our work focuses on inventorying watersheds of all sizes and highlights the contrasts between the larger, well-studied rivers and smaller rivers. The first group consists of “The Big Six” (Ob', Yenisey, Lena, Mackenzie, Yukon, Lena Rivers) and one major watershed draining into the Hudson Bay (Nelson River). Therefore, the “The Big Six” becomes “The Big Seven”, abbreviated as BS. Then, “The Middle Nine” (MN) consists of the Severnaya Dvina, Indigirka, Pechora, Olenek, Thelon, Yana, Khatanga, Pyasina, and Taz Rivers. We then split the remaining watersheds into areas greater than 1000 km2 (yet smaller than the MN), which we named “The Pan-Arctic Thousands” (PAT), and watersheds smaller than 1000 km2, which we named the “The Pan-Arctic Small watersheds” (PAS).
Table 1Summary statistics of the pan-Arctic watersheds database focused on permafrost. Note that this summary excludes watersheds that are fully covered by glaciers or ice sheets.
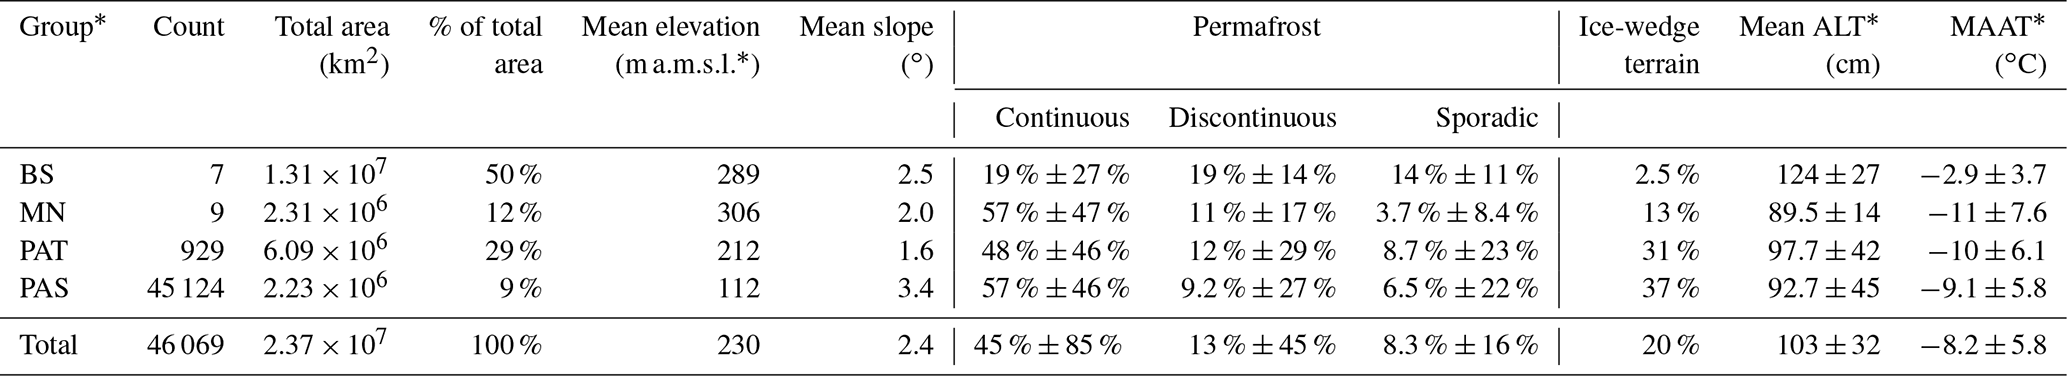
* Abbreviations stand for the grouped watersheds by area: Big Seven (BS), Middle Nine (MN), Pan-Arctic Thousands (PAT), Pan-Arctic Small watersheds (PAS); “count” represents the number of catchments covered by the subsequent data columns; a.m.s.l. stands for “above mean sea level”; ALT stands for “active-layer thickness”; MAAT stands for “mean annual air temperature”.
The BS account for 50 % of the total AO watershed area, while watersheds under 1000 km2 (PAS) account for only 9 % of the entire area. However, these small watersheds are much more abundant, and their landmass is more directly connected to the Arctic Ocean than the BS. Since large parts of the BS watersheds reach into low latitudes (∼ 60 % of their watershed areas are located south of 60∘ north, or 93 % south of the Arctic Circle), the mean annual air temperature in these watersheds is higher compared to the rest of the pan-Arctic watershed (Table 1), influencing mean permafrost coverage, active layer thickness (ALT), and occurrence of ice wedge polygon terrain (Table 3). These permafrost-related watershed properties are susceptible to change under climate-warming trends and play a central role in Arctic watershed hydrology. Our database shows that the MN, PAT, and PAS watersheds have been warming much faster than the BS (Table 7), highlighting the need for more research on these smaller northern watersheds.
Table 2Watershed topographic properties summarized by group (classification based on area) and relevant (sub)continent.
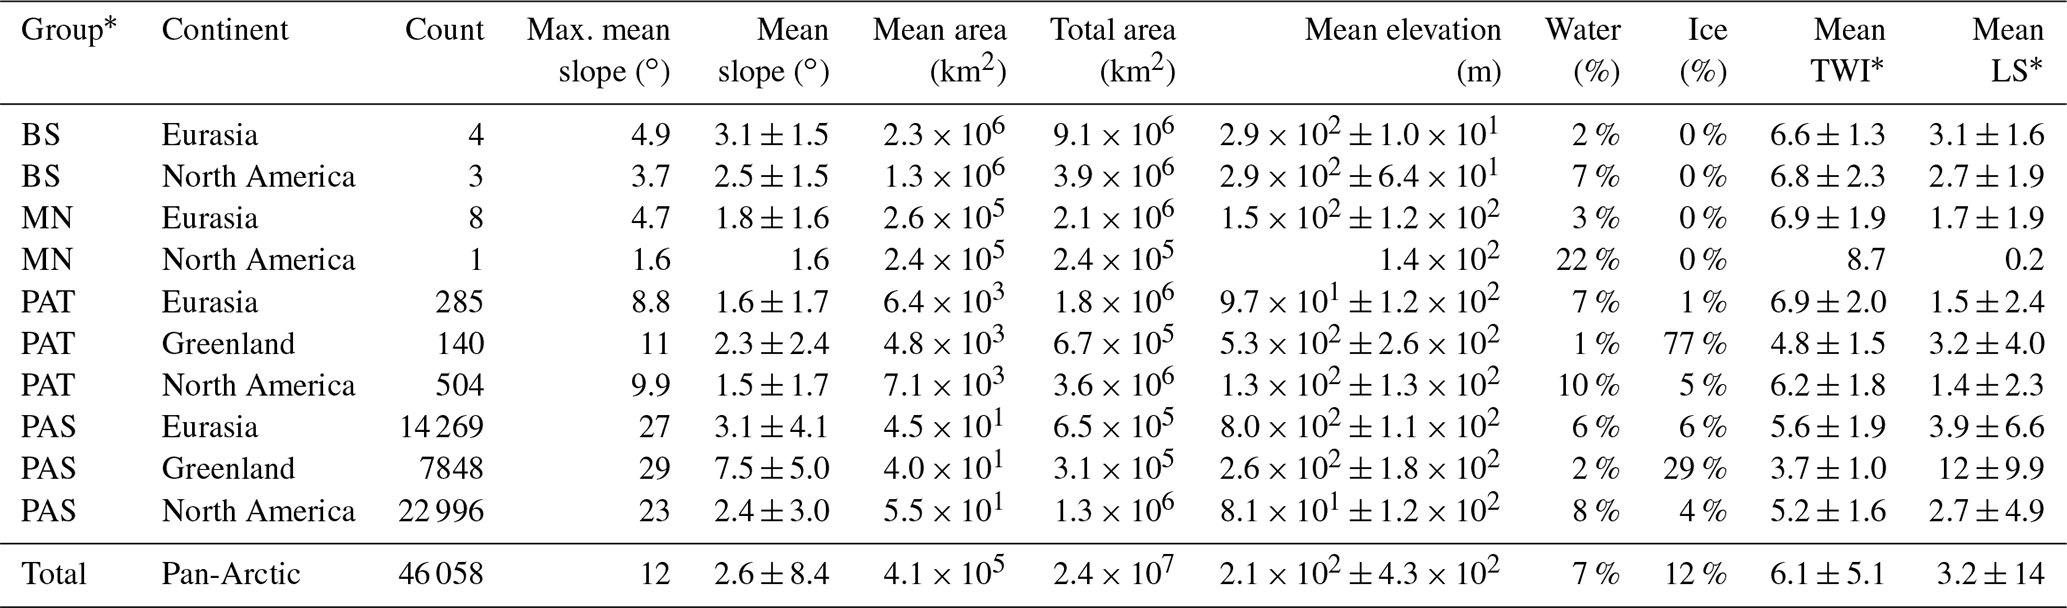
* Abbreviations stand for the grouped watersheds by area: Big Seven (BS), Middle Nine (MN), Pan-Arctic Thousands (PAT), Pan-Arctic Small watersheds (PAS); “count” represents the number of catchments covered by the subsequent data columns; TWI stands for “topographic wetness index” and is based on the SAGA Wetness Index Tool; LS stands for “slope steepness and length factor”.
Table 3Watershed permafrost properties summarized by group (based on area) and relevant (sub)continent.
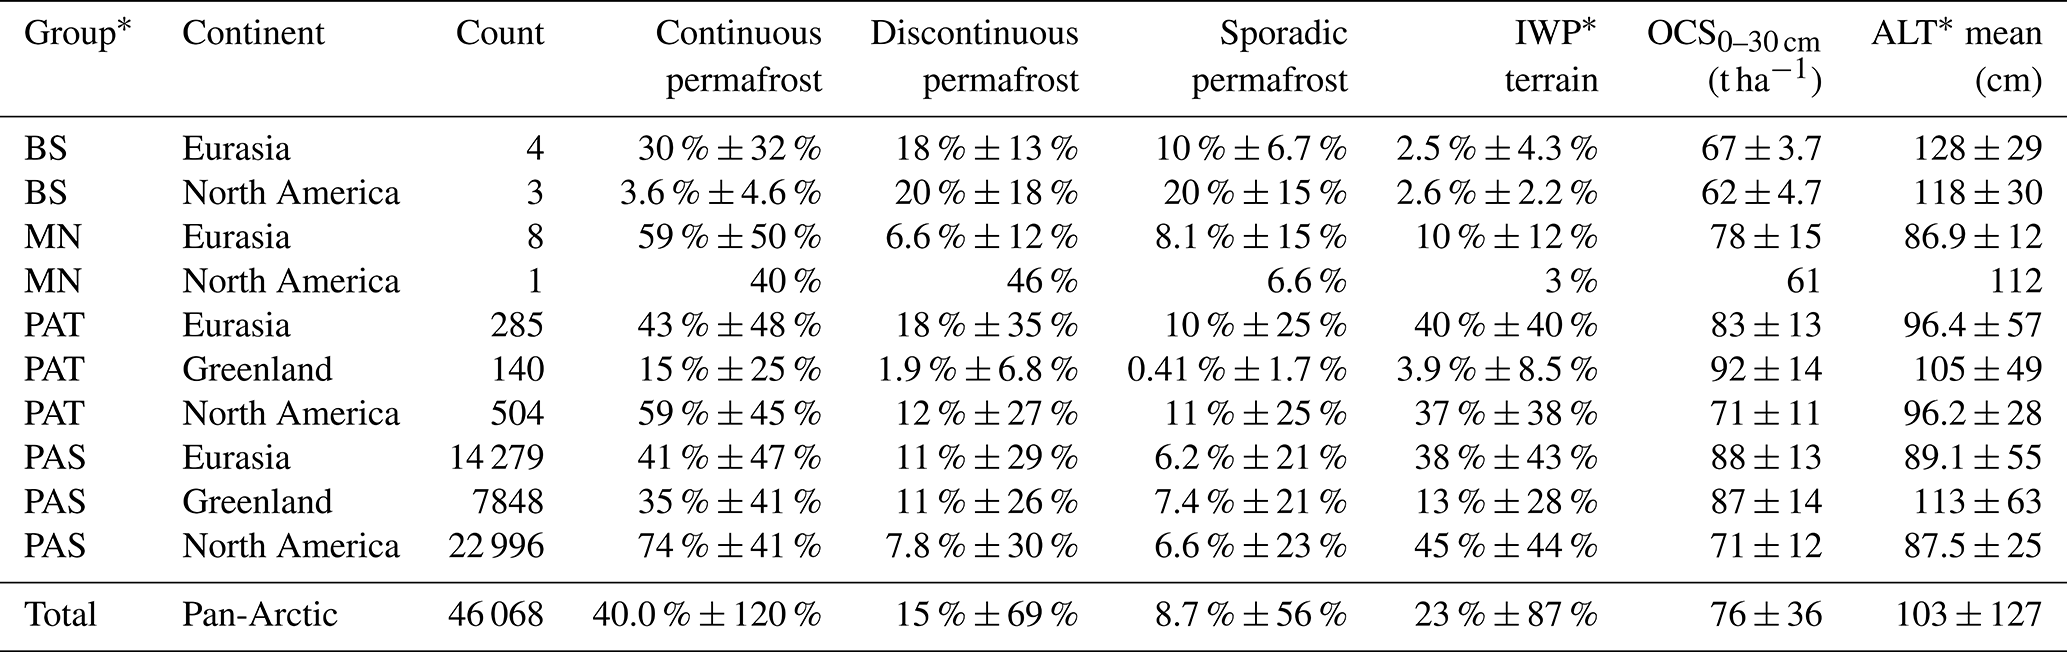
* Abbreviations stand for the grouped watersheds by area: Big Seven (BS), Middle Nine (MN), Pan-Arctic Thousands (PAT), Pan-Arctic Small watersheds (PAS); “count” represents the number of catchments covered by the subsequent data columns; IWP stands for “ice wedge polygon”; OCS0–30 cm stands for “organic carbon stock” in the upper 0–30 cm of the soil; ALT stands for “active-layer thickness”.
3.2 Data coverage
The hydrological functioning of small catchments in the Arctic remains uncertain. Therefore, our database provides a set of catchment properties to help address these uncertainties. Basic topographical catchment metrics such as area, elevation, catchment slope, mean aspect, LS-factor, and TWI are available for all recorded catchments. Due to their resolution and extent, some of the other aggregated datasets have lower coverage. Most notably, ERA5-Land data has ∼ 87 % spatial coverage in the database. Most omitted watersheds are small coastal watersheds that were less than 50 % covered by a cell of the ERA5-Land dataset. The same holds for the ALT and SoilGrids data, which cover about ∼ 82 % and ∼ 92 % of all watersheds, respectively. For all aggregated data sources, > 80 % of watersheds are covered.
3.3 Data quality assessment and limitations
The ARCADE database is the first published 90 m resolution dataset of watersheds draining into the Arctic Ocean. A few unavoidable errors occurred during the watershed delineation. Errors most commonly arise in flat terrain where flow-routing algorithms struggle to determine the flow direction, which troubles the watershed border definition. To deal with this, we used an internal SAGA function to artificially maintain a minimal channel slope by slightly altering the DEM. This minimal slope function effect is visually detectable in small deltas and floodplains where watershed borders sometimes appear to be less accurate than in steep, well-defined terrain. Additionally, this flow path uncertainty in flat terrain caused some errors in approximating the locations of coastal outlets. Given the high DEM resolution, these errors are generally in the order of meters rather than kilometers. This could be improved in future versions by “burning” outlets and channels, such as those derived from satellite imagery, into the DEM.
Our cut-off value in defining a river catchment (outlet Strahler order 5; minimum area of 1 km2) leads to the omission of areas that lie within the pan-Arctic drainage basin but are outside our database's scope (i.e., so-called wolf-tooth patches, remaining coastal areas in between catchments). However, we estimate the summarized area to be less than 1 % of the total pan-Arctic watershed area. The strength of this database lies in the large spatial extent, its novelty, and the range of spatially explicit variables coupled to the delineated catchments. We therefore advise that this database be used to target specific (groups of) catchments and to make comparisons among those to gain insight into spatial patterns and for the localization of target areas for further research.
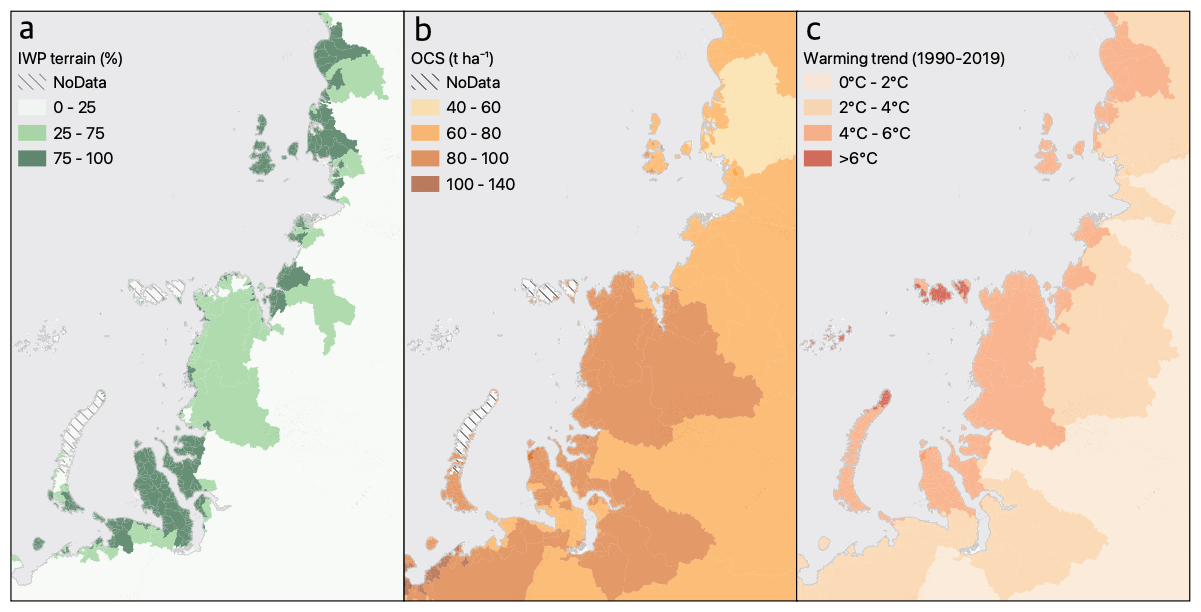
Figure 3Siberian coastal watersheds with ice wedge polygon (IWP) terrain (% watershed coverage) (a), soil organic carbon stock (OCS) in metric tonnes per hectare (b), and the mean watershed temperature trend taken over the period 1990–2019 (c) (map source: ARCADE database (Speetjens et al., 2022)).
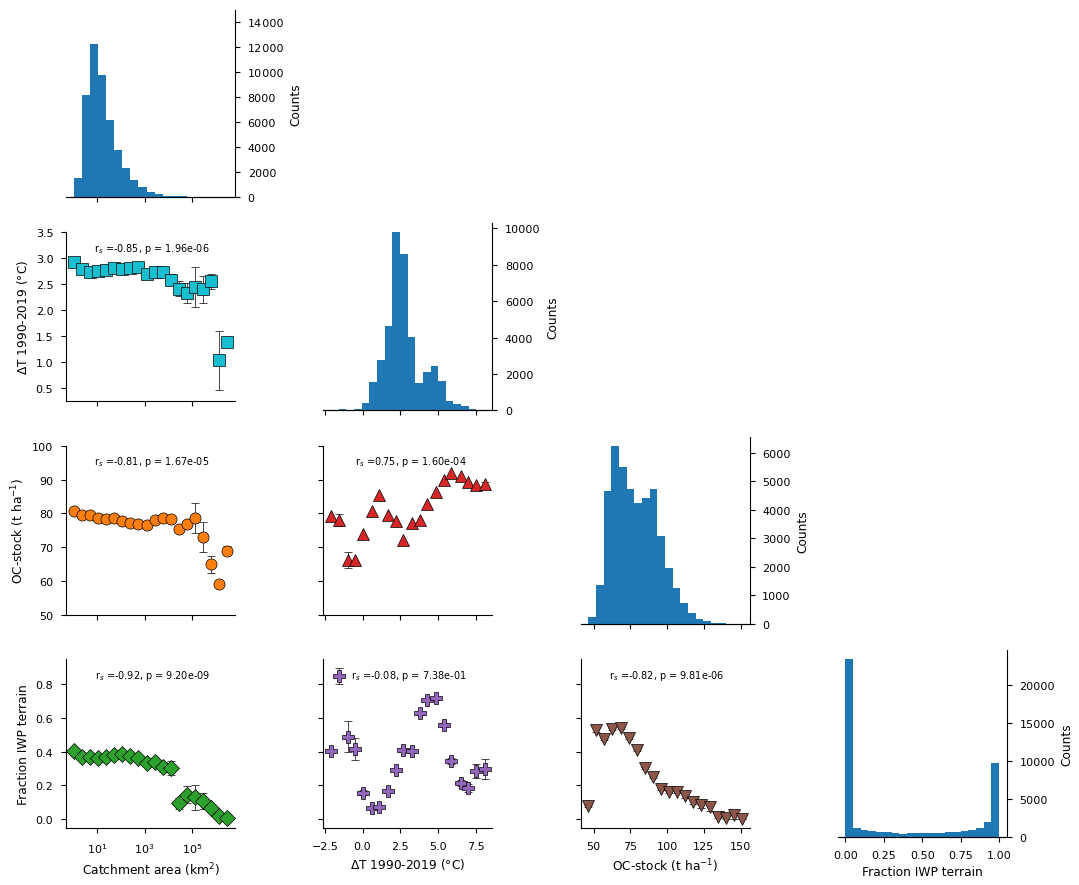
Figure 4Correlations of binned data of selected catchment properties from our database. We calculated Spearman's rho on the binned data. Most notably, we observe that small watersheds have experienced the greatest warming while having the highest mean carbon stocks and the highest fraction of IWP terrain. Similarly, the data show that high OC stocks are found where most warming has occurred.
3.4 Pan-Arctic watersheds properties
ARCADE provides 103 variables with catchment properties divided over 353 columns (including statistics), showcasing a wide variability and spatial resemblances of catchments in the pan-Arctic drainage basin. Additionally, we provide summaries of the most important properties for the BS, MN, PAT, and PAS, both as a whole and on a regional basis (i.e., North America, Greenland, and Eurasia).
3.4.1 Physiographic features
Basic catchment-scale topographical information can be used to categorize watershed types and to estimate their runoff, sediment transport regimes, and biogeochemical constituents. As an example, Connoly et al. (2018) found strong negative correlations between catchment slope, DOM, and NO3- concentrations in Arctic watersheds. According to the data presented here, PAS watersheds have, on average, the highest mean catchment slope. This is partially because Greenlandic small coastal watersheds are mountainous (Tables 3 and 4). Eurasia and North America's proportions of PAT, on the other hand, consist of relatively low elevation, flat terrain (mean slope Eurasia: ∼ 3.1 ± 1.54∘; mean slope North America: ∼ 2.4 ± 1.53∘). The PAS watersheds are underlain mainly by continuous permafrost and feature wetland-type land cover (Eurasia: ∼ 27 % wetland; North America: ∼ 14 % wetland) as opposed to BS (Eurasia 4 % wetland; North America 1 % wetland), with a high area fraction of surface water (Eurasia: ∼ 6 % water; North America: ∼ 8 % water). Because of their permafrost coverage (mostly continuous), PAS watersheds are more likely to feature IWP terrain (37 % IWP terrain in PAS as opposed to 1 % IWP terrain in BS). Another noteworthy property of PAS watersheds is that, on average, they feature higher OC stocks (Eurasia: ∼ 88 t ha−1; Greenland: ∼ 87 t ha−1; North America: ∼ 71 t ha−1) than more commonly studied catchments (BS: ∼ 64.5 t ha−1; MN: ∼ 69.5 t ha−1). Additionally, Greenland stands out in most aspects, with a relatively high mean catchment slope (∼ 7.5∘), elevation (532 m a.m.s.l.), and glacial coverage (77 %) (Tables 4 and 5). This distinction in basic characteristics most likely distinguishes the lateral flux characteristics of Greenlandic watersheds from the rest of PAS. Greenland also includes several (149 out of 929) PAT catchments which are largely (> 80 % of their area) covered by the Greenland ice sheet. Since principles of watershed hydrology do not apply to ice sheets or glaciers, we advise users of this database to take note of the presence of these “ice sheet watersheds” in the database. A solution to circumvent these watersheds is filtering by fractional ice coverage to a value aligned with the study goals.
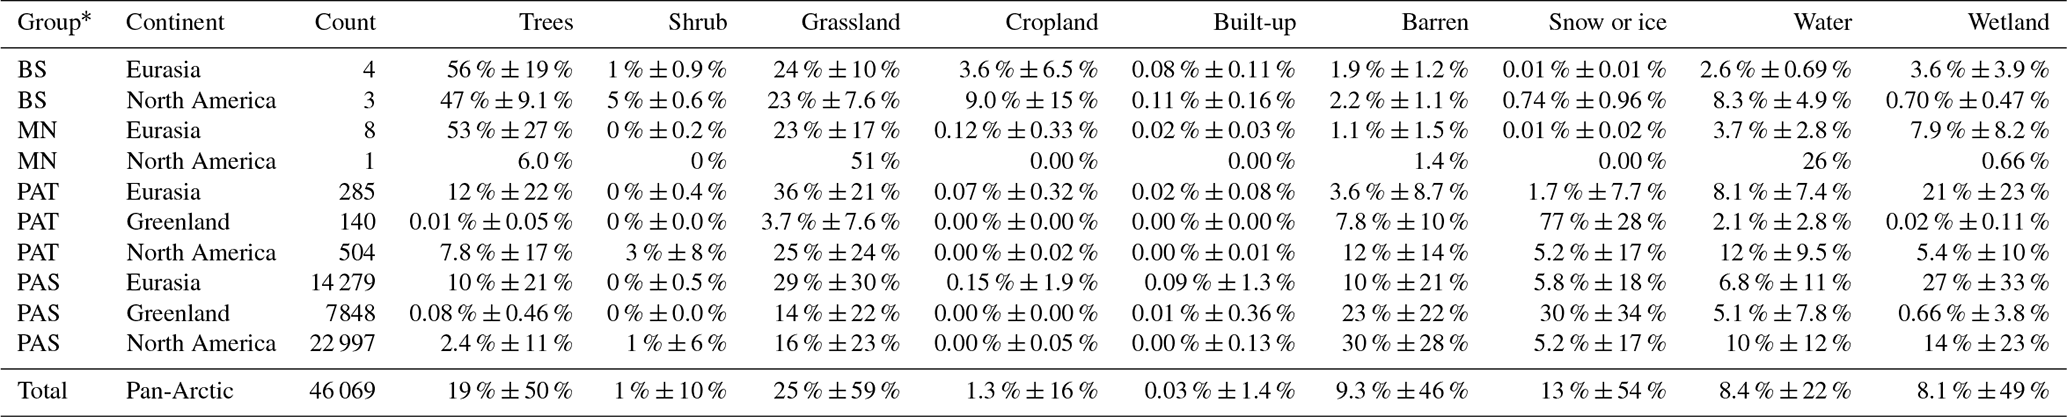
Table 4Watershed land cover type and properties summarized by group (classification based on area) and relevant (sub)continent.

* Abbreviations stand for the grouped watersheds by area: Big Seven (BS), Middle Nine (MN), Pan-Arctic Thousands (PAT), Pan-Arctic Small watersheds (PAS); “count” represents the number of catchments covered by the subsequent data columns
Table 5Watershed climatological properties summarized by group (classification based on area) and relevant (sub)continent.
* Abbreviations stand for the grouped watersheds by area: Big Seven (BS), Middle Nine (MN), Pan-Arctic Thousands (PAT), Pan-Arctic Small watersheds (PAS); “count” represents the number of catchments covered by the subsequent data columns; T stands for temperature, ET stands for total evapotranspiration, P stands for precipitation, and Q stands for runoff. ΔT mean and ΔP mean are calculated from the Sen slope of the monthly mean temperature and precipitation over the period 1999–2019 (mo−1) multiplied by the number of months.
3.4.2 Climatological properties
Since MN, PAT, and PAS are, on average, located in higher latitudes, these watersheds are colder than the BS (BS: −2.9 ∘C; MN: −10.5 ∘C; PAT: −9.1 ∘C; PAS: −10.4 ∘C) (Table 3). While for the BS the Eurasian watersheds are the coldest, the opposite is true for PAS (PAS of Eurasia: −4.7 ∘C; North America: −11.0 ∘C. This is partially because the Gulf Stream warms smaller coastal watersheds of western Eurasia, but there might also already be some effect of temperature increase which has been greatest in the Eurasian PAS (+3.4 ∘C; Table 5). Annual precipitation, mean annual runoff, and the mean increase in precipitation over the past 30 years are highest in PAS and PAT (i.e., smaller watersheds) (Table 7).
3.4.3 Pan-Arctic trends in data
We provide this database as a basis to explore the vast number of watersheds outside the BS and MN that have previously been lumped into a single “unknown”. As a result, they have been underappreciated in terms of their contribution to the pan-Arctic lateral flux budget and their potential sensitivity to climate change as opposed to their bigger siblings. While continuing the scientific focus on large catchment studies (BS) in the Arctic remains vital, we suggest, in parallel, to strongly increase the focus on pan-Arctic small catchments situated entirely at high latitudes. These catchments are experiencing the greatest climatic warming while also storing large quantities of soil carbon in landscapes that are especially prone to degradation of permafrost (i.e., IWP terrain) and associated hydrological-regime shifts. Using our database, these and many other variables are now quantified and made spatially explicit (Figs. 3, 4).
The ARCADE database is publicly available via DataverseNL: https://doi.org/10.34894/U9HSPV (Speetjens et al., 2022) under Creative Commons License Attribution 4.0 International (CC BY 4.0).
ARCADE is the first aggregated database of pan-Arctic river catchments that includes small watersheds at a high resolution. The publication of this database is a necessary step toward more integrated monitoring of the pan-Arctic watershed. An important addition in the following version will be discharge data and derived seasonality (and changes therein) from the RADR database (Feng et al., 2021), which recently greatly advanced understanding of discharge in smaller Arctic rivers. Another important future addition will be the delineations of subbasins and data on river biogeochemistry that is available, albeit non-uniformly and largely unaggregated throughout literature. When numerous valuable datasets from various scientific disciplines are merged, it will be possible to better understand the Arctic's changing hydrology and biogeochemistry. This allows the scientific community to form new hypotheses that direct scientific efforts to specific regions and processes that may have remained under the radar.
NJS coordinated the ARCADE database creation and structure; constructed the data-processing pipeline of the database; collected, aggregated, and inserted all data records; and wrote the first version of the paper. HL and JEV were involved in the initial conceptualization of the database. JEV, WRB, AP, HG, TG, and PAP provided insights from their respective fields of expertise to guide the following database conceptualization steps and during various iterations of its creation. All authors contributed to the final draft of this paper through their various fields of expertise. JEV and HL played key roles in providing funding for the project.
The contact author has declared that none of the authors has any competing interests.
Publisher's note: Copernicus Publications remains neutral with regard to jurisdictional claims in published maps and institutional affiliations.
The authors thank all those who have made this work possible. We thank Justine Ramage for hosting working sessions at Stockholm University. Ingmar Nitze is thanked for providing helpful advice for using Google Earth Engine. We thank Caroline Coch for her role as a sparring partner at the very beginning of this project.
This research has been supported by the Horizon 2020 program (Nunataryuk (grant no. 773421)), and additional financial support was received from ERC (THAWSOME (grant no. 676982).
This paper was edited by Lukas Gudmundsson and reviewed by Lucas Menzel and one anonymous referee.
Aagaard, K. and Carmack, E. C.: The role of sea ice and other fresh water in the Arctic circulation, J. Geophys. Res., 94, C10, https://doi.org/10.1029/jc094ic10p14485, 1989.
Alvarez-Garreton, C., Mendoza, P. A., Boisier, J. P., Addor, N., Galleguillos, M., Zambrano-Bigiarini, M., Lara, A., Puelma, C., Cortes, G., Garreaud, R., McPhee, J., and Ayala, A.: The CAMELS-CL dataset: catchment attributes and meteorology for large sample studies – Chile dataset, Hydrol. Earth Syst. Sci., 22, 5817–5846, https://doi.org/10.5194/hess-22-5817-2018, 2018.
AMAP: Arctic Climate Change Update 2021: Key Trends and Impacts, Summary for Policy-makers, Arctic Monitoring and Assessment Programme (AMAP), ISBN 978-82-7971-201-5, 2021.
Behnke, M. I., McClelland, J. W., Tank, S. E., Kellerman, A. M., Holmes, R. M., Haghipour, N., Eglinton, T. I., Raymond, P. A., Suslova, A., Zhulidov, A. V., Gurtovaya, T., Zimov, N., Zimov, S., Mutter, E. A., Amos, E., and Spencer, R. G. M.: Pan-Arctic Riverine Dissolved Organic Matter: Synchronous Molecular Stability, Shifting Sources and Subsidies, Global Biogeochem. Cy., 35, e2020GB006871, https://doi.org/10.1029/2020GB006871, 2021.
Berghuijs, W. R., Woods, R. A., and Hrachowitz, M.: A precipitation shift from snow towards rain leads to a decrease in streamflow, Nat. Clim. Change, 4, 7, https://doi.org/10.1038/nclimate2246, 2014.
Biskaborn, B. K., Smith, S. L., Noetzli, J., Matthes, H., Vieira, G., Streletskiy, D. A., Schoeneich, P., Romanovsky, V. E., Lewkowicz, A. G., Abramov, A., Allard, M., Boike, J., Cable, W. L., Christiansen, H. H., Delaloye, R., Diekmann, B., Drozdov, D., Etzelmüller, B., Grosse, G., Guglielmin, M., Ingeman-Nielsen, T., Isaksen, K., Ishikawa, M., Johansson, M., Johannsson, H., Joo, A., Kaverin, D., Kholodov, A., Konstantinov, P., Kröger, T., Lambiel, C., Lanckman, J. P., Luo, D., Malkova, G., Meiklejohn, I., Moskalenko, N., Oliva, M., Phillips, M., Ramos, M., Sannel, A. B. K., Sergeev, D., Seybold, C., Skryabin, P., Vasiliev, A., Wu, Q., Yoshikawa, K., Zheleznyak, M., and Lantuit, H.: Permafrost is warming at a global scale, Nat. Commun., 10, 1, https://doi.org/10.1038/s41467-018-08240-4, 2019.
Böhner, J. and Selige, T.: Spatial prediction of soil attributes using terrain analysis and climate regionalisation, Gottinger Geographische Abhandlungen, 115, 13–28, 2006.
Box, J. E., Colgan, W. T., Christensen, T. R., Schmidt, N. M., Lund, M., Parmentier, F. J. W., Brown, R., Bhatt, U. S., Euskirchen, E. S., Romanovsky, V. E., Walsh, J. E., Overland, J. E., Wang, M., Corell, R. W., Meier, W. N., Wouters, B., Mernild, S., Mård, J., Pawlak, J., and Olsen, M. S.: Key indicators of Arctic climate change: 1971–2017, Environ. Res. Lett., 14, 045010, https://doi.org/10.1088/1748-9326/aafc1b, 2019.
Brodzik, M. J., Billingsley, B., Haran, T., Raup, B., and Savoie, M. H.: Correction: Brodzik, M.J., et al. EASE-Grid 2.0: Incremental but Significant Improvements for Earth-Gridded Data Sets. ISPRS International Journal of Geo-Information 2012, 1, 32–4, ISPRS Int. J. Geo-Inf., 3, 1154–1156, https://doi.org/10.3390/ijgi3031154, 2014.
Bruhwiler, L., Parmentier, F. J. W., Crill, P., Leonard, M., and Palmer, P. I.: The Arctic Carbon Cycle and Its Response to Changing Climate, Current Climate Change Reports, 7, 14–34, https://doi.org/10.1007/s40641-020-00169-5, 2021.
Conrad, O., Bechtel, B., Bock, M., Dietrich, H., Fischer, E., Gerlitz, L., Wehberg, J., Wichmann, V., and Böhner, J.: System for Automated Geoscientific Analyses (SAGA) v. 2.1.4, Geosci. Model Dev., 8, 1991–2007, https://doi.org/10.5194/gmd-8-1991-2015, 2015.
Didan, K.: MOD13C1 MODIS/Terra Vegetation Indices 16-Day L3 Global 0.05Deg CMG V006, EOSDIS Land Processes DAAC [data set], https://doi.org/10.5067/MODIS/MOD13C1.006, 2015.
European Space Agency (ESA): A Copernicus DEM – Global and European Digital Elevation Model (COP-DEM), ESA [data set], https://doi.org/10.5270/ESA-c5d3d65, 2021.
Feng, D., Gleason, C. J., Lin, P., Yang, X., Pan, M., and Ishitsuka, Y.: Recent changes to Arctic river discharge, Nat. Comm., 12, 6917, https://doi.org/10.1038/s41467-021-27228-1, 2021.
GISTEMP Team: GISS Surface Temperature Analysis (GISTEMP), version 4, NASA Goddard Institute for Space Studies, https://data.giss.nasa.gov/gistemp/, last access: 31 August 2021.
Gorelick, N., Hancher, M., Dixon, M., Ilyushchenko, S., Thau, D., and Moore, R.: Google Earth Engine: Planetary-scale geospatial analysis for everyone, Remote Sens. Environ., 202, 18–27, https://doi.org/10.1016/j.rse.2017.06.031, 2017.
Hartmann, J., Lauerwald, R., and Moosdorf, N.: A Brief Overview of the GLObal RIver Chemistry Database, GLORICH, 10, 23–27, https://doi.org/10.1016/j.proeps.2014.08.005, 2014.
Holmes, R. M., Coe, M. T., Fiske, G. J., Gurtovaya, T., McClelland, J. W., Shiklomanov, A. I., Spencer, R. G. M., Tank, S. E., and Zhulidov, A. V.: Climate Change Impacts on the Hydrology and Biogeochemistry of Arctic Rivers, in: Climatic Change and Global Warming of Inland Waters: Impacts and Mitigation for Ecosystems and Societies, John Wiley & Sons, Ltd, Chichester, UK, https://doi.org/10.1002/9781118470596.ch1, 2012.
Howat, I. M., Negrete, A., and Smith, B. E.: The Greenland Ice Mapping Project (GIMP) land classification and surface elevation data sets, The Cryosphere, 8, 1509–1518, https://doi.org/10.5194/tc-8-1509-2014, 2014.
Hugelius, G., Strauss, J., Zubrzycki, S., Harden, J. W., Schuur, E. A. G., Ping, C.-L., Schirrmeister, L., Grosse, G., Michaelson, G. J., Koven, C. D., O'Donnell, J. A., Elberling, B., Mishra, U., Camill, P., Yu, Z., Palmtag, J., and Kuhry, P.: Estimated stocks of circumpolar permafrost carbon with quantified uncertainty ranges and identified data gaps, Biogeosciences, 11, 6573–6593, https://doi.org/10.5194/bg-11-6573-2014, 2014.
IPCC: The Ocean and Cryosphere in a Changing Climate, https://www.ipcc.ch/report/srocc/ (last acess: 6 June 2022), 2019.
IUSS Working Group WRB: World Reference Base for Soil Resources 2014, update 2015, International Soil Classification System for Naming Soils and Creating Legends for Soil Maps, 106, ISSN:1748-3387, 2015.
Jakobsson, M., Mayer, L. A., Bringensparr, C., Castro, C. F., Mohammad, R., Johnson, P., Ketter, T., Accettella, D., Amblas, D., An, L., Arndt, J. E., Canals, M., Casamor, J. L., Chauché, N., Coakley, B., Danielson, S., Demarte, M., Dickson, M. L., Dorschel, B., Dowdeswell, J. A., Dreutter, S., Fremand, A. C., Gallant, D., Hall, J. K., Hehemann, L., Hodnesdal, H., Hong, J., Ivaldi, R., Kane, E., Klaucke, I., Krawczyk, D. W., Kristoffersen, Y., Kuipers, B. R., Millan, R., Masetti, G., Morlighem, M., Noormets, R., Prescott, M. M., Rebesco, M., Rignot, E., Semiletov, I., Tate, A. J., Travaglini, P., Velicogna, I., Weatherall, P., Weinrebe, W., Willis, J. K., Wood, M., Zarayskaya, Y., Zhang, T., Zimmermann, M., and Zinglersen, K. B.: The International Bathymetric Chart of the Arctic Ocean Version 4.0, Sci. Data, 7, 1, https://doi.org/10.1038/s41597-020-0520-9, 2020.
Kargel, J. S., Leonard, G. J., Bishop, M. P., Kääb, A., and Raup, B. H.: Global Land Ice Measurements from Space, Springer-Verlag Berlin Heidelberg, 876 pp., https://doi.org/10.1007/978-3-540-79818-7, 2014.
Knoben, W. J. M., Freer, J. E., Peel, M. C., Fowler, K. J. A., and Woods, R. A.: A Brief Analysis of Conceptual Model Structure Uncertainty Using 36 Models and 559 Catchments, Water Resour. Res., 56, e2019WR025975, https://doi.org/10.1029/2019WR025975, 2020.
Lafrenière, M. J. and Lamoureux, S. F.: Effects of changing permafrost conditions on hydrological processes and fluvial fluxes, Earth-Sci. Rev., 191, 212–223,https://doi.org/10.1016/j.earscirev.2019.02.018, 2019.
Lenssen, N., Schmidt, G., Hansen, J., Menne, M., Persin, A., Ruedy, R., and Zyss, D.: Improvements in the GISTEMP uncertainty model, J. Geophys. Res.-Atmos., 124, 6307–6326, https://doi.org/10.1029/2018JD029522, 2019.
Liljedahl, A. K., Boike, J., Daanen, R. P., Fedorov, A. N., Frost, G. V., Grosse, G., Hinzman, L. D., Iijma, Y., Jorgenson, J. C., Matveyeva, N., Necsoiu, M., Raynolds, M. K., Romanovsky, V. E., Schulla, J., Tape, K. D., Walker, D. A., Wilson, C. J., Yabuki, H., and Zona, D.: Pan-Arctic ice-wedge degradation in warming permafrost and its influence on tundra hydrology, Nat. Geo., 9, 312–318, https://doi.org/10.1038/ngeo2674, 2016.
Lindsay, J. B. and Creed, I. F.: Removal of artifact depressions from digital elevation models: Towards a minimum impact approach, Hydrol. Process., 19, 3113–3126, https://doi.org/10.1002/hyp.5835, 2005.
Mann, P. J., Strauss, J., Palmtag, J., Dowdy, K., Ogneva, O., Fuchs, M., Bedington, M., Torres, R., Polimene, L., Overduin, P., Mollenhauer, G., Grosse, G., Rachold, V., Sobczak, W. V., Spencer, R. G. M., and Juhls, B.: Degrading permafrost river catchments and their impact on Arctic Ocean nearshore processes, Ambio, 51, 439–455, https://doi.org/10.1007/s13280-021-01666-z, 2022.
McClelland, J. W., Holmes, R. M., Peterson, B. J., Amon, R., Brabets, T., Cooper, L., Gibson, J., Gordeev, V. V., Guay, C., Milburn, D., Staples, R., Raymond, P. A., Shiklomanov, I., Striegl, R., Zhulidov, A., Gurtovaya, T., and Zimov, S.: Development of Pan-Arctic database for river chemistry, Eos Trans. AGU, 89, 217–218, https://doi.org/10.1029/2008EO240001, 2008.
McClelland, J. W., Holmes, R. M., Dunton, K. H., and Macdonald, R. W.: The Arctic Ocean Estuary, Estuar. Coasts, 35, 353–368, https://doi.org/10.1007/s12237-010-9357-3, 2012.
McGuire, A. D., Anderson, L. G., Christensen, T. R., Scott, D., Laodong, G., Hayes, D. J., Martin, H., Lorenson, T. D., Macdonald, R. W., and Nigel, R.: Sensitivity of the carbon cycle in the Arctic to climate change, Ecol. Monogr., 79, 523–555, https://doi.org/10.1890/08-2025.1, 2009.
Meredith, M., Sommerkorn, M., Cassotta, S., Derksen, C., Ekaykin, A., Hollowed, A., Kofinas, G., Mackintosh, A., Melbourne-Thomas, J., Muelbert, M. M. C., Ottersen, G., Pritchard, H., and Schuur, E. A. G.: Polar Regions, IPCC Special Report on the Ocean and Cryosphere in a Changing Climate, 203–276, 2019.
Mishra, U., Hugelius, G., Shelef, E., Yang, Y., Strauss, J., Lupachev, A., Harden, J. W., Jastrow, J. D., Ping, C. L., Riley, W. J., Schuur, E. A. G., Matamala, R., Siewert, M., Nave, L. E., Koven, C. D., Fuchs, M., Palmtag, J., Kuhry, P., Treat, C. C., Zubrzycki, S., Hoffman, F. M., Elberling, B., Camill, P., Veremeeva, A., and Orr, A.: Spatial heterogeneity and environmental predictors of permafrost region soil organic carbon stocks, Sci. Adv., 7, 9, https://doi.org/10.1126/sciadv.aaz5236, 2021.
Moore, I. D., Gessler, P. E., Nielsen, G. A., and Peterson, G. A.: Soil Attribute Prediction Using Terrain Analysis, 57, Soil Sci. Soc. Am. J., 57, 2, https://doi.org/10.2136/sssaj1993.03615995005700020058x, 1993.
Muñoz-Sabater, J., Dutra, E., Agustí-Panareda, A., Albergel, C., Arduini, G., Balsamo, G., Boussetta, S., Choulga, M., Harrigan, S., Hersbach, H., Martens, B., Miralles, D. G., Piles, M., Rodríguez-Fernández, N. J., Zsoter, E., Buontempo, C., and Thépaut, J.-N.: ERA5-Land: a state-of-the-art global reanalysis dataset for land applications, Earth Syst. Sci. Data, 13, 4349–4383, https://doi.org/10.5194/essd-13-4349-2021, 2021.
Neteler, M., Bowman, M. H., Landa, M., and Metz, M.: GRASS GIS: A multi-purpose open source GIS, Environ. Model. Softw., 31, 124–131, https://doi.org/10.1016/j.envsoft.2011.11.014, 2012.
Newman, B. D., Throckmorton, H. M., Graham, D. E., Gu, B., Hubbard, S. S., Liang, L., Wu, Y., Heikoop, J. M., Herndon, E. M., Phelps, T. J., Wilson, C. J., and Wullschleger, S. D.: Microtopographic and depth controls on active layer chemistry in Arctic polygonal ground, Geophys. Res. Lett., 42, 1808–1817, https://doi.org/10.1002/2014GL062804, 2015.
Nitze, I., Grosse, G., Jones, B. M., Romanovsky, V. E., and Boike, J.: Remote sensing quantifies widespread abundance of permafrost region disturbances across the Arctic and Subarctic, Nat. Commun., 9, 5423, https://doi.org/10.1038/s41467-018-07663-3, 2018.
Obu, J., Westermann, S., Bartsch, A., Berdnikov, N., Christiansen, H. H., Dashtseren, A., Delaloye, R., Elberling, B., Etzelmüller, B., Kholodov, A., Khomutov, A., Kääb, A., Leibman, M. O., Lewkowicz, A. G., Panda, S. K., Romanovsky, V., Way, R. G., Westergaard-Nielsen, A., Wu, T., Yamkhin, J., and Zou, D.: Northern Hemisphere permafrost map based on TTOP modelling for 2000–2016 at 1 km2 scale, Earth-Sci. Rev., 193, 299–316, https://doi.org/10.1016/j.earscirev.2019.04.023, 2019.
Overland, J., Dunlea, E., Box, J. E., Corell, R., Forsius, M., Kattsov, V., Olsen, M. S., Pawlak, J., Reiersen, L. O., and Wang, M.: The urgency of Arctic change, Polar Sci., 21, 6–13, https://doi.org/10.1016/j.polar.2018.11.008, 2019.
Padilla Parellada, M.: ESA Fire Climate Change Initiative (Fire_cci): MODIS Fire_cci Burned Area Pixel product, version 5.1, Centre for Environmental Data Analysis [data set], https://doi.org/10.5285/58f00d8814064b79a0c49662ad3af537, 2018.
Parmentier, F. J. W., Christensen, T. R., Rysgaard, S., Bendtsen, J., Glud, R. N., Else, B., van Huissteden, J., Sachs, T., Vonk, J. E., and Sejr, M. K.: A synthesis of the arctic terrestrial and marine carbon cycles under pressure from a dwindling cryosphere, Ambio, 46, 53–69, https://doi.org/10.1007/s13280-016-0872-8, 2017.
Pekel, J. F., Cottam, A., Gorelick, N., and Belward, A. S.: High-resolution mapping of global surface water and its long-term changes, Nature, 540, 418–422, https://doi.org/10.1038/nature20584, 2016.
Poggio, L., de Sousa, L. M., Batjes, N. H., Heuvelink, G. B. M., Kempen, B., Ribeiro, E., and Rossiter, D.: SoilGrids 2.0: producing soil information for the globe with quantified spatial uncertainty, SOIL, 7, 217–240, https://doi.org/10.5194/soil-7-217-2021, 2021.
Ran, Y., Li, X., Cheng, G., Che, J., Aalto, J., Karjalainen, O., Hjort, J., Luoto, M., Jin, H., Obu, J., Hori, M., Yu, Q., and Chang, X.: New high-resolution estimates of the permafrost thermal state and hydrothermal conditions over the Northern Hemisphere, Earth Syst. Sci. Data, 14, 865–884, https://doi.org/10.5194/essd-14-865-2022, 2022.
Renard, K. G., Laflen, J. M., Foster, G. R., and McCool, D. K.: The revised universal soil loss equation, in: Soil Erosion Research Methods, 2nd Edn., Routledge, https://doi.org/10.1201/9780203739358, 2017.
Schuur, E. A. G., McGuire, A. D., Schädel, C., Grosse, G., Harden, J. W., Hayes, D. J., Hugelius, G., Koven, C. D., Kuhry, P., Lawrence, D. M., Natali, S. M., Olefeldt, D., Romanovsky, V. E., Schaefer, K., Turetsky, M. R., Treat, C. C., and Vonk, J. E.: Climate change and the permafrost carbon feedback, Nature, 520, 171–179, https://doi.org/10.1038/nature14338, 2015.
Sen, P. K.: Estimates of the Regression Coefficient Based on Kendall's Tau, JASA, 63, 324, https://doi.org/10.1080/01621459.1968.10480934, 1968.
Speetjens, N. J., Hugelius, G., Gumbricht, T., Lantuit, H., Berghuijs, W. R., Pika, P. A., Poste, A., and Vonk, J. E.: ARCADE, the pan-ARctic CAtchments DatabasE, DataverseNL [data set], https://doi.org/10.34894/U9HSPV, 2022.
Terhaar, J., Lauerwald, R., Regnier, P., Gruber, N., and Bopp, L.: Around one third of current Arctic Ocean primary production sustained by rivers and coastal erosion, Nat. Commun., 12, 169, https://doi.org/10.1038/s41467-020-20470-z, 2021.
Theobald, D. M., Harrison-Atlas, D., Monahan, W. B., and Albano, C. M.: Ecologically-relevant maps of landforms and physiographic diversity for climate adaptation planning, PLoS ONE, 10, 12, https://doi.org/10.1371/journal.pone.0143619, 2015.
Vincent, W. F.: Arctic climate change: Local impacts, global consequences, and policy implications, in: The Palgrave Handbook of Arctic Policy and Politics, Palgrave Macmillan, https://doi.org/10.1007/978-3-030-20557-7_31, 2019.
Vonk, J. E. and Gustafsson, Ö.: Permafrost-carbon complexities, Nat. Geosci., 6, 675–676, https://doi.org/10.1038/ngeo1937, 2013.
Walvoord, M. A. and Kurylyk, B. L.: Hydrologic Impacts of Thawing Permafrost – A Review, VZJ, 15, 6, https://doi.org/10.2136/vzj2016.01.0010, 2016.
Wild, B., Andersson, A., Bröder, L., Vonk, J., Hugelius, G., McClelland, J. W., Song, W., Raymond, P. A., and Gustafsson, Ö.: Rivers across the Siberian Arctic unearth the patterns of carbon release from thawing permafrost, P. Natl. Acad. Sci. USA, 116, 10280–1028, https://doi.org/10.1073/pnas.1811797116, 2019.
Yamanouchi, T. and Takata, K.: Rapid change of the Arctic climate system and its global influences – Overview of GRENE Arctic climate change research project (2011–2016), Polar Sci., 25, 100548, https://doi.org/10.1016/j.polar.2020.100548, 2020.
Zanaga, D., Van De Kerchove, R., De Keersmaecker, W., Souverijns, N., Brockmann, C., Quast, R., Wevers, J., Grosu, A., Paccini, A., Vergnaud, S., Cartus, O., Santoro, M., Fritz, S., Georgieva, I., Lesiv, M., Carter, S., Herold, M., Linlin, L., Tsendbazar, N., Raimoino, F., and Arino, O.: ESA WorldCover 10 m 2020 v100, Zenodo [data set], https://doi.org/10.5281/zenodo.5571936, 2021.
Zhang, T., Heginbottom, J. A., Barry, R. G., and Brown, J.: Further statistics on the distribution of permafrost and ground ice in the Northern Hemisphere, Polar Geogr., 24, 2, https://doi.org/10.1080/10889370009377692, 2000.
Zhang, T., Barry, R. G., Knowles, K., Heginbottom, J. A., and Brown, J.: Statistics and characteristics of permafrost and ground-ice distribution in the Northern Hemisphere, 31, 47–68, https://doi.org/10.1080/10889370802175895, 2008.