the Creative Commons Attribution 4.0 License.
the Creative Commons Attribution 4.0 License.
 | 01 Feb 2023
Global dataset on seagrass meadow structure, biomass and production
Simone Strydom
Roisin McCallum
Anna Lafratta
Chanelle L. Webster
Caitlyn M. O'Dea
Nicole E. Said
Natasha Dunham
Karina Inostroza
Cristian Salinas
Samuel Billinghurst
Charlie M. Phelps
Connor Campbell
Connor Gorham
Rachele Bernasconi
Anna M. Frouws
Axel Werner
Federico Vitelli
Viena Puigcorbé
Alexandra D'Cruz
Kathryn M. McMahon
Jack Robinson
Megan J. Huggett
Sian McNamara
Glenn A. Hyndes
Seagrass meadows provide valuable socio-ecological ecosystem services, including a key role in climate change mitigation and adaption. Understanding the natural history of seagrass meadows across environmental gradients is crucial to deciphering the role of seagrasses in the global ocean. In this data collation, spatial and temporal patterns in seagrass meadow structure, biomass and production data are presented as a function of biotic and abiotic habitat characteristics. The biological traits compiled include measures of meadow structure (e.g. percent cover and shoot density), biomass (e.g. above-ground biomass) and production (e.g. shoot production). Categorical factors include bioregion, geotype (coastal or estuarine), genera and year of sampling. This dataset contains data extracted from peer-reviewed publications published between 1975 and 2020 based on a Web of Science search and includes 11 data variables across 12 seagrass genera. The dataset excludes data from mesocosm and field experiments, contains 14 271 data points extracted from 390 publications and is publicly available on the PANGAEA® data repository (https://doi.org/10.1594/PANGAEA.929968; Strydom et al., 2021). The top five most studied genera are Zostera, Thalassia, Cymodocea, Halodule and Halophila (84 % of data), and the least studied genera are Phyllospadix, Amphibolis and Thalassodendron (2.3 % of data). The data hotspot bioregion is the Tropical Indo-Pacific (25 % of data) followed by the Tropical Atlantic (21 %), whereas data for the other four bioregions are evenly spread (ranging between 13 and 15 % of total data within each bioregion). From the data compiled, 57 % related to seagrass biomass and 33 % to seagrass structure, while the least number of data were related to seagrass production (11 % of data). This data collation can inform several research fields beyond seagrass ecology, such as the development of nature-based solutions for climate change mitigation, which include readership interested in blue carbon, engineering, fisheries, global change, conservation and policy.
- Article
(1922 KB) - Full-text XML
-
Supplement
(431 KB) - BibTeX
- EndNote


Approximately 65 million years ago, a group of marine angiosperms called seagrasses adapted to life within the coastal zone, and now, they rank among the most valuable ecosystems globally. Seagrasses encompass ∼72 species within 12 genera spread across all continents except Antarctica (Short et al., 2011). Seagrasses are recognised as highly productive habitats that provide multiple ecosystem services relevant to human wellbeing, such as biodiversity, fisheries, sediment stabilisation and nutrient cycling across the coastal zone (Ascioti et al., 2022; Lamb et al., 2017; McMahon et al., 2013; Nordlund et al., 2016; Unsworth et al., 2018). Furthermore, the high primary production rates and capacity of seagrasses to sequester carbon are relevant to mitigating climate change, while their role in stabilising the substrate, ameliorating hydrodynamic energy and nourishing beaches with biogenic sands contributes to climate change adaptation against storms and sea-level rise (Duarte et al., 2013).
Seagrass research initially focussed on understanding biology, distribution, ecology, taxonomy and phenology. More recently, the socio-ecological value of seagrass ecosystem services has received recognition, in part owing to the extensive losses of seagrasses globally. Since the beginning of the 20th century, widespread loss of seagrass meadows has been estimated at 0.9 % yr−1, linked to a variety of factors, including impacts associated with alterations to key drivers of growth (e.g. irradiance and temperature) resulting from sediment loading, eutrophication, extreme climate events and flooding (Hall et al., 1999; Short et al., 2011; Strydom et al., 2020; Waycott et al., 2009). Recent conservation and management actions have resulted in the deceleration and reversal of declining trends in some locations (de los Santos et al., 2019).
Duarte and Chiscano (1999) conducted a review on seagrass biomass and production, which has greatly contributed to the advancement of seagrass research. Information on seagrass meadow structure, production, biomass and reproduction is essential to understanding the role of seagrasses in the global ocean while providing insights for developing restoration initiatives, informing management and ultimately contributing to their conservation (Unsworth et al., 2018). Therefore, understanding global patterns in the functioning of threatened natural ecosystems such as seagrass meadows is crucial to inform management strategies to protect natural assets (Cullen-Unsworth et al., 2014; Hoegh-Guldberg and Bruno, 2010). Since Duarte and Chiscano (1999), new information across hundreds of peer-reviewed papers (past 24 years, 1996–2020) has not been synthesised and made available online, which precludes gathering new knowledge around seagrass natural history based on data synthesis studies. Indeed, data on seagrass reproduction have never been compiled.
In this review, data on key variables on seagrass meadow structure, biomass and production published between 1975 and 2020 (data collected between 1972 and 2020) are presented as a function of biotic and abiotic habitat characteristics. The main goals of this review are to synthesise current literature on seagrass ecology to facilitate further multidisciplinary research and to identify research gaps and provide recommendations for future research. The dataset provides baseline data that can inform science, management and policy. In particular, it provides critical and basic knowledge to inform traditional seagrass biology and ecology fields but also can contribute to advance knowledge in other disciplines including fisheries, biodiversity, conservation, coastal biogeochemistry and emerging fields such as the “blue economy”.
2.1 Literature search
In order to create a global seagrass database containing relevant data on seagrass meadow structure, biomass and production, a Web of Science (WOS; http://www.webofknowledge.com, last access: 15 June 2020) search was conducted in June 2020 using these search terms for the growth, production and biomass variables: ((TS = ((Seagrass* OR eelgrass OR SAV OR Amphibolis OR Cymodocea OR Enhalus OR Halophila OR Halodule OR Posidonia OR Phyllospadix OR Ruppia OR Thalassia OR Thalassodendron OR Zostera) AND (product* OR biomass OR growth OR exten)))).
Table 1Summary table outlining the count of data for each of the 15 seagrass variables based on bioregion, geotype and genera categorical variables. Above-ground biomass (AG), below-ground biomass (BG), total biomass (TB), shoot density (ShD), leaf density (LD), percent cover (Cov), above-ground production (AGP), below-ground production (BGP), total production (TP), shoot production (SP) and leaf production (LP).

Only data from peer-reviewed papers were included, and thereby, the dataset compiled excludes data from non-peer-reviewed papers and reports. We acknowledge that our search has likely missed a small portion of the peer-reviewed data published to date, owing to the use of different terms across research fields and the use of a single search engine, WOS, to conduct the review. Data for 11 variables (mean values) were extracted (Table 1, see Sect. 2.2) and compiled in a database (https://doi.org/10.1594/PANGAEA.929968, Strydom et al., 2021). These variables were selected based on their widespread study among seagrass habitats and on their usefulness for quantifying seagrass condition across papers with different aims (Short and Coles, 2001). Standardised units (spatially, i.e. m−2, and temporally, i.e. d−1) are reported. Note that data from mesocosm experiments, field experiments with the exception of control sites or meadows altered by direct anthropogenic disturbances (i.e. aquaculture, anchoring or dredging) were dismissed as these were considered impacted meadows and were unlikely to reflect meadows in a “natural” condition. Note that seagrass species were recorded following accepted convention as per Short et al. (2011) (e.g. Zostera capricorni, Z. mucronata and Z. novazealandica were named Z. muelleri).
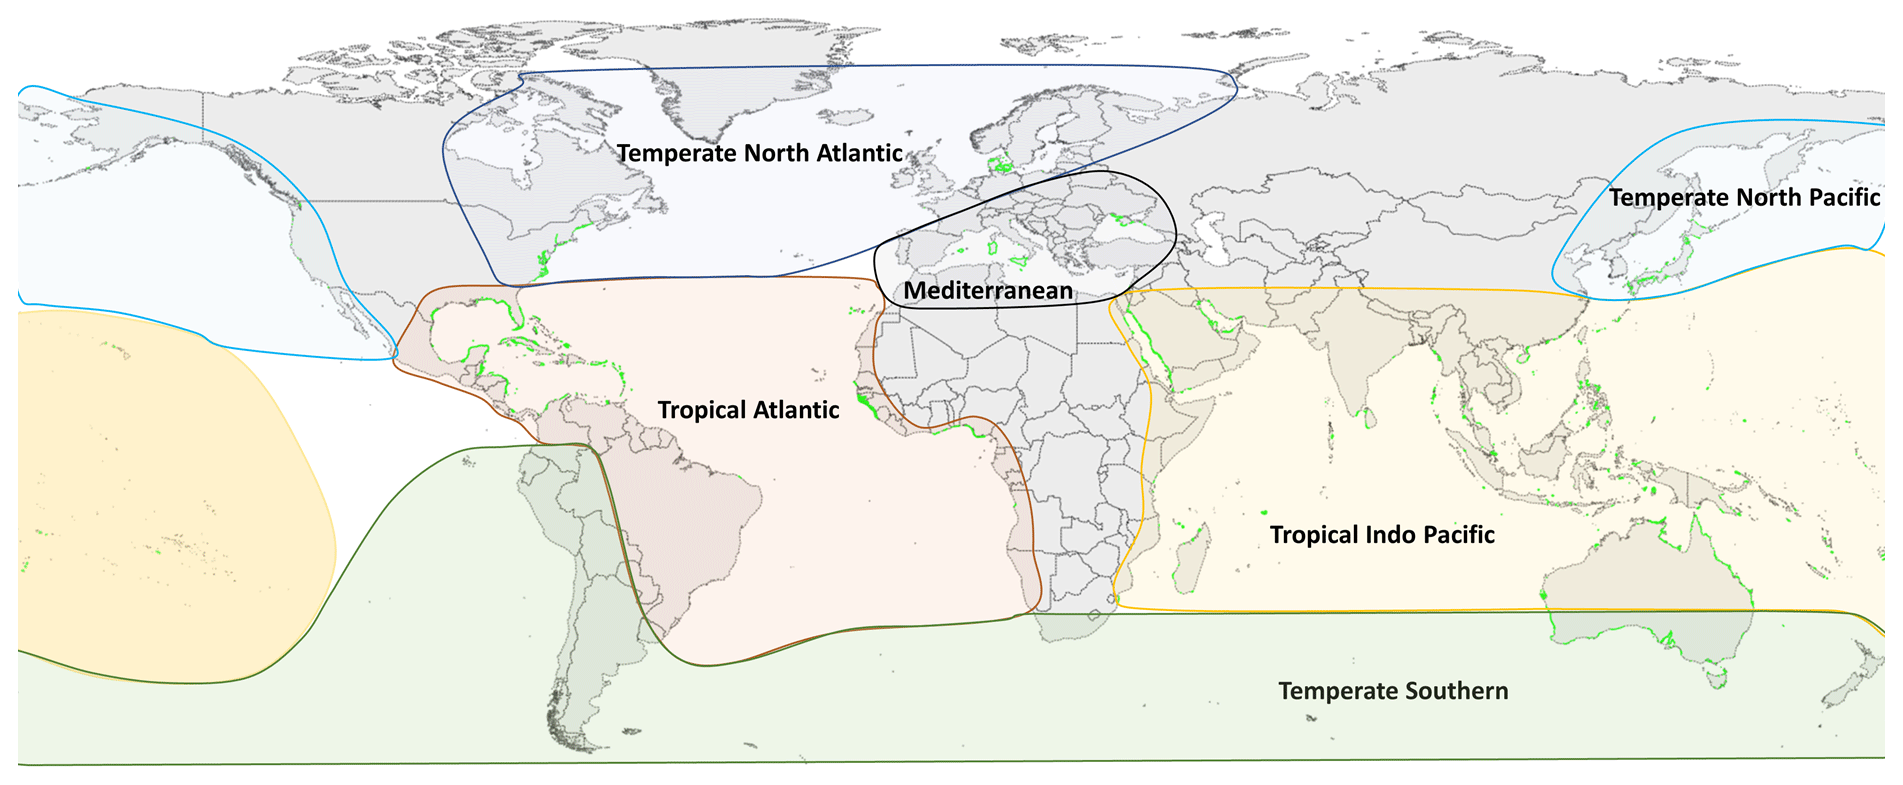
Figure 1Global distribution of seagrass meadows (green) overlaid within six seagrass bioregions. Seagrass distribution data sourced from UNEP-WCMC and Short (2017). Seagrass bioregions adapted from Short et al. (2007).
2.2 Seagrass structure, biomass, production and reproduction variables
The 11 variables extracted from the peer-reviewed literature were classified within three categories: seagrass meadow structure (three variables), biomass (three variables) and production (five variables).
-
seagrass meadow structure – percent cover (%), shoot density (no. shoots m−2), leaf density (no. leaves m−2);
-
seagrass biomass – above-ground biomass dry weight (DW) (g DW m−2), below-ground biomass (g DW m−2) and total biomass (g DW m−2);
-
seagrass production – shoot production (g DW m−2 d−1), leaf production (g DW m−2 d−1), above-ground production (g DW m−2 d−1), below-ground production (g DW m−2 d−1) and total production (g DW m−2 d−1).
For all these 11 variables, relevant data points were extracted from results text, tables and when appropriate from figures using a web-based tool that allow for the extraction of data from plots, images and maps (WebPlotDigitizer: https://automeris.io/WebPlotDigitizer/, last access: 5 September 2022). A data point in an individual row can be a mean of multiple replicates or a single unique measurement point for that variable and location. Other relevant spatial and site information was also extracted, including the latitude and longitude (decimal degrees), seagrass bioregion according to Short et al. (2007) (Fig. 1), geotype (coastal or estuarine geomorphology), seagrass genera, the year of sampling when reported and the DOI of the publication containing the data. When sampling site coordinates were not reported in the publication, study location maps were consulted if applicable and corresponding coordinates estimated using Google Earth. Similarly, geotype was classified as estuarine if the study site was in close proximity to riverine input or within a coastal lagoon; conversely if there were no rivers nearby or the study site was located within an embayment, then it was considered coastal. If publications included data on above-ground biomass and below-ground biomass for the same study site, these two values were summed to estimate a value of total seagrass biomass. Publications that reported growth or production expressed as grams of carbon were excluded. When sampling was conducted over multiple years, the year of sampling was left blank and not reported in the dataset.
The seagrass natural history information reported and the way it was reported has evolved during the 45 years of research compiled. Overall, early publications provided comprehensive details regarding meadow structure and production, while sampling procedures were not clearly described. Later on, the sampling strategies and data reporting became more standardised and comprehensive.
2.3 Statistical analyses
Descriptive parameters (e.g. count of data and publications and minimum, maximum and median values) for all 11 variables were compiled. Median values are reported instead of mean values because the data for most of the variables studied are not normally distributed. Box plots for four key variables sorted by bioregion and genera were produced in R using various packages within Tidyverse (version 4.0.1; Wickham et al., 2019; R Core Team, 2020). In order to spatially illustrate the dataset, maps were also created in R, using the leaflet package (Graul, 2016).
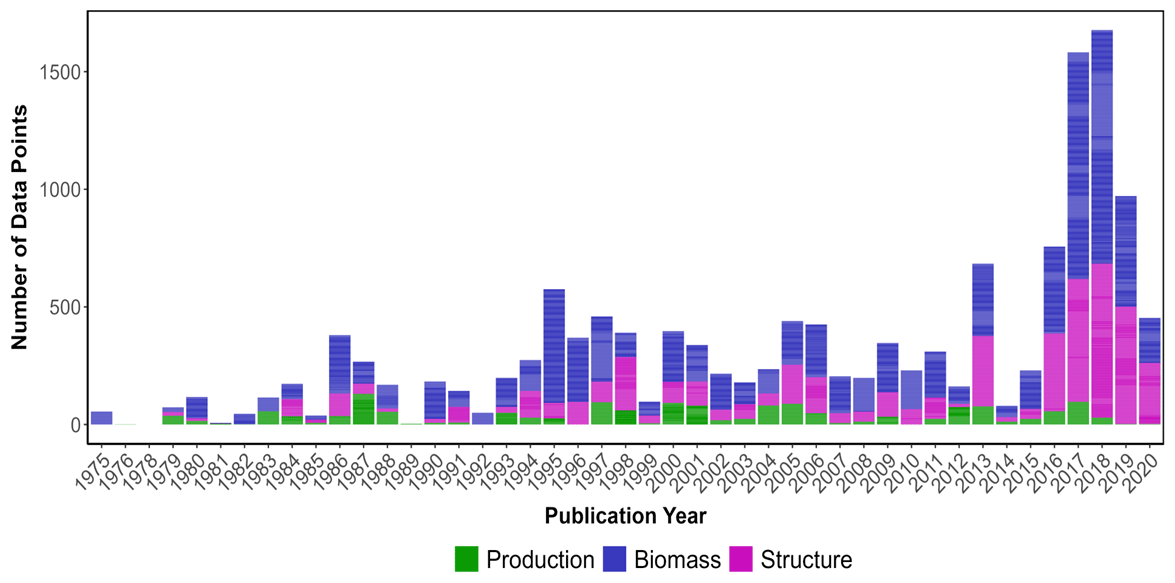
Figure 2Number of publications that included seagrass data (coloured by type: biomass, structure and production) based on the year of data collection. Data from peer-reviewed publications that did not report the year of sampling were not included in this figure.
The highest number of data points were collected in the year 2018, while the lowest occurred in 1975 (Fig. 2). Overall, all data categories were represented well over time (1972–2020), with biomass data present in the majority of papers consistently over time, meadow structure data encompassing a larger proportion of data over the last decade and production data being the least studied category. Data were extracted from a total of 390 peer-reviewed publications, with 66 % of the studies conducted in coastal marine areas (n=263), 32 % conducted in estuarine areas (n=120) and seven studies conducted in both coastal and estuarine areas (2 %).

Figure 3Global distribution map of data on seagrass structure, biomass and production coloured by genera. The coloured points indicate the genera of seagrass studied, and where many studies overlap, the colour appears darker than the key.
3.1 Spatial distribution of seagrass data
The seagrass database includes information collected across 11 variables on seagrass structure, biomass and production from all 12 seagrass genera described to date, spanning all continents except Antarctica (Fig. 3). Based on the count of data, the top five most studied genera making up 84 % of the database were Zostera (n=5736), Thalassia (n=2081), Cymodocea (n=1456), Halodule (n=1416) and Halophila (n=1343). The least studied genera were Amphibolis (n=86), Thalassodendron (n=115) and Phyllospadix (n=126). The predominance of Zostera data could be related to their broad global distribution, including European countries which were the pioneers of seagrass science, while the least studied genera are more geographically restricted (Fig. 3). The bioregion with the highest number of data was the Tropical Indo-Pacific (n=3612), which also included 10 of the 12 genera, illustrating the seagrass biodiversity of this bioregion. The number of data across the Temperate North Pacific (n=2121; four genera), Mediterranean (n=1965; five genera), Temperate North Atlantic (n=1837; five genera), Temperate Southern (n=1790; seven genera) and Tropical Atlantic (n=2946; six genera) bioregions was similar. There was up to a 67-fold difference between the most and least studied seagrass genera but only a 2-fold difference between bioregions. Overall, data for the production category were the least reported (n=1536; 11 %) followed by structure (n=4643; 32 %), whereas biomass variable types were the most reported (n=8092; 57 %) (Fig. 4).
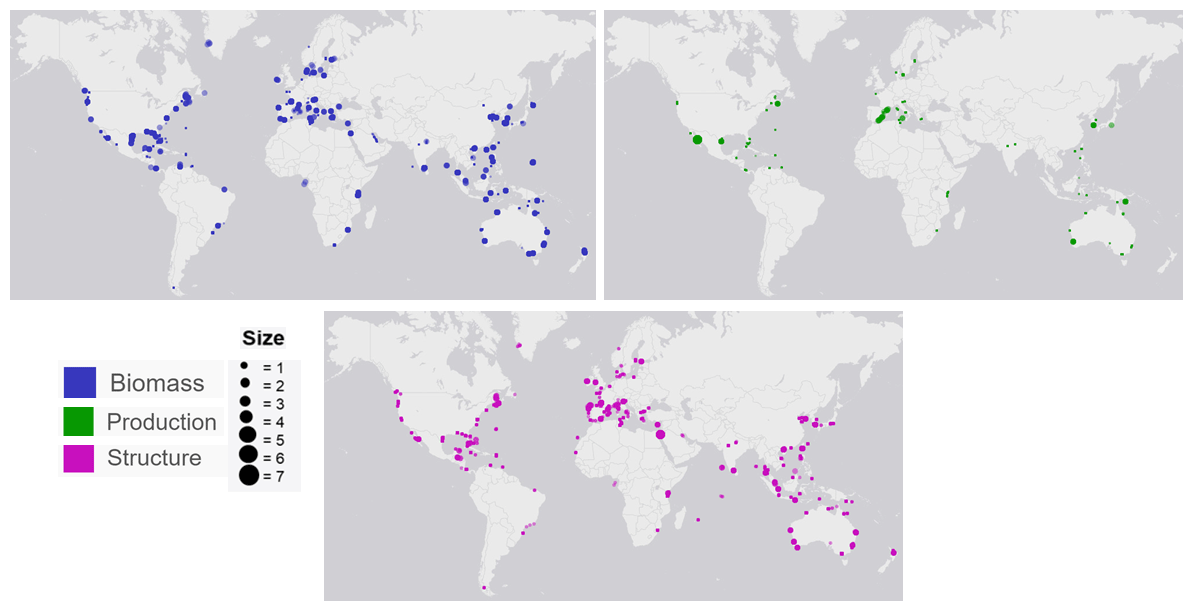
Figure 4Global distribution map of seagrass study sites labelled as dots. The colours indicate the data type (biomass, production and structure), while the size of each dot illustrates the number of data points for each site.
3.2 Variability in seagrass data among variables
The dataset compiled includes data on shoot density (n=3212), percent cover (n=1285), leaf density (n=146), above-ground biomass (n=3389), below-ground biomass, (n=2008), total biomass (n=2695), shoot production (n=151), leaf production (n=737), above-ground production (n=265), below-ground production (n=125) and total production (n=258). Across all datasets, shoot density ranged from 0.08 to 28 682 shoots m−2 (median = 675), percent cover from 0.3 to 100 % (median = 33), leaf density from 5.1 to 48 978 leaves m−2 (median = 3287), above-ground biomass from 0.01 to 1509 g DW m−2 (median = 52), below-ground biomass from 0.03 to 5635 g DW m−2 (median = 69), total biomass from 0.01 to 3393 g DW m−2 (median = 134), shoot production from 0.001 to 24 g DW m−2 d−1 (median = 0.34), leaf production from 0.001 to 165 g DW m−2 d−1 (median = 1.5), above-ground production from 0.001 to 23 g DW m−2 d−1 (median = 1.5), below-ground production from 0.015 to 34 g DW m−2 d−1 (median = 1.3) and total production from 0.002 to 39 g DW m−2 d−1 (median = 2.5).
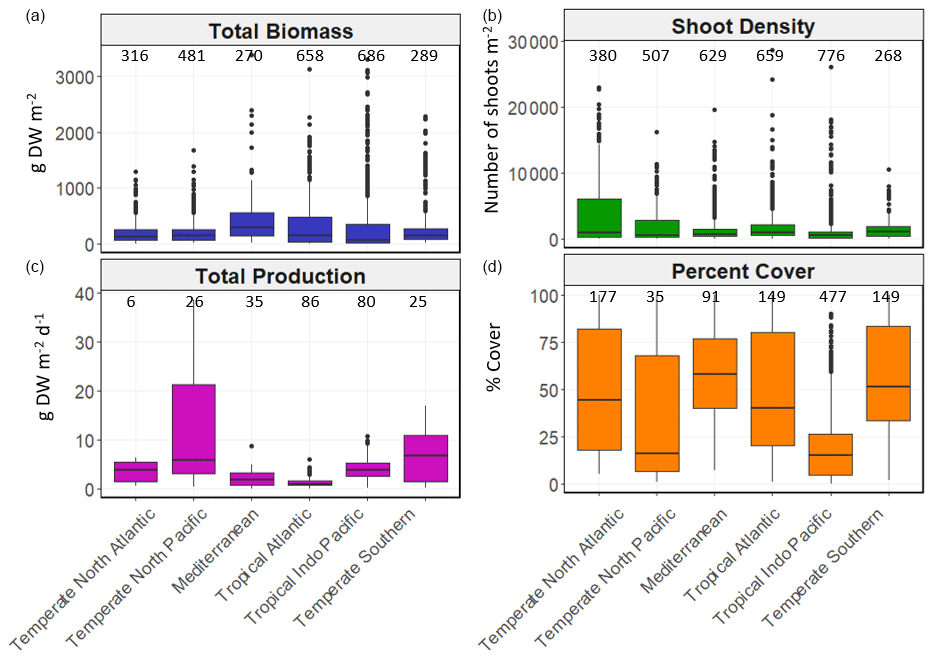
Figure 5Box-and-whisker plots depicting seagrass total biomass (including above-ground and below-ground biomass; g DW m−2), shoot density (number of shoots m−2), total production (g DW m−2 d−1) and percent cover (%) values within each bioregion. The box plots show the median value (black line within box), 75 % and 25 % percentiles create the top and bottom of the box, and the tails are the maximum and minimum contributions within 1.5 interquartile range. Count of data (N) per bioregion is shown at the top of each whisker.
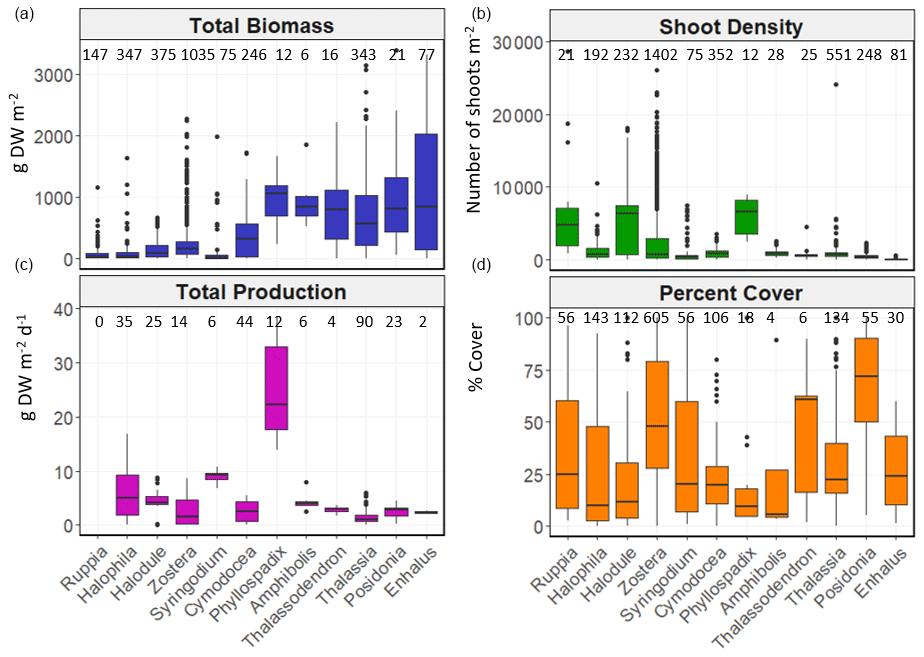
Figure 6Box-and-whisker plots depicting total biomass (g DW m−2), shoot density (number of shoots m−2), total net primary production (g DW m−2 d−1) and percent cover (%) values per genera. The box plots show the median value (black line within box), 75 % and 25 % percentiles create the top and bottom of the box, and the tails are the maximum and minimum contributions within 1.5 interquartile range. Count of data (N) per bioregion is shown at the top of each whisker.
There was high variability in most variables using pooled data across bioregions and genera and in the number of data for each variable across bioregion, geotype and genera (Table 1). The values of some variables varied substantially across the six bioregions (Fig. 5). Median total biomass was highest in the Mediterranean bioregion (283 g DW m−2), while the lowest was in the Tropical Indo-Pacific bioregion (61 g DW m−2). The highest median shoot density values were recorded in the Temperate Southern bioregion (967 shoots m−2) and the lowest in the Temperate North Pacific bioregion (466 shoots m−2), whereas the highest median total production values were recorded in the Temperate Southern bioregion (6.6 g DW m−2 d−1). Of all genera, total biomass was generally highest for seagrasses with persistent life history stages, such as Posidonia and Enhalus (Kilminster et al., 2015). Phyllospadix had the highest median total biomass (1056 g DW m−2), followed by Amphibolis (845 g DW m−2) (Fig. 6). Median shoot density values were highest for Phyllospadix (6593 shoots m−2), followed by Halodule (6343 shoots m−2). Total production was highest for Phyllospadix (median 22 g DW m−2 d−1), followed by Syringodium (median 9.3 g DW m−2 d−1).
3.3 Significant gaps
This global collation of seagrass data has illustrated some gaps in our collective peer-reviewed knowledge. Across seagrass' worldwide distribution, limited peer-reviewed data were found for the eastern Mediterranean and the coastlines of South America and Africa. Data for some seagrass variables were spatially depauperate, such as seagrass production at high latitudes (<50∘ N and S), including the Temperate North Atlantic. Overall, seagrass production variables were the least reported. When considering data among seagrass genera, the least studied were Amphibolis (n=86), Thalassodendron (n=115) and Phyllospadix (n=126), with gaps in most variables.
Data are archived in the data repository PANGAEA (https://doi.org/10.1594/PANGAEA.929968) (Strydom et al., 2022).
R scripts used to generate figures and maps can be found in the Supplement.
This database encompassing peer-reviewed data collected over the last 48 years provides an overview of seagrass distribution, biomass, production and structure on a global scale. The top five most prevalent studied genera encompassing 84 % of data were Zostera (mostly from the Temperate North Pacific), Thalassia and Halodule (Tropical Atlantic), and Cymodocea and Halophila (Tropical Indo-Pacific and Mediterranean), and the least studied genera were Amphibolis, Thalassodendron and Phyllospadix (2.3 % of data). Data hotspots include the Tropical Indo-Pacific bioregion (25 % of dataset), whereas the Temperate Southern bioregion had the least amount of data (13 % of data). The strengths of seagrass natural history knowledge focus on seagrass biomass (57 % of data). Our review can inform several research fields beyond seagrass ecology, such as the development of nature-based solutions for climate change mitigation and adaptation and the blue economy, which include readership interested in blue carbon, engineering, fisheries, global change, conservation and policy.
The supplement related to this article is available online at: https://doi.org/10.5194/essd-15-511-2023-supplement.
OS conceived the idea. SS and OS led the project, curated data and wrote the paper. SS, JR, SM, RB, MJH and OS conducted literature searches. SS, RM, KI, CLW, NES, CS, SB, AL, CMO'D, CC, CG, CMP, ND, AW, AMF, RB, SM, FV, VP, AD'C, KMM, JR, MJH, GAH and OS contributed to the manuscript and/or extracted data from papers. SS, CLW, RM, CMP and OS wrote scripts and created figures and tables. All authors reviewed the manuscript.
The contact author has declared that none of the authors has any competing interests.
Publisher's note: Copernicus Publications remains neutral with regard to jurisdictional claims in published maps and institutional affiliations.
We would also like to acknowledge the help of Madison Williams-Hoffman, Casper Avenant and Paul Lavery for their respective input into earlier versions of this paper and the Centre for Marine Ecosystems Research.
Anna Lafratta was supported by Environmental Protection Authority (SA)/Water SA and Edith Cowan University (ECU) Industry Engagement Scholarship. Cristian Salinas was funded by ECU Higher Degree by Research Scholarship. Oscar Serrano was supported by I+D+i projects RYC2019-027073-I and PIE HOLOCENO 20213AT014 funded by MCIN/AEI/10.13039/501100011033 and FEDER.
This paper was edited by Giuseppe M.R. Manzella and reviewed by two anonymous referees.
Ascioti, F. A., Mangano, M. C., Marcianò, C., and Sarà, G.: The sanitation service of seagrasses–Dependencies and implications for the estimation of avoided costs, Ecosystem Services, 54, 101418, https://doi.org/10.1016/j.ecoser.2022.101418, 2022.
Cullen-Unsworth, L. C., Nordlund, L. M., Paddock, J., Baker, S., McKenzie, L. J., and Unsworth, R. K. F.: Seagrass meadows globally as a coupled social-ecological system: Implications for human wellbeing, Mar. Pollut. Bull., 83, 387–397, https://doi.org/10.1016/j.marpolbul.2013.06.001, 2014.
de los Santos, C. B., Krause-Jensen, D., Alcoverro, T., Marbà, N., Duarte, C. M., van Katwijk, M. M., Pérez, M., Romero, J., Sánchez-Lizaso, J. L., Roca, G., Jankowska, E., Pérez-Lloréns, J. L., Fournier, J., Montefalcone, M., Pergent, G., Ruiz, J. M., Cabaço, S., Cook, K., Wilkes, R. J., Moy, F. E., Trayter, G. M. R., Arañó, X. S., de Jong, D. J., Fernández-Torquemada, Y., Auby, I., Vergara, J. J., and Santos, R.: Recent trend reversal for declining European seagrass meadows, Nat. Commun., 10, 1–8, https://doi.org/10.1038/s41467-019-11340-4, 2019.
Duarte, C. M. and Chiscano, C. L.: Seagrass biomass and production: A reassessment, Aquat. Bot., 65, 159–174, https://doi.org/10.1016/S0304-3770(99)00038-8, 1999.
Duarte, C. M., Losada, I. J., Hendriks, I. E., Mazarrasa, I., and Marbà, N.: The role of coastal plant communities for climate change mitigation and adaptation, Nat. Clim. Chang., 3, 961–968, https://doi.org/10.1038/nclimate1970, 2013.
Graul, C.: leafletR: Interactive Web-Maps Based on the Leaflet JavaScript Library, http://cran.r-project.org/package=leafletR (last access: 12 September 2023), 2016.
Hall, M. O., Durako, M. J., Fourqurean, J. W., and Zieman, J. C.: Decadal changes in seagrass distribution and abundance in Florida Bay, Estuaries, 22, 445–459, https://doi.org/10.2307/1353210, 1999.
Hoegh-Guldberg, O. and Bruno, J. F.: The impact of climate change on the world's marine ecosystems, Science, 328, 1523–1528, https://doi.org/10.1126/science.1189930, 2010.
Kilminster, K., McMahon, K., Waycott, M., Kendrick, G. A., Scanes, P., McKenzie, L., O'Brien, K. R., Lyons, M., Ferguson, A., Maxwell, P., Glasby, T., and Udy, J.: Unravelling complexity in seagrass systems for management: Australia as a microcosm, Sci. Total Environ., 534, 97–109, https://doi.org/10.1016/J.SCITOTENV.2015.04.061, 2015.
Lamb, J. B., Van De Water, J. A. J. M., Bourne, D. G., Altier, C., Hein, M. Y., Fiorenza, E. A., Abu, N., Jompa, J., and Harvell, C. D.: Seagrass ecosystems reduce exposure to bacterial pathogens of humans, fishes, and invertebrates, Science, 355, 731–733, https://doi.org/10.1126/science.aal1956, 2017.
McMahon, K., Collier, C., and Lavery, P. S.: Identifying robust bioindicators of light stress in seagrasses: A meta-analysis, Ecol. Indic., 30, 7–15, https://doi.org/10.1016/j.ecolind.2013.01.030, 2013.
Nordlund, L. M., Koch, E. W., Barbier, E. B., and Creed, J. C.: Seagrass ecosystem services and their variability across genera and geographical regions, edited by K. O. Reinhart, PLoS One, 11, e0163091, https://doi.org/10.1371/journal.pone.0163091, 2016.
R Core Team: R: A language and environment for statistical computing. R Foundation for Statistical Computing, Vienna, Austria, https://www.R-project.org/ (last access: 5 December 2022), 2020.
Short, F., Carruthers, T., Dennison, W., and Waycott, M.: Global seagrass distribution and diversity: A bioregional model, J. Exp. Mar. Bio. Ecol., 350, 3–20, https://doi.org/10.1016/j.jembe.2007.06.012, 2007.
Short, F. T. and Coles, R. G. (Eds.): Global seagrass research methods, Elsevier, ISBN 0 444 50891 0, 2001.
Short, F. T., Polidoro, B., Livingstone, S. R., Carpenter, K. E., Bandeira, S., Bujang, J. S., Calumpong, H. P., Carruthers, T. J. B., Coles, R. G., Dennison, W. C., Erftemeijer, P. L. A., Fortes, M. D., Freeman, A. S., Jagtap, T. G., Kamal, A. H. M., Kendrick, G. A., Judson Kenworthy, W., La Nafie, Y. A., Nasution, I. M., Orth, R. J., Prathep, A., Sanciangco, J. C., Tussenbroek, B. van, Vergara, S. G., Waycott, M., and Zieman, J. C.: Extinction risk assessment of the world's seagrass species, Biol. Conserv., 144, 1961–1971, https://doi.org/10.1016/J.BIOCON.2011.04.010, 2011.
Strydom, S., Murray, K., Wilson, S., Huntley, B., Rule, M., Heithaus, M., Bessey, C., Kendrick, G. A., Burkholder, D., Fraser, M. W., and Zdunic, K.: Too hot to handle: Unprecedented seagrass death driven by marine heatwave in a World Heritage Area, Glob. Chang. Biol., 26, 3525–3538, https://doi.org/10.1111/gcb.15065, 2020.
Strydom, S. Webster, C. L., O'Dea, C. M., Said, N. E., McCallum, R., Inostroza, K., Salinas, C., Billinghurst, S., Lafratta, A., Phelps, C. M., Campbell, C., Gorham, C., Dunham, N., Bernasconi, R., Frouws, A., Werner, A., Vitelli, F., Puigcorbé, V., D'Cruz, A., McMahon, K. M., Robinson, J., Huggett, M. J., McNamara, S., Hyndes, G. A., and Serrano, Ó.: Global database of key seagrass structure, biomass, production and reproduction variables, PANGAEA [data set], https://doi.org/10.1594/PANGAEA.929968, 2021.
UNEP-WCMC and Short, F. T.: Global distribution of seagrasses (version 6.0), Sixth update to the data layer used in Green and Short (2003), Cambridge (UK), UN Environment World Conservation Monitoring Centre, http://data.unepwcmc.org/datasets/7 (last access: 5 June 2018), 2017.
Unsworth, R. K. F., McKenzie, L. J., Collier, C. J., Cullen-Unsworth, L. C., Duarte, C. M., Eklöf, J. S., Jarvis, J. C., Jones, B. L., and Nordlund, L. M.: Global challenges for seagrass conservation, Ambio, 48, 801–815, https://doi.org/10.1007/s13280-018-1115-y, 2018.
Waycott, M., Duarte, C. M., Carruthers, T. J. B., Orth, R. J., Dennison, W. C., Olyarnik, S., Calladine, A., Fourqurean, J. W., Heck, K. L., Hughes, A. R., Kendrick, G. A., Kenworthy, W. J., Short, F. T., and Williams, S. L.: Accelerating loss of seagrasses across the globe threatens coastal ecosystems, P. Natl. Acad. Sci. USA, 106, 12377–12381, https://doi.org/10.1073/pnas.0905620106, 2009.
Wickham, H., Averick, M. Bryan, J., Chang, W., McGowan, L. D., François, R., Grolemund, G., Hayes, A., Henry, L., Hester, J., Kuhn, M., Pedersen, T. L., Miller, E., Bache, S. M., Müller, K., Ooms, J., Robinson, D., Seidel, D. P., Spinu, V., Takahashi, K., Vaughan, D., Wilke, C., Woo, K., Yutani, H.: Welcome to the tidyverse, J. Open Source Softw., 4, 1686, https://doi.org/10.21105/joss.01686, 2019.