the Creative Commons Attribution 4.0 License.
the Creative Commons Attribution 4.0 License.
 | 16 Nov 2023
Database of nitrification and nitrifiers in the global ocean
Bess B. Ward
Michael Beman
Laura Bristow
Darren Clark
Sarah Fawcett
Claudia Frey
François Fripiat
Gerhard J. Herndl
Mhlangabezi Mdutyana
Fabien Paulot
Xuefeng Peng
Alyson E. Santoro
Takuhei Shiozaki
Eva Sintes
Charles Stock
Xianhui S. Wan
Min N. Xu
Yao Zhang
As a key biogeochemical pathway in the marine nitrogen cycle, nitrification (ammonia oxidation and nitrite oxidation) converts the most reduced form of nitrogen – ammonium–ammonia (NH–NH3) – into the oxidized species nitrite (NO) and nitrate (NO). In the ocean, these processes are mainly performed by ammonia-oxidizing archaea (AOA) and bacteria (AOB) and nitrite-oxidizing bacteria (NOB). By transforming nitrogen speciation and providing substrates for nitrogen removal, nitrification affects microbial community structure; marine productivity (including chemoautotrophic carbon fixation); and the production of a powerful greenhouse gas, nitrous oxide (N2O). Nitrification is hypothesized to be regulated by temperature, oxygen, light, substrate concentration, substrate flux, pH and other environmental factors. Although the number of field observations from various oceanic regions has increased considerably over the last few decades, a global synthesis is lacking, and understanding how environmental factors control nitrification remains elusive. Therefore, we have compiled a database of nitrification rates and nitrifier abundance in the global ocean from published literature and unpublished datasets. This database includes 2393 and 1006 measurements of ammonia oxidation and nitrite oxidation rates and 2242 and 631 quantifications of ammonia oxidizers and nitrite oxidizers, respectively. This community effort confirms and enhances our understanding of the spatial distribution of nitrification and nitrifiers and their corresponding drivers such as the important role of substrate concentration in controlling nitrification rates and nitrifier abundance. Some conundrums are also revealed, including the inconsistent observations of light limitation and high rates of nitrite oxidation reported from anoxic waters. This database can be used to constrain the distribution of marine nitrification, to evaluate and improve biogeochemical models of nitrification, and to quantify the impact of nitrification on ecosystem functions like marine productivity and N2O production. This database additionally sets a baseline for comparison with future observations and guides future exploration (e.g., measurements in the poorly sampled regions such as the Indian Ocean and method comparison and/or standardization). The database is publicly available at the Zenodo repository: https://doi.org/10.5281/zenodo.8355912 (Tang et al., 2023).
- Article
(21038 KB) - Full-text XML
- BibTeX
- EndNote


Nitrification (ammonia oxidation and nitrite oxidation) converts the most reduced form of nitrogen (N) – ammonium–ammonia (NH–NH3) – into the oxidized compounds nitrite (NO) and nitrate (NO). Ammonia oxidation is conducted by ammonia-oxidizing archaea (AOA) and bacteria (AOB), with AOA dominating in most marine environments (Francis et al., 2005; Wuchter et al., 2006). Marine AOA are often separated into a few major ecotype groups, including water column group A, water column group B and the Nitrosopumilus-like group (Beman et al., 2008; Tolar et al., 2020), with a diverse group of AOA remaining to be characterized (Alves et al., 2018). Marine nitrite oxidation is carried out by nitrite-oxidizing bacteria (NOB) such as Nitrospina, Nitrospira, Nitrococcus and Nitrobacter, with Nitrospina as the dominant group (Mincer et al., 2007; Pachiadaki et al., 2017). Complete ammonia-oxidizing (comammox) bacteria within the bacterial genus Nitrospira have been identified in freshwater, terrestrial and coastal environments but have not yet been found in the open ocean (Daims et al., 2015; Van Kessel et al., 2015; Xia et al., 2018).
Nitrification and nitrifiers are thought to be regulated by light and/or solar radiation, oxygen, temperature, substrate concentration, pH, and other environmental factors (Ward, 2008), many of which are experiencing dramatic changes in the ocean. For example, light is generally found to inhibit nitrifier growth and nitrification rate (Olson, 1981b; Merbt et al., 2012; Xu et al., 2019). In addition, ocean acidification decreases ammonia oxidation rates (Beman et al., 2011; Breider et al., 2019) partly due to the decreased availability at lower pH levels of NH3, which is the actual substrate for ammonia oxidation (Suzuki et al., 1974). In contrast, ocean warming shifts the NH–NH3 equilibrium towards NH3 by decreasing the pKa (Emerson et al., 1975) and is observed to enhance enzyme activity (Zheng et al., 2017, 2020), further complicating the effect of climate change on nitrification.
Although nitrification does not directly change the absolute inventory of bioavailable N, it can control the relative availability of substrates (NH, NO and NO) for phytoplankton growth. Since prokaryotic phytoplankton preferentially assimilate NH, while eukaryotic phytoplankton are better able to exploit NO in the sunlit surface ocean (Berthelot et al., 2018; Fawcett et al., 2011), variations in the relative supply of NH versus NO can influence phytoplankton community composition and ecosystem functionalities. Because the uptake of NH and NO is often used to differentiate regenerated and new production (Eppley and Peterson, 1979), production of NO by nitrification in the surface ocean may bias the estimate of new production (Yool et al., 2007). NO and NO are also involved in denitrification and anammox, which remove bioavailable N from the ocean. Thus, nitrification can indirectly affect the size of the bioavailable N pool, marine productivity and ultimately the atmospheric CO2 concentration (Falkowski, 1997). As a chemoautotrophic process, nitrification in the ocean water column is estimated to supply ∼0.13–1.4 Pg C yr−1 of organic matter, which is critical to support the heterotrophic microbial community and/or metabolism in the dark ocean (Bayer et al., 2022; Middelburg, 2011; Pachiadaki et al., 2017; Zhang et al., 2020). Nitrification could also contribute to the oxygen consumption and the development of hypoxia or anoxia (Hsiao et al., 2014; Beman et al., 2021). In addition, nitrification is the major global-ocean source of N2O, a potent greenhouse gas and dominant ozone-depleting agent, thus connecting the marine N cycle directly to the Earth's climate system (Freing et al., 2012; Ji et al., 2018).
Considering the important role of nitrification and nitrifiers in marine N and C cycles and Earth's climate, a better understanding of its distribution and regulating factors is highly desirable. Historical observations of nitrification and nitrifiers cover a wide range of environmental gradients and biogeography in the ocean, ranging from cross-Atlantic (e.g., Clark et al., 2008, 2022), western Pacific (e.g., Wan et al., 2021, 2018) and polar oceans (e.g., Shiozaki et al., 2019; Mdutyana et al., 2020) to oxygen-minimum zones (e.g., Peng et al., 2015; Santoro et al., 2021). This study aims to introduce the newly constructed database of nitrification and nitrifiers in the marine water column and to guide future research efforts in field observations and model development of nitrification. This new global synthesis significantly expands upon what was possible with earlier, more limited datasets (Yool et al., 2007; Ward, 2008). Additional reviews on marine nitrification and nitrifiers can be found elsewhere (Schleper and Nicol, 2010; Daims et al., 2016; Ward, 2011b).
2.1 Data sources and compilation
Nitrification rates, including ammonia oxidation and nitrite oxidation, and the abundances of ammonia oxidizers and nitrite oxidizers were extracted directly from the literature published between 1984 and 2022 when the data were presented in tables or supplementary materials from publications; otherwise, data were provided by the co-authors. Some previously unpublished data were also included in the database. Tables 1 and 2 summarize the origin, methods and locations of nitrification rate and nitrifier abundance measurements, sorted in alphabetical order by lead author. The metadata format contains geographical sampling information (date, latitude, longitude and depth) and concurrent measurements of environmental conditions such as light intensity, temperature, salinity, water density, N concentration (NH, NO and NO), pH and oxygen concentration if available. In total, there are 2393, 1006, 2242 and 631 measurements of ammonia oxidation rate, nitrite oxidation rate, ammonia oxidizer abundance and nitrite oxidizer abundance, respectively. However, not all measurements of nitrification rates or nitrifier abundance are accompanied by all the environmental factors because such factors were often not reported in the literature or recorded during the measurements and/or sample collections. Rates, nitrifier abundances and environmental parameters below the methodological detection limits are noted as BDL. NM represents parameters that were not measured. Empty or NA means that data are not available or reported. The database is deposited into the Zenodo repository following the Findable, Accessible, Interoperable and Reusable (FAIR) principles for data management (Wilkinson et al., 2016). We encourage authors and readers to contact us to report an update to or an error in the database.
Table 1Summary of the number of observations for nitrification rates in alphabetical order by lead author. The method (e.g., substrate tracer addition vs. product dilution), sampling regions and whether nitrifier abundance is quantified are listed. Methods used for data collection are described in the next section.
Table 2Summary of the number of observations for nitrifier abundance from qPCR assays in alphabetical order by lead author. The top row indicates the gene quantified for each group (see text for further details). Whether nitrification rate is measured is indicated with yes or no. The primers used for individual studies are identified in the database. AOA: ammonia-oxidizing archaea; AOB: ammonia-oxidizing bacteria; NOB: nitrite-oxidizing bacteria.
We applied Chauvenet's criterion for quality controlling to flag outliers in nitrification rates and nitrifier abundance (Glover et al., 2011). Chauvenet's criterion is commonly applied to normally distributed datasets to identify outliers whose deviations from the mean have a probability of less than , where n is the number of data points (Buitenhuis et al., 2013). We applied the criterion acknowledging the fact that the data were collected at different environmental conditions. After removing measurements of 0 and below detection limit (277, 132, 51, 240, 6 and 11 observations for ammonia oxidation, nitrite oxidation, AOA amoA, AOB amoA, and 16S rRNA of Thaumarchaeota and Nitrospina), nitrification rates and nitrifier abundances were log10 transformed before further analysis. Nitrification rates and nitrifier abundances reported at 0 or below detection limit are noted separately in the database and following analysis. Although we did not find outliers for ammonia oxidation and nitrite oxidation rates, there are some extreme values worth noting. For example, an extremely high ammonia oxidation rate of 4900 nmol L−1 d−1 was observed in the Peruvian oxygen-minimum zone (Lam et al., 2009). Low but detectable rates below 0.01 nmol L−1 d−1 were observed in the Eastern tropical North Pacific oxygen-minimum zone (Frey et al., 2022), the South Atlantic Bight (Liu et al., 2018) and the western Pacific (Xu et al., 2018). Some outliers were identified by Chauvenet's criterion for ammonia oxidizers (1 for AOB amoA and 1 for 16S rRNA of Thaumarchaeota). An abnormally high abundance of the bacterial amoA gene (108 copies L−1) was observed in the South Pacific oxygen-minimum zone (Kalvelage et al., 2013), which was removed from the following analysis. A low abundance of 16S rRNA of Thaumarchaeota (25 copies L−1) was found in the surface water of the western Pacific (Zhang et al., 2020). In addition, the low-ammonia-concentration AOA ecotype (or water column group B AOA), at 2 copies L−1, was reported in the Arctic Ocean (Sintes et al., 2013). Measurements of nitrification rate and nitrifier abundance of 0 or below detection limit were not included in the analysis of outlier identification. For example, an AOA abundance at 0 or below detection limit (varies among studies) has been reported in the surface waters of the South Atlantic Bight (Damashek et al., 2018), the equatorial Pacific (Santoro et al., 2017) and the North Pacific (Shiozaki et al., 2016).
2.2 Methods for measuring ammonia oxidation and nitrite oxidation rates
Ammonia oxidation rate is commonly measured by comparing the changes in nitrite (NO) and nitrate (NO) concentrations in controls versus an experimental treatment containing a nitrification inhibitor (e.g., Dore and Karl, 1996), by tracking the oxidation of 15NH into the NO and NO pool (Olson, 1981a), or by the dilution of 15NO (Clark et al., 2007). Similarly, nitrite oxidation rate can be measured by the change in NO concentration, by tracking the oxidation of 15NO into the NO pool, or by the dilution of 15NO (Ward et al., 1989a). In addition, nitrification has also been estimated from the incorporation of the 14C tracer due to the chemoautotrophic metabolism of nitrifiers (Bianchi et al., 1997). There is a large uncertainty, however, in the conversion factor from carbon fixation to nitrification (Bayer et al., 2022). A more detailed description of methods for measuring nitrification can be found in Ward (2011a). The spatial distribution of different methods used to measure nitrification and the frequency distribution of measured rates using different methods are shown in Fig. 1. Rates measured with the substrate tracer addition method (15NH and 15NO) outnumbered other methods globally, but the product dilution method (15NO and 15NO) dominated in the Atlantic Ocean. The ammonia oxidation rates measured by different methods have similar median values. However, the median nitrite oxidation rate measured by the 15NO dilution method is significantly higher than the rate measured by the 15NO addition method (200.3 vs 7.4 nmol N L−1 d−1). These comparisons, however, are between samples aggregated from measurements taken at different sites. It is thus unclear whether the differences arise from differences in the measurement approaches (e.g., in sensitivity) or in the sites where measurements were made. A direct methods comparison is recommended for future exploration.
Figure 1Distribution of different methods used to measure ammonia oxidation (a) and nitrite oxidation (b). Others include 14C incorporation and concentration change methods. Note that the colors change slightly where they overlap in the histograms.
Incubations to measure nitrification rates have been conducted in polycarbonate and glass bottles, Exetainers, and plastic bags. Seawater is directly transferred from the Niskin bottle into the incubation containers to minimize temperature, oxygen and other perturbations. These incubation containers are usually kept in an incubator with light filters to mimic the ambient temperature and light conditions. After incubating for 3 h to over 24 h, depending on the estimated magnitude of the nitrification rates, the incubation is terminated by filtering via GF/F or 0.22 µm filters (e.g., Baer et al., 2017; Wan et al., 2018). The filtrate is then frozen at −20 or −80 ∘C until further analysis on land. The incubation has also been terminated by subsampling and freezing without filtration (e.g., Damashek et al., 2018). Alternatively, the incubation is preserved by adding mercury chloride or zinc chloride (Kalvelage et al., 2013; Frey et al., 2020). This method allows gas measurements like N2O and N2 production before nitrification analysis. Detailed incubation conditions for each study are presented in the database file.
Various approaches have been developed to measure the N isotopes of NO and NO. For example, (1) dissolved NO is extracted by formation of an azo dye. The resulting dye is filtered onto precombusted GF/F or GF/C filters, and its 15N : 14N ratio is analyzed by elemental analyzer isotope ratio mass spectrometry (Ward et al., 1982; Olson, 1981a). NO can be reduced to NO by cadmium reduction and then extracted using the azo dye method described above. (2) Dissolved NO is converted to Sudan-1, and Sudan-1 is collected via solid-phase extraction. The sample is then purified by HPLC (high-performance liquid chromatography) and derivatized before analysis by GC–MS (gas chromatography–mass spectrometry) (Clark et al., 2007). Similarly, NO can be reduced to NO by cadmium prior to conversion to Sudan-1 for nitrogen isotope analysis. (3) NO can be converted to N2 with sulfamic acid and subsequently measured by isotope ratio mass spectrometry (Dalsgaard et al., 2012; Bristow et al., 2016a). (4) NO can also be converted into N2O by the azide method and subsequently measured by isotope ratio mass spectrometry (Mcilvin and Altabet, 2005). The N isotopes of NO and NO can be measured via the denitrifier method (Sigman et al., 2001; Weigand et al., 2016) where both NO and NO are converted into N2O. In addition, the δ15N of NO alone can be measured using the denitrifier method after removing NO with sulfamic acid (Granger and Sigman, 2009). The azide and denitrifier methods require smaller sample volumes and offer a higher sensitivity in nitrogen isotope detection.
Many factors may complicate the interpretation of rate measurements, e.g., isotope dilution by regeneration of the 15N-labeled substrates and stimulation of nitrification by substrate addition (Lipschultz, 2008). For instance, the amount of tracer addition varied substantially from <10 nM to 5 µM, enriching the ambient pool by <10 % to over 1000 %. The excess addition of substrates will likely enhance the nitrification rate, which will then reflect a potential rate instead of an in situ rate. In addition, the measurement of NO compared to NO NO could also lead to variations in the estimates of the ammonia oxidation rates. Specifically, 15NO produced from 15NH may be further oxidized to 15NO, especially when samples are low in NO concentration. Ammonia oxidation rate may be underestimated if only 15NO is measured instead of measuring both 15NO and 15NO (Santoro et al., 2013; Peng et al., 2015). Therefore, the NO carrier (to increase the NO pool and trap the produced 15NO) may be added to the sample before incubation, or both NO and NO should be measured after incubation when the ambient NO concentration is low. The 15NO isotope dilution method may overestimate ammonia oxidation rates because NO could also be released from phytoplankton after assimilative nitrate reduction (Lomas and Lipschultz, 2006). These confounding factors may be difficult to quantify but are worth recording and reporting in publications for the sake of comparison among studies. In addition, a variety of approaches have been applied to calculate nitrification rates. The following equations are commonly used to estimate nitrification measured by the tracer addition (Eq. 1; e.g., Peng et al., 2015) or tracer dilution method (Eq. 2; e.g., Clark et al., 2007; Cavagna et al., 2015). However, these equations do not account for the effect of other processes such as the isotope dilution on rate estimates. Please refer to other studies for the detailed rate correction processes (e.g., Lipschultz et al., 1986; Santoro et al., 2010; Kanda et al., 1987).
In the above equation, represents the change in concentration of or between the end and start of the incubation. F represents the fraction of 15N, such as or , in the initial substrate pool (NH or NO). Δt is the length of the incubation time.
In the above equation, Rt and R0 represent ratios of to after and before the incubation, respectively. is either or , which are used for calculating ammonia oxidation and nitrite oxidation rates, respectively. and are the concentration after and before the incubation, respectively. Δt is the length of the incubation time.
Nitrification supported by organic N substrates like urea and cyanate has been observed in the Gulf of Mexico (Kitzinger et al., 2018), Pacific (Santoro et al., 2017; Wan et al., 2021), off the coast of the United States (Laperriere et al., 2020; Tolar et al., 2017) and in the polar oceans (Alonso-Saez et al., 2012; Shiozaki et al., 2021). The number of these observations remains limited compared to ammonia oxidation. They can be included in future editions of the database (i.e., not included in the current database), and their role in the marine N cycle deserves future investigations.
2.3 Methods for quantifying ammonia oxidizers and nitrite oxidizers
We summarize the primers used to quantify nitrifier abundance based on both functional genes and 16S rRNA genes using quantitative PCR (qPCR) (Table 3). The cell abundance and biomass can be subsequently estimated based on the gene abundance, number of genes per cell and specific cell biomass (e.g., Kitzinger et al., 2020; Khachikyan et al., 2019). The oxidation of ammonia to hydroxylamine is catalyzed by ammonia mono-oxygenase, which is a multi-sub-unit enzyme partially encoded by the amoA gene. Primers have been designed to quantify both bacterial and archaeal amoA genes (Rotthauwe et al., 1997; Francis et al., 2005; Hornek et al., 2006; Wuchter et al., 2006; Beman et al., 2008; Mosier and Francis, 2012; Sintes et al., 2013). Archaeal ammonia oxidizers are also separated into different ecotypes including water column ecotypes A and B (WCA and WCB), which preferentially inhabit the surface vs. deep ocean, respectively, or high-ammonia-concentration groups vs. low-ammonia-concentration groups, which dominate in high-ammonia-concentration environments vs. low-ammonia-concentration environments, respectively. The nxrB gene, which encodes the beta subunit of nitrite oxidoreductase for nitrite oxidation, has been used to quantify Nitrospira (Pester et al., 2014). However, no primers targeting nxr genes are available for other groups of nitrite oxidizers such as Nitrospina, which is the dominant group of nitrite oxidizers in the ocean (Beman et al., 2013; Pachiadaki et al., 2017). Primers have also been designed to quantify the 16S rRNA gene abundance of Thaumarchaeota, Nitrospira and Nitrospina (Mincer et al., 2007; Graham et al., 2007). The abundance of nitrifiers can be useful for inferring and interpreting nitrification rates. In addition to qPCR, amplicon sequencing and quantitative metagenomics are also useful to determine the abundance of nitrifiers (Tolar et al., 2020; Lin et al., 2019; Satinsky et al., 2013), but these analyses are not included in the database.
Table 3qPCR primers commonly used to quantify nitrifier abundance in the ocean.
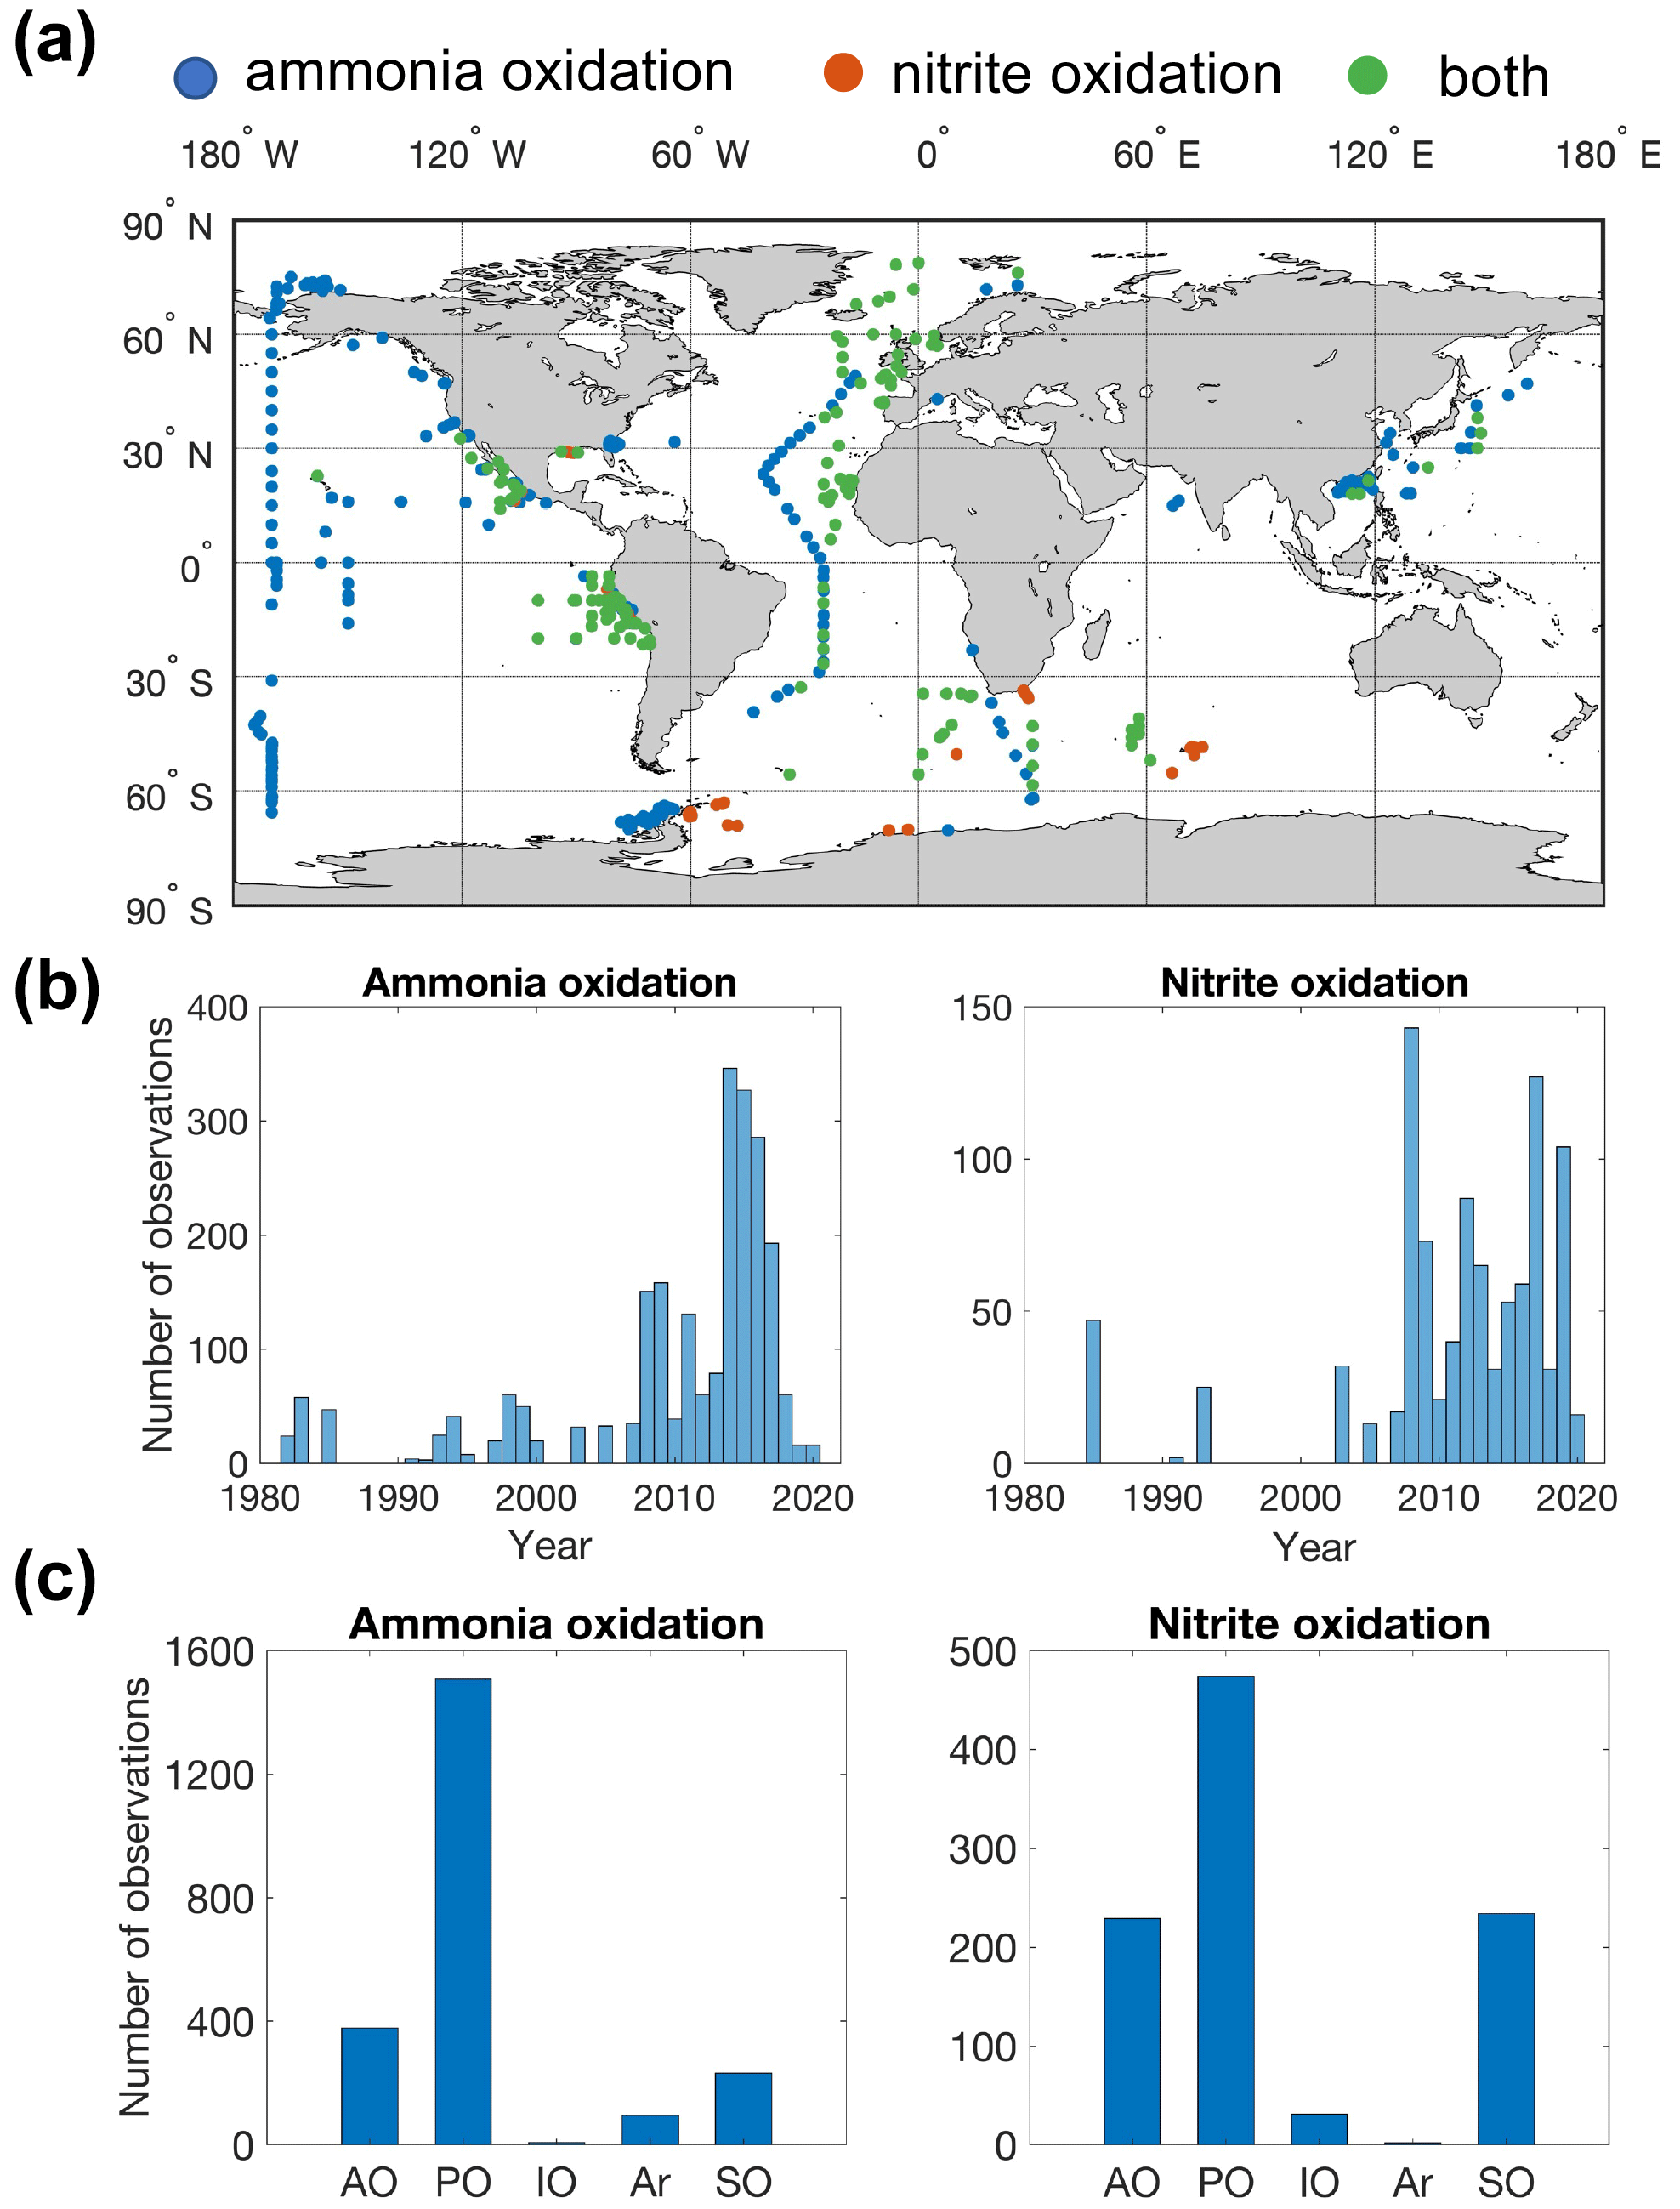
Figure 2Map showing the distribution of sampling locations for nitrification rate measurements (a), the number of observations each year (b) and the number of observations in different ocean basins (c) (AO: Atlantic Ocean; PO: Pacific Ocean; IO: Indian Ocean; Ar: Arctic Ocean; SO: Southern Ocean). Blue points indicate that only ammonia oxidation is measured. Red points indicate that only nitrite oxidation is measured. Green points indicate that both ammonia oxidation and nitrite oxidation are measured.
3.1 Summary of the database
In total, there are 2393 and 1006 measurements of ammonia oxidation and nitrite oxidation, respectively (Fig. 2). Ammonia oxidation and nitrite oxidation have been concurrently measured at 418 locations. The Pacific Ocean has the largest number of nitrification observations, followed by the Atlantic Ocean, Southern Ocean and Indian Ocean. Particularly, meridional transects across ocean basins and biomes have been conducted in the North Pacific and Atlantic (Shiozaki et al., 2016; Clark et al., 2008, 2022). Observations have recently expanded into oxygen-minimum zones (Beman et al., 2012, 2013; Frey et al., 2020, 2022; Peng et al., 2015, 2016; Santoro et al., 2021; Sun et al., 2017) and polar oceans (Cavagna et al., 2015; Shiozaki et al., 2019; Smith et al., 2022; Mdutyana et al., 2022a, b, 2020; Flynn et al., 2021). Nitrification rates are more frequently measured after 2010 (Fig. 2b).
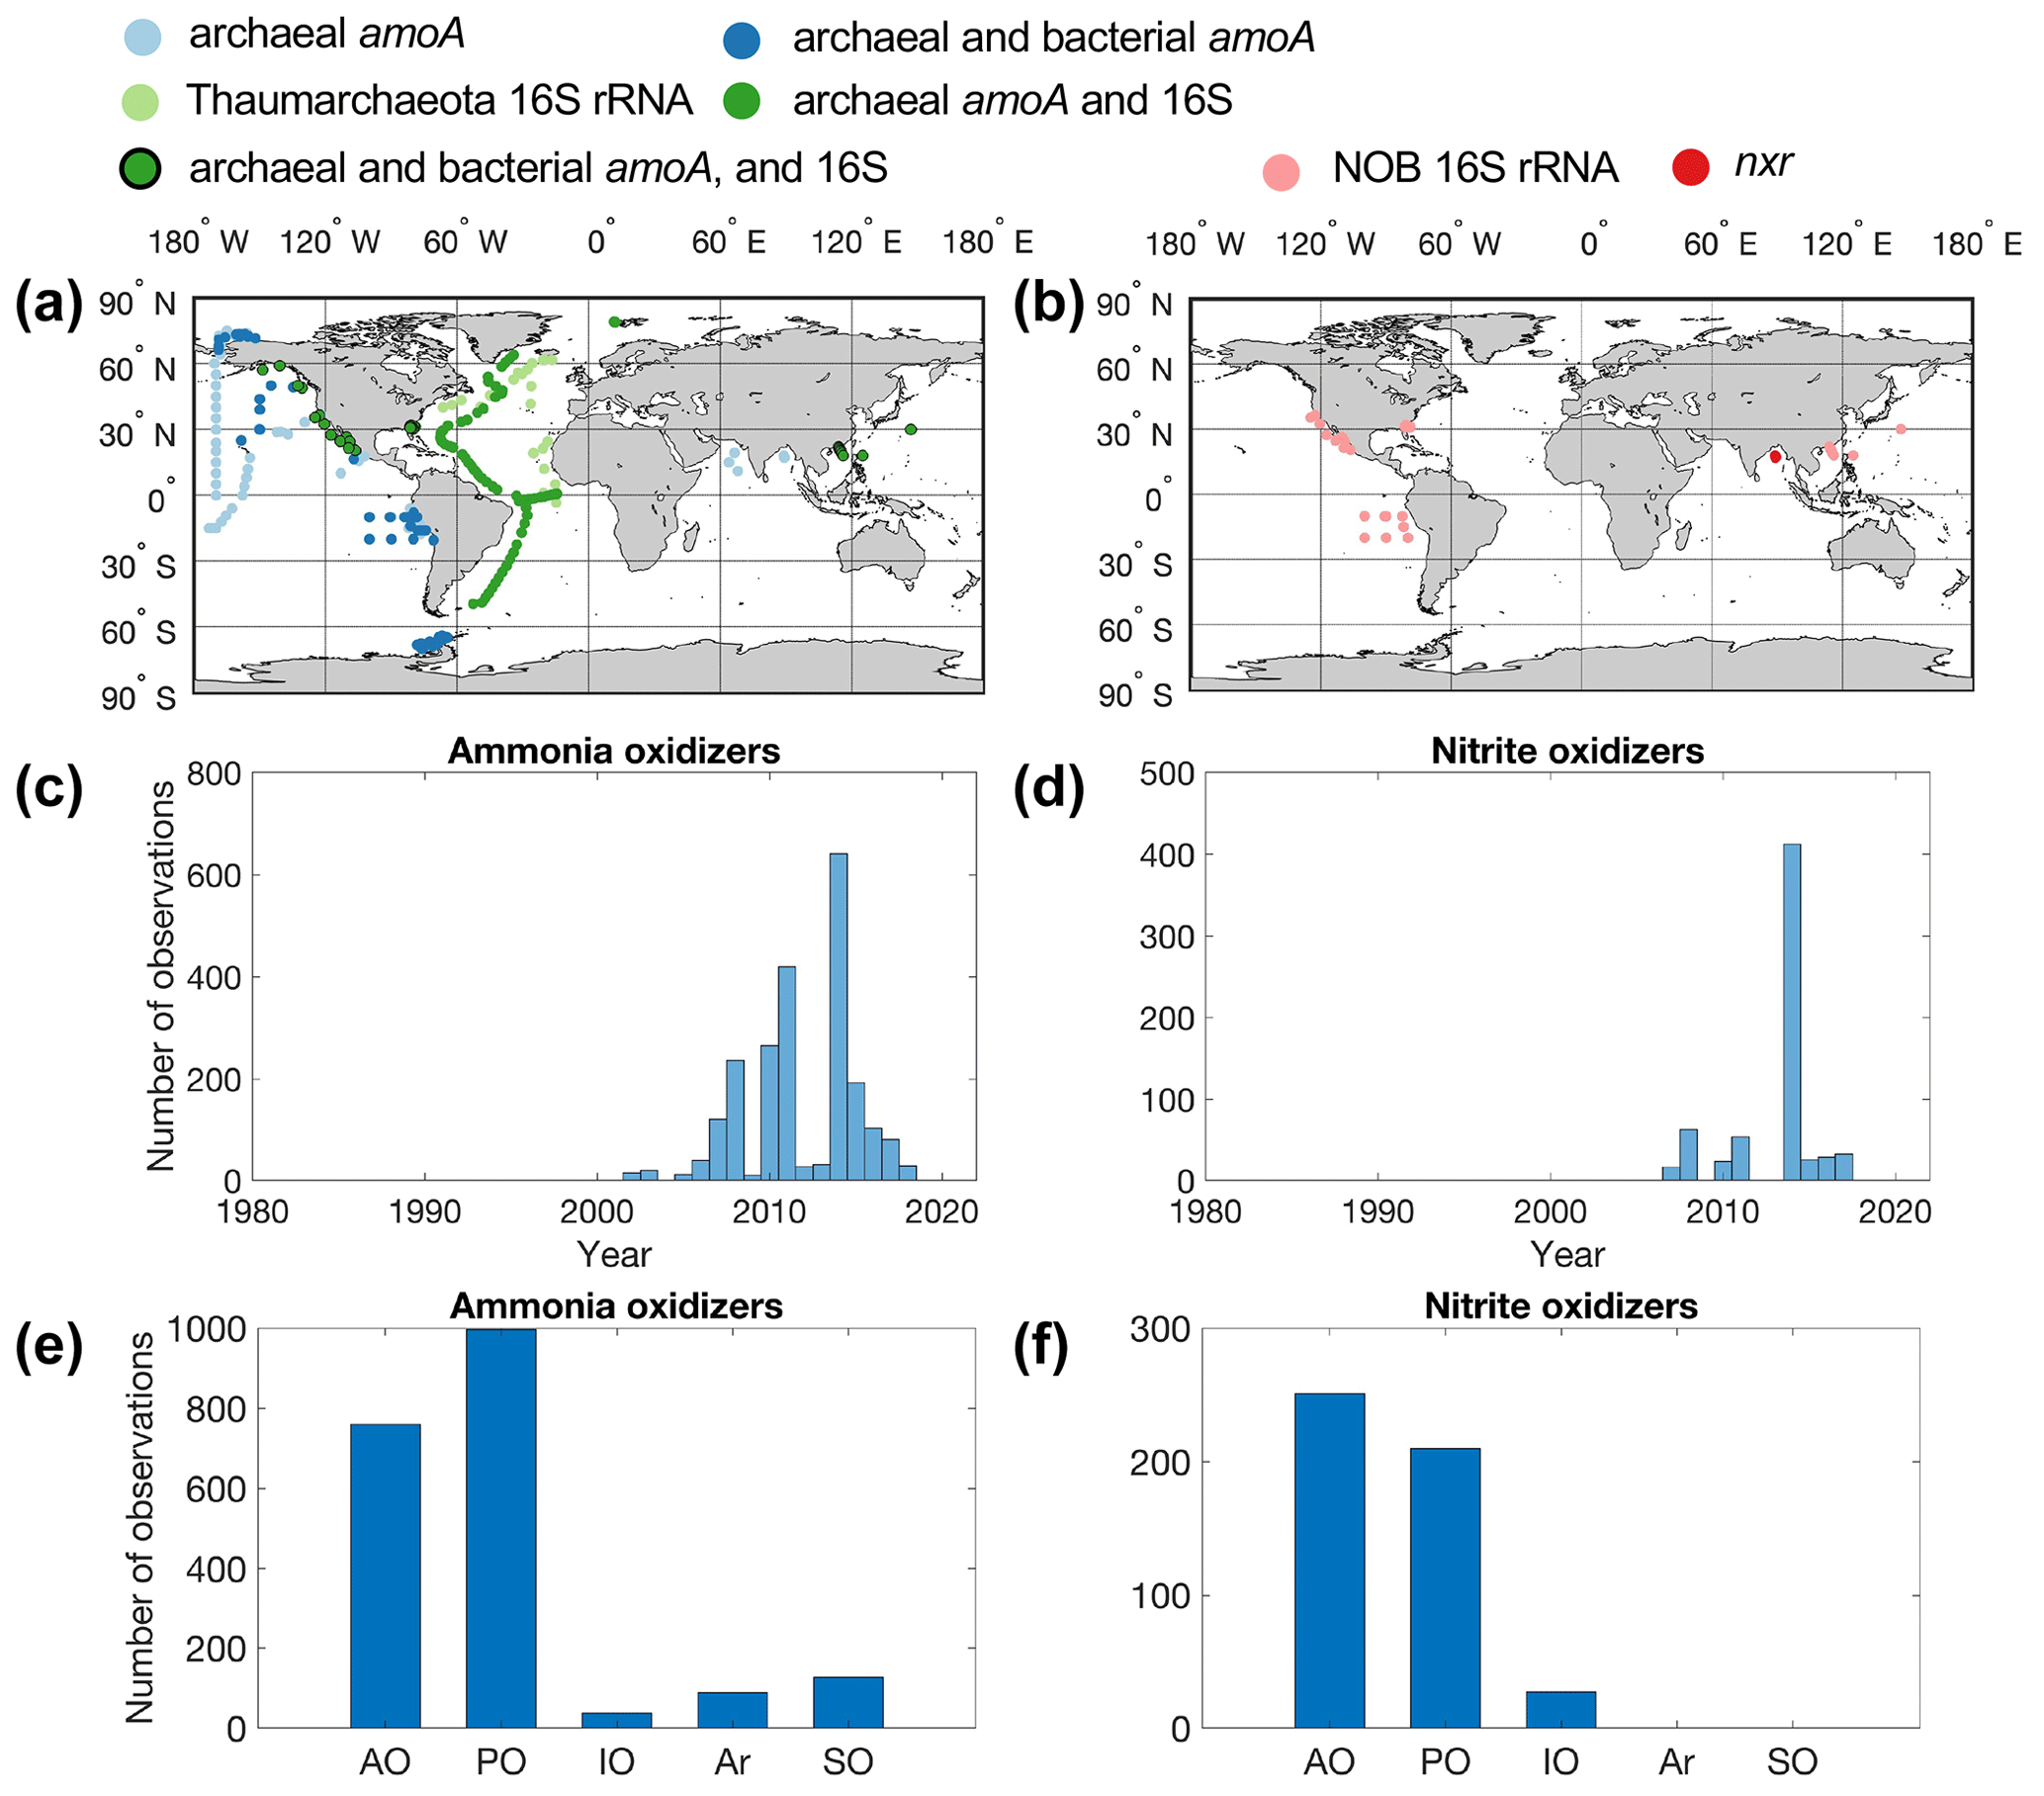
Figure 3Maps showing the distribution of sampling locations for ammonia oxidizers (a) and nitrite oxidizers (b), the number of observations each year (c–d), and the number of observations in different ocean basins (e–f) (AO: Atlantic Ocean; PO: Pacific Ocean; IO: Indian Ocean; Ar: Arctic Ocean; SO: Southern Ocean). (a) Light-blue points indicate that only archaeal amoA was quantified. Dark-blue points indicate that both archaeal and bacterial amoA genes were quantified. Light-green points indicate that the 16S rRNA gene of Thaumarchaeota was quantified. Dark-green points indicate that both archaeal amoA and the 16S rRNA gene of Thaumarchaeota were quantified. Dark-green points with black edges indicate that archaeal and bacterial amoA and the 16S rRNA gene of Thaumarchaeota were quantified. (b) Pink points indicate that 16S rRNA of nitrite oxidizers was quantified. Red points indicate that the nxr gene of nitrite oxidizers was quantified.
In total, there are 2242 and 631 measurements of ammonia oxidizer and nitrite oxidizer abundance, respectively (Fig. 3). Most of the nitrifier quantifications have been conducted in the tropical and subtropical oceans (Fig. 3). Data are sparse in the central Pacific, Indian Ocean and Southern Ocean (with the exception of the western Antarctic Peninsula). Both archaeal amoA and 16S rRNA genes of Thaumarchaeota were quantified on a transect across the Atlantic (Sintes et al., 2016). There are far fewer observations of nitrite oxidizers compared to those of ammonia oxidizers. Notably, there are only 27 observations of nxr genes. The quantification of nitrifier abundance starts to accumulate after 2002 (Fig. 3). Most of the observations of nitrite oxidizers originate from one study where samples were collected in 2014 (Liu et al., 2018). Nitrification rate and nitrifier abundance are sometimes determined at the same location, which allows us to assess the relationship between biogeochemical rate and the abundance of functional groups (e.g., Peng et al., 2015; Shiozaki et al., 2019; Santoro et al., 2021).
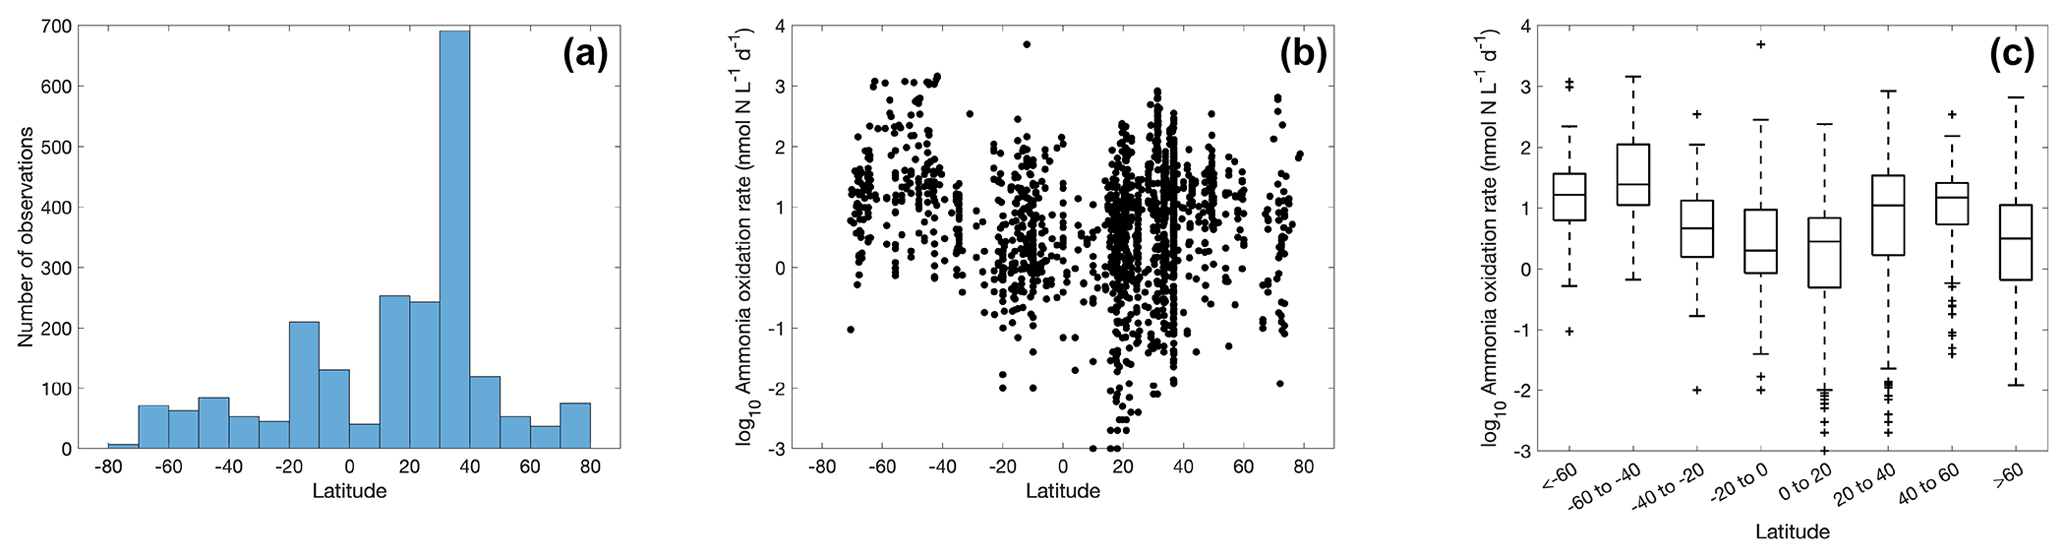
Figure 4The number of ammonia oxidation observations (a) and ammonia oxidation rates (b–c) within latitudinal bands. For the boxplot in this figure and in figures throughout the paper, the black line in each box is the median. The bottom and top of each box are the 25th and 75th percentiles of the observations, respectively. The error bars represent 1.5 times the interquartile range away from the bottom or top of the box, with black + signs showing outliers beyond that range.
3.2 Distribution of ammonia oxidation
A large number of observations exist for the tropical and temperate oceans (Fig. 4), particularly in the 30–40∘ N band where rates were measured in offshore waters of Georgia and California (Tolar et al., 2020; Liu et al., 2018). Ammonia oxidation rates vary from <0.01 to over 1000 nmol N L−1 d−1, with a median value of 7.7±9.8 nmol N L−1 d−1. There is no clear latitudinal trend in the ammonia oxidation rates. In contrast, Clark et al. (2022) found higher ammonia oxidation rates in the Southern Hemisphere along the north–south transect in the Atlantic Ocean. This latitudinal pattern is hypothesized to be explained by the difference in the supply of dissolved organic nitrogen (DON) by lateral transport into the gyre interior from the eastern boundary upwelling (Clark et al., 2022). The stimulation of ammonia oxidation rates by a lateral DON supply has also been observed in the western Pacific (Xu et al., 2018).
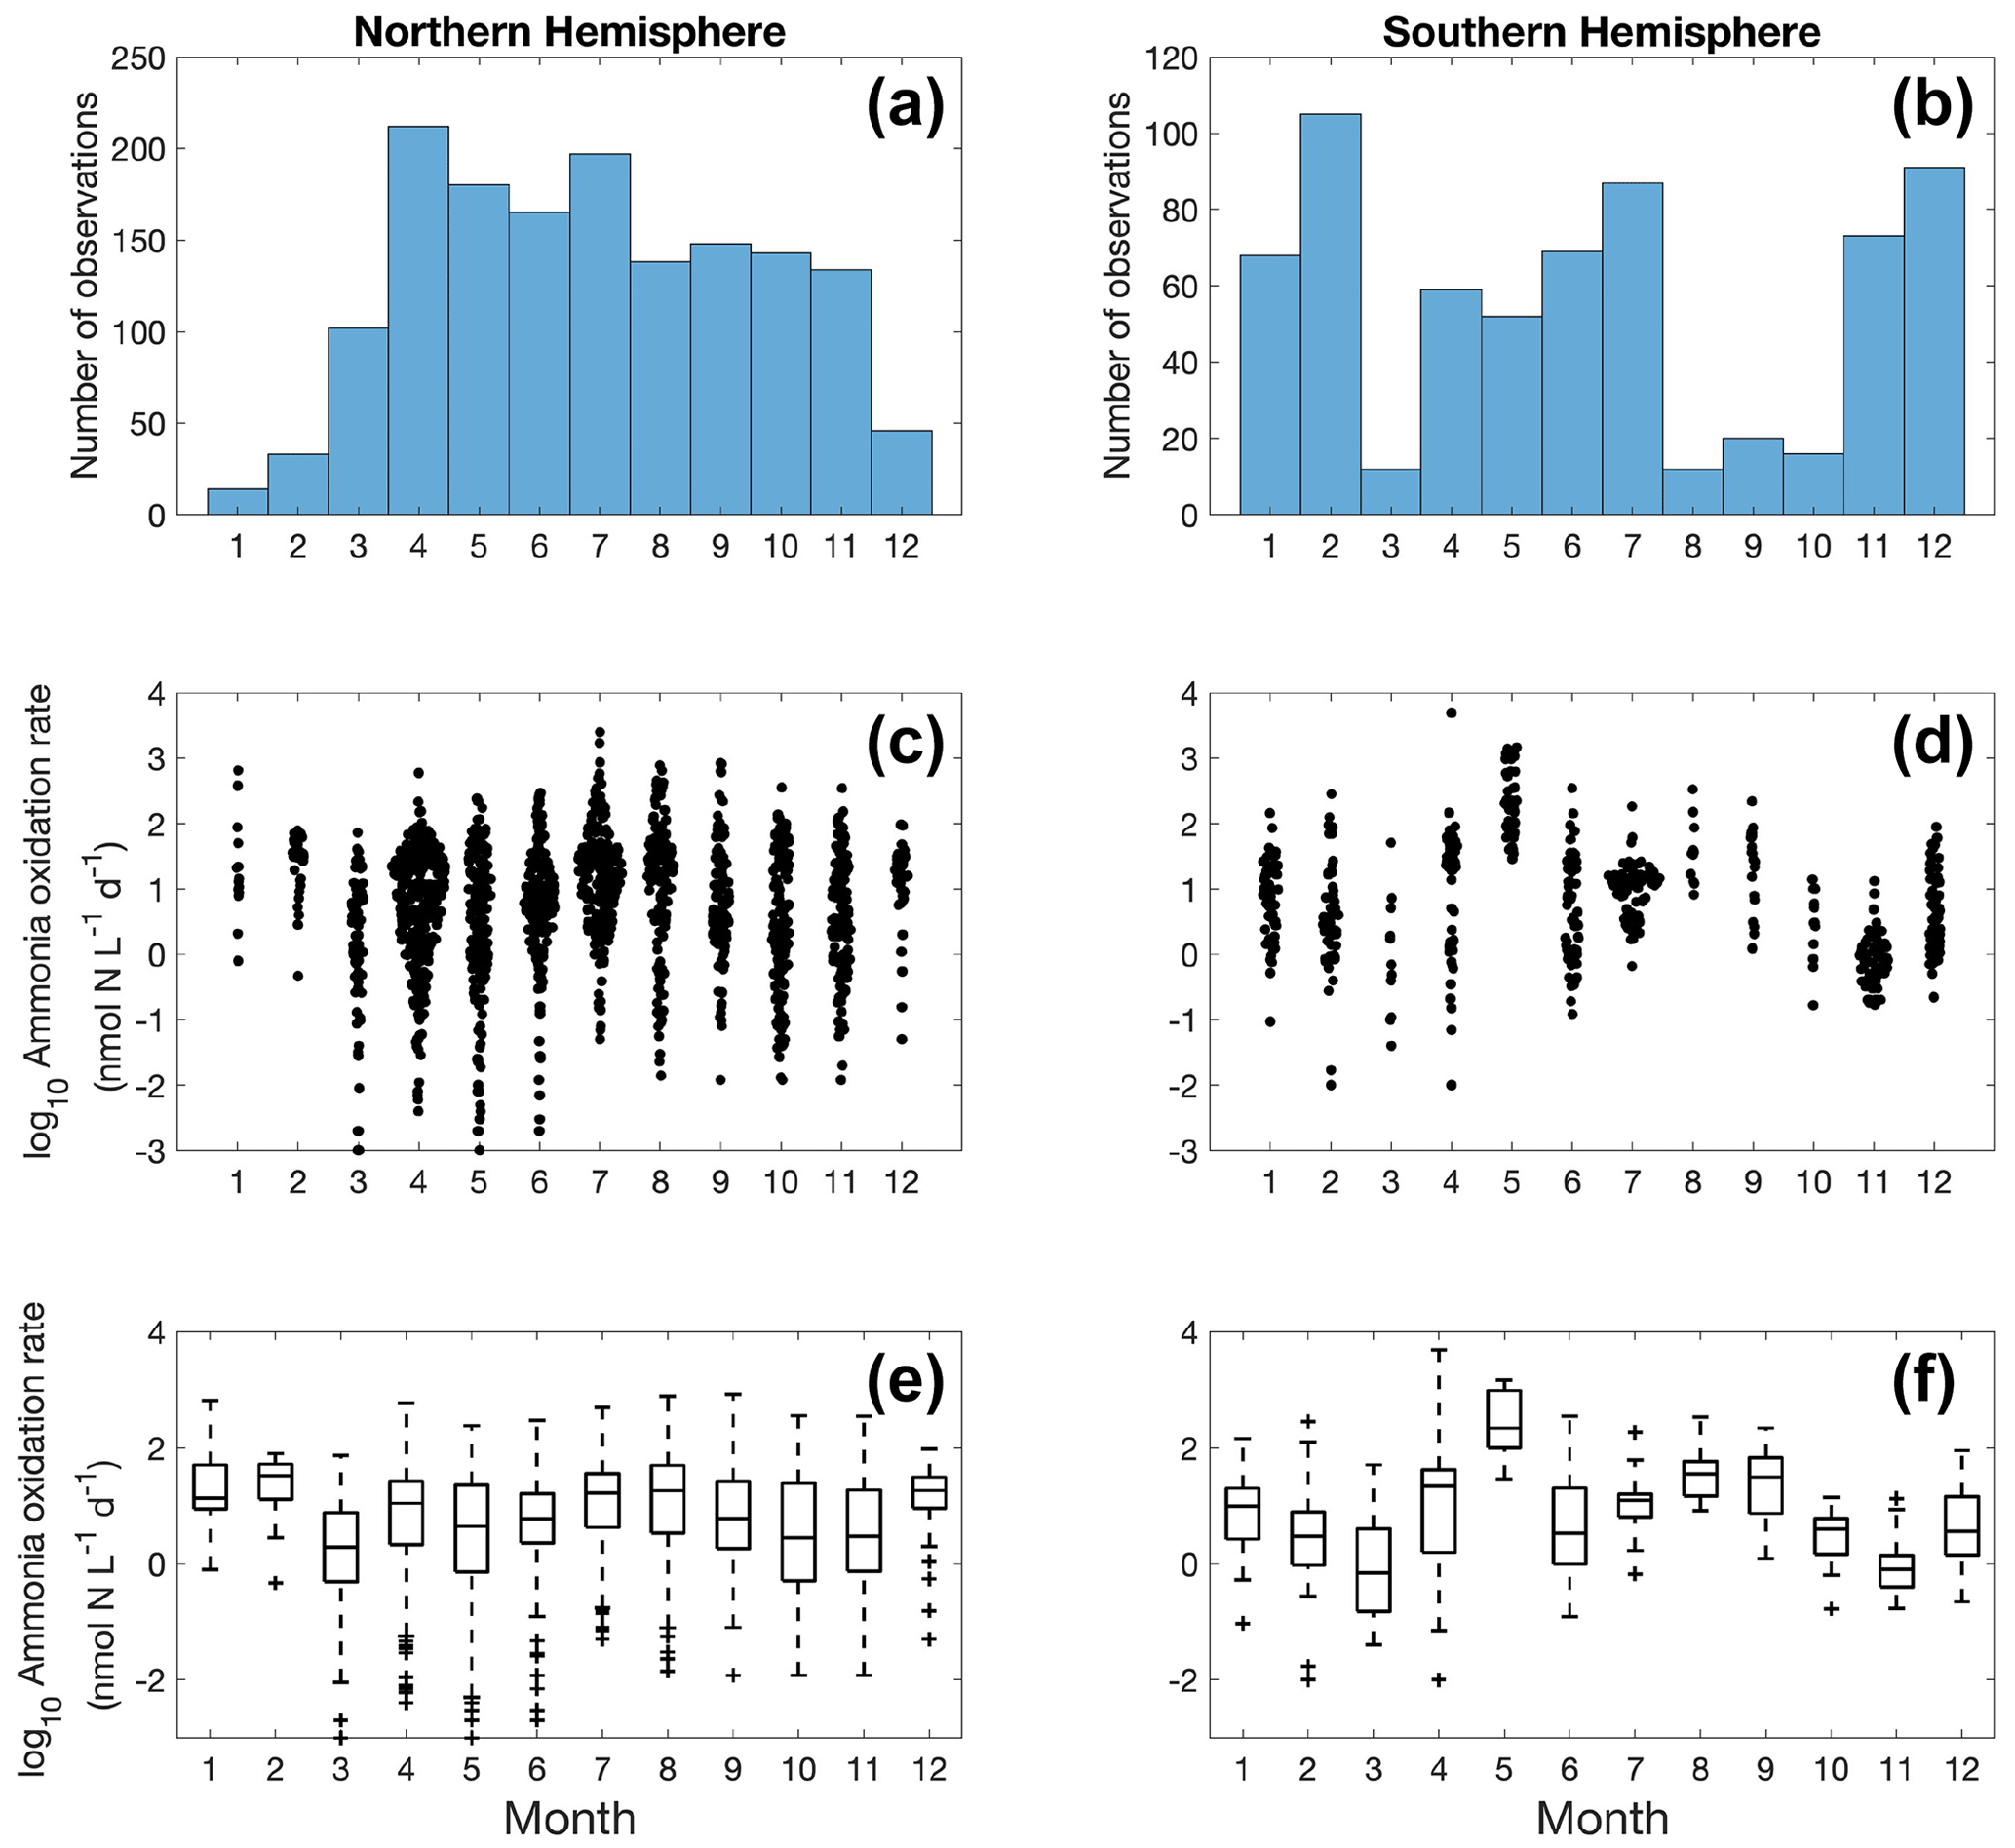
Figure 5Monthly variation (1–12: January to December) of ammonia oxidation observations (a–b) and ammonia oxidation rates (c–f) divided into observations taken in the Northern Hemisphere (a, c, e) and Southern Hemisphere (b, d, f). Jitter according to data density is added in subplots (c) and (d).
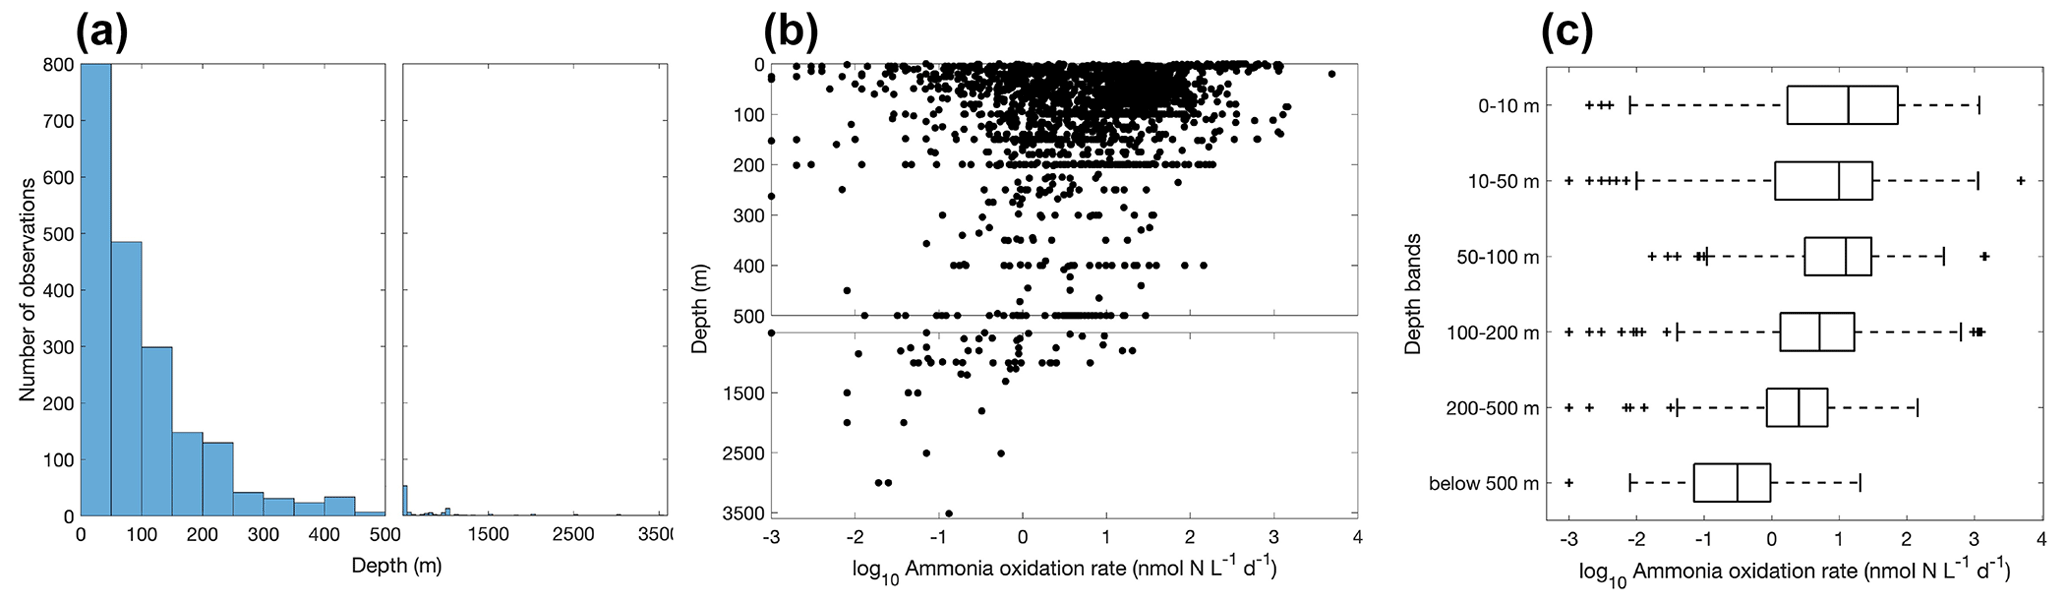
Figure 6Vertical variation of ammonia oxidation observations (a) and ammonia oxidation rates (b–c). Note the axis breaks at 500 m depth in subplots (a) and (b).
More ammonia oxidation measurements were conducted in summer in both hemispheres (Fig. 5), which is likely due to the more challenging weather conditions in winter for field expeditions. The Northern Hemisphere has more observations compared to the Southern Hemisphere. Although no clear seasonal pattern is apparent for ammonia oxidation rates at a global scale, seasonal variation in ammonia oxidation has been seen at time series stations near and offshore of California (Ward, 2005; Tolar et al., 2020; Laperriere et al., 2020). In addition, ammonia oxidation showed a substantial seasonal pattern in the polar ocean, with higher rates observed in the NH-enriched dark winter season (Baer et al., 2017; Mdutyana et al., 2020, 2022b).
Most of the ammonia oxidation rate measurements were made at depths shallower than 500 m, accounting for ∼96 % of the total measurements (Fig. 6). Ammonia oxidation rates often reach a maximum near the base of the euphotic zone or in the 50–100 m layer before decreasing with depth below the euphotic zone. Although nitrification is thought to be inhibited by light, high ammonia oxidation rates >100 nmol N L−1 d−1 have been observed within the euphotic zone (Raes et al., 2020; Bianchi et al., 1997), suggesting complex regulation of nitrification in the surface ocean. This complicates the interpretation of the source of NO in the euphotic zone and, further, the NO-supported new production (Ward et al., 1989a; Diaz and Raimbault, 2000; Yool et al., 2007; Grundle et al., 2013; Mdutyana et al., 2020).
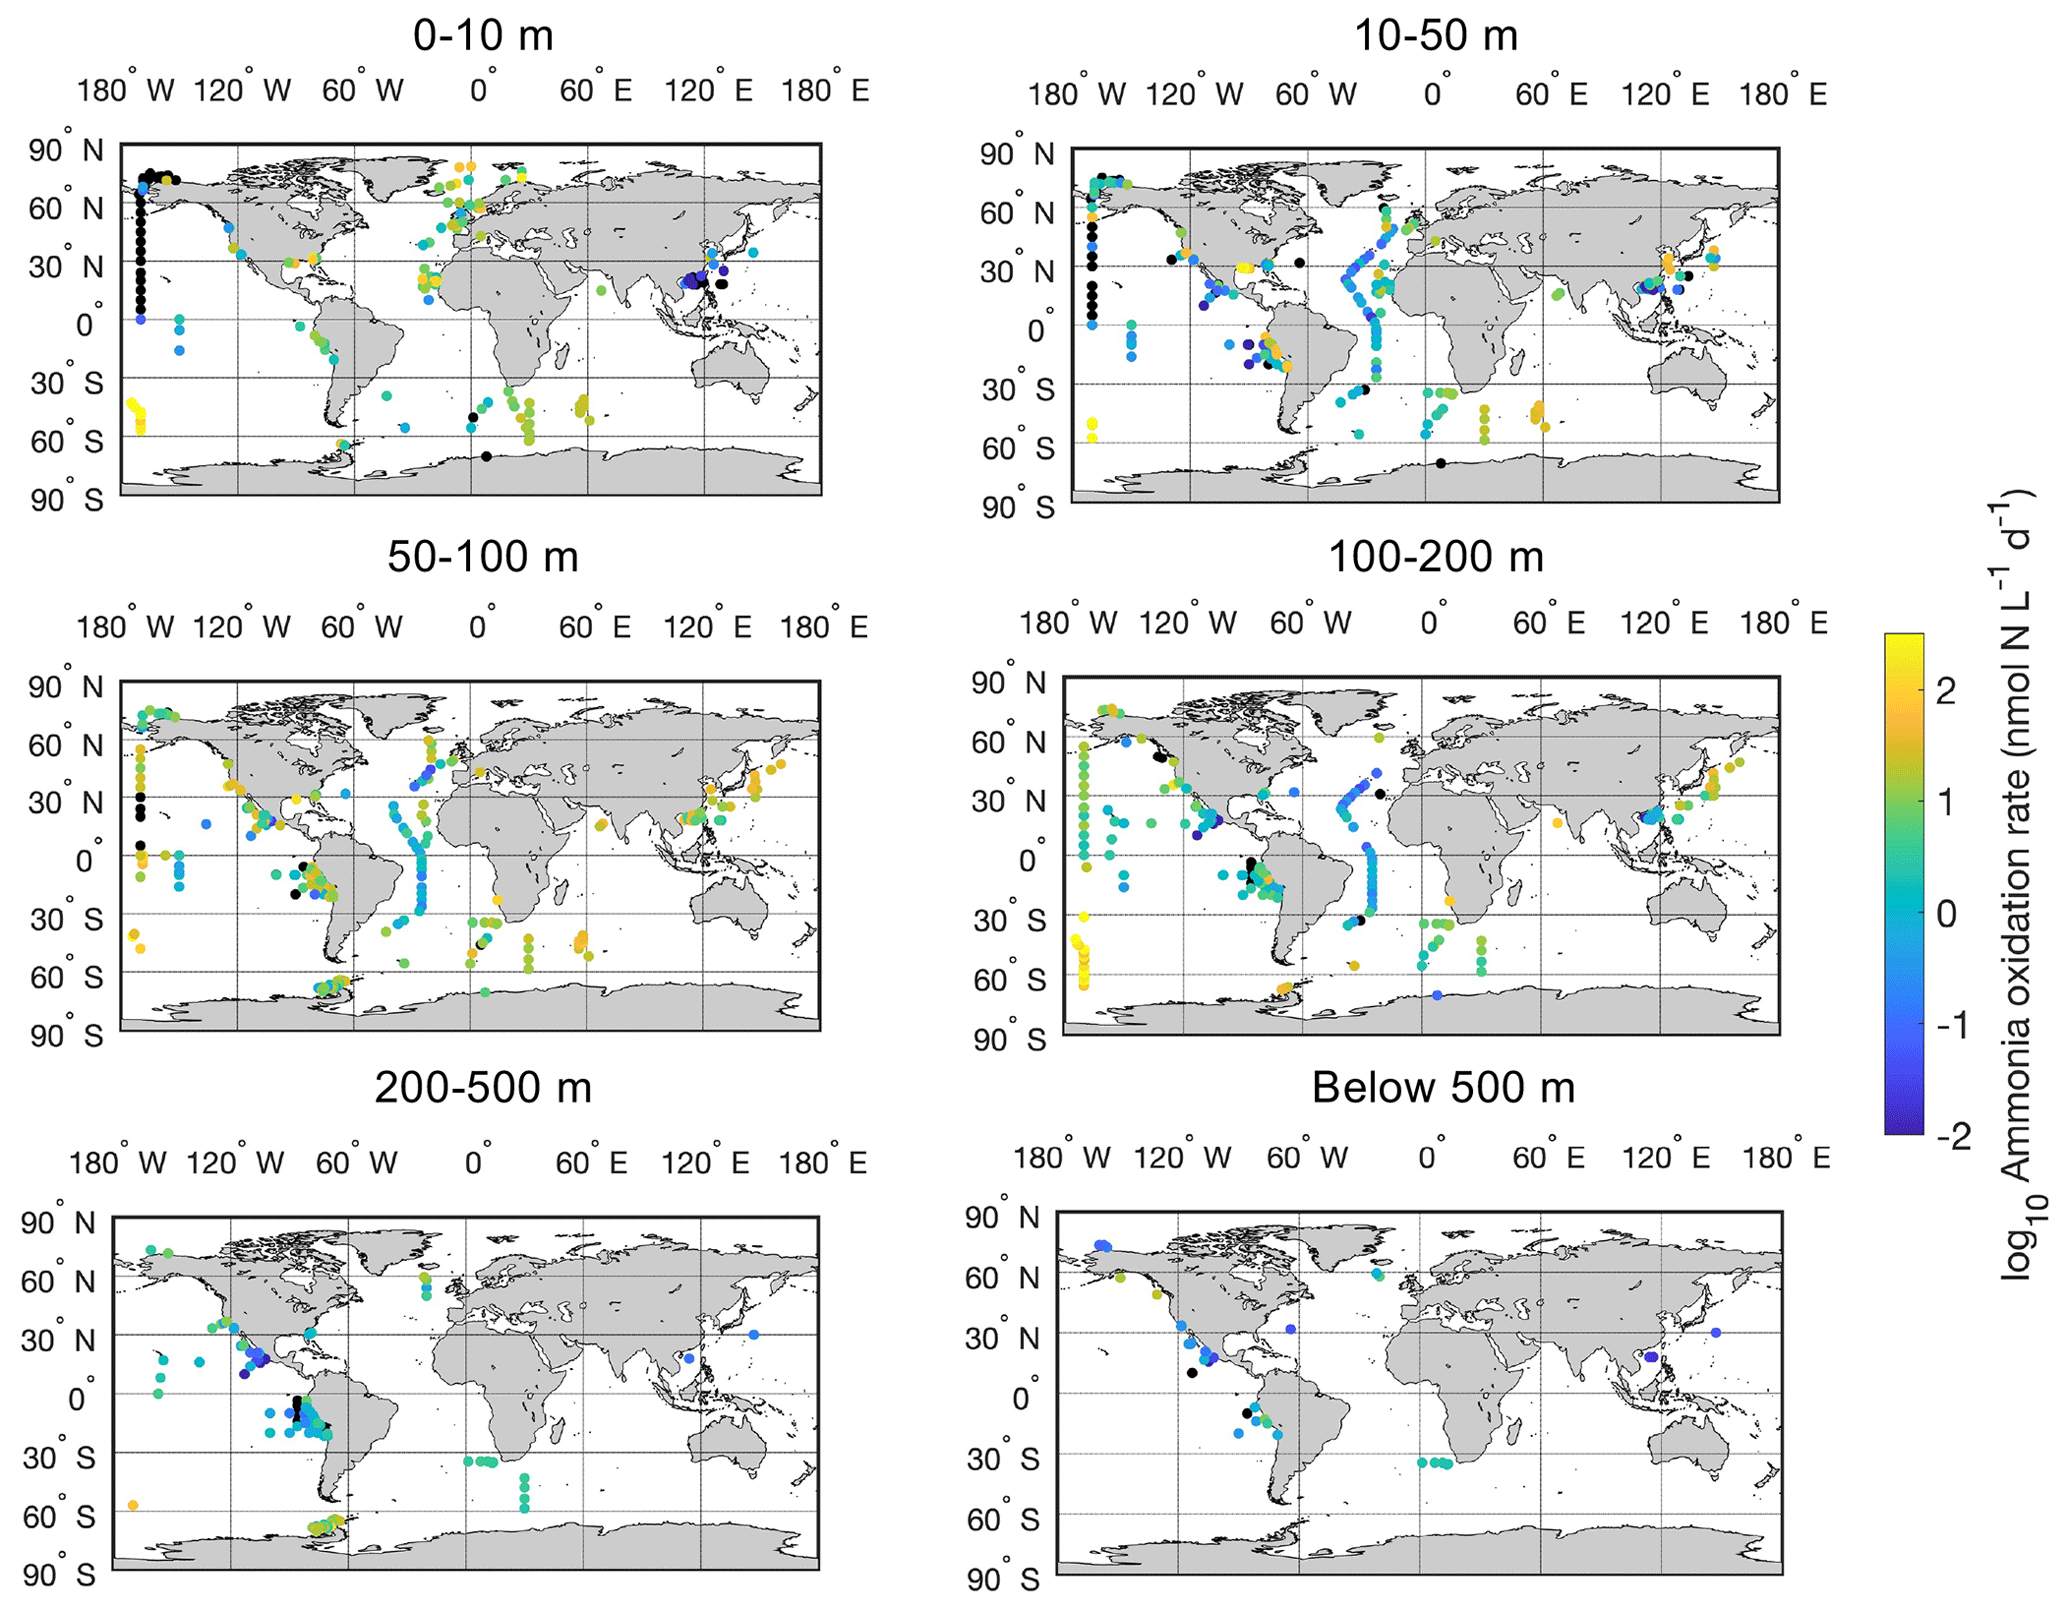
Figure 7Spatial distribution of ammonia oxidation rates in six depth intervals in the global ocean. Locations with rates below the detection limit are shown in the black circles.
There is a large spatial and vertical variation in ammonia oxidation rates (Fig. 7). Some hotspots with rates >100 nmol N L−1 d−1 include the subpolar North Atlantic (Clark et al., unpublished), the Southern Ocean (Mdutyana et al., 2020), and coastal waters off California and Georgia (Tolar et al., 2020; Liu et al., 2018). Particularly, there are extremely high ammonia oxidation rates >1000 nmol N L−1 d−1 observed in the surface Pacific Southern Ocean (Raes et al., 2020), deserving further studies to confirm this pattern. In contrast, some low rates <0.01 nmol N L−1 d−1 or rates below the detection limit are found in the surface sunlit North Pacific, which is likely caused by the light limitation of nitrifiers and nitrifier competition with phytoplankton for NH in well-lit areas (Smith et al., 2014). For example, peak ammonia oxidation rates are often found in regions or depths where NO is present or where light levels are low such that the competition of nitrifiers with phytoplankton for NH diminishes (Fig. 8; Wan et al., 2021). Additionally, low rates are found in the oxygen-depleted waters of the eastern tropical Pacific, where ammonia oxidation is likely limited by oxygen availability (Peng et al., 2016).
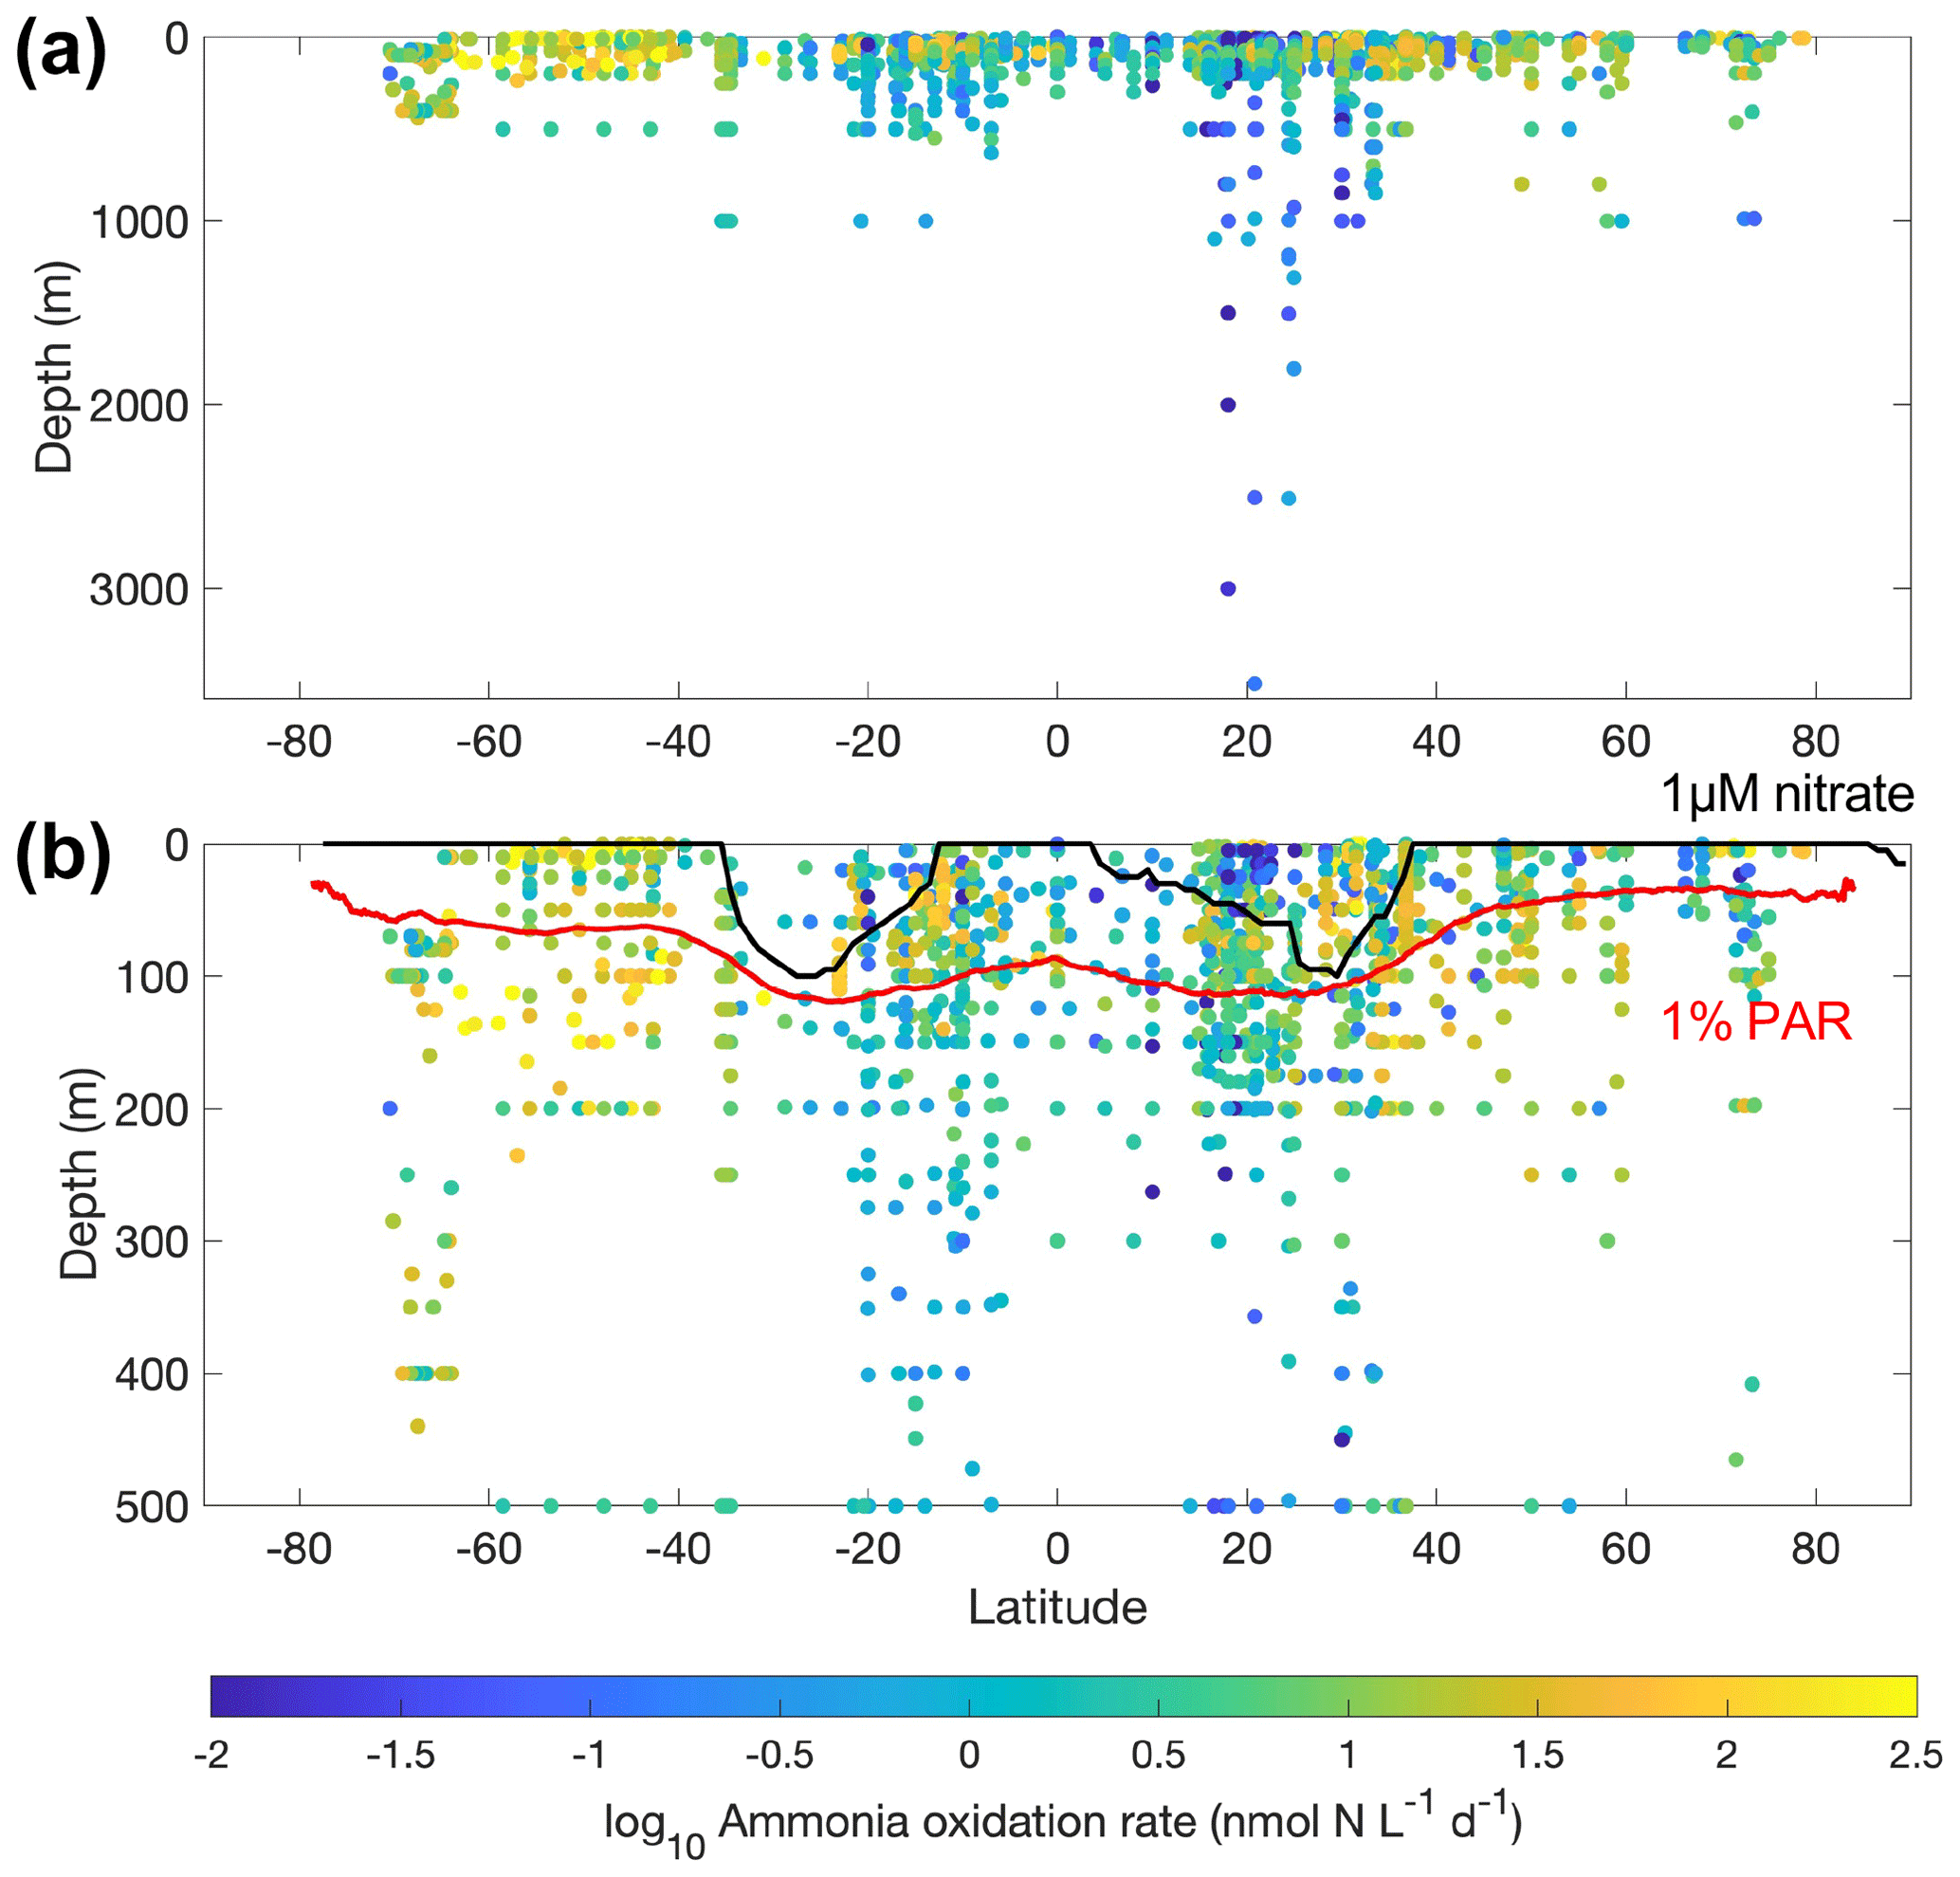
Figure 8Latitudinal and vertical distribution of ammonia oxidation rates in the whole water column (a) and from the top 500 m (b). The climatological depths of the euphotic zone (1 % PAR) obtained from MODIS satellite observations and 1 µM nitrate obtained from the World Ocean Atlas 2018 (García et al., 2019) are shown by the red line and black lines, respectively.
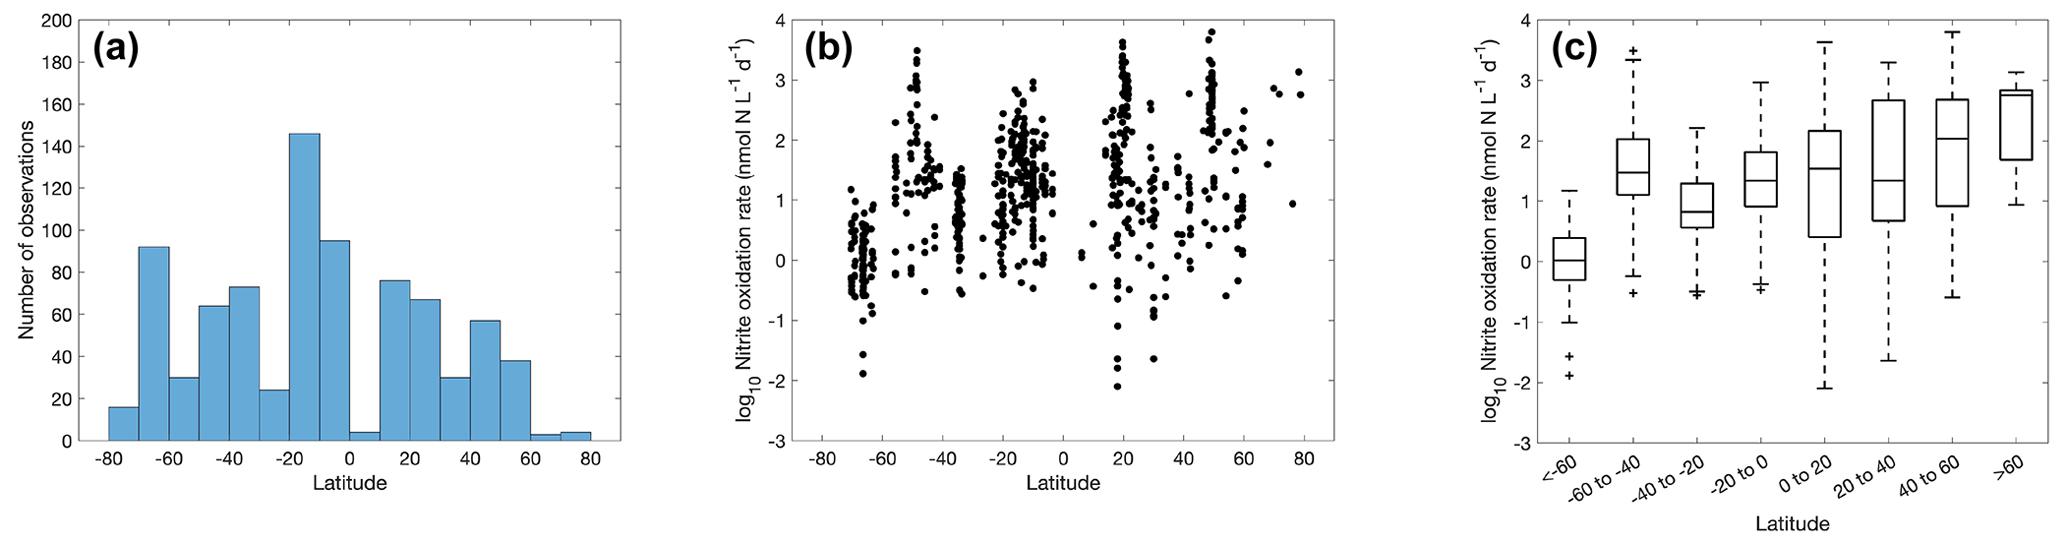
Figure 9Number of nitrite oxidation observations (a) and nitrite oxidation rates (b–c) within latitudinal bands.
3.3 Distribution of nitrite oxidation
Similarly to ammonia oxidation, the majority of the nitrite oxidation observations were conducted in the tropical and subtropical oceans (Fig. 9), particularly in the eastern tropical Pacific oxygen-minimum zones (Ward et al., 1989b; Peng et al., 2015; Kalvelage et al., 2013; Santoro et al., 2021). Recent observations extended into the Southern Ocean (Cavagna et al., 2015; Mdutyana et al., 2020, 2022a; Flynn et al., 2021). The rates vary from 0.01 to >1000 nmol N L−1 d−1 with a median value at 15.9±10.7 nmol N L−1 d−1. Nitrite oxidation rates seem to increase from the Southern Hemisphere to the Northern Hemisphere. The lowest median rates were found in the Southern Ocean south of 60∘ S, which is hypothesized to be regulated by low iron availability (Mdutyana et al., 2022a). Overall, more measurements of nitrite oxidation over a large spatial scale are desired to resolve the latitudinal distribution of nitrite oxidation rates.
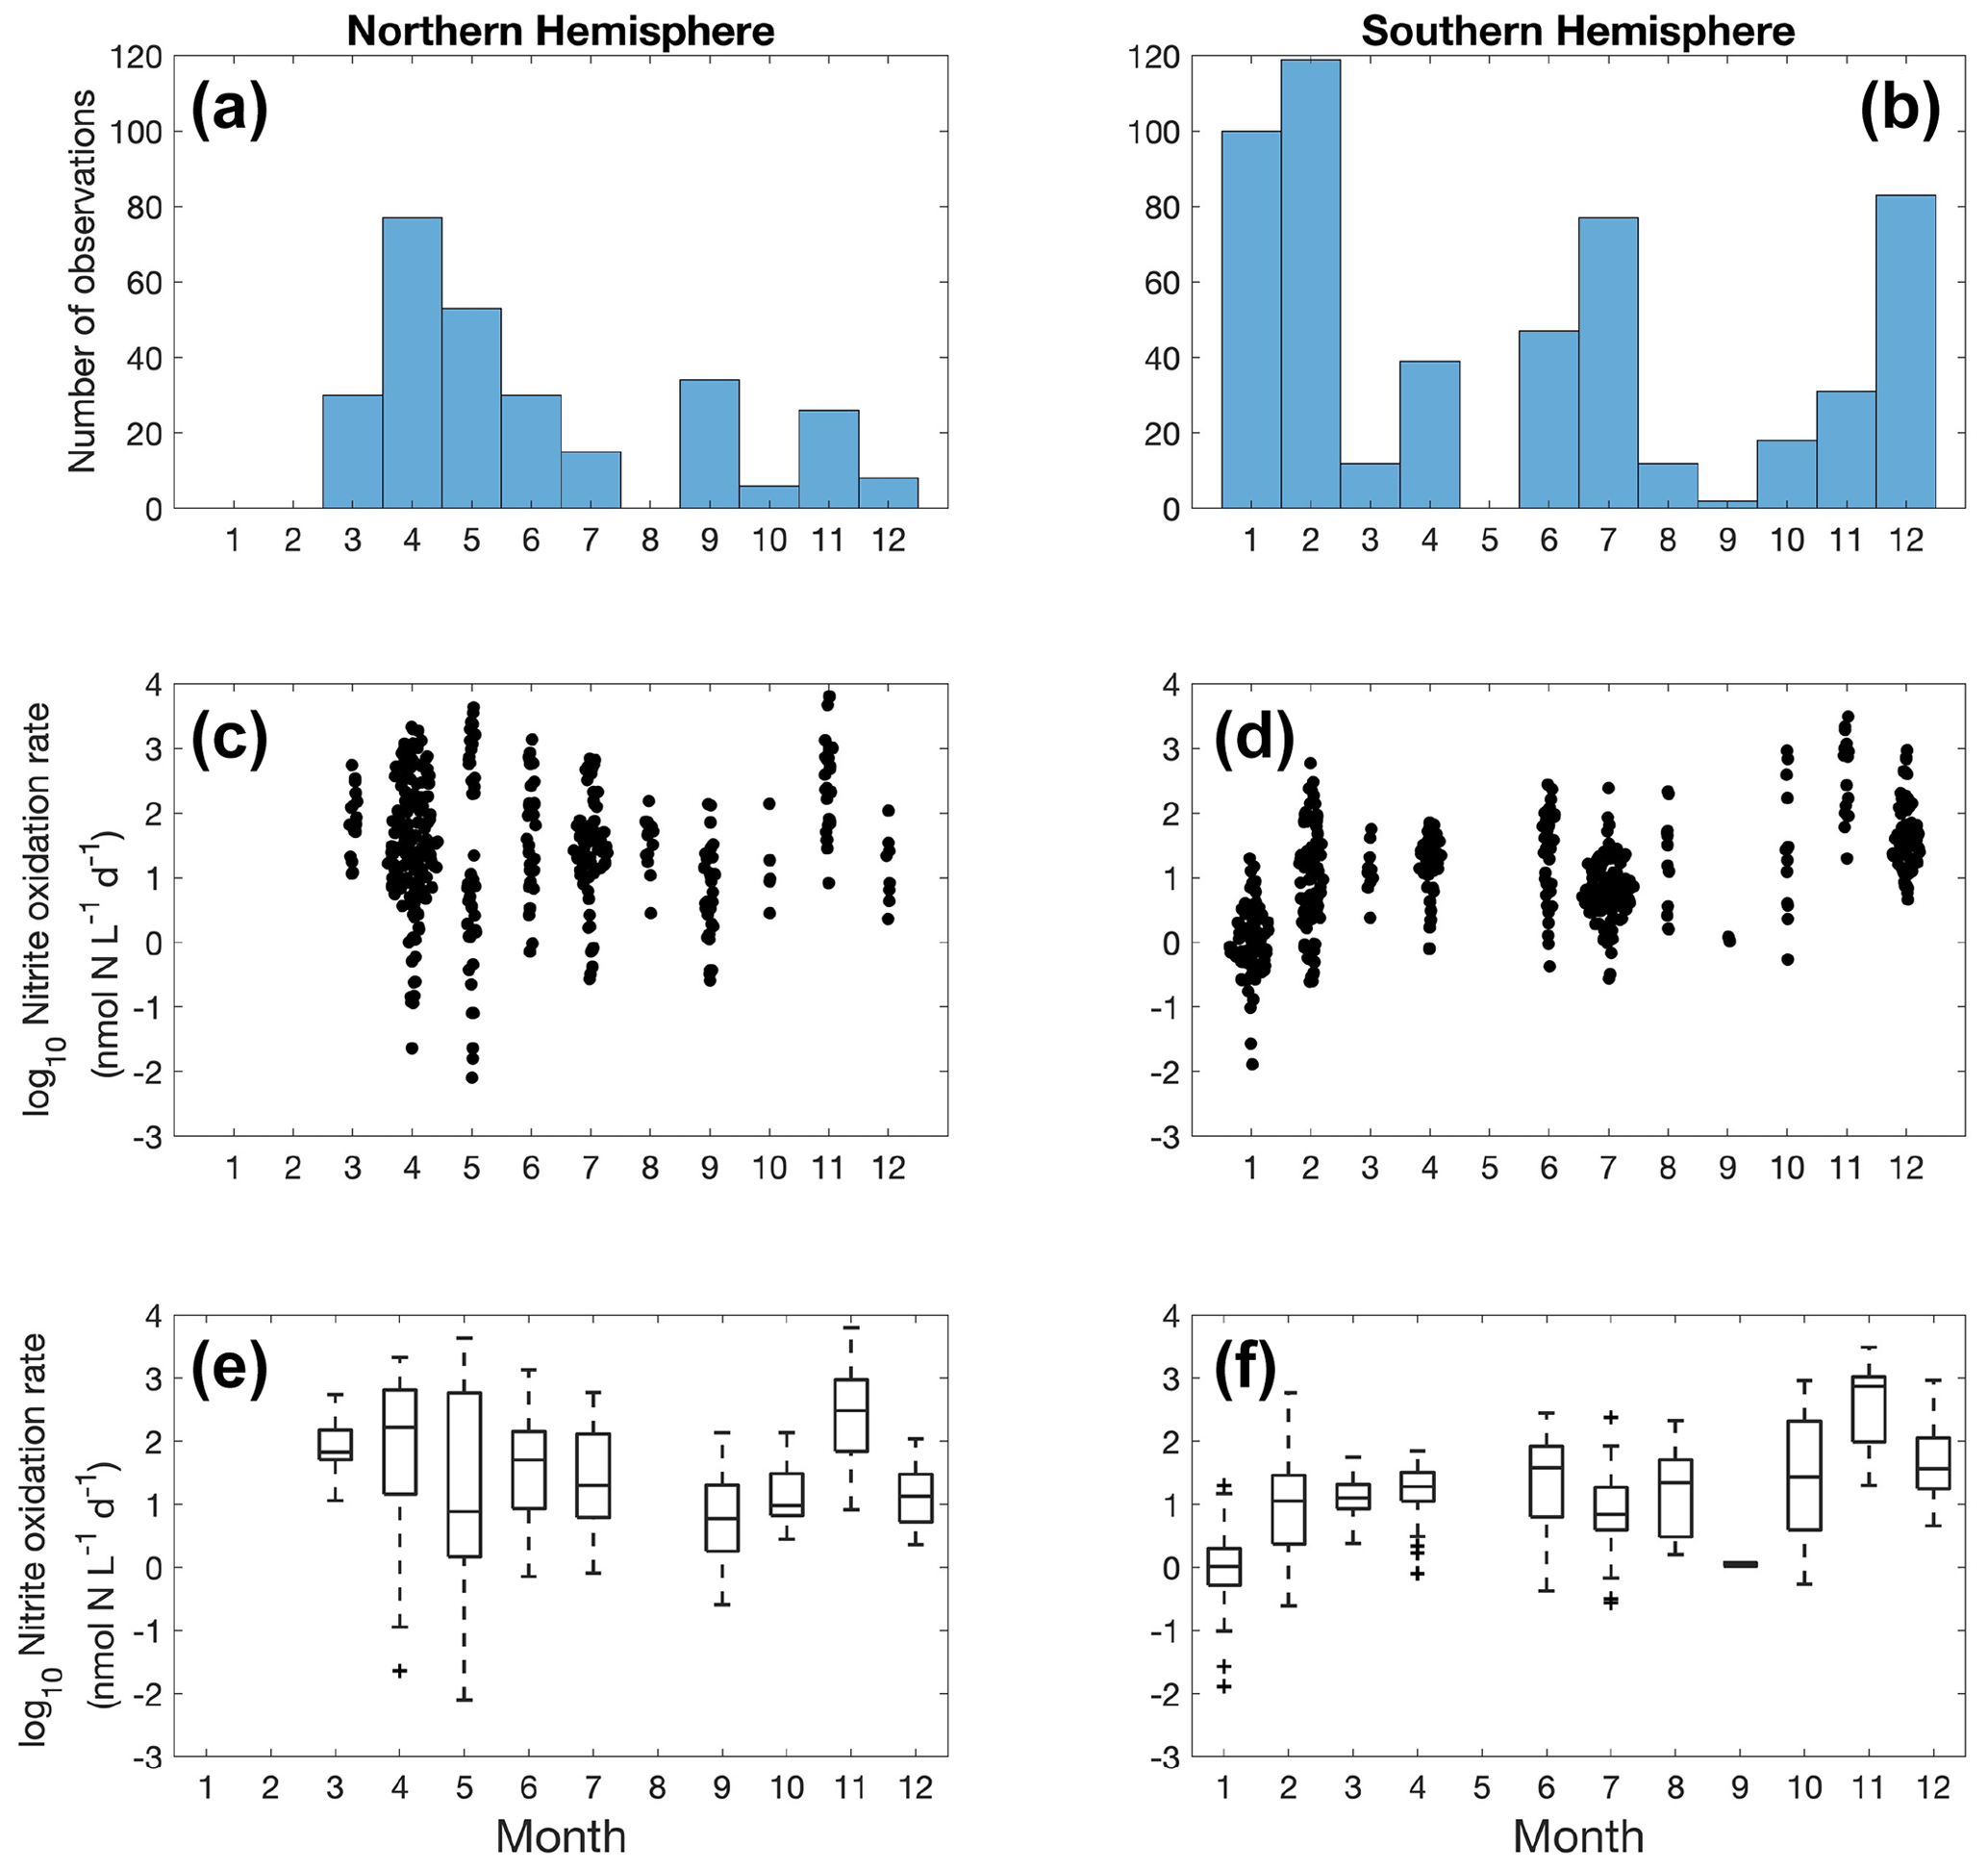
Figure 10Monthly variation (1–12: January to December) of nitrite oxidation observations (a–b) and nitrite oxidation rates (c–f) divided into observations taken in the Northern Hemisphere (a, c, e) and Southern Hemisphere (b, d, f). Jitter according to data density is added in subplot c and d.
Nitrite oxidation measurements are limited in winter in the Northern Hemisphere (Fig. 10). No clear seasonal pattern is found for nitrite oxidation rates at a global scale, except for some of the lowest rates detected in January in the Southern Ocean (austral summer). In addition to iron limitation, light inhibition and competition with phytoplankton for nitrite during the growing season may be important factors driving these low rates. Unlike ammonia oxidation, there is no time series study of nitrite oxidation to show its seasonal variations.
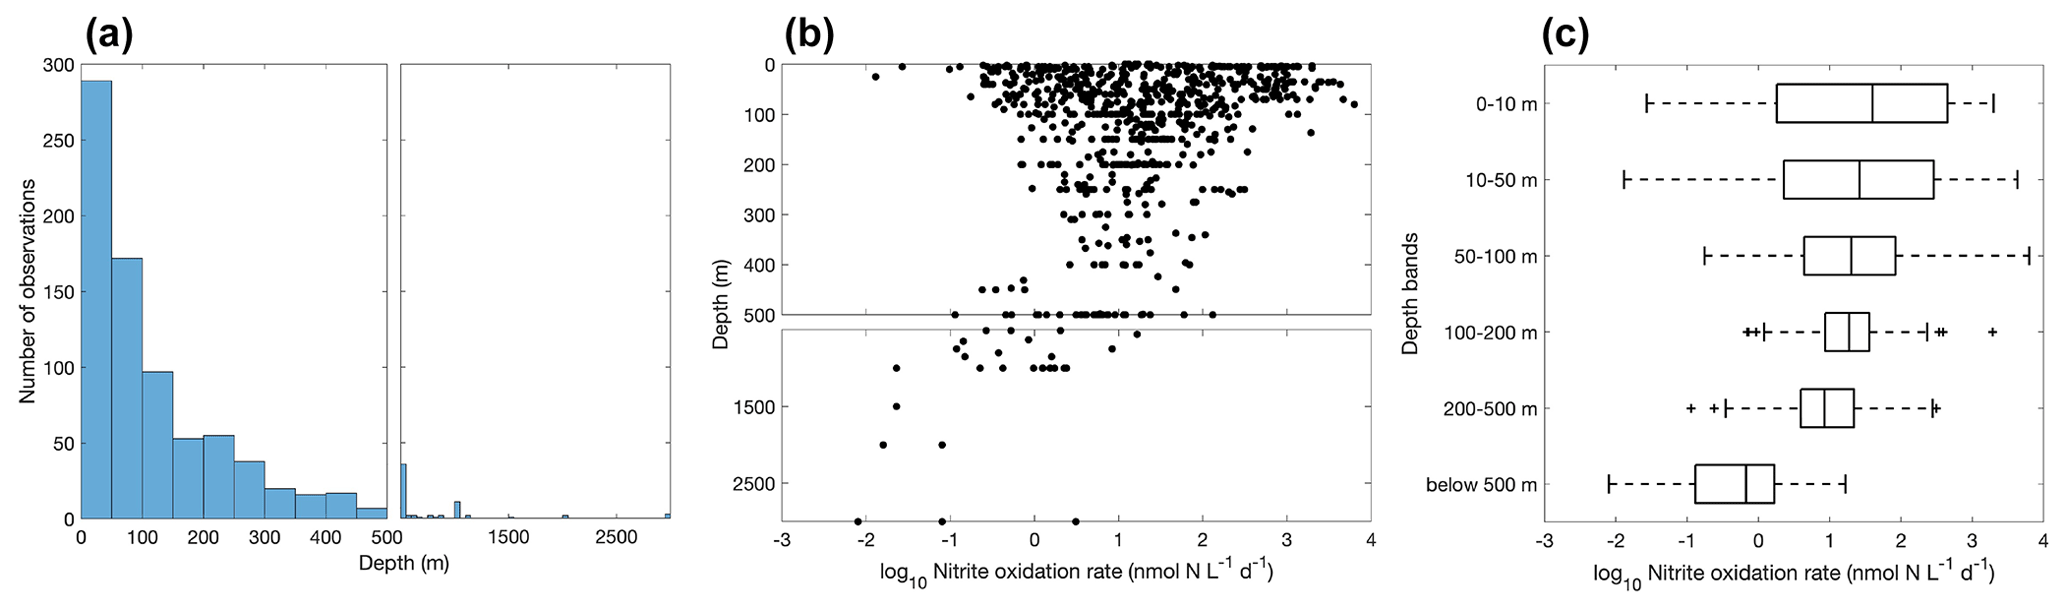
Figure 11Vertical variation of nitrite oxidation observations (a) and nitrite oxidation rates (b–c). Note the axis breaks at 500 m depth in subplots (a) and (b).
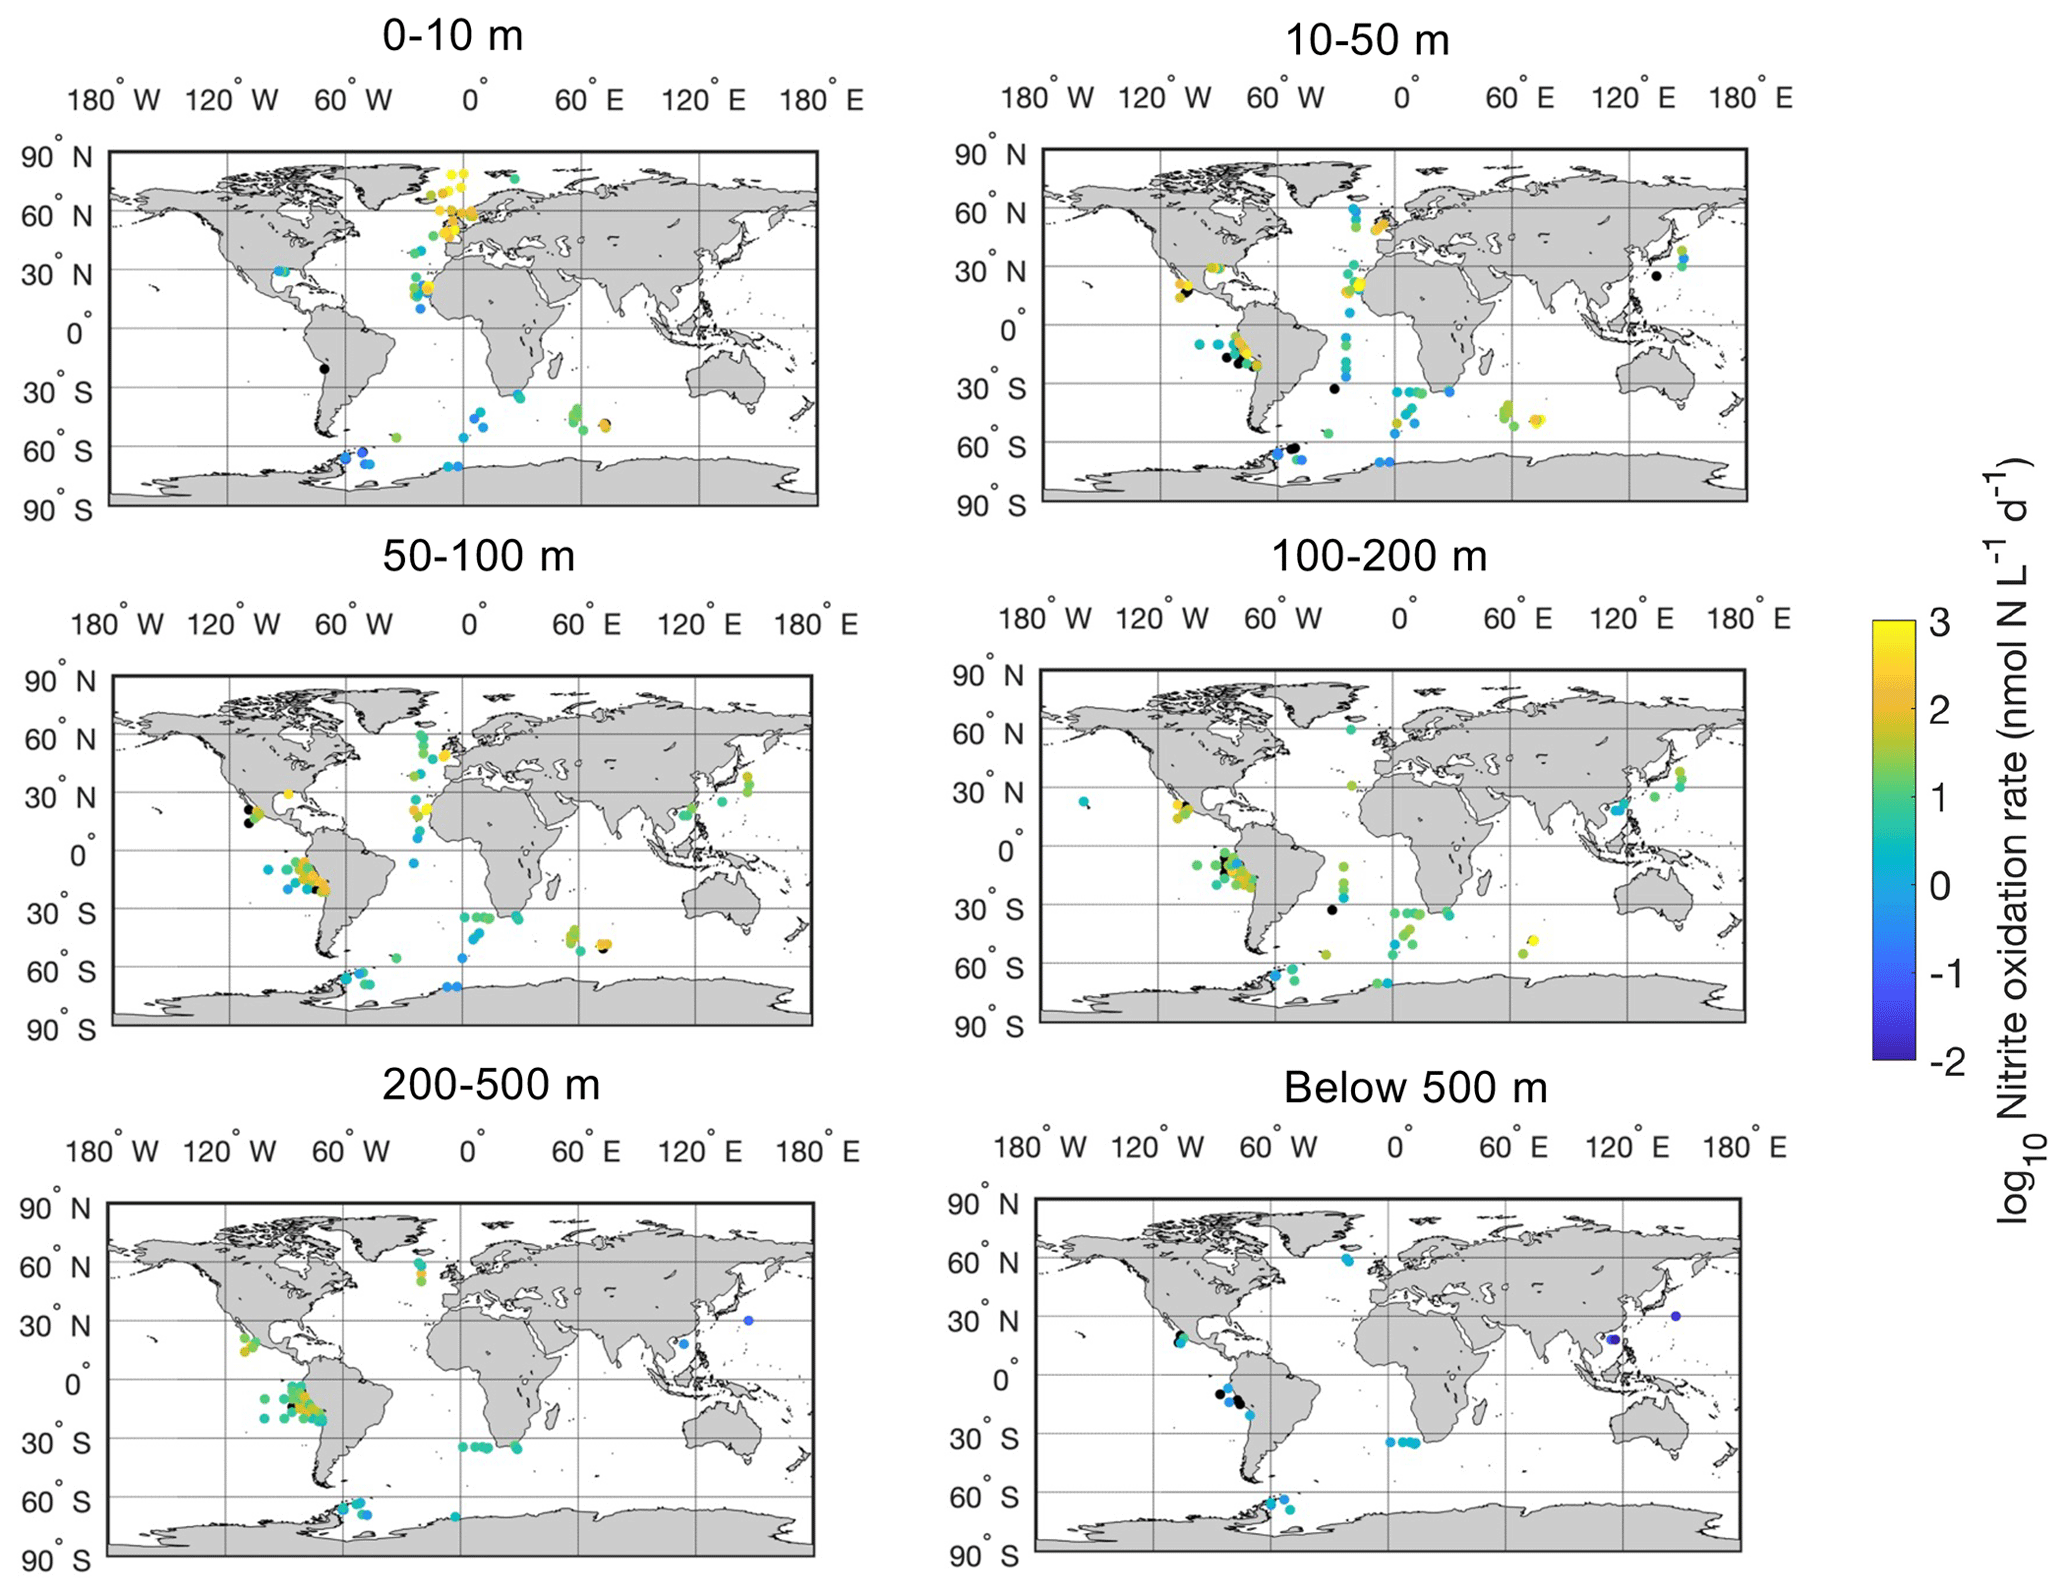
Figure 12Spatial distribution of nitrite oxidation rates in six depth intervals in the global ocean. Locations with rates below the detection limit are shown in the black circles.
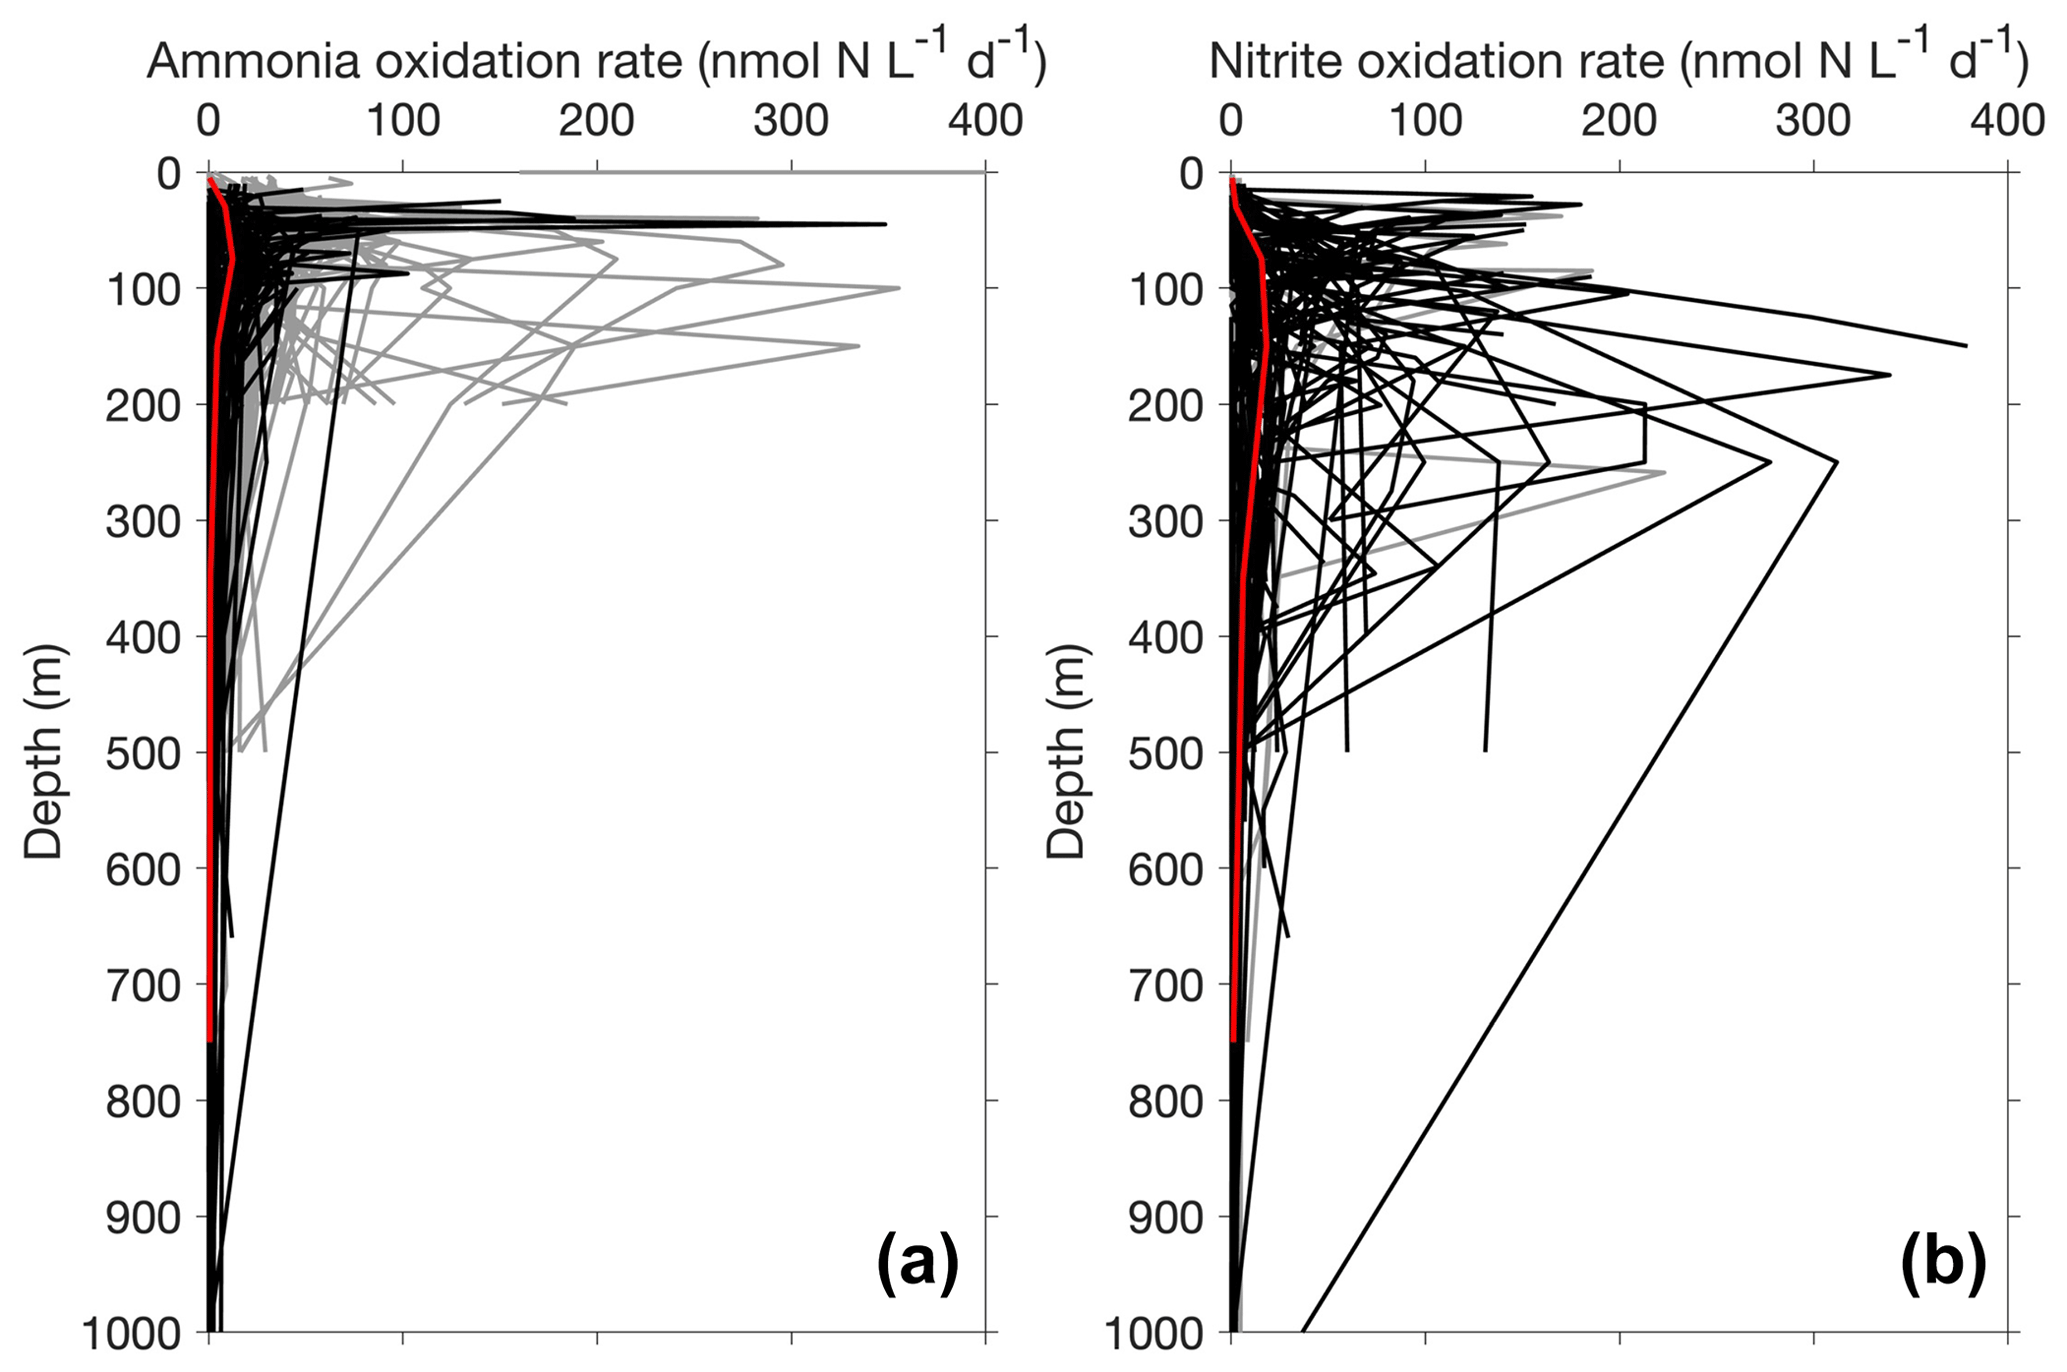
Figure 13Depth profiles of ammonia oxidation (a) and nitrite oxidation (b) in the top 1000 m. Only depth profiles with five or more measurements or depths are included in this figure. The gray lines and black lines show non-paired and paired profiles (i.e., ammonia oxidation and nitrite oxidation were measured concurrently), respectively. The median profiles of ammonia oxidation and nitrite oxidation are shown in red lines, highlighting the maximum of nitrite oxidation deeper than the maximum of ammonia oxidation.
Most of the nitrite oxidation rates were also measured at depths shallower than 500 m, accounting for ∼94 % of the total measurements (Fig. 11). There is a large spatial variation in the nitrite oxidation observations and rates (Fig. 12). Observations are lacking in the central Pacific Ocean and Indian Ocean outside of the oxygen-minimum zones. Nitrite oxidation rates decrease with depth. Globally, the highest median nitrite oxidation rates were found in the surface water (0–10 m layer), which is mainly attributed to the high surface rates observed over the United Kingdom shelves, the subpolar North Atlantic and the Mauritanian upwelling system (Fig. 12; Clark et al., unpublished; Clark et al., 2016). After removing these high surface nitrite oxidation rates, the depth profiles of nitrite oxidation often show a subsurface maximum that is slightly deeper than the subsurface maximum of ammonia oxidation (Fig. 13). This difference may be related to the higher sensitivity of nitrite oxidizers and/or nitrite oxidation to light (Wan et al., 2021; Olson, 1981b). Interestingly, some deep peaks of nitrite oxidation rates have been found in the oxygen-depleted waters in the oxygen-minimum zones (Peng et al., 2015; Babbin et al., 2020; Ward et al., 1989b; Beman et al., 2013). These high rates stand out in depths below the 1 µM nitrate threshold and above the 1 % PAR level between 20∘ N and 20∘ S (Fig. 14). Many hypotheses (Sun et al., 2023) have been proposed to explain the observed anaerobic nitrite oxidation, including alternative oxidants like iodate (Babbin et al., 2017), distinct nitrite oxidizers that are only present in the oxygen-minimum zones (OMZs) and that are adapted to the low-oxygen conditions (Sun et al., 2021), nitrite dismutation (2H+ + 5NO N2+ 3NO H2O; van de Leemput et al., 2011; Babbin et al., 2020; Tracey et al., 2023) and oxygen intrusions (Buchanan et al., 2023). Whether nitrite oxidation is truly anaerobic and how nitrite oxidation is sustained in oxygen-depleted waters remain to be determined.
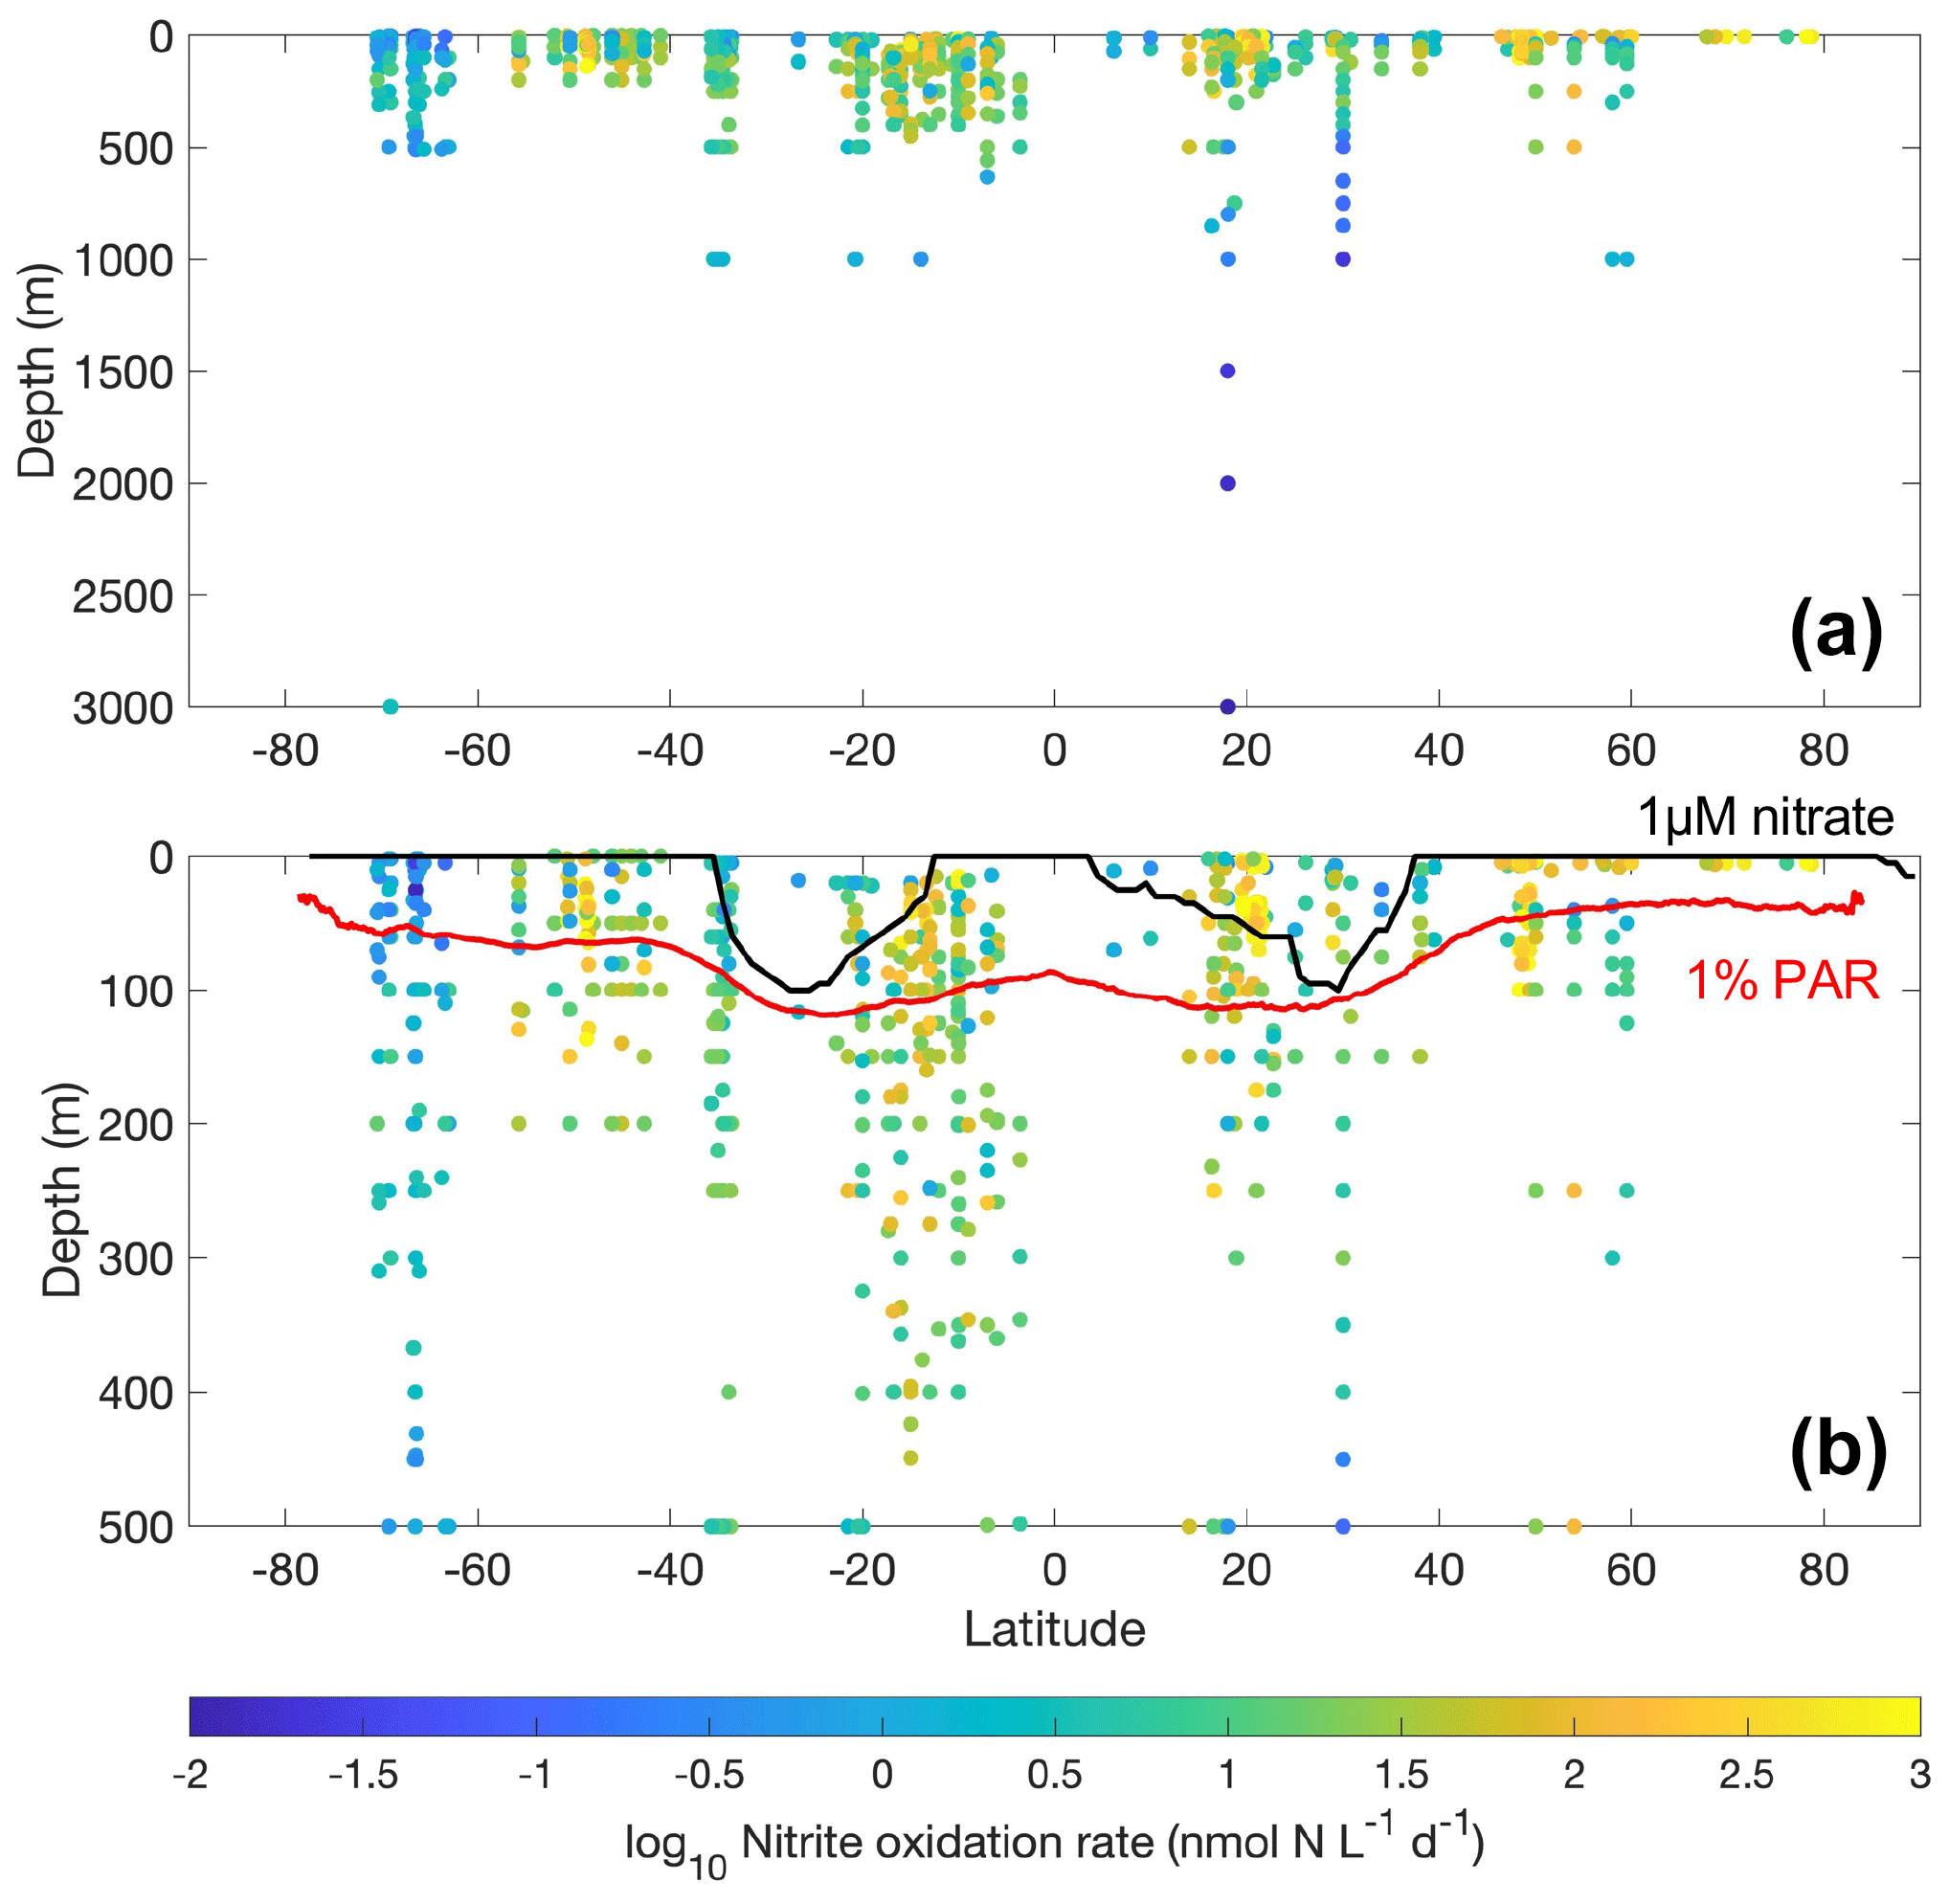
Figure 14Latitudinal and vertical distribution of nitrite oxidation rates in the whole water column (a) and from the top 500 m (b). The lower panel shows data from the top 500 m. The climatological depth of the euphotic zone (1 % PAR) and 1 µM nitrate are shown by the red and black lines, respectively.
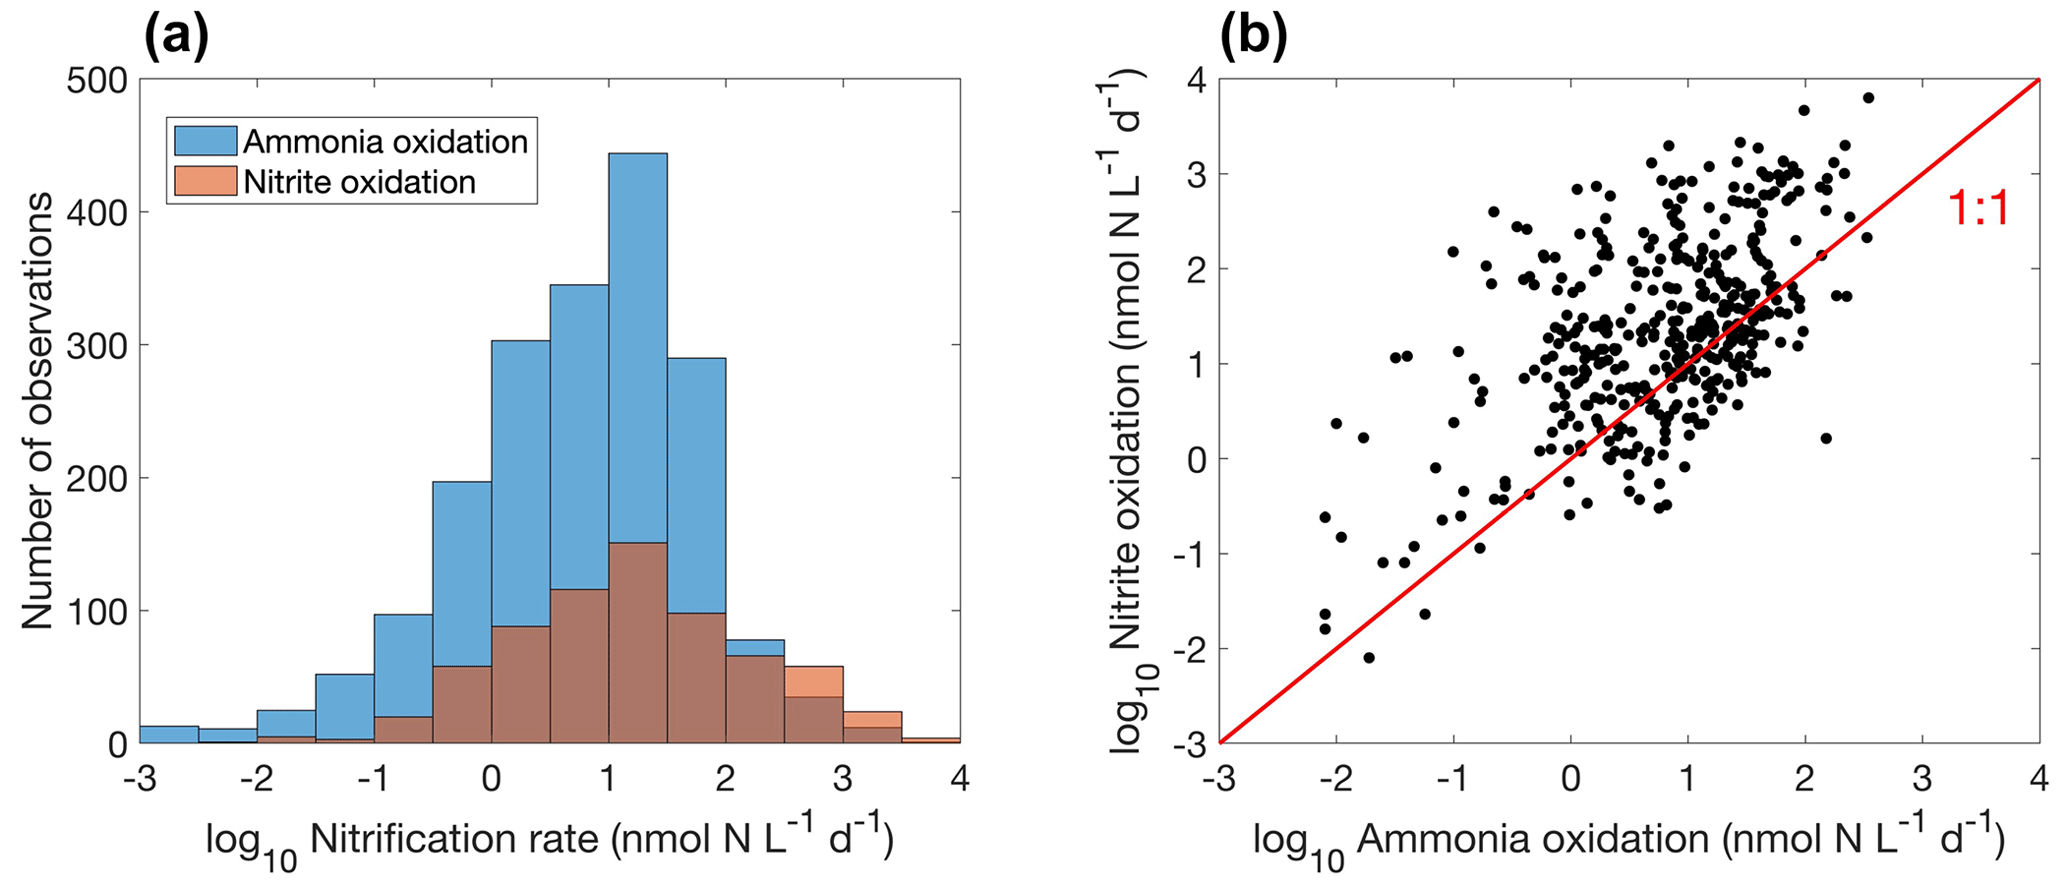
Figure 15Comparison between ammonia oxidation and nitrite oxidation. (a) Histogram of both rates globally. Note that the colors change slightly where they overlap in the histograms. (b) Relationship between ammonia oxidation and nitrite oxidation measured at the same locations and time (, r=0.5, p<0.01).
Overall, there are fewer nitrite oxidation rate measurements compared to ammonia oxidation measurements (Fig. 15a). Ammonia oxidation and nitrite oxidation are generally of similar magnitude (Fig. 15b), leading to the low concentration of NO in most of the ocean. However, ammonia oxidation and nitrite oxidation could be decoupled. For example, higher ammonia oxidation rates than nitrite oxidation rates (Lomas and Lipschultz, 2006) and competition between ammonia oxidation and phytoplankton ammonium assimilation (Zakem et al., 2018) may both partly explain the presence of the primary nitrite maximum. The median nitrite oxidation rate is higher than the median ammonia oxidation rate (15.9 vs. 7.7 nmol N L−1 d−1), which may be related to nitrite production pathways from urea and cyanate oxidation in addition to ammonia oxidation (Wan et al., 2022; Kitzinger et al., 2018). Consistently, when comparing ammonia oxidation and nitrite oxidation rates measured at the same locations and same time, nitrite oxidation rates are mostly higher (Fig. 15b). Mechanisms driving the decoupling of ammonia oxidation and nitrite oxidation deserve further investigations.
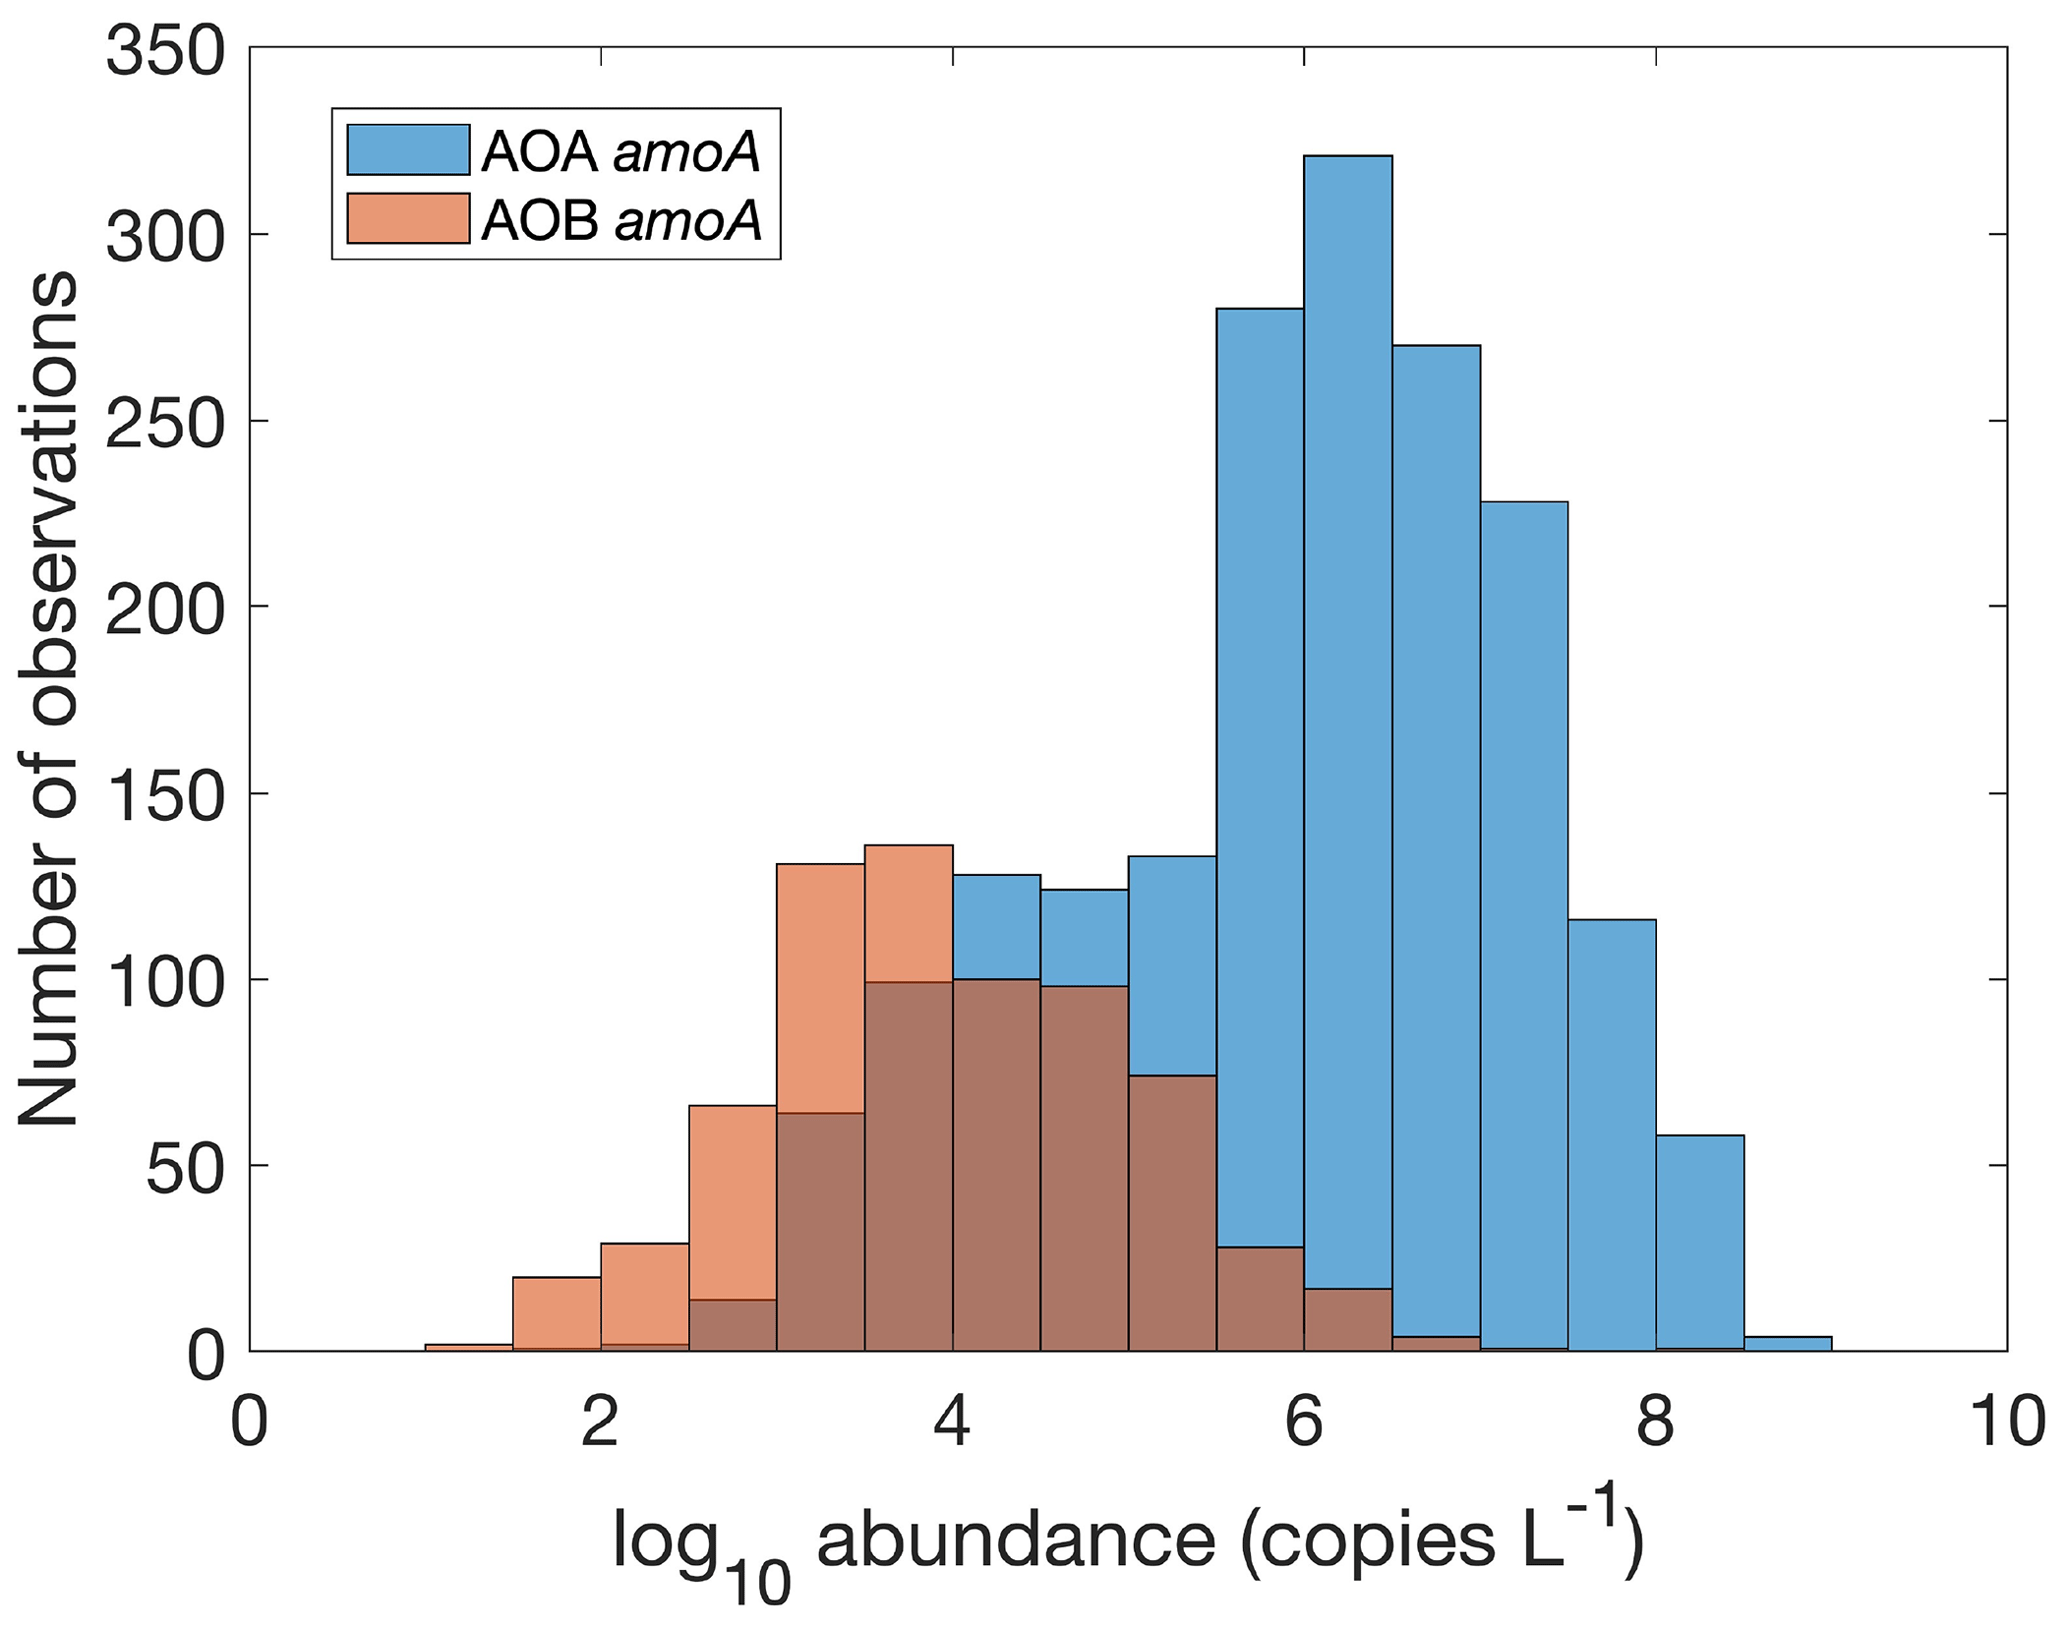
Figure 16Comparison between the gene abundance of AOA amoA and AOB amoA. AOA amoA represent the total abundance of archaeal amoA gene abundance or the sum of WCA and WCB. Note that the colors change slightly where they overlap in the histograms.
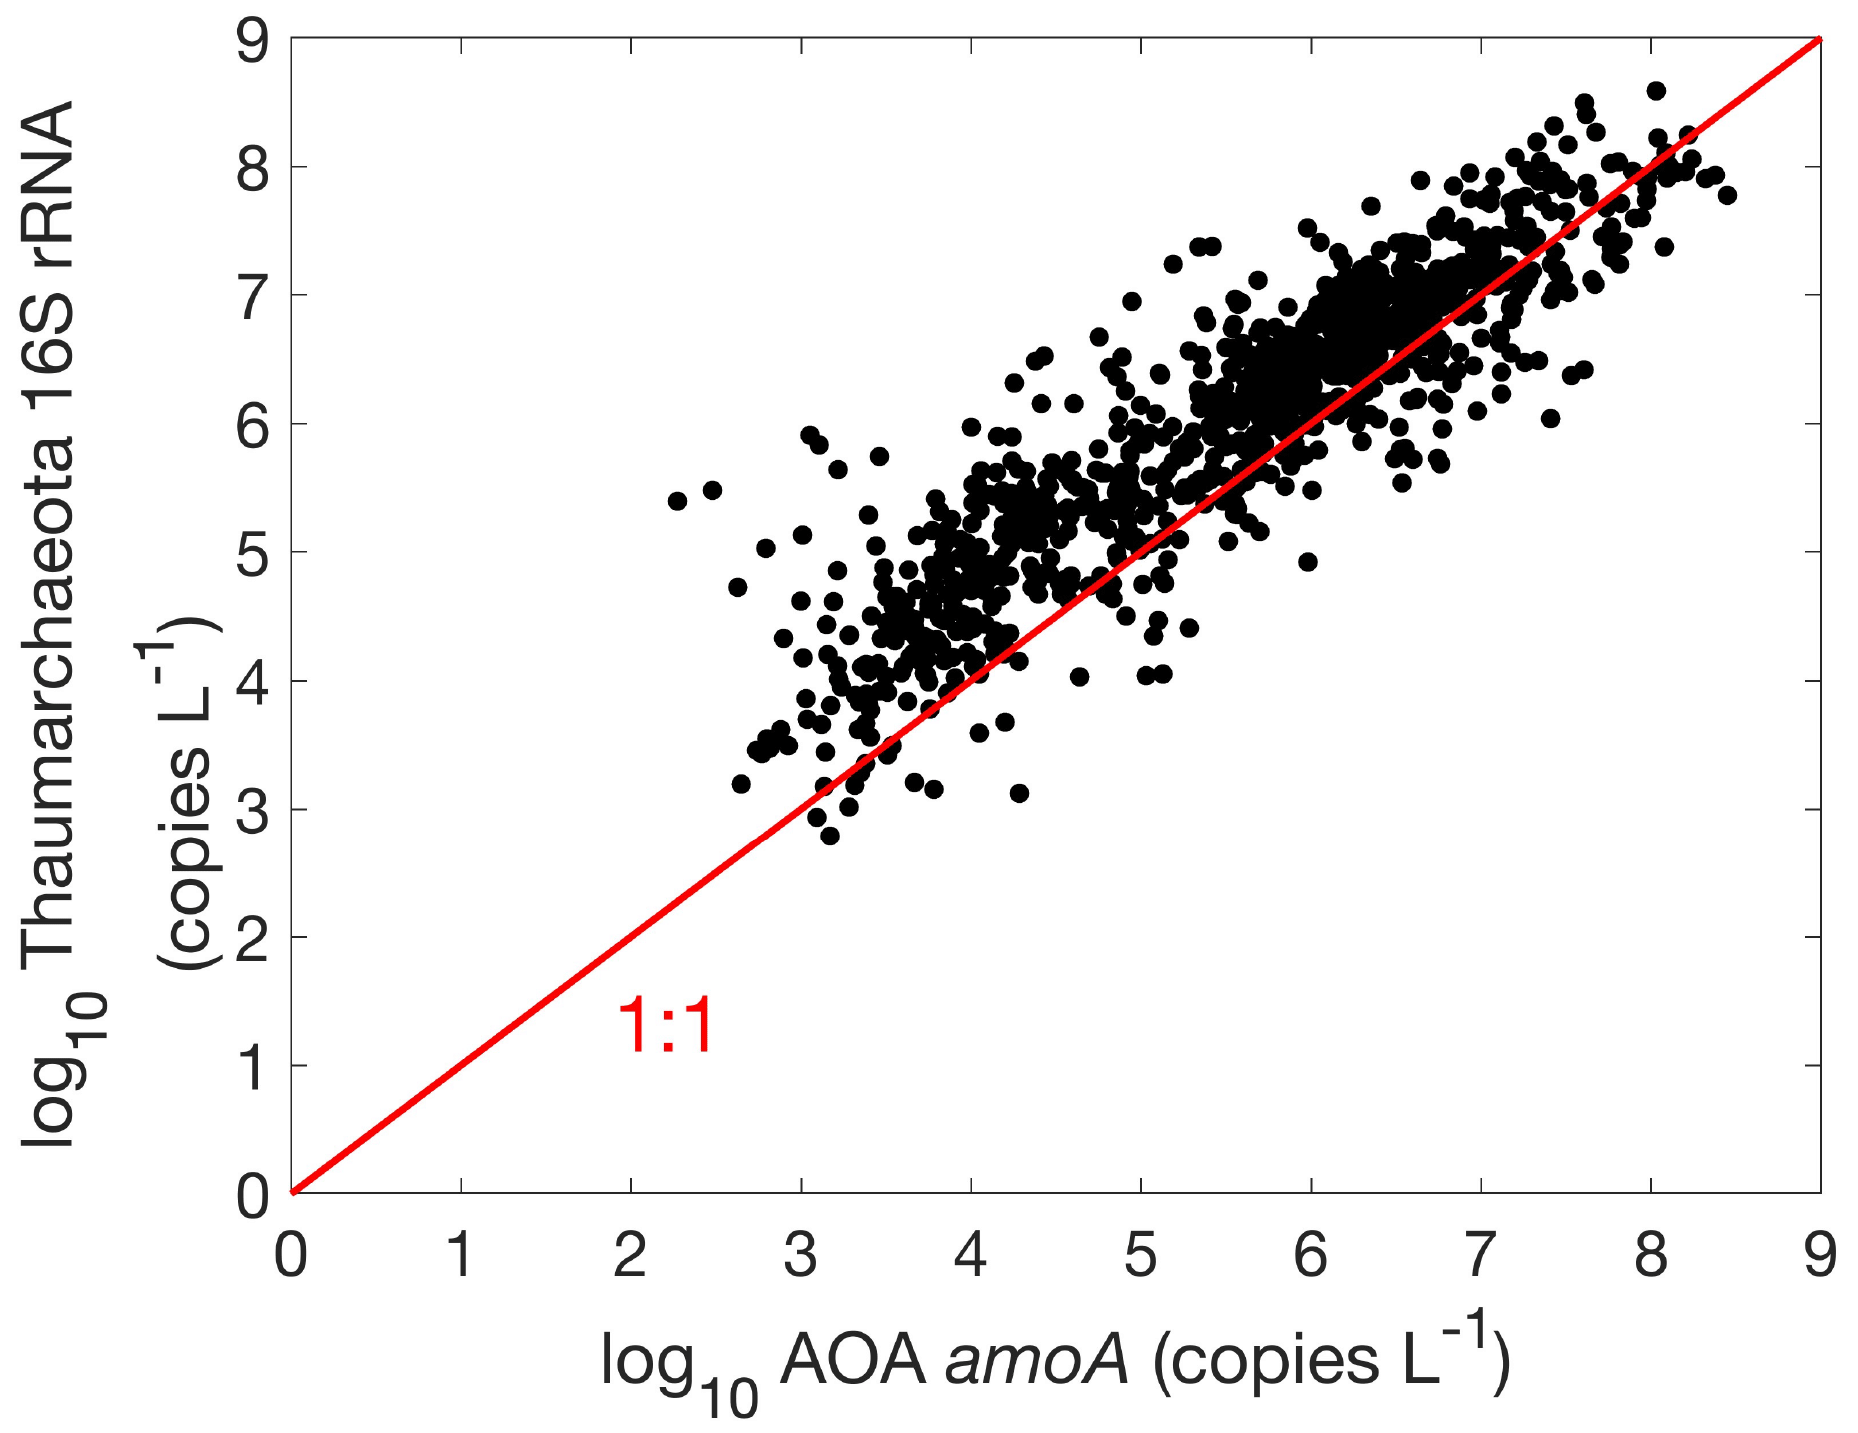
Figure 17Comparison between AOA amoA and Thaumarchaeota 16S rRNA gene abundances (, r=0.9, p<0.01).
3.4 Distribution of ammonia oxidizers
There are 1893, 892 and 1073 measurements of the abundance of the AOA amoA gene, AOB amoA and 16S rRNA of Thaumarchaeota, respectively. Within the measurements of AOA amoA abundance, 1204 and 1101 measurements were separately conducted for water column ecotype A (WCA) amoA and water column ecotype B (WCB) amoA. Thus, the total amoA gene abundance was calculated by summing the abundance of WCA and WCB when available. The AOA amoA abundance, with a median of 1.34×10⁶ copies L−1, is substantially higher than AOB amoA gene abundance, with a median of 7.96×10³ copies L−1 (Fig. 16), confirming the dominance of archaeal ammonia oxidizers in the ocean. We also found that Thaumarchaeota 16S rRNA gene abundance positively correlates with but slightly outnumbers the amoA gene abundance (Fig. 17). This may suggest that not all the Thaumarchaeota contain the amoA genes to oxidize NH, or some organisms containing amoA genes (such as the Nitrosopumilus-like group) may have been missed due to primer bias (Sintes et al., 2016; Hiraoka et al., 2023). Since total AOA amoA genes have the largest number of observations and better represent ammonia oxidation capability, we will use this to show the spatial and vertical distribution of ammonia oxidizer abundance.
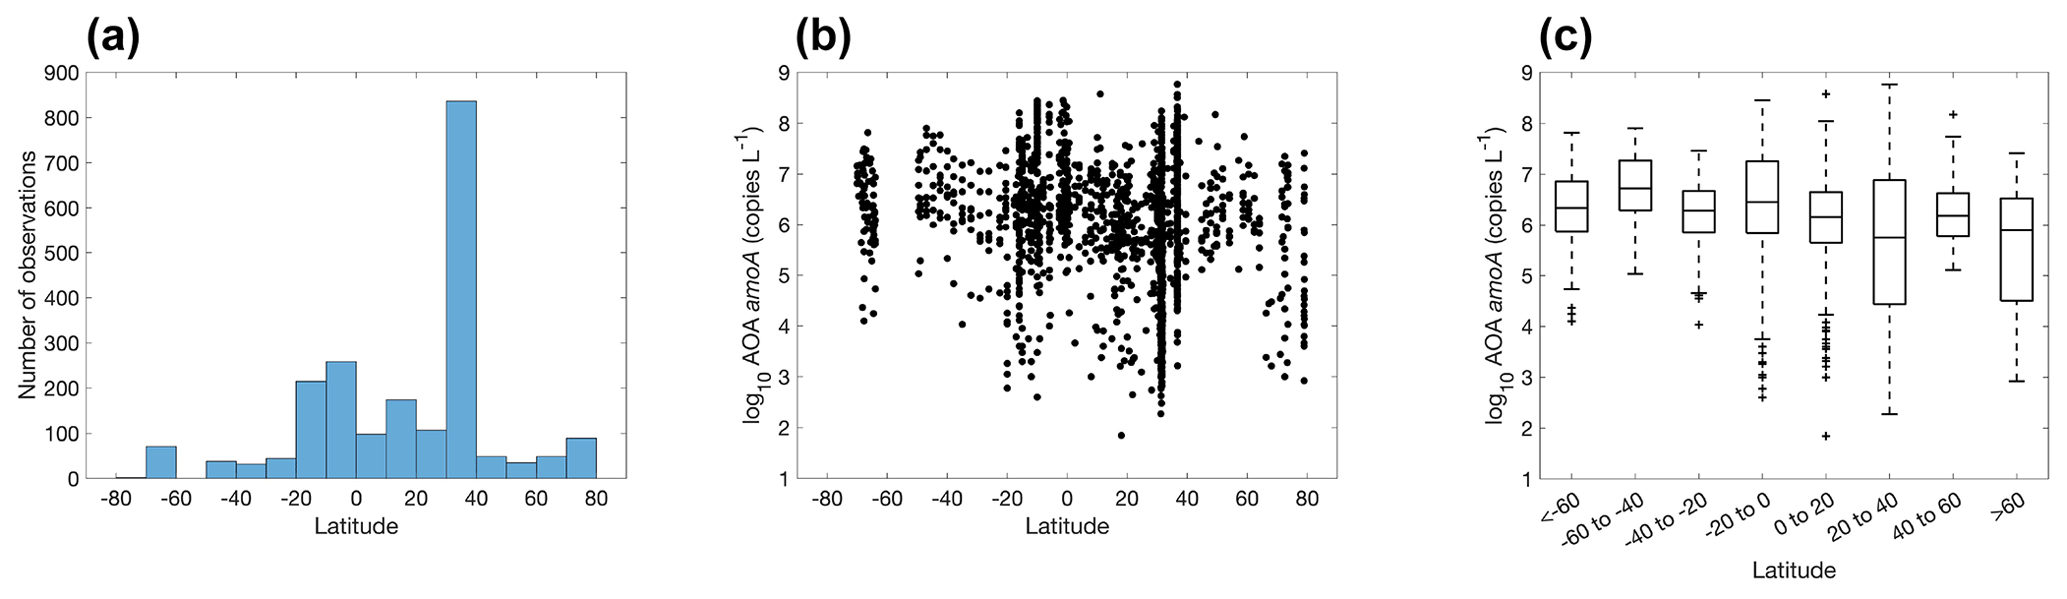
Figure 18Number of observations of archaeal ammonia oxidizers (a) and the abundance of archaeal ammonia oxidizers (b–c) within latitudinal bands.
The eastern Pacific Ocean and Atlantic Ocean have the majority of the observations for ammonia oxidizers, particularly in the 30–40∘ N band (Fig. 18), where ammonia oxidizers were measured in the coastal waters off California and Georgia (Liu et al., 2018; Tolar et al., 2020). In contrast, observations in the Indian Ocean and Southern Ocean are scarce. The AOA amoA gene abundance varies from a few copies per liter in the surface ocean to over 108 copies L−1 in the subsurface of the equatorial Atlantic. There is no clear latitudinal trend in the abundance of ammonia oxidizers.
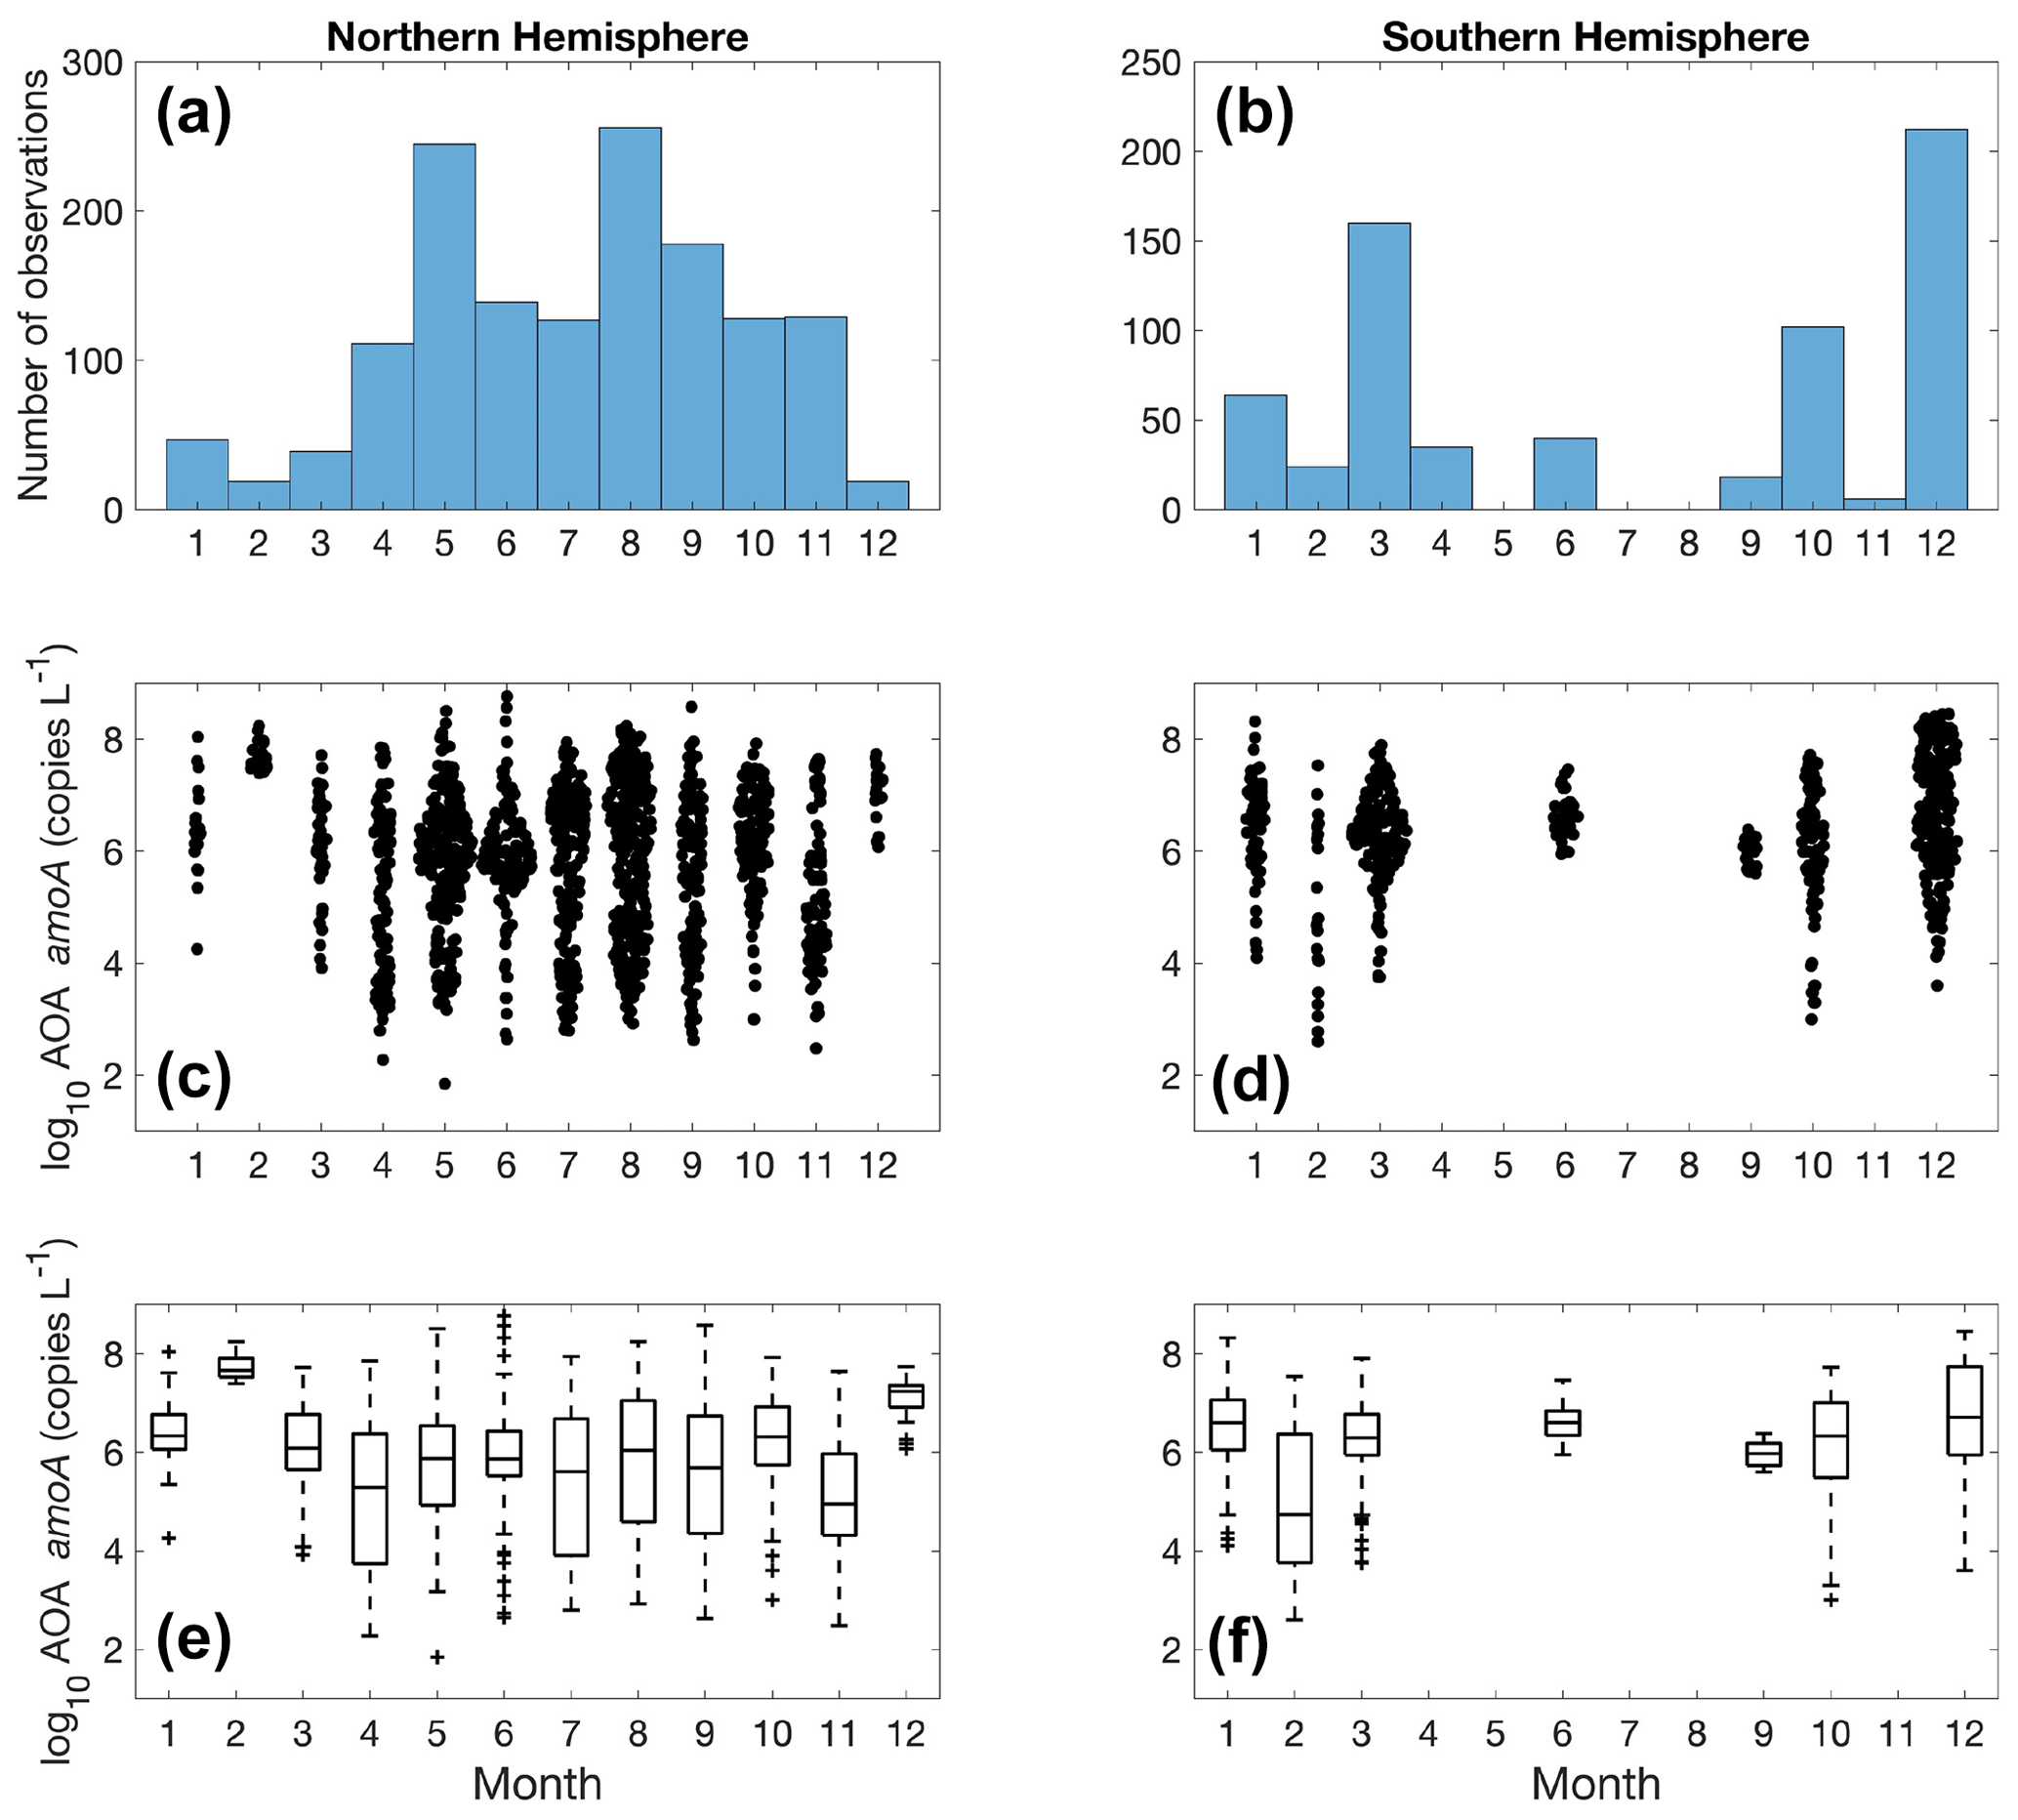
Figure 19Monthly variation (1–12: January to December) of archaeal amoA observations (a–b) and amoA abundance (c–f) divided into observations taken in the Northern Hemisphere (a, c, e) and Southern Hemisphere (b, d, f). Jitter according to data density is added in subplot (c) and (d).
There are substantially more observations in the Northern Hemisphere than in the Southern Hemisphere (Fig. 19). We do not see a clear seasonal trend in nitrifier abundance due to the large monthly variation. A time series study in Monterey Bay shows that seasonality can be observed for the top 200 m, while the overall community of ammonia oxidizers was stable at 500 m (Tolar et al., 2020). In addition, mid-summer peaks in Thaumarchaeota abundance have been observed at the coast off Georgia (Hollibaugh et al., 2014). More time series studies with high-frequency sampling would be useful for characterizing the response of the nitrifier community to seasonal changes in environmental drivers.
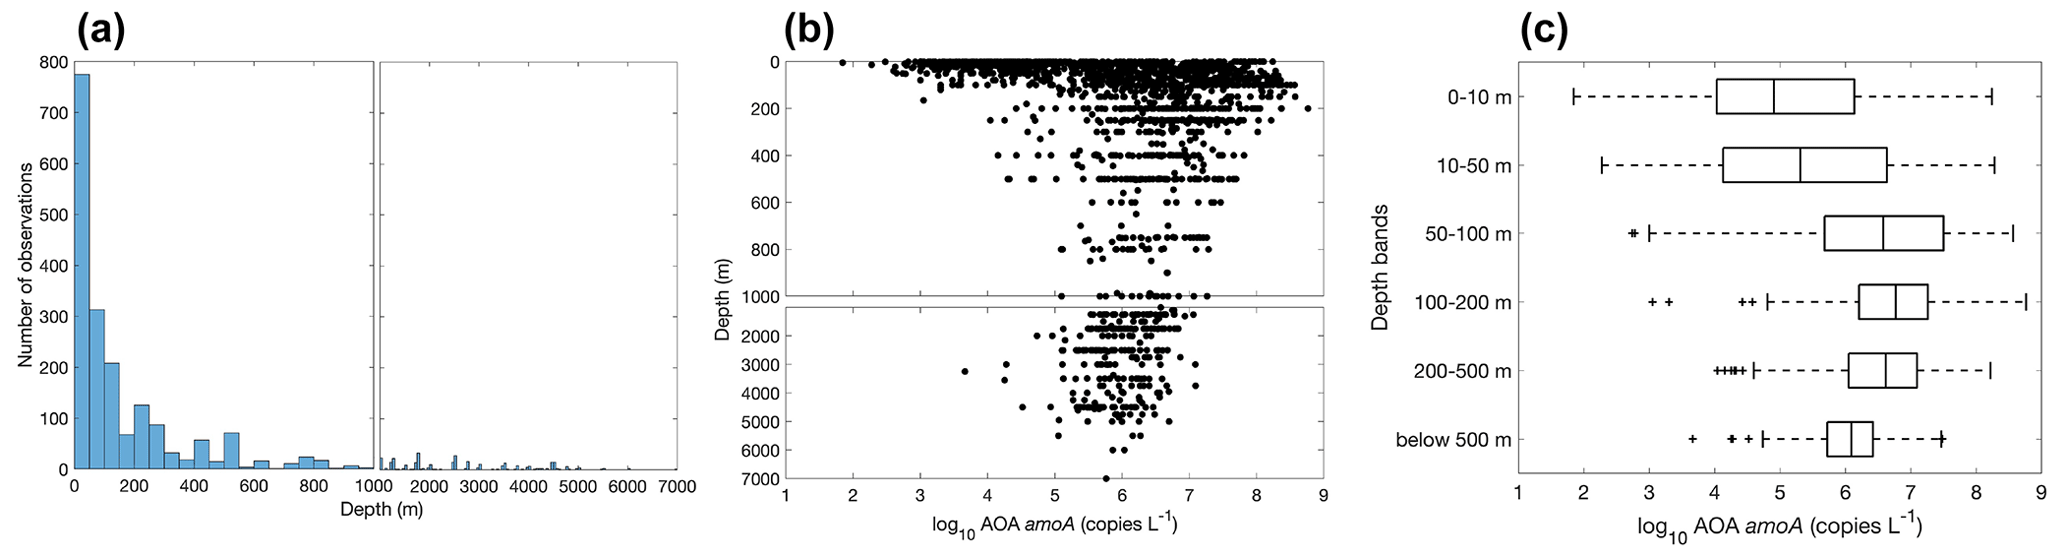
Figure 20Vertical distribution of archaeal amoA observations (a) and archaeal amoA gene abundance (b–c). Note that the axis breaks at 1000 m depth in subplots (a) and (b).
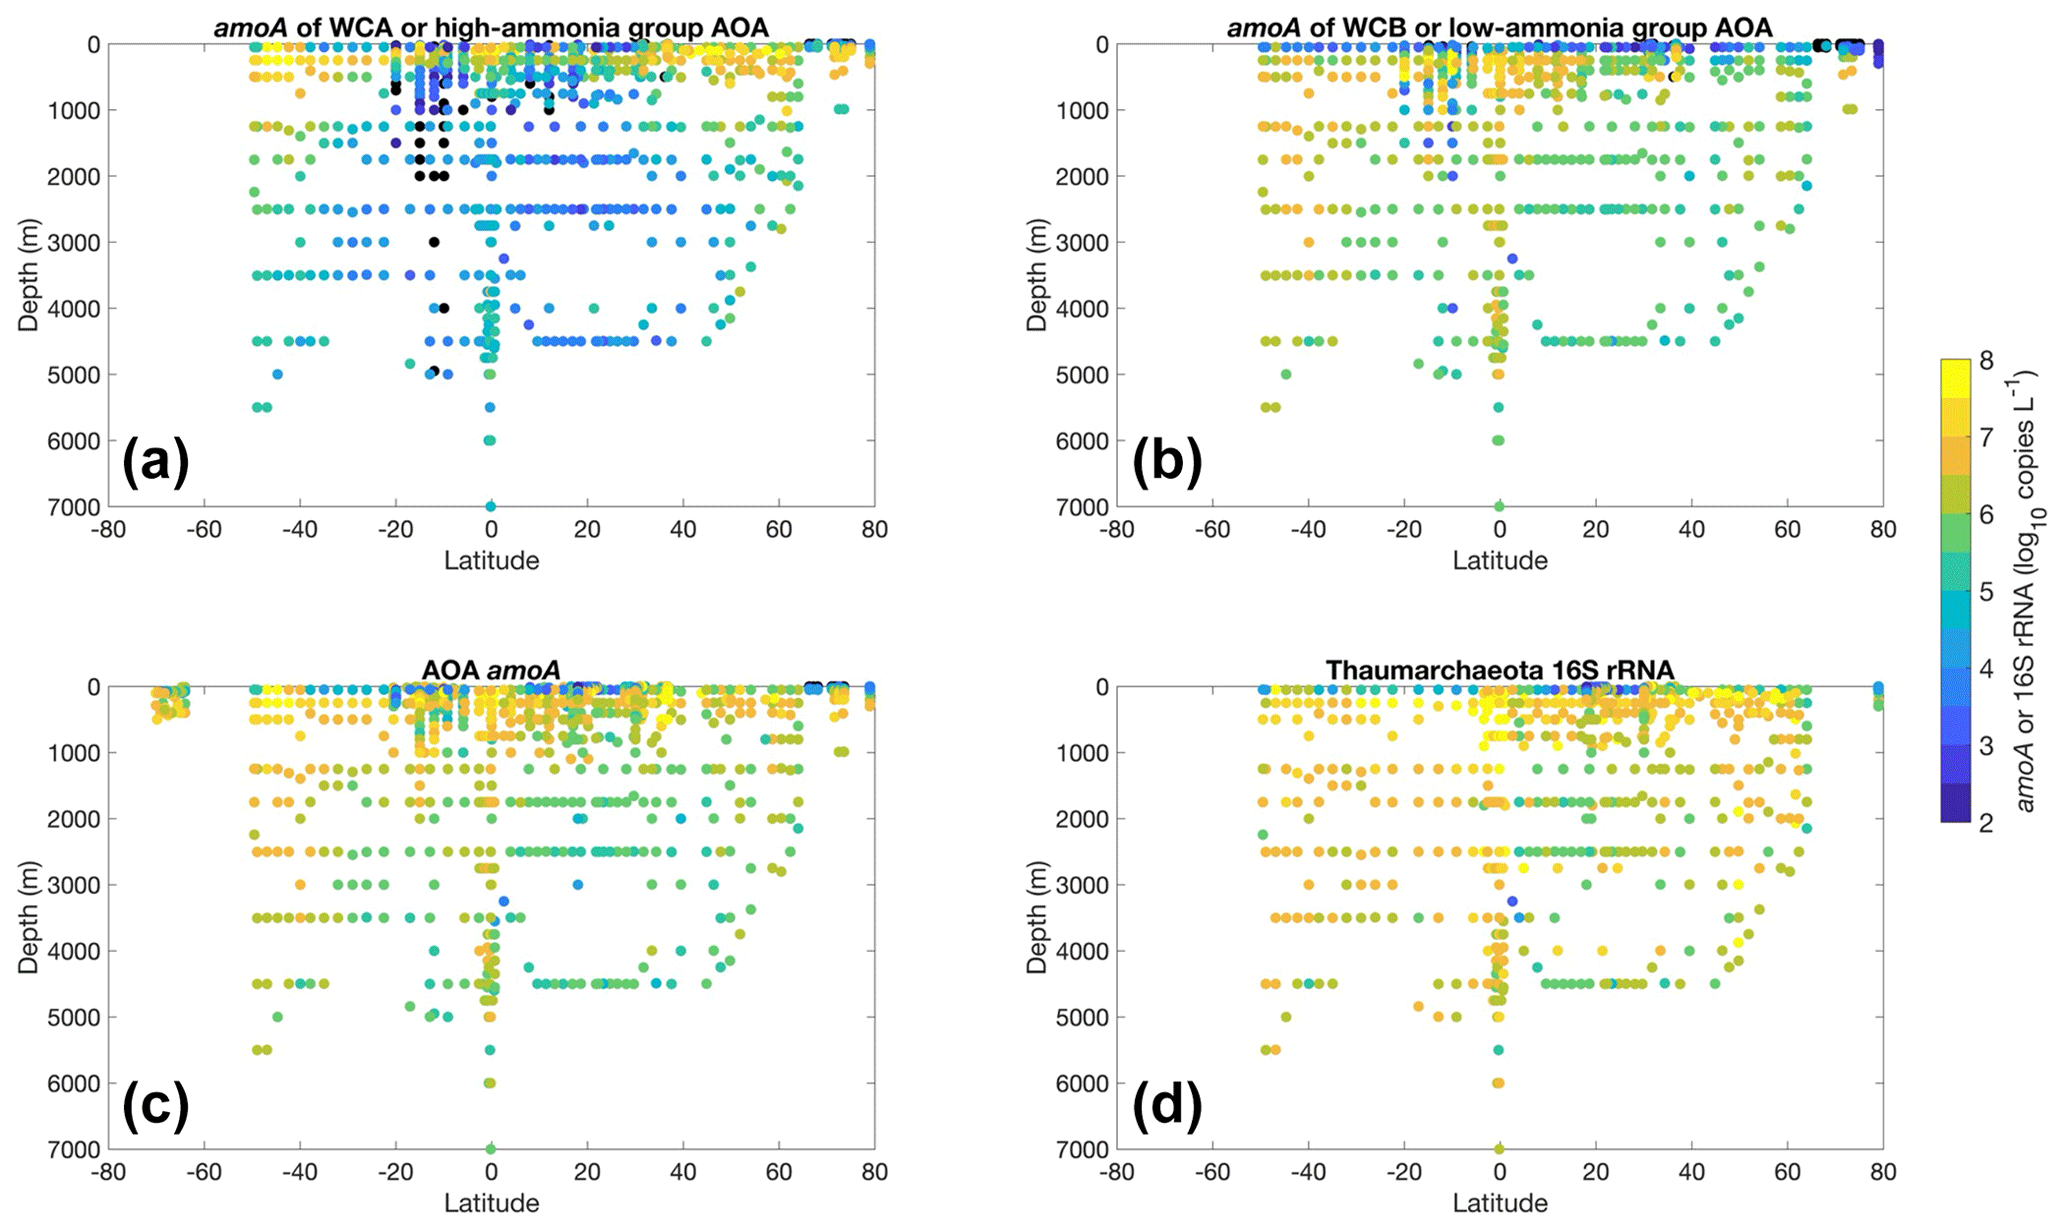
Figure 21Vertical distribution of AOA amoA gene abundance (a–c) and the 16S rRNA of Thaumarchaeota (d) across the latitudinal gradient. WCA and high-ammonia-concentration groups (a) are shown together, while WCB and low-ammonia-concentration groups (b) are shown together. The total AOA amoA or the sum of WCA and WCB is shown in (c).
Most of the abundance measurements of ammonia oxidizers were made in the top 1000 m (Fig. 20). Median ammonia oxidizer abundance increases from ∼105 copies L−1 in the 0–10 m depth layer to ∼107 copies L−1 in the 100–200 m layer, then it decreases with depth and remains relatively constant at ∼106 copies L−1 in the deep ocean below 500 m depth. We noticed that amoA abundance and ammonia oxidation rates appear to have different depth distributions, particularly for the top 200 m (Figs. 6c and 20c): amoA abundance in the 0–10 m layer is lower than in the 100–200 m layer, while ammonia oxidation rates in the 0–10 m layer are comparable to the rates observed in the 100–200 m layer. These distributions may suggest depth differences in cell-specific activity, which might be interesting for future investigation. The archaeal amoA is sometimes quantified separately for two ecotypes, including water column groups A and B. Water column group A dominates the upper 200 m, while water column group B is more abundant in the mesopelagic and bathypelagic deep ocean below 500 m (Fig. 21), likely reflecting their different affinities for NH (Beman et al., 2008; Sintes et al., 2016). The vertical distribution of ammonia oxidizers is similar to the vertical distribution of ammonia oxidation rates (Fig. 13).
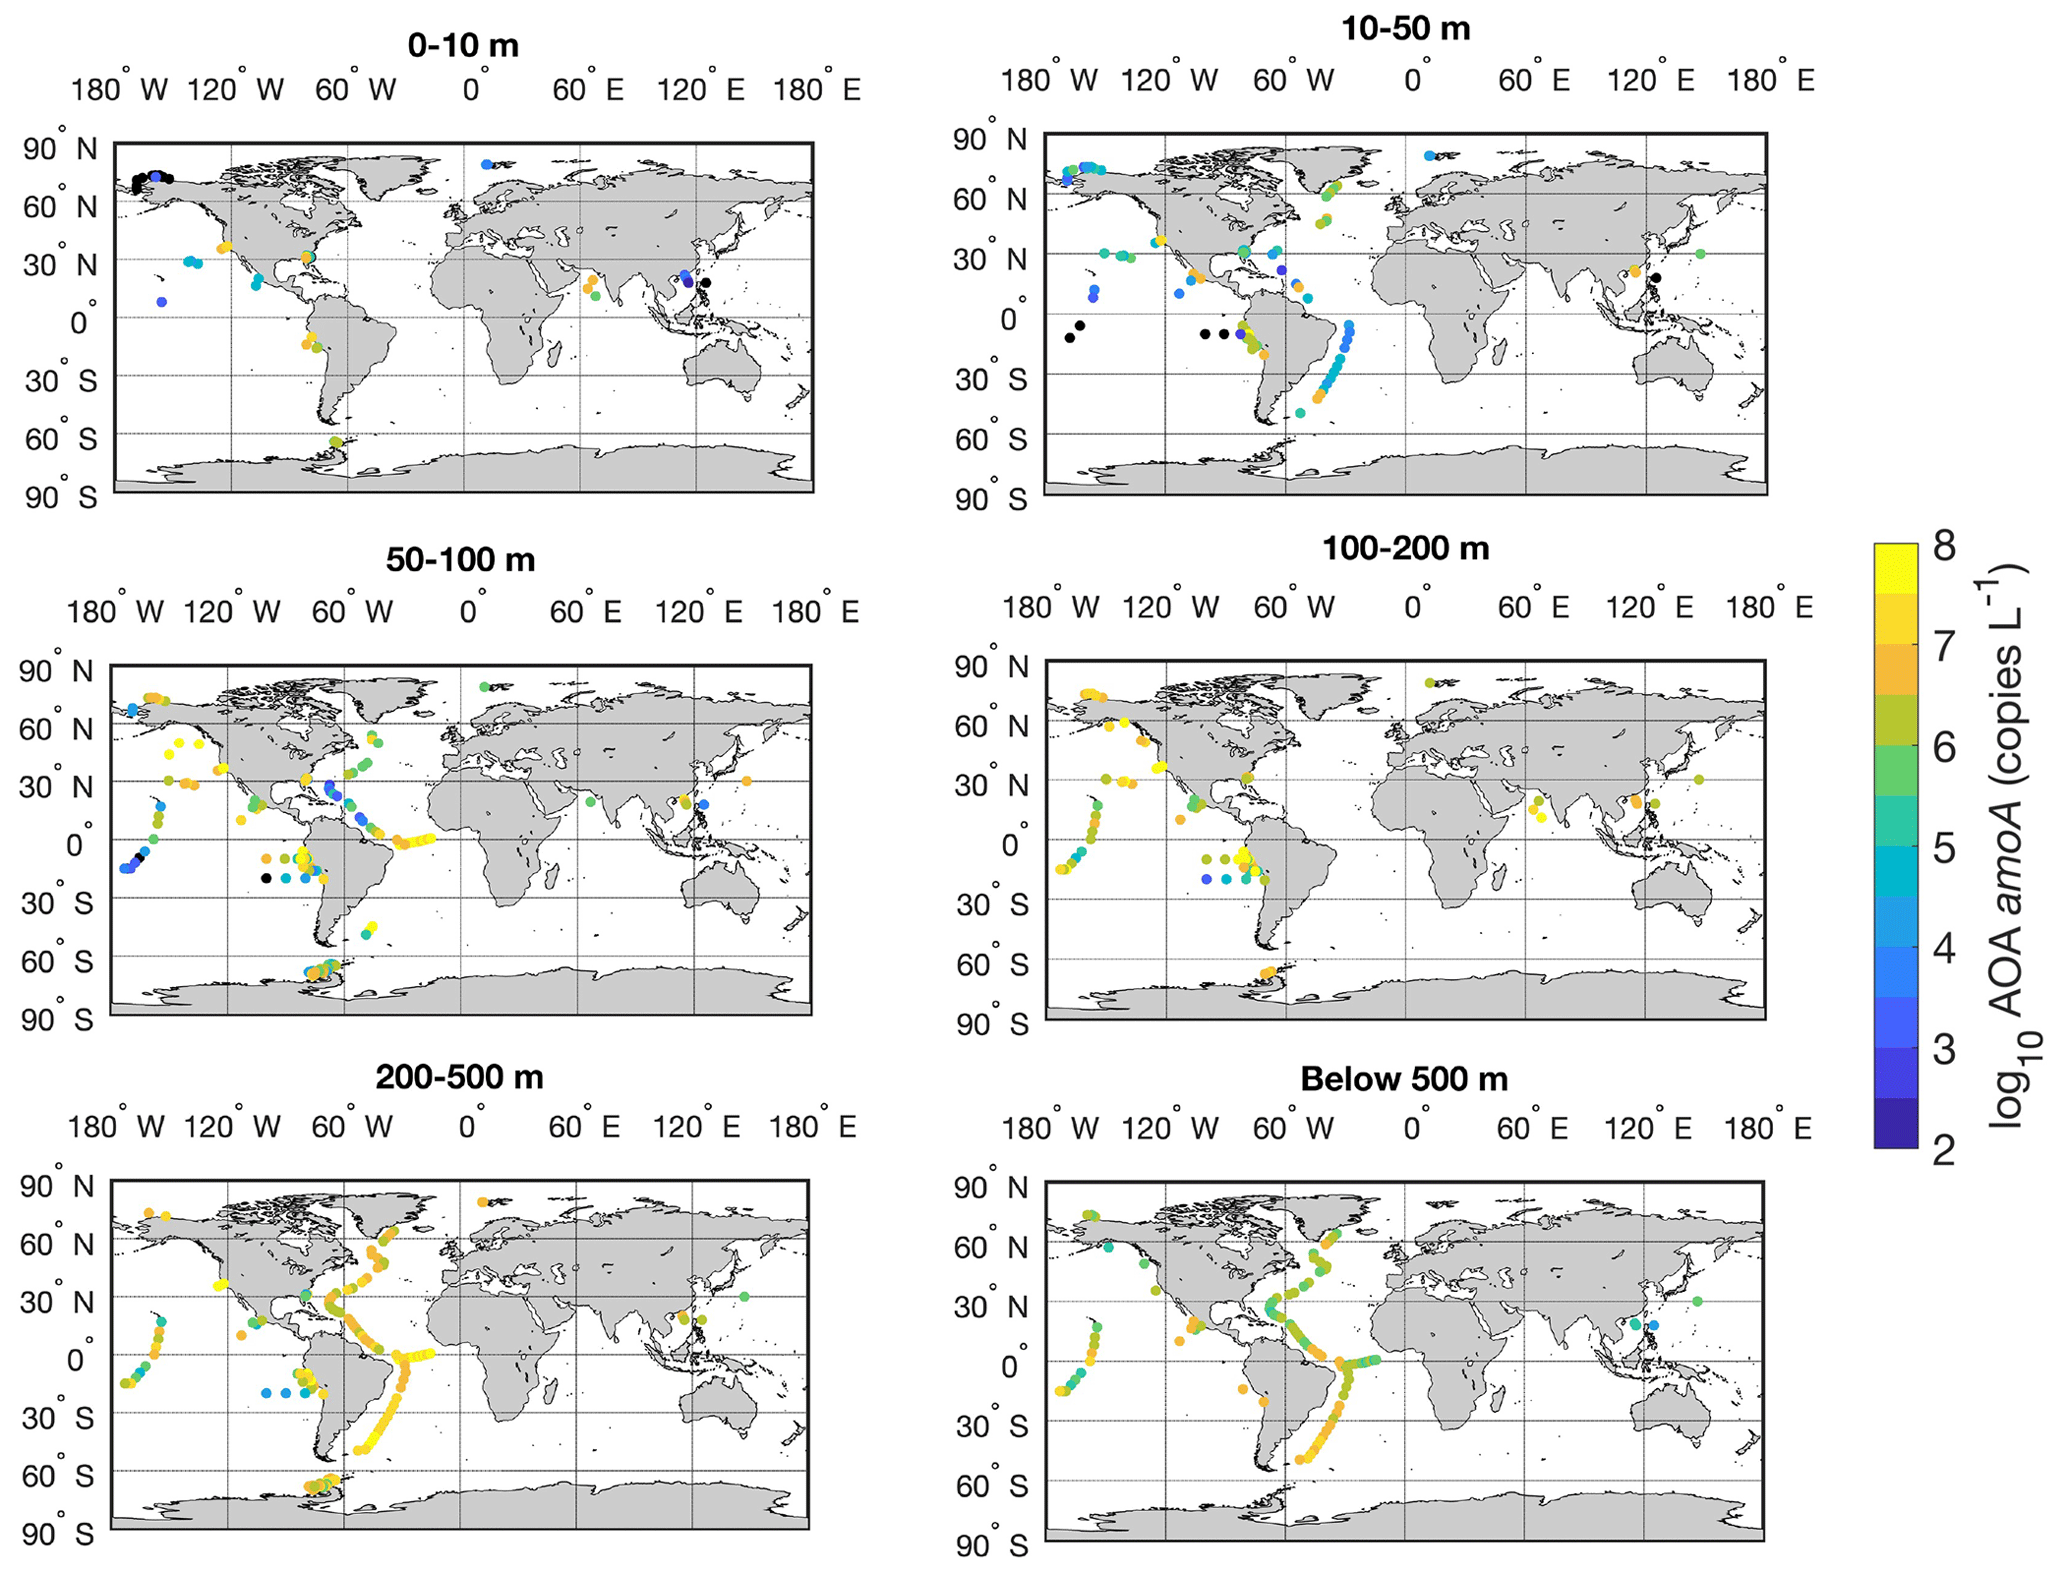
Figure 22Spatial distribution of AOA amoA gene in six depth intervals in the global ocean. Locations with abundance below the detection limit are shown in the black circles.
There is a large spatial variation in the abundance of ammonia oxidizers (Fig. 22). High abundances are found in the tropical Atlantic and eastern tropical Pacific, where upwelling drives high rates of marine primary production. In contrast, some of the lowest abundances of ammonia oxidizers are found in the South China Sea and oligotrophic subtropical Pacific. Therefore, the distribution of marine productivity and organic matter production and export may play an important role in regulating the distribution of ammonia oxidizers because ammonia oxidizers rely on the supply of NH, which is generated by organic matter decomposition.
3.5 Distribution of nitrite oxidizer abundance
There are only seven studies available reporting the abundance of nitrite oxidizers in the ocean. One study used the nxr marker gene, and the other six studies used 16S rRNA gene of either Nitrospina or Nitrospira. Since Nitrospina is the dominant nitrite oxidizer in the ocean (Beman et al., 2013; Pachiadaki et al., 2017) and accounts for most of the observations, we use it to show the distribution of nitrite oxidizers.
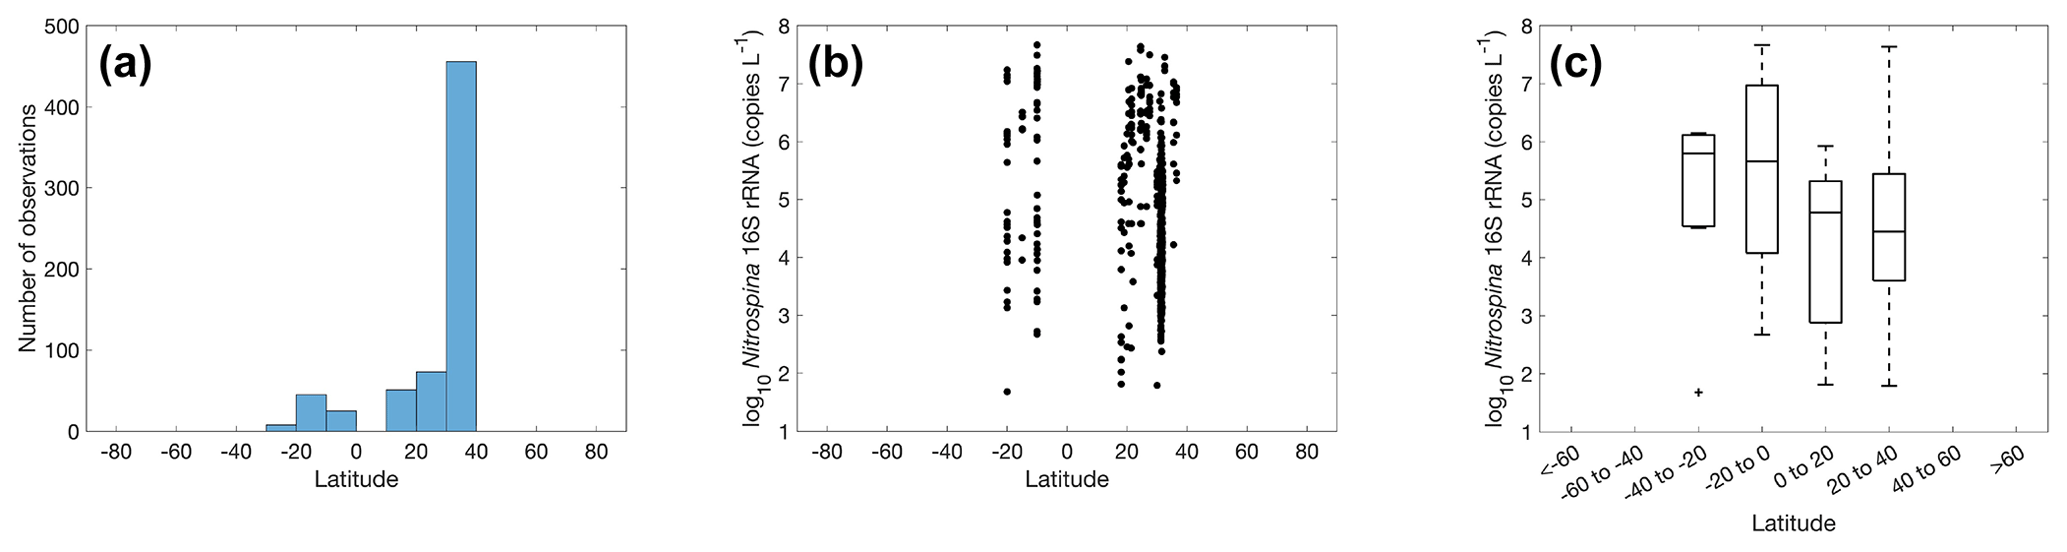
Figure 23Number of observations (a) and abundance (b–c) of Nitrospina within latitudinal bands.
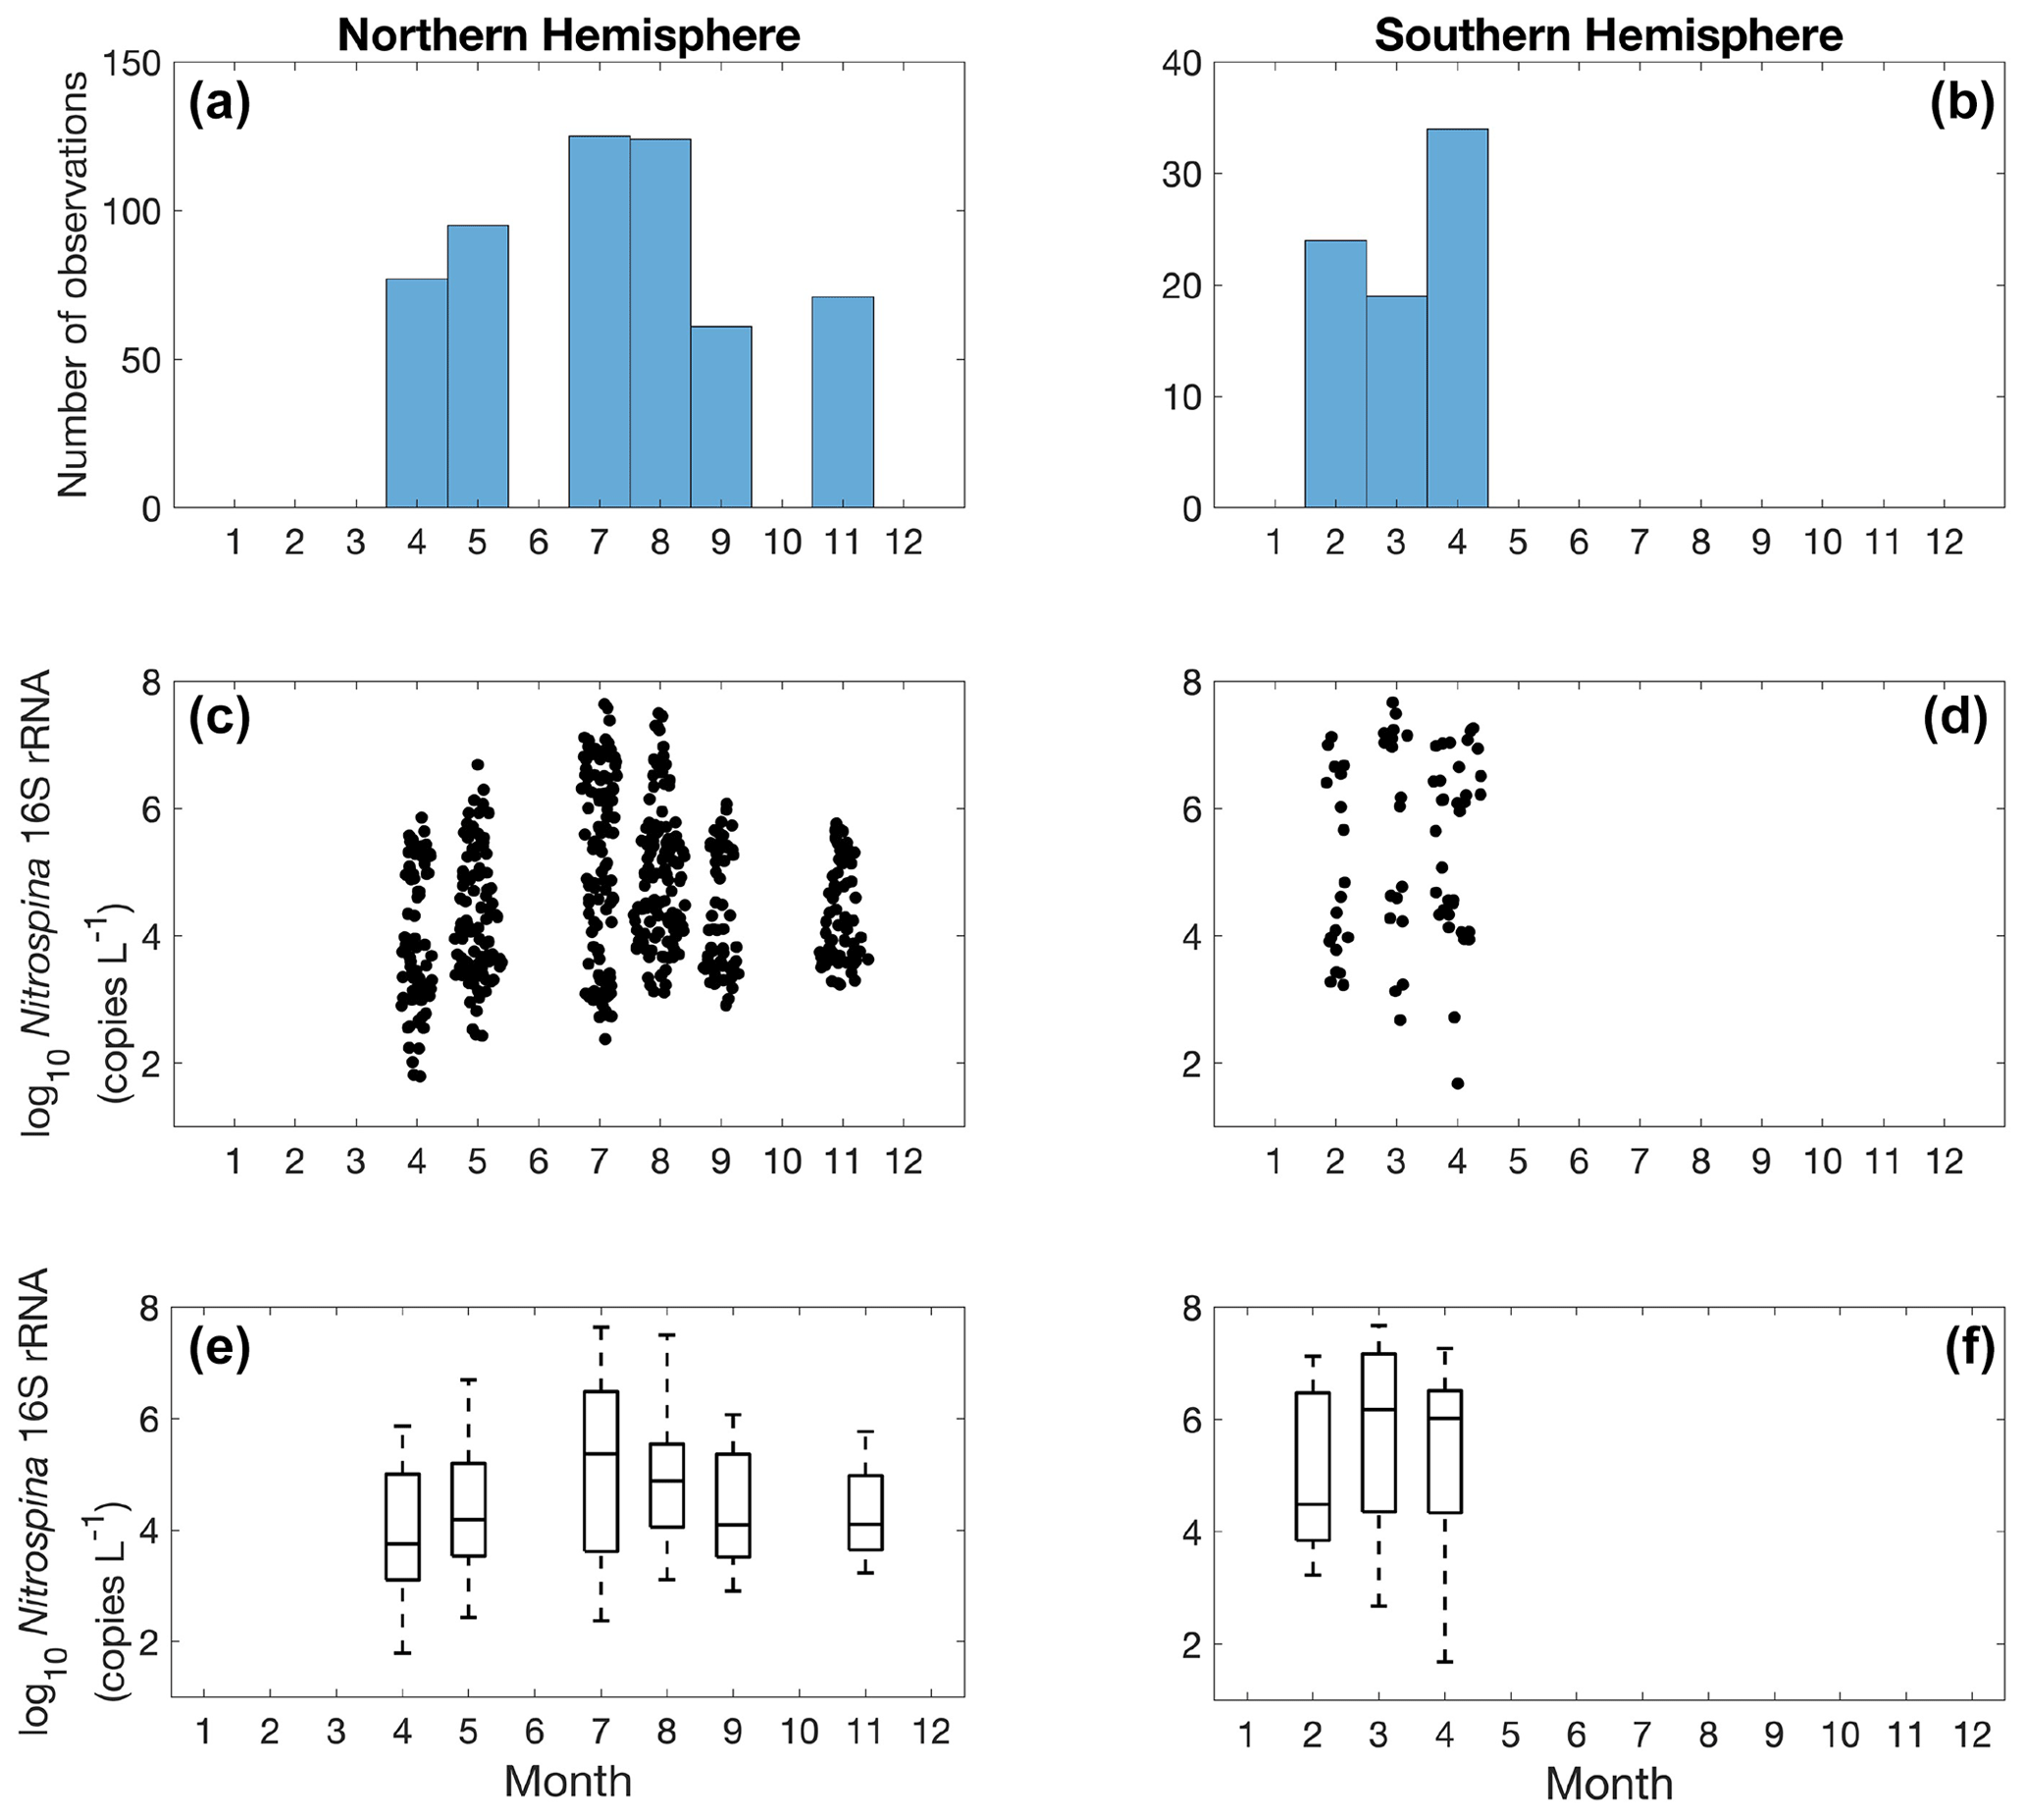
Figure 24Monthly variation (1–12: January to December) of Nitrospina observations (a–b) and Nitrospina abundance (c–f) divided into observations taken in the Northern Hemisphere (a, c, e) and Southern Hemisphere (b, d, f). Jitter according to data density is added in subplot (c) and (d).
Quantification of nitrite oxidizers using the 16S rRNA gene is limited to a few locations between 40∘ N to 40∘ S, including the coastal waters off California and Georgia, the eastern tropical South Pacific, the Bay of Bengal, and the western Pacific (Fig. 23). The number of observations is dominated by one study conducted near the coast of Georgia (Liu et al., 2018). The highest abundance of 4.68×10⁷ copies L−1 was found in the eastern tropical South Pacific. No clear latitudinal or seasonal trend can be determined based on the limited number of observations (Figs. 23–24).
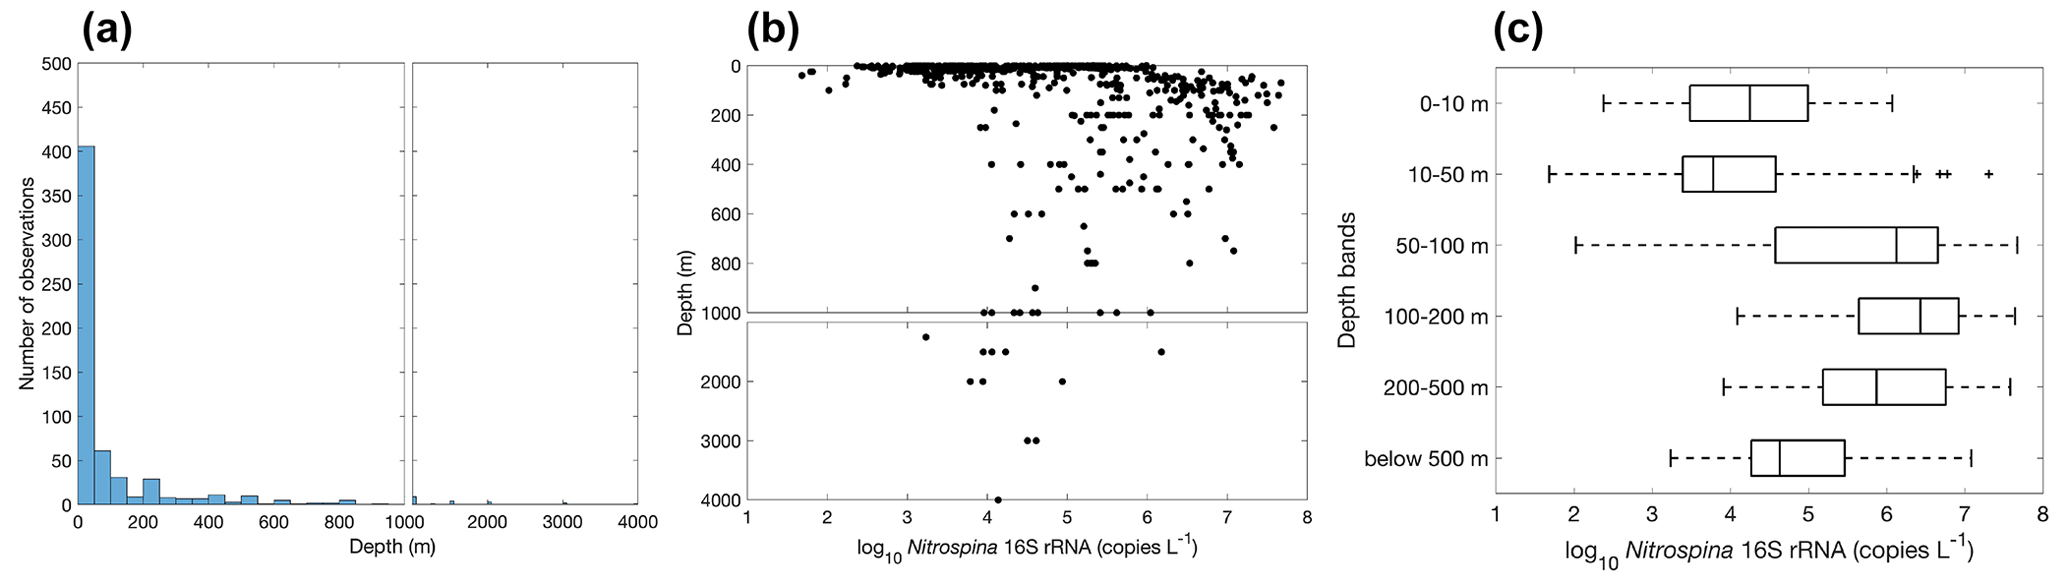
Figure 25Vertical distribution of Nitrospina observations (a) and gene abundance (b–c). Note the axis breaks at 1000 m depth in subplots (a) and (b).
The vertical distribution of nitrite oxidizers resembles the vertical distribution of ammonia oxidizers: it increases from ∼104 copies L−1 in the surface 0–10 m depth layer to a maximum of ∼106 copies L−1 in the 100–200 m layer, then it decreases to ∼104.5 copies L−1 in the deep ocean below 500 m (Figs. 25–26). However, data below 500 m are insufficient to describe the distribution of nitrite oxidizers in the deep ocean. The vertical distribution of nitrite oxidizers qualitatively matches the vertical distribution of nitrite oxidation rates (Fig. 13).
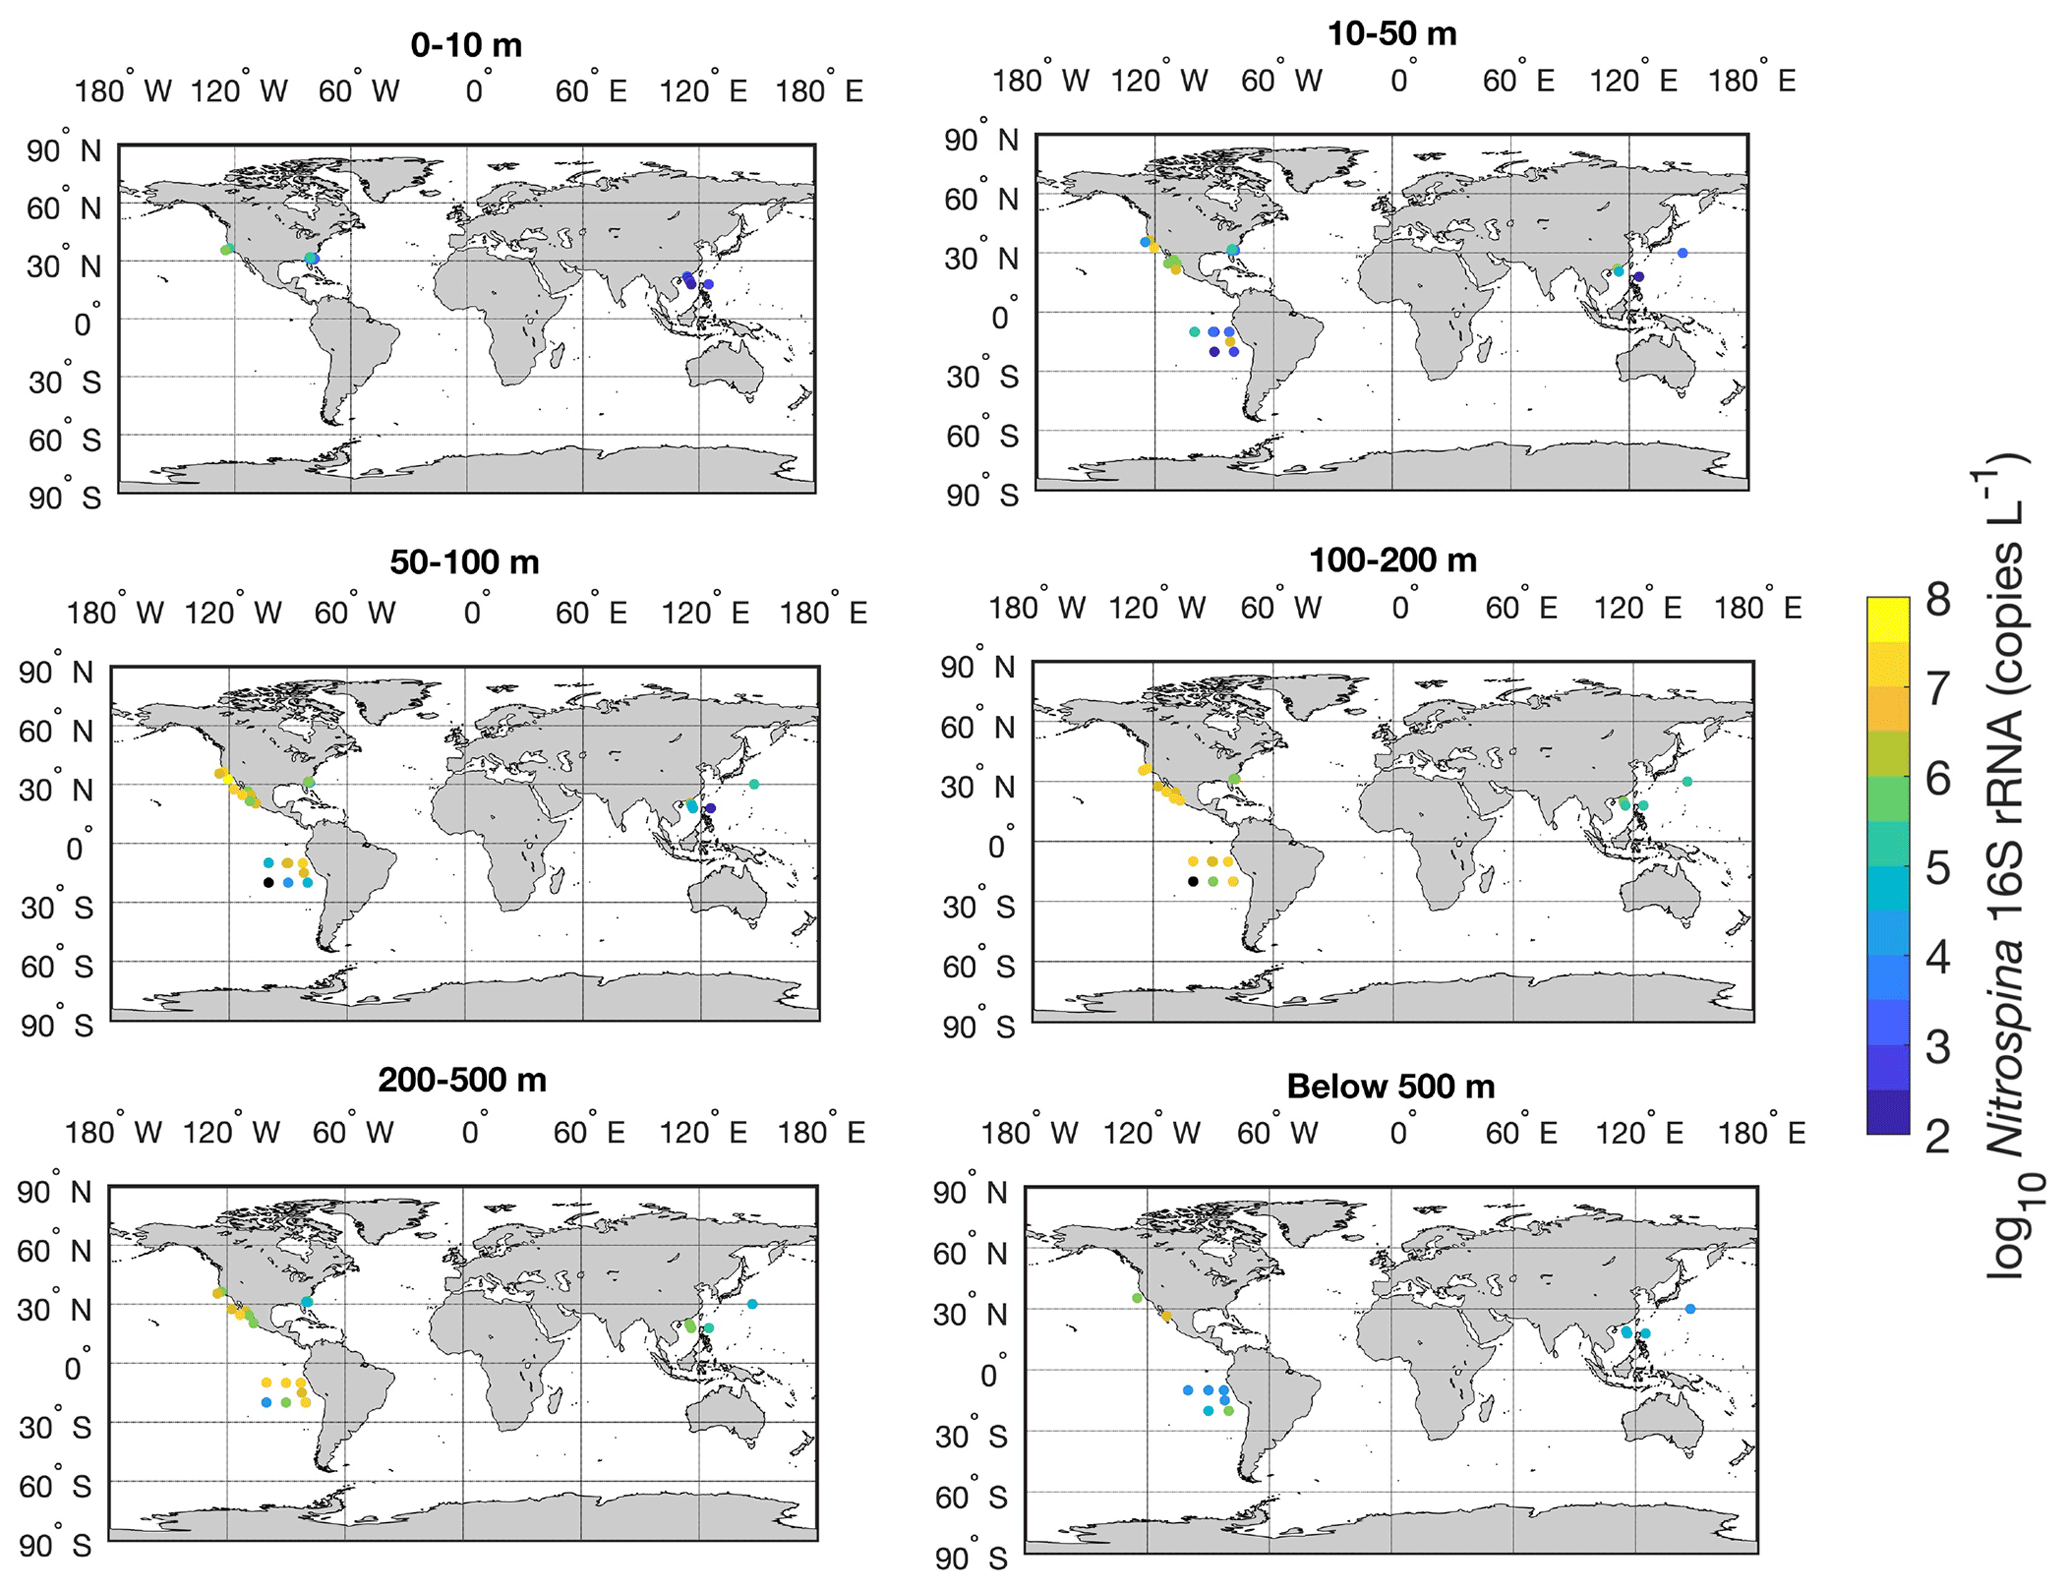
Figure 26Spatial distribution of Nitrospina in six depth intervals in the global ocean. Locations with abundances below the detection limit are shown in the black circles.
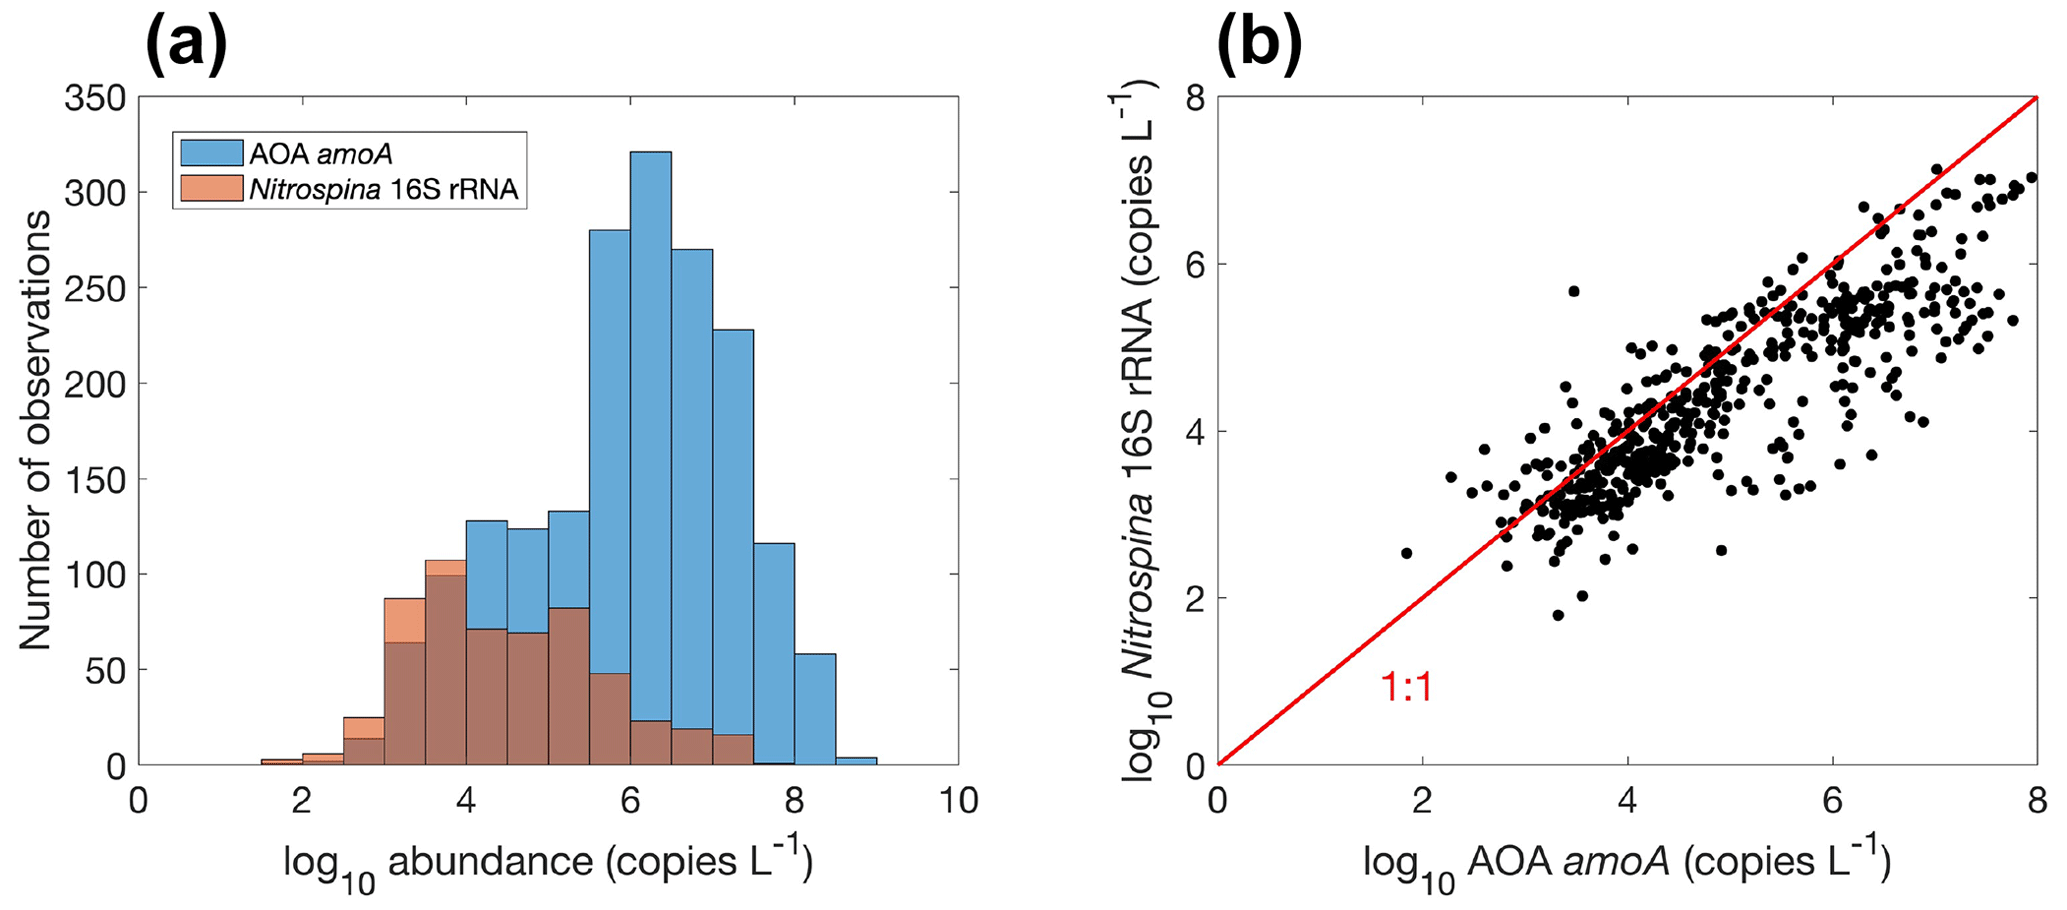
Figure 27Comparison between the number of observations (a) and the correlation between the abundance (b) of the archaeal amoA gene and the Nitrospina 16S rRNA gene (, r=0.85, p<0.01). Note that the colors change slightly where they overlap in the histograms.
When comparing ammonia oxidizers with nitrite oxidizers, the median abundance of ammonia oxidizers of 1.34×10⁶ copies L−1 is approximately 2 orders of magnitude higher than the median nitrite oxidizer of 2.14×10⁴ copies L−1. The difference in their abundance has been predicted by the relative biomass yields and cell quotas (Zakem et al., 2018, 2022) and alternatively is explained by the difference in the mortality or loss rates between AOA and Nitrospina (Kitzinger et al., 2020). In addition, there is a positive relationship between the abundance of ammonia oxidizers and nitrite oxidizers (Fig. 27), as previously shown in observations from the Pacific (Santoro et al., 2019), indicating their coexistence under most conditions.
3.6 Environmental controls on nitrification rates and the abundance of nitrifiers
We compared the measured nitrification rates and nitrifier abundance with concurrently measured or available environmental factors including temperature, oxygen, light and N concentration (NH, NO, NO) to assess the environmental controls on nitrification and nitrifiers (Figs. 28–31). We acknowledge that nitrification rates and nitrifier abundance are regulated by multiple environmental factors, which may not be revealed by the simple correlation analysis with individual factors. The new database will facilitate more sophisticated future analyses.
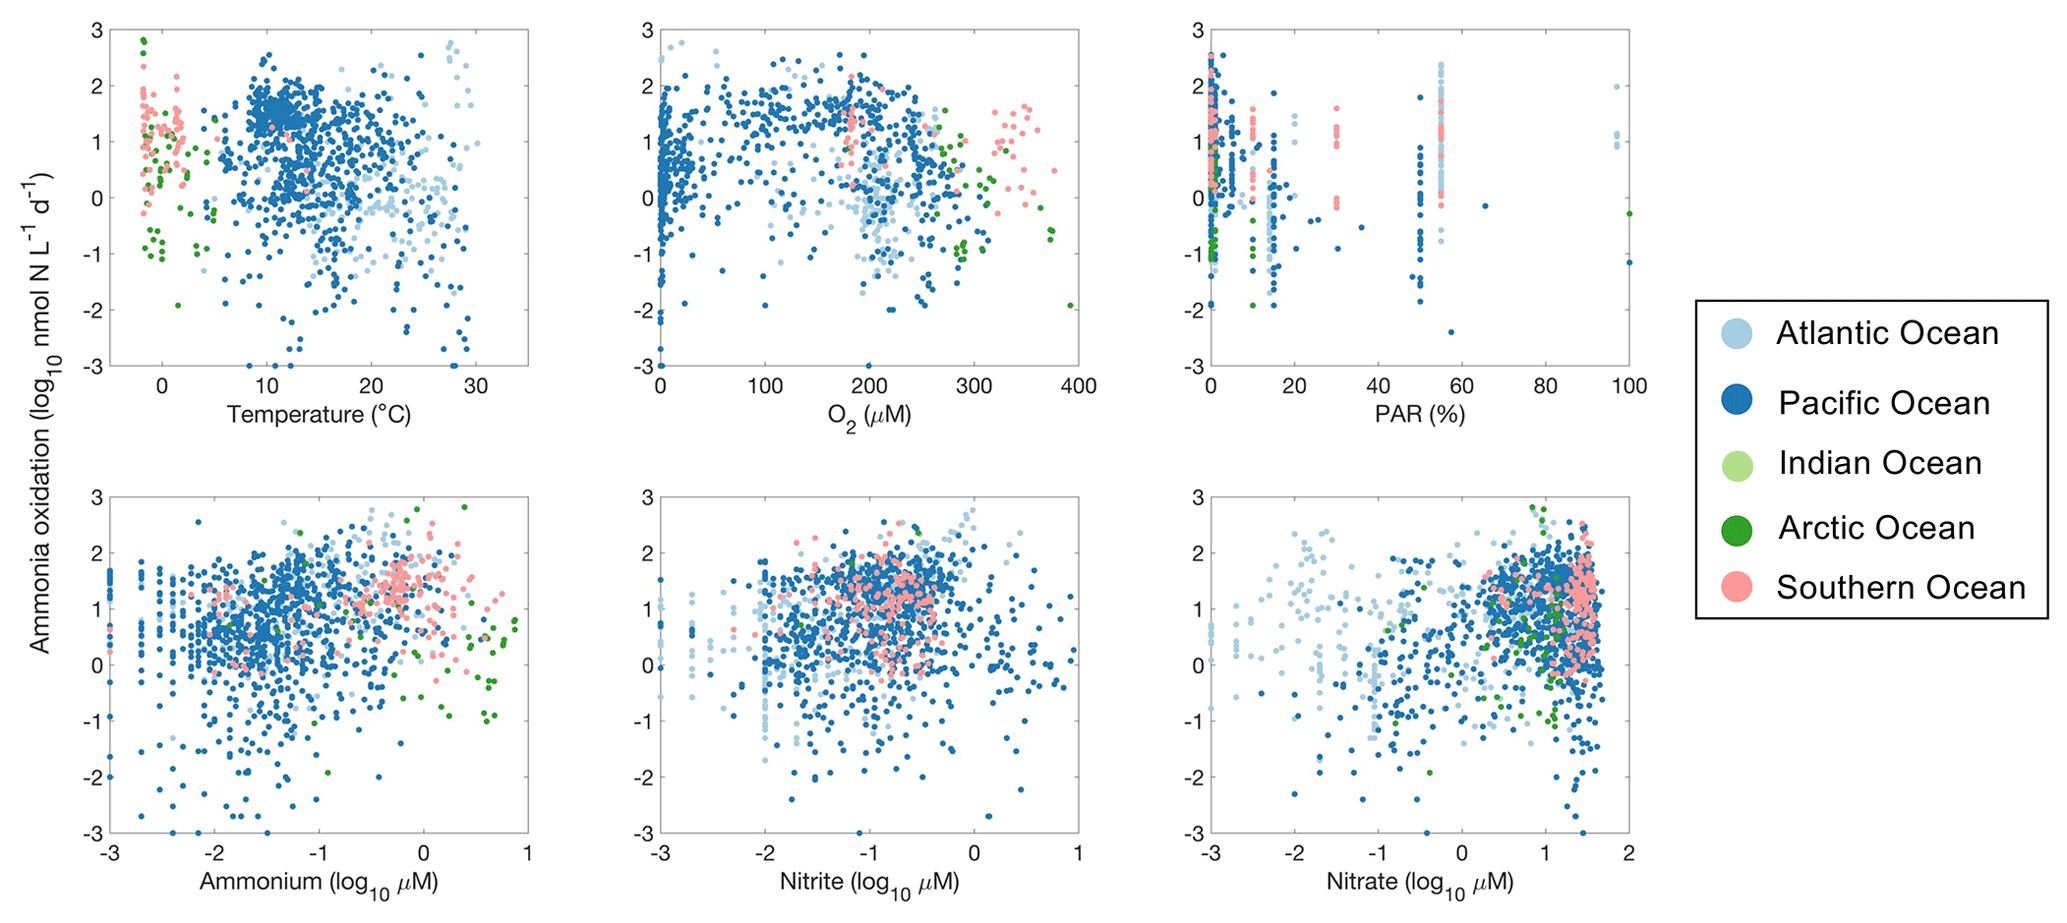
Figure 28Relationship between ammonia oxidation rates and environmental factors observed in different ocean basins.
Ammonia oxidation rates showed a weak negative correlation with temperature (, p<0.01; Fig. 28). Some of the high rates are found below 0 ∘C and at around 10 and 25 ∘C. Temperature manipulation experiments showed the varying temperature sensitivity of ammonia oxidation in different regions or among natural assemblages (Baer et al., 2014; Horak et al., 2018; Zheng et al., 2020). The highest ammonia oxidation rates were found in the oxygen range between 100 and 200 µM (p>0.01). However, ammonia oxidation has also been detected in low-oxygen waters (e.g., <10 µM) in the oxygen-minimum zones (Bristow et al., 2016a; Peng et al., 2015), reflecting the high affinity of ammonia oxidizers for oxygen. Oxygen production by ammonia-oxidizing archaea may support their presence and activity in the oxygen-minimum zones (Kraft et al., 2022). Ammonia oxidation generally decreases at relatively high light intensity (PAR % relative to surface PAR) due to light inhibition and substrate competition with phytoplankton (but the negative slope is not significant, p>0.01). Nevertheless, high ammonia oxidation rates have been measured in the euphotic zone at 55 % PAR in the Atlantic Ocean (Clark et al., 2008; Clark et al., unpublished). Although light manipulation experiments have shown clear light inhibition of the nitrification rate at specific locations (e.g., Xu et al., 2019; Shiozaki et al., 2019), the relationship between nitrification and light intensity is ambiguous at the global scale, which may be related to the compounding factors on nitrification. For example, the co-varying ammonium availability would complicate the impact of change in light intensity. Ammonia oxidation increases with N nutrient concentration (p<0.01). NH is the substrate, while NO is the product of ammonia oxidation. The Michaelis–Menten-like kinetics of ammonia oxidation rate have been observed in various ocean regions (Frey et al., 2022; Newell et al., 2013; Horak et al., 2013; Xu et al., 2019; Zhang et al., 2020; Mdutyana et al., 2022a, b). High concentrations of NH and NO likely reflect intense recycling of organic matter and remineralization. The presence of high NO concentration may relieve the competition between ammonia oxidizers and phytoplankton for NH, therefore leading to high ammonia oxidation rates (Wan et al., 2018). In addition, recent studies have shown that AOA have a high requirement for iron and copper, which may affect the distribution of nitrification in the ocean (Shafiee et al., 2019, 2021).
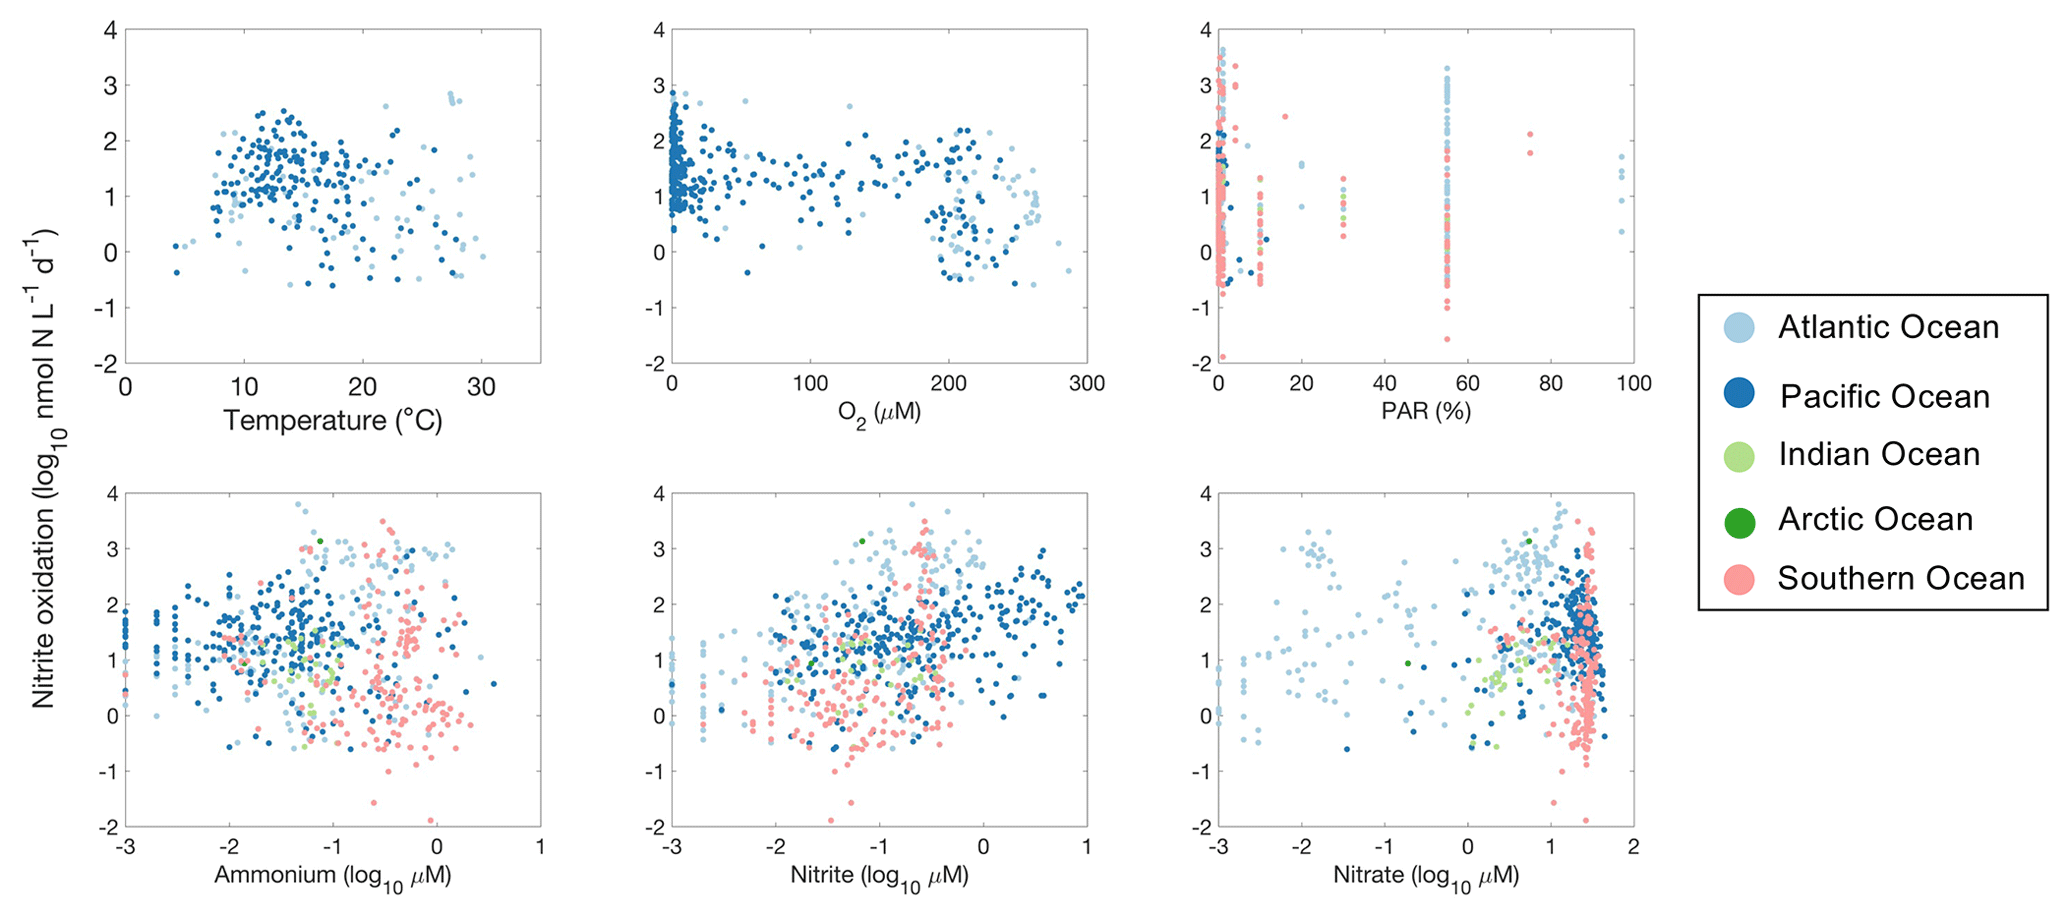
Figure 29Relationships between nitrite oxidation rates and environmental factors observed in different ocean basins.
High nitrite oxidation rates are found between 10 and 20 ∘C (Fig. 29). Surprisingly, some of the highest nitrite oxidation rates were measured in the oxygen-minimum zones even with oxygen levels below detection limits (Füssel et al., 2012; Ward et al., 1989b; Sun et al., 2017, 2021). Nitrite oxidation in anoxic waters has been observed to be inhibited (Sun et al., 2017) or stimulated (Bristow et al., 2016a) by the addition of oxygen. The mechanisms for apparently anaerobic nitrite oxidation remain to be determined (Sun et al., 2023). Similarly to ammonia oxidation, nitrite oxidation is often reported to be inhibited by high light levels, but the relationship is not statistically significant across the database (p>0.01; Fig. 29), partly due to the presence of high nitrite oxidation rates in the euphotic zone (e.g., Clark et al., 2016). High nitrite oxidation rates are observed in regions with high NO concentrations (r=0.23, p<0.01). For example, the highest nitrite oxidation rates were observed at NO concentrations near 0.5 µM (Fig. 29).
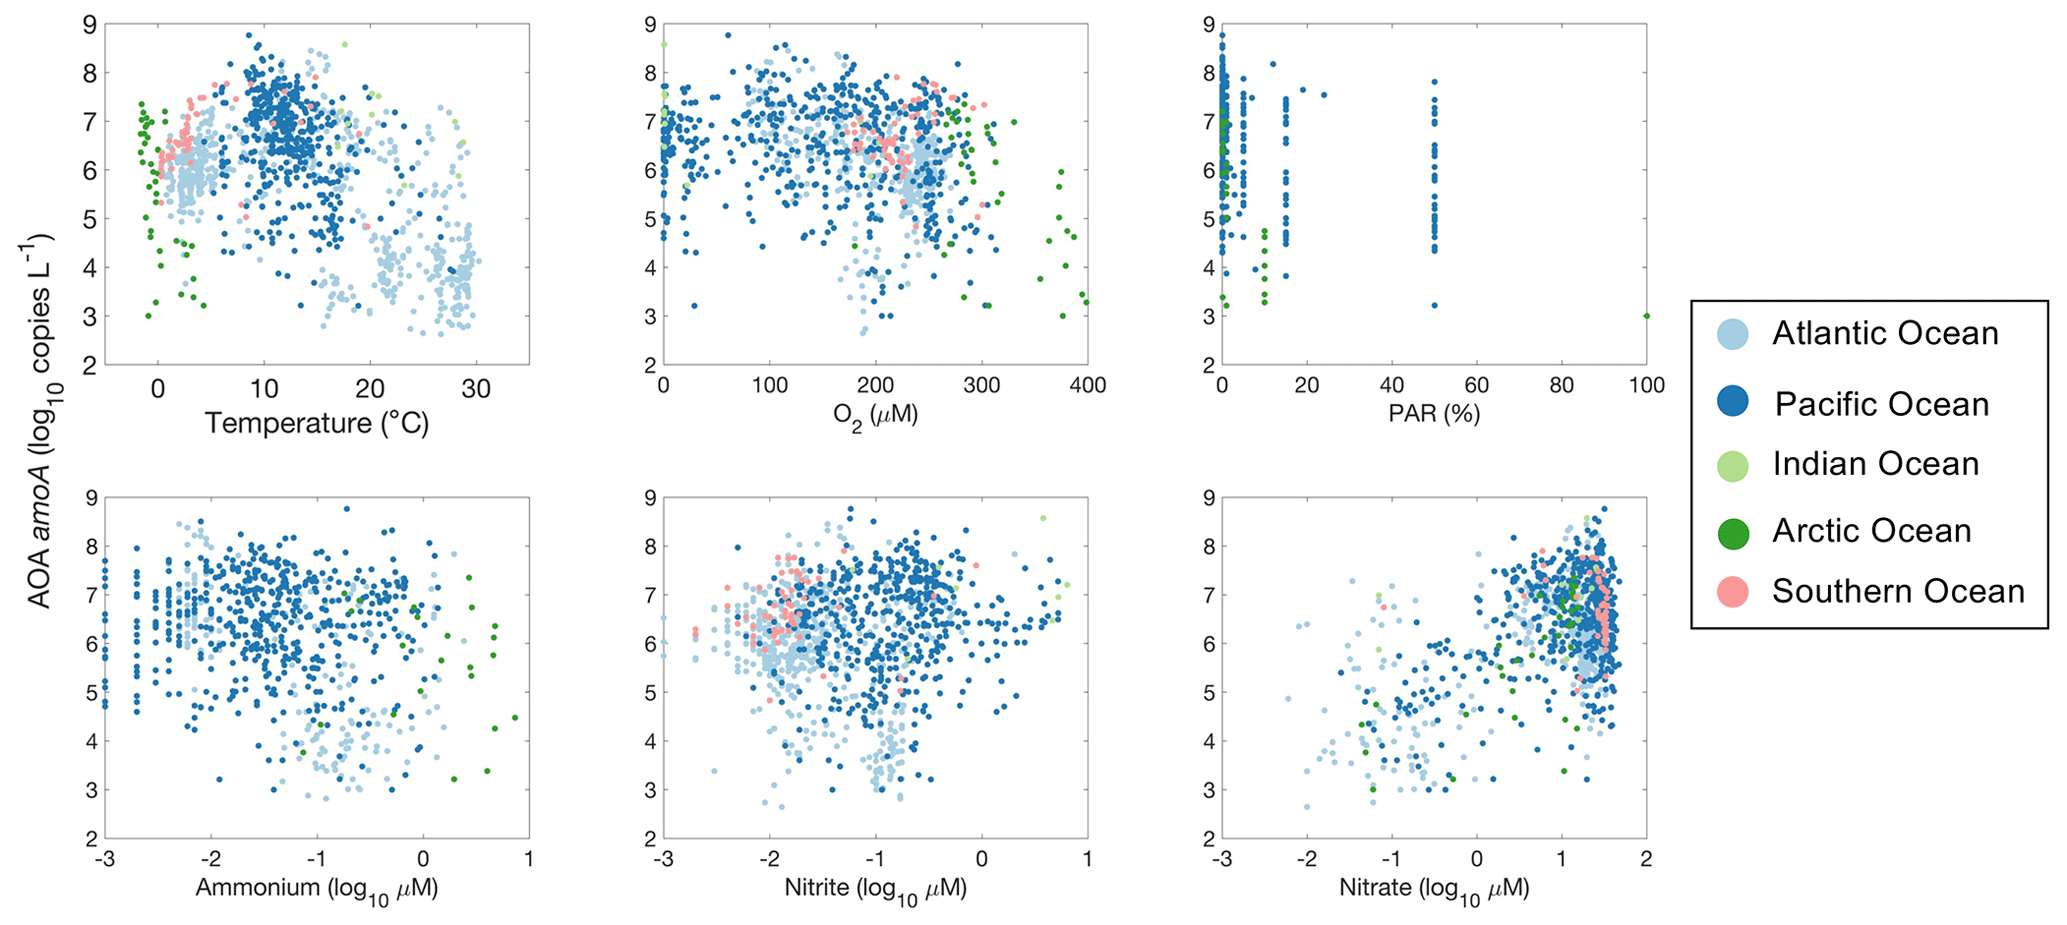
Figure 30Relationship between archaeal amoA gene abundance and environmental factors observed in different ocean basins.
We use amoA gene abundance to represent the abundance of ammonia oxidizers with the caveat that the number of gene copies may not equal the cell numbers. Ammonia oxidizers are adapted to a wide range of environmental conditions (Fig. 30). Their abundance reaches a maximum at around 10 ∘C. Ammonia oxidizers are also present in low-oxygen waters and the euphotic zone with slightly lower abundance. Interestingly, ammonia oxidizers show relatively constant abundance across the NH concentration gradient, while ammonia oxidation rates are low under low NH concentrations (e.g., <0.01 µM). A large portion of the amoA observations were conducted in the deep ocean, where the nitrate concentration was above 10 µM. Some of the highest amoA abundances were found in these NO-enriched waters.
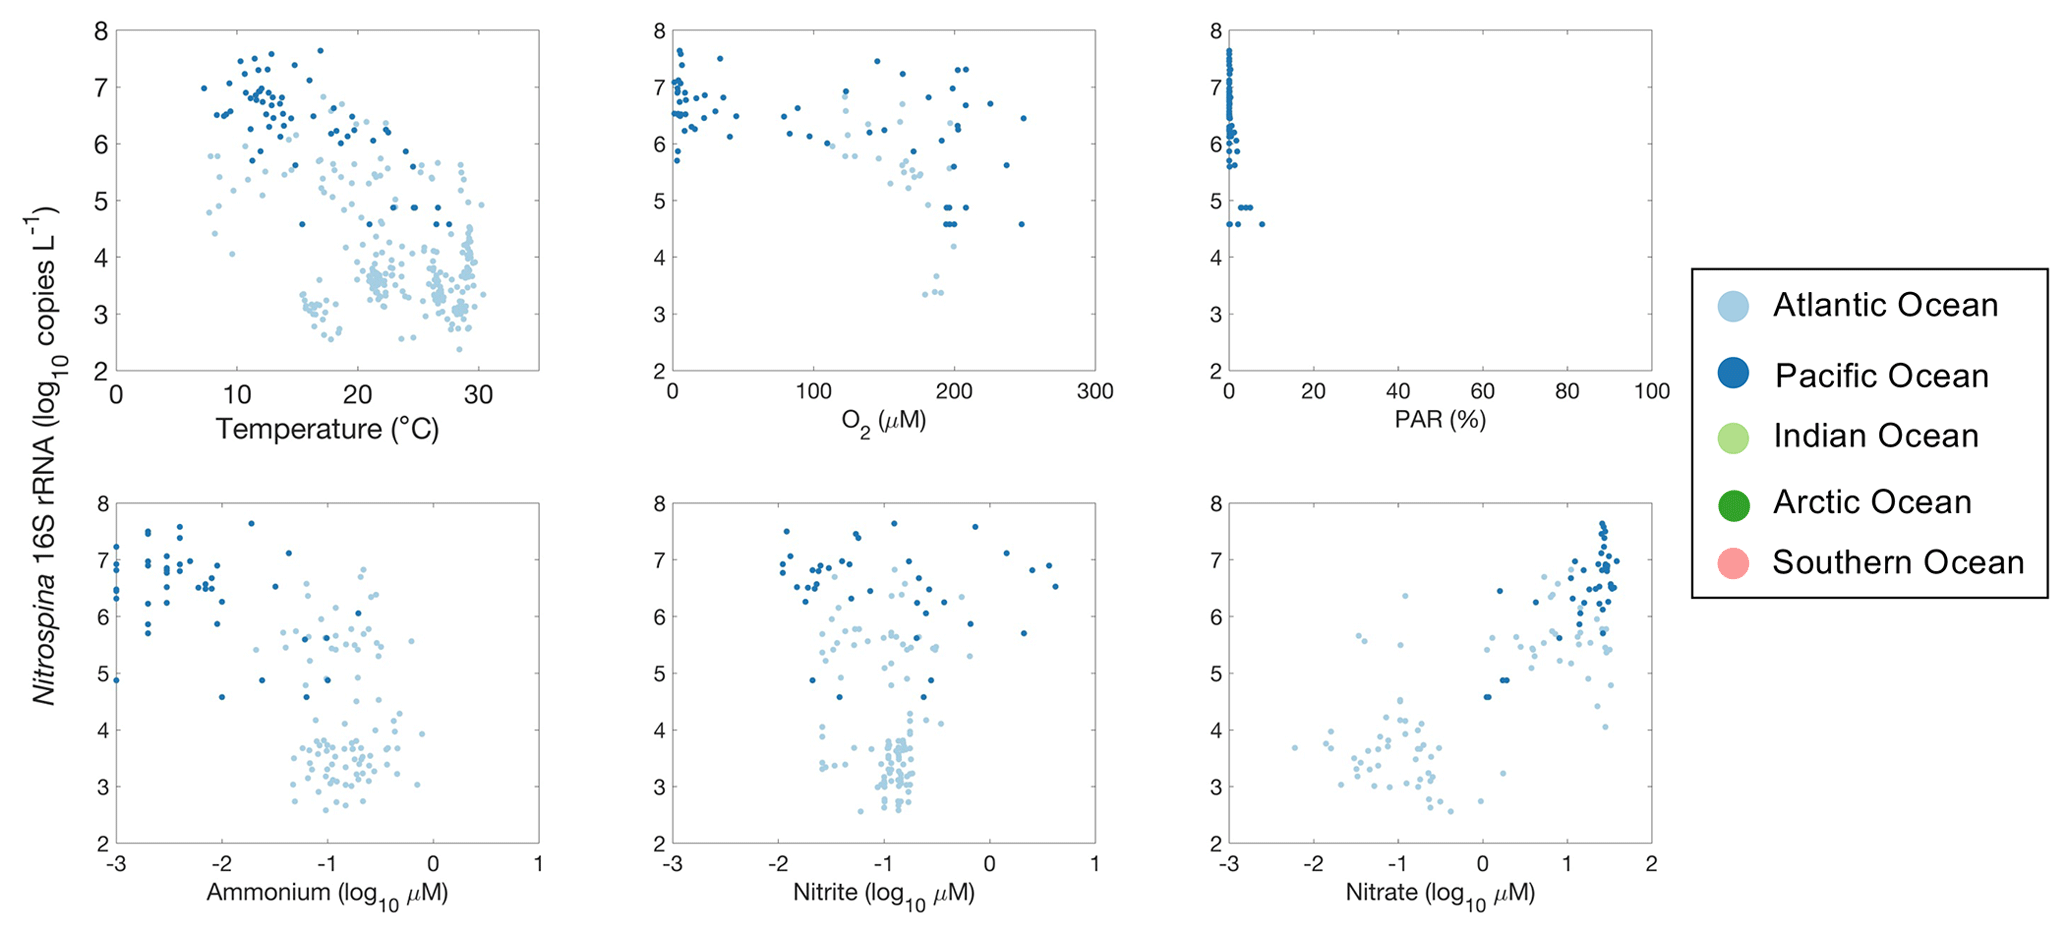
Figure 31Relationships between Nitrospina 16S rRNA gene abundance and environmental factors observed in different ocean basins.
It is difficult to evaluate the relationship between nitrite oxidizers and environmental factors due to the limited number of observations (Fig. 31). Nevertheless, one interesting pattern is the presence of high Nitrospina abundance in oxygen-depleted waters. The nitrite oxidizers present in the oxygen-depleted waters are distinct from those found in oxygenated waters or currently cultivated strains (Sun et al., 2019, 2021). Similarly to amoA abundance, Nitrospina 16S rRNA gene abundance also increased with NO concentration.
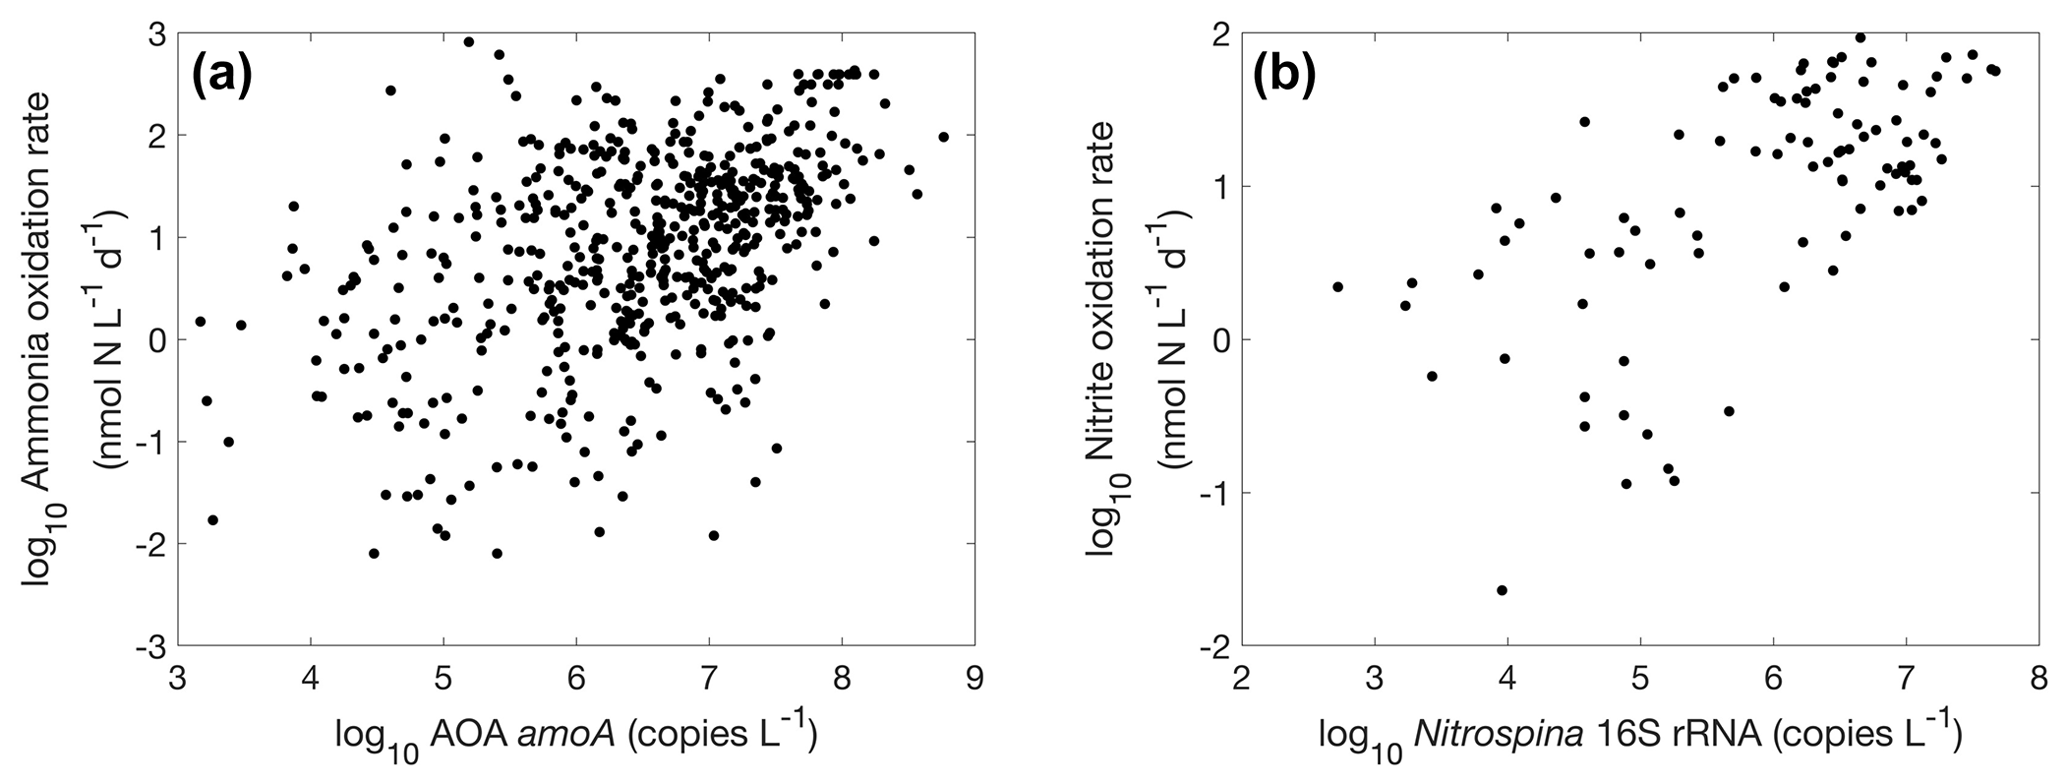
Figure 32Relationships between nitrifier abundance and nitrification rate. (a) Ammonia oxidation vs. AOA amoA gene abundance (, r=0.46, p<0.01); (b) nitrite oxidation vs. Nitrospina 16S rRNA gene abundance (, r=0.65, p<0.01).
There is a positive correlation between AOA amoA gene abundance and ammonia oxidation rates (r=0.46, p<0.01) and between Nitrospina 16S rRNA abundance and nitrite oxidation rate (r=0.65, p<0.01) (Fig. 32), even though the correlation is weak. This lack of a strong relationship has also been found in regional studies (Tolar et al., 2020), which may be caused by the perturbation of the microbial community during rate measurement incubations. Furthermore, the addition of nitrogen substrate during rate measurement incubations may stimulate the growth of nitrifiers and the subsequently measured nitrification rate. Overall, using functional gene abundances to predict their functional activity needs to be conducted with caution since the presence of genes only reflects the functional potentials.
This database will be useful for a broad scientific community that is interested in marine biogeochemistry and marine microbial ecology. Potential applications include but are not limited to the following: (1) we can compare future measurements of nitrification rates or nitrifier abundance in a specific region to previous measurements conducted in the same regions and contextualize new measurements at the global scale. (2) We can conduct meta-analysis of environmental controls on the distribution of nitrification and nitrifier abundance at regional and global scales. The simple correlation analyses provided here only considered individual environmental drivers separately while other drivers are changing simultaneously. Analysis with environmental assemblages could complement laboratory culture experiments. (3) It will help to validate and improve model parametrization of nitrification and nitrifiers. For example, ammonia oxidation has been modeled as a function of substrate concentration and specific ammonia oxidation rate (Yool et al., 2007). However, nitrification has been found to be regulated by temperature, oxygen, light and many other environmental factors that are not considered in that model. A better representation of nitrification in ocean biogeochemical models could help to constrain the estimates of marine new production, N2O production and many other key processes. (4) It will help guide future nitrification studies, e.g., conducting measurements in poorly sampled regions or seasons.
Based on the historical measurements of nitrification and nitrifiers, we provide recommendations for future research below.
-
Method standardization is useful for comparison among studies. Nitrification has been mostly measured by 15N substrate tracer addition and product dilution methods. The 15N product dilution method tends to yield higher rates relative to the 15N substrate tracer addition method (Fig. 1). This is perhaps to be expected since the 15N product dilution method measures all the NO production pathways, including ammonia oxidation (and organic N oxidation) and nitrate reduction, instead of only NO production from ammonia oxidation, as is measured by the 15NH tracer addition method. Comparison between different methods should be conducted to resolve the difference or even correct some of the previous measurements.
Additionally, the amount of tracer added should be recorded and reported because the increased substrate concentration may enhance nitrification rate. Therefore, the measured rates should be interpreted as potential rates rather than in situ rates when the amount of tracer addition is large compared to the ambient substrate concentration. If possible, substrate kinetic experiments should be conducted for in situ rate calibration (e.g., Wan et al., 2018; Mdutyana et al., 2022a, b).
The measured product of ammonia oxidation should also be reported (e.g., either only NO or NO NO). When the ambient NO concentration is low, the 15NO produced from the 15NH tracer may be further oxidized to 15NO. Thus, nitrification may be underestimated if only NO is measured. Alternatively, the NO carrier may be added into the incubation to trap the produced 15NO. In addition to only measuring ammonia oxidation, more observations of nitrite oxidation are desirable to evaluate mechanisms controlling the coupling or decoupling of the two steps of nitrification.
Furthermore, measurements with at least three time points are preferred during the incubation time courses in order to examine whether the rate has changed during the incubation period. Depending on the incubation period, nitrification rates are reported as either nanomoles nitrogen per liter per day (nmol N L−1 d−1) or nanomoles nitrogen per liter per hour (nmol N L−1 h−1). A conversion factor (e.g., 12 or 24 h) is required to obtain the same unit. The choice of the conversion factor may be critical if there is a diel cycle of nitrification rate, e.g., in the euphotic zone where light or solar radiation varies diurnally (Wan et al., 2021). Therefore, incubation conducted under both light and dark conditions may be preferable to obtain the daily nitrification rates. The detection limit of rate measurements should also be estimated and reported (Santoro et al., 2013) instead of presenting rates that are below the detection limit as zero.
For in situ rate measurements, incubations should mimic the in situ environmental conditions as closely as possible, e.g., using light filters to simulate in situ light or solar radiation intensity and quality or using a temperature-controlled incubator to simulate the in situ temperature. Particularly for samples collected in the oxygen-minimum zones, oxygen concentration in the incubation containers should be measured or monitored throughout the incubation because oxygen contamination is common during the sampling process (Garcia-Robledo et al., 2021). Samples collected from the anoxic layer of the oxygen-minimum zones need to be purged with helium or nitrogen gas to remove any oxygen contamination before incubation.
-
Various primers have been designed to target ammonia oxidizers. However, current primers miss the Nitrosopumilus-like amoA (Tolar et al., 2013; Hiraoka et al., 2023), and this group accounts for a large fraction of the AOA based on 16S rRNA sequencing (Tolar et al., 2020). New primers or techniques need to be developed to cover the diverse groups of ammonia oxidizers. In addition, the quantification of nitrite oxidizers is limited. Developing primers for nxr genes may be useful to untangle the relative contribution of different nitrite oxidizers particularly for the unique ones found in the oxygen-minimum zones. The report of qPCR assay should follow the MIQE guidelines (Bustin et al., 2009), including the amplification conditions, amplification efficiency, detection limit and other parameters. Alternatively, the abundance of nitrifiers may be determined with quantitative metagenomics (Lin et al., 2019; Satinsky et al., 2013). In comparison to the gene presence, gene expression and protein synthesis may be better linked to the activity of nitrifiers (Tolar et al., 2016; Frey et al., 2022; Saito et al., 2020), deserving more observations.
-
Future observations should target regions that have been poorly sampled and regions that are experiencing or are expected to experience dramatic changes. For example, the Indian Ocean has the lowest number of observations of nitrification and nitrifiers. With regards to change, oxygen-minimum zones are projected to change under future climate (Breitburg et al., 2018; Busecke et al., 2022). Polar oceans (Arctic Ocean and Southern Ocean) are experiencing warming, ice melt (which affects light or solar radiation availability) and ocean acidification (Meredith et al., 2019). Upward nutrient supply into the subtropical gyres may be affected due to enhanced stratification (Li et al., 2020). How nitrification will respond to these changes deserves further exploration.
Time series studies, observations across a large-scale transect, and observations at a mesoscale or submesoscale would be desirable for investigating the temporal and spatial variation of nitrification rates and nitrifier abundances. When possible, both nitrification rates and nitrifier abundance should be measured at the same locations. While this approach incurs logistical and financial complications in requiring collaborations among laboratories with different expertise, the benefit to comprehensive process description is manifold.
-
Incubation conditions (mentioned in point 1) and ambient environmental conditions associated with rate measurements or gene quantification should be recorded and reported (e.g., temperature, light, substrate concentration, oxygen). This information would be helpful for comparison among different studies and future meta-analyses of environmental controls on nitrification and nitrifiers. For example, light or solar radiation should be reported as both absolute light or solar radiation intensity and relative light or solar radiation intensity in relation to the surface ocean. Analysis of trace metals like iron and copper concentration will be useful to assess their impact on nitrification. Standard notation should be used to denote measurements below detection limit or measurements not conducted, e.g., BDL for below detection limit, NM for not measured, and empty or NA for data not available. A data compilation template is provided for anyone who is interested in contributing to the database with new datasets or datasets currently not included in the database. We encourage the scientific community to contact us with suggestions to improve the database and to contribute to the database.
Data described in this paper can be accessed at the Zenodo repository under the following data DOI: https://doi.org/10.5281/zenodo.8355912 (Tang et al., 2023).
We present a newly compiled database of nitrification rate and nitrifier abundance measurements in the global ocean. This database sheds light on the spatial and temporal patterns of nitrification and nitrifiers even though the spatial and temporal coverages remain limited. In recent years, observations have expanded into oxygen-minimum zones and polar oceans, while the Indian Ocean and Pacific Basin remain poorly sampled, especially with regard to nitrite oxidation and nitrite oxidizers. This database can be applied to assess the environmental controls on nitrification at regional and global scales, to validate and develop biogeochemical models, to guide future observational efforts, and to better constrain the distribution of nitrification and assess its impact on the marine ecosystem and climate. This database has been deposited into the Zenodo repository and can be updated with new datasets.
WT and BBW designed the study with input from FP and CS. WT compiled the database with data contributions from the co-authors, and WT analyzed the database. WT and BBW wrote the paper with contributions from the co-authors.
The contact author has declared that none of the authors has any competing interests.
Publisher’s note: Copernicus Publications remains neutral with regard to jurisdictional claims made in the text, published maps, institutional affiliations, or any other geographical representation in this paper. While Copernicus Publications makes every effort to include appropriate place names, the final responsibility lies with the authors.
We want to thank all the authors who have kindly shared data for this community effort. Weiyi Tang, Bess Ward, Fabien Paulot and Charles Stock are funded by the Cooperative Institute for Modeling the Earth System (CIMES). Gerhard J. Herndl is funded by the Austrian Science Fund (FWF) project DEPOCA (grant no. P 35587-B).
This research has been supported by Cooperative Institute for Modeling the Earth System (CIMES) and by the Austrian Science Fund project DEPOCA (grant no. P 35587-B).
This paper was edited by Xingchen (Tony) Wang and reviewed by Scott Wankel and two anonymous referees.
Agogue, H., Brink, M., Dinasquet, J., and Herndl, G. J.: Major gradients in putatively nitrifying and non-nitrifying Archaea in the deep North Atlantic, Nature, 456, 788–791, https://doi.org/10.1038/nature07535, 2008.
Alonso-Saez, L., Waller, A. S., Mende, D. R., Bakker, K., Farnelid, H., Yager, P. L., Lovejoy, C., Tremblay, J. E., Potvin, M., Heinrich, F., Estrada, M., Riemann, L., Bork, P., Pedros-Alio, C., and Bertilsson, S.: Role for urea in nitrification by polar marine Archaea, P. Natl. Acad. Sci. USA, 109, 17989–17994, https://doi.org/10.1073/pnas.1201914109, 2012.
Alves, R. J. E., Minh, B. Q., Urich, T., von Haeseler, A., and Schleper, C.: Unifying the global phylogeny and environmental distribution of ammonia-oxidising archaea based on amoA genes, Nat. Commun., 9, 1517, https://doi.org/10.1038/s41467-018-03861-1, 2018.
Babbin, A. R., Peters, B. D., Mordy, C. W., Widner, B., Casciotti, K. L., and Ward, B. B.: Multiple metabolisms constrain the anaerobic nitrite budget in the Eastern Tropical South Pacific, Global Biogeochem. Cy., 31, 258–271, https://doi.org/10.1002/2016GB005407, 2017.
Babbin, A. R., Buchwald, C., Morel, F. M. M., Wankel, S. D., and Ward, B. B.: Nitrite oxidation exceeds reduction and fixed nitrogen loss in anoxic Pacific waters, Mar. Chem., 224, 103814, https://doi.org/10.1016/j.marchem.2020.103814, 2020.
Baer, S. E., Connelly, T. L., Sipler, R. E., Yager, P. L., and Bronk, D. A.: Effect of temperature on rates of ammonium uptake and nitrification in the western coastal Arctic during winter, spring, and summer, Global Biogeochem. Cy., 28, 1455–1466, 2014.
Baer, S. E., Sipler, R. E., Roberts, Q. N., Yager, P. L., Frischer, M. E., and Bronk, D. A.: Seasonal nitrogen uptake and regeneration in the western coastal Arctic, Limnol. Oceanogr., 62, 2463–2479, https://doi.org/10.1002/lno.10580, 2017.
Bayer, B., McBeain, K., Carlson, C. A., and Santoro, A. E.: Carbon content, carbon fixation yield and dissolved organic carbon release from diverse marine nitrifiers, Limnol. Oceanogr., 68, 84–96, https://doi.org/10.1002/lno.12252, 2022.
Beman, J., Popp, B. N., and Alford, S. E.: Quantification of ammonia oxidation rates and ammonia-oxidizing archaea and bacteria at high resolution in the Gulf of California and eastern tropical North Pacific Ocean, Limnol. Oceanogr., 57, 711–726, https://doi.org/10.4319/lo.2012.57.3.0711, 2012.
Beman, J. M., Popp, B. N., and Francis, C. A.: Molecular and biogeochemical evidence for ammonia oxidation by marine Crenarchaeota in the Gulf of California, ISME J., 2, 429–441, https://doi.org/10.1038/ismej.2007.118, 2008.
Beman, J. M., Chow, C., King, A. L., Feng, Y. Y., Furhman, J. A., Andersson, A., Bates, N. R., Popp, B., and Hutchins, D. A.: Global declines in oceanic nitrification rates as a consequence of ocean acidification, P. Natl. Acad. Sci. USA, 108, 208–213, 2011.
Beman, J. M., Leilei Shih, J., and Popp, B. N.: Nitrite oxidation in the upper water column and oxygen minimum zone of the eastern tropical North Pacific Ocean, ISME J., 7, 2192–2205, https://doi.org/10.1038/ismej.2013.96, 2013.
Beman, J. M., Vargas, S. M., Wilson, J. M., Perez-Coronel, E., Karolewski, J. S., Vazquez, S., Yu, A., Cairo, A. E., White, M. E., Koester, I., and Aluwihare, L. I.: Substantial oxygen consumption by aerobic nitrite oxidation in oceanic oxygen minimum zones, Nat. Commun., 12, 7043, https://doi.org/10.1038/s41467-021-27381-7, 2021.
Berthelot, H., Duhamel, S., L'Helguen, S., Maguer, J.-F., Wang, S., Cetinić, I., and Cassar, N.: NanoSIMS single cell analyses reveal the contrasting nitrogen sources for small phytoplankton, ISME J., 13, 651–662, https://doi.org/10.1038/s41396-018-0285-8, 2018.
Bianchi, M., Feliatra, F., Tréguer, P., Vincendeau, M.-A., and Morvan, J.: Nitrification rates, ammonium and nitrate distribution in upper layers of the water column and in sediments of the Indian sector of the Southern Ocean, Deep-Sea Res. Pt. II, 44, 1017–1032, https://doi.org/10.1016/S0967-0645(96)00109-9, 1997.
Breider, F., Yoshikawa, C., Makabe, A., Toyoda, S., Wakita, M., Matsui, Y., Kawagucci, S., Fujiki, T., Harada, N., and Yoshida, N.: Response of N2O production rate to ocean acidification in the western North Pacific, Nat. Clim. Change, 9, 954–958, https://doi.org/10.1038/s41558-019-0605-7, 2019.
Breitburg, D., Levin, L. A., Oschlies, A., Grégoire, M., Chavez, F. P., Conley, D. J., Garçon, V., Gilbert, D., Gutiérrez, D., Isensee, K., Jacinto, G. S., Limburg, K. E., Montes, I., Naqvi, S. W. A., Pitcher, G. C., Rabalais, N. N., Roman, M. R., Rose, K. A., Seibel, B. A., Telszewski, M., Yasuhara, M., and Zhang, J.: Declining oxygen in the global ocean and coastal waters, Science, 359, eaam7240, https://doi.org/10.1126/science.aam7240, 2018.
Bristow, L. A., Sarode, N., Cartee, J., Caro-Quintero, A., Thamdrup, B., and Stewart, F. J.: Biogeochemical and metagenomic analysis of nitrite accumulation in the Gulf of Mexico hypoxic zone, Limnol. Oceanogr., 60, 1733–1750, https://doi.org/10.1002/lno.10130, 2015.
Bristow, L. A., Dalsgaard, T., Tiano, L., Mills, D. B., Bertagnolli, A. D., Wright, J. J., Hallam, S. J., Ulloa, O., Canfield, D. E., Revsbech, N. P., and Thamdrup, B.: Ammonium and nitrite oxidation at nanomolar oxygen concentrations in oxygen minimum zone waters, P. Natl. Acad. Sci. USA, 113, 10601–10606, https://doi.org/10.1073/pnas.1600359113, 2016a.
Bristow, L. A., Callbeck, C. M., Larsen, M., Altabet, M. A., Dekaezemacker, J., Forth, M., Gauns, M., Glud, R. N., Kuypers, M. M. M., Lavik, G., Milucka, J., Naqvi, S. W. A., Pratihary, A., Revsbech, N. P., Thamdrup, B., Treusch, A. H., and Canfield, D. E.: N2 production rates limited by nitrite availability in the Bay of Bengal oxygen minimum zone, Nat. Geosci., 10, 24–29, https://doi.org/10.1038/ngeo2847, 2016b.
Buchanan, P. J., Sun, X., Weissman, J., and Zakem, E.: Oxygen intrusions sustain aerobic nitrite oxidation in anoxic marine zones, bioRxiv, https://doi.org/10.1101/2023.02.22.529547, 2023.
Buitenhuis, E. T., Vogt, M., Moriarty, R., Bednaršek, N., Doney, S. C., Leblanc, K., Le Quéré, C., Luo, Y.-W., O'Brien, C., O'Brien, T., Peloquin, J., Schiebel, R., and Swan, C.: MAREDAT: towards a world atlas of MARine Ecosystem DATa, Earth Syst. Sci. Data, 5, 227–239, https://doi.org/10.5194/essd-5-227-2013, 2013.
Busecke, J. J., Resplandy, L., Ditkovsky, S. J., and John, J. G.: Diverging fates of the Pacific Ocean oxygen minimum zone and its core in a warming world, AGU Advances, 3, e2021AV000470, https://doi.org/10.1029/2021AV000470, 2022.
Bustin, S. A., Benes, V., Garson, J. A., Hellemans, J., Huggett, J., Kubista, M., Mueller, R., Nolan, T., Pfaffl, M. W., Shipley, G. L., Vandesompele, J., and Wittwer, C. T.: The MIQE guidelines: minimum information for publication of quantitative real-time PCR experiments, Clin. Chem., 55, 611–622, https://doi.org/10.1373/clinchem.2008.112797, 2009.
Cavagna, A. J., Fripiat, F., Elskens, M., Mangion, P., Chirurgien, L., Closset, I., Lasbleiz, M., Florez-Leiva, L., Cardinal, D., Leblanc, K., Fernandez, C., Lefèvre, D., Oriol, L., Blain, S., Quéguiner, B., and Dehairs, F.: Production regime and associated N cycling in the vicinity of Kerguelen Island, Southern Ocean, Biogeosciences, 12, 6515–6528, https://doi.org/10.5194/bg-12-6515-2015, 2015.
Clark, D. R., Rees, A. P., and Joint, I.: A method for the determination of nitrification rates in oligotrophic marine seawater by gas chromatography/mass spectrometry, Mar. Chem., 103, 84–96, https://doi.org/10.1016/j.marchem.2006.06.005, 2007.
Clark, D. R., Rees, A. P., and Joint, I.: Ammonium regeneration and nitrification rates in the oligotrophic Atlantic Ocean: Implications for new production estimates, Limnol. Oceanogr., 53, 52–62, https://doi.org/10.4319/lo.2008.53.1.0052, 2008.
Clark, D. R., Miller, P. I., Malcolm, E., Woodward, S., and Rees, A. P.: Inorganic nitrogen assimilation and regeneration in the coastal upwelling region of the Iberian Peninsula, Limnol. Oceanogr., 56, 1689–1702, https://doi.org/10.4319/lo.2011.56.5.1689, 2011.
Clark, D. R., Brown, I. J., Rees, A. P., Somerfield, P. J., and Miller, P. I.: The influence of ocean acidification on nitrogen regeneration and nitrous oxide production in the northwest European shelf sea, Biogeosciences, 11, 4985–5005, https://doi.org/10.5194/bg-11-4985-2014, 2014.
Clark, D. R., Widdicombe, C. E., Rees, A. P., and Woodward, E. M. S.: The significance of nitrogen regeneration for new production within a filament of the Mauritanian upwelling system, Biogeosciences, 13, 2873–2888, https://doi.org/10.5194/bg-13-2873-2016, 2016.
Clark, D. R., Rees, A. P., Ferrera, C. M., Al-Moosawi, L., Somerfield, P. J., Harris, C., Quartly, G. D., Goult, S., Tarran, G., and Lessin, G.: Nitrite regeneration in the oligotrophic Atlantic Ocean, Biogeosciences, 19, 1355–1376, https://doi.org/10.5194/bg-19-1355-2022, 2022.
Daims, H., Lebedeva, E. V., Pjevac, P., Han, P., Herbold, C., Albertsen, M., Jehmlich, N., Palatinszky, M., Vierheilig, J., Bulaev, A., Kirkegaard, R. H., von Bergen, M., Rattei, T., Bendinger, B., Nielsen, P. H., and Wagner, M.: Complete nitrification by Nitrospira bacteria, Nature, 528, 504–509, https://doi.org/10.1038/nature16461, 2015.
Daims, H., Lucker, S., and Wagner, M.: A New Perspective on Microbes Formerly Known as Nitrite-Oxidizing Bacteria, Trends Microbiol., 24, 699–712, https://doi.org/10.1016/j.tim.2016.05.004, 2016.
Dalsgaard, T., Thamdrup, B., Farías, L., and Revsbech, N.P.: Anammox and denitrification in the oxygen minimum zone of the eastern South Pacific, Limnol. Oceanogr., 57, 1331–1346, 2012.
Damashek, J., Tolar, B. B., Liu, Q., Okotie-Oyekan, A. O., Wallsgrove, N. J., Popp, B. N., and Hollibaugh, J. T.: Microbial oxidation of nitrogen supplied as selected organic nitrogen compounds in the South Atlantic Bight, Limnol. Oceanogr., 64, 982–995, https://doi.org/10.1002/lno.11089, 2018.
Diaz, F. and Raimbault, P.: Nitrogen regeneration and dissolved organic nitrogen release during spring in a NW Mediterranean coastal zone (Gulf of Lions): implications for the estimation of new production, Mar. Ecol. Prog. Ser., 197, 51–65, 2000.
Dore, J. E. and Karl, D. M.: Nitrification in the euphotic zone as a source for nitrite, nitrate, and nitrous oxide at Station ALOHA, Limnol. Oceanogr., 41, 1619–1628, https://doi.org/10.4319/lo.1996.41.8.1619, 1996.
Emerson, K., Russo, R. C., Lund, R. E., and Thurston, R. V.: Aqueous ammonia equilibrium calculations – effect of ph and temperature, J. Fish. Res. Board Can., 32, 2379–2383, https://doi.org/10.1139/f75-274, 1975.
Eppley, R. W. and Peterson, B. J.: Particulate organic matter flux and planktonic new production in the deep ocean, Nature, 282, 677–680, 1979.
Falkowski, F. G.: Evolutionof the nitrogen cycle and its influence on biological sequestion of CO2 in the ocean, Nature, 387, 272–285, 1997.
Fawcett, S. E., Lomas, M. W., Casey, J. R., Ward, B. B., and Sigman, D. M.: Assimilation of upwelled nitrate by small eukaryotes in the Sargasso Sea, Nat. Geosci., 4, 717–722, https://doi.org/10.1038/ngeo1265, 2011.
Fernández, C., Farías, L., and Alcaman, M. E.: Primary production and nitrogen regeneration processes in surface waters of the Peruvian upwelling system, Prog. Oceanogr., 83, 159–168, https://doi.org/10.1016/j.pocean.2009.07.010, 2009.
Flynn, R. F., Bornman, T. G., Burger, J. M., Smith, S., Spence, K. A. M., and Fawcett, S. E.: Summertime productivity and carbon export potential in the Weddell Sea, with a focus on the waters adjacent to Larsen C Ice Shelf, Biogeosciences, 18, 6031–6059, https://doi.org/10.5194/bg-18-6031-2021, 2021.
Francis, C. A., Roberts, K. J., Beman, J. M., Santoro, A. E., and Oakley, B. B.: Ubiquity and diversity of ammonia-oxidizing archaea in water columns and sediments of the ocean, P. Natl. Acad. Sci. USA, 102, 14683–14688, https://doi.org/10.1073/pnas.0506625102, 2005.
Freing, A., Wallace, D. W. R., and Bange, H. W.: Global oceanic production of nitrous oxide, Philos. T. Roy. Soc. B, 367, 1245–1255, https://doi.org/10.1098/rstb.2011.0360, 2012.
Frey, C., Bange, H. W., Achterberg, E. P., Jayakumar, A., Löscher, C. R., Arévalo-Martínez, D. L., León-Palmero, E., Sun, M., Sun, X., Xie, R. C., Oleynik, S., and Ward, B. B.: Regulation of nitrous oxide production in low-oxygen waters off the coast of Peru, Biogeosciences, 17, 2263–2287, https://doi.org/10.5194/bg-17-2263-2020, 2020.
Frey, C., Sun, X., Szemberski, L., Casciotti, K. L., Garcia-Robledo, E., Jayakumar, A., Kelly, C. L., Lehmann, M. F., and Ward, B. B.: Kinetics of nitrous oxide production from ammonia oxidation in the Eastern Tropical North Pacific, Limnol. Oceanogr., 68, 424–438, https://doi.org/10.1002/lno.12283, 2022.
Füssel, J., Lam, P., Lavik, G., Jensen, M. M., Holtappels, M., Günter, M., and Kuypers, M. M.: Nitrite oxidation in the Namibian oxygen minimum zone. ISME J., 6, 1200–1209, https://doi.org/10.1038/ismej.2011.178, 2012.
Ganesh, S., Bristow, L. A., Larsen, M., Sarode, N., Thamdrup, B., and Stewart, F. J.: Size-fraction partitioning of community gene transcription and nitrogen metabolism in a marine oxygen minimum zone, ISME J., 9, 2682–2696, https://doi.org/10.1038/ismej.2015.44, 2015.
Garcia, H. E., Weathers, K. W., Paver, C. R., Smolyar, I., Boyer, T. P., Locarnini, M. M., Zweng, M. M., Mishonov, A. V., Baranova, O. K., Seidov, D., and Reagan, J. R.: World Ocean Atlas 2018. Vol. 4: Dissolved inorganic nutrients (phosphate, nitrate and nitrate+ nitrite, silicate), https://www.ncei.noaa.gov/sites/default/files/2022-06/woa18_vol4.pdf (last access: 14 November 2023), 2019.
Garcia-Robledo, E., Paulmier, A., Borisov, S. M., and Revsbech, N. P.: Sampling in low oxygen aquatic environments: The deviation from anoxic conditions, Limnol. Oceanogr.-Methods, 19, 733–740, https://doi.org/10.1002/lom3.10457, 2021.
Glover, D. M., Jenkins, W. J., and Doney, S. C.: Modeling methods for marine science, Cambridge University Press, https://doi.org/10.1017/CBO9780511975721, 2011.
Graham, D. W., Knapp, C. W., Van Vleck, E. S., Bloor, K., Lane, T. B., and Graham, C. E.: Experimental demonstration of chaotic instability in biological nitrification, ISME J., 1, 385–393, https://doi.org/10.1038/ismej.2007.45, 2007.
Granger, J. and Sigman, D. M.: Removal of nitrite with sulfamic acid for nitrate N and O isotope analysis with the denitrifier method, Rapid Commun. Mass Spectrom., 23, 3753–3762, https://doi.org/10.1002/rcm.4307, 2009.
Grundle, D. S., Juniper, S. K., and Giesbrecht, K. E.: Euphotic zone nitrification in the NE subarctic Pacific: Implications for measurements of new production, Mar. Chem., 155, 113–123, https://doi.org/10.1016/j.marchem.2013.06.004, 2013.
Hiraoka, S., Ijichi, M., Takeshima, H., Kumagai, Y., Yang, C.C., Makabe-Kobayashi, Y., Fukuda, H., Yoshizawa, S., Iwasaki, W., Kogure, K., and Shiozaki, T.: Probe capture enrichment sequencing of amoA genes discloses diverse ammonia-oxidizing archaeal and bacterial populations, bioRxiv, 2023-04, https://doi.org/10.1101/2023.04.10.536224, 2023.
Hollibaugh, J. T., Gifford, S. M., Moran, M. A., Ross, M. J., Sharma, S., and Tolar, B. B.: Seasonal variation in the metratranscriptomes of a Thaumarchaeota population from SE USA coastal waters, ISME J., 8, 685–698, 2014.
Horak, R. E., Qin, W., Schauer, A. J., Armbrust, E. V., Ingalls, A. E., Moffett, J. W., Stahl, D. A., and Devol, A. H.: Ammonia oxidation kinetics and temperature sensitivity of a natural marine community dominated by Archaea, ISME J., 7, 2023–2033, https://doi.org/10.1038/ismej.2013.75, 2013.
Horak, R. E. A., Qin, W., Bertagnolli, A. D., Nelson, A., Heal, K. R., Han, H., Heller, M., Schauer, A. J., Jeffrey, W. H., Armbrust, E. V., Moffett, J. W., Ingalls, A. E., Stahl, D. A., and Devol, A. H.: Relative impacts of light, temperature, and reactive oxygen on thaumarchaeal ammonia oxidation in the North Pacific Ocean, Limnol. Oceanogr., 63, 741–757, https://doi.org/10.1002/lno.10665, 2018.
Hornek, R., Pommerening-Röser, A., Koops, H.-P., Farnleitner, A. H., Kreuzinger, N., Kirschner, A., and Mach, R. L.: Primers containing universal bases reduce multiple amoA gene specific DGGE band patterns when analysing the diversity of beta-ammonia oxidizers in the environment, J. Microbiol. Meth., 66, 147–155, https://doi.org/10.1016/j.mimet.2005.11.001, 2006.
Hsiao, S. S.-Y., Hsu, T.-C., Liu, J.-w., Xie, X., Zhang, Y., Lin, J., Wang, H., Yang, J.-Y. T., Hsu, S.-C., Dai, M., and Kao, S.-J.: Nitrification and its oxygen consumption along the turbid Chang Jiang River plume, Biogeosciences, 11, 2083–2098, https://doi.org/10.5194/bg-11-2083-2014, 2014.
Ji, Q., Buitenhuis, E., Suntharalingam, P., Sarmiento, J. L., and Ward, B. B.: Global Nitrous Oxide Production Determined by Oxygen Sensitivity of Nitrification and Denitrification, Global Biogeochem. Cy., 32, 1790–1802, https://doi.org/10.1029/2018gb005887, 2018.
Kalvelage, T., Jensen, M. M., Contreras, S., Revsbech, N. P., Lam, P., Gunter, M., LaRoche, J., Lavik, G., and Kuypers, M. M.: Oxygen sensitivity of anammox and coupled N-cycle processes in oxygen minimum zones, PloS one, 6, e29299, https://doi.org/10.1371/journal.pone.0029299, 2011.
Kalvelage, T., Lavik, G., Lam, P., Contreras, S., Arteaga, L., Löscher, C. R., Oschlies, A., Paulmier, A., Stramma, L., and Kuypers, M. M. M.: Nitrogen cycling driven by organic matter export in the South Pacific oxygen minimum zone, Nat. Geosci., 6, 228, https://doi.org/10.1038/ngeo1739, 2013.
Kanda, J., Laws, E. A., Saino, T., and Hattori, A.: An evaluation of isotope dilution effect from conventional data sets of 15N uptake experiments, J. Plankton Res., 9, 79–90, https://doi.org/10.1093/plankt/9.1.79, 1987.
Kitzinger, K., Padilla, C. C., Marchant, H. K., Hach, P. F., Herbold, C. W., Kidane, A. T., Könneke, M., Littmann, S., Mooshammer, M., Niggemann, J., Petrov, S., Richter, A., Stewart, F. J., Wagner, M., Kuypers, M. M. M., and Bristow, L. A.: Cyanate and urea are substrates for nitrification by Thaumarchaeota in the marine environment, Nat. Microbiol., 4, 234–243, https://doi.org/10.1038/s41564-018-0316-2, 2018.
Kitzinger, K., Marchant, H. K., Bristow, L. A., Herbold, C. W., Padilla, C. C., Kidane, A. T., Littmann, S., Daims, H., Pjevac, P., Stewart, F. J., and Wagner, M.: Single cell analyses reveal contrasting life strategies of the two main nitrifiers in the ocean, Nat. Commun., 11, 767, https://doi.org/10.1038/s41467-020-14542-3, 2020.
Khachikyan, A., Milucka, J., Littmann, S., Ahmerkamp, S., Meador, T., Könneke, M., Burg, T., and Kuypers, M. M.: Direct cell mass measurements expand the role of small microorganisms in nature, Appl. Environ. Microb., 85, e00493-19, https://doi.org/10.1128/AEM.00493-19, 2019.
Kraft, B., Jehmlich, N., Larsen, M., Bristow Laura, A., Könneke, M., Thamdrup, B., and Canfield Donald, E.: Oxygen and nitrogen production by an ammonia-oxidizing archaeon, Science, 375, 97–100, https://doi.org/10.1126/science.abe6733, 2022.
Lam, P., Lavika, G., Jensena, M. M., van de Vossenbergb, J., Schmidb, M., and Woebkena, D.: Revising the nitrogen cycle in the Peruvian oxygen minimum zone, P. Natl. Acad. Sci. USA, 106, 4752–4757, https://doi.org/10.1073/pnas.0812444106, 2009.
Laperriere, S. M., Morando, M., Capone, D. G., Gunderson, T., Smith, J. M., and Santoro, A. E.: Nitrification and nitrous oxide dynamics in the Southern California Bight, Limnol. Oceanogr., 66, 1099–1112, https://doi.org/10.1002/lno.11667, 2020.
Li, G., Cheng, L., Zhu, J., Trenberth, K. E., Mann, M. E., and Abraham, J. P.: Increasing ocean stratification over the past half-century, Nat. Clim. Change, 10, 1116–1123, https://doi.org/10.1038/s41558-020-00918-2, 2020.
Lin, Y., Gifford, S., Ducklow, H., Schofield, O., and Cassar, N.: Towards quantitative microbiome community profiling using internal standards, Appl. Environ. Microb., 85, e02634-18, https://doi.org/10.1128/AEM.02634-18, 2019.
Lipschultz, F.: Isotope tracer methods for studies of the marine nitrogen cycle, Nitrogen in the Marine Environment, 2, 1345–1384, https://doi.org/10.1016/B978-0-12-372522-6.00031-1, 2008.
Lipschultz, F., Wofsy, S. C., and Fox, L. E.: Nitrogen metabolism of the eutrophic Delaware River ecosystem1, Limnol. Oceanogr., 31, https://doi.org/10.4319/lo.1986.31.4.0701, 701–716, 1986.
Liu, H., Zhou, P., Cheung, S., Lu, Y., Liu, H., and Jing, H.: Distribution and Oxidation Rates of Ammonia-Oxidizing Archaea Influenced by the Coastal Upwelling off Eastern Hainan Island, Microorganisms, 10, 952, https://doi.org/10.3390/microorganisms10050952, 2022.
Liu, Q., Tolar, B. B., Ross, M. J., Cheek, J. B., Sweeney, C. M., Wallsgrove, N. J., Popp, B. N., and Hollibaugh, J. T.: Light and temperature control the seasonal distribution of thaumarchaeota in the South Atlantic bight, ISME J., 12, 1473–1485, https://doi.org/10.1038/s41396-018-0066-4, 2018.
Lomas, M. W. and Lipschultz, F.: Forming the primary nitrite maximum: Nitrifiers or phytoplankton?, Limnol. Oceanogr., 51, 2453–2467, https://doi.org/10.4319/lo.2006.51.5.2453, 2006.
McCarthy, J. J., Garside, C., and Nevins, J. L.: Nitrogen dynamics during the Arabian Sea Northeast Monsoon, Deep-Sea Res. Pt. II, 46, 1623–1664, https://doi.org/10.1016/S0967-0645(99)00038-7, 1999.
McIlvin, M. R. and Altabet, M. A.: Chemical Conversion of Nitrate and Nitrite to Nitrous Oxide for Nitrogen and Oxygen Isotopic Analysis in Freshwater and Seawater, Anal. Chem., 77, 5589–5595, https://doi.org/10.1021/ac050528s, 2005.
Mdutyana, M., Thomalla, S. J., Philibert, R., Ward, B. B., and Fawcett, S. E.: The Seasonal Cycle of Nitrogen Uptake and Nitrification in the Atlantic Sector of the Southern Ocean, Global Biogeochem. Cy., 34, e2019GB006363, https://doi.org/10.1029/2019gb006363, 2020.
Mdutyana, M., Marshall, T., Sun, X., Burger, J. M., Thomalla, S. J., Ward, B. B., and Fawcett, S. E.: Controls on nitrite oxidation in the upper Southern Ocean: insights from winter kinetics experiments in the Indian sector, Biogeosciences, 19, 3425–3444, https://doi.org/10.5194/bg-19-3425-2022, 2022a.
Mdutyana, M., Sun, X., Burger, J. M., Flynn, R. F., Smith, S., Horsten, N. R., Roychoudhury, A. N., Planquette, H., Bucciarelli, E., Thomalla, S. J., Ward, B. B., and Fawcett, S. E.: The kinetics of ammonium uptake and oxidation across the Southern Ocean, Limnol. Oceanogr., 67, 973–991, https://doi.org/10.1002/lno.12050, 2022b.
Merbt, S. N., Stahl, D. A., Casamayor, E. O., Marti, E., Nicol, G. W., and Prosser, J. I.: Differential photoinhibition of bacterial and archaeal ammonia oxidation, FEMS Microbiol. Lett., 327, 41–46, https://doi.org/10.1111/j.1574-6968.2011.02457.x, 2012.
Meredith, M., Sommerkorn, M., Cassotta, S., Derksen, C., Ekaykin, A., Hollowed, A., Kofinas, G., Mackintosh, A., Melbourne-Thomas, J., Muelbert, M., Ottersen, G., Pritchard, H., and Schuur, E. A. G.: Polar Regions, Chapter 3, IPCC Special Report on the Ocean and Cryosphere in a Changing Climate, https://doi.org/10.1017/9781009157964.005, 2019.
Middelburg, J. J.: Chemoautotrophy in the ocean, Geophys. Res. Lett., 38, L24604, https://doi.org/10.1029/2011gl049725, 2011.
Mincer, T. J., Church, M. J., Taylor, L. T., Preston, C., Karl, D. M., and DeLong, E. F.: Quantitative distribution of presumptive archaeal and bacterial nitrifiers in Monterey Bay and the North Pacific Subtropical Gyre, Environ. Microbiol., 9, 1162–1175, https://doi.org/10.1111/j.1462-2920.2007.01239.x, 2007.
Mosier, A. C. and Francis, C. A.: Determining the distribution of marine and coastal ammonia-oxidizing archaea and bacteria using a quantitative approach, Method. Enzymol., 486, 205–221, 2012.
Newell, S. E., Fawcett, S. E., and Ward, B. B.: Depth distribution of ammonia oxidation rates and ammonia-oxidizer community composition in the Sargasso Sea, Limnol. Oceanogr, 58, 1491–1500, 2013.
Olson, R.: 15N tracer studies of the primary nitrite maximum, J. Mar. Res., 39, 203–226, 1981a.
Olson, R.: Differential photoinhibition of marine nitrifying bacteria: a possible mechanism for the formation of the primary nitrite maximum, J. Mar. Res., 39, 227–238, 1981b.
Pachiadaki, M. G., Sintes, E., Bergauer, K., Brown, J. M., Record, N. R., Swan, B. K., Mathyer, M. E., Hallam, S. J., Lopez-Garcia, P., Takaki, Y., Nunoura, T., Woyke, T., Herndl, G. J., and Stepanauskas, R.: Major role of nitrite-oxidizing bacteria in dark ocean carbon fixation, Science, 358, 1046–1051, https://doi.org/10.1126/science.aan8260, 2017.
Peng, X., Jayakumar, A., and Ward, B. B.: Community composition of ammonia-oxidizing archaea from surface and anoxic depths of oceanic oxygen minimum zones, Front. Microbiol., 4, 177, https://doi.org/10.3389/fmicb.2013.00177, 2013.
Peng, X., Fuchsman, C. A., Jayakumar, A., Oleynik, S., Martens-Habbena, W., Devol, A. H., and Ward, B. B.: Ammonia and nitrite oxidation in the Eastern Tropical North Pacific, Global Biogeochem. Cy., 29, 2034–2049, https://doi.org/10.1002/2015GB005278, 2015.
Peng, X., Fuchsman, C. A., Jayakumar, A., Warner, M. J., Devol, A. H., and Ward, B. B.: Revisiting nitrification in the Eastern Tropical South Pacific: A focus on controls, J. Geophys. Res.-Oceans, 121, 1667–1684, https://doi.org/10.1002/2015jc011455, 2016.
Peng, X., Fawcett, S. E., van Oostende, N., Wolf, M. J., Marconi, D., Sigman, D. M., and Ward, B. B.: Nitrogen uptake and nitrification in the subarctic North Atlantic Ocean, Limnol. Oceanogr., 63, 1462–1487, https://doi.org/10.1002/lno.10784, 2018.
Pester, M., Maixner, F., Berry, D., Rattei, T., Koch, H., Lucker, S., Nowka, B., Richter, A., Spieck, E., Lebedeva, E., Loy, A., Wagner, M., and Daims, H.: NxrB encoding the beta subunit of nitrite oxidoreductase as functional and phylogenetic marker for nitrite-oxidizing Nitrospira, Environ. Microbiol., 16, 3055–3071, https://doi.org/10.1111/1462-2920.12300, 2014.
Raes, E. J., van de Kamp, J., Bodrossy, L., Fong, A. A., Riekenberg, J., Holmes, B. H., Erler, D. V., Eyre, B. D., Weil, S.-S., and Waite, A. M.: N2 Fixation and New Insights Into Nitrification From the Ice-Edge to the Equator in the South Pacific Ocean, Front. Mar. Sci., 7, 389, https://doi.org/10.3389/fmars.2020.00389, 2020.
Raimbault, P., Slawyk, G., Boudjellal, B., Coatanoan, C., Conan, P., Coste, B., Garcia, N., Moutin, T., and Pujo-Pay, M.: Carbon and nitrogen uptake and export in the equatorial Pacific at 150∘ W: Evidence of an efficient regenerated production cycle, J. Geophys. Res.-Oceans, 104, 3341–3356, https://doi.org/10.1029/1998jc900004, 1999.
Rotthauwe, J. H., Witzel, K. P., and Liesack, W.: The ammonia monooxygenase structural gene amoA as a functional marker: molecular fine-scale analysis of natural ammonia-oxidizing populations, Appl. Environ. Microbiol., 63, 4704–4712, 1997.
Saito, M. A., McIlvin, M. R., Moran, D. M., Santoro, A. E., Dupont, C. L., Rafter, P. A., Saunders, J. K., Kaul, D., Lamborg, C. H., Westley, M., and Valois, F.: Abundant nitrite-oxidizing metalloenzymes in the mesopelagic zone of the tropical Pacific Ocean, Nat. Geosci., 13, 355–362, 2020.
Santoro, A. E., Casciotti, K. L., and Francis, C. A.: Activity, abundance and diversity of nitrifying archaea and bacteria in the central California Current, Environ. Microbiol., 12, 1989–2006, https://doi.org/10.1111/j.1462-2920.2010.02205.x, 2010.
Santoro, A. E., Sakamoto, C. M., Smith, J. M., Plant, J. N., Gehman, A. L., Worden, A. Z., Johnson, K. S., Francis, C. A., and Casciotti, K. L.: Measurements of nitrite production in and around the primary nitrite maximum in the central California Current, Biogeosciences, 10, 7395–7410, https://doi.org/10.5194/bg-10-7395-2013, 2013.
Santoro, A. E., Saito, M. A., Goepfert, T. J., Lamborg, C. H., Dupont, C. L., and DiTullio, G. R.: Thaumarchaeal ecotype distributions across the equatorial Pacific Ocean and their potential roles in nitrification and sinking flux attenuation, Limnol. Oceanogr., 62, 1984–2003, https://doi.org/10.1002/lno.10547, 2017.
Santoro, A. E., Buchwald, C., Knapp, A. N., Berelson, W. M., Capone, D. G., and Casciotti, K. L.: Nitrification and Nitrous Oxide Production in the Offshore Waters of the Eastern Tropical South Pacific, Global Biogeochem. Cy., 35, e2020GB006716, https://doi.org/10.1029/2020gb006716, 2021.
Satinsky, B. M., Gifford, S. M., Crump, B. C., and Moran, M. A.: Use of internal standards for quantitative metatranscriptome and metagenome analysis, Meth. Enzymol., 531, 237–250, 2013.
Schleper, C. and Nicol, G. W.: Ammonia-oxidising archaea–physiology, ecology and evolution, Adv. Microb. Physiol., 57, 1–41, https://doi.org/10.1016/B978-0-12-381045-8.00001-1, 2010.
Shafiee, R. T., Snow, J. T., Zhang, Q., and Rickaby, R. E. M.: Iron requirements and uptake strategies of the globally abundant marine ammonia-oxidising archaeon, Nitrosopumilus maritimus SCM1, ISME J., 13, 2295–2305, https://doi.org/10.1038/s41396-019-0434-8, 2019.
Shafiee, R. T., Diver, P. J., Snow, J. T., Zhang, Q., and Rickaby, R. E.: Marine ammonia-oxidising archaea and bacteria occupy distinct iron and copper niches, ISME Communications, 1, 1, https://doi.org/10.1038/s43705-021-00001-7, 2021.
Shiozaki, T., Ijichi, M., Fujiwara, A., Makabe, A., Nishino, S., Yoshikawa, C., and Harada, N.: Factors Regulating Nitrification in the Arctic Ocean: Potential Impact of Sea Ice Reduction and Ocean Acidification, Global Biogeochemi. Cy., 33, 1085–1099, https://doi.org/10.1029/2018gb006068, 2019.
Shiozaki, T., Ijichi, M., Isobe, K., Hashihama, F., Nakamura, K.-i., Ehama, M., Hayashizaki, K.-i., Takahashi, K., Hamasaki, K., and Furuya, K.: Nitrification and its influence on biogeochemical cycles from the equatorial Pacific to the Arctic Ocean, ISME J., 10, 2184–2197, https://doi.org/10.1038/ismej.2016.18, 2016.
Shiozaki, T., Hashihama, F., Endo, H., Ijichi, M., Takeda, N., Makabe, A., Fujiwara, A., Nishino, S., and Harada, N.: Assimilation and oxidation of urea-derived nitrogen in the summer Arctic Ocean, Limnol. Oceanogr., 66, 4159–4170, https://doi.org/10.1002/lno.11950, 2021.
Sigman, D. M., Casciotti, K. L., Andreani, M., Barford, C., Galanter, M., and Böhlke, J. K.: A Bacterial Method for the Nitrogen Isotopic Analysis of Nitrate in Seawater and Freshwater, Anal. Chem., 73, 4145–4153, https://doi.org/10.1021/ac010088e, 2001.
Sintes, E., Bergauer, K., De Corte, D., Yokokawa, T., and Herndl, G. J.: Archaeal amoA gene diversity points to distinct biogeography of ammonia-oxidizing Crenarchaeota in the ocean, Environ. Microbiol., 15, 1647–1658, https://doi.org/10.1111/j.1462-2920.2012.02801.x, 2013.
Sintes, E., De Corte, D., Haberleitner, E., and Herndl, G. J.: Geographic Distribution of Archaeal Ammonia Oxidizing Ecotypes in the Atlantic Ocean, Front. Microbiol., 7, 77, https://doi.org/10.3389/fmicb.2016.00077, 2016.
Smith, J. M., Chavez, F. P., and Francis, C. A.: Ammonium uptake by phytoplankton regulates nitrification in the sunlit ocean, PloS one, 9, e108173, https://doi.org/10.1371/journal.pone.0108173, 2014.
Smith, S., Altieri, K. E., Mdutyana, M., Walker, D. R., Parrott, R. G., Gallie, S., Spence, K. A. M., Burger, J. M., and Fawcett, S. E.: Biogeochemical controls on ammonium accumulation in the surface layer of the Southern Ocean, Biogeosciences, 19, 715–741, https://doi.org/10.5194/bg-19-715-2022, 2022.
Sun, X., Ji, Q., Jayakumar, A., and Ward, B. B.: Dependence of nitrite oxidation on nitrite and oxygen in low-oxygen seawater, Geophys. Res. Lett., 44, 7883–7891, https://doi.org/10.1002/2017GL074355, 2017.
Sun, X., Kop, L. F. M., Lau, M. C. Y., Frank, J., Jayakumar, A., Lücker, S., and Ward, B. B.: Uncultured Nitrospina-like species are major nitrite oxidizing bacteria in oxygen minimum zones, ISME J., 13, 2391–2402, https://doi.org/10.1038/s41396-019-0443-7, 2019.
Sun, X., Frey, C., Garcia-Robledo, E., Jayakumar, A., and Ward, B. B.: Microbial niche differentiation explains nitrite oxidation in marine oxygen minimum zones, ISME J., 15, 1317–1329, https://doi.org/10.1038/s41396-020-00852-3, 2021.
Sun, X., Frey, C., and Ward, B. B.: Nitrite oxidation across the full oxygen spectrum in the ocean, Global Biogeochem. Cy., 37, 2022GB007548, https://doi.org/10.1029/2022GB007548, 2023.
Sutka, R. L., Ostrom, N. E., Ostrom, P. H., and Phanikumar, M. S.: Stable nitrogen isotope dynamics of dissolved nitrate in a transect from the north Pacific subtropical gyre to the eastern tropical north Pacific, Geochim. Cosmochim. Ac., 68, 517–527, https://doi.org/10.1016/S0016-7037(03)00483-6, 2004.
Suzuki, I., Dular, U., and Kwok, S.: Ammonia or ammonium ion as substrate for oxidation by Nitrosomonas europaea cells and extracts, J. Bacteriol., 120, 556–558, https://doi.org/10.1128/jb.120.1.556-558.1974, 1974.
Tang, W., Ward, B., Beman, M., Bristow, L., Clark, D., Fawcett, S., Frey, C., Fripiat, F., Herndl, G., Mdutyana, M., Paulot, F., Peng, X., Santoro, A., Shiozaki, T., Sintes, E., Stock, C., Sun, X., Wan, X., Xu, M., and Zhang, Y.: Database of nitrification and nitrifiers in the global ocean, Zenodo [data set], https://doi.org/10.5281/zenodo.8355912, 2023.
Tolar, B. B., King, G. M., and Hollibaugh, J. T.: An analysis of Thaumarchaeota populations from the Northern Gulf of Mexico, Front. Microbiol., 4, 72, https://doi.org/10.3389/fmicb.2013.00072, 2013.
Tolar, B. B., Ross, M. J., Wallsgrove, N. J., Liu, Q., Aluwihare, L. I., Popp, B. N., and Hollibaugh, J. T.: Contribution of ammonia oxidation to chemoautotrophy in Antarctic coastal waters, ISME J., 10, 2605–2619, https://doi.org/10.1038/ismej.2016.61, 2016.
Tolar, B. B., Wallsgrove, N. J., Popp, B. N., and Hollibaugh, J. T.: Oxidation of urea-derived nitrogen by thaumarchaeota-dominated marine nitrifying communities, Environ. Microbiol., 19, 4838–4850, https://doi.org/10.1111/1462-2920.13457, 2017.
Tolar, B. B., Reji, L., Smith, J. M., Blum, M., Pennington, J. T., Chavez, F. P., and Francis, C. A.: Time series assessment of Thaumarchaeota ecotypes in Monterey Bay reveals the importance of water column position in predicting distribution–environment relationships, Limnol. Oceanogr., 65, 2041–2055, https://doi.org/10.1002/lno.11436, 2020.
Tracey, J. C., Babbin, A. R., Wallace, E., Sun, X., DuRussel, K. L., Frey, C., Martocello III, D. E., Tamasi, T., Oleynik, S., and Ward, B. B.: All about nitrite: exploring nitrite sources and sinks in the eastern tropical North Pacific oxygen minimum zone, Biogeosciences, 20, 2499–2523, https://doi.org/10.5194/bg-20-2499-2023, 2023.
van de Leemput, I. A., Veraart, A. J., Dakos, V., de Klein, J. J., Strous, M., and Scheffer, M.: Predicting microbial nitrogen pathways from basic principles, Environ. Microbiol., 13, 1477–1487, 2011.
van Kessel, M. A. H. J., Speth, D. R., Albertsen, M., Nielsen, P. H., Op den Camp, H. J. M., Kartal, B., Jetten, M. S. M., and Lücker, S.: Complete nitrification by a single microorganism, Nature, 528, 555–559, https://doi.org/10.1038/nature16459, 2015.
Wallschuss, S., Mdutyana, M., Parrott, R. G., Forrer, H. J., Roman, R., Walker, D. R., Ansorge, I. J., and Fawcett, S. E.: The influence of Agulhas leakage on primary production and nitrogen cycling in the southeastern Atlantic Ocean, J. Geophys. Res.-Oceans, 127, e2022JC018971, https://doi.org/10.1029/2022JC018971, 2022.
Wan, X. S., Sheng, H.-X., Dai, M., Zhang, Y., Shi, D., Trull, T. W., Zhu, Y., Lomas, M. W., and Kao, S.-J.: Ambient nitrate switches the ammonium consumption pathway in the euphotic ocean, Nat. Commun., 9, 915, https://doi.org/10.1038/s41467-018-03363-0, 2018.
Wan, X. S., Sheng, H.-X., Dai, M., Church, M. J., Zou, W., Li, X., Hutchins, D. A., Ward, B. B., and Kao, S.-J.: Phytoplankton-nitrifier interactions control the geographic distribution of nitrite in the upper ocean, Global Biogeochem. Cy., 35, e2021GB007072, https://doi.org/10.1029/2021GB007072, 2021.
Wan, X. S., Sheng, H.-X., Dai, M., Casciotti, K. L., Church, M. J., Zou, W., Liu, L., Shen, H., Zhou, K., Ward, B. B., and Kao, S.-J.: Epipelagic nitrous oxide production offsets carbon sequestration by the biological pump, Nat. Geosci., 16, 29–36, https://doi.org/10.1038/s41561-022-01090-2, 2022.
Ward, B. B.: Nitrogen transformations in the Southern California Bight, Deep-Sea Res. Pt. I, 34, 785–805, https://doi.org/10.1016/0198-0149(87)90037-9, 1987.
Ward, B. B.: Measurement and distribution of nitrification rates in the oceans, in: Methods in enzymology, Elsevier, 307–323, https://doi.org/10.1016/B978-0-12-381294-0.00013-4, 2011a.
Ward, B. B.: Nitrification in the Ocean, in: Nitrification, 323–345, https://doi.org/10.1128/9781555817145.ch13, 2011b.
Ward, B. B.: Temporal variability in nitrification rates and related biogeochemical factors in Monterey Bay, California, USA, Mar. Ecol. Prog. Ser., 292, 97–109, 2005.
Ward, B. B.: Nitrification in Marine Systems, in: Nitrogen in the Marine Environment, 2 ed., edited by: Capone, D. G., Bronk, D. A., Mulholland, M. R., and Carpenter, E. J., Elsevier, 199–262, https://doi.org/10.1016/B978-0-12-372522-6.00005-0, 2008.
Ward, B. B. and Zafiriou, O. C.: Nitrification and nitric oxide in the oxygen minimum of the eastern tropical North Pacific, Deep-Sea Res. Pt. I, 35, 1127–1142, https://doi.org/10.1016/0198-0149(88)90005-2, 1988.
Ward, B. B., Olson, R. J., and Perry, M. J.: Microbial nitrification rates in the primary nitrite maximum off southern California, Deep-Sea Res. Pt. I, 29, 247–255, https://doi.org/10.1016/0198-0149(82)90112-1, 1982.
Ward, B. B., Talbot, M. C., and Perry, M. J.: Contributions of phytoplankton and nitrifying bacteria to ammonium and nitrite dynamics in coastal waters, Cont. Shelf Res., 3, 383–398, https://doi.org/10.1016/0278-4343(84)90018-9, 1984.
Ward B. B, Kilpatrick, K. A., Renger, E. H., and Eppley, R. W.: Biological nitrogen cycling in the nitracline, Limnol. Oceanogr.. 34, 493–513, https://doi.org/10.4319/lo.1989.34.3.0493, 1989a.
Ward, B. B., Glover, H. E., and Lipschultz, F.: Chemoautotrophic activity and nitrification in the oxygen minimum zone off Peru, Deep-Sea Res. Pt. I, 36, 1031–1051, https://doi.org/10.1016/0198-0149(89)90076-9, 1989b.
Weigand, M. A., Foriel, J., Barnett, B., Oleynik, S., and Sigman, D. M.: Updates to instrumentation and protocols for isotopic analysis of nitrate by the denitrifier method, Rapid Commun. Mass Spectrom., 30, 1365–1383, 2016.
Wilkinson, M. D., Dumontier, M., Aalbersberg, I. J., Appleton, G., Axton, M., Baak, A., Blomberg, N., Boiten, J.-W., da Silva Santos, L. B., Bourne, P. E., Bouwman, J., Brookes, A. J., Clark, T., Crosas, M., Dillo, I., Dumon, O., Edmunds, S., Evelo, C. T., Finkers, R., Gonzalez-Beltran, A., Gray, A. J. G., Groth, P., Goble, C., Grethe, J. S., Heringa, J., 't Hoen, P. A. C., Hooft, R., Kuhn, T., Kok, R., Kok, J., Lusher, S. J., Martone, M. E., Mons, A., Packer, A. L., Persson, B., Rocca-Serra, P., Roos, M., van Schaik, R., Sansone, S.-A., Schultes, E., Sengstag, T., Slater, T., Strawn, G., Swertz, M. A., Thompson, M., van der Lei, J., van Mulligen, E., Velterop, J., Waagmeester, A., Wittenburg, P., Wolstencroft, K., Zhao, J., and Mons, B.: The FAIR Guiding Principles for scientific data management and stewardship, Sci. Data, 3, 160018, https://doi.org/10.1038/sdata.2016.18, 2016.
Wuchter, C., Abbas, B., Coolen, M. J., Herfort, L., van Bleijswijk, J., Timmers, P., Strous, M., Teira, E., Herndl, G. J., Middelburg, J. J., Schouten, S., and Sinninghe Damste, J. S.: Archaeal nitrification in the ocean, P. Natl. Acad. Sci. USA, 103, 12317–12322, https://doi.org/10.1073/pnas.0600756103, 2006.
Xia, F., Wang, J. G., Zhu, T., Zou, B., Rhee, S. K., and Quan, Z. X.: Ubiquity and diversity of complete ammonia oxidizers (comammox), Appl. Environ. Microb., 84, e01390-18, https://doi.org/10.1128/AEM.01390-18, 2018.
Xu, M. N., Zhang, W., Zhu, Y., Liu, L., Zheng, Z., Wan, X. S., Qian, W., Dai, M., Gan, J., and Hutchins, D. A.: Enhanced ammonia oxidation caused by lateral Kuroshio intrusion in the boundary zone of the northern South China Sea, Geophys. Res. Lett., 45, 6585–6593, https://doi.org/10.1029/2018GL077896, 2018.
Xu, M. N., Li, X., Shi, D., Zhang, Y., Dai, M., Huang, T., Glibert, P. M., and Kao, S. J.: Coupled effect of substrate and light on assimilation and oxidation of regenerated nitrogen in the euphotic ocean, Limnol. Oceanogr., 64, 1270–1283, https://doi.org/10.1002/lno.11114, 2019.
Yool, A., Martin, A. P., Fernández, C., and Clark, D. R.: The significance of nitrification for oceanic new production, Nature, 447, 999–1002, 2007.
Zakem, E. J., Al-Haj, A., Church, M. J., van Dijken, G. L., Dutkiewicz, S., Foster, S. Q., Fulweiler, R. W., Mills, M. M., and Follows, M. J.: Ecological control of nitrite in the upper ocean, Nat. Commun., 9, 1206, https://doi.org/10.1038/s41467-018-03553-w, 2018.
Zakem, E. J., Bayer, B., Qin, W., Santoro, A. E., Zhang, Y., and Levine, N. M.: Controls on the relative abundances and rates of nitrifying microorganisms in the ocean, Biogeosciences, 19, 5401–5418, https://doi.org/10.5194/bg-19-5401-2022, 2022.
Zhang, Y., Qin, W., Hou, L., Zakem, E. J., Wan, X., Zhao, Z., Liu, L., Hunt, K. A., Jiao, N., Kao, S. J., Tang, K., Xie, X., Shen, J., Li, Y., Chen, M., Dai, X., Liu, C., Deng, W., Dai, M., Ingalls, A. E., Stahl, D. A., and Herndl, G. J.: Nitrifier adaptation to low energy flux controls inventory of reduced nitrogen in the dark ocean, P. Natl. Acad. Sci. USA, 117, 4823–4830, https://doi.org/10.1073/pnas.1912367117, 2020.
Zheng, Z. Z., Wan, X. H., Xu, M. N., Hsiao, S. S. Y., Zhang, Y., Zheng, L. W., Wu, Y. H., Zou, W. B., and Kao, S. J.: Effects of temperature and particles on nitrification in a eutrophic coastal bay in southern China, J. Geophys. Res.-Biogeo., 122, 2325–2337, https://doi.org/10.1002/2017jg003871, 2017.
Zheng, Z.-Z., Zheng, L.-W., Xu, M. N., Tan, E., Hutchins, D. A., Deng, W., Zhang, Y., Shi, D., Dai, M., and Kao, S.-J.: Substrate regulation leads to differential responses of microbial ammonia-oxidizing communities to ocean warming, Nat. Commun., 11, 3511, https://doi.org/10.1038/s41467-020-17366-3, 2020.