the Creative Commons Attribution 4.0 License.
the Creative Commons Attribution 4.0 License.
 | 31 Oct 2023
A gridded dataset of consumptive water footprints, evaporation, transpiration, and associated benchmarks related to crop production in China during 2000–2018
Wei Wang
La Zhuo
Xiangxiang Ji
Zhiwei Yue
Zhibin Li
Meng Li
Huimin Zhang
Rong Gao
Chenjian Yan
Ping Zhang
Pute Wu
Evapotranspiration over crop growth period, also referred to as the consumptive water footprint of crop production (WFCP), is an essential component of the hydrological cycle. However, the existing high-resolution consumptive WFCP datasets do not distinguish between soil evaporation and crop transpiration and disregard the impacts of different irrigation practices. This restricts the practical implementation of existing WFCP datasets for precise crop water productivity assessments, agricultural water-saving evaluations, the development of sustainable irrigation techniques, cropping structure optimization, and crop-related interregional virtual water trade analysis. This study establishes a 5-arcmin gridded dataset of monthly green and blue WFCP, evaporation, transpiration, and associated unit WFCP benchmarks for 21 crops grown in China during 2000–2018. The data simulation was based on calibrated AquaCrop modelling under furrow-, sprinkler-, and micro-irrigated as well as rainfed conditions. Data quality was validated by comparing the current results with multiple public datasets and remote sensing products. The improved gridded WFCP dataset is available at https://doi.org/10.5281/zenodo.7756013 (Wang et al., 2023) and effectively compensated for the gaps in the existing datasets through (i) revealing the intensity, structure, and spatiotemporal evolution of both productive and non-productive blue and green water consumption on a monthly scale, and (ii) including crop-by-crop unit WFCP benchmarks according to climatic zones.
- Article
(24690 KB) - Full-text XML
-
Supplement
(50664 KB) - BibTeX
- EndNote


The grain production potential of irrigated agriculture can effectively cope with the pressure that population growth places on the food supply (Wada et al., 2013; Haddeland et al., 2014; Rosa et al., 2020; Puy et al., 2021; Wang et al., 2021) and restrain the encroachment of cultivated land on natural regions (Tilman et al., 2011; Brown and Pervez, 2014; Jägermeyr et al., 2017; Puy et al., 2020). Currently, irrigation accounts for more than 70 % of worldwide blue water withdrawals (FAO, 2020) and 90 % of global water consumption (Döll, 2009). Irrigated cropland increases the soil water content and releases water vapour into the atmosphere, leading to an alteration in the hydrological cycle (Rodell et al., 2009; Elliott et al., 2014; Leng et al., 2014). Meanwhile, water scarcity is expected to increase in more than 80 % of global farmlands, together with the increasingly serious threats on sufficient agricultural water supply by the competition for water among sectors (Yin et al., 2017; Pastor et al., 2019; Liu et al., 2022). Apparently, accurate assessment of water consumption on irrigated and rainfed farmlands is crucial for identifying water-use hotspots and ensuring a stable food supply, particularly in the context of climate change.
The consumptive water footprint of crop production (WFCP) measures the consumption of blue water (i.e. irrigation water extracted from surface and groundwater) and green water (i.e. soil water directly from rainfall) during the crop growth period (Hoekstra and Chapagain, 2008; Hoekstra et al., 2011; Hoekstra, 2013), permitting a unified evaluation of the water consumption of irrigated and rainfed crops (Lovarelli et al., 2016). The most widely used WFCP database is the WaterStat (Hoekstra and Mekonnen, 2012). It covers the WFCP of a wide variety of crops, crop derivatives, and biofuels, with data resolution at national, watershed, and county spatial scales, but it only contains 10-year averages for 1996–2005 (WFN, 2022). The CWASI database established by Tamea et al. (2021) fills the resultant gap concerning the interannual evolution of WFCP data through a fast-track approach (Tuninetti et al., 2017) at the national scale, suggesting that there is significant interannual variation in the water footprint per unit mass of crop production (uWFCP), which should be taken into account in analyses and applications. However, none of the aforementioned studies have considered intra-annual variations or intra-national differences in agricultural water consumption. Considering that disparities in space and time in the WFCP and uWFCP may have various effects on the formulation of water management measures, such changes must be evaluated to provide a reference for seasonal water shortages (Hoekstra, 2013; Zhuo et al., 2016c).
Numerous studies have assessed the blue and green WFCP of specific crops at finer spatial and temporal resolutions using the agro-hydrological models including CROPWAT (Mekonnen and Hoekstra, 2011; Tuninetti et al., 2015), GEPIC (Liu et al., 2007), GCWM (Siebert and Döll, 2010), LPJmL (Fader et al., 2011), and AquaCrop (Zhuo et al., 2016b; Wang et al., 2019). Utilizing the WATNEEDs model, Chiarelli et al. (2020) produced the first dataset to record global monthly blue and green water requirements of producing 23 crops at a 5 arcmin scale. They found that green water accounts for 84 % of the considered global crop water requirements. However, the actual water consumption during crop production is frequently less than the predicted water requirement owing to soil water deficit, insufficient precipitation, and differences in field management (Long and Singh, 2013; Fisher et al., 2017). Furthermore, the aforementioned datasets ignore the non-negligible differences between the WFCP when using different water supply modes or irrigation practices and do not distinguish between the blue and green water consumption of two independent processes, namely soil evaporation (that is, extravagant water consumption) and crop transpiration. In summary, the limitations of existing WFCP databases mean that they cannot be used to evaluate the effect of implementing water-saving irrigation practices on the spatiotemporal distribution of agricultural water consumption at a large regional scale (Wang et al., 2019). Moreover, the lack of information on extravagant water consumption of crops in terms of the water sources and the spatiotemporal distribution hinders the precise implementation of water-saving agricultural policies and technologies (Jung et al., 2010; Lian et al., 2018).
To fill the abovementioned gaps in existing WFCP datasets, we developed a gridded dataset comprising monthly green and blue WFCP, evaporation and transpiration, and associated uWFCP benchmarks for 21 crops grown in China during 2000–2018. A self-sufficiency-oriented food policy has fuelled the explosive growth of water-saving irrigated farmlands in China in recent decades (SCIO, 1996; Ghose, 2014), with water-saving irrigated areas increasing by 5698 kha from 2000 to 2018 (representing 12 % of the total irrigated area in 2018) (NBSC, 2022). The current study followed the WFN accounting framework (Hoekstra et al., 2011) and used the Food and Agriculture Organization (FAO) AquaCrop Plug-In program v6.0 to simulate the monthly WFCP at a resolution of 5 arcmin. The considered 21 crops account for 83 % of national sown areas and 75 % of national crop production in China (NBSC, 2022). The dataset differs from the others in four aspects: (i) It evaluated the effects of different water supply modes (irrigated or rainfed) and irrigation practices (furrow, sprinkler, and micro-irrigation) on water consumption throughout the crop growth period. (ii) It distinguished between monthly blue and green water consumption via soil evaporation and crop transpiration. (iii) The dataset encompassed both the WFCP in m3 yr−1 and the uWFCP in m3 t−1. (iv) It identified uWFCP benchmarks that differentiated between various climatic zones and irrigation practices. The data quality was verified through its comparison with available public databases and remote sensing products.
Three main steps were followed to create and validate the WFCP dataset under various water supply modes and irrigation practices during 2000–2018 (Fig. 1).
-
Step 1: data preparation. We collected, verified, and inverted data on the yearly planting area of each crop under various water supply modes and irrigation practices at a resolution of 5 arcmin. The AquaCrop simulation required monthly precipitation, temperature, reference evapotranspiration (ET0), and CO2 datasets. The calibrated crop parameters were obtained from the published literature.
-
Step 2: water footprint simulation. The AquaCrop model was run with daily steps to simulate soil evaporation, crop transpiration, and crop yield during the growth period of crops. The WFCP and uWFCP were calculated for different water supply modes and irrigation practices using a spatial resolution of 5 arcmin and a temporal resolution of months (Zhuo et al., 2016c; Wang et al., 2019).
-
Step 3: data validation. The simulation results were verified by comparing them with remote sensing products of actual evapotranspiration (Cheng et al., 2021) and publicly accessible WFCP datasets (Mekonnen and Hoekstra, 2011; Zhuo et al., 2016a; Chiarelli et al., 2020).
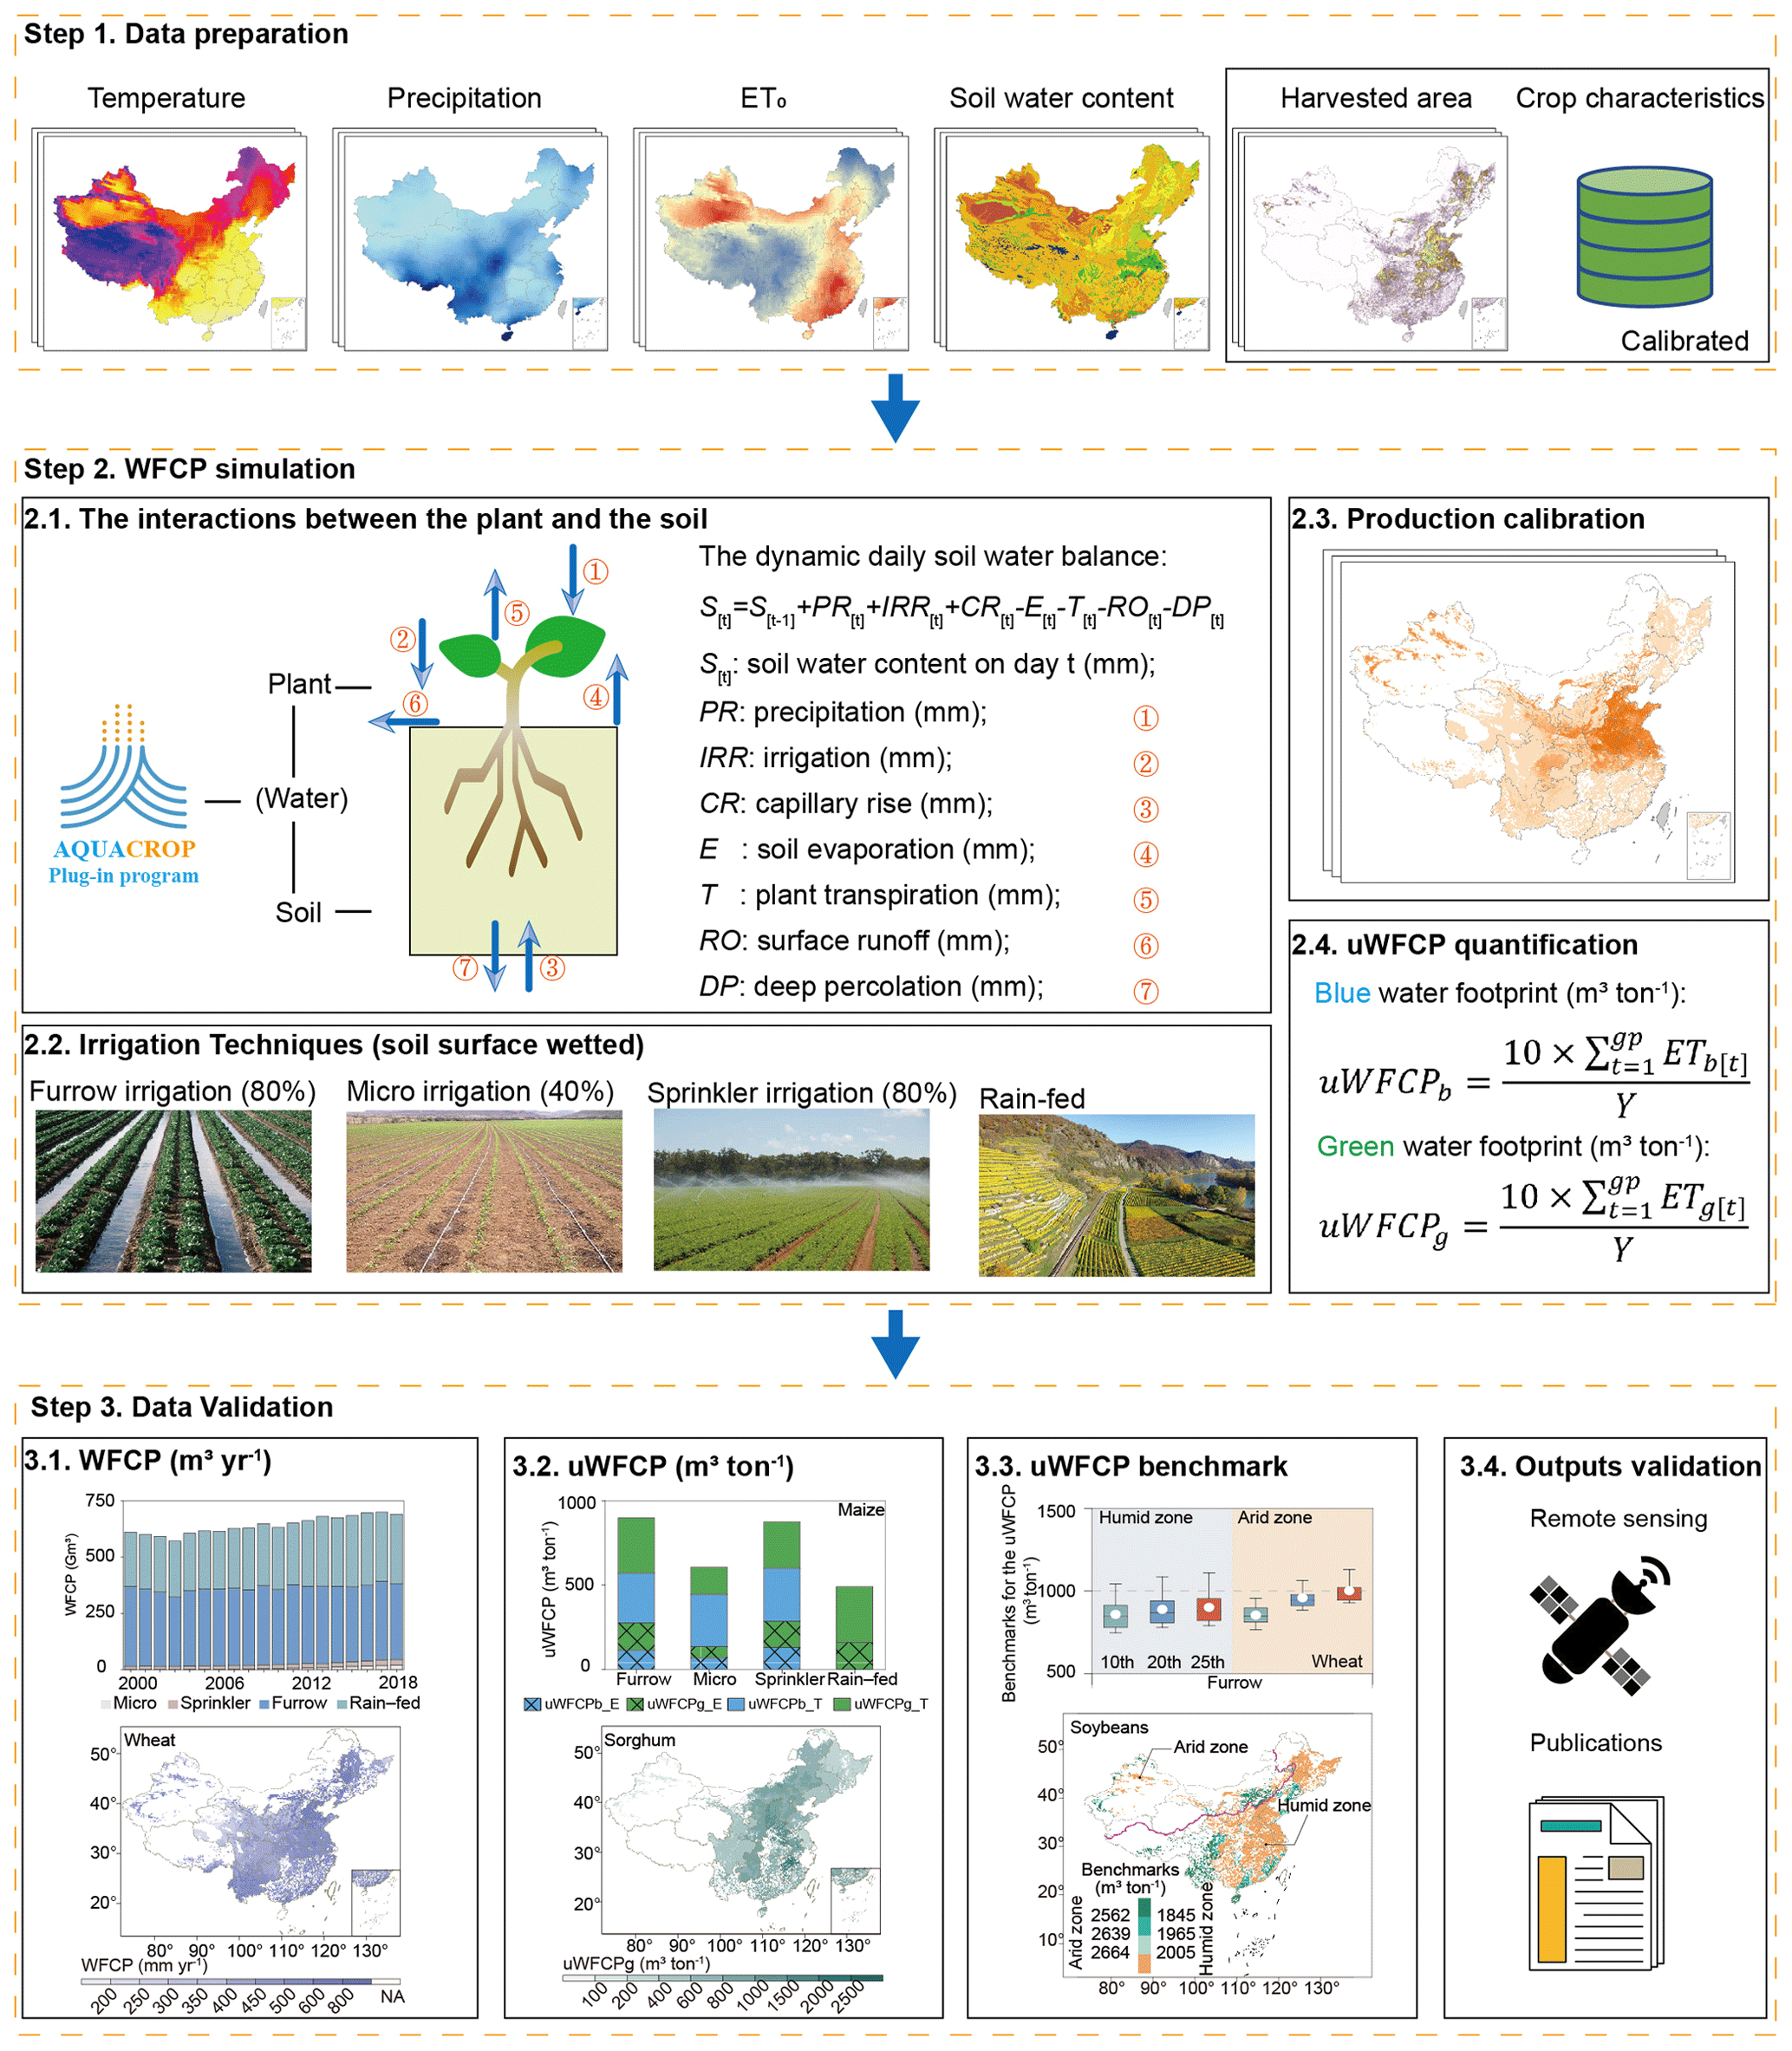
Figure 1The three main steps for quantifying the water footprint of crop production.
2.1 Data sources
2.1.1 Crop planting area and production
The irrigated and rainfed areas of each crop from 2001 to 2018 were assigned at a resolution of 5 arcmin according to the base map for the year 2000 obtained from the MIRCA2000 dataset (Portmann et al., 2010) and interannual changes per province extracted from the China Statistical Yearbook (NBSC, 2022). At the provincial scale, irrigation data from 2000–2018 were spatially divided into the proportional areas in which furrow, sprinkler, and micro-irrigation was used for each crop, retrieving data from the statistical yearbook (CAMIYC, 2022). Due to the lack of data in this regard, all vegetables were assumed to be grown under irrigation as based on agricultural practice. Further details about the planting area data selection have been provided in the data and methods in the Supplement. The national production data for tomatoes and cabbage were derived from the Food and Agriculture Organization dataset (FAO, 2022) and was proportionally allocated to vegetable production by provinces. Production data for the remaining crops were obtained from the NBSC (2022).
2.1.2 Meteorological and soil data
The monthly data for precipitation, minimum and maximum temperature, and reference evapotranspiration were obtained from the Climatic Research Unit Time-Series 4.06 dataset (Harris et al., 2020). All meteorological data were resampled to a 5 arcmin spatial resolution using the ArcGIS mapping platform. Atmospheric CO2 concentration data were acquired from the Mauna Loa Observatory in Hawaii (Tans and Keeling, 2022). Soil texture data were obtained from the International Soil Reference and Information Centre (ISRIC) soil profile database (Dijkshoorn et al., 2008). Soil water content data were obtained from the ISRIC World Inventory of Soil Emission Potentials database (Batjes, 2012). Table 1 summarizes the data sources.
Table 1Inventory of data sources.
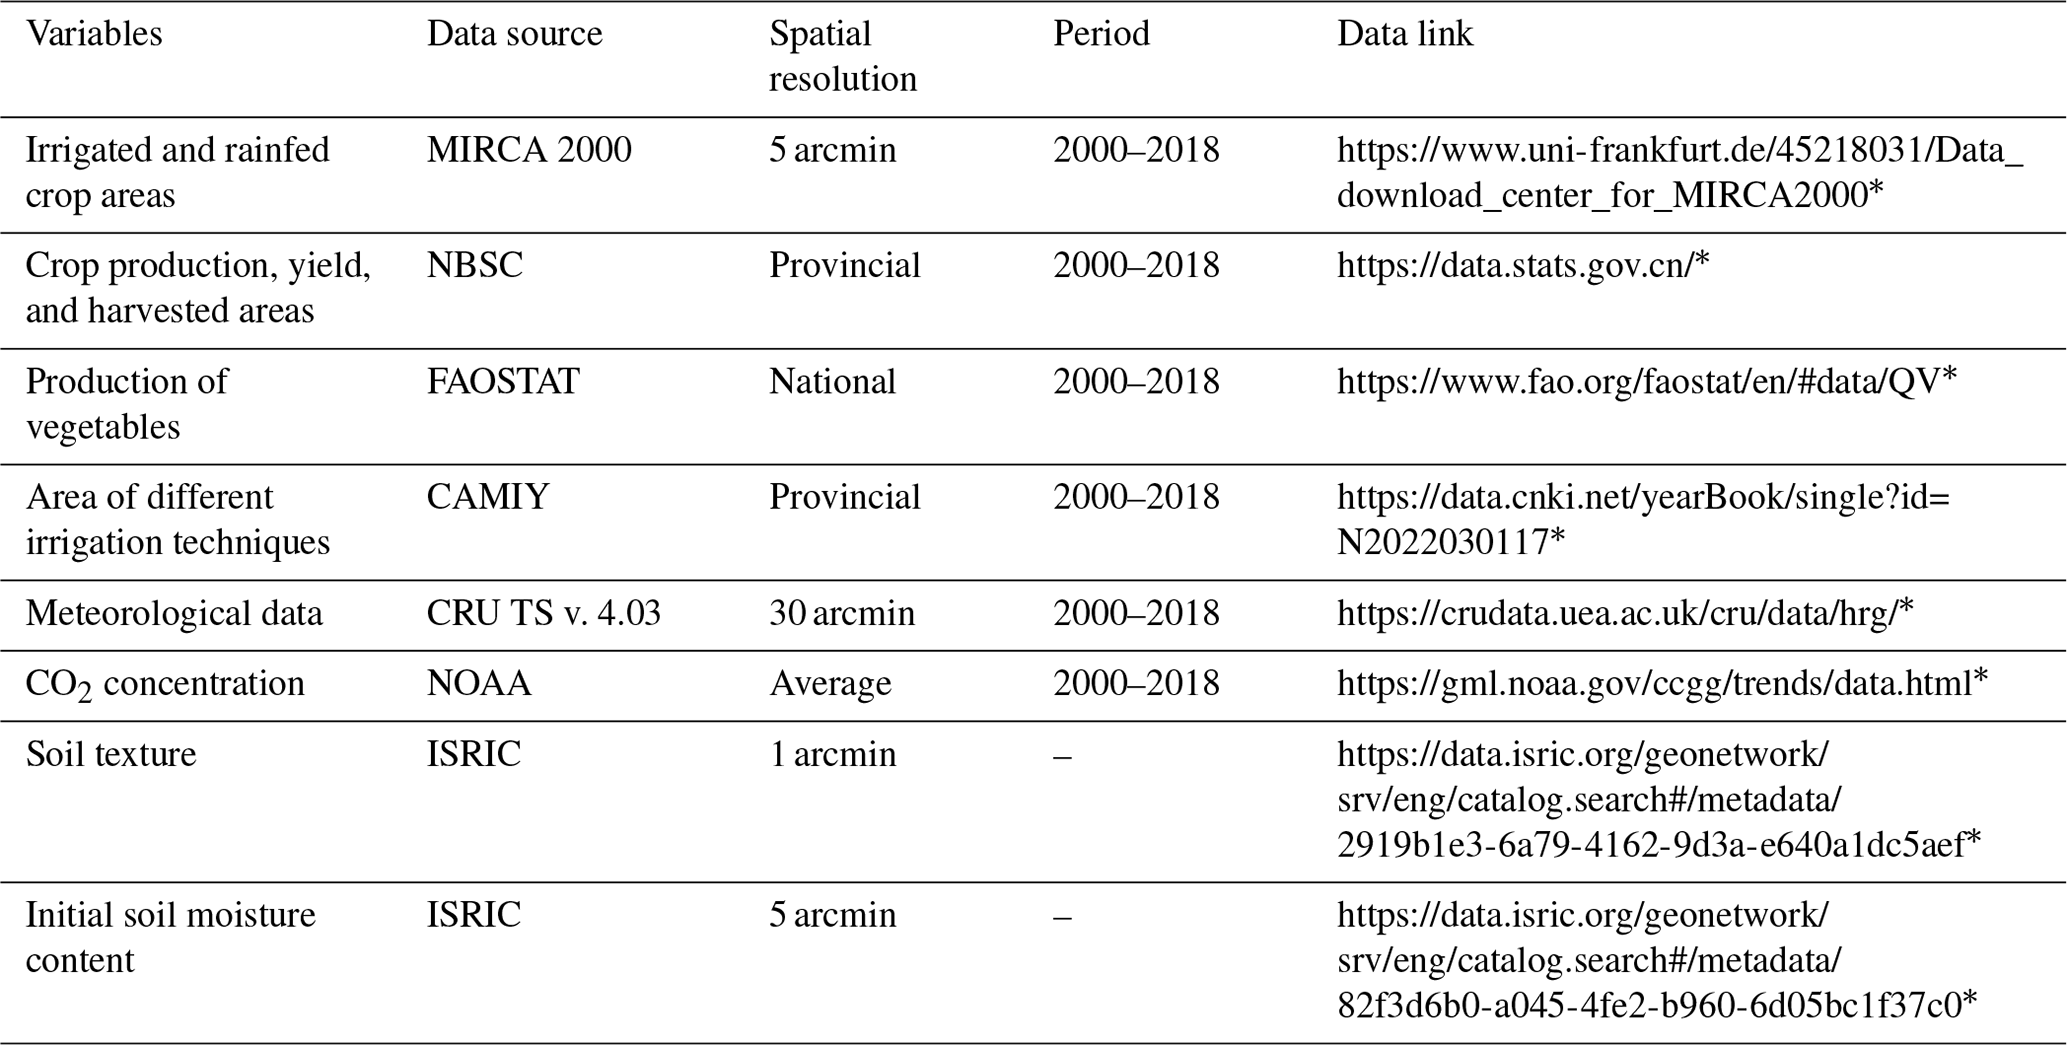
Dashes indicate constant values. * Last access: 23 October 2023.
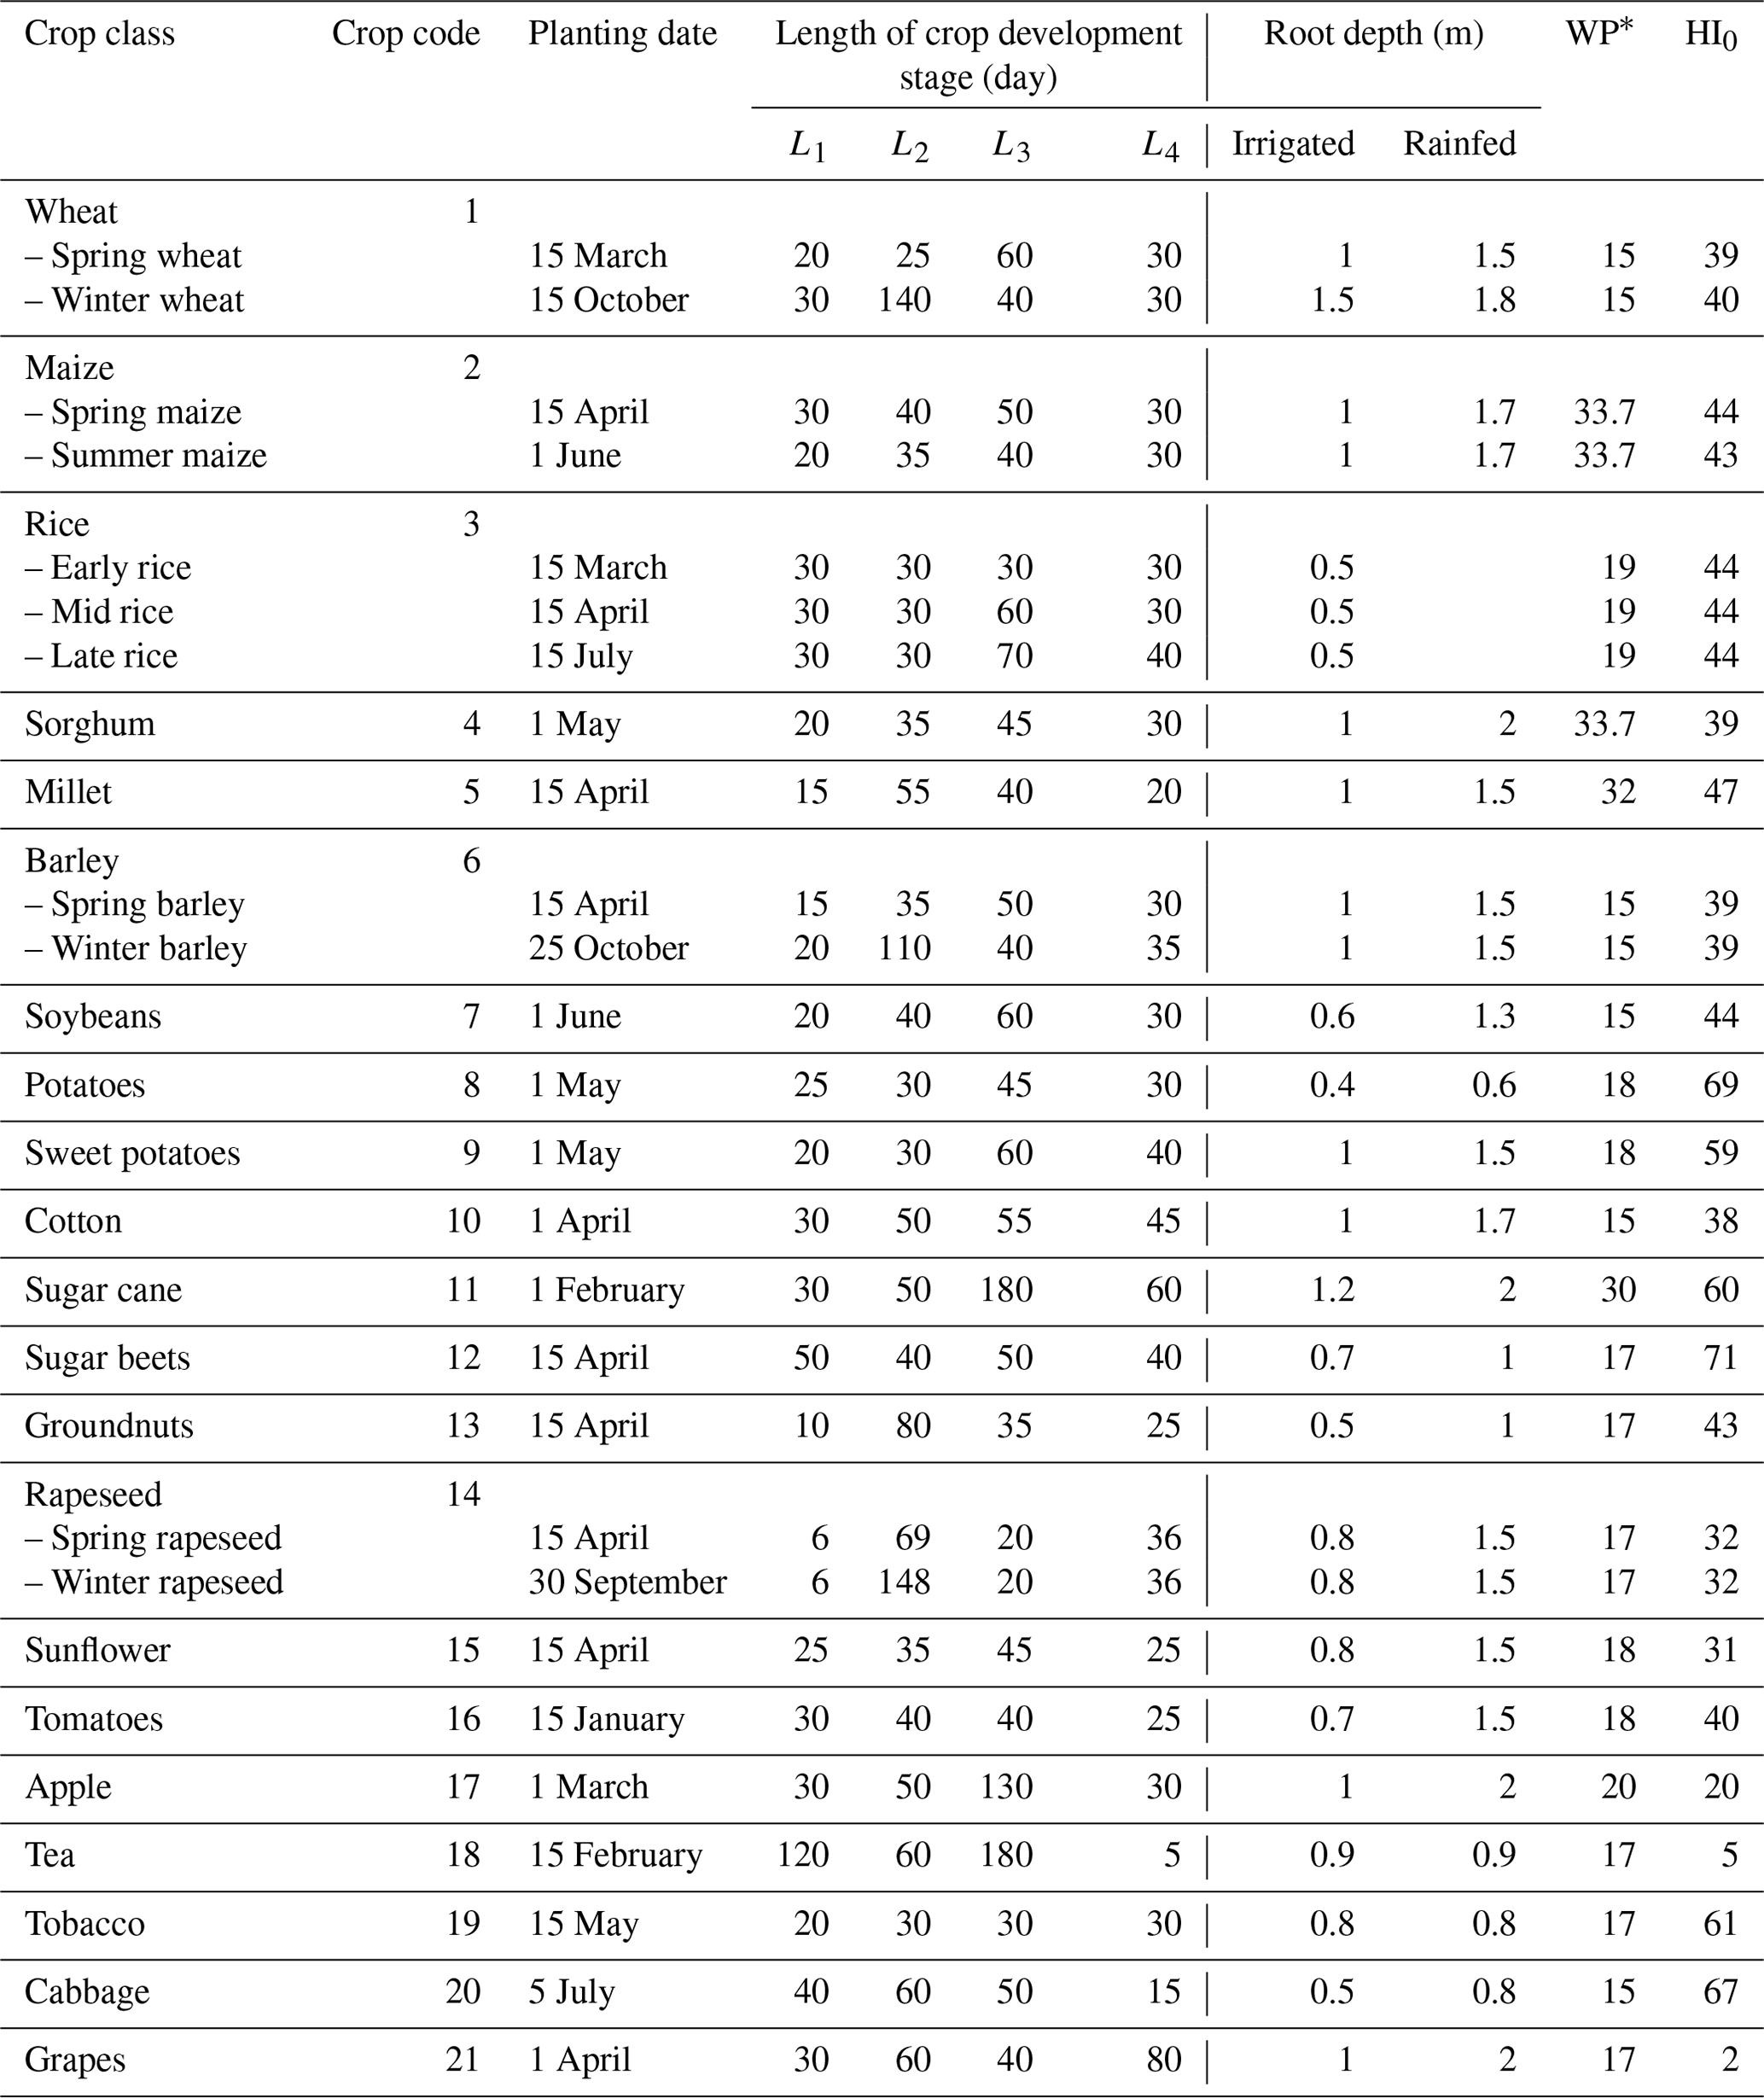
2.1.3 Crop characteristics
The characteristics of crops selected for this study are listed in Table 2. Due to differences in their phenology, wheat, maize, barley, and rapeseed had two sowing periods, whereas rice had three sowing periods across the study's time frame. The growth period of all crops was divided into four stages based on their growth characteristics (Allen et al., 1998; Vanuytrecht et al., 2014): the initial (L1), crop development (L2), mid-season (L3), and late-season (L4) growth stages. Crop planting dates were retrieved from Chen et al. (1995). The phenology selection procedure is delineated and the sensitivity analysis of WFCP to phenology are performed within the phenology selection of the data and methods in the Supplement. The reference harvest index (HI0) is from Xie et al. (2011) and Zhang and Zhu (1990), and the crop growth stages and maximum root depth are from Allen et al. (1998) and Hoekstra and Chapagain (2006).
2.2 Methods
2.2.1 Spin-up for the model
To establish the initial soil moisture content at the beginning of the growing season, the method and assumptions proposed by Siebert and Döll (2010) were adopted. Following their approach, the initial soil moisture content was generated utilizing the maximum soil moisture content of rainfed fallow land in the 2 years preceding the planting period. The initial soil moisture at the start of the growing period is assumed as green water. Such settings and assumptions have been extensively applied with acceptable uncertainties (Chiarelli et al., 2020; Hoogeveen et al., 2015).
2.2.2 Parameterization of perennial crop
In AquaCrop, the simulated annual crops are programmed to die at the harvest stage, signifying the completion of their life cycle, upon which their biomass is reduced to zero. This stands in contrast to perennial plants, such as tea and apple trees, where the harvest of fruits does not result in the complete loss of the standing biomass. To accommodate the simulation of perennial crops in AquaCrop, the model is used differently than the normal model set-up. We attempted to simulate the perennial crops by simulating the foliage, twigs, and stem of the plants following Poppe (2016). These components are considered the annual portion of perennial crops within the scope of this study. The remaining biomass, including major branches, is assumed to remain constant once the tree matures. Additionally, there will also be no root development for the crop. Since yield is a direct function of biomass and harvest index, adjustments are made to the harvest index to reflect its applicability to foliage, twigs, and stem biomass, rather than the whole biomass. Similar to other crops, the evapotranspiration of perennial crops is directly associated with the canopy cover.
2.2.3 Calculation of uWFCP
The blue and green uWFCP were obtained from the blue and green components of the WFCP (evapotranspiration during the crop growth period) in relation to the crop yield (Hoekstra et al., 2011):
where uWFCPb and uWFCPg are the blue and green uWFCP, respectively (m3 t−1); ETb and ETg are the blue and green WFCP (that is, WFCPb and WFCPg), respectively (mm) (see Eqs. 8 and 9); gp represents the days in the growing period; 10 is the unit conversion factor; Y (see Eq. 4 below) is the crop yield (t ha−1); and t indicates a given day.
The daily aboveground biomass production (B) was obtained as follows:
where WP∗ (t ha−1) expresses the aboveground dry matter produced per unit land area per unit of transpired water, which is governed by a combination of atmospheric CO2 concentration, crop type (C3 and C4 crops), and soil fertility. The WP∗ is multiplied with the ratio of crop transpiration (Tr) to the reference evapotranspiration (ET0) for that day. The goal of normalization is to make WP∗ applicable to diverse locations and seasons, including future climate scenarios.
The crop yield (Y) (t ha−1) was obtained by multiplying the aboveground biomass (B) with an adjusted reference harvest index,
where fHI is the calibration coefficient of the standardized harvest index HI0, which is influenced by water stress and temperature stress.
2.2.4 Dynamic daily soil water balance
By tracking the daily incoming and outgoing water fluxes at the root zone boundary, the dynamic daily soil water balance was calculated as follows (Mekonnen and Hoekstra, 2010):
where S is the soil water content (mm); PR is the precipitation (mm); IRR is the irrigation water volume (mm); CR is the capillary rise from groundwater, assumed to be zero (mm); RO is the surface runoff (mm); DP is the deep soil percolation (mm); and ET is the actual evapotranspiration (mm), consisting of soil evaporation (E) and crop transpiration (Tr), which were calculated as follows:
where Kr is the evaporation reduction coefficient, which is less than 1 (dimensionless); Ke is the soil evaporation coefficient, which is proportional to the fraction of the soil surface not covered by the canopy (dimensionless); Ks is the soil water stress coefficient, which is smaller than 1 when there is insufficient soil water to meet the evaporative demand of the atmosphere (dimensionless); is the cold stress coefficient, which drops below 1 when the temperature is insufficient for growth (dimensionless); and is the crop transpiration coefficient, which is proportional to the green canopy cover (dimensionless).
By tracking the proportional contribution of daily rainfall and irrigation water to each element of the soil water balance, ETb[t], ETg[t], Eb[t], Eg[t], Trb[t] and Trg[t] were extracted (Zhuo et al., 2016c; Chukalla et al., 2015):
where Sb[t] and Sg[t] are the blue and green soil water content (mm) for a crop, respectively, at the end of day t. Following Zhuo et al. (2016c), the green water value was used as the initial soil water content in each calculation cell.
2.2.5 Irrigation practices module
Different irrigation practices indirectly affect water consumption during the growth period due to differences in the fraction of the surface wetted (fw) by each method (Raes et al., 2018). The soil evaporation coefficient (Ke) was multiplied by the fw value to account for partial wetness when only a portion of any soil surface was irrigated. This irrigation-practices-differentiation approach commonly has been used before (Pereira et al., 2015; Wang et al., 2019; Chibarabada et al., 2020; Li et al., 2022; Yue et al., 2022). We employed a supplementary irrigation strategy whereby irrigation is applied when soil moisture falls below the plant wilting point to bring it up to field capacity. Owing to special environmental restrictions, furrow irrigation was used for rice planting in this study. Specific irrigation conditions were divided into either sufficient or water-demanding subtypes (irrigation to field capacity when the soil water content reached the wilting point):
where the fw values used for furrow, sprinkler, and micro-irrigation were 80 %, 100 %, and 40%, respectively; (1 – CC∗) is the dimensionless adjusted fraction of the non-covered soil surface (dimensionless); CC is canopy cover (m2 m−2); and is the maximum soil evaporation coefficient (dimensionless) for fully wet and non-shaded soil surfaces.
2.2.6 Benchmarks for uWFCP
In contrast to variables such as rainfed and irrigated croplands, wet and dry years, warm and cold years, different soil types, climate zone was evidenced to be the key factor influencing regional uWFCP benchmarks (Zhuo et al., 2016b). Therefore, we classified China's climatic regions based on the aridity index (Middleton and Thomas, 1997) (AI; defined as the ratio of rainfall to reference evapotranspiration) and set up regional uWFCP benchmarks for humid (AI >0.5) and arid (AI <0.5) zones. The uWFCP of each grid in the same climate zone was ranked from lowest to highest, and the uWFCP corresponding to a cumulative crop production of 10 %, 20 %, and 25 % of the total production were recorded as the regional uWFCP benchmarks (Mekonnen and Hoekstra, 2014; Zhuo et al., 2016b; Wang et al., 2019; Yue et al., 2022).
2.3 Calibration and validation
2.3.1 Production calibration
Given the data accessibility, the current study utilized provincial statistics to validate the simulated production by scaling each grid-based simulated result using provincial calibration coefficients (R), rather than forcing the simulated production of all grids within a province to a constant value (Mialyk et al., 2022; Yue et al., 2022; Zhuo et al., 2016a). This approach maintained the spatial variability of simulated production within each province:
where P_PNBSC is the statistical (sta) provincial crop production (t yr−1), i represents the water supply modes and irrigation practices, P_Gi,sim is the simulated (sim) grid crop production value (t yr−1) according to i, and P_Gi,act is the actual (act) grid crop production value (t yr−1) according to i.
It should be noted that although provincial yearbooks include some city-level crop production data, considering the numerous crop types involved in this study and the division of certain crops by harvest periods (e.g. winter wheat, spring wheat, early rice, mid rice, and late rice), there are indeed many instances of missing and incomplete data at the city scale. The meteorological and soil factors are critical factors affecting the estimation of WFCP (Zhuo et al., 2014; Tuninetti et al., 2015). Consequently, the simulated outcomes can exhibit spatial heterogeneity after integrating high-resolution soil texture, precipitation, temperature, and other model inputs, even with provincial production calibration.
2.3.2 Remote sensing validation
Because of the spatially fragmented nature of crop cultivation, the water consumption results of the current study were validated against the dual-source (PML-V2(China)) and single-source (SEBAL) remote sensing products over screened grids to reduce the interference of non-agricultural land with the validation results. According to Chinese Agricultural Cropping System (IGSNRR, 2022), we selected grids in which the sum of planted areas was greater than 5 kha (>50 % of a single grid) and greater than 10 kha (>100 % of a single grid) for single- and multi-crop regions, respectively. In terms of the time span, 19 of the 21 crops studied experienced growth periods from April to August; therefore, these 5 months were set as the validation interval in terms of total evapotranspiration. The PML-V2 (He et al., 2022) and SEBAL (Cheng et al., 2021) products had spatial resolutions of 500 m and 1 km, respectively, with a temporal resolution of 1 d. Bilinear was implemented to resample the data to 5 arcmin. Notably, the SEBAL products solely comprised aggregate evapotranspiration figures, whereas the PML-V2 separated land surface evapotranspiration into vegetation transpiration (Ec), soil evaporation (Es), evaporation of intercepted precipitation (Ei), and water body evaporation (Ew). In this study, Ec + Es, Ec, and Es were compared with the generated ET, E and Tr data, respectively.
2.3.3 Publications comparison
The present dataset was compared with published studies that included temporal and spatial data overlaps. The comparison included the crop planting area at the grid scale (IFPRI, 2019; Grogan et al., 2022), and the WFCP and uWFCP values at the grid and national scales (Mekonnen and Hoekstra, 2011; Zhuo et al., 2016a; Chiarelli et al., 2020; Cheng et al., 2021).
2.3.4 Accuracy assessment
The linear regression coefficient (R2) was used to measure the consistency between the statistical data, remote sensing data, and simulated results. The root mean square error (RMSE) metric was utilized to evaluate model performance. Mathematically, the R2 and RMSE can be expressed as
where n indicates the number of samples; xi and refi represent the simulated and statistical values (remote sensing data), respectively; and and are the mean values of the simulated and statistical values (remote sensing data), respectively.
3.1 Water footprint of crop production
During the study period, the WFCP of 21 crops in China increased by 13 % to 690 Gm3 yr−1 in 2018, with WFCPb and WFCPg accounting for 29 % and 71 % of this increase, respectively. The WFCPb and WFCPg varied greatly across crops, time, and space. Table 3 presents the WFCP of the 21 crops under different water supply modes and irrigation practices in 2018. Maize (165 Gm3 yr−1), rice (143 Gm3 yr−1), and wheat (125 Gm3 yr−1) had the highest annual average WFCP, accounting for 67 % of the total WFCP. The WFCP of grapes (177 %) and maize (94 Gm3 yr−1) showed the greatest growth rate, with their planting areas expanding by 156 % and 82 %, respectively (NBSC, 2022).
Table 3WFCP and planting area under different water supply modes and irrigation practices for 21 crops in 2018.
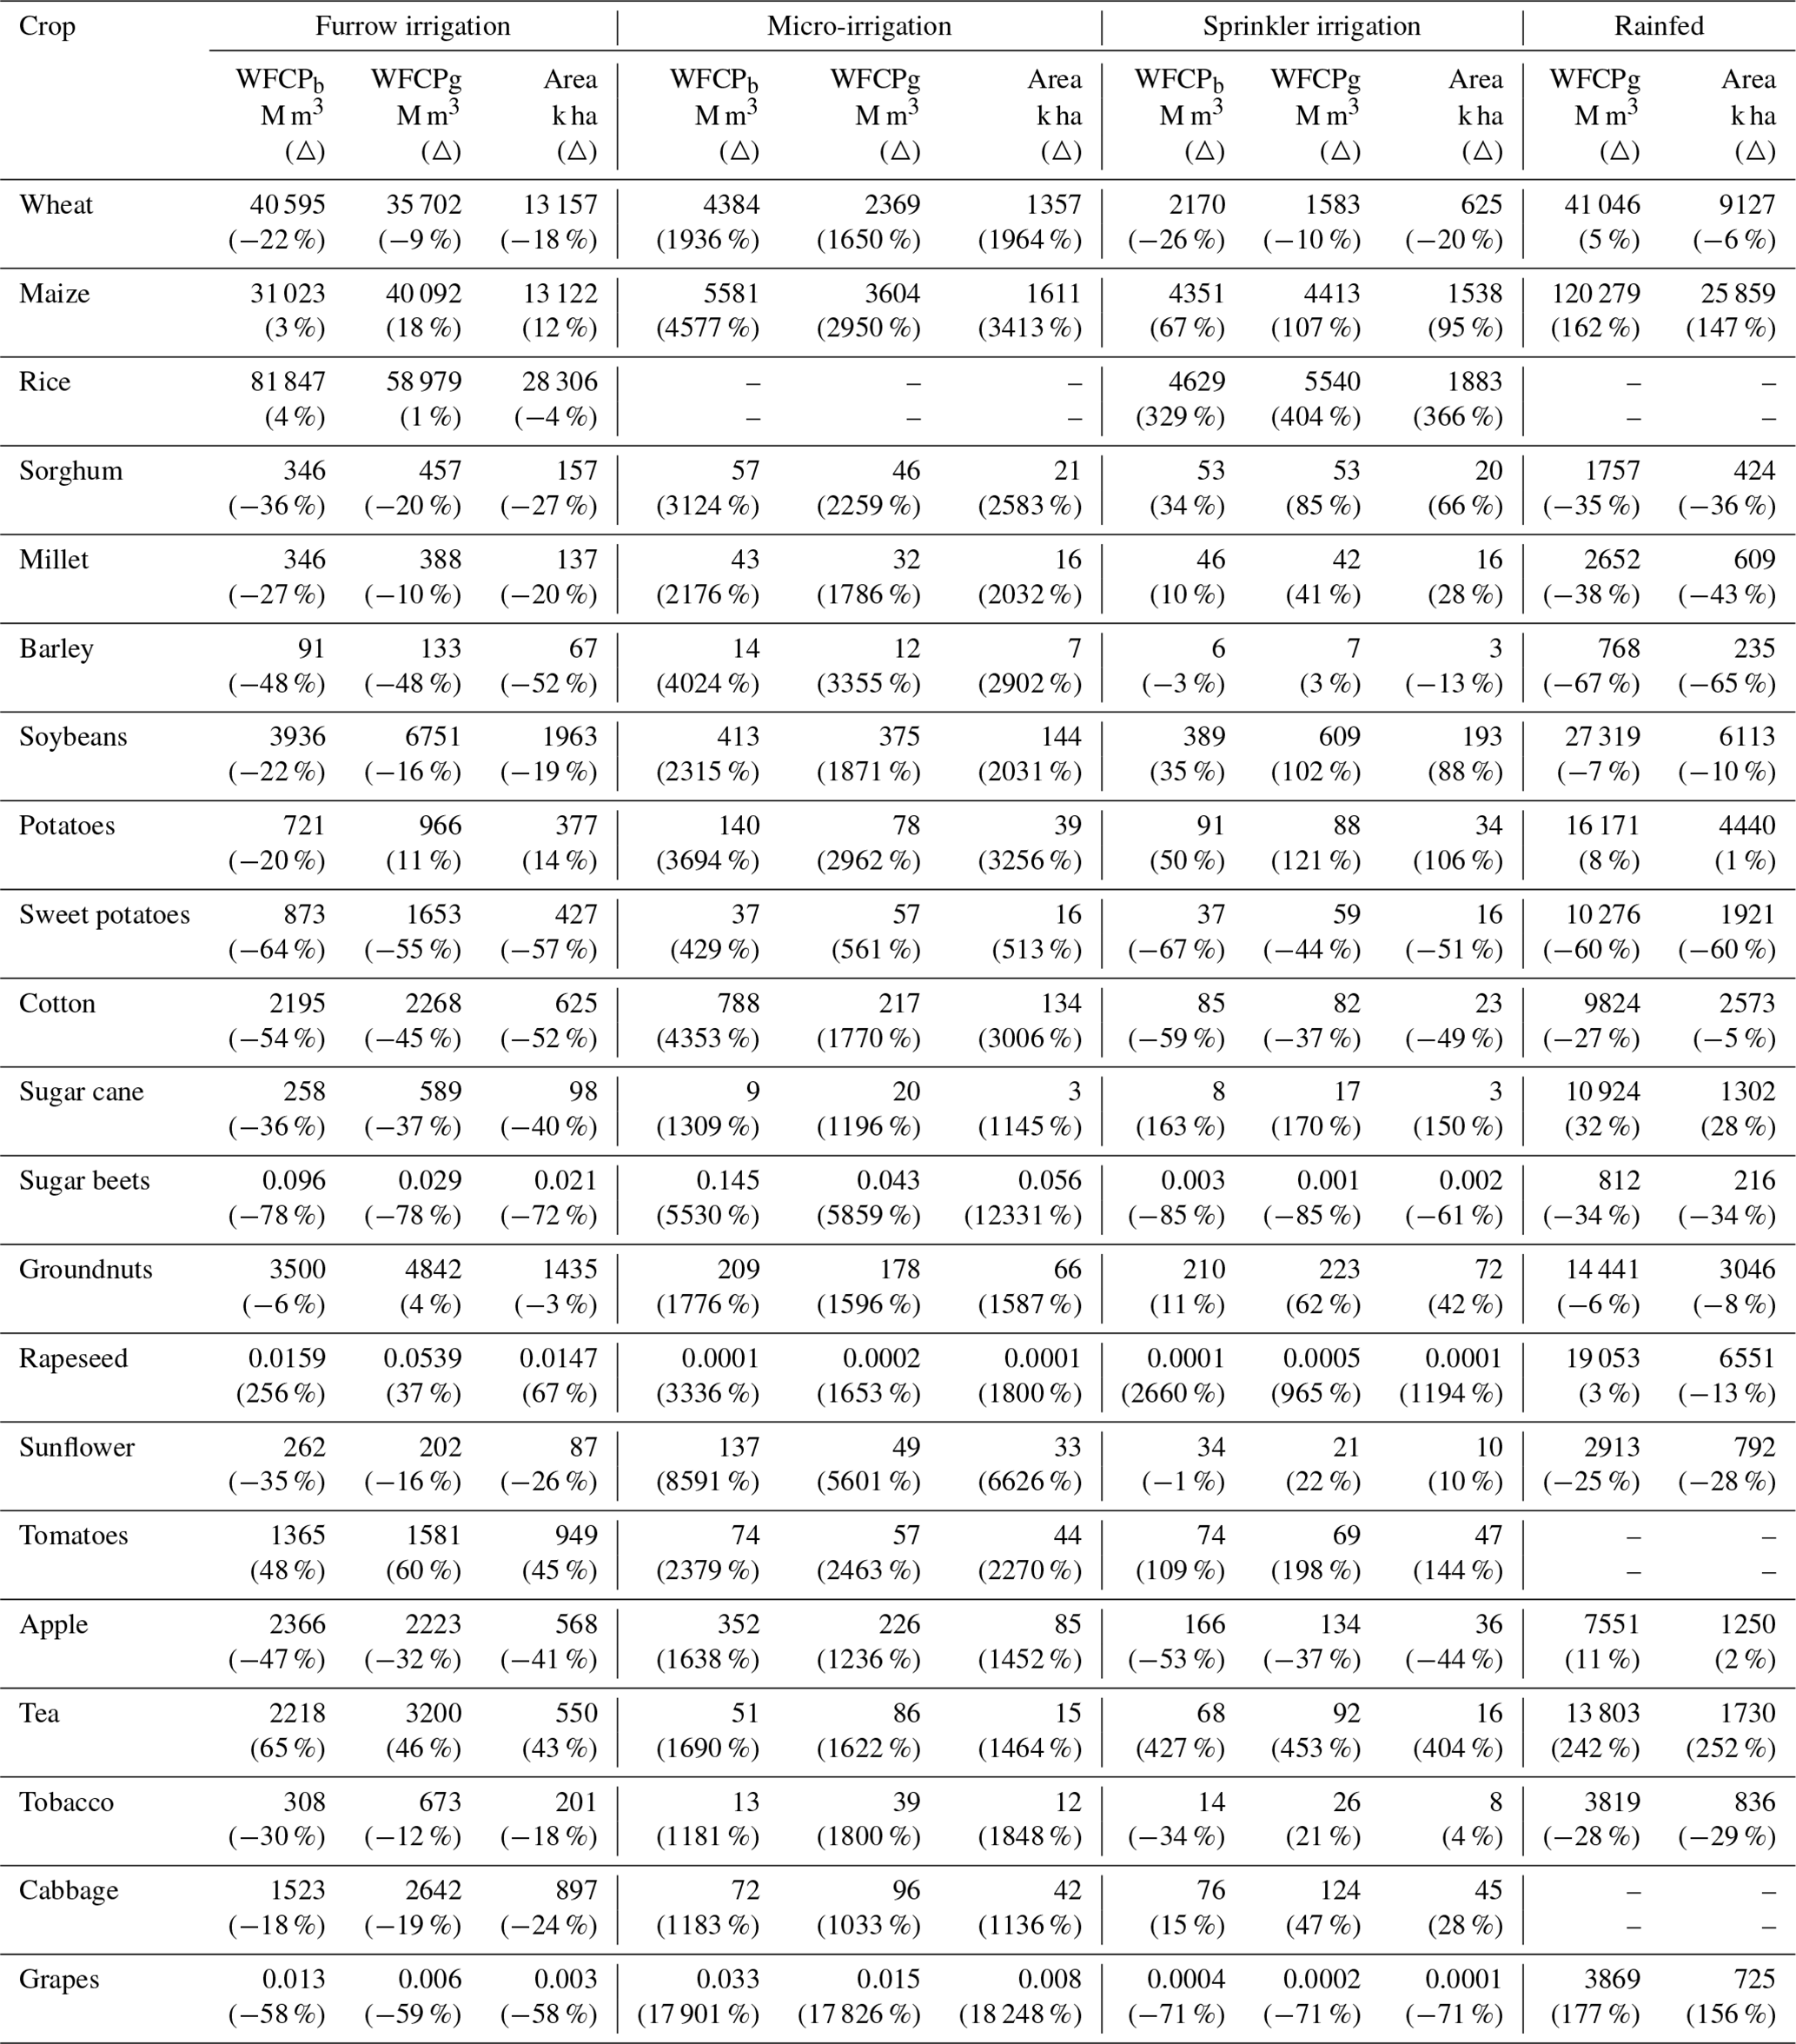
Note: “△” refers to the rate of change from 2000 to 2018. Dashes indicate that no crops were grown.
In addition, the annual average proportions of WFCP attributable to furrow irrigation and rainfed conditions reached 53 % and 44 %, respectively (Fig. S1 in the Supplement). Nevertheless, the WFCP of sprinkler and micro-irrigation expanded by 11 and 19 Gm3 yr−1, respectively, increasing their proportional contribution to the total WFCP by respective factors of 1.6 and 23. Over the same period, WFCP under furrow irrigation decreased by 5 %. Considering the positive correlation between WFCP and the cultivated area under different water supply and irrigation practices, the above results reflect that sprinkler and micro-irrigation planting modes are being deployed more often on existing and freshly reclaimed farmland in China (NBSC, 2022). Given the large scale of crop cultivation in China, such a significant shift in irrigation practices will have important implications: (i) it will affect the quantification of national crop water consumption and (ii) it will create market opportunities while concurrently propelling technological innovation in the irrigation infrastructure. In conclusion, when quantifying and evaluating the WFCP, it is vital to consider the influence of various water supply modes and irrigation practices (Wang et al., 2019).
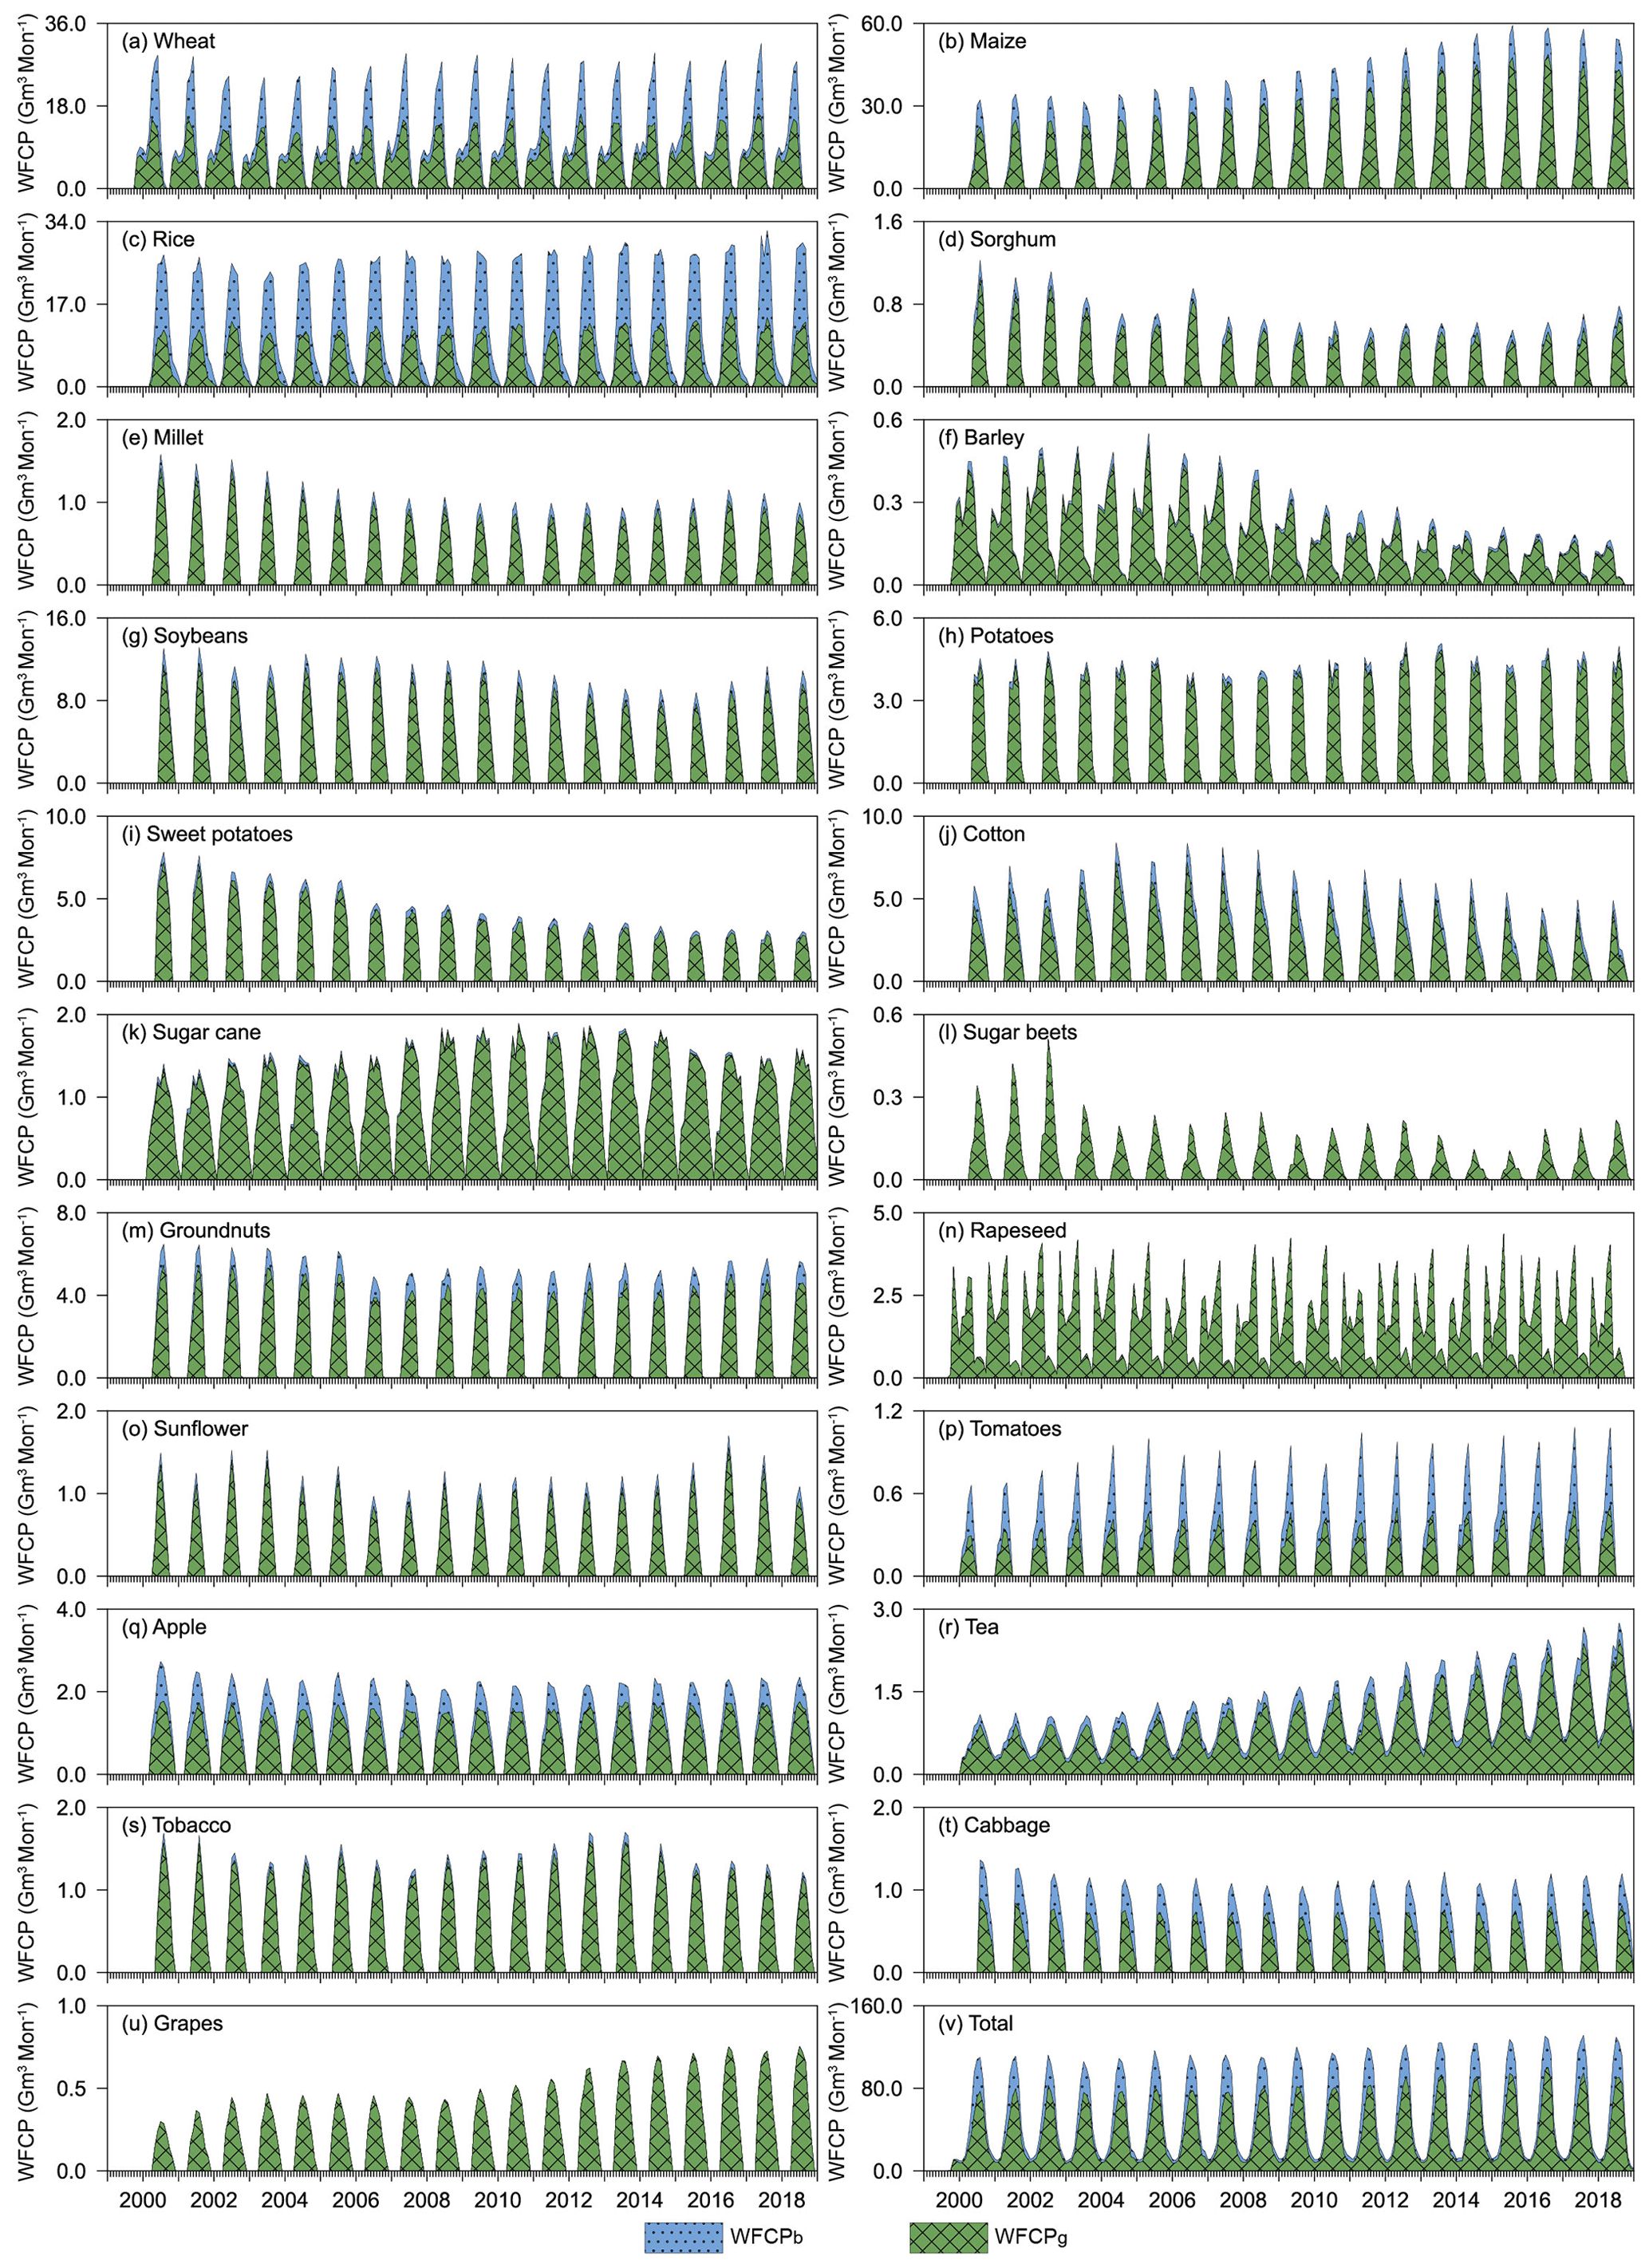
The water source accessed for crop production varied cyclically across years (Fig. 2). The WFCPb peaked annually in May, with an average annual value of 16 Gm3 per month; water usage by rice and maize crops was responsible for 40 % and 37% of this value, respectively. In January and February of each year, the WFCPg comprised almost 75 % of the monthly WFCP. The annual peak of the WFCPg alternated between June and July, with an average annual value of 83 Gm3 per month, 40 % of which was attributable to water consumption by maize crops. The monthly WFCP values revealed that the peaks of evaporation (average annual value of 45 Gm3 per month) and transpiration (average annual value of 56 Gm3 per month) for the 21 crops occurred in May and July, respectively (Figs. S2 and S3). The monthly WFCP fluctuated within each crop; nevertheless, the relative contributions of evapotranspiration and transpiration to total water consumption during the same growth period varied less from year to year. The above analysis allowed us to identify the quantity, type, and periods of water consumption by each crop.
The grid-scale spatial distributions of the monthly WFCP, WFCPb, and WFCPg values are shown in Fig. 3. The months with large grid WFCP (WFCP >50 mm per month, WFCPb>10 mm per month, and WFCPg>30 mm per month) mainly comprised April to August. The northeast plain, north plain, and Sichuan basin contained the regions with the highest grid WFCP. The grid WFCP varied considerably among the 21 crops, but its spatial distribution was consistent within the planted area of each crop. In addition, the regional distribution of grid WFCPb and WFCPg values of each crop exhibited significant spatial heterogeneity (Figs. S4 and S5). The grid WFCP, WFCPb, and WFCPg of sprinkler irrigation at the monthly and annual scales were significantly higher than those of the other two irrigation practices, and high-value regions were concentrated in the northeast, southwest, and south of China (Figs. S6–S10). This is attributable to the substantially higher surface wetting fraction achieved with sprinkler irrigation relative to furrow and micro-irrigation, which augments crop water consumption per unit cultivated area during the growing period by affecting the soil evaporation coefficient (Eqs. 6, 7, and 14). The relative blue and green water consumption via evaporation and transpiration depended on the natural conditions prevailing at the time and in the space where the 21 crops were grown, as well as the water supply modes and irrigation practices (Figs. S11–S14).
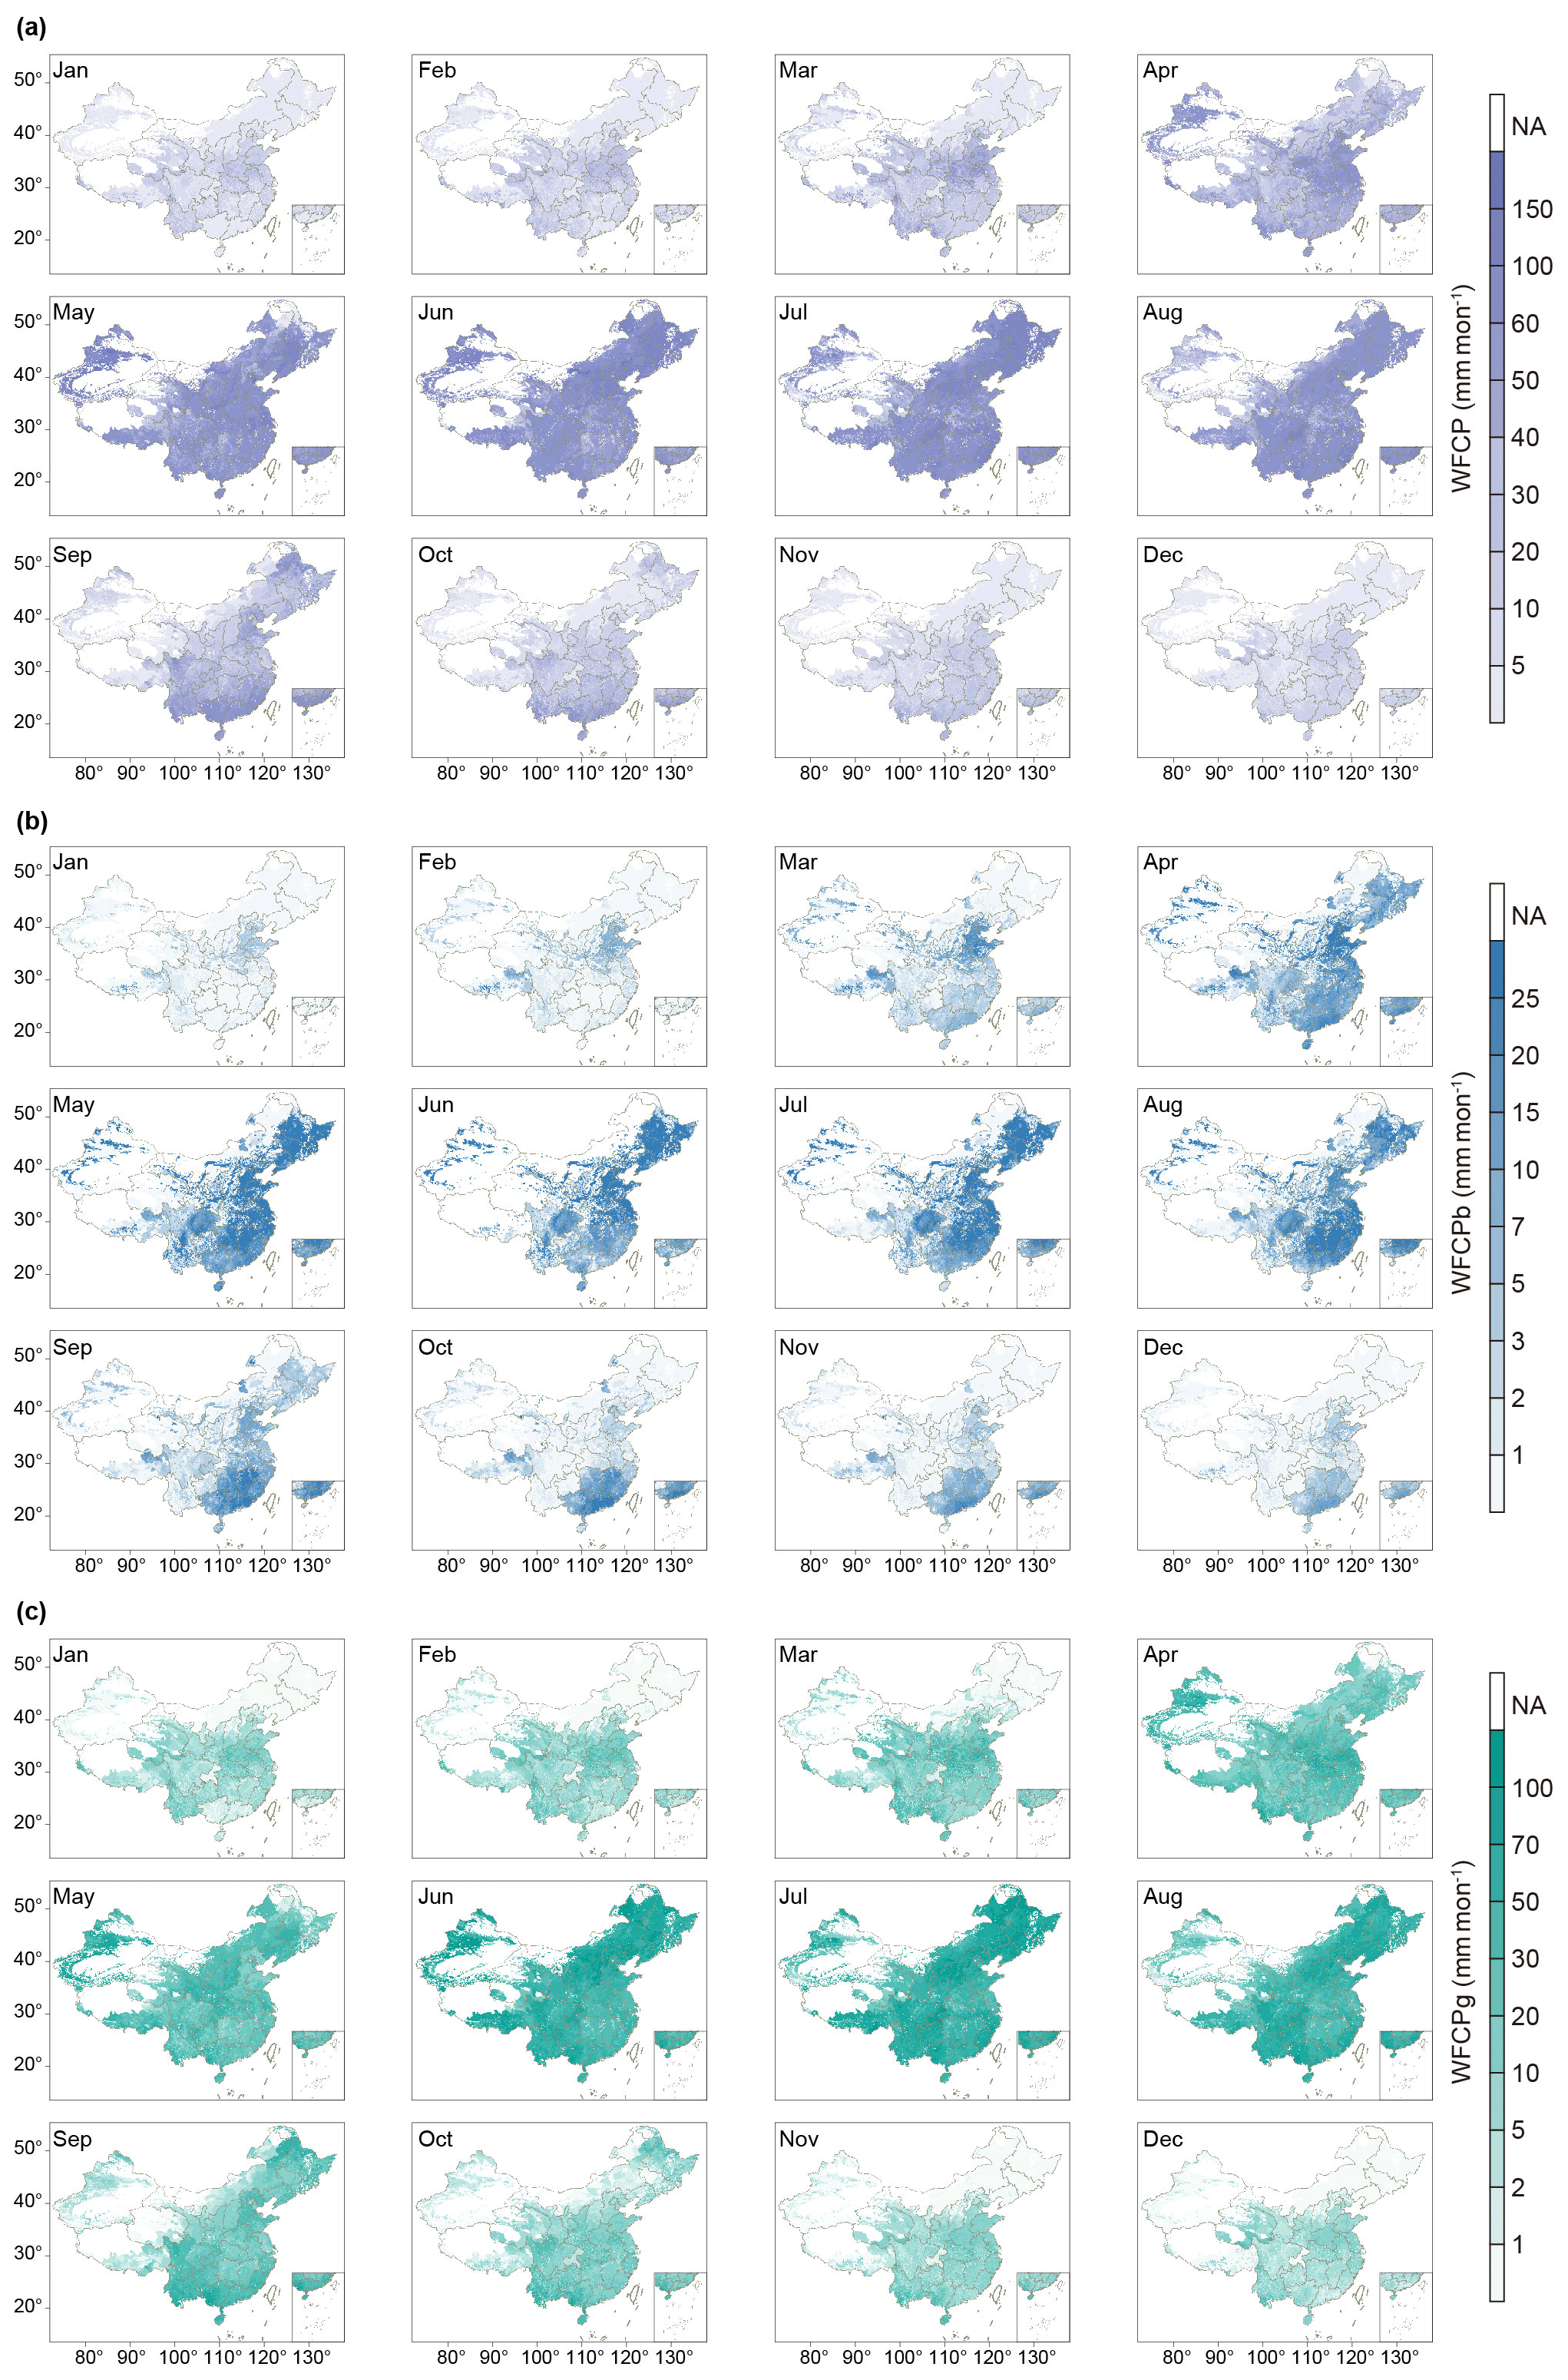
Figure 3Gridded monthly total WFCP (a), WFCPb (b), and WFCPg (c) of 21 crops in China by 2017.
3.2 Water footprint per unit of crop production
Tea (8372 m3 t−1), cotton (3974 m3 t−1), and tobacco (2242 m3 t−1) had comparatively large uWFCP, whereas fruits and vegetables had a uWFCP of less than 500 m3 t−1. Among the grain crops, wheat and maize had a uWFCP of 1110 and 883 m3 t−1, respectively. Late rice (826 m3 t−1) had a slightly greater uWFCP than early (654 m3 t−1) and mid (732 m3 t−1) rice. The uWFCP, uWFCPb, and uWFCPg for all 21 crops showed a trend of fluctuating decline during the study period as yield grew (Fig. 4). The uWFCP of cotton (51 %), sugar beets (52 %), and apples (55 %) showed the greatest reduction. The uWFCP of wheat and maize decreased by more than 25 %, because the yield increased by 45 % and 33 %, respectively.
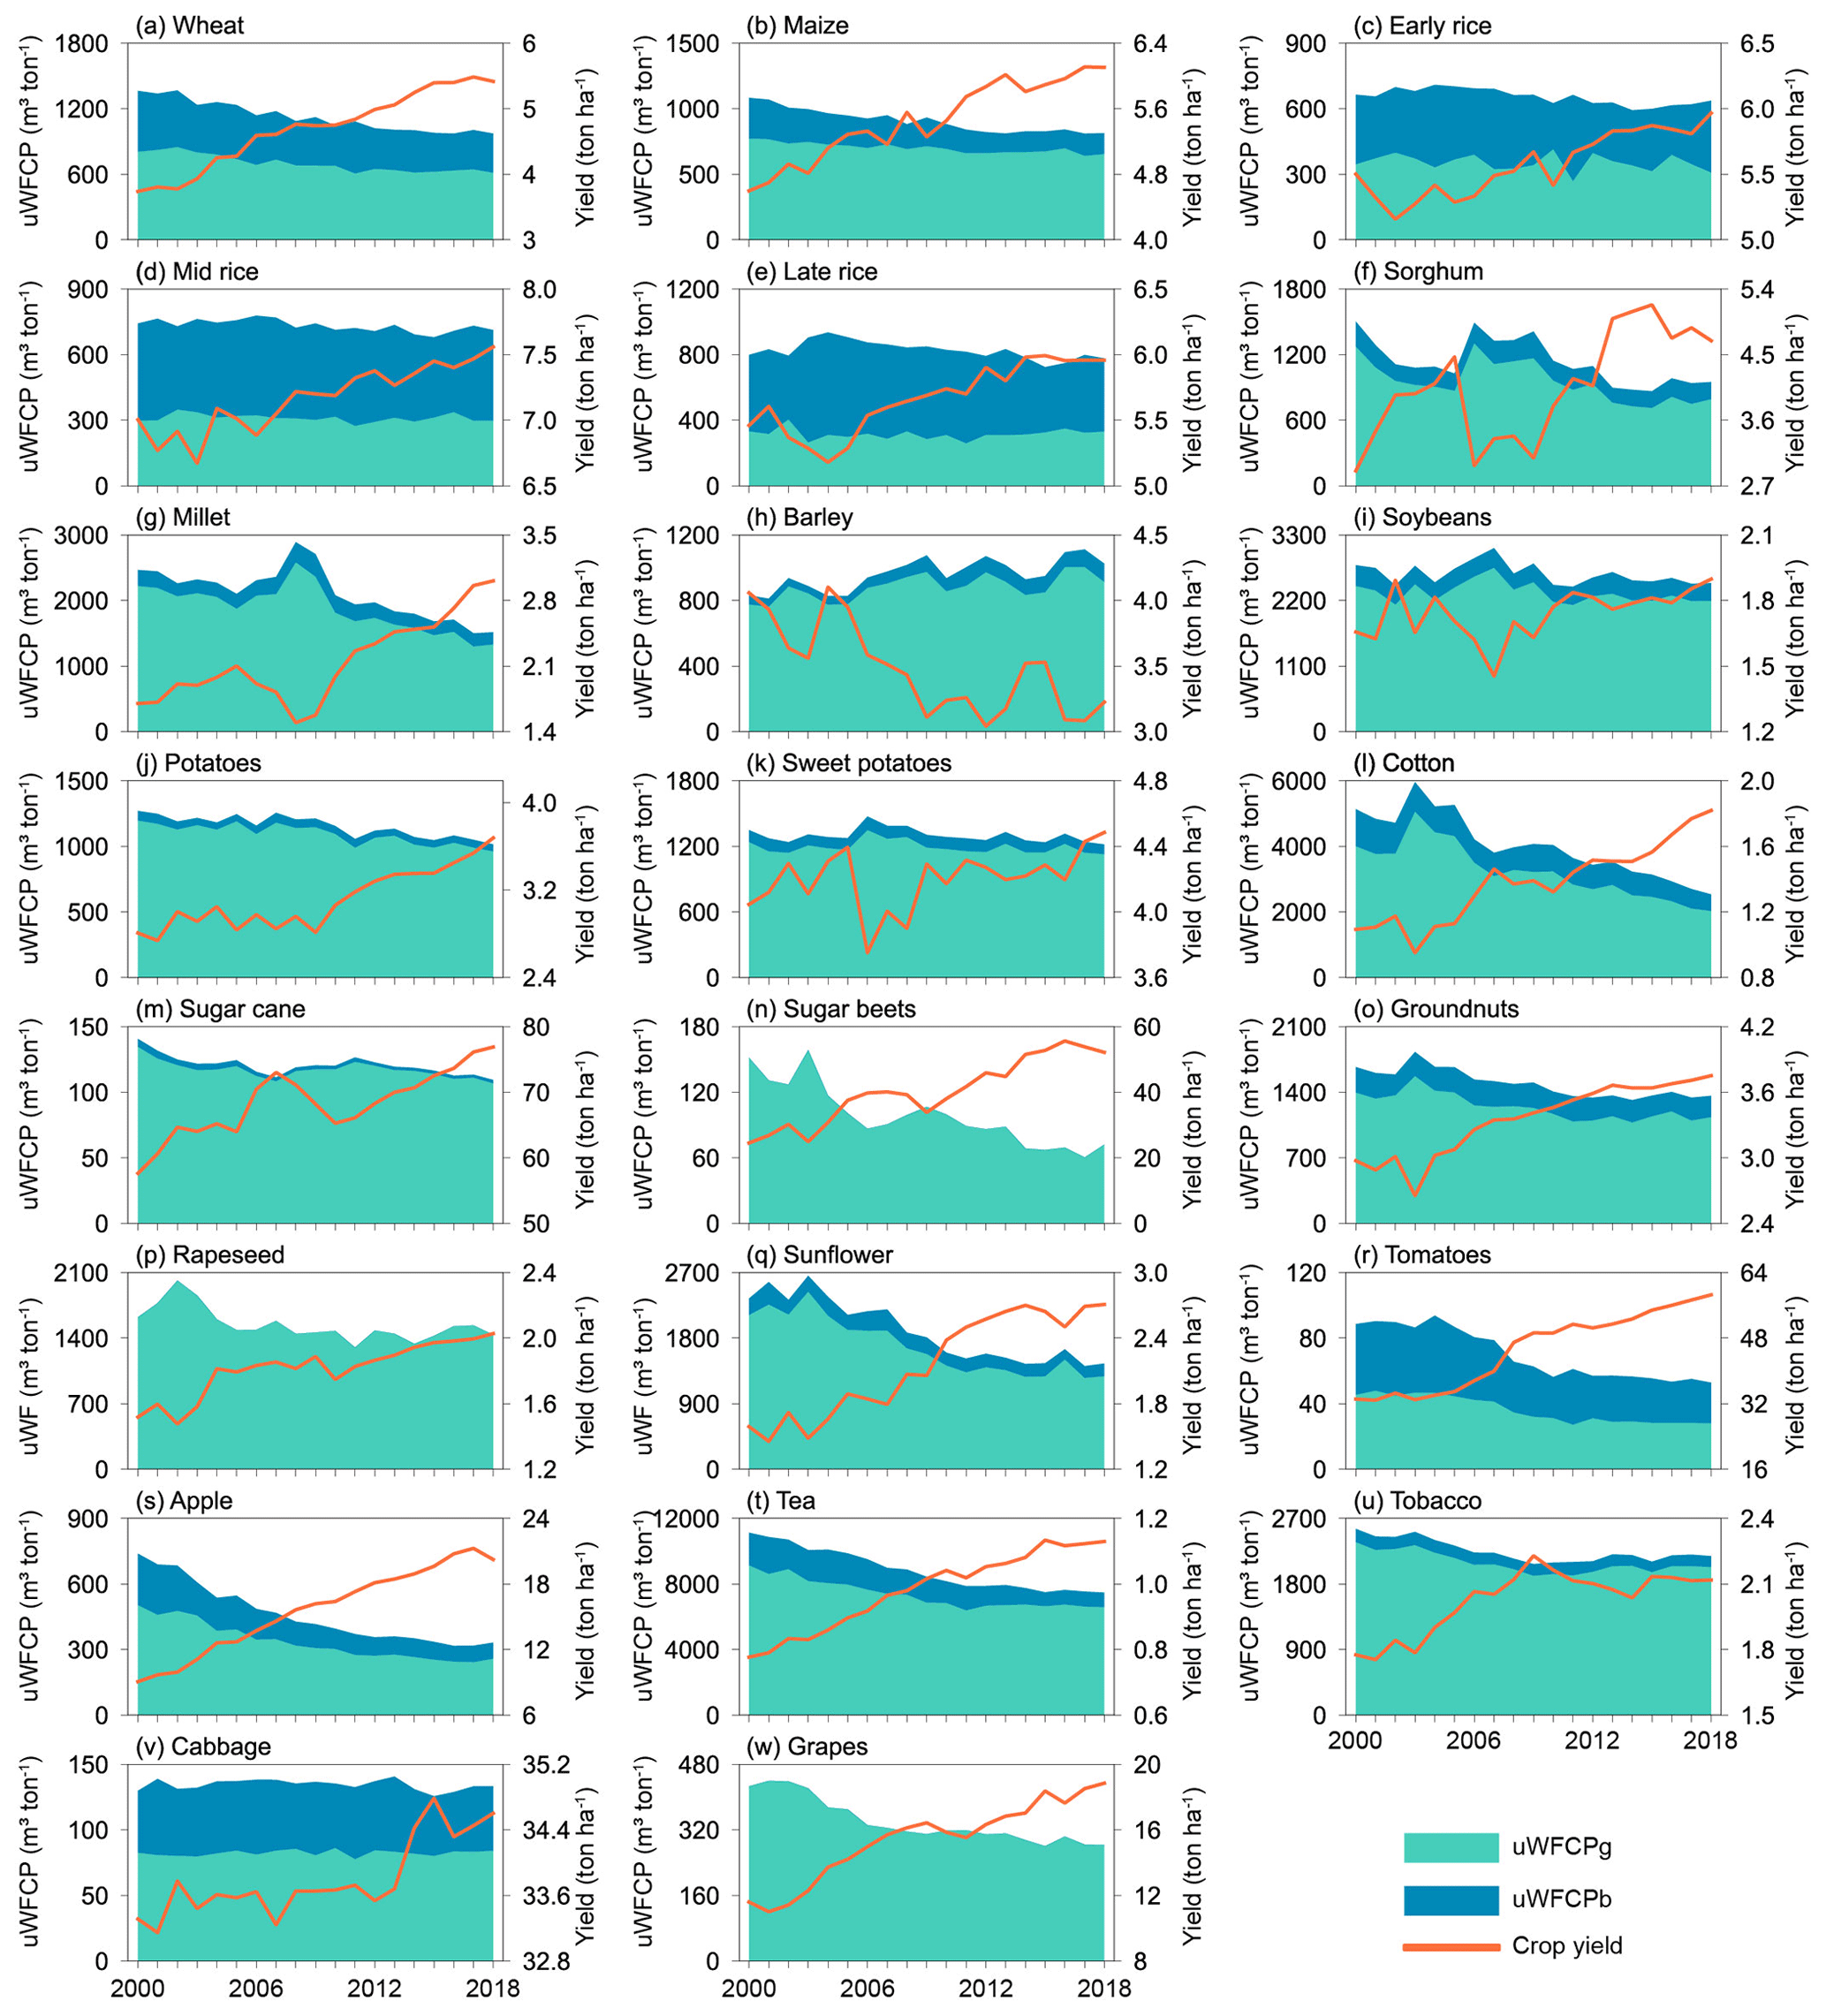
Figure 4Interannual variation in uWFCPb, uWFCPg, and yield of 21 crops in China over 2000–2018.
The uWFCP of the 21 crops was relatively high under rainfed conditions (Table 4, Fig. S15). Additionally, the uWFCPb, uWFCPg, and yield of each crop responded differently to the three irrigation treatments. These variations were caused by the fact that the proportions of blue and green water consumption via soil evaporation and crop transpiration differed between crops and irrigation practices (Fig. S16). For example, blue water consumption via crop transpiration in furrow and sprinkler irrigation accounted for 45 % and 51 % of the total crop water consumption, respectively, which was much lower than that of micro-irrigation (62 %). Therefore, the effects of different water supply modes and irrigation practices should be considered in the quantification of uWFCP over a long time series.
Table 4The uWFCPb, uWFCPg, and yield of 21 crops under different water supply modes and irrigation practices in 2018.
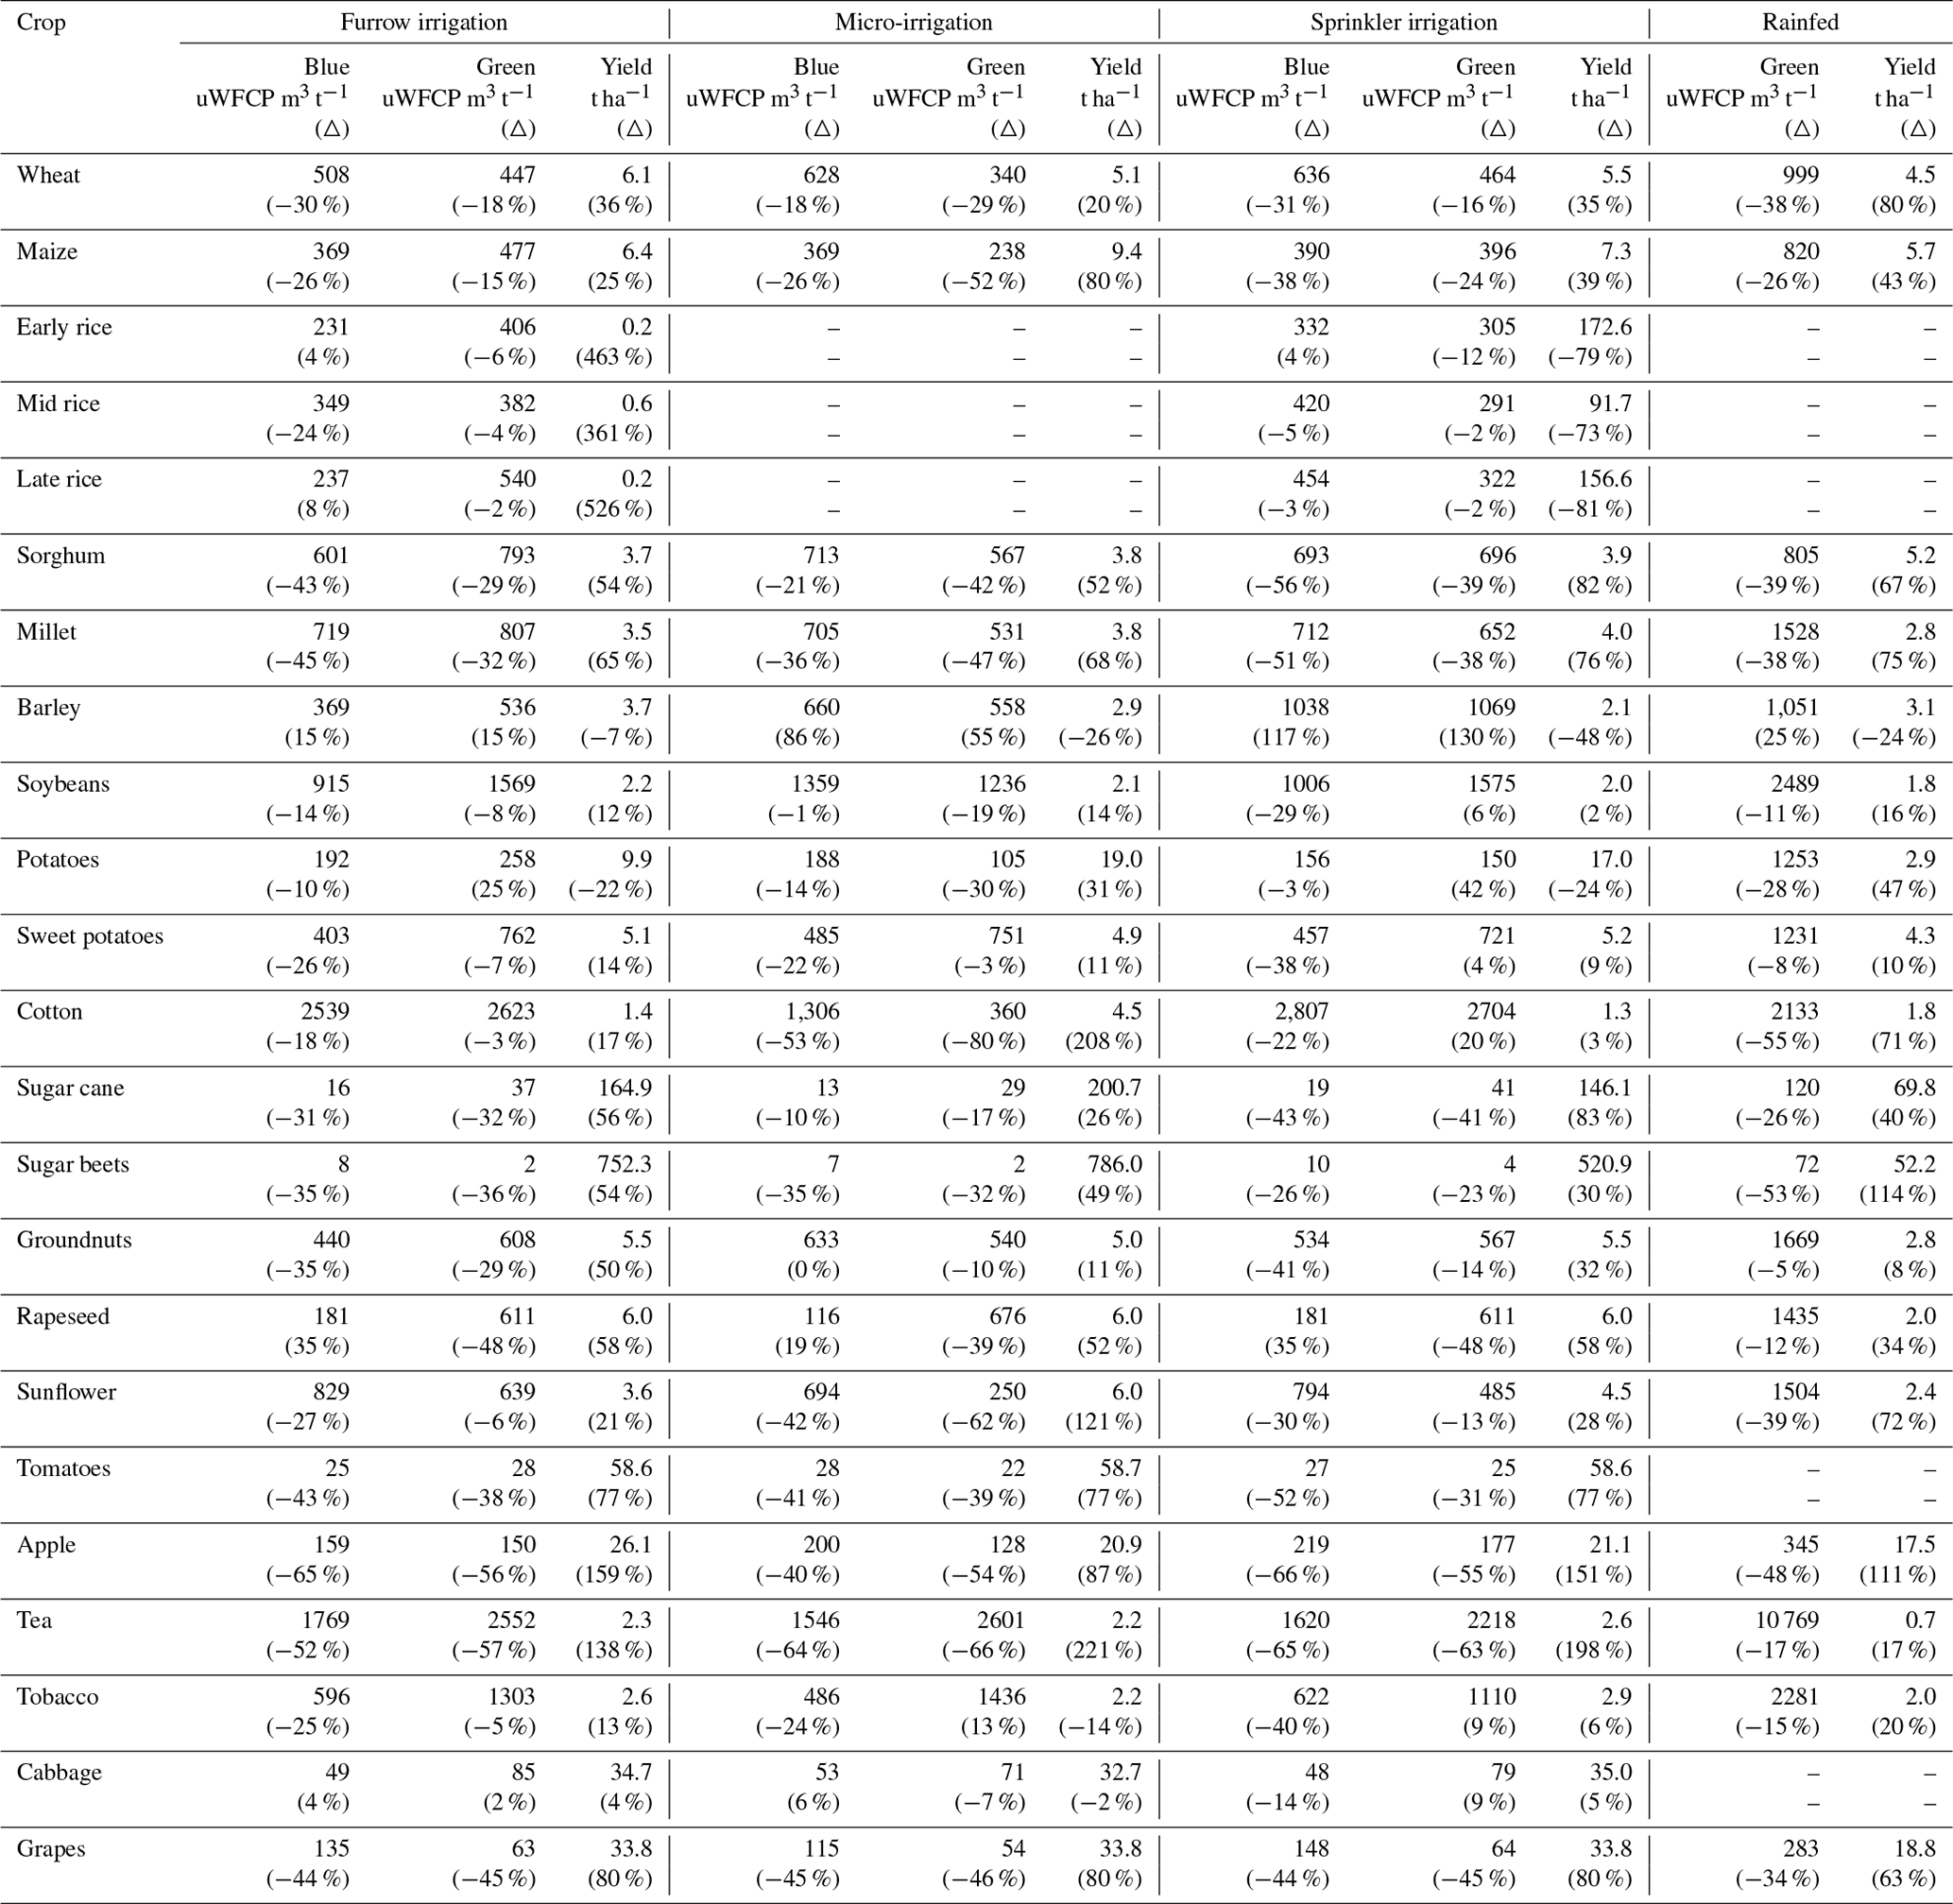
Note: “△” refers to the rate of change from 2000 to 2018. Dashes indicate that no crops were grown.
The spatial distribution of the gridded uWFCP showed significant heterogeneity (Figs. 5, S17, and S18). There were many regions with high-gridded uWFCP values for potatoes, which were concentrated in northern China. The crop with the densest distribution of high-gridded uWFCPb values was tea, which was commonly dispersed throughout the southern regions. Soybean and millet possessed more uWFCPg high-value areas, mainly in the northern regions. By comparing the relative changes in the average grid uWFCP from the period of 2000–2009 to that of 2010–2018, it was determined that the uWFCP of all 21 crops exhibited a spatially significant decreasing trend (Figs. S19–S21). It is essential to emphasize that the dominant factors governing this decrease in uWFCP varied among crops. For example, the decline observed in the uWFCP of apples was attributable to a substantially larger decrease in uWFCPg than the corresponding rise in uWFCPb, whereas that observed for tea was caused by a considerable decrease in uWFCPb.
For most crops, rainfed ones had more regions of high uWFCP than irrigated ones, and the geographical distribution of uWFCP for the same crop was generally consistent, regardless of irrigation practices. The variation in uWFCPb and uWFCPg for the same water supply mode and irrigation practice in a crop was considerable owing to regional water consumption and yield differences (Figs. S22 and S23). Additionally, the temporal evolution of uWFCPb and uWFCPg under various water supply modes and irrigation practices was analysed, and rainfed crops demonstrated a more rapid and wider reduction in uWFCP than irrigated crops.
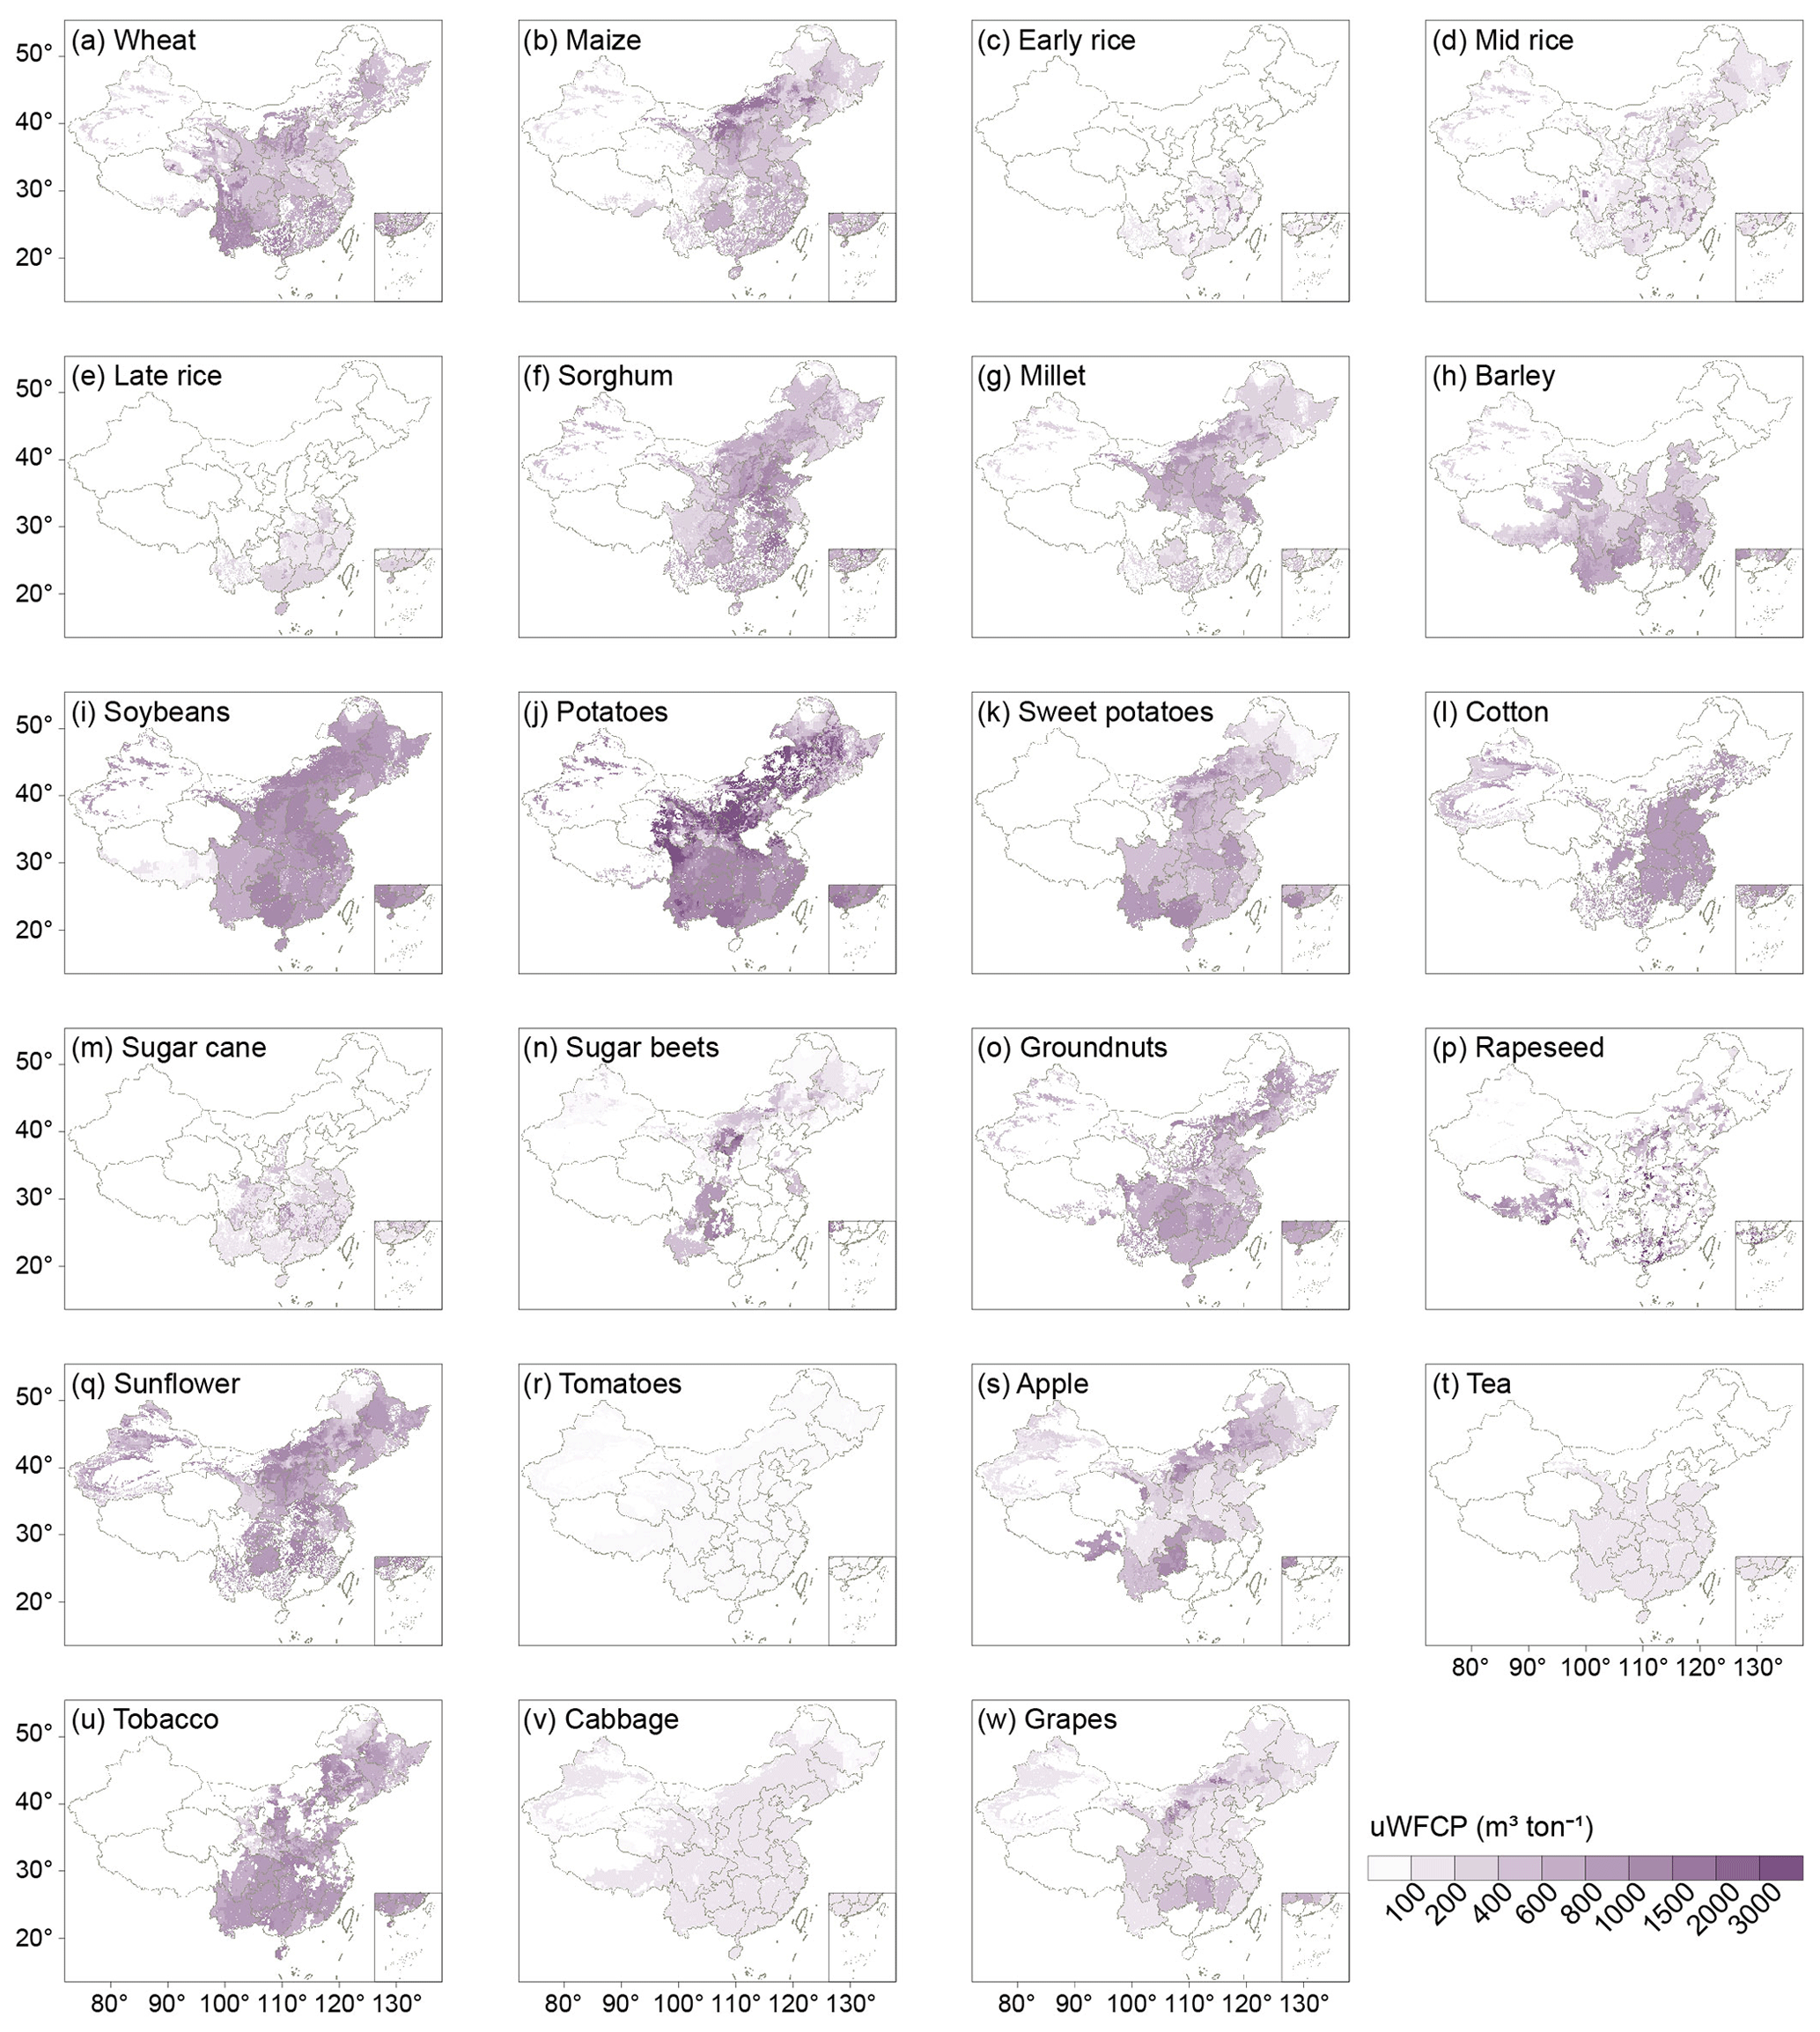
Figure 5Gridded uWFCP of 21 crops in China at annual average level for 2000–2018.
3.3 Benchmarks for uWFCP
Annual uWFCP benchmarks were calculated using the different production percentiles for each of the 21 crops under various water supply modes and irrigation practices. Significant interannual differences existed between these uWFCP benchmarks; therefore, we reassessed these benchmarks using whole time series measurements to reduce the impact of anomalous values resulting from extreme climate events. The crops uWFCP benchmarks in Table S1 in the Supplement can be selected as a reference for future analysis like that by Yue et al. (2022). Results show that benchmarks for the uWFCP of different crops responded differently to climatic zone. Crops such as millet, soybeans, and groundnuts had higher benchmarks for uWFCP in arid zones than in humid zones due to differences in production percentiles; the reverse was true for maize, cotton, and sunflower. Two factors contribute to these results: first, crops cultivated in arid zones are more irrigation reliant due to scarce precipitation and undergo greater evapotranspiration, resulting in higher uWFCP versus humid zones. Second, certain crops like cotton possess higher benchmarks in humid zones since their yields are markedly lower than those extensively grown in arid regions. Overall, the uWFCP benchmarks for rainfed crops were higher than those for irrigated crops. The uWFCP benchmarks for each irrigation practice varied by crop species.
Figures 6 and S26–S28 present the uWFCP benchmarks according to different production percentiles in humid and arid zones and as obtained for various water supply modes and irrigation practices. Except for vegetables (tomatoes and cabbage), the majority of crops were cultivated in regions with a uWFCP benchmark that exceeded the 25 % production percentile. Under furrow and sprinkler irrigation, the areas that fell below the uWFCP benchmark at the 25 % production percentile were predominantly distributed in the humid zone. In the arid zone, a greater proportion of micro-irrigated regions fell below the uWFCP benchmark at the 25 % production percentile. The results indicate that governing bodies need to consider the influence of climatic zones as well as water supply modes and irrigation practices when quantifying uWFCP benchmarks to identify hotspots for water-saving potential. Specific water-use policies need to be formulated both for crop varieties and irrigation practices.
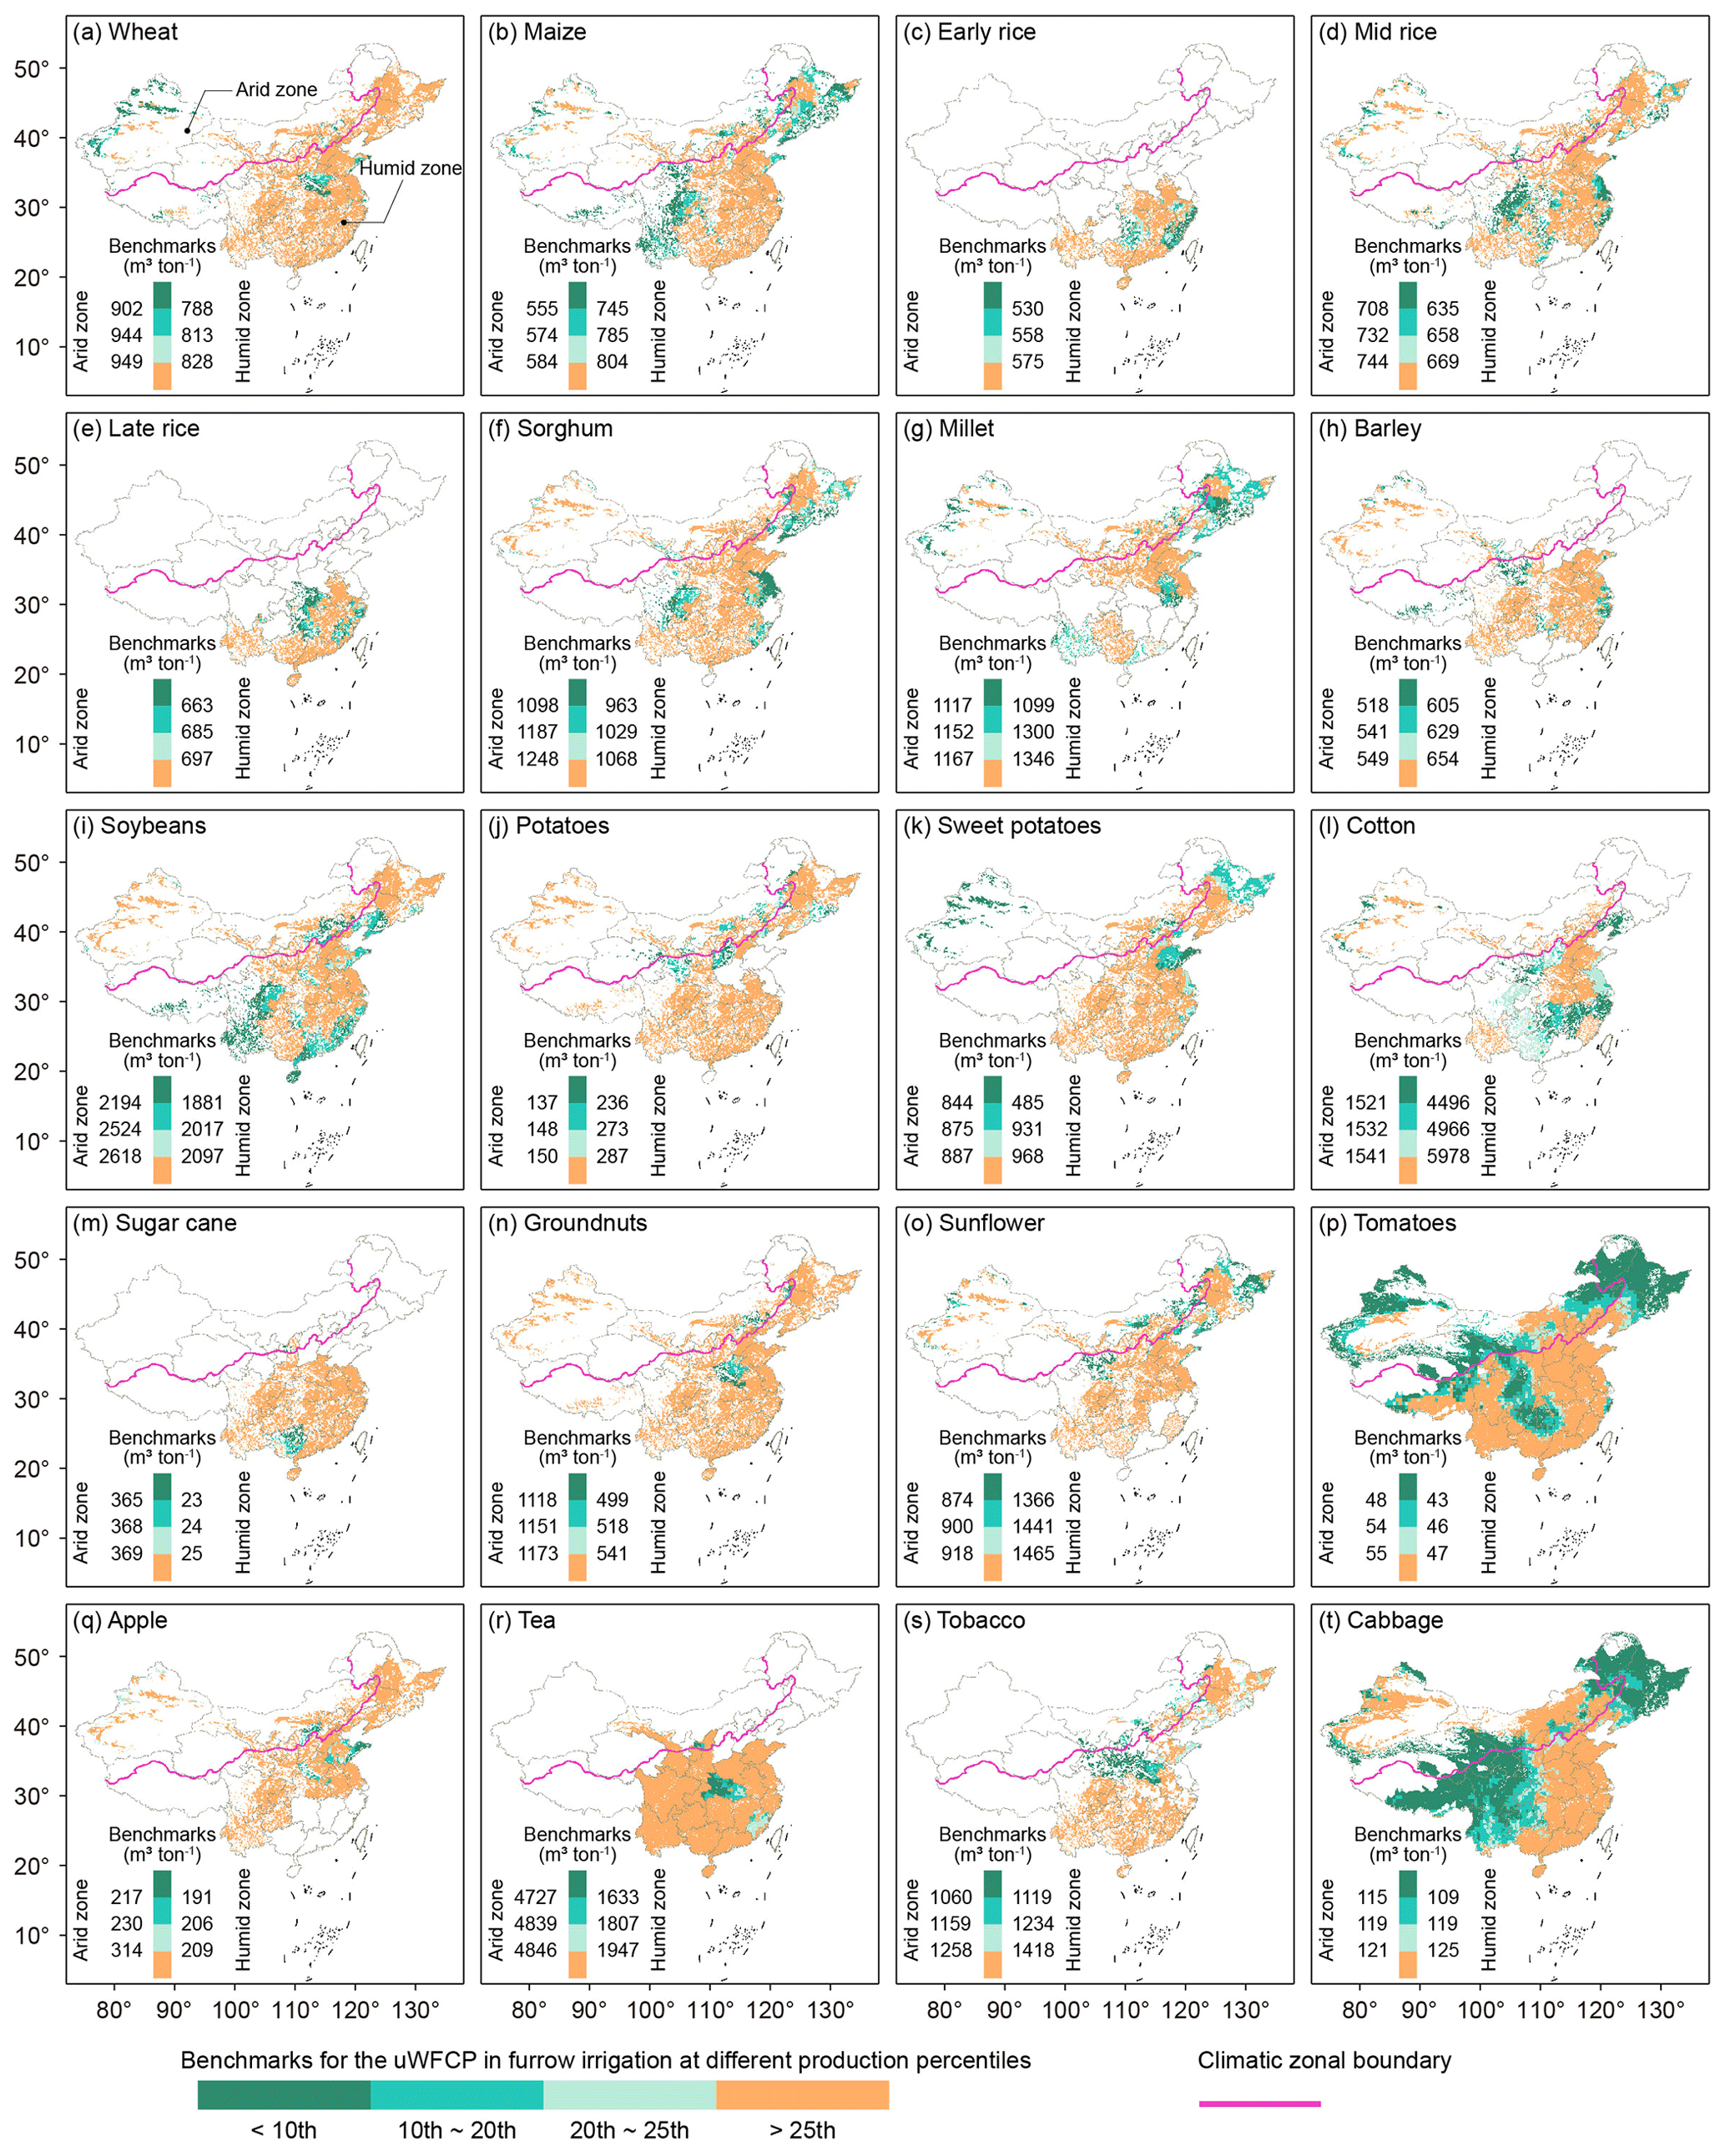
Figure 6Benchmarks for uWFCP at different production percentiles under furrow irrigation in China by 2018.
3.4 Results comparison
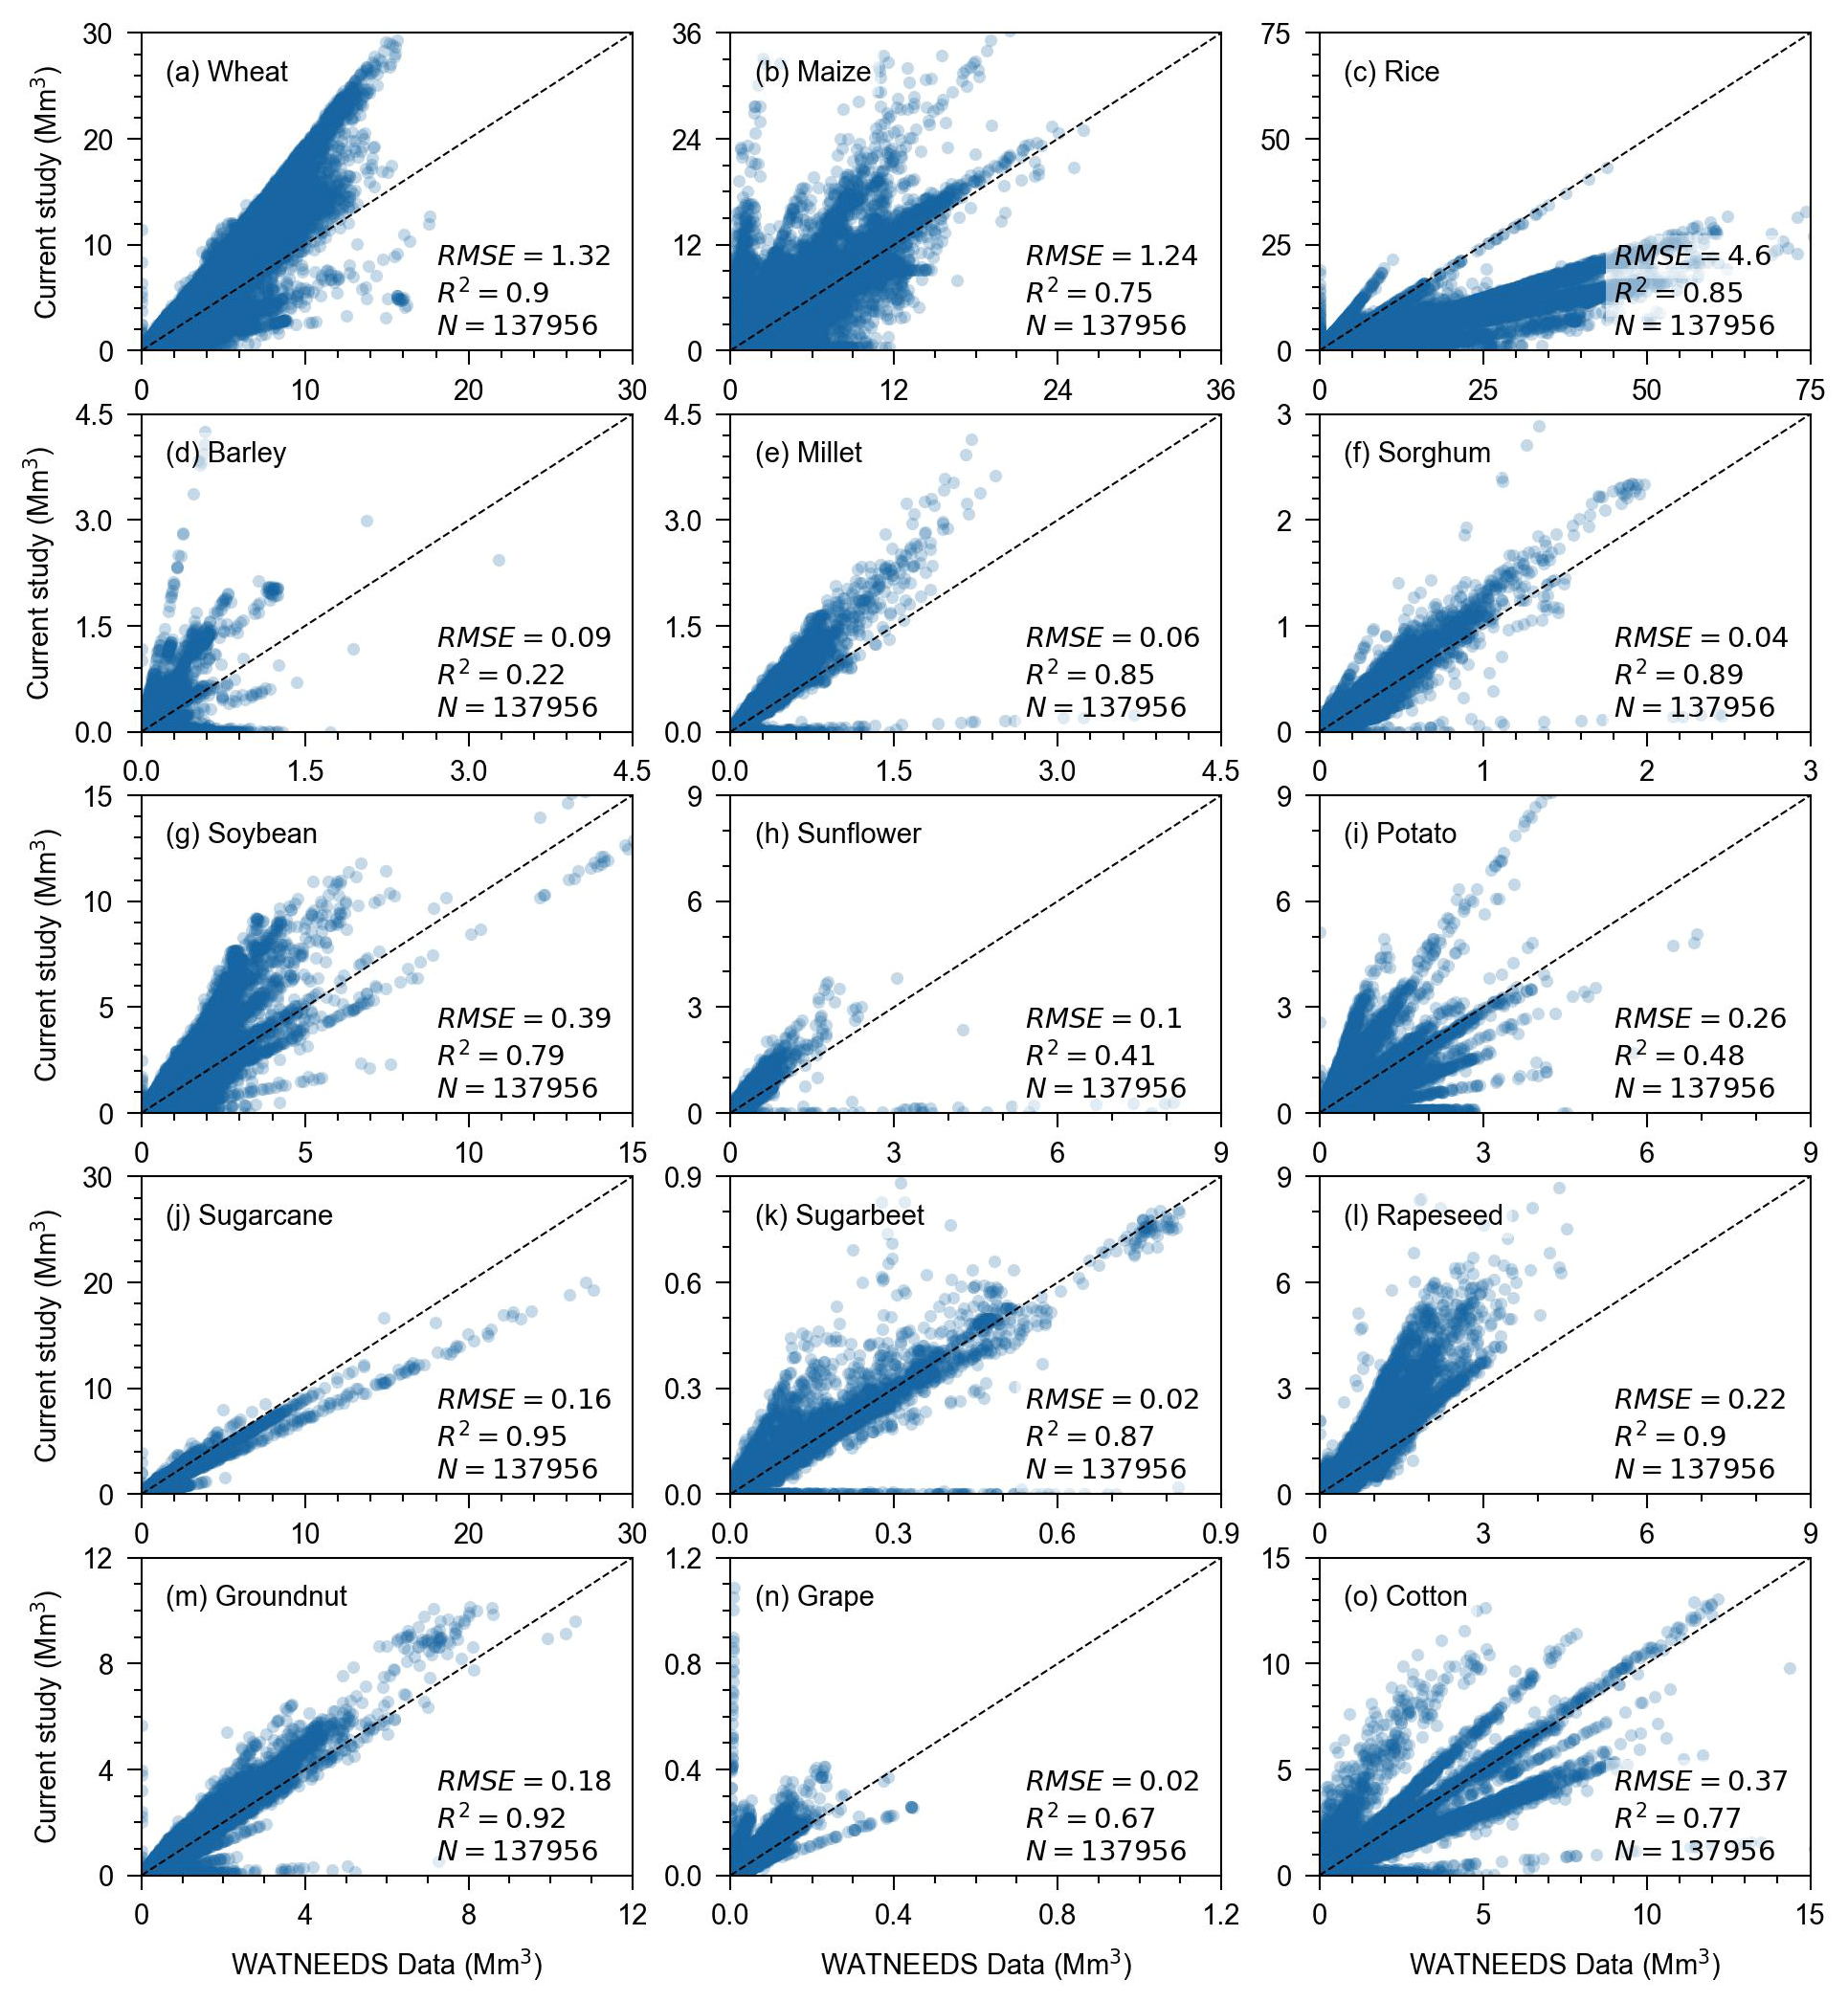
Using publicly available datasets, we compared the water use of 15 crops with the WATNEEDS dataset (Chiarelli et al., 2020) that overlapped in time (in 2000) and space (137 956 grids). As illustrated in Fig. 7, the results showed that R2>0.60 (p<0.01) among 12 of the crops. However, large deviations were present in the comparisons of data for barley, sunflower, and potatoes. The following two factors were responsible for this disparity: first, the current study aimed to quantify the actual water consumption during crop growth, whereas the WATNEEDS dataset concentrated on theoretical crop water requirements. Second, this study divided irrigation into furrow, sprinkler, and micro-irrigation categories at the grid scale. In reality, sprinkler irrigation covers a much larger area than micro-irrigation and also possesses the highest fw of our three irrigation categories, which is ultimately reflected in a higher water consumption in our data. Overall, our dataset displayed a high level of reliability. The comparison of our WFCP data with the WATNEEDS dataset (Chiarelli et al., 2020) on a national scale is shown in Table 5. Except for rice, the variability of WFCP and WFCPb between the two datasets was under 25 % and 20%, respectively, demonstrating high consistency. Large differences in the WFCPg between the two datasets can be attributed to two factors, namely, the different quantification methods used (including model mechanisms and green water definitions) and the different sources of precipitation data used for model input, leading to variations in green water simulations. With regards to the variability observed in rice data, some of our grids contained information for two to three seasons of rice cultivation (combined with the actual regional cultivation) and all these instances were assumed to receive irrigation in this study; this may have resulted in a comparatively low WFCPg value.
In a comparison of the uWFCP obtained for 21 crops in our dataset with figures reported by Mekonnen and Hoekstra (2011) and Zhuo et al. (2016a), the variability of data for 18 crops was under 30 %, which was attributed to the uncertainty imposed by model simulation (Table 5). Although crop acreage remains consistent at the national scale, sets of crop distribution data must be matched with different sets of input variables (such as precipitation, temperature, and soil moisture content), which has a significant impact on the simulated values. The differences in the uWFCP of potato, sweet potato, and cotton resulted from the large discrepancies in production data, with simulated values for these three crops by Mekonnen and Hoekstra (2011) and Zhuo et al. (2016a) being 80 %, 81 %, and 67 % higher than those in the statistical yearbook.
Table 5Comparison of WFCP and uWFCP in overlapping time and space with published results.
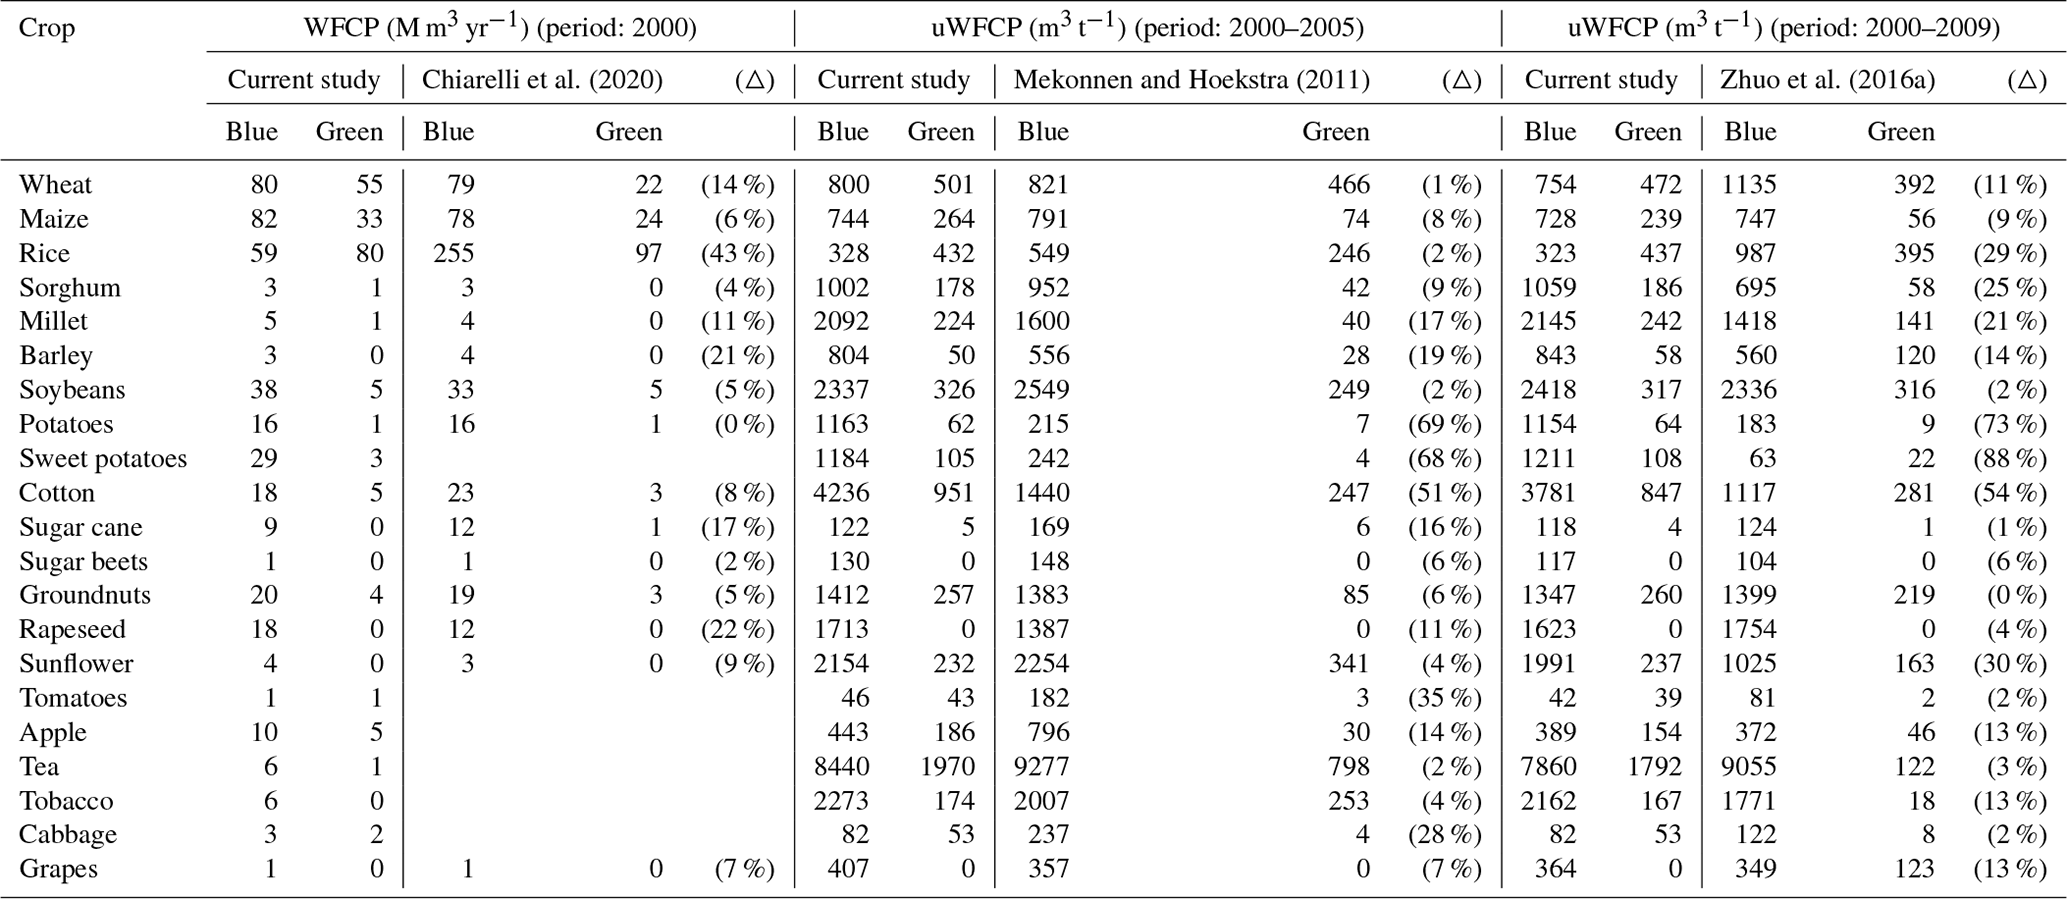
Note: “△” means calculated as the ratio of the study difference to the study mean.
4.1 Data validation
We compared our 5 arcmin resolution of major crop areas, as calculated by the proportional invariant method, with the GAEZ+ (Grogan et al., 2022) and SPAM (IFPRI, 2019) data products in the same year (Fig. 8). Linear regression results for data on wheat, maize, and rice coverage showed that R2 was greater than 0.50 (p<0.01) at the raster scale and greater than 0.80 (p<0.01) at the provincial scale, and the overall variability at the national scale was under 8 %. We further compared planting areas of other crops in SPAM and our data provincially and in grids (Figs. S29 and S30). It is evident that there is a high R2 at the provincial scale. The differences at the grid scale can be attributed to discrepancies in the identification of gridded land use between the MIRCA2000 and SPAM. According to Figs. S31 and S32, the planting area data for sorghum, millet, barley, and sugar beets in the GAEZ+ exhibit significant deviations from this study, both at the provincial and grid scales. However, we emphasize that all crop planting area data in this study have been calibrated against statistical data at the provincial scale, implying an underestimation of the planting area for the mentioned crops in the GAEZ+. Overall, comparisons with existing products validated the accuracy of the gridded representation of crop land coverage as obtained in this study.
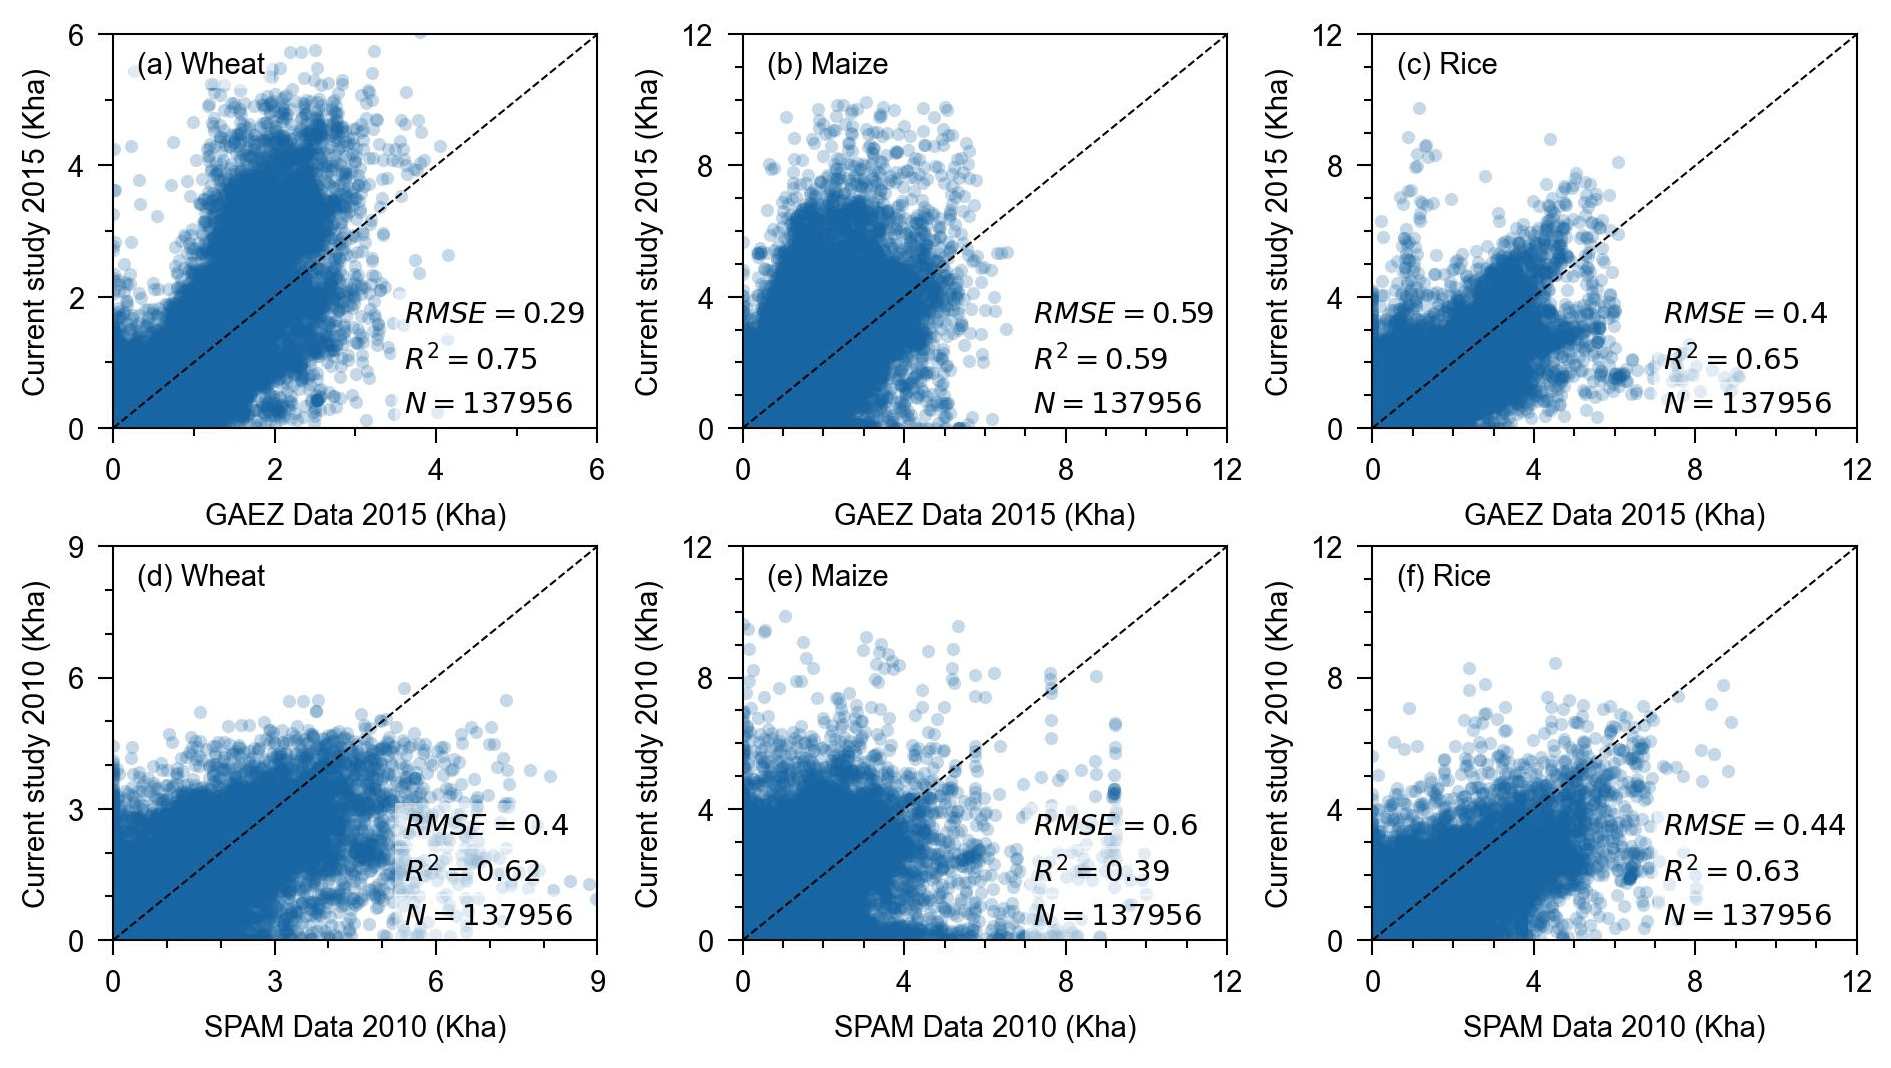
Figure 8Comparison of the current gridded area representing land coverage by major crops with the GAEZ+ and SPAM datasets.
Based on data from dual-source (PML-V2(China)) and single-source (SEBAL) remote sensing products, we validated our evapotranspiration, evaporation, and transpiration results specifically over the major cropping period from April to August by following the selection process outlined in Sect. 2.3.2. Comparative analysis in Figs. 9 and S33 revealed stronger agreement between the simulated evapotranspiration and the PML-V2 products (R2=0.49–0.85, RMSE = 5.82–12.12 Mm3) than those with the SEBAL products (R2=0.44–0.75, RMSE = 8.51–15.82 Mm3), although both comparisons demonstrated robust overall consistency. The validation results of soil evaporation (E) are presented in Fig. S34. The simulated E were marginally lower than the PML-V2 products (R2=0.22–0.70, RMSE = 3.25–6.65 Mm3), owing to the current study calculating E exclusively for the planted regions of 21 crops, whereas the PML-V2 disregarded land use types during E estimation. Comparative analysis of crop transpiration in Fig. S35 indicated that our simulated values were higher than those of the PML-V2 products which deducted canopy evaporation (R2=0.38–0.69, RMSE = 6.04–10.35 Mm3). Overall, considering the differences in basic input data, spatiotemporal resolution and calculation methods, the evapotranspiration, evaporation, and transpiration data products produced in this study showed acceptable results when compared with various remote sensing products, given the discrepancies exhibited.
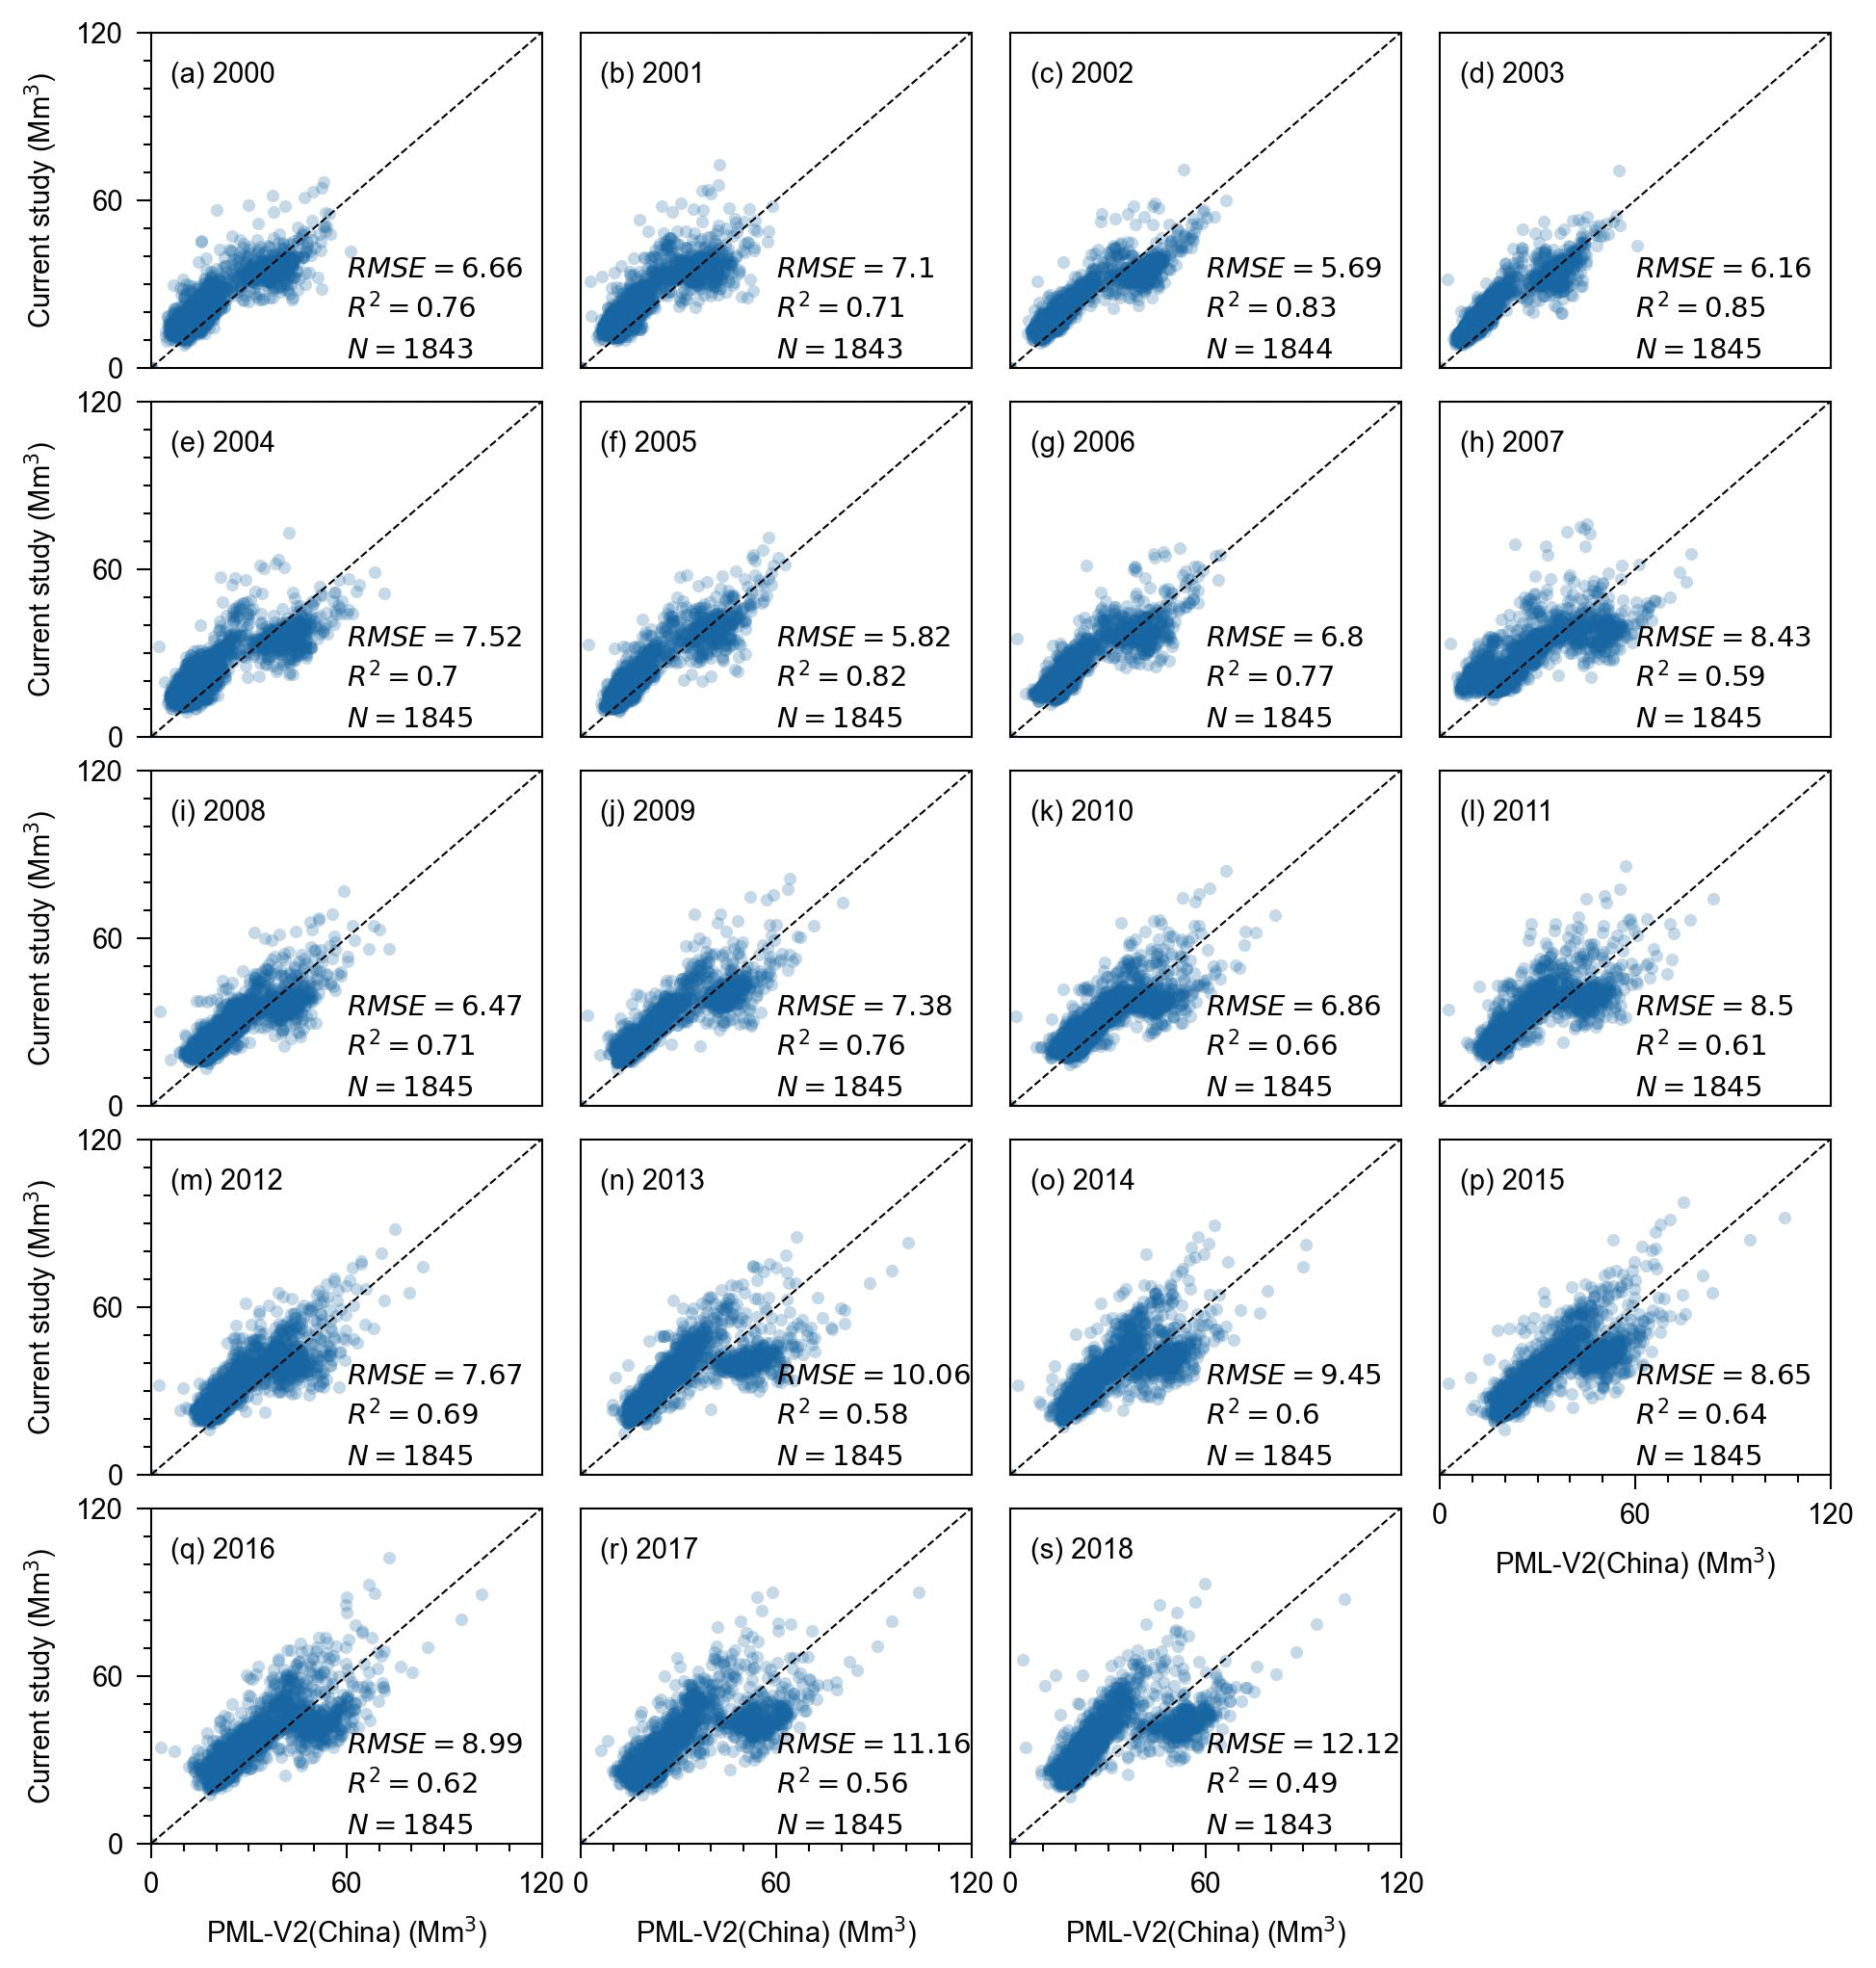
Figure 9Validation of the evapotranspiration at croplands for the period April to August with PML-V2(China) datasets.
4.2 Sensitivity and uncertainty analysis
To clarify the sensitivity of a WFCP assessment to the main parameters in a simulation, a previous study by the present authors applied the one-at-a-time and sensitivity index methods to quantitatively evaluate a WFCP calculation by AquaCrop (Li et al., 2022). The results indicated that crop water consumption and production were extremely sensitive to the reference evapotranspiration, planting date (PD), and the crop transpiration coefficient (KcTr). The effect of PD differed for each crop, and advancing or delaying it exposed crops to completely different rain and heat conditions. Minor shifts in PD forward or backward have relatively small influences on WFCP since crop water consumption is primarily concentrated in crop development and mid-season stages (Fig. S36; Table S4). Moreover, yield and WFCP exhibited minimal sensitivity to changes in crop PD when preserving constant growing degree days (Zhuo et al., 2014). In the annex of the reference manual for the AquaCrop (Raes et al., 2018), default values of crop parameters for the crops covered in the current study are given, including crop transpiration, biomass production and yield formation, and stresses, totalling 41 parameters. Furthermore, these parameters are further classified based on crop sensitivity as conservative generally applicable (including KcTr), conservative for a given species but can or may be cultivar specific, dependent on environment and/or management, and cultivar specific. The conservative parameters are generally applicable and remain unchanged across a wide spectrum of conditions, including different climatic and geographic locations, crop cultivars and genotypes, as well as variable soil moisture stress statuses. Once calibrated, these identical parameters would be utilized without further modification. Importantly, the accuracy of all model studies (including those using AquaCrop) is dependent on both the model mechanism and the input data. AquaCrop's accuracy in simulating crop water consumption and production for various climates, soils, and field management practices has been extensively validated (Zhuo et al., 2016a; Pirmoradian and Davatgar, 2019; Wang et al., 2019; Chibarabada et al., 2020).
At the outset of the simulation used in this study, we rigorously screened the input data according to the principles of accuracy and representativeness. However, there was a degree of bias in the model set-up and input data. For instance, the current study focused on the effect of water stress on crop growth and worked from the assumption that all nutrients required for crops were provided. First, AquaCrop, as a water-driven model, simulates crop growth comprehensively by establishing the responsive link between effective soil water usage and crop yield (Raes et al., 2018). Second, AquaCrop adopts a semi-quantitative method to evaluate fertilizer stress, that is, it cannot directly simulate crop response to fertilizer based on plant nutritional demand and soil nutrient content (Akumaga et al., 2017). Research shows AquaCrop performs better without fertilizer stress versus with stress (Adeboye et al., 2021; Wu et al., 2022). In fact, there is a serious over-application of chemical fertilizers in Chinese farmlands (Chen et al., 2014; Cui and Shoemaker, 2018). The impact of fertilization on crop production was indirectly reflected through calibration against statistical data. Third, gridded data is deficient regarding fertilizer varieties and application quantities, and more so for crop-specific data, so like past AquaCrop global (Mialyk et al., 2022) and national (Wang et al., 2019) studies, nutrient stress is not considered in simulations. Certainly, the above assumption has limitations. Establishing high-resolution fertilizer application databases is vital for future crop production research.
Furthermore, the parameters we used for fraction of the surface wetted in either furrow, sprinkler, or micro-irrigation remained consistent across regions owing to the absence of any data related to possible variance as mentioned in Sect. 2.2.5. In other words, we downplayed regional variations within the same irrigation practice. Taking micro-irrigation as an example, the difference between different micro-irrigation products mostly lies in the transport and distribution pipe networks and irrigator, which have little impact on the fraction of the surface wetted in the crop root zone. In terms of crop parameters, strict regional differences were considered during the initial screening of the 21 crops' parameters. According to the regional classification results in Table S3, these key parameters like plant dating, reference harvest index, crop growth stages, and maximum root depth for this study are obtained by referring to the studies described in Sect. 2.1.3. These data have been validated to be reliable and applicable in large-scale studies (Cao et al., 2014; Zhuo et al., 2016a; Wang et al., 2019). Due to data limitations, the remaining parameters, such as maximum canopy cover, canopy cover decline coefficient, and canopy growth coefficient, were assigned the mean values within the reference range provided in the annex of the reference manual for the AquaCrop. Although this approach may overlook certain potential variations, the use of mean values generally captures the central tendency of the data.
Unlike small-scale studies at site level that emphasize region-specific measured parameters for model simulation, large regional-scale studies often adopt literature-recommended parameter values during data collection, with greater focus on regional variability and wide adaptability of the parameters. (Hoekstra and Wiedmann 2014; Davis et al., 2017; Mekonnen and Hoekstra, 2020; Lutz et al., 2022; Halpern et al., 2022; Liu et al., 2022; Chiarelli et al., 2022; Demay et al., 2023). It was neither practical nor feasible to calibrate crop parameters individually for each grid given the constraints of the available data. Nevertheless, we have made every effort to ensure the reliability of the model input parameters within the existing limitations. Consequently, in future research, attention to the collection and organization of basic data can play a positive role in the improvement of the model mechanism and accuracy of the output (Mekonnen and Hoekstra, 2010, 2011).
In general, despite the uncertainties in the input data, the calculated WFCP and uWFCP were in good agreement with existing studies at both the grid and national scales, and the dataset in the long time series was compatible with remote sensing products. The above analysis demonstrated that the findings of our current study correctly reflected water consumption during the crop growth period under various water supply modes and irrigation practices.
All data used in this study are freely available with the links given in Sect. 2. The dataset presented in this article are available from the Zenodo repository at https://doi.org/10.5281/zenodo.7756013 (Wang et al., 2023). Both gridded consumptive water footprints, evaporation, transpiration, and associate benchmarks of crop production are provided.
The current study constructed a gridded WFCP database for 21 crops in China for 2000–2018 to reflect different water supply modes and irrigation practices, thereby addressing monthly blue and green water consumption in soil evaporation and crop transpiration. Additionally, we established uWFCP benchmarks for various climatic zones, water supply modes, and irrigation practices. The current dataset was thoroughly validated. The results highlighted the necessity to explore the influences of different field management practices on WFCP quantification and benchmarking in future research.
The WFCP is a crucial indicator used for evaluating water consumption by crops and a key component to solving the problems associated with the environmental “footprint family” and “planetary boundary” (Galli et al., 2012; Hoekstra and Wiedmann, 2014; Steffen et al., 2015). The current dataset is able to support for precise crop water productivity assessments, agricultural water-saving evaluations, the development of sustainable irrigation techniques, cropping structure optimization, and crop-related interregional virtual water trade analysis. The dataset can furthermore be applied to develop dynamic water management policies by virtue of its analysis of the spatial and temporal fluctuations in crop water consumption. The methodological framework for batch quantification of the WFCP can facilitate the updating of relative dataset and scale conversion studies.
The supplement related to this article is available online at: https://doi.org/10.5194/essd-15-4803-2023-supplement.
LZ and PW designed the research. WW collected basic data, performed simulations, and conducted results validation and calibration. XJ conducted the sensitivity analysis. ZY, ZL, ML, HZ, RG, CY, and PZ performed simulations. WW and LZ wrote the original manuscript. LZ and PW revised the manuscript.
The contact author has declared that none of the authors has any competing interests.
Publisher’s note: Copernicus Publications remains neutral with regard to jurisdictional claims made in the text, published maps, institutional affiliations, or any other geographical representation in this paper. While Copernicus Publications makes every effort to include appropriate place names, the final responsibility lies with the authors.
We thank all colleagues for their support and work. The dataset could not have been established without the contributions of all participants.
This research has been supported by the Program for Cultivating Outstanding Talents on Agriculture, Ministry of Agriculture and Rural Affairs, People's Republic of China (grant no. 13210321), the National Youth Talents Plan, and Chinese Universities Scientific Fund (grant no. 2452021168) to La Zhuo.
This paper was edited by Francesco N. Tubiello and reviewed by three anonymous referees.
Adeboye, O. B., Schultz, B., Adeboye, A. P., Adekalu, K. O., and Osunbitan, J. A.: Application of the AquaCrop model in decision support for optimization of nitrogen fertilizer and water productivity of soybeans, Inf. Process, 8, 419–436, https://doi.org/10.1016/j.inpa.2020.10.002, 2021.
Akumaga, U., Tarhule, A., and Yusuf, A. A.: Validation and testing of the FAO AquaCrop model under different levels of nitrogen fertilizer on rainfed maize in Nigeria, West Africa, Agr. Forest Meteorol., 232, 225–234, https://doi.org/10.1016/j.agrformet.2016.08.011, 2017.
Allen, R. G., Pereira, L. S., Raes, D., and Smith, M.: Crop evapotranspiration – Guidelines for computing crop water requirements, FAO Irrigation and drainage paper, 56, Food and Agriculture Organization (FAO), Rome, Italy, ISBN 9251042195, 1998.
Batjes, N. H.: WISE derived soil properties on a 5 by 5 arc-minutes global grid (ver. 1.2), ISRIC [data set], https://data.isric.org/geonetwork/srv/eng/catalog.search#/metadata/82f3d6b0-a045-4fe2-b960-6d05bc1f37c0 (last access: 10 October 2023), 2012.
Brown, J. F. and Pervez, M. S.: Merging remote sensing data and national agricultural statistics to model change in irrigated agriculture, Agric. Syst., 127, 28–40, https://doi.org/10.1016/j.agsy.2014.01.004, 2014.
Cao, X. C., Wu, P. T., Wang, Y. B., and Zhao, X. N.: Assessing blue and green water utilisation in wheat production of China from the perspectives of water footprint and total water use, Hydrol. Earth Syst. Sci., 18, 3165–3178, https://doi.org/10.5194/hess-18-3165-2014, 2014.
Chen, X., Cui, Z., Fan, M., Vitousek, P., Zhao, M., Ma, W., Wang, Z., Zhang, W., Yan, X., and Yang, J.: Producing more grain with lower environmental costs, Nature, 514, 486–489, https://doi.org/10.1038/nature13609, 2014.
Chen, Y., Guo, G., Wang, G., Kang, S., Luo, H., and Zhang, D.: Main crop water requirement and irrigation of China, Hydraulic and Electric Press, Beijing, ISBN 7120021001, 1995.
Cheng, M., Jiao, X., Li, B., Yu, X., Shao, M., and Jin, X.: Long time series of daily evapotranspiration in China based on the SEBAL model and multisource images and validation, Earth Syst. Sci. Data, 13, 3995–4017, https://doi.org/10.5194/essd-13-3995-2021, 2021.
Chiarelli, D. D., Passera, C., Rosa, L., Davis, K. F., D'Odorico, P., and Rulli, M. C.: The green and blue crop water requirement WATNEEDS model and its global gridded outputs, Sci. Data, 7, 273, https://doi.org/10.1038/s41597-020-00612-0, 2020.
Chiarelli, D. D., D'Odorico, P., Müller, M. F., Mueller, N. D., Davis, K. F., Dell'Angelo, J., Penny, G., and Rulli, M. C.: Competition for water induced by transnational land acquisitions for agriculture, Nat. Commun., 13, 505, https://doi.org/10.1038/s41467-022-28077-2, 2022.
Chibarabada, T., Modi, A., and Mabhaudhi, T.: Calibration and evaluation of aquacrop for groundnut (Arachis hypogaea) under water deficit conditions, Agric. For. Meteorol., 281, 107850, https://doi.org/10.1016/j.agrformet.2019.107850, 2020.
China Agricultural Machinery Industry Yearbook Committee (CAMIYC): China Agricultural Machinery Industry Yearbook, China Machine Press, Beijing, ISBN 9787549247349, 2022.
Chukalla, A. D., Krol, M. S., and Hoekstra, A. Y.: Green and blue water footprint reduction in irrigated agriculture: effect of irrigation techniques, irrigation strategies and mulching, Hydrol. Earth Syst. Sci., 19, 4877–4891, https://doi.org/10.5194/hess-19-4877-2015, 2015.
Cui, K. and Shoemaker, S. P.: A look at food security in China, NPJ Sci. Food., 2, 4, https://doi.org/10.1038/s41538-018-0012-x, 2018.
Davis, K. F., Rulli, M. C., Seveso, A., and D'Odorico, P.: Increased food production and reduced water use through optimized crop distribution, Nat. Geosci., 10, 919–924, https://doi.org/10.1038/s41561-017-0004-5, 2017.
Demay, J., Ringeval, B., Pellerin, S., and Nesme, T.: Half of global agricultural soil phosphorus fertility derived from anthropogenic sources, Nat. Geosci., 16, 69–74, https://doi.org/10.1038/s41561-022-01092-0, 2023.
Dijkshoorn, K., van Engelen, V., and Huting, J.: Soil and Terrain Database (SOTER) for China, ISRIC [data set], https://data.isric.org/geonetwork/srv/eng/catalog.search#/metadata/2919b1e3-6a79-4162-9d3a-e640a1dc5aef (last access: 10 October 2023), 2008.
Döll, P.: Vulnerability to the impact of climate change on renewable groundwater resources: a global-scale assessment, Environ. Res. Lett., 4, 035006, https://doi.org/10.1088/1748-9326/4/3/035006, 2009.
Elliott, J., Deryng, D., Müller, C., Frieler, K., Konzmann, M., Gerten, D., Glotter, M., Flörke, M., Wada, Y., and Best, N.: Constraints and potentials of future irrigation water availability on agricultural production under climate change, P. Natl. Acad. Sci. USA, 111, 3239–3244, https://doi.org/10.1073/pnas.1222474110, 2014.
Fader, M., Gerten, D., Thammer, M., Heinke, J., Lotze-Campen, H., Lucht, W., and Cramer, W.: Internal and external green-blue agricultural water footprints of nations, and related water and land savings through trade, Hydrol. Earth Syst. Sci., 15, 1641–1660, https://doi.org/10.5194/hess-15-1641-2011, 2011.
Fisher, J. B., Melton, F., Middleton, E., Hain, C., Anderson, M., Allen, R., McCabe, M. F., Hook, S., Baldocchi, D., and Townsend, P. A.: The future of evapotranspiration: Global requirements for ecosystem functioning, carbon and climate feedbacks, agricultural management, and water resources, Water Resour. Res., 53, 2618–2626, https://doi.org/10.1002/2016WR020175, 2017.
Food and Agriculture Organization (FAO): The State of Food and Agriculture 2020. Overcoming water challenges in agriculture, Rome, https://doi.org/10.4060/cb1447en, 2020.
Food and Agriculture Organization (FAO): Crops and livestock products, FAOSTAT [data set], https://www.fao.org/faostat/en/#data/QCL (last access: 10 October 2023), 2022.
Galli, A., Wiedmann, T., Ercin, E., Knoblauch, D., Ewing, B., and Giljum, S.: Integrating ecological, carbon and water footprint into a “footprint family” of indicators: definition and role in tracking human pressure on the planet, Ecol. Indic., 16, 100–112, https://doi.org/10.1016/j.ecolind.2011.06.017, 2012.
Ghose, B.: Food security and food self-sufficiency in China: from past to 2050, Food Energy Secur., 3, 86–95, https://doi.org/10.1002/fes3.48, 2014.
Grogan, D., Frolking, S., Wisser, D., Prusevich, A., and Glidden, S.: Global gridded crop harvested area, production, yield, and monthly physical area data circa 2015, Sci. Data, 9, 15, https://doi.org/10.1038/s41597-021-01115-2, 2022.
Haddeland, I., Heinke, J., Biemans, H., Eisner, S., Flörke, M., Hanasaki, N., Konzmann, M., Ludwig, F., Masaki, Y., and Schewe, J.: Global water resources affected by human interventions and climate change, P. Natl. Acad. Sci. USA, 111, 3251–3256, https://doi.org/10.1073/pnas.1222475110, 2014.
Halpern, B. S., Frazier, M., Verstaen, J., Rayner, P.-E., Clawson, G., Blanchard, J. L., Cottrell, R. S., Froehlich, H. E., Gephart, J. A., Jacobsen, N. S., Kuempel, C. D., McIntyre, P. B., Metian, M., Moran, D., Nash, K. L., Többen, J., and Williams, D. R.: The environmental footprint of global food production, Nat. Sustain., 5, 1027–1039, https://doi.org/10.1038/s41893-022-00965-x, 2022.
Harris, I., Osborn, T. J., Jones, P., and Lister, D.: Version 4 of the CRU TS monthly high-resolution gridded multivariate climate dataset, Sci. Data, 7, 109, https://doi.org/10.1038/s41597-020-0453-3, 2020.
He, S., Zhang, Y., Ma, N., Tian, J., Kong, D., and Liu, C.: A daily and 500 m coupled evapotranspiration and gross primary production product across China during 2000–2020, Earth Syst. Sci. Data, 14, 5463–5488, https://doi.org/10.5194/essd-14-5463-2022, 2022.
Hoekstra, A. Y.: The water footprint of modern consumer society, Routledge, London, ISBN 1849713030, 2013.
Hoekstra, A. Y. and Chapagain, A. K.: Water footprints of nations: water use by people as a function of their consumption pattern, Water Resour. Manag., 21, 35–48, https://doi.org/10.1007/s11269-006-9039-x, 2006.
Hoekstra, A. Y. and Chapagain, A. K.: Globalization of water: Sharing the planet's freshwater resources, Blackwell Publishing, Oxford, ISBN 9781405163354, 2008.
Hoekstra, A. Y. and Wiedmann, T. O.: Humanity's unsustainable environmental footprint, Science, 344, 1114–1117, https://doi.org/10.1126/science.1248365, 2014.
Hoekstra, A. Y., Chapagain, A. K., Aldaya, M. M., and Mekonnen, M. M.: The water footprint assessment manual: Setting the global standard, Routledge, London, ISBN 9781849712798, 2011.
Hoekstra, A.Y. and Mekonnen, M.M.: The water footprint of humanity, P. Natl. Acad. Sci. USA, 109, 3232–3237, https://doi.org/10.1073/pnas.1109936109, 2012.
Hoogeveen, J., Faurès, J.-M., Peiser, L., Burke, J., and van de Giesen, N.: GlobWat – a global water balance model to assess water use in irrigated agriculture, Hydrol. Earth Syst. Sci., 19, 3829–3844, https://doi.org/10.5194/hess-19-3829-2015, 2015.
International Food Policy Research Institute (IFPRI): Global spatially-disaggregated crop production statistics data for 2010 version 2.0, Harvard Dataverse [data set], https://doi.org/10.7910/DVN/PRFF8V, 2019.
Institute of Geographic Sciences and Natural Resources Research, CAS (IGSNRR): Chinese Agricultural Cropping System, Resource and Environment Science and Data Center [data set], https://www.resdc.cn/data.aspx?DATAID=274 (last access: 10 October 2023), 2022.
Jägermeyr, J., Pastor, A., Biemans, H., and Gerten, D.: Reconciling irrigated food production with environmental flows for Sustainable Development Goals implementation, Nat. Commun., 8, 15900, https://doi.org/10.1038/ncomms15900, 2017.
Jung, M., Reichstein, M., Ciais, P., Seneviratne, S. I., Sheffield, J., Goulden, M. L., Bonan, G., Cescatti, A., Chen, J., and De Jeu, R.: Recent decline in the global land evapotranspiration trend due to limited moisture supply, Nature, 467, 951–954, https://doi.org/10.1038/nature09396, 2010.
Leng, G., Huang, M., Tang, Q., Gao, H., and Leung, L. R.: Modeling the effects of groundwater-fed irrigation on terrestrial hydrology over the conterminous United States, J. Hydrometeorol., 15, 957–972, https://doi.org/10.1175/JHM-D-13-049.1, 2014.
Li, Z., Feng, B., Wang, W., Yang, X., Wu, P., and Zhuo, L.: Spatial and temporal sensitivity of water footprint assessment in crop production to modelling inputs and parameters, Agr. Water Manage., 271, 107805, https://doi.org/10.1016/j.agwat.2022.107805, 2022.
Lian, X., Piao, S., Huntingford, C., Li, Y., Zeng, Z., Wang, X., Ciais, P., McVicar, T. R., Peng, S., and Ottlé, C.: Partitioning global land evapotranspiration using CMIP5 models constrained by observations, Nat. Clim. Chang., 8, 640–646, https://doi.org/10.1038/s41558-018-0207-9, 2018.
Liu, J., Williams, J. R., Zehnder, A. J., and Yang, H.: GEPIC–modelling wheat yield and crop water productivity with high resolution on a global scale, Agric. Syst., 94, 478–493, https://doi.org/10.1016/j.agsy.2006.11.019, 2007.
Liu, X., Liu, W., Tang, Q., Liu, B., Wada, Y., and Yang, H.: Global agricultural water scarcity assessment incorporating blue and green water availability under future climate change, Earth's Future, 10, e2021EF002567, https://doi.org/10.1029/2021EF002567, 2022.
Long, D. and Singh, V. P.: Assessing the impact of end-member selection on the accuracy of satellite-based spatial variability models for actual evapotranspiration estimation, Water Resour. Res., 49, 2601–2618, https://doi.org/10.1002/wrcr.20208, 2013.
Lovarelli, D., Bacenetti, J., and Fiala, M.: Water Footprint of crop productions: A review, Sci. Total Environ., 548, 236–251, https://doi.org/10.1016/j.scitotenv.2016.01.022, 2016.
Lutz, A. F., Immerzeel, W. W., Siderius, C., Wijngaard, R. R., Nepal, S., Shrestha, A. B., Wester, P., and Biemans, H.: South Asian agriculture increasingly dependent on meltwater and groundwater, Nat. Clim. Change, 12, 566–573, https://doi.org/10.1038/s41558-022-01355-z, 2022.
Mekonnen, M. M. and Hoekstra, A. Y.: A global and high-resolution assessment of the green, blue and grey water footprint of wheat, Hydrol. Earth Syst. Sci., 14, 1259–1276, https://doi.org/10.5194/hess-14-1259-2010, 2010.
Mekonnen, M. M. and Hoekstra, A. Y.: The green, blue and grey water footprint of crops and derived crop products, Hydrol. Earth Syst. Sci., 15, 1577–1600, https://doi.org/10.5194/hess-15-1577-2011, 2011.
Mekonnen, M. M. and Hoekstra, A. Y.: Water footprint benchmarks for crop production: A first global assessment, Ecol. Indic., 46, 214–223, https://doi.org/10.1016/j.ecolind.2014.06.013, 2014.
Mekonnen, M. M., and Hoekstra, A. Y.: Blue water footprint linked to national consumption and international trade is unsustainable, Nat. Food, 1, 792–800, https://doi.org/10.1038/s43016-020-00198-1, 2020.
Mialyk, O., Schyns, J. F., Booij, M. J., and Hogeboom, R. J.: Historical simulation of maize water footprints with a new global gridded crop model ACEA, Hydrol. Earth Syst. Sci., 26, 923–940, https://doi.org/10.5194/hess-26-923-2022, 2022.
Middleton, N. and Thomas, D.: World atlas of desertification: Second Edition, Arnold, London, ISBN 0340691662, 1997.
National Bureau of Statistics (NBSC): China Statistical Yearbook, China Statistical Press, Beijing, https://data.stats.gov.cn/ (last access: 23 October 2023), 2022.
Pastor, A., Palazzo, A., Havlik, P., Biemans, H., Wada, Y., Obersteiner, M., Kabat, P., and Ludwig, F.: The global nexus of food–trade–water sustaining environmental flows by 2050, Nat. Sustain., 2, 499–507, https://doi.org/10.1038/s41893-019-0287-1, 2019.
Pereira, L. S., Paredes, P., Rodrigues, G. C., and Neves, M.: Modeling malt barley water use and evapotranspiration partitioning in two contrasting rainfall years. Assessing AquaCrop and SIMDualKc models, Agr. Water Manage., 159, 239–254, https://doi.org/10.1016/j.agwat.2015.06.006, 2015.
Pirmoradian, N. and Davatgar, N.: Simulating the effects of climatic fluctuations on rice irrigation water requirement using AquaCrop, Agr. Water Manage., 213, 97–106, https://doi.org/10.1016/j.agwat.2018.10.003, 2019.
Poppe, M.: Simulating the water footprint of woodies in Aquacrop and Apex, M.S. thesis, Water Engineering and Management, University of Twente, the Netherlands, https://essay.utwente.nl/71442/ (last access: 10 October 2023), 2016.
Portmann, F. T., Siebert, S., and Döll, P.: MIRCA2000 – Global monthly irrigated and rainfed crop areas around the year 2000: A new high-resolution data set for agricultural and hydrological modeling, Glob. Biogeochem. Cycle, 24, GB1011, https://doi.org/10.1029/2008GB003435, 2010.
Puy, A., Lo Piano, S., and Saltelli, A.: Current models underestimate future irrigated areas, Geophys. Res. Lett., 47, e2020GL087360, https://doi.org/10.1029/2020GL087360, 2020.
Puy, A., Borgonovo, E., Lo Piano, S., Levin, S. A., and Saltelli, A.: Irrigated areas drive irrigation water withdrawals, Nat. Commun., 12, 4525, https://doi.org/10.1038/s41467-021-24508-8, 2021.
Raes, D., Steduto, P., Hsiao, T., and Fereres, E.: Reference Manual, Chapter 3 – AquaCrop Model, Version 6.1, FAO, Rome, https://www.fao.org/documents/card/en/c/BR248E (last access: 23 October 2023), 2018.
Rodell, M., Velicogna, I., and Famiglietti, J. S.: Satellite-based estimates of groundwater depletion in India, Nature, 460, 999–1002, https://doi.org/10.1038/nature08238, 2009.
Rosa, L., Chiarelli, D. D., Rulli, M. C., Dell'Angelo, J., and D'Odorico, P.: Global agricultural economic water scarcity, Sci. Adv., 6, eaaz6031, https://doi.org/10.1126/sciadv.aaz6031, 2020.
Siebert, S. and Döll, P.: Quantifying blue and green virtual water contents in global crop production as well as potential production losses without irrigation, J. Hydrol., 384, 198–217, https://doi.org/10.1016/j.jhydrol.2009.07.031, 2010.
State Council Information Office (SCIO): White Paper: the Grain Issue in China, http://www.scio.gov.cn/zfbps/ndhf/1996/Document/307978/307978.htm (last access: 7 March 2023), 1996.
Steffen, W., Richardson, K., Rockström, J., Cornell, S. E., Fetzer, I., Bennett, E. M., Biggs, R., Carpenter, S. R., De Vries, W., and De Wit, C. A.: Planetary boundaries: Guiding human development on a changing planet, Science, 347, 1259855, https://doi.org/10.1126/science.1259855, 2015.
Tamea, S., Tuninetti, M., Soligno, I., and Laio, F.: Virtual water trade and water footprint of agricultural goods: the 1961–2016 CWASI database, Earth Syst. Sci. Data, 13, 2025–2051, https://doi.org/10.5194/essd-13-2025-2021, 2021.
Tans, P. and Keeling, R.: Mauna Loa CO2 monthly mean data, Global Monitoring Laboratory [data set], https://gml.noaa.gov/ccgg/trends/data.html (last access: 23 October 2023), 2022.
Tilman, D., Balzer, C., Hill, J., and Befort, B. L.: Global food demand and the sustainable intensification of agriculture, P. Natl. Acad. Sci. USA, 108, 20260–20264, https://doi.org/10.1073/pnas.1116437108, 2011.
Tuninetti, M., Tamea, S., D'Odorico, P., Laio, F., and Ridolfi, L.: Global sensitivity of high-resolution estimates of crop water footprint, Water Resour. Res., 51, 8257–8272, https://doi.org/10.1002/2015WR017148, 2015.
Tuninetti, M., Tamea, S., Laio, F., and Ridolfi, L.: A Fast Track approach to deal with the temporal dimension of crop water footprint, Environ. Res. Lett., 12, 074010, https://doi.org/10.1088/1748-9326/aa6b09, 2017.
Vanuytrecht, E., Raes, D., Steduto, P., Hsiao, T. C., Fereres, E., Heng, L. K., Vila, M. G., and Moreno, P. M.: AquaCrop: FAO's crop water productivity and yield response model, Environ. Modell. Softw., 62, 351–360, https://doi.org/10.1016/j.envsoft.2014.08.005, 2014.
Wada, Y., Wisser, D., Eisner, S., Flörke, M., Gerten, D., Haddeland, I., Hanasaki, N., Masaki, Y., Portmann, F. T., and Stacke, T.: Multimodel projections and uncertainties of irrigation water demand under climate change, Geophys. Res. Lett., 40, 4626–4632, https://doi.org/10.1002/grl.50686, 2013.
Water Footprint Network.: WaterStat – water footprint statistics, https://waterfootprint.org/en/resources/waterstat/ (last access: 7 March 2023), 2020.
Wang, W., Zhuo, L., Li, M., Liu, Y., and Wu, P.: The effect of development in water-saving irrigation techniques on spatial-temporal variations in crop water footprint and benchmarking, J. Hydrol., 577, 123916, https://doi.org/10.1016/j.jhydrol.2019.123916, 2019.
Wang, W., Zhuo, L., Ji, X., Yue, Z., Li, Z., Li, M., Zhang, H., Gao, R., Yan, C., Zhang, P., and Wu, P.: CWFETB-China: Gridded dataset of consumptive water footprints, evaporation, transpiration, and associate benchmarks of crop production in China (2000–2018), Zenodo [data set], https://doi.org/10.5281/zenodo.7756013, 2023.
Wang, X., Müller, C., Elliot, J., Mueller, N. D., Ciais, P., Jägermeyr, J., Gerber, J., Dumas, P., Wang, C., and Yang, H.: Global irrigation contribution to wheat and maize yield, Nat. Commun., 12, 1235, https://doi.org/10.1038/s41467-021-21498-5, 2021.
Wu, H., Yue, Q., Guo, P., Xu, X., and Huang, X.: Improving the AquaCrop model to achieve direct simulation of evapotranspiration under nitrogen stress and joint simulation-optimization of irrigation and fertilizer schedules, Agr. Water Manage., 266, 107599, https://doi.org/10.1016/j.agwat.2022.107599, 2022.
Xie, G., Han, D., Wang, X., and Lü, R.: Harvest index and residue factor of cereal crops in China, J. China Agric. Univ, 16, 1–8, https://doi.org/10.11841/j.issn.1007-4333.2011.01.001, 2011 (in Chinese).
Yin, Y., Tang, Q., Liu, X., and Zhang, X.: Water scarcity under various socio-economic pathways and its potential effects on food production in the Yellow River basin, Hydrol. Earth Syst. Sci., 21, 791–804, https://doi.org/10.5194/hess-21-791-2017, 2017.
Yue, Z., Ji, X., Zhuo, L., Wang, W., Li, Z., and Wu, P.: Spatiotemporal responses of the crop water footprint and its associated benchmarks under different irrigation regimes to climate change scenarios in China, Hydrol. Earth Syst. Sci., 26, 4637–4656, https://doi.org/10.5194/hess-26-4637-2022, 2022.
Zhang, F. and Zhu, Z.: Harvest index for various crops in China, Scientia Agricultura Sinica, 23, 83–87, 1990 (in Chinese).
Zhuo, L., Mekonnen, M. M., and Hoekstra, A. Y.: Sensitivity and uncertainty in crop water footprint accounting: a case study for the Yellow River basin, Hydrol. Earth Syst. Sci., 18, 2219–2234, https://doi.org/10.5194/hess-18-2219-2014, 2014.
Zhuo, L., Mekonnen, M. M., and Hoekstra, A. Y.: The effect of inter-annual variability of consumption, production, trade and climate on crop-related green and blue water footprints and inter-regional virtual water trade: A study for China (1978–2008), Water Res., 94, 73–85, https://doi.org/10.1016/j.watres.2016.02.037, 2016a.
Zhuo, L., Mekonnen, M. M., and Hoekstra, A. Y.: Benchmark levels for the consumptive water footprint of crop production for different environmental conditions: a case study for winter wheat in China, Hydrol. Earth Syst. Sci., 20, 4547–4559, https://doi.org/10.5194/hess-20-4547-2016, 2016b.
Zhuo, L., Mekonnen, M. M., Hoekstra, A. Y., and Wada, Y.: Inter-and intra-annual variation of water footprint of crops and blue water scarcity in the Yellow River basin (1961–2009), Adv. Water Resour., 87, 29–41, https://doi.org/10.1016/j.advwatres.2015.11.002, 2016c.