the Creative Commons Attribution 4.0 License.
the Creative Commons Attribution 4.0 License.
 | 30 Oct 2023
SinoLC-1: the first 1 m resolution national-scale land-cover map of China created with a deep learning framework and open-access data
Zhuohong Li
Mofan Cheng
Jingxin Hu
Guangyi Yang
In China, the demand for a more precise perception of the national land surface has become most urgent given the pace of development and urbanization. Constructing a very-high-resolution (VHR) land-cover dataset for China with national coverage, however, is a nontrivial task. Thus, this has become an active area of research that is impeded by the challenges of image acquisition, manual annotation, and computational complexity. To fill this gap, the first 1 m resolution national-scale land-cover map of China, SinoLC-1, was established using a deep-learning-based framework and open-access data, including global land-cover (GLC) products, OpenStreetMap (OSM), and Google Earth imagery. Reliable training labels were generated by combining three 10 m GLC products and OSM data. These training labels and 1 m resolution images derived from Google Earth were used to train the proposed framework. This framework resolved the label noise stemming from a resolution mismatch between images and labels by combining a resolution-preserving backbone, a weakly supervised module, and a self-supervised loss function, to refine the VHR land-cover results automatically without any manual annotation requirement. Based on large-storage and computing servers, processing the 73.25 TB dataset to obtain the SinoLC-1 covering the entirety of China, ∼ 9 600 000 km2, took about 10 months. The SinoLC-1 product was validated using a visually interpreted validation set including over 100 000 random samples and a statistical validation set collected from the official land survey report provided by the Chinese government. The validation results showed that SinoLC-1 achieved an overall accuracy of 73.61 % and a κ coefficient of 0.6595. Validations for every provincial region further indicated the accuracy of this dataset across the whole of China. Furthermore, the statistical validation results indicated that SinoLC-1 conformed to the official survey reports with an overall misestimation rate of 6.4 %. In addition, SinoLC-1 was compared with five other widely used GLC products. These results indicated that SinoLC-1 had the highest spatial resolution and the finest landscape details. In conclusion, as the first 1 m resolution national-scale land-cover map of China, SinoLC-1 delivered accuracy and provided primal support for related research and applications throughout China. The SinoLC-1 land-cover product is freely accessible at https://doi.org/10.5281/zenodo.7707461 (Li et al., 2023).
- Article
(27106 KB) - Full-text XML
- BibTeX
- EndNote


As a basic Earth observation application, land-cover mapping enables the investigation of human and nonhuman activities that shape the national landscape (Lin and Ho, 2003). Researchers and decision-makers use the insights from land-cover maps to assist communities and governments achieve the Sustainable Development Goals (Wang et al., 2022). The past few decades have witnessed tremendous advancements in the spatial resolution of land-cover mapping products, as remote-sensing images with a finer spatial resolution have become easier to acquire (Roy et al., 2021). Very-high-resolution (VHR) imagery, in particular, typically finer than 3 m px−1, reveals land-cover objects at an ever finer granularity, providing a clearer, more detailed picture of the situation on the ground (Feng and Li, 2020). The VHR land-cover datasets are becoming increasingly ubiquitous in numerous large-scale research and application domains, such as agriculture (Griffiths et al., 2019), urbanization (Luo and Ji, 2022), and ecology (Yang et al., 2020). As the largest agricultural country and the second-largest economy in the world, China has experienced rapid development and urbanization in the past decades (Chang and Brada, 2006; Guan et al., 2018), and much land-cover research on China has been conducted. However, a VHR land-cover map with national coverage is still unavailable in China, hindering effective policy formulation and efficient resource allocation. In this context, investigation into a fine-grained national-scale land-cover map for China is a necessary guiding principle to comprehensively understand the environment, development, and future trend of the country.
Over the past 40 years, numerous satellite missions have been launched to improve the knowledge of Earth's resources and monitor natural phenomena. With the continuous updating of airborne and spaceborne platforms, the spatial resolution of the available remote-sensing images has undergone rapid increments of change (Tong et al., 2020; Li et al., 2022b). Moreover, studies on land-cover mapping methods have achieved great progress. Depending on the context, the spatial resolutions of the published land-cover products have gone through trends of coarse to fine (Cao and Huang, 2022). Nevertheless, due to the low orbit of the VHR image-capture platforms, the corresponding VHR land-cover products generally have a low coverage that is insufficient to cover the entirety of China (Wang et al., 2021). Furthermore, even if national-scale VHR imagery can be obtained by combining different image sources, the immense data volumes, laborious annotations, and computational costs are still the main obstacles for national-scale VHR land-cover mapping. Thus, currently, available land-cover datasets for China lack either a fine spatial resolution or nationwide coverage. In terms of the coverage scale and spatial resolution, the related existing land-cover datasets can be grouped into four general types: global-scale low-resolution (LR), global-scale moderate-/high-resolution (MR/HR), national-scale MR/HR, and regional-scale VHR land-cover products. These four general product types are outlined in the following:
-
Global-scale LR land-cover products. From the 1980s to the 2010s, global remote-sensing imagery with LR (finer than 1000 m px−1) was captured by satellites including the Satellite pour l'Observation de la Terre 4 (SPOT 4), the Advanced Very High Resolution Radiometer (AVHRR), and the Moderate Resolution Imaging Spectroradiometer (MODIS), and Environmental Satellite. Subsequently, many representative LR global products have emerged, for example, the European Commission's Joint Research Centre (JRC) published a 1 km resolution global land-cover (GLC) product in 2007 that was classified based on imagery from SPOT 4 (Bartholomé and Belward, 2007). The JRC and the United States Geological Survey (USGS) produced a 1 km resolution GLC product based on the monthly AVHRR normalized difference vegetation index composites (Loveland et al., 2010). Moreover, the USGS and the National Aeronautics and Space Administration produced a 500 m resolution GLC product in 2009, called MOD12Q1, which was based on MODIS imagery and classified via the decision tree algorithm (Friedl et al., 2010).
-
Global-scale MR/HR land-cover products. From the 2010s to the 2020s, owing to the open-access imagery from the Landsat and Sentinel missions with moderate (∼ 30 m) and high (∼ 10 m) resolution, research on global-scale MR/HR land-cover mapping blossomed. With respect to the MR land-cover products, Gong et al. (2013) proposed the first 30 m GLC product based on Landsat data, called FROM_GLC, with an overall accuracy of 65 %. Soon afterward, based on Landsat data and the imagery from the Huanjing-1 satellite, Chen et al. (2015) produced a 30 m GLC product, called GlobeLand30, with an accuracy of 80 %. More recently, based on Landsat time series imagery, Zhang et al. (2021) proposed GLC_FCS30, which is a 30 m GLC product with an accuracy of 83 %. Numerous GLC products with high resolution have also been published recently. Based on Sentinel-2A imagery, Gong et al. (2019b) produced the first 10 m GLC map with an accuracy of 73 %. Using Sentinel-1 and Sentinel-2 data, ESA has provided an annually updated 10 m GLC map since 2020, with a reported accuracy of 74 % (Van De Kerchove et al., 2021). Similarly, based on Sentinel-2 imagery, the Environmental Systems Research Institute (Esri) and the Impact Observatory proposed a 10 m GLC product in 2021 that reported an accuracy of 85 % (Karra et al., 2021).
-
National-scale MR/HR land-cover products. Similarly, based on open-access MR/HR imagery, numerous national-scale land-cover products are continuously produced. For example, with Landsat imagery, the USGS cyclically updates the 30 m National Land Cover Database (NLCD) covering the USA (Wickham et al., 2021). With Sentinel imagery, the UK Centre for Ecology & Hydrology (UKCEH) periodically publishes a national-scale 10 m land-cover map of the UK (Morton et al., 2021). For China, researchers adopted diverse methods to produce high-quality national-scale land-cover maps. By manually interpreting the Landsat images, Liu et al. (2014) produced a national-scale 30 m resolution land-cover product covering the whole of China, which revealed the land-cover patterns of China from the 1980s to 2015 at an interval of 5 years. Furthermore, based on the more frequent Landsat images and the Google Earth Engine, Yang and Huang (2021) produced the first 30 m annual land-cover dataset in China and analyzed the national-scale long-term land-cover change from 1990 to 2019, thereby providing important support for multi-temporal land-cover research in the region. Recently, Liu et al. (2023) took the training pairs with mismatched resolution, including the 30 m GLC product (noisy labels) and the 10 m Sentinel images at the year 2020, to train a deep-learning-based method and produced a national-scale 10 m land-cover map of China.
-
Regional-scale VHR land-cover products. In the 2020s, due to easily available VHR imagery, establishing VHR land-cover datasets for fine-object interpretation and deep-learning-based research has become a research hotspot (Xia et al., 2023). The current VHR land-cover datasets are generally regional-scale products (typically covering a few cities/provinces and smaller than a national scale) because of limitations with respect to the coverage and temporal resolutions of VHR imagery. For example, Wang et al. (2021) utilized imagery from airborne cameras and Google Earth to create a 0.3 m resolution regional-scale dataset, covering 536.15 km2 (including Nanjing, Changzhou, and Wuhan) of China. Huang et al. (2020) proposed a 2.1 m resolution regional-scale land-cover dataset, called Hi-ULCM, covering 42 major cities in China. Hi-ULCM was produced based on Ziyuan-3 (ZY-3) satellite imagery and reported an overall accuracy of 86 %. Moreover, Du et al. (2020) produced a 2.4 m resolution land-cover product, called PKU-USED, covering 81 China major cities. PKU-USED was based on the VHR imagery from ZY-3, Gaofen-6 (GF-6), and Google Earth.
Different production schemes are used for these four types of land-cover products. For the LR, MR, and HR land-cover products, the image sources (i.e., MODIS, Landsat, and Sentinel) are commonly openly accessible and contain massive amounts of spectral information but relatively low spatial context information compared with VHR imagery. Therefore, pixel-based machine learning algorithms (e.g., support vector machine; decision tree; and random forest, RF) are usually adopted to produce acceptable results (Defourny et al., 2007; Friedl et al., 2010; Gong et al., 2019b). Nevertheless, the production of VHR land-cover products usually faces two main problems. First, VHR imagery is commonly captured from commercial and military satellites with high acquisition costs (Coltri et al., 2013; Pengra et al., 2015). Second, VHR imagery commonly contains a few bands, for example, the spaceborne 2.1 m ZY-3 and 2 m GF-6 imagery only contain four bands: red, green, blue, and near-infrared. With limited spectral information and extensive spatial detail, pixel-based methods generally report low accuracy with respect to VHR land-cover mapping tasks (Zhang et al., 2018). With reference to the second problem, the object-based image analysis (OBIA) technique is widely utilized to produce VHR land-cover products. OBIA-based methods depend on handcrafted features to classify land objects and improve product accuracy (Jalan, 2012; Du et al., 2020). However, the feature selection of OBIA-based methods requires human intervention, which inevitably limits their application to large-scale product production (Pilant et al., 2020; Huang et al., 2020).
Recently, with the blossoming of deep learning techniques, many studies have employed deep-learning-based models for VHR land-cover mapping. For example, the 1 m National Agriculture Imagery Program imagery was used to train a deep learning framework and produced a 15-class land-cover map for the entire state of Maryland, USA (Li et al., 2022c). Moreover, using limited spectral information from optical imagery, numerous studies have shown that deep learning methods are suitable and capable of obtaining satisfactory results in a variety of regional-scale VHR applications such as land-use mapping (Srivastava et al., 2019), construction site mapping (Cao and Huang, 2022), greenhouse mapping (Ma et al., 2021), and change detection (Zhang et al., 2020; Li et al., 2021). However, existing deep learning methods rely on well-labeled data, which are time-consuming and laborious to annotate. This limitation has created a large obstacle preventing the production of a national-scale VHR land-cover map (Cao and Huang, 2022; Li et al., 2022a).
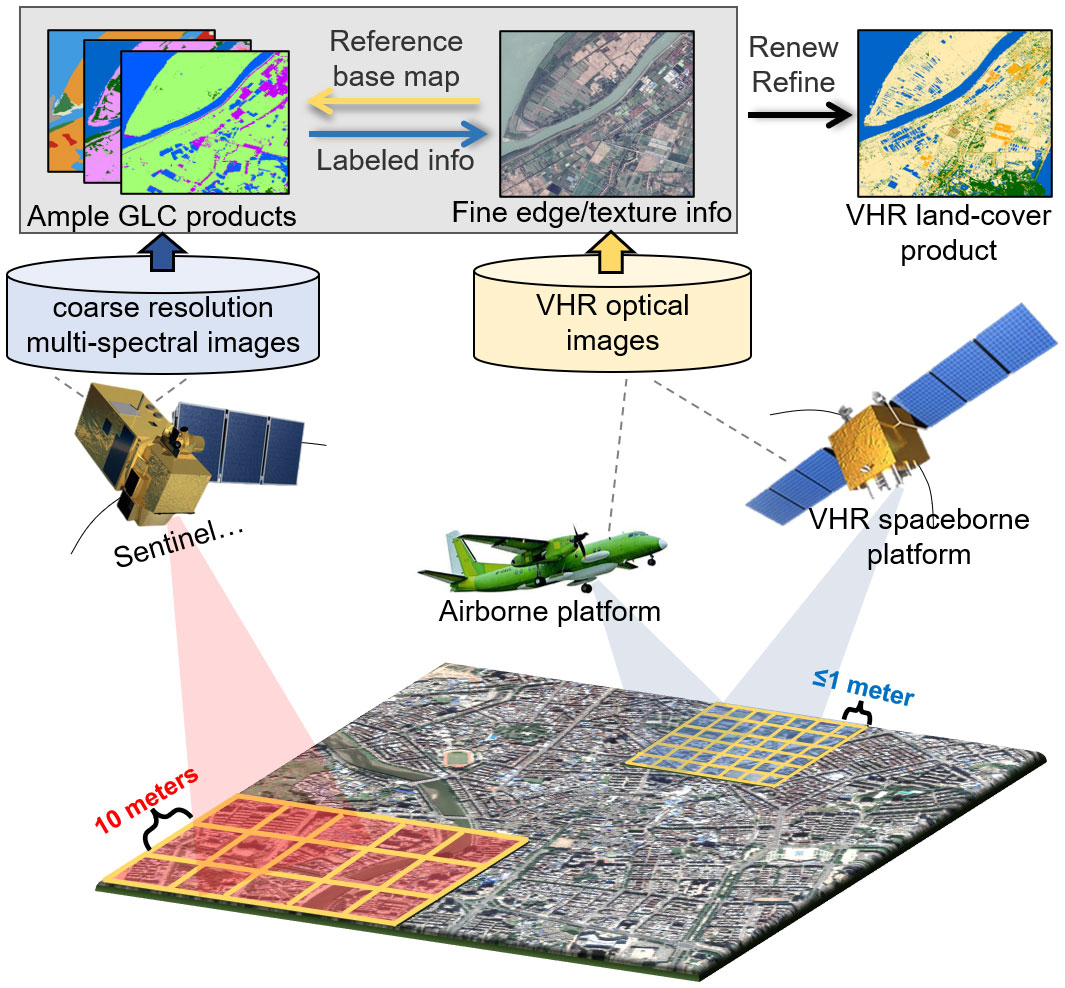
Figure 1Demonstration of using the fine-edge and texture information from VHR images to renew and refine the current ample coarse-resolution GLC products. The VHR remote-sensing images in the figure are from © Google Earth 2021.
To overcome these limitations, in this paper, a deep-learning-based framework is presented to create the first 1 m land-cover map for the entirety of China – called SinoLC-1 – using freely available 1 m Google Earth imagery, open-access 10 m GLC products, and OpenStreetMap (OSM) as input data. Figure 1 shows that, by combining the amply available GLC products containing adequate land-cover information and the VHR images containing fine-edge and texture information, a VHR land-cover map can be automatically refined through the proposed framework. In detail, the multisource 10 m land-cover products and the OSM are first integrated to generate coarse training labels. About 30 % of the land surface in China is selected to generate training pairs containing aligned VHR images and coarse labels. Training pairs are used to train the proposed low-to-high network (L2HNet), which is a large-scale VHR land-cover mapping network that was proposed in our previous work (Li et al., 2022c). Considering the label noise caused by the mismatched resolution between the VHR images and the coarse labels, the L2HNet integrates a resolution-preserving backbone, a weakly supervised module, and a self-supervised loss function to excavate the texture information from the VHR images and utilize the supervision information from the coarse labels. In practice, three large computing servers are used to conduct the training and mapping process. Finally, processing the 73.25 TB of data to produce the 1 m land-cover map covering ∼ 9 600 000 km2 of China takes about 10 months. Moreover, SinoLC-1 is produced without using any commercial data and without any requirement for manual annotations, resulting in a low capital expenditure and low labor cost. To the best of our knowledge, the SinoLC1 is the first 1 m resolution land-cover product and currently the highest-resolution land-cover product that covers the whole of China.
The remainder of this paper is arranged as follows: the dataset used is introduced in Sect. 2; the proposed framework, including the processes of training data collection, land-cover classification, and assessment, is illustrated in Sect. 3; the produced land-cover product is demonstrated, the validation results are analyzed, and the product limitations are discussed in Sect. 4; access to the data is provided in Sect. 5; and conclusions are given in Sect. 6.
2.1 Open-access remote-sensing images at 1 m resolution
The VHR optical images were collected from open-access Google Earth imagery, which has a resolution of 1.07 m. Google Earth, a well-known tool widely used in many popular image processing and Geographic Information System (GIS) software packages, provides freely available VHR images with large-scale coverage. By integrating the images captured from different satellites (e.g., WorldView, QuickBird, IKONOS, GeoEye-1, Pleiades, SuperView-1, and Kompsat-3A), Google Earth imagery enables the coverage of a very large range, including the entirety of China (Zhao et al., 2014). We have two main reasons for adopting Google Earth as the image source of VHR national-scale land-cover mapping. First, most VHR imagery is commonly captured from commercial and military satellites, and purchasing the imagery covering the whole of China is extraordinarily expensive (Rahman et al., 2010; Coltri et al., 2013; Pengra et al., 2015). Second, Google Earth imagery generally has mature sifting and preprocessing procedures to produce cloudless, high-quality imagery (Pulighe et al., 2016). Based on this image source, the misclassification of land objects caused by the image quality, cloud, and cloud shadow can be minimized. Many researchers have also reported the feasibility and possibility of using Google Earth imagery to conduct VHR large-scale land-cover mapping (Malarvizhi et al., 2016; Guo et al., 2016; Li et al., 2020).
To construct the image database for producing SinoLC-1, imagery from the “December 2021” version was collected according to every provincial administrative regional border of China and cropped into a size of 6000 pixels × 6000 pixels as the basic storage tile. The total storage size of imagery with red, green, and blue bands was about 73.25 TB, covering ∼ 9 600 000 km2 of China's land surface area. The use of Google Earth imagery and the country boundary are demonstrated in Fig. 2a.
2.2 Global land-cover data at a 10 m resolution
Annotating the VHR-labeled samples for national-scale VHR land-cover mapping is a challenging, laborious process. In general land-cover mapping studies, most of the published land-cover products were produced based on well-labeled training samples, which inevitably hinders their productivity and application coverage (Cao and Huang, 2022). In this paper, multiple open-access GLC products at 10 m resolution were integrated to obtain reliable labeled samples, and we combined weakly and self-supervised strategies during the network training to utilize them as a reasonable supervision source.
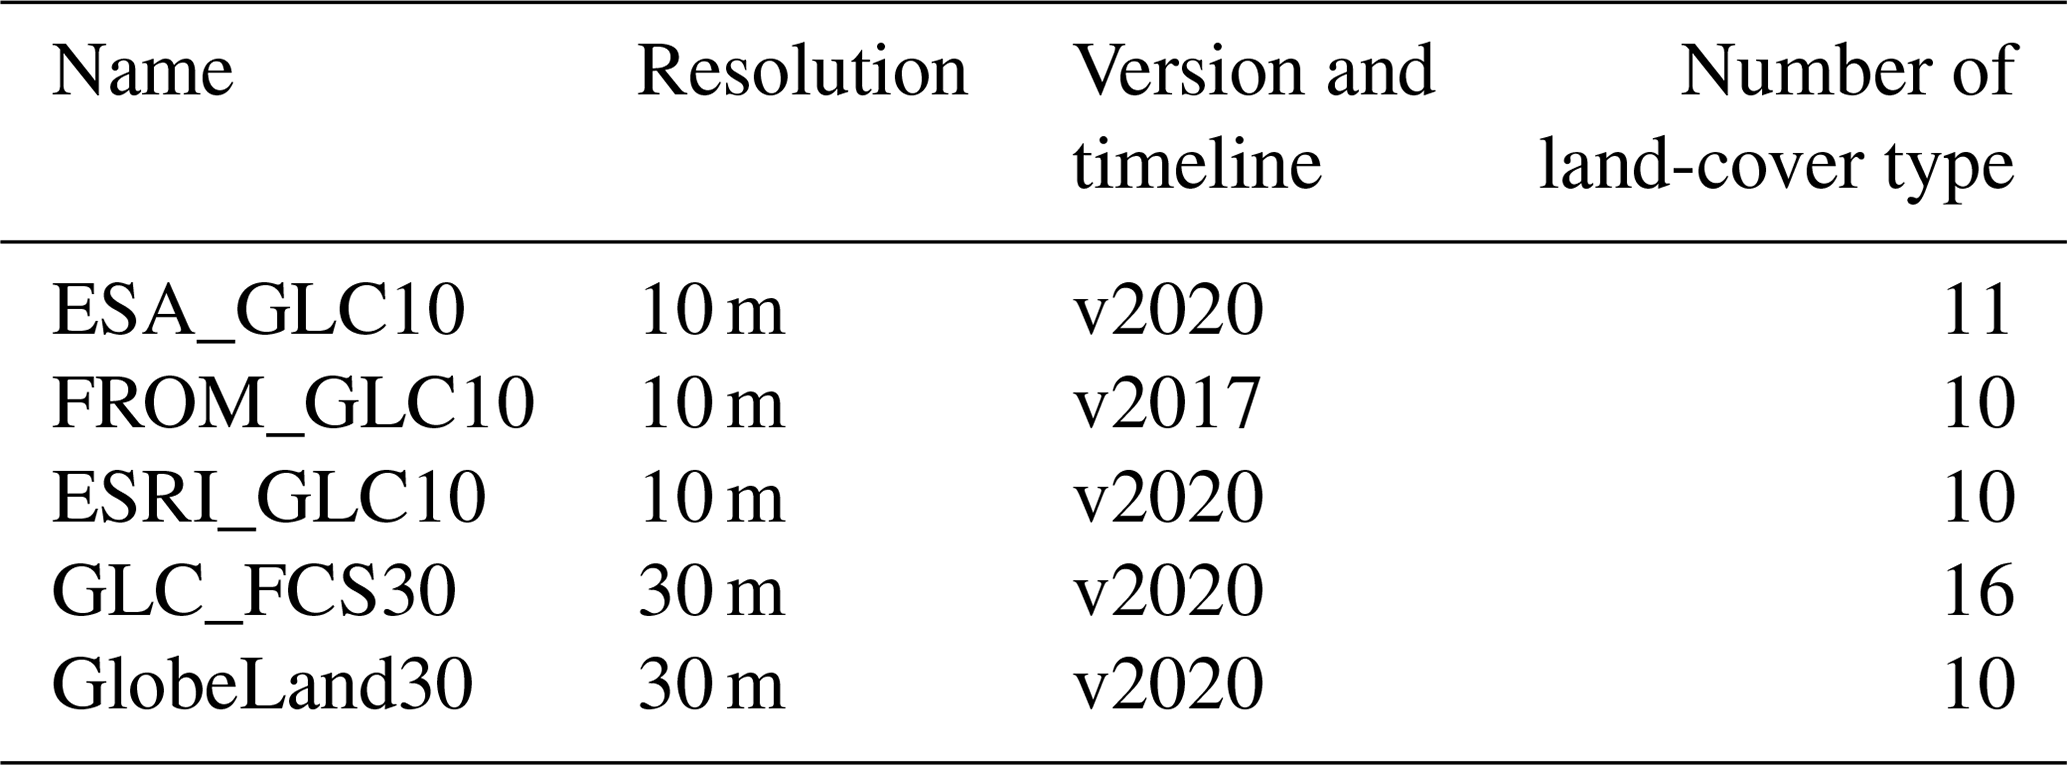
Concretely, the land-cover-labeled data were collected from three open-access 10 m GLC products, namely, FROM_GLC10 (Gong et al., 2019b), Esri world cover (Karra et al., 2021), and ESA_WorldCover v100 (Van De Kerchove et al., 2021). FROM_GLC10 was produced using Sentinel-2A imagery, which reported an overall accuracy of 73 % at a global scale. Esri world cover (abbreviated as ESRI_GLC10) was produced based on Sentinel-2 imagery and reported an overall accuracy of 85 %. ESA_WorldCover v100 (abbreviated as ESA_GLC10) was produced using Sentinel-1 and Sentinel-2 data and reported an overall accuracy of 74 %. Table 1 shows the land-cover relationships between these products and the proposed SinoLC-1 product.
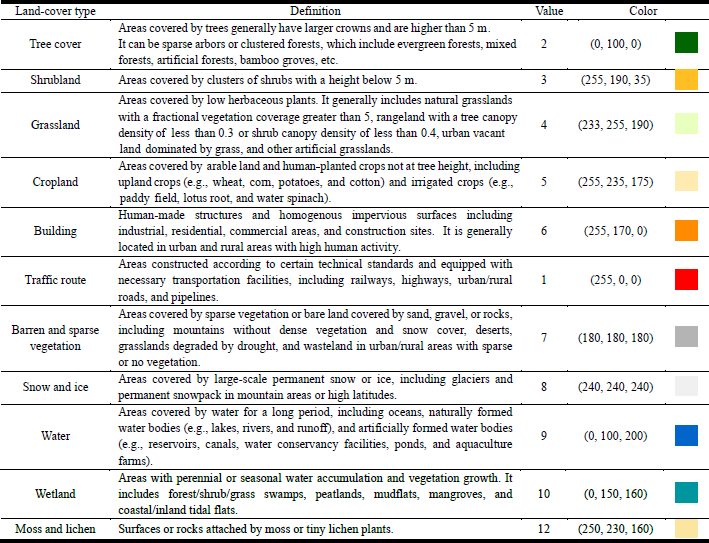
Table 2 shows the definition, value, and color of each land-cover type of the SinoLC-1 product. SinoLC-1 contains 11 land-cover classes and includes the unique class of “Traffic route” compared with other products. Subpanels 1–3 in Fig. 2c show the demonstration samples of the three 10 m GLC products located in the city of Wuhan.
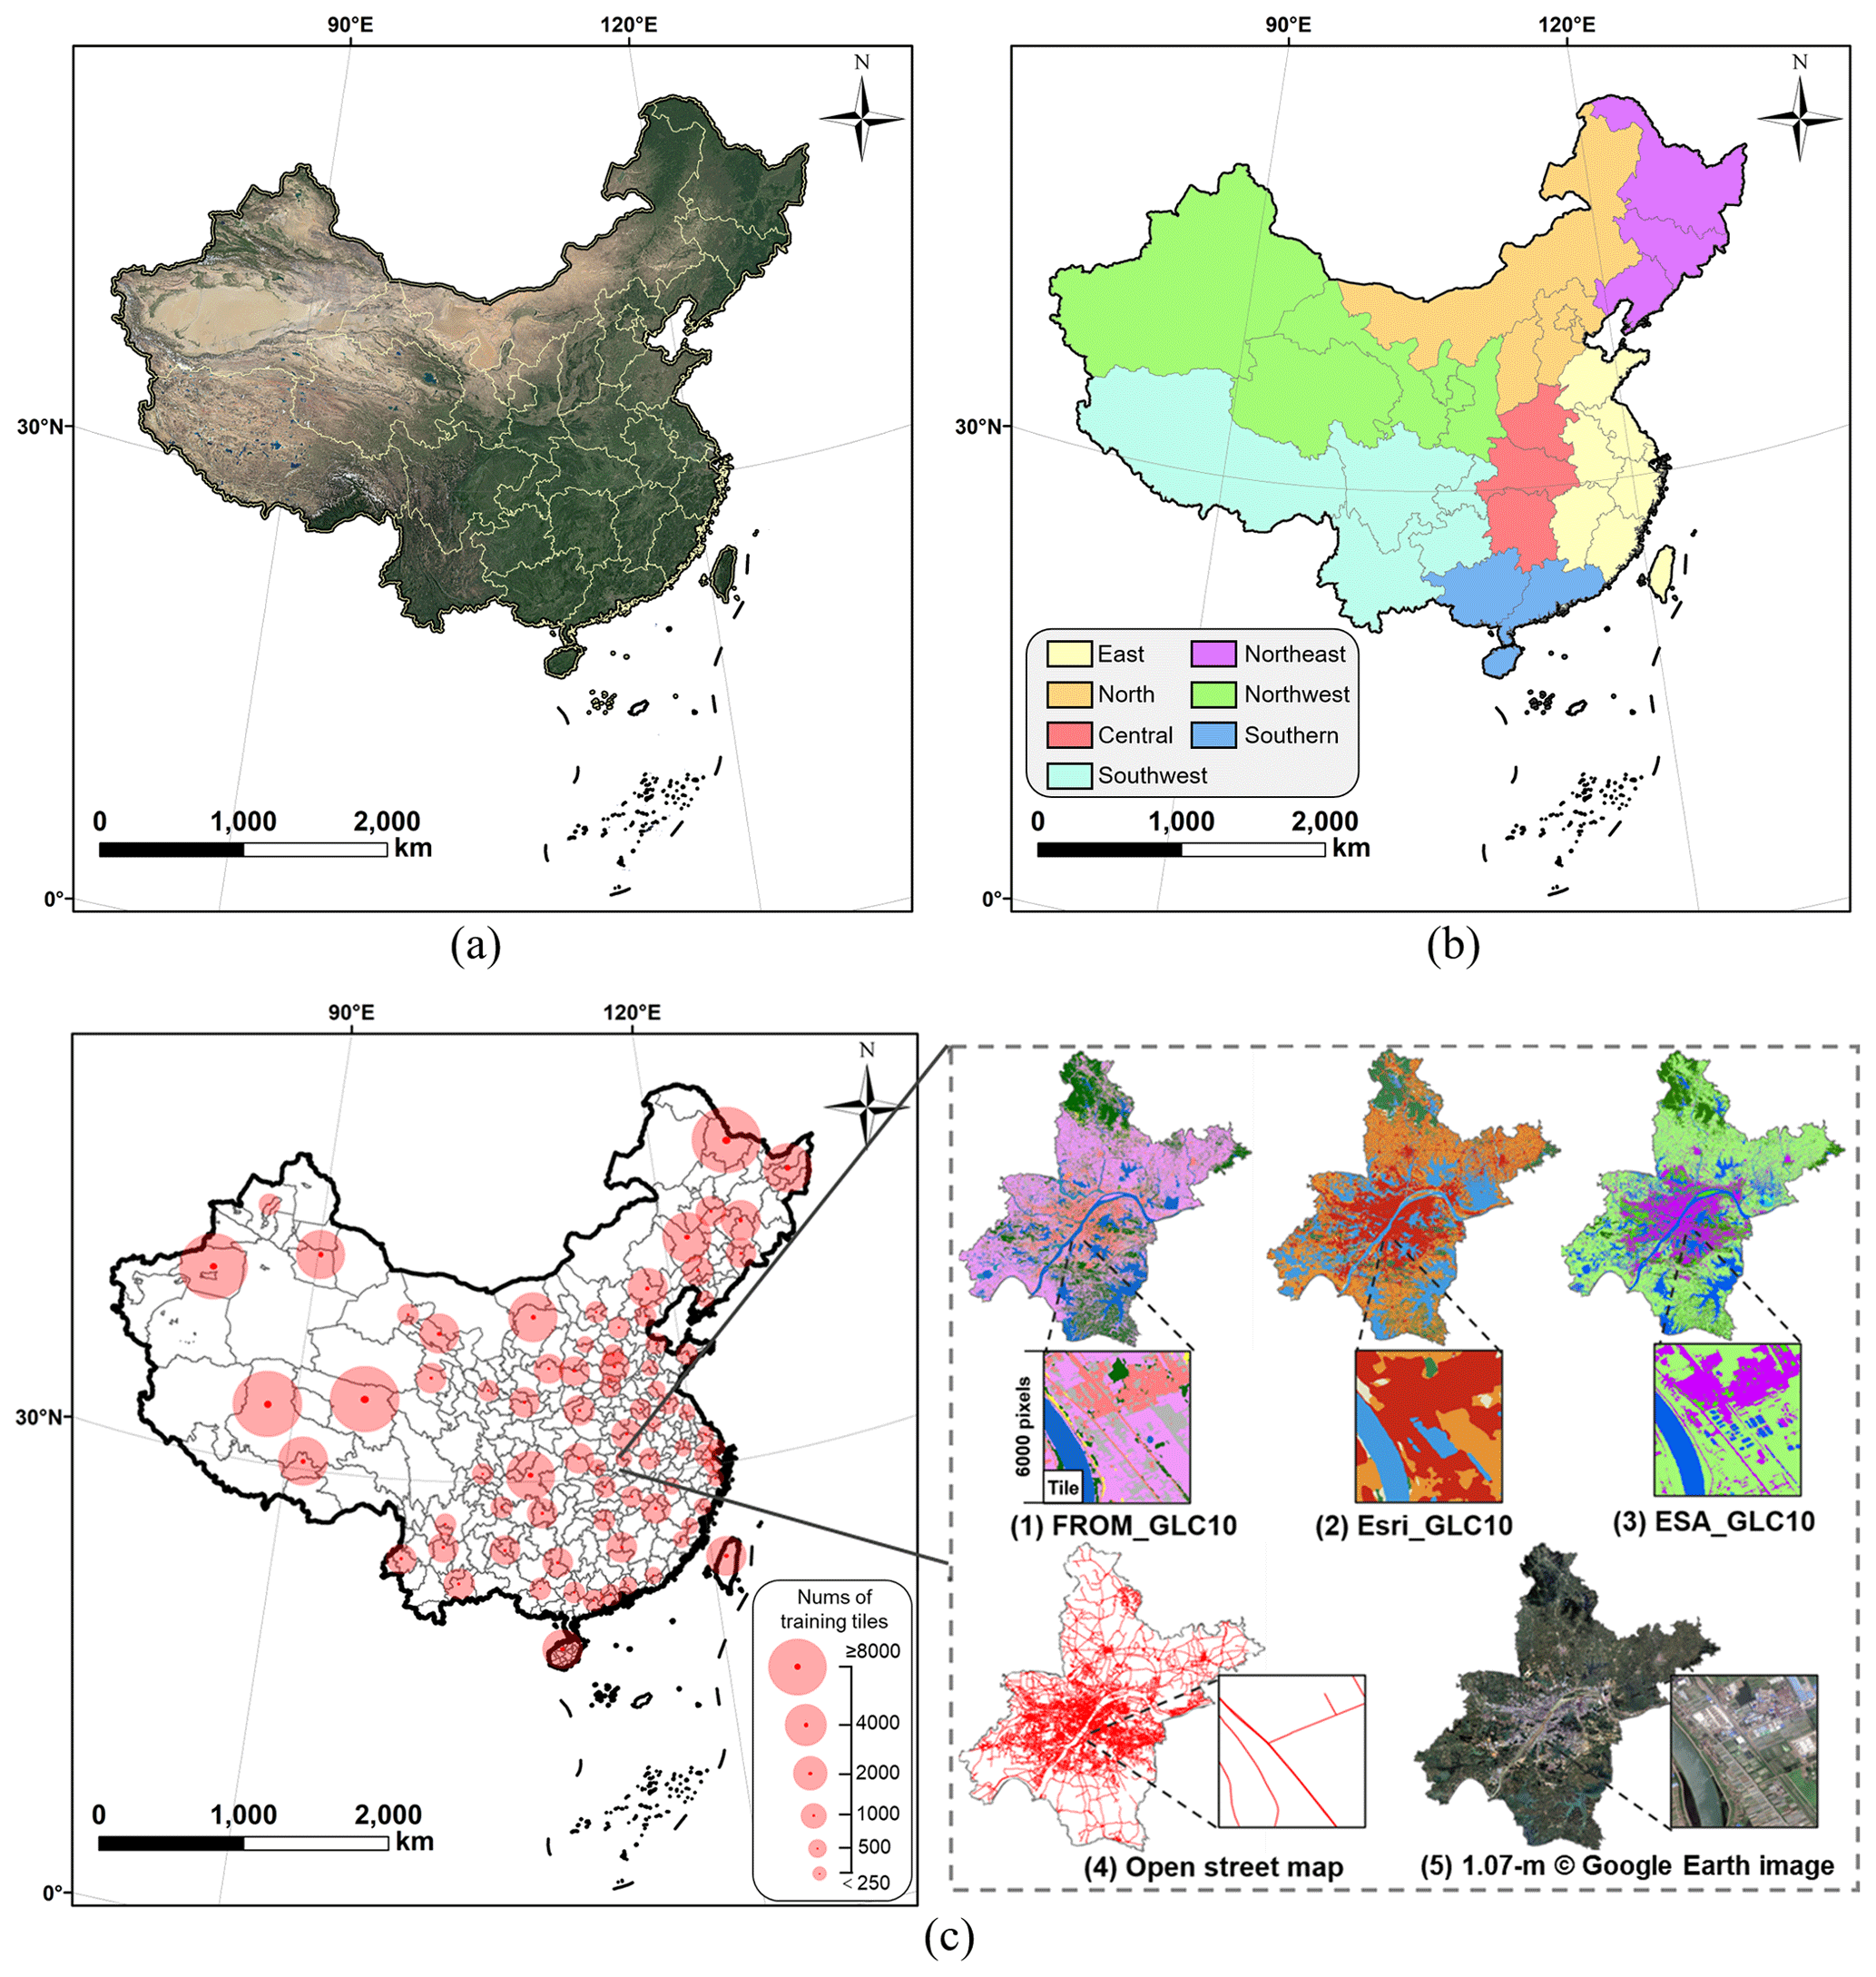
Figure 2Demonstration of the regional division, training sample selection, and use of five datasets: (a) © Google Earth 2021 imagery of China, (b) seven geographical regions of China, and (c) the distribution and volume of the training samples.
Table 1Category relations between FROM_GLC10, ESA_ GLC10, ESRI_GLC10, and the proposed SinoLC-1.
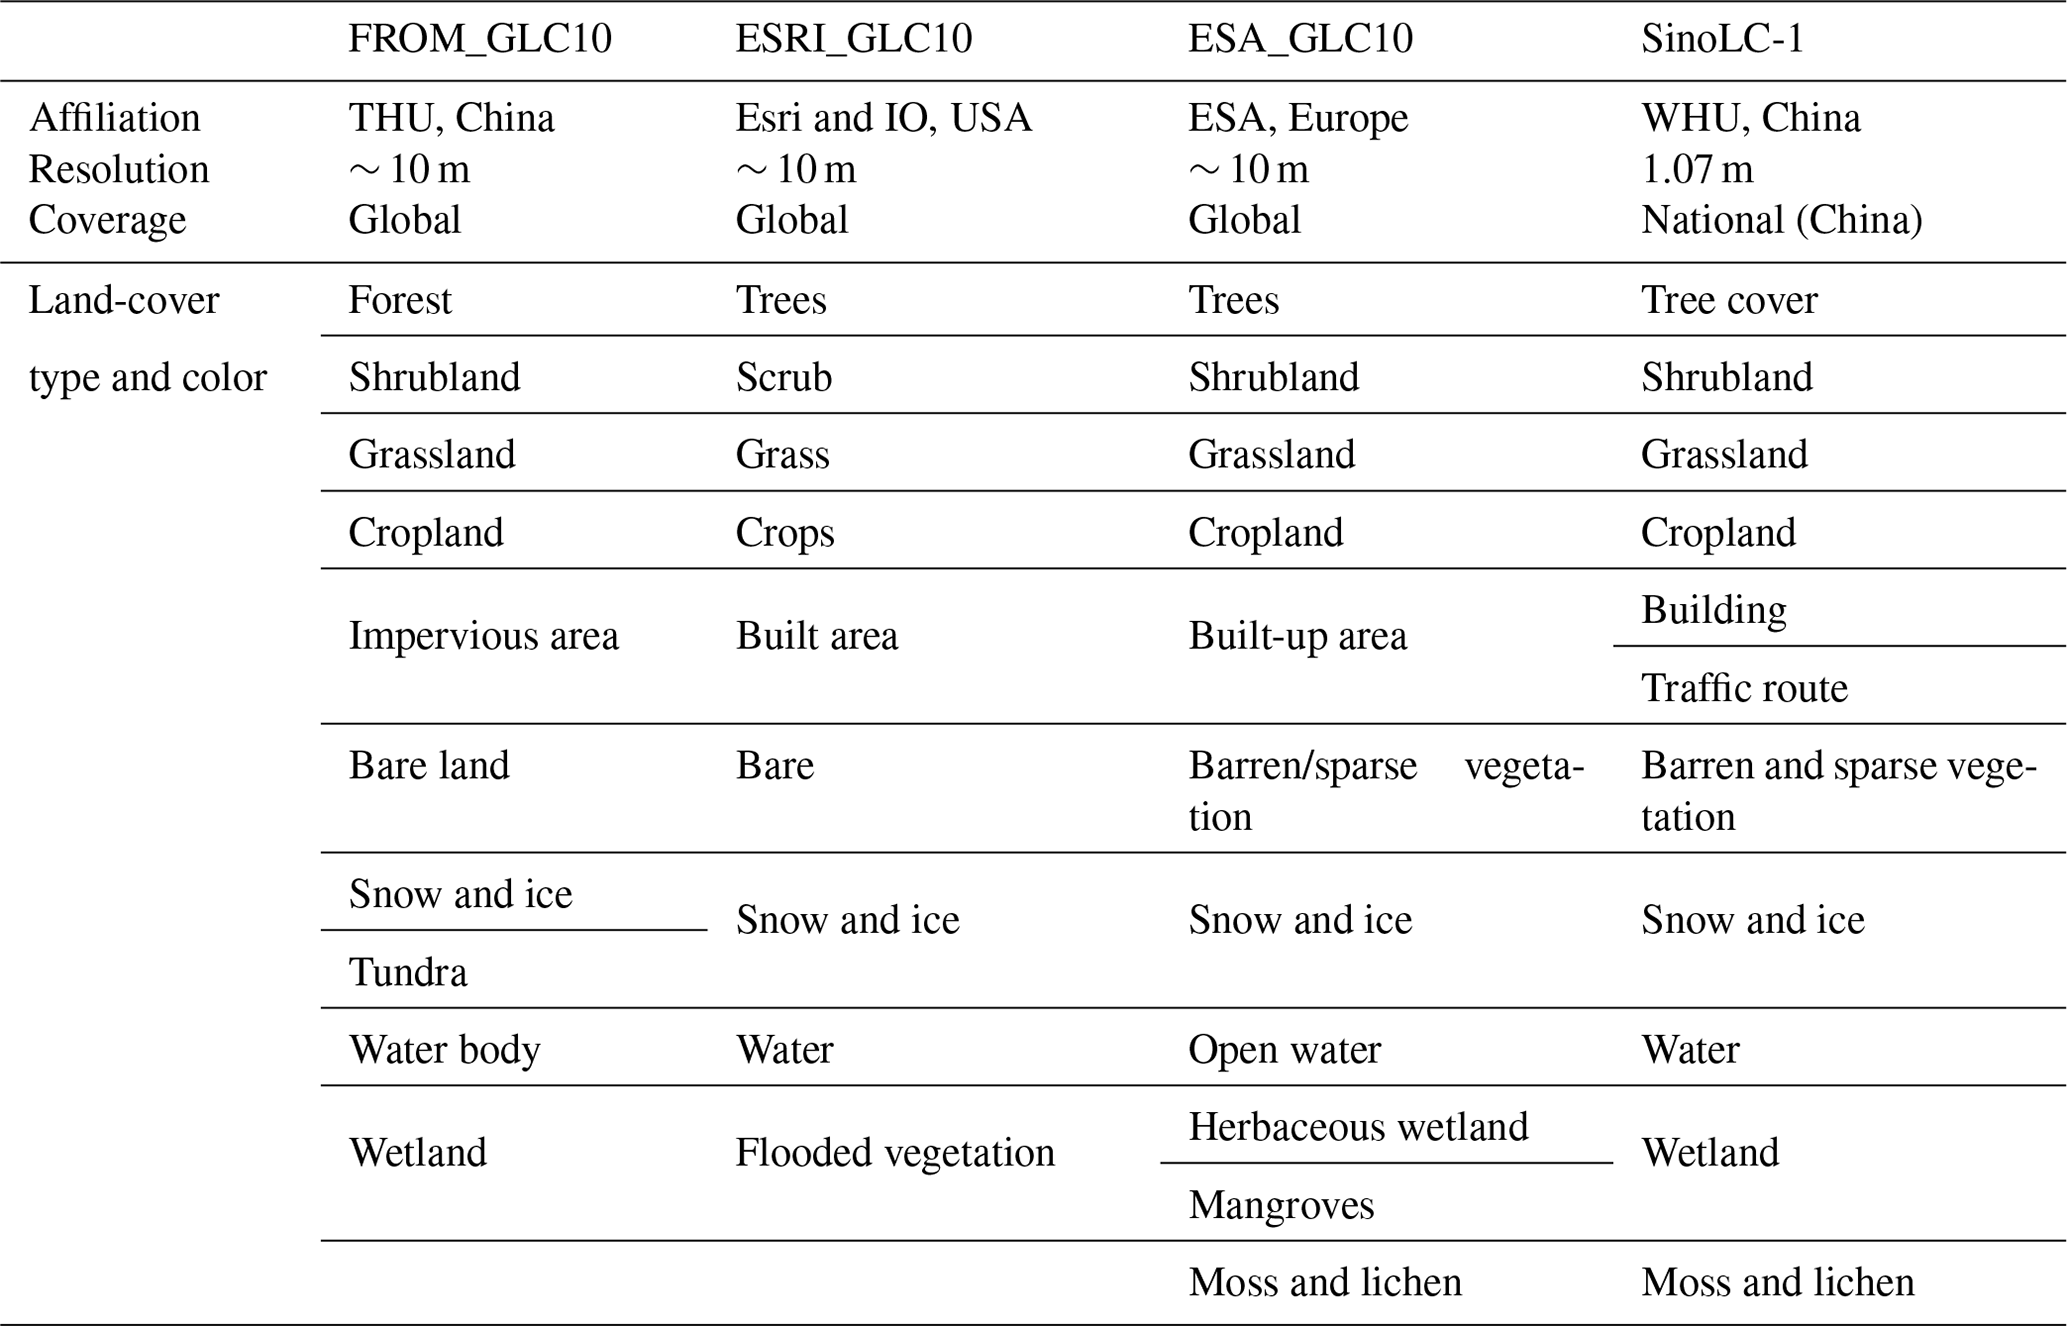
The abbreviations/acronyms used in the table are as follows: THU – Tsinghua University; Esri – Esri, Inc.; IO – IO, Inc.; and WHU – Wuhan University.
2.3 OpenStreetMap data
Traffic routes and transportation networks provide important information to better understand the development, urbanization, and population of a country (Osses et al., 2022). In VHR land-cover mapping research, the traffic route is a fundamental land-cover type to reveal urban patterns and reflect regional traffic (Boguszewski et al., 2020; Xia et al., 2023; Hu et al., 2023). Given that the traffic route can be clearly identified from the 1 m resolution imagery, the land-cover type of Traffic route was also considered in the proposed SinoLC-1 land-cover product. To obtain reliable traffic-route-labeled information, the labeled data were collected from the OSM database in vector format. As one of the most popularly volunteered geographic information data sources, the road-pattern-labeled information provided by the OSM is stable and reliable, and it is often used as a supplemental data source in land-cover or land-use mapping tasks (Zhu et al., 2022; Zhong et al., 2020; Audebert et al., 2017). In order to use the OSM data as a supervision source during network training, the vector OSM data were transformed into raster format at the same resolution as the GLC products. Thus, they can be utilized as pixel-level labels to guide the training process. Figure 2c shows the samples of traffic routes obtained from the OSM located in the city of Wuhan, Hubei Province.
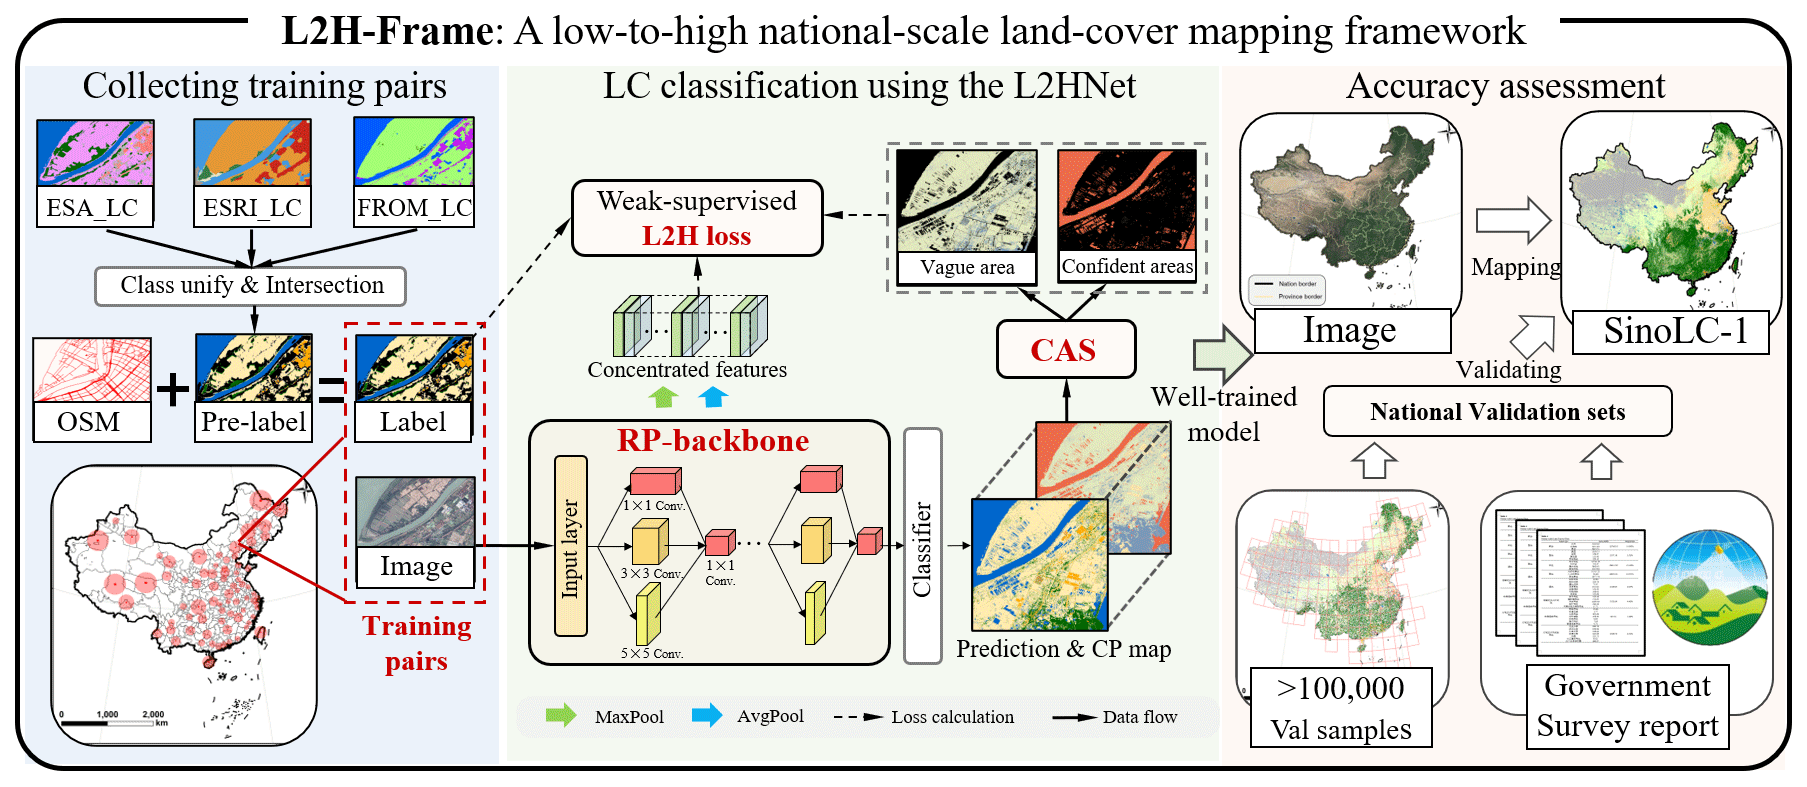
Figure 3The overall workflow of the L2H-Frame. The framework includes three main parts: (a) collecting training pairs, (b) land-cover classification using the L2HNet, and (c) accuracy assessment. The VHR remote-sensing images in the figure are from © Google Earth 2021.
In this section, the proposed L2H-Frame, which is an efficient deep-learning-based framework for national-scale VHR land-cover mapping, is introduced. Based on a series of weakly and self-supervised strategies, the L2H-Frame only uses open-access data sources as training data to produce the 1 m resolution land-cover map of China, which allows the framework to maintain low capital expenditure costs with respect to image acquisition and low labor cost with respect to training label annotation. As per the overall framework depicted in Fig. 3, the L2H-Frame consists of three main steps: (a) collecting nationwide training pairs, (b) land-cover classification using the L2HNet, and (c) accuracy assessments. In the following subsection, these main steps are introduced sequentially.
3.1 Collecting nationwide training pairs
To collect reliable training pairs for the national-scale VHR land-cover mapping process, 98 municipal-level areas were selected from the 34 provincial administrative regions of China. In every selected municipal-level area, the data were divided into numerous non-overlapping 6000 pixel × 6000 pixel tiles. In each tile, the training pairs were constructed by five types of data: three 10 m GLC products, the OSM data, and the 1.07 m resolution Google Earth images. Figure 2c demonstrates the sample using the data, location, and contained volume of tiles for all the selected training areas. Moreover, by considering the immense span of China's territory and the variable landforms, according to the geographic location, climate, economic development, and land-cover pattern (Lin, 2002; Ning et al., 2022), the land surface of China was divided into seven geographical regions for separate training. Figure 2b shows the locations and borders of the seven geographical regions: east, northeast, north, northwest, central, southern, and southwest.
According to the classification system of mainstream large-scale land-cover products and the landscape style of China, the classification system of SinoLC-1 was defined as the following 11 land-cover classes: “Tree cover”, “Shrubland”, “Grassland”, “Cropland”, “Building”, “Traffic route”, “Barren and sparse vegetation”, “Snow and ice”, “Water”, “Wetland”, and “Moss and lichen”. The detailed definitions of each type are shown in Table 2.
Specifically, to obtain reliable land-cover information and generate the training labels from three GLC products, the classification systems of ESA_GLC10, ESRI_GLC10, and FROM_GLC10 (see Table 1) were unified, and the unified results were then intersected to generate the pre-labels. In the pre-labels, the pixels/areas in which the land-cover types were the same in the three GLC products were preserved as the stable labeled areas; otherwise, the pixels/areas were set as unlabeled and retained a void value. In particular, because the Moss and lichen land-cover type is a unique land-cover type of the ESA_GLC10 product, the areas covered by the Moss and lichen type were directly inherited from the ESA_GLC10 product during the generation of pre-labels. Moreover, to generate stable labeled samples for the traffic route, the vector road pattern information collected from OSM was transformed into raster format with the same resolution as the pre-labels, and the transferred road pattern samples were then overlaid onto the pre-labels to generate the final training labels. Figure 4a shows the proportion of the training area in each geographical region, and Fig. 4b shows the land-cover distribution of the training labels in each geographical region.
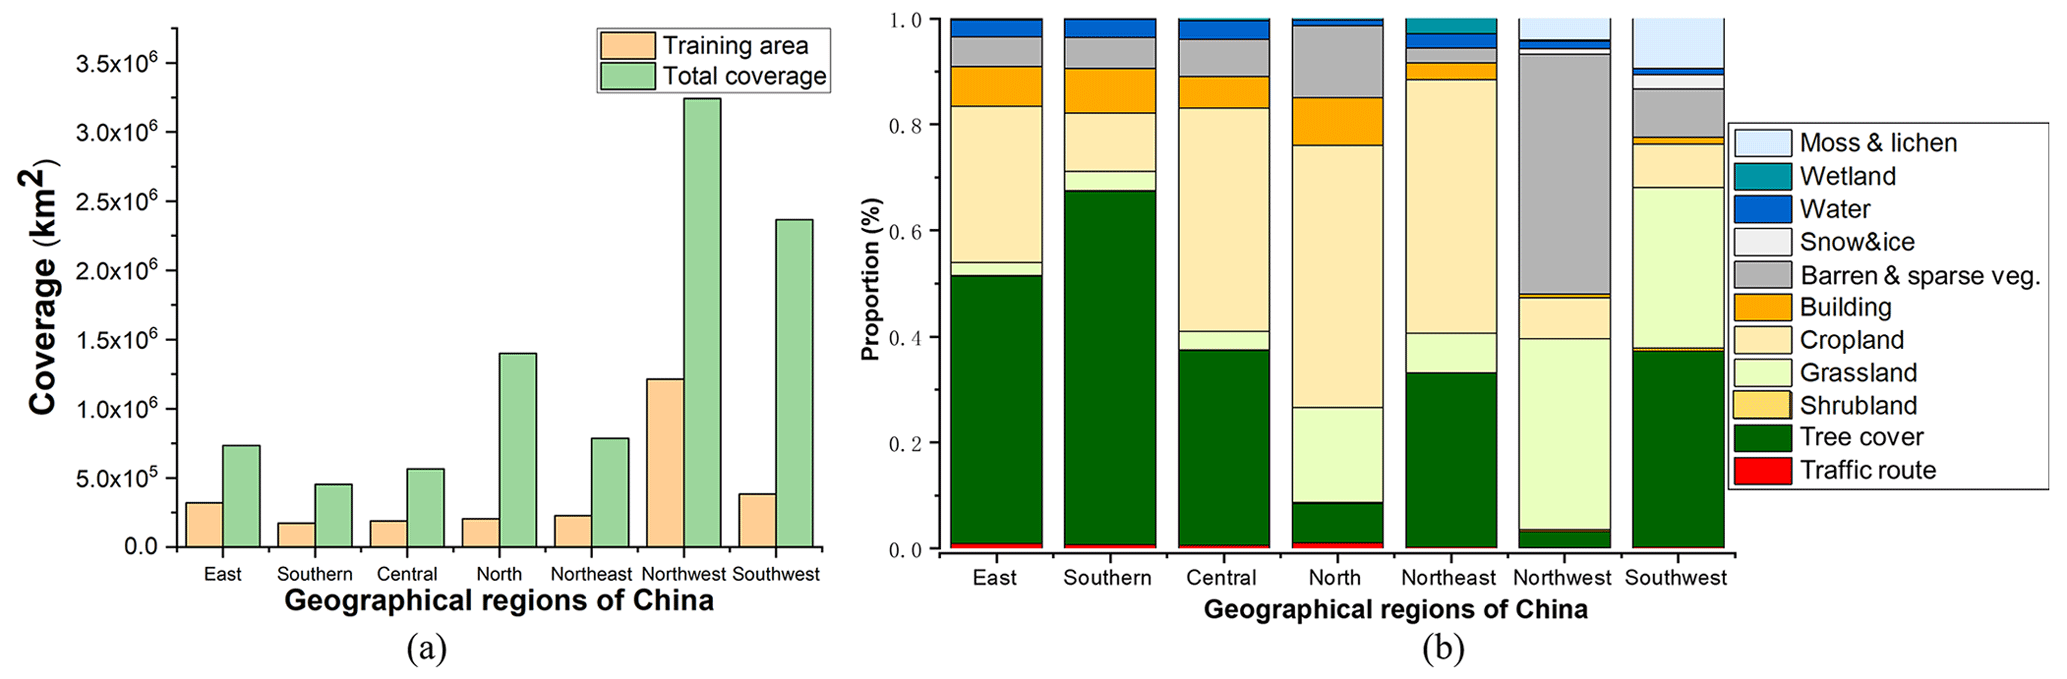
Figure 4Statistical information on the selected training labels in seven geographical regions: (a) proportion of training area and (b) class distribution of training labels.
3.2 Land-cover classification using the low-to-high network
3.2.1 Training of the low-to-high network
To process the resolution-mismatched training pairs and realize automatic national-scale VHR land-cover mapping for China, the low-to-high network (L2HNet), as outlined in our previous work (Li et al., 2022c), was applied. Aiming to robustly extract multiscale features and use the coarse labels as a more reasonable supervision source during the training, as shown in Fig. 3b, the L2HNet combined a resolution-preserving (RP) backbone, a confident area selection (CAS) model based on a weakly supervised strategy, and a low-to-high (L2H) loss based on an unsupervised strategy.
To extract features robustly from the VHR images, the images first passed through an input layer (i.e., a 64-channel 3 × 3 convolutional layer) to obtain dense feature maps. Then, the RP backbone consisting of five blocks, where each block contained multiscale (i.e., 1 × 1, 3 × 3, and 5 × 5) convolution layers with the channel setting of “64:32:16”, extracted the multiscale information from the dense feature maps by highly preserving their spatial resolution. Unlike the common deep-learning-based networks that deeply down-sample the features with encoder–decoder structures (e.g., UNet, Ronneberger et al., 2015, and DeepLabv3+, Liang-Chieh et al., 2018), the channel number of different-scale convolutional layers in each block of the L2HNet were inversely proportional to their receptive fields. Therefore, the multiscale layers can scan the feature maps with proper receptive fields to preserve the feature resolution rather than over-down-sampling them and losing feature details. Lastly, based on a classifier constructed by a softmax function and a 1 × 1 convolutional layer, the extracted features were classified into the prediction results and the corresponding confidence probability (CP) map.
To take the coarse training label as a more reasonable supervision source, the L2H loss was designed as a two-part composition with weakly and self-supervised strategies. For the first part, a CAS module based on a weakly supervised strategy was designed to select the trustworthy parts from the coarse labels and ignore the noisy samples according to the CP map of the predictions. Then, the confident area (CA) set, which had a high CP in the predictions, was selected to calculate the cross entropy (CE) loss with the coarse labels, and the vague area (VA) set, which had low confidence, was ignored during the CE loss calculation. Formally, for a training patch with the size of W×H, Y′, , and represent the coarse training labels, the prediction results, and the selected mask generated by the CAS module, respectively. The modified CE loss can be written as follows:
where and denote class l of the label Y′ and the prediction Y′ in coordinates (i, j), respectively. Element of the selected mask is a binary scalar to represent if the coordinate (i, j) is selected into the CA set.
For the second part, by considering the feature similarity of the same land-cover classes, the unsupervised dynamic vague area (DVA) loss was designed to constrain the within-class variance (Otsu, 1979) dynamically between the well-predicted CA set and the unsupervised VA set in the feature space. Formally, the 2-norm of the inter-area mean difference was used, represented as , to describe the land-cover class variance in the feature layer. Moreover, the DVA loss is the accumulation of in every land-cover class and feature layer, whose specific form is as follows:
where γ is a scale factor that is set as 0.05 according to our previous work (Li et al., 2022c). By combining Eqs. (1) and (2), the L2H loss can be described as follows:
Furthermore, according to the location of seven geographical regions and the training sample distributions shown in Fig. 2b and c, seven L2HNets were trained separately for every region to adapt the variable landforms and different land-cover patterns over the immense span of China's territory. During the training of L2HNet, each training tile (the aligned VHR image and 6000 pixel × 6000 pixel training label) was randomly cropped into 500 patches, where each patch had a size of 256 pixels × 256 pixels, to utilize the training data fully while ensuring training efficiency.
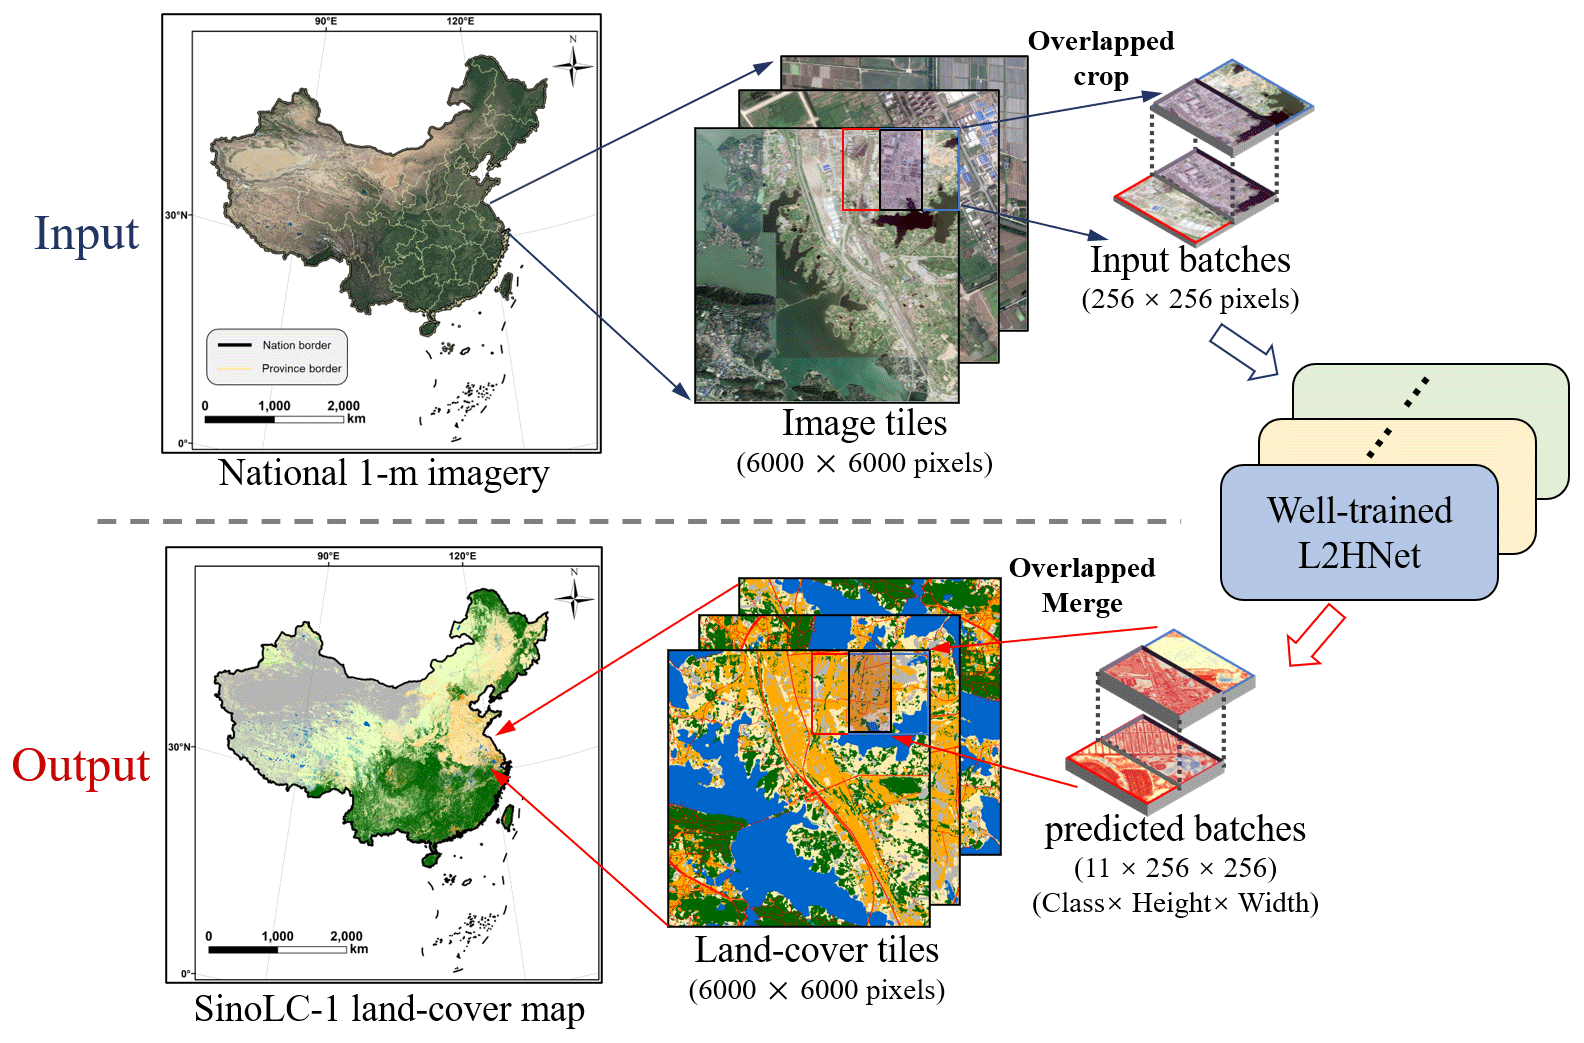
Figure 5Demonstration of the mapping and merging to produce SinoLC-1. The VHR remote-sensing images in the figure are from © Google Earth 2021.
3.2.2 Seamless mapping and merging process
To acquire the seamless national-scale land-cover map, a seamless mapping and merging strategy was employed to successively process the massive number of data covering China. Specifically, as shown in Fig. 5, the whole process included four steps. First, the nationwide 1 m resolution imagery was sorted out according to the borders of each provincial administrative region. In each region, the region-wide coverage image was sequentially cropped into numerous non-overlapping 6000 pixel × 6000 pixel image tiles. Second, to obtain the image batches that can be sent to the well-trained networks, each image tile was sequentially cropped into numerous 256 × 256 patches with 128 overlapping pixels. Based on the training process introduced in Sect. 3.2.1, seven L2HNets were separately trained with the training pairs collected from seven geographical regions of China. Third, according to the geographical region of the input image source, the image batches were sent to the corresponding well-trained L2HNet, and the predicted batches of the land-cover mapping results were obtained. The input batches had 128 overlapping pixels, so the adjacently predicted batches, which represent a predicted probability matrix with the size of 11 × 256 × 256 (class × height × width), were seamlessly merged into the land-cover tiles by calculating average probabilities of the overlapping areas and taking the arguments of the maxima (argmax) among all the classes. By conducting the seamless mapping and merging process, the influence of edge cracks between the cropped predicted batches is reduced. Finally, for each provincial administrative region, every merged land-cover tile was sequentially spliced into the intact land-cover map.
Based on the procedure, three large computing servers, including eight NVIDIA GeForce RTX 3090 GPUs and a large-storage server, were employed to conduct the mapping and merging of the SinoLC-1 in parallel. Processing all of the imagery with a total storage size of about 73.25 TB to obtain the SinoLC-1 land-cover product encompassing the ∼ 9 600 000 km2 area of China took about 10 months.
3.3 Accuracy assessment
Assessing the accuracy of land-cover products is an essential step in describing their quality before they are used in related applications (Olofsson et al., 2013). To comprehensively validate the accuracy of the proposed SinoLC-1 product at pixel and statistical levels and to analyze the omission and commission errors in detail, a nationwide pixel-level validation set was built by randomly sampling and visually interpreting over 100 000 points for the entirety of China, and a statistical-level validation set for every provincial administrative region in China was derived by collecting the official land resource survey data from the Natural Resources and Planning Bureau of the Chinese government.
3.3.1 Generating a pixel-level validation sample set across China
As a widely used assessment method for land-cover products, many studies including the 30 m annual land-cover dataset of China (Yang and Huang, 2021) and the impervious surface map of China (Gong et al., 2019a) divided the whole of China into numerous grids with the same size and randomly sampled the points in each grid to generate the validation sets. In this paper, China was divided into 171 grids, each with a size of 3∘ × 3∘, and 800 points in each grid were randomly sampled to generate the national validation sample set to assess the accuracy of SinoLC-1. After removing the sample points located in the far ocean and outside the nation's borders, 106 852 points remained; these sample points were then manually annotated by combining the visual interpretation results of VHR imagery captured from Google Earth and HR imagery captured from the Sentinel-2 mission to identify their land-cover types. Figure 6 shows the sample grids, legend, and VHR samples of the national validation set, and Fig. 7 shows the class proportion comparison between the sample set and the SinoLC-1 product. The land-cover proportion of selected sample points in the validation set is relatively similar to the SinoLC-1 dataset, further indicating that the ∼ 100 000 sample points have a reasonable class distribution. Based on the national validation sample set, the quantitative metrics – including the user's accuracy (UA), which measures the commission error; the producer's accuracy (PA), which measures the omission error; the overall accuracy (OA); and the κ coefficient – can be calculated to comprehensively assess the performance of SinoLC-1.
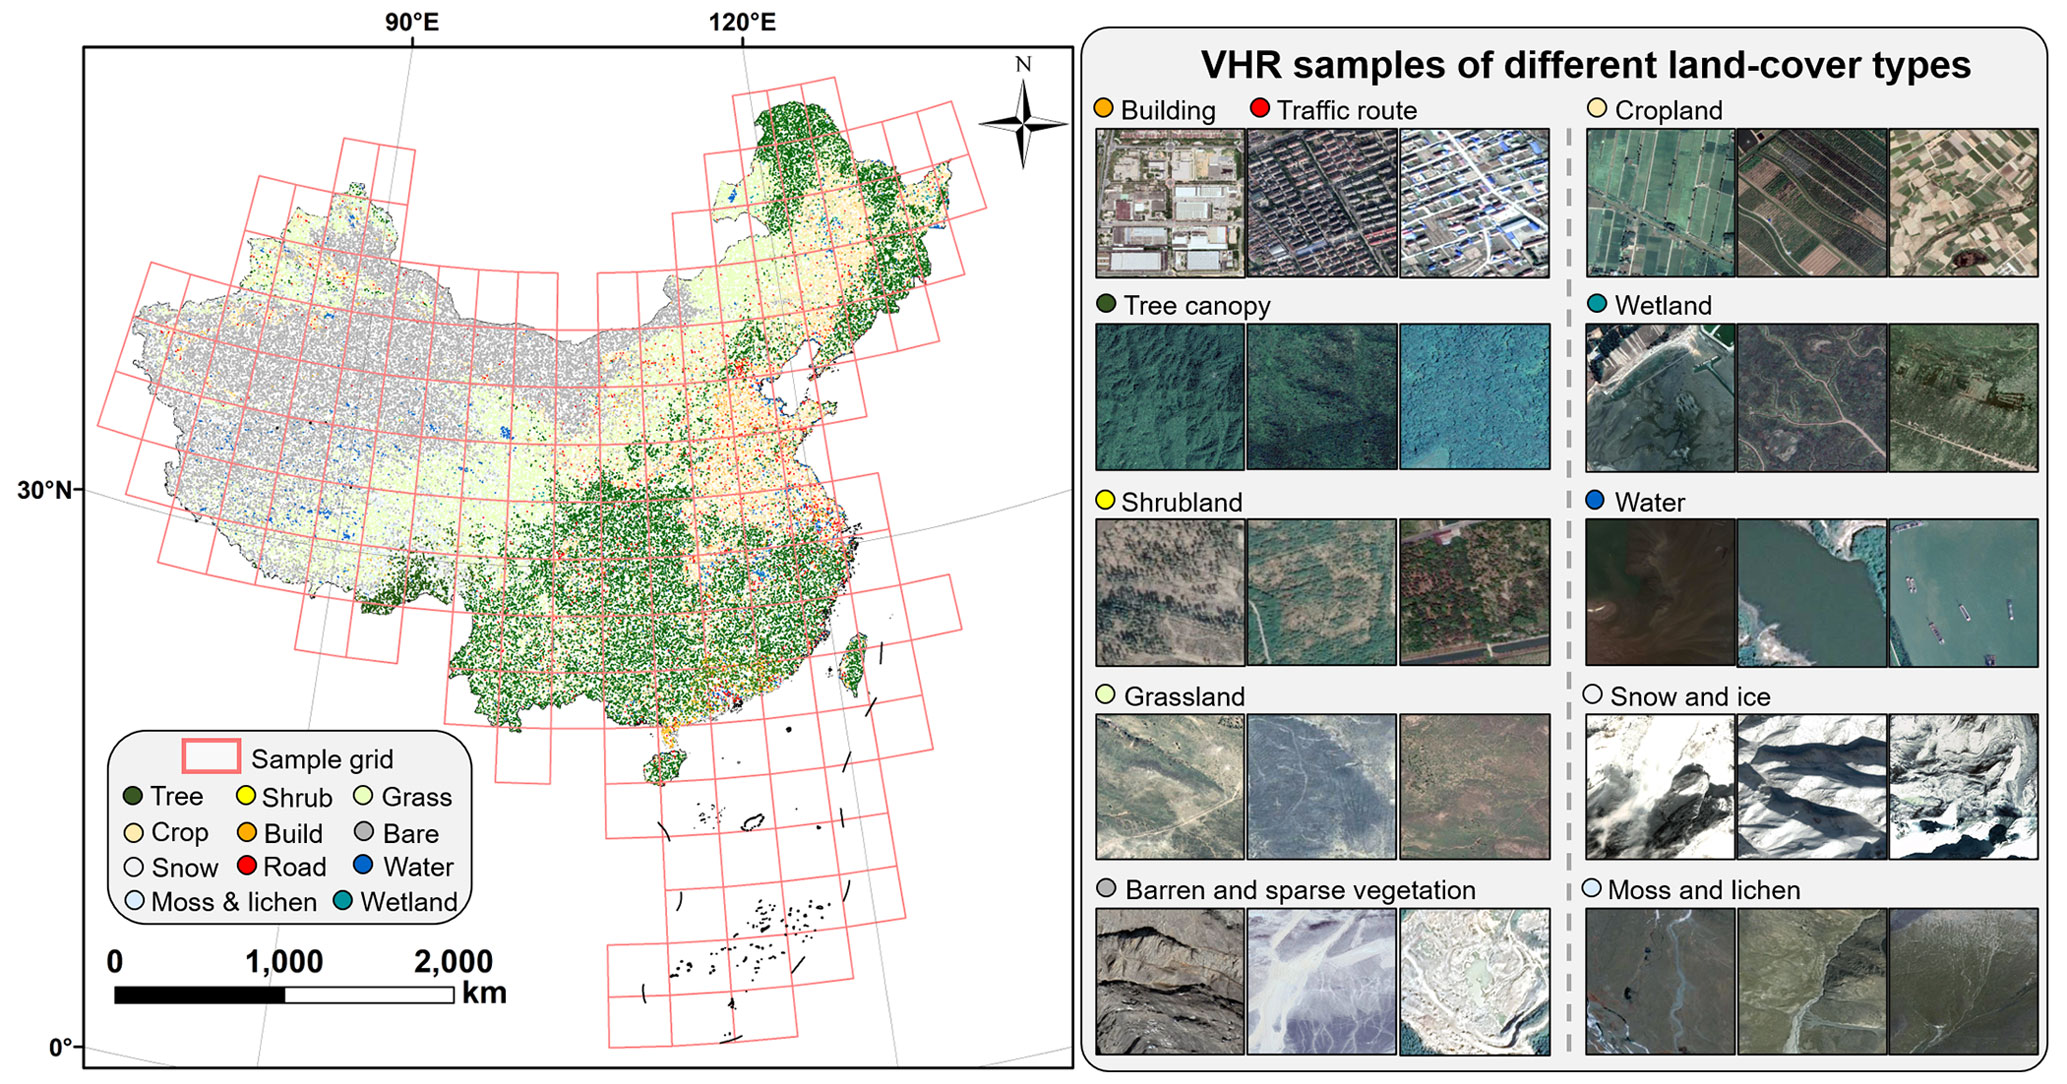
Figure 6Demonstration of the sample grid, VHR samples, and the national validation sample set. The left panel shows the spatial distributions of the sample set (the legend is written in shorter forms). The right panel presents the VHR samples of different land-cover types collected from 1.07 m resolution © Google Earth imagery all around China.
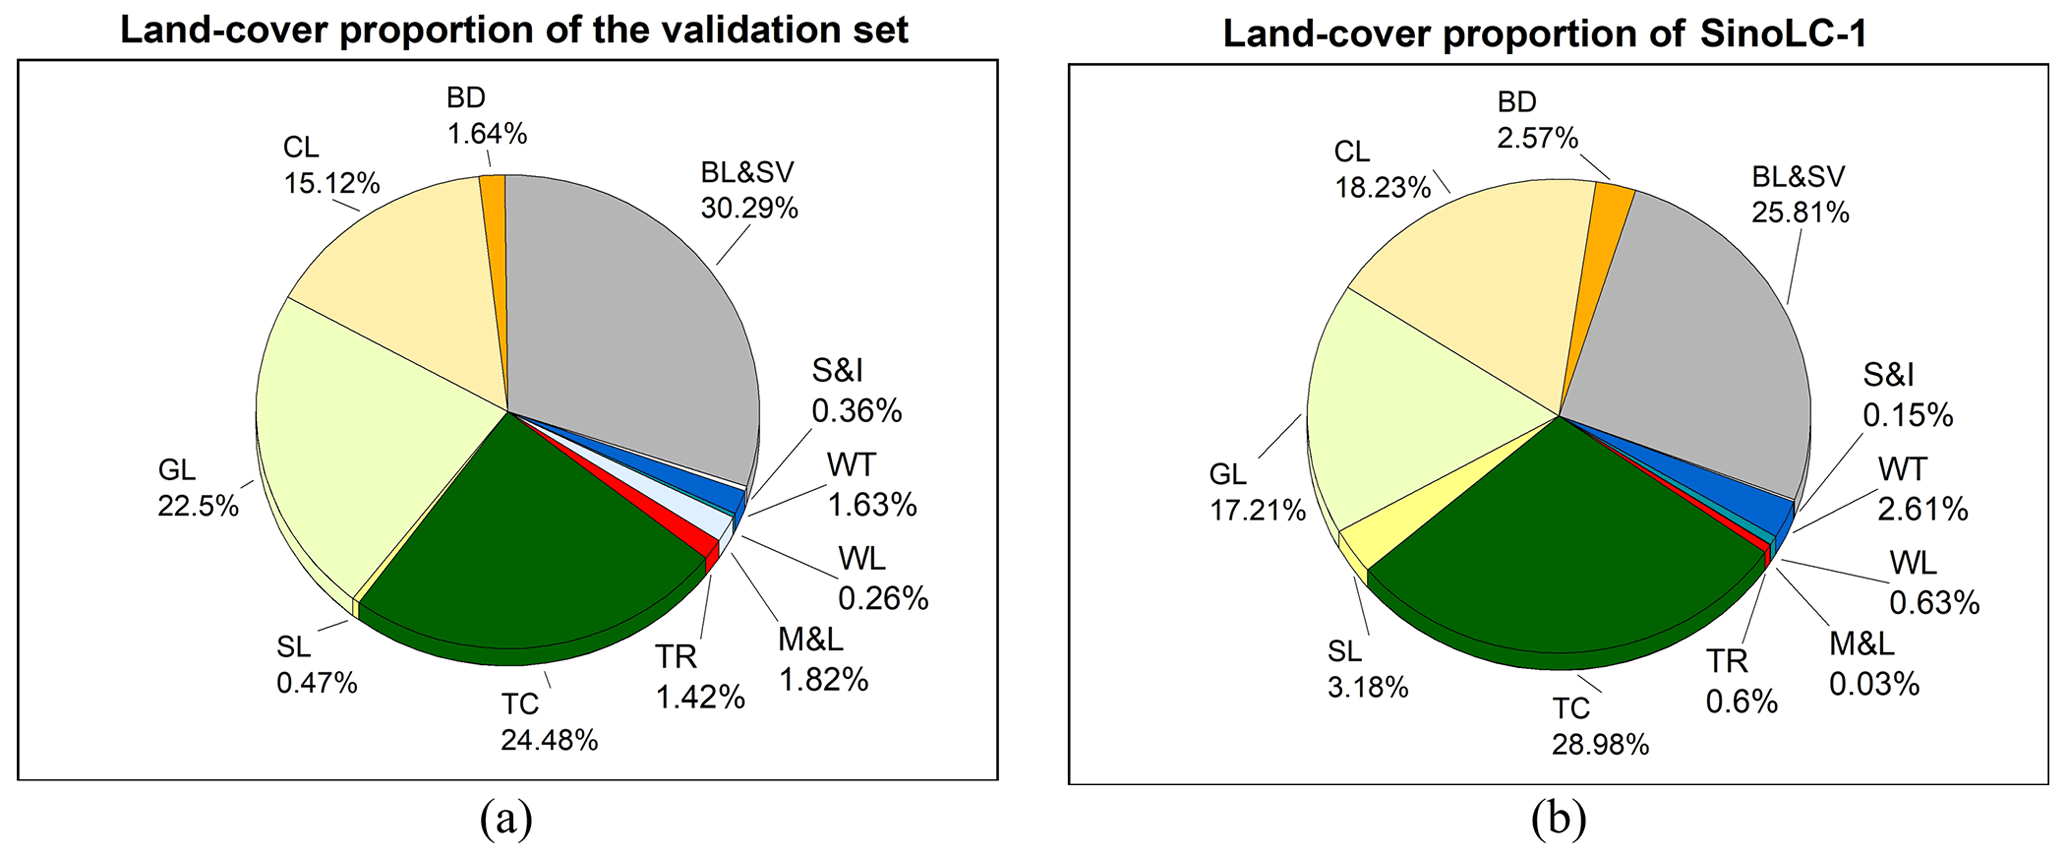
Figure 7The land-cover proportion of the national validation sample set and the produced SinoLC-1 land-cover product: (a) class proportion of the national validation sample set and (b) class proportion of the SinoLC-1 land-cover product.
3.3.2 Collecting a statistical-level validation set from government survey reports
To assess the statistical-level performance of SinoLC-1 in every provincial administrative region of China, the statistical validation set was collected from the Third National Land Resource Survey (NLRS) project (abbreviated as “3rd NLRS” in the following) from the Ministry of Natural Resources of the People's Republic of China and the Natural Resources and Planning Bureau of every provincial administrative region in China. The NLRS projects were launched in 1984 to comprehensively monitor urban expansion and land resources using remote-sensing technology (Zhang and Zhang, 2007; Liu et al., 2015). From October 2017 to December 2020, the 3rd NLRS project adopted remote-sensing images with a resolution better than 1 m to accumulate survey data for the entirety of China. Advanced technologies such as mobile internet, cloud computing, and uncrewed aerial vehicles were also widely used during the survey. Overall, 295 million survey spot data were collected, and the state of national land use and land cover was thoroughly investigated. Therefore, the survey report collected from the government institutes can be used as an authoritative reference source to validate the quality of the SinoLC-1 product at the statistical level.
By considering the classification standard of the 3rd NLRS, a land-cover type relationship was built between SinoLC-1 and the 3rd NLRS, as shown in Table 3. In the corresponding relationship, the 3rd NLRS data commonly have finer land-cover types, e.g., for the general Cropland type, there are six subtypes in the 3rd NLRS data. However, some of the land-cover types in the 3rd NLRS data are still described in a more generalized way. For example, the 3rd NLRS only contains three subtypes (natural, artificial, and other grasslands) to describe landscapes that are covered by spare and low vegetation, which correspond to the Grassland and Barren and spare vegetation types in SinoLC-1. As shown in Table 4, the statistical validation set was collected from 31 provincial administrative regions, where three special zones (Hong Kong, Macau, and Taiwan) are not available in the 3rd NLRS project. In general, the statistical validation set enabled a comparison of the statistical results of SinoLC-1 with the official survey data collected from the 3rd NLRS projects, thereby allowing an assessment of the overall performance of SinoLC-1.
Table 3Corresponding land-cover type relationship between the SinoLC-1 products and the 3rd NLRS.
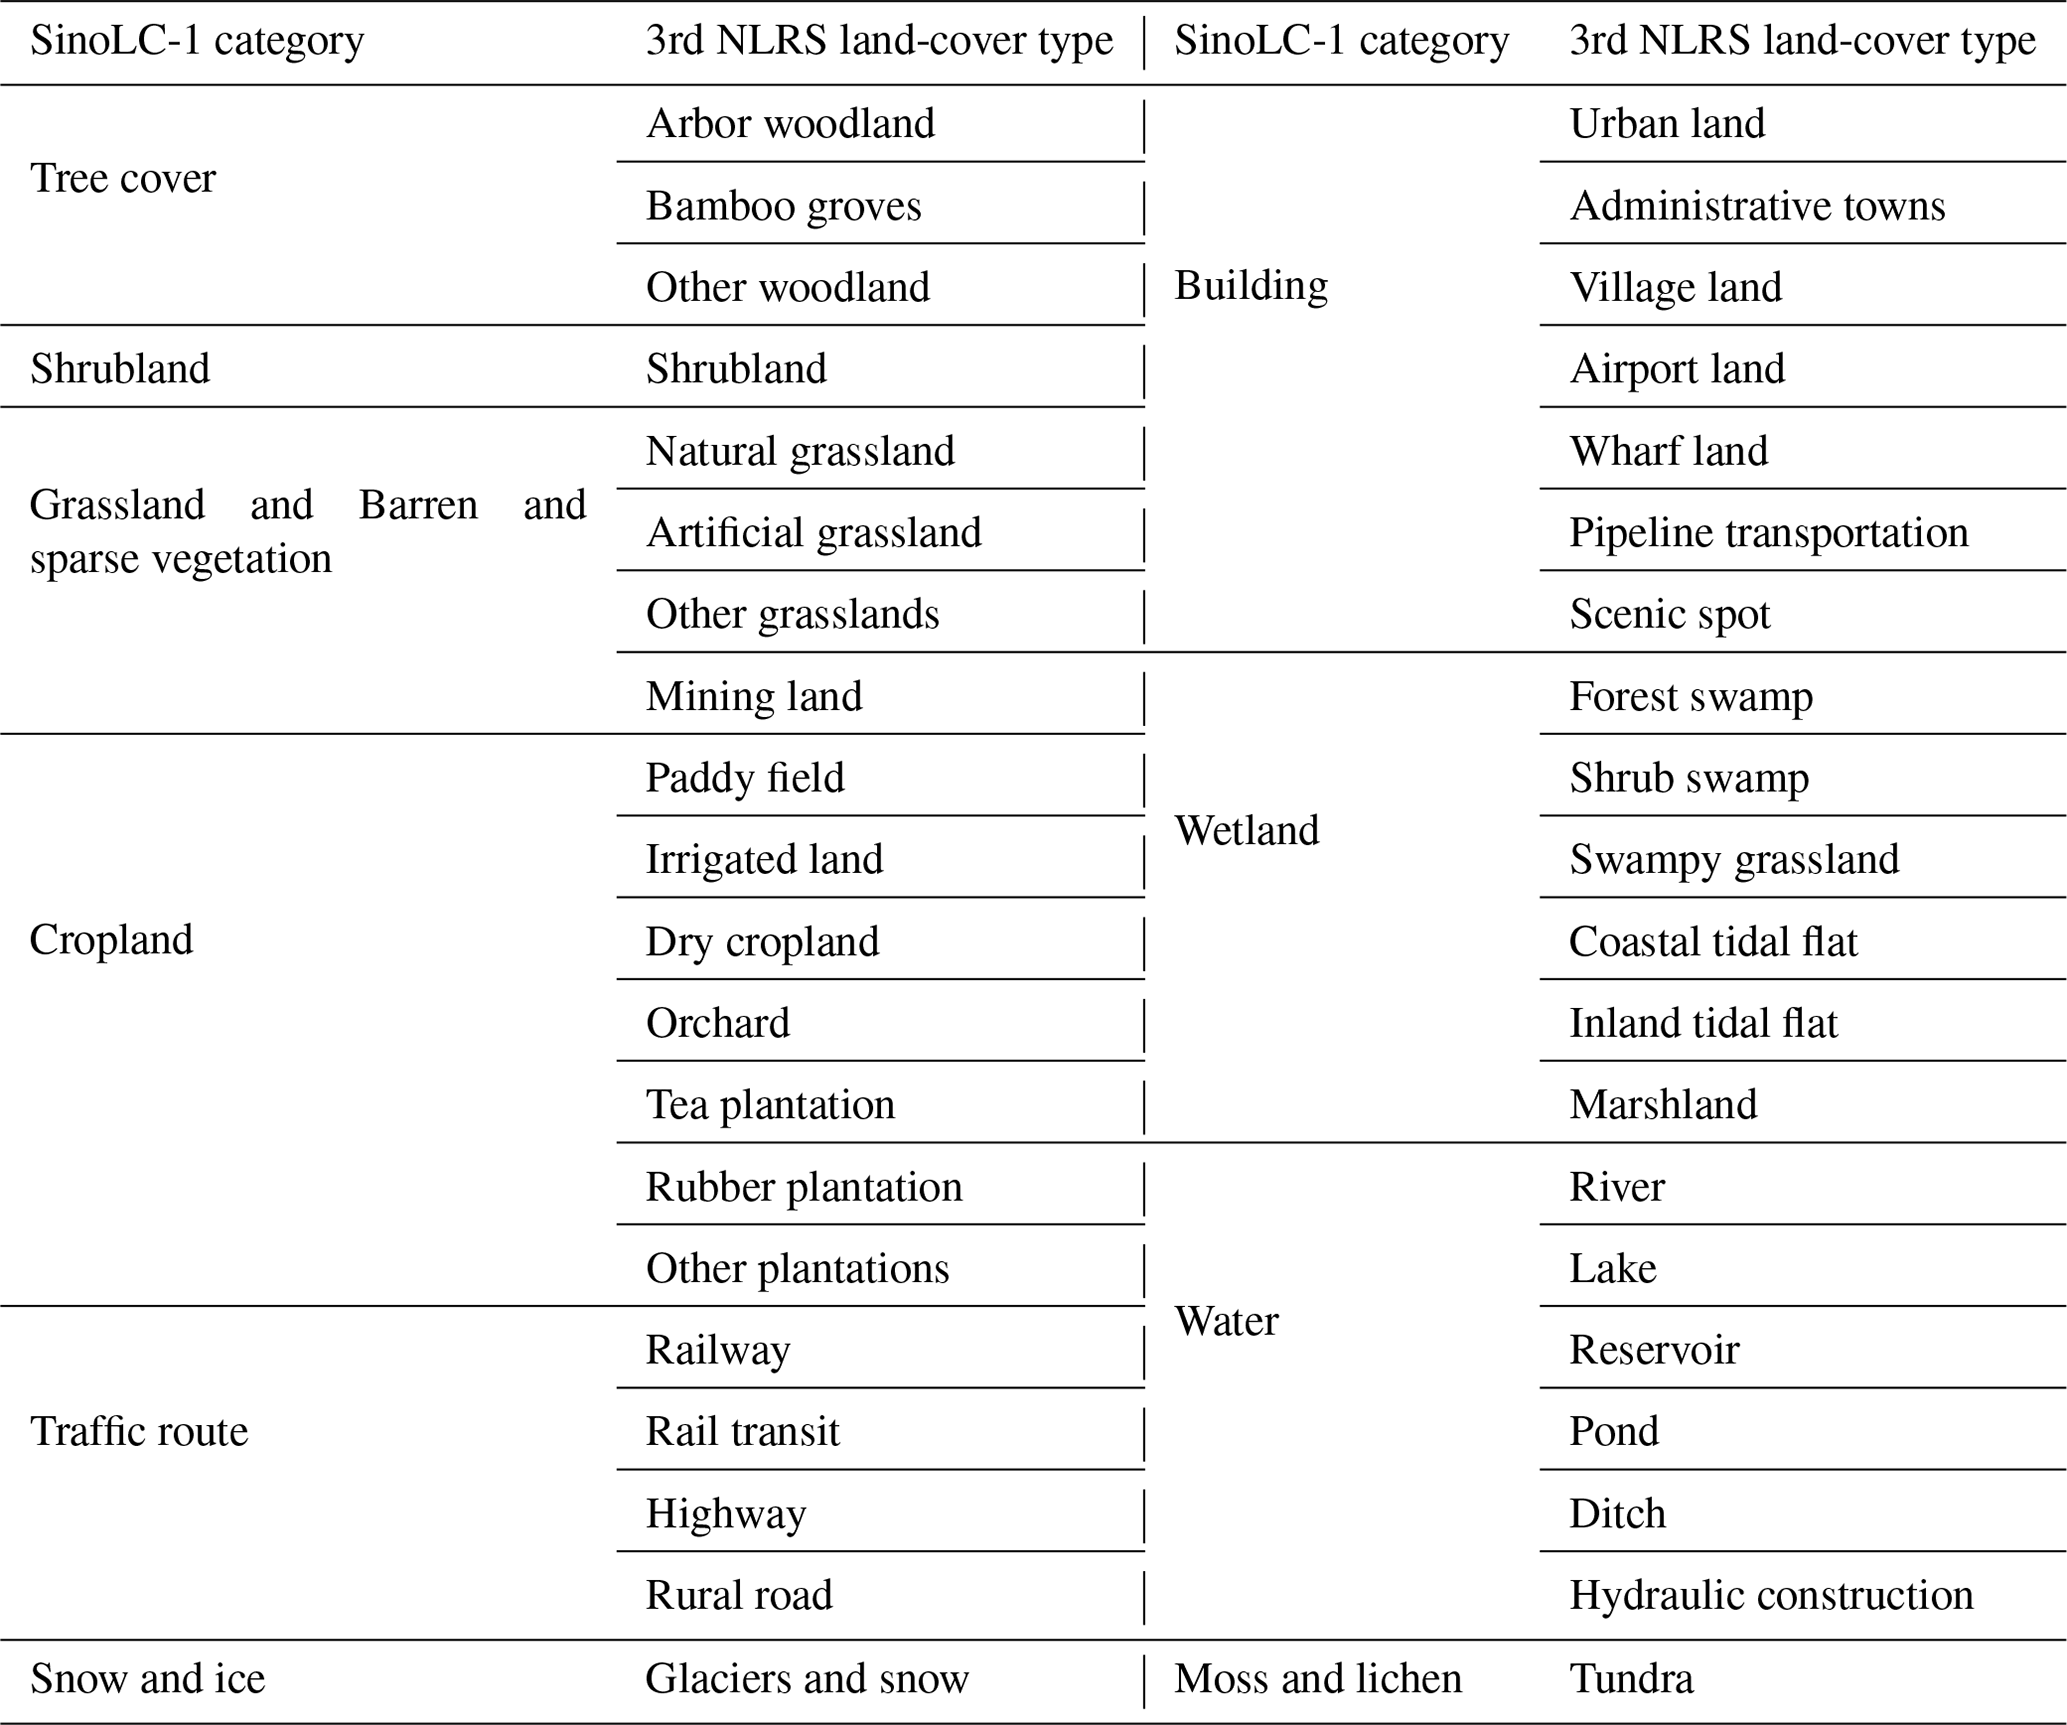
Table 4Statistical validation set collected from the 3rd NLRS project.
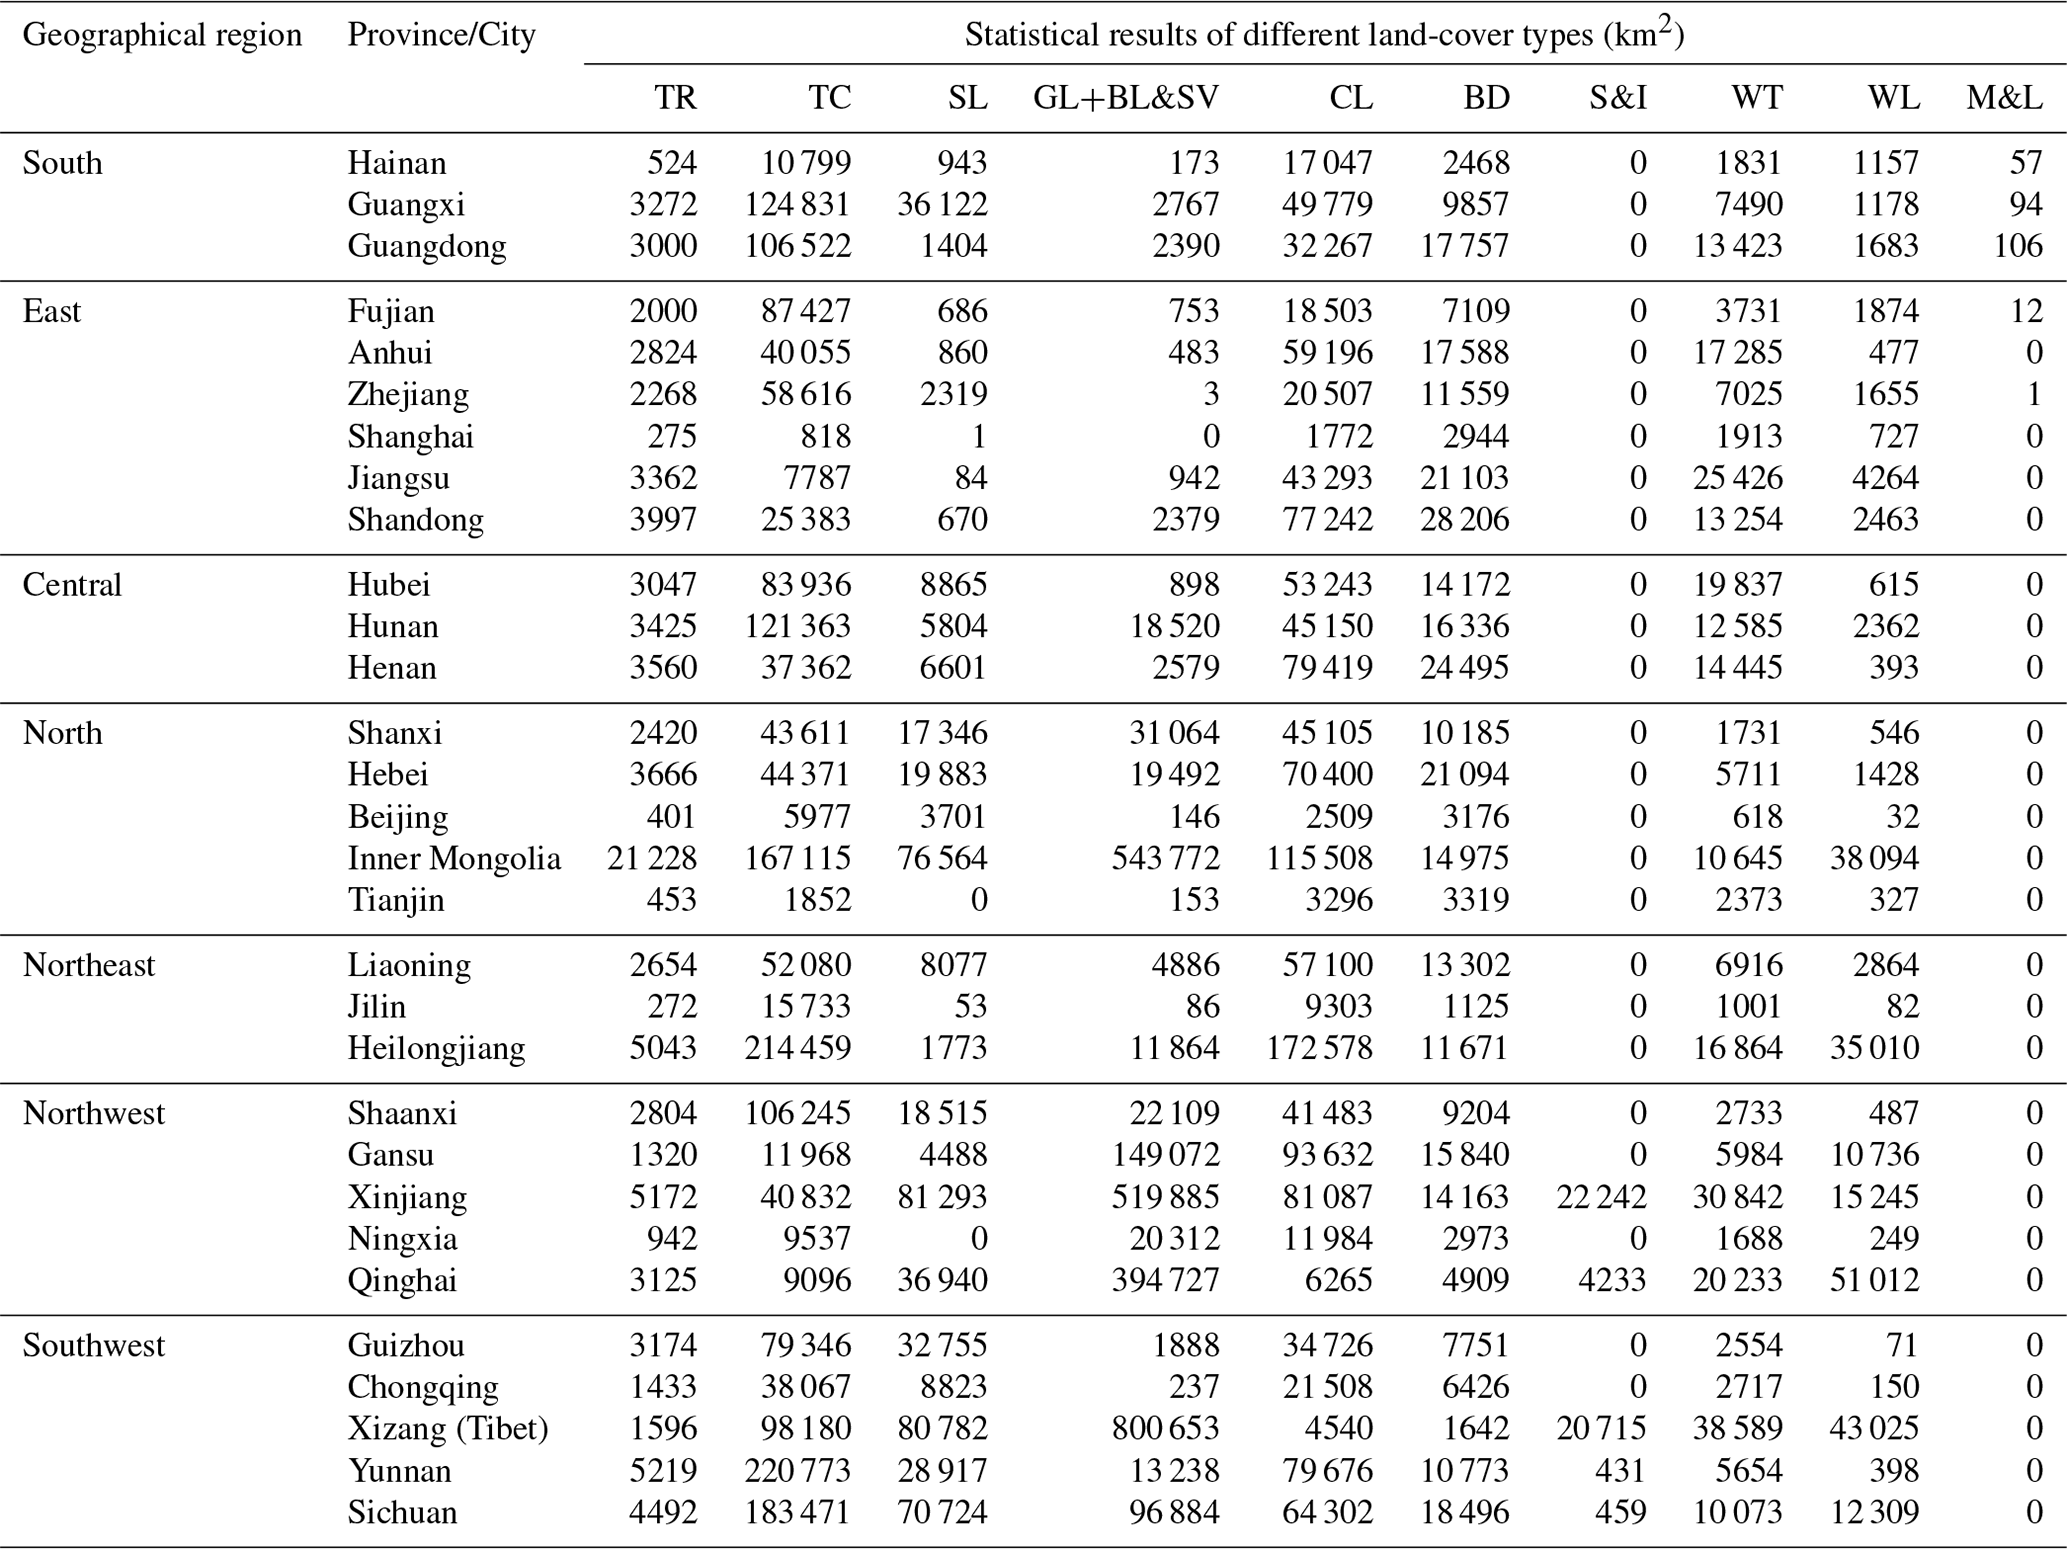
The abbreviations/acronyms used in the table are as follows: TR – Traffic route, TC – Tree cover, SL – Shrubland, GL+BL&SV – the total of Grassland and Barren and sparse vegetation, CL – Cropland, BD – Building, S&I – Snow and ice, WT – Water, WL – Wetland, and M&L – Moss and lichen.
4.1 SinoLC-1: a 1 m resolution national-scale land-cover map for China
First, the 1 m resolution national-scale land-cover map for China (SinoLC-1) and the legend for the 11 included land-cover types are illustrated in Fig. 8. The Tree cover land type is mainly located in the southern part of China and on the northeastern border, Cropland is mainly distributed in the north and on the Northeast China Plain, and the northwest and southwest parts of China are mainly covered by Grassland and Barren and sparse vegetation land types. In general, based on previous research and land-cover survey reports of China (Yue et al., 2007; Song and Deng, 2017), the overall visual result of SinoLC-1 accurately reflects the land-cover distribution of China and conforms to the actual land-cover pattern of China.
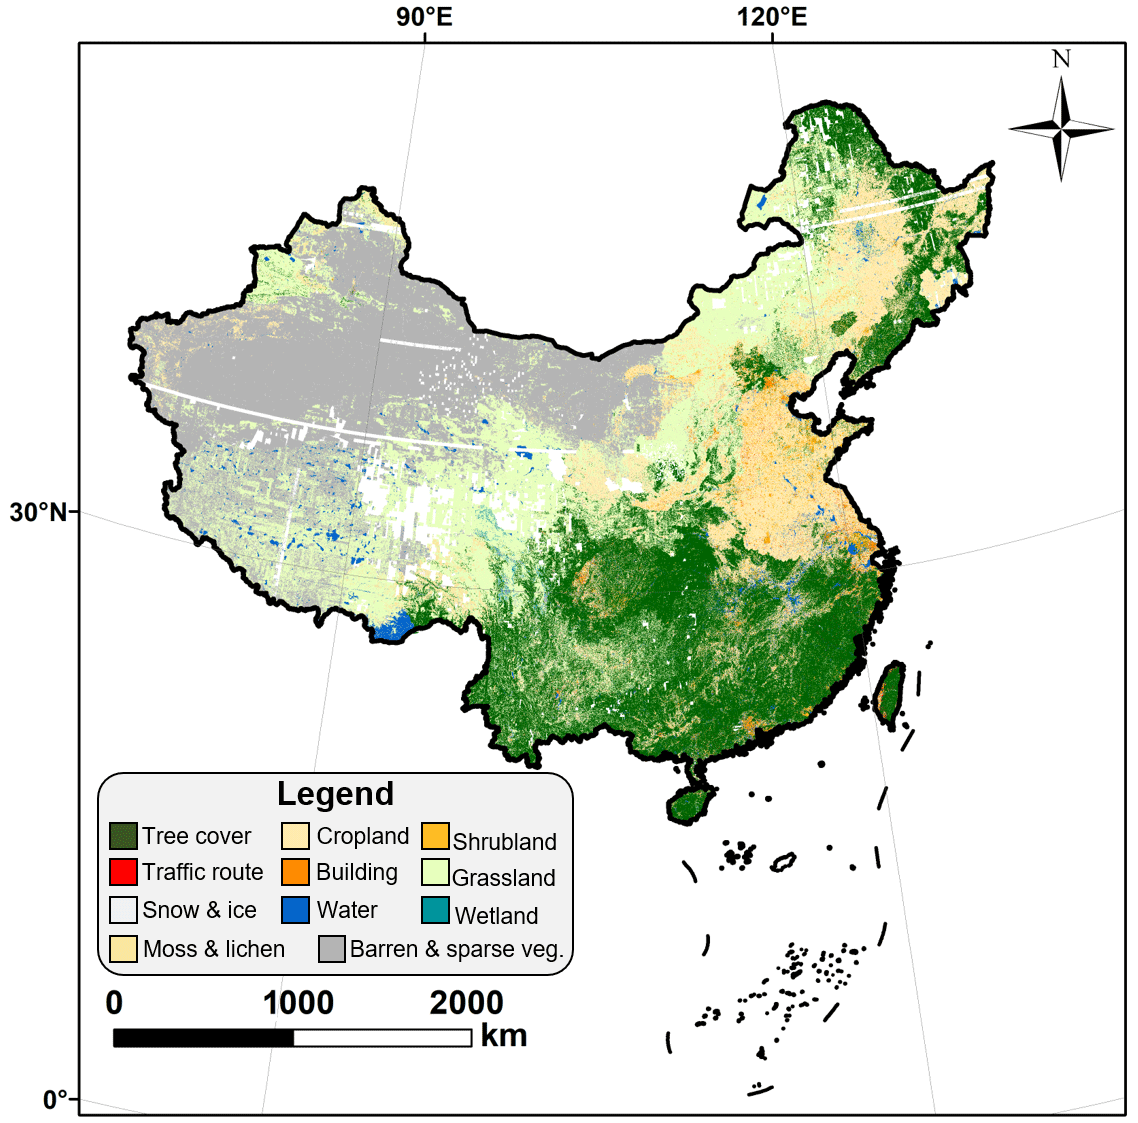
Figure 8Demonstration of SinoLC-1: a 1 m resolution national-scale land-cover map of China.
Second, to visualize the results of SinoLC-1 in detail, 30 m digital elevation model (DEM) data collected from the Shuttle Radar Topography Mission (SRTM) are illustrated, and three typical regions are selected to demonstrate the performance of the SinoLC-1 product. As shown in Fig. 9, the three typical regions include the following: (1) northeastern China, where the Northeast China Plain (an important grain production base of China) and the Greater Khingan Range, known as the largest virgin forest in China, are located; (2) eastern China, where the North China Plain (another important grain production base of China) and the Yangtze River Delta (an important economic zone of China) are located; and (3) southern China, where the Pearl River Delta, known as the largest urban agglomeration with the largest population in the world, is located. In detail, as shown in Fig. 10, the sample areas of Heilongjiang, Jilin, and Liaoning provinces in northeastern China show the boundaries between forest, grassland, and cropland are clearly predicted. As shown in Figs. 11 and 12, the sample areas of eastern China, including Shandong, Jiangsu, and Jiangxi provinces, and southern China, including Guangxi, Guangdong, and Hainan provinces, show that the village and city patterns of rural and urban areas are accurately reflected in the SinoLC-1 product. Overall, by combining all the visual results and analysis, SinoLC-1 performs well in various landscapes (e.g., forest, cropland, rural, and urban) and shows acceptable results at the national and regional scales.
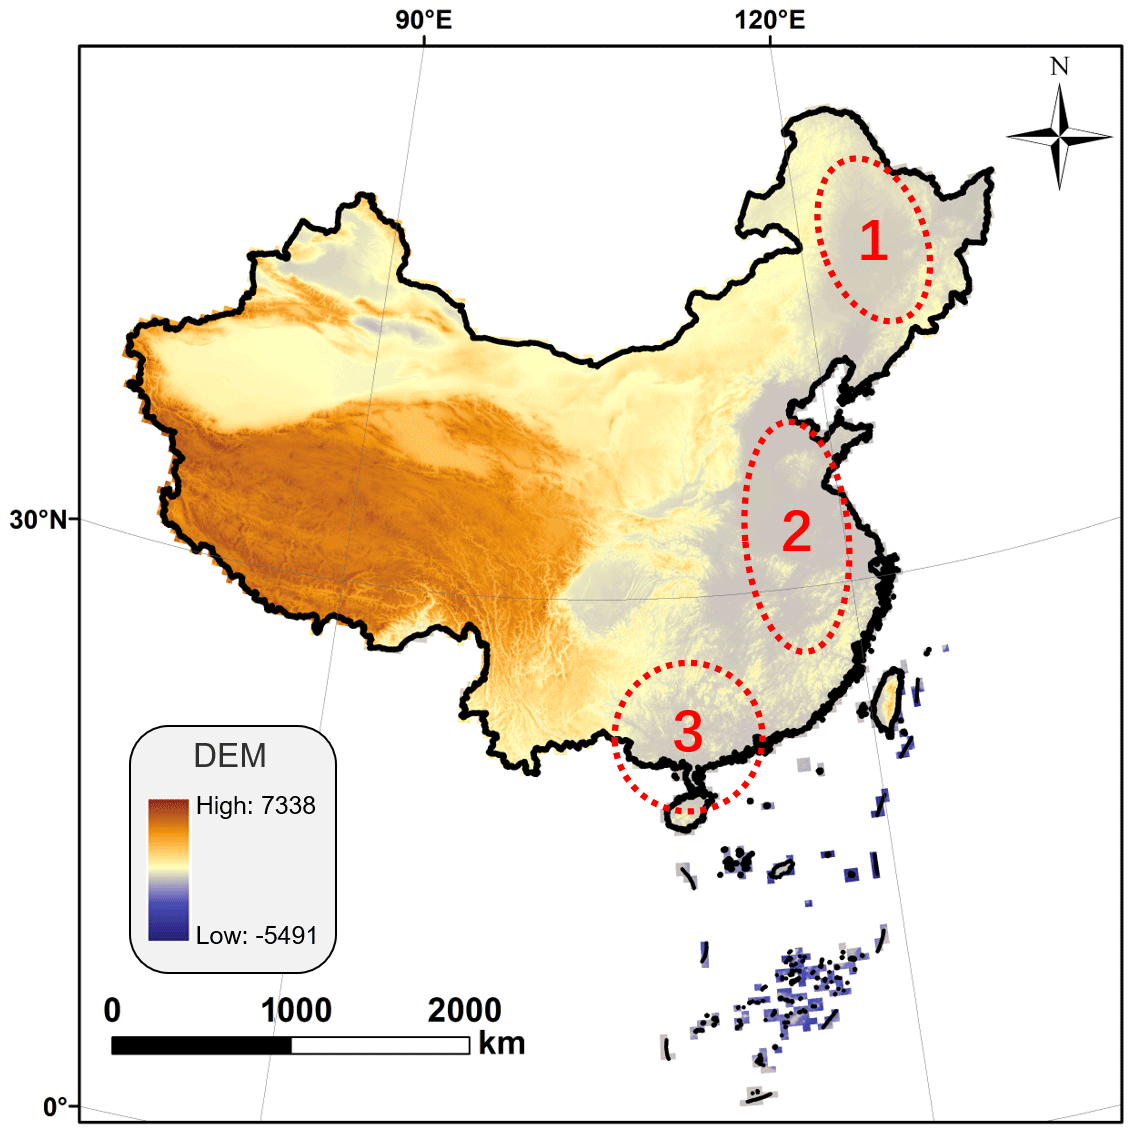
Figure 9Illustration of the 30 m DEM data (from SRTM) and the locations of three demonstration areas.
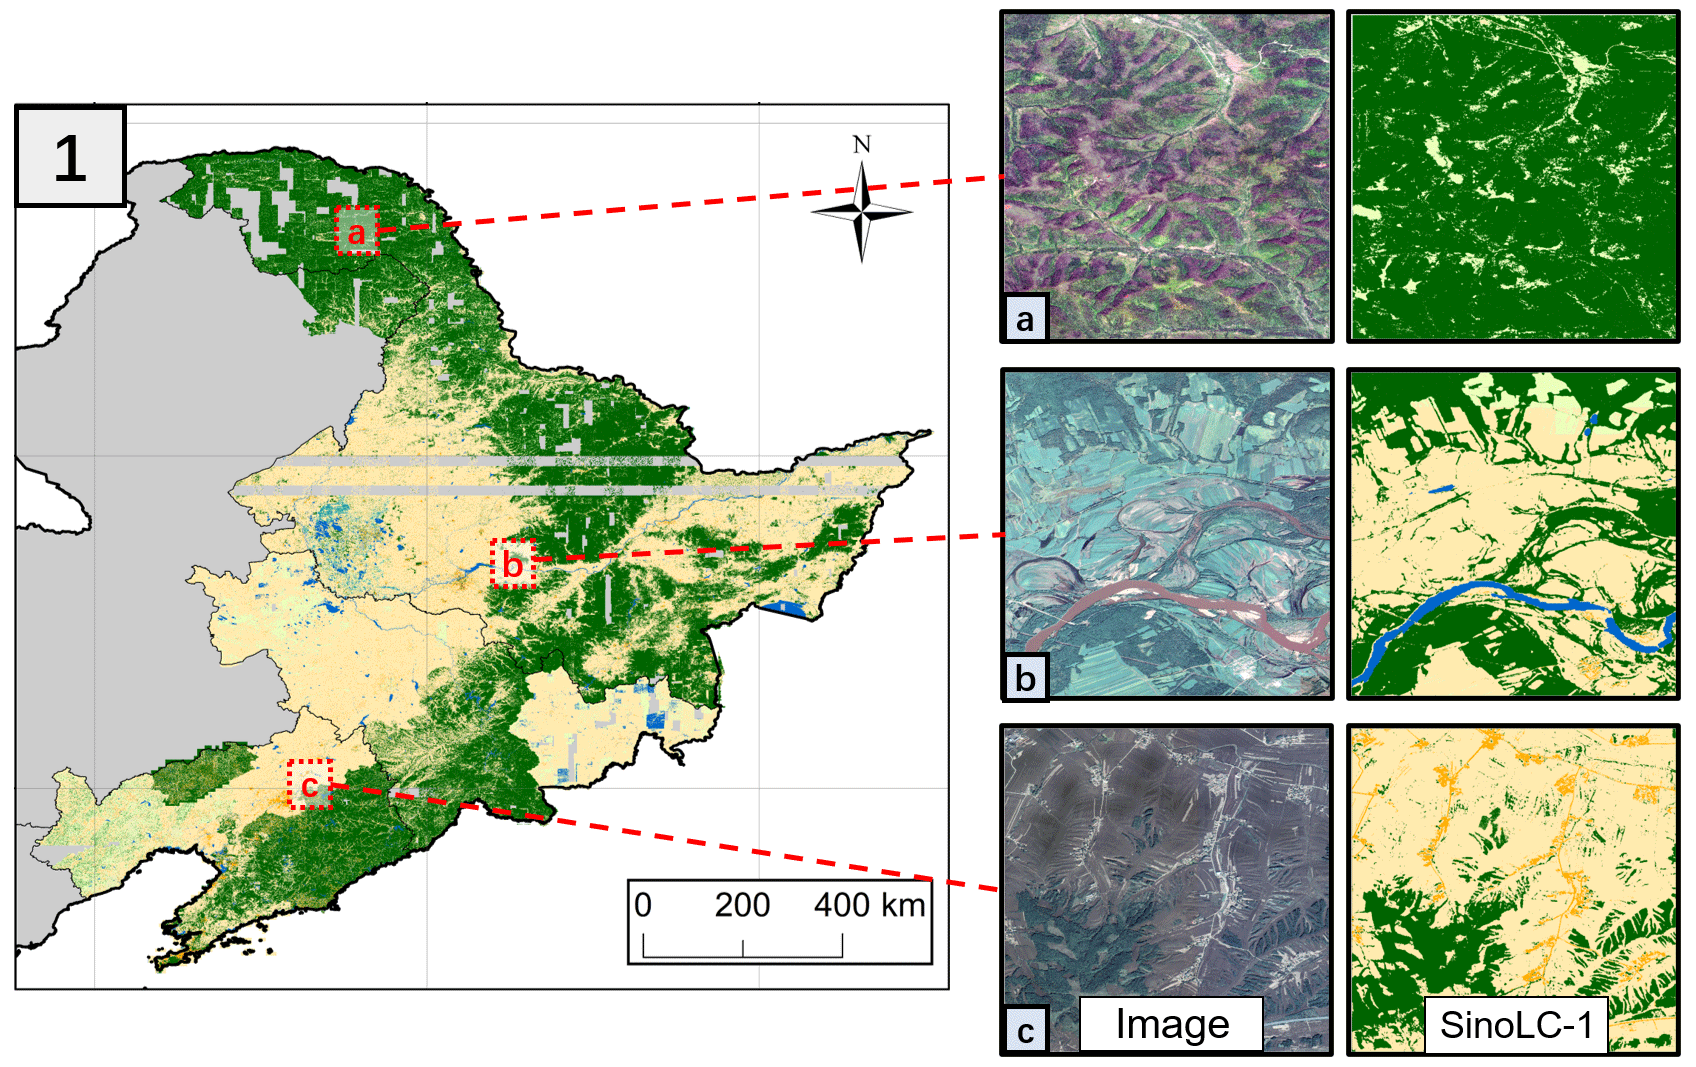
Figure 10Demonstration for northeastern China, including the sample areas of Heilongjiang, Jilin, and Liaoning. The VHR remote-sensing images in the figure are from © Google Earth 2021.
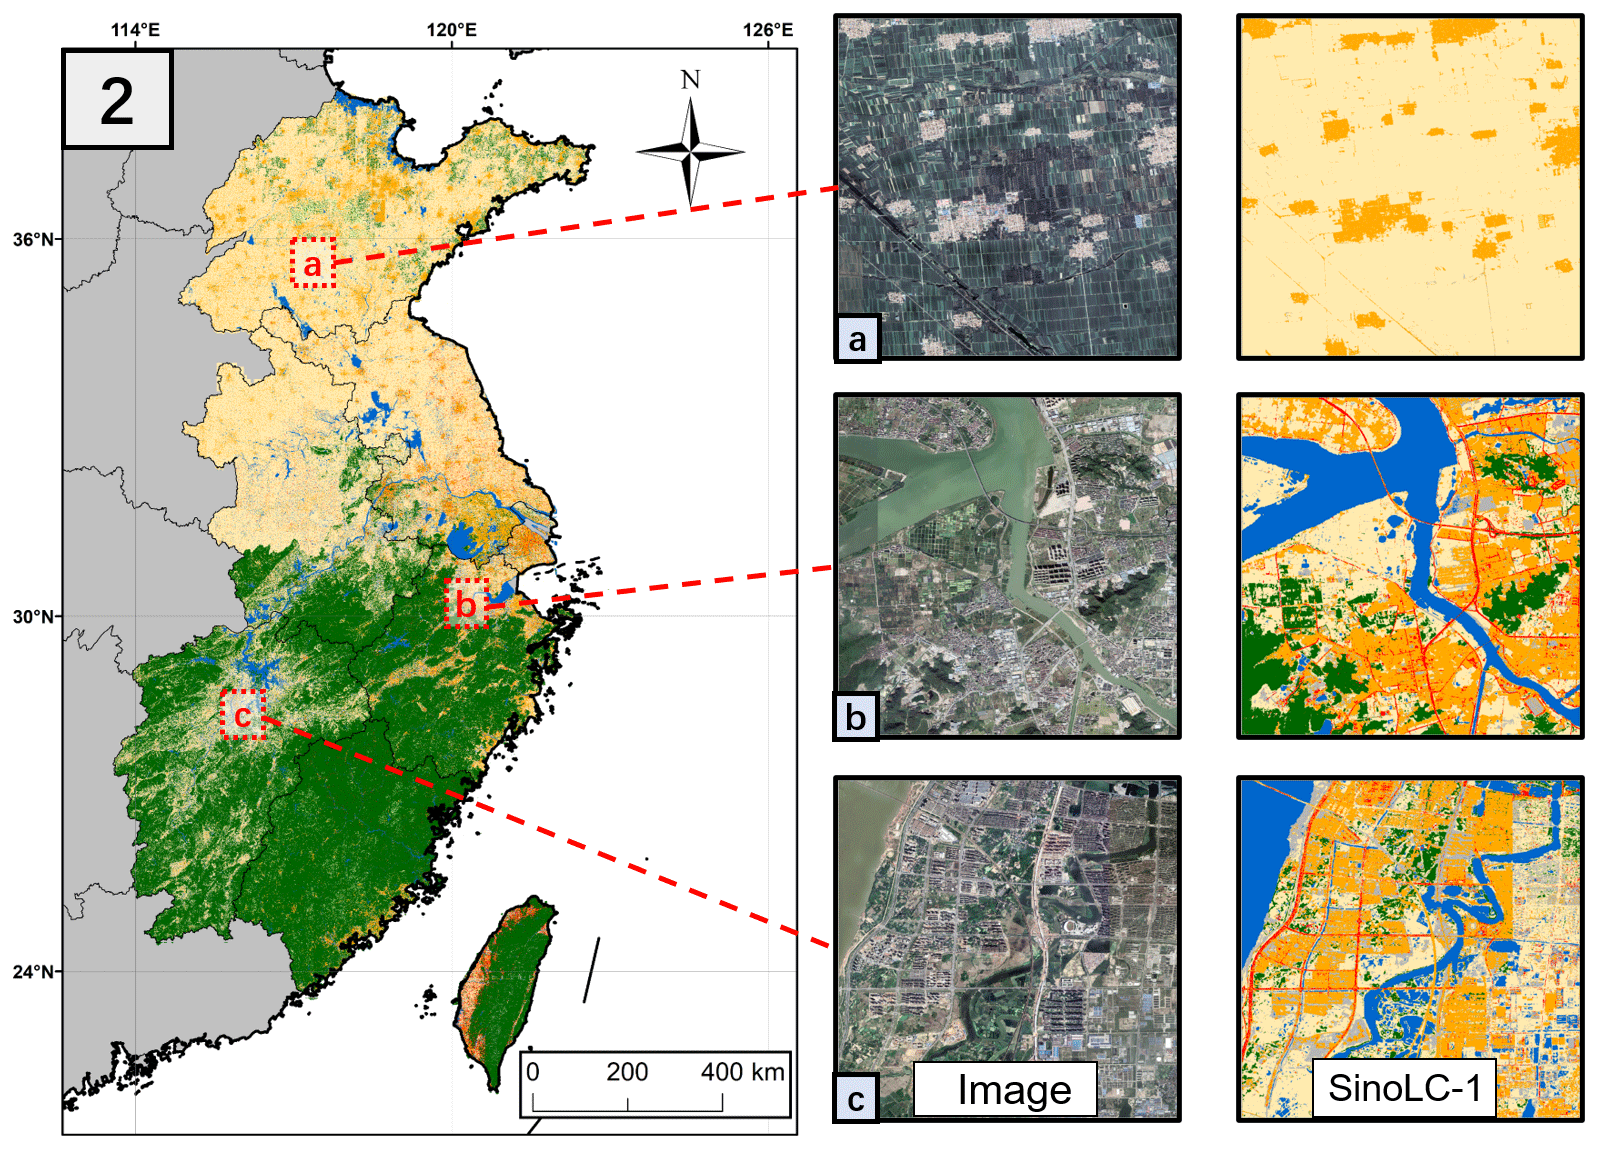
Figure 11Demonstration for eastern China, including the sample areas of Shandong, Jiangsu, and Jiangxi. The VHR remote-sensing images in the figure are from © Google Earth 2021.
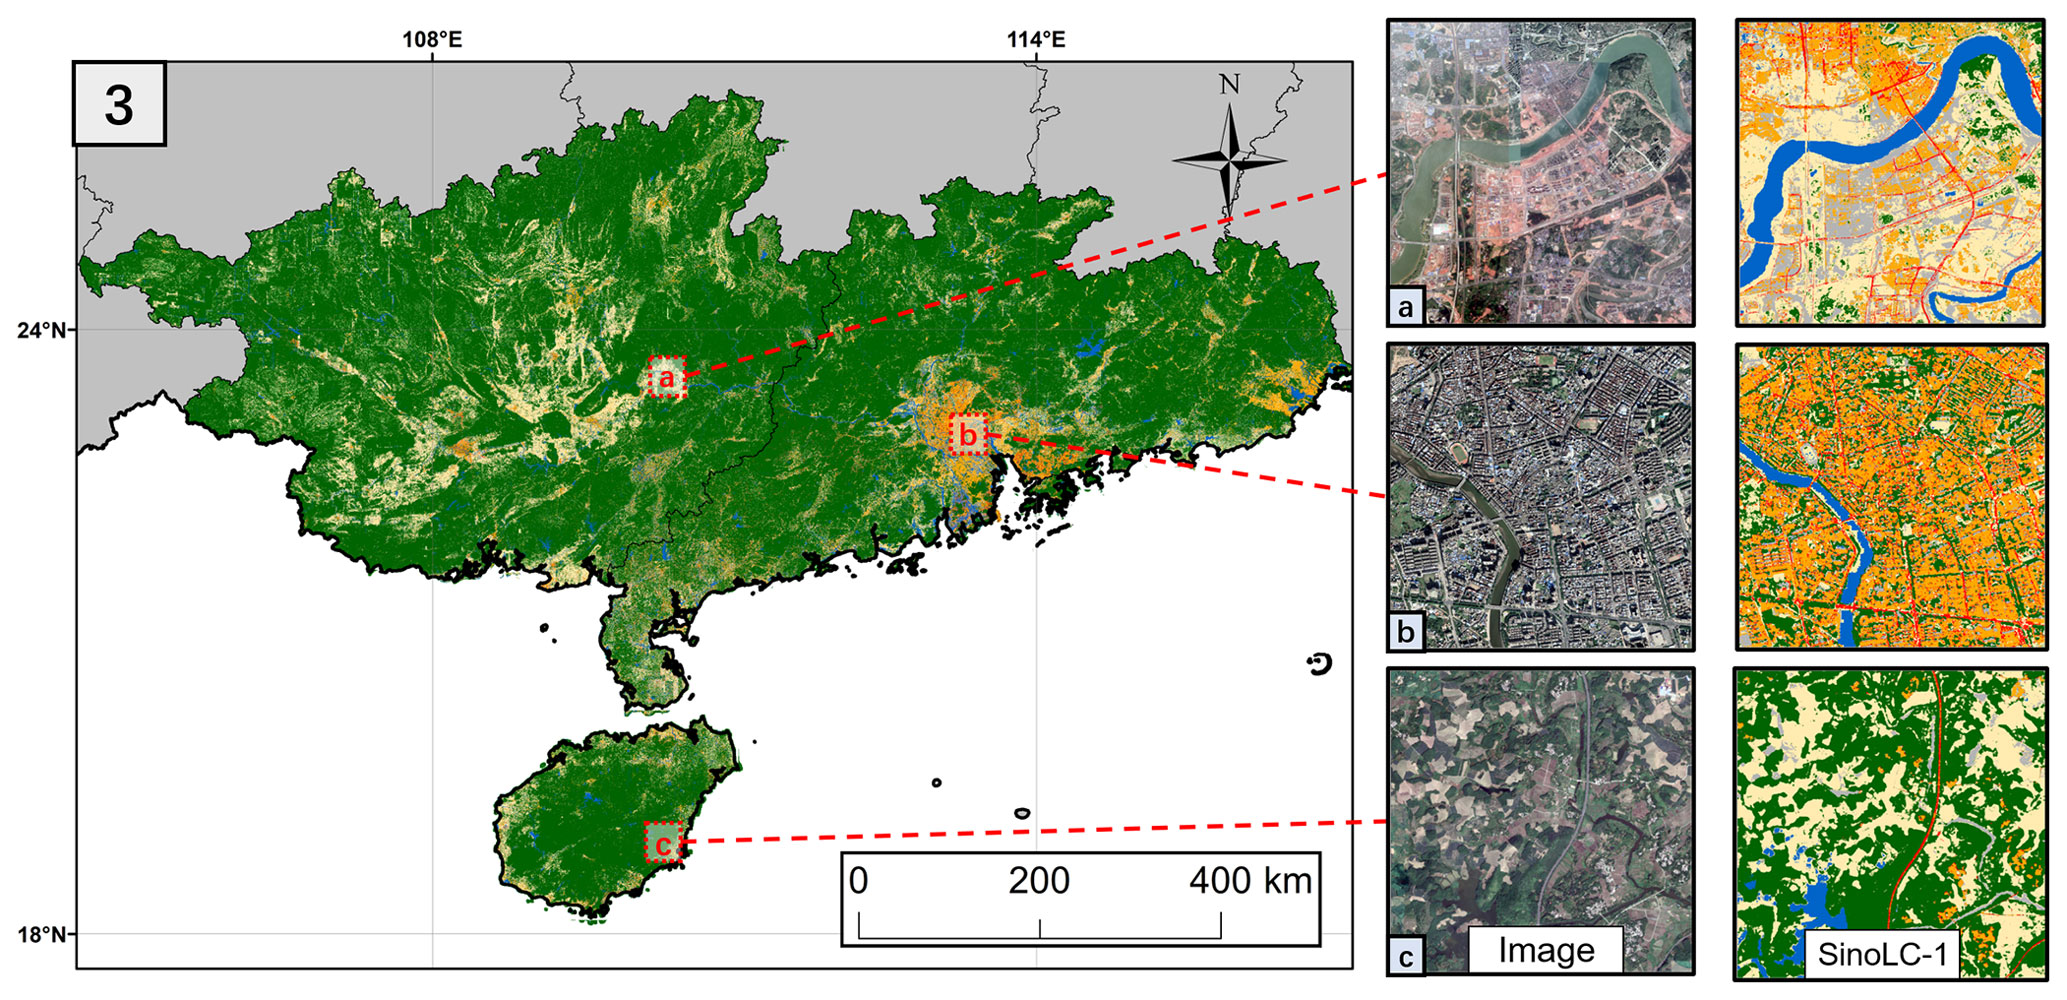
Figure 12Demonstration for southern China, including the sample areas of Guangxi, Guangdong, and Hainan. The VHR remote-sensing images in the figure are from © Google Earth 2021.
4.2 Qualitative comparison with other land-cover products
To assess the SinoLC-1 land-cover product qualitatively, the produced SinoLC-1 and five widely used large-scale land-cover products were visually compared. The compared land-cover products included ESA_GLC10 (Van De Kerchove et al., 2021), FROM_GLC10 (Gong et al., 2019b), ESRI_GLC10 (Karra et al., 2021), GLC_FCS30 (Zhang et al., 2021), and GlobeLand30 (Chen et al., 2015). The information on these comparison products is listed in Table 5. As shown in Figs. 13 and 14, five typical regions covering various landscapes and different land-cover patterns were selected to compare the performance of SinoLC-1 with respect to the five land-cover products.
First, Fig. 13 illustrates a large-scale comparison in the city of Changzhou, Jiangsu Province, which contains various land-cover types. From the qualitative comparison, ESRI_GLC10 in Fig. 13e and GlobeLand30 in Fig. 13g have blurred land-cover results according to the VHR image in Fig. 13a, in which the detailed land object located in the urban areas (i.e., Tree cover, Building, and Cropland) are confused. Moreover, SinoLC-1, ESA_GLC10, FROM_GLC10, and GLC_FCS30 show relatively accurate spatial distributions of the land-cover types. Among them, GLC_FCS30 shows limited performance for tree cover and slender land objects (i.e., traffic routes, rivers, and runoff). FROM_GLC10 shows accurate performance for water bodies (e.g., the pools, canals, and rivers) but has limited performance for the Tree cover land type. ESA_GLC10 shows relatively better results among other comparative products, but it still shows insufficient visualization for water bodies. Compared with these GLC products, SinoLC-1 comprehensively shows better performance where the fine land-cover details including slender rivers, runoff, small pools, vegetation, and building are well predicted. Furthermore, because the Traffic route land-cover type is also included in the SinoLC-1 product, the road networks can better reflect the traffic pattern and city layout of the region.
Second, Fig. 14 illustrates four other typical regions that were sampled from four provincial administrative regions, including Shanghai, Jiangxi, Guangdong, and Hainan. Similarly, ESRI_GLC10 and GlobeLand30 show limited performance and lose the land-cover details. By comparing the urban areas shown in Fig. 14a and b (i.e., the demonstration areas of Shanghai and Jiangxi), SinoLC-1 indicates more accurate land-cover details, where some of the slender roads that cannot be observed in the 10 m resolution land-cover products are well predicted in the 1 m resolution SinoLC-1 product. The comparison suggests that the 1 m SinoLC-1 product can be a better land-cover product with respect to indicating the finer urban pattern and providing more accurate information to the users. By comparing the agricultural areas (e.g., fish ponds and paddy fields) in Fig. 14c and d (i.e., the demonstration areas of Guangdong and Hainan), ESRI_GLC10 and GlobeLand30 overestimate the water bodies and misrepresent the real land-cover situation, where many independent fish ponds and paddy fields are incorrectly mapped as a large water-cover areas. On the contrary, ESA_GLC10 and GLC_FCS30 underestimate the water bodies, as most of the ponds are not indicated in their mapping results. SinoLC-1 and FROM_GLC10 indicate the most accurate land-cover situations, where all single ponds are mapped. However, due to the limitation of the spatial resolution, FROM_GLC10 still loses part of the land-cover details around ponds and fields (e.g., traffic route and tree cover).
Third, Fig. 15 demonstrates three special landscapes that are challenging to distinguish in VHR optical images and even in HR multispectral images. The three landscapes include (column a) “Marshland” (i.e., muddy areas with dense water and grass that has been soaked in stagnant water) captured from the Daqing Longfeng Wetland Nature Reserve, Heilongjiang Province, which is the largest urban wetland in China; (column b) “Forest swamp” (i.e., the landscape dominated by trees or shrubs formed under humid soil, stagnant water, or shallow water layers) captured from Chongming Island, Shanghai City, which is known as the world's largest estuarine alluvial island wetland; and (column c) “Watercourse” (the route through which river water flows, usually referring to navigable waterways) captured from the Beijing–Hangzhou Grand Canal. As shown in Fig. 15a, SinoLC-1 reveals most of the marshland in the area and distinguishes the surrounding water and grasslands. Among the three 10 m land-cover products generated from the Sentinel image, ESA_GLC10 accurately reflects the marshland in the area, but FROM_GLC10 and ESRI_GLC10 miss the majority of the Wetland type. As shown in Fig. 15b, it is observed that the VHR optical image shows more clear spatial detail than the 10 m Sentinel-2 image. From the perspective of the land-cover map, SinoLC-1 shows the forest swamp (i.e., Wetland land-cover type in the legend), rivers, and tree cover content in the area. ESRI_GLC10 shows an accurate result with respect to the Forest swamp landscape. ESA_GLC10 overestimates the Tree cover type, and FROM_GLC10 overestimates the Cropland type. As shown in Fig. 15c, SinoLC-1 accurately reflects the watercourse, and (due to the fine spatial resolution) the bridges on the watercourse are also clearly displayed. Among the three 10 m land-cover products generated from the Sentinel image, ESRI_GLC10 and FROM_GLC10 have acceptable classification results with respect to the watercourse. However, FROM_GLC10 only shows the central part of the watercourse and underestimates the width. Using ESA_GLC10, the watercourse was incorrectly classified into the Barren and sparse vegetation land-cover type.
Overall, by comparing the SinoLC-1 product with five widely used land-cover products in many typical regions, the produced SinoLC-1 product shows three main advantages: (1) with higher spatial resolution, SinoLC-1 can reflect finer land objects and indicates more precise land details; (2) with more diverse and reliable training samples, SinoLC-1 shows more accurate spatial distributions of land-cover types; and (3) with the additional Traffic route land-cover type, SinoLC-1 can better outline the traffic network and city layout in dense urban areas.
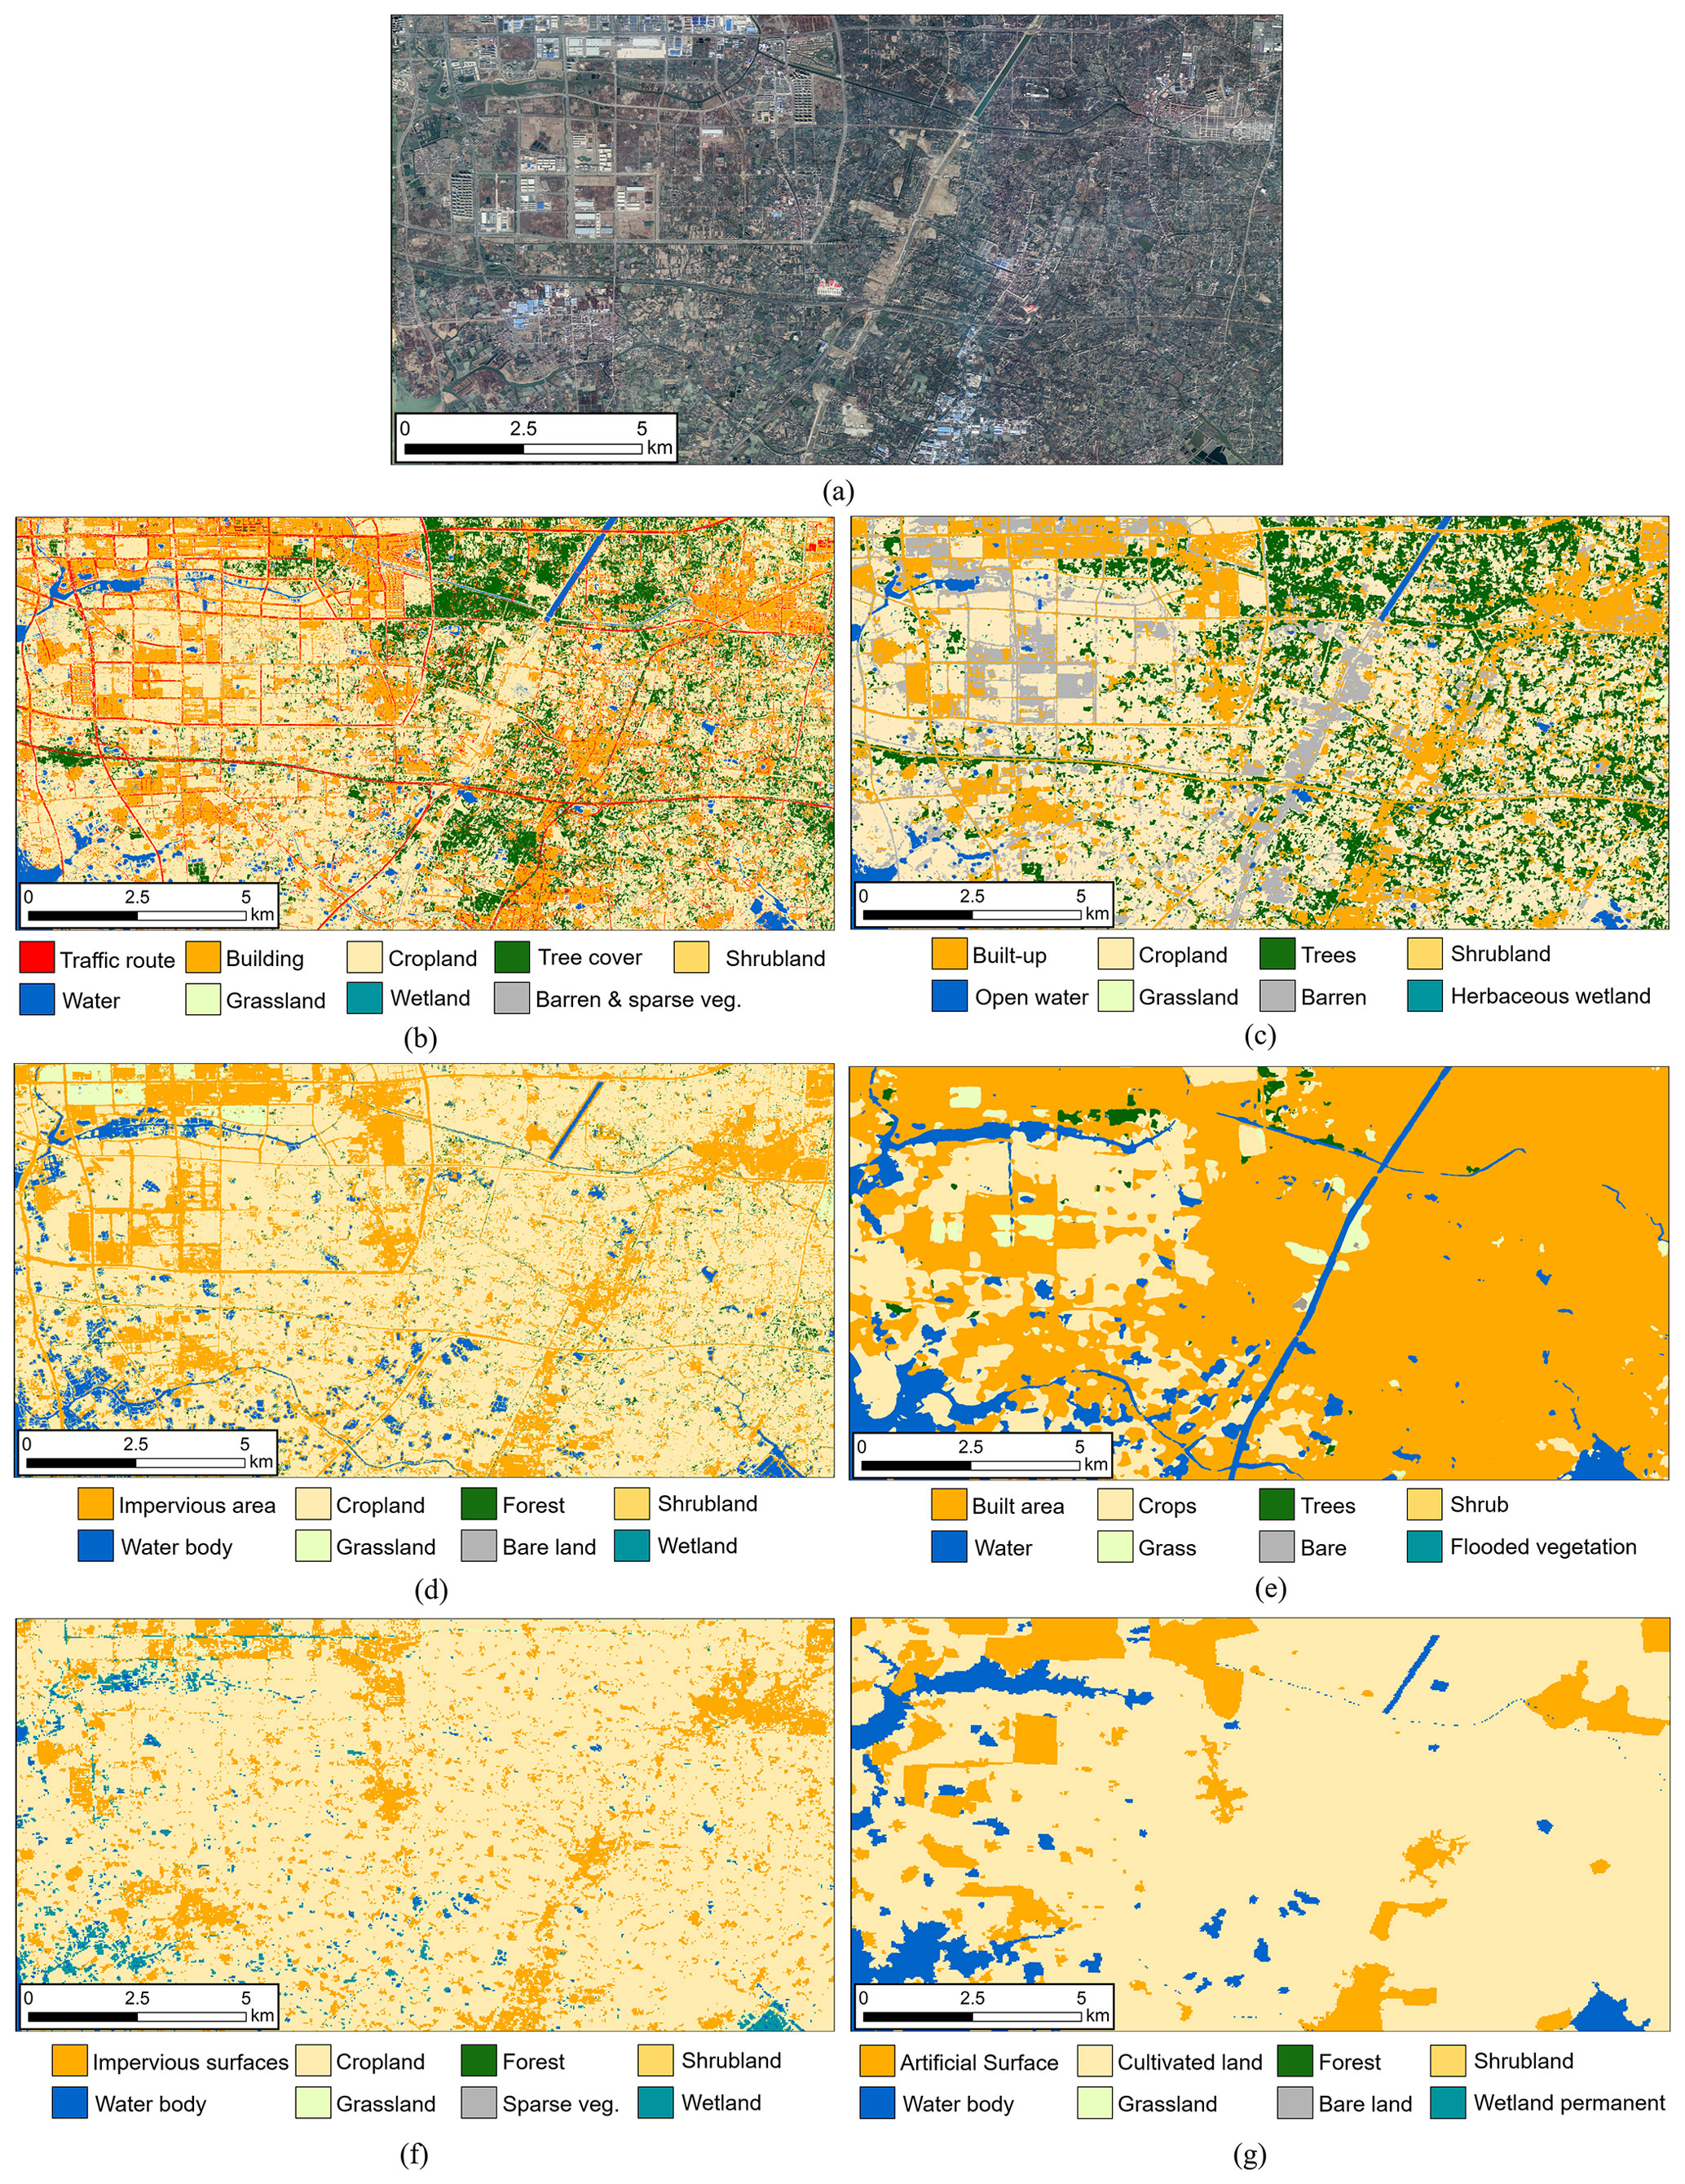
Figure 13Demonstration of the visual comparison for Changzhou, Jiangsu Province: (a) 1 m © Google Earth image, (b) 1 m SinoLC-1, (c) 10 m ESA_GLC10, (d) 10 m FROM_GLC10, (e) 10 m ESRI_ GLC10, (f) 30 m GLC_FCS30, and (g) 30 m GlobeLand30. The VHR remote-sensing images in the figure are from © Google Earth 2021.
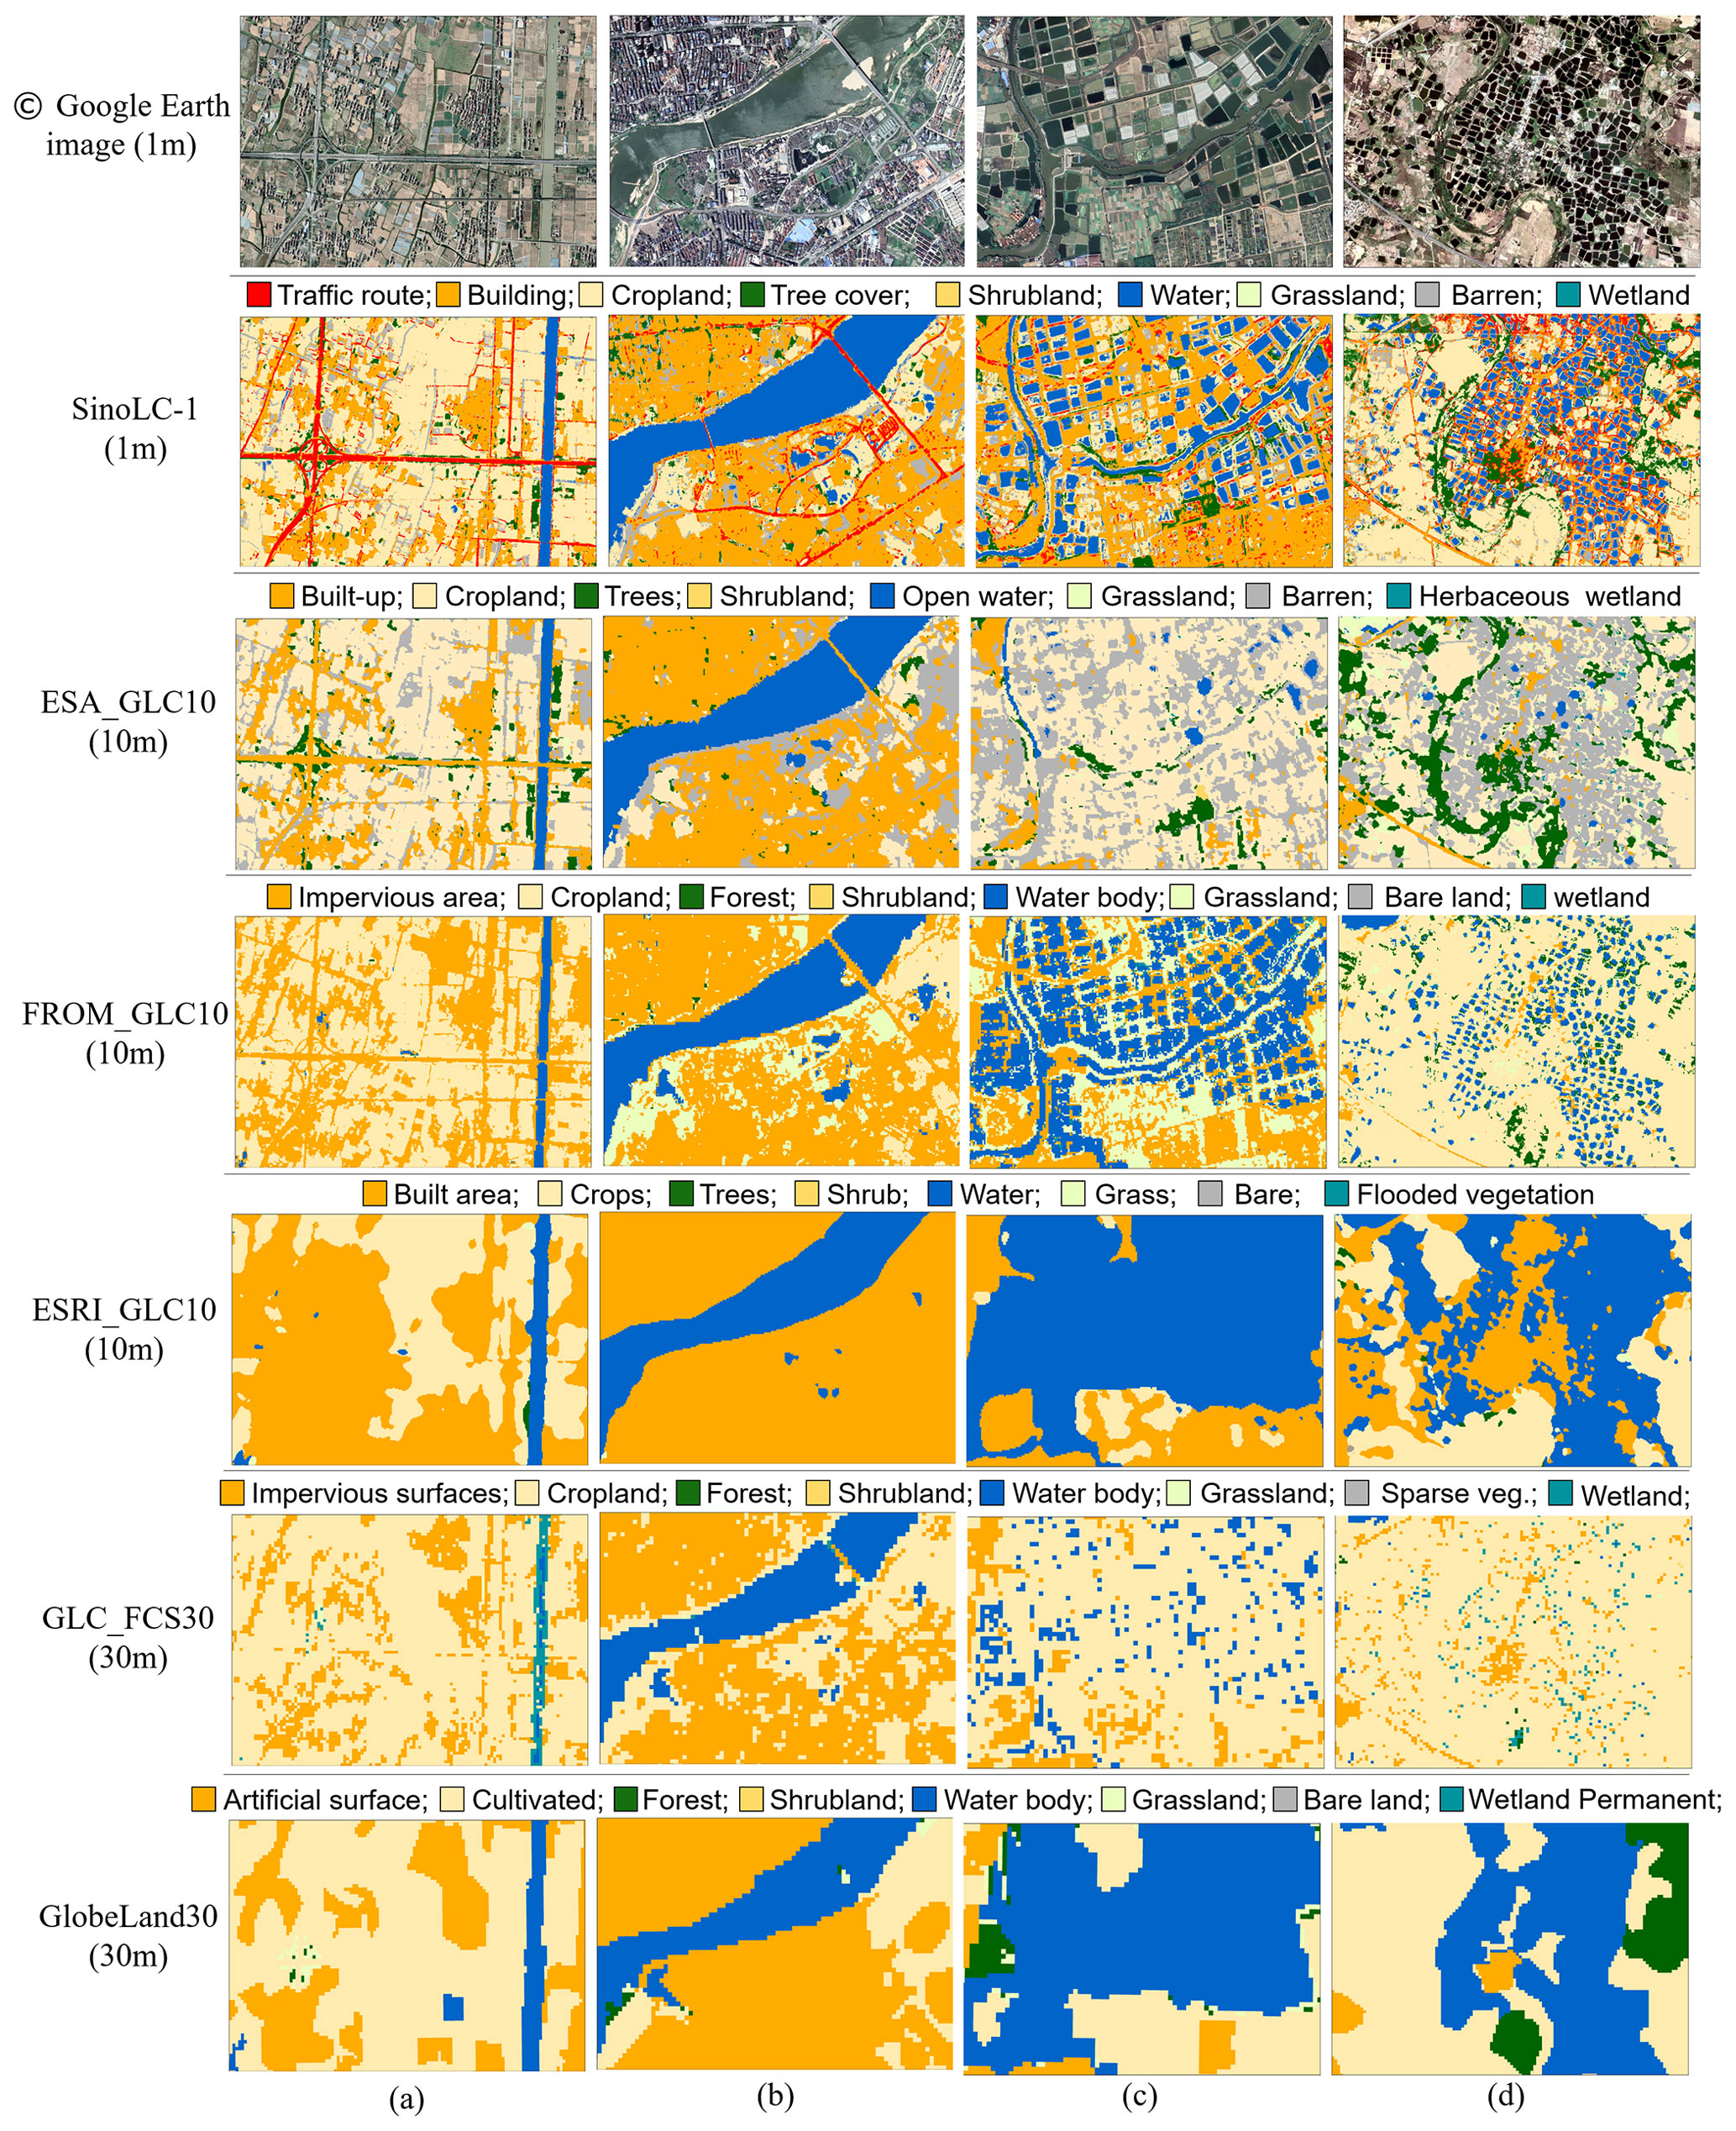
Figure 14Demonstrations of the visual comparison for four typical regions: (a) Shanghai, (b) Jiangxi, (c) Guangdong, and (d) Hainan. The VHR remote-sensing images in the figure are from © Google Earth 2021.
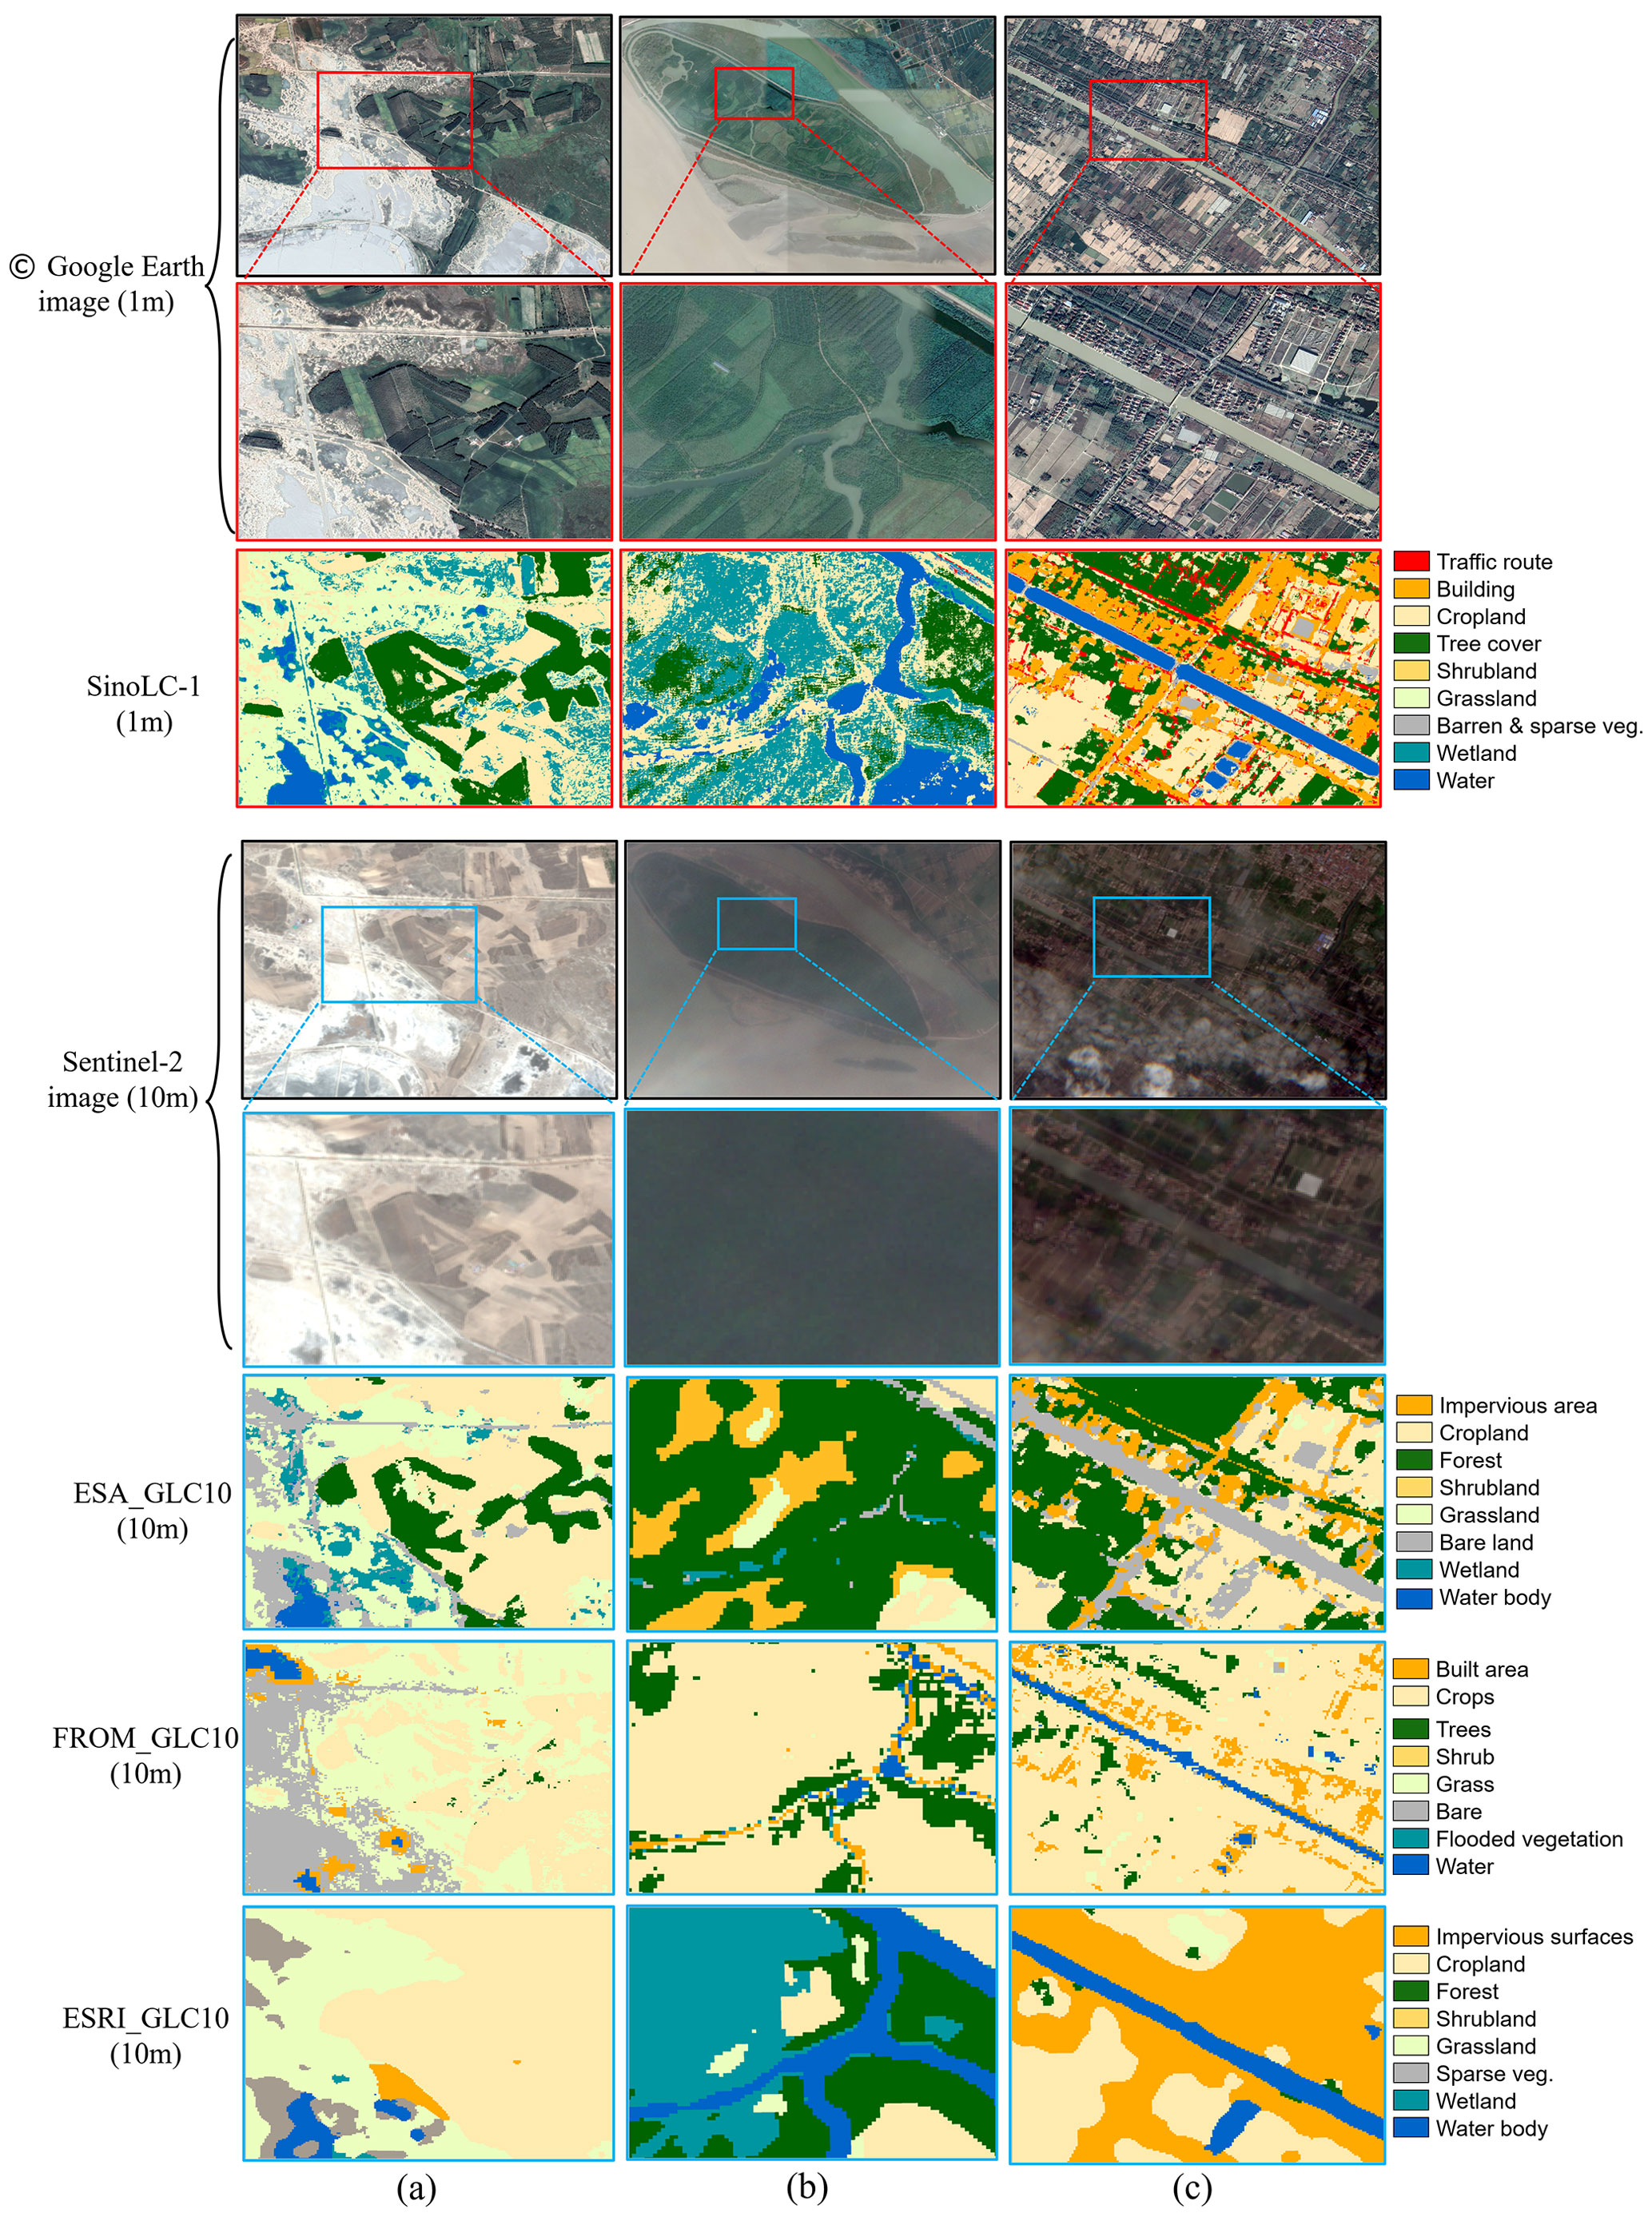
Figure 15Demonstrations of the visual comparison for challenging land-cover types: (a) Marshland, (b) Forest swamp, and (c) Watercourse. The VHR remote-sensing images in the figure are from © Google Earth 2021.
4.3 Quantitative analysis and accuracy assessment
4.3.1 Pixel-level validation
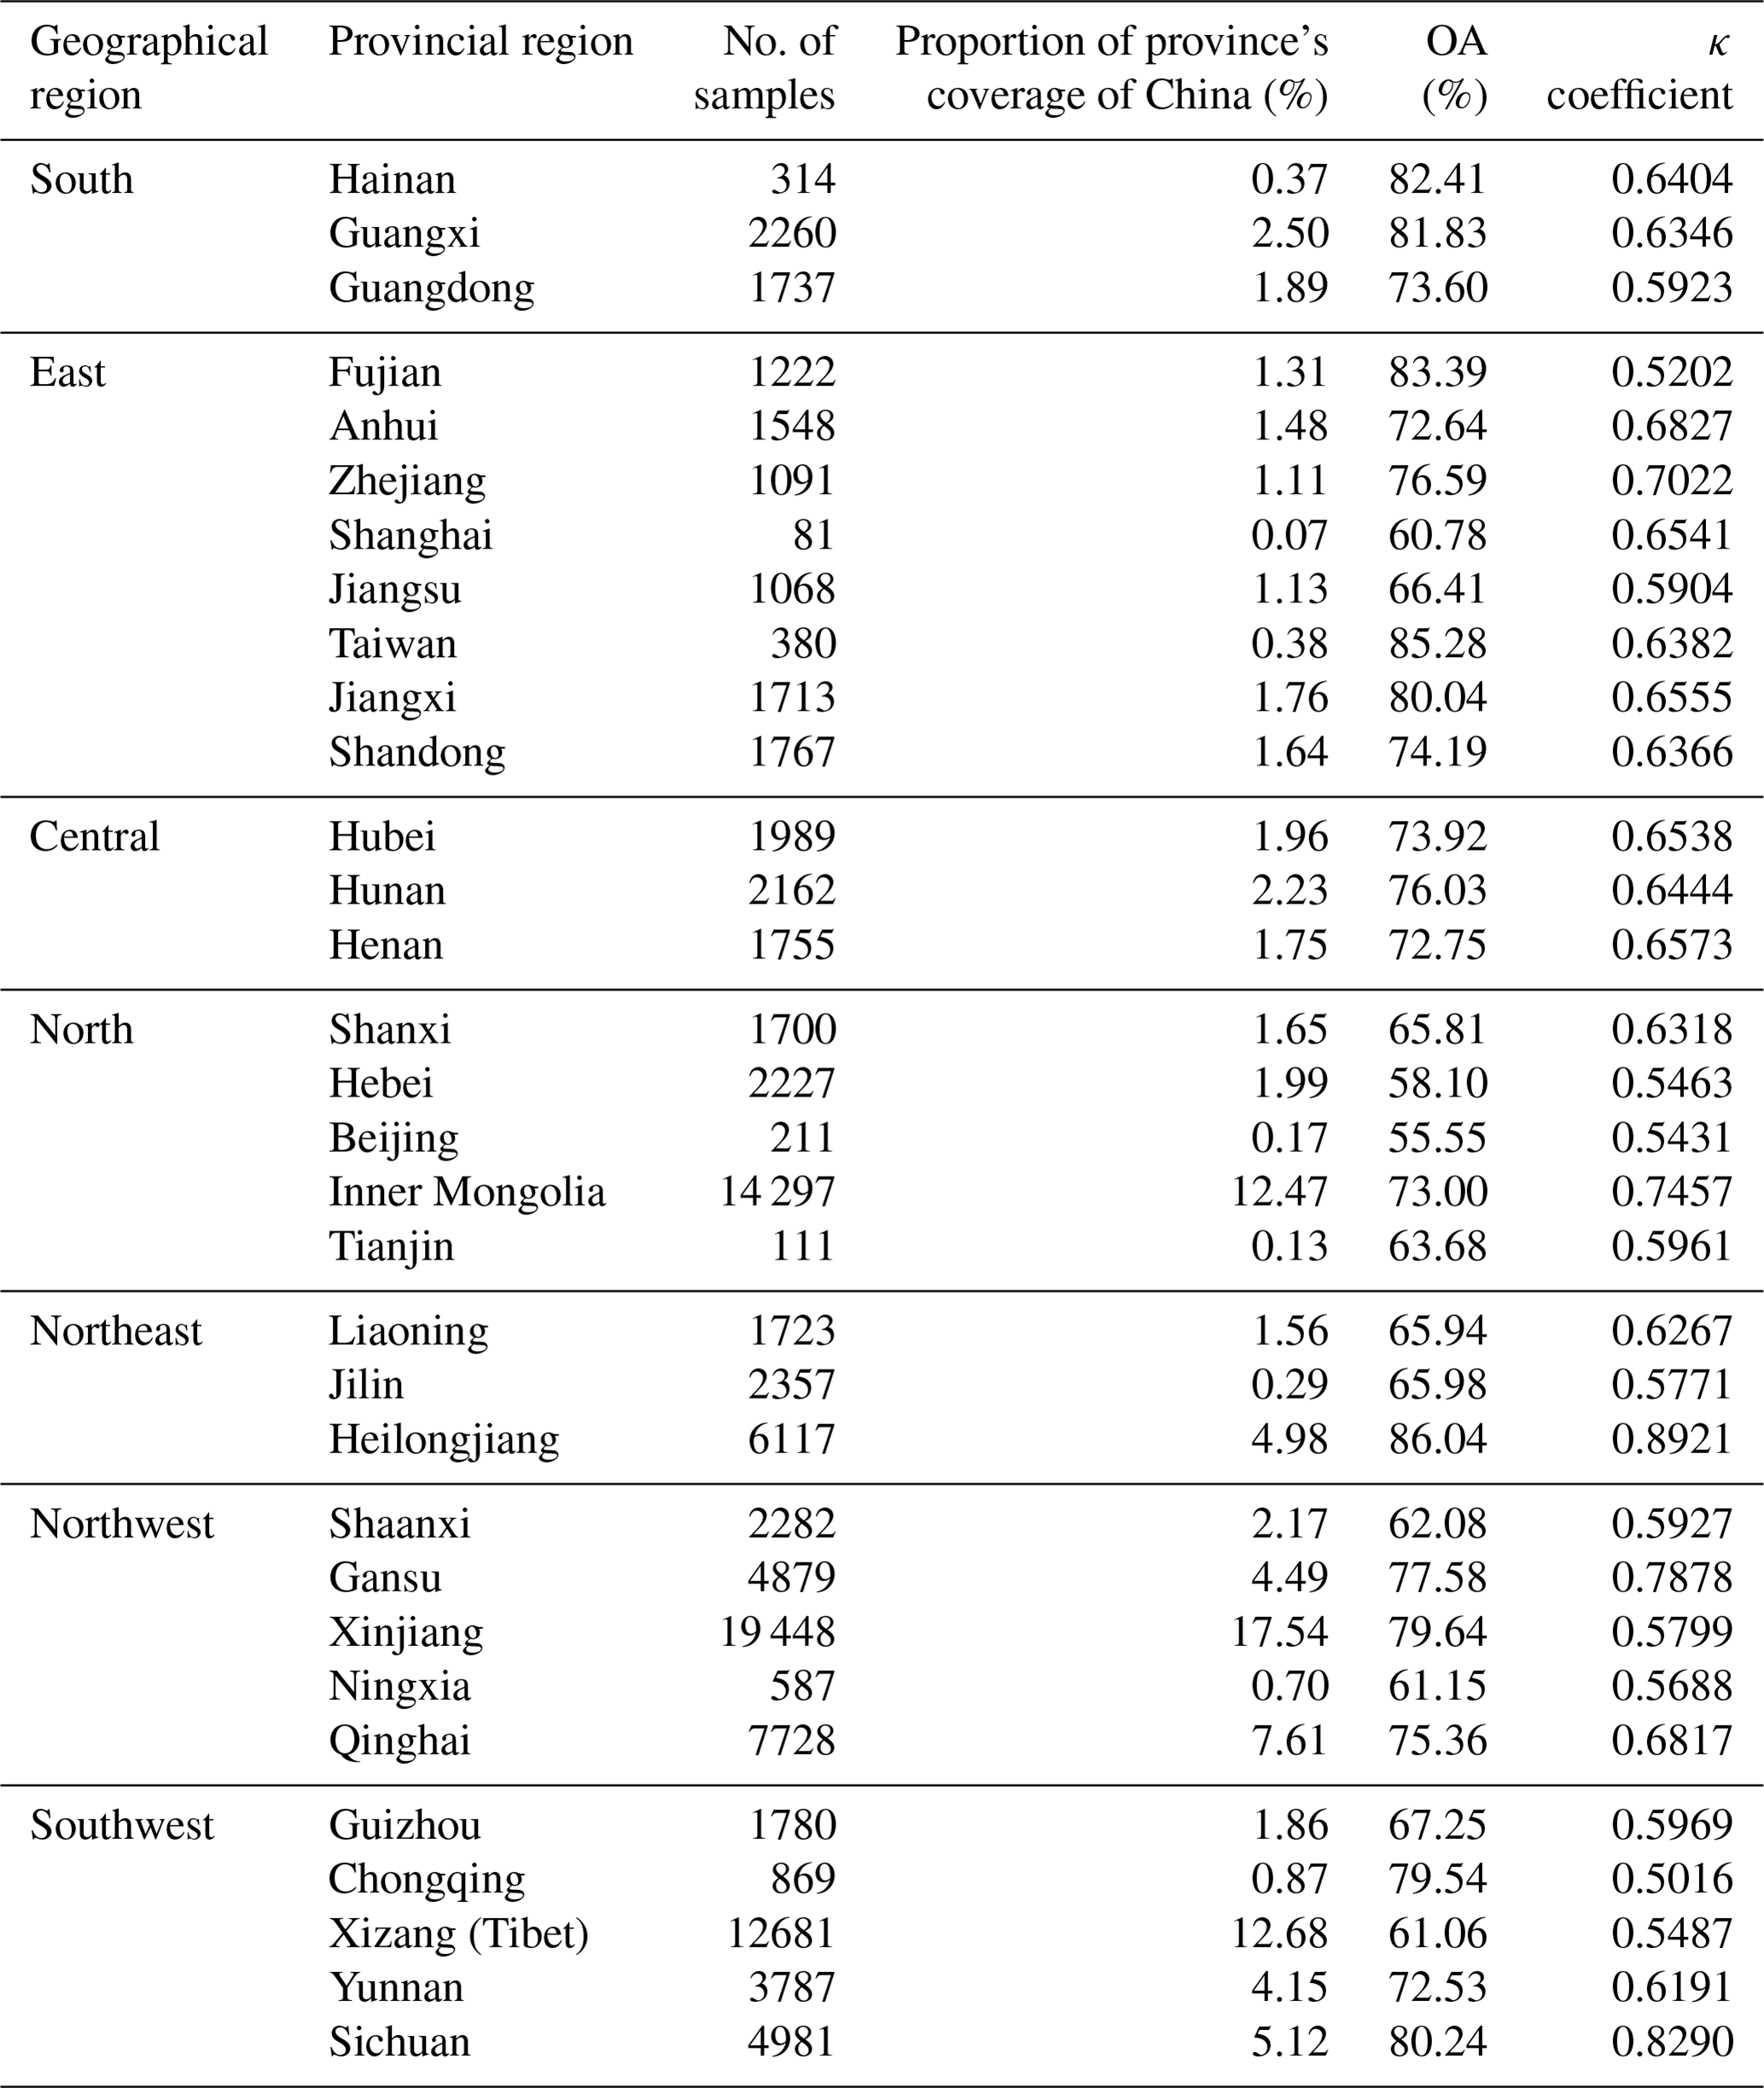
Based on the national validation sample set introduced in Sect. 3.3.1, over 100 000 sample points were visually interpreted to quantitatively validate the accuracy of the SinoLC-1 land-cover product. First, as a widely used method of assessing the accuracy of land-cover maps (Foody and Mathur, 2004; Gómez et al., 2016; Olofsson et al., 2014), the overall confusion matrix is shown in Table 6, and the confusion proportion for each land-cover type is demonstrated in Fig. 16. With the confusion matrix, the OA and κ coefficients were calculated to measure the overall performance of the SinoLC-1 product. Then, the UA and PA were calculated to measure the respective commission and omission errors of the product. Furthermore, as shown in Table 7, the number of samples, coverage area, OA, and κ coefficients of every provincial administration region were listed to demonstrate the accuracy of SinoLC-1 in different regions. It is important to note that the “No. of samples” in Table 7 represents the sample counts of the generated validation set; thus, some points may represent a void value in both the VHR images and SinoLC-1 product. The spatial distribution of the OA of every provincial administration region and the statistical accuracy of every geographical region are shown in Fig. 17.
The confusion matrix in Table 6 shows that the SinoLC-1 land-cover product achieves an OA of 73.61 % and a κ coefficient of 0.6595. Due to the void values of images and land-cover results in some regions, 106 344 validation sample points were ultimately counted in the confusion matrix. In terms of PA, the Water land-cover type has the highest accuracy (86.1 %), followed by Tree cover, Barren and spare vegetation, Grassland, Cropland, and Building; however, the Shrubland, Wetland, Moss and lichen, Snow and ice, and Traffic route land-cover types have relative low accuracies. By combining the class proportion of the validation sample set shown in Fig. 7 and the confusion matrix shown in Table 6 and Fig. 16, the quantitative results of the basic land-cover types (i.e., the Tree cover, Grassland, Cropland, Barren and sparse vegetation, and Water types), which have easily distinguishable features and occupy a large area in China, report higher accuracies and have a small proportion of misclassification. By contrast, the land-cover types that occupy a small area (i.e., the types of Traffic route, Moss and lichen, and Snow and ice) obtain relatively low accuracies and have a large proportion of misclassification.
The confusion proportion in Fig. 16 shows three points. First, partial traffic routes are incorrectly classified into a few common land-cover types (e.g., Tree cover, Cropland, and Grassland) because the models incorrectly predict the road width; thus, other land objects distributed on both sides of the roads cause commission errors. Second, most of the types, including Tree cover, Shrubland, Grassland, Cropland, Building, Barren and spare vegetation, Wetland, and Water, are well predicted and only contain a small proportion of the commission errors. Third, the Snow and ice and Moss and lichen land-cover types are commonly distributed in the northwest region of China; thus, the confusing land-cover types are mainly the Grassland and Barren and sparse vegetation types, which are the most confusable and occupy a large proportion of northwestern China.
The OA and κ coefficients of every provincial administrative region in Table 7 and Fig. 17 show the following findings. First, by comparing the spatial distribution of OA in China, most of the regions have an OA of over 70 %, although eight areas (Hainan, Taiwan, Jiangxi, Fujian, Yunnan, Chongqing, Xinjiang, and Heilongjiang) achieve over 80 %. Hebei and Beijing have a relatively low OA (in the range of 50 %–60 %). Second, by comparing every geographical region shown in Fig. 17b, southern and northeastern China have the highest OA among all regions (about 78 %) because the Tree cover land-cover type occupies a very large proportion and the land-cover patterns in southern and northeastern China are relatively simple. Northern China, including Beijing, Tianjin, Hebei, Shanxi, and Inner Mongolia, have the lowest OA (lower than 70 %). For Inner Mongolia, the wide longitude span of the region and the diverse landscapes caused the misclassification of the region. For Beijing, most of the misclassified samples are (1) the confusion between Tree cover and Grassland and (2) the confusion between Building and Traffic route. For Tianjin, most of the misclassification is the confusion among Cropland, Building, and Traffic route. For Hebei, most of the misclassified samples are (1) the confusion between Tree cover and Grassland and (2) the confusion between Cropland and Grassland. For Shanxi, most of the misclassified samples are (1) the confusion among Tree cover, Grassland, and Cropland, (2) the confusion between Building and Traffic route, and (3) the confusion between Cropland and Barren and sparse vegetation. Moreover, except for northern China, the rest of the geographical regions have accuracies of over 70 %.
Table 6Confusion matrix for the SinoLC-1 land-cover product according to the national validation sample sets.
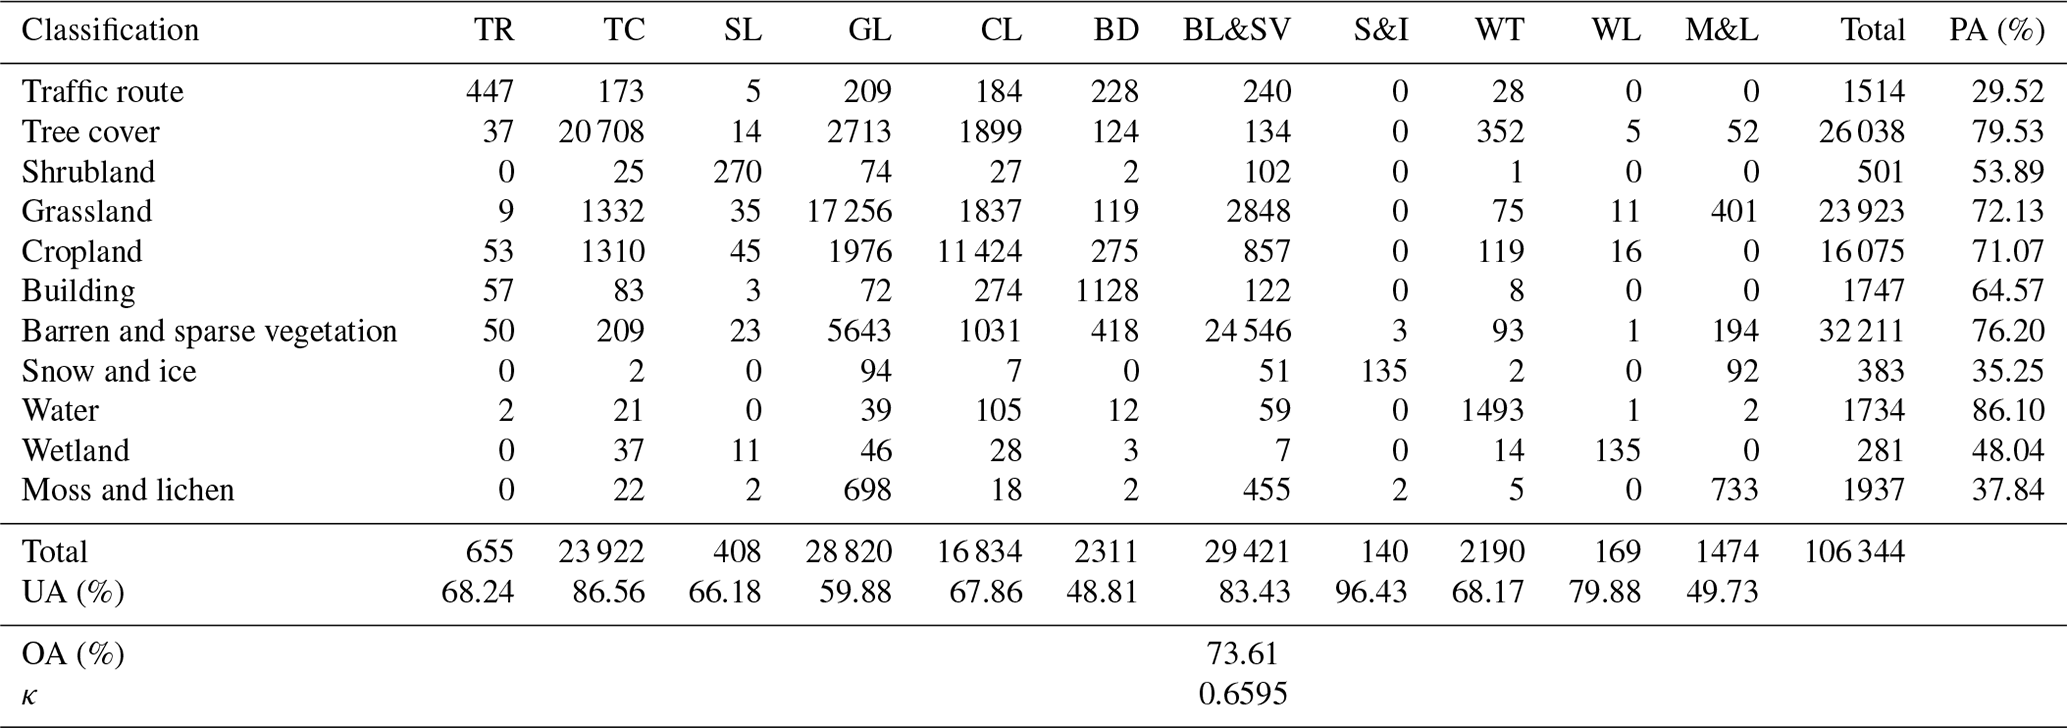
The abbreviations used in the table are as follows: TR – Traffic route, TC – Tree cover, SL – Shrubland, GL – Grassland, CL – Cropland, BD – Building, BL&SV – Barren and sparse vegetation, S&I – Snow and ice, WT – Water, WL – Wetland, and M&L – Moss and lichen.
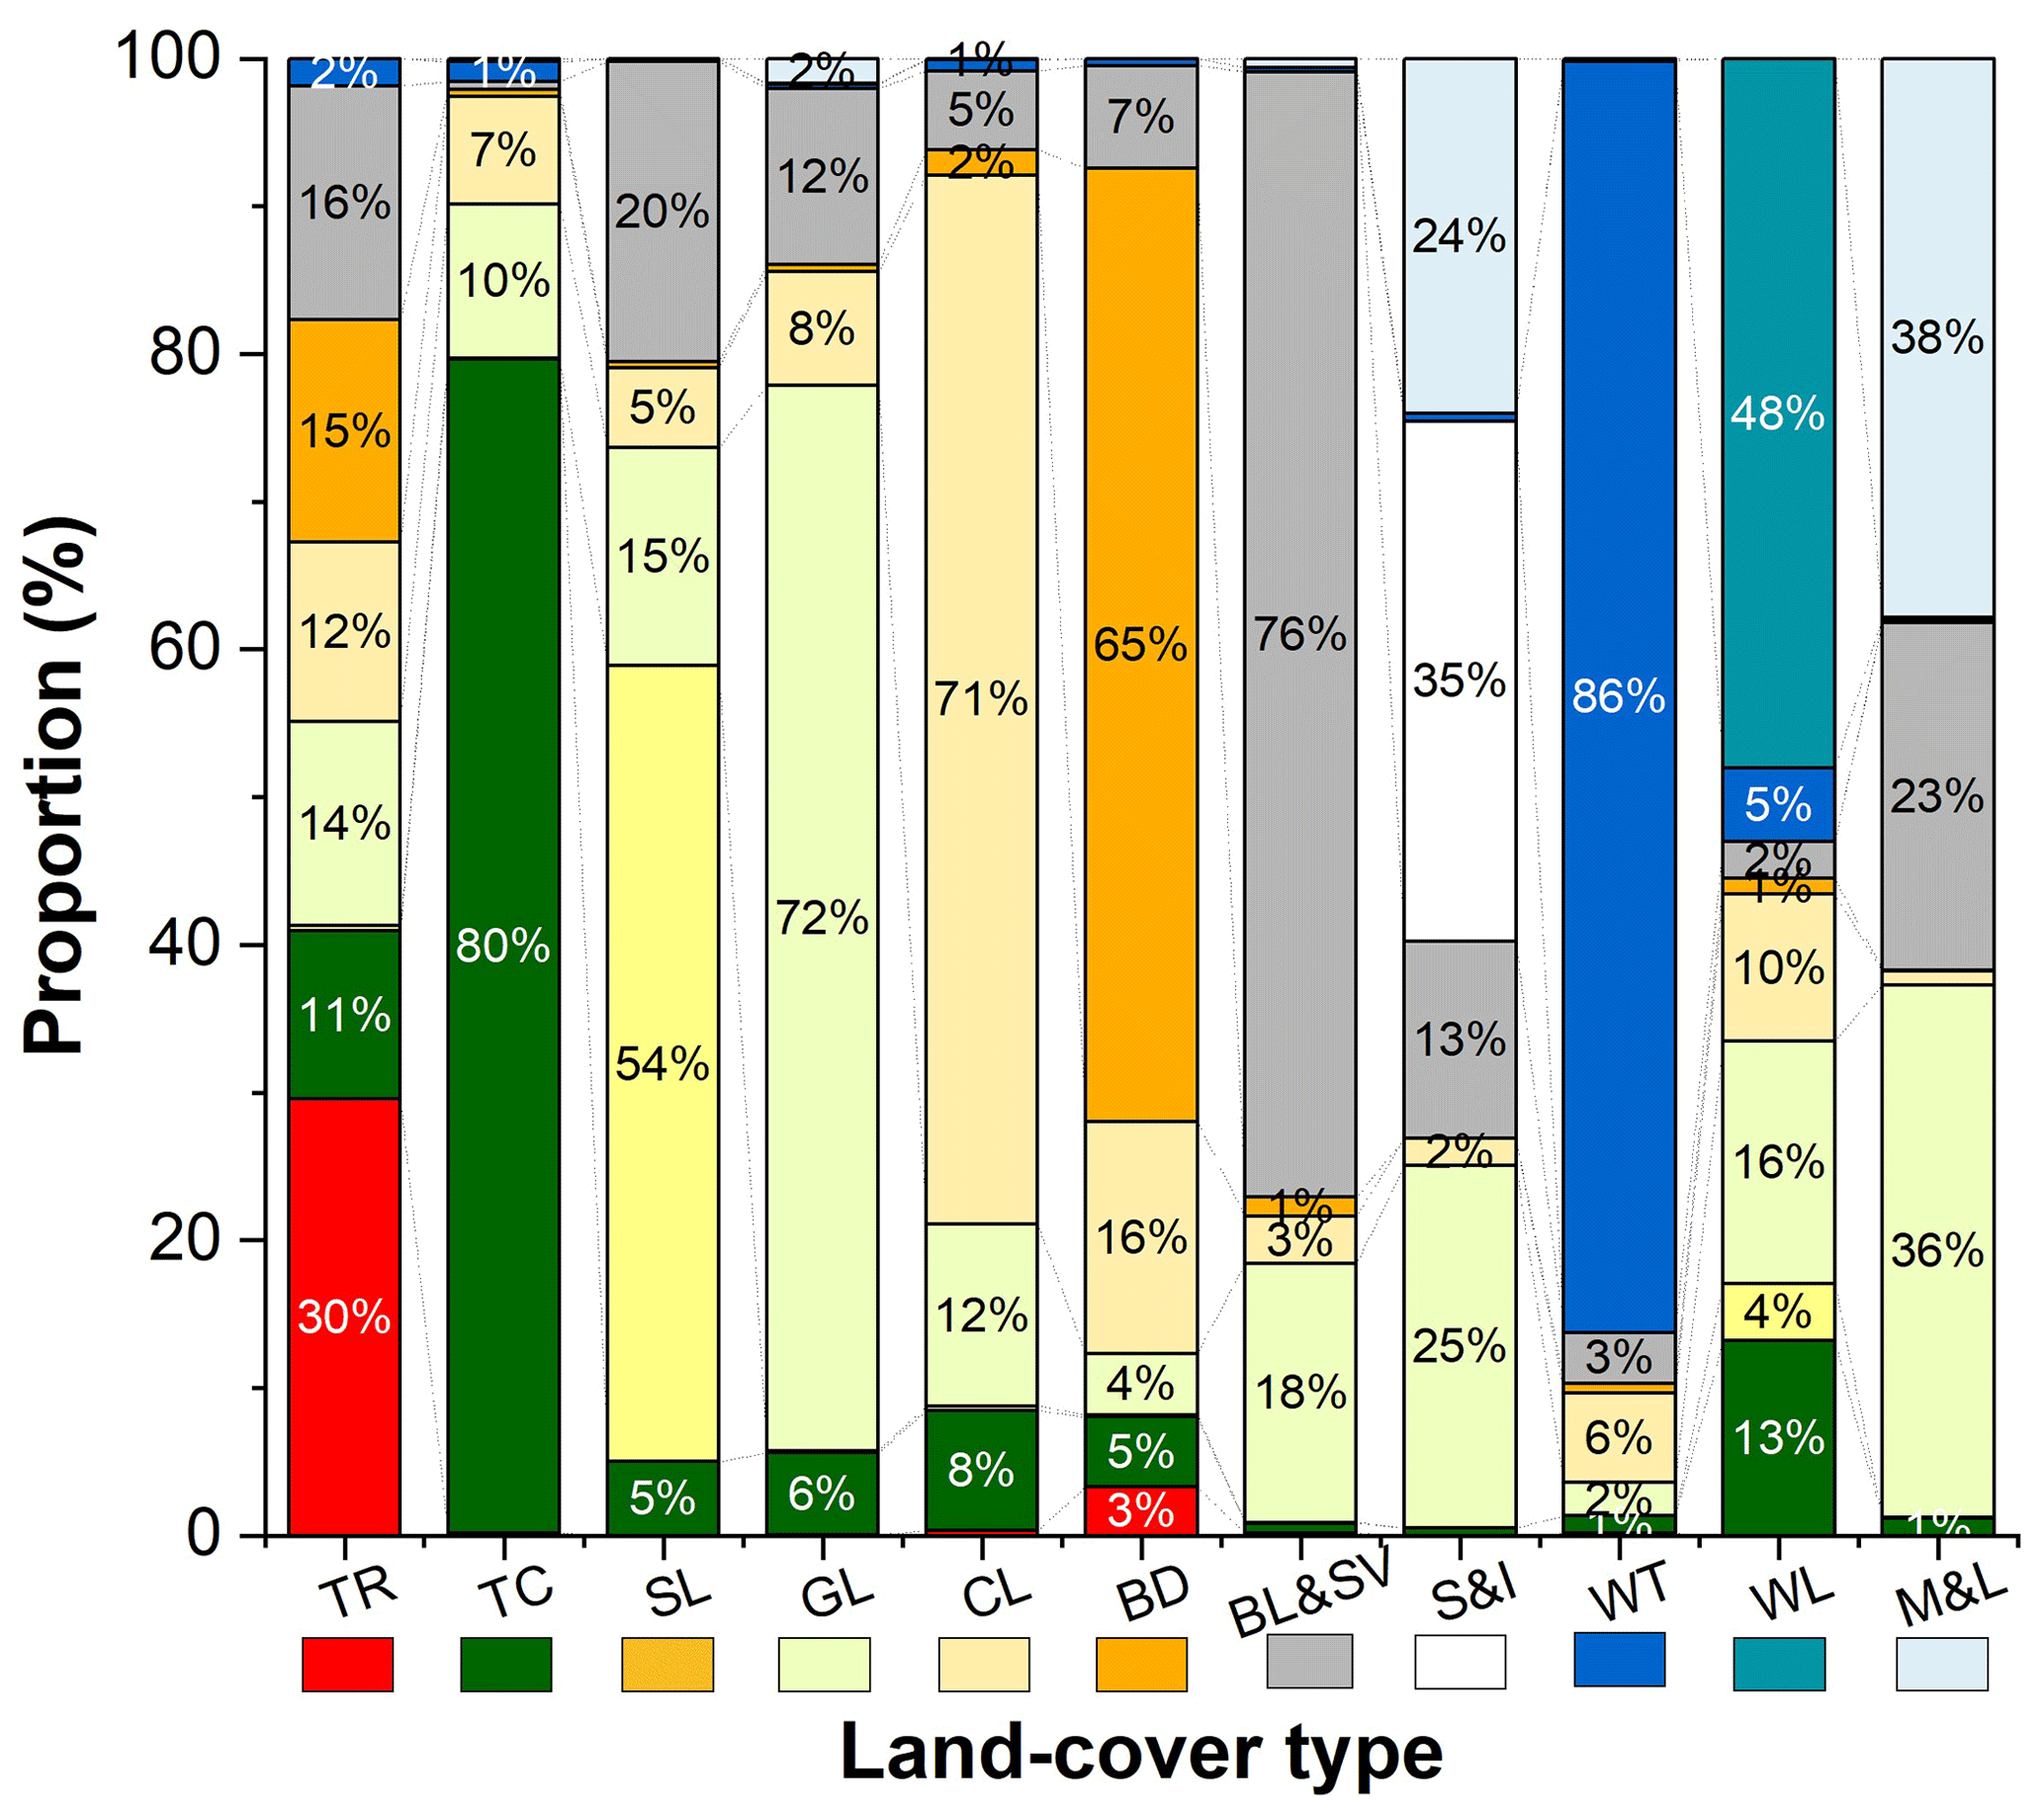
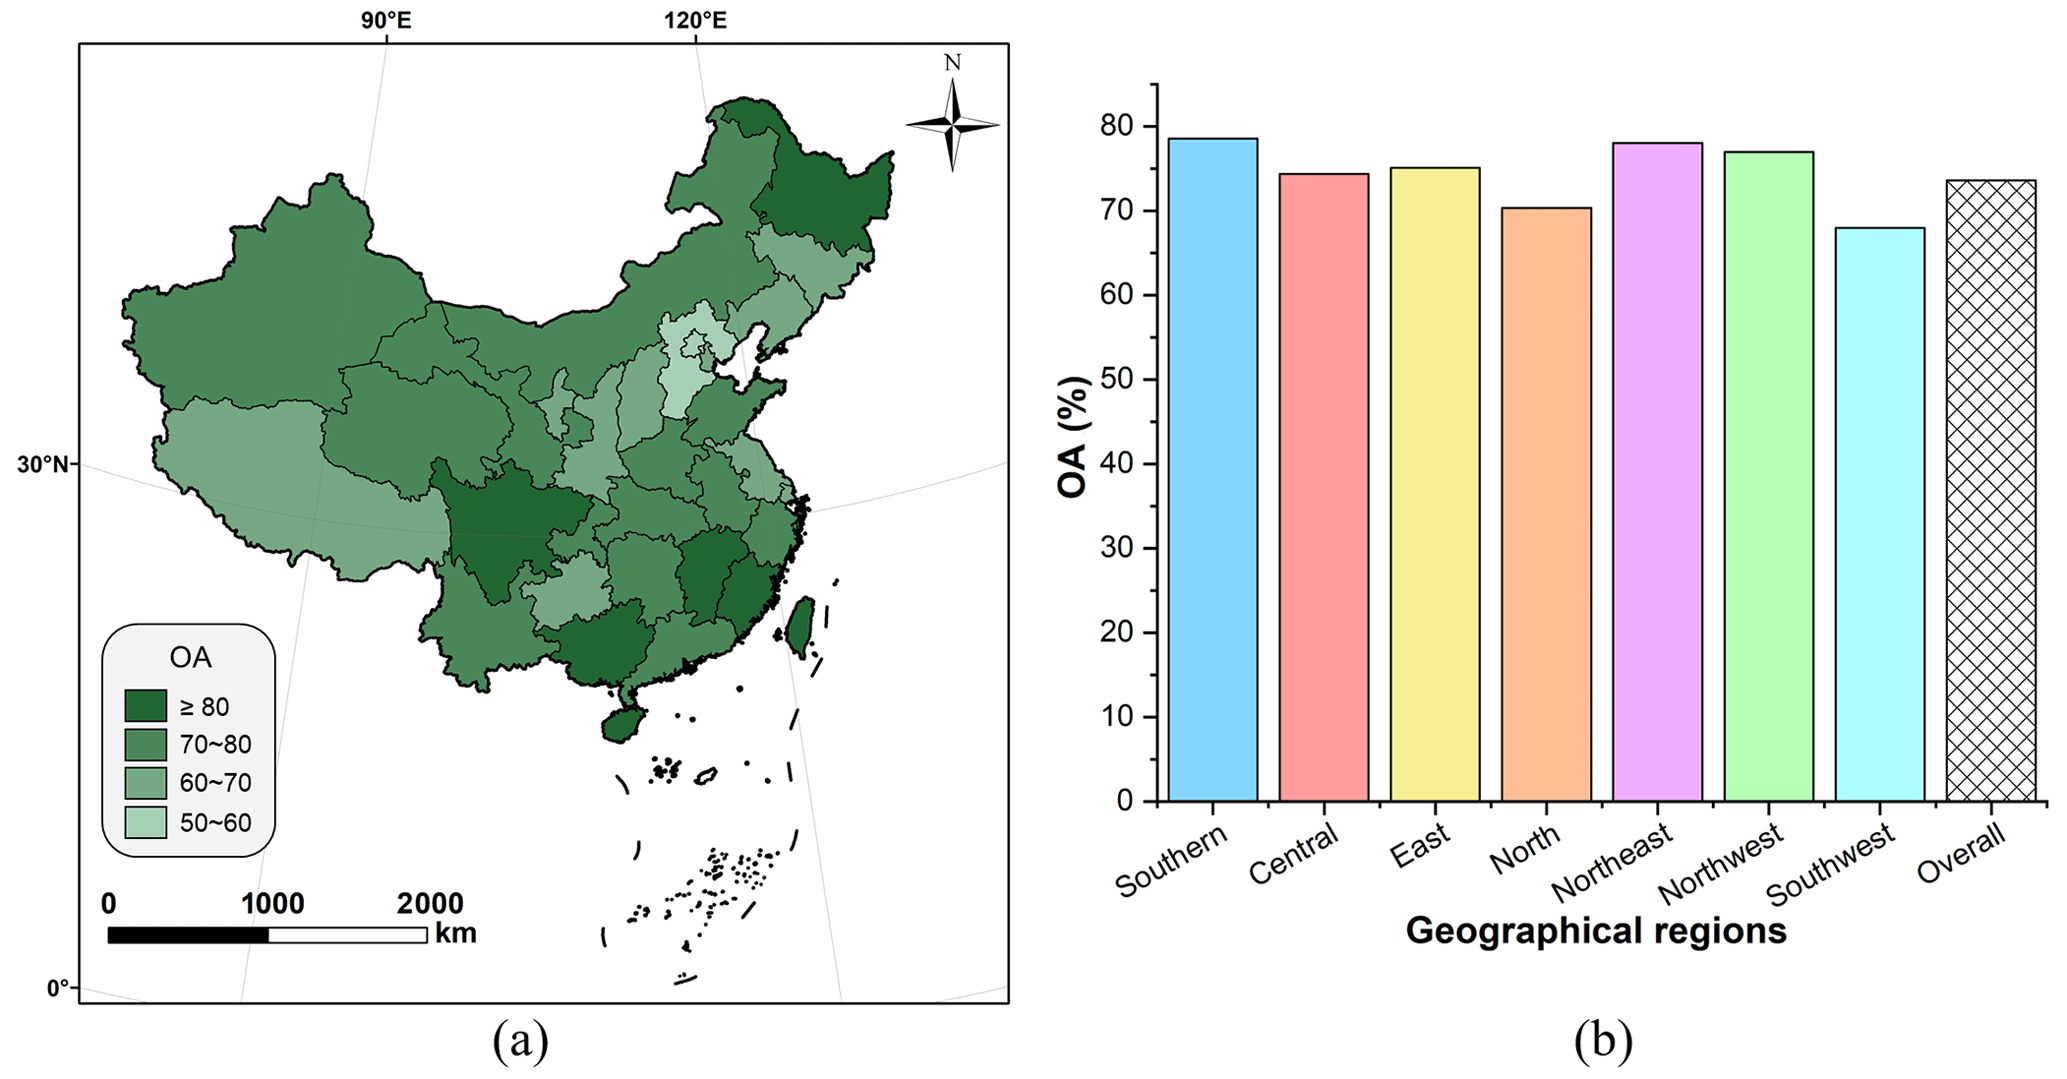
Figure 17Spatial distribution and the statistical results of overall accuracy over China: (a) spatial distribution of OA for every province and (b) statistical OA for every geographical region of China.
Table 7Number of samples, coverage area, OA, and κ coefficient of provincial administrative regions in China.
4.3.2 Quantitative comparison based on open-access validation sets
To quantitatively compare the SinoLC-1 land-cover product with the other land-cover products, we conducted a complete validation of SinoLC-1 and the other five land-cover products based on two open-access validation datasets (Zhao et al., 2014; Liu et al., 2019). These validation datasets were created based on multiple data sources and manual verification, reporting a stable quality and high independence. Their spatial distribution and classification system are shown in Fig. 18.
Based on two open-access validation datasets, we calculated the confusion matrix of SinoLC-1 and further validated the OA and the κ coefficient of SinoLC-1. The OA values of SinoLC-1 validated using the validation sets created by Liu et al. (2019) and Zhao et al. (2014) are 78.80 % and 64.69 %, respectively; the κ coefficients are 0.7394 and 0.5588, respectively. To illustrate more detailed assessment results, Fig. 19 shows the corresponding confusion proportions for each considered land-cover type of SinoLC-1 validated using two datasets. Furthermore, Fig. 20 shows the validation results of five comparative land-cover products. Comparing the validation results of two datasets, all products have a higher OA on the validation set created by Liu et al. (2019), and SinoLC-1 ranks second with an OA of 78.81 % (lower than the 30 m GLC_FCS30). With the validation set created by Zhao et al. (2014), all products have an OA of around 60 %, and SinoLC-1 ranks second with an OA of 64.69 % (lower than the 10 m ESA_GLC10).
Overall, by quantitatively comparing the SinoLC-1 product with five widely used land-cover products using two open-access validation datasets, the produced SinoLC-1 product shows an acceptable confusion proportion among all considered land-cover types and has a competitive accuracy compared to the other land-cover products across China.
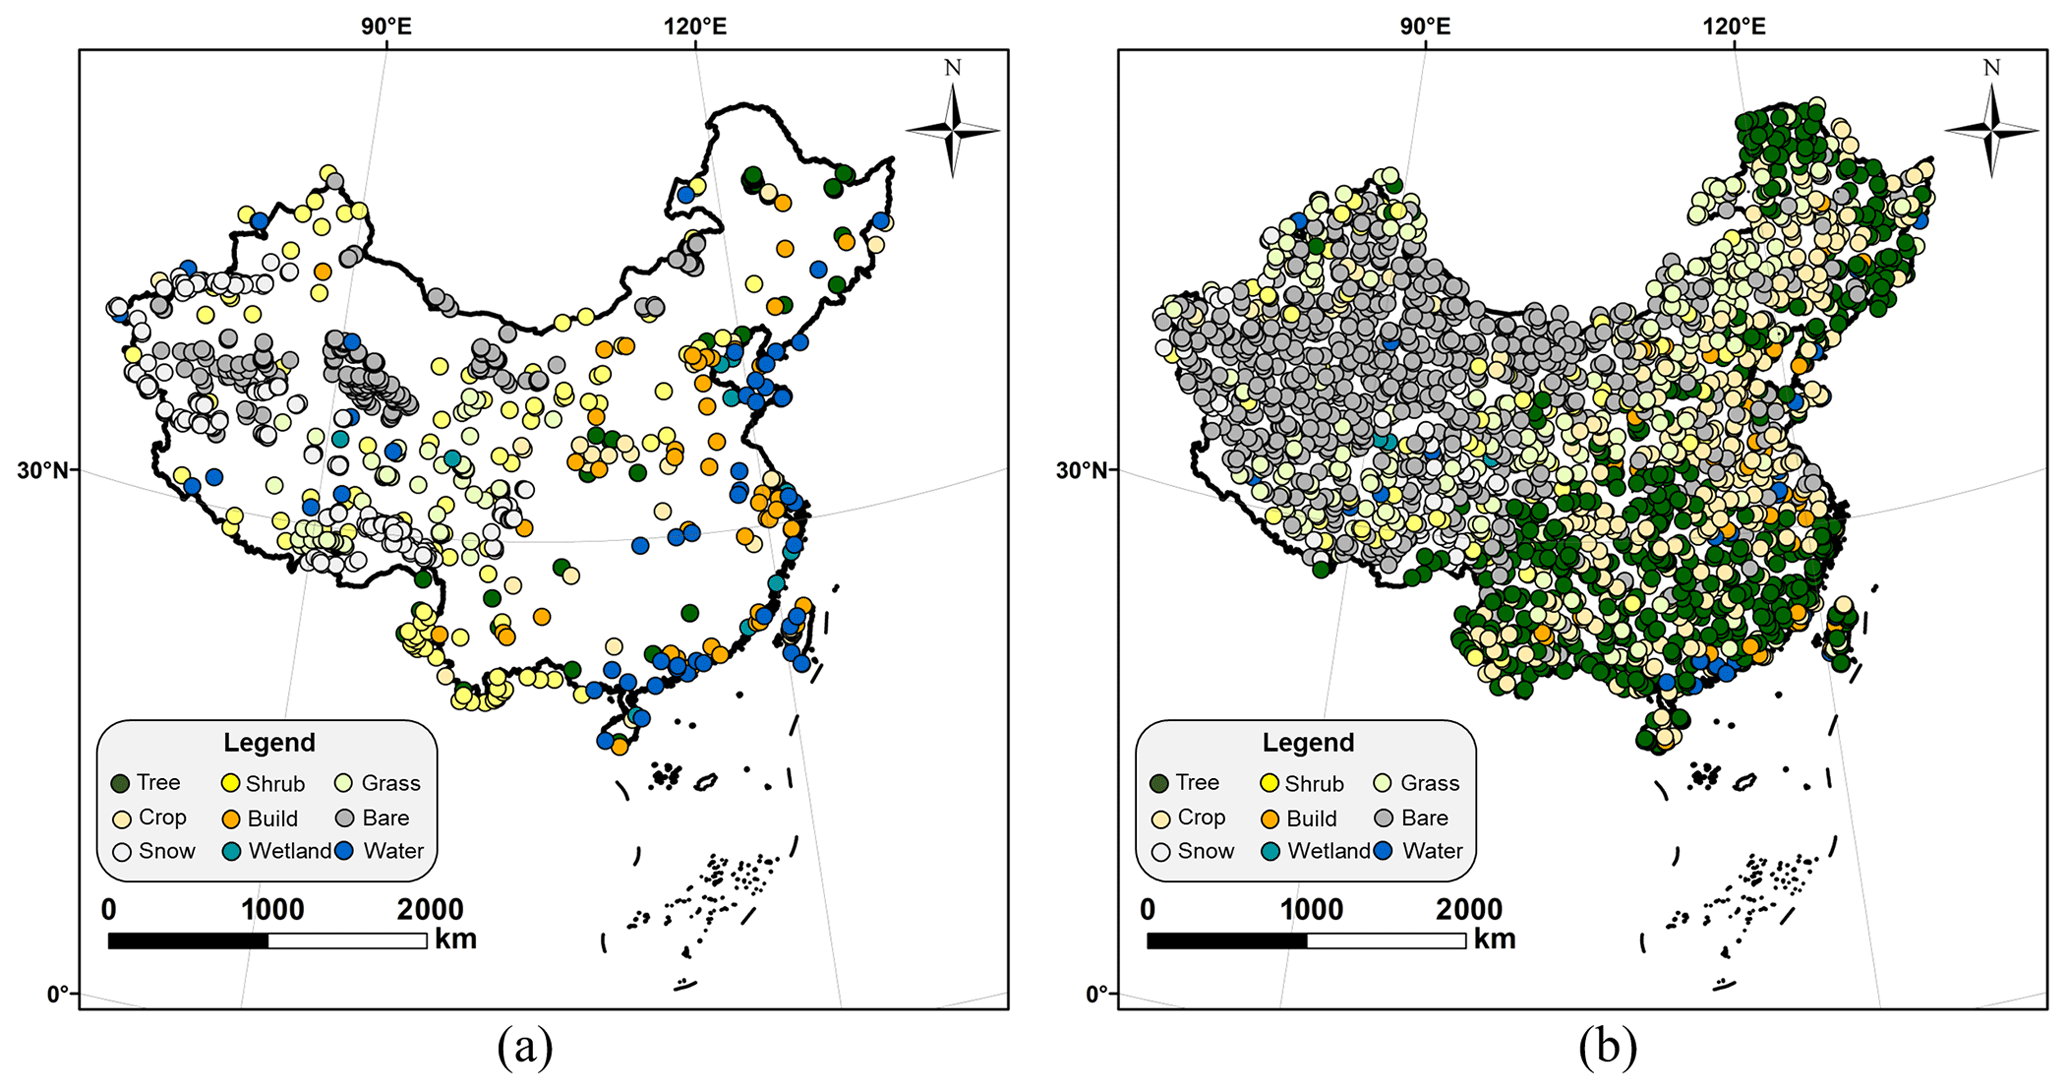
Figure 18Spatial distribution and classification system of two open-access validation sets: (a) the validation set created by Liu et al. (2019) and (b) the validation set created by Zhao et al. (2014).
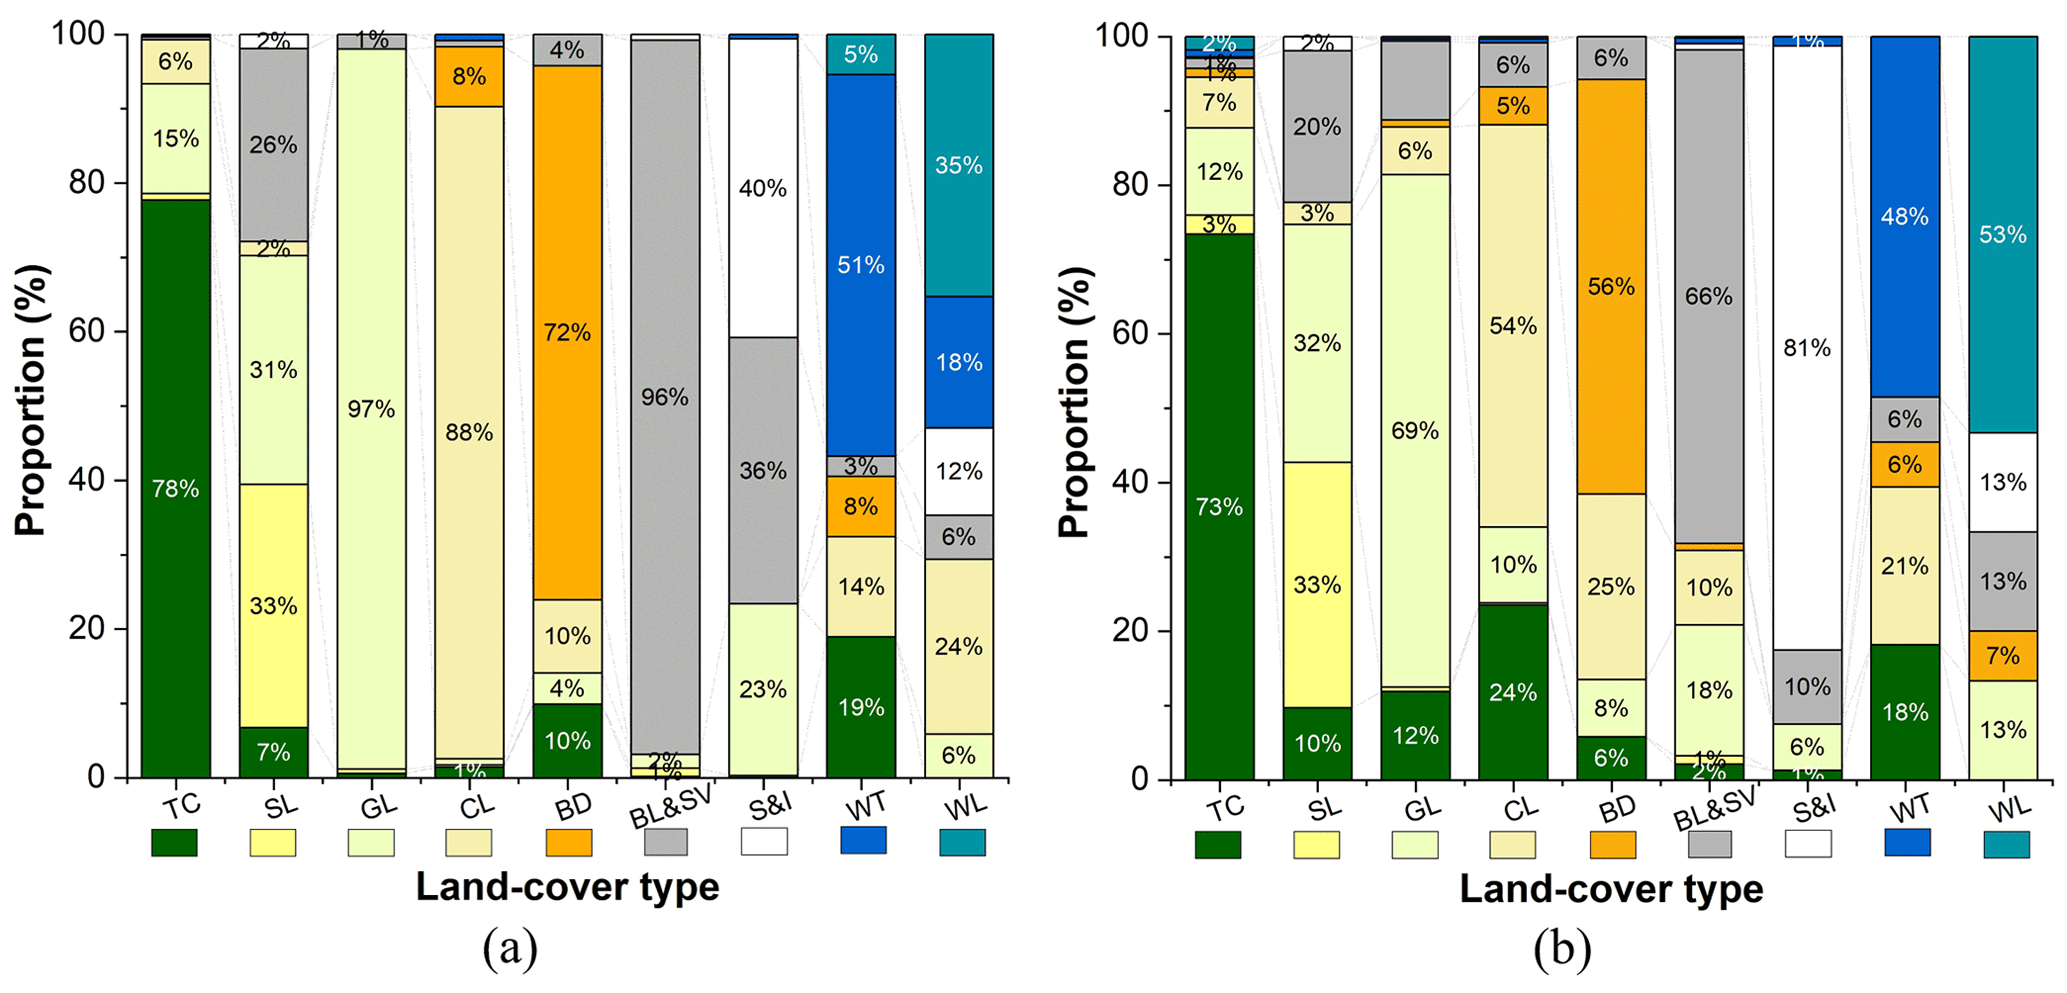
Figure 19Confusion proportions of SinoLC-1 with two open-access validation datasets: (a) confusion proportions of SinoLC-1 validated with the dataset created by Liu et al. (2019) and (b) confusion proportions of SinoLC-1 validated with the dataset created by Zhao et al. (2014).
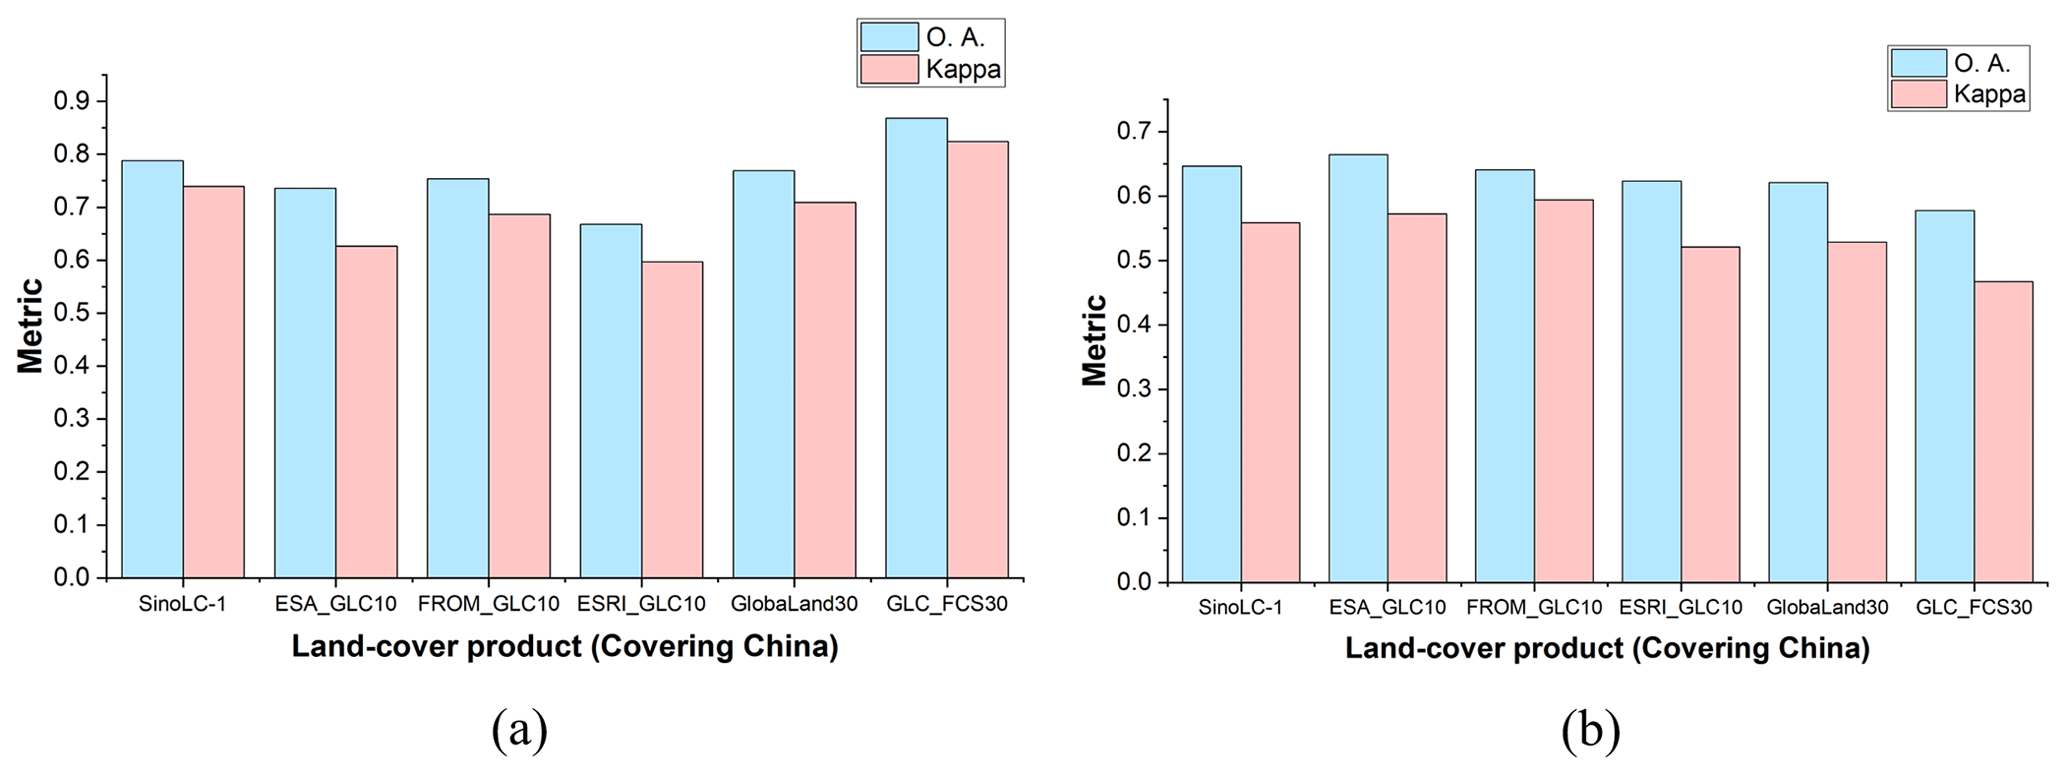
Figure 20The quantitative validation and comparison of SinoLC-1 and the other five land-cover products: (a) the validation results based on the dataset created by Liu et al. (2019) and (b) the validation results based on the dataset created by Zhao et al. (2014).
4.3.3 Statistical-level validation
Based on the statistical validation set described in Sect. 3.3.2, the official land resource survey data of 31 provincial administrative regions were collected to validate the statistical-level performance of SinoLC-1, as shown in Tables 3 and 4. Figure 21 compares the statistical results of all considered land-cover types between the SinoLC-1 and 3rd NLRS data in every considered provincial administrative region where the overestimation (positive value) and underestimation (negative value) of SinoLC-1 are reflected. Furthermore, the statistical analysis among the provincial- and geographical-level regions is shown in Fig. 23.
The statistical comparisons in Fig. 21 reveal that the statistical results of most regions are relatively consistent with the 3rd NLRS data. Overall, in southern and central China, the misestimation of land-cover types is mainly distributed in the Tree cover and Cropland land-cover types. In eastern China, the over-forecast of the cropland is the main confusion for the SinoLC-1 product, which is evident in the Shandong, Anhui, and Jiangsu provinces. In northern China, the statistical comparisons indicate similar conclusions to the pixel-level validation discussed in Sect. 4.3.1. The landscapes vary and easily lead to incorrect predictions due to the wide longitudinal span of the regions. The misestimation of land-cover types in northern China is mainly due to the underestimation of Shrubland and the over-forecast of Grassland, Barren and sparse vegetation, and Cropland. In northeastern China, the results of all provincial administrative regions show acceptable performance, which is highly consistent with the survey data, because the landscapes of northeastern China are relatively similar (mainly composed of Tree cover and Cropland) and not easily confused. In northwestern and southwestern China, as the main land-cover types with respect to distribution, the misestimation of Grassland and Barren and sparse vegetation still exists in some provinces.
To demonstrate the spatial distribution of the misestimation rate for each land-cover type across China, we illustrate misestimation maps for every land-cover type in Fig. 22. From the results, the misestimation of some land-cover types shows a strong pattern with respect to distribution. For example, the misestimation of Shrubland is mainly distributed in the north and southwest of China. The misestimations of Grassland and Barren and sparse vegetation are concentrated in the north, northwest, and southwest of China. The misestimations of Cropland and Building are distributed on the coasts of eastern and southern China. The main misestimated land-cover types distributed in western China (i.e., Qinghai–Tibet Plateau and Xinjiang) are Wetland, with a misestimation rate of 7.6 %–9.5 %; Snow and ice, with a misestimation rate of 0.5 %–1.8 %; and Moss and lichen, with a misestimation rate of 0.2 %–0.3 %. Moreover, for Hainan and Chongqing provinces, SinoLC-1 presents a high overestimation of Tree cover and an underestimation of Cropland. By considering the survey data, statistical comparison, and model training processing shown in Table 4, Fig. 21, and Fig. 3, Hainan and Chongqing provinces have a high proportion of Tree cover in practice, and the labels generated for model training retain massive samples of Tree cover in these two areas, resulting in the model overfitting and overestimating the Tree cover land type.
To evaluate and analyze the overall misestimated area of every land-cover type, a box plot was first used to describe the error distribution of every land-cover type in 31 provincial administrative regions. Figure 23a shows that the misestimation rate of most land types remains low, which indicates that SinoLC-1 is a statistically acceptable land-cover product across the nation.
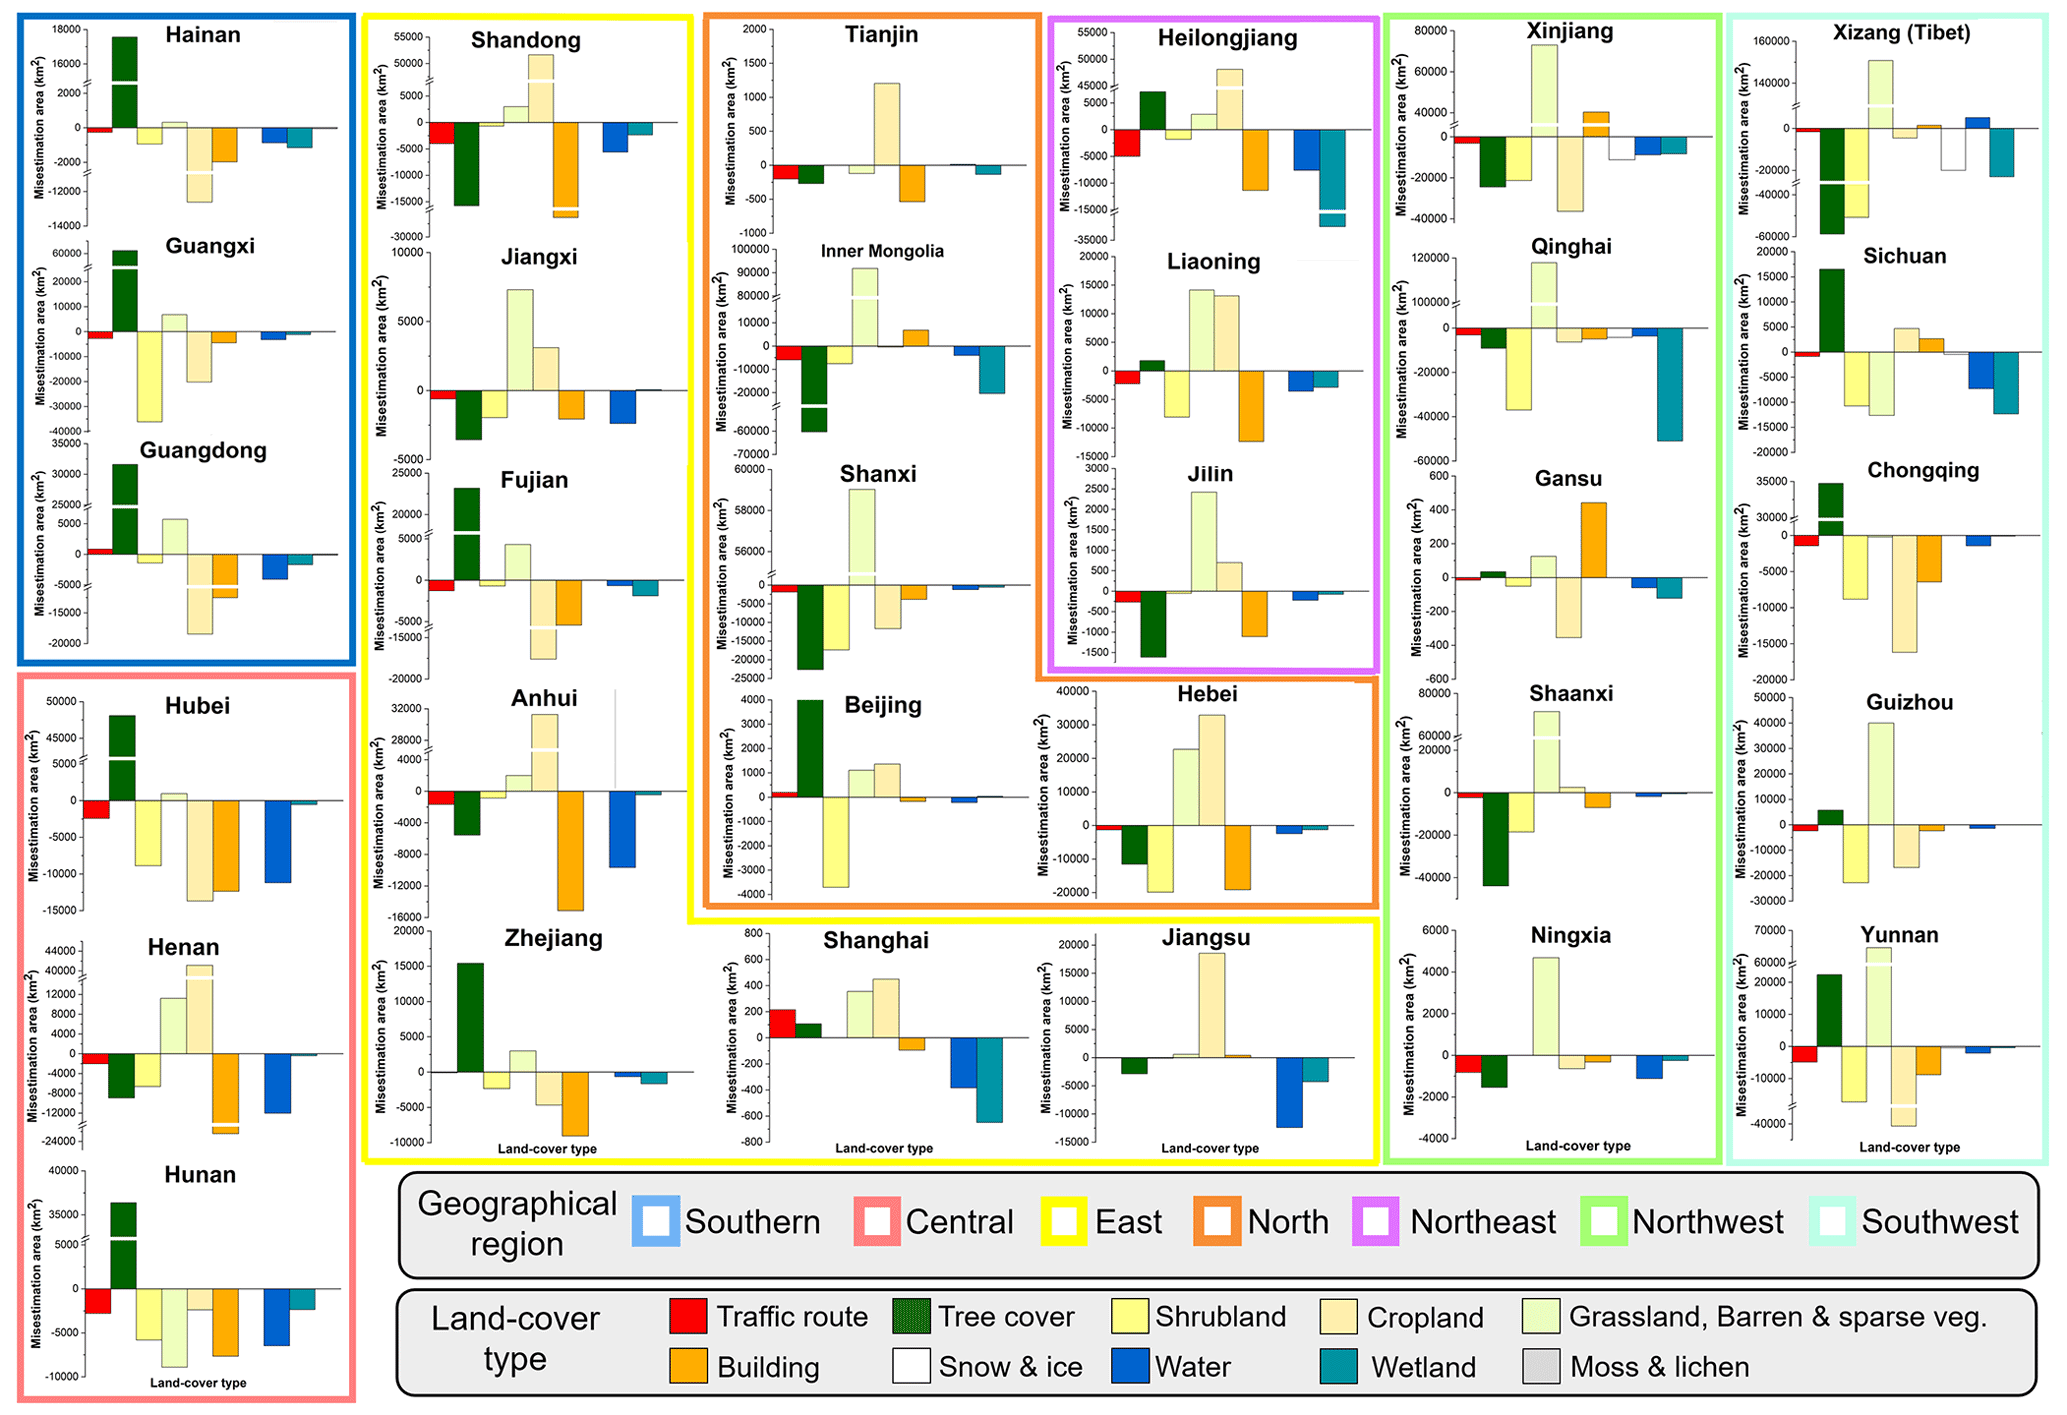
Figure 21Statistical comparison between SinoLC-1 and 3rd NLRS data for 31 provinces in China. The provinces in different geographical regions are represented by dissimilar wireframe colors. In every subplot, the abscissa axis represents the land-cover types and the vertical axis represents the misestimated area.
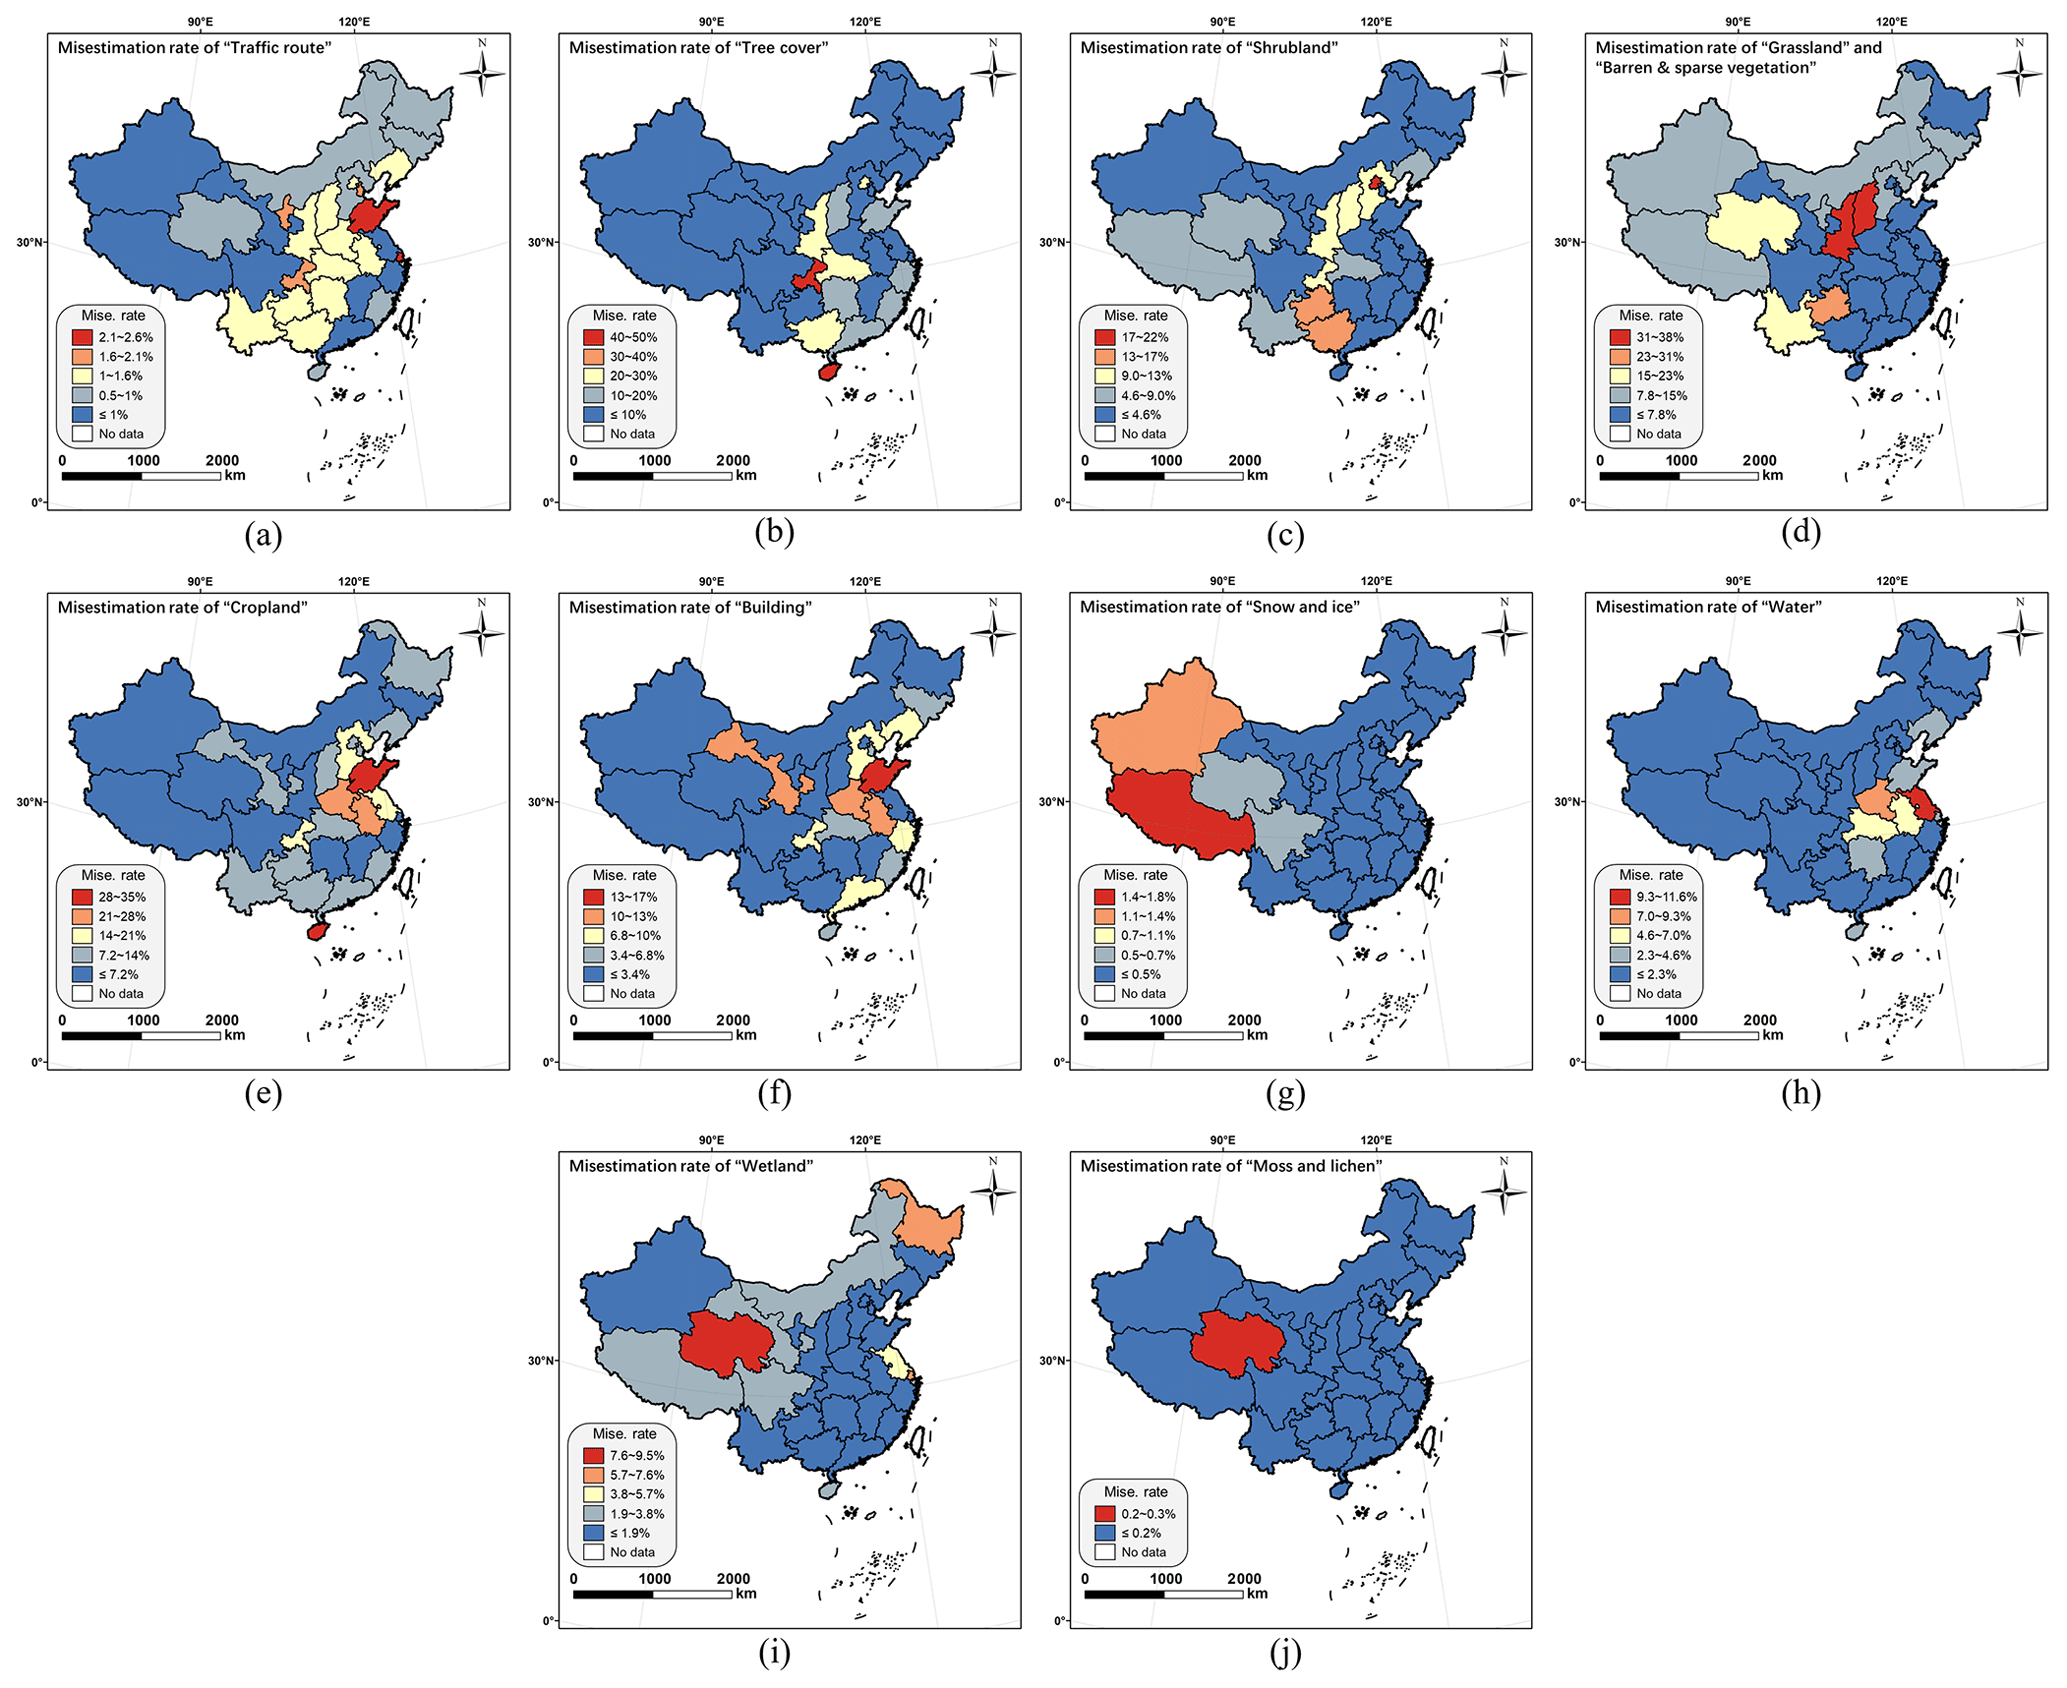
Figure 22The misestimation rate of SinoLC-1 for 31 provinces in China. In every subplot, a statistical comparison between SinoLC-1 and 3rd NLRS data is illustrated for a specific land-cover type: (a) Traffic route, (b) Tree cover, (c) Shrubland, (d) the combination of Grassland and Barren and sparse vegetation, (e) Cropland, (f) Building, (g) Snow and ice, (h) Water, (i) Wetland, and (j) Moss and lichen.
Nevertheless, some outliers and large areas of misestimation are observed in the Grassland and Barren and sparse vegetation land-cover types, and this misestimation is mainly in the northwest and southwest parts of China where such land-cover types occupy a very large proportion of the region and are easily overestimated. A multi-column chart was then used to demonstrate the misestimation rate (calculated using the misestimated area for each land-cover type divided by the total area of the region) in the seven geographical regions. Figure 23b shows that these regions exhibit different dominant misestimated land-cover types based on the various main landscape types of the seven geographical regions, and the misestimation rates of the seven regions are all under 20 % (most of them are under 15 %). Next, we demonstrate a histogram of the national misestimation rate (shown in Fig. 23c) to visualize the statistical assessment of every land-cover type contained in SinoLC-1.
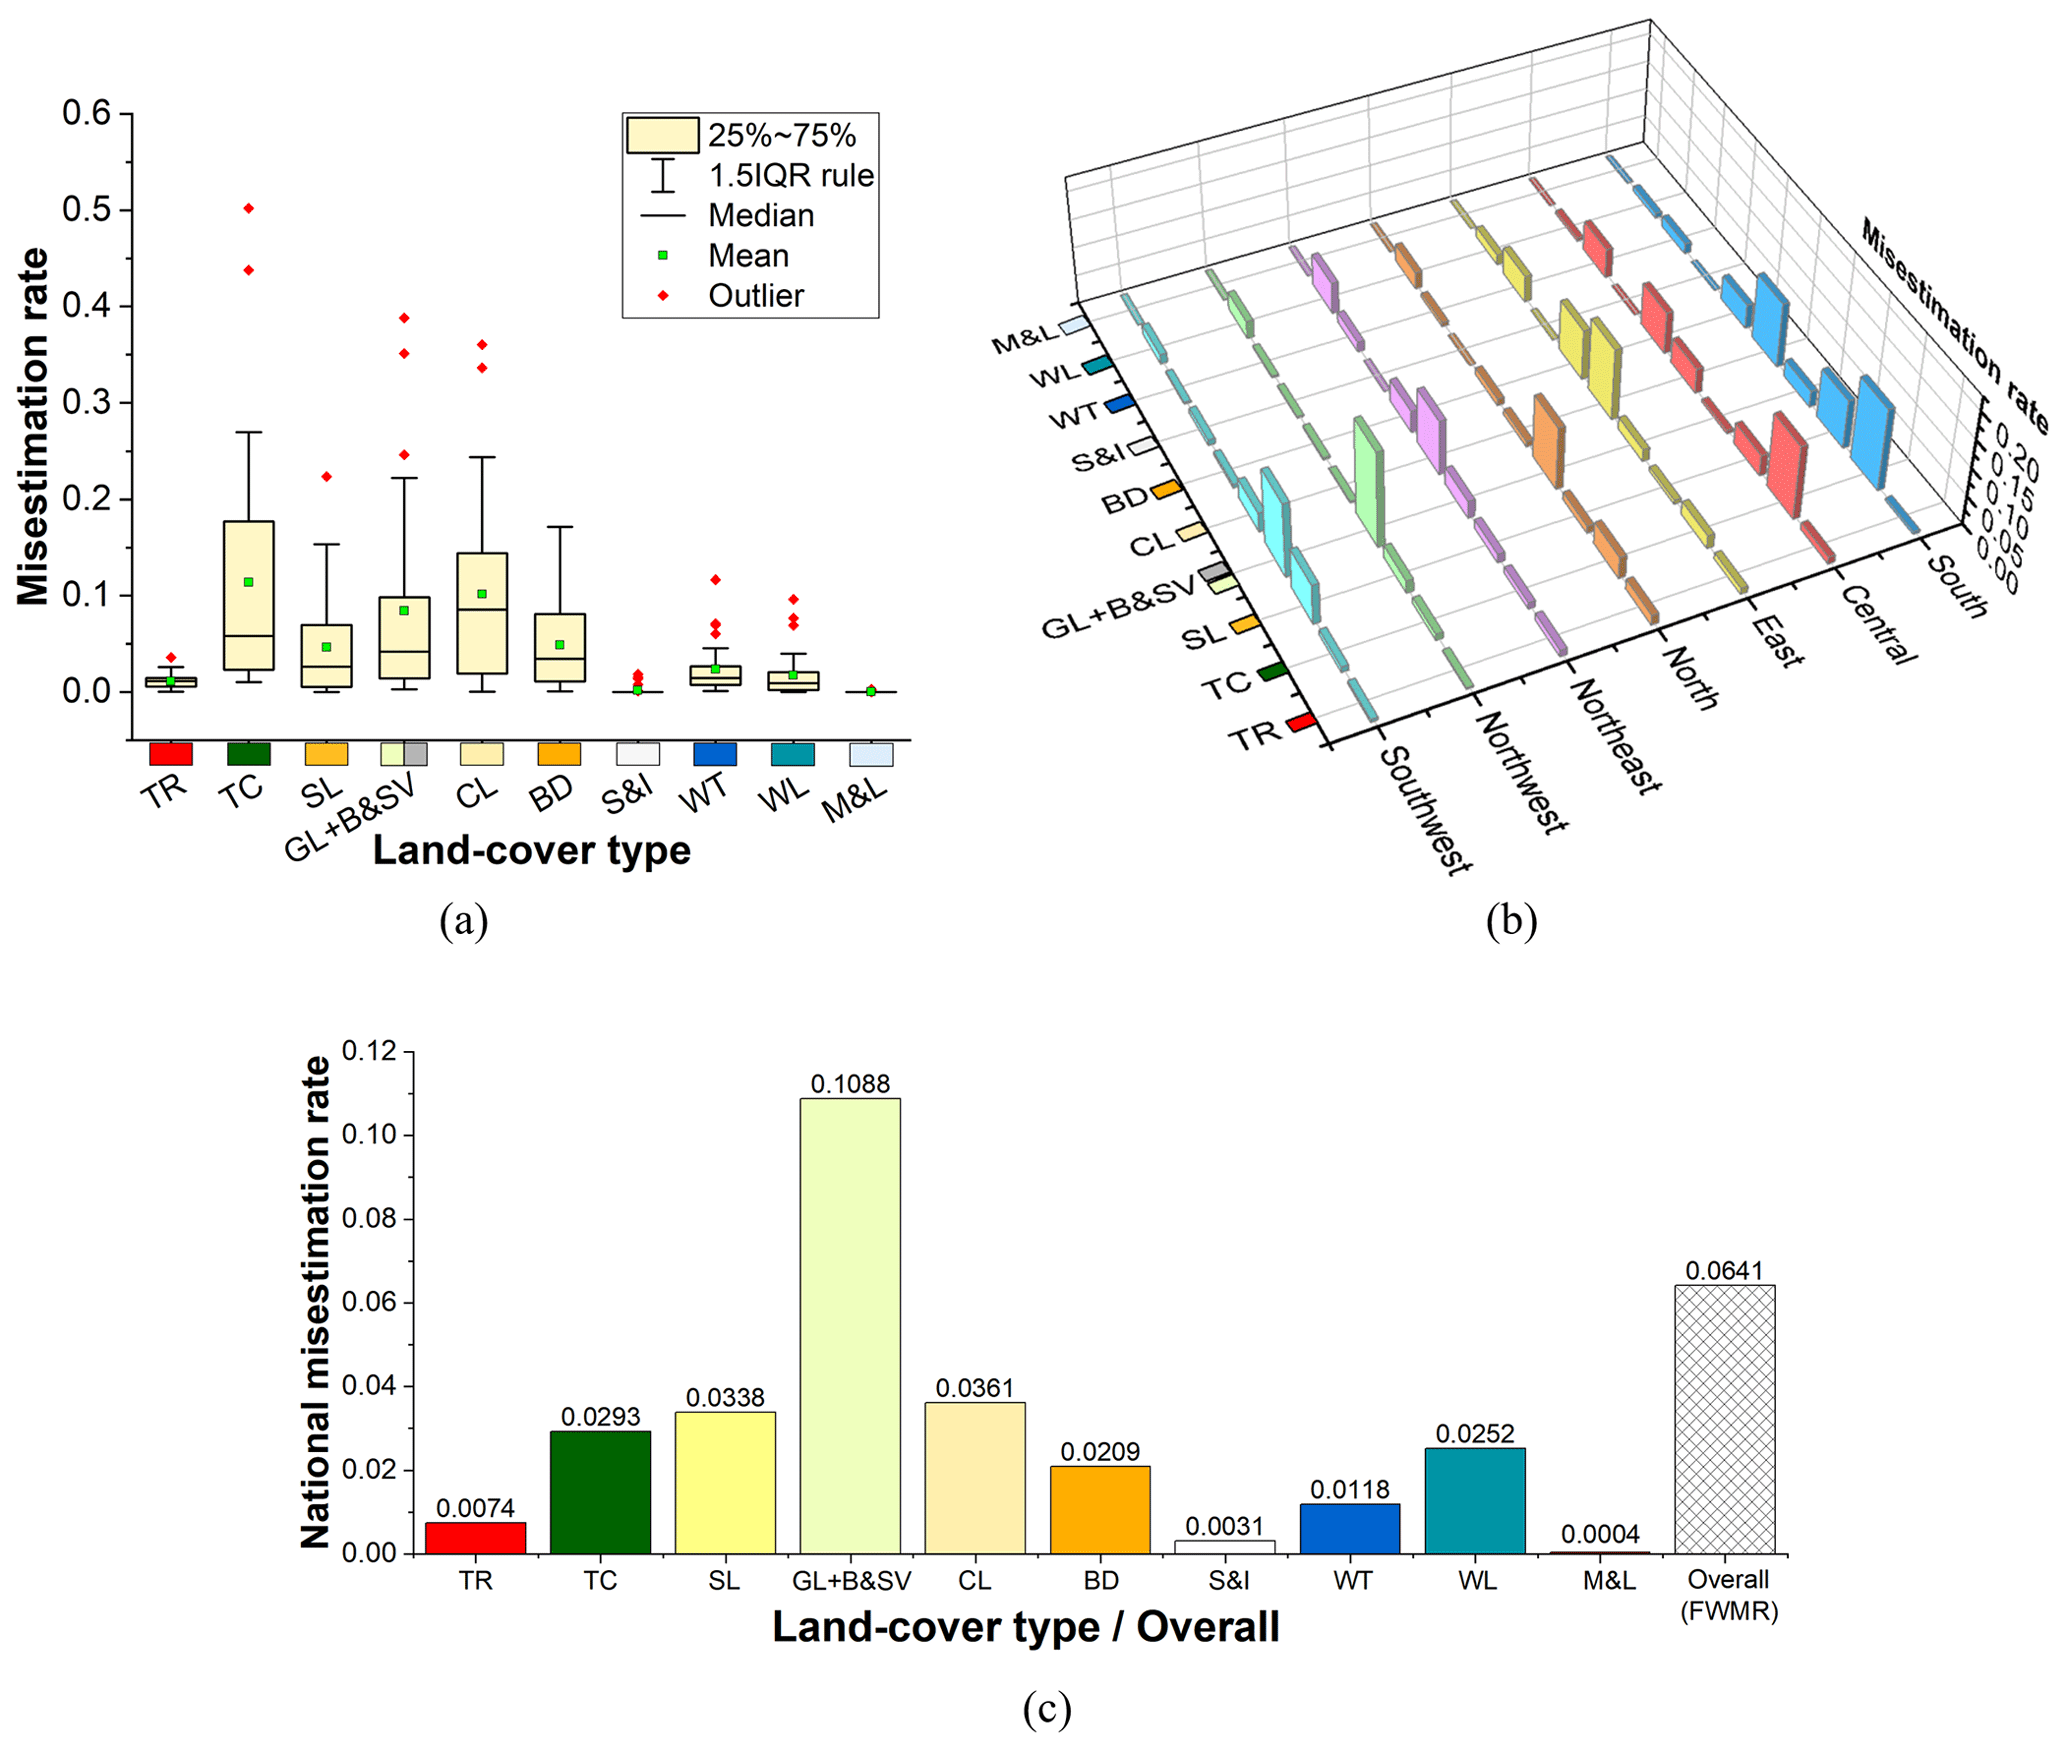
Figure 23Overall misestimation distributions for every land-cover type across China: (a) overall misestimation rate for every land-cover type for 31 provinces in China, (b) overall misestimation rate for every land-cover type for seven geographical regions, and (c) the national misestimation rate of every land-cover type across China.
Moreover, to measure the overall statistical performance of SinoLC-1, we calculated the frequency-weighted misestimation rate (FWMR) of SinoLC-1 to measure the overall proximity of SinoLC-1 with respect to the official survey reports. Formally, the FWMR is calculated by multiplying the misestimation rate of each land-cover type by their proportion shown in Fig. 7b and summing these values. The FWMR can be written as follows:
where c represents the land-cover types, counting from 1 to 11 (from Traffic route to Moss and lichen); pc represents the class proportion of the c land-cover type; and mc represents the misestimation rate of the c land-cover type. According to the results shown in Fig. 23c, the national misestimation rates of all land-cover types are under 11 %, and the overall FWMR is 6.4 %.
Overall, according to the official land resource survey data collected from the 3rd NLRS project, the reliability of the SinoLC-1 product was further validated from a statistical perspective. The 3rd NLRS data were published by the provincial administrative governments; thus, the comparisons of every land-cover type in 31 provincial administrative regions first indicate that the SinoLC-1 product is highly consistent with the official survey data in most of the provinces. Second, the overall performance of the SinoLC-1 at 31 provincial administrative regions and seven geographical regions was examined. The results indicate that the misestimation rate of the SinoLC-1 is generally acceptable with an overall FWMR of 6.4 %, and the main misestimated land-cover types are Grassland and Barren and sparse vegetation in northwestern and southwestern China.
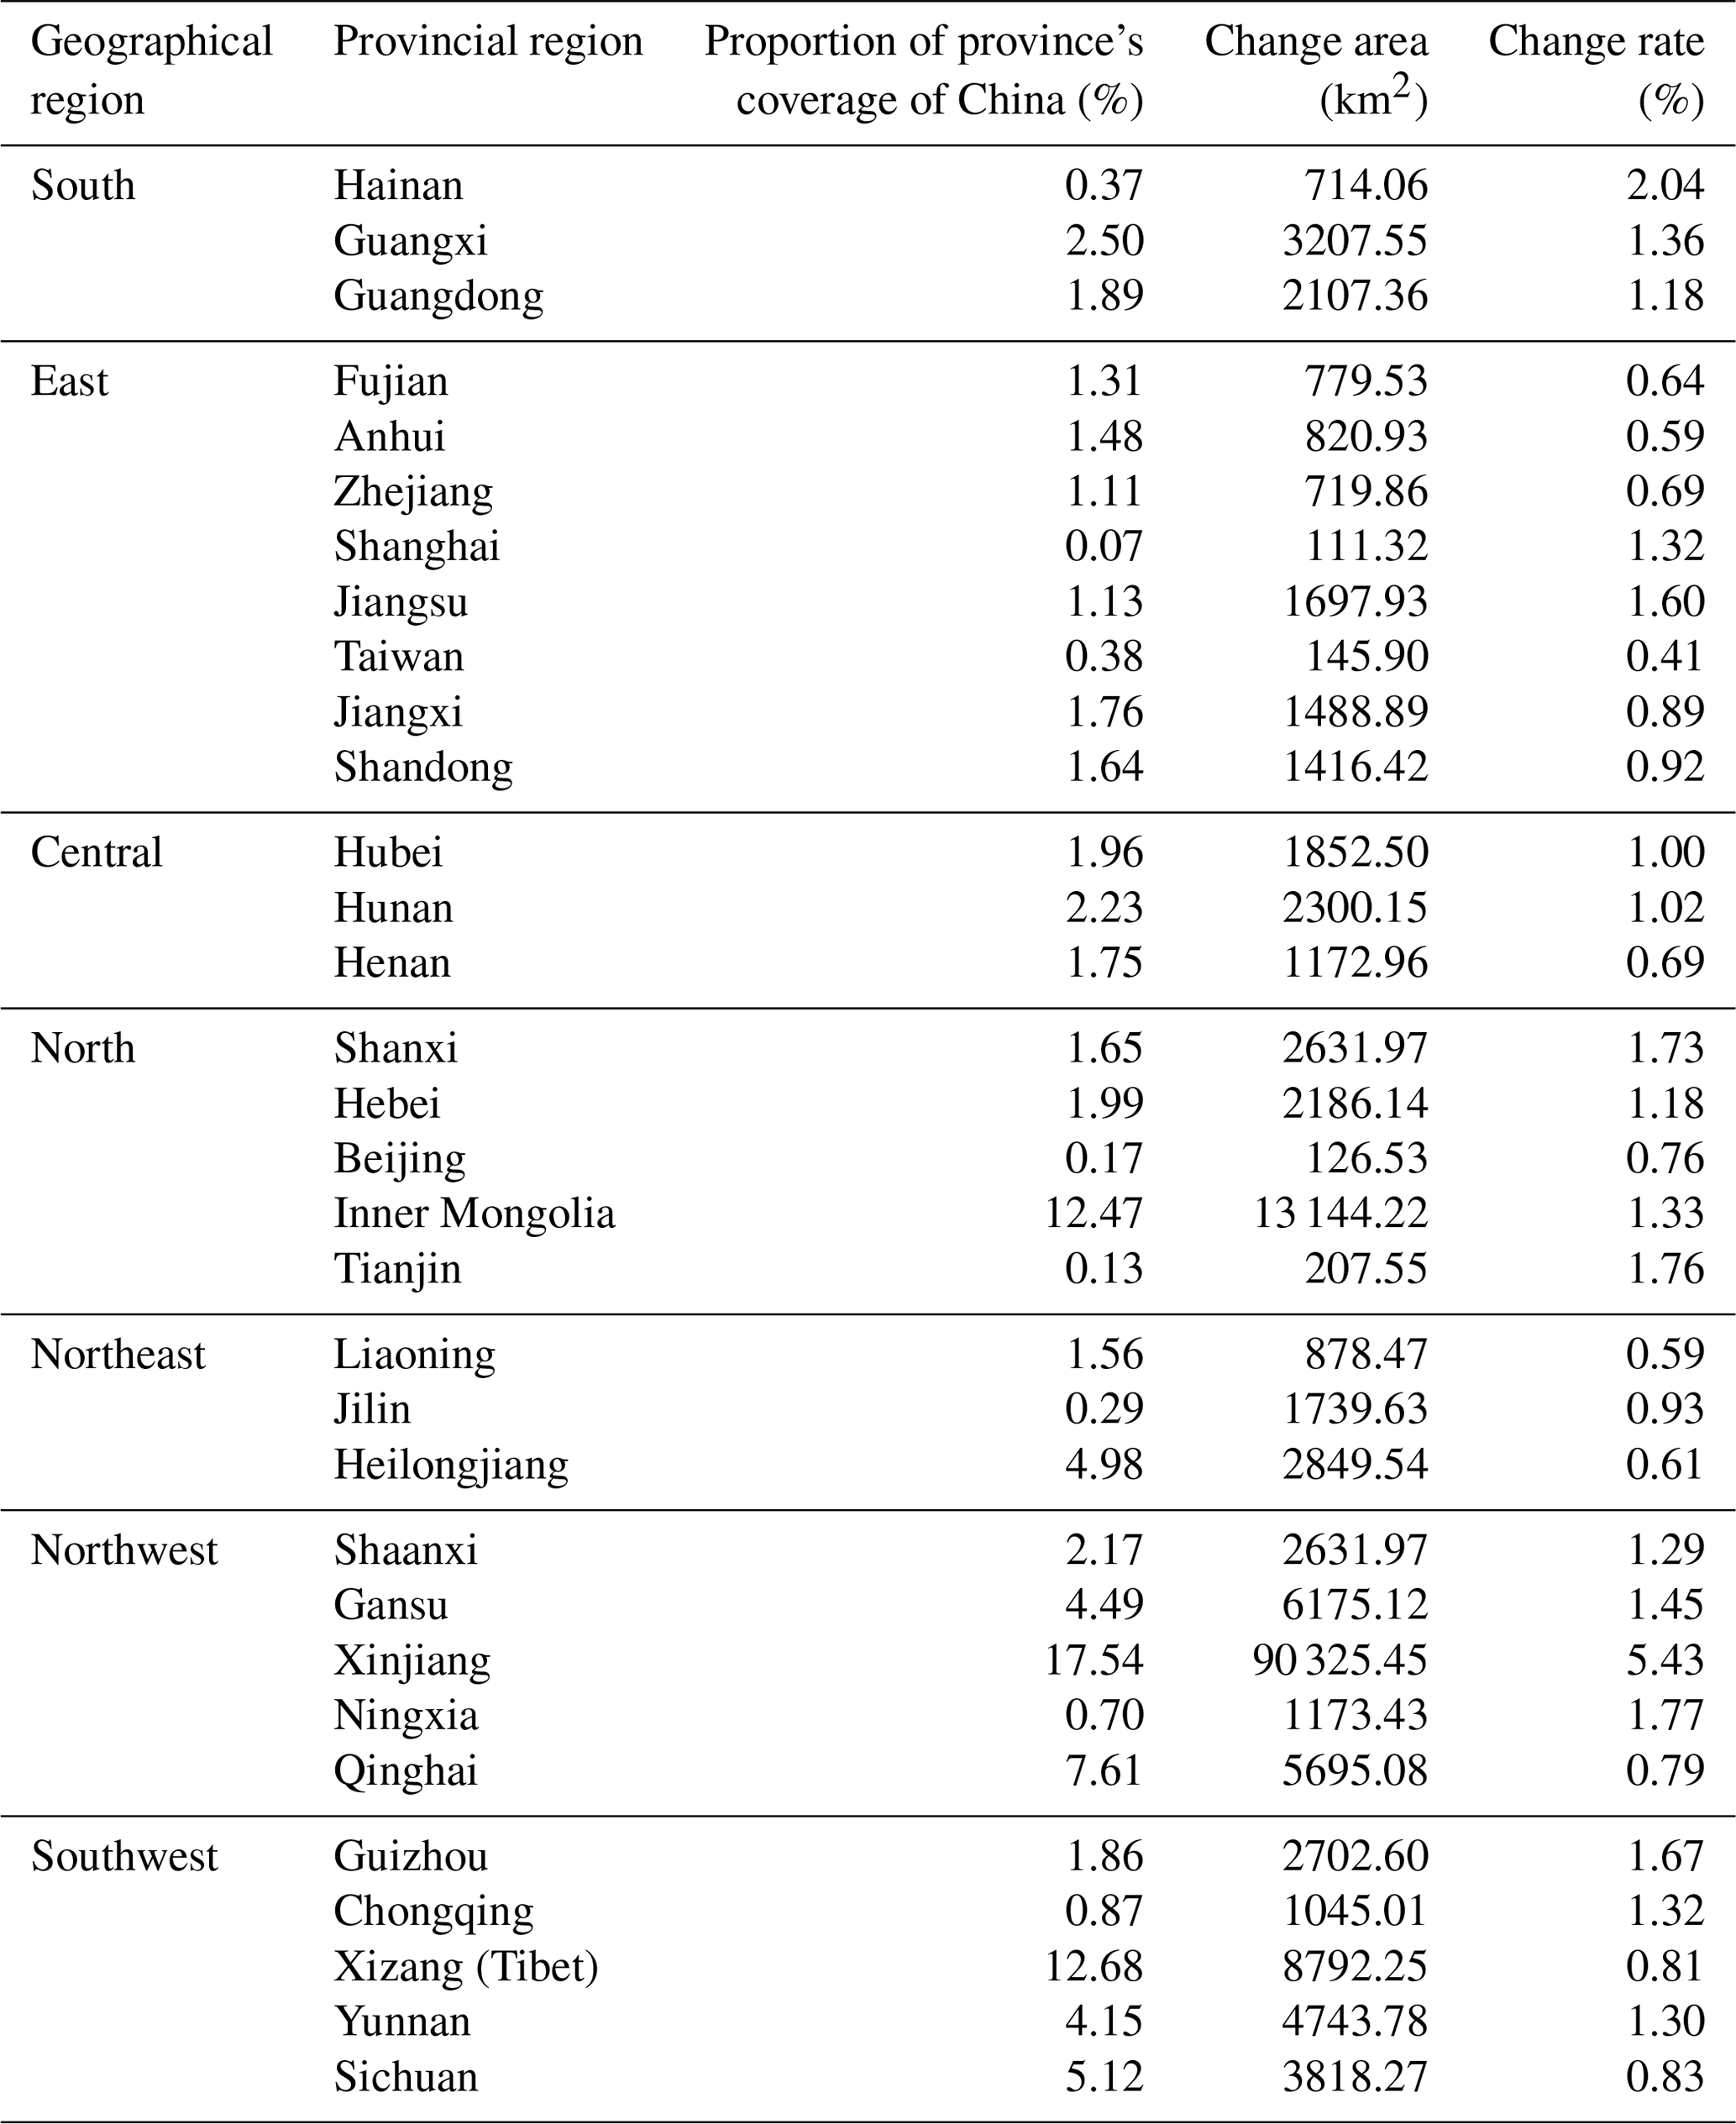
Table 8The provincial-scale land-cover change area and land-cover change rate (2011–2021) for China.
4.4 Uncertainty and limitations of the SinoLC-1 land-cover product
SinoLC-1 enables VHR land-cover monitoring over China using a deep-learning-based mapping framework with multisource open-access data. During the production of SinoLC-1, no manual annotation to create VHR-labeled data was required, and no commercial VHR image source was used. The general process maintained low capital expenditure and low labor costs. However, as a trade-off situation between the spatial and temporal resolution of the remote-sensing images, one of the major limitations in the production of SinoLC-1 was the uneven temporal coverage of Google Earth images. The Google Earth images were collected from different platforms at different time points to generate seamless images with large-scale coverage. Although Google Earth is a low-cost source to acquire VHR images with nationwide coverage, the uneven temporal coverage of the images can affect the uniformity of the land-cover products.
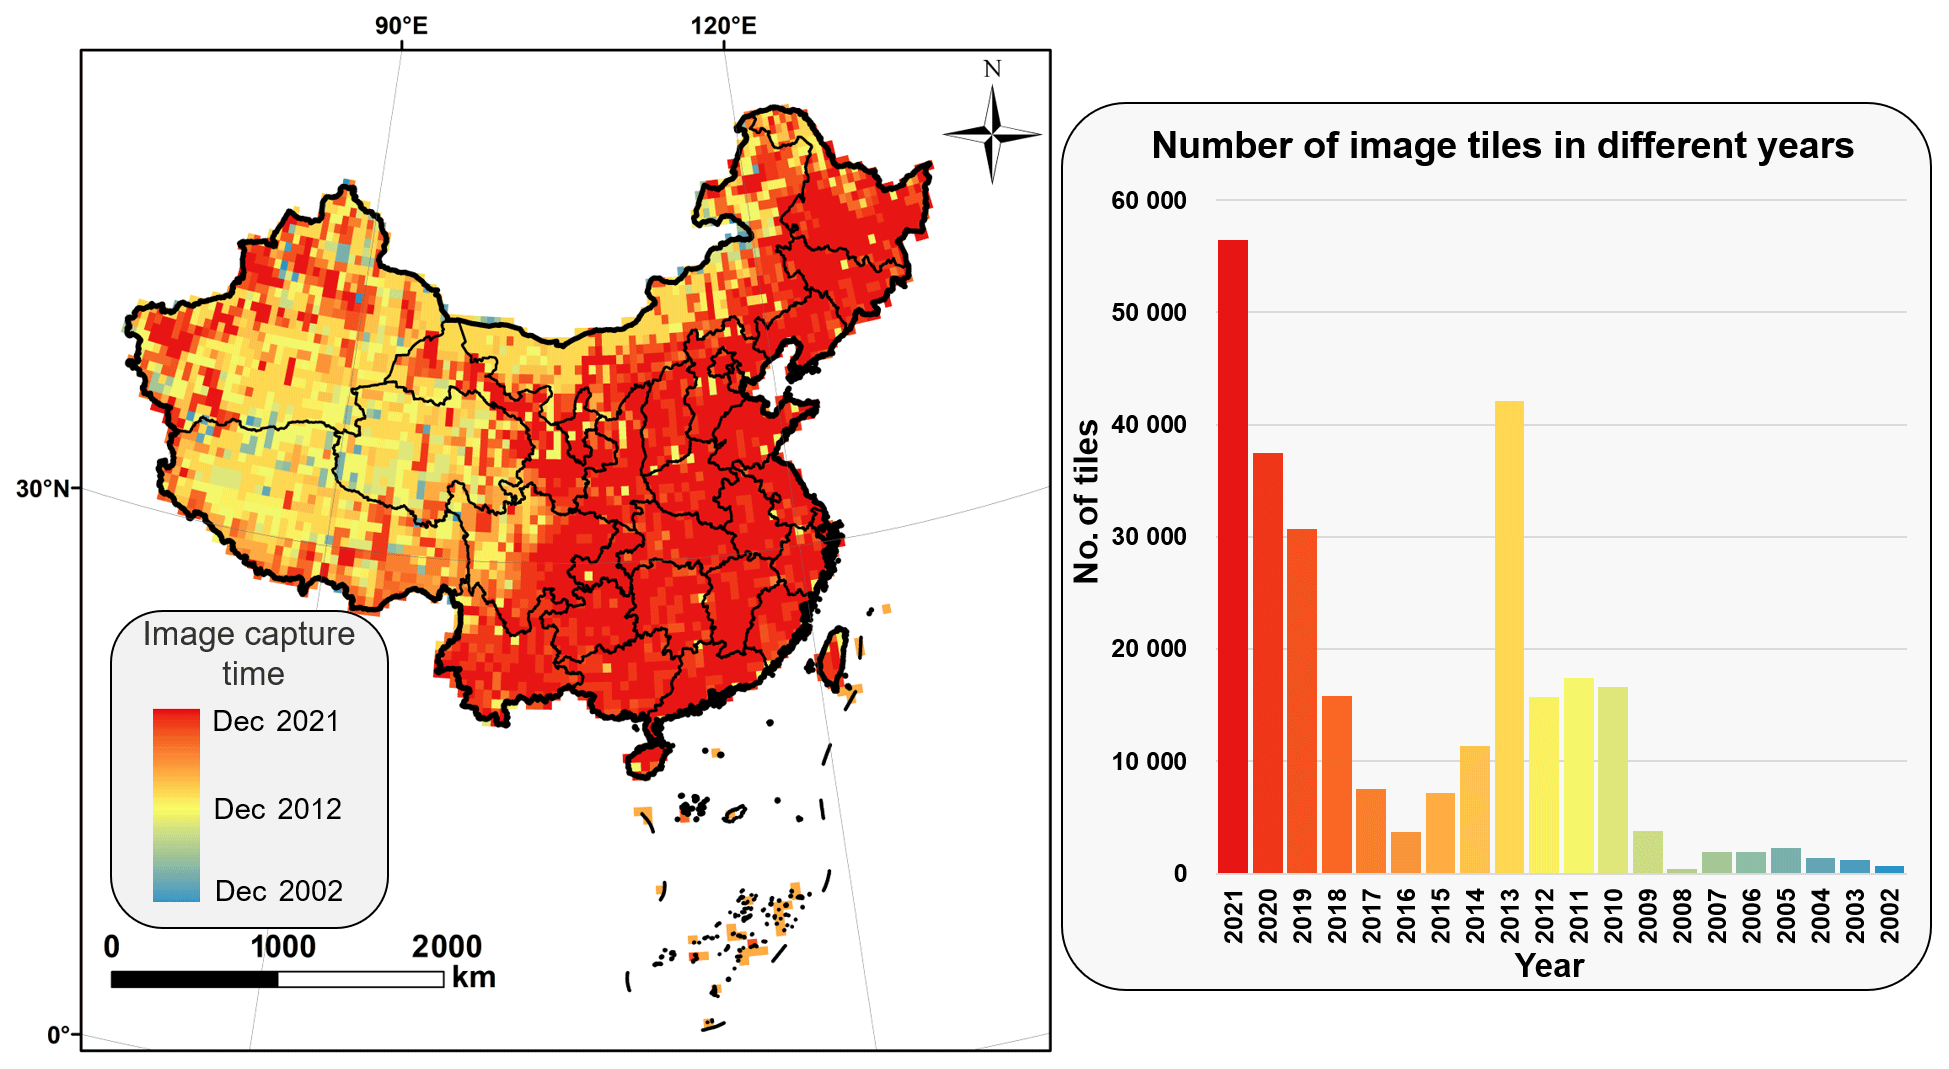
Figure 24Demonstration of the image capture time and the number of image tiles in different years.
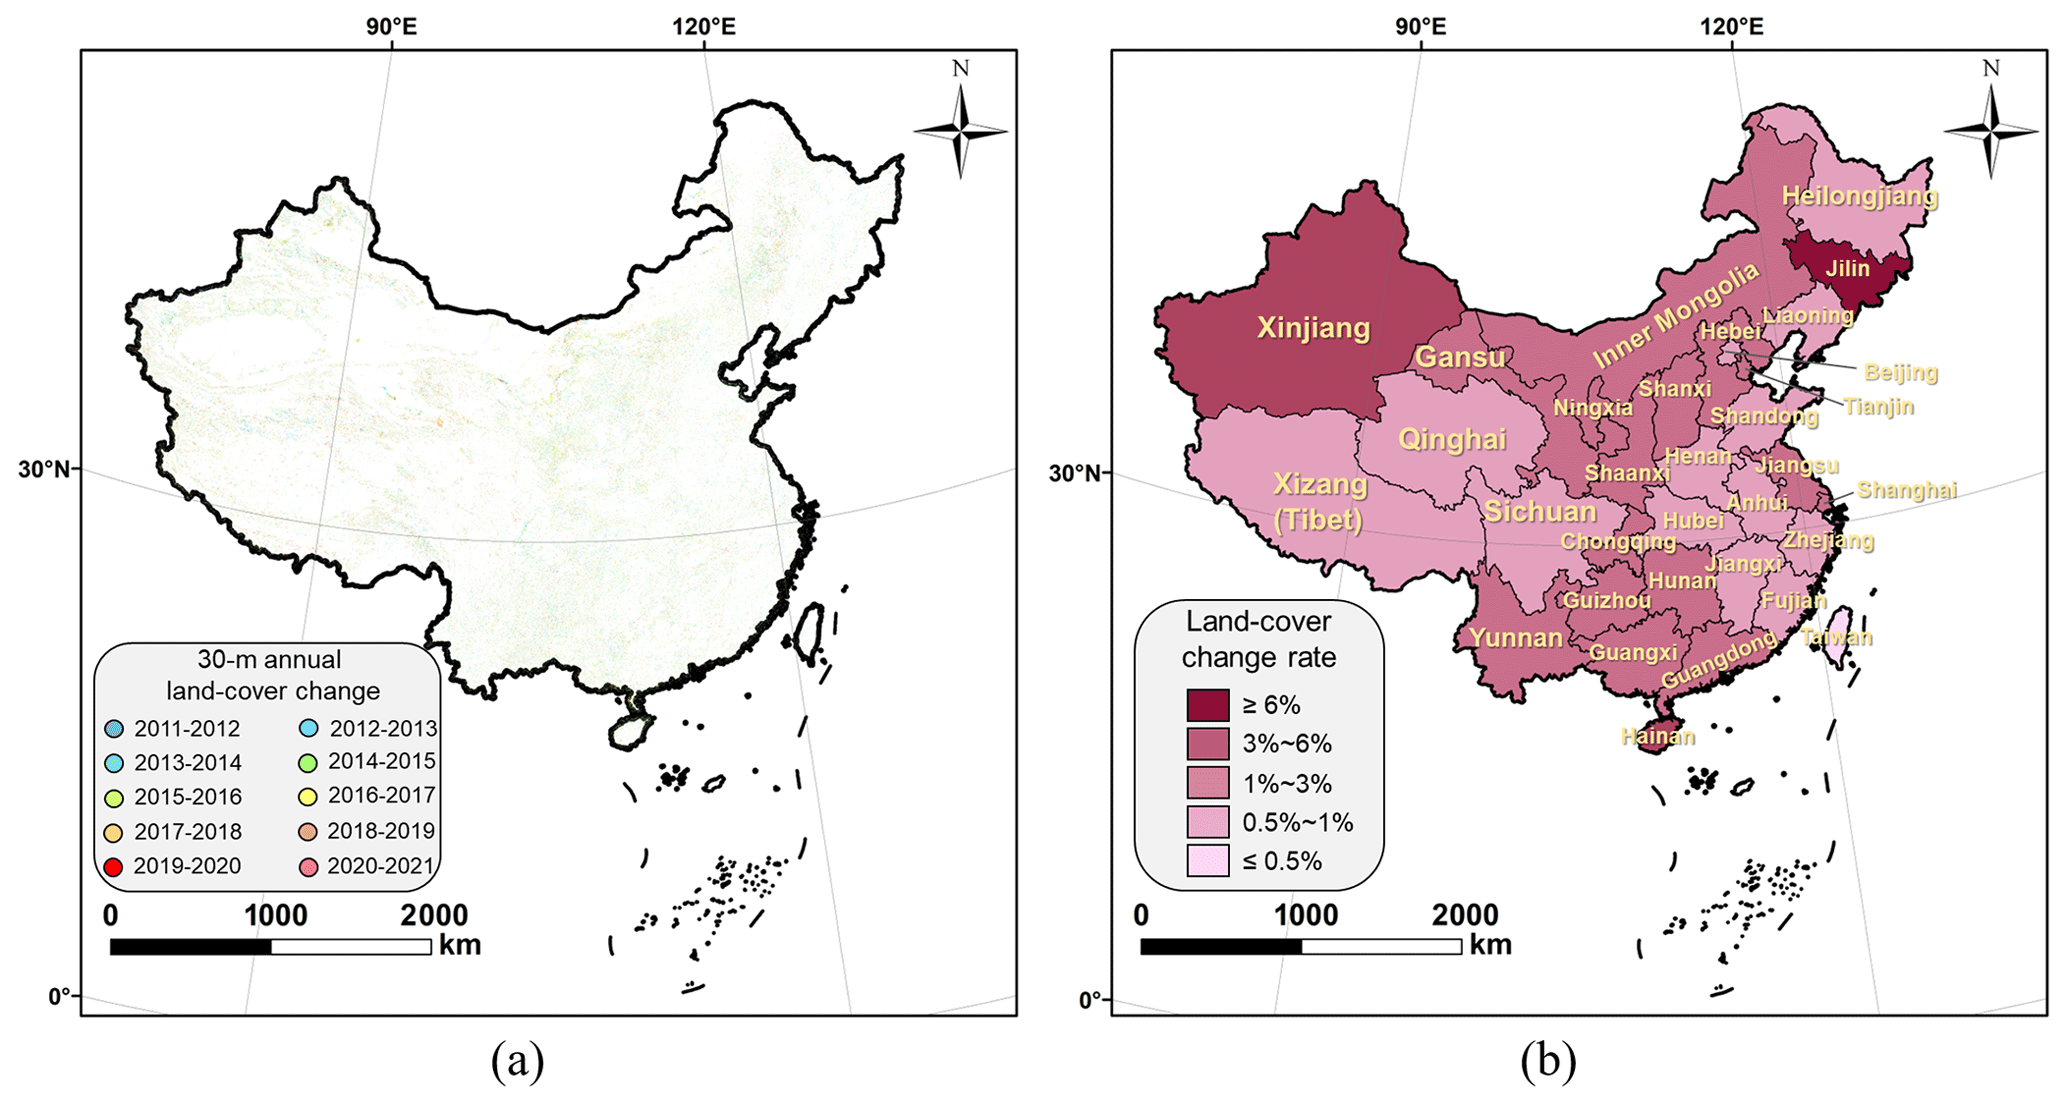
Figure 25Spatial distribution of 30 m land-cover change in China from 2011 to 2021: (a) the 30 m annual land-cover change in China from 2011 to 2021 and (b) the provincial-scale land-cover change rate (2011–2021) in China.
Figure 24 shows the spatial distribution of the image capture time and the number of image tiles captured in different years. Most of the images were acquired around the year 2021, and the early images with respect to capture time were mainly distributed on the northern land frontier and in the northwestern part of China. According to the DEM data shown in Fig. 9 and other published GLC products, the outdated images were generally in the west of China and are covered by plateau landforms (typically Grassland and Barren and sparse vegetation land-cover types). Furthermore, based on the 30 m annual land-cover datasets provided by Yang and Huang (2021), as shown in Fig. 25, we generated an annual land-cover change heatmap from 2011 to 2021 (the main time distributions of the used VHR images) and a provincial-scale land-cover change map to demonstrate the change rate in every provincial region. In Fig. 25a, the annual change heatmaps show that the land-cover change from 2011 to 2021 was relatively sparse. In Fig. 25b, the spatial distribution of the change areas shows that the most significant land-cover changes from 2011 to 2010 are located in the provinces in the south (e.g., Hainan, Guangdong, and Guangxi), north (e.g., Inner Mongolia, Shanxi, and Hebei), northeast (e.g., Jilin), and northwest (e.g., Xinjiang and Gansu). By combining the image capture times shown in Fig. 24, the outdated VHR images are most likely to cause uncertainty in the mapping results for the northern part of Inner Mongolia and Gansu (i.e., the northern border of China, with a change rate of 1 %–3 % from 2011 to 2021) and the southern part of Xinjiang (i.e., the Tarim Basin, with a change rate of 1 %–3 % from 2011 to 2021).
This distribution indicates that the areas containing a large number of outdated images generally had less land-cover change over the years (e.g., Tibet and Qinghai provinces of southwestern China, with a change rate lower than 1 %), which limited the uneven effect on the produced results. Furthermore, during the production of SinoLC-1, the land-cover information mostly came from the three 10 m GLC products, of which two (ESA_WorldCover v100 and Esri land cover) represented more recent (i.e., the year 2020) land-cover information, and the VHR optical images mainly provided the fine-edge and texture information of the land surface. Therefore, although the uneven temporal range of the VHR images can still cause uncertainty in the SinoLC-1 land-cover product, owing to the training strategy that reasonably utilized the texture information of images and land-cover information of the labels, the influence was minimized.
The SinoLC-1 land-cover product generated in this paper and corresponding user guidelines are available at https://doi.org/10.5281/zenodo.7707461 (Li et al., 2023). The product is grouped by city tiles in the GeoTIFF format; these tiles are packaged in provincial administrative region folders and stored as .zip files. Each city tile is named “G_P_C.tif”: “G” is the information on geographical region (south, central, east, north, northeast, northwest, or northeast of China), “P” is information on the provincial administrative region, and “C” is the city name. For example, the 1 m land-cover map for the city of Wuhan, Hubei Province, is named “Central_Hubei_Wuhan.tif”. Furthermore, each tile contains a land-cover label band ranging from 0 to 255, where the corresponding relationship between the value and the land-cover types is shown in Table 2 of Sect. 2.
A VHR (i.e., 1.07 m resolution) national-scale land-cover product for China, called SinoLC-1, was produced using a low-cost deep-learning-based L2H-Frame and multisource open-access data derived from three 10 m GLC products, OSM, and Google Earth imagery. In the L2H-Frame, reliable land-cover and traffic-route-labeled information was collected to generate the training labels, and VHR texture features were extracted from the 1 m images using the RP backbone. The resolution mismatch between the VHR prediction results and the coarse training labels was resolved using the CAS module and the L2H loss function with their weakly and self-supervised strategies.
The produced SinoLC1 dataset is the first 1 m resolution product and currently the highest-resolution land-cover product that covers all of China. Comprehensive comparisons with five other widely used products revealed that the SinoLC-1 product, with the highest spatial resolution, yielded the most accurate land-cover edges, indicating the finest landscape details. Moreover, with an additional Traffic route land-cover type, the SinoLC-1 product portrayed the details of dense city and urban patterns more precisely compared with other products. Quantitative assessments found that the validation results derived from over 100 000 samples indicate that SinoLC-1 achieved an OA of 73.61 % and a κ coefficient of 0.6595 across China. The validation results of every geographical region indicated an acceptable accuracy distribution across China. Furthermore, the statistical validation results indicated that SinoLC-1 conforms to the official survey reports with an overall misestimation rate of 6.4 % according to the government data. Overall, assessments and analysis in this paper suggested that the SinoLC-1 land-cover product accurately provided clear land-cover information and could become a vital support for downstream applications.
ZL and HZ designed the method. ZL and WH programmed the framework codes. ZL, MC, JH, and GY collected and annotated the validation sets. ZL wrote the original draft. HZ and WH reviewed the draft. HZ was responsible for project administration and funding acquisition.
The contact author has declared that none of the authors has any competing interests.
Publisher’s note: Copernicus Publications remains neutral with regard to jurisdictional claims made in the text, published maps, institutional affiliations, or any other geographical representation in this paper. While Copernicus Publications makes every effort to include appropriate place names, the final responsibility lies with the authors. Regarding the maps used in this paper, please note that Figs. 2, 3, 5, 6, 8, 9, 11, 17, 18, 22, 24, and 25 contain disputed territories.
The authors gratefully acknowledge the free access to the ESA_WorldCover v100 land-cover products provided by the European Space Agency, Esri land-cover products provided by Esri and IO, FROM_GLC products provided by Tsinghua University, traffic route information provided by the OSM, and VHR Google Earth images provided by Google.
This research has been supported by the National Key Research and Development Program of China (grant no. 2022YFB3903605), the National Natural Science Foundation of China (grant no. 42071322), and the Natural Science Foundation of Hubei Province (grant no. 2020CFA053).
This paper was edited by Hao Shi and reviewed by three anonymous referees.
Audebert, N., Le Saux, B., and Lefèvre, S.: Joint learning from earth observation and openstreetmap data to get faster better semantic maps, In Proceedings of the 2017 IEEE Conference on Computer Vision and Pattern Recognition Workshops, 21–26 July 2017, Honolulu, HI, USA, 67–75, https://doi.org/10.1109/CVPRW.2017.199, 2017.
Bartholomé, E. and Belward, A. S.: GLC2000: a new approach to global land cover mapping from Earth observation data, Int. J. Remote Sens., 26, 1959–1977, https://doi.org/10.1080/01431160412331291297, 2007.
Boguszewski, A., Batorski, D., Ziemba-Jankowska, N., Dziedzic, T., and Zambrzycka, A.: LandCover.ai: Dataset for Automatic Mapping of Buildings, Woodlands, Water and Roads from Aerial Imagery, In Proceedings of the 2022 IEEE/CVF Conference on Computer Vision and Pattern Recognition Workshops, 19–20 June 2022, New Orleans, LA, USA, 1102–1110, https://doi.org/10.1109/cvprw53098.2021.00121, 2020.
Cao, Y., and Huang, X.: A coarse-to-fine weakly supervised learning method for green plastic cover segmentation using high-resolution remote sensing images, ISPRS J. Photogramm. Remote Sens., 188, 157–176, https://doi.org/10.1016/j.isprsjprs.2022.04.012, 2022.
Chang, G. H. and Brada, J. C.: The paradox of China's growing under-urbanization, Econ. Syst., 30, 24–40, https://doi.org/10.1016/j.ecosys.2005.07.002, 2006.
Chen, J., Chen, J., Liao, A., Cao, X., Chen, L., Chen, X., He, C., Han, G., Peng, S., Lu, M., Zhang, W., Tong, X., and Mills, J.: Global land cover mapping at 30 m resolution: A POK-based operational approach, ISPRS J. Photogramm. Remote Sens., 103, 7–27, https://doi.org/10.1016/j.isprsjprs.2014.09.002, 2015.
Coltri, P. P., Zullo, J., Gonçalves, R. R. do V., Romani, L. A. S., and Pinto, H. S.: Coffee Crop's Biomass and Carbon Stock Estimation With Usage of High Resolution Satellites Images, IEEE J. Sel. Topics Appl. Earth Observ. Remote Sens., 6, 1786–1795, https://doi.org/10.1109/JSTARS.2013.2262767, 2013.
Defourny, P., Vancutsem, C., Bicheron, C., Brockmann, F., Nino, L., Schouten, and Leroy, M.: GLOBECOVER: a 300 m global land cover product for 2005 using Envisat MERIS time series, in: Proceedings of ISPRS Commission VII Mid-Term Symposium: Remote Sensing: from Pixels to Processes, Ensched, the Netherlands, May 2006, 8–11, https://citeseerx.ist.psu.edu/document?repid=rep1&type=pdf&doi=abeb2ddafabe2b945a9b3d425e68606c2bd92c70 (last access: 4 October 2023), 2007.
Du, S., Du, S., Liu, B., Zhang, X., and Zheng, Z.: Large-scale urban functional zone mapping by integrating remote sensing images and open social data, GISci. Remote Sens., 57, 411–430, https://doi.org/10.1080/15481603.2020.1724707, 2020.
Feng, M. and Li, X.: Land cover mapping toward finer scales, Sci. Bulletin, 65, 1604–1606, https://doi.org/10.1016/j.scib.2020.06.014, 2020.
Foody, G. M. and Mathur, A.: Toward intelligent training of supervised image classifications: directing training data acquisition for SVM classification, Remote Sens. Environ., 93, 107–117, https://doi.org/10.1016/j.rse.2004.06.017, 2004.
Friedl, M. A., Sulla-menashe, D., Tan, B., Schneider, A., Ramankutty, N., Sibley, A., and Huang, X.: Remote Sensing of Environment MODIS Collection 5 global land cover: Algorithm re fi nements and characterization of new datasets, Remote Sens. Environ., 114, 168–182, https://doi.org/10.1016/j.rse.2009.08.016, 2010.
Gómez, C., White, J. C., and Wulder, M. A.: Optical remotely sensed time series data for land cover classification: A review, ISPRS J. Photogramm. Remote Sens., 116, 55–72, https://doi.org/10.1016/j.isprsjprs.2016.03.008, 2016.
Gong, P., Wang, J., Yu, L., Zhao, Y., Zhao, Y., Liang, L., Yu, L., Wang, L., Liu, X., Shi, T., Zhu, M., Chen, Y., Yang, G., Tang, P., Xu, B., Giri, C., Clinton, N., Zhu, Z., Chen, J., and Chen, J.: Finer resolution observation and monitoring of global land cover: first mapping results with Landsat TM and ETM + data, Int. J. Remote Sens., 34, 2607–2654, https://doi.org/10.1080/01431161.2012.748992, 2013.
Gong, P., Li, X., and Zhang, W.: 40-Year (1978–2017) human settlement changes in China reflected by impervious surfaces from satellite remote sensing, Sci. Bulletin, 64, 756–763, https://doi.org/10.1016/j.scib.2019.04.024, 2019a.
Gong, P., Liu, H., Zhang, M., Li, C., Wang, J., Huang, H., Clinton, N., Ji, L., Li, W., Bai, Y., Chen, B., Xu, B., Zhu, Z., and Yuan, C.: Stable classification with limited sample: transferring a 30 m resolution sample set collected in 2015 to mapping 10 m resolution global land cover in 2017, Sci. Bulletin, 64, 370–373, https://doi.org/10.1016/j.scib.2019.03.002, 2019b.
Griffiths, P., Nendel, C., and Hostert, P.: Intra-annual reflectance composites from Sentinel-2 and Landsat for national-scale crop and land cover mapping, Remote Sens. Environ., 220, 135–151, https://doi.org/10.1016/j.rse.2018.10.031, 2019.
Guan, X., Wei, H., Lu, S., Dai, Q., and Su, H.: Assessment on the urbanization strategy in China: Achievements, challenges and reflections, Habitat Int., 71, 97–109, 2018.
Guo, Z., Shao, X., Xu, Y., Miyazaki, H., Ohira, W., and Shibasaki, R.: Identification of village building via Google Earth images and supervised machine learning methods, Remote Sens., 8, 271, https://doi.org/10.3390/rs8040271, 2016.
Hu, J., Liu, R., Hong, D., Camero, A., Yao, J., Schneider, M., Kurz, F., Segl, K., and Zhu, X. X.: MDAS: a new multimodal benchmark dataset for remote sensing, Earth Syst. Sci. Data, 15, 113–131, https://doi.org/10.5194/essd-15-113-2023, 2023.
Huang, X., Wang, Y., Li, J., Chang, X., Cao, Y., Xie, J., and Gong, J.: High-resolution urban land-cover mapping and landscape analysis of the 42 major cities in China using ZY-3 satellite images, Sci. Bulletin, 65, 1039–1048, https://doi.org/10.1016/j.scib.2020.03.003, 2020.
Jalan, S.: Exploring the potential of object based image analysis for mapping urban land cover, J. Indian Soc. Remote, 40, 507–518, 2012.
Karra, K., Kontgis, C., Statman-weil, Z., Mazzariello, J. C., Mathis, M., and Steven, P.: Global land use/land cover with Sentinel 2 and deep learning, in: 2021 IEEE International Geoscience and Remote Sensing Symposium (IGARSS), Brusseles, Belgium, 11–16 July 2021, 4704–4707, https://doi.org/10.1109/IGARSS47720.2021.9553499, 2021.
Li, W., Dong, R., Fu, H., Wang, J., Yu, L., and Gong, P.: Integrating Google Earth imagery with Landsat data to improve 30 m resolution land cover mapping, Remote Sens. Environ., 237, 111563, https://doi.org/10.1016/j.rse.2019.111563, 2020.
Li, Z., Lu, F., Zhang, H., Yang, G., and Zhang, L.: Change cross-detection based on label improvements and multi-model fusion for multi-temporal remote sensing images, in: 2021 IEEE International Geoscience and Remote Sensing Symposium (IGARSS), Brusseles, Belgium, 11–16 July 2021, 2054–2057, https://doi.org/10.1109/IGARSS47720.2021.9553120, 2021.
Li, Z., Zou, J., Lu, F., and Zhang, H.: Multi-Stage Pseudo-Label Iteration Framework for Semi-Supervised Land-Cover Mapping, in: 2022 IEEE International Geoscience and Remote Sensing Symposium (IGARSS), 4607–4610, https://doi.org/10.1109/IGARSS46834.2022.9884345, 2022a.
Li, Z., Lu, F., Zhang, H., Tu, L., Li, J., Huang, X., Robinson, C., Malkin, N., Jojic, N., Ghamisi, P., Hansch, R., and Yokoya, N.: The Outcome of the 2021 IEEE GRSS Data Fusion Contest – Track MSD: Multitemporal Semantic Change Detection, IEEE J. Sel. Topics Appl. Earth Observ. Remote Sens., 15, 1643–1655, https://doi.org/10.1109/JSTARS.2022.3144318, 2022b.
Li, Z., Zhang, H., Lu, F., Xue, R., Yang, G., and Zhang, L.: Breaking the resolution barrier: A low-to-high network for large-scale high-resolution land-cover mapping using low-resolution labels, ISPRS J. Photogramm. Remote Sens., 192, 244–267, https://doi.org/10.1016/j.isprsjprs.2022.08.008, 2022c.
Li, Z., Zhang, H., He, W., Chen, M., Hu, J., An, X., Yan, H., and Yang, G.: SinoLC-1: the first 1 m resolution national-scale land-cover map of China created with the deep learning framework and open-access data, Zenodo [data set], https://doi.org/10.5281/zenodo.7707461, 2023.
Liang-Chieh, C., Zhu, Y., Papandreou, G., Schroff, F., and Hartwig, A.: Encoder-Decoder with Atrous Separable Convolution for Semantic Image Segmentation, Proc. Eur. Conf. Comput. Vis., 34, 137–143, 2018.
Lin, G. C. S.: The growth and structural change of Chinese cities: a contextual and geographic analysis, Cities, 19, 299–316, https://doi.org/10.1016/S0264-2751(02)00039-2, 2002.
Lin, G. C. S. and Ho, S. P. S.: China's land resources and land-use change: Insights from the 1996 land survey, Land Use Policy, 20, 87–107, https://doi.org/10.1016/S0264-8377(03)00007-3, 2003.
Liu, J., Kuang, W., Zhang, Z., Xu, X., Qin, Y., Ning, J., Zhou, W., Zhang, S., Li, R., and Yan, C.: Spatiotemporal characteristics, patterns, and causes of land-use changes in China since the late 1980s, J. Geogr. Sci., 24, 195–210, 2014.
Liu, L., Gao, Y., Zhang, X., Chen, X., and Xie, S.: A Dataset of Global Land Cover Validation Samples, Zenodo [data set], https://doi.org/10.5281/ZENODO.3551995, 2019.
Liu, T., Liu, H., and Qi, Y.: Construction land expansion and cultivated land protection in urbanizing China: Insights from national land surveys, 1996–2006, Habitat Int., 46, 13–22, https://doi.org/10.1016/j.habitatint.2014.10.019, 2015.
Liu, Y., Zhong, Y., Ma, A., Zhao, J., and Zhang, L.: Cross-resolution national-scale land-cover mapping based on noisy label learning: A case study of China, Int. J. Appl. Earth Obs., 118, 103265, https://doi.org/10.1016/j.jag.2023.103265, 2023.
Loveland, T. R., Reed, B. C., Brown, J. F., Ohlen, D. O., Zhu, Z., and Yang, L.: Development of a global land cover characteristics database and IGBP DISCover from 1 km AVHRR data, Int. J. Remote Sens., 21, 1303–1330, https://doi.org/10.1080/014311600210191, 2010.
Luo, M. and Ji, S.: Cross-spatiotemporal land-cover classification from VHR remote sensing images with deep learning based domain adaptation, ISPRS J. Photogramm. Remote Sens., 191, 105–128, https://doi.org/10.1016/j.isprsjprs.2022.07.011, 2022.
Ma, A., Chen, D., Zhong, Y., Zheng, Z., and Zhang, L.: National-scale greenhouse mapping for high spatial resolution remote sensing imagery using a dense object dual-task deep learning framework: A case study of China, ISPRS J. Photogramm. Remote Sens., 181, 279–294, https://doi.org/10.1016/j.isprsjprs.2021.08.024, 2021.
Malarvizhi, K., Kumar, S. V., and Porchelvan, P.: Use of high resolution Google Earth satellite imagery in landuse map preparation for urban related applications, Proc. Tech., 24, 1835–1842, 2016.
Morton, R. D., Marston, C. G., O'Neil, A. W., and Rowland, C. S.: Land Cover Map 2020 (10 m classified pixels, GB), NERC EDS Environmental Information Data Centre [data set], https://doi.org/10.5285/35c7d0e5-1121-4381-9940-75f7673c98f7, 2021.
Ning, Y., Liu, S., Zhao, S., Liu, M., Gao, H., and Gong, P.: Urban growth rates, trajectories, and multi-dimensional disparities in China, Cities, 126, 103717, https://doi.org/10.1016/j.cities.2022.103717, 2022.
Olofsson, P., Foody, G. M., Stehman, S. V, and Woodcock, C. E.: Making better use of accuracy data in land change studies: Estimating accuracy and area and quantifying uncertainty using stratified estimation, Remote Sens. Environ., 129, 122–131, https://doi.org/10.1016/j.rse.2012.10.031, 2013.
Olofsson, P., Foody, G. M., Herold, M., Stehman, S. V, Woodcock, C. E., and Wulder, M. A.: Good practices for estimating area and assessing accuracy of land change, Remote Sens. Environ., 148, 42–57, https://doi.org/10.1016/j.rse.2014.02.015, 2014.
Osses, M., Rojas, N., Ibarra, C., Valdebenito, V., Laengle, I., Pantoja, N., Osses, D., Basoa, K., Tolvett, S., Huneeus, N., Gallardo, L., and Gómez, B.: High-resolution spatial-distribution maps of road transport exhaust emissions in Chile, 1990–2020, Earth Syst. Sci. Data, 14, 1359–1376, https://doi.org/10.5194/essd-14-1359-2022, 2022.
Otsu, N.: A threshold selection method from gray-level histograms, IEEE T. Syst. Man. Cyb., 9, 62–66, 1979.
Pengra, B., Long, J., Dahal, D., Stehman, S. V., and Loveland, T. R.: A global reference database from very high resolution commercial satellite data and methodology for application to Landsat derived 30 m continuous field tree cover data, Remote Sens. Environ., 165, 234–248, https://doi.org/10.1016/j.rse.2015.01.018, 2015.
Pilant, A., Endres, K., Rosenbaum, D., and Gundersen, G.: US EPA EnviroAtlas Meter-Scale Urban Land Cover (MULC): 1-m Pixel Land Cover Class Definitions and Guidance, Remote Sens., 12, 1909, https://doi.org/10.3390/rs12121909, 2020.
Pulighe, G., Baiocchi, V., and Lupia, F.: Horizontal accuracy assessment of very high resolution Google Earth images in the city of Rome, Italy, Int. J. Digit. Earth, 9, 342–362, 2016.
Rahman, A., Aggarwal, S. P., Netzband, M., and Fazal, S.: Monitoring urban sprawl using remote sensing and GIS techniques of a fast growing urban centre, India, IEEE J. Sel. Topics Appl. Earth Observ. Remote Sens., 4, 56–64, 2010.
Ronneberger, O., Fischer, P., and Brox, T.: U-Net: Convolutional Networks for Biomedical Image Segmentation, in: Proc. Int. Conf. Med. Image Comput. Comput.-Assisted Intervention, Munich, Germany, 5–9 October 2015, 234–241, https://doi.org/10.1007/978-3-319-24574-4, 2015.
Roy, D. P., Huang, H., Houborg, R., and Martins, V. S.: A global analysis of the temporal availability of PlanetScope high spatial resolution multi-spectral imagery, Remote Sens. Environ., 264, 112586, https://doi.org/10.1016/j.rse.2021.112586, 2021.
Song, W. and Deng, X.: Land-use/land-cover change and ecosystem service provision in China, Sci. Total Environ., 576, 705–719, https://doi.org/10.1016/j.scitotenv.2016.07.078, 2017.
Srivastava, S., Vargas-Muñoz, J. E., and Tuia, D.: Understanding urban landuse from the above and ground perspectives: A deep learning, multimodal solution, Remote Sens. Environ., 228, 129–143, https://doi.org/10.1016/j.rse.2019.04.014, 2019.
Tong, X.-Y., Xia, G.-S., Lu, Q., Shen, H., Li, S., You, S., and Zhang, L.: Land-cover classification with high-resolution remote sensing images using transferable deep models, Remote Sens. Environ., 237, 111322, https://doi.org/10.1016/j.rse.2019.111322, 2020.
Van De Kerchove, R., Zanaga, D., Keersmaecker, W., Souverijns, N., Wevers, J., Brockmann, C., Grosu, A., Paccini, A., Cartus, O., and Santoro, M.: ESA WorldCover: Global land cover mapping at 10 m resolution for 2020 based on Sentinel-1 and 2 data, AGU Fall Meeting Abstracts, 2021, GC45I-0915, https://ui.adsabs.harvard.edu/abs/2021AGUFMGC45I0915V (last access: 4 October 2023), 2021.
Wang, J., Zheng, Z., Lu, X., and Zhong, Y.: LoveDA: A Remote Sensing Land-Cover Dataset for Domain Adaptive Semantic Segmentation, arXiv [preprint], https://doi.org/10.48550/arXiv.2110.08733, 2021.
Wang, J., Ma, A., Zhong, Y., Zheng, Z., and Zhang, L.: Cross-sensor domain adaptation for high spatial resolution urban land-cover mapping: From airborne to spaceborne imagery, Remote Sens. Environ., 277, 113058, https://doi.org/10.1016/j.rse.2022.113058, 2022.
Wickham, J., Stehman, S. V, Sorenson, D. G., Gass, L., and Dewitz, J. A.: Thematic accuracy assessment of the NLCD 2016 land cover for the conterminous United States, Remote Sens. Environ., 257, 112357, https://doi.org/10.1016/j.rse.2021.112357, 2021.
Xia, J., Yokoya, N., Adriano, B., and Broni-Bediako, C.: OpenEarthMap: A Benchmark Dataset for Global High-Resolution Land Cover Mapping, in: Proceedings of the IEEE/CVF Winter Conference on Applications of Computer Vision, Waikoloa, HI, USA, 2–7 January 2023, 6254–6264, https://doi.org/10.1109/WACV56688.2023.00619, 2023.
Yang, J. and Huang, X.: The 30 m annual land cover dataset and its dynamics in China from 1990 to 2019, Earth Syst. Sci. Data, 13, 3907–3925, https://doi.org/10.5194/essd-13-3907-2021, 2021.
Yang, Y., Wu, T., Wang, S., and Li, H.: Fractional evergreen forest cover mapping by MODIS time-series FEVC-CV methods at sub-pixel scales, ISPRS J. Photogramm. Remote Sens., 163, 272–283, https://doi.org/10.1016/j.isprsjprs.2020.03.012, 2020.
Yue, T. X., Fan, Z. M., and Liu, J. Y.: Scenarios of land cover in China, Global Planet. Change, 55, 317–342, https://doi.org/10.1016/j.gloplacha.2006.10.002, 2007.
Zhang, C., Sargent, I., Pan, X., Li, H., Gardiner, A., Hare, J., and Atkinson, P. M.: An object-based convolutional neural network (OCNN) for urban land use classification, Remote Sens. Environ., 216, 57–70, https://doi.org/10.1016/j.rse.2018.06.034, 2018.
Zhang, C., Yue, P., Tapete, D., Jiang, L., Shangguan, B., Huang, L., and Liu, G.: A deeply supervised image fusion network for change detection in high resolution bi-temporal remote sensing images, ISPRS J. Photogramm. Remote Sens., 166, 183–200, https://doi.org/10.1016/j.isprsjprs.2020.06.003, 2020.
Zhang, J. and Zhang, Y.: Remote sensing research issues of the National Land Use Change Program of China, ISPRS J. Photogramm. Remote Sens., 62, 461–472, https://doi.org/10.1016/j.isprsjprs.2007.07.002, 2007.
Zhang, X., Liu, L., Chen, X., Gao, Y., Xie, S., and Mi, J.: GLC_FCS30: global land-cover product with fine classification system at 30 m using time-series Landsat imagery, Earth Syst. Sci. Data, 13, 2753–2776, https://doi.org/10.5194/essd-13-2753-2021, 2021.
Zhao, Y., Gong, P., Yu, L., Hu, L., Li, X., Li, C., Zhang, H., Zheng, Y., Wang, J., Zhao, Y., Cheng, Q., Liu, C., Liu, S., and Wang, X.: Towards a common validation sample set for global land-cover mapping, Int. J. Remote Sens., 35, 4795–4814, https://doi.org/10.1080/01431161.2014.930202, 2014.
Zhong, Y., Su, Y., Wu, S., Zheng, Z., Zhao, J., Ma, A., Zhu, Q., Ye, R., Li, X., Pellikka, P., and Zhang, L.: Open-source data-driven urban land-use mapping integrating point-line-polygon semantic objects: A case study of Chinese cities, Remote Sens. Environ., 247, 111838, https://doi.org/10.1016/j.rse.2020.111838, 2020.
Zhu, Q., Lei, Y., Sun, X., Guan, Q., Zhong, Y., Zhang, L., and Li, D.: Knowledge-guided land pattern depiction for urban land use mapping: A case study of Chinese cities, Remote Sens. Environ., 272, 112916, https://doi.org/10.1016/j.rse.2022.112916, 2022.