the Creative Commons Attribution 4.0 License.
the Creative Commons Attribution 4.0 License.
 | 19 Oct 2023
LCM2021 – the UK Land Cover Map 2021
Christopher G. Marston
Aneurin W. O'Neil
R. Daniel Morton
Claire M. Wood
Clare S. Rowland
Land cover is a key environmental variable, underpinning widespread environmental research and decision making. The UK Centre for Ecology and Hydrology (UKCEH) has provided reliable land cover information since the early 1990s; this supports multiple scientific, government and commercial objectives. Recent advances in computation and satellite data availability have enabled annual UKCEH land cover maps since 2017. Here, we introduce the latest, annual UK Land Cover Map representing 2021 (LCM2021), and we describe its production and validation. LCM2021 methods replicate those of LCM2017 to LCM2020 with minor deviations in cloud-masking processes and training data sourcing to enhance accuracy. LCM2021 is based on the classification of satellite and spatial context data into 21 land cover or habitat classes, from which a product suite is derived. The production of LCM2021 involved three highly automated key stages: pre-processing of input data, image classification and production of the final data products. Google Earth Engine scripts were used to create an input data stack of satellite and context data. A set of training areas was created based on data harvested from historic UKCEH land cover maps. The training data were used to construct a random forest classifier, which yielded classified images. Compiled results were validated against 35 182 reference samples, with correspondence tables indicating variable class accuracy and an overall accuracy of 82.6 % for the 21-class data and 86.5 % at a 10-aggregated-classes level.
The UK Land Cover Map product suite includes a set of raster products in various projections, thematic and spatial resolutions (10 m, 25 m and 1 km), and land–parcel or vector products. The data are provided in 21-class (all configurations) and aggregated 10-class (1 km raster products only) versions. All raster products are freely available for academic and non-commercial research. The data for Great Britain (GB) are provided in the British National Grid projection (EPSG: 27700) and the Northern Ireland (NI) data are in the TM75 Irish Grid (EPSG: 29903). Information on how to access the data is given in the “Data availability” section of the paper.
- Article
(8932 KB) - Full-text XML
- BibTeX
- EndNote


Monitoring and managing environmental change is one of the key challenges for the 21st century (Turner et al., 2007; Allen et al., 2021). Land cover change is both a key cause and a consequence of environmental change (Lambin et al., 2001; Foley et al., 2005), and, as such, it is recognised as a key variable for characterising the environment (Rockström et al., 2009; Bojinski et al., 2014). Land cover affects all aspects of the environment (Foley et al., 2005), including the hydrosphere (Teixeira et al., 2014), atmosphere (Allen et al., 2017) and biosphere (Oliver and Morecroft, 2014), as well as being able to compound or mitigate climate change (Morecroft et al., 2019). Land cover data are therefore an important starting point in many environmental projects and analyses as they form a basis against which other data sets may be integrated and understood (e.g. Coxon et al., 2020). Consequently, there is a demand nationally and internationally for accurate, timely data on land cover. In the United Kingdom (UK), the demand for land cover data has been met by the UK Land Cover Map (LCM) series, comprising LCMs for 1990, 2000, 2007, 2015, 2017, 2018, 2019, 2020 and now 2021. The UK LCMs are a core part of the UK environmental data infrastructure, providing data for a wide range of environmental applications and for a diverse range of users, including academics, businesses, and government departments and agencies. Government use of land cover data includes informing government decision making by exploring the impact of different land use scenarios (Harrison et al., 2022), creating new data sets to aid the implementation of conservation objectives (Natural England, 2022) and providing for the UK's natural-capital accounts (Office for National Statistics, 2021).
UK LCM data have proven valuable for commercial applications, typically in combination with other data and modelling, in terms of enabling companies to better manage resources and target interventions. For example, water companies have used LCM and modelling to optimise water quality monitoring in areas with high levels of agricultural run-off (United Utilities, 2017). Additionally, telecommunication companies mapped locations of TV “white space” (low or no signal) to target improvements in poor-signal areas using LCM and elevation data (Ishizu and Tran, 2014). LCM data have also enabled companies to make better use of their land, with Highways England using LCM and data modelling to identify and remedy key gaps in biodiversity corridors in their land holdings around roads across SW England (UKCEH, 2021). LCMs have also been used in data services for different sectors of UK industry, including underpinning flood modelling, where LCM data are used in the Flood Estimation Handbook web service, the industry standard for assessing UK flood risk (FEH, 2018). The data have also been used to conserve a protected species by enabling the mapping of Great Crested Newt risk zones (Natural England, 2022), thereby enabling a conservation partnership to sustainably manage the impact of development on newt populations (Tew and Nicolet, 2019), and the data are increasingly used by environmental consultancies for estimating natural-capital accounts (White et al., 2015).
Academic uses of LCM data are wide ranging, including applications in pollution, ecology, hydrology, meteorology and climate change, with research topics motivated by both science and policy-related questions. Ecological applications have included epidemiology (Gulliver et al., 2011); conservation (Hooftman and Bullock, 2012); and modelling spatial distributions for mammals (Croft et al., 2017), insects (Mair et al., 2014), birds (Carrasco et al., 2018), invasive species (Fraser et al., 2015) and pollination (Senapathi et al., 2015; Baude et al., 2016). Hydrological applications have included assessing the impacts of catchment land use on rivers and lakes (Bussi et al., 2016), determining flood risk (Reynard et al., 2001; FEH, 2018), and modelling the impacts of farming on water quality (Taylor et al., 2016). Spatial variability in health has also been explored through the modelling of hay fever risk (McInnes et al., 2017), air pollution impacts on human health (Stedman et al., 1997) and bovine tuberculosis (Wint et al., 2002). In recent years, the LCM has also been used increasingly for mapping ecosystem service provision (Emmett et al., 2016) and natural capital (Norton et al., 2018) and to aid in the creation of new data sets such as the UKCEH Land Cover Plus: Pesticides 2012–2017 maps (Jarvis et al., 2020).
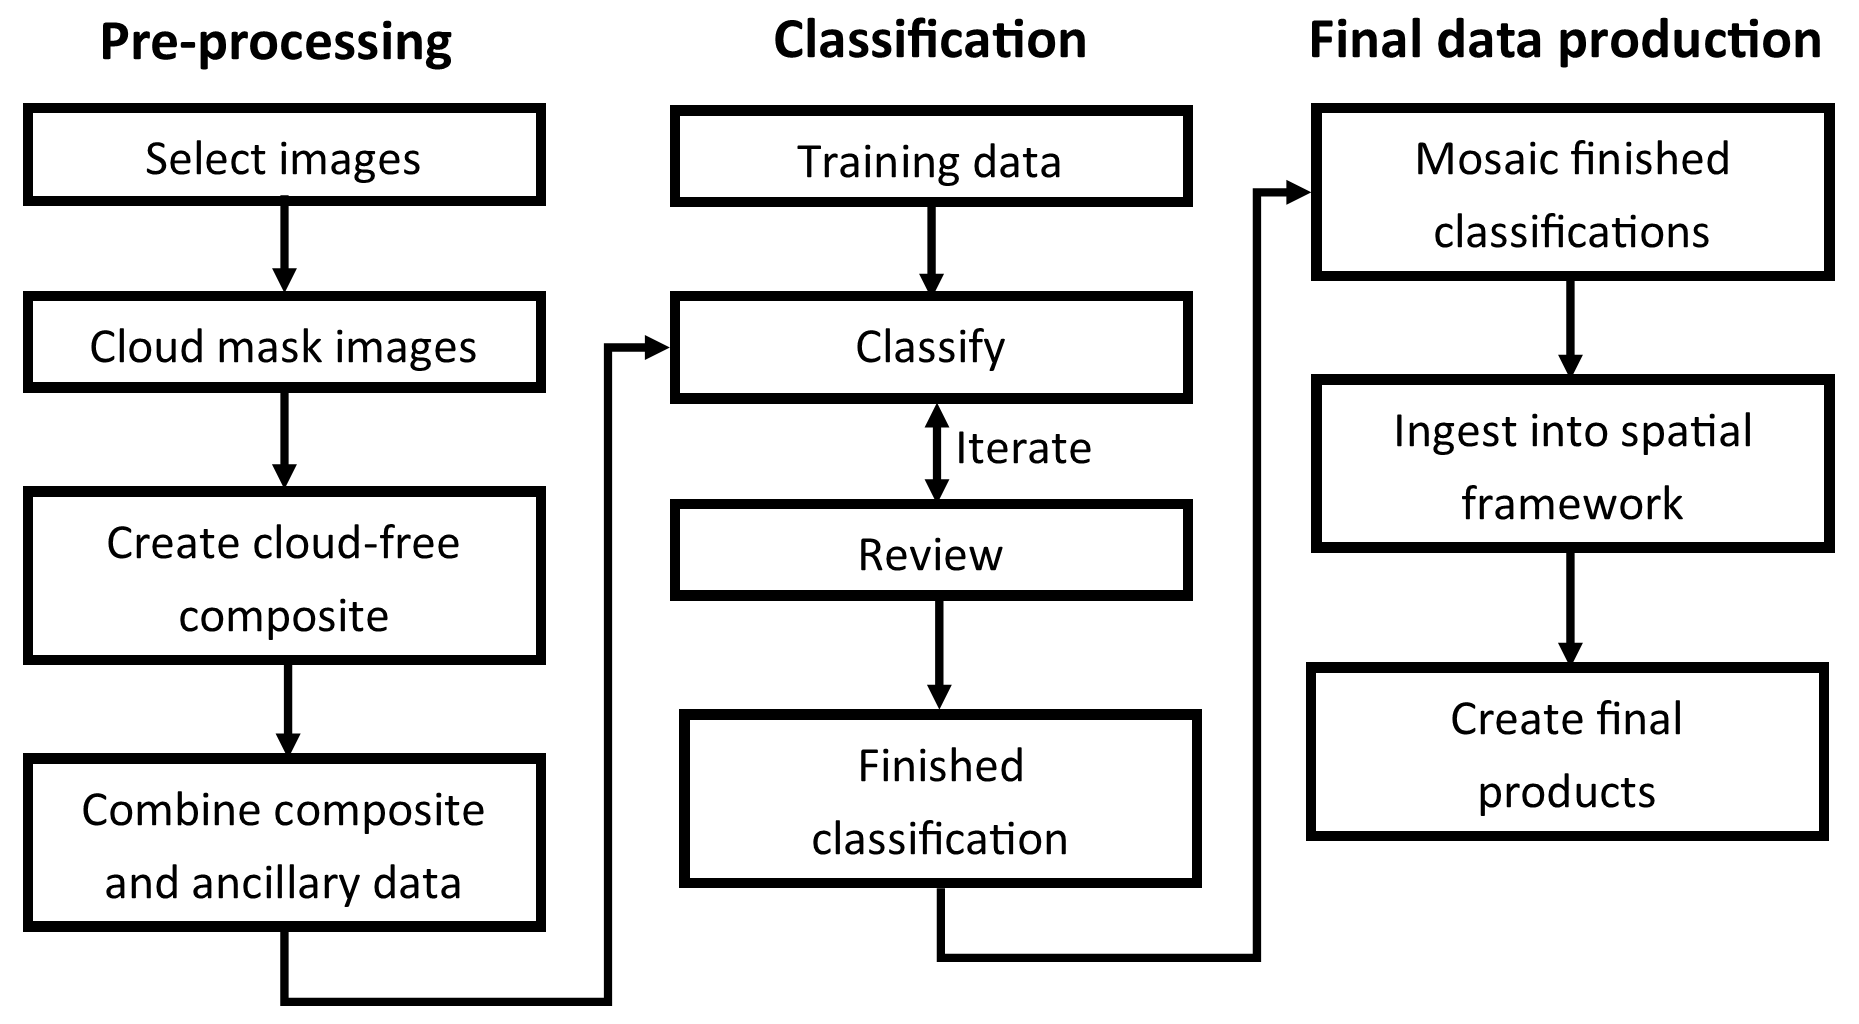
This paper describes the methods and data used to produce the UK Land Cover Map 2021 (LCM2021), as well as the derived LCM2021 data products. LCM2021 was created by classifying satellite data into 21 land cover classes, with these classes being based on the UK Biodiversity Action Plan Broad Habitat definitions (Jackson, 2000). The LCM2021 production process involved three stages: pre-processing of input data, image classification and production of the final data products. We present the results of the classification and the validation of 21-class and 10-class versions of the data set. We describe the different data products available and explain how they can be accessed.
Producing a land cover map requires a range of data sets, typically including satellite data and context data, as well as training and validation data. These data sets are described here, followed by the methods in Sect. 3.
2.1 Satellite data
LCM2021 used Sentinel-2 MultiSpectral Instrument (MSI) Level-2A surface reflectance satellite data (Drusch et al., 2012; Claverie et al., 2018) acquired and pre-processed in Google Earth Engine (Gorelick et al., 2017). The images were acquired between 1 December 2020 and 31 January 2022. All 10 and 20 m spectral bands, comprising bands 2 (490 nm), 3 (560 nm), 4 (665 nm), 5 (705 nm), 6 (740 nm), 7 (783 nm), 8 (842 nm), 8a (865 nm), 11 (1610 nm) and 12 (2190 nm), were used.
2.2 Context data
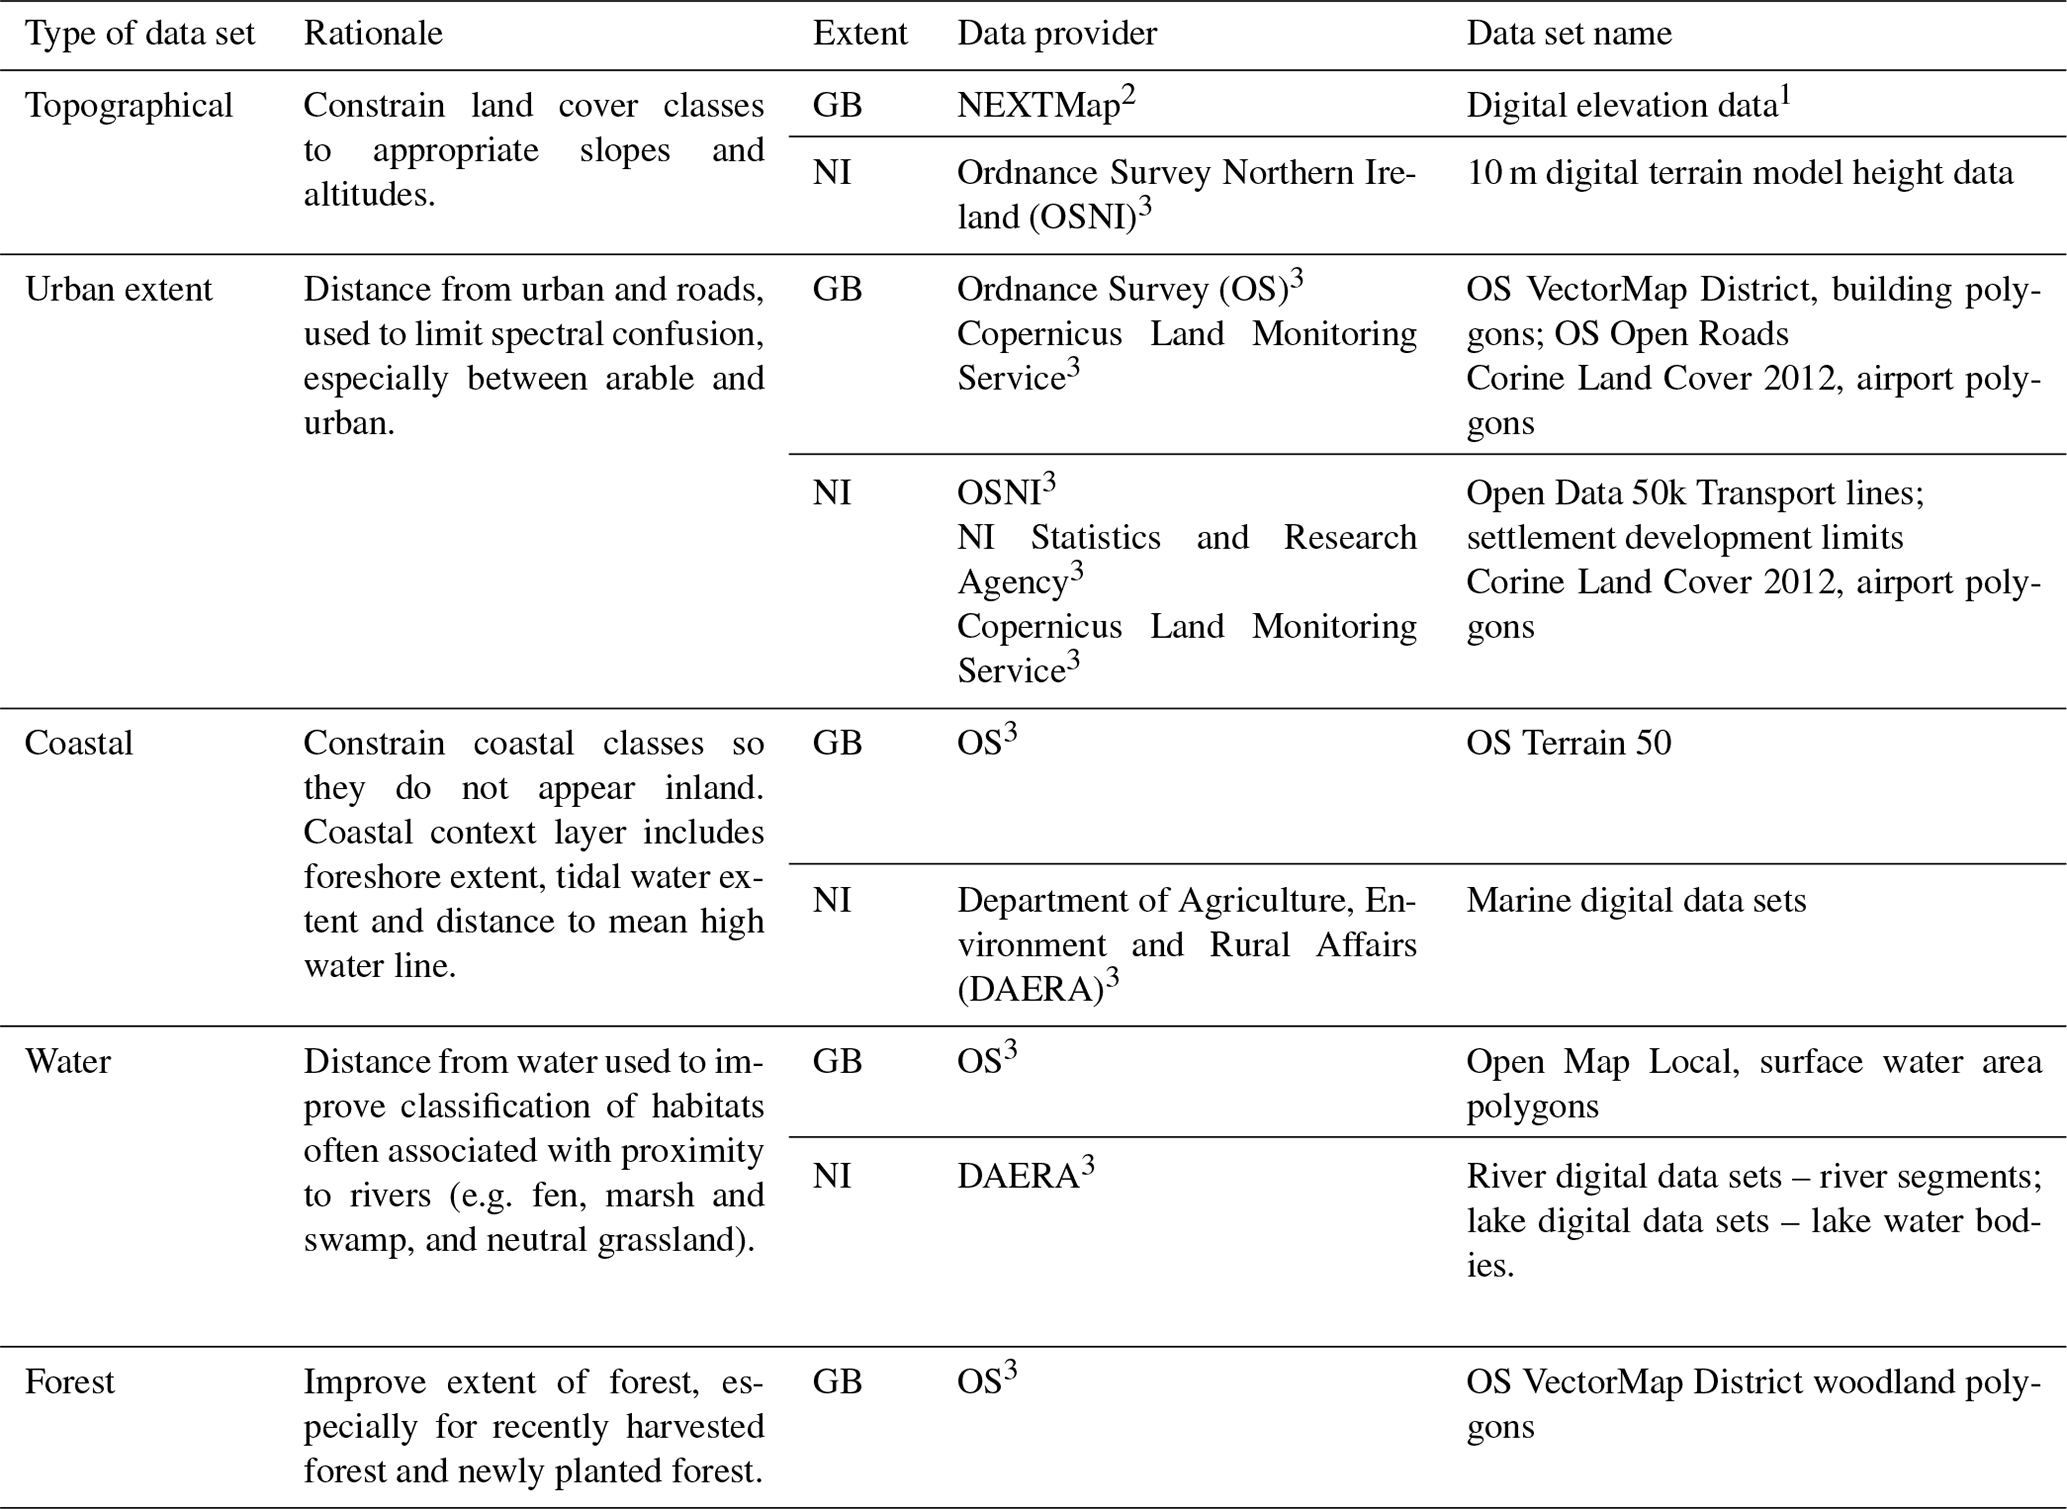
Context data were used as additional inputs to the classification process to enable better classification of the required land cover classes (Rogan et al., 2003). The context data included a digital elevation model (DEM); coastline, foreshore and tidal water layers (to aid coastal classification); building and road layers (to reduce confusion between arable and urban areas) (Table 1); and freshwater and forest layers. The DEM was used to calculate slope and aspect, which were also included as context layers. National cartographic products for Great Britain (GB) were provided by the Ordnance Survey (OS), the national mapping agency of GB, whereas for Northern Ireland (NI), products were provided by a number of government organisations including the NI Statistics and Research Agency (NISRA); the Ordnance Survey Northern Ireland (OSNI); and the NI Department of Agriculture, Environment and Rural Affairs (DAERA). Slightly different context products were available for NI compared to GB (Table 1). The main difference between the OSNI and Ordnance Survey Great Britain (OSGB) context data is the lack of an NI equivalent to the GB building layer. The OS layers were converted from vector to raster data, with the “distance from” layers created for buildings, roads, rivers and water bodies. The “distance from” products were used to allow the context data products to influence a wider area rather than just the pixels they intersected with. The 10 m NEXTMap digital elevation model (DEM) was used to calculate slope and aspect, with elevation, slope and aspect included as context layers.
Table 1Context data set details, including comments on accessibility, data quality and timeliness. 1 Slope and aspect were derived from the DEM data. Abbreviations: Great Britain (GB), Northern Ireland (NI). 2 Data used subject to licensing conditions. 3 Data used under an open license. Ordnance Survey GB open data are from https://osdatahub.os.uk/ (last access: 15 December 2022), Ordnance Survey NI data are from https://www.nidirect.gov.uk/articles/osni-open-data-product-list (last access: 15 December 2022), NI Statistics and Research Agency data are from https://www.opendatani.gov.uk/dataset/settlement-development-limits-2015 (last access: 15 December 2022), DAERA data sets are from https://www.daera-ni.gov.uk/articles/wmu-spatial-datasets (last access: 12 October 2023), and Copernicus Land Monitoring Service data sets are from https://land.copernicus.eu/pan-european/corine-land-cover/clc-2012 (last access: 15 December 2022).
2.3 Training-area data
LCM2021 is produced through supervised classification of satellite images, an empirical process that requires training areas of known land cover type. The training areas for the classification were widely distributed to capture the range of spectral signatures typical of each class. For LCM2021, training areas were primarily harvested from existing vector data from LCM2018 (Morton et al., 2020a, b), LCM2019 (Morton et al., 2020c, d) and LCM2020 (Morton et al., 2021e, f). The method is described in Sect. 3.2.1.
2.4 Spatial framework
The LCM spatial framework is a set of land parcel polygons summarising the landscape of the UK into real-world objects such as lakes, fields, woodlands and urban sites. It was derived from generalised digital cartography (Ordnance Survey MasterMap™ topographic layer (OSMM) for GB and Ordnance Survey of Northern Ireland (OSNI) Large-scale Vector for NI), supplemented with rural payment boundary data (Smith et al., 2007; Morton et al., 2011a). The spatial framework was first generated for LCM2007 and revised for LCM2015 onwards by fixing some minor spatial errors and making additional simplifications in terms of land parcel structure. The spatial framework is used to derive a land parcel data set from which 25 m and 1 km raster data sets are generated.
2.5 Validation data sets
Validation data are necessary to establish the accuracy of land cover classifications (Foody, 2002). LCM2021 validation used a UK-wide data set of 35 182 points gathered from field observations, manual interpretation of aerial photography and quality-assured third-party data sets (Fig. 1). The validation data included habitat-mapping and plot data from Countryside Survey data (Wood et al., 2017), supplemented with additional points for arable land (8589 points) collected in 2020 by the Rural Payments Agency. Data from the National Forest Inventory (NFI, 2019) were used to validate the broadleaved woodland and coniferous woodland classes for GB. Further data were gathered from the 2007 LCM validation field survey (Morton et al., 2011a) and were checked against current (circa-2021) aerial photography to ensure no change had occurred; some additional manually derived points (interpreted from aerial photography) were also added, particularly for water and urban classes.
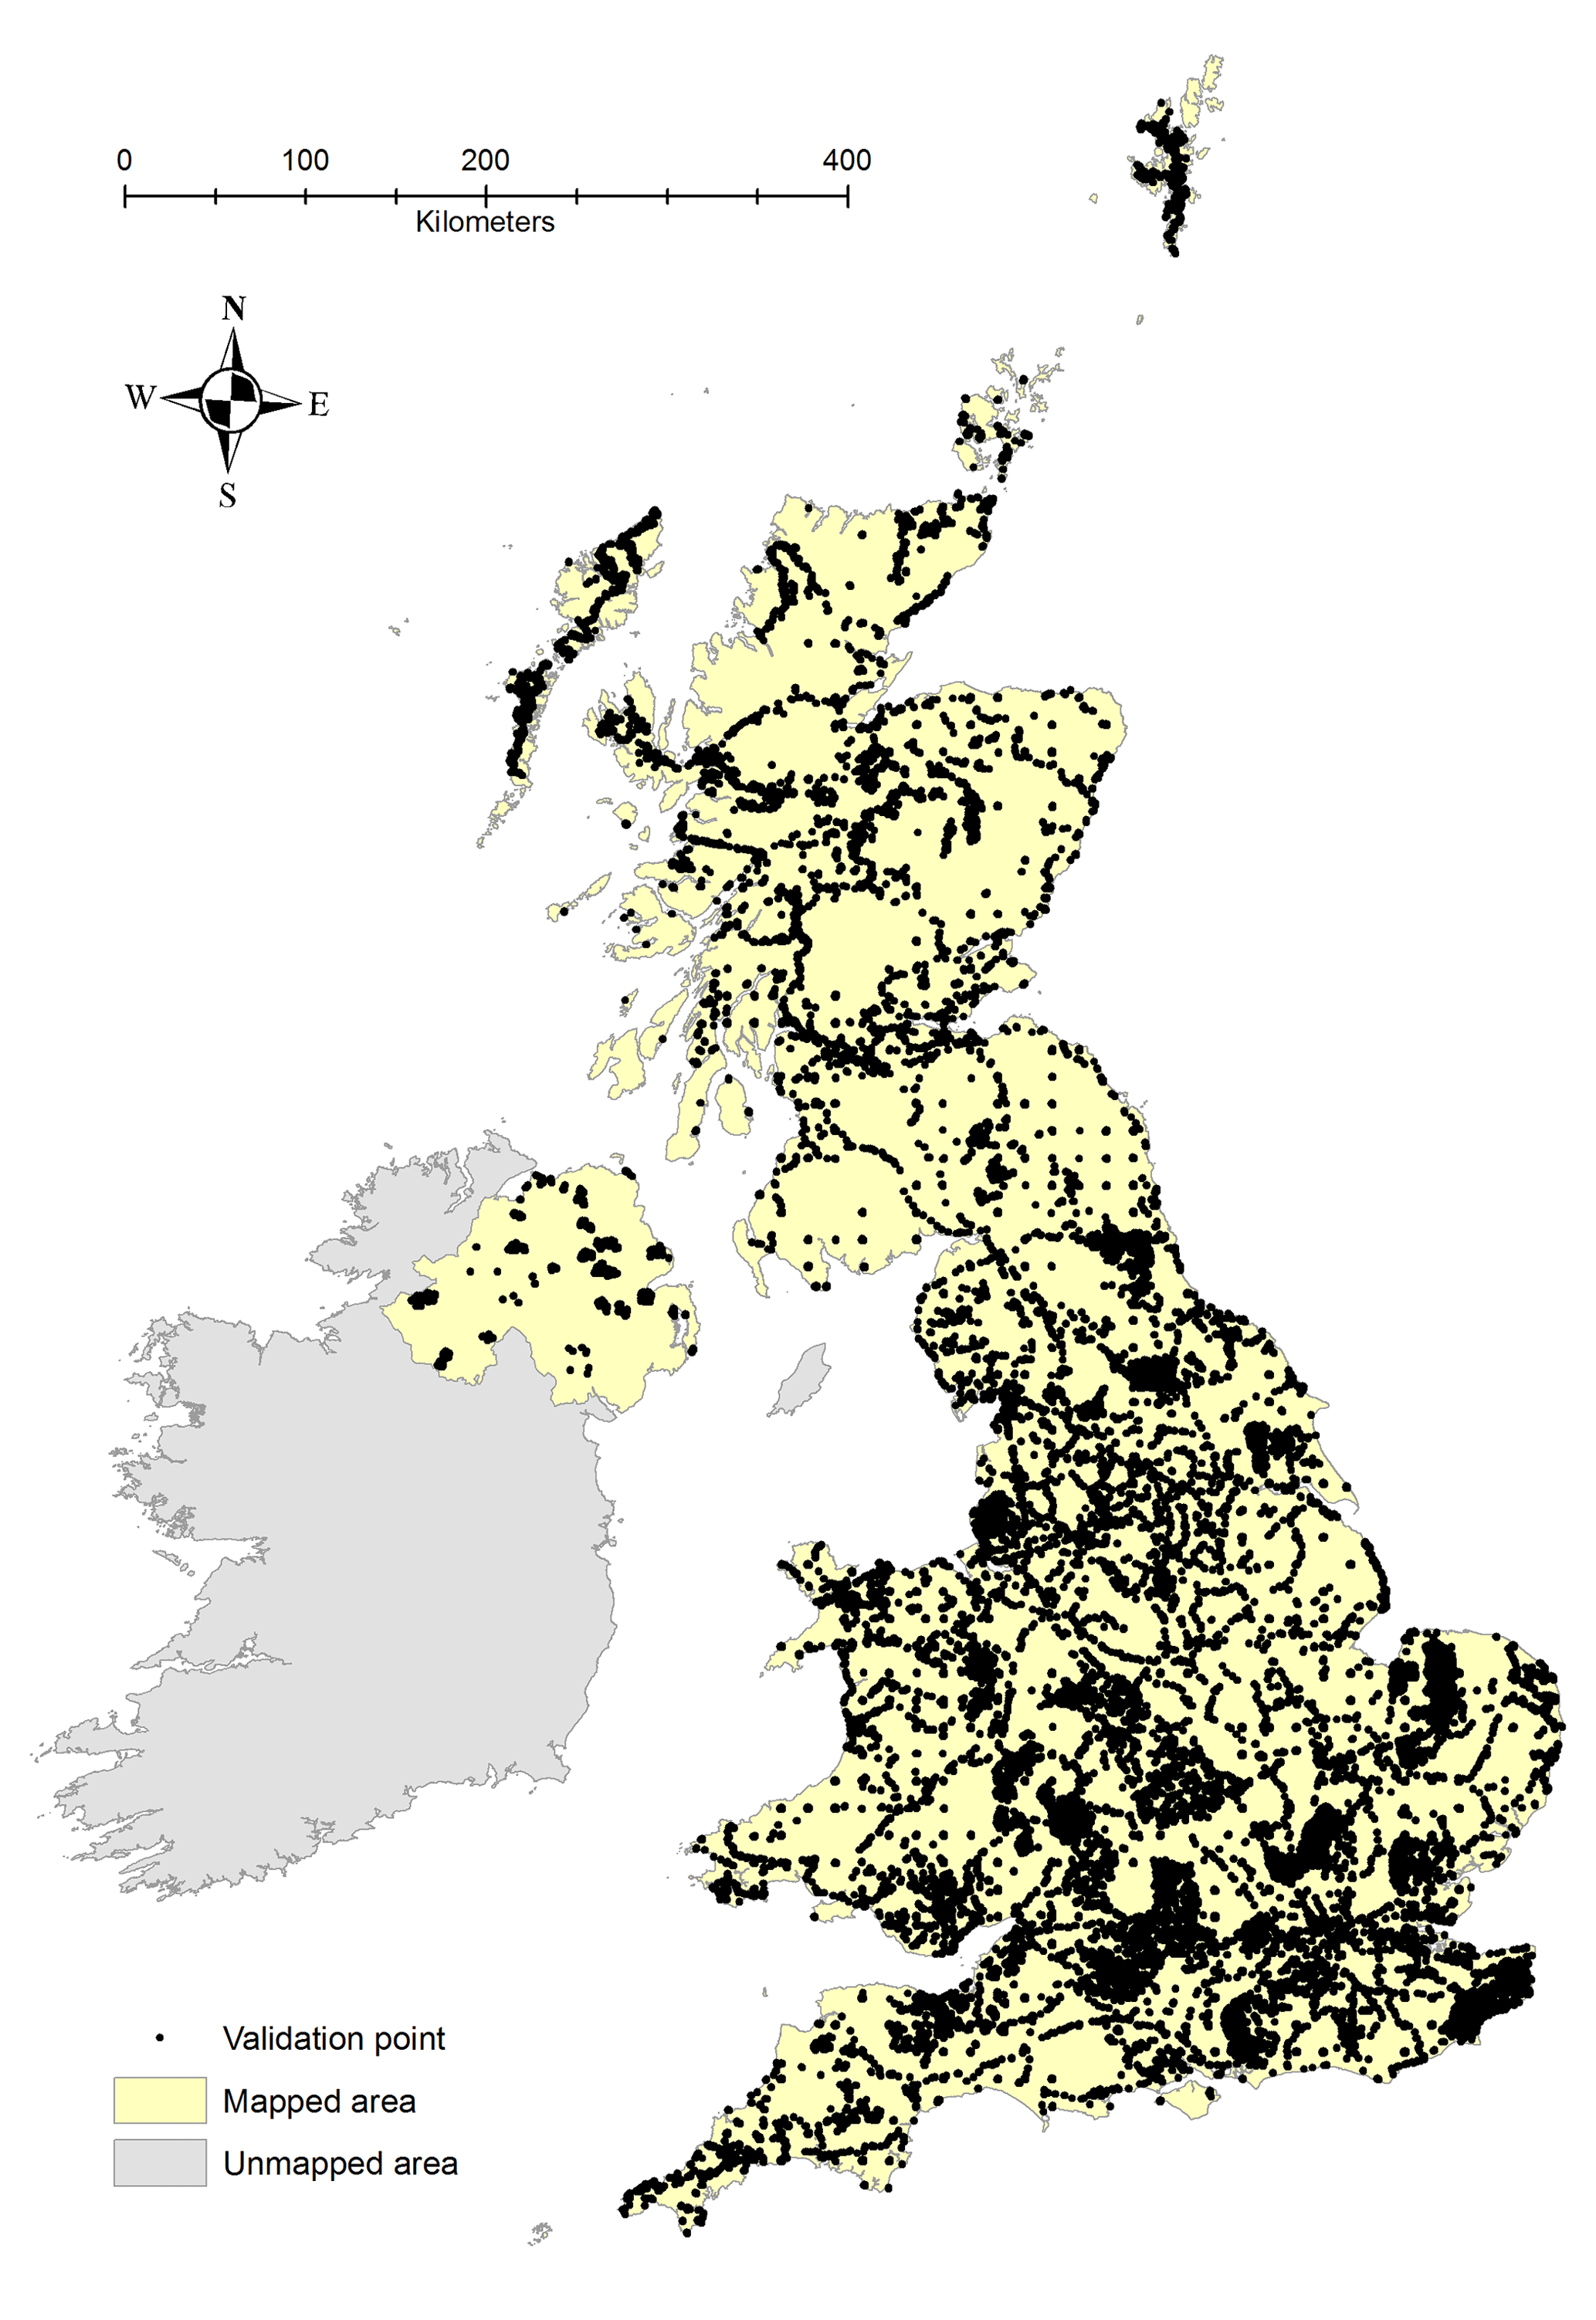
Figure 1Distribution of the 35 182 validation points for LCM2021.
Figure 2 shows the key stages in the creation of LCM2021, from image acquisition through to the creation of the final suite of data products.
3.1 Composite-image creation
Temporal composite images (also known as temporal aggregations) are increasingly used to compress voluminous image collections and to overcome problems of data gaps caused by clouds in optical imagery (Carrasco et al., 2019; Holben, 1986). Cloud computation platforms, such as Google Earth Engine (Gorelick et al., 2017), provide users with tools to create composite images aggregated over user-defined intervals (e.g. annually, monthly, bi-monthly) and for user-defined properties (e.g. raw bands, spectral indices) and with user-defined functions (e.g. median, maximum, mean).
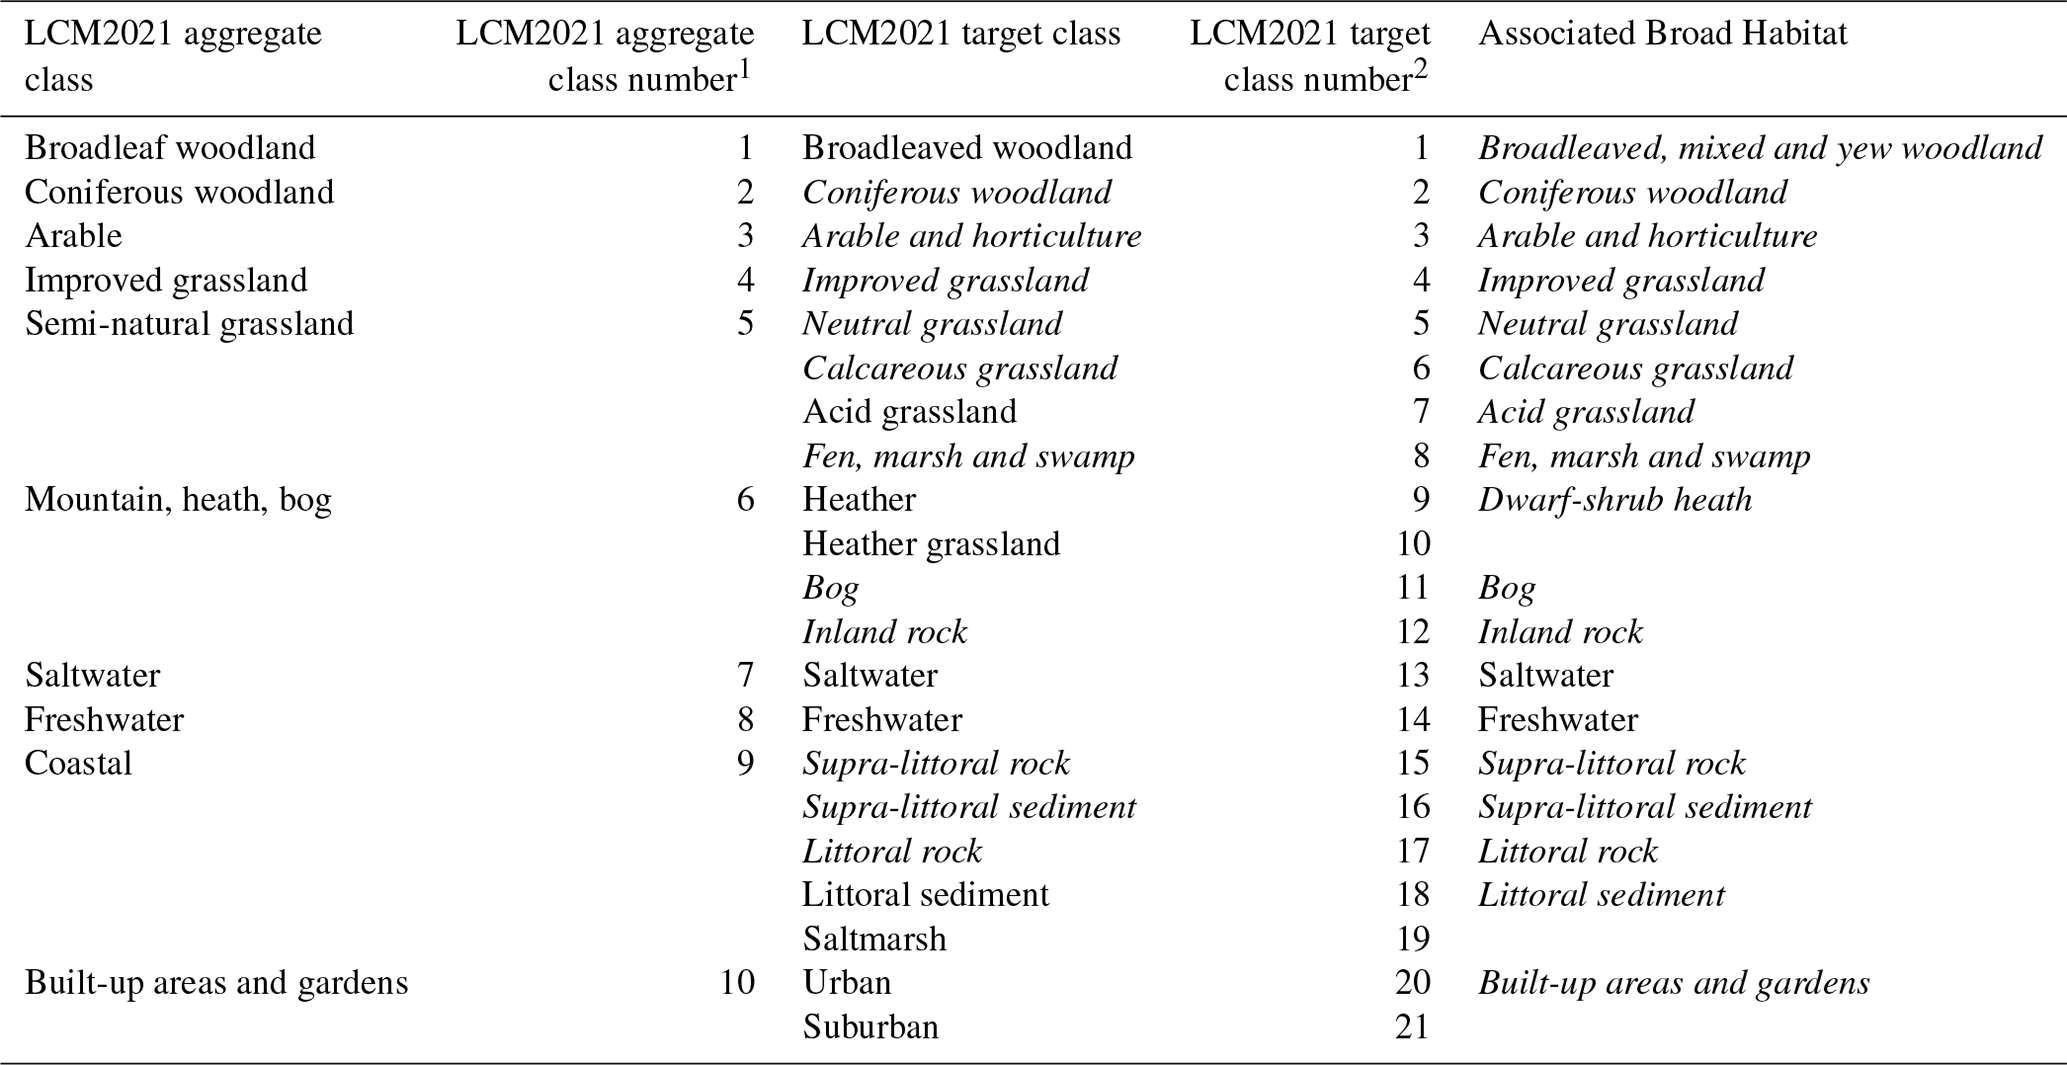
Table 2Relationship between the 21 LCM2021 classes, the 10 aggregate classes and the underlying Broad Habitat classes. Italic text highlights classes meeting the Broad Habitat classes as documented in Jackson (2000). 1,2 LCM2021 and aggregate class numbers are used for raster data sets.
Seasonal composite images of Sentinel-2 Multi-Spectral Instrument (MSI) Level 2-A data (Drusch et al., 2012) were created using Google Earth Engine, with cloud masking based on the Sentinel-2 Cloud Probability layer, s2cloudless (Skakun et al., 2022), and snow masking based on the quality assurance (QA) attributes performed. Images representing median surface reflectance were aggregated over four composite periods: 1 December 2020–31 March 2021, 1 April 2021–30 June 2021, 1 July 2021–31 September 2021 and 1 October 2021–31 January 2022. Periods 1 and 4 were extended by a month into the previous and following years to reduce cloud effects. Seasonal composites were used as they capture the variability in vegetation phenology throughout the year, which aids in the separation of the different land cover classes (Carrasco et al., 2019), and for the UK, aggregation of Sentinel-2 data for four seasons provides data for all four seasons in over 99.9 % of pixels (see SI). Context layers including slope, aspect, elevation distance to coast, distance to building, distance to road and distance to freshwater; in addition, a foreshore mask, a tidal water mask and a forest mask (GB only) were integrated with the composite period satellite imagery (see Table 1 for details of the context data layers, which varied slightly between GB and NI). The addition of context layers reduces spectral confusion between different classes with similar spectral characteristics. The seasonal composites, with the added context data, were then classified.
3.2 Classification
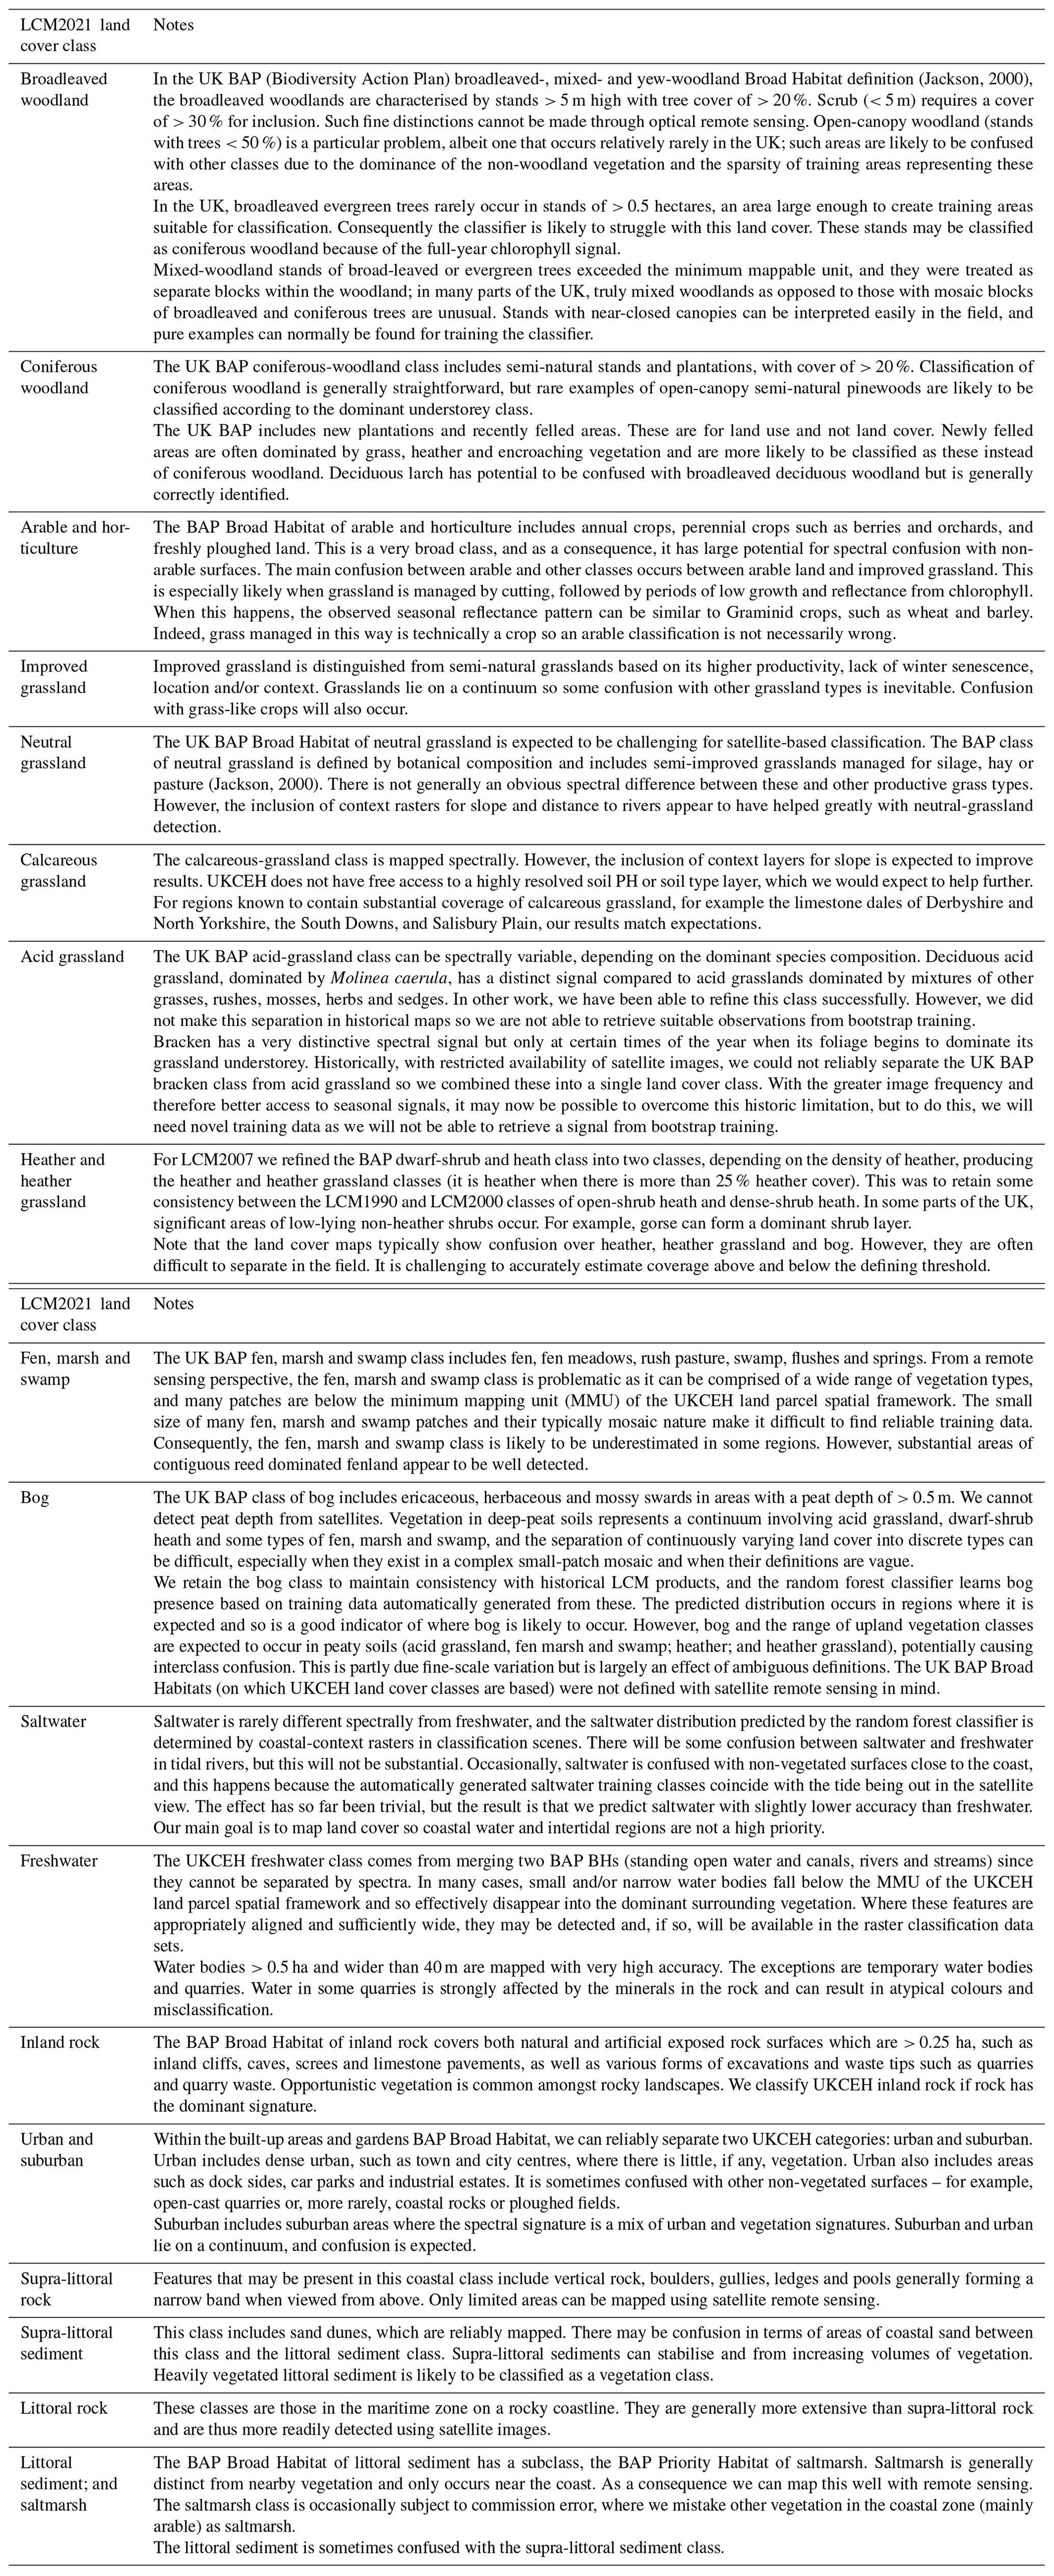
LCM2021 is based on the 21-class nomenclature presented in Table 2. The 21 land cover classes are based on UK Broad Habitat definitions (Jackson, 2000) and are designed to cover the range of habitats found in the UK that can be reliably mapped from satellites. Detailed descriptions of the classes are given in Appendix A. Production of the classifications is split into two stages, first developing the core training areas (Sect. 3.2.1) and then developing the classification process (Sect. 3.2.2).
3.2.1 Core training areas
Selecting appropriate training areas is crucial for the accurate classification of satellite data and has traditionally been time consuming. LCM2021 used a method based on training areas that remained stable across the three previous maps (LCM2018, LCM2019 and LCM2020) on the assumption that many areas such as woodland and urban areas remain stable over decades. Identifying such areas provides a core data set as a starting point for each classification, with this core data set undergoing edits where required to produce the final classification.
When selecting training polygons from this spatial framework and when identifying polygons classified as being the same land cover class for LCM2018, 2019 and 2020, these polygons were also required to have a purity value of > 80 % in each of the three land cover classifications to be included. The purity value of a polygon is a measure of the percentage of the modal land cover class over the total number of pixels corresponding to that polygon. The 80 % threshold was selected to retain a high level of purity within the training polygons but also to retain a large enough set of polygons within each classification extent, with the aim of achieving a spatially distributed training data set with a good representation of all land cover classes. Some incorrect training polygons were present within this core training data set due to either misclassifications in the earlier land cover maps or changes in land cover. Systematic visual checks of the training data and the resultant classifications aided in identifying and removing inappropriate polygons.
3.2.2 Classification algorithm
The composite images were classified using the random forest algorithm (Breiman, 2001) in the WEKA package (Hall et al., 2009; Frank et al., 2016). For each of the tiles, a random forest classifier based on 200 trees was trained. When building a random forest classifier it is important to balance the training samples. An unbalanced classifier will be biased towards common classes, and rare classes may be lost from results completely. Balance was achieved by bagging all training pixels per class then sampling from each bag 10 000 pixels with replacements. For each pixel, the balanced random forest classifier yields a probability of membership for all 21 land cover classes. Land cover per pixel is assigned by highest probability.
3.3 Product construction
Classifications for all tiles were compiled into a full UK spatial coverage at 10 m pixel resolution. This produced a two-band image. Band one is the most likely land cover; band two is the probability associated with this land cover but rescaled into an integer over the interval 0 to 100. Rescaling to an integer enables classification results to be stored in 8-bit, thereby reducing data size without degrading information. The 10 m raster is the precursor for all derived products.
The ingestion into the spatial framework involved determining the majority (modal) class for each polygon. Separate GB and NI data sets were created to accommodate the different map projections. Figure 3 shows the extents of the 32 composites used to achieve complete coverage of the UK. The approximate 100×100 km tile size, based on a modified version of the Ordnance Survey 100 km tile grid, was chosen as this provides a manageable size for processing. Some tiles such as those encompassing the Western Isles, Orkney and Shetland, and Cornwall and the Scilly Isles are intentionally enlarged to avoid a sparsity of training data due to the extensive presence of sea in these tiles. Occasionally, where tile extents are modified, overlap between adjacent tiles does occur.
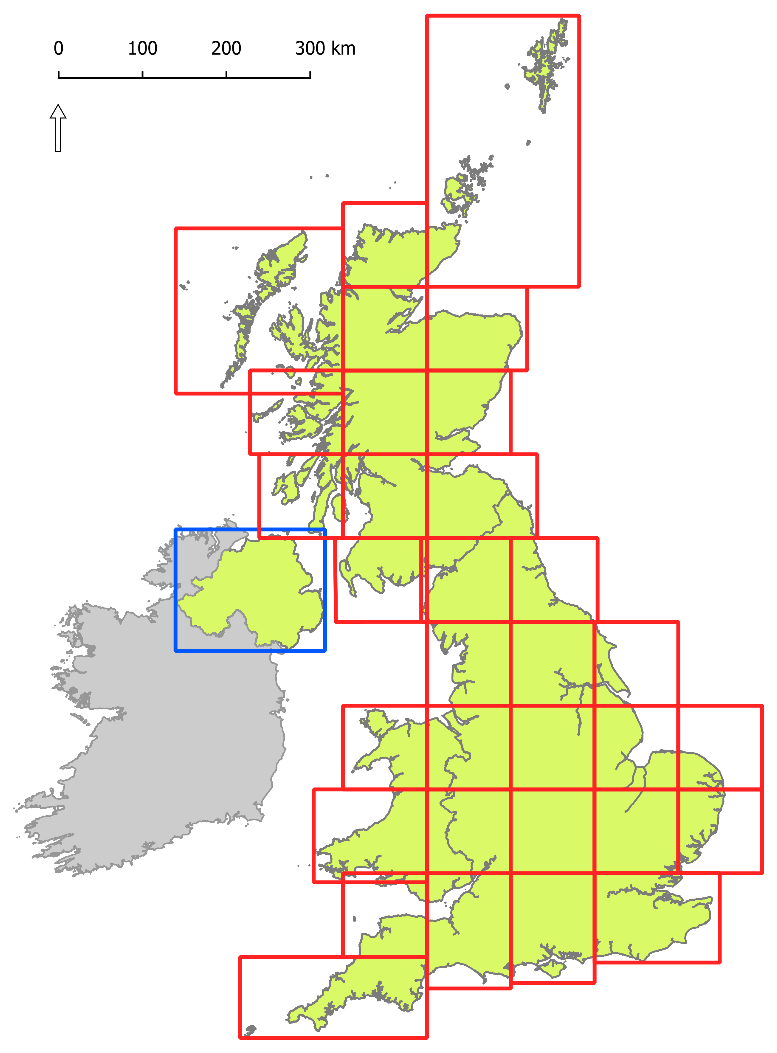
Figure 3Composite-image extents comprising LCM2021 for Great Britain (red) and Northern Ireland (blue).
Once the GB and NI classification mosaics were complete, a series of minor knowledge-based corrections was applied. These included the reclassification of misclassified arable pixels to improved grassland in urban green-space areas (as denoted by the OS Open Greenspace data set) and of coastal classes misclassified inland using a coastal mask.
3.4 Validation
The LCM2021 class was extracted for each of the validation points. From these data, confusion matrices were plotted for the 21 target classes and the 10 aggregate classes used for LCM2021.
4.1 Validation results
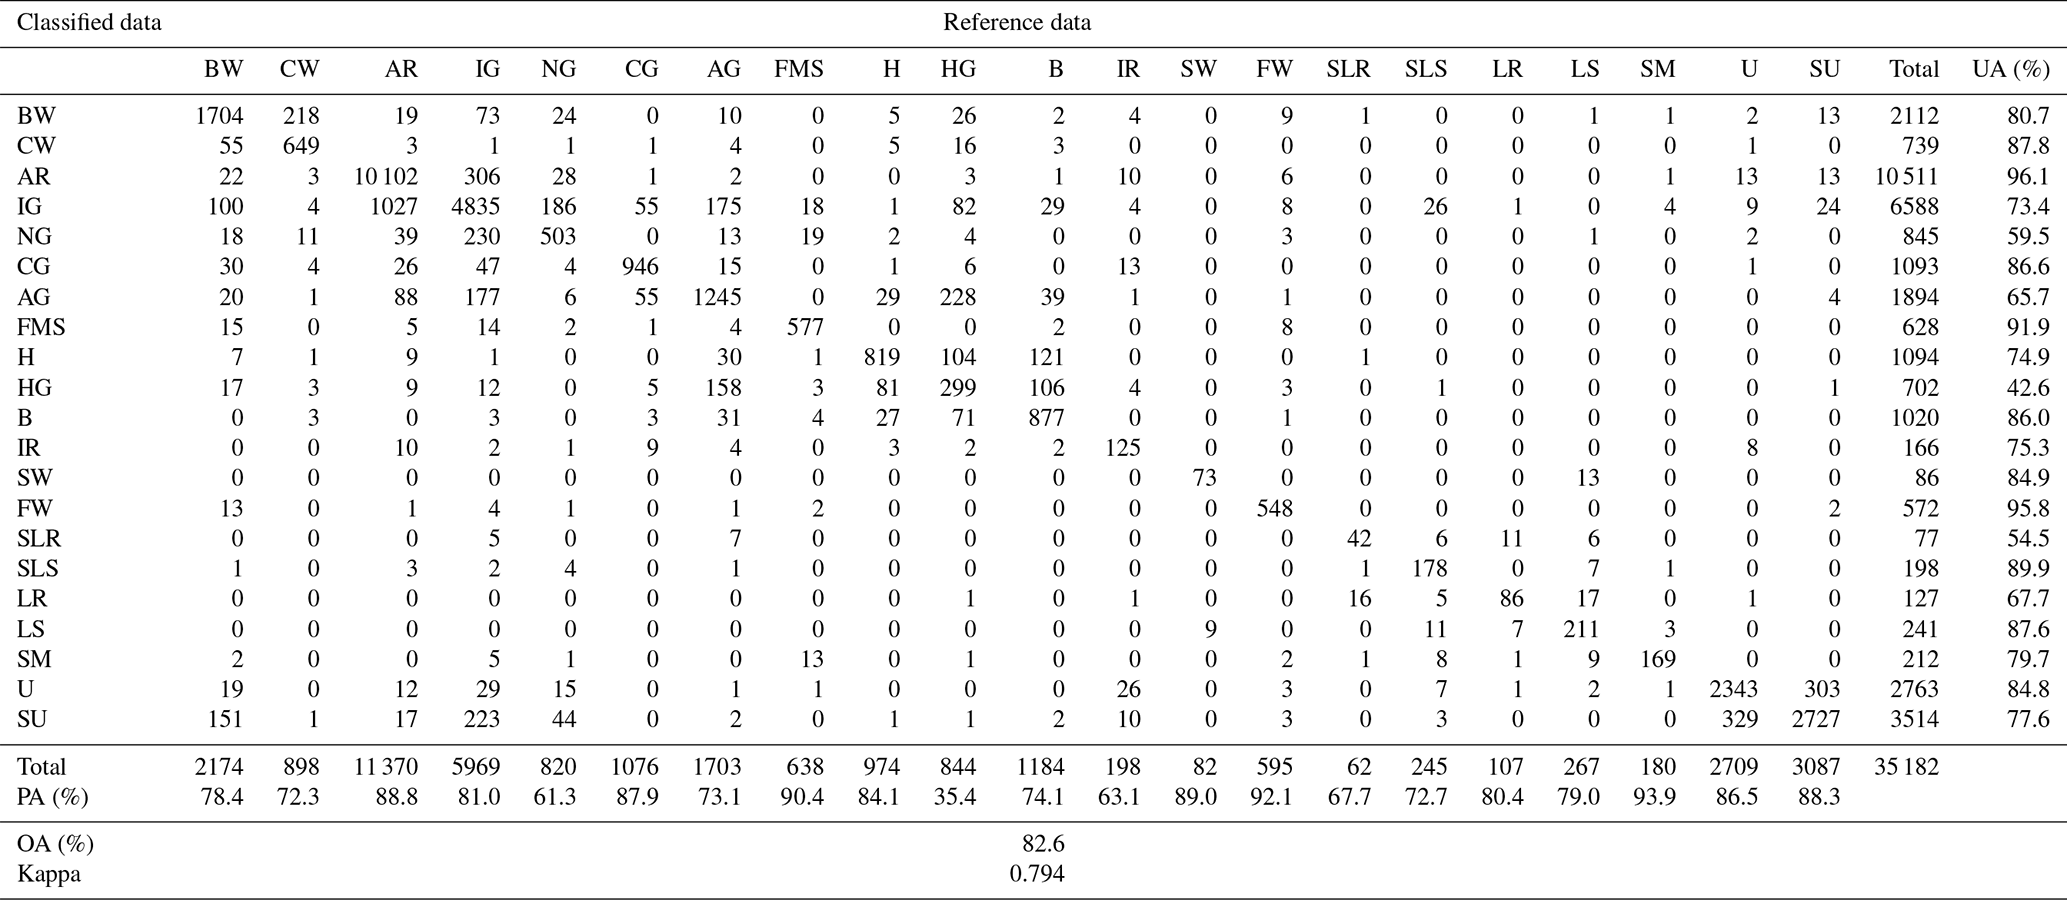
The 25 m rasterised polygon version of LCM2021 (Marston et al., 2022e, f) was validated using 35 182 points distributed across the UK (Table 3). The results are summarised in a confusion matrix, which shows how reference points for each of the classes were classified. Ideally, all the points would fall along the main diagonal, showing complete agreement between the reference data and the classification. Table 3 shows that LCM2021 has an overall accuracy of 82.6 %, with the accuracy of individual classes varying. The results of the validation are shown in a confusion matrix (Table 3), with the reference data in the columns and the classification data in the rows. The confusion matrix shows the level of agreement between the classification and the reference data, as well as the areas of disagreement or confusion. The accuracy varies with class, with the producer's accuracy ranging between high and low values of 93.9 % (saltmarsh) and 35.4 % (heather grassland) and the user's accuracy varying between 96.1 % (arable) and 42.6 % (heather grassland). For the products that use the 10 aggregate classes (see Sect. 5 for more details about the aggregate-class products), the validation suggests an overall accuracy of 86.5 % (Table 4).
Table 3Confusion matrix for LCM2021 against 35 182 reference points. BW refers to broadleaved woodland; CW refers to coniferous woodland; AR refers to arable; IG refers to improved grassland; NG refers to neutral grassland; CG refers to calcareous grassland; AG refers to acid grassland; FMS refers to fen, marsh and swamp; H refers to heather; HG refers to heather grassland; B refers to bog; IR refers to inland rock; SW refers to saltwater; FW refers to freshwater; SLR refers to supra-littoral rock; SLS refers to supra-littoral sediment; LR refers to littoral rock; LS refers to littoral sediment; SM refers to saltmarsh; U refers to urban; SU refers to suburban; PA refers to producer's accuracy; U refers to user's accuracy; OA refers to overall accuracy.
4.2 LCM2021 map
The final LCM2021 product shows the expected distribution of classes across the UK (Fig. 4). At the scale shown in Fig. 4, the differences between the grassland of the west and the arable areas in the east are clear, as are the uplands in Wales and Scotland, with London, the UK's largest urban area, clearly visible.
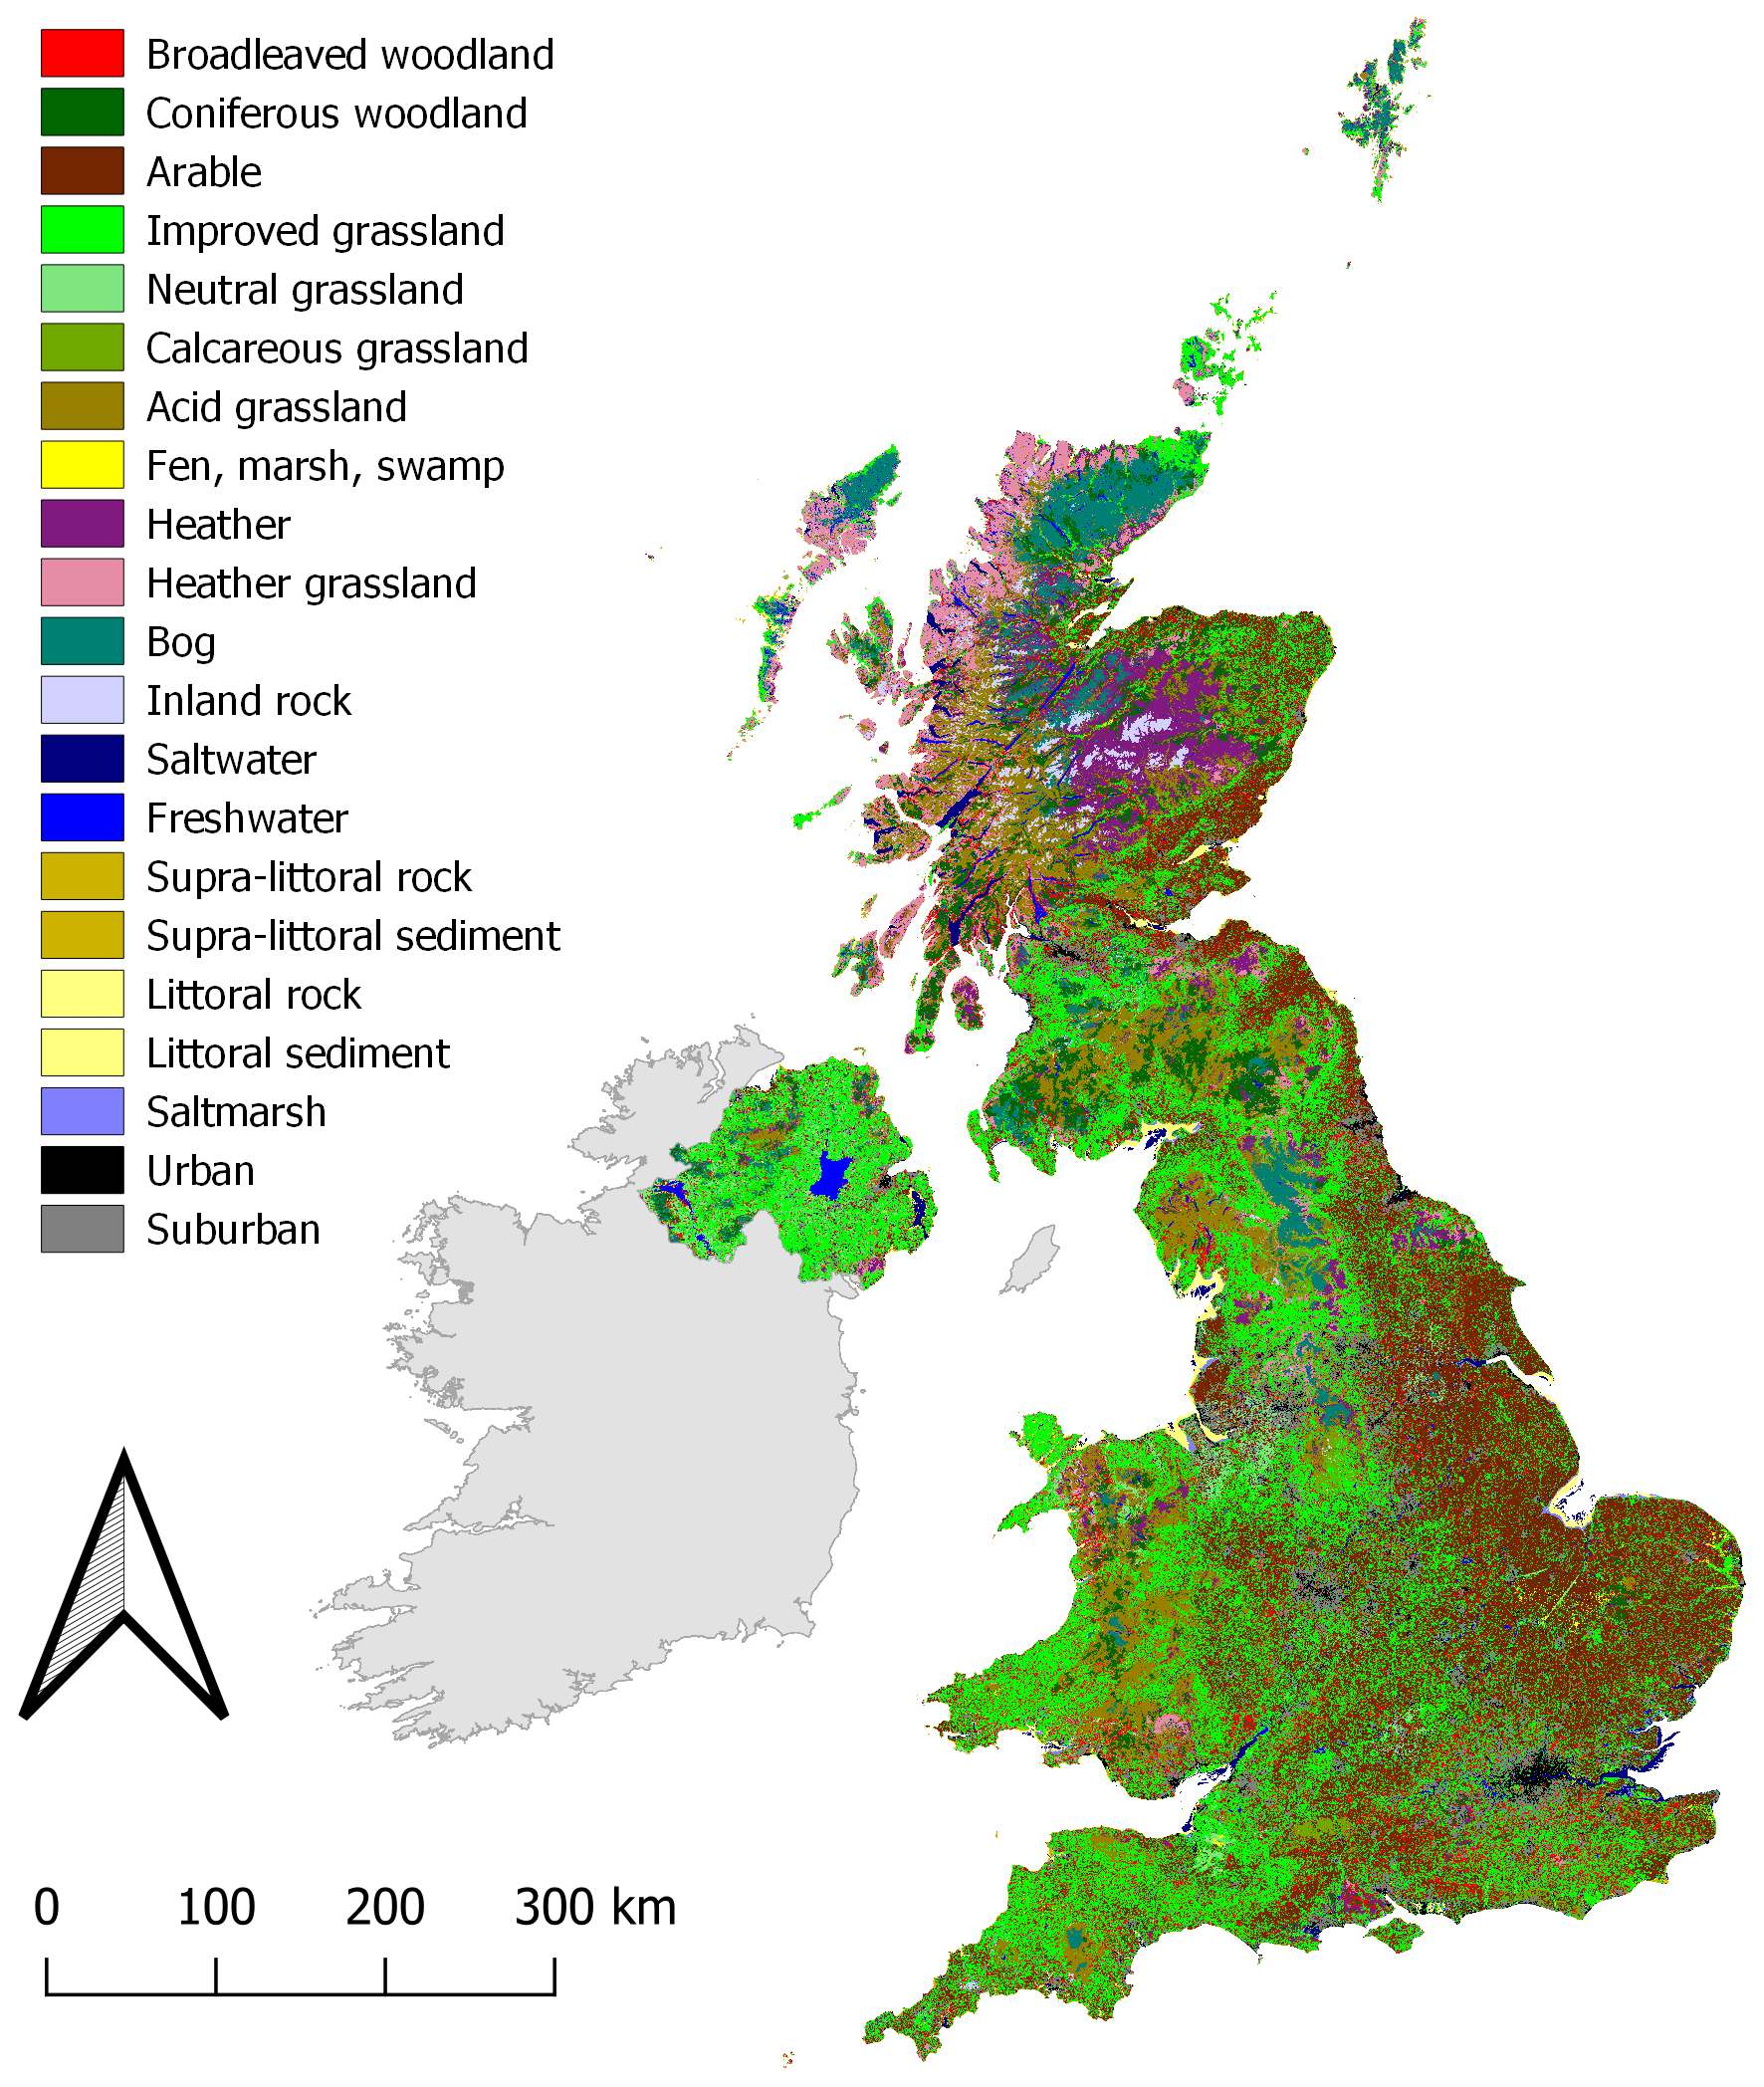
Figure 4LCM2021 in standard colour palette (see Table B2 for palette details) (see Appendix B for LCM2021 in revised colour palette).
4.3 LCM statistics
One of the uses of LCM2021 is to produce country-level statistics (Table 5), although land cover statistics can also be produced for other types of spatial units, such as river or lake catchments or national parks and protected areas.
Table 4Confusion matrix for LCM2021 aggregate classes against 35 182 reference points. BW refers to broadleaved woodland; CW refers to coniferous woodland; AR refers to arable; IG refers to improved grassland; SNG refers to semi-natural grassland; MHB refers to mountain, heath and bog; SW refers to saltwater; FW refers to freshwater; C refers to coastal; BU refers to built-up and gardens; PA refers to producer's accuracy; UA refers to user's accuracy; OA refers to overall accuracy.
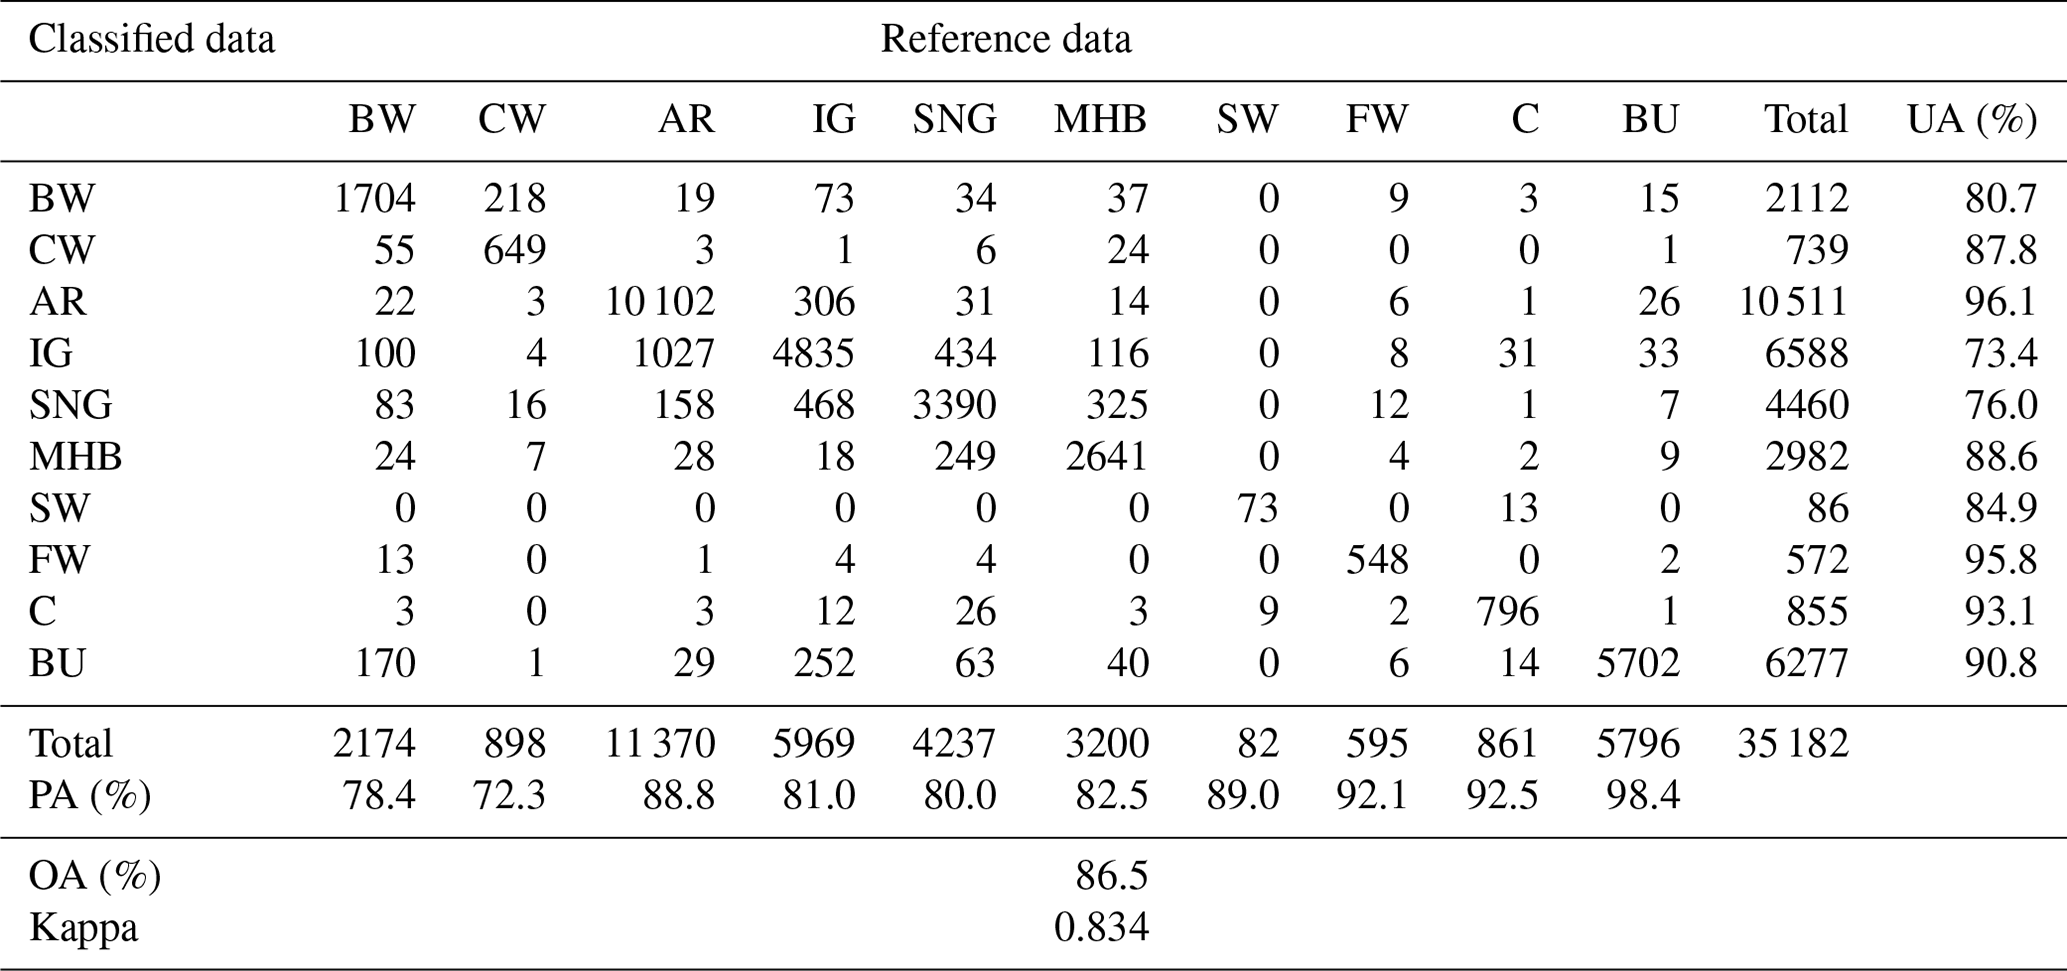
Table 5UK land cover statistics derived from LCM2021 in area (km2) calculated from the 10 m raster product.
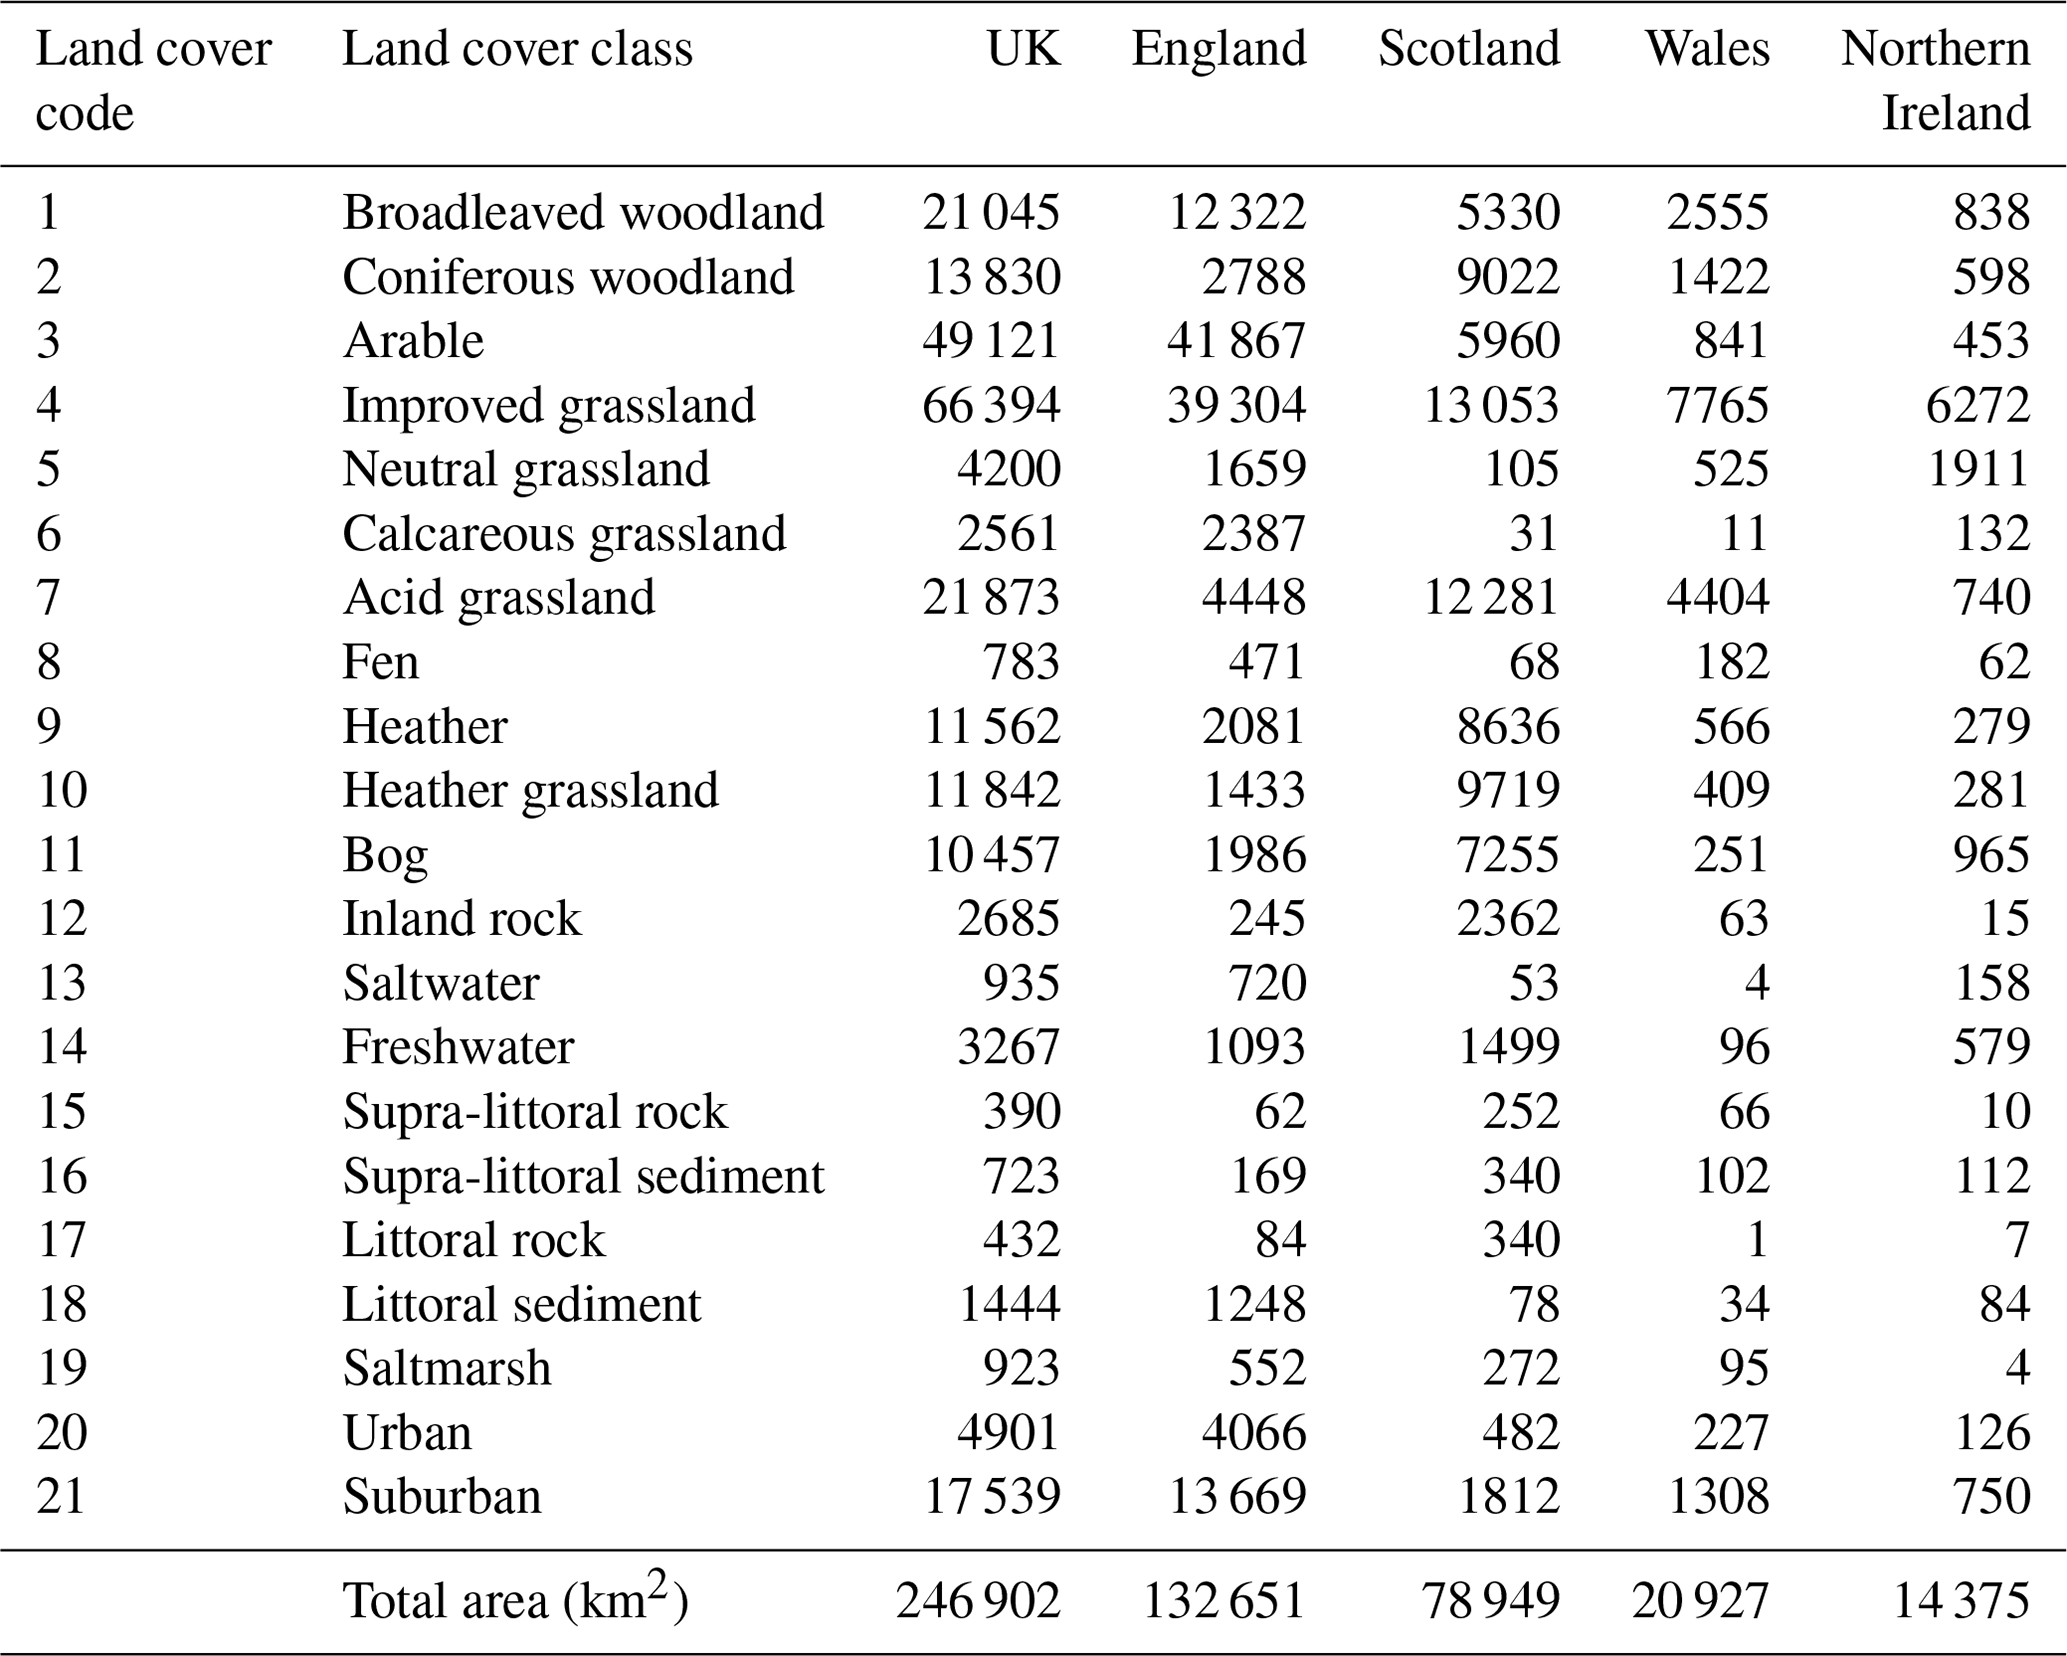
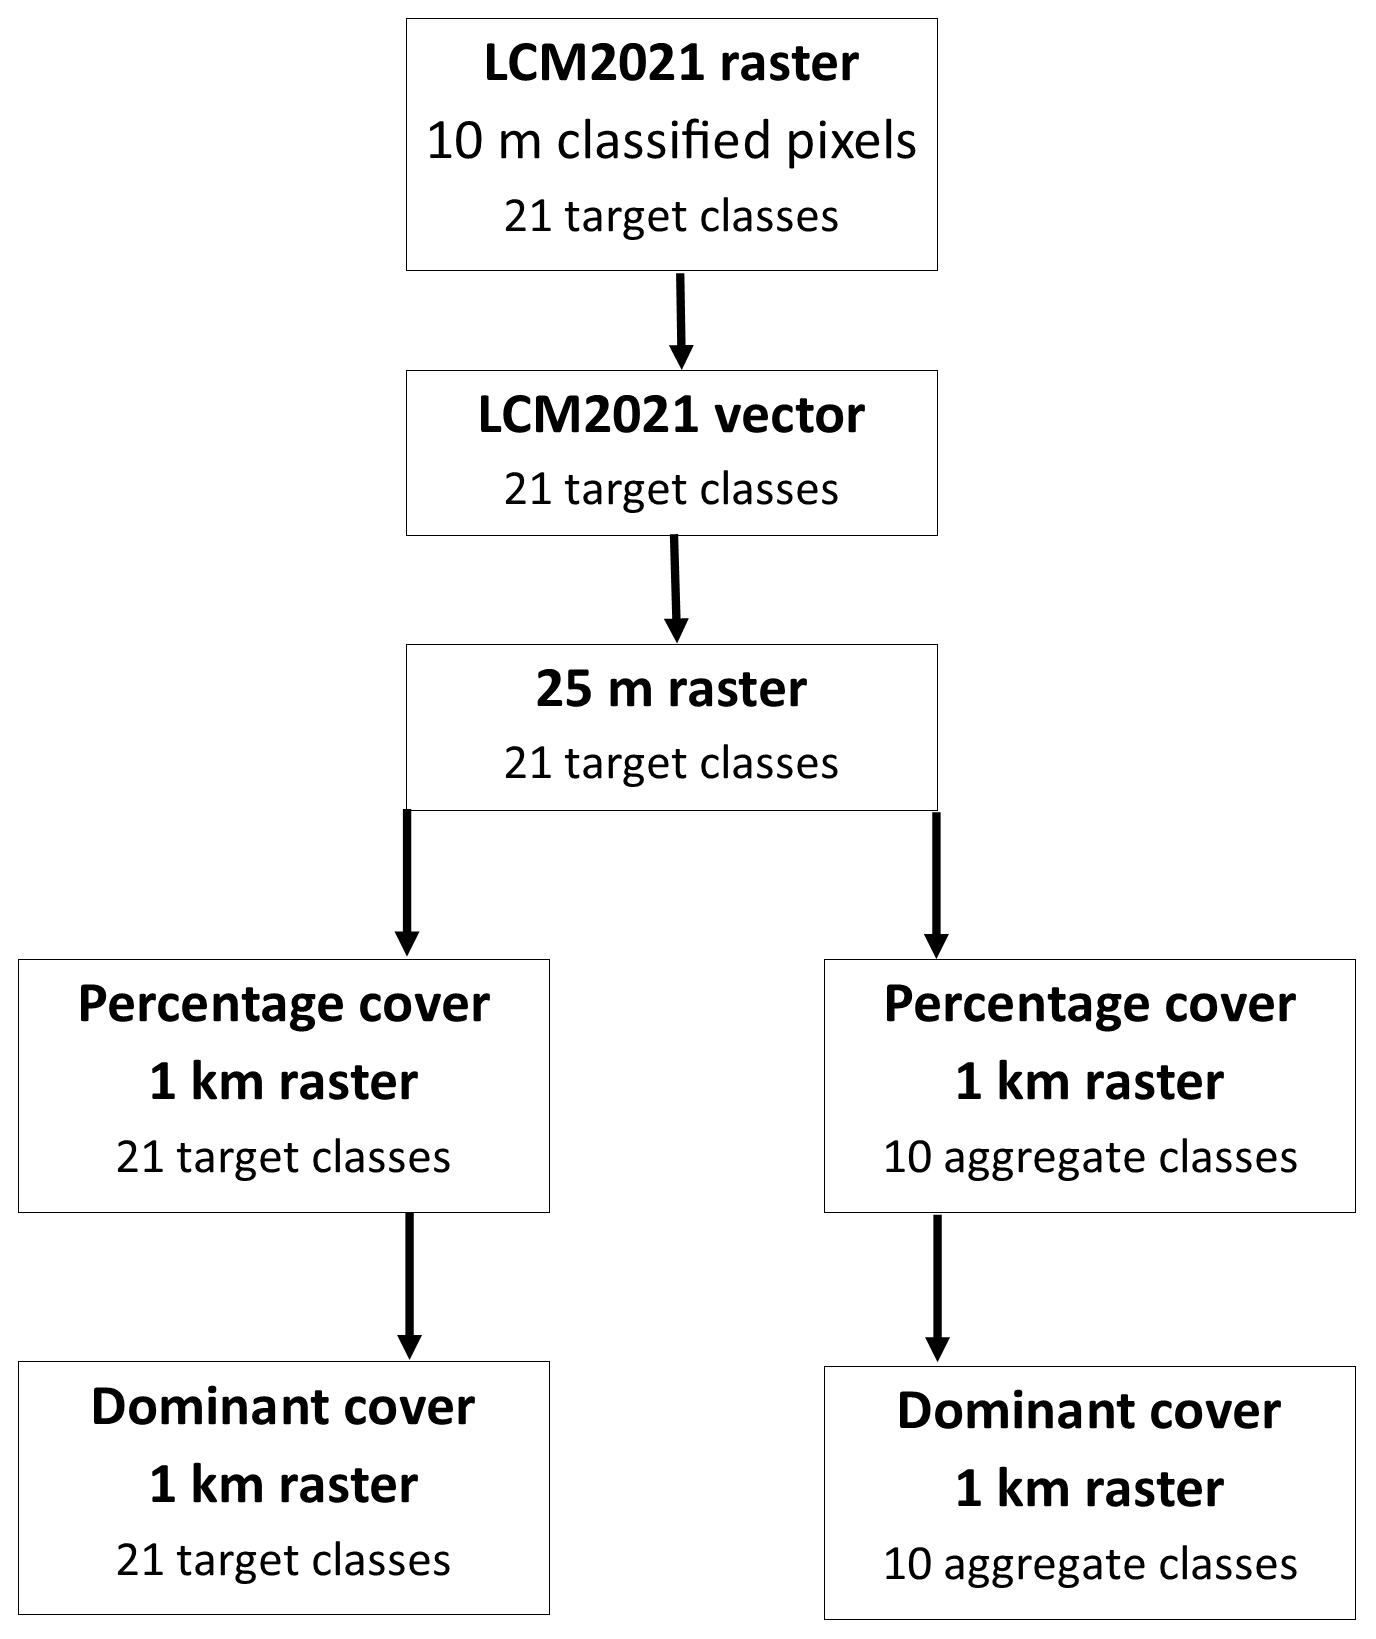
Figure 5Overview of the LCM2021 data set production process. The vector version of the data set is constrained by licensing restrictions due to the inclusion of national mapping agency data.
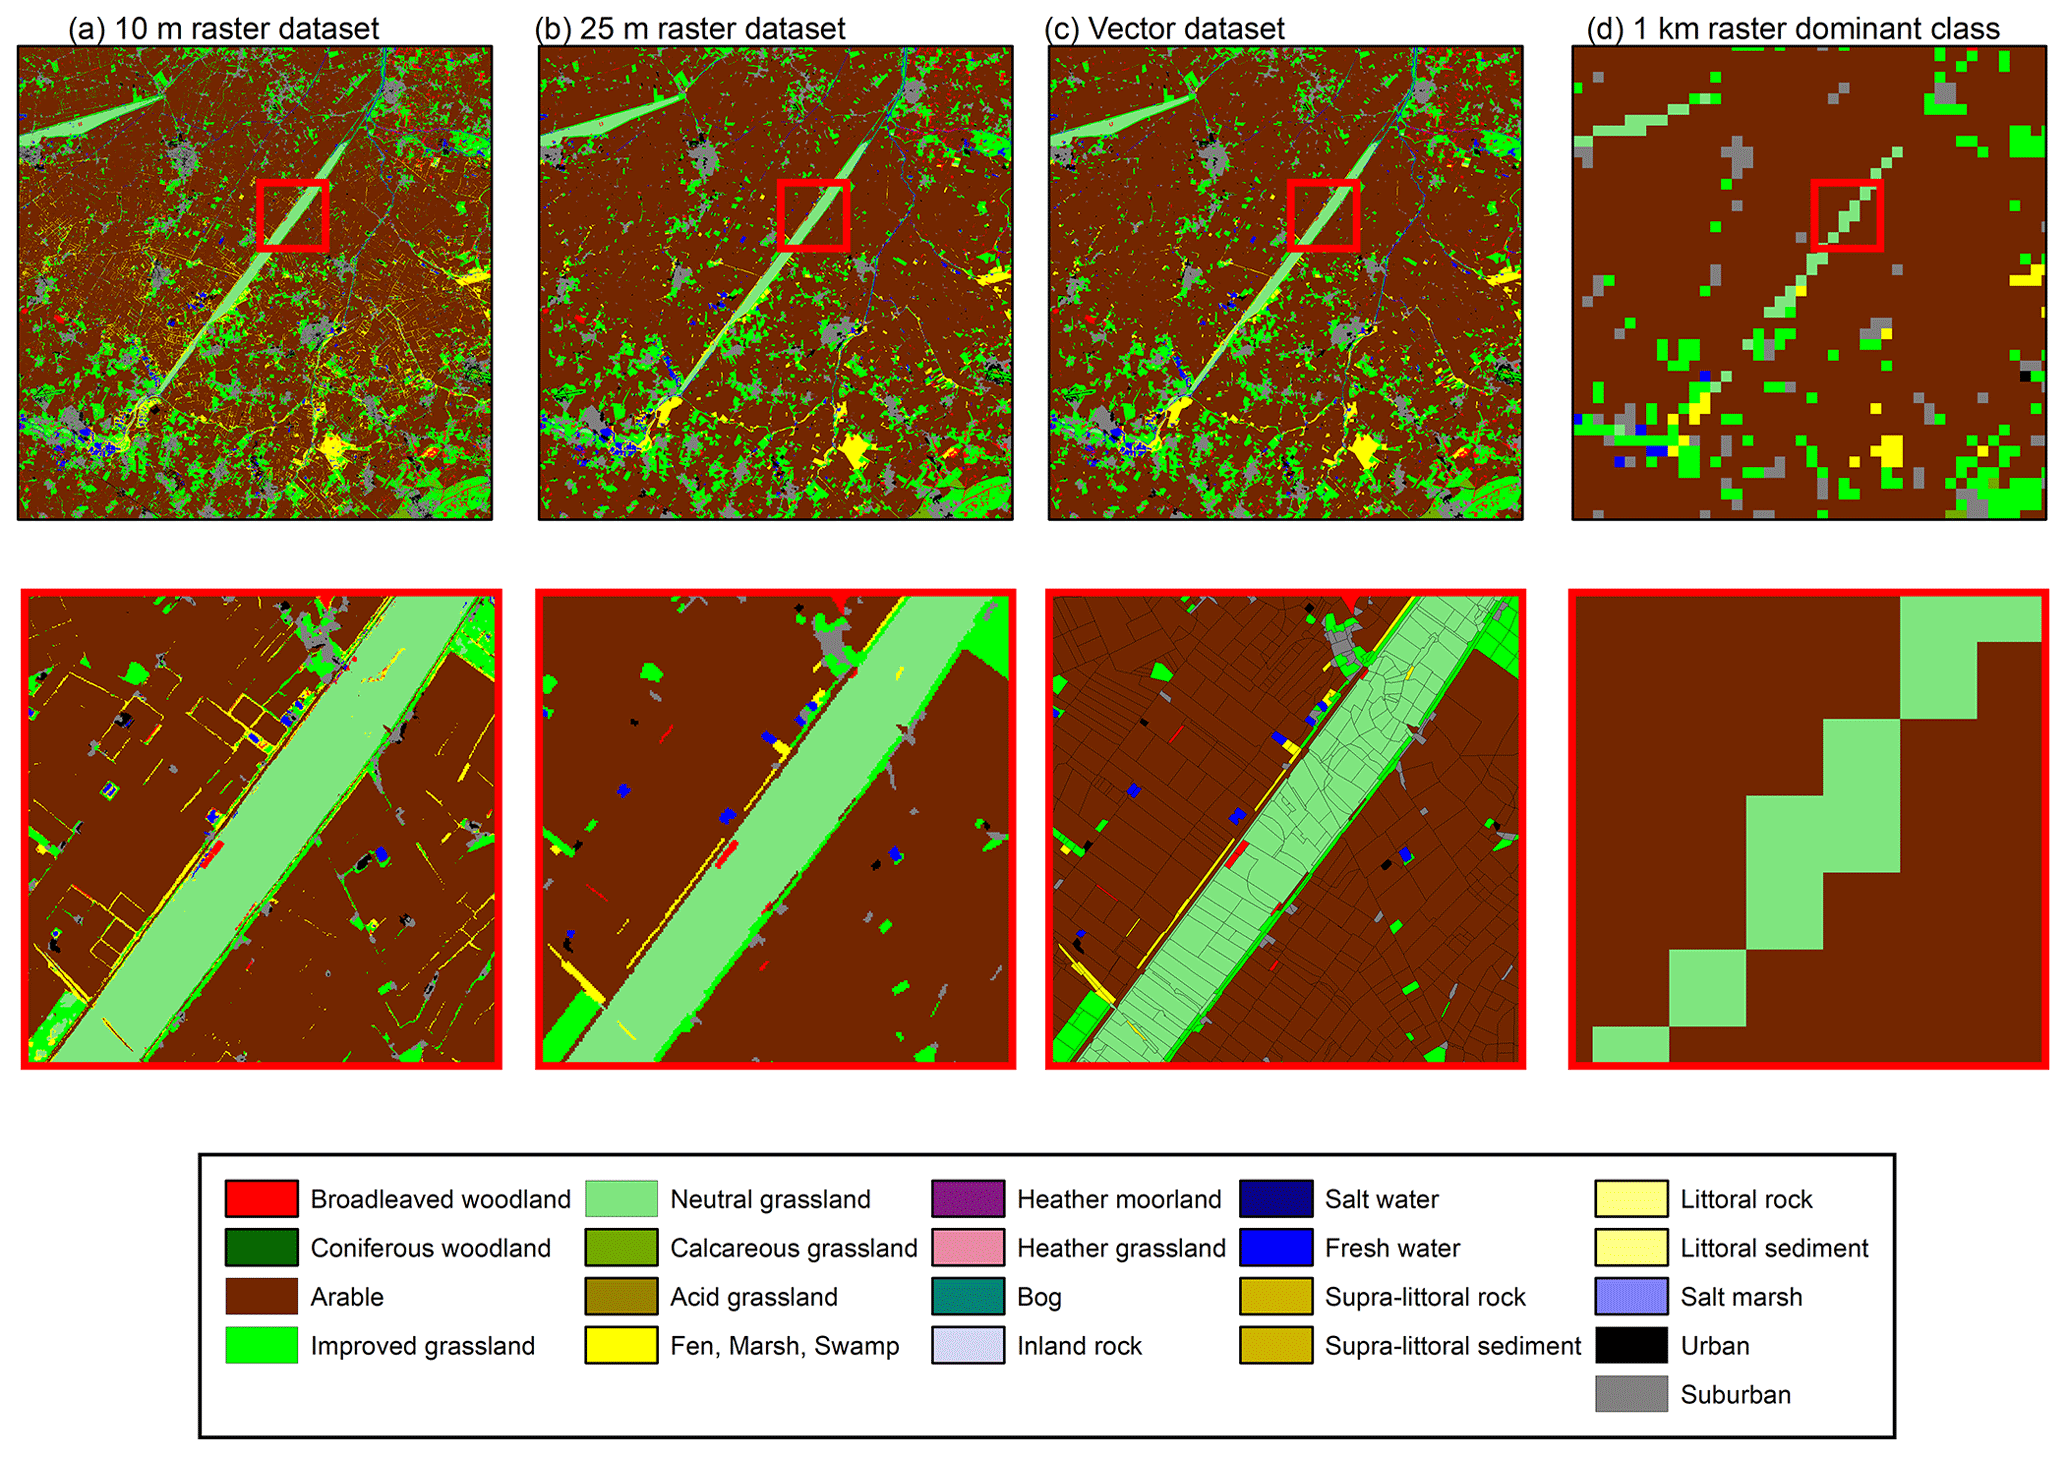
Figure 6Examples of the level of spatial detail provided by the (a) 10 m raster, (b) 25 m rasterised polygons, (c) vector data set and (d) 1 km raster data sets. The top panel shows the zoomed-out view, and the red box shows the location of the zoomed-in area in the lower panels.
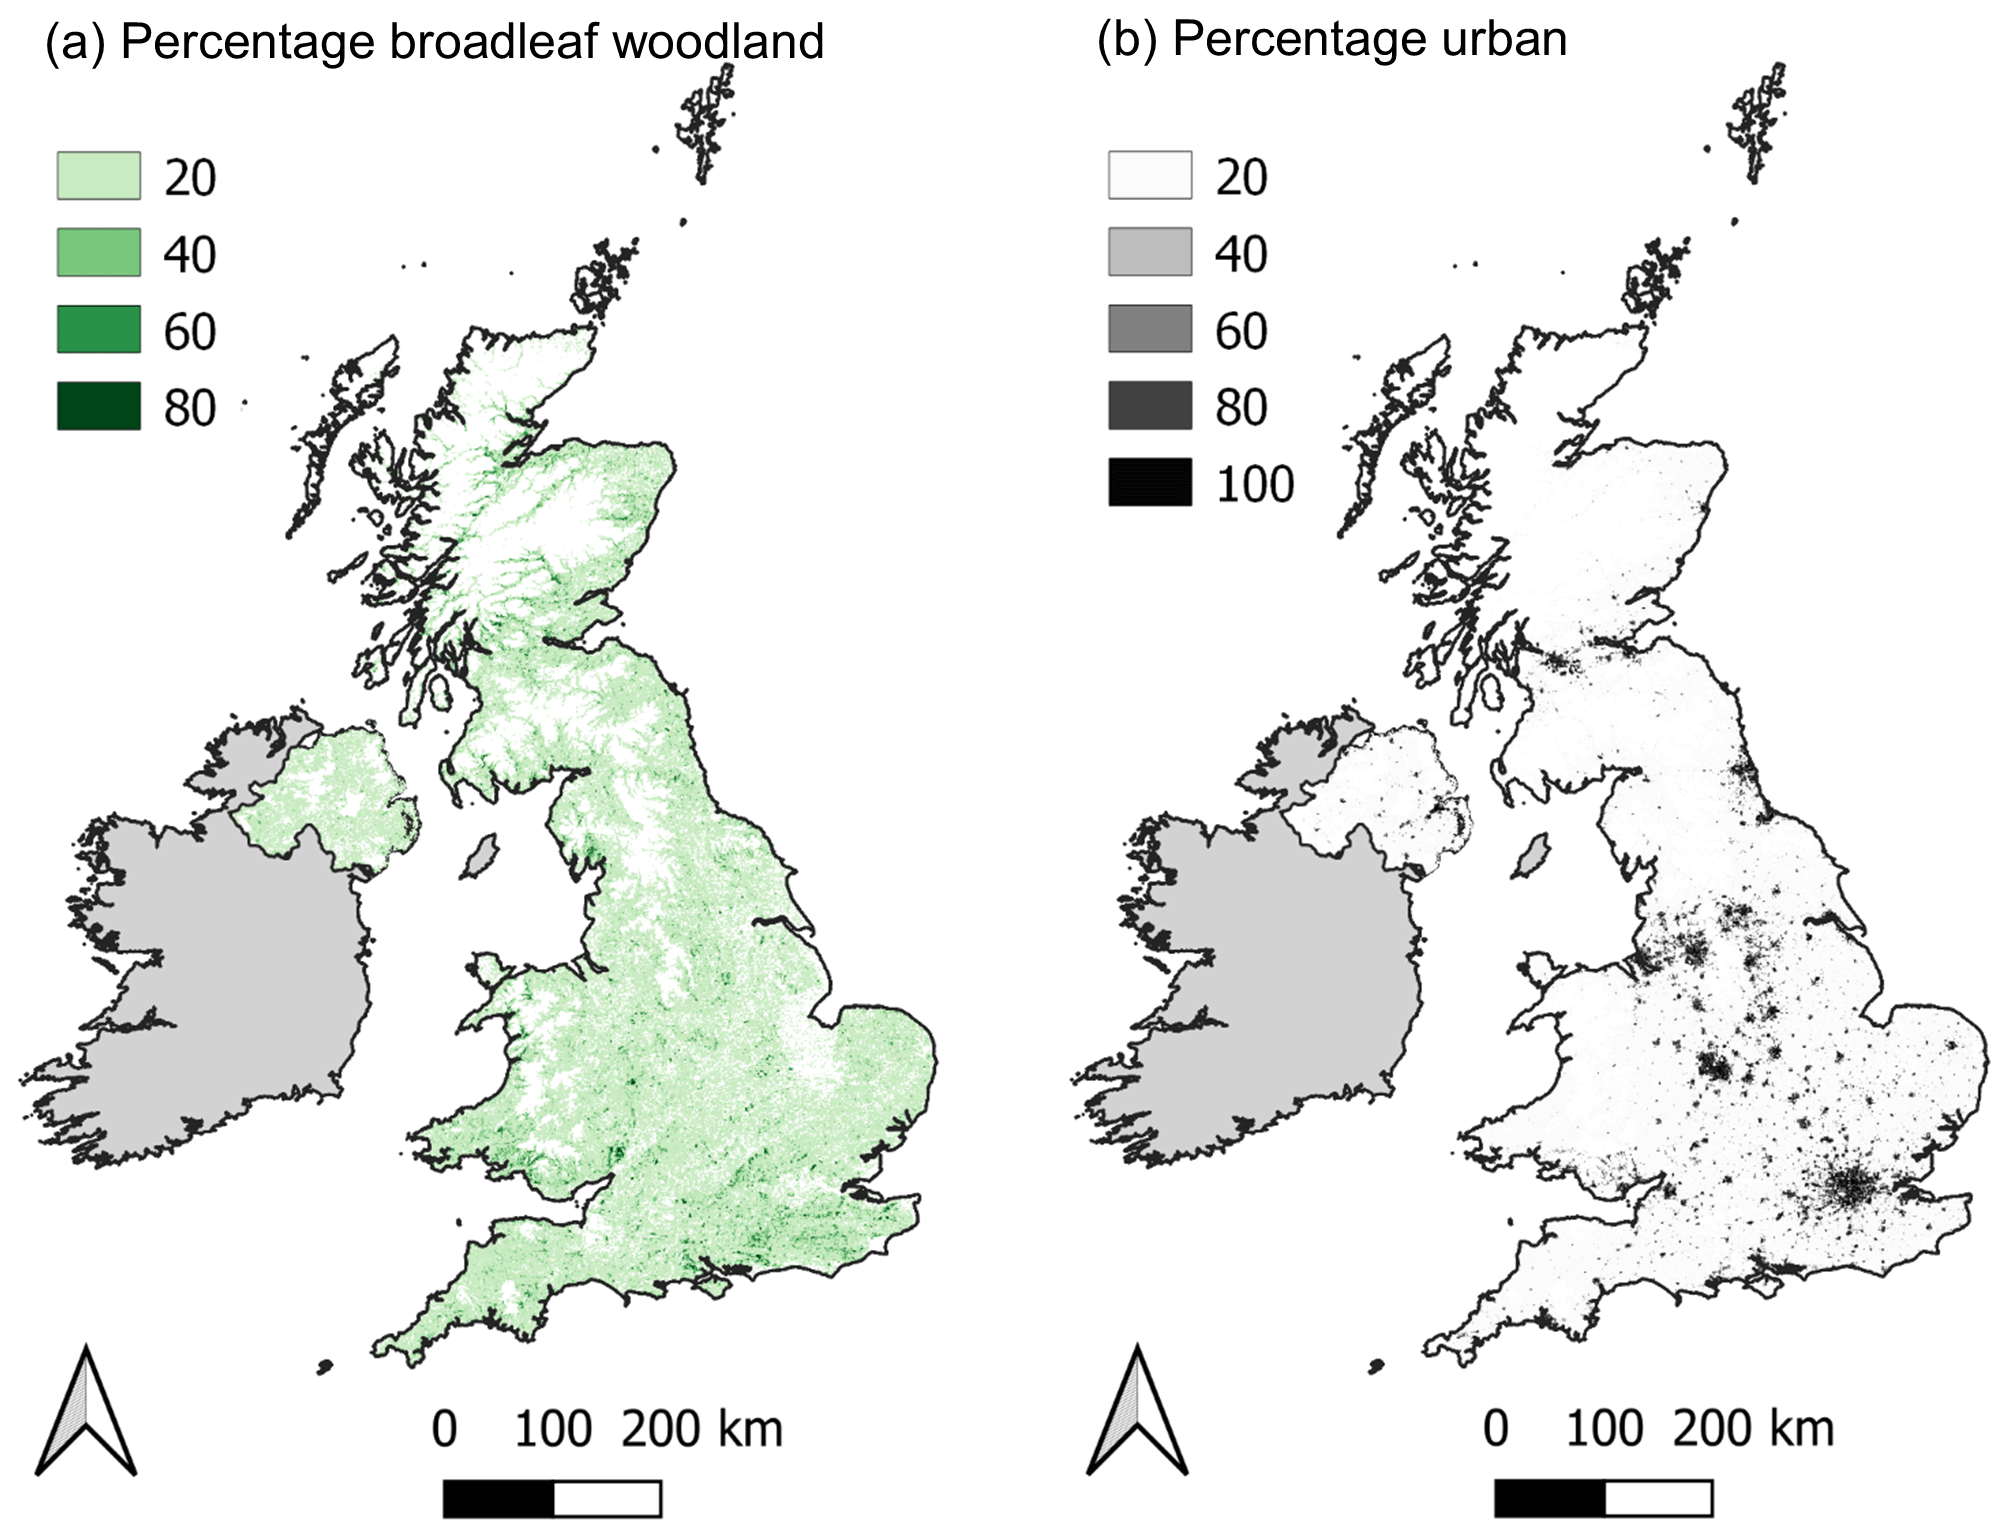
Figure 7Examples of the UK-wide distribution of (a) broadleaf woodland and (b) built-up areas and gardens in terms of percentage cover based on the 1 km aggregate class percentage data sets for GB and NI (Marston et al., 2022g).
LCM2021 is provided in a range of open data formats and in a range of thematic and spatial resolutions to support the needs of a wide range of users and applications. There are 21 target classes in the full-thematic-resolution product and 10 classes in the aggregated products (Table 2). The base product is the 10 m raster (Marston et al., 2022a, b) from which all other products are derived (Fig. 5). The LCM2021 10 m raster is ingested into the spatial framework to produce a vector version of the data set (Marston et al., 2022c, d). The vector version of the data set is then used to create a rasterised polygon version of the data set with a 25 m pixel size (Marston et al., 2022e, f). The 25 m version is effectively the legacy-style land cover map and maintains a spatial consistency with the earlier Landsat-based land cover maps of LCM1990 (Rowland et al., 2020a, b), LCM2007 (Morton et al., 2011b, 2014) and LCM2015 (Rowland et al., 2017a, b); LCM2000 (Fuller et al., 2002a, b) currently uses a different spatial structure. The 25 m raster product is then used to produce the 1 km percentage cover and dominant cover products for both the 21 target classes and the 10 aggregate classes (Marston et al., 2022g). The Great Britain and Northern Ireland data sets are provided separately, with the GB data in the British National Grid projection (EPSG:27700) and the Northern Ireland data in the Irish Grid projection (EPSG:29903).
LCM2021 is produced with a range of spatial resolutions (Fig. 6) to support different types of analyses. The 10 m data set is a relatively new data set (first produced in LCM2020) and is enabled by the 10 m resolution of the optical Sentinel-2 bands. The higher-spatial-resolution products capture the fine detail of the landscape and are often used for the assessment of landscape features requiring a fine resolution, such as habitat connectivity (Hooftman and Bullock, 2012), or for detailed studies of small areas (e.g. Miller et al., 2020). The 1 km data sets are primarily used for national-scale modelling, often in conjunction with a range of other coarser-resolution environmental data sets (e.g. Coxon et al., 2020; Jordan et al., 2022), and these are useful for showing the distribution of a particular class across the UK. For example, Fig. 7 shows the distribution of the broadleaf woodland class and the urban class from the aggregated 1 km percentage data sets for the UK.
Table 6Digital object identifier (DOI) for the LCM2021 openly available products.
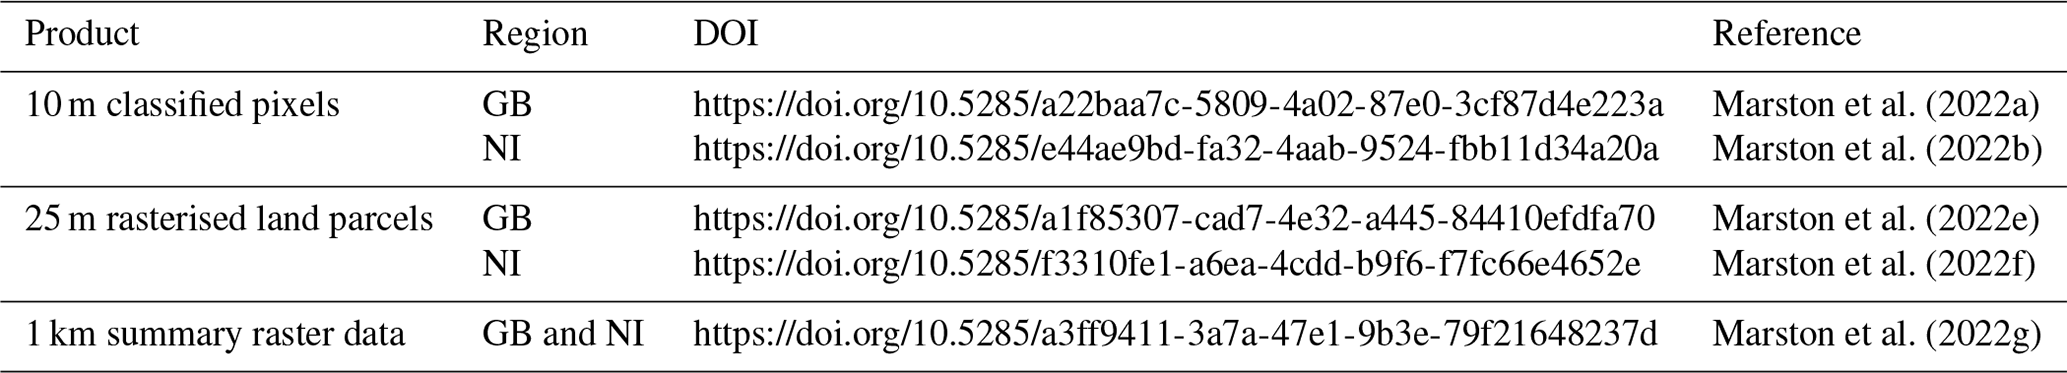
The LCM2021 data products (Table 6) have digital object identifiers (DOIs) and are available via the NERC Environmental Data Service (https://eds.ukri.org/environmental-data-service, last access: 15 December 2022), with all versions listed on the LCM2021 data collection page (https://catalogue.ceh.ac.uk/documents/017313c6-954b-4343-8784-3d61aa6e44da, UKCEH, 2022a). Raster data are provided as uncompressed GeoTIFFs and are supplied with data set documentation and QGIS files for displaying the classifications in the LCM standard palette (used since LCM2000) (see Table B1 in Appendix B, for example) and a palette designed to aid users affected by colour-vision deficiency (see Fig. B1, for example). The 10 m raster data sets are also viewable via a web mapping service (https://catalogue.ceh.ac.uk/documents/2ad19a50-b940-469e-a40d-17818b77020c, UKCEH, 2022b).
All LCM raster data sets are available under a single common licence without charge for non-commercial use, which includes non-commercial research and use within public bodies and charities and their contractors. Alternative licensing can be arranged on request with commercial organisations who wish to use the data sets within their own internal business operations or to develop commercial products or services.
The UK Land Cover Map series, comprising LCM1990 (formerly LCMGB) (Fuller et al., 1994), LCM2000 (Fuller et al., 2002c), LCM2007 (Morton et al., 2011b), LCM2017, LCM2018, LCM2019 and LCM2020, underpins a wide range of UK environmental science analyses, and LCM2021 is expected to continue this trend. The accuracy of LCM2021 varies with class, but it has an overall accuracy of 82.6 % for the 21 target classes and of 86.5 % for the 10 aggregate classes.
Table A1Discussion and commentary on each of the UK LCM2021 land cover and habitat classes. See Jackson (2000) for a description of the underlying Broad Habitat classes.
The UK Land Cover Map can be displayed however users require. However, standard and revised colour palettes are available (Tables B1 and B2) and are supplied as QGIS symbology files to enable users to rapidly display products.
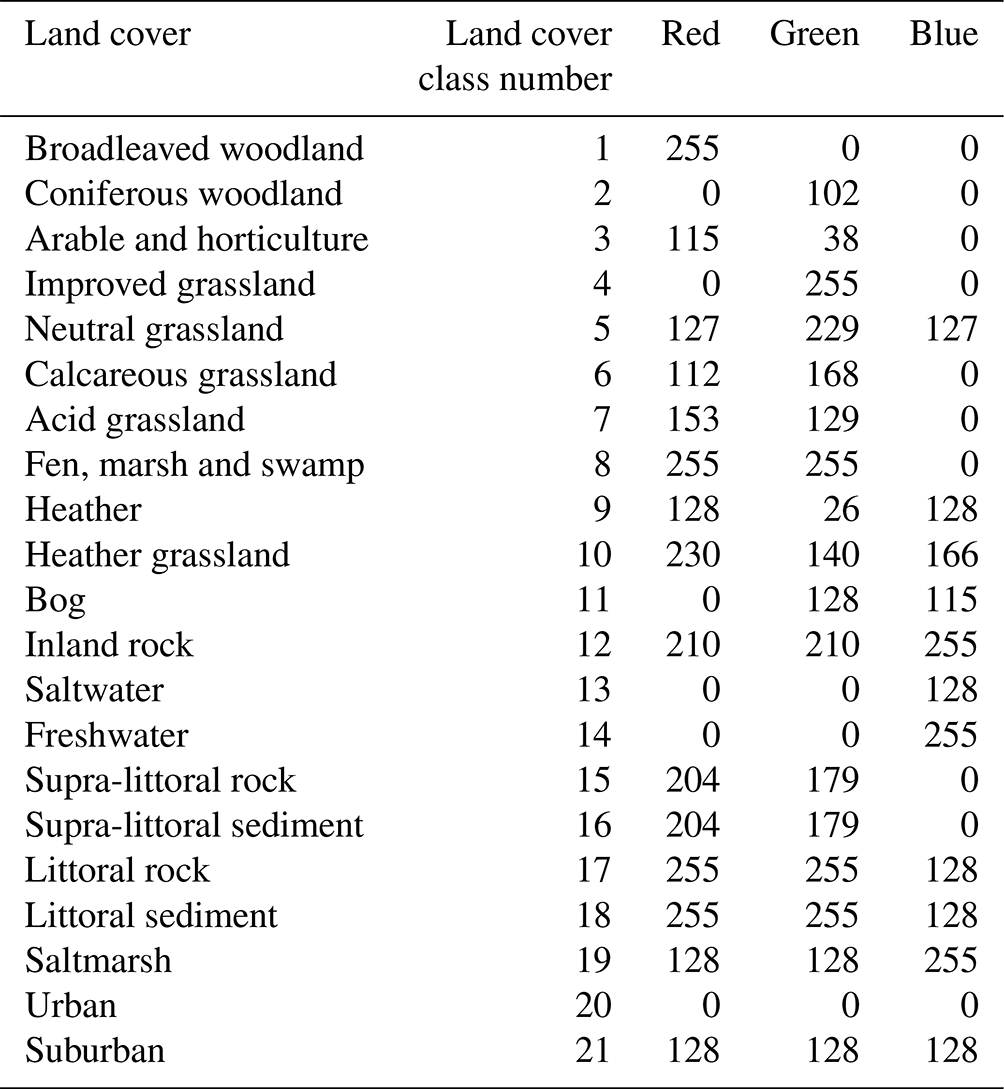
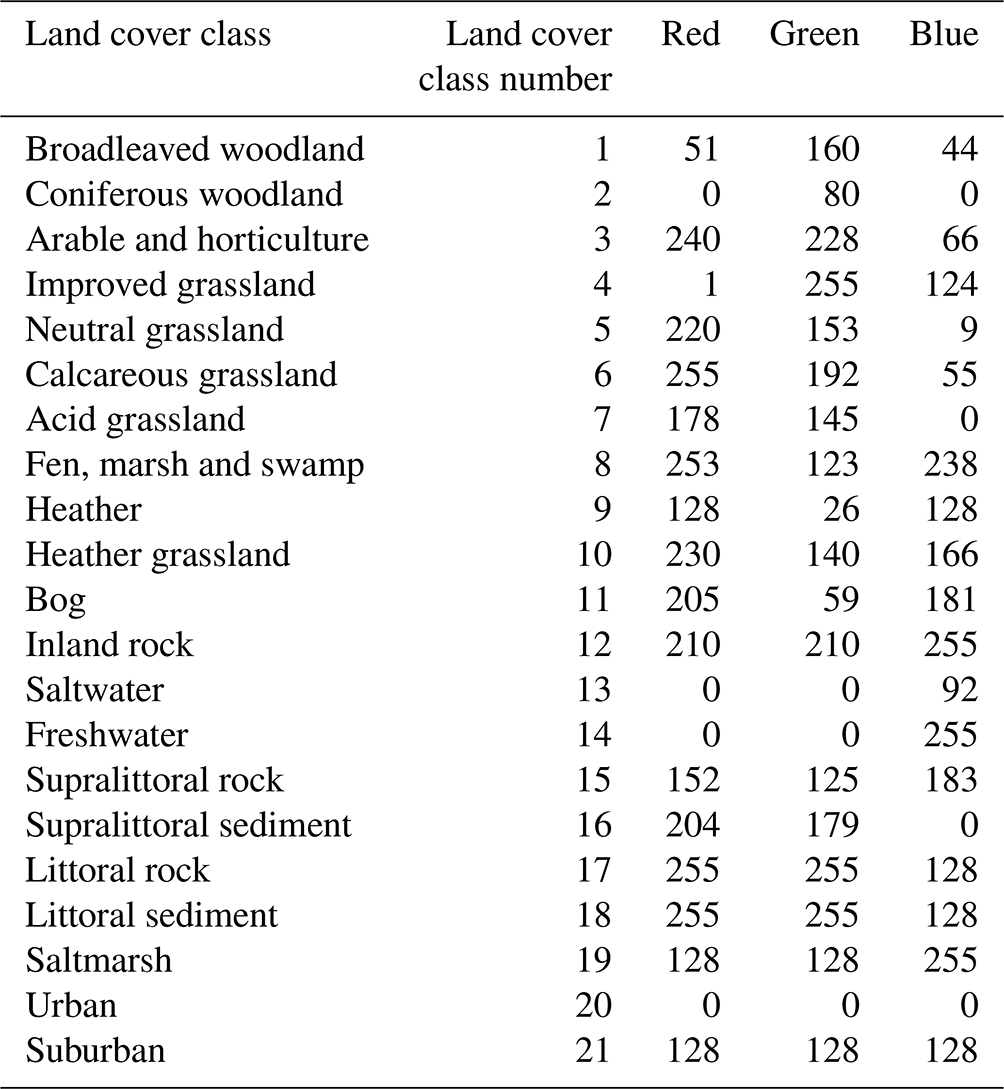
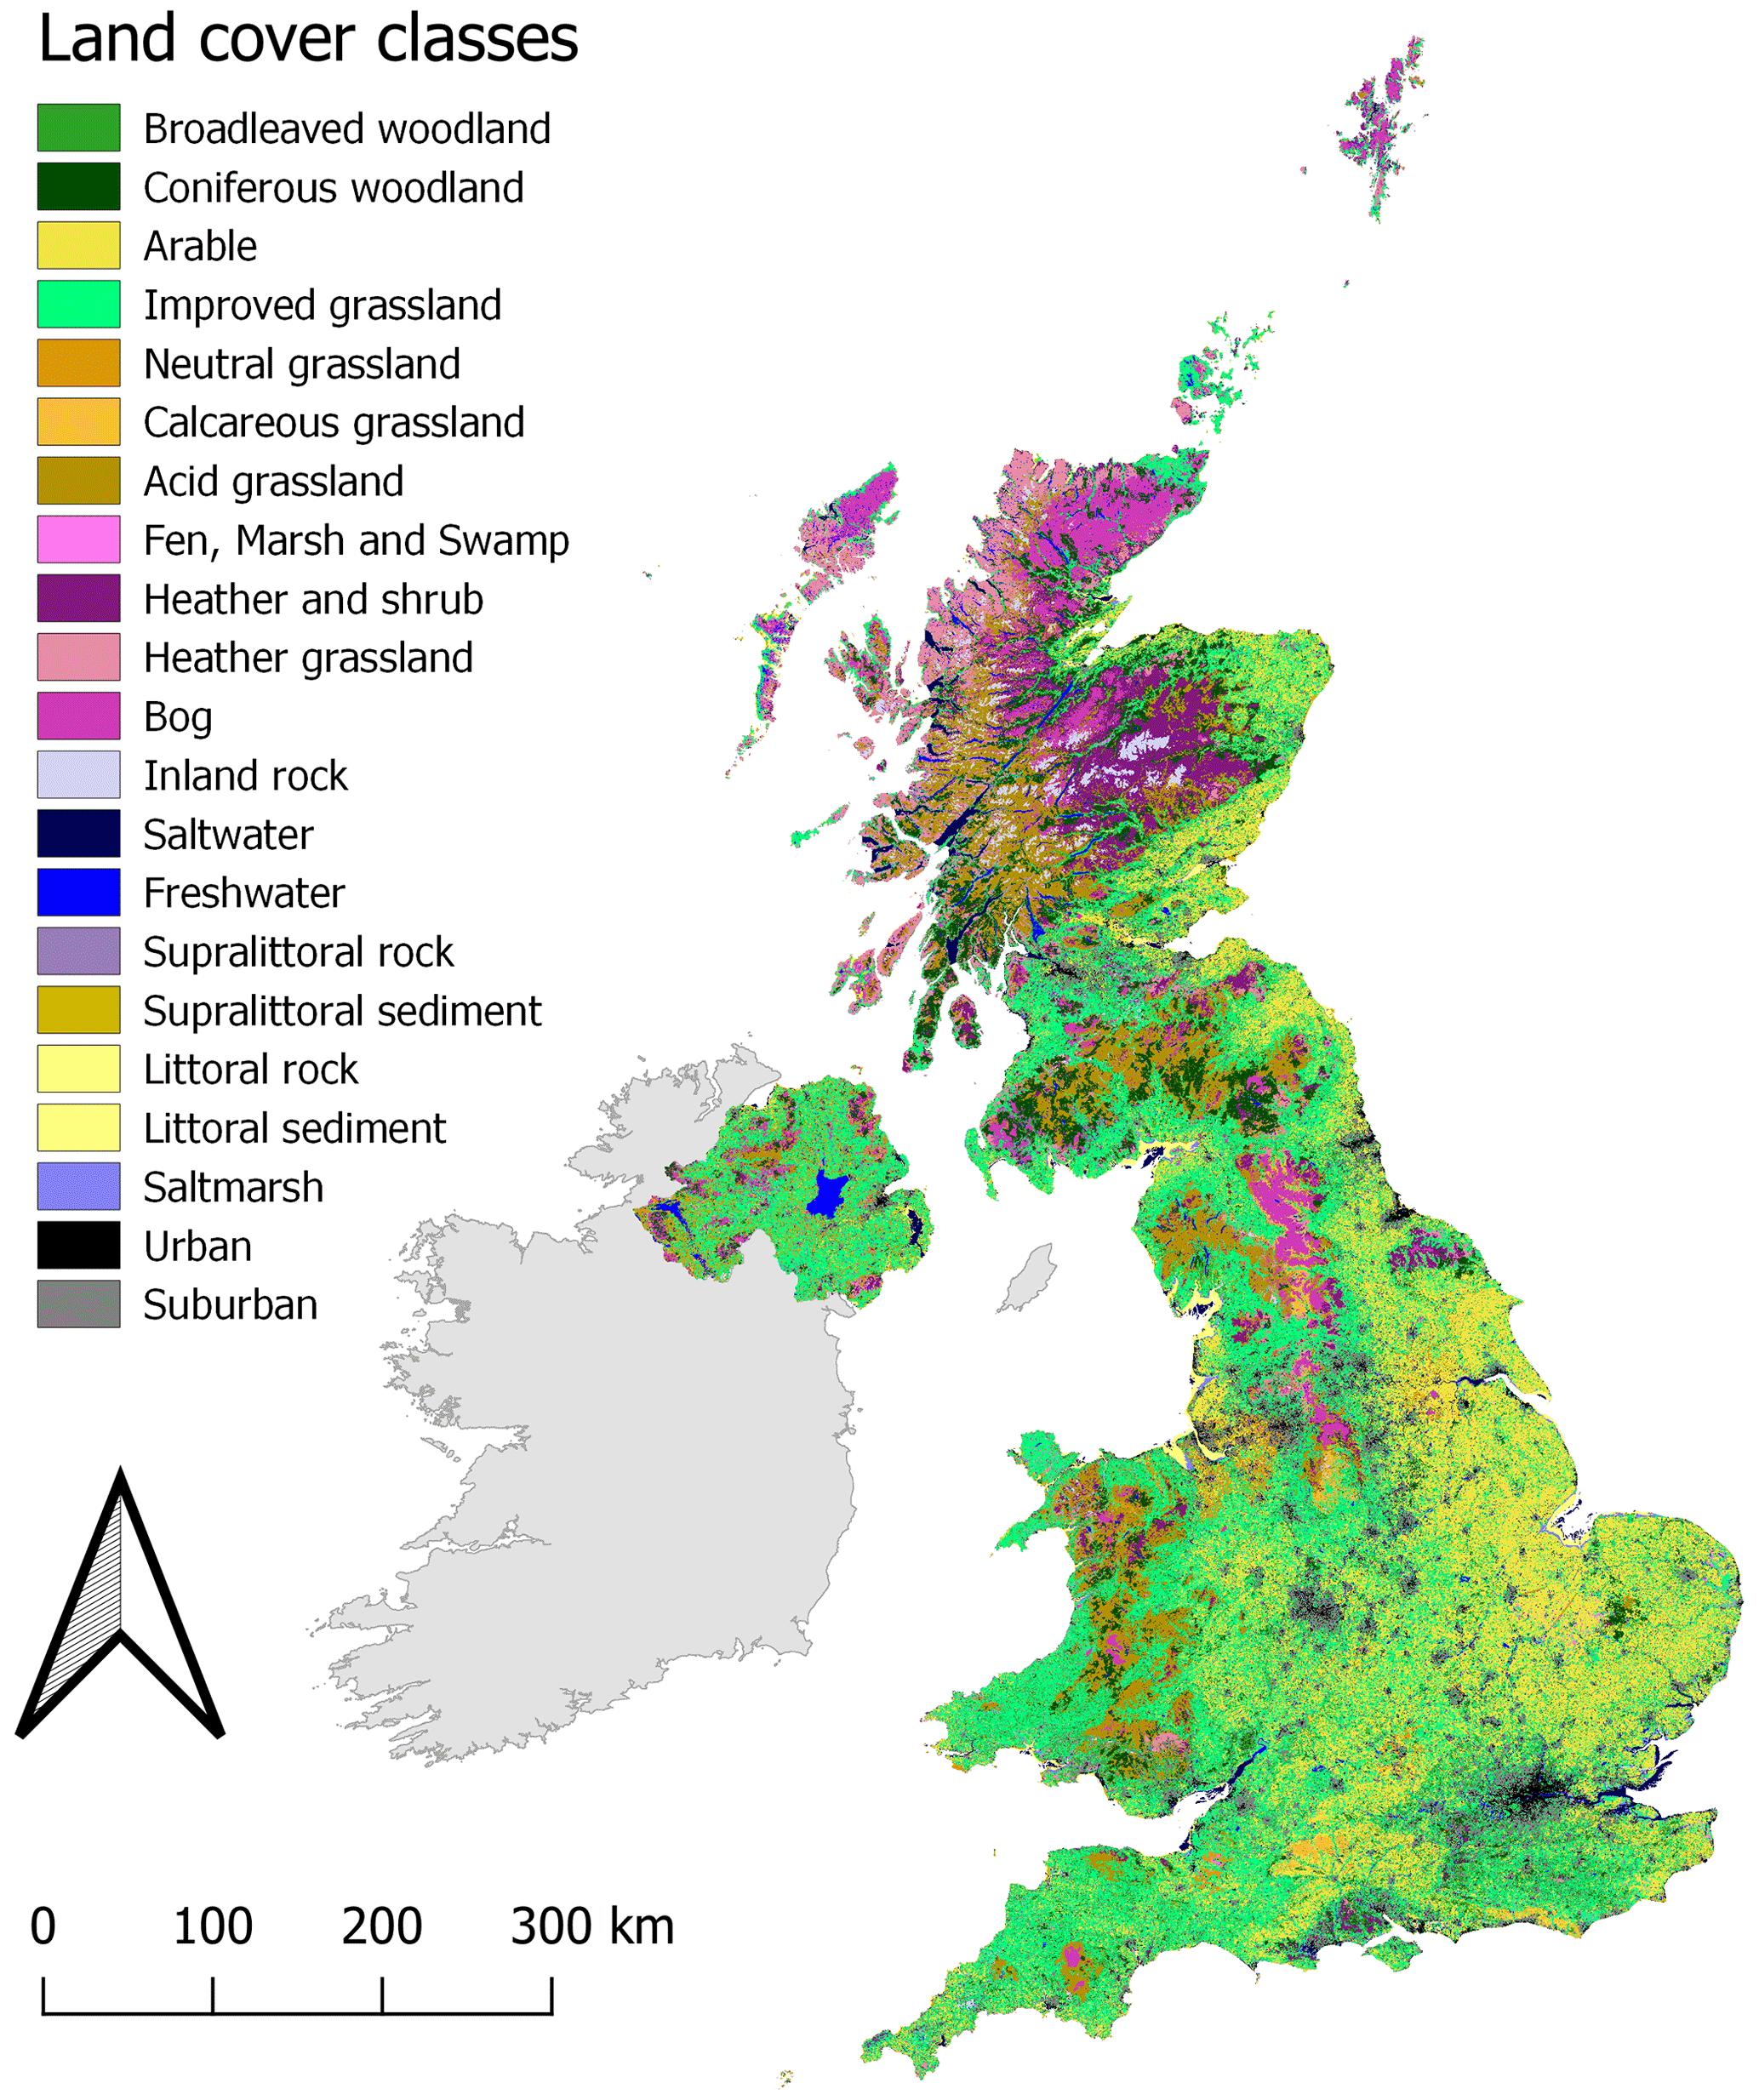
Figure B1Land Cover Map 2021 in revised colour palette (details of revised colour palette in Table B2).
RDM and CSR acquired funding. CGM, CSR and RDM pre-processed the data and conducted classifications. RDM designed and implemented the random forest classification software and supporting computation structures with input from the whole team. CSR, RDM and CGM developed the code for pre-processing the satellite data. CGM, CSR and AWO reviewed the classifications. CSR, CGM and AWO prepared the validation data. CSR and CGM prepared the paper with contributions from RDM, AWO and CMW. RDM, CSR and CGM designed the project. CGM led the production of LCM2021.
The contact author has declared that none of the authors has any competing interests.
Publisher's note: Copernicus Publications remains neutral with regard to jurisdictional claims made in the text, published maps, institutional affiliations, or any other geographical representation in this paper. While Copernicus Publications makes every effort to include appropriate place names, the final responsibility lies with the authors.
The authors would like to thank all the data collectors, processors and providers who made this work possible.
The satellite data provision contains modified Copernicus Sentinel data (2021).
Cartographic and DEM data for NI are from the settlement development limits of the © Northern Ireland Statistics and Research Agency (NISRA) (2015). NI open data layers for coastal water and freshwater are from the © Department of Agriculture, Environment and Rural Affairs, Northern Ireland. OSNI digital elevation data and road network data contain public-sector information licensed under the terms of the Open Government Licence v3.0. Urban green-space correction used green-space areas for NI, identified from OpenStreetMap data provided by OpenStreetMap and available under the Open Database License.
Cartographic data and DEM data for GB are from the digital elevation data of © Intermap Technologies Inc. or its suppliers (2003). OS open data layers contain OS data from © Crown copyright and database right (2015). Boundaries are from the Rural Payments Agency © Crown copyright and database right and/or © third-party licensors; the Welsh Government, Department of Rural Affairs © Crown copyright and database right and/or © third-party licensors; and the Scottish Government © Crown copyright and database right and/or © third-party licensors. This study contains OS Greenspace data © Crown copyright and database right (2021).
Validation data are from the National Forest Inventory (NFI) Woodland GB 2018 data provided by the Forestry Commission and contain Forestry Commission information licensed under the Open Government License v3.0. Defra and the Rural Payments Agency are thanked for the access to the IACS Agricultural data and Rural Payment Agency field survey data. We thank the Countryside Survey team for provision of the Countryside Survey data. Countryside Survey data are owned by the UK Centre for Ecology and Hydrology.
In addition, we thank Robbie Still of the Kent Wildlife Trust for the provision of the revised colour palette, and we thank all those who have been involved in the UK LCM since 1990 as this LCM builds on their hard work.
This paper was edited by Kirsten Elger and reviewed by Daniel Marc dela Torre and one anonymous referee.
This work was supported by the Natural Environment Research Council award number NE/R016429/1 as part of the UK-SCAPE programme delivering National Capability.
Allen, C., Smith, M., Rabiee, M., and Dahmm, H.: A review of scientific advancements in datasets derived from big data for monitoring the Sustainable Development Goals, Sustain. Sci., 16, 1701–1716, https://doi.org/10.1007/s11625-021-00982-3, 2021.
Allen, D. J., Tomlin, A. S., Bale, C. S. E., Skea, A., Vosper, S., and Gallani, M. L.: A boundary layer scaling technique for estimating near-surface wind energy using numerical weather prediction and wind map data, Appl. Energ., 208, 1246–1257, https://doi.org/10.1016/j.apenergy.2017.09.029, 2017.
Baude, M., Kunin, W. E., Boatman, N. D., Conyers, S., Davies, N., Gillespie, M. A., Morton, R. D., Smart, S. M., and Memmott, J.: Historical nectar assessment reveals the fall and rise of floral resources in Britain, Nature, 530, 85–88, https://doi.org/10.1038/nature16532, 2016.
Bojinski, S., Verstraete, M., Peterson, T. C., Richter, C., Simmons, A., and Zemp, M.: The Concept of Essential Climate Variables in Support of Climate Research, Applications, and Policy, B. Am. Meteorol. Soc., 95, 1431–1443, https://doi.org/10.1175/BAMS-D-13-00047.1, 2014.
Breiman, L.: Random forests, Mach Learn., 45, 5–32, https://doi.org/10.1023/A:1010933404324, 2001.
Bussi, G., Dadson, S. J., Prudhomme, C., and Whitehead, P. G.: Modelling the future impacts of climate and land-use change on suspended sediment transport in the River Thames (UK), J. Hydrol., 542, 357–372, https://doi.org/10.1016/j.jhydrol.2016.09.010, 2016.
Carrasco, L., Norton, L., Henrys, P., Siriwardena, G. M., Rhodes, C. J., Rowland, C., and Morton, D.: Habitat diversity and structure regulate British bird richness: Implications of non-linear relationships for conservation, Biol. Conserv., 226, 256–263, https://doi.org/10.1016/j.biocon.2018.08.010, 2018.
Carrasco, L., O'Neil, A. W., Morton, R. D., and Rowland, C. S.: Evaluating combinations of temporally aggregated Sentinel-1, Sentinel-2 and Landsat 8 for land cover mapping with Google Earth Engine, Remote Sens., 3, 288, https://doi.org/10.3390/rs11030288, 2019.
Claverie, M., Ju, J., Masek, J. G., Dungan, J. L., Vermote, E. F., Roger, J. C., Skakun, S. V., and Justice, C.: The Harmonized Landsat and Sentinel-2 surface reflectance data set, Remote Sens. Environ., 219, 145–161, https://doi.org/10.1016/j.rse.2018.09.002, 2018.
Coxon, G., Addor, N., Bloomfield, J. P., Freer, J., Fry, M., Hannaford, J., Howden, N. J. K., Lane, R., Lewis, M., Robinson, E. L., Wagener, T., and Woods, R.: CAMELS-GB: hydrometeorological time series and landscape attributes for 671 catchments in Great Britain, Earth Syst. Sci. Data, 12, 2459–2483, https://doi.org/10.5194/essd-12-2459-2020, 2020.
Croft, S., Chauvenet, A. L., and Smith, G. C.: A systematic approach to estimate the distribution and total abundance of British mammals, PloS one, 12, e0176339, https://doi.org/10.1371/journal.pone.0176339, 2017.
Drusch, M., Del Bello, U., Carlier, S., Colin, O., Fernandez, V., Gascon, F., Hoersch, B., Isola, C., Laberinti, P., Martimort, P., and Meygret, A.: Sentinel-2: ESA's optical high-resolution mission for GMES operational services, Remote. Sens. Environ., 120, 25–36, https://doi.org/10.1016/j.rse.2011.11.026, 2012.
Emmett, B. A., Cooper, D., Smart, S., Jackson, B., Thomas, A., Cosby, B., Evans, C., Glanville, H., McDonald, J. E., Malham, S. K., and Marshall, M.: Spatial patterns and environmental constraints on ecosystem services at a catchment scale, Sci. Total. Environ., 572, 1586–1600, https://doi.org/10.1016/j.scitotenv.2016.04.004, 2016.
FEH: Flood Estimation Handbook Web Service, https://fehweb.ceh.ac.uk/ (last access: 28 November 2018), 2018.
Foley, J. A., DeFries, R., Asner, G. P., Barford, C., Bonan, G., Carpenter, S. R., Chapin, F. S., Coe, M. T., Daily, G. C., Gibbs, H. K., Helkowski, J. H., Holloway, T., Howard, E. A., Kucharik, C. J., Monfreda, C., Patz, J. A., Prentice, C. I., Ramankutty, N., and Snyder, P. K.: Global Consequences of land Use, Science, 309, 570–574, https://doi.org/10.1126/science.1111772, 2005.
Foody, G. M.: Status of land cover classification accuracy assessment, Remote. Sens. Environ., 80, 185–201, https://doi.org/10.1016/S0034-4257(01)00295-4, 2002.
Frank, E., Hall, M. A., and Witten, I. H.: The WEKA Workbench, Online Appendix for “Data Mining: Practical Machine Learning Tools and Techniques”, Morgan Kaufmann, 4th Edn, https://www.cs.waikato.ac.nz/ml/weka/Witten_et_al_2016_appendix.pdf (last access: 15 December 2022), 2016.
Fraser, E. J., Lambin, X., Travis, J. M., Harrington, L. A., Palmer, S. C., Bocedi, G., and Macdonald, D. W.: Range expansion of an invasive species through a heterogeneous landscape–the case of American mink in Scotland, Divers. Distrib., 21, 888–900, https://doi.org/10.1111/ddi.12303, 2015.
Fuller, R. M., Groom, G. B., and Jones, A. R.: The Land Cover Map of Great Britain: an automated classification of Landsat Thematic Mapper data, Photogramm. Eng. Rem. S., 60, 553–562, 1994.
Fuller, R. M., Smith, G. M., Sanderson J. M., Hill, R. A., Thomson, A. G., Cox, R., Brown, N. J., Clarke, R. T., Rothery, P., and Gerard, F. F.: Land Cover Map 2000 (vector, GB), NERC Environmental Information Data Centre [data set], https://doi.org/10.5285/b79e887e-a2a7-4224-8fd7-e78066b950b3, 2002a.
Fuller, R. M., Smith, G. M., Sanderson J. M., Hill, R. A., Thomson, A. G., Cox, R., Brown, N. J., Clarke, R. T., Rothery, P., and Gerard, F. F.: Land Cover Map 2000 (vector, N.Ireland), NERC Environmental Information Data Centre [data set], https://doi.org/10.5285/9f043047-d1c7-4852-b513-aa00204022a8, 2002b.
Fuller, R. M., Smith, G. M., Sanderson, J. M., Hill, R. A., and Thomson, A. G.: The UK Land Cover Map 2000: construction of a parcel-based vector map from satellite images, Cartogr. J., 39, 15–25, https://doi.org/10.1179/caj.2002.39.1.15, 2002c.
Gorelick, N., Hancher, M., Dixon, M., Ilyushchenko, S., Thau, D., and Moore, R.: Google Earth Engine: Planetary-scale geospatial analysis for everyone, Remote Sens. Environ., 202, 18–17, https://doi.org/10.1016/j.rse.2017.06.031, 2017.
Gulliver, J., de Hoogh, K., Fecht, D., Vienneau, D., and Briggs, D.: Comparative assessment of GIS-based methods and metrics for estimating long-term exposures to air pollution, Atmos. Environ., 45, 7072–7080, https://doi.org/10.1016/j.atmosenv.2011.09.042, 2011.
Hall, M., Frank, E., Holmes, G., Pfahringer, B., Reutemann, P., and Witten, I. H.: The WEKA data mining software: an update, SIGKDD Explor. Newsl. 11, 10–18, https://doi.org/10.1145/1656274.1656278, 2009.
Harrison, P. A., Dunford R., Whittaker, F., Mondain-Monval, T., Beauchamp, K., Cooper, J., Dickie, I., Fitch, A., Gooday, R., Hollaway, M., Holman, I. P., Jones, L., Matthews, R., Sandars, D., Seaton, F., Siriwardena, G. M., Smart, S. M., Thomas, A. R. C., Trembath, P., Vieno, M., West, B., and Williams, A. G.: Environment and Rural Affairs Monitoring and Modelling Programme (ERAMMP). ERAMMP Technical Annex-2 Report-60TA2: ERAMMP Integrated Modelling Platform (IMP) Land Use Scenarios Quality Assurance, Report to Welsh Government (Contract C210/2016/2017) (UK Centre for Ecology and Hydrology Projects 06297 and 06810), https://erammp.wales/sites/default/files/2022-11/60b%20ERAMMP%20Rpt-60TA2%20IMP%20Land%20Use%20Scenarios%20QA%20Annex.pdf (last access: 15 December 2022), 2022.
Holben, B. N.: Characteristics of maximum-value composite images from temporal AVHRR data, Int. J. Remote Sens., 7, 1417–1434, https://doi.org/10.1080/01431168608948945, 1986.
Hooftman, D. A. P. and Bullock, J. M.: Mapping to inform conservation: a case study of changes in semi-natural habitats and their connectivity over 70 years, Biol. Conserv., 145, 30–38, https://doi.org/10.1016/j.biocon.2011.09.015, 2012.
Ishizu, K. and Tran, H. N.: TV white space communication system: NICT's device and database technologies and prototypes, in: Presentation at ETSI RRS Workshop, Spectrum management issues on the use of white spaces by cognitive radio systems, Geneva, Vol. 20, https://docbox.etsi.org/Workshop/2014/201412_RRSWORKSHOP/Demonstrations/Ha-Nguyen_NICT.pdf (last access: 15 December 2022), 2014.
Jackson, D. L.: Guidance on the interpretation of the Biodiversity Broad Habitat Classification (terrestrial and freshwater types): Definitions and the relationship with other classifications, JNCC Report 307, Peterborough, UK, ISSN 0963 8091, 73 pp., https://data.jncc.gov.uk/data/0b7943ea-2eee-47a9-bd13-76d1d66d471f/JNCC-Report-307-SCAN-WEB.pdf (last access: 15 December 2022), 2000.
Jarvis, S. G., Redhead, J. W., Henrys, P. A., Risser, H. A., Da Silva Osório, B. M., and Pywell, R. F.: CEH Land Cover plus: Pesticides 2012–2017 (England, Scotland and Wales), NERC Environmental Information Data Centre [data set], https://doi.org/10.5285/99a2d3a8-1c7d-421e-ac9f-87a2c37bda62, 2020.
Jordon, M. W., Smith, P., Long, P. R., Bürkner, P. C., Petrokofsky, G., and Willis, K. J.: Can Regenerative Agriculture increase national soil carbon stocks? Simulated country-scale adoption of reduced tillage, cover cropping, and ley-arable integration using RothC, Sci. Total Environ., 825, 153955, https://doi.org/10.1016/j.scitotenv.2022.153955, 2022.
Lambin, E. F., Turner, B. L., Geist, H. J., Agbola, S. B., Angelsen, A., Bruce, J. W., Coomes, O. T., Dirzo, R., Fischer, G., Folke, C., George, P. S., Homewood, K., Jacques Imbernon, J., Rik Leemans, R., Xiubin Li, X., Emilio F., Moran, E. F., Michael Mortimore, M., Ramakrishnan, P. S., Richards, J. F., Skånes, H., Steffen, W., Stone, G. D., Svedin, U., Veldkamp, T. A., Vogel, C., and Xu, J.: The causes of land-use and land-cover change: moving beyond the myths, Global Environ. Chang., 11, 261–269, https://doi.org/10.1016/S0959-3780(01)00007-3, 2001.
Mair, L., Hill, J. K., Fox, R., Botham, M., Brereton, T., and Thomas, C. D.: Abundance changes and habitat availability drive species' responses to climate change, Nat. Clim. Change, 4, 127, https://doi.org/10.1038/nclimate2086, 2014.
McInnes, R. N., Hemming, D., Burgess, P., Lyndsay, D., Osborne, N. J., Skjøth, C. A., Thomas, S., and Vardoulakis, S.: Mapping allergenic pollen vegetation in UK to study environmental exposure and human health, Sci. Total Environ., 599, 483–499, https://doi.org/10.1016/j.scitotenv.2017.04.136, 2017.
Marston, C., Rowland, C. S., O'Neil, A. W., and Morton, R. D.: Land Cover Map 2021 (10 m classified pixels, GB), NERC EDS Environmental Information Data Centre [data set], https://doi.org/10.5285/a22baa7c-5809-4a02-87e0-3cf87d4e223a, 2022a.
Marston, C., Rowland, C. S., O'Neil, A. W., and Morton, R. D.: Land Cover Map 2021 (10 m classified pixels, N. Ireland), NERC EDS Environmental Information Data Centre [data set], https://doi.org/10.5285/e44ae9bd-fa32-4aab-9524-fbb11d34a20a, 2022b.
Marston, C., Rowland, C. S., O'Neil, A. W., and Morton, R. D.: Land Cover Map 2021 (land parcels, GB), NERC EDS Environmental Information Data Centre [data set], https://doi.org/10.5285/398dd41e-3c08-47f5-811f-da990007643f, 2022c.
Marston, C., Rowland, C. S., O'Neil, A. W., and Morton, R. D.: Land Cover Map 2021 (land parcels, N. Ireland), NERC EDS Environmental Information Data Centre [data set], https://doi.org/10.5285/abe1f414-6168-4e04-9dc9-4a658a3136ca, 2022d.
Marston, C., Rowland, C. S., O'Neil, A. W., and Morton, R. D.: Land Cover Map 2021 (25 m rasterised land parcels, GB). NERC EDS Environmental Information Data Centre [data set], https://doi.org/10.5285/a1f85307-cad7-4e32-a445-84410efdfa70, 2022e.
Marston, C., Rowland, C. S., O'Neil, A. W., and Morton, R. D.: Land Cover Map 2021 (25 m rasterised land parcels, N. Ireland), NERC EDS Environmental Information Data Centre [data set], https://doi.org/10.5285/f3310fe1-a6ea-4cdd-b9f6-f7fc66e4652e, 2022f.
Marston, C., Rowland, C. S., O'Neil, A. W., and Morton, R. D.: Land Cover Map 2021 (1 km summary rasters, GB and N. Ireland), NERC EDS Environmental Information Data Centre [data set], https://doi.org/10.5285/a3ff9411-3a7a-47e1-9b3e-79f21648237d, 2022g.
Miller, J. D., Stewart, E., Hess, T., and Brewer, T.: Evaluating landscape metrics for characterising hydrological response to storm events in urbanised catchments, Urban Water J., 17, 247–258, https://doi.org/10.1080/1573062X.2020.1760320, 2020.
Morecroft, M. D., Duffield, S., Harley, M., Pearce-Higgins, J. W., Stevens, N., Watts, O., and Whitaker, J.: Measuring the success of climate change adaptation and mitigation in terrestrial ecosystems, Science, 366, eaaw9256, https://doi.org/10.1126/science.aaw9256, 2019.
Morton, R. D., Rowland, C., Wood, C. Meek, L., Marston, C., Smith, G., Wadsworth, R., and Simpson, I.C.: Final Report for LCM2007 – the new UK land cover map, Countryside Survey Technical Report No 11/07 NERC/Centre for Ecology and Hydrology, Wallingford, https://nora.nerc.ac.uk/id/eprint/14854 (last access: 15 December 2022), 2011a.
Morton, R. D., Rowland, C., Wood, C. M., Meek, L., Marston, G., Smith, G., Wadsworth, R., and Simpson, I.: Land Cover Map 2007 (vector, N. Ireland), NERC Environmental Information Data Centre [data set], https://doi.org/10.5285/fdc3fd67-a0bc-4e94-950e-9cabd4e636bb, 2011b.
Morton, R. D., Rowland, C. S., Wood, C. M., Meek, L., Marston, C. G., and Smith, G. M.: Land Cover Map 2007 (vector, GB) v1.2, NERC Environmental Information Data Centre [data set], https://doi.org/10.5285/2ab0b6d8-6558-46cf-9cf0-1e46b3587f13, 2014.
Morton, R. D., Marston, C. G., O'Neil, A. W., and Rowland, C. S.: Land Cover Map 2018 (land parcels, GB), NERC Environmental Information Data Centre [data set], https://doi.org/10.5285/9f7f7f70-5137-4bfc-a6a3-f91783d5a6a6, 2020a.
Morton, R. D., Marston, C. G., O'Neil, A. W., and Rowland, C. S.: Land Cover Map 2018 (land parcels, N. Ireland), NERC Environmental Information Data Centre [data set], https://doi.org/10.5285/35f15502-d340-4ab5-a586-abd42f238b6e, 2020b.
Morton, R. D., Marston, C. G., O'Neil, A. W., and Rowland, C. S.: Land Cover Map 2019 (land parcels, GB), NERC Environmental Information Data Centre [data set], https://doi.org/10.5285/44c23778-4a73-4a8f-875f-89b23b91ecf8, 2020c.
Morton, R. D., Marston, C. G., O'Neil, A. W., and Rowland, C. S.: Land Cover Map 2019 (land parcels, N. Ireland), NERC Environmental Information Data Centre [data set], https://doi.org/10.5285/6e67cba0-c872-4146-bc09-d6c98731f3b3, 2020d.
Morton, R. D., Marston, C. G., O'Neil, A. W., and Rowland, C. S.: Land Cover Map 2020 (land parcels, GB), NERC EDS Environmental Information Data Centre [data set], https://doi.org/10.5285/0e99d57e-1757-451f-ac9d-92fd1256f02a, 2021e.
Morton, R. D., Marston, C. G., O'Neil, A. W., and Rowland, C. S.: Land Cover Map 2020 (land parcels, N. Ireland), NERC EDS Environmental Information Data Centre [data set], https://doi.org/10.5285/36343ace-d56a-43ea-9d48-2f434dafcb26, 2021f.
Natural England: GCN – Risk Zones (Shropshire), https://www.data.gov.uk/dataset/998ebd5a-e0f5-4fbc-a349-719e8a71ab37/gcn-risk-zones-shropshire#licence-info (last access: 15 December 2022), 2022.
NFI: National Forest Inventory GB 2018 data set, https://data-forestry.opendata.arcgis.com/datasets/d3d7bfba1cba4a3b83a948f33c5777c0_0/ (last access: 15 December 2022), 2019.
Norton, L. R., Smart, S. M., Maskell, L. C., Henrys, P. A., Wood, C. M., Keith, A. M., Emmett, B. A., Cosby, B. J., Thomas, A., Scholefield, P. A., Greene, S., Morton, R. D., and Rowland, C. S.: Identifying effective approaches for monitoring national natural capital for policy use, Ecosyst. Serv., 30, 98–106, https://doi.org/10.1016/j.ecoser.2018.01.017, 2018.
Office for National Statistics (ONS): Semi-natural habitat natural capital accounts, UK: https://www.ons.gov.uk/economy/environmentalaccounts/bulletins/seminaturalhabitatnaturalcapitalaccountsuk/2021 (last access: 15 December 2022), 2021.
Oliver, T. H. and Morecroft, M. D.: Interactions between climate change and land use change on biodiversity: attribution problems, risks, and opportunities, Wires Clim. Change, 5, 317–335, https://doi.org/10.1002/wcc.271, 2014.
Reynard, N. S., Prudhomme, C., and Crooks, S. M.: The flood characteristics of large UK rivers: potential effects of changing climate and land use, Climatic Change, 48, 343–359, https://doi.org/10.1023/A:1010735726818, 2001.
Rockström, J., Steffen, W., Noone, K., Persson, Å., Chapin, F. S., Lambin, E. F., Lenton, T. M., Scheffer, M., Folke, C., Schellnhuber, H. J., and Nykvist, B.: A safe operating space for humanity, Nature, 461, 472–475, https://doi.org/10.1038/461472a, 2009.
Rogan, J., Miller, J., Stow, D., Franklin, J., Levien, L., and Fischer, C.: Land-cover change monitoring with classification trees using Landsat TM and ancillary data, Photogramm. Eng. Rem. S., 69, 793–804, https://doi.org/10.14358/PERS.69.7.793, 2003.
Rowland, C. S., Morton, R. D., Carrasco, L., McShane, G., O'Neil, A. W., and Wood, C. M.: Land Cover Map 2015 (vector, GB), NERC Environmental Information Data Centre [data set], https://doi.org/10.5285/6c6c9203-7333-4d96-88ab-78925e7a4e73, 2017a.
Rowland, C. S., Morton, R. D., Carrasco, L., McShane, G., O'Neil, A. W., and Wood, C. M.: Land Cover Map 2015 (vector, N. Ireland), NERC Environmental Information Data Centre [data set], https://doi.org/10.5285/60764028-adeb-4316-987a-14b3b21a8f9a, 2017b.
Rowland, C. S., Marston, C. G., Morton, R. D., and O'Neil, A. W.: Land Cover Map 1990 (vector, GB), NERC Environmental Information Data Centre [data set], https://doi.org/10.5285/304a7a40-1388-49f5-b3ac-709129406399, 2020a.
Rowland, C. S., Marston, C. G., Morton, R. D., and O'Neil, A. W.: Land Cover Map 1990 (vector, N. Ireland), NERC Environmental Information Data Centre [data set], https://doi.org/10.5285/d6a3588b-23a8-4715-88e9-e21ab0060727, 2020b.
Senapathi, D., Carvalheiro, L. G., Biesmeijer, J. C., Dodson, C. A., Evans, R. L., McKerchar, M., Morton, R. D., Moss, E. D., Roberts, S. P., Kunin, W. E., and Potts, S. G.: The impact of over 80 years of land cover changes on bee and wasp pollinator communities in England, P. Roy. Soc. B., 282, 20150294, https://doi.org/10.1098/rspb.2015.0294, 2015.
Skakun, S., Wevers, J., Brockmann, C., Doxani, G., Aleksandrov, M., Batič, M., Frantz, D., Gascon, F., Gómez-Chova, L., Hagolle, O., López-Puigdollers, D., Louis, J., Lubej, M., Mateo-García, G., Osman, J., Peressutti, D., Pflug, B., Puc, J., Richter, R., Roger, J-C., Scaramuzza, P., Vermote, E., Vesel, N., Zupanc, A., and Žust, L.: Cloud Mask Intercomparison eXercise (CMIX): An evaluation of cloud masking algorithms for Landsat 8 and Sentinel-2, Remote Sens. Environ., 274, 112990, https://doi.org/10.1016/j.rse.2022.112990, 2022.
Smith, G., Beare, M., Boyd, M., Downs, T., Gregory, M., Morton, D., Brown, N., and Thomson, A.: UK land cover map production through the generalisation of OS MasterMap®, Cartogr. J., 44, 276–283, https://doi.org/10.1179/000870407X241827, 2007.
Stedman, J. R., Anderson, H. R., Atkinson, R. W., and Maynard, R. L.: Emergency hospital admissions for respiratory disorders attributable to summer time ozone episodes in Great Britain, Thorax., 52, 958–963, https://doi.org/10.1136/thx.52.11.958, 1997.
Taylor, S. D., He, Y., and Hiscock, K. M.: Modelling the impacts of agricultural management practices on river water quality in Eastern England, J. Environ. Manage., 180, 147–163, https://doi.org/10.1016/j.jenvman.2016.05.002, 2016.
Teixeira, Z., Teixeira, H., and Marques, J. C.: Systematic processes of land use/land cover change to identify relevant driving forces: Implications on water quality, Sci. Total Environ., 470, 1320–1335, https://doi.org/10.1016/j.scitotenv.2013.10.098, 2014.
Tew, T. and Nicolet, P.: District Licensing for Great Crested Newts – A Successful First Year for the South Midlands Scheme, in: Practice: Bulletin of the Chartered Institute of Ecology and Environmental Management, 103, 28–32, https://naturespaceuk.com/download/2419/ (last access: 15 December 2022), 2019.
Turner, B. L., Lambin, E. F., and Reenberg, A.: The emergence of land change science for global environmental change and sustainability, P. Natl. Acad. Sci. USA, 104, 20666–20671, https://doi.org/10.1073/pnas.0704119104, 2007.
UKCEH: Impact CASE STUDY: Informing government and business decision-making by mapping how land is used across the UK, https://www.ceh.ac.uk/sites/default/files/2021-06/UKCEH-Case-study-Informing-decision-making-by-mapping-land-cover.pdf (last access: 15 December 2022), 2021.
UKCEH: LCM2021 Data Collection, UKCEH [data set], https://catalogue.ceh.ac.uk/documents/017313c6-954b-4343-8784-3d61aa6e44da (last access: 15 December 2022), 2022a.
UKCEH: Land Cover Map 2021 10 m web map service – EIDC (ceh.ac.uk), UKCEH [data set], https://catalogue.ceh.ac.uk/documents/2ad19a50-b940-469e-a40d-17818b77020c (last access: 15 December 2022), 2022b.
United Utilities: River Dee Catchment – Using Data and Evidence to Target Water Quality Measures, https://issuu.com/westcountryriverstrust/docs/uu_dee_catchment_report_11-09-17_we (last access: 25 August 2022), 2017.
White, C., Dunscombe, R., Dvarskas, A., Eves, C., Finisdore, J., Kieboom, E., Maclean, I., Obst, C., Rowcroft, P., and Silcock, P.: “Developing ecosystem accounts for protected areas in England and Scotland: Main Report”, Department for Food, Environment and Rural Affairs/The Scottish Government, http://sciencesearch.defra.gov.uk/Default.aspx?Menu=MenuandModule=MoreandLocation=NoneandCompleted=0andProjectID=19271 (last access: 15 December 2022), 2015.
Wint, G. W., Robinson, T. P., Bourn, D. M., Durr, P. A., Hay, S. I., Randolph, S. E., and Rogers, D. J.: Mapping bovine tuberculosis in Great Britain using environmental data, Trends Microbiol., 10, 441–444, https://doi.org/10.1016/S0966-842X(02)02444-7, 2002.
Wood, C. M., Smart, S. M., Bunce, R. G. H., Norton, L. R., Maskell, L. C., Howard, D. C., Scott, W. A., and Henrys, P. A.: Long-term vegetation monitoring in Great Britain – the Countryside Survey 1978–2007 and beyond, Earth Syst. Sci. Data, 9, 445–459, https://doi.org/10.5194/essd-9-445-2017, 2017.
- Abstract
- Introduction
- Input data sets
- Methods
- Results
- LCM2021 data products
- Data availability
- Conclusions
- Appendix A: Notes on LCM2021 land cover classes
- Appendix B: Display of LCM products
- Author contributions
- Competing interests
- Disclaimer
- Acknowledgements
- Review statement
- Financial support
- References