the Creative Commons Attribution 4.0 License.
the Creative Commons Attribution 4.0 License.
 | 05 Oct 2023
Geospatial dataset for hydrologic analyses in India (GHI): a quality-controlled dataset on river gauges, catchment boundaries and hydrometeorological time series
Streamflow gauging stations not only track the pulse of rivers but also act as common reference points for hydrologic and other environmental analyses. As such, streamflow data and metadata on gauging stations – Geographic Information System (GIS) data on station locations, their upstream catchment boundaries and river flow networks – are critical for analyses. However, for India's river basins, the availability of such data is limited; when available, data are not in an analysis-ready format and can have substantial errors. Studies often use available information from India's water agencies as is, without checking its validity. This study addresses the above limitations by building a new dataset using existing metadata (from the Central Water Commission, CWC, and the Water Resources Information System, WRIS) and checking it against publicly available information from global data sources (e.g., World Wildlife Fund, Multi-Error-Removed Improved-Terrain Hydro and Copernicus) and online maps (e.g., Google Maps). The quality control process categorizes existing metadata based on their consistency with these sources; also, existing metadata are supplemented with additional information where needed. The new dataset developed here is called the “Geospatial dataset for Hydrologic analyses in India” (GHI) and uses Hydrological data and maps based on Shuttle Elevation Derivatives at multiple Scales (HydroSHEDS) data as the underlying template. GHI has both geospatial and time series information. In this initial version of GHI, the spatial domain includes only the river basins of Peninsular India where daily streamflow data are publicly available.
Following the quality control process, the CWC's 645 stations in Peninsular India were categorized into three groups: Group 1 (reliable metadata and adequate daily streamflow data; 213 stations), Group 2 (reliable metadata and inadequate or no daily streamflow data; 259 stations) and Group 3 (missing or unreliable metadata; 173 stations). For each of the 472 stations falling into groups 1 and 2, catchment-specific annual and monthly time series spanning 71 water years (1950–2020) of the following were compiled: observed precipitation from the Indian Meteorological Department (IMD); observed streamflow from WRIS; estimated precipitation, evapotranspiration (ET) and streamflow from ERA5-Land; and ET from the Global Land Evaporation Amsterdam Model (GLEAM). A preliminary analysis of catchment-scale time series of data indicates that, while the compiled data appear reasonable over most of the study domain, spurious runoff–precipitation ratios were observed in the hilly coastal regions of Western India. This adds to yet another data-related obstacle faced by the hydrologic community. In order to quantify historical changes and reconcile them with anticipated future changes, the community needs robust and reliable hydrographic and hydrometeorological datasets as well as unrestricted access to such datasets. The goal of this study is to highlight the limitations of existing datasets and pave the way for a community-led effort towards building the needed datasets. GHI serves as a placeholder until such datasets become available. Potential improvements to GHI are discussed. GHI is publicly available at https://doi.org/10.5281/zenodo.7563599 (Goteti, 2023).
- Article
(11660 KB) - Full-text XML
- BibTeX
- EndNote


Water resources assessments and other large-scale hydrologic analyses are important and useful means to objectively quantify the water budget. Such analyses often require reconciling observed streamflow at a gauging station with estimated or modeled fluxes over the upstream catchment area. As such, having accurate Geographic Information System (GIS) data on gauging station locations and catchment boundaries is critical. However, for India's watersheds, such metadata – GIS data on river gauging station locations, river networks and catchment area boundaries, etc. – are publicly available only to a limited extent. The primary sources of such information are the Central Water Commission (CWC) and the online Water Resources Information System (WRIS, https://indiawris.gov.in/wris, last access: 21 August 2022). Data from CWC, if available, are buried within various CWC reports; thus, users need to piece together the needed information from such reports. WRIS addresses some of CWC's deficiencies; however, catchment area boundaries from WRIS are available only for the large river basins, and contributing catchment areas outside of India are excluded by WRIS.
There are further data-related challenges when it comes to hydrologic analyses over India. Streamflow data are available through WRIS only if the river basins are entirely within India's boundaries. Hence, WRIS data are only available for the basins of Peninsular India (shaded regions in Fig. 1a). For river basins such as the Ganga, Brahmaputra and Indus, which have catchment areas spanning multiple countries, data are “classified” by CWC and are not publicly available (unshaded regions in Fig. 1). Thus, streamflow data for a large portion of India are not readily available. Analysts could use compiled information from established sources such as the Global Runoff Data Center (GRDC, https://www.bafg.de/GRDC/, last access: 21 August 2022), the Global Monthly River Discharge Data Set (RivDIS) (Vorosmarty et al., 1998), the Global Streamflow Indices and Metadata Archive (GSIM) (Do et al., 2018; Gudmundsson et al., 2018) or other global databases. RivDIS and the GRDC contain legacy data only for a small fraction of the gauging stations currently operated by CWC. There is limited or no information available on the specific Indian entities that supplied these data to GRDC or RivDIS nor on the extent of missing streamflow data in these sources. GSIM's streamflow data for India are based solely on “non-classified” information already available from WRIS.
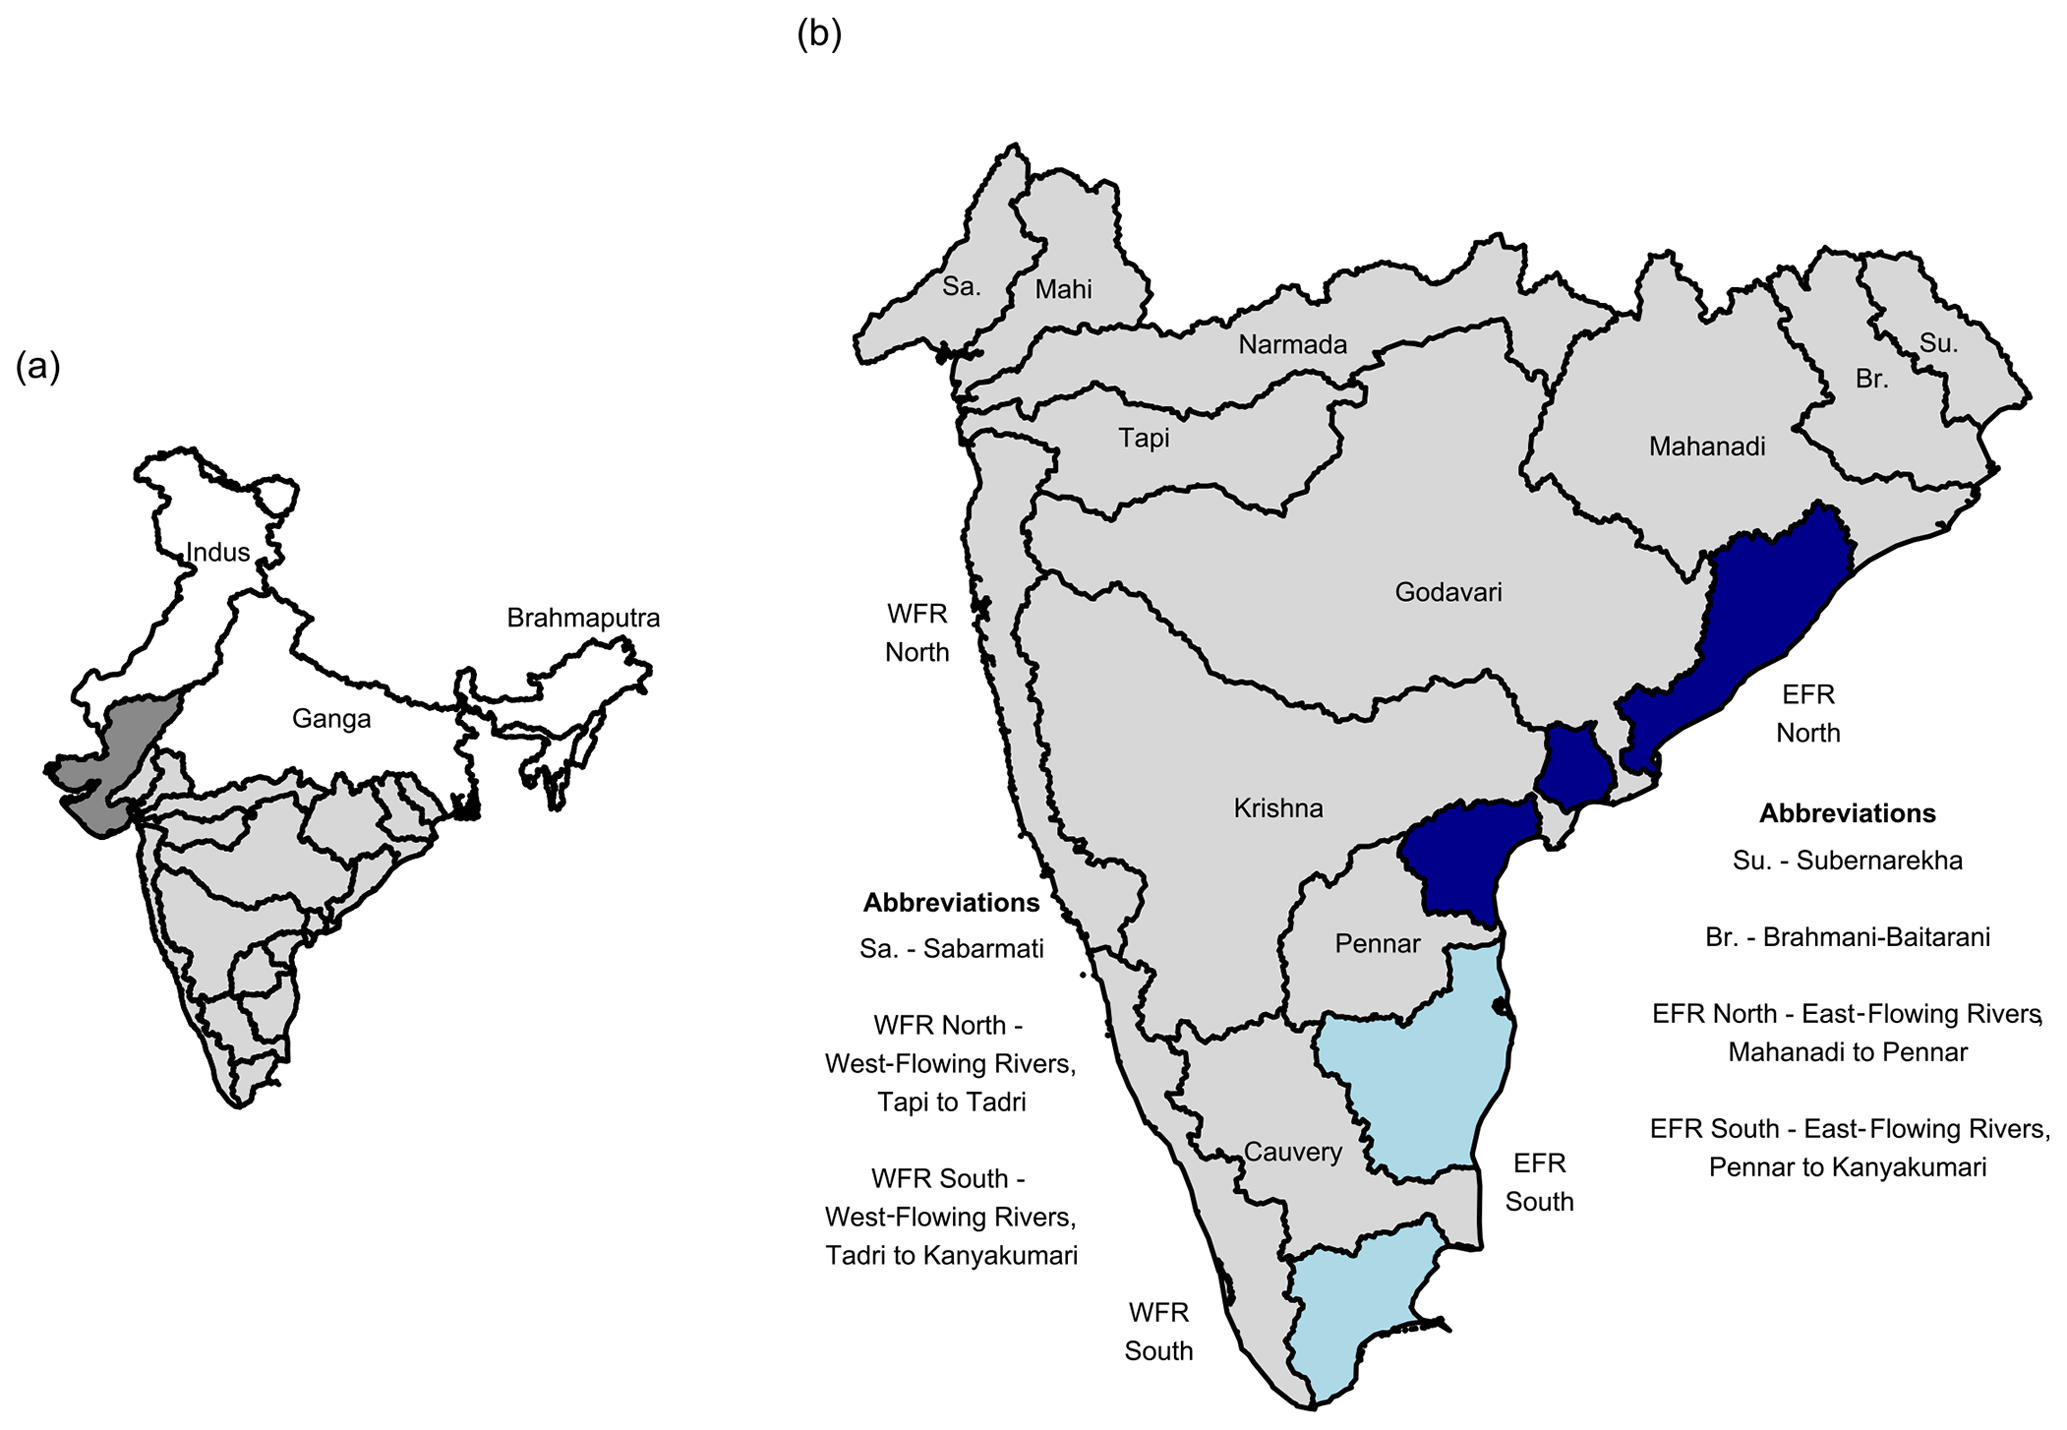
Figure 1(a) Major river basins of India and those used in this study (lightly shaded). (b) Composite basins of Peninsular India identified within the Geospatial dataset for Hydrologic analyses in India (GHI). Some basin names within the map are abbreviated for ease of display but are defined next to the map.
Due to a lack of readily available metadata or hydrographic data, studies often compile the needed information, using whatever is available from CWC and WRIS as a reference. For instance, Shah and Mishra (2016) calibrated and validated their hydrologic model at 18 stations across India; most of their data were from CWC/WRIS, and the remaining data were from RivDIS. It is not known whether Shah and Mishra (2016) accounted for any of the missing streamflow data in their study. Madhusoodhanan et al. (2017) assessed uncertainties in modeled fluxes using 20 stations from WRIS whose streamflow was minimally affected by human interventions. The station metadata from WRIS were used as is without checking their validity. CWC used more than a hundred stations across India within their water resources assessment (CWC-19, 2019) but did not provide any GIS data on the stations nor their catchment boundaries. Goteti (2022) noted some discrepancies in estimated catchment areas from CWC-19 (2019).
Ganguli et al. (2022) used catchment boundaries compiled by GSIM to quantify hydrometeorological variables of interest in their analysis of drought in Peninsular India. GSIM's goals were similar to those of this study but for thousands of stations across may countries (Do et al., 2018; Gudmundsson et al., 2018). As such, GSIM could not perform manual verification of available station metadata. GSIM tailored its boundary delineation process by relocating the stations onto the river network such that the final catchment area estimates matched the “reference” catchment area estimates from CWC. Catchment boundaries were derived for select stations available from CWC's inventory from 2012. While relocating stations onto river networks to match the reference catchment area is a reasonable approach (and is also used by GRDC and other studies), the reference metadata from CWC or WRIS have several limitations and are not completely reliable. Station locations are prone to substantial errors, meaning that catchment area estimates are inconsistent with other sources (and sometimes inconsistent with CWC's own reports). The following is a discussion of these limitations.
1.1 Issues with existing data
1.1.1 Spurious station locations
Actual stations locations can sometimes be hundreds of kilometers away from their current location based on CWC's published coordinates. Some such examples are identified in Fig. 2 and Table 1. In some instances, current station locations fall in the Bay of Bengal (Station S2 in Table 1) or in the Arabian Sea (Station S5 in Table 1).
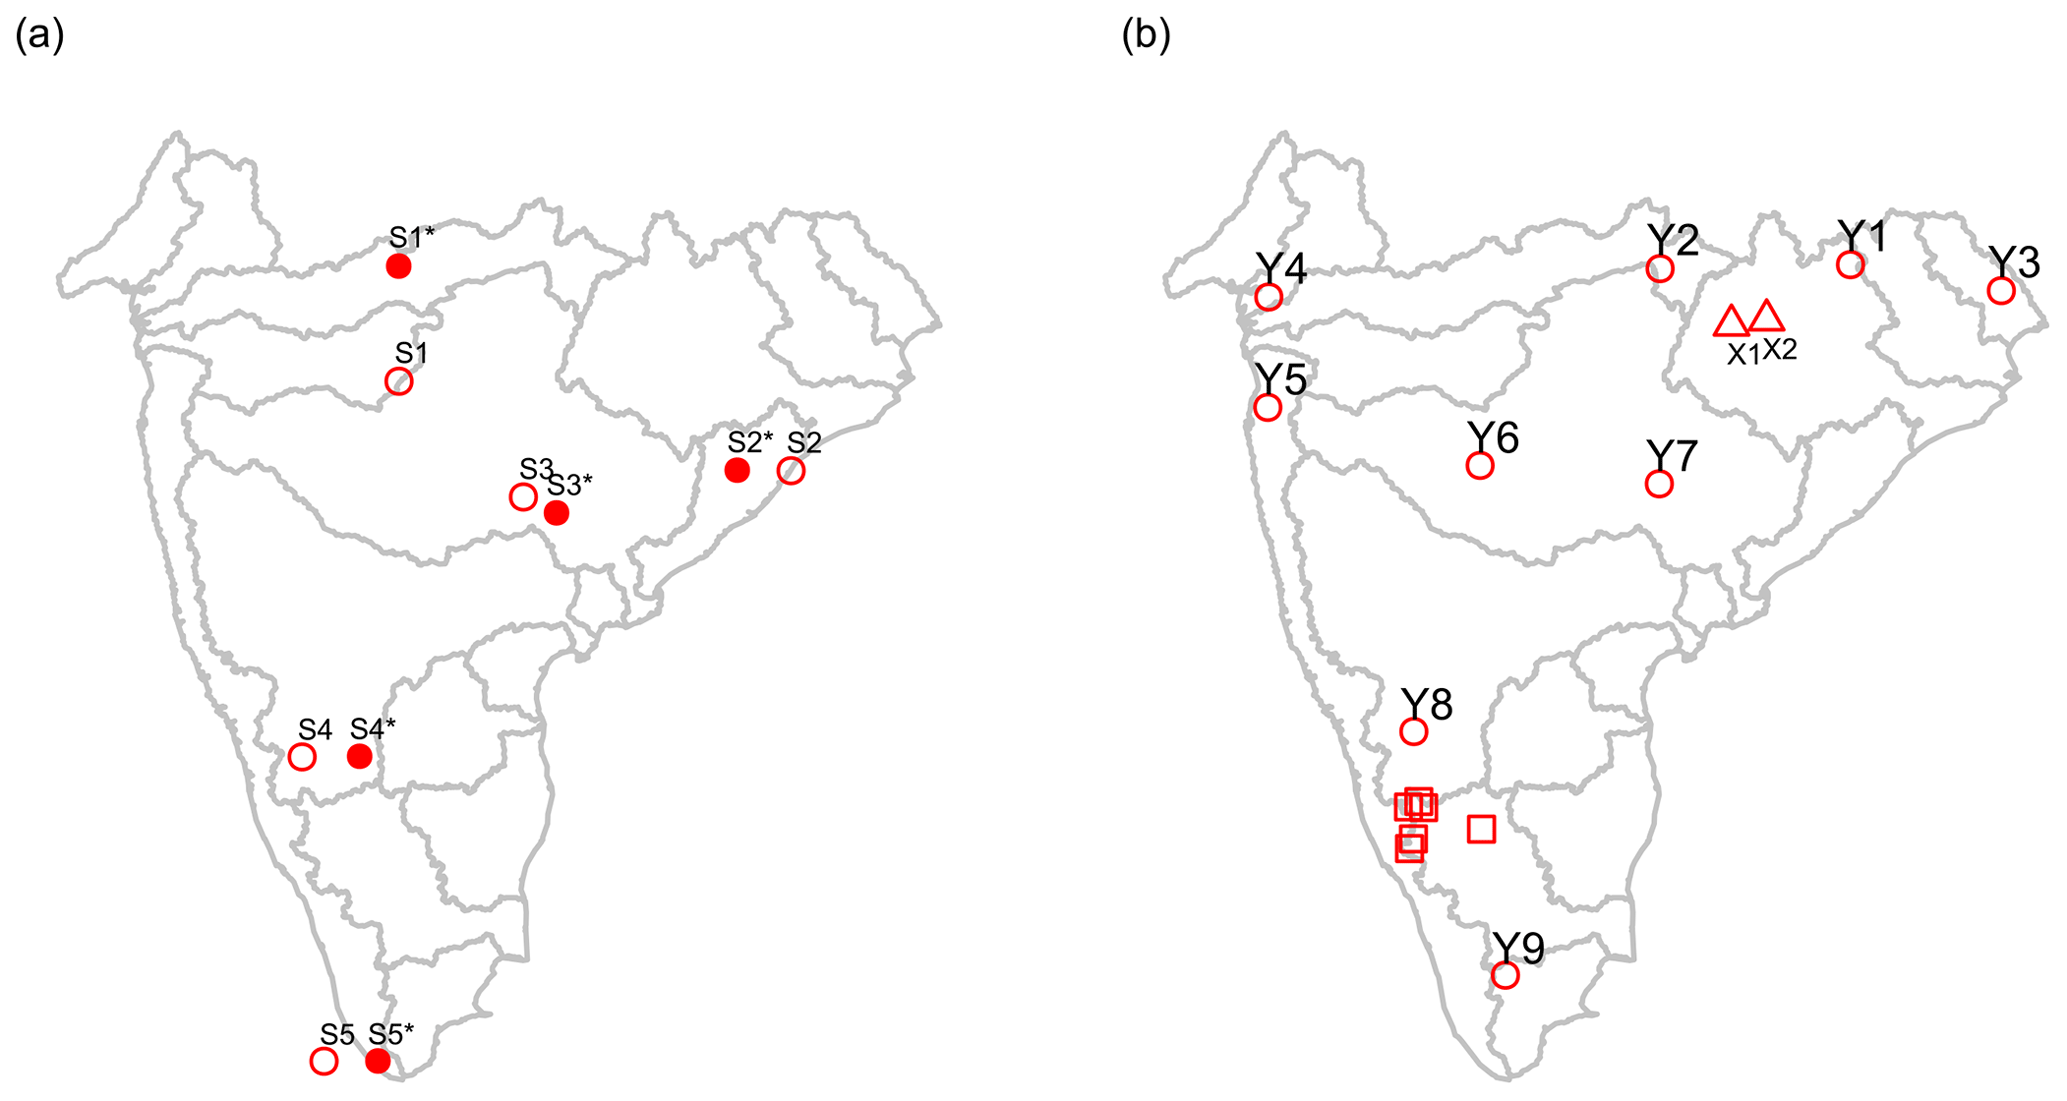
Figure 2Select stations used as examples to illustrate issues with existing metadata. Panel (a) presents the stations discussed in Table 1. The current locations from CWC are shown as open red circles, whereas the potential correct locations are shown as shaded red circles. Panel (b) shows the stations discussed in Table 2 (squares), Table 3 (triangles) and Table 4 (circles).
One particular example is further illustrated in Fig. 3. According to CWC, the Eturunagaram station is on the Godavari River. However, when overlaid on Google Maps, the current location falls on the Manair River, near the Manair Bridge. Moreover, the current location of Eturunagaram almost coincides with the current location of another CWC station (Somanpally station). The potential correct location is more than 60 km to the southeast, by the town of Eturunagaram, close to the Godavari River. Based on the visual pattern of current locations and their potential correct locations in Fig. 2a, it appears that these errors could be due to typographical errors in station coordinates – the potential correct locations are generally along the latitude or the longitude passing through the current location. As such, the station coordinates from CWC are not reliable, and they individually need to be verified with other sources, such as Google Maps, before one can proceed with any analysis.
Table 1Examples of stations with spurious locations, labeled S1 through S5 in Fig. 2a. Catchment area is in square kilometers (km2).
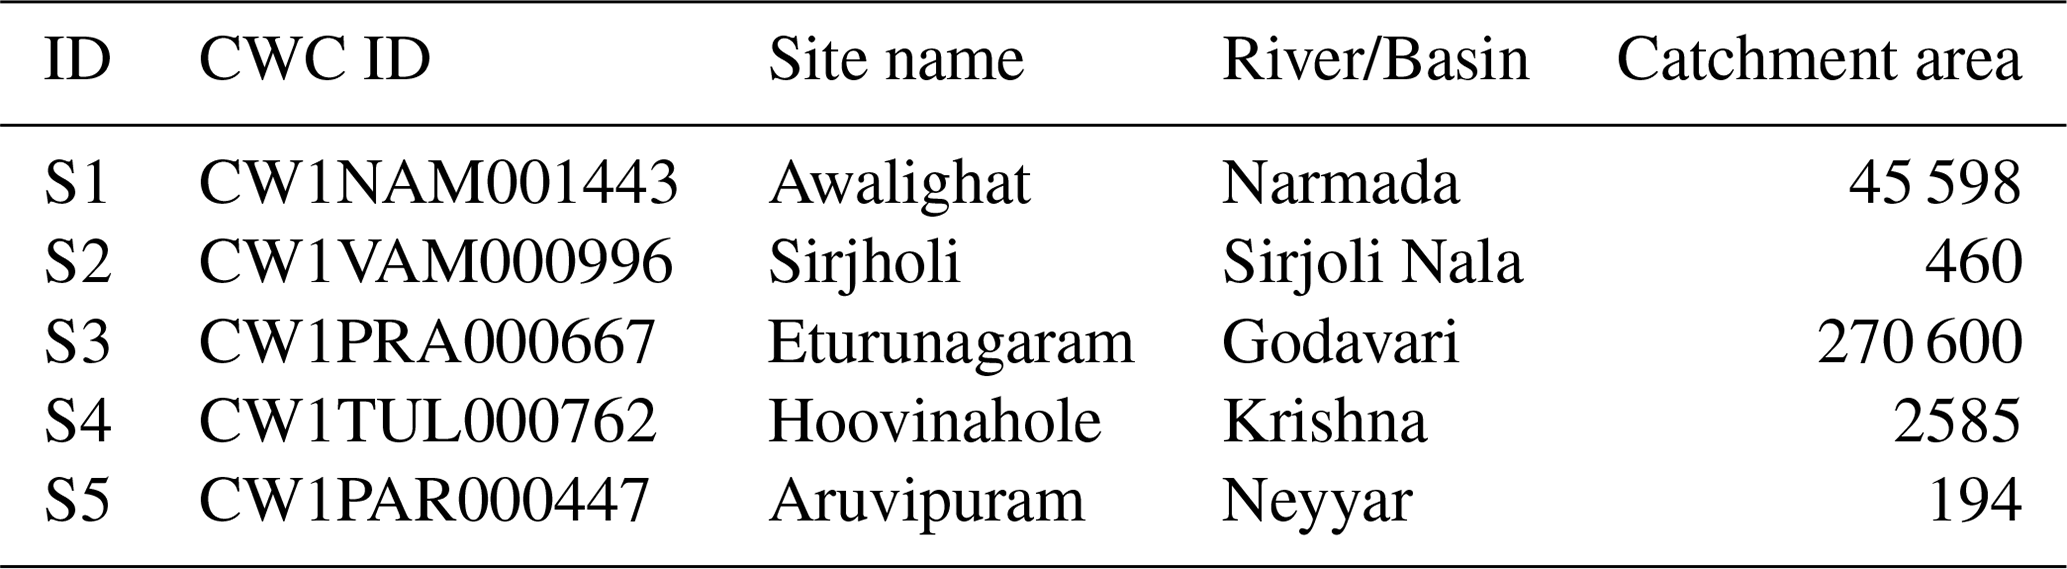
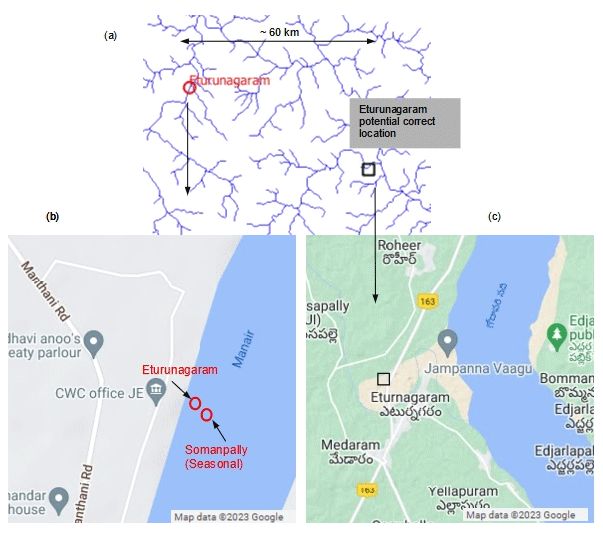
Figure 3(a) Erroneous station location from CWC for the Eturunagaram station in the Godavari Basin. The potential correct location is at least 60 km southeast of CWC's current location and is verified using Google Maps – black square indicates a reference landmark corresponding to the town of Eturunagaram. (b) CWC's current location for the Eturunagaram station suspiciously coincides with CWC's location for the Somanpally station in the Godavari Basin. (c) The potential correct location for Eturunagaram station is on the Godavari River, by the town of Eturunagaram, matching CWC's site description of the station.
1.1.2 Spurious catchment area estimates
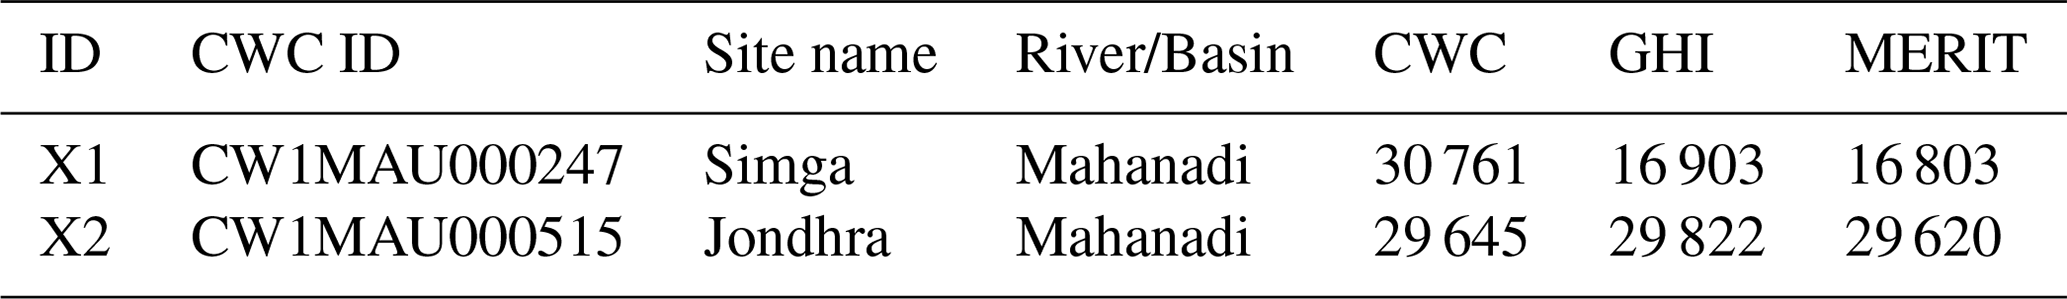
Drawbacks of catchment area estimates from CWC are illustrated using examples in Tables 2, 3 and 4. In some cases, the catchment areas for different stations in the basin are identical – for instance, the six stations in the Cauvery Basin identified in Table 2 have an identical catchment area of 6410 km2. In some cases, the catchment area for upstream stations is higher than the catchment area for the downstream station. For instance, Simga station in the Mahanadi Basin is upstream of Jondhra and should have a smaller catchment area, but the opposite is the case: 30 761 km2 at Simga vs. 29 645 km2 at Jondhra (Table 3). The catchment area estimates from this study, discussed in the subsequent sections, do not have such issues.
Table 2Catchment area estimates from CWC for select stations in the Cauvery Basin. The locations of these stations are shown as squares in Fig. 2b. Catchment area is in square kilometers (km2).
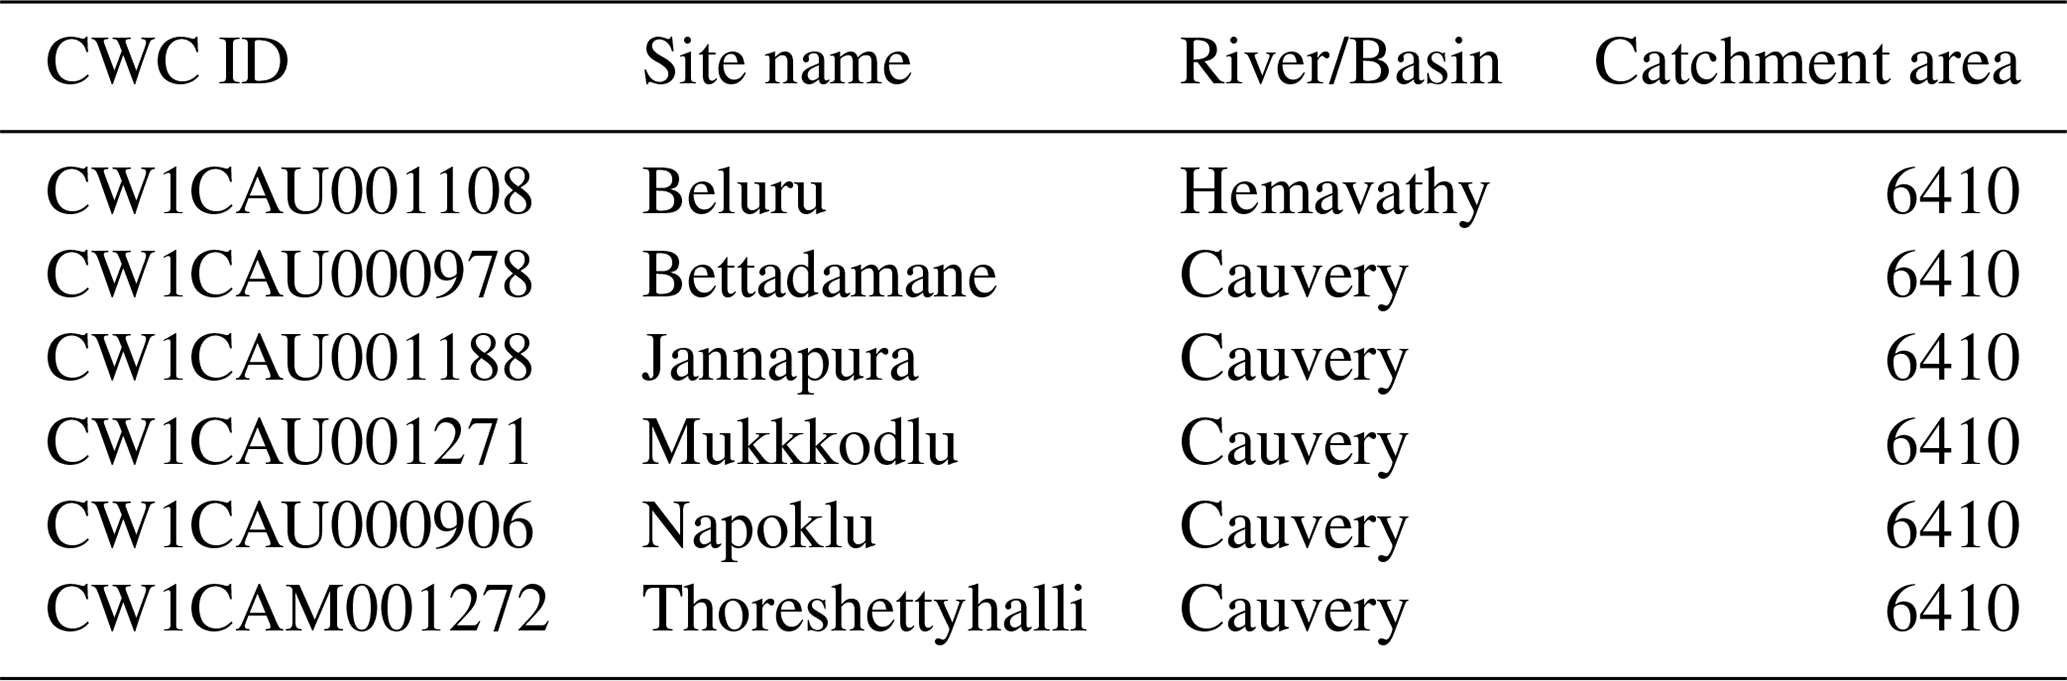
Table 3Potential erroneous catchment area in square kilometers (km2) from CWC for Simga station in the Mahanadi Basin. The corresponding values from GHI and MERIT (estimated in Sect. 3) are also shown. The ID for each station corresponds to its location in Fig. 2.
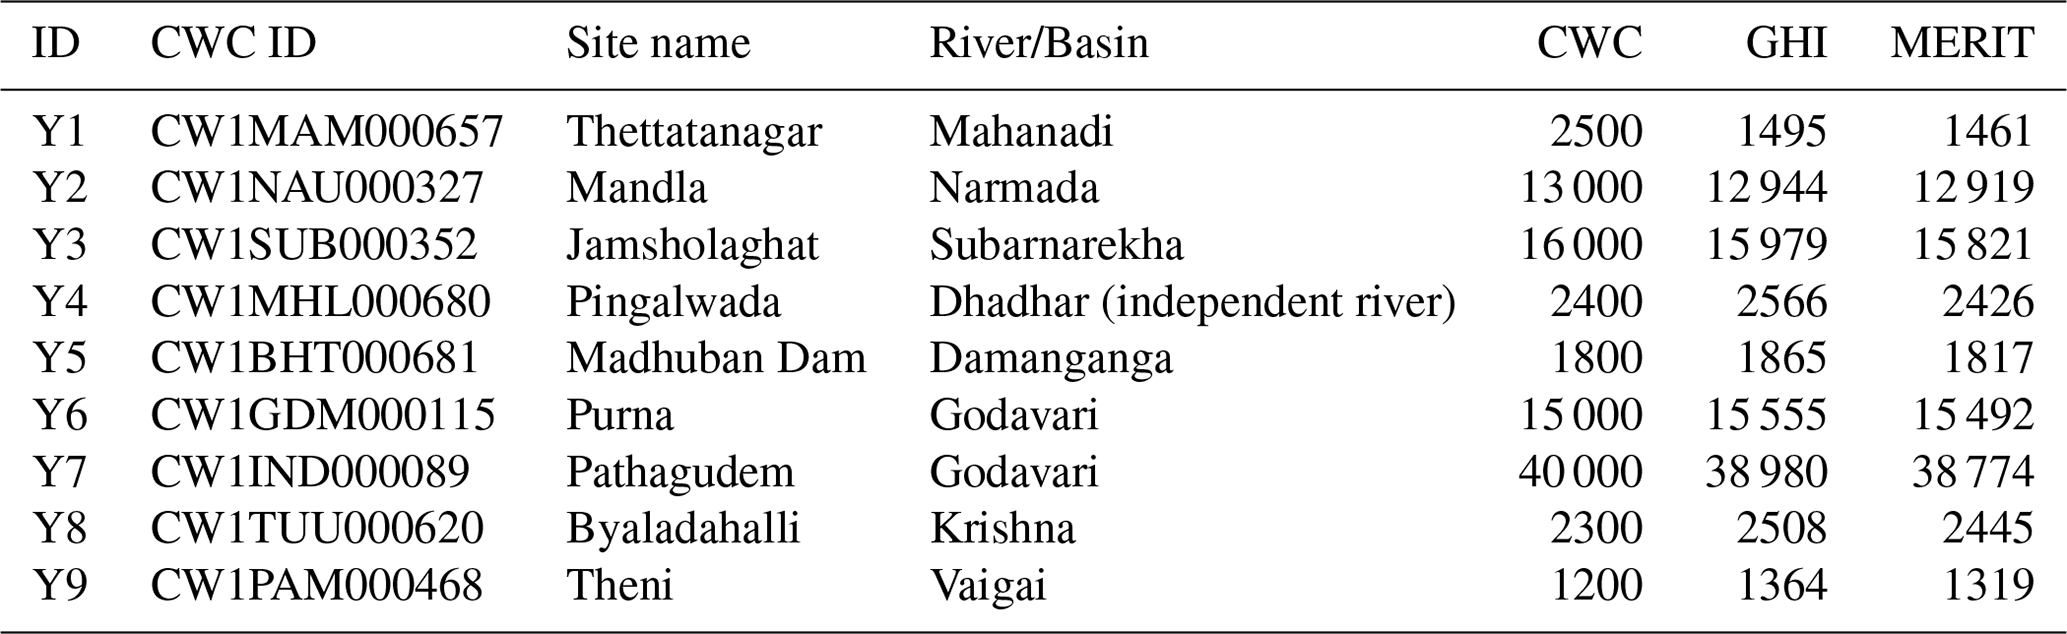
Another issue with the catchment areas from CWC is the extent of rounding used in the presentation of these estimates. Table 4 shows nine select stations in various basins whose catchment area varies from about 1000 km2 to about 40 000 km2. Based on these catchment areas; those presented in Tables 1, 2 and 3; and a general examination of other CWC estimates, the rounding used by CWC appears to be arbitrary. While the rounding used by CWC can be reasonable in some cases (e.g., Jamsholaghat station, Y3), it can result in large departures from actual values (station Y7 and Y9) or be completely unreasonable (station Y1) in other cases.
Table 4Select catchment area estimates in square kilometers (km2) from CWC to showcase the rounding used by CWC. The ID for each station corresponds to its location in Fig. 2b.
1.1.3 Other issues
As mentioned earlier, daily streamflow data are available through WRIS only for stations in Peninsular India (WRIS-OL, 2022). Such data can have missing information. While seasonal stations have data available only for a portion of the year, perennial stations can sometimes have a number of days with missing observations (i.e., blanks in the raw data). Ignoring such values when estimating monthly or annual statistics could lead to the underestimation of aggregate streamflow and the potential misrepresentation of the regional water balance.
Daily, monthly and annual streamflow data from WRIS-OL can be downloaded as spreadsheets. Within these spreadsheets, river gauging station names, parent river and parent river basin information, and other relevant details are provided. However, there is no use of the station identification codes developed by CWC. It appears that WRIS contains streamflow data not only corresponding to CWC stations but also to stations from other agencies (such as state and regional agencies). As such, the user needs to manually match the WRIS stations to the CWC stations based on available station description information. Given that WRIS contains duplicates and sometimes conflicting information on some stations, the user is burdened with inferring the streamflow data corresponding the desired station, checking for missing values and filling in missing values. There appears to be at least a few years of latency in the data provided by WRIS. Data for the current season are not available. The individual values within the downloaded spreadsheets do not have any quality control flags associated with them – such as those indicating overbank flow, gauge malfunction, outlier data, etc.
1.2 Motivation for this study
In the presence of the abovementioned limitations, the analysts have to rely on their individual ability to clean the data and compile the needed information. The lack of reliable metadata on river gauges and catchment boundaries affects the compilation and subsequent analysis of catchment-scale hydrometeorological variables. India's river basins have witnessed a rise in average temperature, a decrease in monsoon precipitation and a rise in droughts, along with a number of other hydroclimatological changes (Krishnan et al., 2020). In order to better understand and quantify such changes, the research community needs robust hydrometeorological datasets across all river basins of India. Reliable hydrographic data are a fundamental building block of such datasets. Increasingly available satellite and other high-resolution data products can be leveraged to build the needed datasets. Moreover, high-resolution river discharge measurements from the new Surface Water and Ocean Topography mission (SWOT, https://swot.jpl.nasa.gov/, last access: 1 February 2023) can be reconciled with historical information only when there are robust hydrographic data. Leveraging the state-of-the-art remote-sensing data to build the needed hydrographic datasets is the motivation behind this study.
The National Hydrography Dataset (NHD, https://www.usgs.gov/national-hydrography, last access: 1 February 2023), from the US Geological Survey (USGS) is an excellent example of a robust hydrography dataset. It is not feasible for one individual to build such a dataset for India's river basins; instead, this requires agency-level or community-wide effort. Based on the recent reports available from WRIS, it appears that WRIS is progressing towards creating such a dataset. In the interim, hydrologists and other analysts still need a reliable dataset on India's river gauging stations, catchment boundaries and other relevant data. By making use of the widely used Hydrological data and maps based on Shuttle Elevation Derivatives at multiple Scales (HydroSHEDS) dataset as the underlying template, this study leverages the valuable and abundant data resources available via HydroSHEDS. The specific goal of this study is to build a quality-controlled analysis-ready dataset from publicly available resources for use in hydrologic analyses while highlighting the major limitations of existing datasets.
The remainder of this paper is organized as follows: in Sect. 2, the data sources used in this study are discussed; in Sect. 3, the methodology used to differentiate the more reliable gauging stations from the less reliable stations is described; the final product from this study, called the Geospatial dataset for Hydrologic analyses in India (GHI), is described in Sect. 4; in Sect. 5, a preliminary analysis of GHI's time series of data is discussed; Sect. 6 provides a discussion of the limitation of GHI and potential next steps; and the conclusions from this study are presented in Sect. 8.
A number of datasets were used in this study; they are described in this section and outlined in Table 5. These datasets pertain to metadata on river gauging stations, publicly available hydrography products, online maps, and observed or modeled hydrometeorological data. The two main agencies providing metadata on India's river gauging stations and streamflow data are CWC and WRIS. Several reports from these agencies were used in this study, and the following notation is used to distinguish between the various reports from these agencies: CWC-21 refers to a list of the latest active streamflow gauging stations as of 2021 (CWC-21, 2021); CWC-19 is a water resources assessment by CWC and WRIS conducted in 2019 (CWC-19, 2019); CWC-YB refers to annual yearbooks published by CWC that contain statistical summaries on select streamflow gauging stations (CWC-YB, 2021); WRIS-GIS denotes GIS data on major river basin boundaries used by WRIS, obtained from WRIS via data request (WRIS-GIS, 2021); WRIS-OL refers to the online system from WRIS to disseminate streamflow and other hydrological data (WRIS-OL, 2022); and WRIS-BR represents basin reports published by WRIS in 2014 (WRIS-BR, 2014).
Lin et al. (2021)Table 5Datasets used in this study and relevant information.
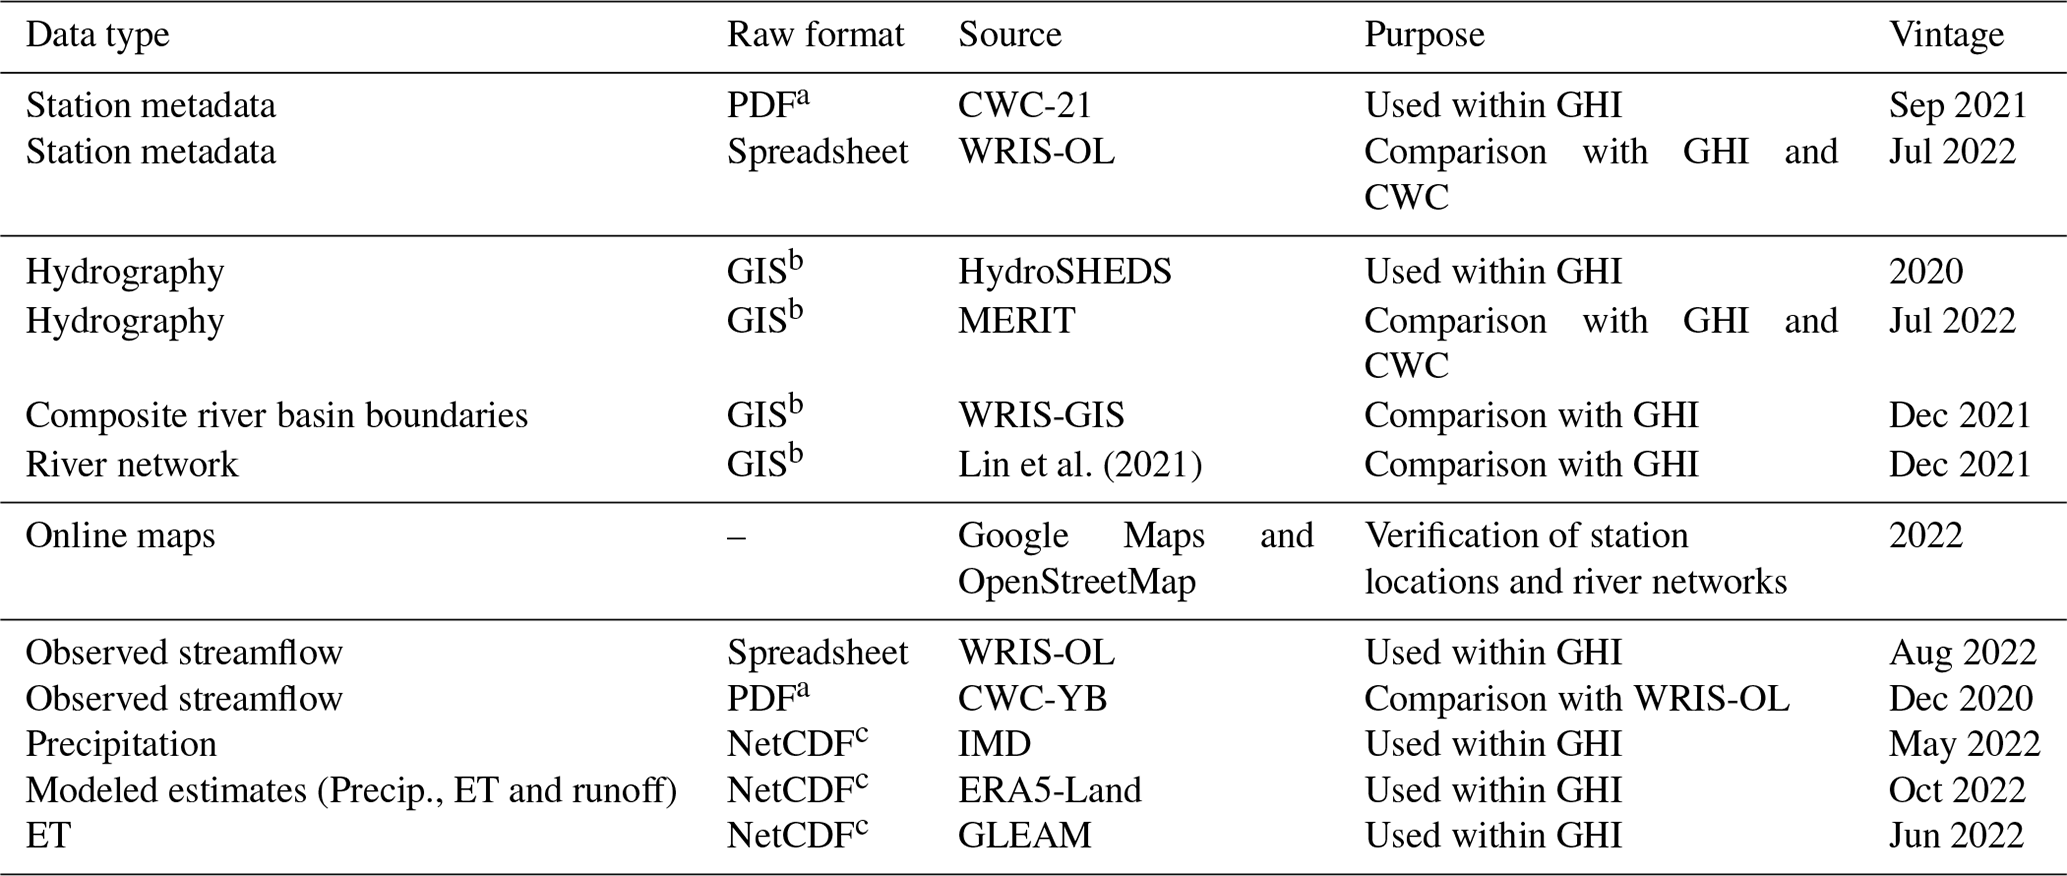
a PDF is portable document format; b GIS includes a variety of formats such as shapefiles, raster files and geodatabases; c NetCDF is a file format often used to store and share gridded meteorological data.
2.1 Station metadata
2.1.1 CWC
India's river gauging stations are maintained by CWC as well as regional agencies (Chatterjee and Sinha, 2014). However, metadata on these gauging stations are limited to stations maintained by CWC and are available via a number of reports from CWC and WRIS. For instance, the annual yearbooks published by CWC (CWC-YB) contain information on station location and also streamflow measurements for select stations. The basin reports published by WRIS (WRIS-BR) contain maps of river basins along with the location of select gauging stations. However, the underlying GIS data on basin boundaries and other relevant information are not available from WRIS (personal communication, 4 January 2022). The only publication from CWC that contains the latest information on all of its active river gauging stations is in the form of a PDF file from 2021 (CWC-21). This PDF file was used in this study as the definitive source of station metadata from CWC.
2.1.2 WRIS
The online WRIS portal (WRIS-OL) provides station coordinates within the downloadable streamflow data files. A snippet of this data is shown in Fig. A1 in Appendix A. A preliminary analysis indicated that station coordinates from WRIS-OL matched those from CWC-21 in some instances, but there were many instances where blatant errors were found, such as coordinates falling in the Southern Hemisphere or a location with the same name having differing coordinate values. For these reasons, station coordinates from WRIS-OL were not used in this study.
2.2 Hydrography
2.2.1 Major river basin boundaries
CWC and other water agencies subdivide the entire country into major basins for administrative and data management purposes. Due to the presence of river deltas, coastal basins and islands and due to national boundaries not always following topography, river basins are conveniently lumped to create “composite” river basins. CWC often uses such composite basins to cross-reference its data. WRIS-OL also uses similar composite basins from CWC to reference the stations associated with its streamflow data. However, other water agencies of India appear to have developed their own composite basins (https://indiawris.gov.in/wiki/doku.php?id=river_basins, last access: 1 September 2022). This study also uses such composite basins for ease of illustration and cross-referencing (see Sect. 3.1).
2.2.2 HydroSHEDS
The Hydrological data and maps based on Shuttle Elevation Derivatives at multiple Scales (HydroSHEDS) dataset (Lehner and Grill, 2013; Lehner et al., 2008) is one of the few high-resolution, global, quality-controlled and analysis-ready datasets currently available to the scientific community. It has been widely used by a number of studies worldwide and is continually being improved. HydroSHEDS version 1, used in the creation of GHI, is derived primarily from Shuttle Radar Topography Mission (SRTM) elevation data at a 3 arcsec resolution (about 90 m at the Equator).
The suite of products from HydroSHEDS comprises the basis of the geospatial information within GHI. The core products from HydroSHEDS are raster datasets, such as the digital elevation model (DEM) and derived flow direction. The secondary products from HydroSHEDS are derived from the core products and include vector products, such as watershed boundaries (HydroBASINS) and river networks (HydroRIVERS). This study makes extensive use of HydroBASINS and HydroRIVERS. HydroBASINS is a series of vectorized polygon layers on watershed boundaries nested within larger river basins. Within HydroBASINS, the Pfafstetter coding system is used to represent the hierarchical nesting of watersheds from level 1 (PF-1, large river basins) through level 12 (PF-12, smallest watersheds). A sample graphic illustrating watersheds at various PF levels is given in Appendix A (Fig. A2). HydroRIVERS is a vectorized line network of river paths in which the upstream catchment area is at least 10 km2 or in which the estimated average streamflow is at least 0.1 m3 s−1, or both. Both HydroBASINS and HydroRIVERS are derived from the core HydroSHEDS products after aggregating to a 15 arcsec resolution (about 500 m at the Equator). Thus, the underlying resolution for spatial products within GHI is 500 m.
2.2.3 MERIT
While several products similar to HydroSHEDS are available, including Hydrologic Derivatives for Modeling and Analysis (HDMA) (Verdin, 2017), Multi-Error-Removed Improved-Terrain Hydro (MERIT) (Yamazaki et al., 2019), river networks (Yan et al., 2019) and river drainage density (Lin et al., 2021), such products neither have the breadth of data nor the widespread usage that HydroSHEDS currently has. MERIT-based products include relatively fewer sub-datasets, but these products are growing. MERIT was developed at a 3 arcsec resolution (about 90 m at the Equator) after correcting for errors using multiple satellite datasets and filtering techniques. While upstream catchment area is readily available from MERIT, river networks are not. However, Lin et al. (2021) used MERIT to delineate high-resolution river networks at a global scale. This river network from Lin et al. (2021) was used in this study as a proxy for river network data from MERIT. The information from MERIT serves as an independent check on the HydroSHEDS data.
2.3 Online maps
Landmarks such as rivers, bridges and highways are often used as reference points by CWC to describe the location of its gauging stations. As publicly available maps from Google (Google Maps) and OpenStreetMap (OSM) contain such landmarks, they can be used to verify CWC's station description. The names of nearby towns and cities are also available from these sources and serve as reference landmarks. Such landmarks can be independently verified by users and are useful in the validation of station coordinates and other metadata. Google Maps products typically contain more information on cities and towns than OSM. However, OSM typically has more information than Google Maps on rivers and other waterbodies. An example graphic illustrating some of these differences between Google Maps and OSM is shown in Fig. A3 in Appendix A. The publicly available QGIS software (https://qgis.org/en/site/, last access: 1 January 2022) has plug-ins for both Google Maps and OSM. QGIS was used throughout this study for GIS analyses, and the plug-ins for online maps were used wherever needed.
2.4 Streamflow
2.4.1 WRIS
Daily runoff data from WRIS-OL was used to estimate monthly and annual runoff as needed. WRIS provides daily river stage and/or daily river flow information for gauging stations. WRIS enforces a limit of 1 calendar year's worth of data for each download. Thus, the user has to go through the tedious process of downloading 1 year at a time. Such data were downloaded for more than 70 years for all available stations. Only daily river flow data were used here. River stage information was not used because appropriate stage–discharge relationships were not readily available. A sample of raw data from WRIS is shown in Fig. A1 in Appendix A.
2.4.2 Other sources
Streamflow data are available through global databases but were not used in this study because there is only limited information on the quality of such datasets. Only a brief description is provided here to make the reader aware of their existence. GRDC contains legacy streamflow data for only a handful of stations in India. Moreover, usage of data from the GRDC is permitted only after approval of a written request. It is also not known which specific Indian agency (CWC or other) provided data on India's gauging stations to GRDC nor the quality of such data. RivDIS contains monthly discharge data for 1018 stations around the world, including some in the GHI domain. However, this database has not been updated in more than 20 years. Moreover, the source of the streamflow data for India's gauging stations and the quality of such data are unknown. For these reasons, data from neither GRDC nor RivDIS were used in this study. GSIM contains streamflow data at gauging stations, among other metrics for use in hydrologic analyses. GSIM's streamflow data for India are based solely on information available from WRIS from around the year 2017. Thus, GSIM does not contain any information that is not already available for India's river basins and was, thus, not used in this study.
2.5 Hydrometeorological data
Long-term hydrometeorological products spanning the entire study domain, often cited in scientific literature as reasonable products for use in hydrologic analyses, and currently being maintained and/or developed were chosen for this study. The gridded precipitation dataset from the Indian Meteorological Department (IMD) (Pai et al., 2014) has become the benchmark precipitation dataset and has been used by a number of studies (e.g., Rana et al., 2015; Rani et al., 2021; Thakur et al., 2019). Mahto and Mishra (2019) evaluated ERA5 products (ERA5 is the predecessor of ERA5-Land) and found that ERA5 is superior to other reanalysis products analyzed in their study and is suitable for hydrologic assessments over India. Goteti (2022) used ET from ERA5-Land and the Global Land Evaporation Amsterdam Model (GLEAM), among other products, for water resources assessment in the Godavari and Krishna river basins. This study specifically uses data from IMD, ERA5-Land and GLEAM. Sample precipitation and ET data for water year (WY) 2020 are shown in Fig. A4 in Appendix A.
2.5.1 IMD
The IMD dataset used here is the monthly total precipitation for the period of 1950–2020 on a 0.25∘ latitude–longitude grid (about 25 km at the Equator).
2.5.2 ERA5-Land
ERA5-Land is based on the land component of the European Centre for Medium-Range Weather Forecasts (ECMWF) ERA5 climate reanalysis (Muñoz-Sabater et al., 2021). The dataset used here is the post-processed monthly data on a 0.10∘ latitude–longitude grid (about 10 km at the Equator) for the period of 1950–2020. In the remainder of this paper, ERA5-Land is referred to as ERA unless otherwise specified.
2.5.3 GLEAM
The Global Land Evaporation Amsterdam Model (GLEAM) is a set of algorithms that separately estimate the different components of ET, including transpiration, bare-soil evaporation, interception loss, open-water evaporation and sublimation (Martens et al., 2017; Miralles et al., 2011). The dataset used here is the GLEAM v3.6a global dataset (https://www.gleam.eu/, last access: 1 July 2022) which provides monthly total ET for the period of 1980–2020 on a 0.25∘ latitude–longitude grid (about 25 km at the Equator).
GHI contains both geospatial and time series of data. The geospatial component of GHI includes three layers, and the time series component includes annual and monthly observations or modeled estimates of hydrometeorological variables such as precipitation, ET and runoff. The end product includes the above information in typical data-sharing formats, such as shapefiles and plain-text files. An overview of the input datasets used within GHI, the methods applied to prepare the outputs, the specific quality control measures used during the preparation and the final outputs from GHI are outlined in Fig. 4a. The specific sequence of steps taken to get to the final GHI product is outlined in Fig. 4b. The remainder of this section describes the creation of the different components of GHI.
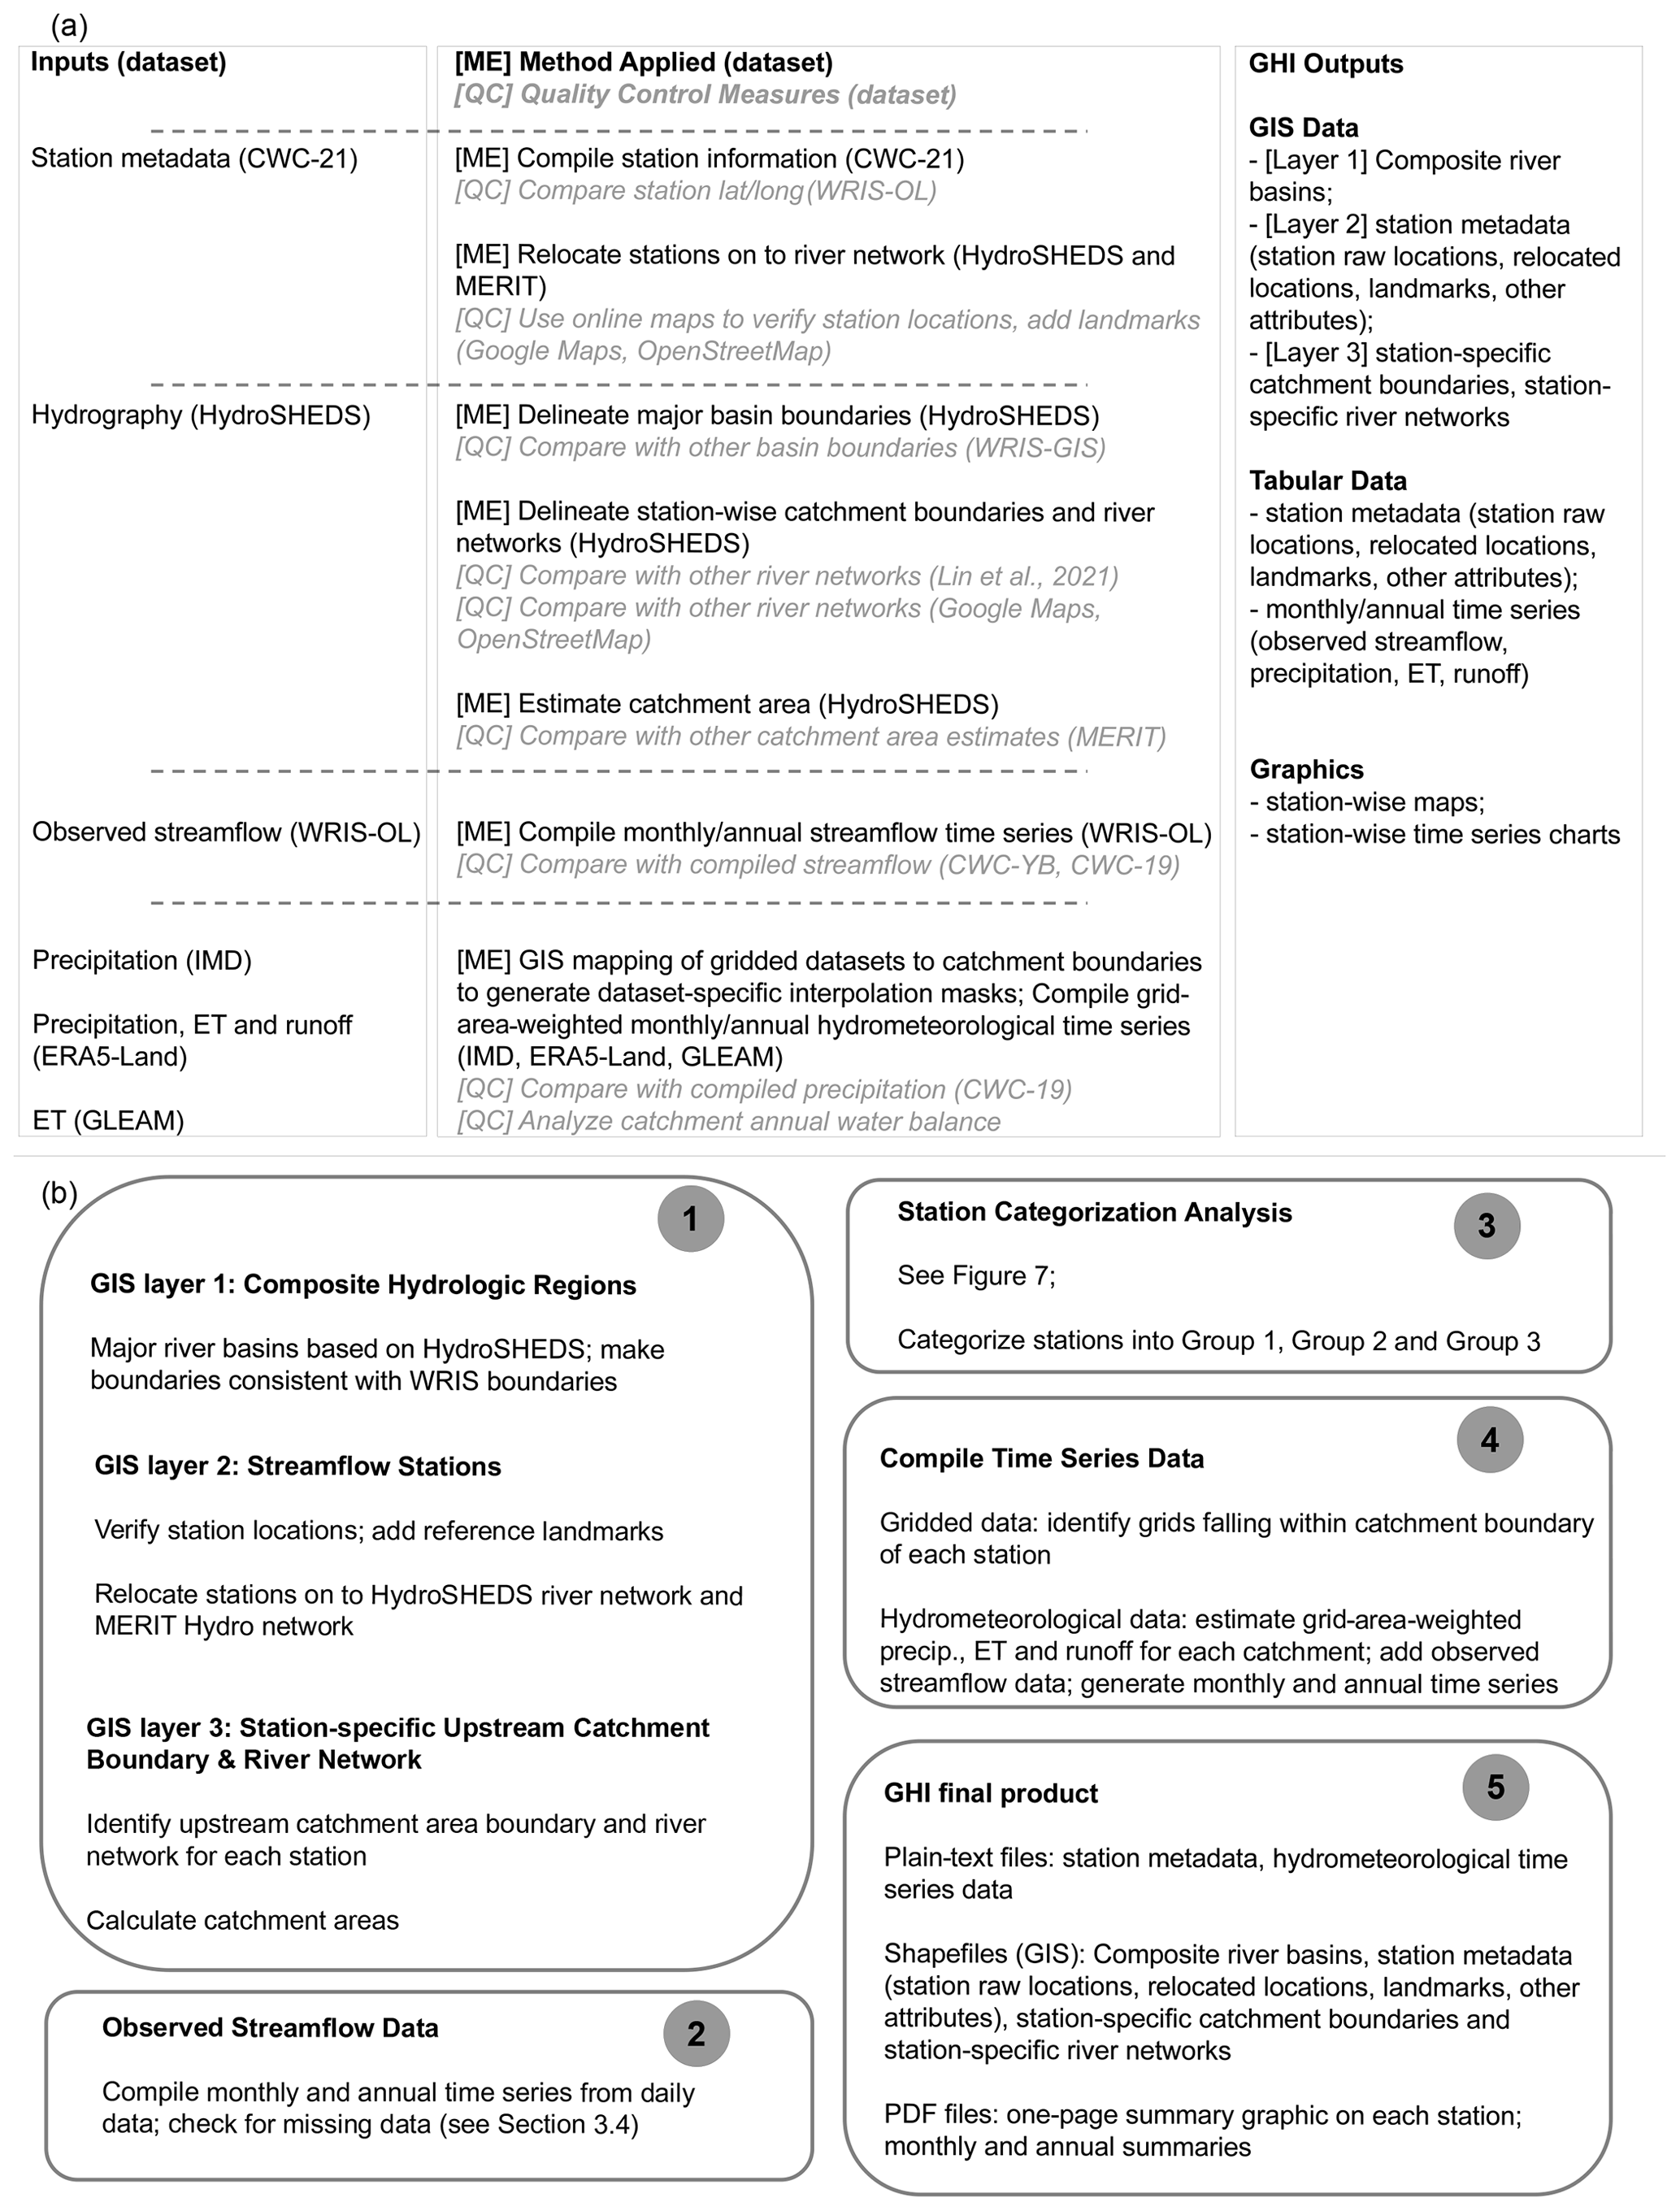
Figure 4Overview of GHI: (a) input datasets used within GHI, the specific quality control measures used to compile the needed outputs and the final outputs from GHI; (b) the sequence of steps followed within GHI to create the final GHI outputs.
3.1 Composite basins
The study domain comprises only those river basins of India where daily streamflow data are publicly available (Fig. 1). For ease of analysis and to be consistent with WRIS-GIS, the study domain was separated into composite river basins. Such composite basins serve as a regional spatial reference. Every gauging station within GHI is tagged with the parent composite basin information. Starting with PF-12 watersheds from HydroSHEDS, composite basins were manually delineated using the QGIS software. It was ensured that the boundaries of these basins followed topographic divides, and the resulting basins were consistent with those from WRIS-GIS to the extent possible. The study domain was grouped into 15 composite hydrologic basins (Fig. 1). The names of these composite basins are generally consistent with those from WRIS-GIS, but they are more consistent with those from CWC-19. Most composite basins are contiguous and are shown in gray shading in Fig. 1. Basins that are not contiguous are shaded; these include the East-Flowing Rivers North Basin (EFR North, dark blue) and the East-Flowing Rivers South Basin (EFR South, light blue).
The catchment area of these GHI composite basins is compared with equivalent basins from other sources in Table 6. The categorization of basins is not the same across sources; hence, a new category (West-Flowing Rivers, or WFR, North and South) was created to facilitate comparison. For ease of comparison, the different sources are compared against WRIS-GIS. The discrepancies between the different sources are typically less than 5 %. GHI-estimated catchment areas are much closer to CWC-19 than to WRIS-GIS. Discrepancies between the various estimates are attributed to differences in the underlying topographic data's spatial resolution, land vs. ocean demarcation, used within the data and GIS projection system and/or coordinate system used.
Within GIS analyses, it is customary to choose an appropriate coordinate projection system that determines how three-dimensional landscapes can be projected onto two dimensions for analysis and visualization. Estimation of area on the surface of the Earth, such as catchment area, is affected by the choice of the projection system or coordinate system and is based on a number of factors (e.g., https://pro.arcgis.com/en/pro-app/latest/help/mapping/properties/coordinate-systems-and-projections.htm, last access: 1 September 2022). While the basin boundaries from WRIS-GIS are in the Lambert conformal conic projection (https://pro.arcgis.com/en/pro-app/latest/help/mapping/properties/lambert-conformal-conic.htm, last access: 1 September 2022), it is not known whether this is the best or recommended projection system for India's river basins. Data sources such as MERIT estimate catchment areas using the World Geodetic System 1984 (WGS84) coordinate reference system (https://pro.arcgis.com/en/pro-app/latest/help/mapping/properties/specify-a-coordinate-system.htm, last access: 1 September 2022), without using a specific projection system. Gridded meteorological data often use the WGS84 coordinate reference system as well. For the sake of convenience, this study also uses the WGS84 coordinate reference system.
Table 6Summary of catchment area in square kilometers (km2) by composite basin from various sources. The numbers in parentheses indicate the percentage deviation from WRIS-GIS values.
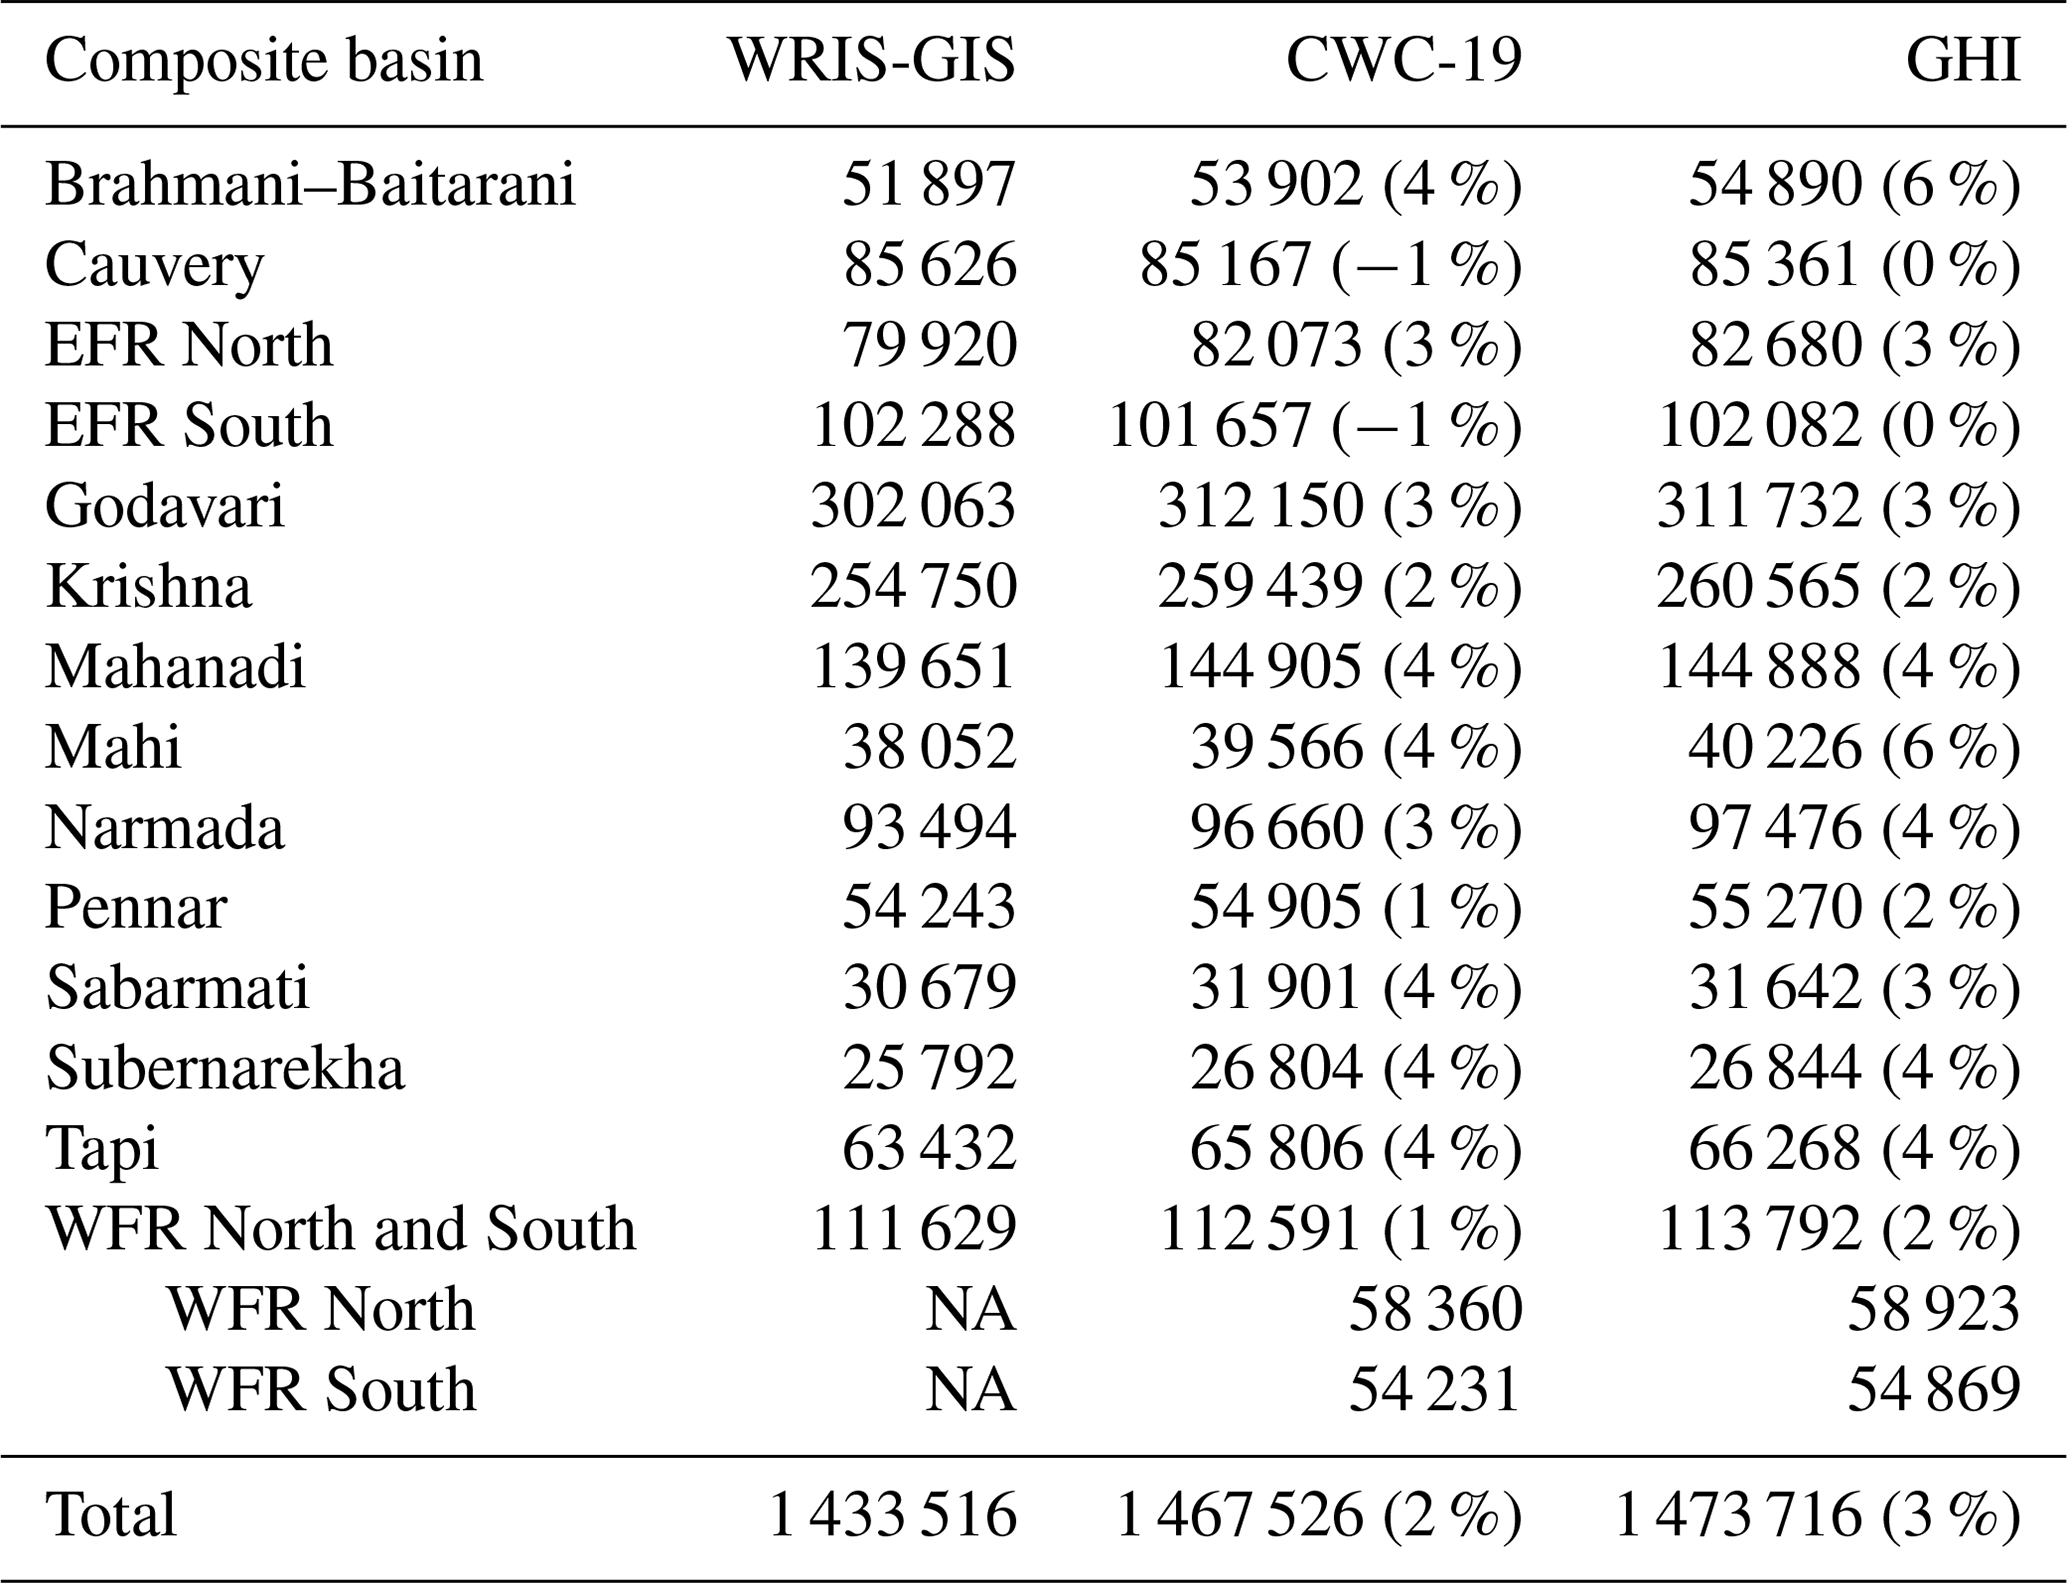
NA denotes that catchment area information was not available.
3.2 Gauging station verification and landmark identification
The second geospatial layer in GHI contains metadata on river gauging stations. Station-specific metadata – latitude, longitude, site name and river name – were used to verify the location of each CWC station within Google Maps and/or OSM. CWC's stations are typically named after nearby towns, cities or other landmarks. A reference landmark was identified for each station whenever possible, and the coordinates of the landmark are included within GHI. Such landmarks provide a definitive reference location which can be reverified by other users and/or repositioned if needed. The distance between CWC's station location and corresponding GHI landmark as well as the direction of the landmark relative to the CWC station are also noted.
An example of the abovementioned site verification and landmark identification is presented in Fig. 5 for the Neeleeswaram station on Periyar River in the WFR South Basin. The CWC location is shown as a red circle. The town of Neeleeswaram is about 4 km to the west of the CWC location and is chosen as the landmark (black square) for this station. The CWC locations do not fall on the pixel-based river network from HydroSHEDS nor MERIT due to the approximate nature of these networks. For feasibility of catchment area delineation and other subsequent analyses, the original station location needs to be relocated onto these river networks such that the relocated station is in the middle of a HydroSHEDS (or MERIT) pixel. The relocated station is shown by the blue circle on the river network from HydroSHEDS (Fig. 5a) and by the green circle on the river network from MERIT (Fig. 5b).
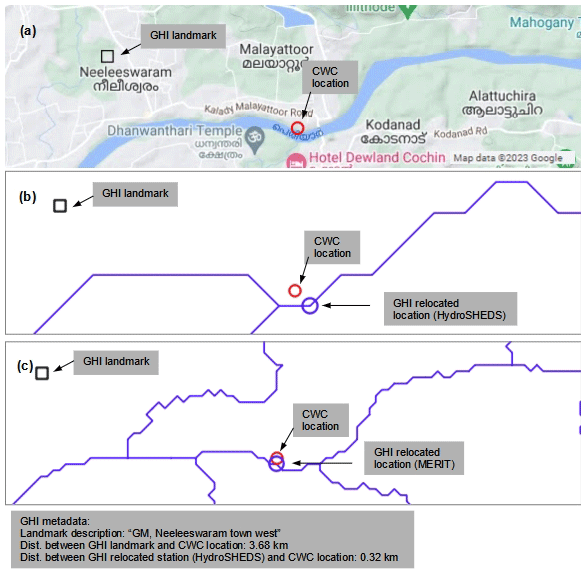
Figure 5Example showing GHI site verification and landmark identification for Neeleeswaram station on Periyar River. (a) CWC's station (red circle) is on the right of the graphic. The center of the nearest HydroSHEDS pixel on the GHI river network is the relocated location (blue circle). The landmark is with reference to the CWC location and is on the left (black square). Panel (b) is the same as panel (a) but for the MERIT network. The text box below panel (c) shows metadata on landmarks and relocated locations included within GHI.
3.3 Catchment boundary delineation
The third geospatial layer in GHI contains station-specific catchment boundaries and river networks. Catchment boundaries were derived using the PF-12 watersheds from HydroSHEDS. Using information on the upstream watersheds associated with each PF-12 watershed, all of the PF-12 watersheds upstream of the relocated station were recursively identified. The polygons corresponding to the most downstream PF-12 watershed and all of identified upstream watersheds were merged (or “dissolved” in GIS jargon) to create a catchment boundary topographically consistent with HydroSHEDS. At this juncture, the delineated boundary includes the most downstream PF-12 watershed in its entirety. However, the portion downstream of the relocated station is not needed. Using pixel-specific flow direction information from HydroSHEDS, only the portion contributing to flow at the relocated location was extracted and the remainder was discarded. The boundary delineation procedure just described is conceptually similar to standard procedures available within GIS software. The specific procedure used here ensures that the final delineated boundary is consistent with HydroSHEDS' underlying topographic data and is also accurate to the extent feasible. The station-specific river network was identified by extracting (or “clipping” in GIS jargon) the HydroSHEDS river network present within the upstream catchment boundary.
A schematic illustrating the abovementioned catchment boundary delineation procedure is presented in Fig. 6 for the Watrak Dam station in the Sabarmati River basin. The original CWC location (red circle), the relocated GHI station (blue circle) and the GHI river network (blue lines) are overlaid on Google Maps information (Fig. 6a). The gray polygons are the HydroSHEDS PF-12 watersheds upstream of the Watrak Dam station. The portion downstream of the station, not contributing to flow at the station, was discarded, and the final catchment boundary was delineated.
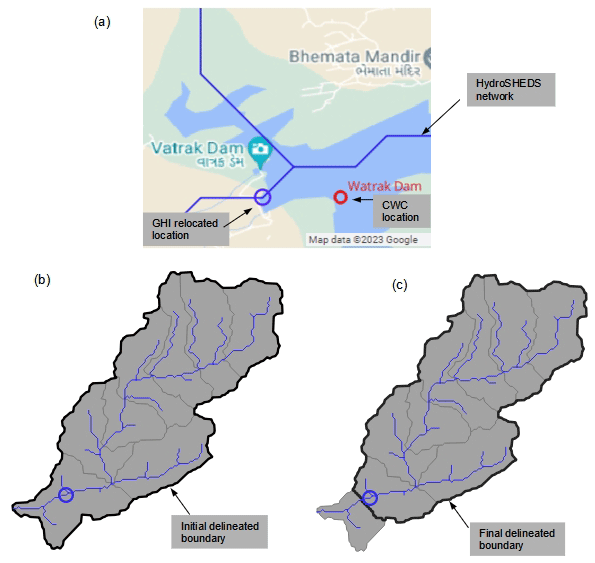
Figure 6Example illustrating GHI's boundary delineation process: (a) CWC's Watrak Dam station (red circle) on the Sabarmati River and GHI relocated location (blue circle); (b) initial delineated catchment boundary using PF-12 watersheds; and (c) final catchment boundary after discarding the portion downstream of the relocated station.
The catchment area associated with each station was obtained by estimating the area enclosed by the delineated HydroSHEDS-based catchment boundary. An additional estimate of catchment area was obtained using the MERIT 90 m raster layer on upstream catchment area. CWC's stations were relocated onto the MERIT river network. The catchment area corresponding to the station was estimated as the raster value at the 90 m pixel containing the relocated location. The HydroSHEDS and MERIT relocated station locations as well as the estimated upstream catchment areas are included within the metadata available through GHI.
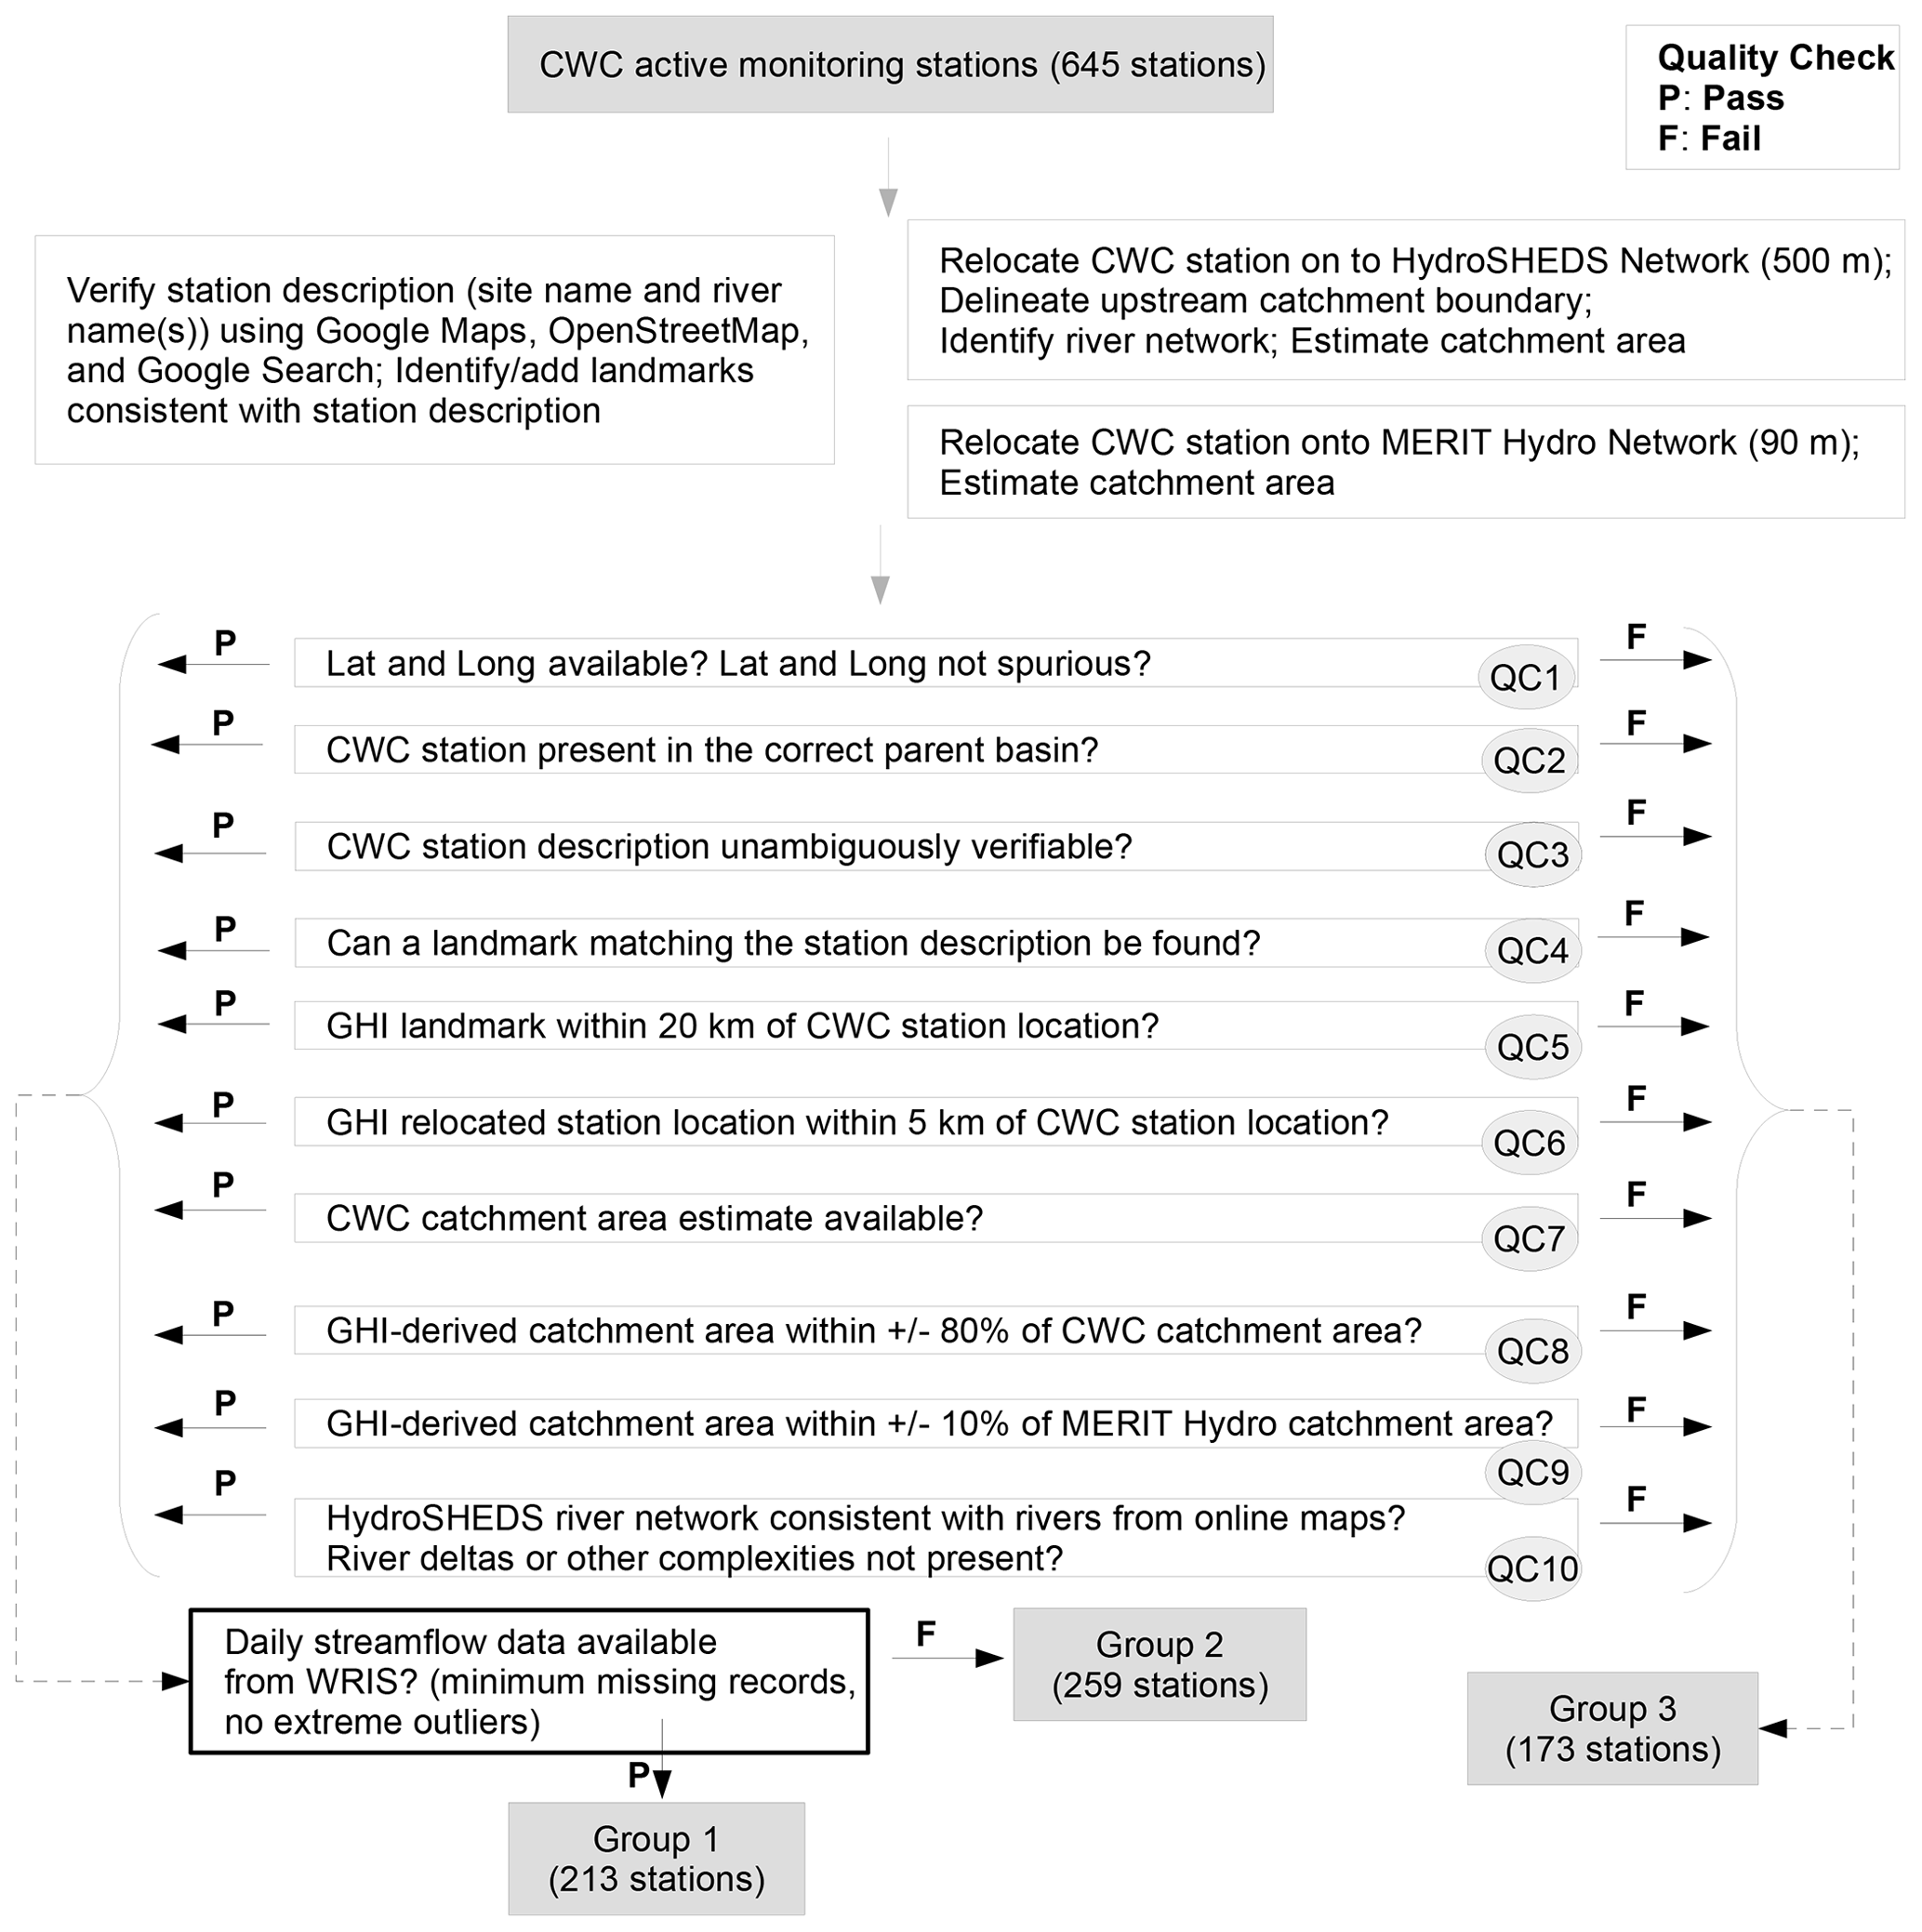
Figure 7Overview of GHI's quality control process used in the categorization of gauging stations. CWC's inventory of stations are placed in groups 1, 2 or 3 based on the outcome (“P” for pass or “F” for fail) of each quality check.
3.4 Quality control
The quality control process used to assess the reliability of station-wise metadata and hydrography data involves several steps (as outlined in Fig. 7) and is described in the following text. There are 10 quality check (QCs) and 1 data check (DC), and each station is assigned a “P” (for pass) or an “F” (for fail) corresponding to each of these 11 checks. If a station passes a specific check, then it is flagged as P for the particular check. Otherwise, the station is flagged as F for the particular check. A station is placed in Group 3 if it fails to meet any one of the 10 QCs. Otherwise, stations are placed in Group 1 or Group 2 based on the availability of streamflow data (i.e., based the status of the only DC). Thus, metadata associated with stations in Group 3 should be considered the least reliable. Stations in Group 1 and Group 2 are equally reliable when it comes to metadata, but Group 1 has reliable daily streamflow data available.
QC1 is on the availability and reliability of station coordinates – latitude and longitude. Stations with missing or spurious coordinates are placed in Group 3. Latitude and longitude from CWC are presented in “DDMMSS” format. The numerical value of minutes and seconds under such a format should span the values from 0 to 60. When values violate such bounds, the coordinates are considered spurious. QC2 ensures that CWC's description of the station is broadly consistent with its coordinates. If the river basin specified by CWC did not match the composite basin associated with the station's coordinates, then it was placed in Group 3.
QC3 ensures that CWC's description of the station is verifiable using either Google Maps or OSM. CWC's description includes the name of the station, the name of the main river (and sometimes a tributary) on which the station is located. Within a general vicinity of 50 km around the station coordinates, a visual search was performed for the namesake river body and a namesake village, town or other landmark (such as a bridge or a highway). The visual search was performed first using Google Maps and then, if needed, OSM. An approximate match was also considered acceptable when searching for names of rivers and places. Sometimes, CWC's stations were nowhere near a waterbody, and sometimes one station's location exactly coincided with the location of another station with a different name. There were also instances in which a station was present at a river confluence and it was not evident if the station was intended to be downstream of the confluence or upstream of the confluence (on one of the river branches). One such example is presented in Fig. A5 in Appendix A. All such ambiguous situations resulted in the station being placed in Group 3.
QC4 is related to QC3 but is an independent check on CWC's station names. QC4 ensures that a reference landmark matching the station name can be found, regardless of whether a river body is present in the vicinity or not. If a reliable landmark was not found, the station was placed in Group 3. QC5 ensures that the identified reference landmark is not far from the original CWC station. Some of CWC's stations began operation more than 50 years ago. It is possible that population centers (and their names) have experienced changes during this time and do not always reflect those shown within present-day Google Maps or OSM. A distance of 20 km was selected as a reasonable threshold based on an examination of the typical distances between stations and their landmarks. A majority of the stations meet this criterion and were within 5 km of the corresponding GHI landmark (Fig. 8a). If a station was more than 20 km away from its landmark, it was placed in Group 3.
During the catchment delineation process, stations were relocated onto the pixel-based river networks. QC6 ensures that the relocated station is in the proximity of the original CWC location. Typically, the relocated stations are only a few pixels away from the original location. However, the relocation distance was much larger on some occasions. Given that some of the larger rivers can have channels spanning multiple HydroSHEDS pixels, a distance of 5 km (approximately 10 HydroSHEDS pixels) was assumed to be a reasonable relocation distance. A majority of the stations meet this criterion and were relocated less than 1 km (Fig. 8b). If a station was relocated more than 5 km, it was placed in Group 3.
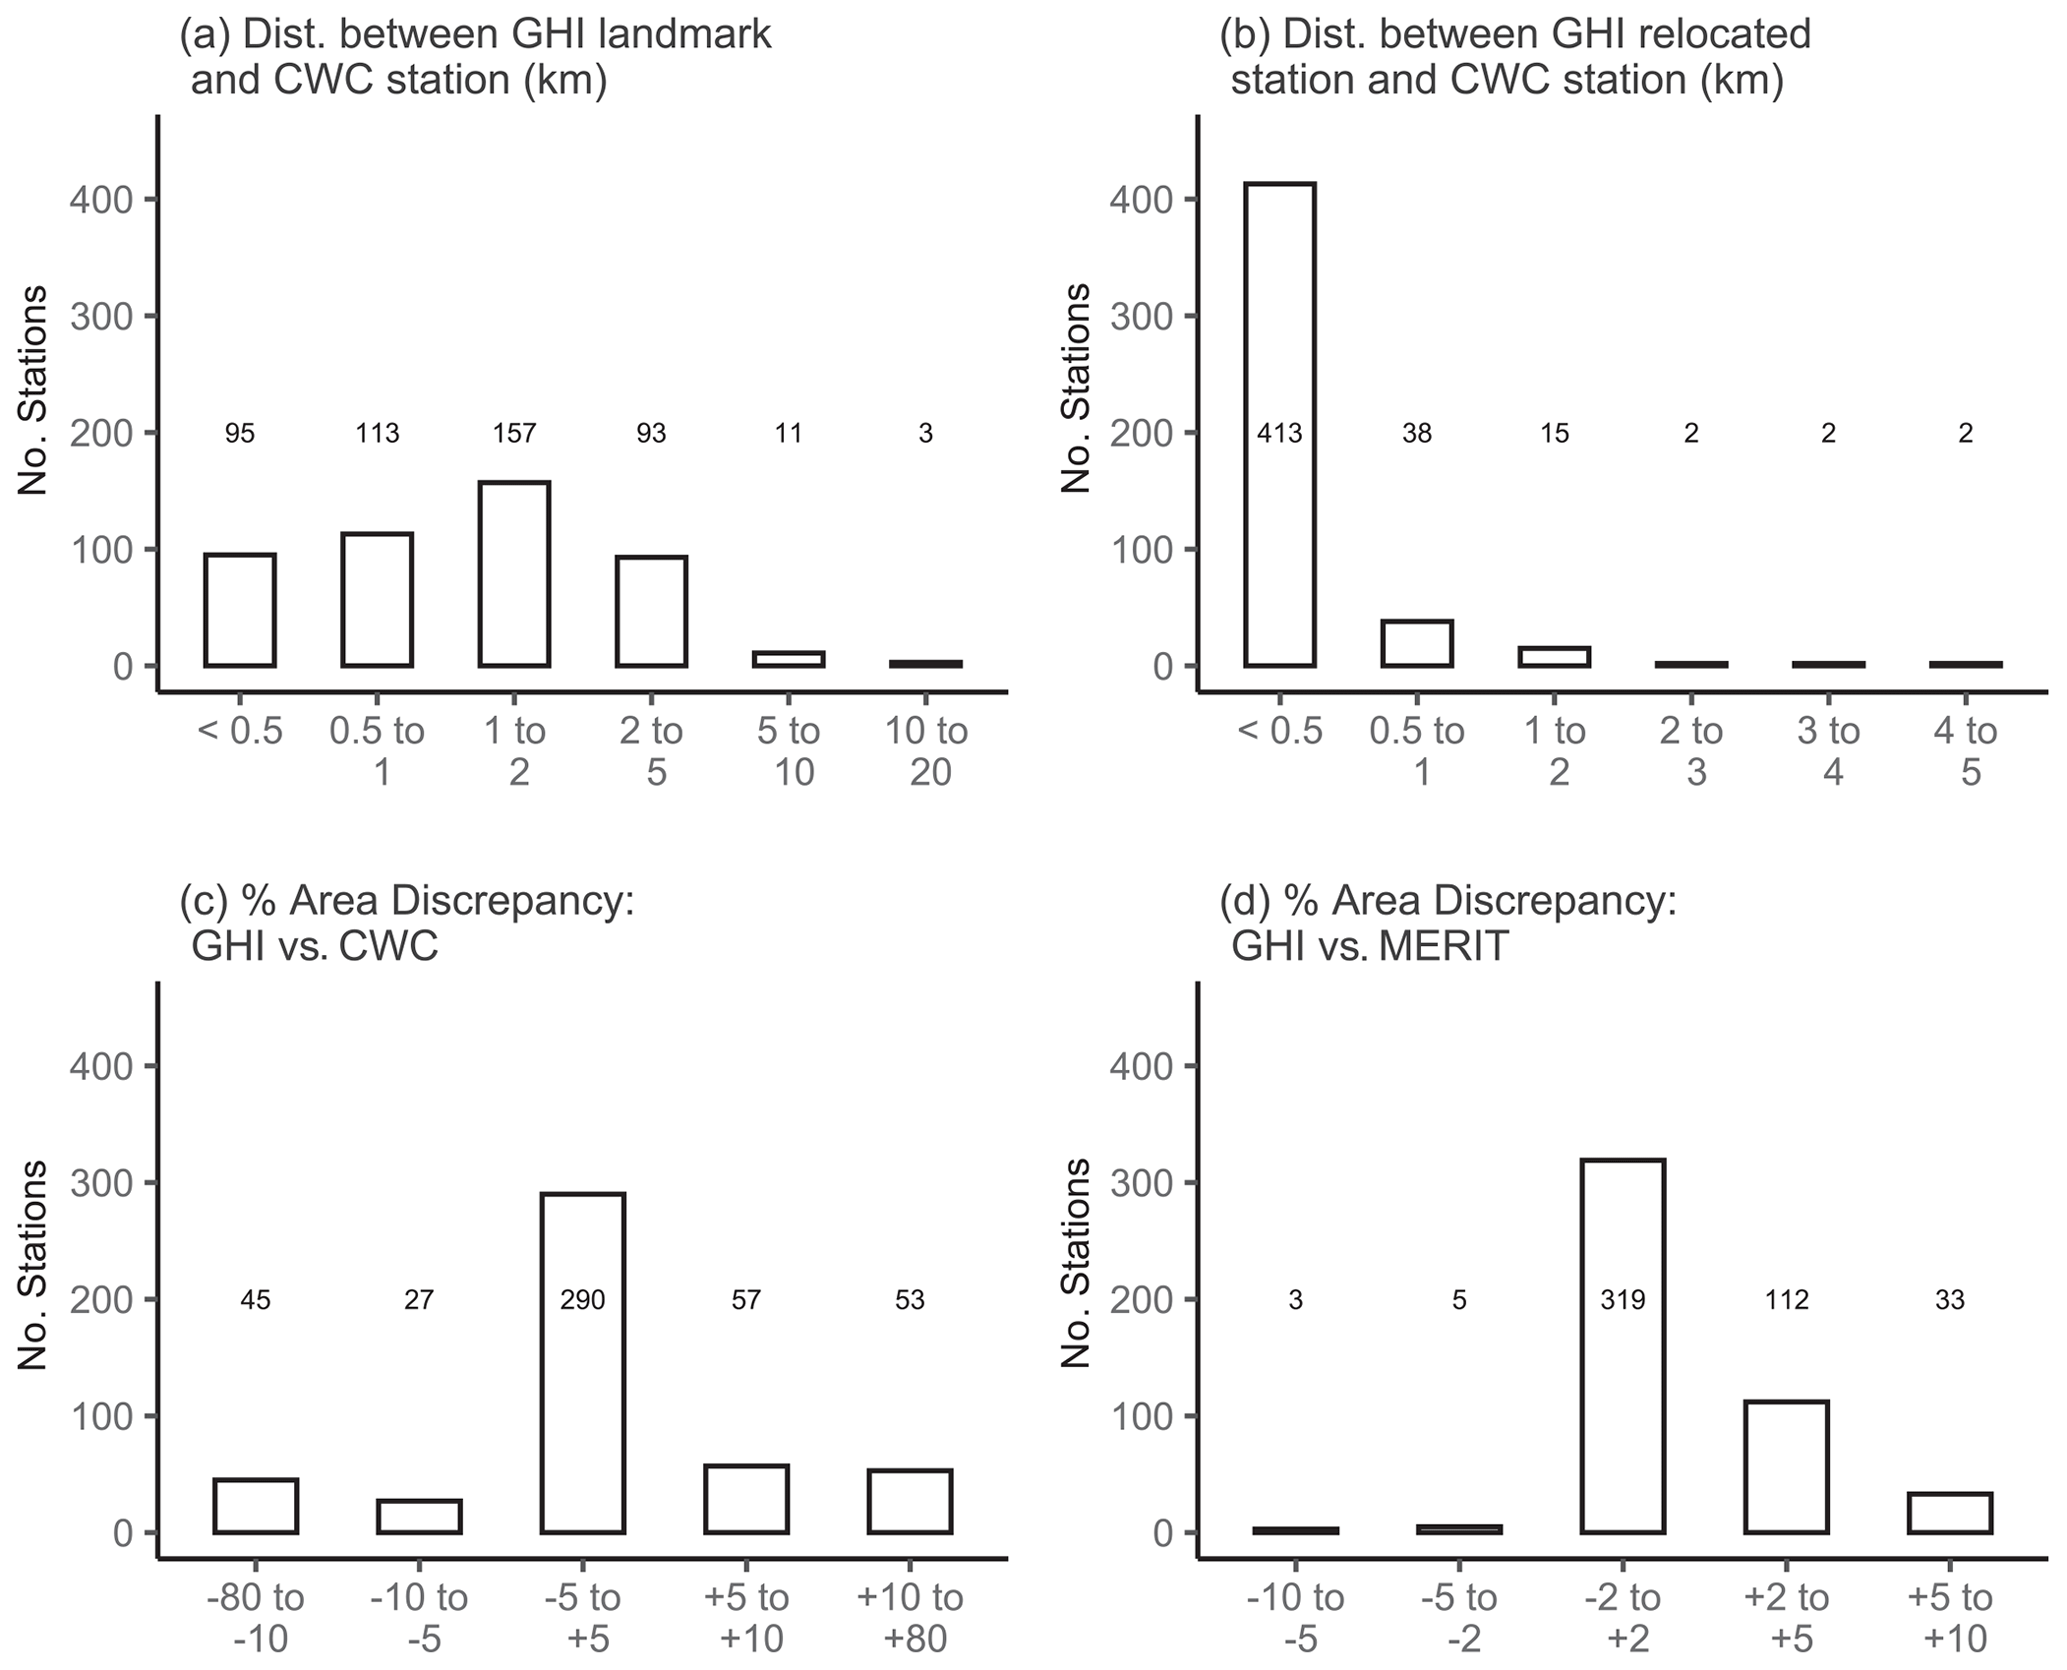
Figure 8Summary of select quality control metrics for stations in groups 1 and 2: (a) QC5 – distance between GHI landmark and the corresponding CWC station; (b) QC6 – distance between GHI relocated station and the corresponding CWC station; (c) QC8 – discrepancy in estimated catchment area between GHI and CWC; and (d) QC9 – discrepancy in estimated catchment area between GHI and MERIT. The numbers within each panel indicate the number of stations associated with each bar of the bar plot.
QC7, QC8 and QC9 pertain to the availability and reliability of catchment area estimates from CWC. Catchment area was not available for certain CWC stations, and QC7 ensures that such stations are placed in Group 3. As discussed in Sect. 1.1, CWC's catchment area estimates are not reliable, and they could sometimes have more than a 50 % discrepancy. The discrepancy between GHI's catchment area estimates and those from CWC and MERIT are shown in Fig. 8. Based on this chart and an examination of other discrepancies, a discrepancy of 80 % between GHI and CWC (GHI relative to CWC) was considered an appropriate threshold. As MERIT-based catchment area estimates are considered equally reliable with respect to those from GHI, a smaller discrepancy of 10 % between GHI and MERIT (GHI relative to MERIT) was considered an appropriate threshold. QC8 and QC9 ensure that the catchment area estimates from GHI stay below these thresholds.
QC10 is on the adequacy of the delineated HydroSHEDS-based river network upstream of the gauging station. While the HydroSHEDS river network typically resembles the actual river network based on Google Maps or OSM, it can be grossly inadequate, particularly in the presence of braided river channels, distributaries or other complex flow regimes. The reasoning behind the use of QC10 is to qualitatively assess the adequacy of the delineated network by visually comparing it with actual river flow paths from Google Maps and OSM. A number of stations in the river deltas of the Mahanadi and Cauvery basins and a number of stations on smaller tributaries did not pass this check. One such example is presented in Fig. A5 in Appendix A.
The final check is on the adequacy of daily streamflow data. As discussed earlier, for many of CWC's stations in Peninsular India, daily streamflow data are available via WRIS. However, there are often many missing records. It should be noted that a flow value of zero was not considered to be missing data in this study. Missing values from WRIS are blanks in the downloaded data spreadsheets. When available, daily data were aggregated to monthly and annual data. Only months with a maximum of 5 missing days and years with a maximum of 60 missing days were used. This would mean that data would be available for at least 80 % of the days in a typical month and for 80 % of the days in a year. Finally, only those stations with a minimum of 5 years of annual streamflow data were selected. As water resources assessments and other hydrologic studies often desire sufficiently long time series, a minimum threshold of 5 years was used in this study. However, these 5 years need not be sequential.
The compiled annual time series was checked against statistics presented by CWC-YB for select stations to ensure consistency between the two sets of estimates. A self-consistency check was also performed to ensure that there were no spuriously large values. After a visual examination of annual time series of streamflow across all available stations, a value of 2 times the 95th percentile was deemed to be a reasonable threshold. Two stations – Pathagudem in Godavari Basin and Sadalga in Krishna Basin, had annual values that exceeded the abovementioned threshold for WY 2017. Both annual and monthly data for WY 2017 for these two stations were discarded.
Table 7Distribution of gauging stations by GHI group within each composite basin.
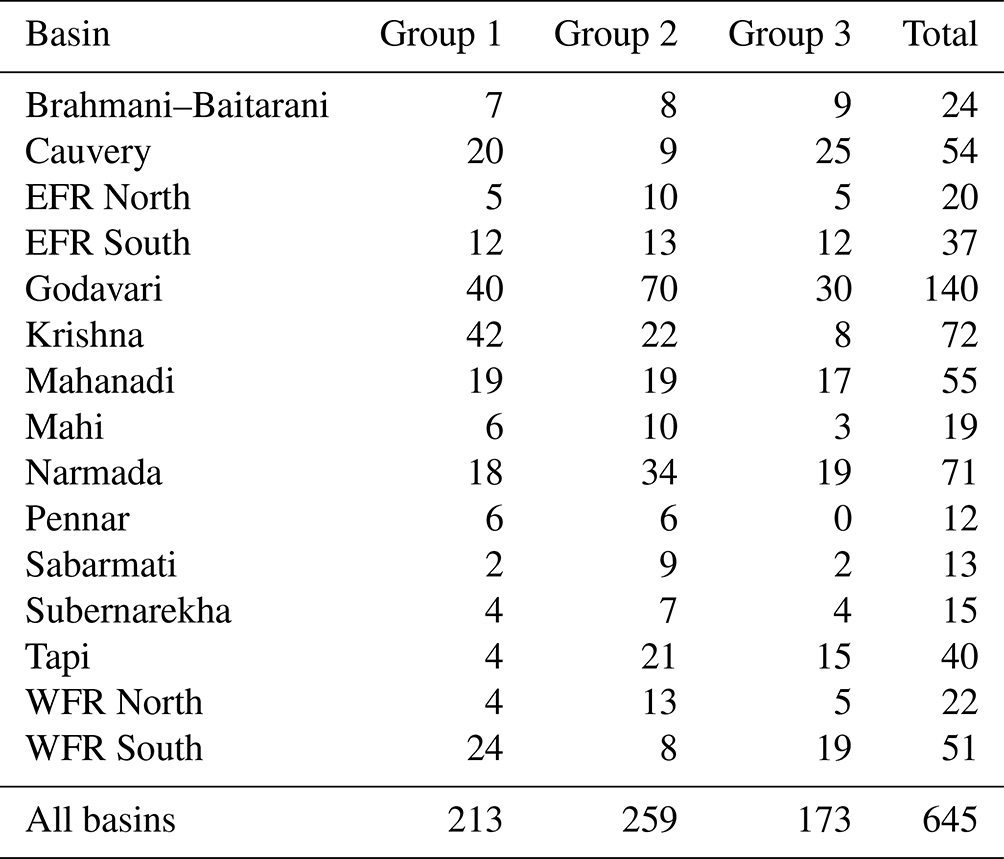
The number of stations falling within each group are tabulated in Table 7. Out of the 645 stations analyzed here, 213 are in Group 1, 259 are in Group 2 and the remaining 173 are in Group 3. Thus 472 of 645 (or about 73 %) of the stations are in Group 1 and Group 2. Except for the Pennar Basin, all river basins have at least one station falling in Group 3. All of the basins have at least a few stations in Group 1. Figure 9 shows the spatial distribution of stations across groups. Figure 9d shows a cluster of stations in the Mahanadi and Cauvery deltas. These stations are associated with river networks that are too complex for GHI to delineate. Stations in the WFR South Basin correspond to catchment areas that are typically much smaller than those in other basins. This is due to the presence of the Western Ghats (or mountains) along the coast, resulting in many small coastal watersheds along the western coast of India. Several such catchments of the WFR South Basin have catchment area discrepancies larger than the thresholds defined in the quality control process (QC8 and QC9 in Fig. 7). Such stations typically have catchment areas of a few hundred square kilometers or less. As discussed in Sect. 6, the 500 m resolution of HydroSHEDS data is probably too coarse to adequately resolve the boundaries and river networks of such catchments.
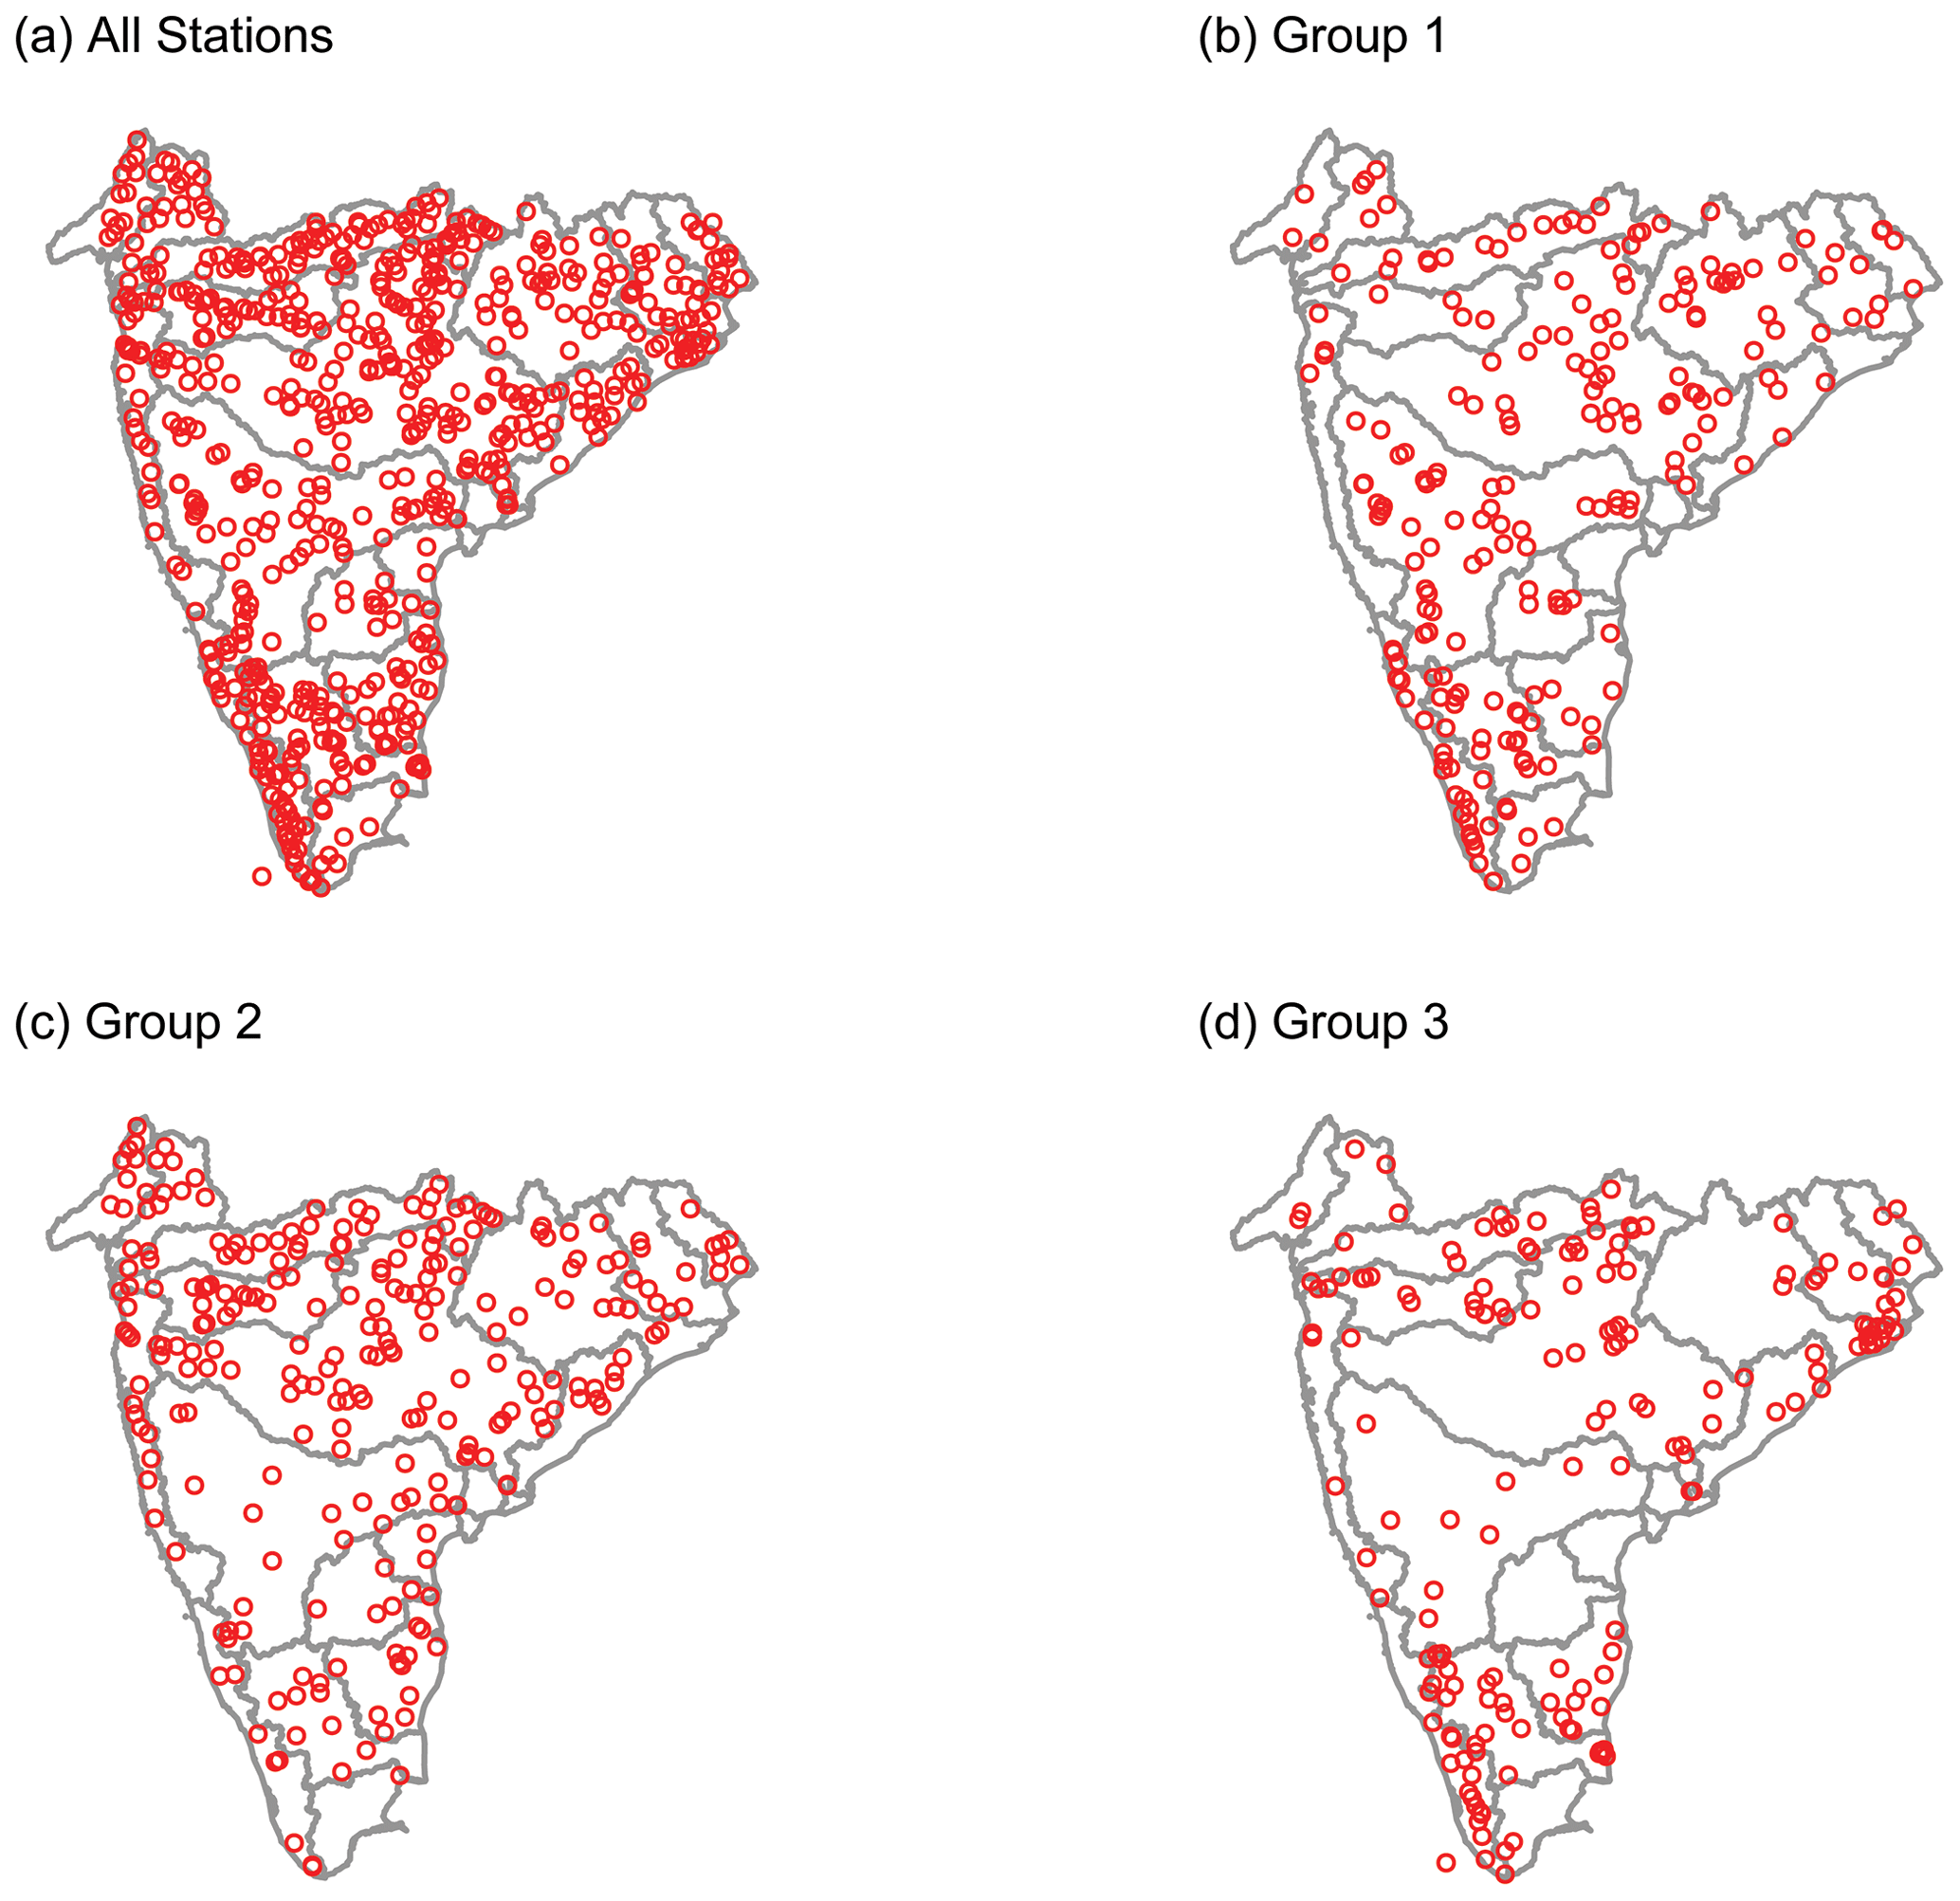
Figure 9Stations falling with each GHI group: (a) all stations, (b) Group 1, (c) Group 2 and (d) Group 3.
3.5 Time series data compilation
Station-wise monthly and annual time series of data of select hydrometeorological variables are compiled for only those stations falling into Group 1 or Group 2. The variables compiled include observed streamflow; observation-based precipitation from IMD; model-based precipitation, ET and runoff from ERA; and ET from GLEAM.
In order to facilitate comparison across these variables, they are expressed in the same units of volume. As various reports from CWC (e.g., CWC-19 and CWC-YB) present summary statistics on streamflow (and other hydrometeorological variables) in units of “MCM” (or 106 m3), this unit was chosen to facilitate cross-checking. For the purposes of discussion and graphical display, sometimes the unit of billion cubic meters (“BCM”, equivalent to km3) was also used. Observed daily streamflow, available in units of cubic meters per second (m3 s−1) was aggregated to cumulative monthly and annual volumes (MCM per month and MCM per year, respectively). Gridded data on precipitation, modeled ET and runoff, available in units of depth per unit area per month (e.g., millimeters per month), were also aggregated to cumulative monthly and annual volumes. The process of aggregating grid-based products to a catchment scale involves identifying the spatial overlap between the grids and the catchment. Such relationships were identified using a GIS analysis. Grid-specific fractional areas were used to aggregate the gridded data to each catchment. A schematic illustrating the process of aggregation is given in Fig. A6.
Instead of the calendar year (January–December), a water year (WY) is often used in hydrological analyses. Consistent with CWC-19 and other CWC publications, the water year in this study is defined as the period starting on 1 June and ending on 31 May of the following calendar year. For example, WY 2020 spans the period 1 June 2020 through 31 May 2021.
The time span of GHI's time series of data is WY 1950 to 2020 (71 water years), whenever data are available. Precipitation data from IMD and all data from ERA span the 71 WYs, whereas GLEAM data span WY 1980 to 2020 (41 WYs). The availability of streamflow data from WRIS is station dependent, and no station spans the entirety of the above 71 WYs. The compiled streamflow observations for stations in Group 1 span WY 1965 to 2017, with individual station record lengths varying from 6 WYs to 53 WYs (median length of 34 WYs). There are 175 stations within GHI that have at least 20 WYs of streamflow data.
GHI is publicly available (Goteti, 2023) and includes metadata on stations, GIS data on catchment boundaries and river networks, station-wise time series of data on hydrometeorological variables, and station-wise summary graphics. Additional information on files included within GHI is provided in Sect. 7.
While users of this dataset can filter down to the specific station or river basin of interest, it is useful to have readily available summary graphics that provide an overview of catchment-scale water balance metrics. Such summary graphics not only provide a visual check on the data created for this station but could also be useful tools for water managers and other stakeholders. Two sets of summary graphics are included within GHI: a station-wise annual time series chart and a monthly time series chart. An example for the Mancherial station in the Godavari Basin is shown in Figs. 10 and 11. Figure 10 includes a map of the station location and also a map of the upstream catchment area and the river network. The charts show the time series of catchment-averaged hydrometeorological data available through GHI.
From Fig. 10, it is evident that annual precipitation from IMD and ERA are generally consistent with each other. Estimated ET values from ERA and GLEAM are also temporally consistent with each other but consistently differ in magnitude for this station. While the specific causes of discrepancies between these two datasets are unknown, the reader is referred to Muñoz-Sabater et al. (2021) and the references therein for further discussion. Annual runoff from ERA tends to be lower than observed runoff prior to 1990 but higher than observed runoff after 1990. While the exact cause of this is unknown, it is speculated that flow regulation by dams and reservoirs could be one of the reasons. ERA does not account for flow regulation by dams and reservoirs and is not expected to match the observed flow. Overall, ERA reasonably captures annual-scale observed precipitation (from IMD) and observed runoff (streamflow from WRIS).
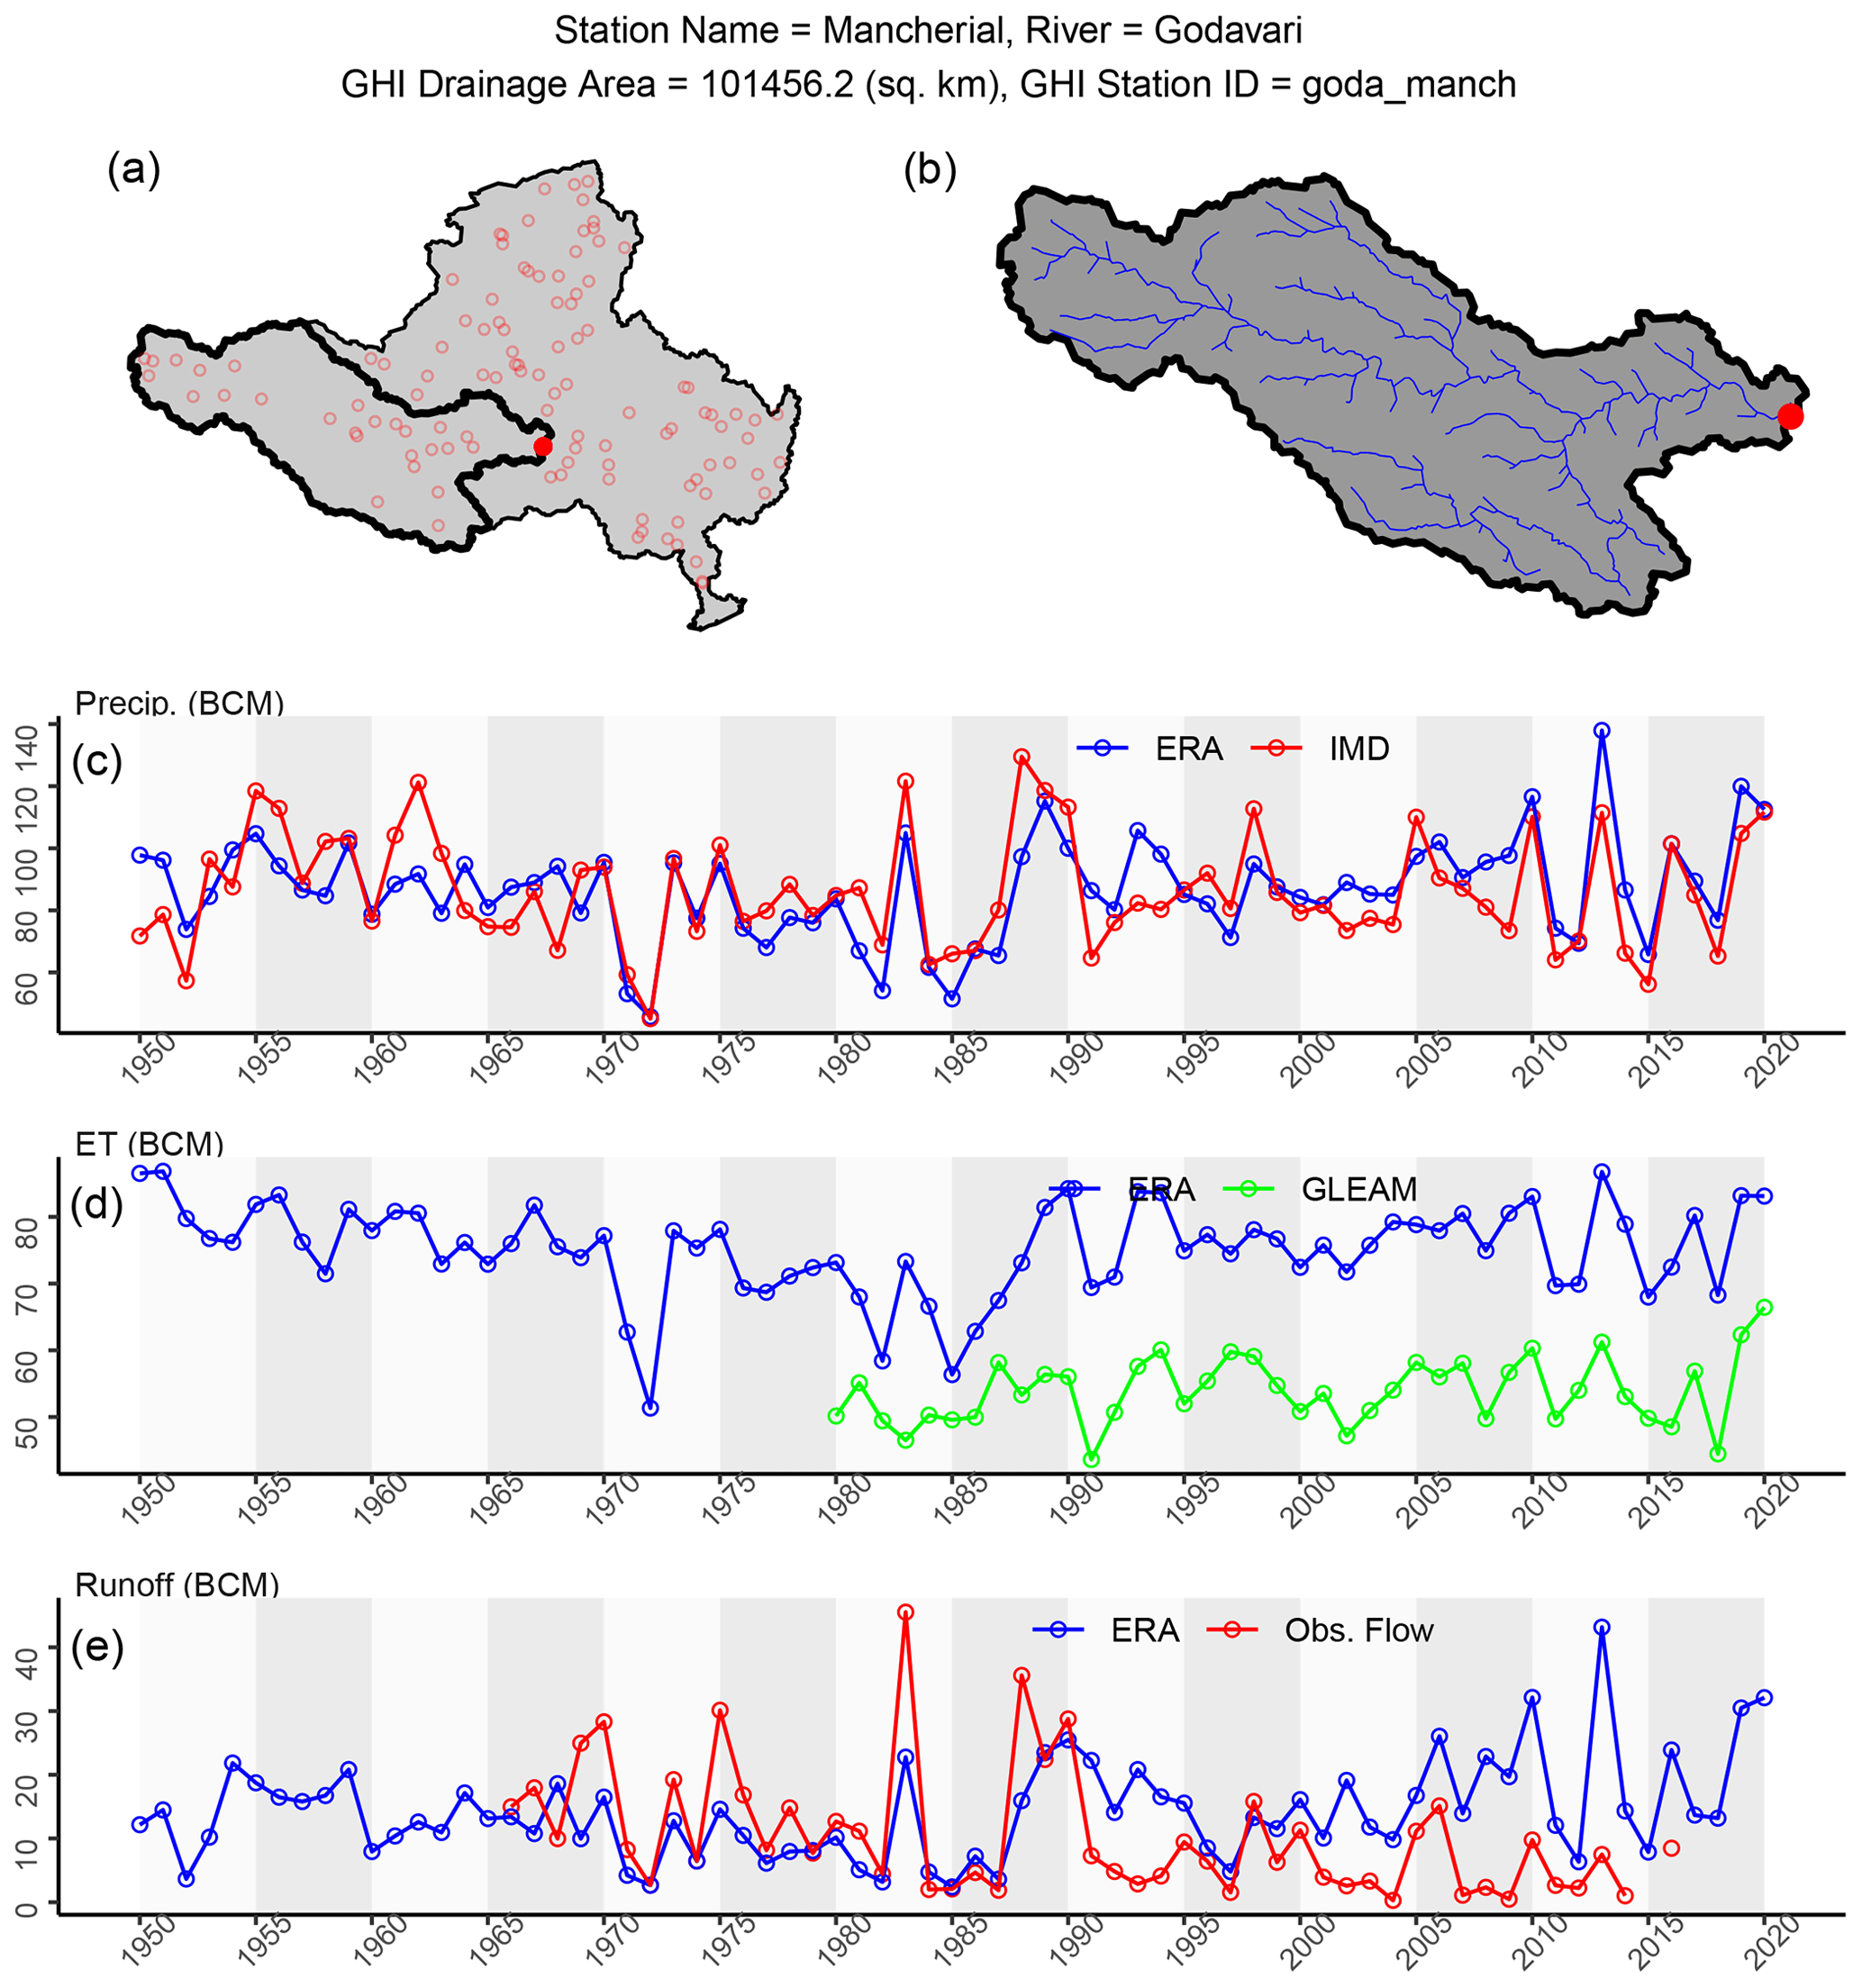
Figure 10One-page summary of final GHI output for Mancherial station in the Godavari Basin. Panel (a) shows the location of the Mancherial catchment within the Godavari Basin. Panel (b) displays the Mancherial catchment and river network. Panels (c), (d) and (e) present respective time series of precipitation, evapotranspiration and runoff by water year (WY).
The monthly time series of hydrometeorological variables for the Mancherial station is shown for the most recent 10-year period in Fig. 11. The monthly time series for each year in the chart begin in June of the current year and end in May of the following calendar year, consistent with the definition of water year used throughout this study. Similar to Fig. 10, precipitation from ERA and IMD are highly consistent with each other. ET from ERA is higher than that from GLEAM, particularly at the beginning of the water year (summer and fall months). As mentioned earlier, ERA does not account for flow regulation, and this could be one of the reasons why ERA's runoff is higher than observed flow. The monthly time series of precipitation, ET and runoff reflect the seasonality imposed by the southwest monsoons – wet season from June to September, followed by a dry season.
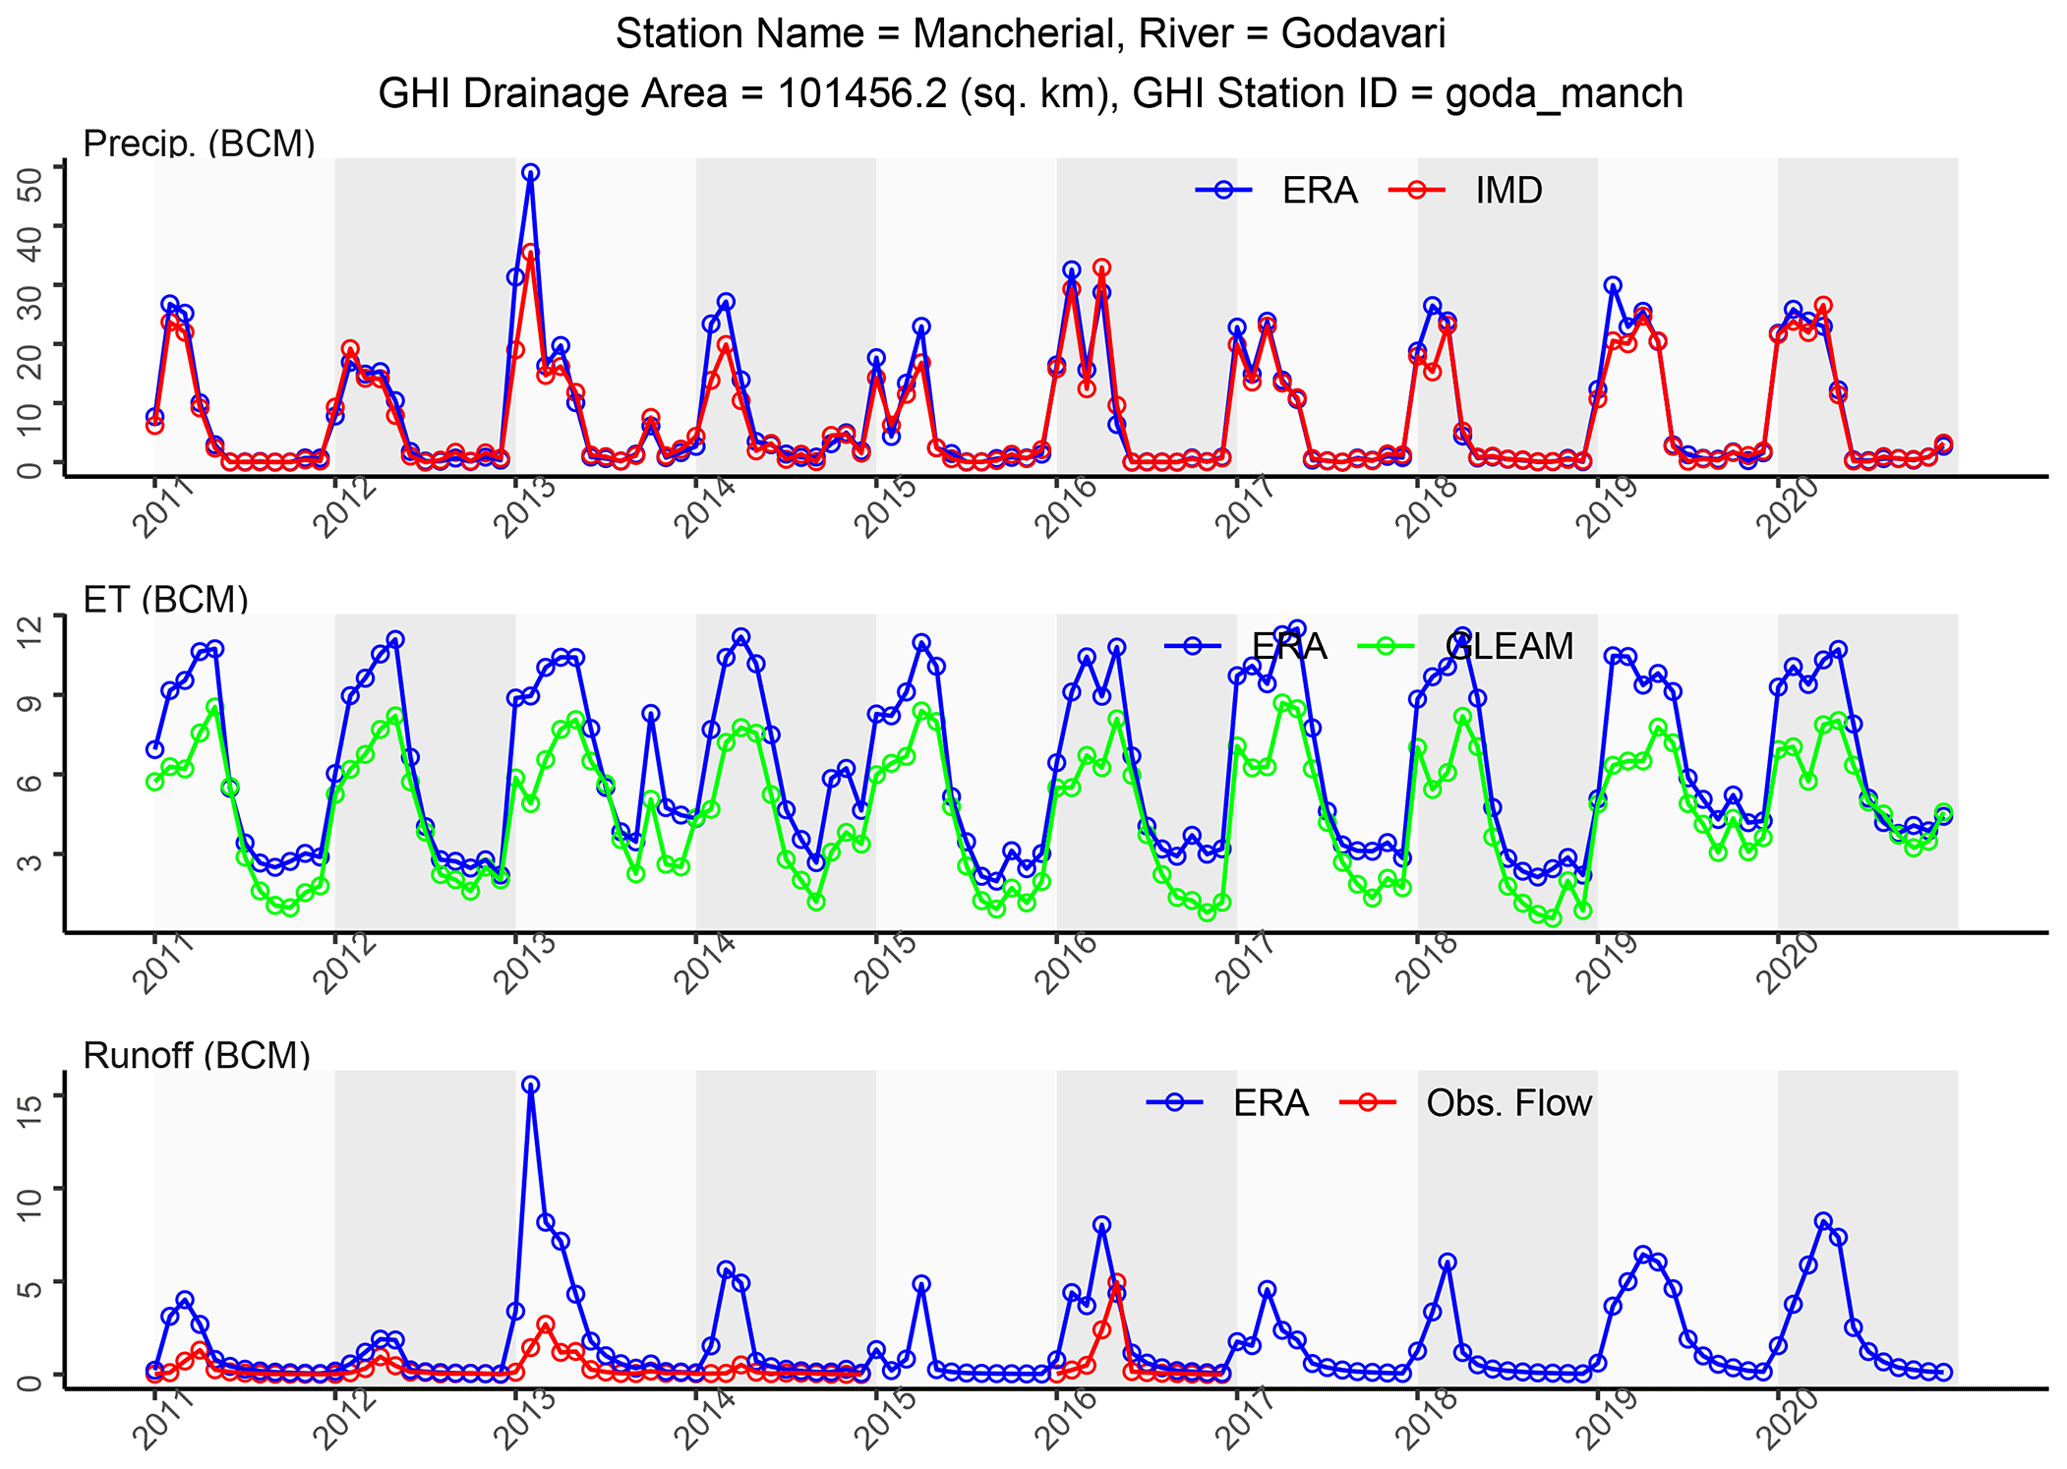
Figure 11Same as Fig. 10 but showing monthly time series of compiled hydrometeorological data for WY 2011–2020.
Similar graphics are available for the rest of the stations in Group 1 and Group 2. While users can visually examine graphics on individual stations, it is not feasible to assess the overall adequacy of the compiled hydrometeorological through visual examination alone. A preliminary analysis was performed in Sect. 5 using the compiled hydrometeorological data. The aim of this analysis was to check for the presence (or absence) of patterns expected based on the hydrology and climate of the study domain. Such an analysis would also reveal any spurious patterns within the compiled time series of data and help understand the consistency between different datasets.
The analysis presented here focuses only on catchment-averaged annual-scale metrics for the sake of simplicity. Metrics examined include the correlation between precipitation from ERA and IMD, the correlation between ET from ERA and GLEAM, and the ratio of observed runoff and precipitation. Only stations in groups 1 and 2 (472 stations) were considered when analyzing precipitation and ET, while only stations in Group 1 (213 stations) were considered when analyzing observed runoff.
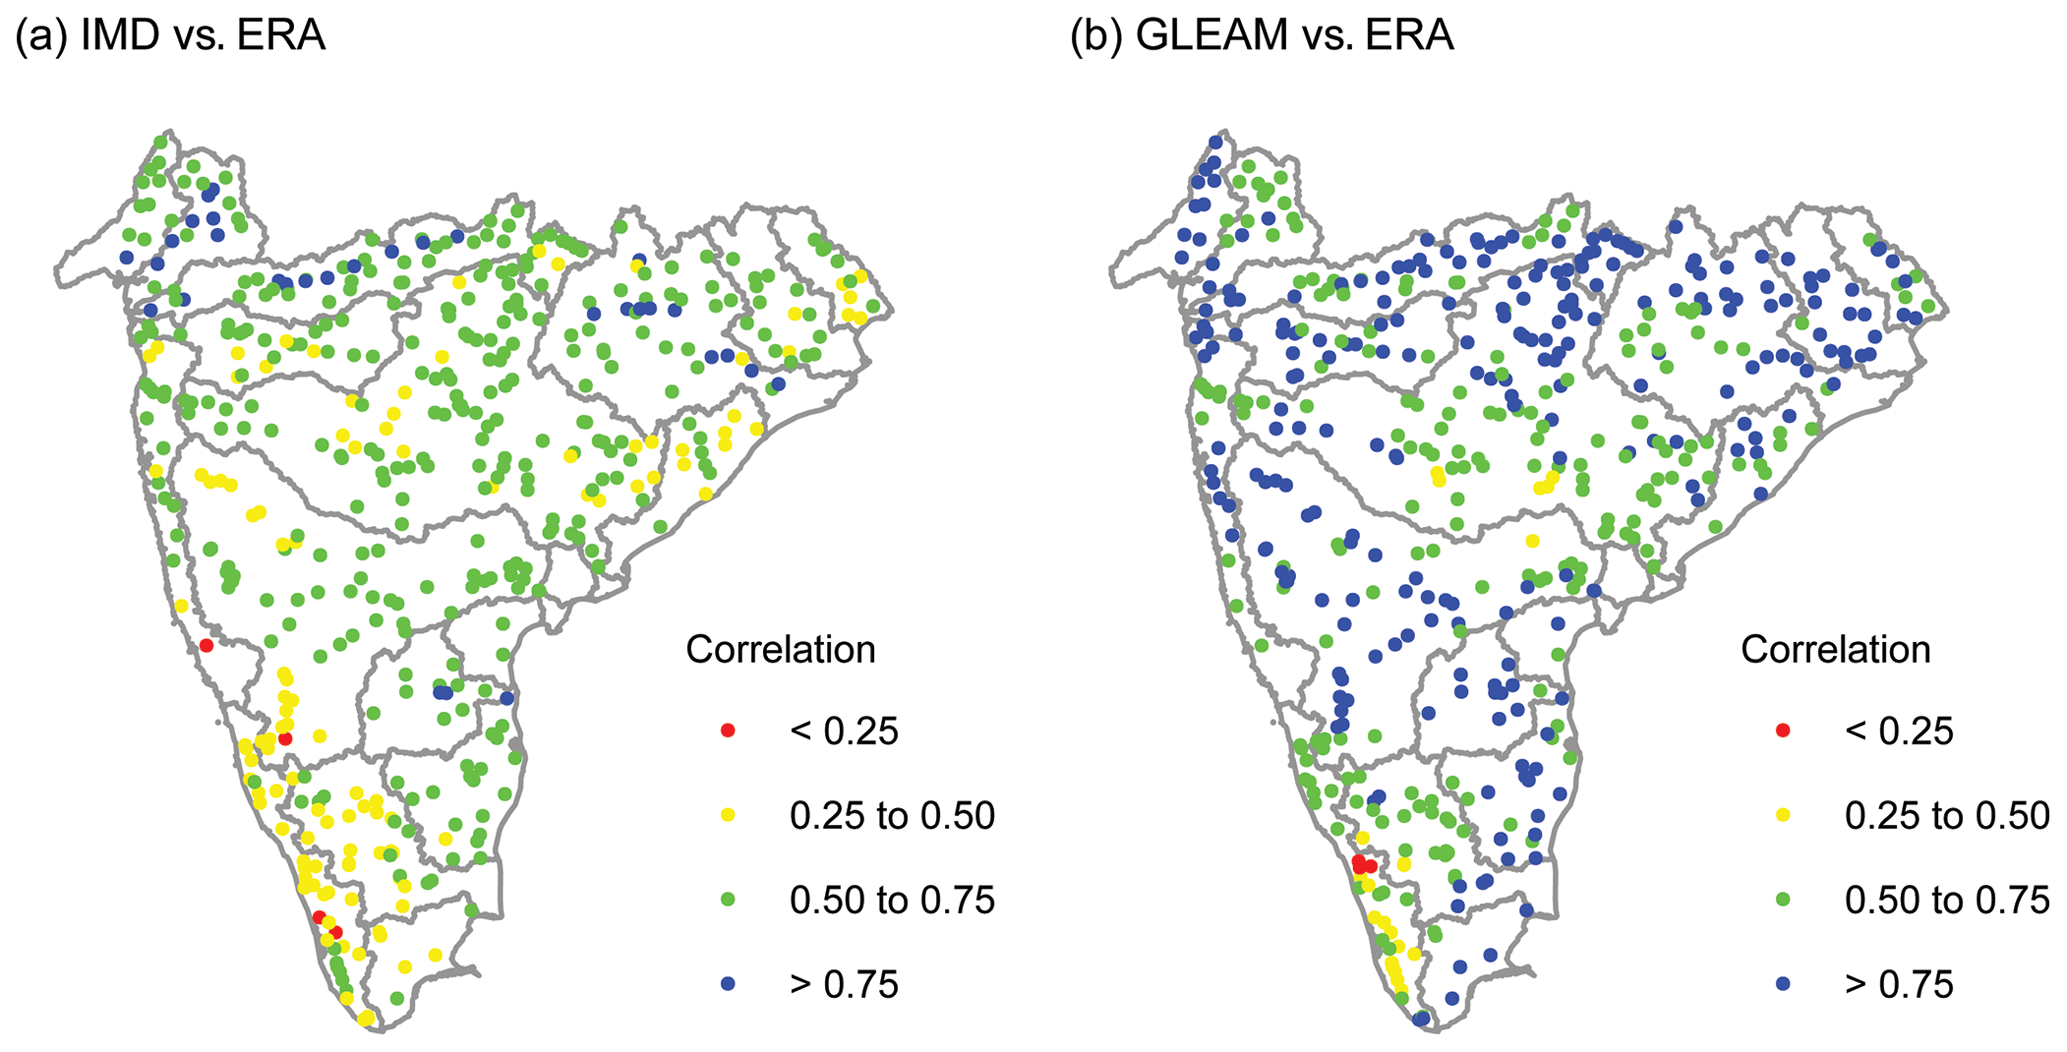
Figure 12(a) Correlation between annual catchment-averaged precipitation from IMD and ERA and (b) correlation between annual catchment-averaged ET from GLEAM and ERA.
The linear correlation coefficient (Pearson correlation using pairwise complete data) between IMD's annual precipitation and ERA's annual precipitation is shown in Fig. 12. For a majority of the stations (331 out of 472), the correlation is between 0.50 and 0.75. The correlation is greater than 0.75 for a small number of stations (31 out of 472), whereas it is lower in the southwestern portion of the study domain where hilly terrain is typical – this includes southern Krishna Basin, western Cauvery Basin, parts of WFR North Basin, and almost the entirety of WFR South Basin. The general consistency between IMD and ERA precipitation was also reported by Mahto and Mishra (2019) and Goteti (2022).
The correlation between annual ET from GLEAM and ERA is also shown in Fig. 12. For a majority of the stations (250 out of 472), the correlation is greater than 0.75. Similar to precipitation, the correlation is higher in other parts of the study domain, compared with the southwestern portion of the study domain. The consistent high correlation between GLEAM and ERA estimated ET was also noted by Goteti (2022).
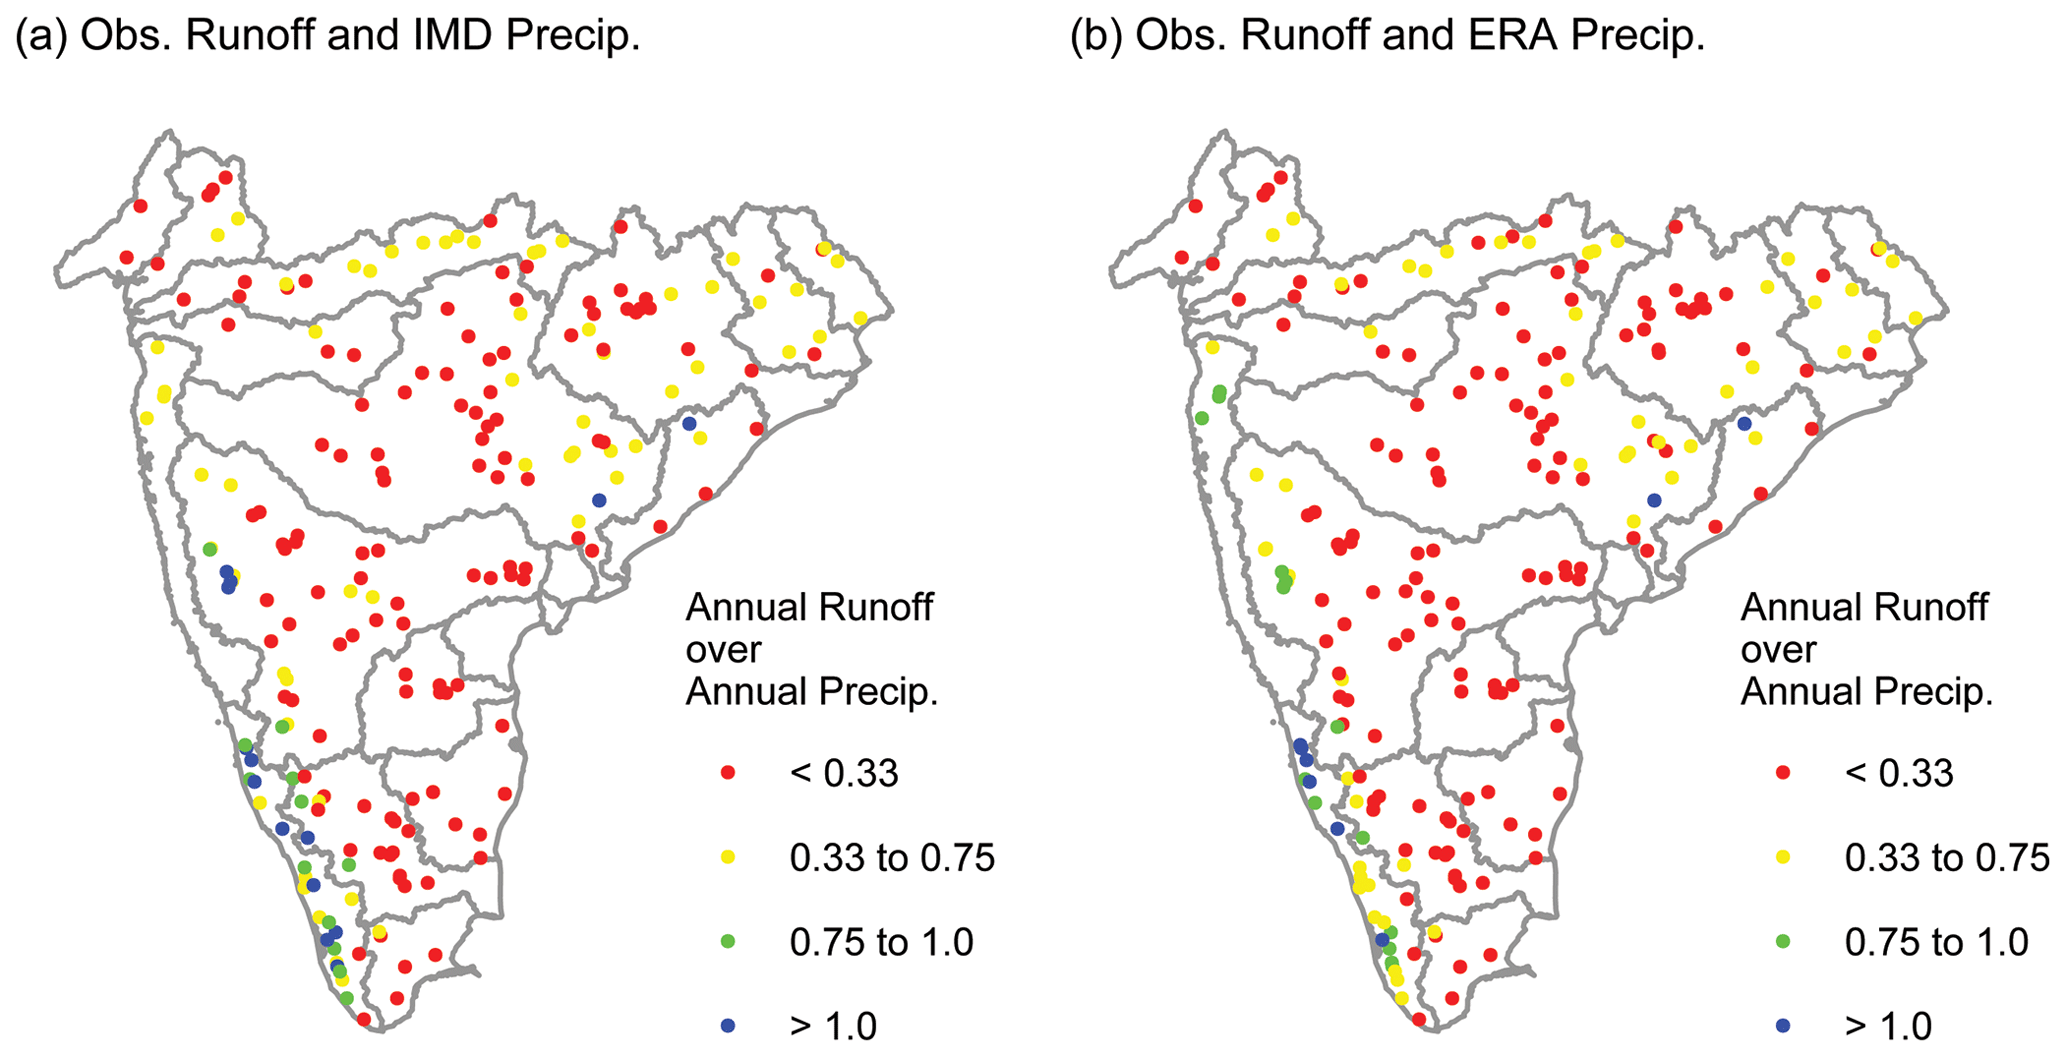
Figure 13(a) Median ratio of observed annual runoff and IMD annual catchment-averaged precipitation and (b) median ratio of observed annual runoff and ERA annual catchment-averaged precipitation.
Figure 13 shows median ratio of observed runoff and precipitation () from IMD and ERA. For each year, was computed using available data, and the median value was estimated and is plotted in Fig. 13. In general, for a majority of the stations (125 out of 213 for IMD and 136 out of 213 for ERA), median is less than 0.33. This is expected given the semiarid climate of a large part of the study domain. In such climates, a large portion of the annual precipitation would go towards satisfying the evaporative demand, resulting in low ratios. For the southwestern portion of the study domain, where hilly terrain and wet climate are prevalent, ratios are expected to be higher. This was the case for several stations. However, median is greater than 1.0 for certain stations, regardless of whether the precipitation was from IMD or ERA. Such stations are present mostly in the hilly regions along the western coast of India. A value greater than 1.0 implies that total annual runoff from the catchment exceeds the total annual precipitation. Such a finding may seem “absurd” at a first glance and warrants further discussion.
From basic hydrologic balance, in the absence of any human intervention, the annual volume of runoff from a river basin is expected to be less than the annual volume of precipitation. Hence, values of greater than 1.0 suggest either substantial human intervention to the water cycle (e.g., carryover reservoir storage) or errors associated with data. Such errors could be with catchment area delineation, erroneous data compilation, or erroneous underlying runoff or precipitation data. Catchment area discrepancy between GHI and CWC-21 for stations where is greater than 1.0 is within 5 % for most of the stations. Moreover, precipitation and observed streamflow data compiled from this study are consistent with independent compilations from other studies (CWC-YB and CWC-19). Hence, data compilation errors can be ruled out.
It is speculated that the “absurdity” of being greater than 1.0 is either due to carryover reservoir flow or due to errors with the underlying streamflow or precipitation data. It is not known whether there are any gross measurement inaccuracies associated with streamflow data. Other studies have indicated the complexities of capturing precipitation in this region where orographic effects play a major role in creating intense precipitation events (e.g., Rana et al., 2015; Thakur et al., 2019). The estimated catchment areas of these stations with spurious ratios are typically less than 1000 km2. As IMD's individual grids are about 25 km × 25 km or 625 km2 in size, IMD's data may not be suited to capture the necessary spatial variability in precipitation. However, ERA's precipitation suffers from a similar issue despite being at a higher resolution (grid size of about 100 km2). It should also be noted that this is not the first study to encounter spurious values in this region. CWC-19 tabulated annual runoff values greater than annual precipitation for some of the catchments of the WFR South Basin (CWC-19, 2019, see their Appendix R, Tables R-1 to R-10) but did not delve into the underlying causes. A further discussion of this topic is beyond the scope of this paper and will be addressed in the future.
GHI's adoption of 15 arcsec (500 m) HydroSHEDS data as the underlying template imposes a limit on the spatial accuracy of delineated catchment boundaries and river networks. For larger river basins, this resolution is probably adequate for most practical purposes. However, for smaller river basins, such as those less than 100 km2 (equivalent to about 400 HydroSHEDS pixels), topographic data based on higher resolution might be more appropriate. A new version of HydroSHEDS (v2, https://www.hydrosheds.org/, last access: 1 February 2023) based on 12 m topographic data is scheduled to be released in 2023. It is expected that this new version would improve the spatial accuracy of the entire suite of HydroSHEDS products. GHI's catchment boundaries and river networks could be updated with this latest dataset. While significant effort was made to accurately identify the catchment boundaries corresponding to each station, there were instances where the delineated boundary included a few 500 m pixels not contributing to flow at the station. The effect of such pixels on delineated catchment boundaries and area estimates is minimal, but they need to be discarded to make the boundaries more accurate. In future revisions, this issue will be addressed.
Some of the quality checks used in the development of GHI use subjective thresholds and were devised to separate the more reliable data from the less reliable. One could end up with a different number of stations within each group if those subjective thresholds were changed. Out of the 645 stations analyzed here, 173 stations were placed in Group 3 because sufficient reliable metadata could not be compiled for many of these stations. It is hoped that CWC will corroborate metadata on these stations so that they can eventually be moved into Group 1 or Group 2. An obvious next step is to extend the domain of GHI from Peninsular India to the whole of India. However, streamflow data for the rest of India are not publicly available. Such data are critical for hydrologic assessments, climate change studies and other modeling analyses. It is also hoped that this study will encourage CWC and other custodians of streamflow data to make such data publicly available. Another issue with extending the domain of GHI to the whole of India is the issue of drainage boundaries crossing international boundaries and the prevailing uncertainty about these drainage boundaries. An analysis on the Ganga's basin boundaries delineated using HydroSHEDS data and the discrepancies between such boundaries and those available from CWC and WRIS is currently being pursued by the author.
Missing daily streamflow values were filled in using the average of available daily data. Such a procedure will not adequately capture the rising and falling limbs of the daily hydrograph. Future revisions could use established methods such as the time series interpolation of Fritsch and Carlson (1980), which is readily available within many data analysis software packages. Currently, hydrometeorological data within GHI includes precipitation, modeled ET and runoff, and observed streamflow. Additional variables, such as catchment-averaged soil moisture, could be useful in water balance studies. Modeled runoff was aggregated to the catchment without accounting for travel time from individual grids to the catchment outlet, assuming that the resulting monthly and annual hydrographs are unaffected by channel routing. Such an assumption may not be appropriate for the downstream locations of large river basins. Agriculture is the biggest land use in India (NRSC, 2007) and is responsible for about 70 % of water abstractions (CWC-19). Inclusion of annual maps of cropland and irrigated area would be useful in the estimation of consumptive water use within water resources assessments, such as those by CWC-19 and Goteti (2022).
While event-scale precipitation over the western coast of India has been analyzed before, such as the extreme precipitation resulting in the floods of 2018 (e.g., Hunt and Menon, 2020), this is probably the first study to report potential annual-scale underrepresentation of precipitation in this region. This issue needs to be investigated further. High-resolution datasets on precipitation, such as those from the Indian Monsoon Data Assimilation and Analysis (IMDAA) (Rani et al., 2021) and Climate Hazards Group InfraRed Precipitation with Station data (CHIRPS) (Funk et al., 2014) could be helpful in addressing such issues. Human management of the water could have a substantial effect on streamflow and the hydrologic cycle. The inclusion of data on dams and reservoirs (both metadata and live storage) would be helpful in quantifying the effects of flow regulation. WRIS-OL provides live storage information for select reservoirs, and these data could be included within GHI in future revisions.
GHI is publicly available at https://doi.org/10.5281/zenodo.7563599 (Goteti, 2023) and includes the following files: (1) a “Readme.txt” file that outlines the available files, the format of these files and the data fields within these files; (2) plain-text files on station metadata (station locations from CWC, relocated locations, landmarks, catchment areas and other attributes) and hydrometeorological data time series (monthly and annual files); (3) shapefiles (GIS) on composite river basin boundaries, catchment boundaries and catchment-specific river networks for stations present in Group 1 and Group 2; and (4) PDF files showing station-wise summary maps and time series (monthly and annual files).
GIS data on river gauging stations, their upstream catchment area boundaries and river networks comprise a fundamental building block of hydrologic analyses. Information on India’s river basins is insufficient and is limited by drawbacks such as ambiguous station locations and inconsistent or erroneous catchment area estimates, among others. The goal of this study is to highlight the limitations of existing data and to build a publicly available hydrographic dataset using state-of-the-art global resources. The dataset developed by this study, GHI, categorizes available information from India's water agencies based on its consistency with global data sources. Existing metadata are supplemented with additional information where needed. The quality control aspect of GHI includes the following: verifying the station description using online maps, checking for visual consistency of delineated river network with online maps, comparing GHI-estimated catchment areas with those from CWC and MERIT, and checking streamflow data for missing records and extreme outliers.
The current version of GHI is limited to 645 stations in 15 river basins of Peninsular India. Out of these 645 stations, 472 were deemed reliable for subsequent analyses and 173 were not. While the geospatial information within GHI includes GIS data on gauge locations, catchment boundaries and river networks, the time series information within GHI includes precipitation, ET and runoff at monthly and annual timescales for each of the above 472 stations. A preliminary analysis using GHI's time series of data suggests that, while the compiled data are reasonable over most of the study domain, spurious runoff–precipitation ratios were observed in the hilly coastal regions of Western India. This issue needs to be investigated further. Building a robust hydrographic and hydrometeorological dataset is beyond the scope of one individual. Until such datasets become available, GHI is intended to serve as a building block and a reliable reference for hydrologic analyses on India's river basins.
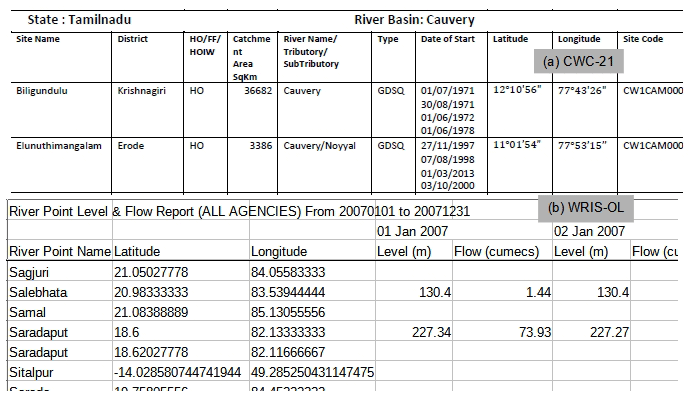
Figure A1Snippet showing the metadata information available from CWC and WRIS: (a) data from CWC-21 and (b) raw downloaded streamflow data from WRIS-OL for the year 2007. Daily data from WRIS-OL are sometimes available as the gauge level and/or discharge. Note the discrepancy in latitude and longitude for the Saradaput station; also note the spurious latitude and longitude for the Sitalpur station (which corresponds to a location in the Southern Hemisphere).
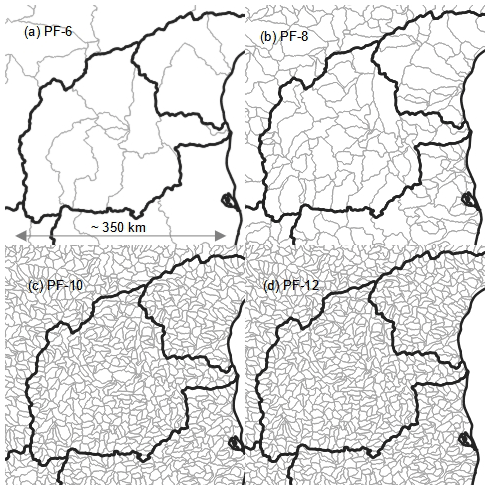
Figure A2HydroSHEDS watersheds (gray lines) across the Pennar River basin (black line) at different Pfafstetter (PF) levels: PF-6, PF-8, PF-10 and PF-12.
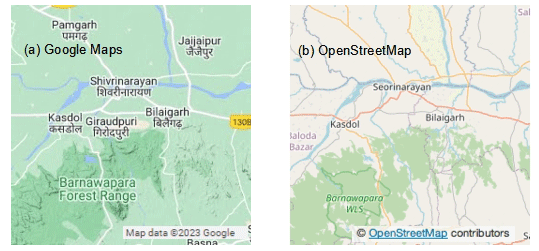
Figure A3Example showing the typical information available from (a) Google Maps and (b) OSM for a selected region in the Mahanadi River basin. Google Maps typically has more town and city names, whereas OSM has more natural features such as rivers and waterbodies.
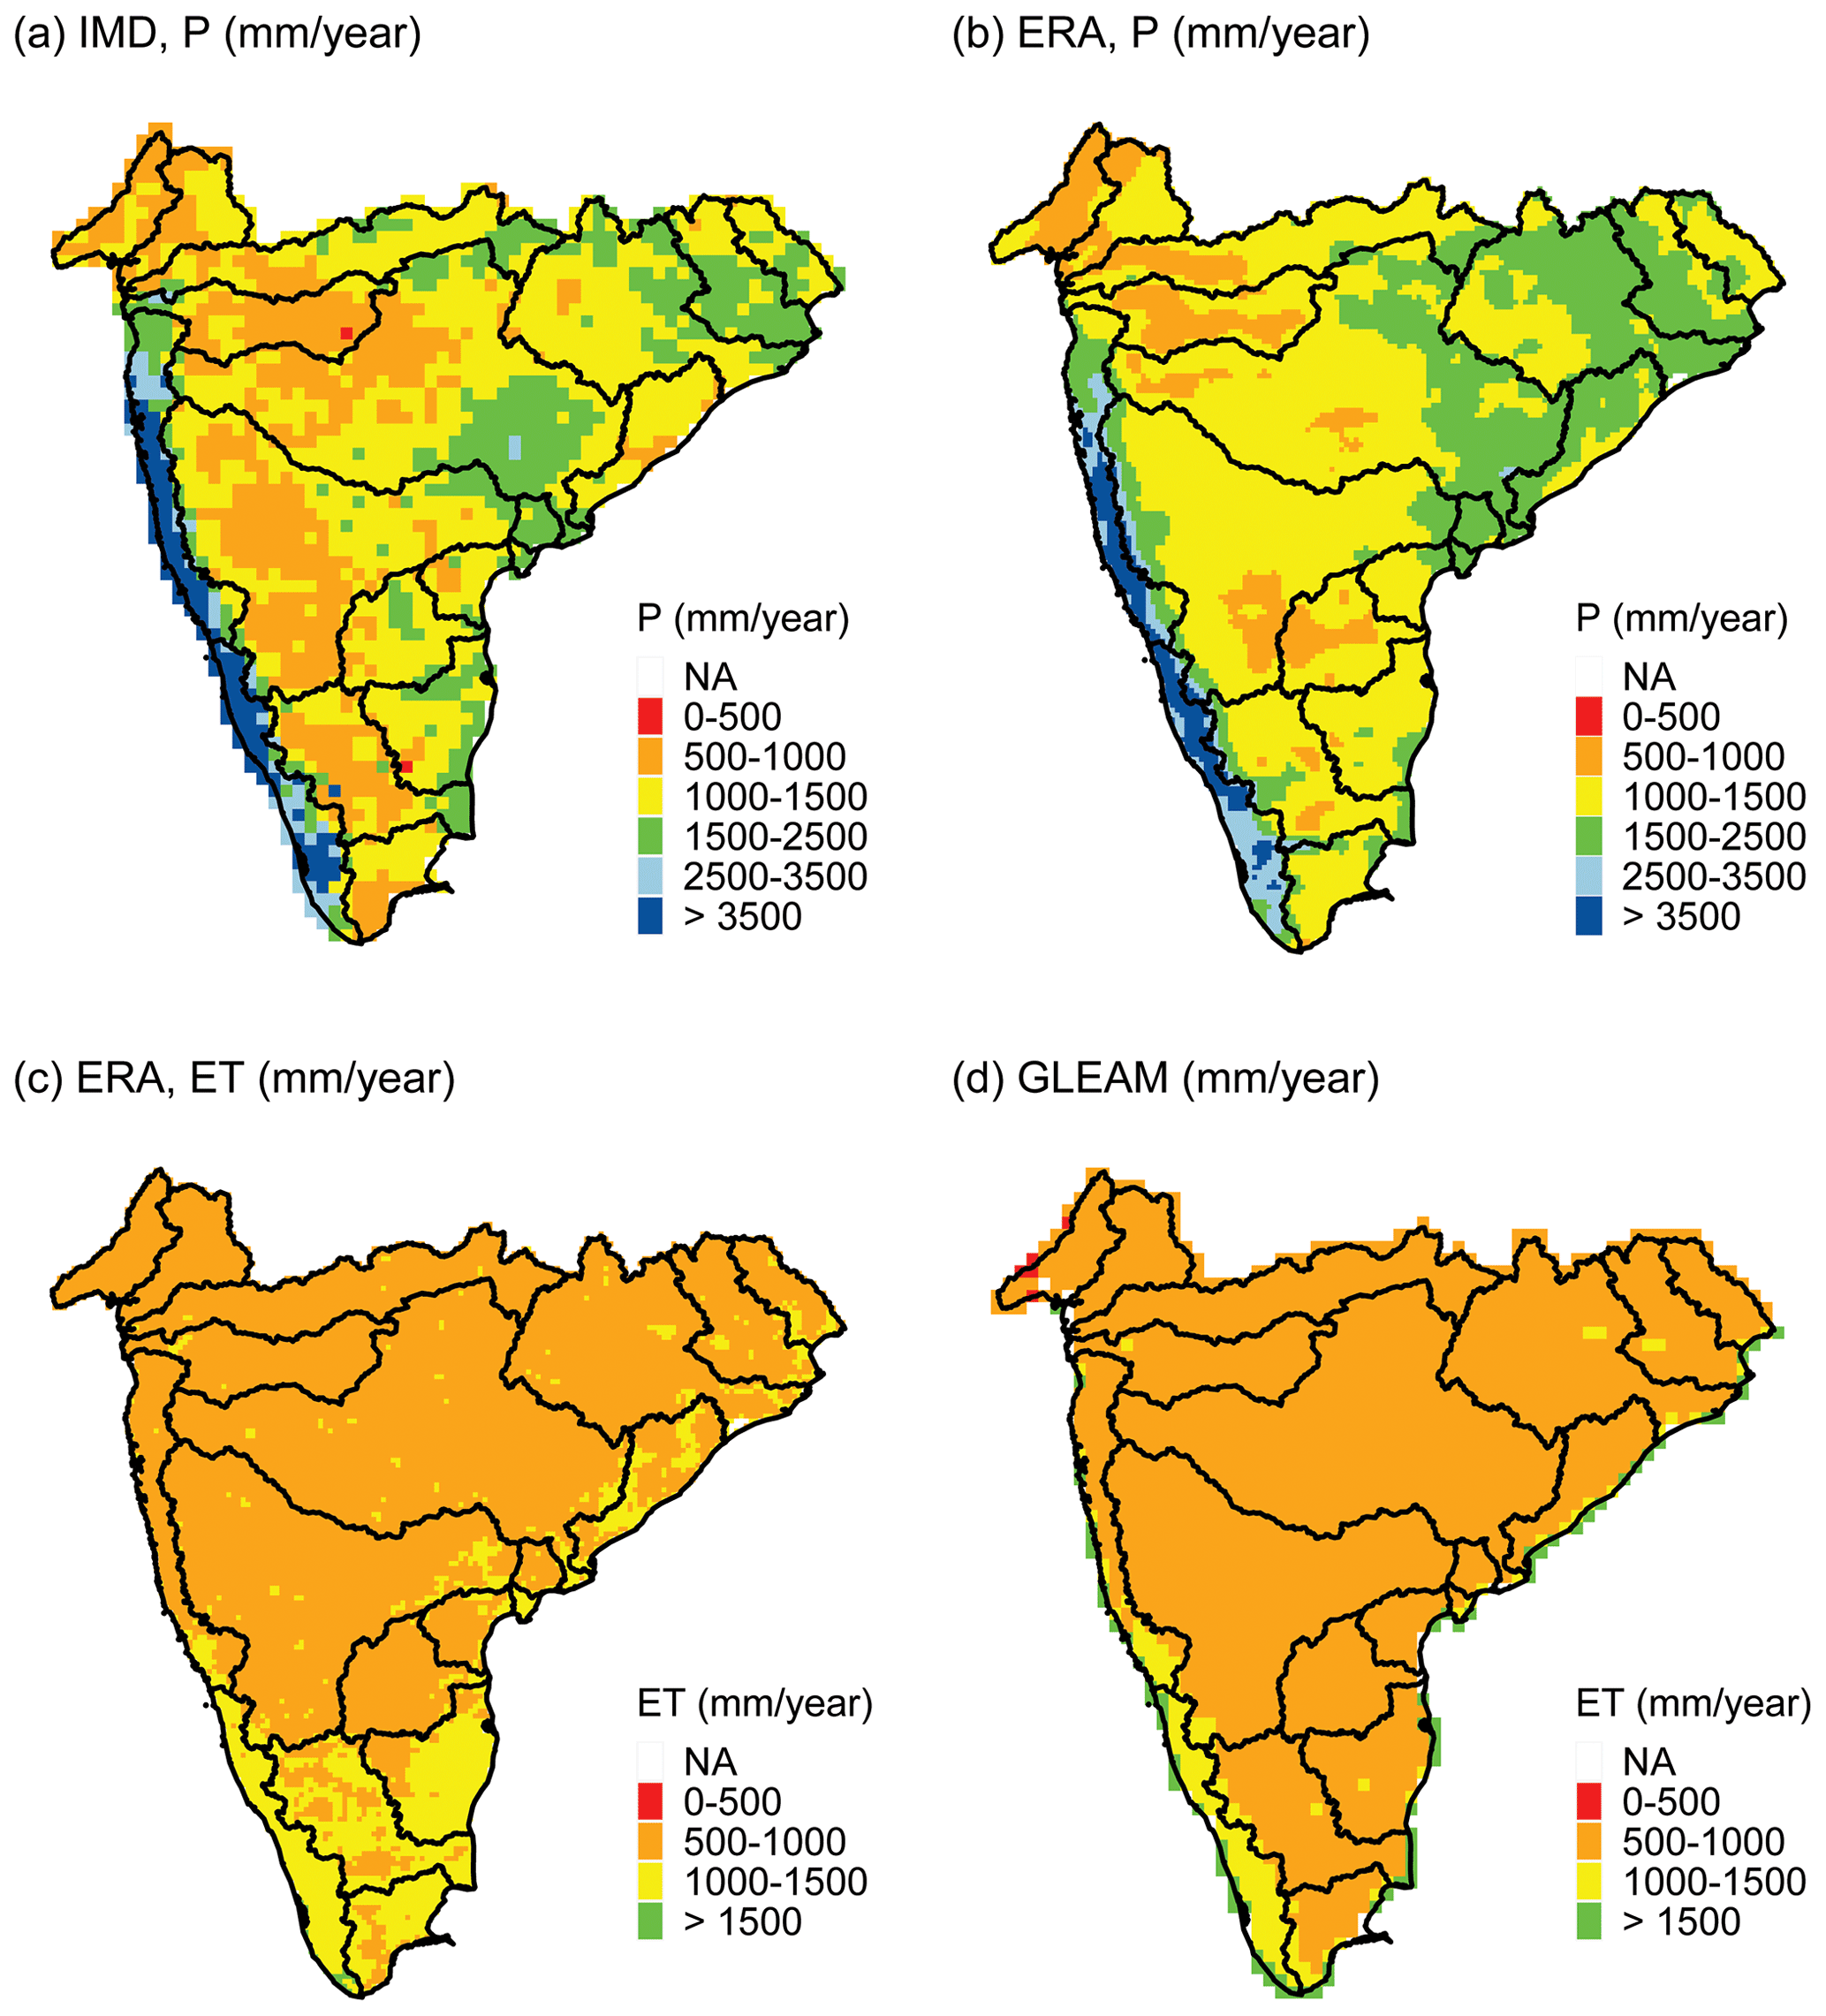
Figure A4Total annual precipitation (mm yr−1) for WY 2020 (June 2020 through May 2021) from (a) IMD and (b) ERA. Total ET (mm yr−1) for WY 2020 from (c) ERA and (d) GLEAM. “NA” in the legend indicates missing or unavailable data. IMD and GLEAM data are shown on the native 0.25∘ grid, whereas ERA data are shown on the native 0.10∘ grid.
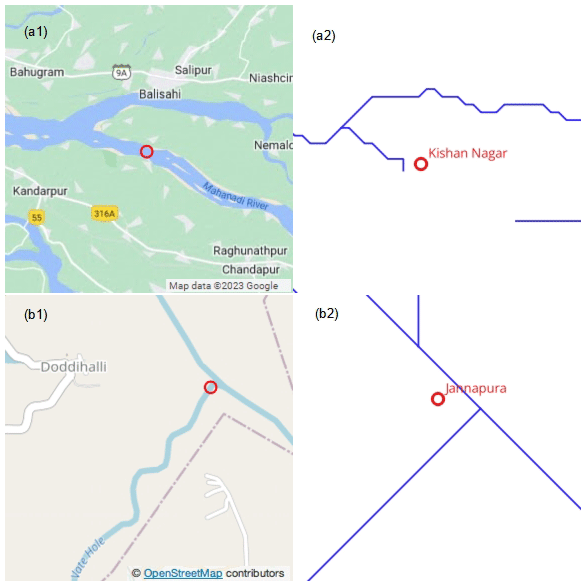
Figure A5(a1) Kishan Nagar station (red circle) is on one of the distributaries within the delta of the Mahanadi River (background from Google Maps). (a2) The HydroSHEDS river network (blue line) cannot capture such complex features. (b1) Jannapura station in the Cauvery Basin (red circle, background from OSM) could not be decisively relocated onto the HydroSHEDS network (blue line in b2) because it was unclear whether the station was intended to be upstream or downstream of the confluence.
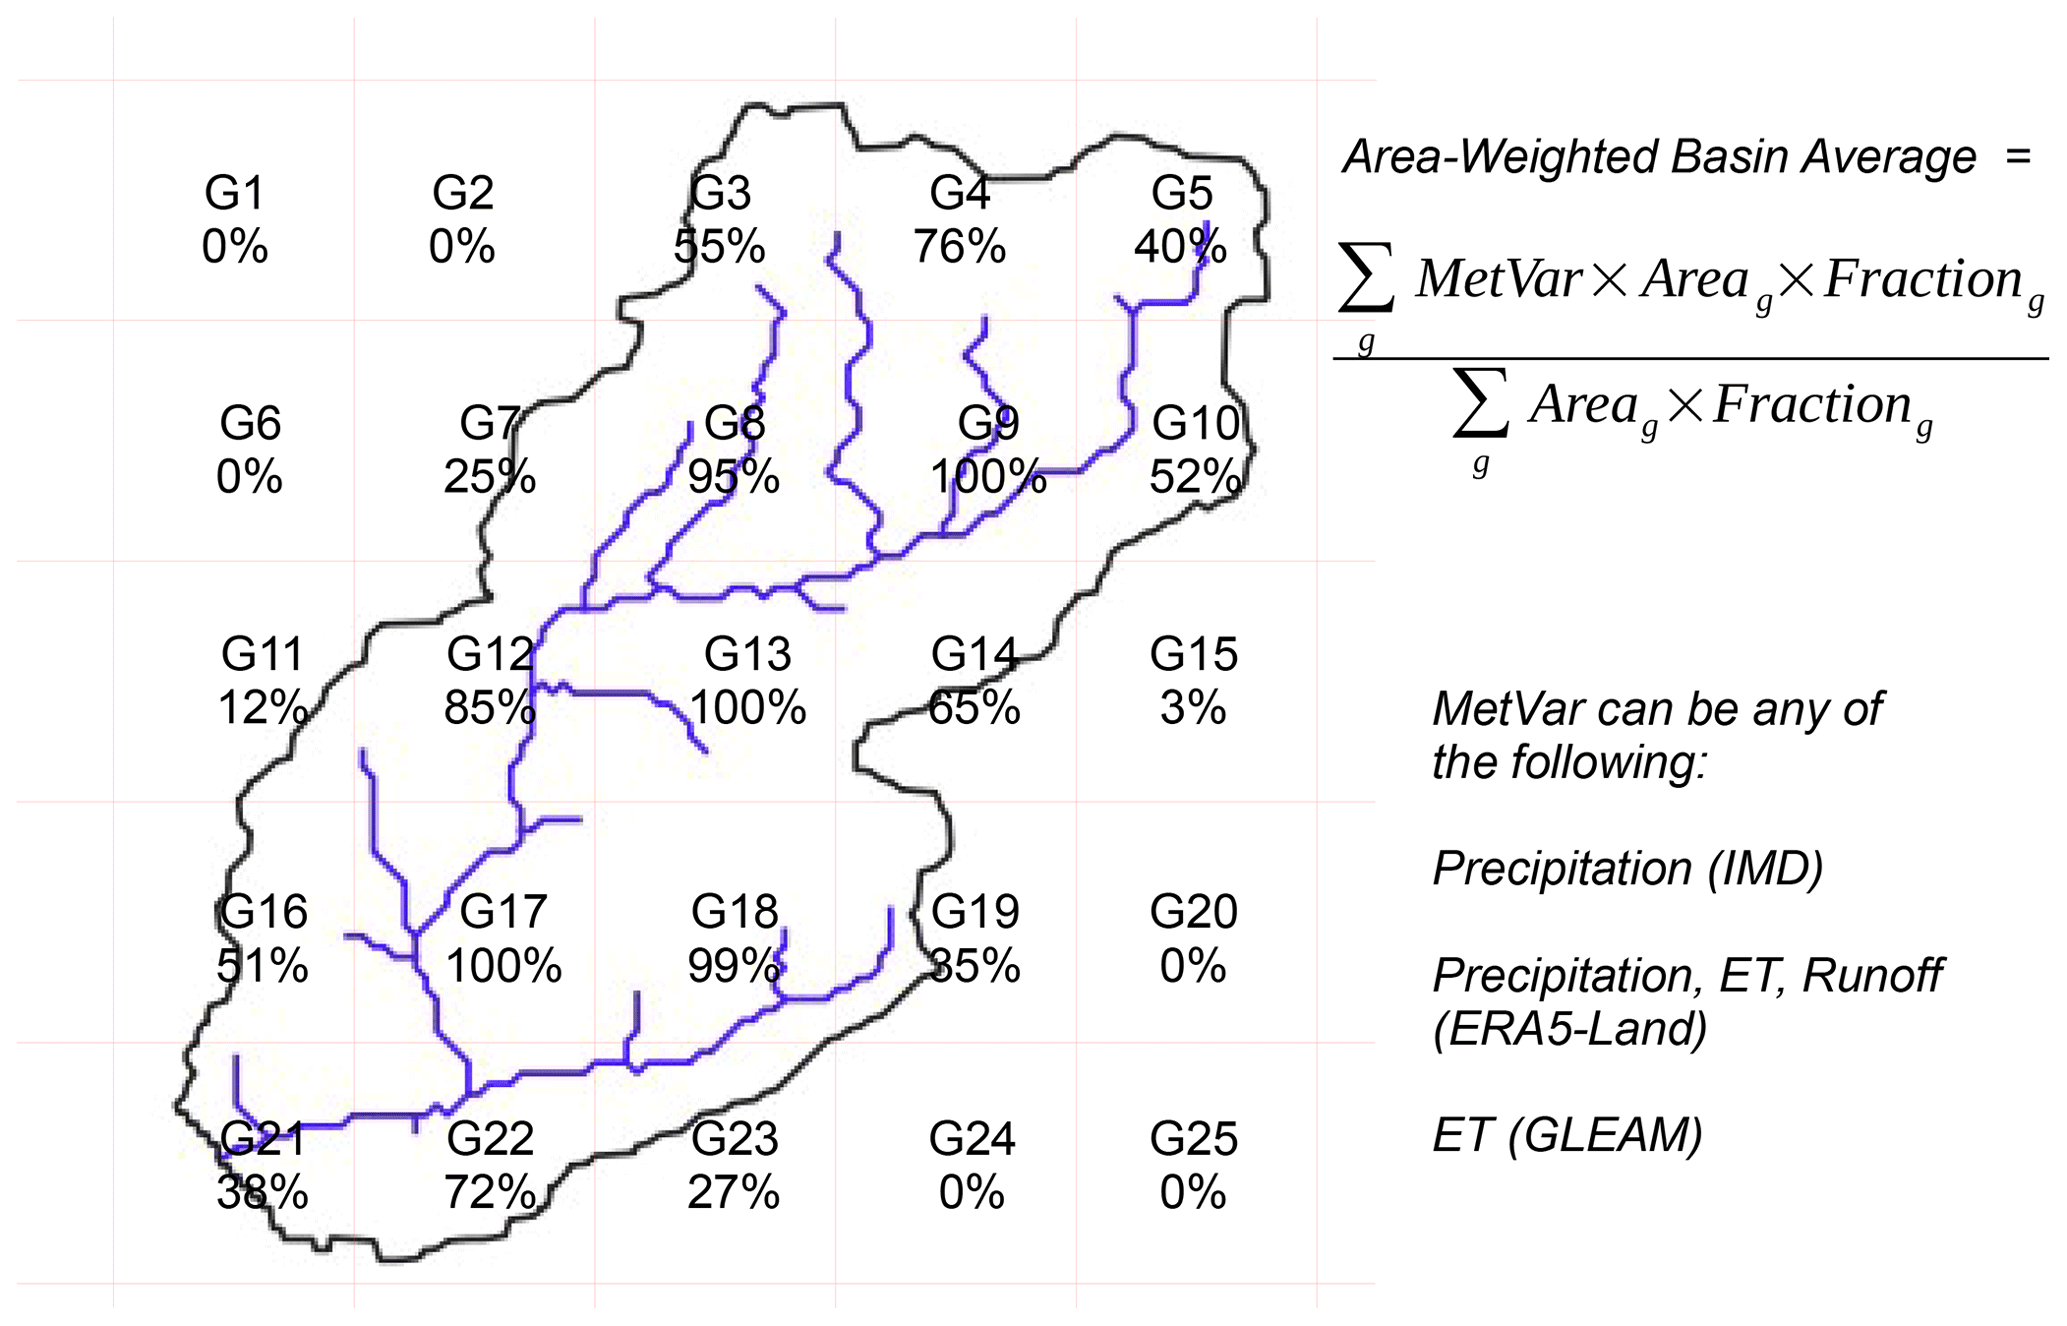
Figure A6Example illustrating the area-weighted averaging procedure used within GHI to obtain basin-aggregated hydrometeorological variables. Gridded products typically have many grids (red lines) spanning a basin (black line): some grids are completely present in the basin (100 % fractional extent), whereas the rest are only partially present (<100 % fractional extent). The grid-wise fractional extent is accounted for when estimating basin-scale average values of hydrometeorological variables.
The author has declared that there are no competing interests.
Publisher's note: Copernicus Publications remains neutral with regard to jurisdictional claims in published maps and institutional affiliations.
A number of publicly available datasets were used in this study and are cited wherever applicable. Software used in this study includes the R statistical computing and graphics software for data analysis (https://www.r-project.org/, last access: 1 June 2021) and QGIS for GIS analysis (https://qgis.org/en/site/, last access: 1 January 2022). Political boundaries for India were obtained from the Survey of India (https://surveyofindia.gov.in/pages/outline-maps-of-india, last access: 1 June 2021) and used for illustration only.
This paper was edited by Yuanzhi Yao and reviewed by two anonymous referees.
Chatterjee, R. and Sinha, S.: Water Resources Database–Development and Management, Proc. Indian Natn. Sci. Acad., 80, 713–730, 2014. a
CWC-19: Reassessment of Water Availability in India using Space Inputs, Central Water Commission, Basin Planning and Management Organisation, http://www.cwc.gov.in/water-resource-estimation (last access: 1 June 2021), 2019. a, b, c, d
CWC-21: Hydrological Observation Stations in India under Central Water Commission, September 2021, http://cwc.gov.in/hydrological-observation-stations-india-under-central-water-commission-september-2021 (last access: 1 September 2022), 2021. a
CWC-YB: Hydrological Year Books, http://www.cwc.gov.in/publications (last access: 1 December 2022), 2021. a
Do, H. X., Gudmundsson, L., Leonard, M., and Westra, S.: The Global Streamflow Indices and Metadata Archive (GSIM) – Part 1: The production of a daily streamflow archive and metadata, Earth Syst. Sci. Data, 10, 765–785, https://doi.org/10.5194/essd-10-765-2018, 2018. a, b
Fritsch, F. N. and Carlson, R. E.: Monotone piecewise cubic interpolation, SIAM J. Numer. Anal., 17, 238–246, https://doi.org/10.1137/0717021, 1980. a
Funk, C. C., Peterson, P. J., Landsfeld, M. F., Pedreros, D. H., Verdin, J. P., Rowland, J. D., Romero, B. E., Husak, G. J., Michaelsen, J. C., and Verdin, A. P.: A quasi-global precipitation time series for drought monitoring, US Geological Survey data series, 832, 1–12, https://doi.org/10.3133/ds832, 2014. a
Ganguli, P., Singh, B., Reddy, N. N., Raut, A., Mishra, D., and Das, B. S.: Climate-catchment-soil control on hydrological droughts in peninsular India, Sci. Rep., 12, 1–14, https://doi.org/10.1038/s41598-022-11293-7, 2022. a
Goteti, G.: Estimation of water resources availability (WRA) using gridded evapotranspiration data: A simpler alternative to Central Water Commission’s WRA assessment, J. Earth Syst. Sci., 131, 1–24, 2022. a, b, c, d, e
Goteti, G.: Geospatial dataset for Hydrologic analyses in India (GHI): A quality controlled dataset on river gauges, catchment boundaries and hydrometeorological time series, Zenodo [data set], https://doi.org/10.5281/zenodo.7563599, 2023. a, b, c
Gudmundsson, L., Do, H. X., Leonard, M., and Westra, S.: The Global Streamflow Indices and Metadata Archive (GSIM) – Part 2: Quality control, time-series indices and homogeneity assessment, Earth Syst. Sci. Data, 10, 787–804, https://doi.org/10.5194/essd-10-787-2018, 2018. a, b
Hunt, K. M. and Menon, A.: The 2018 Kerala floods: a climate change perspective, Clim. Dynam., 54, 2433–2446, https://doi.org/10.1007/s00382-020-05123-7, 2020. a
Krishnan, R., Sanjay, J., Gnanaseelan, C., Mujumdar, M., Kulkarni, A., and Chakraborty, S.: Assessment of climate change over the Indian region: a report of the ministry of earth sciences (MOES), government of India, Springer Nature, https://library.oapen.org/handle/20.500.12657/39973 (last access: 1 September 2021), 2020. a
Lehner, B. and Grill, G.: Global river hydrography and network routing: baseline data and new approaches to study the world's large river systems, Hydrol. Process., 27, 2171–2186, 2013. a
Lehner, B., Verdin, K., and Jarvis, A.: New global hydrography derived from spaceborne elevation data, Eos, Transactions American Geophysical Union, 89, 93–94, https://doi.org/10.1029/2008EO100001, 2008. a
Lin, P., Pan, M., Wood, E. F., Yamazaki, D., and Allen, G. H.: A new vector-based global river network dataset accounting for variable drainage density, Sci. Data, 8, 1–9, https://doi.org/10.1038/s41597-021-00819-9, 2021. a, b, c, d
Madhusoodhanan, C., Sreeja, K., and Eldho, T.: Assessment of uncertainties in global land cover products for hydro-climate modeling in India, Water Resour. Res., 53, 1713–1734, https://doi.org/10.1002/2016WR020193, 2017. a
Mahto, S. S. and Mishra, V.: Does ERA-5 outperform other reanalysis products for hydrologic applications in India?, J. Geophys. Res.-Atmos., 124, 9423–9441, https://doi.org/10.1029/2019JD031155, 2019. a, b
Martens, B., Miralles, D. G., Lievens, H., van der Schalie, R., de Jeu, R. A. M., Fernández-Prieto, D., Beck, H. E., Dorigo, W. A., and Verhoest, N. E. C.: GLEAM v3: satellite-based land evaporation and root-zone soil moisture, Geosci. Model Dev., 10, 1903–1925, https://doi.org/10.5194/gmd-10-1903-2017, 2017. a
Miralles, D. G., Holmes, T. R. H., De Jeu, R. A. M., Gash, J. H., Meesters, A. G. C. A., and Dolman, A. J.: Global land-surface evaporation estimated from satellite-based observations, Hydrol. Earth Syst. Sci., 15, 453–469, https://doi.org/10.5194/hess-15-453-2011, 2011. a
Muñoz-Sabater, J., Dutra, E., Agustí-Panareda, A., Albergel, C., Arduini, G., Balsamo, G., Boussetta, S., Choulga, M., Harrigan, S., Hersbach, H., Martens, B., Miralles, D. G., Piles, M., Rodríguez-Fernández, N. J., Zsoter, E., Buontempo, C., and Thépaut, J.-N.: ERA5-Land: a state-of-the-art global reanalysis dataset for land applications, Earth Syst. Sci. Data, 13, 4349–4383, https://doi.org/10.5194/essd-13-4349-2021, 2021. a, b
NRSC: National Land Use and Land Cover Mapping Using Multi-Temporal AWiFS data, Second Cycle Report, 2005-06, Bhuvan thematic services, https://bhuvan-app1.nrsc.gov.in/2dresources/bhuvanstore.php (last access: 1 June 2021), 2007. a
Pai, D., Sridhar, L., Rajeevan, M., Sreejith, O., Satbhai, N., and Mukhopadhyay, B.: Development of a new high spatial resolution (0.25×0.25) long period (1901–2010) daily gridded rainfall data set over India and its comparison with existing data sets over the region, Mausam, 65, 1–18, 2014. a
Rana, S., McGregor, J., and Renwick, J.: Precipitation seasonality over the Indian subcontinent: An evaluation of gauge, reanalyses, and satellite retrievals, J. Hydrometeorol., 16, 631–651, https://doi.org/10.1175/JHM-D-14-0106.1, 2015. a, b
Rani, S. I., Arulalan, T., George, J. P., Rajagopal, E., Renshaw, R., Maycock, A., Barker, D. M., and Rajeevan, M.: IMDAA: High-Resolution Satellite-Era Reanalysis for the Indian Monsoon Region, J. Climate, 34, 5109–5133, https://doi.org/10.1175/JCLI-D-20-0412.1, 2021. a, b
Shah, H. L. and Mishra, V.: Hydrologic changes in Indian subcontinental river basins (1901–2012), J. Hydrometeorol., 17, 2667–2687, https://doi.org/10.1175/JHM-D-15-0231.1, 2016. a, b
Thakur, M. K., Kumar, T., Koteswara Rao, K., Barbosa, H., and Rao, V. B.: A new perspective in understanding rainfall from satellites over a complex topographic region of India, Sci. Rep., 9, 1–10, https://doi.org/10.1038/s41598-019-52075-y, 2019. a, b
Verdin, K. L.: Hydrologic Derivatives for Modeling and Analysis – A new global high-resolution database, Tech. rep., US Geological Survey, https://doi.org/10.3133/ds1053, 2017. a
Vorosmarty, C., Fekete, B., and Tucker, B.: Global River Discharge, 1807–1991, Version 1.1 (RivDIS), ORNL DAAC, Oak Ridge, Tennessee, USA, https://doi.org/10.3334/ORNLDAAC/199, 1998. a
WRIS-BR: River Basin Reports, https://indiawris.gov.in/wris/#/Basin (last access: 1 September 2021), 2014. a
WRIS-GIS: GIS data on major river basin boundaries of India, data obtained via email request, 14 December 2021, National Water Informatics Centre, https://indiawris.gov.in/wris/ (last access: 14 December 2021), 2021. a
WRIS-OL: India Water Resources Information System, https://indiawris.gov.in/wris/ (last access: 21 August 2022), 2022. a, b
Yamazaki, D., Ikeshima, D., Sosa, J., Bates, P. D., Allen, G. H., and Pavelsky, T. M.: MERIT Hydro: A high-resolution global hydrography map based on latest topography dataset, Water Resour. Res., 55, 5053–5073, https://doi.org/10.1029/2019WR024873, 2019. a
Yan, D., Wang, K., Qin, T., Weng, B., Wang, H., Bi, W., Li, X., Li, M., Lv, Z., Liu, F., He, S., Ma, J., Shen, Z., Wang, J., Bai, H., Man, Z., Sun, C., Liu, M., Shi, X., Jing, L., Sun, R., Cao, S., Hao, C., Wang, L., Pei, M., Dorjsuren, B., Gedefaw, M., Girma, A., and Abiyu, A.: A data set of global river networks and corresponding water resources zones divisions, Sci. Data, 6, 1–11, https://doi.org/10.1038/s41597-019-0243-y, 2019. a