the Creative Commons Attribution 4.0 License.
the Creative Commons Attribution 4.0 License.
 | 25 Sep 2023
IWIN: the Isfjorden Weather Information Network
Marius Opsanger Jonassen
Teresa Remes
Florina Roana Schalamon
Agnes Stenlund
In an effort led by the University Centre in Svalbard (UNIS), with support from the Norwegian Meteorological Institute (MET Norway), the Isfjorden Weather Information Network (IWIN) is under development in the Isfjorden region in central Svalbard. The network substantially expands upon the relatively sparse existing operational network of weather stations and consists of compact and cost-efficient all-in-one weather stations permanently installed at lighthouses around Isfjorden and on board small tourist cruise ships trafficking the fjord from spring to autumn. All data from the network until June 2023, as presented in this paper, can be found at https://doi.org/10.5281/zenodo.8137588 (Frank et al., 2023b). New data become freely available in near-real time via MET Norway's data portals (https://doi.org/10.21343/ebrw-w846, Frank et al., 2023a). The IWIN data are highly valuable for scientific purposes such as atmospheric boundary layer research, the validation and development of numerical weather prediction models, and assimilation in these, as well as the planning and safe conduction of outdoor activities in the region.
- Article
(10902 KB) - Full-text XML
- BibTeX
- EndNote


In this study, we present the Isfjorden Weather Information Network (IWIN), which is a new network of automatic weather stations located in the Isfjorden area in central Svalbard. The network is developed by the University Centre in Svalbard (UNIS) with support from the Norwegian Meteorological Institute (MET Norway).
IWIN consists of compact and relatively cost-efficient all-in-one weather stations measuring near-surface temperature, humidity, wind speed, wind direction and pressure. The stations are robust with no movable parts and are thereby well suited to the harsh arctic climate in Svalbard. The stations are mounted both at fixed points (lighthouses) situated along the shoreline of Isfjorden and on small tourist ships that traffic the fjord from spring to autumn. Hence, the network uses existing infrastructure as instrument platforms, and its (added) environmental footprint is therefore minimal. IWIN is under continuous development, and as of summer 2023, it consists of seven weather stations, four of which are mounted on lighthouses and three of which are mounted on ships (in the following, these are referred to as mobile stations). The data from IWIN are made freely and publicly available in near-real time on MET Norway's Thematic Real-time Environmental Distributed Data Services (THREDDS) server (https://thredds.met.no/thredds/unis-obs/unis-obs.html, last access: 12 September 2023) and via the Arctic Data Centre (ADC, https://doi.org/10.21343/ebrw-w846. Frank et al., 2023a).
The usefulness of the IWIN observations is multifold. From a research perspective, IWIN provides valuable in situ, near-surface weather observations from the Arctic, where such observations are otherwise very sparse. The network supports our need to better document and understand the ongoing strong climate warming in Svalbard (Isaksen et al., 2022), which is well beyond the pan-Arctic warming rate of nearly 4 times the global average (Rantanen et al., 2022). Embedded in the Svalbard climate change are effects such as sea ice retreat (Muckenhuber et al., 2016; Dahlke et al., 2020), extreme precipitation events (Müller et al., 2022) and rain-on-snow events (Peeters et al., 2019; Wickström et al., 2020). Future climate projections indicate further warming and more of these climate-change-related effects in the decades to come (e.g., Hanssen-Bauer et al., 2019). The complex topography of Svalbard exacerbates the need for more observations from the archipelago as the weather typically varies substantially in space due to, among others, flow phenomena such as gap winds (Jackson and Steyn, 1994), channeling effects (e.g., Skeie and Gronas, 2000) and katabatic winds (Esau and Repina, 2012). With its rugged coast line, surrounded by steep mountain ranges and deep valleys, the Isfjorden area is no exception. The atmospheric component (and its related forcing) of the fjord system furthermore acts as a boundary condition for geological, physical and biological interactions in the region (Cottier et al., 2007; Walczowski and Piechura, 2011; Nilsen et al., 2016; Descamps et al., 2017; Skogseth et al., 2020; Schuler et al., 2020).
Numerical models are integral parts of several of the above-cited studies of weather and climate processes in Svalbard. However, such models typically struggle to accurately represent weather and climate processes in the Arctic (Jung et al., 2016). Recent progress has yielded promising results (Bromwich et al., 2016), and MET Norway's operational AROME-Arctic model (covering Svalbard and northern Fennoscandia; Müller et al., 2017) has been shown to perform favorably compared to e.g., the global forecasting model of the European Centre of Medium-Range Weather Forecasting (Køltzow et al., 2019). Further progress in model development, related to the purposes of both validation and assimilation, relies heavily on more observations such as those provided by IWIN. High-resolution observations are especially useful as we progress towards hectometric-scale model simulations, which are currently in testing for Svalbard (Valkonen et al., 2020).
IWIN data are also useful in a societal context, especially because the Isfjorden region is the most populated area in Svalbard. Here, we find the settlements of Longyearbyen, Barentsburg and Pyramiden, and human activity is widespread in the form of, among others, fishery, tourism and research activities. In particular, the latter of the two peak during summertime. Furthermore, emergency situations may occur at any time of the year in the harsh arctic environment of Svalbard, frequently sparking search-and-rescue missions. Online, near-real-time weather observations, like those provided by IWIN, are key to keeping the planning and conduction of such activities as safe as possible.
The primary goal of this paper is to provide documentation on the instrumental setup of IWIN and to describe and evaluate the data it produces. This includes introductions to the observation locations and information on the instrumentation in use (Sect. 2), as well as a description of the data-handling process (Sect. 3). In Sect. 4, we provide an evaluation of the quality of the data set and discuss remaining uncertainties. By presenting two examples of weather phenomena observed through IWIN in Sect. 5, we draw connections between these and the data evaluation, and we highlight the novel capabilities of the network and indicate potential usage for future work. In the end, we summarize the current status of IWIN in Sect. 6 and give an outlook on the further development of the network in Sect. 8.
Comprising a combination of stationary and mobile automatic weather stations, IWIN provides near-surface observations of temperature (T), relative humidity (RH), pressure (p), wind speed (WS) and wind direction (WD) from a large portion of Isfjorden. Thus, IWIN complements the long-term reference surface weather stations operated by MET Norway and located around the fjord at Isfjord Radio (IR), Svalbard Airport (SA), Nedre Sassendalen (NS) and Pyramiden (PYR). As some of the land-based IWIN station locations are inaccessible for large parts of the year, using rugged all-in-one weather stations with no moving parts ensures a low risk of failure and long maintenance intervals. By making use of already existing infrastructure, observations from remote areas are obtained at a low cost, while at the same time, the local, additional environmental impact of these observations can be considered to be negligible. All observations are automatically transferred from the stations to UNIS in regular intervals via the 4G cellular network. In the following, the individual station locations are introduced in more detail.
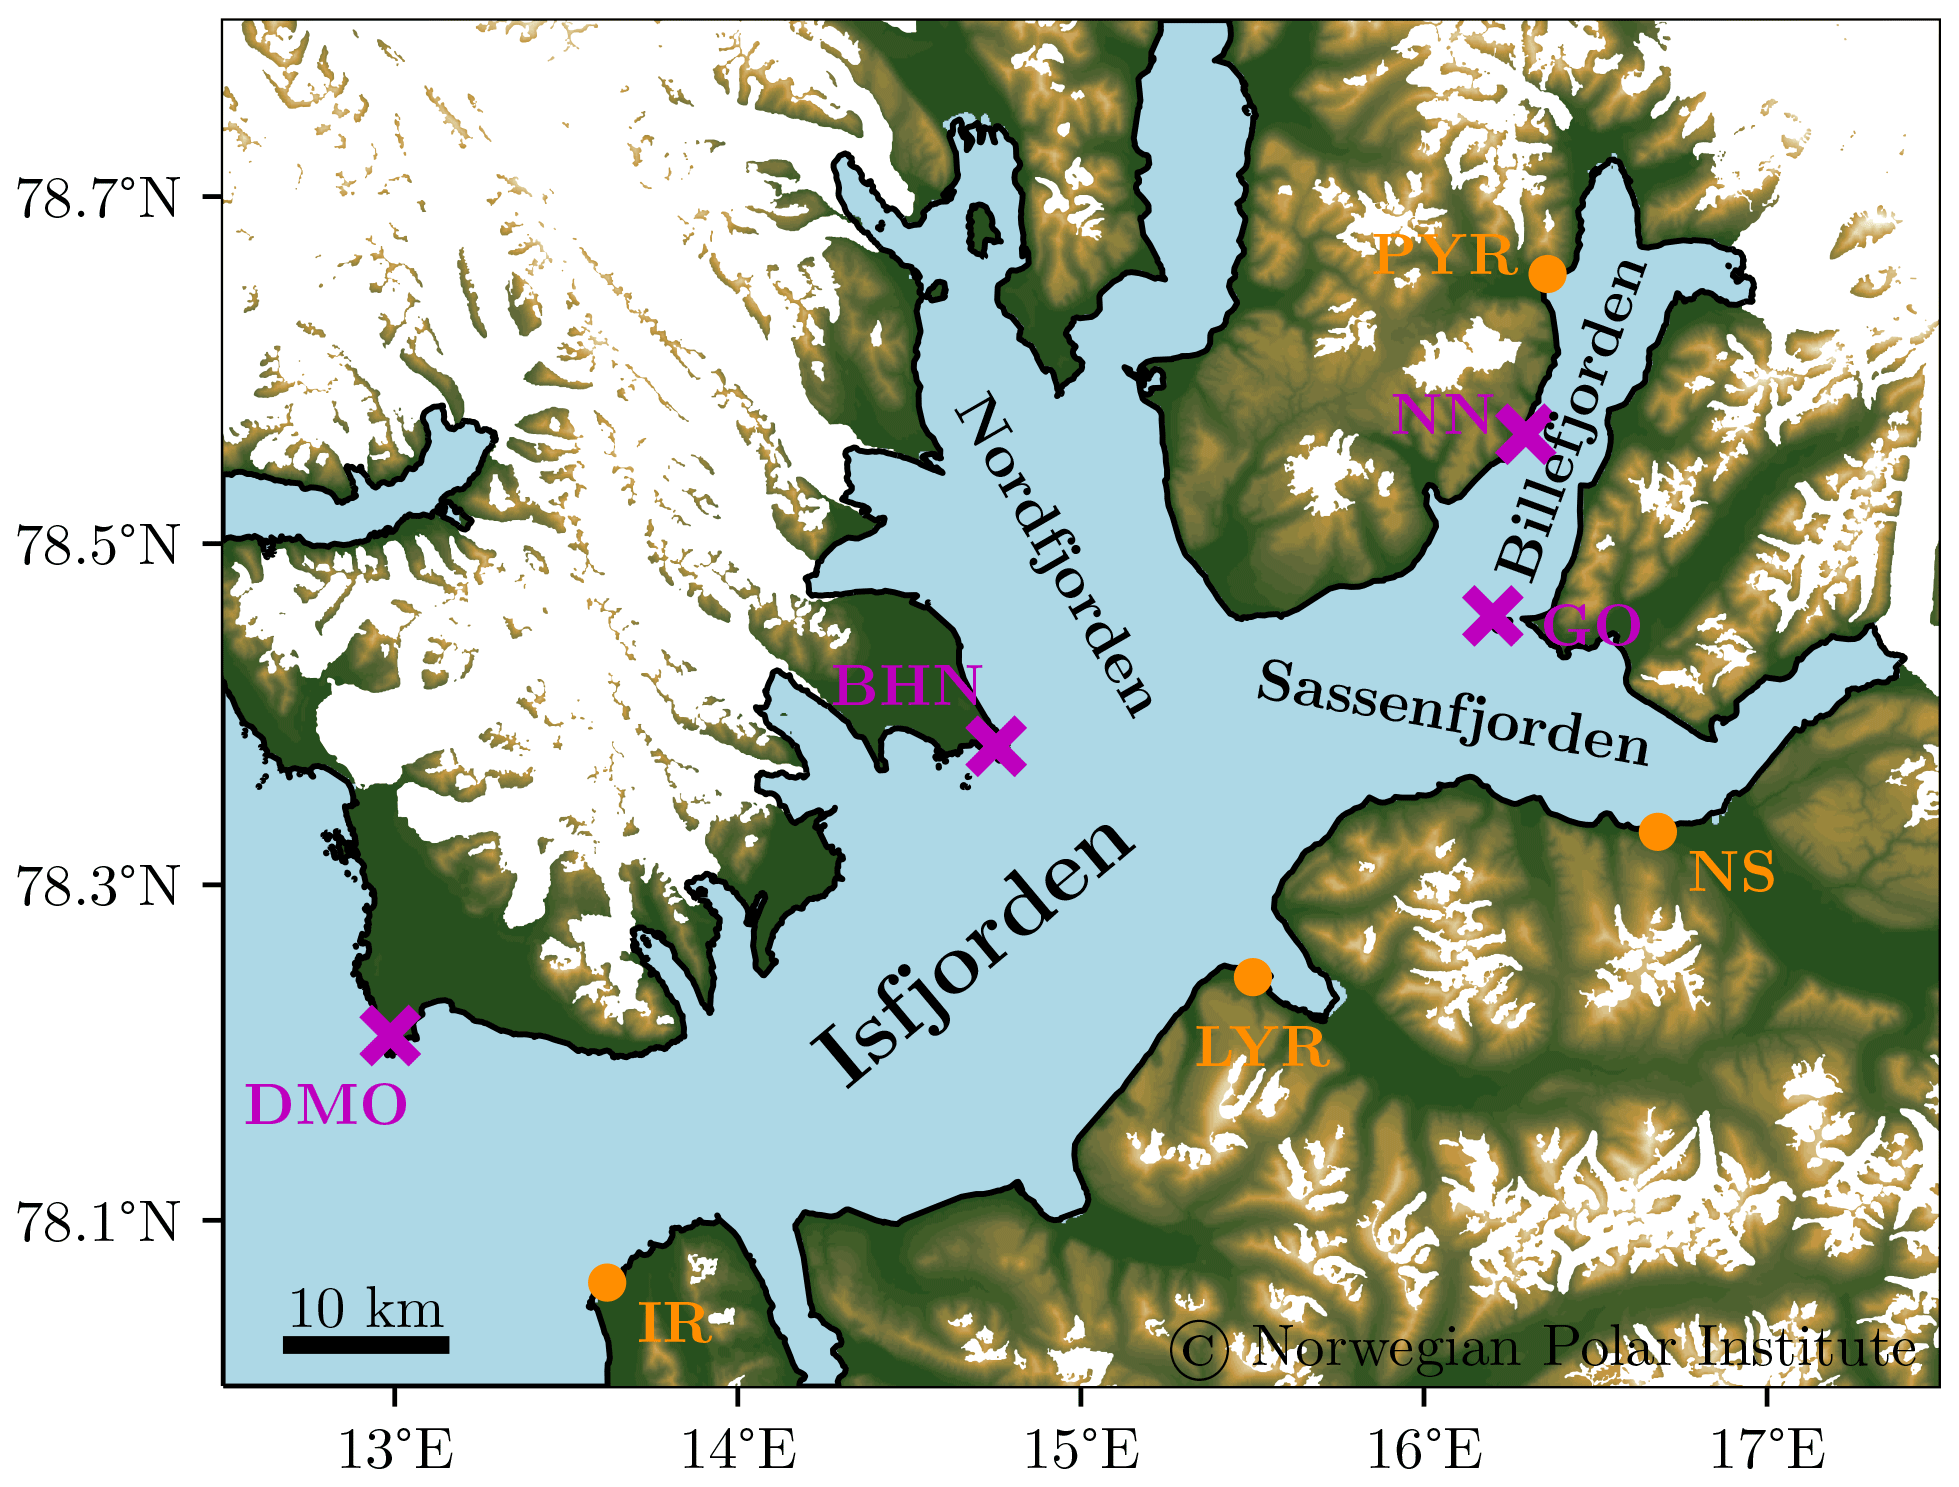
Figure 1Overview map of the Isfjorden area. Local fjord names are given in black, locations of MET Norway weather stations are marked with orange dots, and the IWIN lighthouse stations are marked with magenta crosses. See main text and Table 1 for full station names. This and all following map figures are produced using map data from the Norwegian Polar Institute (https://geodata.npolar.no, last access: 12 September 2023).
2.1 Lighthouse stations
Presently, IWIN comprises four stationary stations around Isfjorden (for the exact geographical locations, see Table 1 and Fig. 1). The stations are installed on top of small coastal lighthouses (see Fig. 2), approximately 3.6 m above ground level. The instruments used are Campbell Scientific MetSENS500 sensors, configured to measure T, RH, p, WS and WD at a raw sampling frequency of 5 s. While T, RH and p are measured by solid-state sensor circuits located inside a radiation shield in the lower part of the instrument, a 2D sonic anemometer on top provides WS and WD.
Table 1Overview of lighthouse stations. The sensors are installed on top of the lighthouses, approximately 3.6 m above ground level.
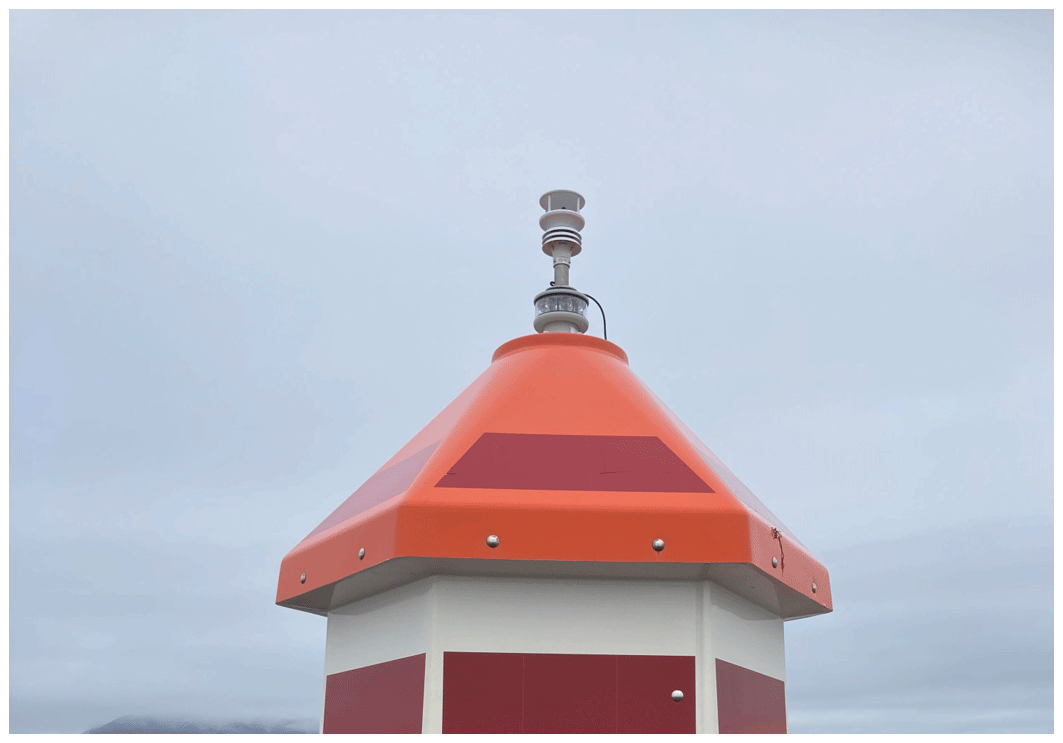
The first lighthouse station was installed at Bohemanneset (BHN) in August 2021. This lighthouse is located at 8 m above sea level on the tip of the flat headland of Bohemanflya. The location sticks out approximately 10 km into central Isfjorden in the southeasterly direction (see Fig. 1) in relation to the nearest major mountains in the northwest. The wind rose from this station (Fig. 3) shows the prevailing wind directions to be aligned with three major (side-)fjord axes. The main sectors NW–N and NE–E resemble outflow from Nordfjorden and Sassenfjorden, respectively. The secondary peak for SW directions matches inflow into Isfjorden along the main fjord axis. The highest wind speeds almost exclusively occur with flow out of Sassenfjorden.
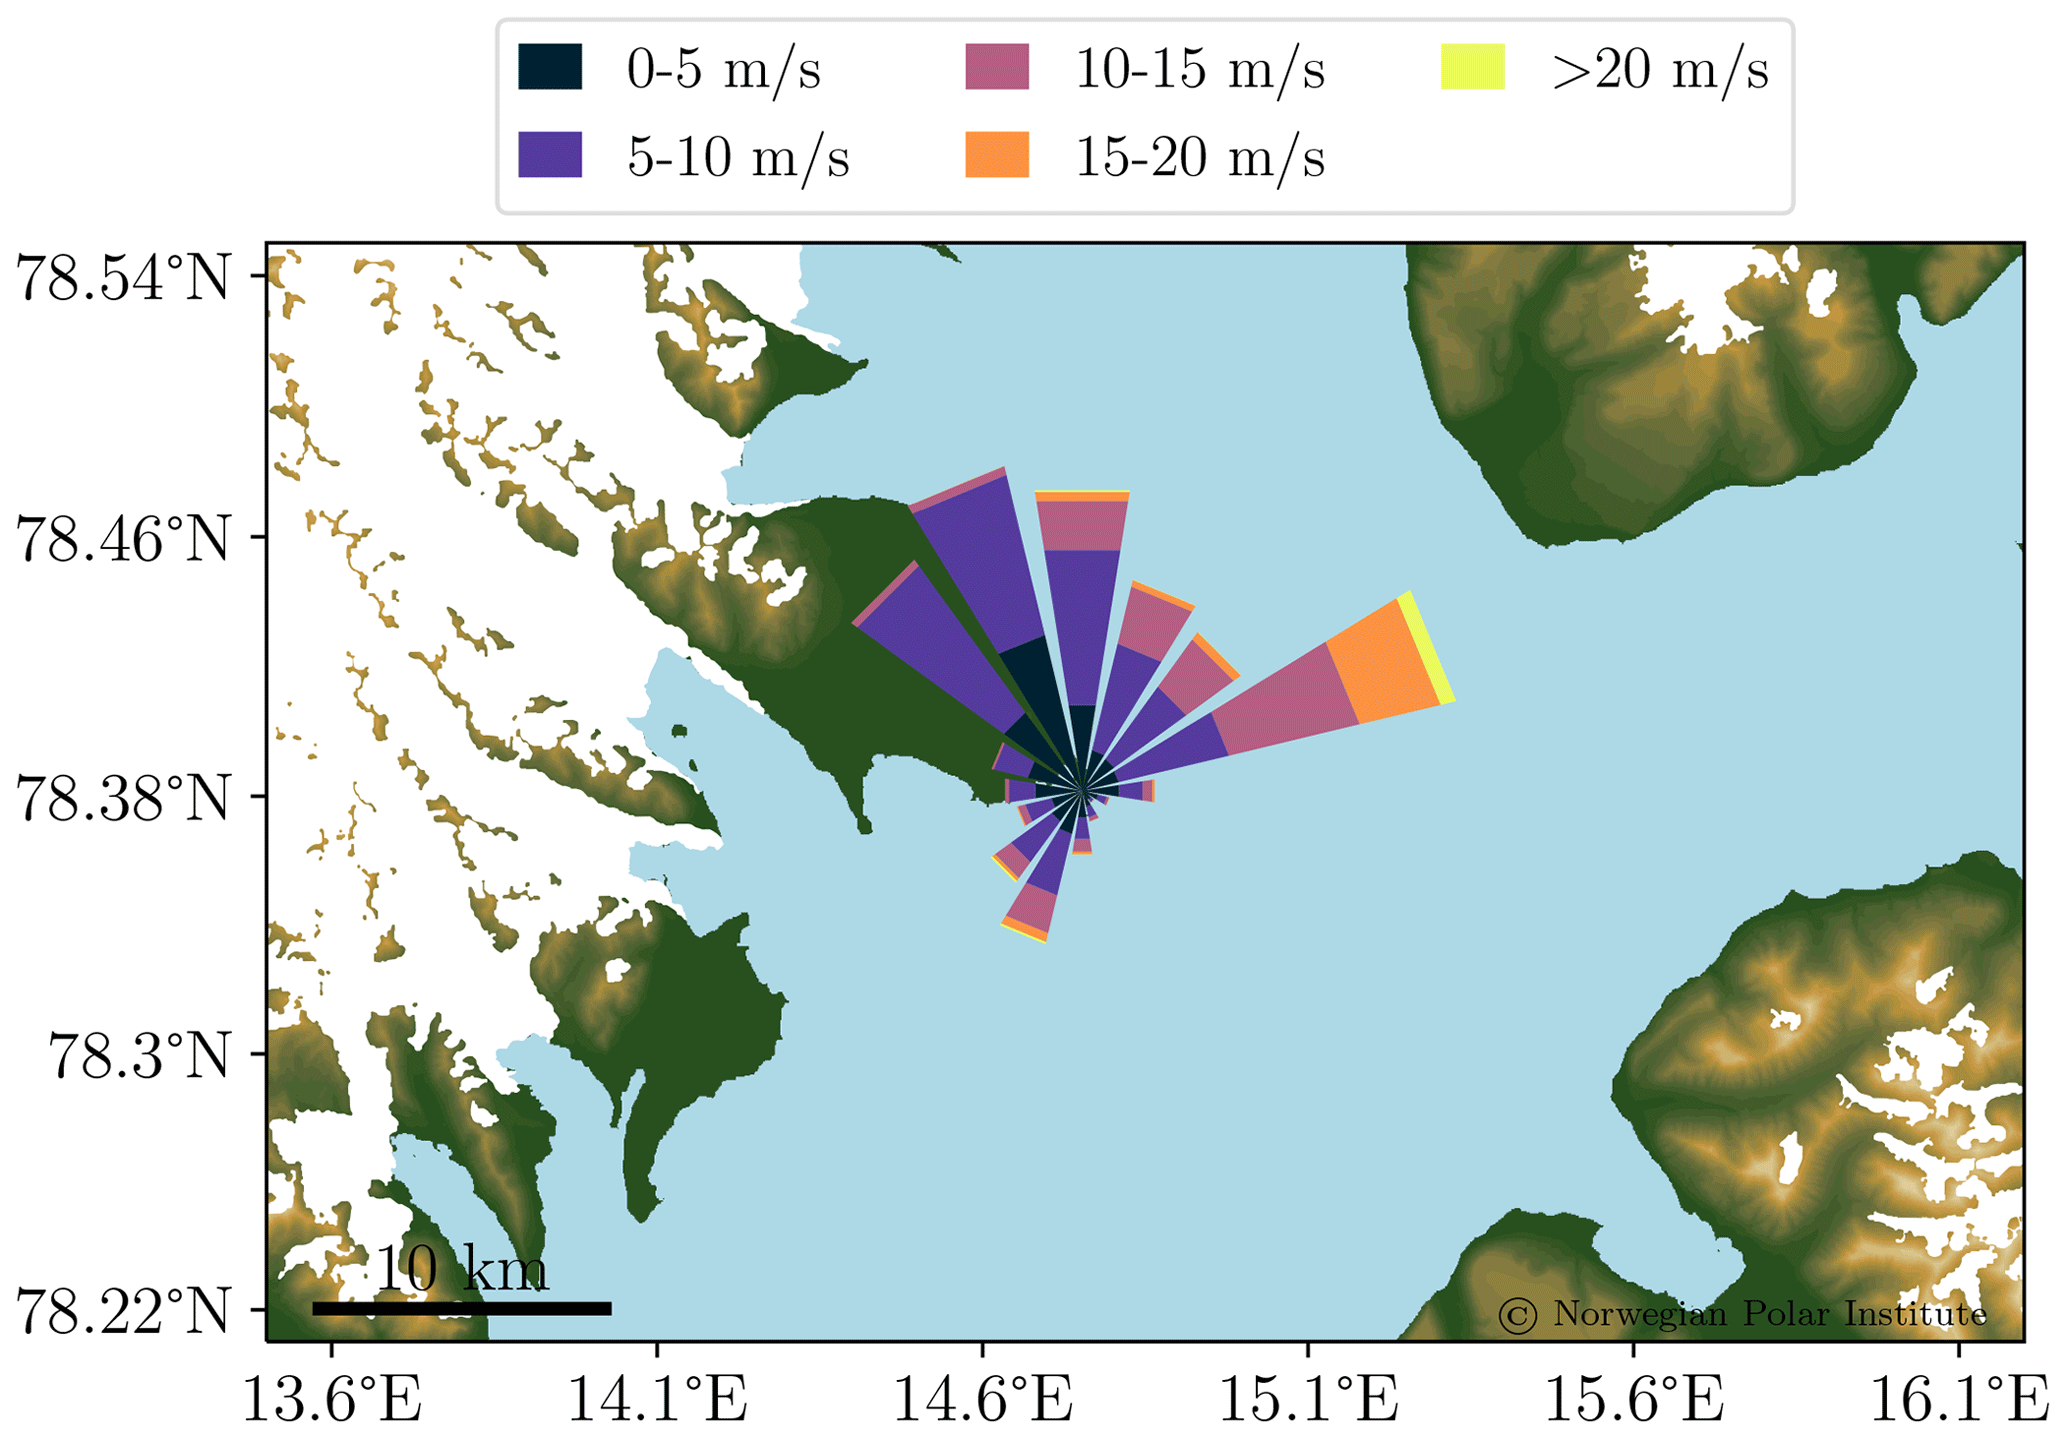
Figure 3Wind climatology at Bohemanneset, including all data available from 19 August 2021 to 22 June 2023.
After the BHN station had operated flawlessly throughout winter 2021–2022, three more lighthouse stations were installed during the summer of 2022. The first of these (installed in mid-June 2022) is located on the western shoreline in central Billefjorden on a small headland called Narveneset (NN, approximately 3 m above sea level; see Fig. 1). Billefjorden is the innermost sidearm of Isfjorden and is surrounded by steep topography. As could be expected, the wind observations from NN show a very dominant alignment with the fjord axis (NE–SW; see Fig. 4).
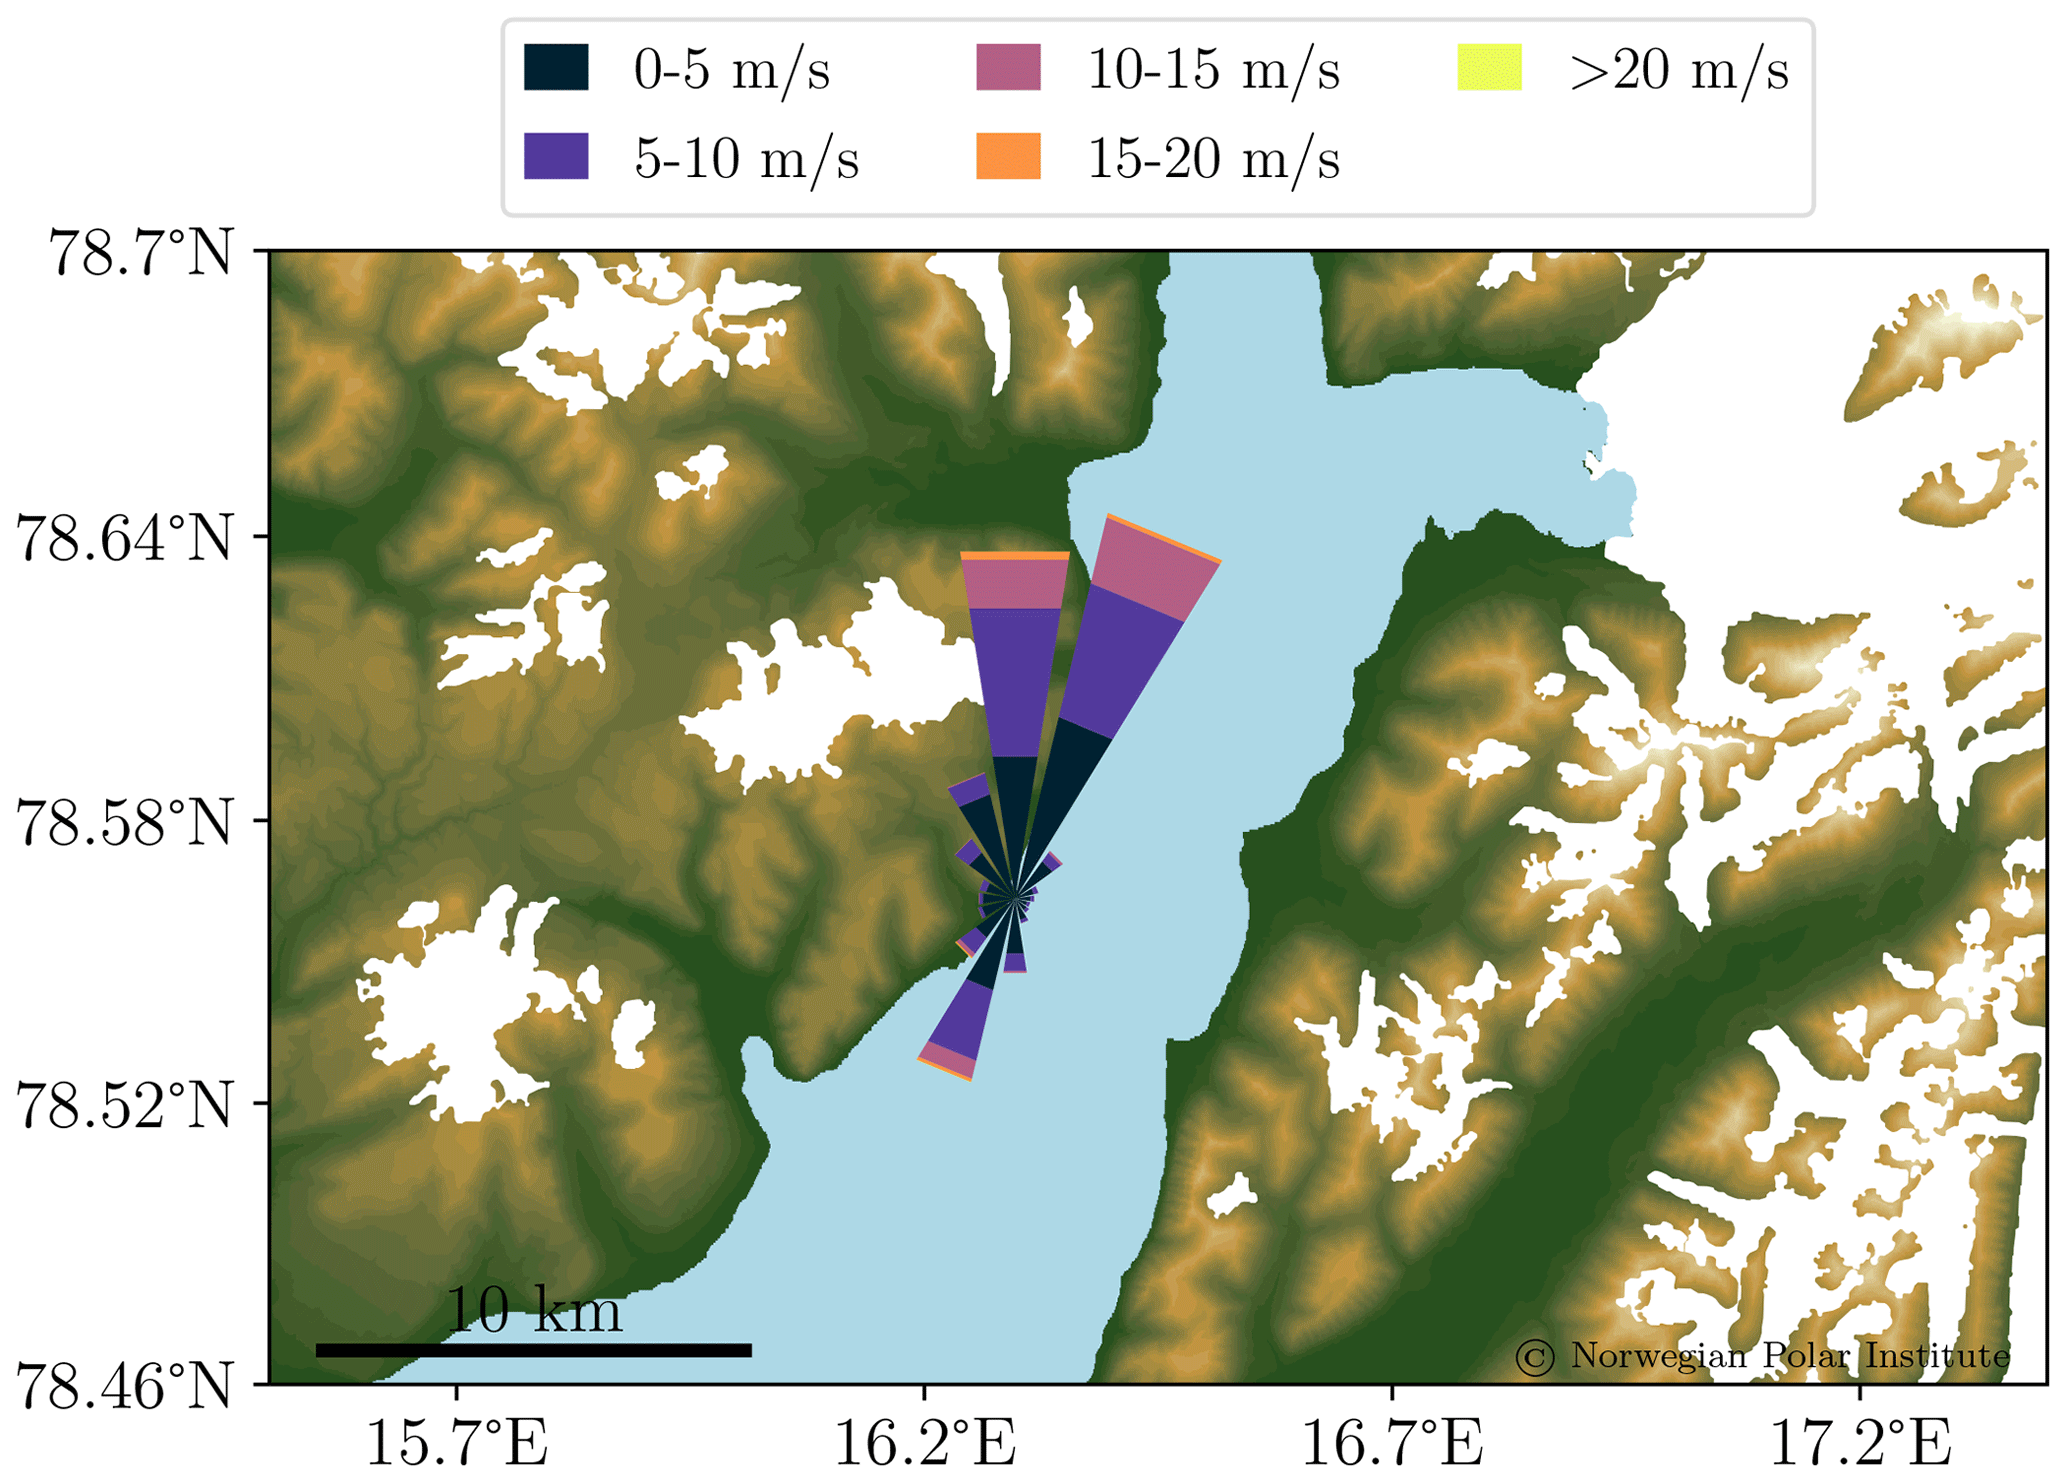
Figure 4Wind climatology at Narveneset, including all data available from 17 June 2022 to 22 June 2023.
The station at Daudmannsodden (DMO, installed in the beginning of July 2022) is situated on the northern shore right outside the mouth of Isfjorden (see Fig. 1). The location is distanced from the nearest coastal mountain ranges by the approximately 8 km wide Daudmannsøyra headland. The lighthouse itself is located on a small hill rising approximately 20 m above the surrounding flatland, resulting in a total station height of 35 m above sea level. The observations from this station exhibit stronger maritime characteristics than those from the other stations (e.g., smaller annual temperature range and, on average, higher specific humidity; see also evaluation results in Sect. 4) due to the influence of the large open water body in Fram Strait and the warm water masses transported northwards by the West Spitsbergen Current. Winds from westerly sectors are fairly equally distributed over all respective directions, presumably due to no guiding topography upstream of the station for those sectors (see wind rose in Fig. 5). The main (easterly) peak in the wind rose is still strongly related to outflow through the mouth of Isfjorden and winds aligned with the valleys in the nearby coastal mountain ranges.
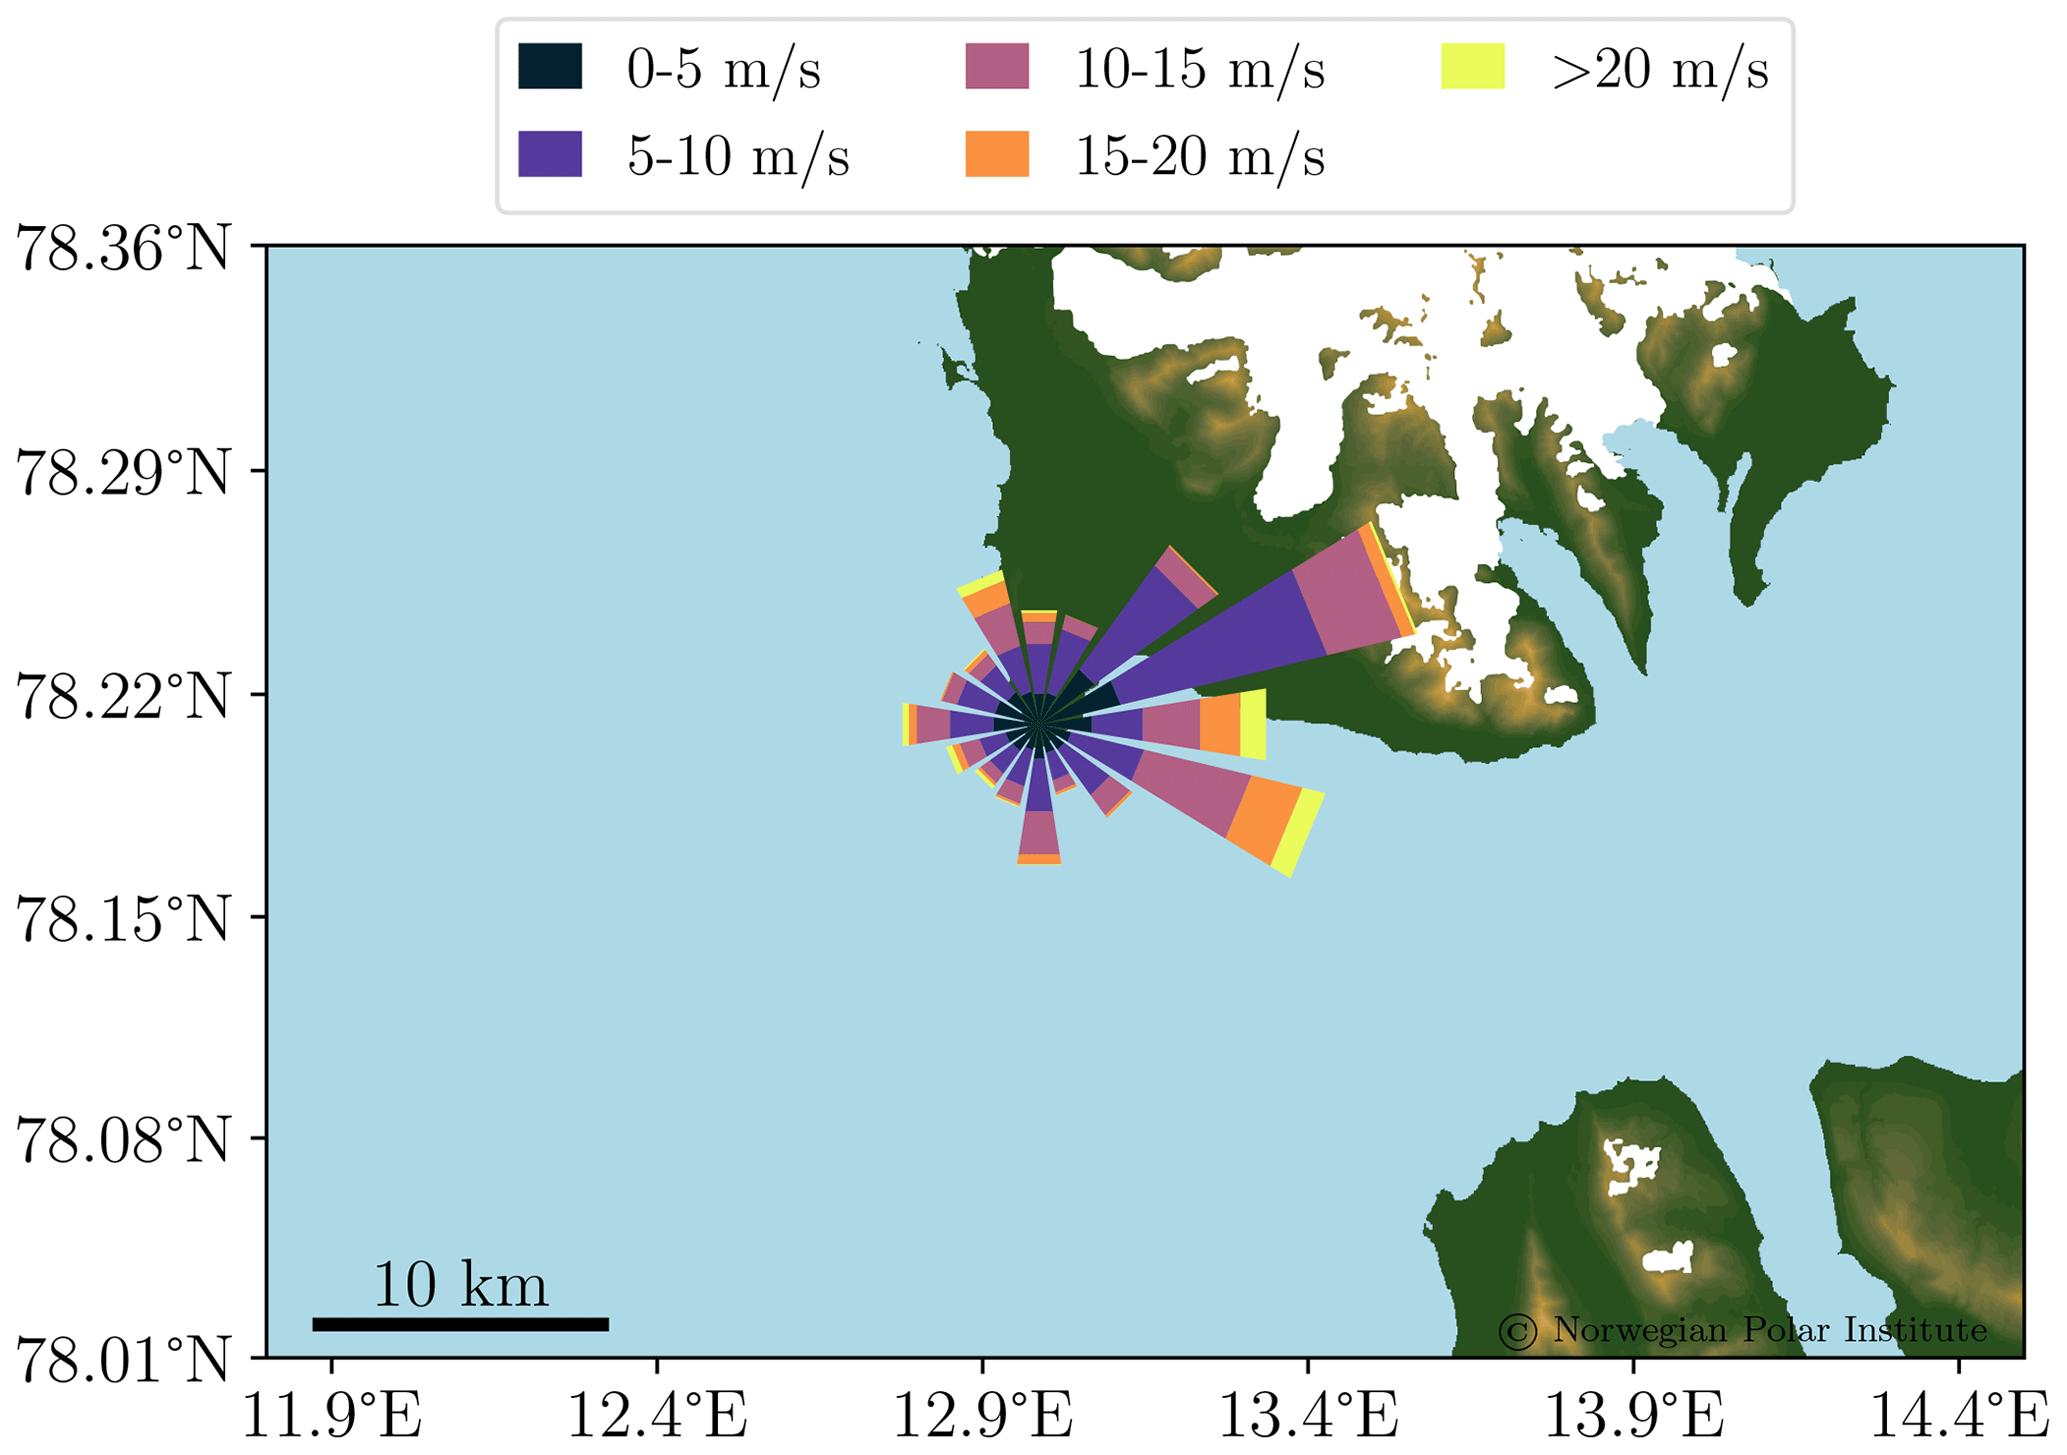
Figure 5Wind climatology at Daudmannsodden, including all data available from 8 July 2022 to 22 June 2023.
The hitherto last IWIN lighthouse station was installed at Gåsøyane (GØ) in the beginning of September 2022. Gåsøyane is a group of small islands at the intersection of Billefjorden and inner Sassenfjorden (see Fig. 1). The lighthouse with the station on top is located on the largest of these small islands, on a small cliff approximately 15 m above sea level. The axes of both Billefjorden and inner Sassenfjorden (NE–SW and SE–NW) are strongly imprinted in the observed wind direction distribution (see wind rose in Fig. 6). Additionally, a secondary peak resembles inflow into outer Sassenfjorden.
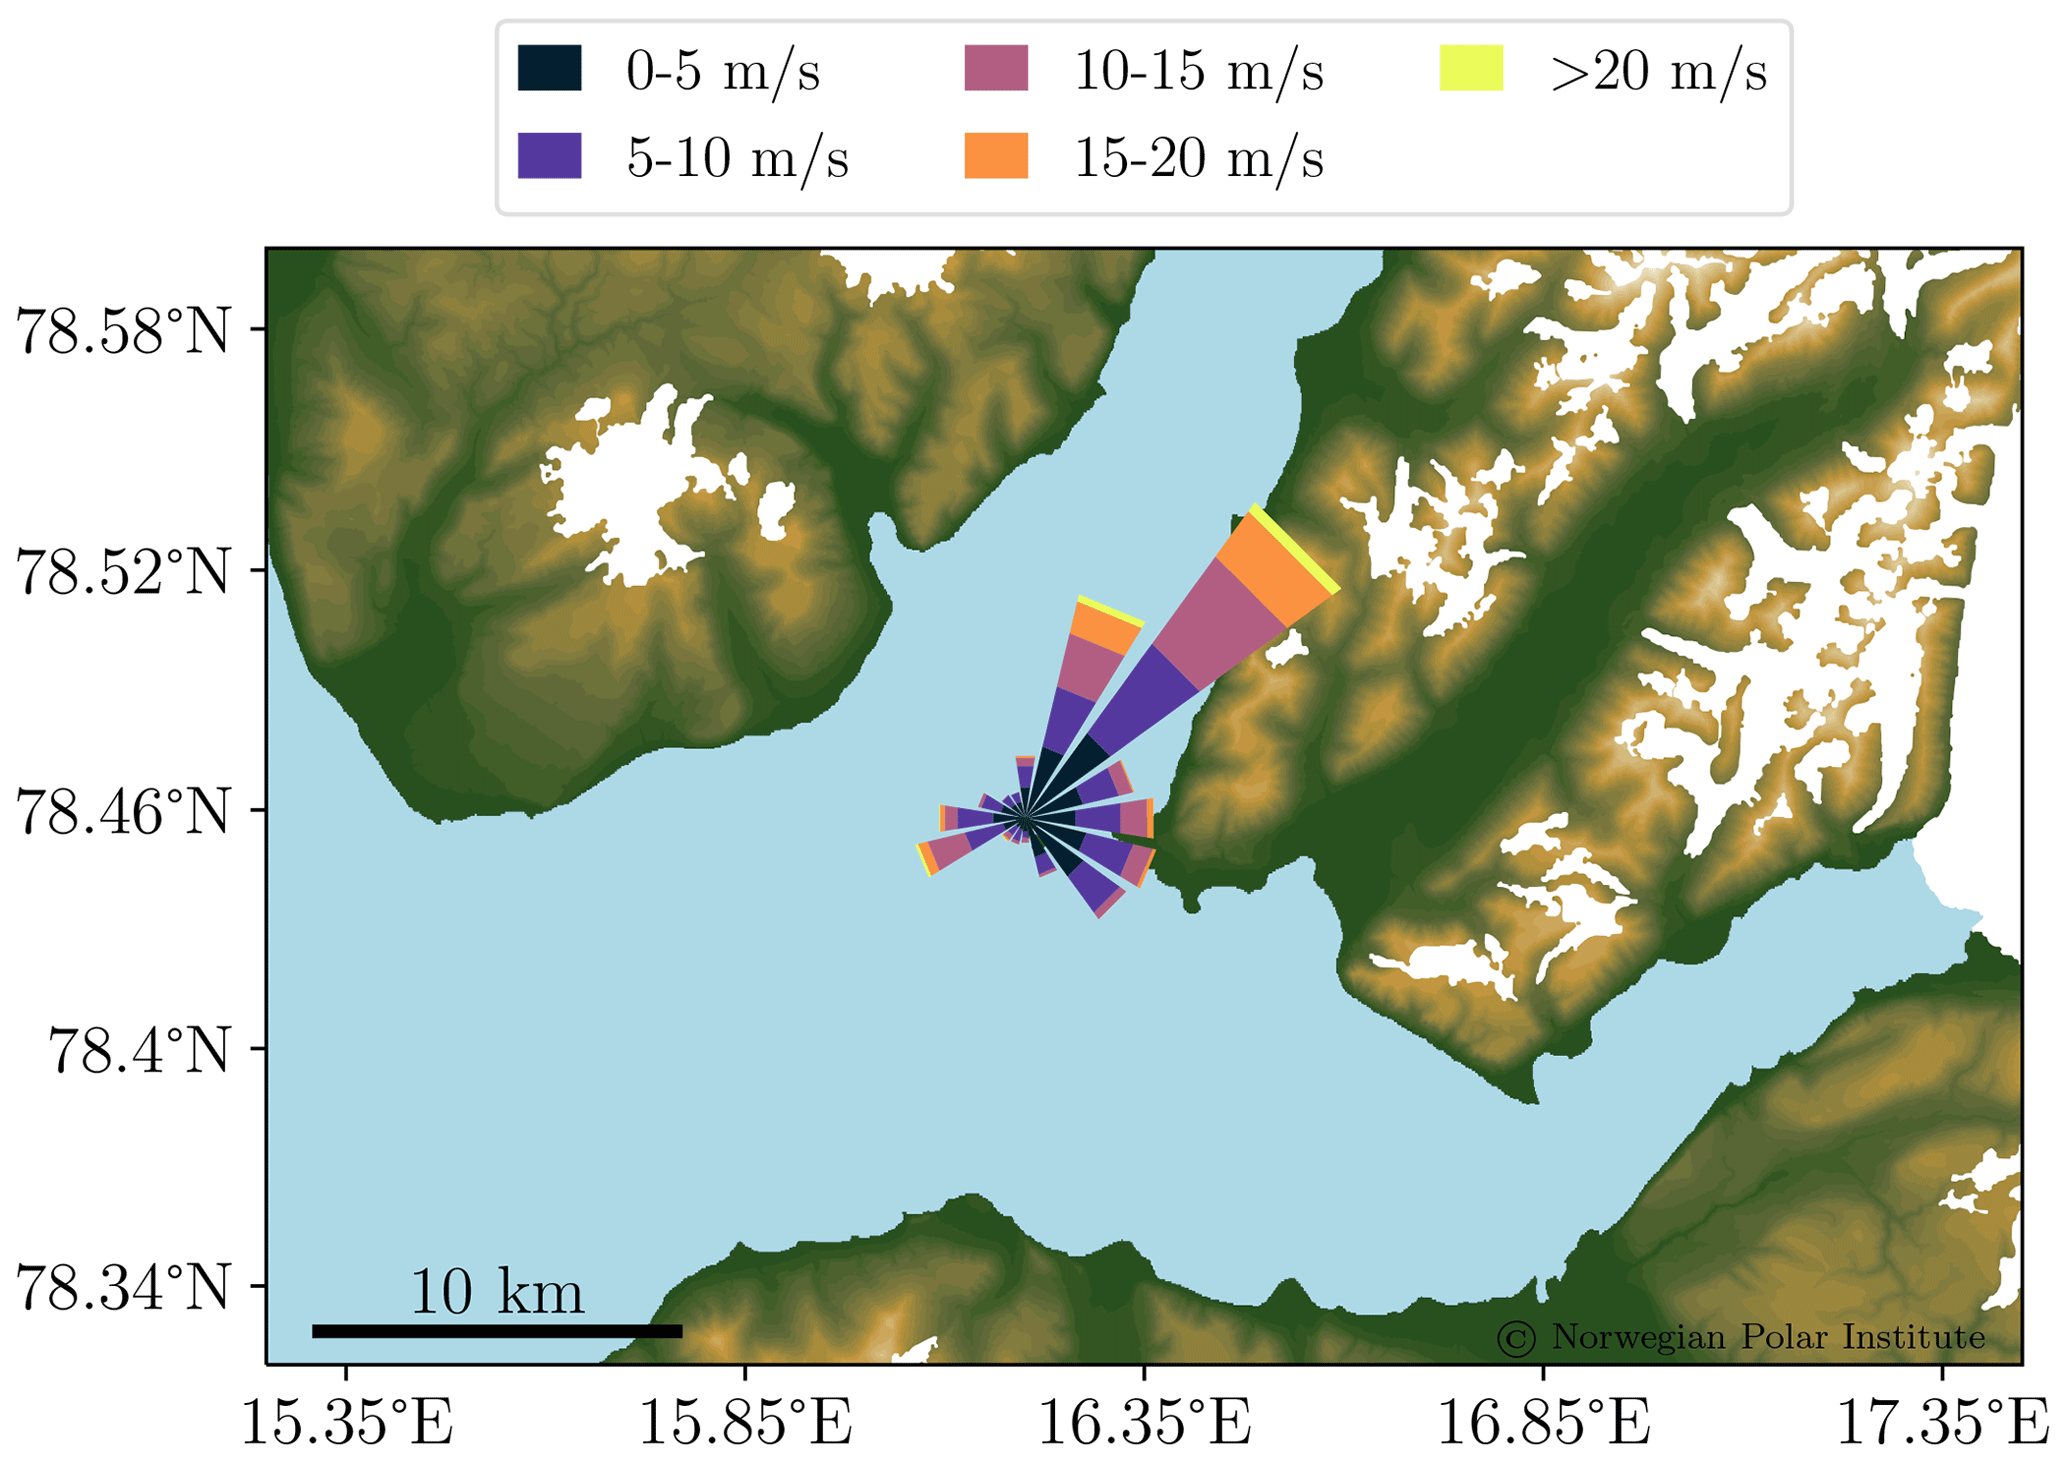
Figure 6Wind climatology at Gåsøyane, including all data available from 3 September 2022 to 22 June 2023.
As of June 2023, all lighthouse stations have been measuring continuously since their respective installation dates (see Table 1 and Fig. 7). In combination with MET Norway's reference surface weather stations in the region, they provide a good overview of the weather conditions in different parts of the Isfjorden system at all times. Furthermore, different subsets of the network can, for example, be used to investigate local gradients within the fjord system, e.g., along the main fjord axis (DMO/IR–BHN/SA–GØ–NN–PYR) or across the fjord (DMO–IR, BHN–SA, NN–GØ–NS).
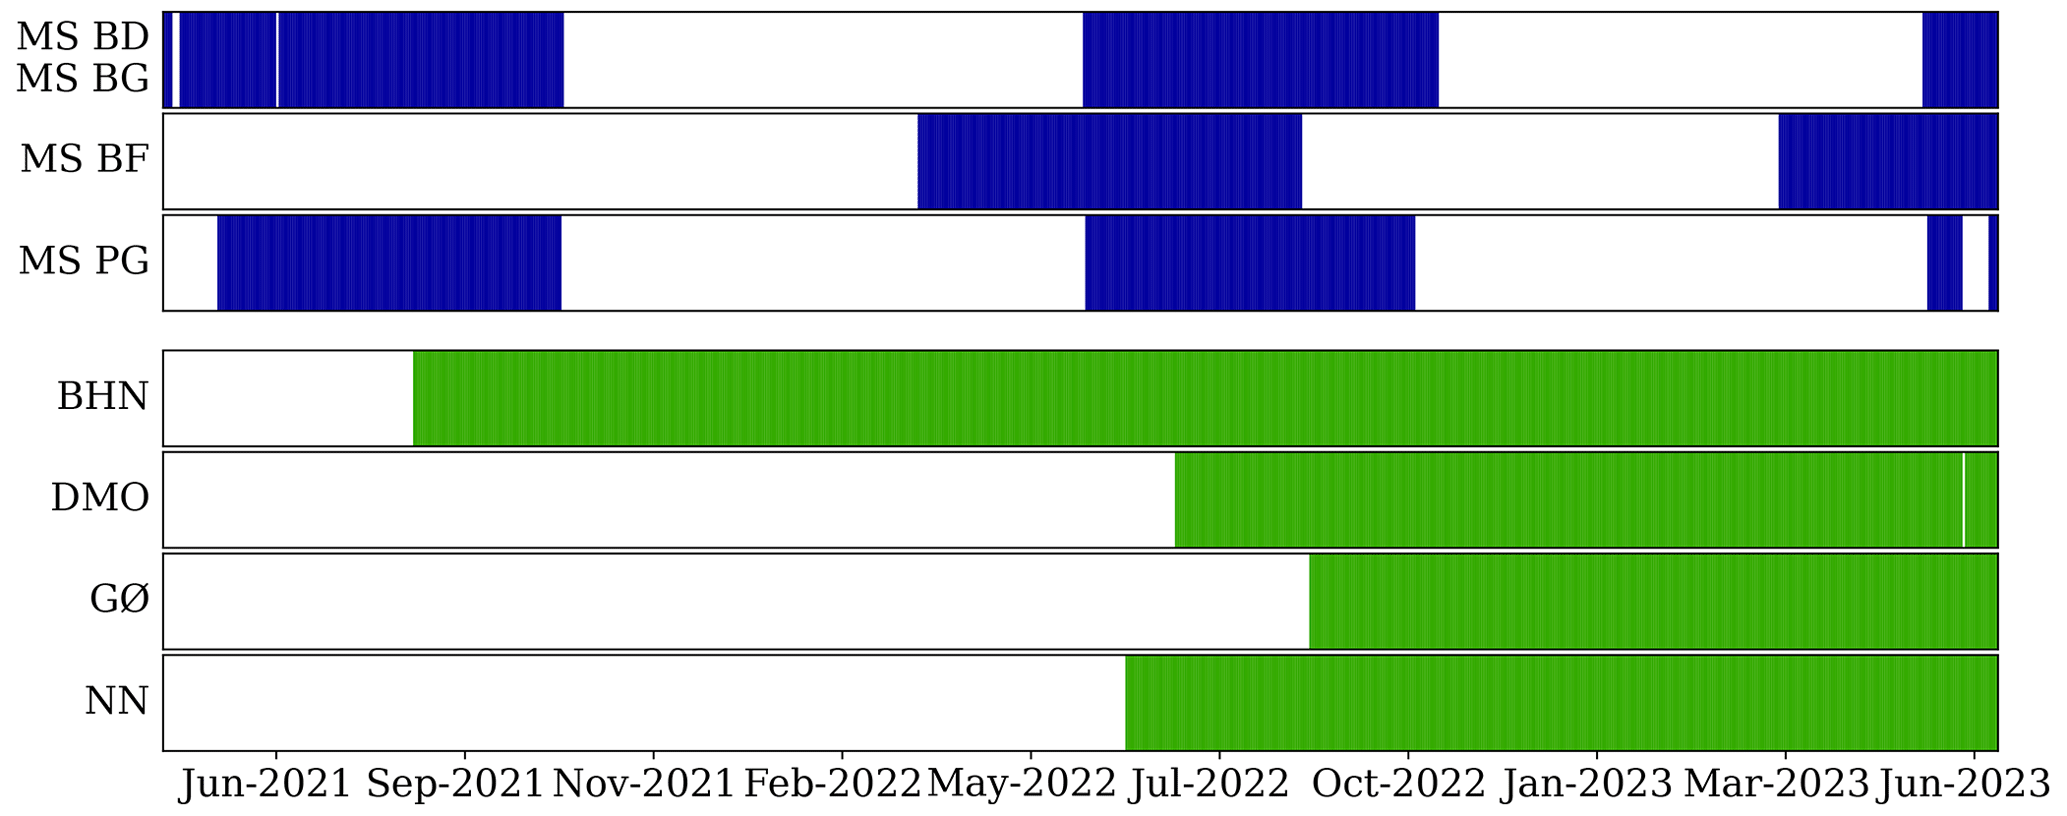
Figure 7Temporal data availability from the installation of the first station in spring 2021 until 22 June 2023. The mobile stations are colored in blue, and the lighthouse stations are colored in green.
2.2 Mobile stations
In addition to the lighthouse stations operating year-round, a set of mobile weather stations complete the IWIN network from spring to autumn each year (see Fig. 7). During the first season of operation in 2021, two stations were installed on the tourist cruise ships MS Bard and MS Polargirl. The former is a modern, 24 m long catamaran with a hybrid-electric propulsion system. In 2023, MS Bard was renamed MS Berg, and this ship will hereafter be referred to as MS Bard/Berg. MS Polargirl is a 35 m long passenger vessel with a classic streamlined design. In 2022, a third station was added on MS Billefjord, which has similar dimensions and design as MS Polargirl. From day to day, the three ships follow different schedules and routes; however, they generally visit the same destinations, mainly including Pyramiden, Barentsburg and the glaciers in the northern and eastern parts of Isfjorden. Combining the measurements from all mobile stations results in the track pattern and corresponding spatial data density indicated in Fig. 8. One can see that the tracks cover large parts of Isfjorden from the mouth area in the west to the head of Billefjorden in the east.
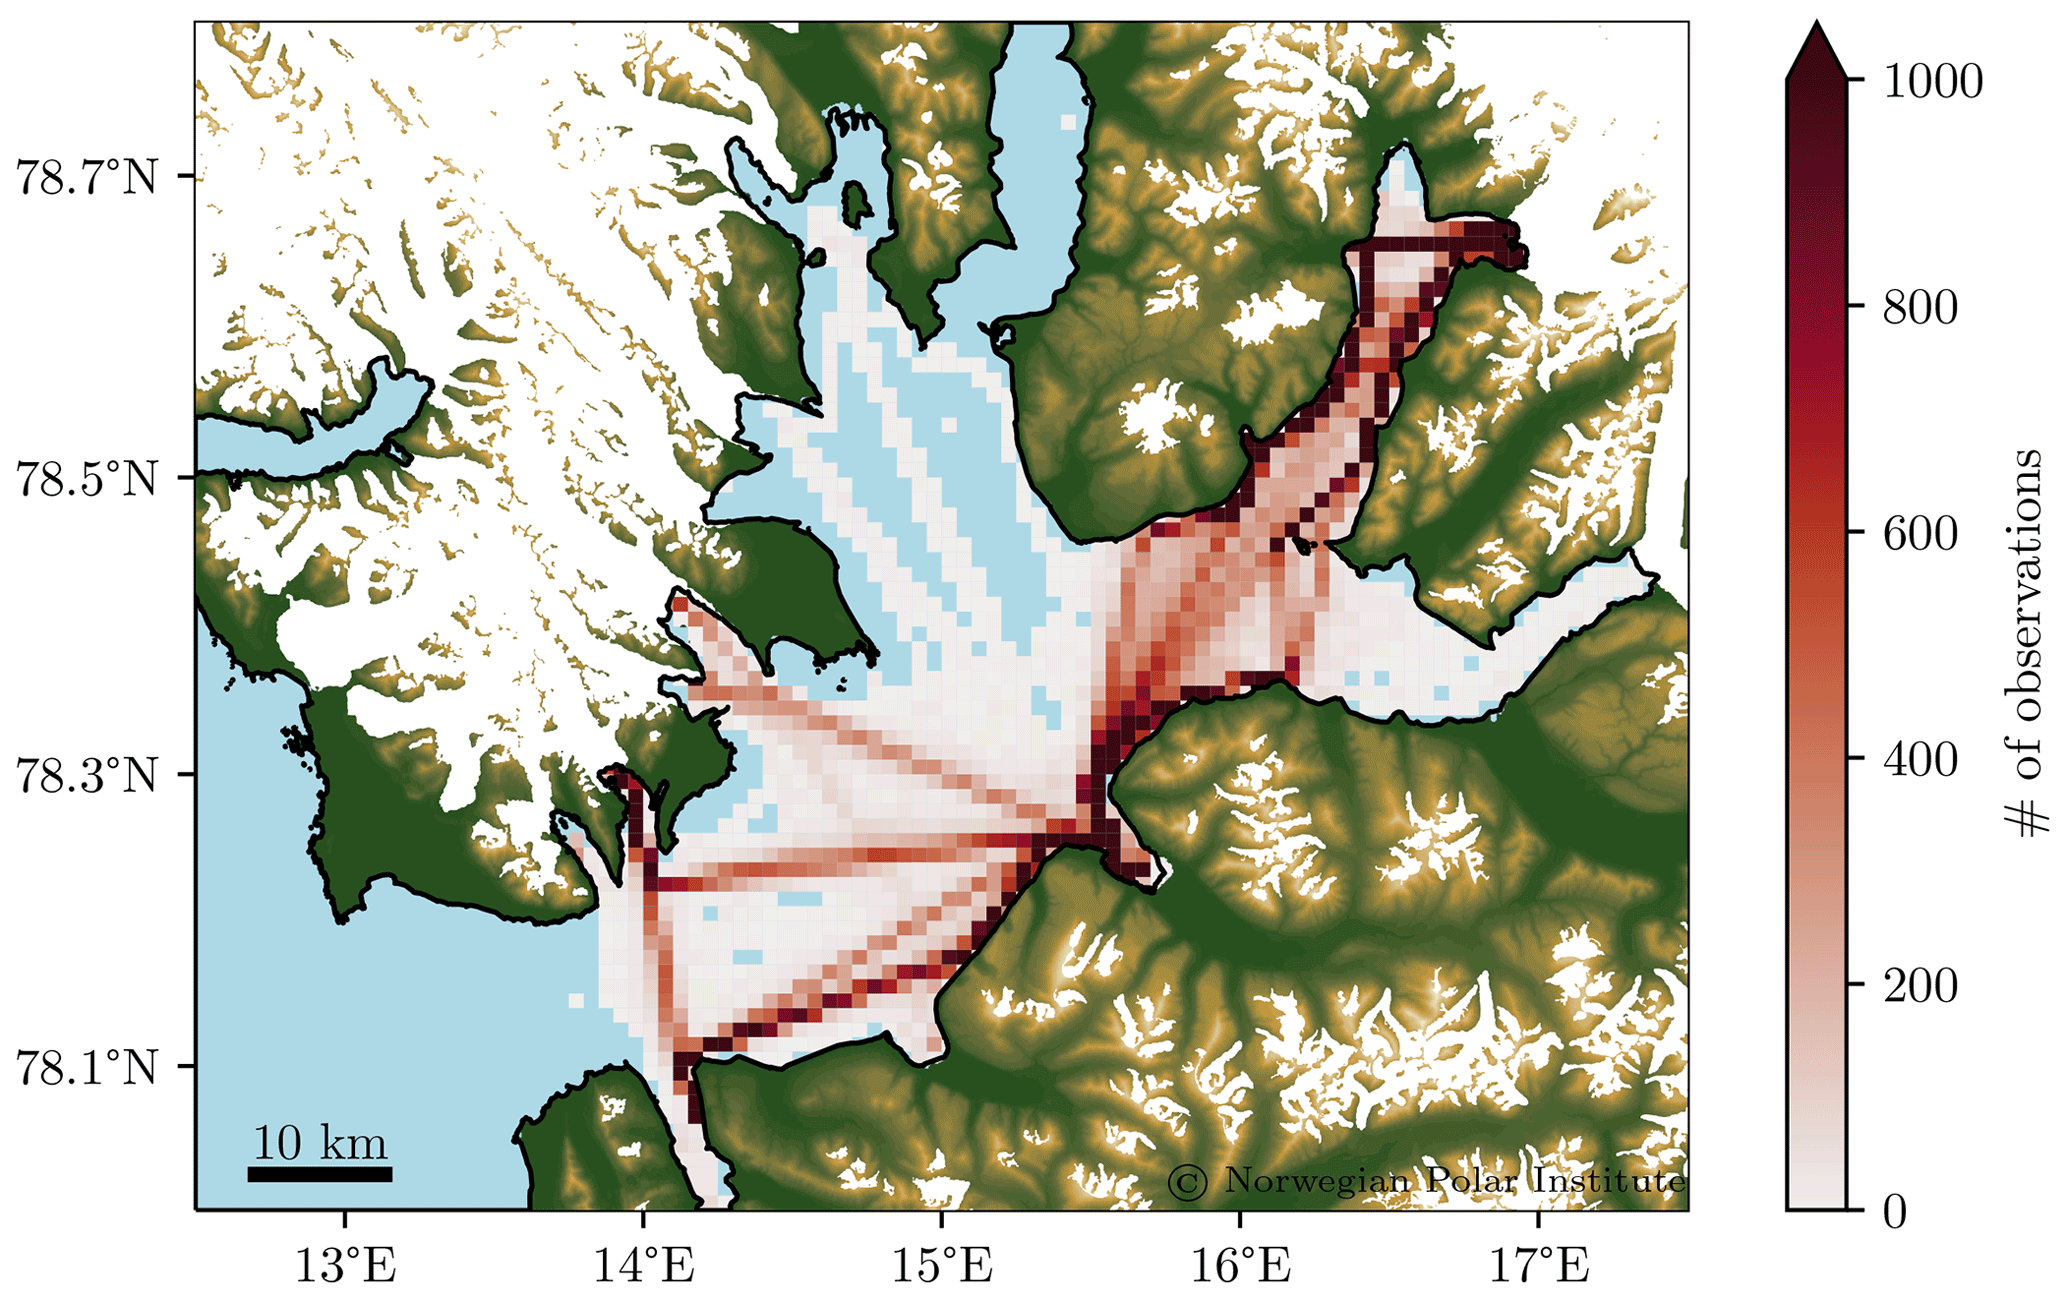
Figure 8Overview map of the tracks from the ships MS Bard/Berg, MS Polargirl and MS Billefjord, where observations are available from the three mobile weather stations from the seasons 2021, 2022 and 2023 (until 22 June). The spatial density of observations is discretized (counted) in boxes of approximately 1×1 km in size and is indicated in shades of red based on a temporal data resolution of 1 min.
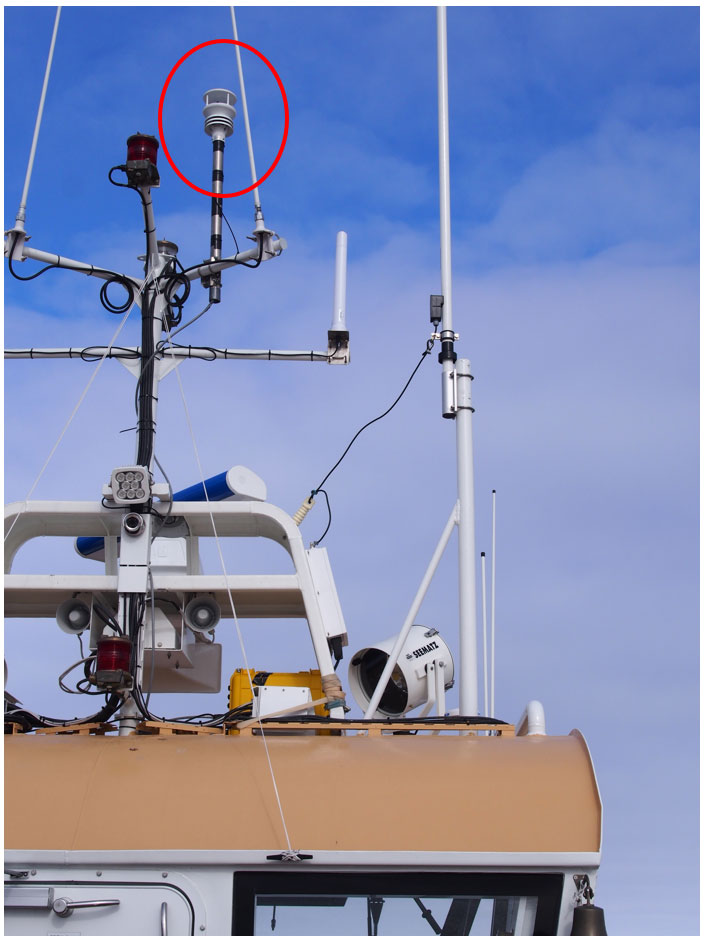
The mobile stations are installed at the top of the ships' masts at 19–21 m above sea level (see Fig. 9) to minimize disturbance of the measurements caused by flow distortion from the ships' own structures. Furthermore, sea spray rarely reaches that high up, which reduces the risk of icing in the beginning and the end of the season, when temperatures often fall below zero. The sensors used are Gill MaxiMet GMX500, configured to sample at a raw frequency of 1 Hz. The individual parameters are measured in the same way as with the lighthouse stations (T, RH, p – solid-state sensor circuits; WS, WD – sonic anemometer). In addition to the standard meteorological variables, the sensors provide heading and GPS position measurements.
The raw measurements undergo a series of processing steps before being published online. This starts with the averaging of the raw data over 1 min and 10 min intervals directly in the data logger connected to the individual weather stations. The data measured by the mobile stations additionally get averaged over 20 s intervals for a higher spatial resolution of the data along the ship tracks.1
After the initial averaging, the data are transferred to UNIS via the 4G cellular network at intervals of 2 and 30 min for the mobile and lighthouse stations, respectively. The differing transfer intervals are chosen because of power consumption considerations, especially with regards to the data modems that consume relatively large amounts of power when they are active. While the mobile stations are connected to the ships' onboard power supply and power consumption is therefore not a limitation, the lighthouse stations run on the lighthouses' battery banks. These batteries are charged via solar panels over summer but have to bridge the polar night (approximately end of October until end of February).
At UNIS, the meteorological data first get filtered for nonphysical outliers by discarding data outside predefined valid ranges for each variable (specified in the final data files). The mobile station data are additionally filtered for erroneous GPS positions located outside the Isfjorden area. Subsequently, the raw wind measurements from the mobile stations are corrected for the ships' horizontal movements using the GPS speed and heading data via basic vector geometry during times when the ships move faster than 0.25 m s−1 (approx. 0.5 kn). Based on the raw wind direction measurements relative to the ships, an additional variable is introduced to mark data points potentially affected by the ships' exhaust plumes (see Table 2 for the respective wind direction sectors). Note that MS Bard/Berg does not have this problem as its exhaust funnel is located down at sea level.
The final data are stored in daily files using the netCDF4 format (individual files for each temporal resolution). This data format allows for extensive meta data to be added directly to each file. For the measured meteorological variables, this includes, amongst others, information about the valid ranges applied in the filtering (see above), the physical units of the measurements and standardized naming. Furthermore, each data file includes a set of global attributes with a summary of its contents, as well as information about the instrument measuring the raw data, the data-processing steps and contact information of the creators. The data files conform to the Climate and Forecast Metadata Convention (CF-Convention, version 1.8) and the Attribute Convention for Data Discovery (ADCC, version 1.3), which makes them machine readable and easy to access.
Table 2Overview of mobile stations and respective exhaust plume sectors.

* Relative to the ship – 0∘ resembles head wind.
The files produced and updated with the newest data at UNIS are synchronized with a virtual server owned by MET Norway via Secure File Transfer Protocol every 5 min. From there, they become publicly available in near-real time (time lag of approximately 5–10 min) at Met Norway's Thematic Real-time Environmental Distributed Data Services (THREDDS) server (https://thredds.met.no/thredds/unis-obs/unis-obs.html, last access: 12 September 2023) and at the Arctic Data Centre (ADC, https://doi.org/10.21343/ebrw-w846, Frank et al., 2023a).
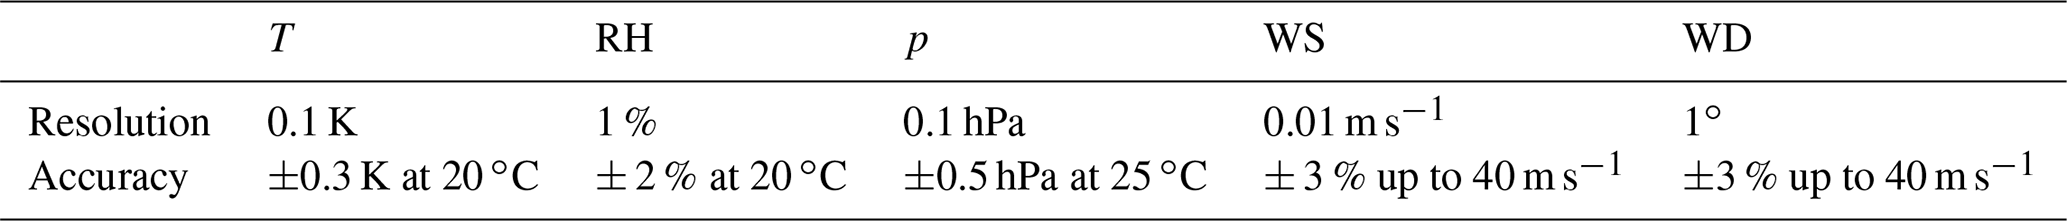
The harsh arctic environment of Svalbard presents challenges to equipment placed in the field for continuous measurements over long time periods. The instrumentation used in IWIN has been chosen accordingly. With no movable parts, the sensors are robust and well suited for operation under a wide range of environmental conditions. Prior to installation, all sensors were factory calibrated and quality checked with respect to the measurement specifications stated by the manufacturers (see Table 3). Even though the reference temperatures accompanying these specifications are rather high compared to the measurements in Isfjorden, the specified operating range of the sensors (−40–+70 ∘C) is large enough to cover even the coldest temperature events occurring in the region. However, it should be pointed out that these factory calibrations and accuracy estimates correspond to ideal laboratory conditions, and deviations are to be expected in a real, field-based environment. Thus, we have performed an extensive evaluation of the IWIN weather station data, including comparison against, among others, reference data from MET Norway, as outlined in the following.
Table 3Measurement resolutions and accuracies for the sensors used in IWIN as stated by the manufacturers (lighthouse stations: https://s.campbellsci.com/documents/us/product-brochures/b_metsens500.pdf (last access: 12 September 2023), mobile stations: https://gillinstruments.com/wp-content/uploads/2022/08/1957-008-Maximet-gmx500-Iss-9.pdf, last access: 12 September 2023).
4.1 Evaluation of lighthouse station data
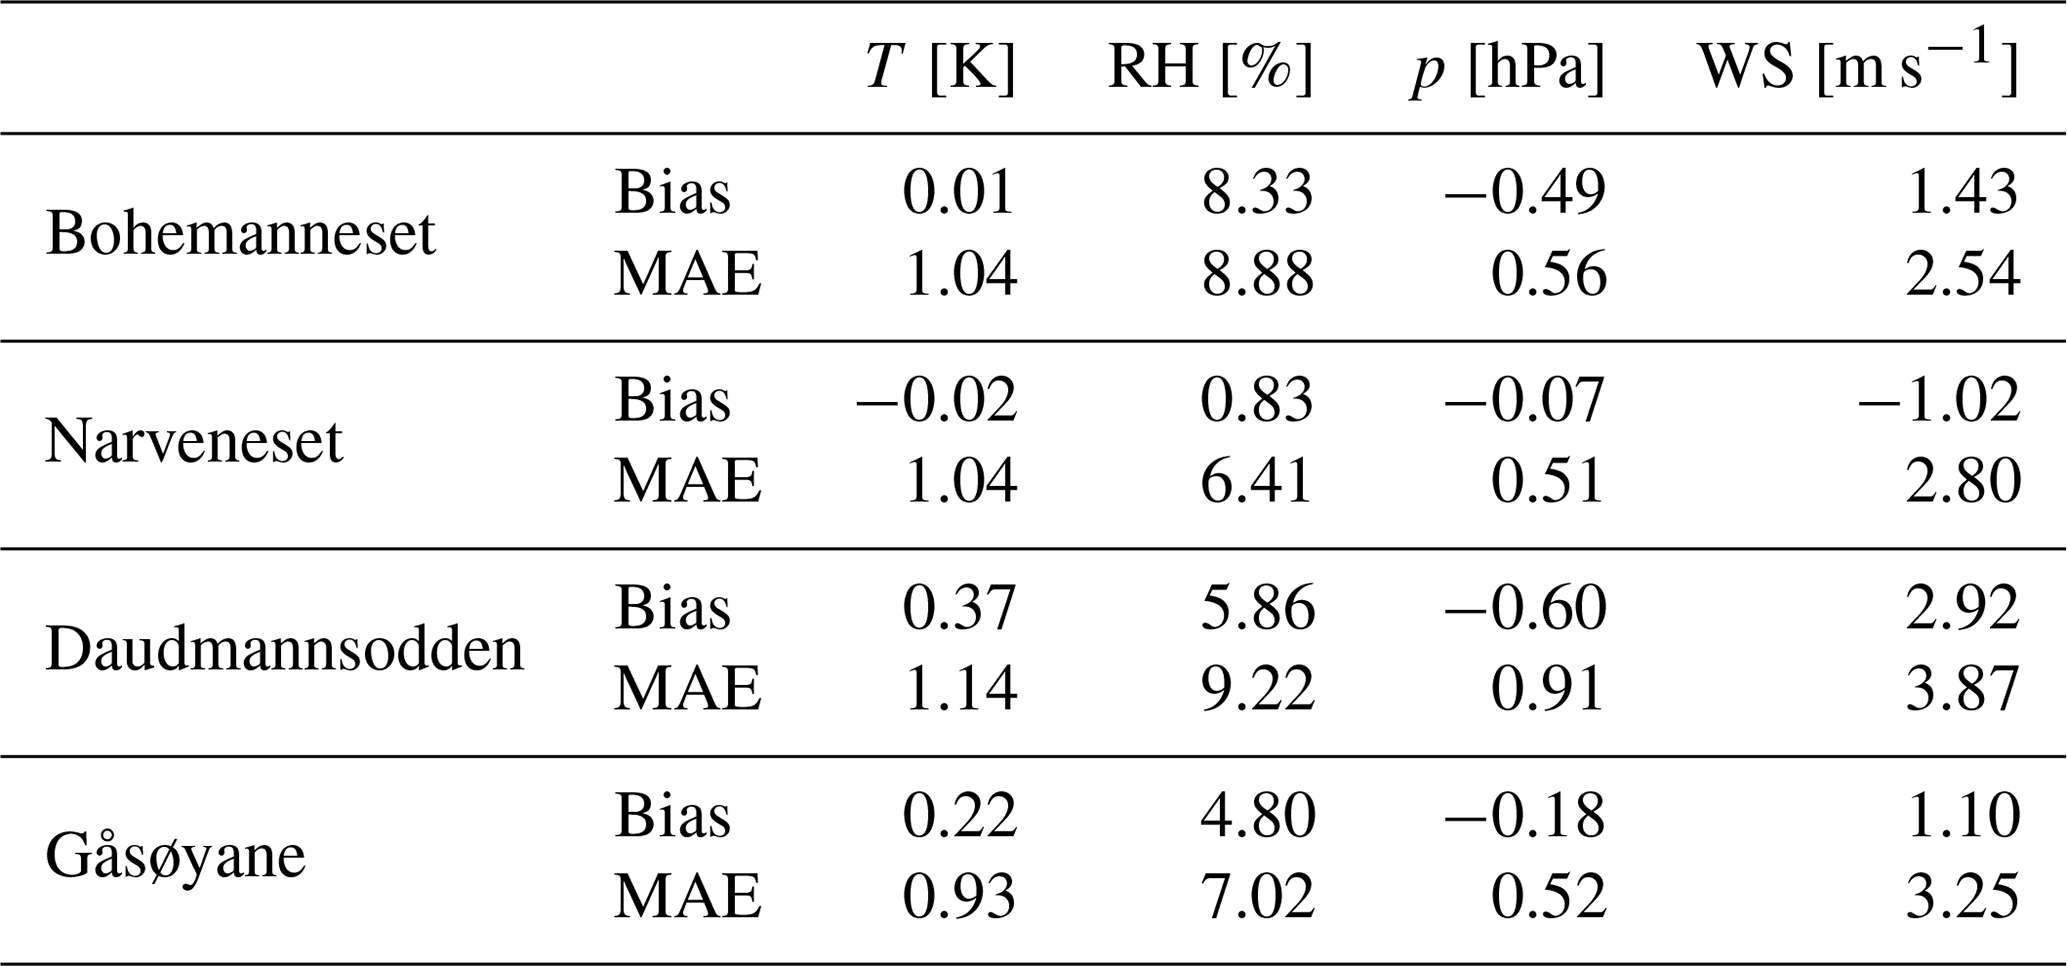
Given their remote locations, validation of the lighthouse station measurements against an absolute reference is difficult. However, MET Norway's surface reference stations at Isfjord Radio, Svalbard Airport and Nedre Sassendalen (see Fig. 1) can be said to constitute a small ensemble representing the general weather conditions in the Isfjorden area. Figure 10 shows the measurement time series for the period 2 September 2022–22 June 2023 (period since the so-far-last lighthouse station in Gåsøyane became operational) from all three MET Norway reference stations and all four IWIN lighthouse stations. It can be seen that all seven stations agree qualitatively very well and exhibit the same overall temporal variations. Furthermore, it can be seen that measurements of individual variables tend to have reoccurring deviations at certain locations, e.g., lower temperatures in Nedre Sassendalen during winter and higher wind speeds at Daudmannsodden. Table 4 corroborates these findings, summarizing the corresponding, quantitative comparison statistics for the lighthouse stations using the ensemble mean of the MET Norway data as a reference.
Daudmannsodden in the west is the warmest location, with an average deviation from the ensemble mean (bias) of 0.37 K. Narveneset in the east, in contrast, is the coldest location, with a (marginal) bias of −0.02 K. Indeed, Gjelten et al. (2016) found a corresponding east–west gradient in their study of spatial temperature variability in the Isfjorden region, attributing the warmer temperatures in the west to a stronger influence of the open ocean in Fram Strait. The lighthouse stations are, on average, biased towards being moist (positive relative humidity biases), and the strongest bias of 8.33 % is found at Bohemanneset. It is unclear what would cause these moist biases, but the lighthouses are all located very close to the Isfjorden shoreline, which might make them more influenced by moisture from the sea compared to the (mean of the) MET Norway stations. Another explanation might be a slight calibration offset at the lighthouse stations. Air pressure is generally a little lower at the lighthouse stations (negative biases), and the largest average deviation (bias) of −0.60 hPa is found at Daudmannsodden. The pressure mean absolute errors (MAEs) are on the order of 0.5 hPa (maximum 0.91 hPa at Daudmannsodden). Wind speed is, on average, higher at the lighthouse stations, with the only exception being Narveneset, with a bias of −1.02 m s−1. It is likely that larger portions of the wind speed biases can be attributed to natural atmospheric variability in the wind field, for example, being induced by topography. Indeed, the wind climatologies (wind roses) presented in Sect. 2.1 feature considerable, topography-induced variability.
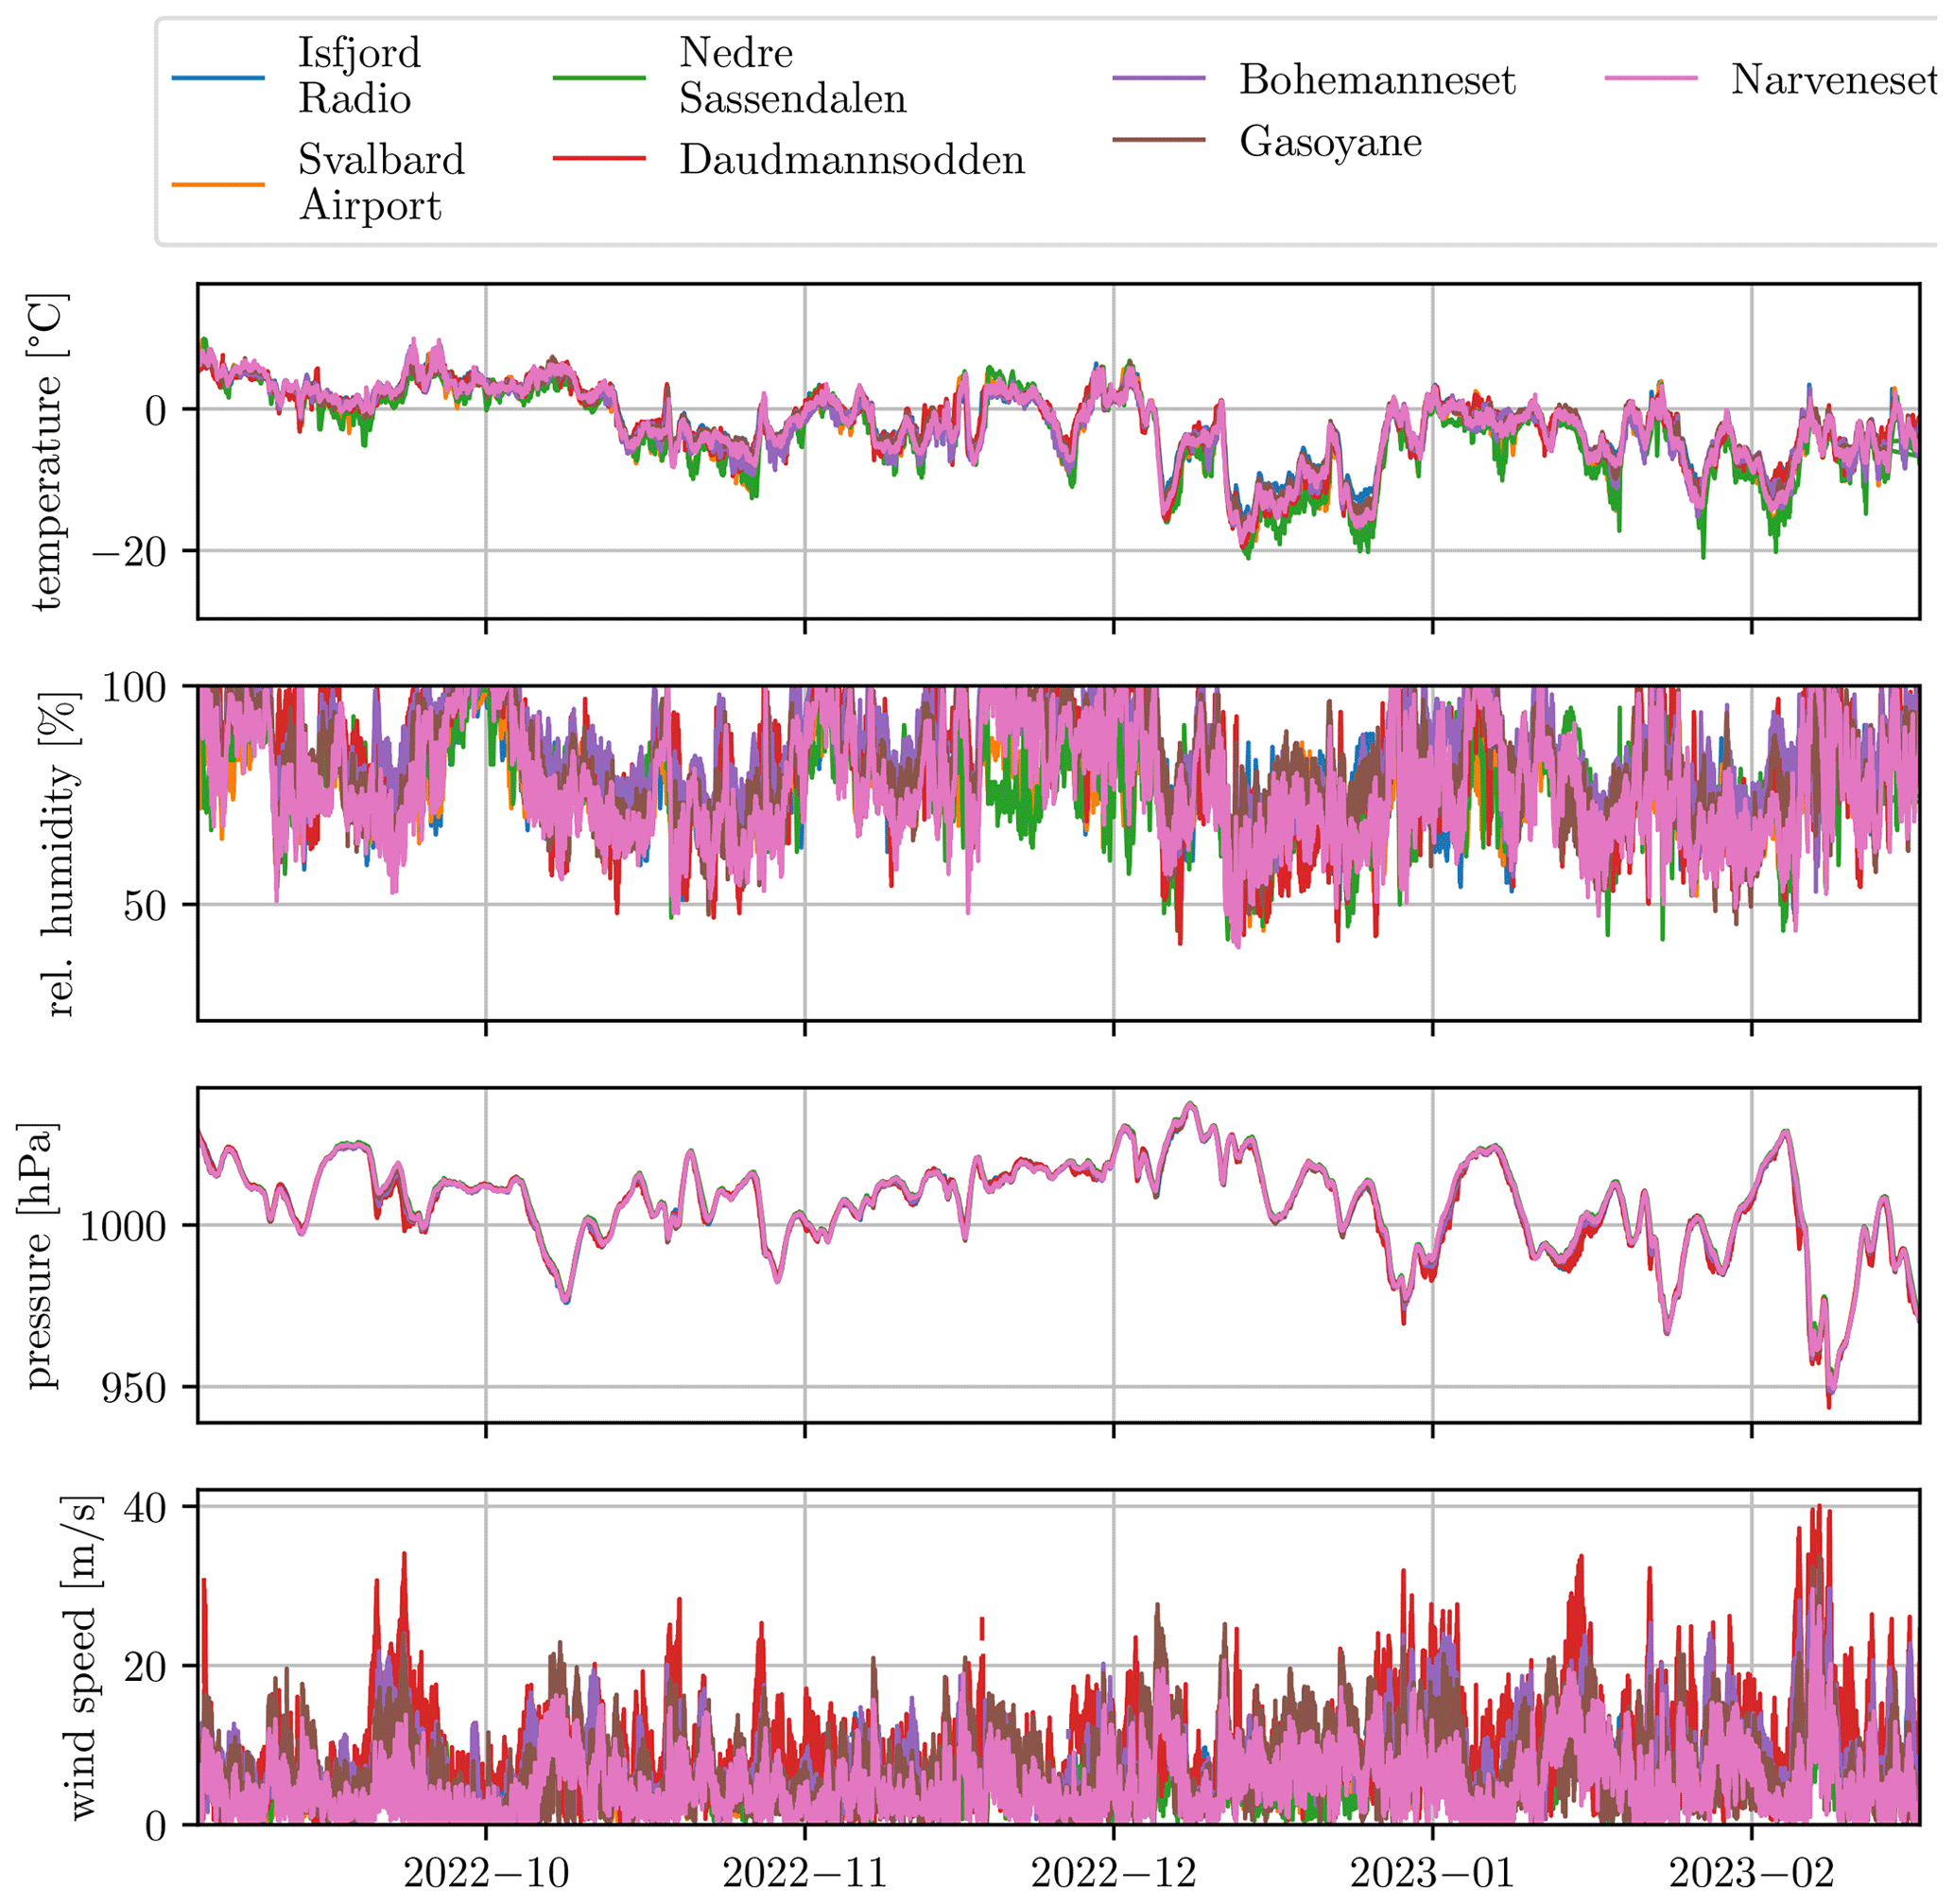
Figure 10Time series of T, WS, RH and p from the four IWIN lighthouse stations and three additional MET Norway stations around Isfjorden. The pressure measurements from the individual stations have been reduced to mean sea level to account for the differences in station elevation.
Table 4Lighthouse station comparison statistics for T, RH, p and WS, calculated with respect to the ensemble mean of the three MET Norway surface reference stations at Isfjord Radio, Svalbard Airport and Nedre Sassendalen.
4.2 Evaluation of mobile station data
Evaluation of the IWIN mobile station data has been done through three sets of comparisons, as outlined in the following.
4.2.1 Internal comparison of mobile station data
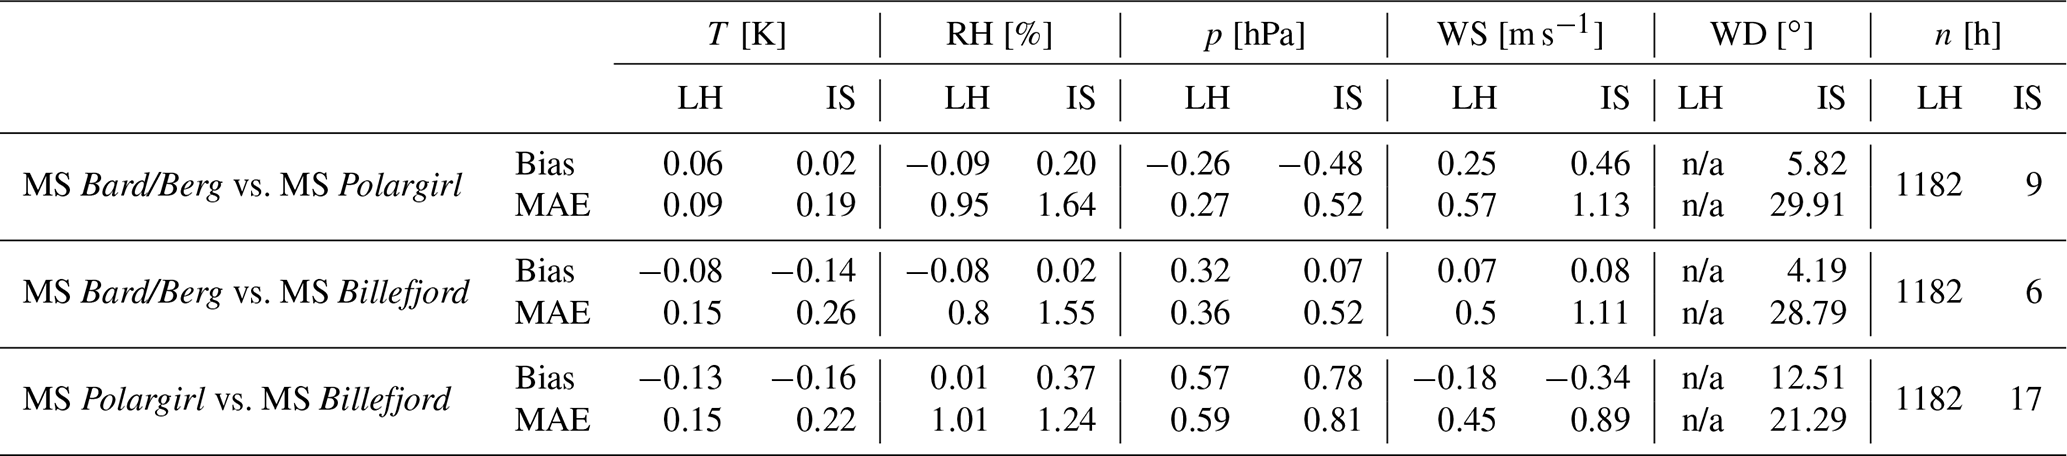
The first comparison set addresses the consistency in data across the different mobile stations for two subsets of situations when the three respective ships were located in the near vicinity of each other: (1) when all three ships were docked in the Longyearbyen harbor (78.2285∘ N, 15.607∘ E) and (2) when pairs of ships passed each other (distance < 1 km) during transit in Isfjorden. The former subset does not include wind direction as the estimation of this variable relies on the ships moving, and the latter subset has been filtered for GPS speed values lower than 0.25 m s−1 to ensure reliable wind direction estimates. The results from this first set of comparisons are presented in Table 5. For both subsets (Longyearbyen harbor and Isfjorden), the temperature and relative humidity comparison statistics (bias and MAE) are within the accuracies given by the instrument manufacturer (Table 3) and hence indicate excellent matches between the three mobile stations for these variables. These results also suggest that the influence of any sources of deviation between the stations (such as calibration offsets and/or the different ships' physical characteristics (their size, shape, etc.)) is minimal. The pressure measurements also agree well between the different stations for both subsets, and most numbers are within the given factory accuracy. One smaller exception is the station on MS Polargirl, which, on average, yields slightly higher pressure values than the other two stations (e.g., 0.78 hPa higher pressure on average than MS Billefjord during transit in Isfjorden). This is likely caused by a slight calibration offset of the pressure sensor at this station. Wind speed compares favorably between the stations for the Longyearbyen harbor subset, and even though MAE values are higher than the manufacturer's accuracy, the values are still fairly low, with the highest MAE of 0.57 m s−1 found between MS Bard/Berg and MS Polargirl. The corresponding wind speed comparison statistics for the Isfjorden subset are somewhat less favorable than for the Longyearbyen harbor subset, with the highest MAE value of 1.11 m s−1 found between MS Bard/Berg and MS Billefjord. Given the distance of up to 1 km between the ships in Isfjorden, it is likely that the natural atmospheric variability in wind might be a substantial source of deviation between the data sets. As illustrated in the wind climatology from the lighthouse stations (Sect. 2.1), considerable spatial variability in wind over Isfjorden has indeed been documented. Wind direction displays the largest difference between the mobile stations. Note that the sign convention of the wind direction bias is such that positive is clockwise. Although the biases are relatively low (within 12.53∘), the MAEs reach 30.05∘ (comparing MS Bard/Berg and MS Polargirl). The ships' differing physical characteristics and natural variability are both likely to be sources of deviations, but there might also be further sources involved. One such source is the alignment of the sensors with the ships. It is generally challenging to align the stations' north–south axes exactly along the ships' “x axes” (from bow to stern) when mounting them on the ships. It is likely that slight offsets related to this alignment are a source of deviation. Another source of deviation is the uncertainty in the GPS heading estimates during times when the ships move very slowly. Even though a threshold of 0.25 m s−1 for the ship speeds is used in the correction algorithm, it cannot be completely ruled out that uncertainty in the GPS heading estimates impacts the corrected wind direction observations during times when a ship moves only slightly faster than the threshold speed. When using wind direction data from the mobile IWIN stations, it is important to take these uncertainties in the wind direction measurements into account and to apply additional filters or corrections if needed.
Table 5Mobile station comparison statistics for T, RH, p, WS and WD for times when all three ships were docked in the Longyearbyen harbor (LH) and for times when they were passing each other during transit in Isfjorden within 1 km distance (IS). The 1 min data are used for the comparison, and the number of data points (n) is given in hours. n/a – not applicable.
4.2.2 Comparison of mobile station and lighthouse station data
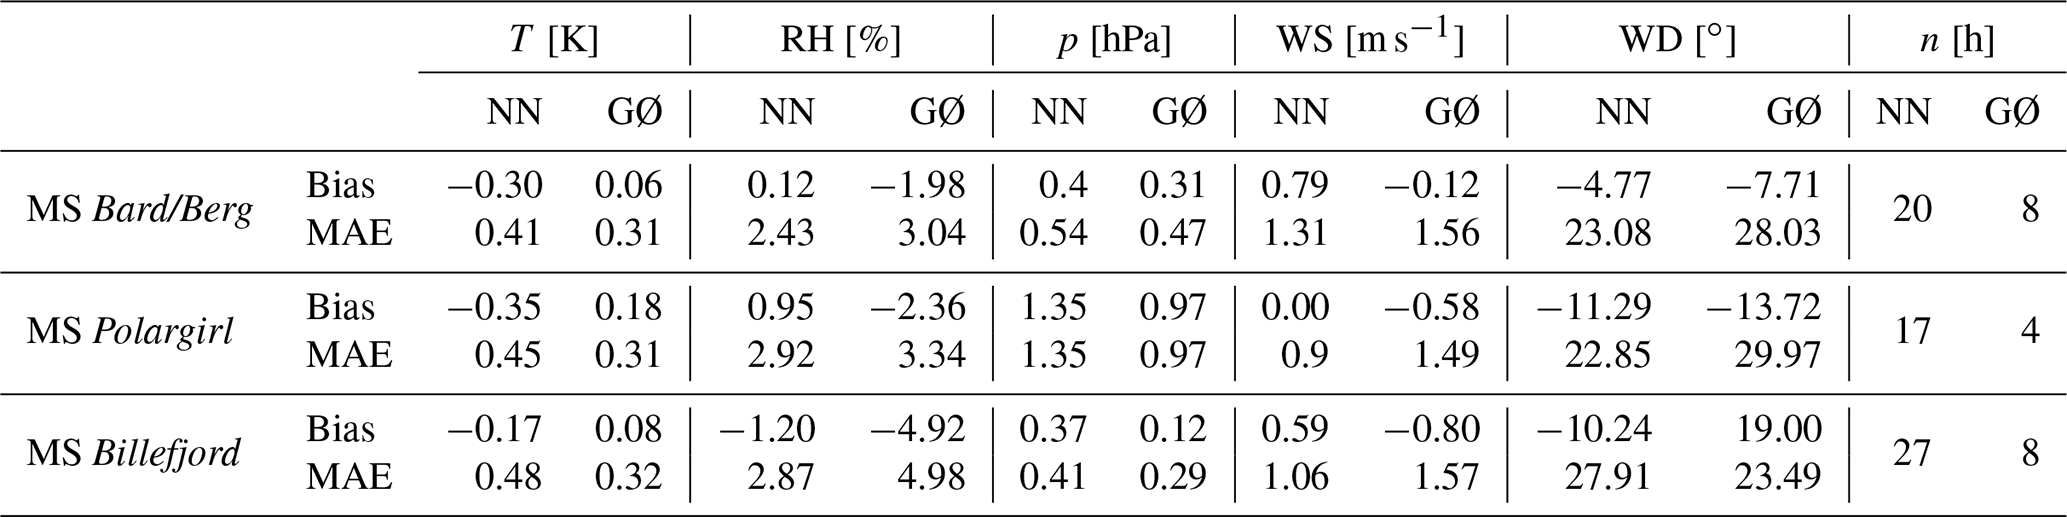
The second comparison set contrasts the measurements between the three mobile stations and the two lighthouse stations at Narveneset and Gåsøyane for time steps when the mobile stations are within a distance of 2 km from the respective lighthouse station. The temperature comparison statistics for Gåsøyane are all below or only slightly above the sensor accuracy of 0.3 K (Table 6). The Narveneset statistics are somewhat worse, and all mobile station data are, on average, slightly colder compared to this lighthouse station (−0.35 K for MS Polargirl). A closer investigation of these numbers reveals that this cold bias is stronger during summer (June–July) than autumn (September–October). For example, comparing MS Bard/Berg and MS Polargirl to Narveneset yields −0.46 and −0.53 K during summer and −0.04 and −0.22 K during autumn, respectively. This is likely an effect of the air over land being heated more than the air over the sea during summer. The Gåsøyane comparison does not display a similar tendency, which can likely be explained by this location being situated on a smaller island that is more exposed to the (air from the) sea. In terms of relative humidity, the comparison statistics are fairly favorable and only slightly beyond the manufacturers' accuracy. A notable exception is the statistics for the MS Billefjord and Gåsøyane comparison, where there is a bias of −4.92 % and an MAE of 4.98 %. However, this comparison is based on data from only a short time period in spring 2023 (see limited overlap in terms of data availability from the two stations in Fig. 7). The pressure data comparison statistics are very favorable and mostly within the manufacturers' accuracy of 0.5 hPa. An exception is found for MS Polargirl, with both the bias and MAE values reaching 1.35 hPa when compared against Narveneset. This fits with the previously suggested calibration offset for pressure measured by the mobile station on MS Polargirl. The wind speed measured by the three mobile stations is, on average, higher than that at Narveneset, and for Gåsøyane, the opposite is the case. This could be linked to the measurement heights above sea level. While both lighthouse stations are located at about 3.6 m above the ground level, their altitudes (base of lighthouses) above sea level differ, with Narveneset being located at about 3 m above sea level and Gåsøyane at 15 m above sea level. This is presumably particularly relevant for wind directions at Gåsøyane coming from a northern and northeastern sector, where there is a cliff in the immediate vicinity (30–50 m distance) of the lighthouse. This is in contrast to the southern and southwestern sectors, where this lighthouse faces relatively flat, open land for several hundred meters. Stratifying the comparison statistics by wind direction measured at Gåsøyane indeed reveals differences. While wind from between 20 and 60∘ (north–northeast) at Gåsøyane gives biases of −1.60, −1.87 and −1.41 m s−1 for MS Bard/Berg, MS Polargirl and MS Billefjord, respectively, the corresponding biases for wind from between 180 and 290∘ (south–west) are 0.27, 0.19 and −0.09 m s−1. It is likely that north–northeast wind is locally accelerated over the cliff at Gåsøyane and that this, at least in part, explains the statistics' sensitivity to wind direction at this location. The wind direction statistics are quite similar between the different mobile and lighthouse stations. Also, at least in terms of MAE, they are similar to the comparison between the mobile stations on the different ships (Sect. 4.2.1), with values between 20 and 30 ∘.
Table 6Mobile station comparison statistics for T, RH, p, WS and WD calculated with respect to the lighthouse stations at Narveneset (NN) and Gåsøyane (GØ) for times when the ships were within 2 km of these stations. The 1 min data are used for the comparisons, and the number of data points (n) is given in hours.
4.2.3 Comparison of mobile station data with reference station data
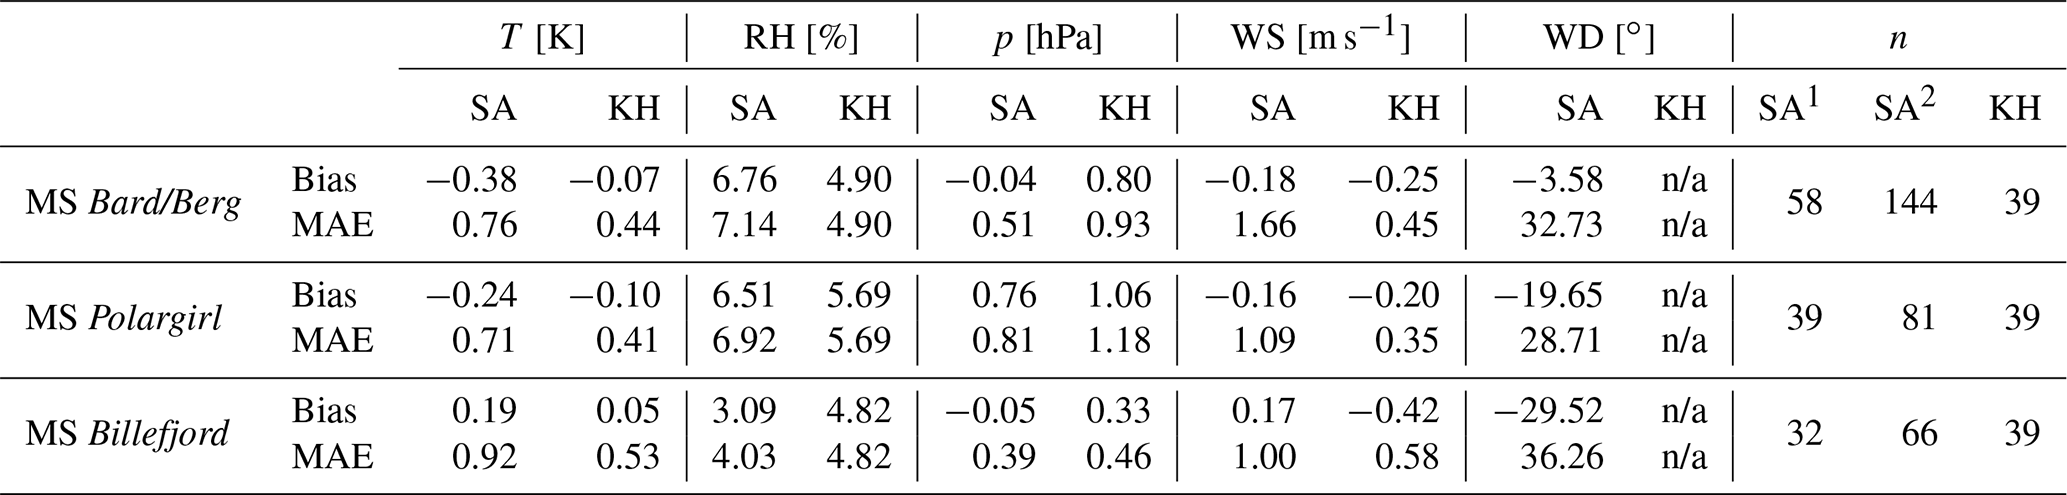
The third comparison set consists of two subsets contrasting mobile station data with (1) data from the MET Norway reference station at Svalbard Airport (SA) for times when the ships were within 2 km of this station and (2) data from the Norwegian research vessel Kronprins Haakon (KH) for times when this ship was docked in the Longyearbyen harbor alongside the ships with the mobile stations. For the comparison against SA, only data from when the ships were moving (higher GPS speed than 0.25 m s−1) have been considered. Also, mobile station data from east of 15.529∘ E have been excluded from the comparison because an industrial site with several buildings is located between this longitude and SA. In addition, for the SA wind data comparison, only cases when the wind at SA originated from a sector between 220 and 300∘ (roughly southwest to northwest) have been considered for the same reason.
Regarding measurement heights at SA and KH, the former follows the conventional 2 and 10 m heights, while at KH, temperature, relative humidity and pressure are measured at 21 m above sea level, and wind speed and wind direction are measured at 36 m above sea level. Compared against the SA measurements, the mobile station data are biased towards being cold on MS Bard/Berg and MS Polargirl (−0.38 and −0.24 K) and towards being slightly warm on MS Billefjord (0.19 K). Stratifying these data by summer (June–July) and autumn (September–October) for the two former ships reveals consistent negative biases during summer (−0.98 and −0.78 K) and positive biases during autumn (0.50 and 0.65 K). MS Billefjord has not operated in autumn, but the spring (March–April) data reveal a positive bias of 1.53 K versus a summer data bias of −0.67 K. Given the seasonal dependency on the sign of these biases, it is likely that they feature large contributions from natural atmospheric variability. Indeed, the air above land is generally warmer than over the sea during summer in the Isfjorden region and vice versa during spring and autumn. Compared against the measurements from KH, all mobile station data yield small temperature biases between 0.05 K at MS Billefjord and −0.10 K at MS Polargirl. The corresponding MAEs are also relatively small between 0.41 K (MS Bard/Berg) and 0.53 K (MS Billefjord). The mobile station data are all biased towards being moist compared to both the SA and the KH measurements, with a bias of up to 6.76 % for MS Bard/Berg compared to SA. Considering only the SA comparison, one could expect the mobile station data to be moister as these were measured over the sea, and the SA data were measured over land. However, the KH comparison gives similar moist biases, and these data were obtained from virtually the same location as the mobile station data. It is not clear what causes these moist biases in the mobile station measurements. However, as similar moist biases have also been found for the lighthouse stations, the particular humidity sensors in the Gill MaxiMet GMX500 and Campbell Scientific MetSENS500 instruments used in IWIN could be biased somewhat towards being moist in general.
The pressure data error statistics are the least favorable for MS Polargirl, yielding positive biases of 0.79 and 1.06 hPa against SA and KH. This is in line with the previously found tendency for this mobile station to report slightly higher pressure values than the other mobile stations. The error statistics for MS Billefjord are all within the manufacturers' stated accuracy of 0.5 hPa, while for MS Bard/Berg, the values are slightly larger, with an MAE of up to 0.93 hPa when compared against KH. The wind speed error statistics reveal very small biases for all three mobile stations, especially compared to SA but also compared to KH. The latter biases are consistently negative, which fits with the wind measurements at KH being obtained at 31 m above sea level compared to 19–21 m above sea level for the mobile stations. In terms of MAE, the values are least favorable for the comparison against SA, ranging between 1.00 m s−1 (MS Billefjord) and 1.66 m s−1 (MS Bard/Berg). This is not surprising given the differing underlying surfaces (land vs. sea) and horizontal distances (up to 2 km) involved, and it is reasonable to assume that natural atmospheric variability plays a role in these deviations. Regarding wind direction, the measurements from MS Billefjord feature the least favorable error statistics, with an MAE of 36.26∘ when compared against SA. It is again clear that wind direction is the variable from the mobile stations with the lowest accuracy.
Table 7Mobile station comparison statistics for T, RH, p, WS and WD, calculated with respect to (1) measurements from the MET Norway reference station at Svalbard Airport (SA) for times when the ships were within 2 km of this station and (2) measurements from the Norwegian research vessel Kronprins Haakon (KH) when this was docked in the Longyearbyen harbor alongside the three ships. The number of data points (n) is also indicated. Note that SA reports T, RH and p every hour (SA1) and WS and WD every 10 min (SA2). KH reports all variables every hour. n/a – not applicable
4.2.4 Remaining uncertainties
In summary, the evaluation presented above documents the quality of the IWIN data set and underlines its potential for investigations on the temporal and spatial atmospheric variability in the Isfjorden region.
Some sources of uncertainty remain, however, especially with regards to the mobile stations and their wind direction data, which display the largest inaccuracies in comparison to each other and the other stations. As discussed above, there are likely several sources for these inaccuracies, including the sensors' alignment with the ships, the ships' differing physical characteristics (their shape, size, etc.), uncertainties in the ships' heading estimates from GPS data, and, not least, natural atmospheric variability when comparing the mobile stations to references located on land and at a distance of up to 2 km. Efforts are currently underway to improve the accuracy of the IWIN mobile stations' wind measurements. New and better routines for aligning the sensors (north–south axes) with the ships' bow–stern axes during the annual installation process will be investigated. In addition, a GPS-based compass for better estimation of the ships' heading is currently under testing with MS Bard/Berg. The results from this are still under evaluation, and if proven successful, this compass should also allow wind direction measurements when the ships are standing still (as opposed to the now minimum GPS speed of 0.25 m s−1). Furthermore, a recent master study at UNIS carried out computational fluid dynamics (CFD) simulations for investigating flow distortion around MS Bard/Berg (Reen, 2022). The results from this study are still to be formally published, and a thorough analysis is beyond the scope of this paper, but they do indicate quantitatively little influence of this flow distortion on the wind measurements on that ship at the location of the sensors (at the ship's highest point). The generally excellent match between the different ships' wind speed measurements (Table 5) supports this finding as the three ships' physical characteristics are rather different. The same applies to the temperature and relative humidity measurements, which also match excellently between the ships. Besides the actual horizontal motion of the ships, pitching and rolling motions in heavy seas introduce additional artificial wind components measured by the stations. However, the temporal averaging of the raw data acts as a low-pass filter for this high-frequency variability, and their impact on the final data set is thus presumably small. Finally, with sub-zero temperatures for extended periods during a year, icing and/or riming might cause sensor malfunctioning, especially for the (non-heated) exposed sonic anemometer transducer heads. As the ships used as platforms for the mobile stations do not operate during winter and because the sensors themselves are mounted high up on the masts, the danger of icing or riming can be considered to be rather small. The lighthouse stations are mounted in remote locations that are virtually inaccessible during conditions when icing and/or riming might occur. Therefore, we have not been able to visually monitor them for such issues. However, from the data records, we do not see any indications of icing and/or riming impacting the measurements.
As discussed in the evaluation of the IWIN observations (Sect. 4), natural atmospheric (spatial) variability has an impact on the comparison statistics and at least in part explains offsets between the measurements from the various IWIN and reference weather stations. The inferred atmospheric variability includes, among others, (seasonally dependent) contrasts between near-surface temperatures over land and sea, as seen, for example, in the comparisons of the mobile station data against data from Svalbard Airport and Narveneset. In addition, there are signs of topographic effects impacting the wind field, as deduced from the comparison between the mobile station data and data from Gåsøyane. In this section, examples will be given of such atmospheric variability, and connections will be made to the aforementioned evaluation of the IWIN data. Furthermore, the examples demonstrate the capabilities of IWIN to observe local weather phenomena and show potential for future use of the data set. A further, in-depth analysis of the weather phenomena is, however, beyond the scope of this paper.
The first example is taken from 20 October 2022. On this day, Svalbard was under the influence of a high-pressure ridge extending over the western central Arctic and Greenland and a low-pressure system centered over Novaya Zemlya. This setup established a weak but well-defined northerly synoptic flow over Svalbard, advecting relatively cold Arctic air masses over the Isfjorden region. Figure 11 shows near-surface wind and temperature data on this day from Billefjorden and the adjacent Isfjorden proper, as observed by the mobile station on MS Bard/Berg. Both the local temperature and the wind field display rather strong variability. The lowest temperatures are generally found close to the entrance of valleys, and several of these valleys have wind emanating from them, affecting areas such as those close to Pyramiden, Kapp Ekholm, Rundodden, Skansbukta and Narveneset. Given the low temperatures at these locations, as well as the relatively weak synoptic flow and the local wind directions (along the valley axes), the air masses are likely driven by a thermal component (drainage flow) set up by the land–sea temperature contrast, bringing a terrestrial atmospheric (in this case cold) footprint onto the fjord. Other locations, such as along the shoreline between Narveneset and Pyramiden and indeed also the stretch of Billefjorden covered by MS Bard/Berg as it passed by Gåsøyane, do not show signs of such a terrestrial footprint. MS Bard/Berg's close proximity to the lighthouses Narveneset and Gåsøyane on this day allows a detailed comparison of the IWIN data from these sources and a brief analysis of how the described natural atmospheric variability affects this. Figure 12 shows time series of the data from MS Bard/Berg and the lighthouses at Narveneset and Gåsøyane, measured during the 20 min periods when the ship passed by the respective lighthouse. The red shading highlights the subperiod corresponding to the 2 km threshold used in the calculation of the comparison statistics in Sect. 4.2.2. One can see that small-scale spatial variability like the drop in temperature observed by MS Bard/Berg when passing the valley entrance south of the Narveneset lighthouse (at about 08:57 UTC) is not captured by the stationary measurements at the lighthouse. Comparing the magnitude of this temperature drop (approx. 1 K) with the results from the mobile station evaluation presented in Table 6 (MAEs of approx. 0.3–0.5 K) exemplifies how natural spatial variability in the near-surface atmospheric variables can contribute to large parts of the differences between the stations. Similarly, the wind speed at Narveneset featured substantially less variability for this comparison than that recorded by the mobile station on MS Bard/Berg, contributing to differences of up to 5 m s−1 (at about 09:01 UTC). In the comparison of data from MS Bard/Berg and Gåsøyane, the recorded temperatures match very well, both being dominated by a fetch from Billefjorden (northerly flow). The wind speed, however, is higher at Gåsøyane than at MS Bard/Berg, and this can likely be related to the aforementioned topographic effect (acceleration of the wind) at Gåsøyane for the northerly flow, as discussed in Sect. 4.2.2.
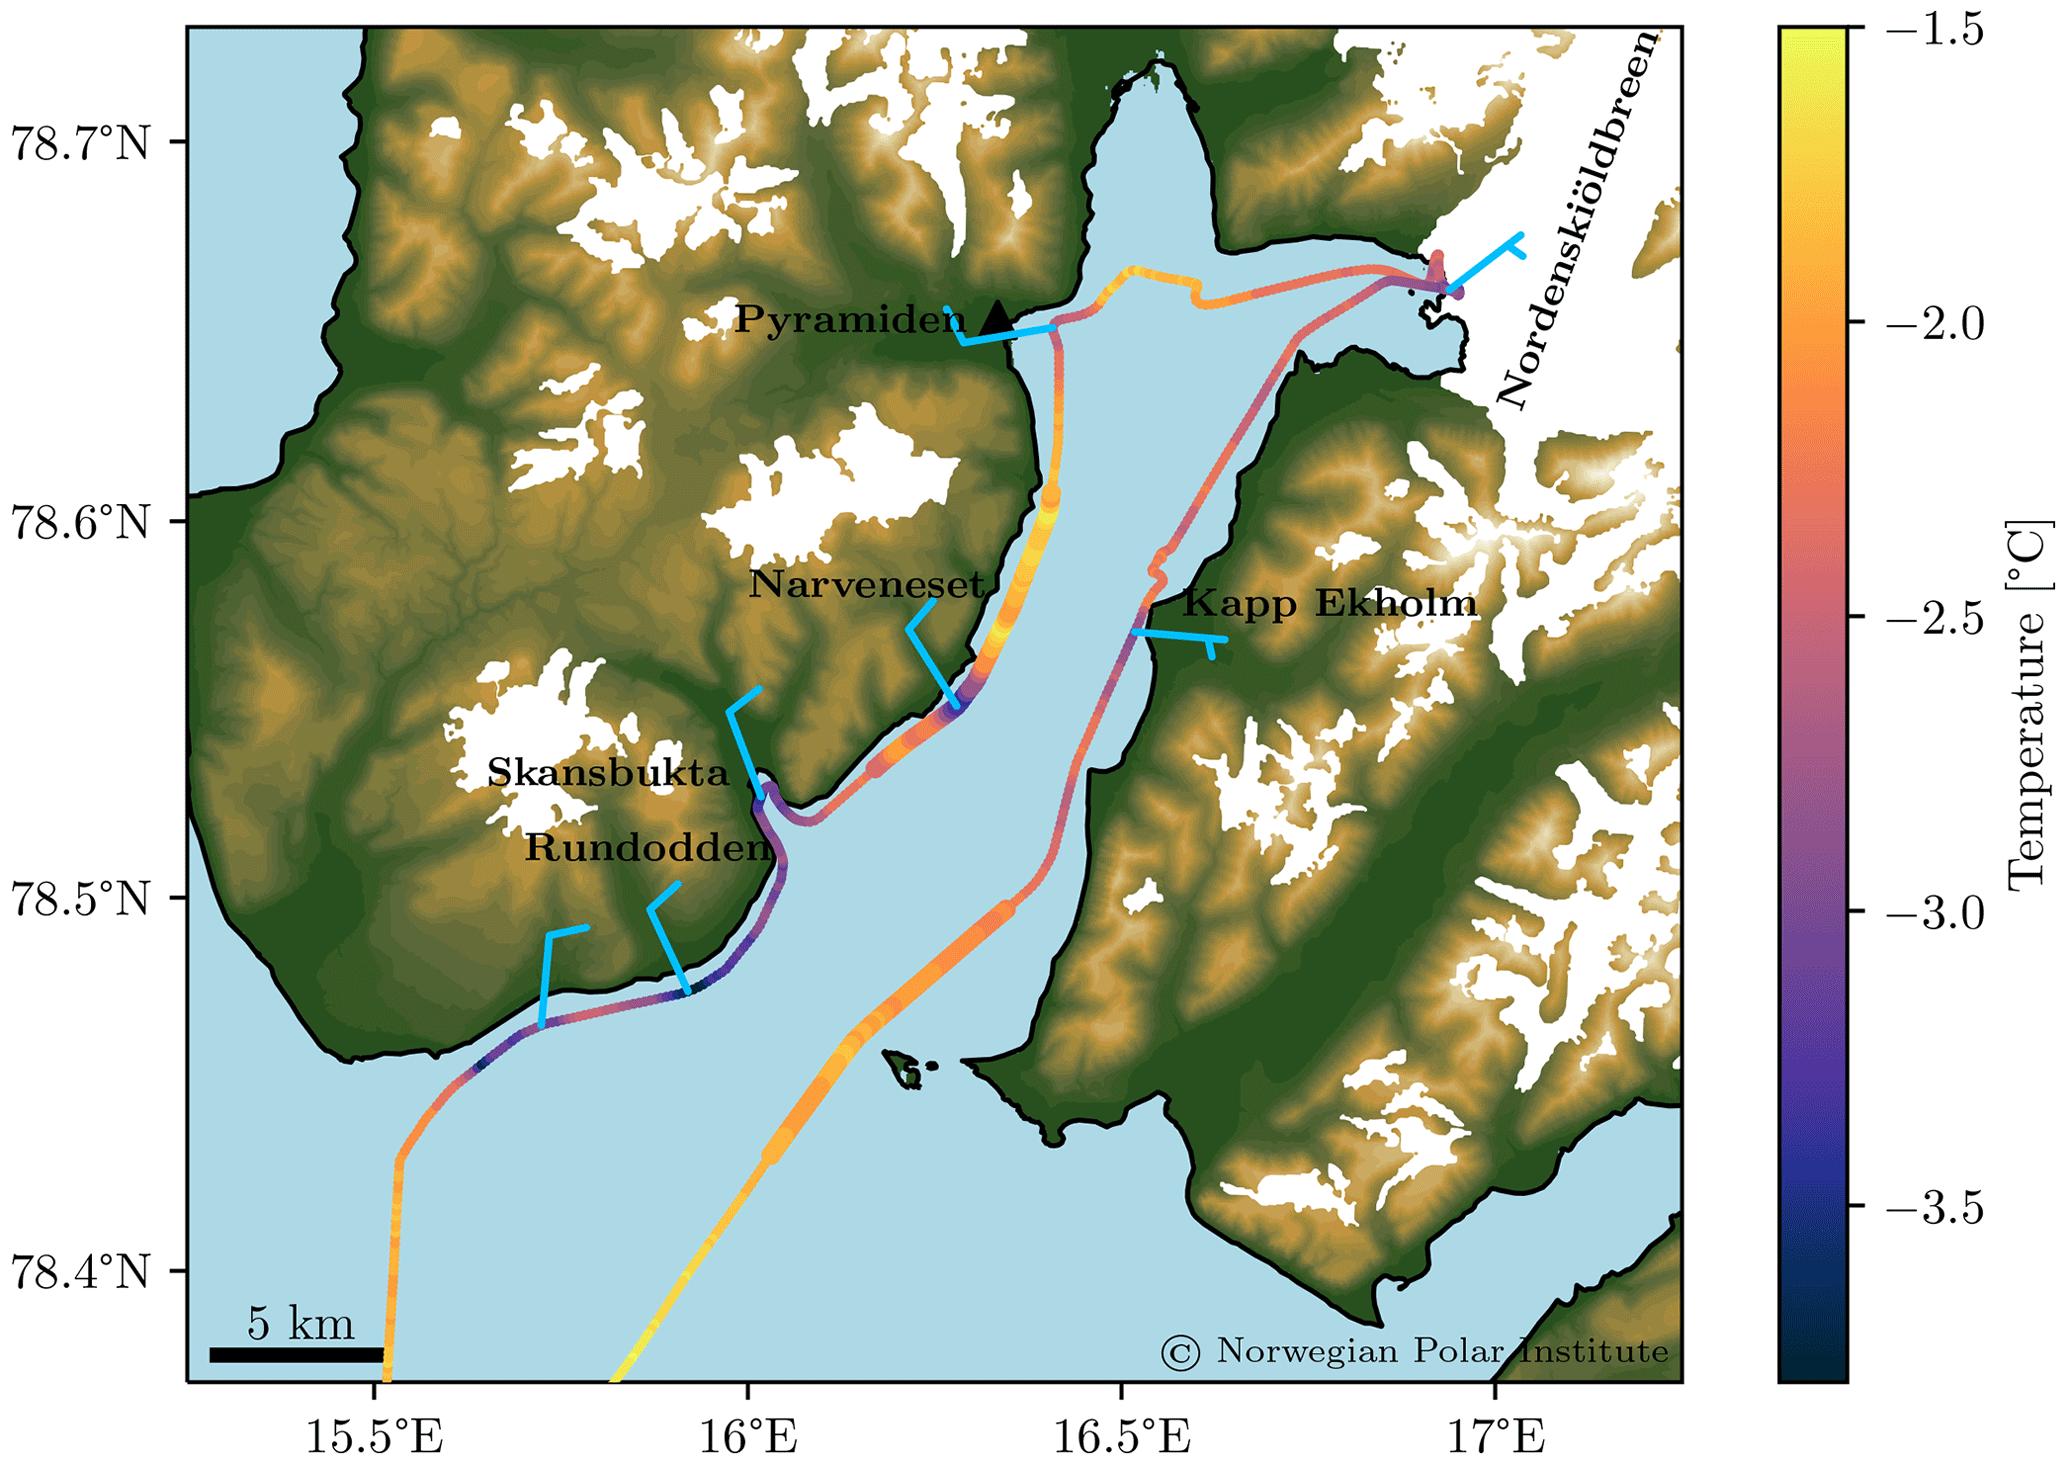
Figure 11Temperature (solid line, colored shading) and winds (wind barbs) over Isfjorden, as observed by the IWIN mobile weather station on MS Bard/Berg during the time 07:00–13:00 UTC on 20 October 2022. Those parts of the ship track presented with increased marker size correspond to the data comparison time series shown in Fig. 12.
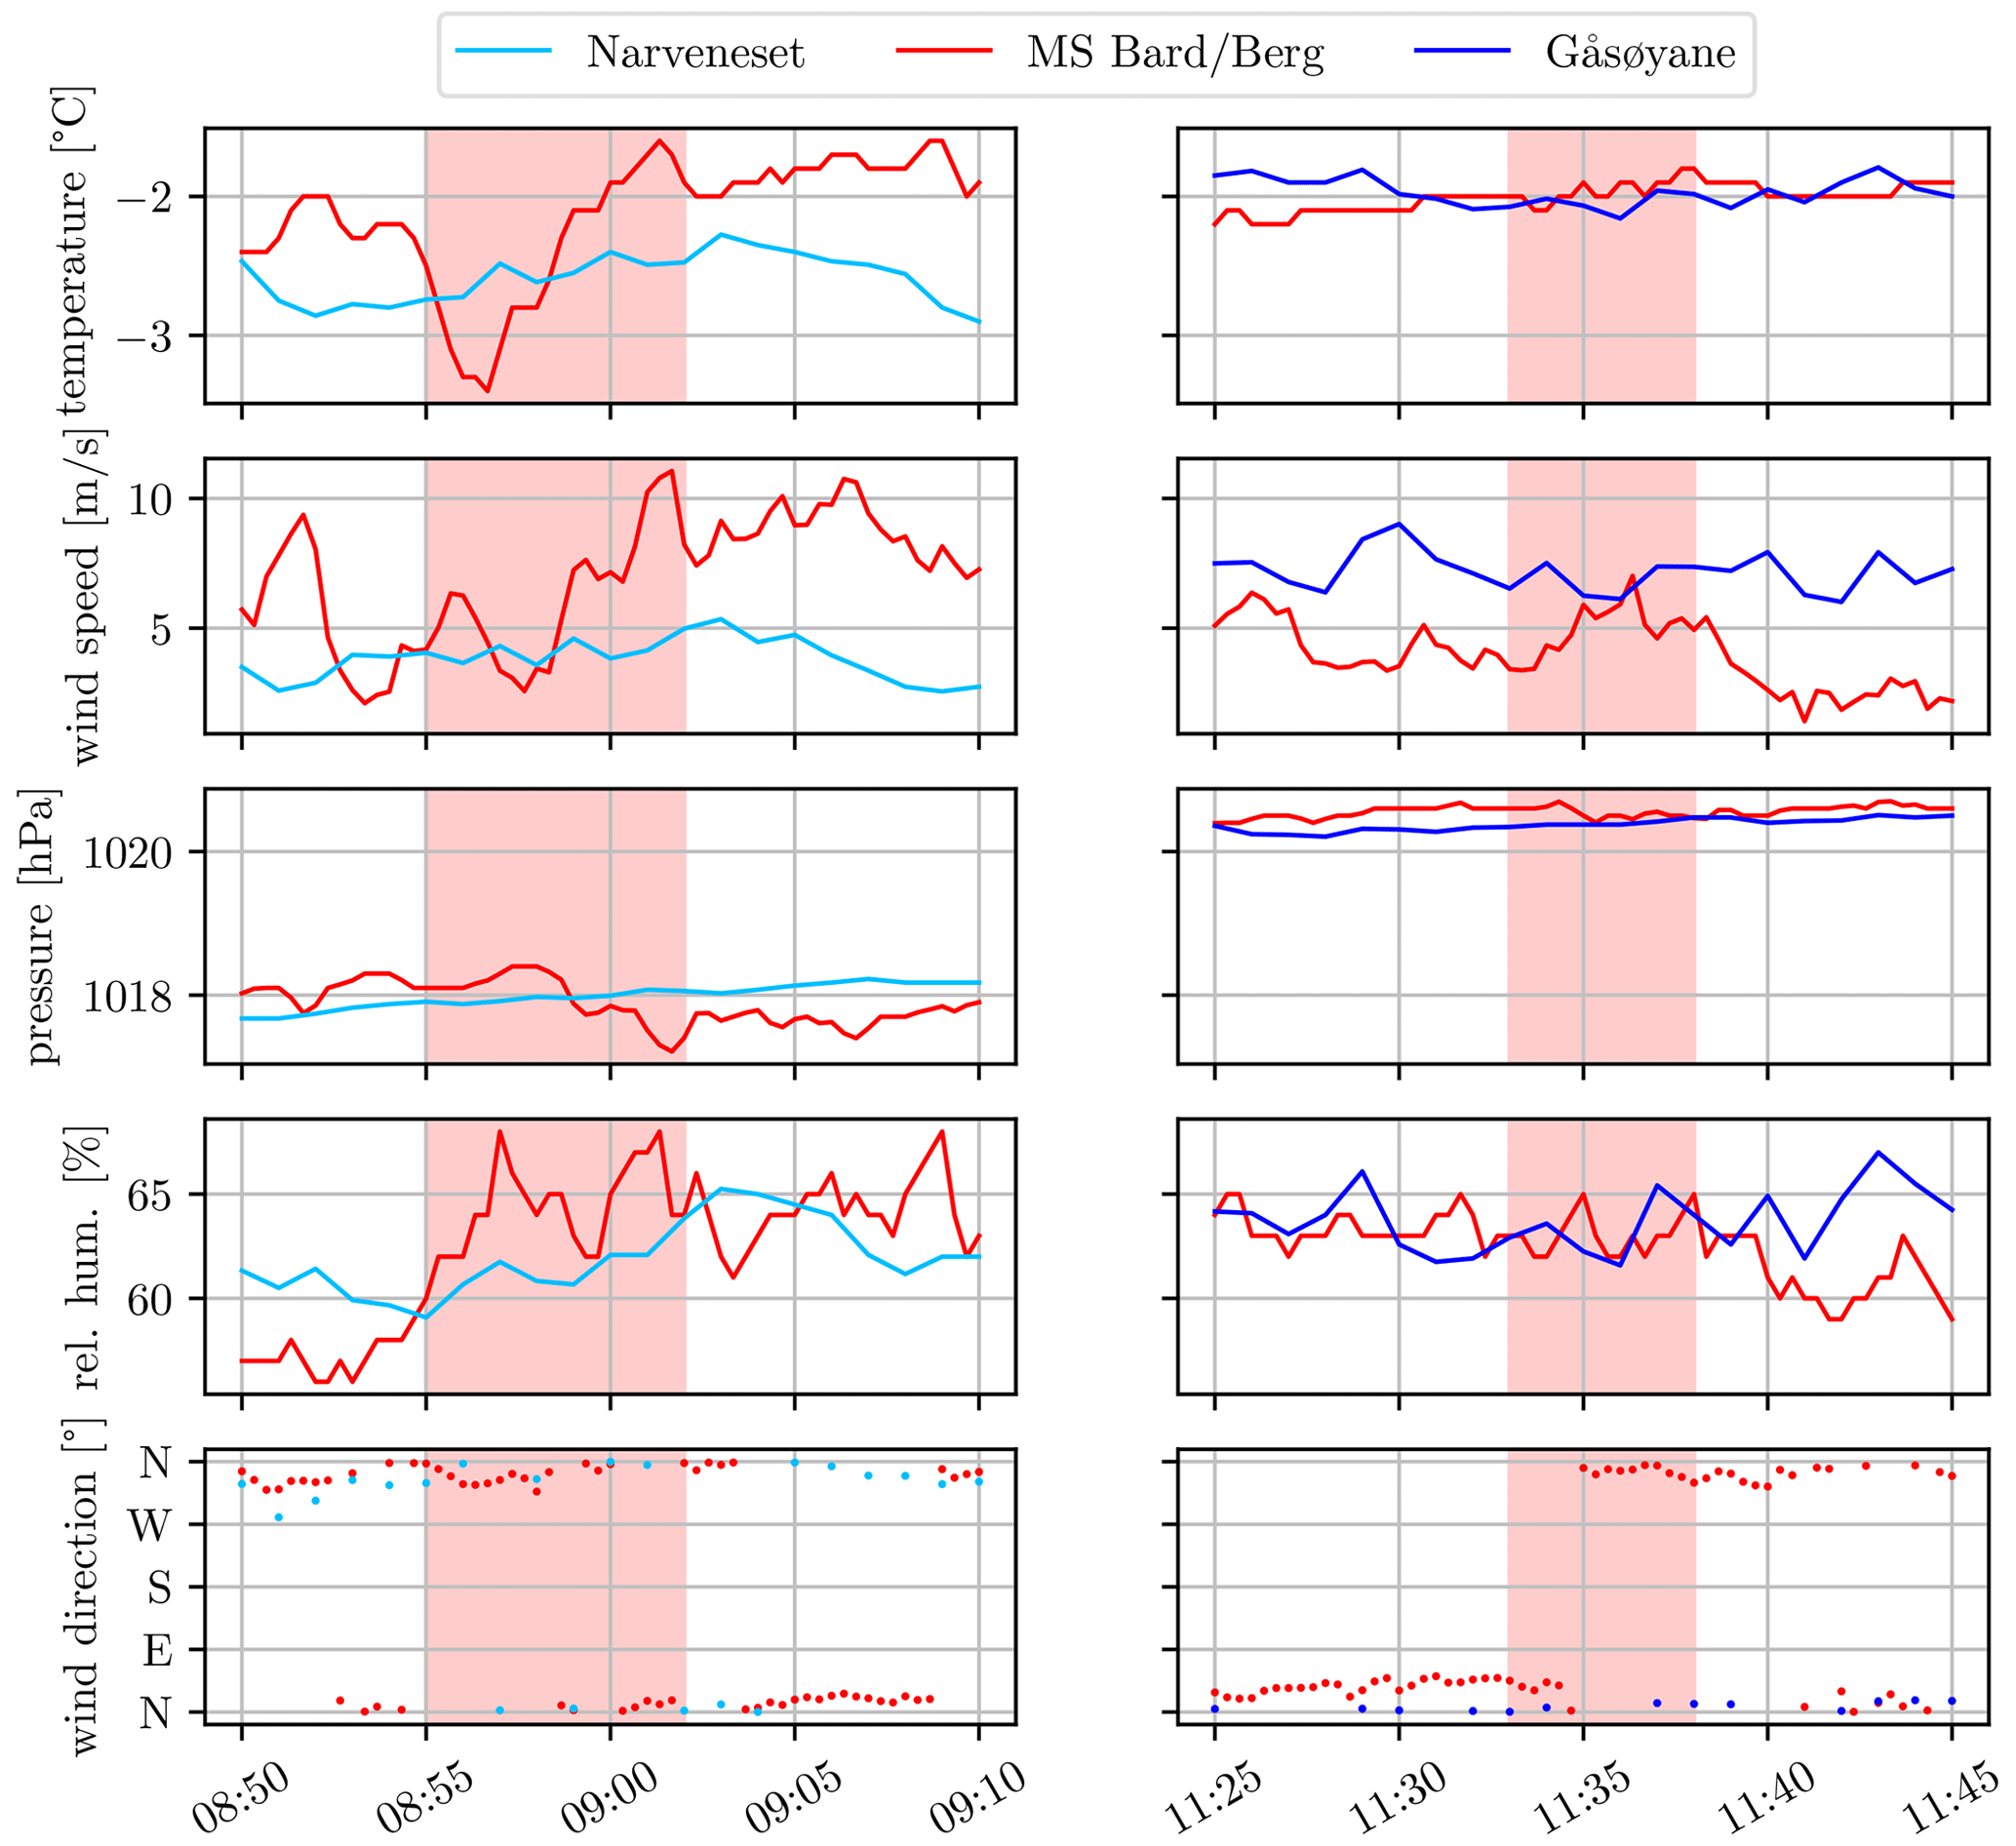
Figure 12Comparison of time series measured on board MS Bard/Berg and at the two lighthouses at Narveneset (left column) and Gåsøyane (right column) on 20 October 2022 for the time periods the ship passed by the respective lighthouse. The respective part of the ship track is indicated with an increased marker size in Fig. 11. The data that contributed to the calculation of the comparison statistics presented in Table 6 in Sect. 4 are highlighted with a light-red background color. Times indicated are in UTC.
The second example is from spring 2022, covering the period 4–6 April. The example demonstrates marine and terrestrial footprints on the air masses by the Bohemanneset lighthouse station, which is located right on the shoreline of Isfjorden and is therefore ideally situated to measure both types of air masses. During the days in question, Svalbard was situated under a weak to moderately strong easterly flow field, set up by a high-pressure system to the north and a low-pressure system to the south. However, locally at Bohemanneset (Fig. 13a), the wind direction varied, resulting in several large step changes in temperature and specific humidity. For instance, there was a marked drop in both temperature and specific humidity in the first few hours of 4 April by almost 8 K and 0.5 g kg−1, followed by an equally sharp increase just minutes later. These step changes coincide in time with a change in wind direction from NE to NW and back to NW. A closer look at the satellite picture in Fig. 13b reveals that air masses advected from the NE originated from over the open water (marine footprint), and air masses advected from the NW originated from the land (terrestrial footprint) at Bohemanneset. It stands to reason that the relatively warm and moist air mass characteristics over the fjord are related to the impact of the heat and moisture release from the fjord surface. In contrast, air masses advected from the terrestrial sector (NW) have been cooled and dried over land. The comparison of IWIN mobile station data with land-based station data from Svalbard Airport and Narveneset is likely impacted by corresponding effects from natural, spatial atmospheric variability.
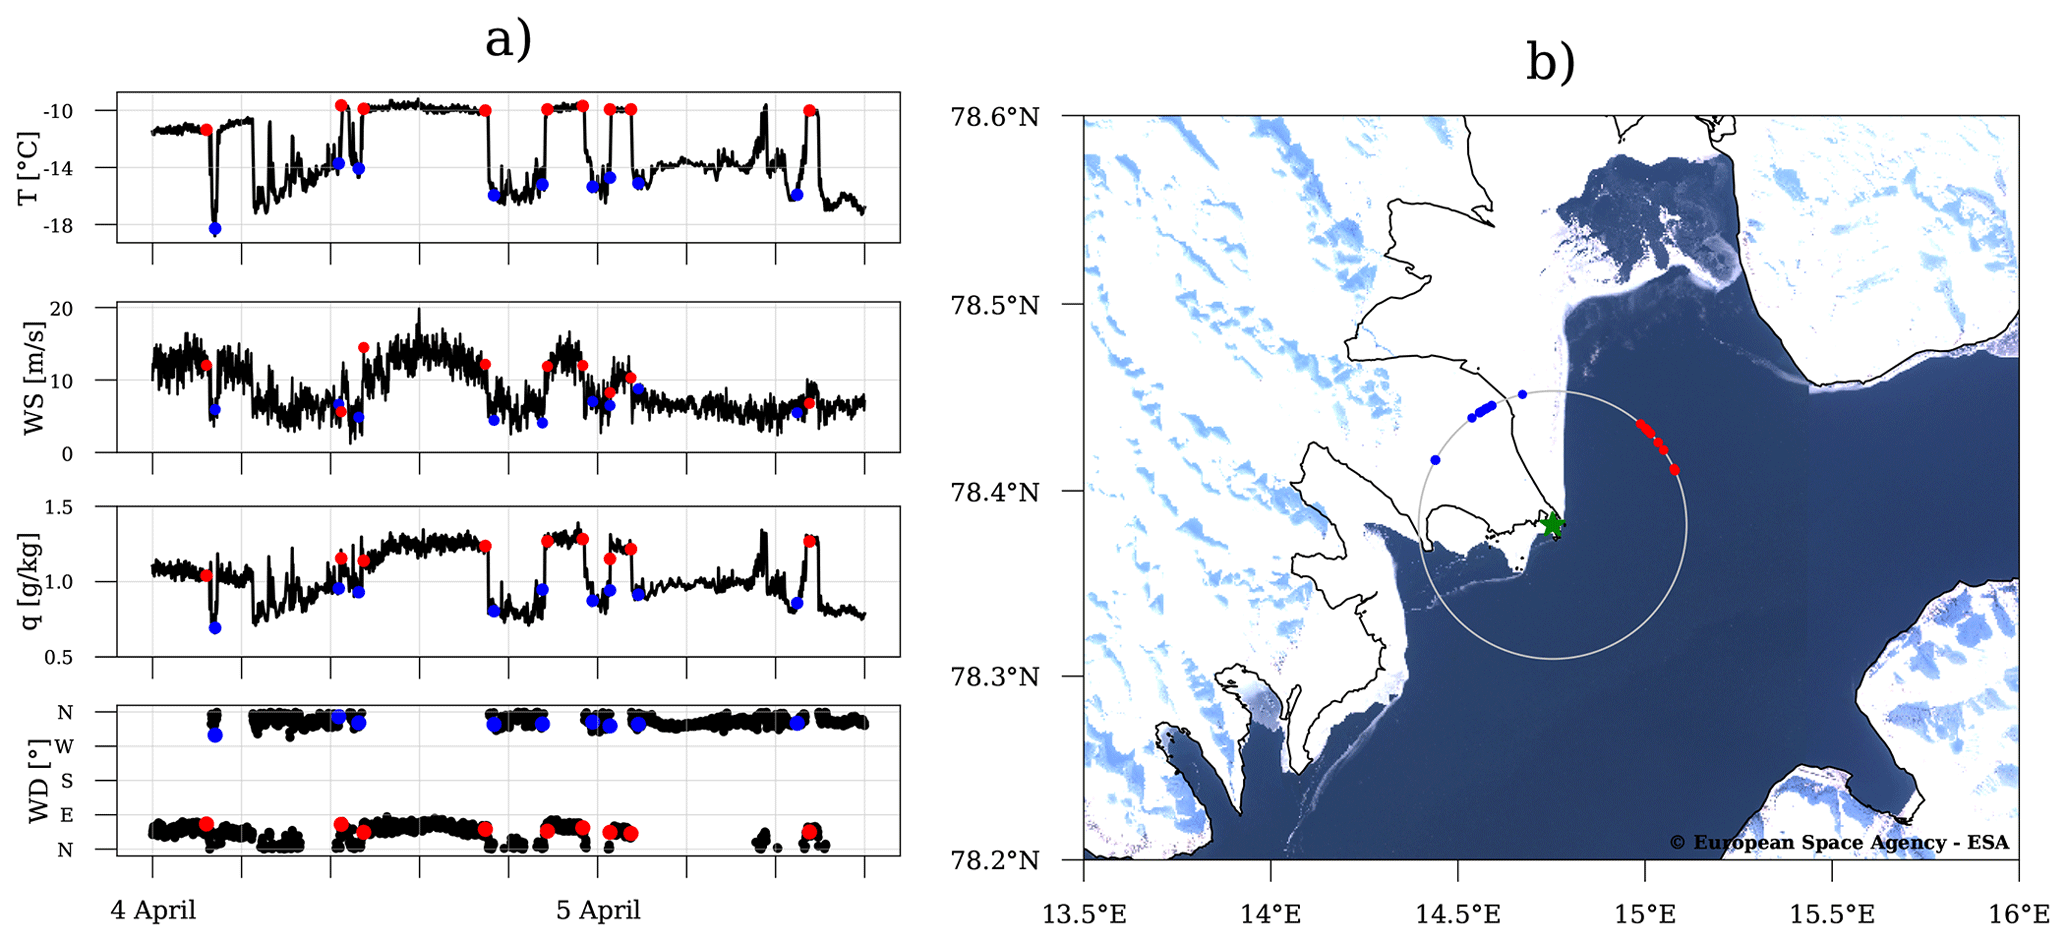
Figure 13(a) Example time series from the IWIN weather station at Bohemanneset from 4–6 April 2022 of temperature (T), wind speed (WS), specific humidity (q) and wind direction (WD) during a period when changes in WD induced step changes in the other three parameters. (b) True-color satellite image (composite of two Sentinel-2 overpasses on 5 and 11 April 2022, produced from European Space Agency (ESA) remote sensing data, downloaded from the Copernicus Hub, https://scihub.copernicus.eu/dhus/, last access: 19 September 2023) centered on the location of Bohemanneset (green star). The coast line is marked by a solid black line. Notable positive and negative step changes are indicated with, respectively, red and blue markers in both the time series of T and WD (a) and on the map with a circle centered on Bohemanneset (b).
IWIN is a new network of weather stations installed on lighthouses and ships in the Isfjorden region. The network is developed by UNIS with support from MET Norway and provides online, freely available and near-real-time in situ meteorological observations from large parts of the Isfjorden fjord system through MET Norway's data portals.
As a high-Arctic fjord system, Isfjorden has been subject to strong climate change during the last couple of decades. It has gone from being dominated by Arctic Water during winter to being more dominated by Atlantic Water. Among the consequences is a rapidly diminishing sea ice cover. Atmospheric forcing plays a key role in this regard, which has been documented by, among others, Cottier et al. (2007), Muckenhuber et al. (2016), Nilsen et al. (2016) and Skogseth et al. (2020). So far, these kinds of air–sea–ice studies have mainly relied on model and satellite data and sparsely available in situ atmospheric observations. IWIN helps fill an observational gap over Isfjorden, and it will thereby provide an important basis for future process studies of the importance of intra-fjord, local atmospheric forcing in this climatically important air–sea–ice interaction context (Stenlund, 2022). Indeed, the set of cases presented in this paper demonstrates the unprecedented (for the region) capabilities of IWIN to capture local- to meso-scale atmospheric phenomena. These phenomena include sharp contrasts in temperature and humidity between marine and terrestrial-based air masses, as evidenced by IWIN observations along the Isfjorden coast line. The observations also give insight into topographically induced wind phenomena during moderate to strong synoptic flow, such as channeling (fjord jet) and wake effects downstream of and along steep, coastal topography.
Furthermore, observations from IWIN address the need for improving our weather and climate prediction capabilities in the Arctic, which are not as good as at lower latitudes (Køltzow et al., 2021). IWIN does so by providing additional observations from an otherwise data-sparse region, both for better process-level understanding (and thereby model and parameterization development) and for data assimilation purposes. Indeed, a recent master study at UNIS applying the IWIN observations to an evaluation of the AROME-Arctic weather model, run operationally by MET Norway for the Svalbard region, revealed shortcomings (biases) in this system that likely would not have been detected otherwise (Schalamon, 2022). Also, IWIN will support the development and validation of new and ongoing efforts (see e.g., Valkonen et al., 2020) for building capacity for hectometric-scale numerical weather simulations for the Arctic.
The Arctic is seeing a rather sharp increase in human activity in the form of, among others, tourism, shipping and research activity. Svalbard, and in particular Isfjorden, is no exception. IWIN helps enhance the safety of such activity by providing online, freely accessible and near-real-time weather data from Isfjorden.
In summary, IWIN supports our needs for (a) better understanding and documenting local meteorological processes that are relevant for and related to the ongoing rapid climate change in Svalbard; (b) enhanced weather prediction capabilities through making unique in situ observations available for model validation and assimilation purposes; and (c) enhanced safety for the increasing human activity in the region in the form of, among others, tourism, research and search-and-rescue missions through the provision of data that are freely available online in near-real time.
The IWIN data product described here (data until June 2023) can be found at Zenodo (https://doi.org/10.5281/zenodo.8137588, Frank et al., 2023b). The complete IWIN data set is available from MET Norway's THREDDS server (https://thredds.met.no/thredds/unis-obs/unis-obs.html, Frank et al., 2023c), with the latest data becoming available in near-real time (approximately 5–10 min time lag). THREDDS is an open-source software solution for providing a way to publish and access scientific data in a distributed environment. It supports a wide range of remote data access, including OPeNDAP (Open-source Project for a Network Data Access Protocol).
Additionally, the full data set is registered at MET Norway's Arctic Data Centre (ADC, https://doi.org/10.21343/ebrw-w846, Frank et al., 2023a). The ADC offers additional functionality to access and download the data set as ASCII-formatted CSV text files, as well as direct visualization via a graphical user interface. This can be achieved by starting from https://adc.met.no/metsis/search?fulltext=IWIN and selecting the data set of interest via the “Child data” buttons in the “Data access” panels. In the end, the data sets can be downloaded or directly visualized using the respective buttons.
The data from MET Norway's reference surface weather stations in the Isfjorden region used for validation of the IWIN data set are also available from MET Norway's data portals (e.g., https://seklima.met.no, Dyrrdal et al., 2023).
The Python and MATLAB code used to process the data, produce the final data files and create the figures for this paper can be found at https://github.com/lfrankunis/Iwin (last access: 12 September 2023) and https://doi.org/10.5281/zenodo.8338313 (Frank and Jonassen, 2023).
In concert with the growing demand for in situ observations in the climate-sensitive region of Svalbard, IWIN is under continuous development. Funding has already been granted for one additional lighthouse station (which will be installed at Kapp Thordsen – 78.45632∘ N, 15.46768∘ E – during summer 2023) and one more mobile station. This fourth mobile station will be mounted on board the UNIS RV Hanna Resvoll. In addition to the standard meteorological variables T, Q, WS, WD and p, it will also provide measurements of photosynthetically active radiation (PAR), which is critical for primary production both over the sea and on land. Depending on the scientific needs of the researchers using the ship, RV Hanna Resvoll will travel into parts of the fjord system not visited by the tourist cruise ships. In that way, the observations from the new station will nicely complement those from the established stations presented in this paper.
Besides the expansion of IWIN by adding more stations, we continuously work towards assuring the highest-possible data quality, especially for the correction of the wind measurements from the mobile stations. One example of this is the efforts that are currently underway to include satellite compasses in the mobile station setups. These will give highly accurate estimates of the ships' motions and headings at any time and will allow for more sophisticated wind measurement corrections, even when the ships are not moving or are only moving slowly.
LF was responsible for the publication of the data set, including the processing of the raw data into netCDF files and the data transfer to MET Norway. LF is also the corresponding author of this paper. MOJ was the main person responsible for the funding acquisition and also contributed with data analysis and the writing of this paper. TR was responsible for the organization of the data at MET Norway's servers. FRS and AS contributed with written text and figures in Sects. 2 and 5.
The contact author has declared that none of the authors has any competing interests.
Publisher's note: Copernicus Publications remains neutral with regard to jurisdictional claims in published maps and institutional affiliations.
Stefan Claes provided invaluable help with the installation of, especially, the lighthouse stations and the coordination with Kystverket, which gladly allowed us to use the lighthouses as platforms and power sources. Special thanks is given to Henningsen Transport and Guiding, Polarcharter, Hurtigruten, and Brim Explorer, including their respective crews on board the ships, for providing us with the mobile measurement platforms. Thanks is also given to Charlotte Gausa for her help with the installation of the stations and with the maintenance work.
IWIN has been financially supported by a number of different institutions and projects, including UNIS, MET Norway, Alertness (project no. NFR-280573), N-FORCES (project no. NFR-337229) and the Jan Christensen foundation.
This paper was edited by David Carlson and reviewed by two anonymous referees.
Bromwich, D. H., Wilson, A. B., Bai, L.-S., Moore, G. W., and Bauer, P.: A comparison of the regional Arctic System Reanalysis and the global ERA-Interim Reanalysis for the Arctic, Q. J. Roy. Meteor. Soc., 142, 644–658, 2016. a
Cottier, F., Nilsen, F., Enall, M. E., Gerland, S., Tverberg, V., and Svendsen, H.: Wintertime warming of an Arctic shelf in response to large-scale atmospheric circulation, Geophys. Res. Lett., 34, 10607, https://doi.org/10.1029/2007GL029948, 2007. a, b
Dahlke, S., Hughes, N. E., Wagner, P. M., Gerland, S., Wawrzyniak, T., Ivanov, B., and Maturilli, M.: The observed recent surface air temperature development across Svalbard and concurring footprints in local sea ice cover, Int. J. Climatol., 40, 5246–5265, https://doi.org/10.1002/joc.6517, 2020. a
Descamps, S., Aars, J., Fuglei, E., Kovacs, K. M., Lydersen, C., Pavlova, O., Pedersen, A., Ravolainen, V., and Strøm, H.: Climate change impacts on wildlife in a High Arctic archipelago–Svalbard, Norway, Glob. Change Biol., 23, 490–502, 2017. a
Dyrrdal, A. V., Nilsen, I. B., Mayer, S., and Hygen, H. O.: Norsk Klima Service Senter, https://seklima.met.no/, last access: 12 September 2023. a
Esau, I. and Repina, I.: Wind climate in kongsfjorden, svalbard, and attribution of leading wind driving mechanisms through turbulence-resolving simulations, Adv. Meteorol., 2012, 568454, https://doi.org/10.1155/2012/568454, 2012. a
Frank, L. and Jonassen, M. O.: Iwin, Zenodo [code] https://doi.org/10.5281/zenodo.8338313, 2023. a
Frank, L., Jonassen, M. O., and Remes, T.: IWIN: The Isfjorden Weather Information Network, Norwegian Meteorological Institute/Arctic Data Centre [data set], https://doi.org/10.21343/ebrw-w846, 2023a. a, b, c, d
Frank, L., Jonassen, M. O., and Remes, T.: IWIN: The Isfjorden Weather Information Network (August 2021–June 2023), Zenodo [data set], https://doi.org/10.5281/zenodo.8137588, 2023b. a, b
Frank, L., Jonassen, M. O., and Remes, T.: IWIN: The Isfjorden Weather Information Network, Norwegian Meteorological Institute [data set], https://thredds.met.no/thredds/unis-obs/unis-obs.html, (last access: 12 September 2023), 2023. a
Gjelten, H. M., Nordli, O., Isaksen, K., Førland, E. J., Sviashchennikov, P. N., Wyszynski, P., Prokhorova, U. V., Przybylak, R., Ivanov, B. V., and Urazgildeeva, A. V.: Air temperature variations and gradients along the coast and fjords of western Spitsbergen, Polar Res., 35, 29878, https://doi.org/10.3402/polar.v35.29878, 2016. a
Hanssen-Bauer, I., Førland, E., Hisdal, H., Mayer, S., Sandø, A., Sorteberg, A., Adakudlu, M., Andresen, J., Bakke, J., Beldring, S., Benestad, R., van der Bilt, W., Bogen, J., Borstad, C., Breili, K., Breivik, O., Børsheim, K., Christiansen, H., Dobler, A., and Wong, W.: Climate in Svalbard 2100 - A knowledge base for climate adaptation, NCSS report, https://doi.org/10.13140/RG.2.2.10183.75687, 2019. a
Isaksen, K., Nordli, O., Ivanov, B., Køltzow, M., Aaboe, S., Gjelten, H. M., Mezghani, A., Eastwood, S., Førland, E., Benestad, R. E., Hanssen-Bauer, I., Brækkan, R., Sviashchennikov, P. N., Demin, V., Revina, A., and Karandasheva, T.: Exceptional warming over the Barents area, Sci. Rep., 12, 1–18, 2022. a
Jackson, P. L. and Steyn, D. G.: Gap Winds in a Fjord. Part II: Hydraulic Analog, Mon. Weather Rev., 122, 2666–2676, 1994. a
Jung, T., Gordon, N. D., Bauer, P., Bromwich, D. H., Chevallier, M., Day, J. J., Dawson, J., Doblas-Reyes, F., Fairall, C., Goessling, H. F., Holland, M., Inoue, J., Iversen, T., Klebe, S., Lemke, P., Losch, M., Makshtas, A., Mills, B., Nurmi, P., Perovich, D., Reid, P., Renfrew, I. A., Smith, G., Svensson, G., Tolstykh, M., and Yang, Q.: Advancing polar prediction capabilities on daily to seasonal time scales, B. Am. Meteorol. Soc., 97, 1631–1647, 2016. a
Køltzow, M., Casati, B., Bazile, E., Haiden, T., and Valkonen, T.: An NWP model intercomparison of surface weather parameters in the European Arctic during the year of polar prediction special observing period Northern Hemisphere 1, Weather Forecast., 34, 959–983, 2019. a
Køltzow, M., Grote, R., and Singleton, A.: On the configuration of a regional Arctic Numerical Weather Prediction system to maximize predictive capacity, Tellus A, 73, 1–18, 2021. a
Muckenhuber, S., Nilsen, F., Korosov, A., and Sandven, S.: Sea ice cover in Isfjorden and Hornsund, Svalbard (2000–2014) from remote sensing data, The Cryosphere, 10, 149–158, https://doi.org/10.5194/tc-10-149-2016, 2016. a, b
Müller, M., Batrak, Y., Kristiansen, J., Køltzow, M., Noer, G., and Korosov, A.: Characteristics of a convective-scale weather forecasting system for the European Arctic, Mon. Weather Rev., 145, 4771–4787, 2017. a
Müller, M., Kelder, T., and Palerme, C.: Decline of sea-ice in the Greenland Sea intensifies extreme precipitation over Svalbard, Weather Climate Extremes, 36, 100437, https://doi.org/10.1016/j.wace.2022.100437, 2022. a
Nilsen, F., Skogseth, R., Vaardal-Lunde, J., and Inall, M.: A simple shelf circulation model: Intrusion of Atlantic water on the West Spitsbergen Shelf, J. Phys. Oceanogr., 46, 1209–1230, https://doi.org/10.1175/JPO-D-15-0058.1, 2016. a, b
Peeters, B., Pedersen, A. O., Loe, L. E., Isaksen, K., Veiberg, V., Stien, A., Kohler, J., Gallet, J.-C., Aanes, R., and Hansen, B. B.: Spatiotemporal patterns of rain-on-snow and basal ice in high Arctic Svalbard: detection of a climate-cryosphere regime shift, Environ. Res. Lett., 14, 015002, https://doi.org/10.1088/1748-9326/aaefb3, 2019. a
Rantanen, M., Karpechko, A. Y., Lipponen, A., Nordling, K., Hyvärinen, O., Ruosteenoja, K., Vihma, T., and Laaksonen, A.: The Arctic has warmed nearly four times faster than the globe since 1979, Comm. Earth Environ., 3, 1–10, 2022. a
Reen, S. V.: CFD Simulation of the Air Flow Field around a Ship, Master's thesis, Aalto University, Norwegian University of Science and Technology, Aalto, Trondheim, http://urn.fi/URN:NBN:fi:aalto-202212187036 (last access: 19 September 2023), 2022. a
Schalamon, F.: Evaluation of the AROME Arctic Model Based on Mobile Observations in Isfjorden, Svalbard, Master's thesis, Johannes Gutenberg University, Mainz, https://bibsys-almaprimo.hosted.exlibrisgroup.com/permalink/f/khgud4/BIBSYS_ILS71659707010002201 (last access: 19 September 2023), 2022. a
Schuler, T. V., Kohler, J., Elagina, N., Hagen, J. O. M., Hodson, A. J., Jania, J. A., Kääb, A. M., Luks, B., Malecki, J., Moholdt, G., Pohjola, V. A., Sobota, I., and van Pelt, W. J. J.:Reconciling Svalbard glacier mass balance, Front. Earth Sci., 8, 156, https://doi.org/10.3389/feart.2020.00156, 2020. a
Skeie, P. and Gronas, S.: Strongly stratified easterly flows across Spitsbergen, Tellus A, 52, 473–486, https://doi.org/10.3402/tellusa.v52i5.12281, 2000. a
Skogseth, R., Olivier, L. L. A., Nilsen, F., Falck, E., Fraser, N., Tverberg, V., Ledang, A. B., Vader, A., Jonassen, M. O., Søreide, J., Cottier, F., Berge, J., Ivanov, B. V., and Falk-Petersen, S.: Variability and decadal trends in the Isfjorden (Svalbard) ocean climate and circulation – An indicator for climate change in the European Arctic, Prog. Oceanogr., 187, 102394, https://doi.org/10.1016/j.pocean.2020.102394, 2020. a, b
Stenlund, A.: A Statistical Overview of the Spatial Atmospheric Variability Over Isfjorden, Svalbard, Master's thesis, Uppsala University, Uppsala, https://urn.kb.se/resolve?urn=urn:nbn:se:uu:diva-488105 (last access: 19 September 2023), 2022. a
Valkonen, T., Stoll, P., Batrak, Y., Køltzow, M., Schneider, T. M., Stigter, E. E., Aashamar, O. B., Støylen, E., and Jonassen, M. O.: Evaluation of a sub-kilometre NWP system in an Arctic fjord-valley system in winter, Tellus A, 72, 1–21, 2020. a, b
Walczowski, W. and Piechura, J.: Influence of the West Spitsbergen Current on the local climate, Int. J. Climatol., 31, 1088–1093, https://doi.org/10.1002/joc.2338, 2011. a
Wickström, S., Jonassen, M., Cassano, J., and Vihma, T.: Present Temperature, Precipitation, and Rain-on-Snow Climate in Svalbard, J. Geophys. Res.-Atmos., 125, 032155, https://doi.org/10.1029/2019JD032155, 2020. a
Prior to May 2022, T, RH and p from the mobile stations and T from the lighthouse station at BHN were sampled as instantaneous values at the end of each averaging interval. This was changed to the above-described averaging procedure in order to unify the IWIN data set.
- Abstract
- Introduction
- Weather station network
- Data processing and storage
- Measurement evaluation and remaining uncertainties
- Natural atmospheric variability: examples of observed weather phenomena and linkages to the evaluation of the IWIN data
- Summary
- Code and data availability
- Outlook
- Author contributions
- Competing interests
- Disclaimer
- Acknowledgements
- Financial support
- Review statement
- References