the Creative Commons Attribution 4.0 License.
the Creative Commons Attribution 4.0 License.
 | 11 Sep 2023
Refined fine-scale mapping of tree cover using time series of Planet-NICFI and Sentinel-1 imagery for Southeast Asia (2016–2021)
Feng Yang
Zhenzhong Zeng
High-resolution mapping of tree cover is indispensable for effectively addressing tropical forest carbon loss, climate warming, biodiversity conservation and sustainable development. However, the availability of precise, high-resolution tree cover map products remains inadequate due to the inherent limitations of mapping techniques utilizing medium- to coarse-resolution satellite imagery, such as Landsat and Sentinel-2 imagery. In this study, we have generated an annual tree cover map product at a resolution of 4.77 m for Southeast Asia (SEA) for the years 2016–2021 by integrating Norway's International Climate and Forests Initiative imagery from Planet (hereafter Planet-NICFI) and Sentinel-1 synthetic aperture radar data. We have also collected annual tree cover/non-tree cover samples to assess the accuracy of our Planet-NICFI tree cover map product. The results show that our Planet-NICFI tree cover map product for 2016–2021 achieves high accuracy, with an overall accuracy of ≥0.867 ± 0.017 and a mean F1 score of 0.921. Furthermore, our tree cover map product exhibits high temporal consistency from 2016 to 2021. Compared with existing map products (e.g., Finer Resolution Observation and Monitoring of Global Land Cover 10 m, FROM-GLC10, and European Space Agency WorldCover 2020 and 2021), our tree cover map product exhibits better performance, both statistically and visually. However, the imagery obtained from Planet-NICFI does not perform as well with respect to mapping tree cover in areas with diverse vegetation or complex landscapes due to insufficient spectral information. Nevertheless, we highlight the capability of Planet-NICFI imagery to provide quick and fine-scale tree cover mapping to a large extent. The consistent characterization of tree cover dynamics in SEA's tropical forests can be further applied in various disciplines. Our data from 2016 to 2021 at a 4.77 m resolution are publicly available at https://doi.org/10.57760/sciencedb.07173 (Yang and Zeng, 2023).
- Article
(10487 KB) - Full-text XML
- BibTeX
- EndNote


Forests and tree-based systems outside of forests play a crucial role in land-based carbon emission or removal, making them essential to support and monitor the implementation of the Reducing Emissions from Deforestation and Forest Degradation (REDD+) and other land-based activities under the Paris Agreement (Shukla et al., 2022; CoP26, 2021; FAO, 2020). However, current forest cover map products exhibit large errors with respect to accurately estimating forest area and change, particularly in areas comprising trees outside of forests and forest edge landscapes (Mugabowindekwe et al., 2023; Reiner et al., 2023; Brandt et al., 2020). As a result, there is a growing demand for timely, high-quality and high-resolution tree cover map products to accurately capture the dynamics and changes in forest cover.
Many tree cover map products have been developed at medium to coarse resolutions (10–500 m), such as Finer Resolution Observation and Monitoring of Global Land Cover 10 m (FROM-GLC10; Gong et al., 2019), Environmental Systems Research Institute (Esri) Land Cover (2017–2021) (Karra et al., 2021), European Space Agency (ESA) WorldCover 2020 and 2021 (Zanaga et al., 2022, 2021), Global Forest Change (GFC; Hansen et al., 2013), Globeland30 (Chen et al., 2015), Copernicus Global Land Service (CGLS) land cover (Buchhorn et al., 2020), ESA Climate Change Initiative (CCI; ESA, 2017), and the National Aeronautics and Space Administration (NASA) MCD12Q1 (Friedl and Sulla-Menashe, 2019). However, accurate high-resolution tree cover map products at continental to global scales are still lacking due to mapping through medium- to coarse-resolution imagery (Zanaga et al., 2021; Hansen et al., 2010). Consequently, some uncertainties occur in acquiring global tree inventories and monitoring forest disturbances (deforestation and forest degradation). This is mainly due to isolated trees or long, narrow forest cover removal (Reiner et al., 2023; Wagner et al., 2023; Sexton et al., 2016; Hammer et al., 2014; Hsieh et al., 2001).
Only recently have two tree cover map products at <4.77 m been produced over Africa and the state of Mato Grosso in Brazil using Norway's International Climate and Forests Initiative imagery from Planet (hereafter Planet-NICFI) based on deep learning algorithms (Reiner et al., 2023; Wagner et al., 2023). However, these two maps only have limited temporal or spatial coverage. Since the early 21st century, agricultural expansion has created a new wave of drastic land use/land cover changes in Southeast Asia (SEA), leading the region to be one of the most deforested regions worldwide (Zeng et al., 2018a, b; Achard et al., 2014). Average elevations and slopes of forest-loss sites have significantly increased in SEA, particularly in the 2010s, and geometrically irregular upland land use sites commonly occur (Velasco et al., 2022; Yang et al., 2021). However, existing tree cover map products have underestimated deforestation (by 25 %–116 %) and upland agricultural expansion rates (by 9 %–113 %), especially on the topographic boundaries in SEA (Zeng et al., 2018a). Thus, fine-resolution tree cover map products in SEA, with high spatial resolution and longer consistent time series, are urgently needed to accurately monitor tree cover loss and related illegal deforestation. In addition, combining high-resolution optical imagery and synthetic aperture radar (SAR) data (e.g., Sentinel-1 data) to produce large-area tree cover map products is still in its early stage (Zanaga et al., 2022, 2021; Karra et al., 2021; Buchhorn et al., 2020; Hansen et at., 2010).
Concurrently, advances in large-scale cloud computing (e.g., Google Earth Engine, GEE; Gorelick et al., 2017) and available high-resolution satellite imagery (Roy et al., 2021) can facilitate the development of high-resolution and longer-time-series tree cover map products at continental to global scales. In this paper, we generated a state-of-the-art, fine-scale, open-source tree cover map product for SEA during 2016–2021 using Planet-NICFI imagery, Sentinel-1 SAR data and the random forest (RF) method from a previous study (Yang et al., 2023). This dataset allows for extensive assessments of forest dynamics' change, such as deforestation, forest degradation and reforestation. In addition, our dataset can monitor trees outside of forests and long, narrow forest cover removal, thereby improving the accuracy of automated continental tree inventories, which helps optimize REDD+ under the Paris Agreement.
2.1 Satellite imagery
We utilized Planet-NICFI and Sentinel-1 imagery for the years 2016–2021 to generate a time series of the tree cover map product for SEA. The Planet-NICFI program provides high-resolution (4.77 m per pixel) optical PlanetScope surface reflectance mosaics specifically designed for the tropics. These mosaics offer accurate and reliable spatial data with minimized effects from the atmosphere and sensor characteristics, making them an ideal “ground truth” representation (Planet Team, 2017). The mosaics cover the best imagery to represent every part of the coverage area during leaf-on periods from June to November based on cloud cover and acutance (image sharpness). The Planet-NICFI imagery consists of four bands (red, green, blue and near-infrared) and covers a time period from 2015 to 2020 at a biannual resolution for the archive and a time period from 2020 to 2023 at a monthly resolution for monitoring purposes. We accessed and utilized these products in the GEE platform by linking the GEE account to our NICFI account.
We utilized Sentinel-1 on the GEE platform, specifically the 10 m resolution dual-polarization Ground Range Detected (GRD) scenes (vertical–vertical, VV, and vertical–horizontal, VH). We chose Sentinel-1 SAR imagery to correct cases of overestimation caused by confusion with herbaceous vegetation or cases of underestimation due to optical satellite observations omitting deciduous or semi-deciduous characteristics (Shimada et al., 2014). The SAR imagery, available every 12 d for a single satellite or 6 d for a dual-satellite constellation from October 2014 to the present, was preprocessed with the Sentinel-1 Toolbox for thermal noise removal, radiometric calibration and terrain correction.
2.2 Validation dataset collection
We collected validation datasets to assess the tree cover map product during the period from 2016 to 2021, except for 2019 which has been provided by Yang et al. (2023). Our mapping approach has been comprehensively assessed since its development in 2019 (Yang et al., 2023). However, despite the advancements in the land cover/land use change (LCLUC) community, a notable gap remains with respect to the absence of publicly available high-resolution (e.g., ≤10 m) tree cover/non-tree cover labels. The existing coarse-resolution labels for tree cover/non-tree cover can introduce considerable uncertainties when evaluating high-resolution tree cover maps. As a result, our ability to delve deeper into the accuracy of a time series of the tree cover map datasets was hindered.
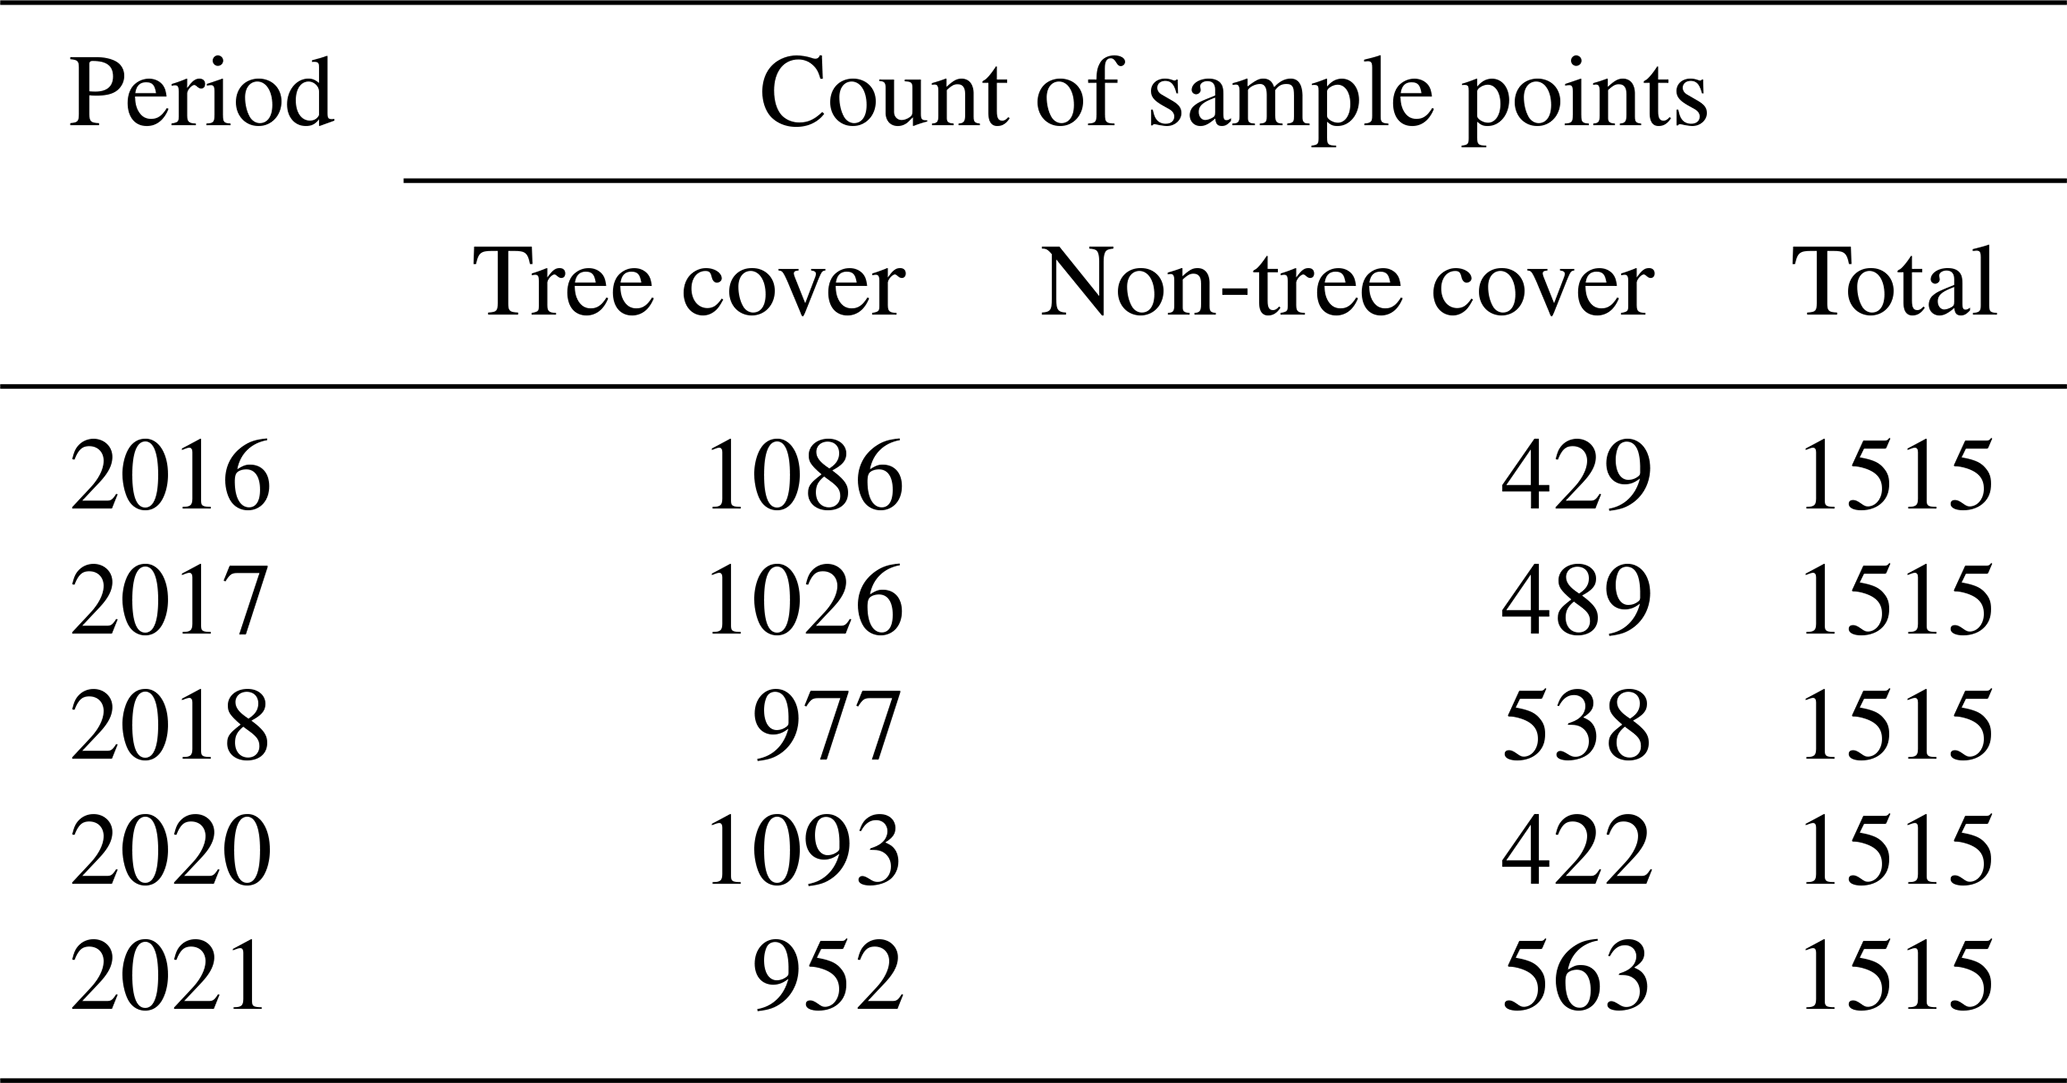
Following the methodology established by Yang et al. (2023), we undertook a rigorous process to generate a robust validation dataset for our study. Firstly, we randomly generated 1515 points to ensure a representative sample of collected visual data, as illustrated in Fig. 1. Next, to classify these points as trees or not trees, we enlisted four human interpreters and employed Planet Explorer within QGIS. Our approach involved visually identifying tree cover/non-tree cover pixels in the true-color composite of Planet-NICFI imagery where the points were located. To ensure accuracy, we superimposed the 10 m tree height data, previously developed by Lang et al. (2022), onto the Planet-NICFI imagery. This step ensured that the labels adhered to the specified tree height criteria (i.e., ≥5 m). Subsequently, we thoroughly evaluated and refined the labels using Google Earth. To make tree cover/non-tree cover labels, we maintained the geographic location of the 1515 points and changed the year of the Planet-NICFI imagery. The resulting labels encompassed data from the years 2016, 2017, 2018, 2020 and 2021. Detailed information about the validation dataset is presented in Table 1.
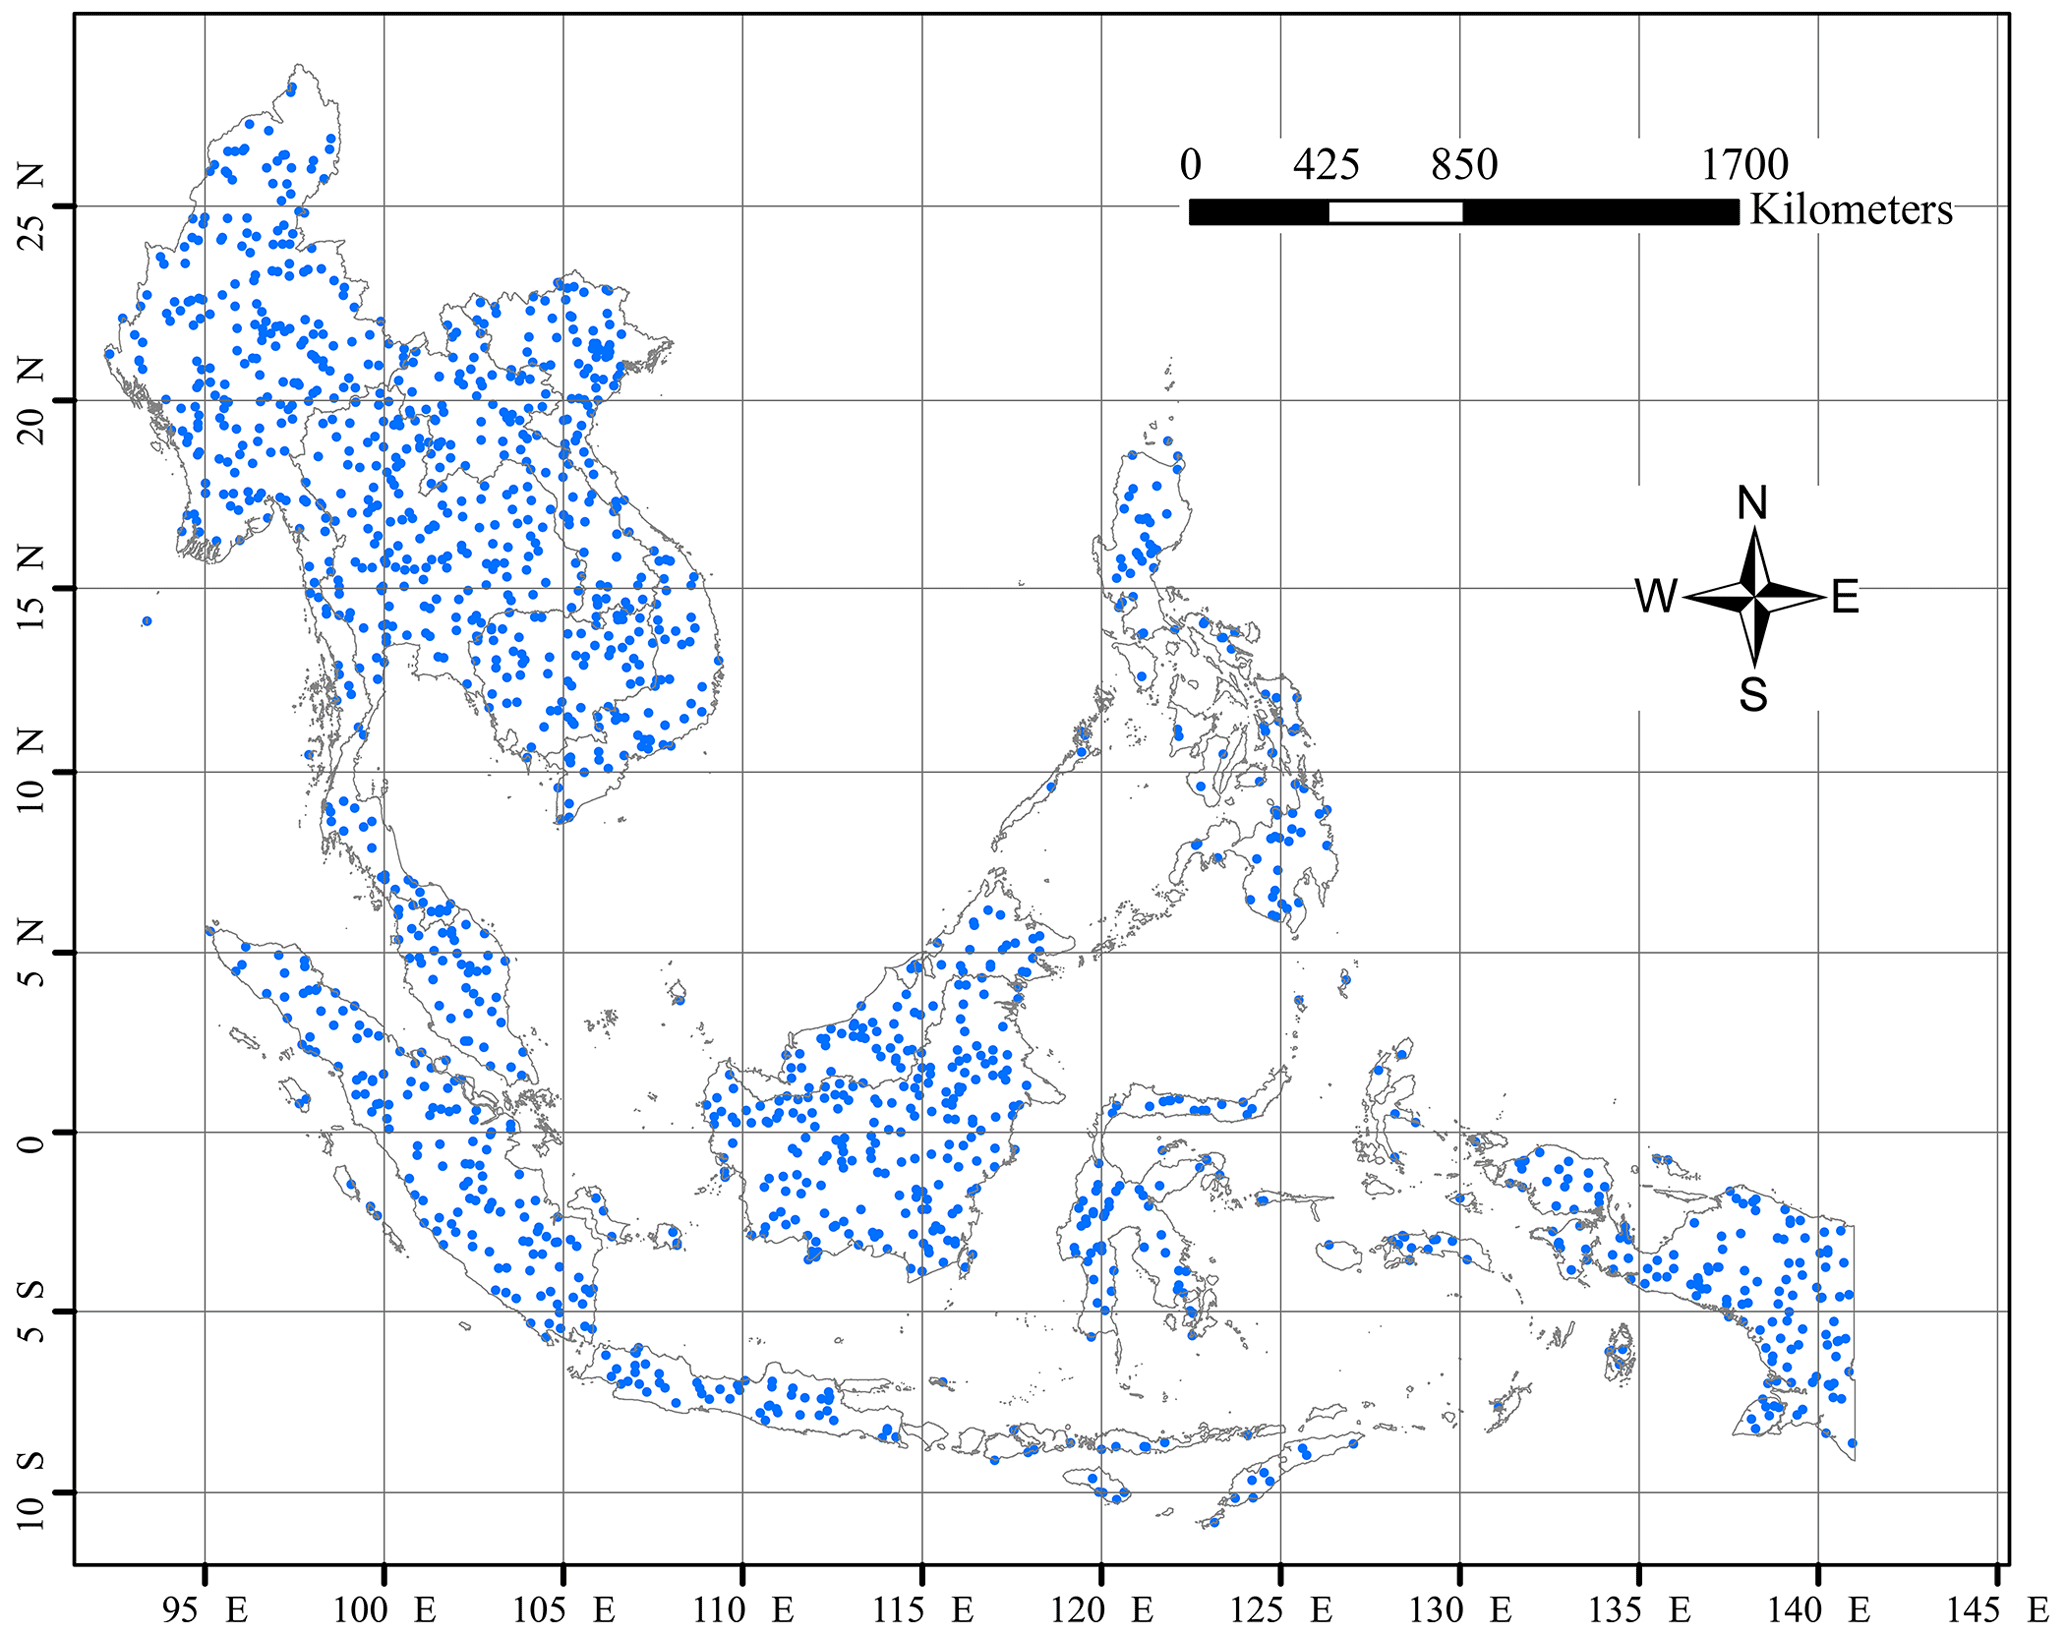
Figure 1Spatial distribution of 1515 randomly generated validation dataset points. (Please note that the latitude and longitude are given in degrees on both axes.)
Table 1Information on the mapped validation dataset for evaluating the generated tree cover map product.
2.3 Methods
We integrated Planet-NICFI and Sentinel-1 SAR imagery to generate a high-resolution (4.77 m) annual tree cover map product for SEA covering the years from 2015 to 2021. Our framework involved several key steps, including defining mapped objects, the preprocessing of imagery and the generation of the time series of the tree cover map product. The detailed workflow is illustrated in Fig. 2.
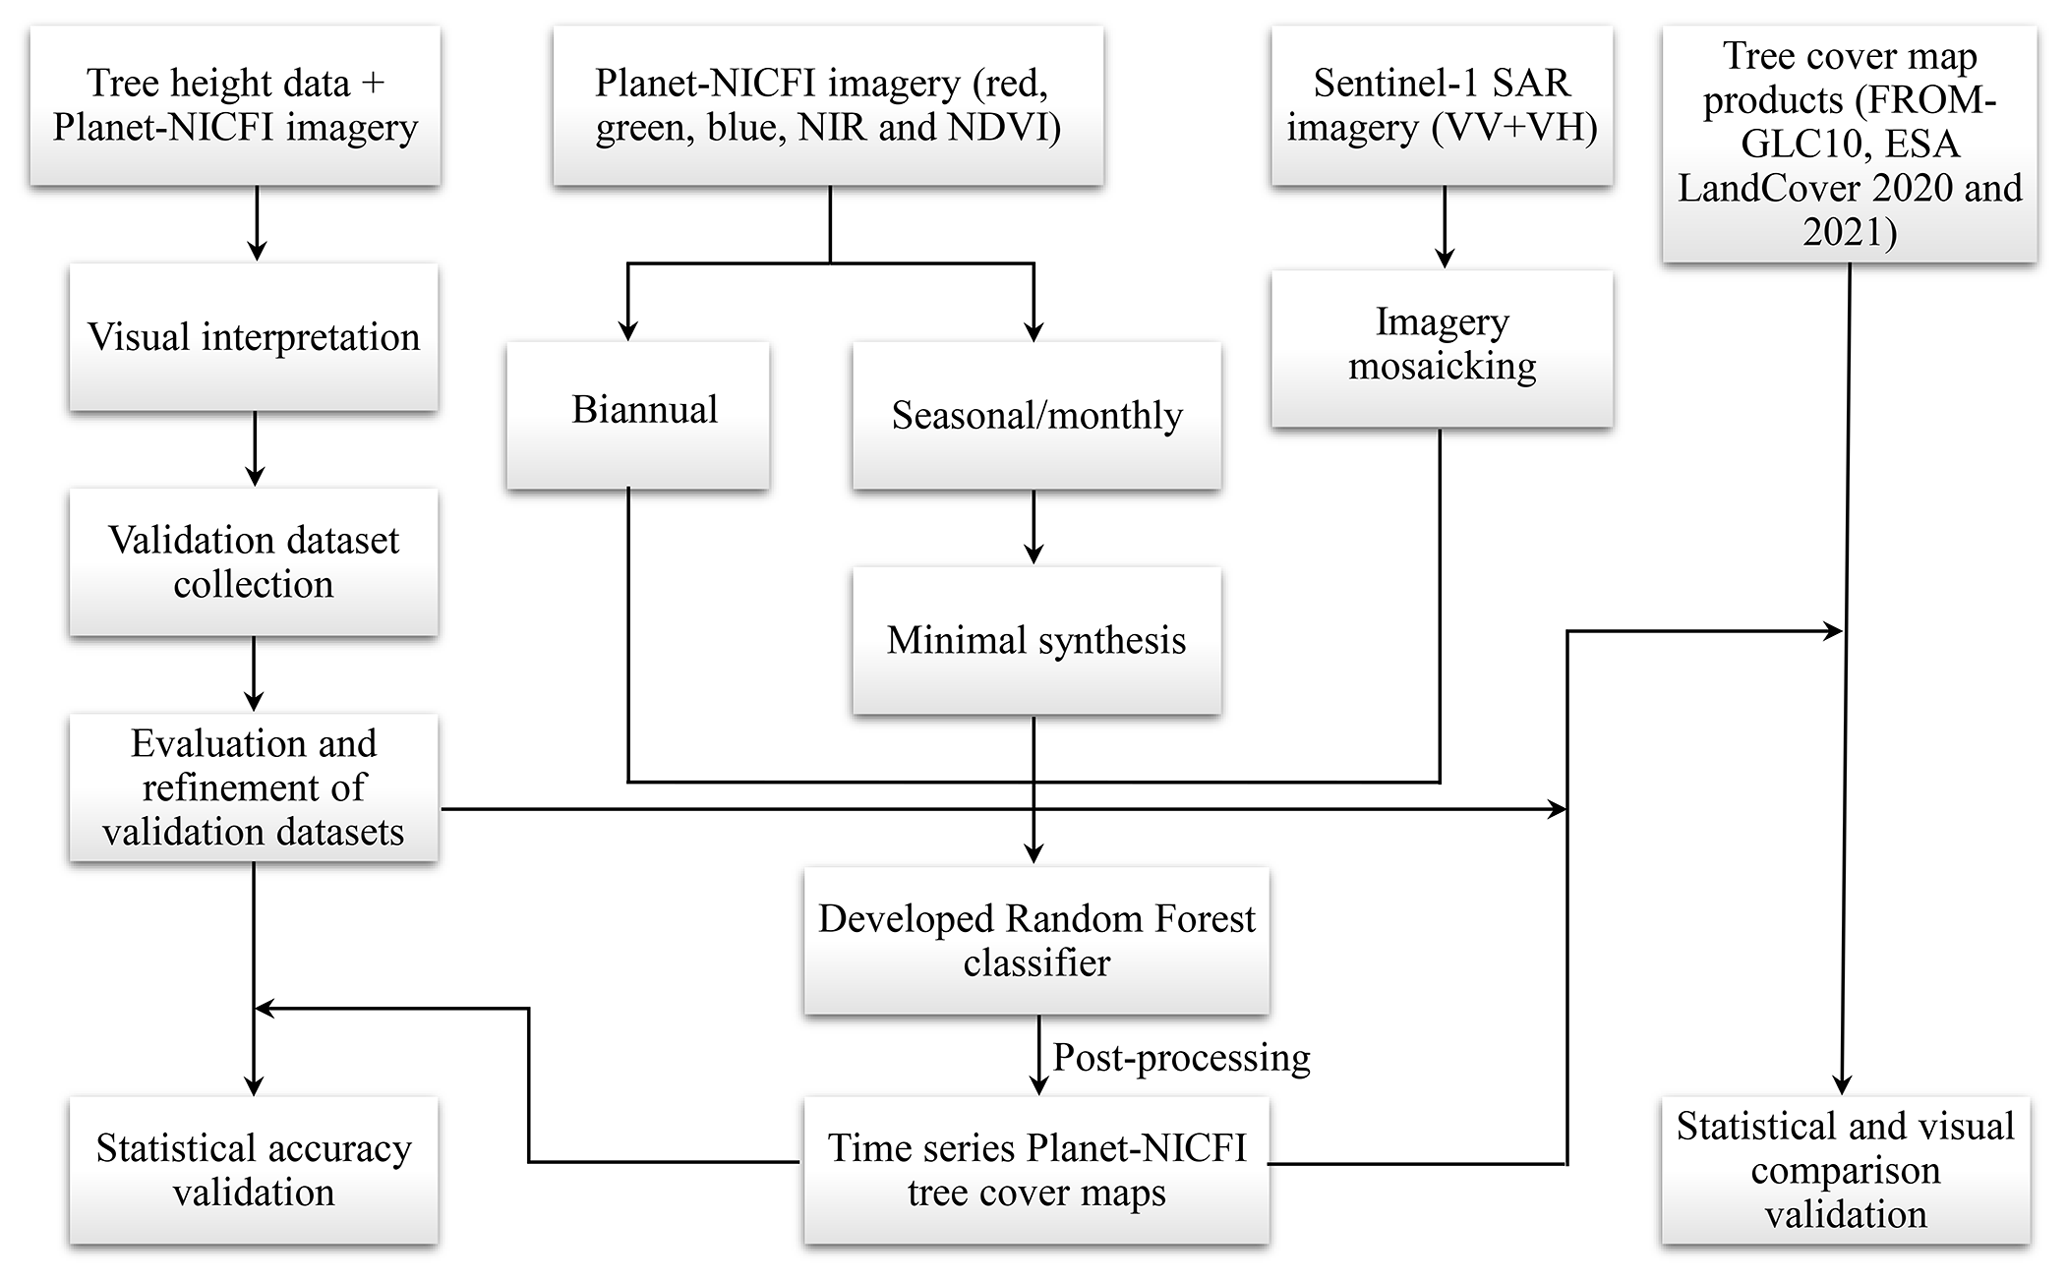
Figure 2Workflow for generating the tree cover map product for 2016–2021, including the preprocessing of imagery, generation of the tree cover map product and accuracy validation.
2.3.1 Definition of mapped tree cover
Traditionally, forests are considered to meet specific criteria (tree cover and height). The Food and Agriculture Organization (FAO) of the United Nations (UN) defines forests as land spanning more than 0.5 ha with trees higher than 5 m and a canopy cover above 10 % (FAO, 2020). According to the UN Framework Convention on Climate Change (UNFCCC), forests are defined as areas with a minimum canopy cover of 10 %–30 %, a minimum tree height of 2–5 m and a minimum area of 0.1 ha (Parker et al., 2008).
In this study, tree cover is defined as any geographic area dominated by trees without a percentage of tree coverage at the pixel level (Zanaga et al., 2021; Hansen et al., 2013). This is attributed to the fact that the resolution of the Planet pixel (4.77 m) is closer to the size of trees in tropical areas. Next, we utilized Planet-NICFI imagery to generate a prototype tree cover map with a resolution of 4.77 m and trees higher than 5 m. Our tree cover map product serves as baseline data for forest cover analysis. Upon further development of the map to include trees higher than 5 or 2–5 m, it can be utilized to derive forest cover maps for various functions, such as those provided by the FAO and UNFCCC, respectively.
2.3.2 Preprocessing of imagery
We utilized the GEE platform to preprocess Planet-NICFI imagery and Sentinel-1 SAR data to generate tree cover maps for the years 2016–2021 (Fig. 2). Specifically, following the methodology of Yang et al. (2023), we first employed the “ee.ImageCollection.mosaic()” function to merge and assemble overlapping Sentinel-1 SAR data over the specified time period into seamless, continuous imagery. Subsequently, we performed bilinear resampling on the SAR imagery, specifically the VV and VH bands, to match the spatial resolution of Planet-NICFI imagery with a spatial resolution of 4.77 m.
Planet-NICFI offers imagery at two different temporal frequencies spanning from 2016 to 2021. This includes semiannual imagery from 2016 to 2019 and monthly data from 2020 to 2021. To create a coherent and consistent dataset for 2020 and 2021, we synthesized the selected time window of monthly imagery into single imagery for each band, namely the red, green, blue and near-infrared bands. Specifically, we utilized the ee.ImageCollection.min() function on each monthly imagery to extract the minimum monthly imagery, which was then used to generate the second semiannual imagery for 2020 and 2021. This approach was employed to minimize the impact of cloud pollution on Planet-NICFI imagery (Oishi et al., 2018).
2.3.3 Generation of the time series of the tree cover map product
In addition to applying the RF approach in our tree cover mapping (Yang et al., 2023), RF-based methods have been widely employed to develop global LCLUC products, and these methods show good performance (Zanaga et al., 2022, 2021; Buchhorn et al., 2020). To acquire the time series of the tree cover map dataset, our methodology involved a two-step process. Initially, we integrated our custom RF approach, implemented on Google Earth Engine (GEE), with a cloud-based machine learning platform. This combination enabled us to obtain semiannual Planet-NICFI and Sentinel-1 imagery spanning the years from 2016 to 2021, as illustrated in Fig. 2. Following data acquisition, we performed several post-processing steps to generate an accurate tree cover map product for the SEA region. These steps included downloading the acquired data from the cloud platform to a local location, conducting mosaic operations, clipping relevant areas, applying projection transformations and performing correlation statistics. By employing this approach, we produced a high-resolution tree cover map product.
2.3.4 Statistical accuracy assessment
We used two methods to assess the statistical accuracy of our tree cover map product. The generated tree cover map product was compared pixel by pixel with the tree cover/non-tree cover labels. We then obtained a confusion matrix, including true tree cover (TP), true non-tree cover (TN), false tree cover (FP) and false non-tree cover (FN). These four values were used to calculate the user's accuracy, producer's accuracy and overall accuracy, at a 95 % confidence level (Olofsson et al., 2014), and the F1 score, based on Eqs. (1)–(4), respectively. Note that we opted against utilizing the kappa coefficient for accuracy assessment due to its unsuitability for mapping error evaluation (Pontius and Millones, 2011; Allouche et al., 2006).
In addition, following Tsendbazar et al. (2021), we used a stability index based on the user's and producer's accuracy to evaluate the time series' accuracy and consistency for the tree cover map product. The stability index used to evaluate tree cover accuracy is expressed as follows:
where SIt1 is the stability index that indicates the accuracy of tree cover maps (user's or producer's accuracy) at time t1, TCt1 is tree cover accuracy at time t1 and TCt1−1 is tree cover accuracy at the previous time (t0 or the reference year). We also used the maximum and average stability index for 2 consecutive years to assess the stability of our tree cover map product over a long period.
We employed two approaches to assess the performance of our Planet-NICFI 2016–2021 tree cover map product. Firstly, we estimated the accuracy of our tree cover map product for each year to gain insights into its accuracy and consistency, based on the method developed by Tsendbazar et al. (2021). Additionally, we presented illustrative time series of the tree cover maps and documented the dynamics with respect to tree cover area changes during the 2016–2021 period. Secondly, we compared our tree cover map product to widely used global tree cover map products at a 10 m resolution, including FROM-GLC10 in 2017 (Gong et al., 2019), as well as ESA WorldCover 2020 and 2021 (Zanaga et al., 2022, 2021).
3.1 Assessment of the tree cover map product
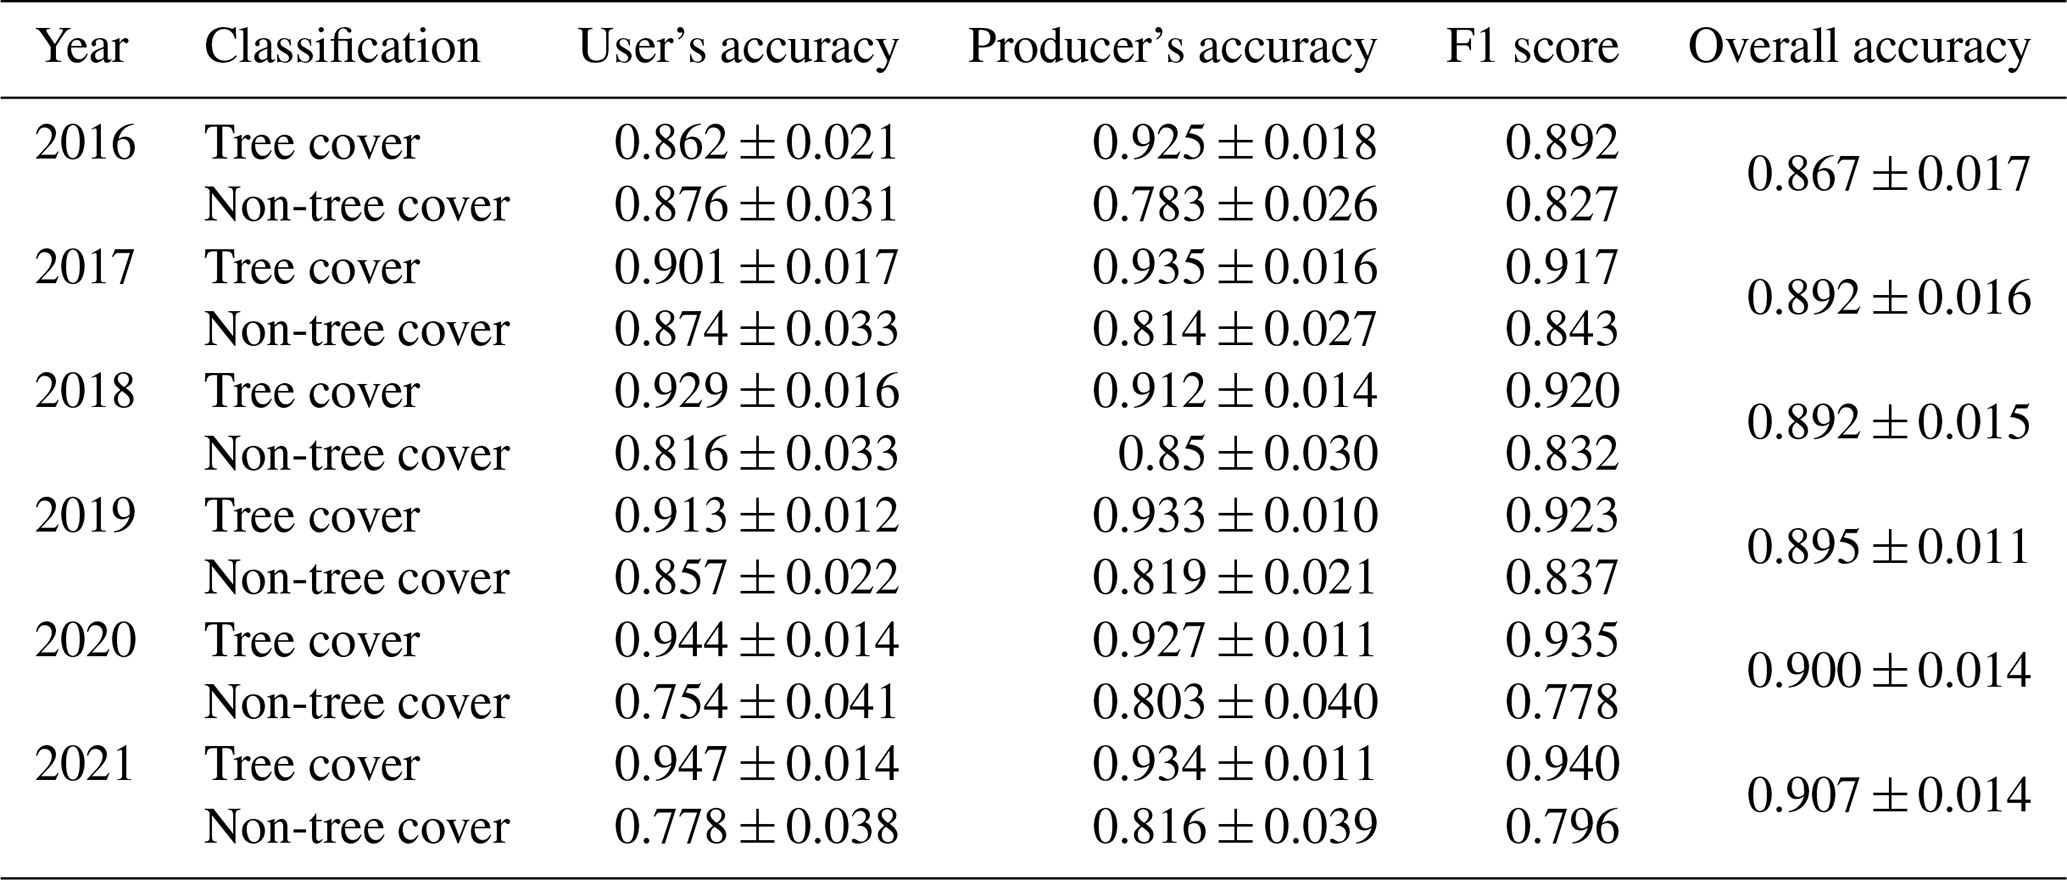
We reported the annual accuracy of the time series of the Planet-NICFI tree cover map product in Table 2 with a 95 % confidence level. The tree cover accuracy results for 2019 were provided by Yang et al. (2023). The overall accuracy of the tree cover map product ranged between 0.867± 0.015 and 0.907± 0.015 from 2016 to 2021, with the highest accuracy of 0.907 ± 0.014 in 2021 and the lowest accuracy of 0.867 ± 0.017 in 2016 (Table 2). This discrepancy may be due to poor data in the Planet-NICFI imagery during 2016 (Roy et al., 2021). The F1 score showed a similar trend from 2016 to 2021, with an average of approximately 0.921. The user's accuracy consistently exceeded 0.901 ± 0.017 over the 6 years, except for 2016 when it was 0.862 ± 0.021. The producer's accuracies were all higher than 0.912 ± 0.014 (Table 2). Nevertheless, the mapping results of our time series of Planet-NICFI tree cover maps were highly consistent. Additionally, compared with the tree cover, the non-tree cover showed a lower user's accuracy, producer's accuracy and F1 score (i.e., approximately 0.856 ± 0.027, 0.852 ± 0.025 and 0.853, respectively), likely due to the complex composition of non-tree cover types, such as shrubland and herbaceous wetland.
Table 2User's accuracies, producer's accuracies, F1 score and overall accuracies of the Planet-NICFI V1.0 2016–2021 tree cover map product for SEA at a 95 % confidence level. The accuracy evaluation results in 2019 were provided by Yang et al. (2023).
We also estimated the stability of our Planet-NICFI tree cover maps accuracy over 2016–2021 (Fig. 3). The results show that the user's and producer's stability indexes were low than 4.5 % and 2.5 %, respectively, indicating the good stability of our mapped Planet-NICFI tree cover maps for the 6 years (2016–2021).
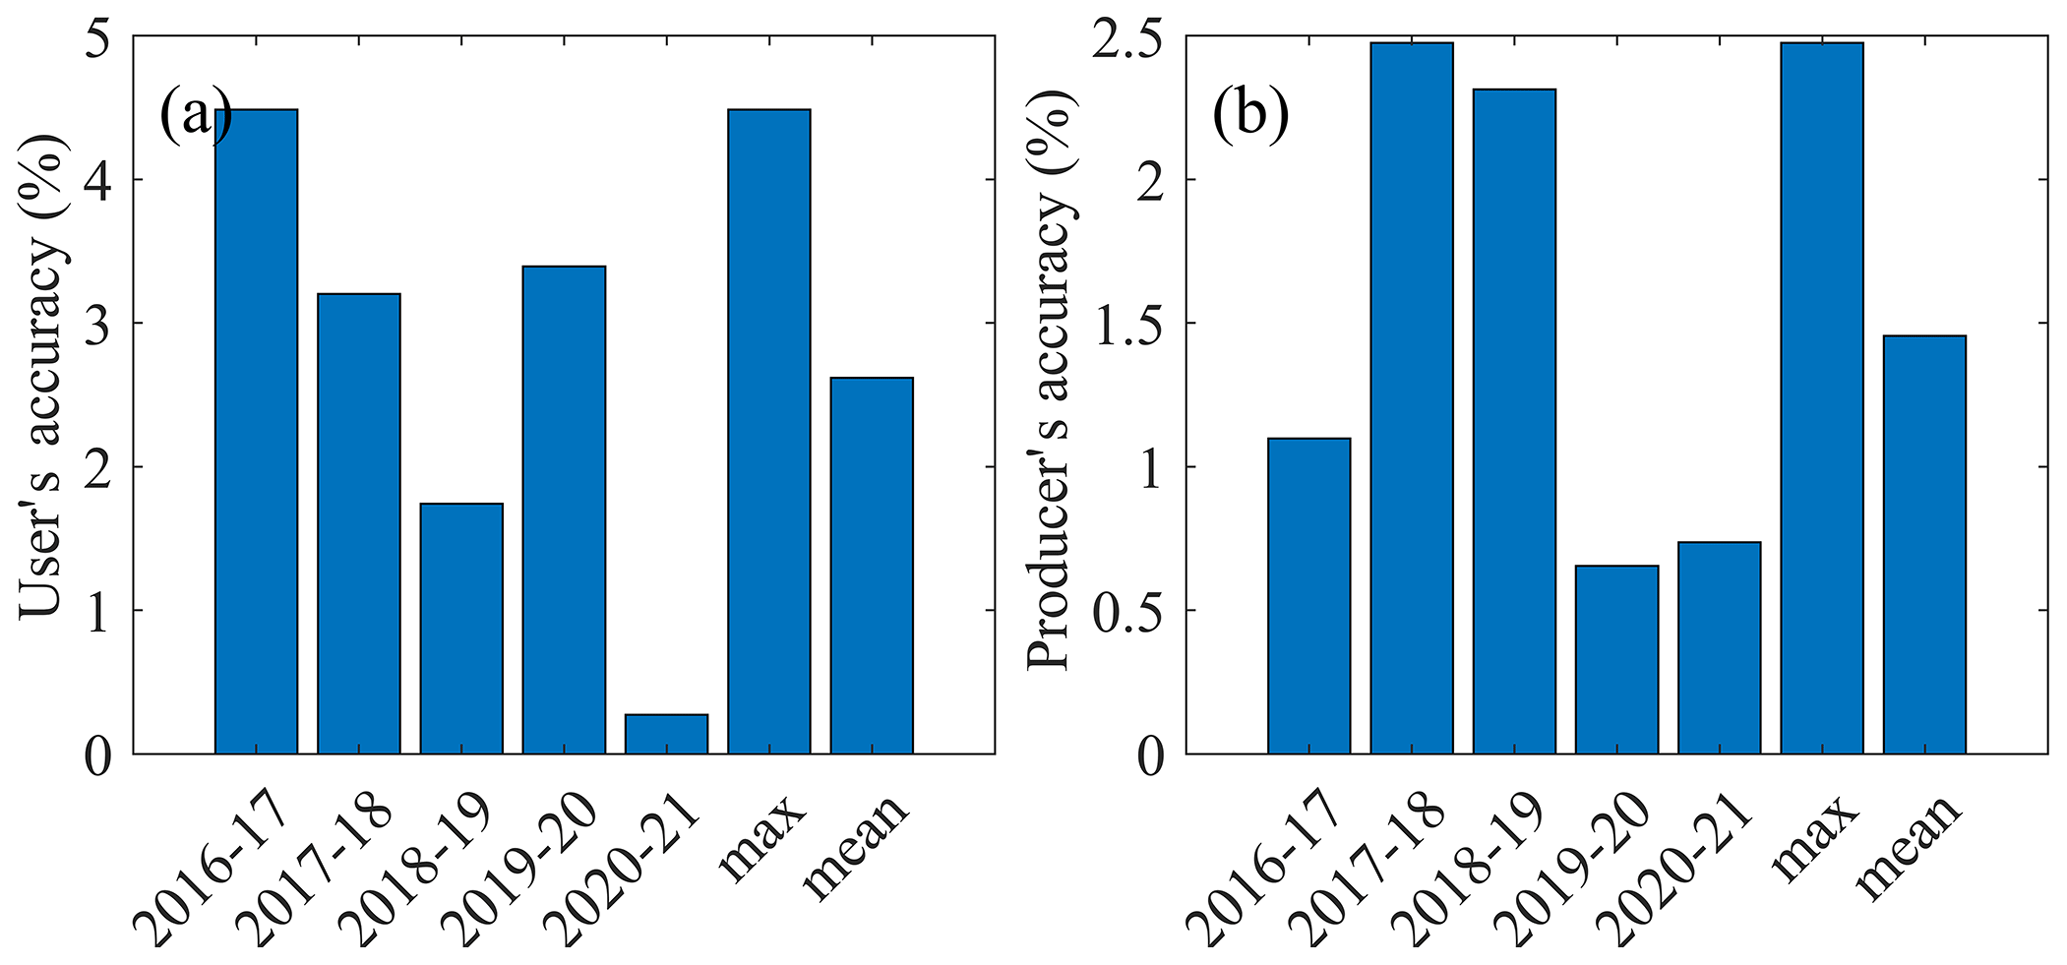
Figure 3Stability index estimates for the Planet-NICFI tree cover map product for 2016–2021 for (a) the user's accuracy and (b) the producer's accuracy.
We further visually compared our time series of the tree cover map product to the original Planet-NICFI imagery during 2016–2019 (Figs. 4, 5). Note that we have not shown the years 2020 and 2021 due to the inconvenient visualization of Planet-NICFI imagery collected from QGIS at a monthly resolution. In comparison, our tree cover map product showed better consistency with Planet-NICFI imagery, such as roads, the spatial distribution pattern of tree cover and non-tree cover. However, our tree cover product potentially exhibited a “salt-and-pepper” phenomenon in some years (i.e., 2017 and 2018) due to the employment of the RF approach. In practical applications, we need to pay attention to this phenomenon. In addition, we counted the time series of the area estimates of tree cover maps during 2016–2021 and showed a slight increasing trend from 2016 to 2021, which is in line with the area estimates of ESA tree cover for the years 2020 and 2021 (Fig. 6). This may be due to forest restoration after the 2015 El Niño phenomenon (Wigneron et al., 2020) and to the impact of expanded plantations (Xu et al., 2020).
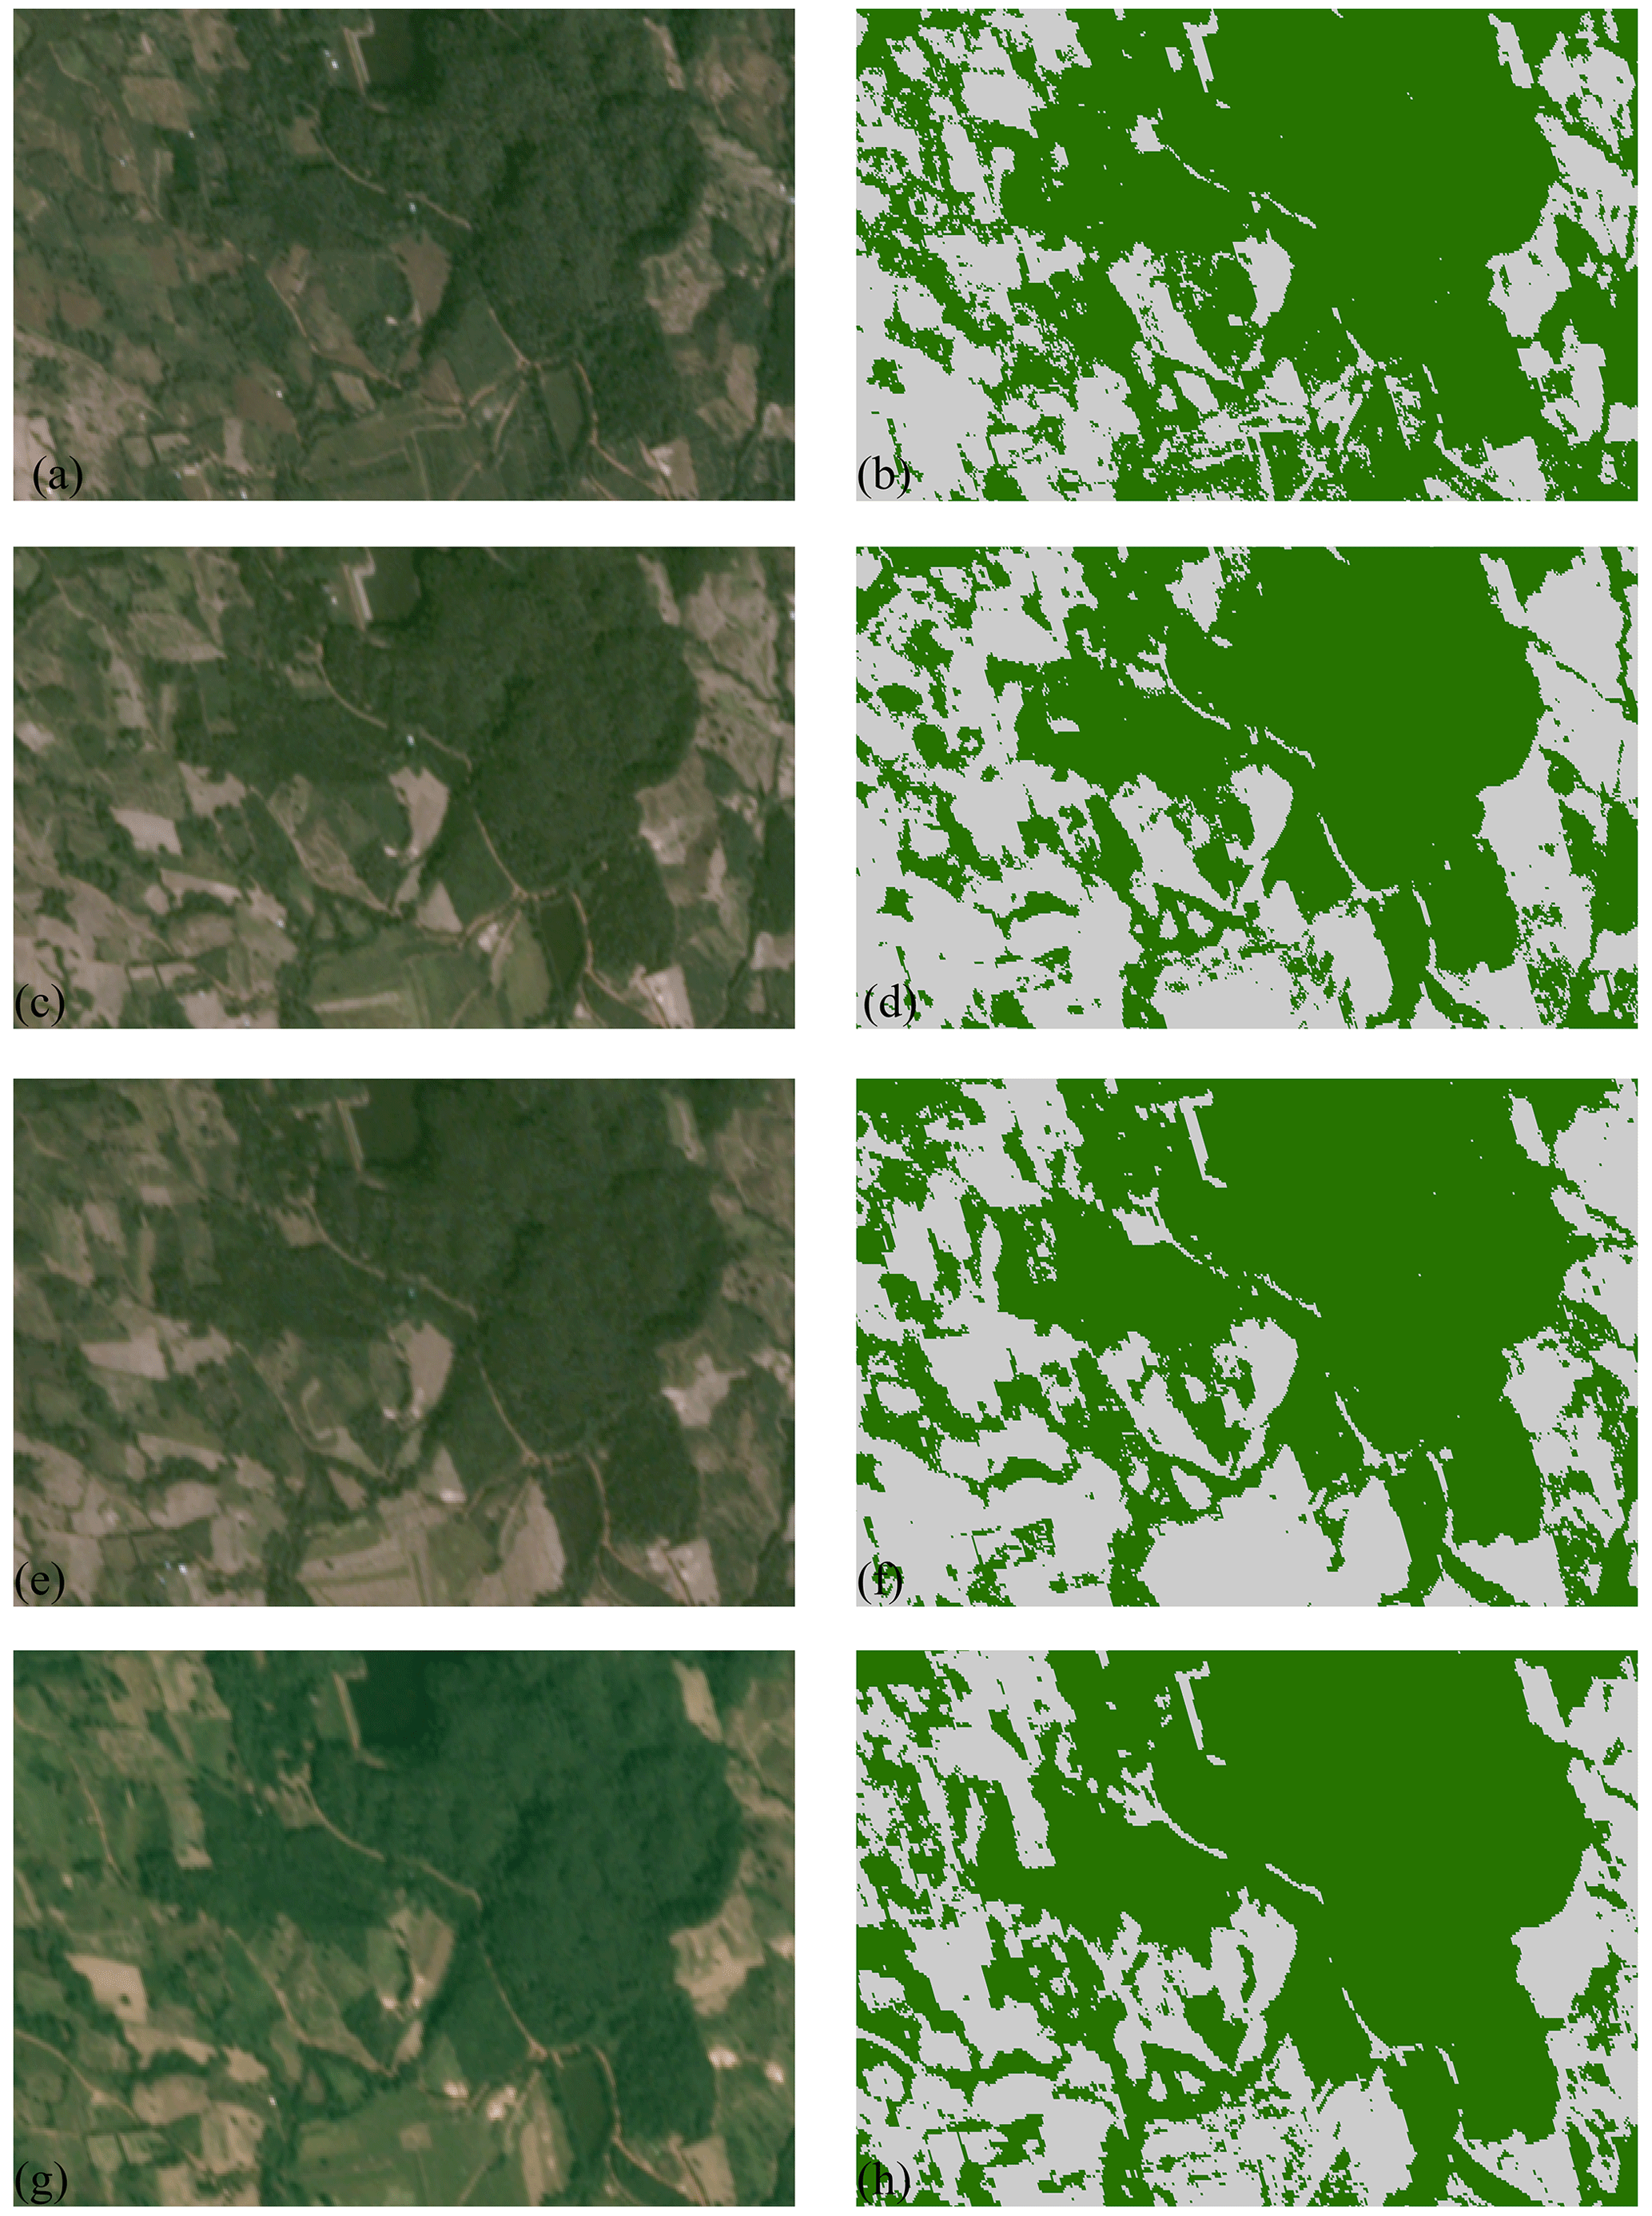
Figure 4Comparison of the time series of the derived tree cover maps (a, c, e, g) and Planet-NICFI imagery (https://www.planet.com/nicfi/, last access: 6 September 2023; b, d, f, h) for the selected mainland SEA area (18.400–18.409∘ N, 100.301–100.322∘ E). Panels (a) and (b), (c) and (d), (e) and (f), and (g) and (h) indicate 2019, 2018, 2017 and 2017, respectively.
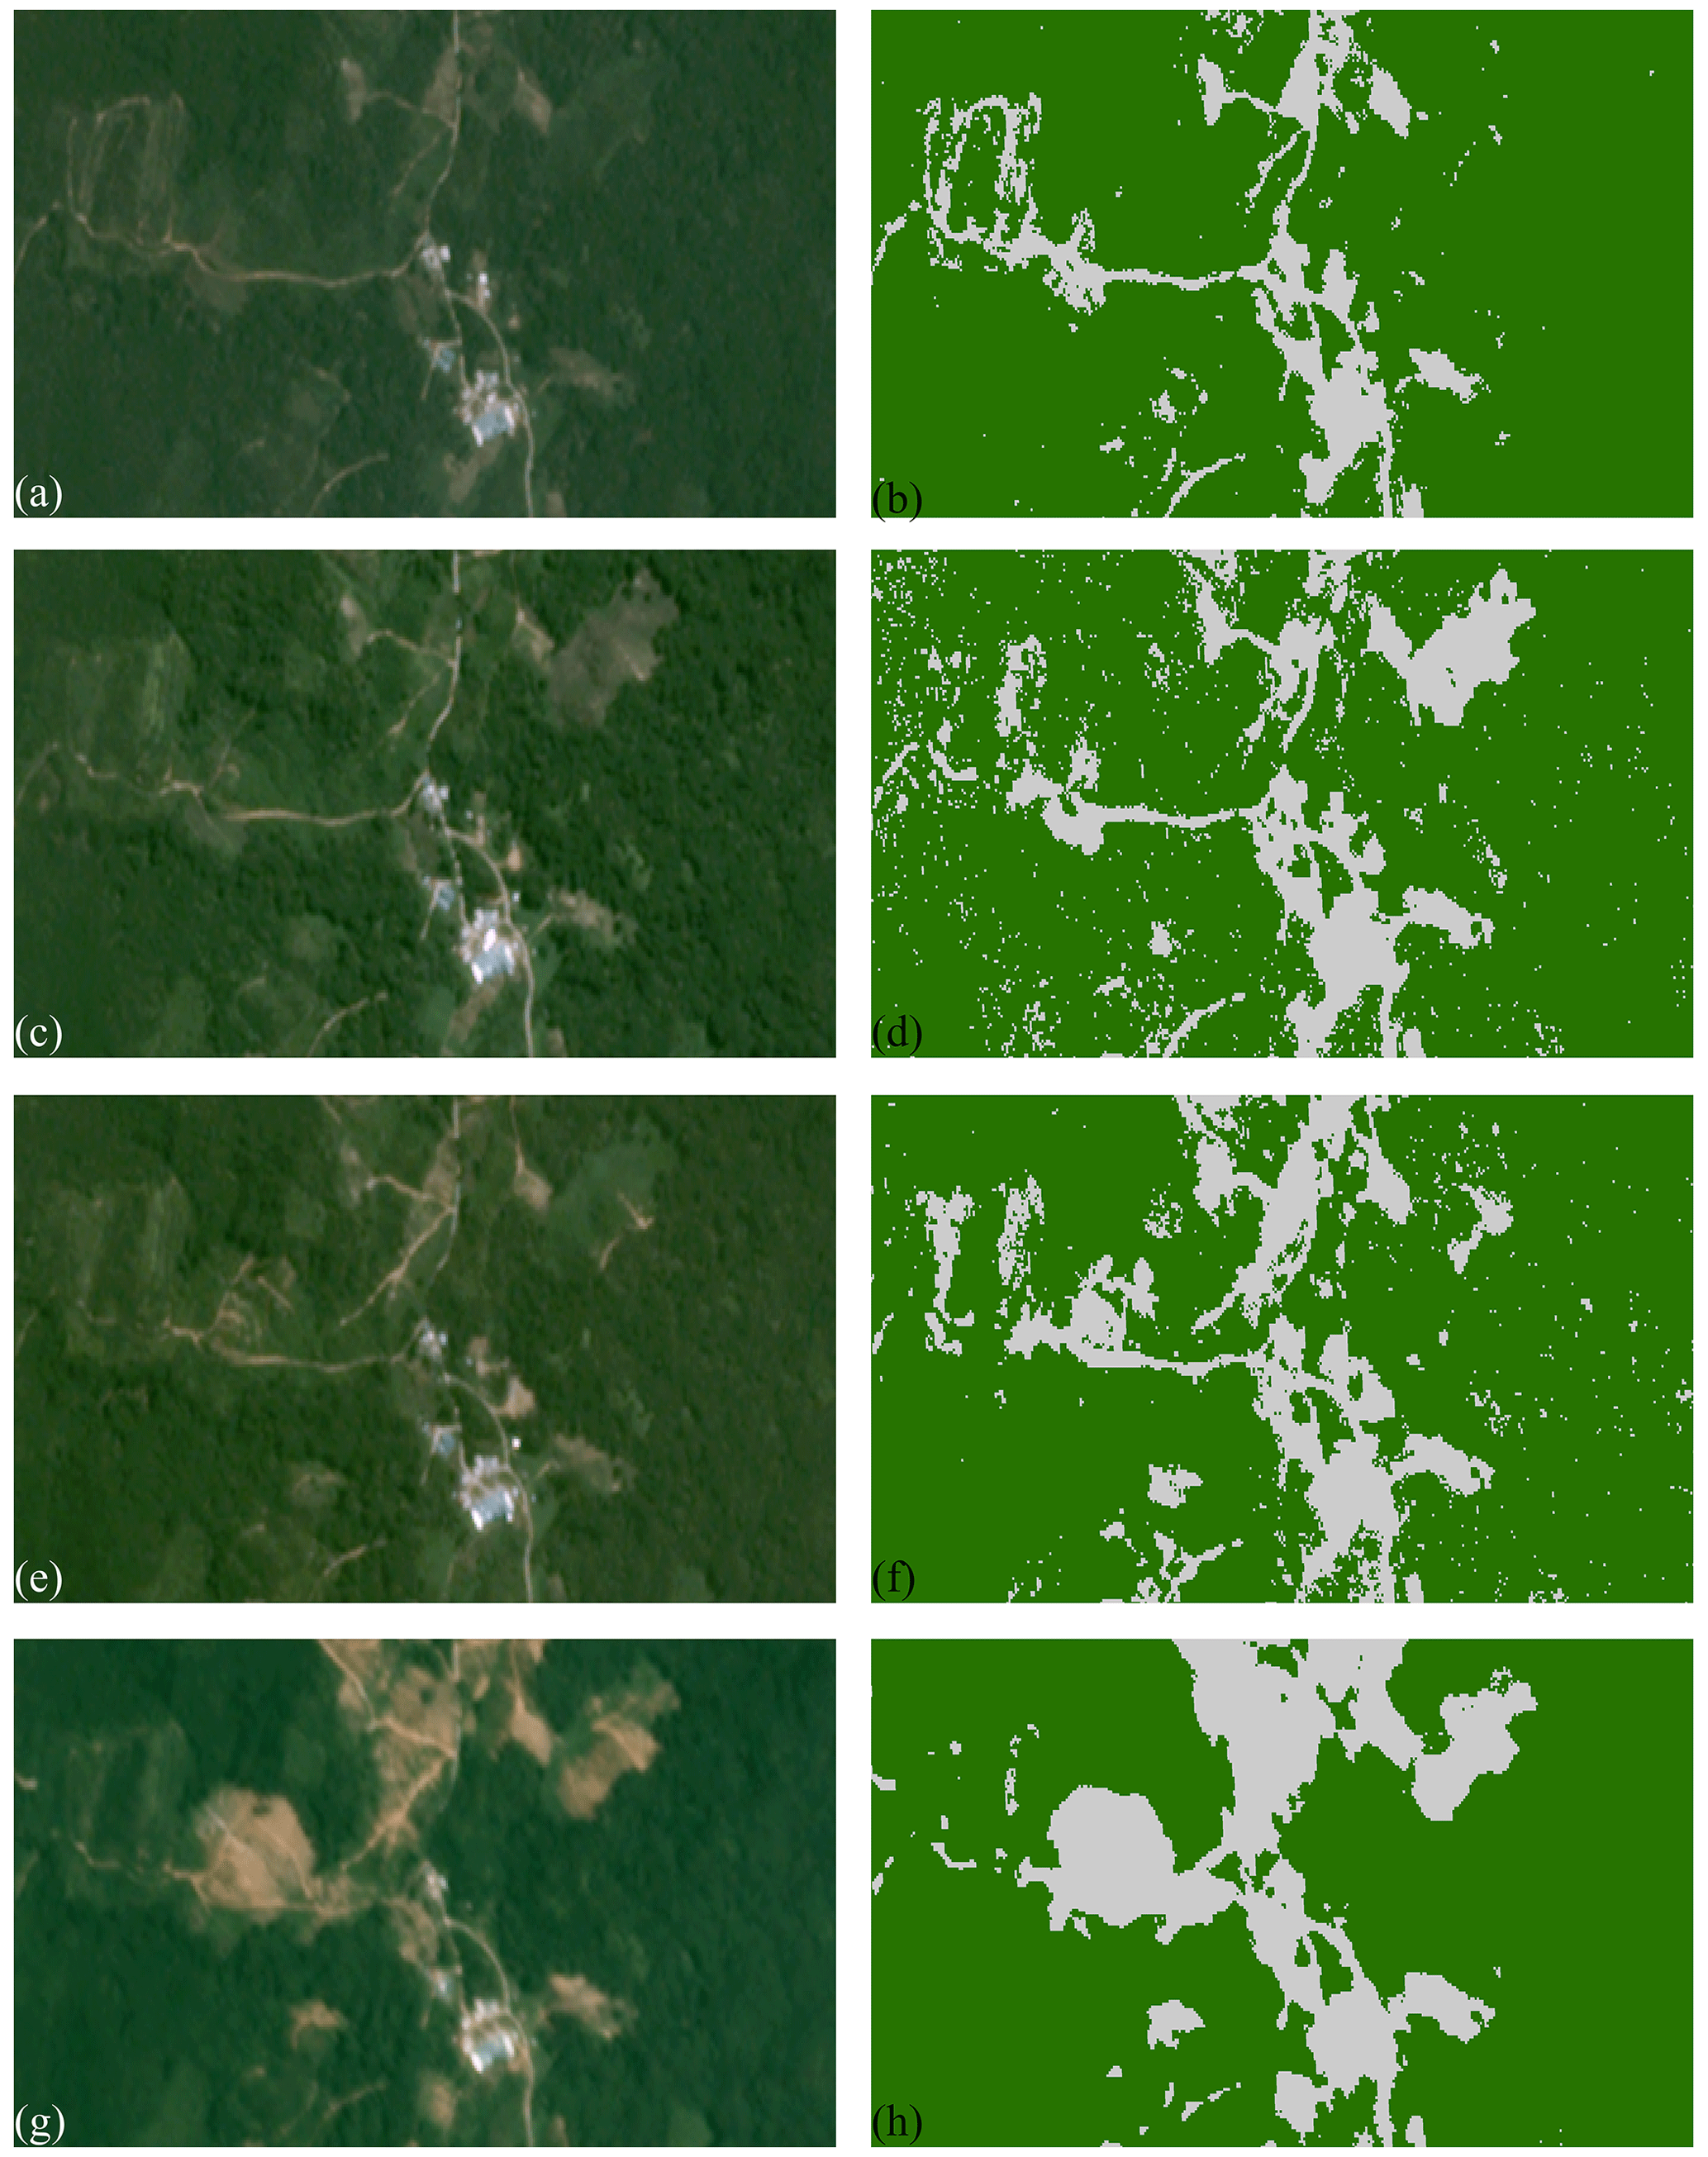
Figure 5Comparison of the time series of the derived tree cover maps (a, c, e, g) and Planet-NICFI imagery (https://www.planet.com/nicfi/, last access: 6 September 2023; b, d, f,h) for the selected maritime SEA area (2.032–2.040∘ N, 111.789–111.806∘ E). Panels (a) and (b), (c) and (d), (e) and (f), and (g) and (h) indicate 2019, 2018, 2017 and 2017, respectively.
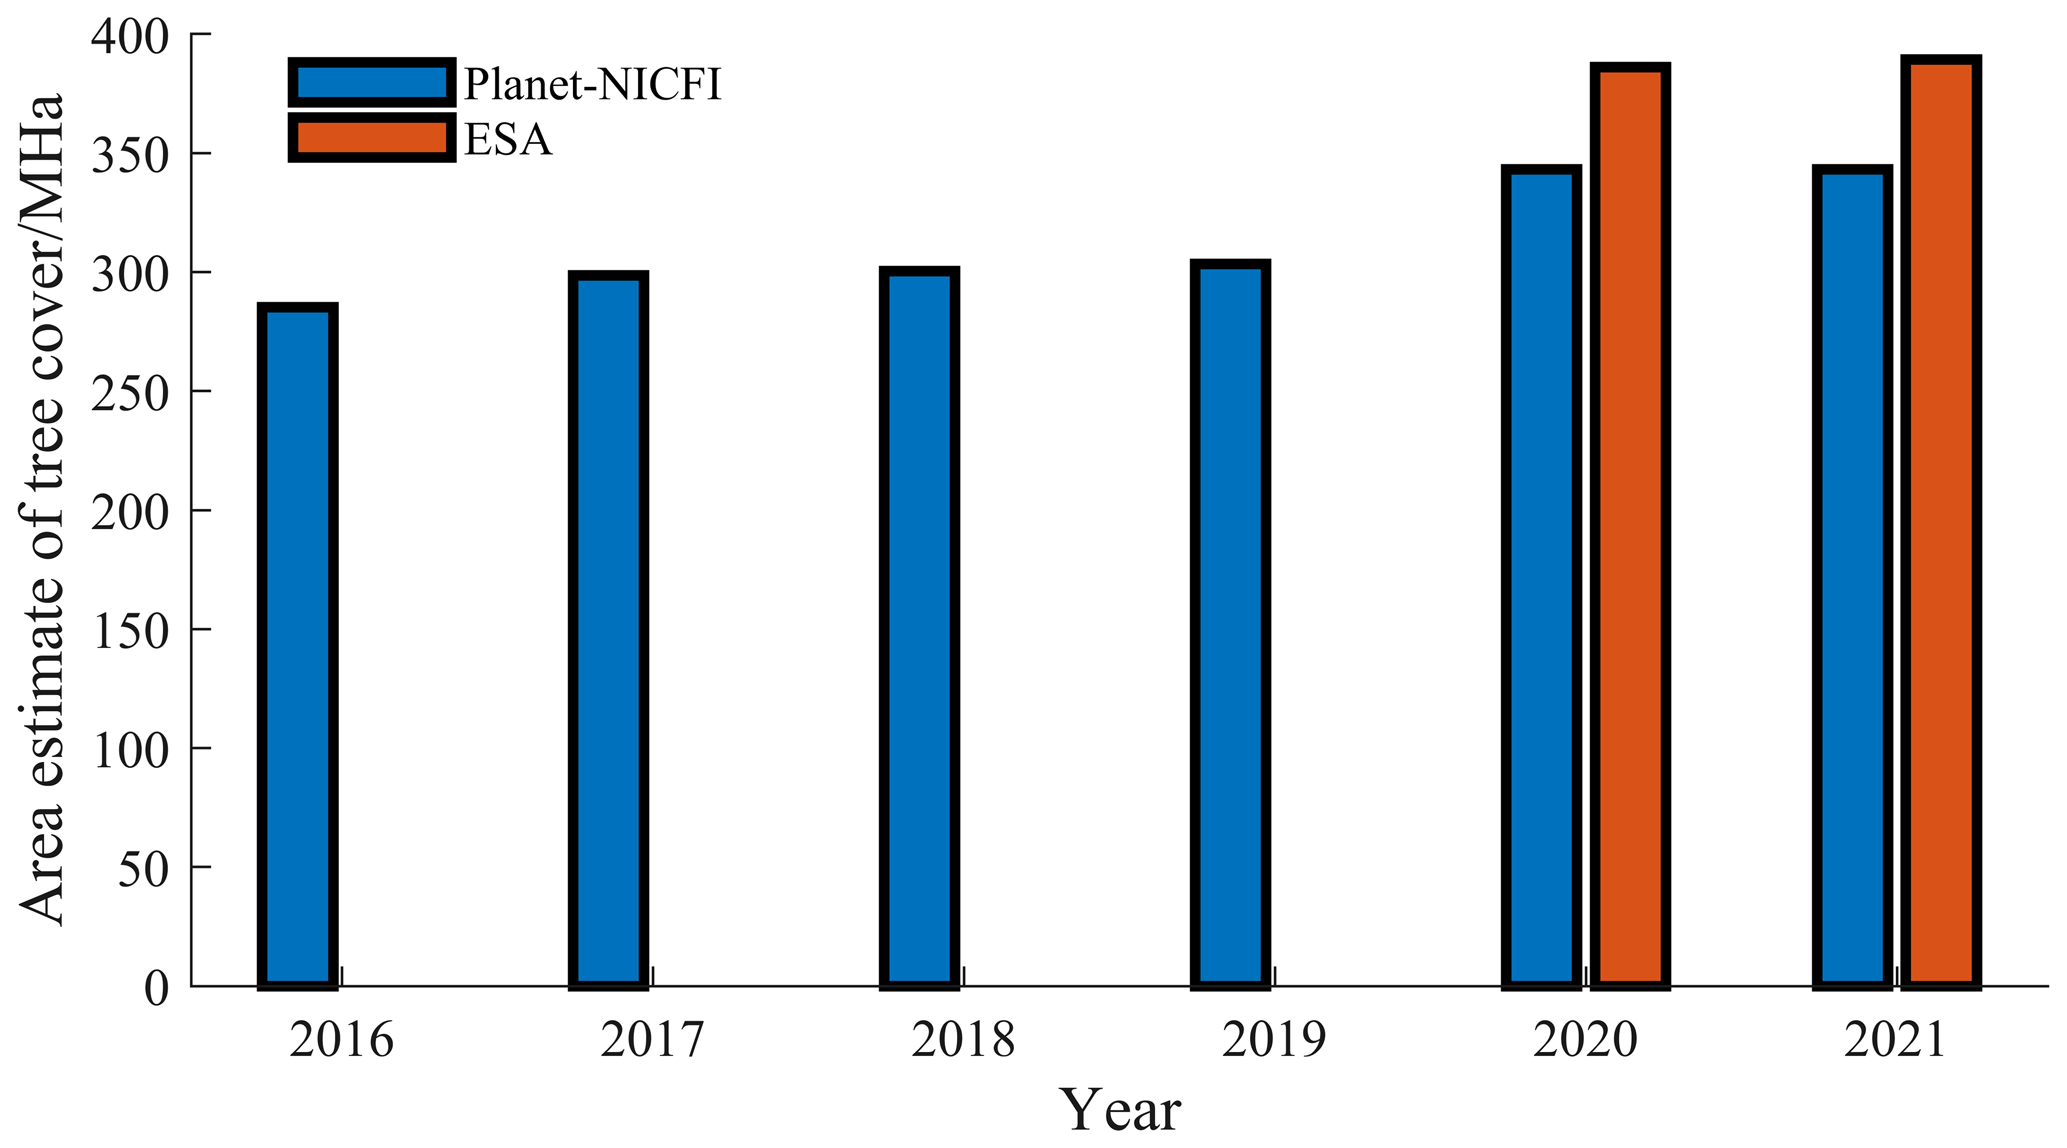
Figure 6Area dynamics: change in tree cover maps for Planet-NICFI and ESA from 2016 to 2021.
3.2 Comparison with existing tree cover map products
We compared our mapped Planet-NICFI tree cover maps with FROM-GLC10 and with ESA WorldCover 2020 and 2021 with respect to statistical accuracy (Fig. 7). The results show that our tree cover maps outperformed FROM-GLC10 with respect to the user's accuracy, producer's accuracy and overall accuracy. The user's accuracy and overall accuracy of our tree cover maps exceeded 0.083. ESA WorldCover 2020 and 2021 showed a similar performance to our Planet-NICFI tree cover maps. Particularly, the user's accuracy, producer's accuracy and overall accuracy of ESA WorldCover 2020 decreased by 0.020, 0.008 and 0.017, respectively (Fig. 4). This may be because we all used the SAR imagery as input and applied the RF-based machine learning method to classify our tree cover.
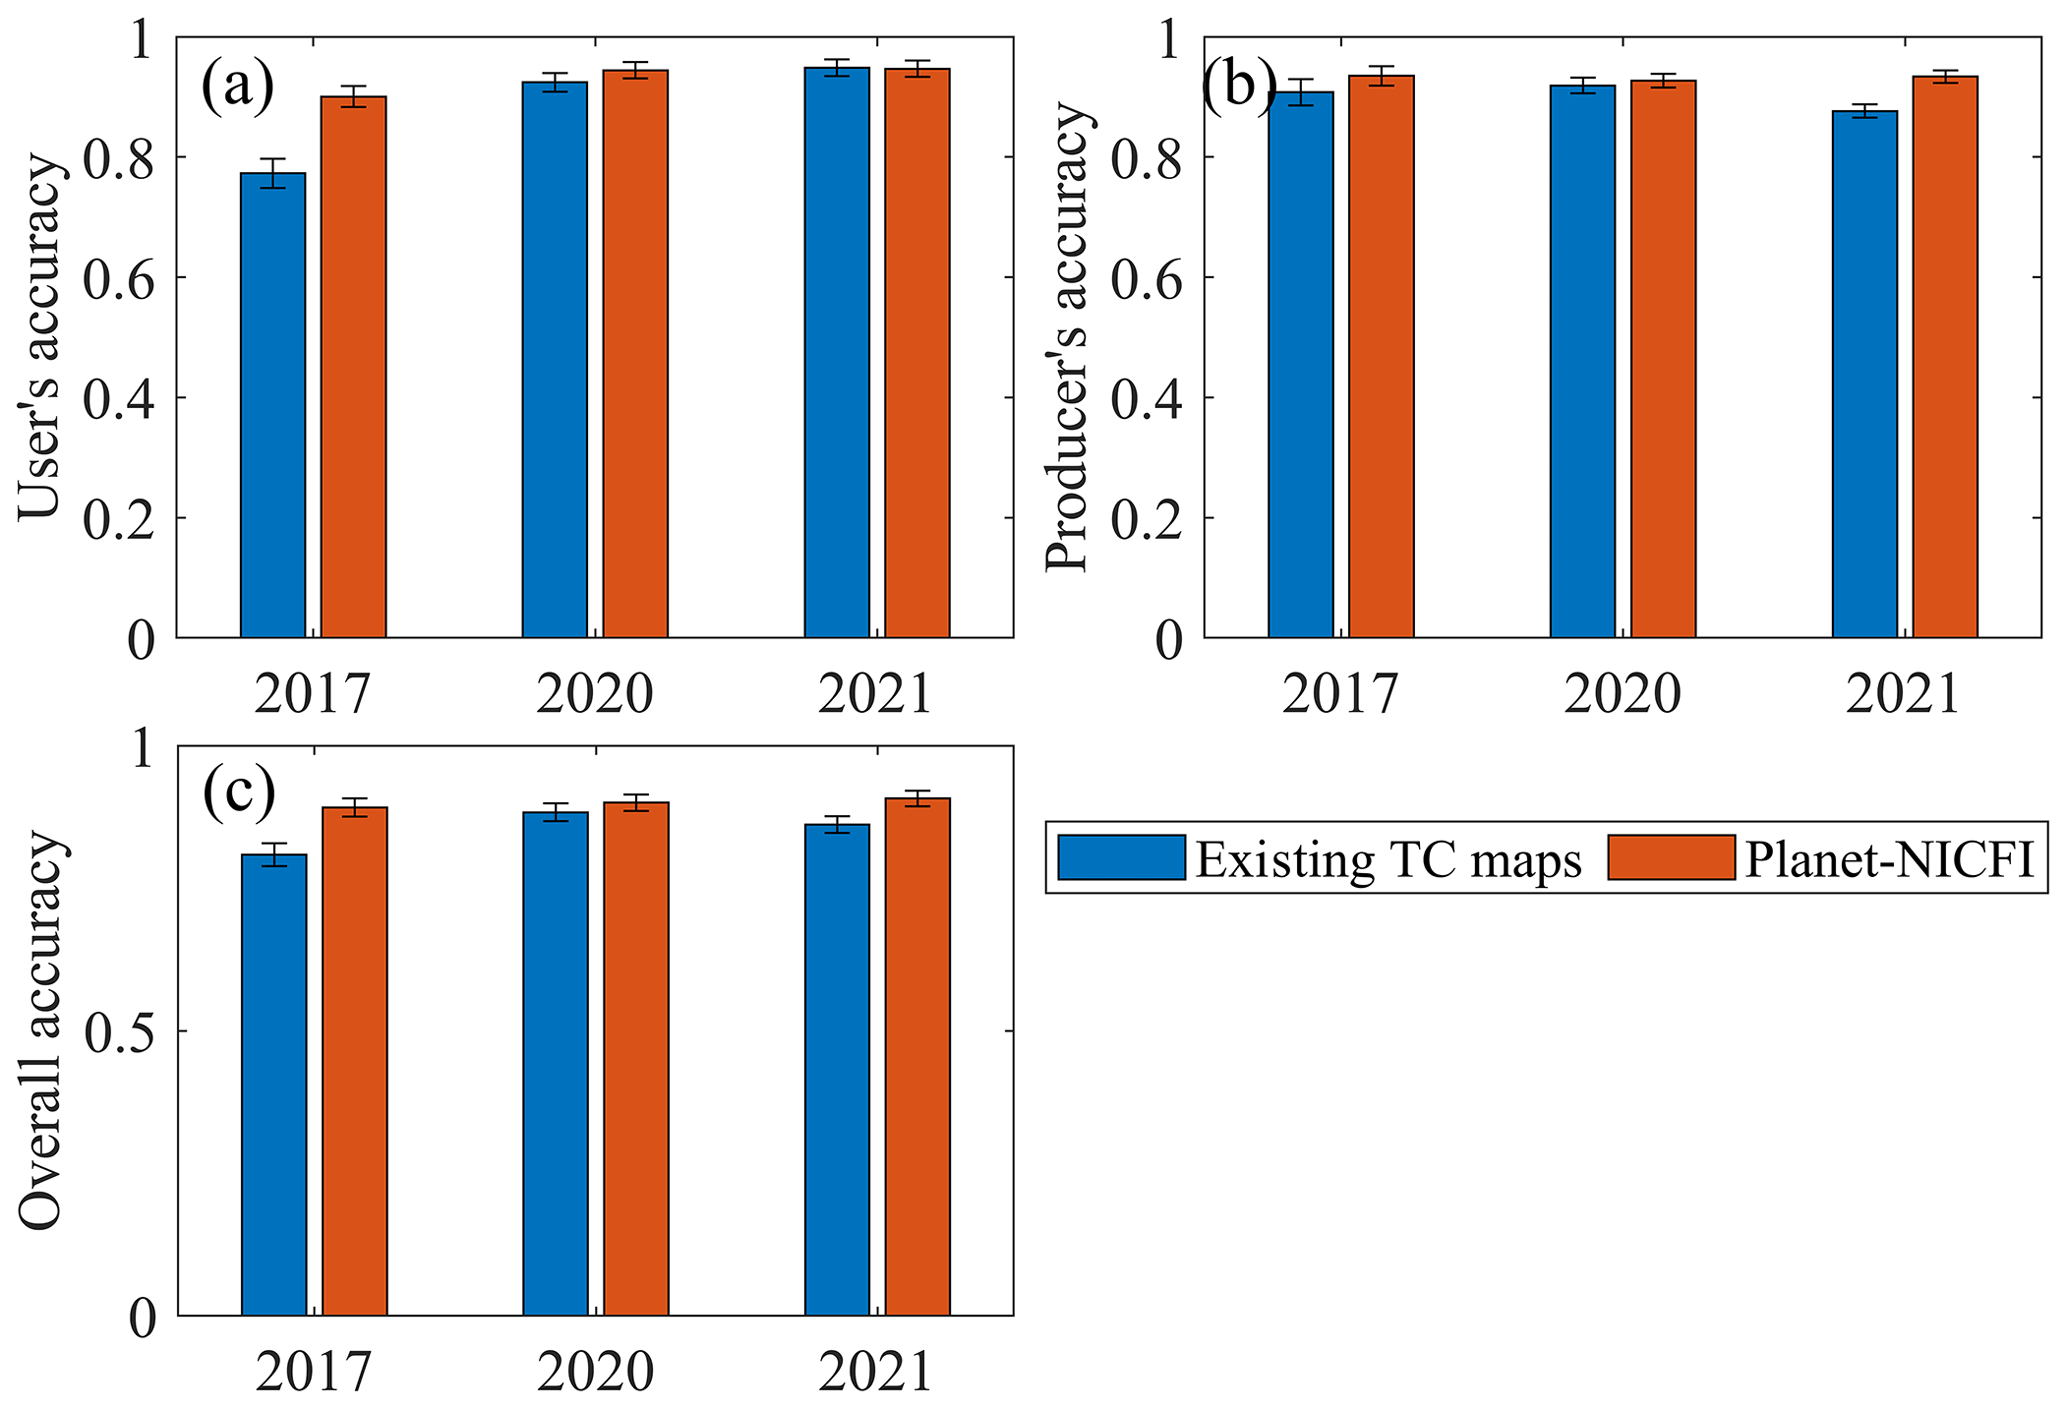
Figure 7Accuracy comparison between existing tree cover maps and the generated Planet-NICFI tree cover maps at a 95 % confidence level: (a) user's accuracy, (b) producer's accuracy and (c) overall accuracy.
We selected six locations (three mainland SEA areas and three maritime SEA areas) to visually compare our Planet-NICFI tree cover maps with three other 10 m products, namely, FROM-GLC10 and ESA WorldCover 2020 and 2021 (Figs. 8, 9, 10). We found that it is easier for FROM-GLC10 to classify all mixed tree and non-tree areas into non-tree cover maps (Fig. 8a). This may be because FROM-GLC10 cannot apply SAR imagery to tree cover mapping. However, our tree cover maps and ESA WorldCover 2020 and 2021 can capture tree cover landscapes at a higher level of detail than FROM-GLC, such as long, narrow roads; croplands; and built-up areas (Figs. 9, 10a). It should be noted that ESA WorldCover 2020 and 2021 omitted some long, narrow, non-tree cover landscapes and small, isolated, tree cover and non-tree cover landscapes due to the limitation of the imagery resolution (10 m).
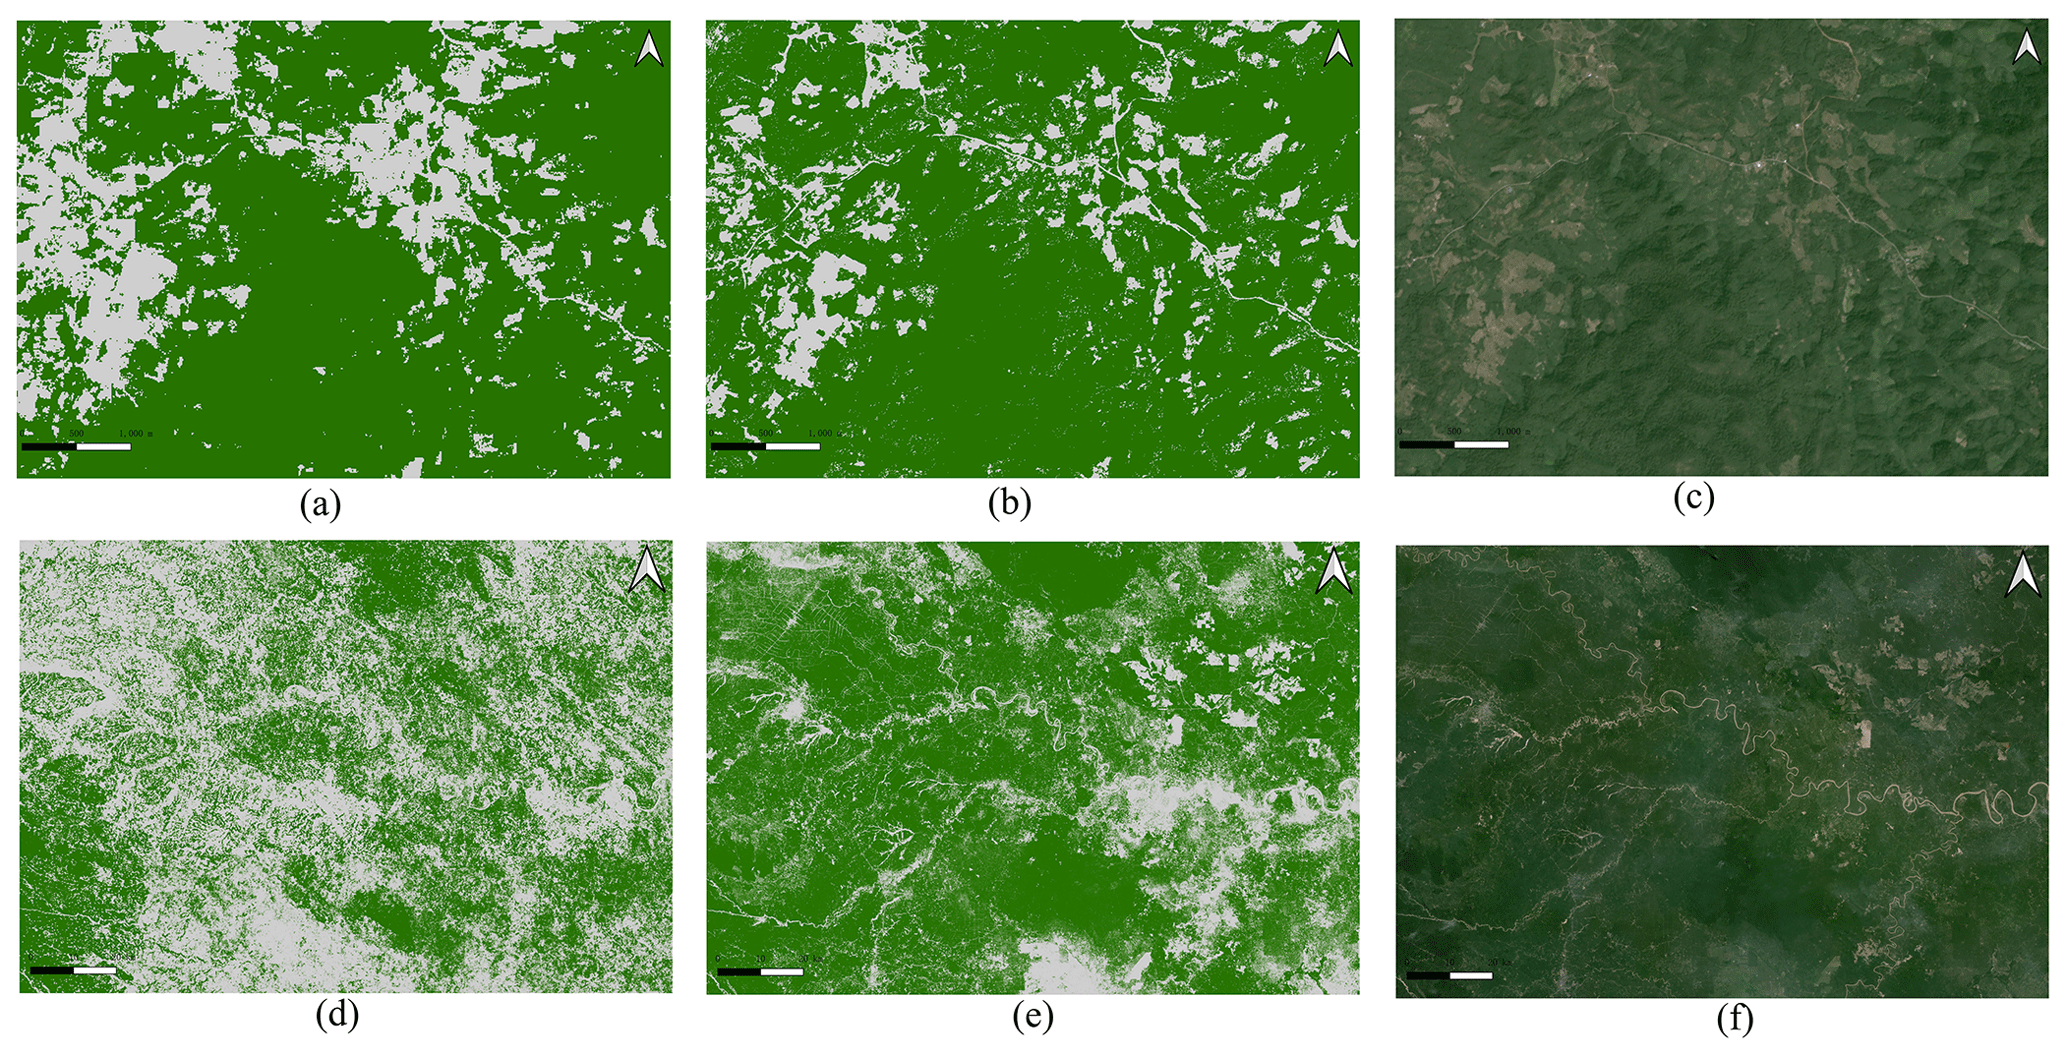
Figure 8Comparison of FROM-GLC10 (a, d), Planet-NICFI tree cover (b, e) and Planet-NICFI imagery (https://www.planet.com/nicfi/, last access: 6 September 2023; c, f) for the mainland SEA area (19.254–19.294∘ N, 101.594–101.651∘ E; a–c) and the maritime SEA area (2.096–1.145∘ S, 101.925–103.296∘ E; d–f). Green and light gray indicate tree cover and non-tree cover, respectively.
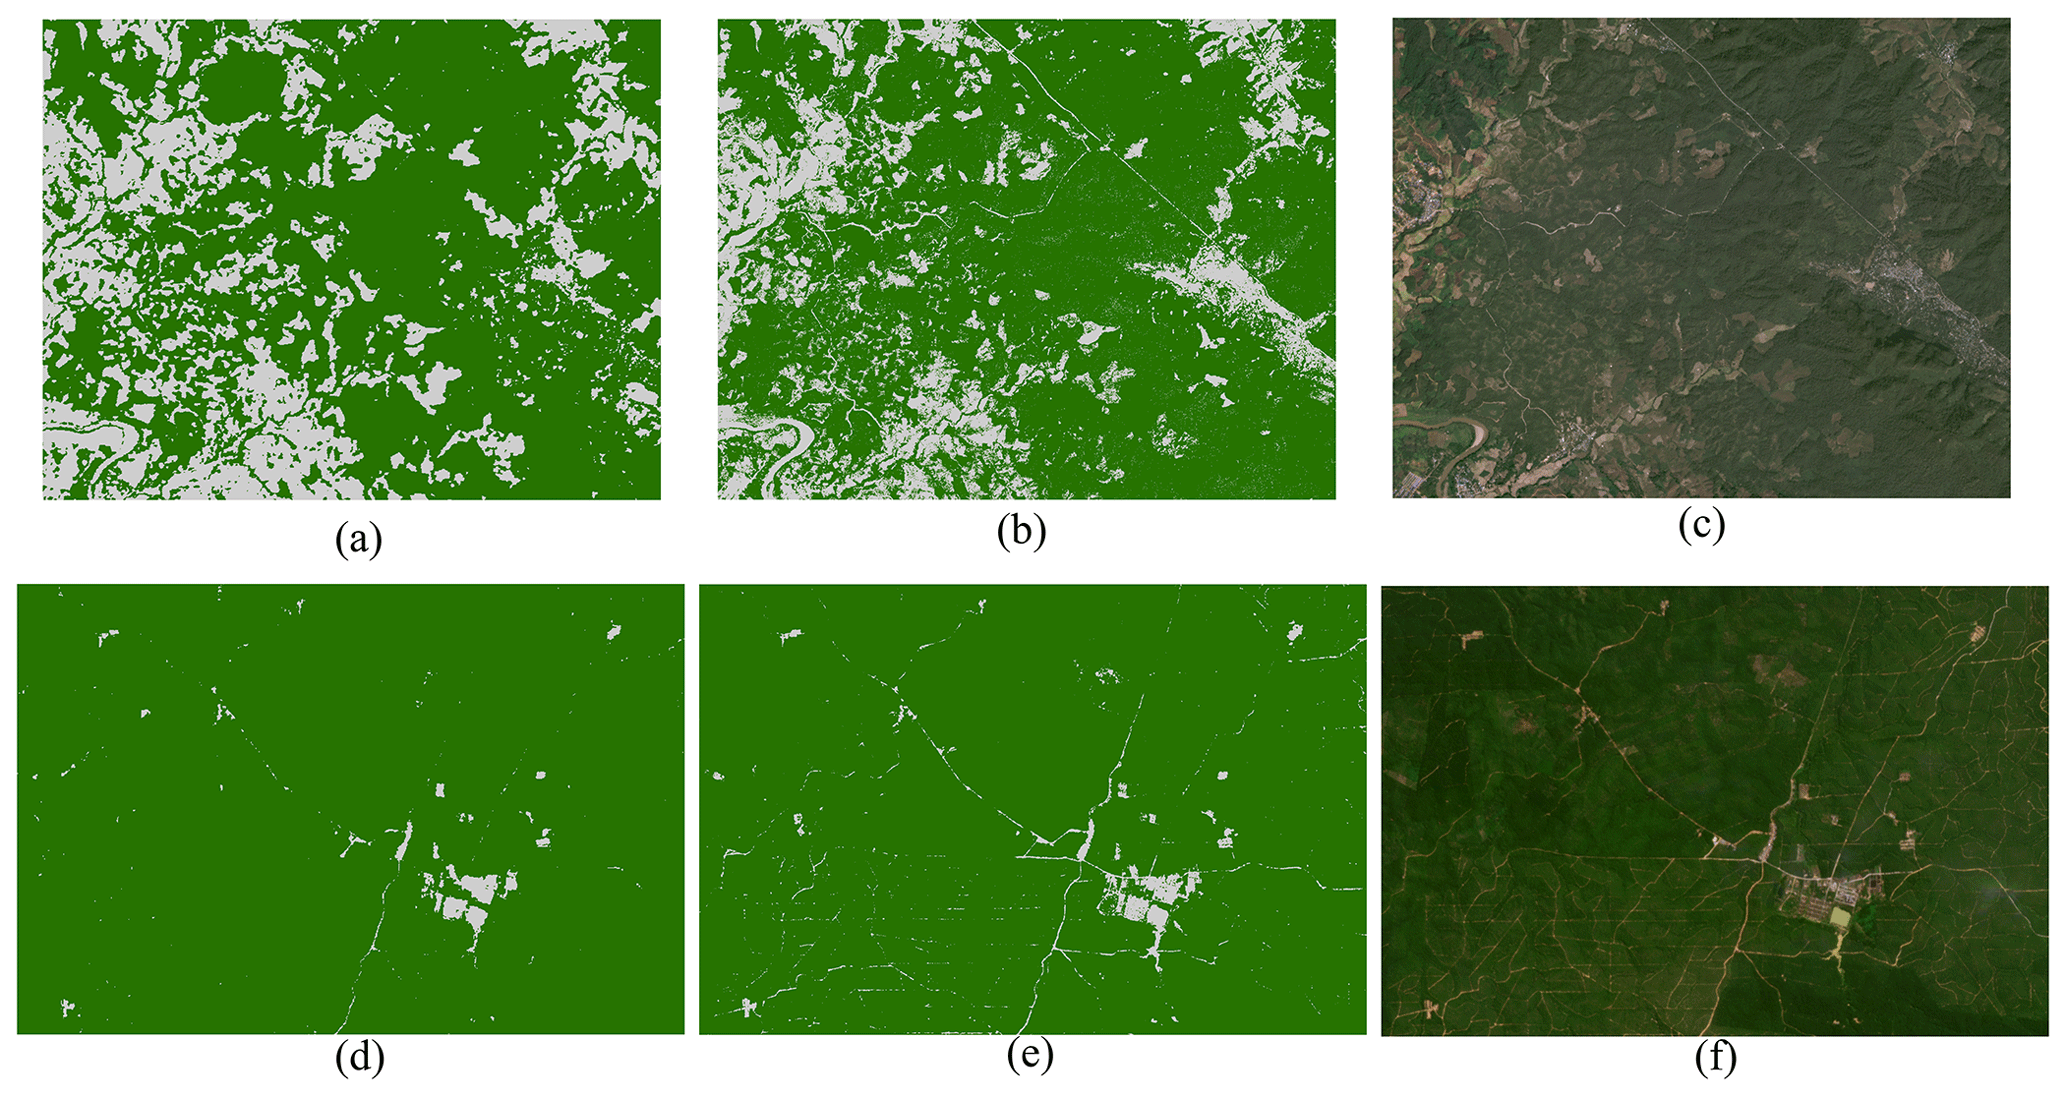
Figure 9Comparison of ESA WorldCover 2020 (a, d), Planet-NICFI tree cover (b, e) and Planet-NICFI imagery (https://www.planet.com/nicfi/, last access: 6 September 2023; c, f) for the mainland SEA area (17.102–17.166∘ N, 98.310–98.392∘ E; a–c) and the maritime SEA area (1.387–1.442∘ N, 99.983–100.064∘ E; d–f). Green and light gray indicate tree cover and non-tree cover, respectively.
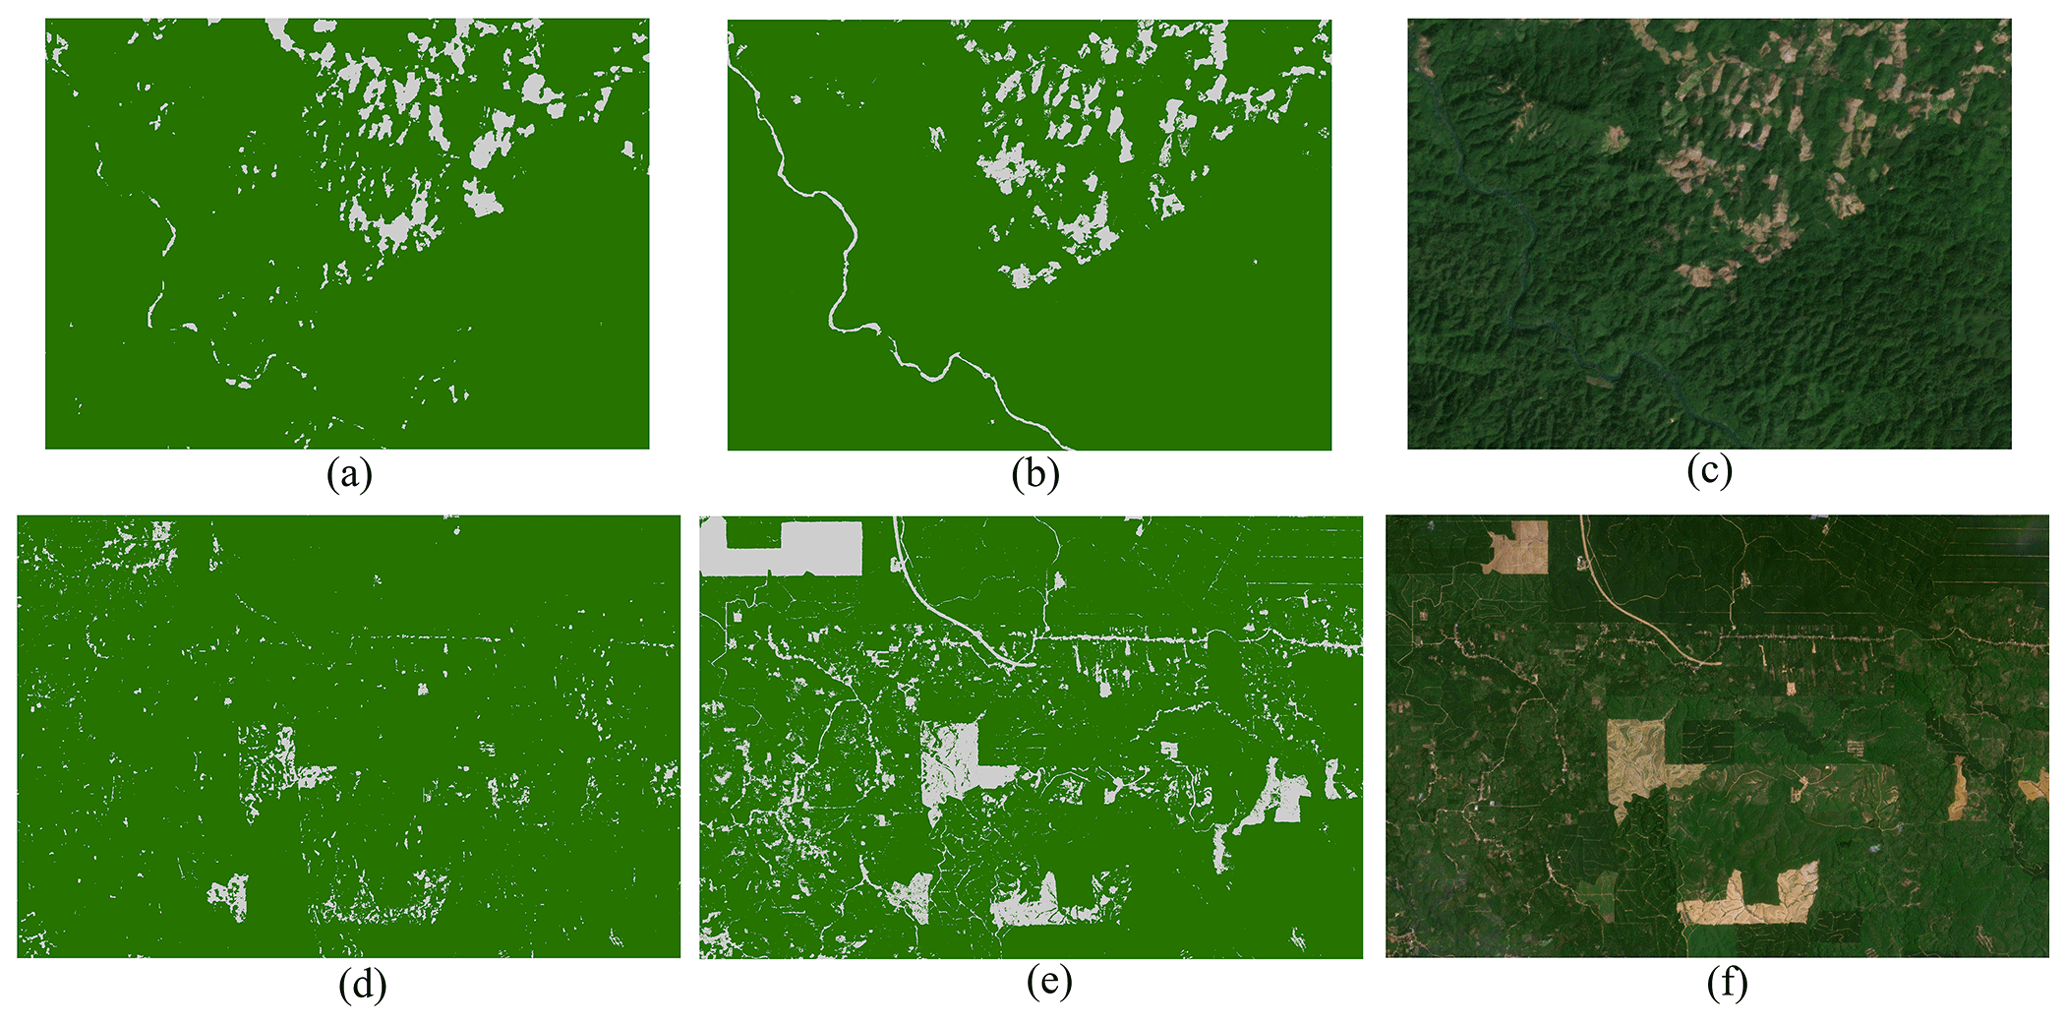
Figure 10Comparison of ESA WorldCover 2021 (a, d), Planet-NICFI tree cover (b, e) and Planet-NICFI imagery (https://www.planet.com/nicfi/, last access: 6 September 2023; c, f) for the mainland SEA area (18.676–18.726∘ N, 102.179–102.249∘ E; a–c) and the maritime SEA area (1.892–1.967∘ N, 99.951–100.063∘ E; d–f). Green and light gray indicate tree cover and non-tree cover, respectively.
Our Planet-NICFI tree cover map product was mapped twice a year to mitigate the impact of smog, light, cloud and topographic effects in tropical areas (Roy et al., 2021; Marta, 2018). This high-resolution tree cover map product meets the minimum tree height requirement of ≥5 m needed to further generate forest data. However, it should be noted that we cannot guarantee 100 % tree cover for each higher-resolution pixel, which may introduce some uncertainties when using the higher-resolution tree cover maps. Despite excluding plantations during sample point labeling, some plantations, such as oil palm, may still be mixed into our tree cover map product due to similarities in anomalies (Mugabowindekwe et al., 2023; Zanaga et al., 2022, 2021). As a result, caution should be exercised when using our Planet-NICFI tree cover map product for certain purposes.
To generate a high-resolution time series of the tree cover map product at a continental scale, we utilized advanced random-forest-based machine learning algorithms on the GEE platform. However, for fine-scale tree cover mapping, deep-learning-based segmentation methods, such as U-Net (Falk et al., 2019), are necessary, particularly when using limited bands (Mugabowindekwe et al., 2023; Wagner et al., 2023; Zanaga et al., 2022, 2021; Brandt et al., 2020). As a result, our tree cover map product still has some uncertainty due to limitations in the optical PlanetScope imagery. Additionally, our tree cover map product has the potential to display a salt-and-pepper phenomenon in certain locations and years, which is attributed to the utilization of the RF method. To improve our tree cover mapping product with higher accuracy, we need to consider adding more bands or utilizing advanced deep learning algorithms in the future.
The scripts used to generate all Planet-NICFI V1.0 tree cover for 2016–2021 are provided in JavaScript (https://code.earthengine.google.com/?scriptPath=users%2Fyftaurus%2Fcodes%3APlanet_RF-LC_rac, last access: 6 September 2023). The maps can be automatically generated by running the codes. The scripts are also available from Zhenzhong Zeng upon request.
The high-resolution Planet-NICFI V1.0 time series of the tree cover product is now available at https://doi.org/10.57760/sciencedb.07173 (Yang and Zeng, 2023). This product is provided in the Mollweide projection and the World Geodetic System 1984 (WGS1984) datum and geographic coordinate system. Tree cover and non-tree cover are denoted as 0 and 1, respectively, in each yearly file and are stored as UINT8 in GeoTIFF format. The GeoTIFF files are named Planet-FC_SEA_<YEAR>_prj.tif – for example, Planet-FC_SEA_16_prj.tif.
We have successfully generated the first accurate and high-resolution time series of the tree cover map product for SEA by combining optical and SAR satellite observations, utilizing advanced random forest machine learning algorithms on the GEE platform. Our Planet-NICFI tree cover map product exhibits excellent accuracy and consistency over 6 years (2016–2021). The baseline tree cover map product, with a resolution of 4.77 m, can be easily converted to forest cover maps at different resolutions to cater to the diverse needs of users. Moreover, our tree cover map product has the unique ability to address rounding errors in forest cover mapping by accurately capturing isolated trees and monitoring the removal of long, narrow forest cover. These cutting-edge, fine-scale time series of the tree cover maps represent a milestone in forest monitoring and offer unprecedented opportunities for users across diverse disciplines.
ZZ designed the research. FY performed the analysis and wrote the draft. All authors contributed to the interpretation of the results and the writing of the paper.
The contact author has declared that none of the authors has any competing interests.
Publisher's note: Copernicus Publications remains neutral with regard to jurisdictional claims in published maps and institutional affiliations.
This study was supported by the National Natural Science Foundation of China (grant no. 42071022), the start-up fund provided by the Southern University of Science and Technology (grant no. 29/Y01296122) and the China Postdoctoral Science Foundation (grant no. 2022M711472). We thank Sen Jiang, Haowen Duan, Hao Li and Fangdong Fu for making the tree cover/non-tree cover label data that were used to assess the time series of the tree cover map products.
This research has been supported by the National Natural Science Foundation of China (grant no. 42071022) and the China Postdoctoral Science Foundation (grant no. 2022M711472).
This paper was edited by Nophea Sasaki and reviewed by two anonymous referees.
Achard, F., Beuchle, R., Mayaux, P., Stibig, H. J., Bodart, C., Brink, A., Carboni, S., Desclée, B., Donnay, F., Eva, H. D., and Lupi, A.: Determination of tropical deforestation rates and related carbon losses from 1990 to 2010, Global Change Biol., 20, 2540–2554, 2014.
Allouche, O., Tsoar, A., and Kadmon, R.: Assessing the accuracy of species distribution models: prevalence, kappa and the true skill statistic (TSS), J. Appl. Ecol., 43, 1223–1232, 2006.
Brandt, M., Tucker, C. J., Kariryaa, A., Rasmussen, K., Abel, C., Small, J., Chave, J., Rasmussen, L. V., Hiernaux, P., Diouf, A. A., and Kergoat, L.: An unexpectedly large count of trees in the West African Sahara and Sahel, Nature, 587, 78–82, 2020.
Buchhorn, M., Lesiv, M., Tsendbazar, N. E., Herold, M., Bertels, L., and Smets, B.: Copernicus global land cover layers – collection 2, Remote Sens.-Basel, 12, 1044, 2020.
Chen, J., Chen, J., Liao, A., Cao, X., Chen, L., Chen, X., He, C., Han, G., Peng, S., Lu, M., and Zhang, W.: Global land cover mapping at 30 m resolution: A POK-based operational approach, ISPRS J. Photogramm., 103, 7–27, 2015.
CoP26, G. L.: Glasgow Leaders' Declaration on Forests and Land Use, https://webarchive.nationalarchives.gov.uk/ukgwa/20230418175226/https://ukcop26.org/glasgow-leaders-declaration-on-forests-and-land-use/, last access: 6 September 2023.
ESA: Land Cover CCI Product User Guide Version 2, Tech. Rep., http://maps.elie.ucl.ac.be/CCI/viewer/download/ESACCI-LC-Ph2-PUGv2_2.0.pdf (last access: 6 September 2023), 2017.
Falk, T., Mai, D., Bensch, R., Çiçek, Ö., Abdulkadir, A., Marrakchi, Y., Böhm, A., Deubner, J., Jäckel, Z., Seiwald, K., and Dovzhenko, A.: U-Net: deep learning for cell counting, detection, and morphometry, Nat. Methods, 16, 67–70, 2019.
FAO: Global Forest Resources Assessment 2020 Main report, https://www.fao.org/3/ca9825en/ca9825en.pdf, last access: 6 September 2023.
Feng, Y., Ziegler, A. D., Elsen, P. R., Liu, Y., He, X., Spracklen, D. V., Holden, J., Jiang, X., Zheng, C., and Zeng, Z.: Upward expansion and acceleration of forest clearance in the mountains of Southeast Asia, Nat. Sustain., 4, 892–899, 2021.
Friedl, M. and Sulla-Menashe, D.: MCD12Q1 MODIS/Terra+Aqua Land Cover Type Yearly L3 Global 500 m SIN Grid V006, NASA EOSDIS Land Processes DAAC, https://doi.org/10.5067/MODIS/MCD12Q1.006, 2019.
Gong, P., Liu, H., Zhang, M., Li, C., Wang, J., Huang, H., Clinton, N., Ji, L., Li, W., Bai, Y., Chen, B., Xu, B., Zhu, Z., Yuan, C., Suen, H. Ping, Guo, J., Xu, N., Li, W., Zhao, Y., Yang, J., Yu, C., Wang, X., Fu, H., Yu, L., Dronova, I., Hui, F., Cheng, X., Shi, X., Xiao, F., Liu, Q., and Song, L.: Stable classification with limited sample: Transferring a 30 m resolution sample set collected in 2015 to mapping 10 m resolution global land cover in 2017, Sci. Bull., 64, 370–373, 2019.
Gorelick, N., Hancher, M., Dixon, M., Ilyushchenko, S., Thau, D., and Moore, R.: Google Earth Engine: Planetary-scale geospatial analysis for everyone, Remote Sens. Environ., 202, 18–27, 2017.
Hammer, D., Kraft, R., and Wheeler, D.: Alerts of forest disturbance from MODIS imagery, Int. J. Appl. Earth Obs., 33, 1–9, 2014.
Hansen, M. C., Stehman, S. V., and Potapov, P. V.: Quantification of global gross forest cover loss, P. Natl. Acad. Sci. USA, 107, 8650–8655, 2010.
Hansen, M. C., Potapov, P. V., Moore, R., Hancher, M., Turubanova, S. A., Tyukavina, A., Thau, D., Stehman, S. V., Goetz, S. J., Loveland, T. R., and Kommareddy, A.: High-resolution global maps of 21st-century forest cover change, Science, 342, 850–853, 2013.
Hsieh, P. F., Lee, L. C., and Chen, N. Y.: Effect of spatial resolution on classification errors of pure and mixed pixels in remote sensing, IEEE T. Geosci. Remote, 39, 2657–2663, 2001.
Karra, K., Kontgis, C., Statman-Weil, Z., Mazzariello, J. C., Mathis, M., and Brumby, S. P.: Global land use/land cover with Sentinel 2 and deep learning, in: IEEE International Geoscience and Remote Sensing Symposium IGARSS, IEEE, 4704–4707, 11–16 July 2021, Brussels, Belgium, https://doi.org/10.1109/IGARSS47720.2021.9553499, 2021.
Lang, N., Jetz, W., Schindler, K., and Wegner, J. D.: A high-resolution canopy height model of the Earth, arXiv [preprint], https://doi.org/10.48550/arxiv.2204.08322, 2022.
Marta, S.: Planet imagery product specifications, https://assets.planet.com/docs/Combined-Imagery-Product-Spec-Dec-2018.pdf, last access: 6 September 2023.
Mugabowindekwe, M., Brandt, M., Chave, J., Reiner, F., Skole, D. L., Kariryaa, A., Igel, C., Hiernaux, P., Ciais, P., Mertz, O., and Tong, X.: Nation-wide mapping of tree-level aboveground carbon stocks in Rwanda, Nat. Clim. Change, 13, 91–97, 2023.
Oishi, Y., Sawada, Y., Kamei, A., Murakami, K., Nakamura, R., and Matsunaga, T.: Impact of Changes in Minimum Reflectance on Cloud Discrimination, Remote Sens.-Basel, 10, 693, 2018.
Olofsson, P., Foody, G. M., Herold, M., Stehman, S. V., Woodcock, C. E., and Wulder, M. A.: Good practices for estimating area and assessing accuracy of land change, Remote Sens. Environ., 148, 42–57, 2014.
Parker, C., Mitchell, A., Trivedi, M., and Mardas, N.: The little REDD book: a guide to governmental and non-governmental proposals for reducing emissions from deforestation and degradation, http://www.globalcanopy.org/themedia/file/PDFs/LRB_lowres/lrb_en.pdf (last access: 6 September 2023), 2008.
Planet Team: Planet Application Program Interface: In Space for Life on Earth, San Francisco, CA, https://api.planet.com (last access: 6 September 2023), 2017.
Pontius Jr., R. G. and Millones, M.: Death to Kappa: birth of quantity disagreement and allocation disagreement for accuracy assessment, Int. J. Remote Sens., 32, 4407–4429, 2011.
Reiner, F., Brandt, M., Tong, X., Skole, D., Kariryaa, A., Ciais, P., Davies, A., Hiernaux, P., and Chave, J.: More than one quarter of Africa's tree cover found outside areas previously classified as forest, Nat. Commun., 14, 2258, 2023.
Roy, D. P., Huang, H., Houborg, R., and Martins, V. S.: A global analysis of the temporal availability of PlanetScope high spatial resolution multi-spectral imagery, Remote Sens. Environ., 264, 112586, https://doi.org/10.1016/j.rse.2021.112586, 2021.
Sexton, J. O., Noojipady, P., Song, X. P., Feng, M., Song, D. X., Kim, D. H., Anand, A., Huang, C., Channan, S., Pimm, S. L., and Townshend, J. R.: Conservation policy and the measurement of forests, Nat. Clim. Change, 6, 192–196, 2016.
Shimada, M., Itoh, T., Motooka, T., Watanabe, M., Shiraishi, T., Thapa, R., and Lucas, R.: New global forest/non-forest maps from ALOS PALSAR data (2007–2010), Remote Sens. Environ., 155, 13–31, 2014.
Shukla, P. R., Skea, J., Slade, R., Al Khourdajie, A., Van Diemen, R., McCollum, D., Pathak, M., Some, S., Vyas, P., Fradera, R., and Belkacemi, M.: Climate change 2022: Mitigation of climate change, IPCC Sixth Assessment Report, https://www.ipcc.ch/report/ar6/wg3/downloads/report/IPCC_AR6_WGIII_FullReport.pdf (last access: 6 September 2023), 2022.
Tsendbazar, N., Herold, M., Li, L., Tarko, A., De Bruin, S., Masiliunas, D., Lesiv, M., Fritz, S., Buchhorn, M., Smets, B., and Van De Kerchove, R.: Towards operational validation of annual global land cover maps, Remote Sens. Environ., 266, 112686, https://doi.org/10.1016/j.rse.2021.112686, 2021.
Velasco, R. F., Lippe, M., Tamayo, F., Mfuni, T., Sales-Come, R., Mangabat, C., Schneider, T., and Günter, S.: Towards accurate mapping of forest in tropical landscapes: A comparison of datasets on how forest transition matters, Remote Sens. Environ., 274, 112997, https://doi.org/10.1016/j.rse.2022.112997, 2022.
Wagner, F. H., Dalagnol, R., Silva-Junior, C. H., Carter, G., Ritz, A. L., Hirye, M. C., Ometto, J. P., and Saatchi, S.: Mapping Tropical Forest Cover and Deforestation with Planet NICFI Satellite Images and Deep Learning in Mato Grosso State (Brazil) from 2015 to 2021, Remote Sens., 15, 521, https://doi.org/10.3390/rs15020521, 2023.
Wigneron, J. P., Fan, L., Ciais, P., Bastos, A., Brandt, M., Chave, J., Saatchi, S., Baccini, A., and Fensholt, R.: Tropical forests did not recover from the strong 2015–2016 El Niño event, Sci. Adv., 6, eaay4603, https://doi.org/10.1126/sciadv.aay4603, 2020.
Xu, Y., Yu, L., Li, W., Ciais, P., Cheng, Y., and Gong, P.: Annual oil palm plantation maps in Malaysia and Indonesia from 2001 to 2016, Earth Syst. Sci. Data, 12, 847–867, https://doi.org/10.5194/essd-12-847-2020, 2020.
Yang, F. and Zeng, Z.: Fine-scale maps of tree cover generated using time-series Planet-NICFI imagery for Southeast Asia (2016-2021) [DS/OL], V1, Science Data Bank [data set], https://doi.org/10.57760/sciencedb.07173, 2023.
Yang, F., Jiang, X., Ziegler, A. D., Estes, L. D., Wu, J., Chen, A., Ciais, P., Wu, J., and Zeng, Z.: Improved finescale tropical forest cover mapping for Southeast Asia using Planet-NICFI and Sentinel-1 imagery, J. Remote Sens., 3, 0064, https://doi.org/10.34133/remotesensing.0064, 2023.
Zanaga, D., Van De Kerchove, R., De Keersmaecker, W., Souverijns, N., Brockmann, C., Quast, R., Wevers, J., Grosu, A., Paccini, A., Vergnaud, S., Cartus, O., Santoro, M., Fritz, S., Georgieva, I., Lesiv, M., Carter, S., Herold, M., Li, L. L., Tsendbazar, N. E., Ramoino, F., and Arino, O.: ESA WorldCover 10 m 2020 v100, https://doi.org/10.5281/zenodo.5571936, 2021.
Zanaga, D., Van De Kerchove, R., Daems, D., De Keersmaecker, W., Brockmann, C., Kirches, G., Wevers, J., Cartus, O., Santoro, M., Fritz, S., and Lesiv, M.: ESA WorldCover 10 m 2021 v200, https://doi.org/10.5281/zenodo.7254221, 2022.
Zeng, Z., Estes, L., Ziegler, A. D., Chen, A., Searchinger, T., Hua, F., Guan, K., Jintrawet, A., and Wood, E. F.: Highland cropland expansion and forest loss in Southeast Asia in the twenty-first century, Nat. Geosci., 11, 556–562, 2018a.
Zeng, Z., Gower, D., and Wood, E. F.: Accelerating Forest loss in Southeast Asian Massif in the 21st century: A case study in Nan Province, Thailand, Global Change Biol., 24, 4682–4695, 2018b.