the Creative Commons Attribution 4.0 License.
the Creative Commons Attribution 4.0 License.
 | 05 Sep 2023
An atlas of seabed biodiversity for Aotearoa New Zealand
Fabrice Stephenson
Tom Brough
Drew Lohrer
Daniel Leduc
Shane Geange
Owen Anderson
David Bowden
Malcolm R. Clark
Niki Davey
Enrique Pardo
Dennis P. Gordon
Brittany Finucci
Michelle Kelly
Diana Macpherson
Lisa McCartain
Sadie Mills
Kate Neill
Wendy Nelson
Rachael Peart
Matthew H. Pinkerton
Geoffrey B. Read
Jodie Robertson
Ashley Rowden
Kareen Schnabel
Andrew Stewart
Carl Struthers
Leigh Tait
Di Tracey
Shaun Weston
Carolyn Lundquist
The waters of Aotearoa New Zealand span over 4.2 million km2 of the South Pacific Ocean and harbour a rich diversity of seafloor-associated taxa. Due to the immensity and remoteness of the area, there are significant gaps in the availability of data that can be used to quantify and map the distribution of seafloor and demersal biodiversity, limiting effective management. In this study, we describe the development and accessibility of an online atlas of seabed biodiversity that aims to fill these gaps. Species distribution models were developed for 579 taxa across four taxonomic groups: demersal fish, reef fish, subtidal invertebrates and macroalgae. Spatial layers for taxa distribution based on habitat suitability were statistically validated and then, as a further check, evaluated by taxonomic experts to provide measures of confidence to guide the future use of these layers. Spatially explicit uncertainty (SD) layers were also developed for each taxon distribution. We generated layer-specific metadata, including statistical and expert evaluation scores, which were uploaded alongside the accompanying spatial layers to the open access database Zenodo. This database provides the most comprehensive source of information on the distribution of seafloor taxa for Aotearoa New Zealand and is thus a valuable resource for managers, researchers and the public that will guide the management and conservation of seafloor communities. The atlas of seabed biodiversity for Aotearoa New Zealand is freely accessible via the open-access database Zenodo under https://doi.org/10.5281/zenodo.7083642 (Stephenson et al., 2022).
- Article
(4783 KB) - Full-text XML
-
Supplement
(842 KB) - BibTeX
- EndNote


The identification of priority areas for resource management and conservation biology is often hampered by a lack of comprehensive knowledge of biodiversity patterns (Ferrier et al., 2007; Arponen et al., 2008; Hortal et al., 2015). Unfortunately, producing quantitative descriptions of large-scale biodiversity patterns is challenging, particularly in offshore marine environments, where sampling is both difficult and expensive, resulting in patchy and/or irregular coverage (Leathwick et al., 2006; Thomson et al., 2014). Species distribution models (SDMs), which are correlative models that predict the occurrence of species in relation to environmental variables, can provide estimates of biodiversity patterns across broad spatial scales where data are often sparse. Spatial predictions of species distributions from SDMs have become an important part of resource management and conservation biology (Moilanen et al., 2011).
The development of SDMs has been further advanced by increasing accessibility to biological records from open-access data repositories such as OBIS (https://obis.org/, last access: 4 September 2023) and GBIF (https://www.gbif.org/, last access: 4 September 2023) and journals that specialise in providing descriptions of, and access to, datasets (e.g. Earth System Science Data). In addition, the spatially explicit environmental variables that are used to predict species distributions from the SDMs are also more accessible and are available at increasingly finer spatial resolutions (i.e. smaller grid cells size), e.g. Bio-ORACLE (Assis et al., 2018). Finally, the development of flexible machine learning methods (e.g. boosted regression tree, Elith et al., 2006), random forest models (Breiman, 2001), Maxent software (Phillips et al., 2006, among others) and advances in computing power mean that it is possible to automate the prediction of a large number of species distributions with less input required from ecologists or statisticians for model parameterisation. Species distribution layers are therefore becoming more available to stakeholders and decision-makers, thus facilitating their use in spatial management and systematic conservation planning.
Geographic information systems (GIS) provide a tool to store, visualise and explore relationships between spatial information describing taxa distributions (Hamylton, 2017). Increasingly, GIS are available online (as online atlases, e.g. Asaad et al. (2019), providing a platform to explore and download data without the requirement to have access to traditional desktop-based GIS. Online atlases exist for several coastal regions, including Ireland's Marine Atlas (https://atlas.marine.ie/, last access: 4 September 2023), the Oregon Coastal Atlas (https://www.coastalatlas.net/, last access: 4 September 2023), the European Atlas of the Seas (Barale et al., 2018) and the Atlas of Biodiversity Conservation in the Coral Triangle (https://uoa.maps.arcgis.com/apps/MinimalGallery/index.html?appid=e0ccfa15b54d49de9ea6a8db2079d8ac, last access: 4 September 2023).
To facilitate access to biodiversity information for spatial management and systematic conservation planning, an online open-access atlas of seabed biodiversity for the seas around Aotearoa New Zealand was developed. Aotearoa New Zealand's territorial sea (TS) and exclusive economic zone (EEZ) extends over 4.2 million km2 of the South Pacific Ocean (≈25–57∘ S; 162∘ E–172∘ W) and contains high biological diversity, reflecting its wide latitudinal gradient (subtropical to subantarctic), range of water depths (intertidal to deep ocean trenches) and zones of high productivity (Costello et al., 2017; Gordon et al., 2010). In addition, the relatively large distance between Aotearoa New Zealand and other major land masses has resulted in a high degree of species endemism (i.e. a high number of species are not found elsewhere on the planet; Gordon et al., 2010). Such high biodiversity values mean that it is critical that spatial information of biodiversity is available for effective spatial management and conservation planning (Costello et al., 2017). Here, we provide an overview of the development and availability of spatial predictions for 579 taxa across four biotic groups (demersal fish, reef fish, subtidal invertebrates and macroalgae), their respective estimates of uncertainty and the online atlas created to download these data. In addition, we provide extensive metadata which include information on the robustness of the predictions based on quantitative assessments (i.e. how closely the model predictions match taxa records) and expert assessment. Together, these assessments provide valuable information for guiding the appropriate use of biodiversity information accessed from the atlas of seabed biodiversity of Aotearoa New Zealand.
This atlas was developed to provide geo-referenced seafloor biodiversity information, and their associated uncertainty, for the waters surrounding Aotearoa New Zealand. The process began with the pooling of datasets on taxa occurrence and high-resolution environmental variables that can be used to develop SDMs (Fig. 1). The methods used to produce the taxon distribution layers followed well-documented procedures and are provided in the supplementary materials (Supplement, Part 1). Briefly, spatial distributions were generated for each taxon from four biotic groups: demersal fish (n taxa = 235, bottom-dwelling fish occurring on, or near, the seafloor throughout the study area), reef fish (n taxa = 51, reef-associated fish, occurring on coastal rocky reefs), subtidal invertebrates (n taxa = 207, bottom-dwelling or benthic invertebrates occurring throughout the study area) and macroalgae (n taxa = 86, occurring in the coastal margin within the photic zone) using ensemble SDM methods. These ensembles used the combined outputs from flexible machine learning boosted regression tree (BRT) and random forest (RF) models as in Stephenson et al. (2021b).
Spatial predictions and associated uncertainty estimates were generated with differing geographical extents for the biotic groups to avoid predicting into completely unsampled parts of the study area, where such extrapolation would be highly uncertain (Fig. 2). Demersal fish and subtidal invertebrate taxa were predicted from the coastline to depths of 2000 m at a 1 km grid resolution (Fig. 2), whereas macroalgae and reef fish taxa were predicted to subtidal reef habitats only (defined by New Zealand Department of Conservation (DOC) national rocky reef layer) at a 250 m grid resolution. Macroalgae were predicted to depths shallower than 40 m, while reef fish were predicted to the full depth range of reef habitats (see Supplement, Part 1, for further details). Spatial predictions were represented by a habitat suitability index (HSI) – the relative suitability of the environmental envelope for each taxon ranging from 0 to 1, with higher values indicating a more suitable environment. To aid interpretation of HSI values, we followed the subjectively defined categorisation by Georgian et al. (2019): <0.4 = low suitability, 0.4–0.8 = moderate suitability and >0.8 = high suitability. Spatially explicit measures of uncertainty for each taxon were represented by the standard deviation (SD) of the mean HSI.
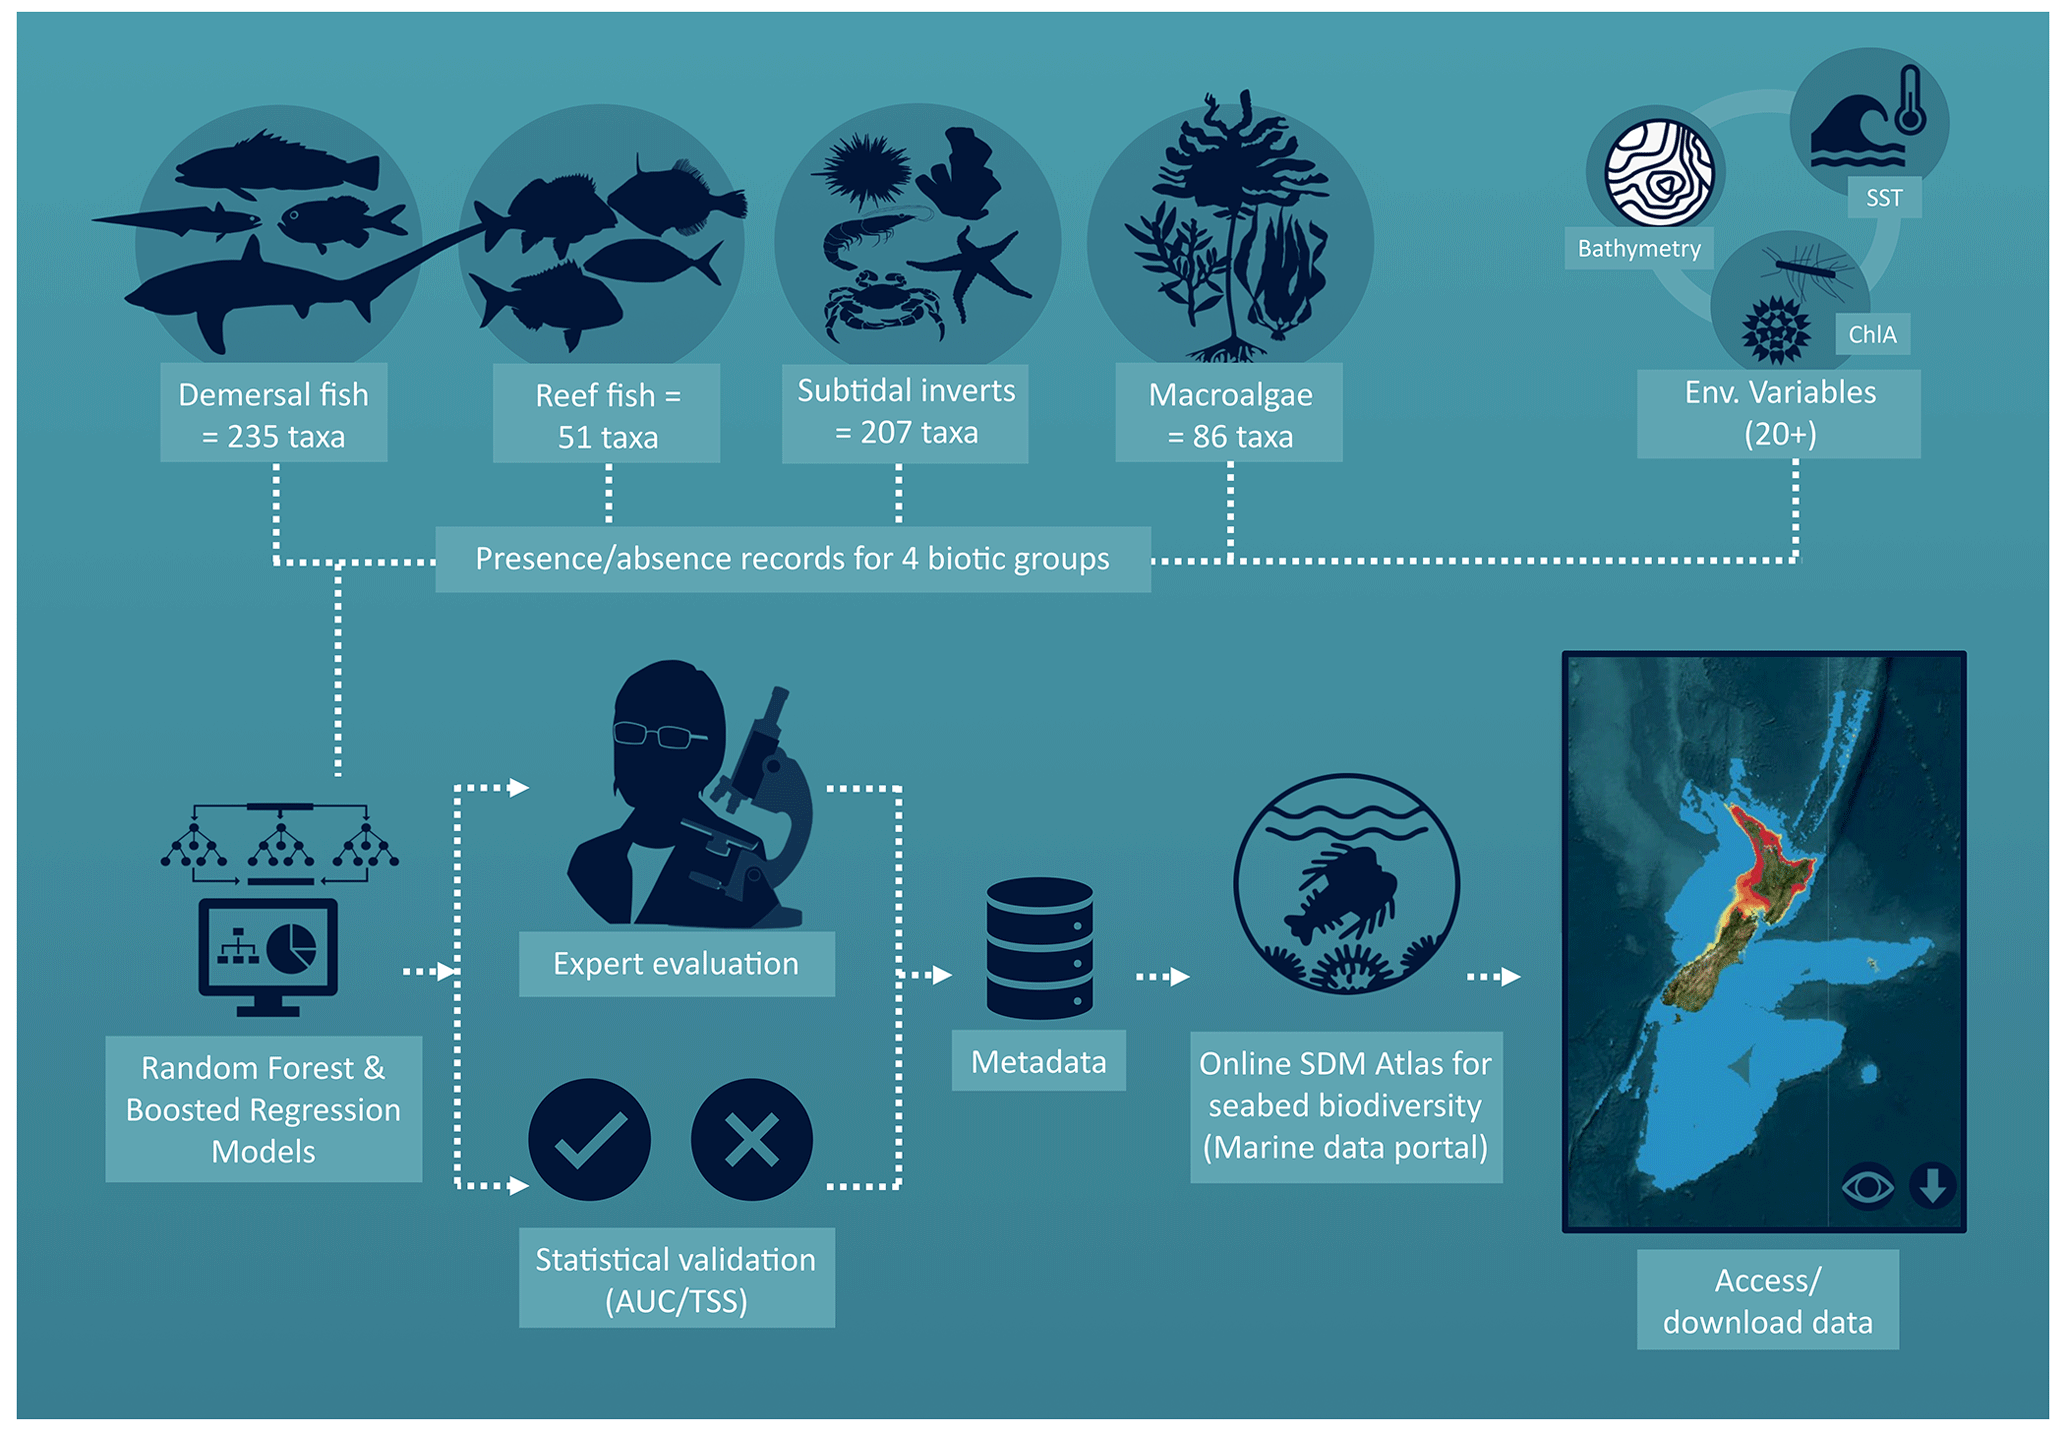
Figure 1Infographic illustrating the development of the atlas described in this study. Presence and absence (p/a) records for four taxonomic groups were combined with over 20 spatially explicit environmental variables and used to run ensembled SDMs of boosted regression trees and random forest models. The number of unique spatial occurrences available for modelling ranged over 50–13 926 unique spatial occurrences for demersal fish (collected over 1979–2016), 36–339 unique spatial occurrences for reef fish (collected over 1986–2014), 70–10 804 unique spatial occurrences for subtidal invertebrate (collected over 1896–2019) and 50–422 unique spatial occurrences for macroalgae taxa (collected over 1896–2018). The models were statistically validated using best practice procedures and evaluated by taxonomic experts to further appraise model accuracy. These assessments were incorporated within the metadata of each layer and uploaded, along with the layers themselves, to the Zenodo data portal. World imagery basemap utilised in the inset (ESRI et al., 2022).
An important component of being able to appropriately use the predicted distributions for management or future scientific investigations is to estimate how well the models perform. That is, if a model is assessed as performing very poorly, it may be best to use the associated prediction with caution or not at all. Historically, this model assessment was derived from statistical model fit metrics (i.e. assessing how well the model predicts to the available biological data). However, these measures can sometimes result in over-confidence in the model results (Bowden et al., 2021). Therefore, for each taxon, two measures of model performance were provided in the metadata (Fig. 1): firstly, model fit metrics using standard statistical validation; secondly, an expert evaluation (see Supplement, Part 1, for methods and further information). Combined, these assessments provide complementary information that highlights limitations and inaccuracies in the predicted taxa layers. Statistical model fits provided in the atlas include model evaluation scores (true skill statistic score) and the number of unique spatial occurrences to develop the modelled distribution for each taxon. The true skill statistic provides an index ranging from −1 to +1, where +1 equals perfect agreement and −1 is no better than random. Taxa records were aggregated spatially to a 1 km grid resolution representing unique spatial occurrences. The number of unique spatial occurrences varied over 50–13 926 for demersal fish, 36–339 for reef fish, 70–10 804 for subtidal invertebrates and 50–422 for macroalgae, with a minimum of 30 unique spatial occurrences required for modelling. Predicted distributions were also evaluated by taxonomists and ecologists with substantial expertise in the distribution and abundance of the various taxonomic groupings. The expert assessment focussed on the congruence between predicted taxa distribution and the expert view of taxa distribution, with scores ranging from 1 (very accurate – the predicted distribution reflects expert view of taxa distribution, i.e. >80 % overlap) to 5 (very inaccurate – the predicted distribution does not match the expert view of the taxa distribution, i.e. <20 % agreement). Taxon layers with expert evaluation scores of 4 or 5 (n=17) are likely to contain substantial inaccuracies (irrespective of the statistical model fits) and should therefore only be used with caution (this is highlighted in the metadata field “use limitations”; as an illustration, see examples of where model performance statistics and expert assessment agree and disagree in the Supplement, Part 1).
Metadata were developed for each layer following standard metadata protocols (ISO 19139 Geographic Information – Metadata – Implementation Specification, 2007) – see the Supplement, Part 1, for an overview and description of the metadata categories and an example for the subtidal invertebrate Goniocorella sp. (erect branching coral; Fig. 2). Metadata for all taxa available in the atlas of seabed biodiversity for Aotearoa New Zealand are available to download from this publication (Fig. 3) and include information on both the statistical model validation and expert evaluation for each layer in the atlas.
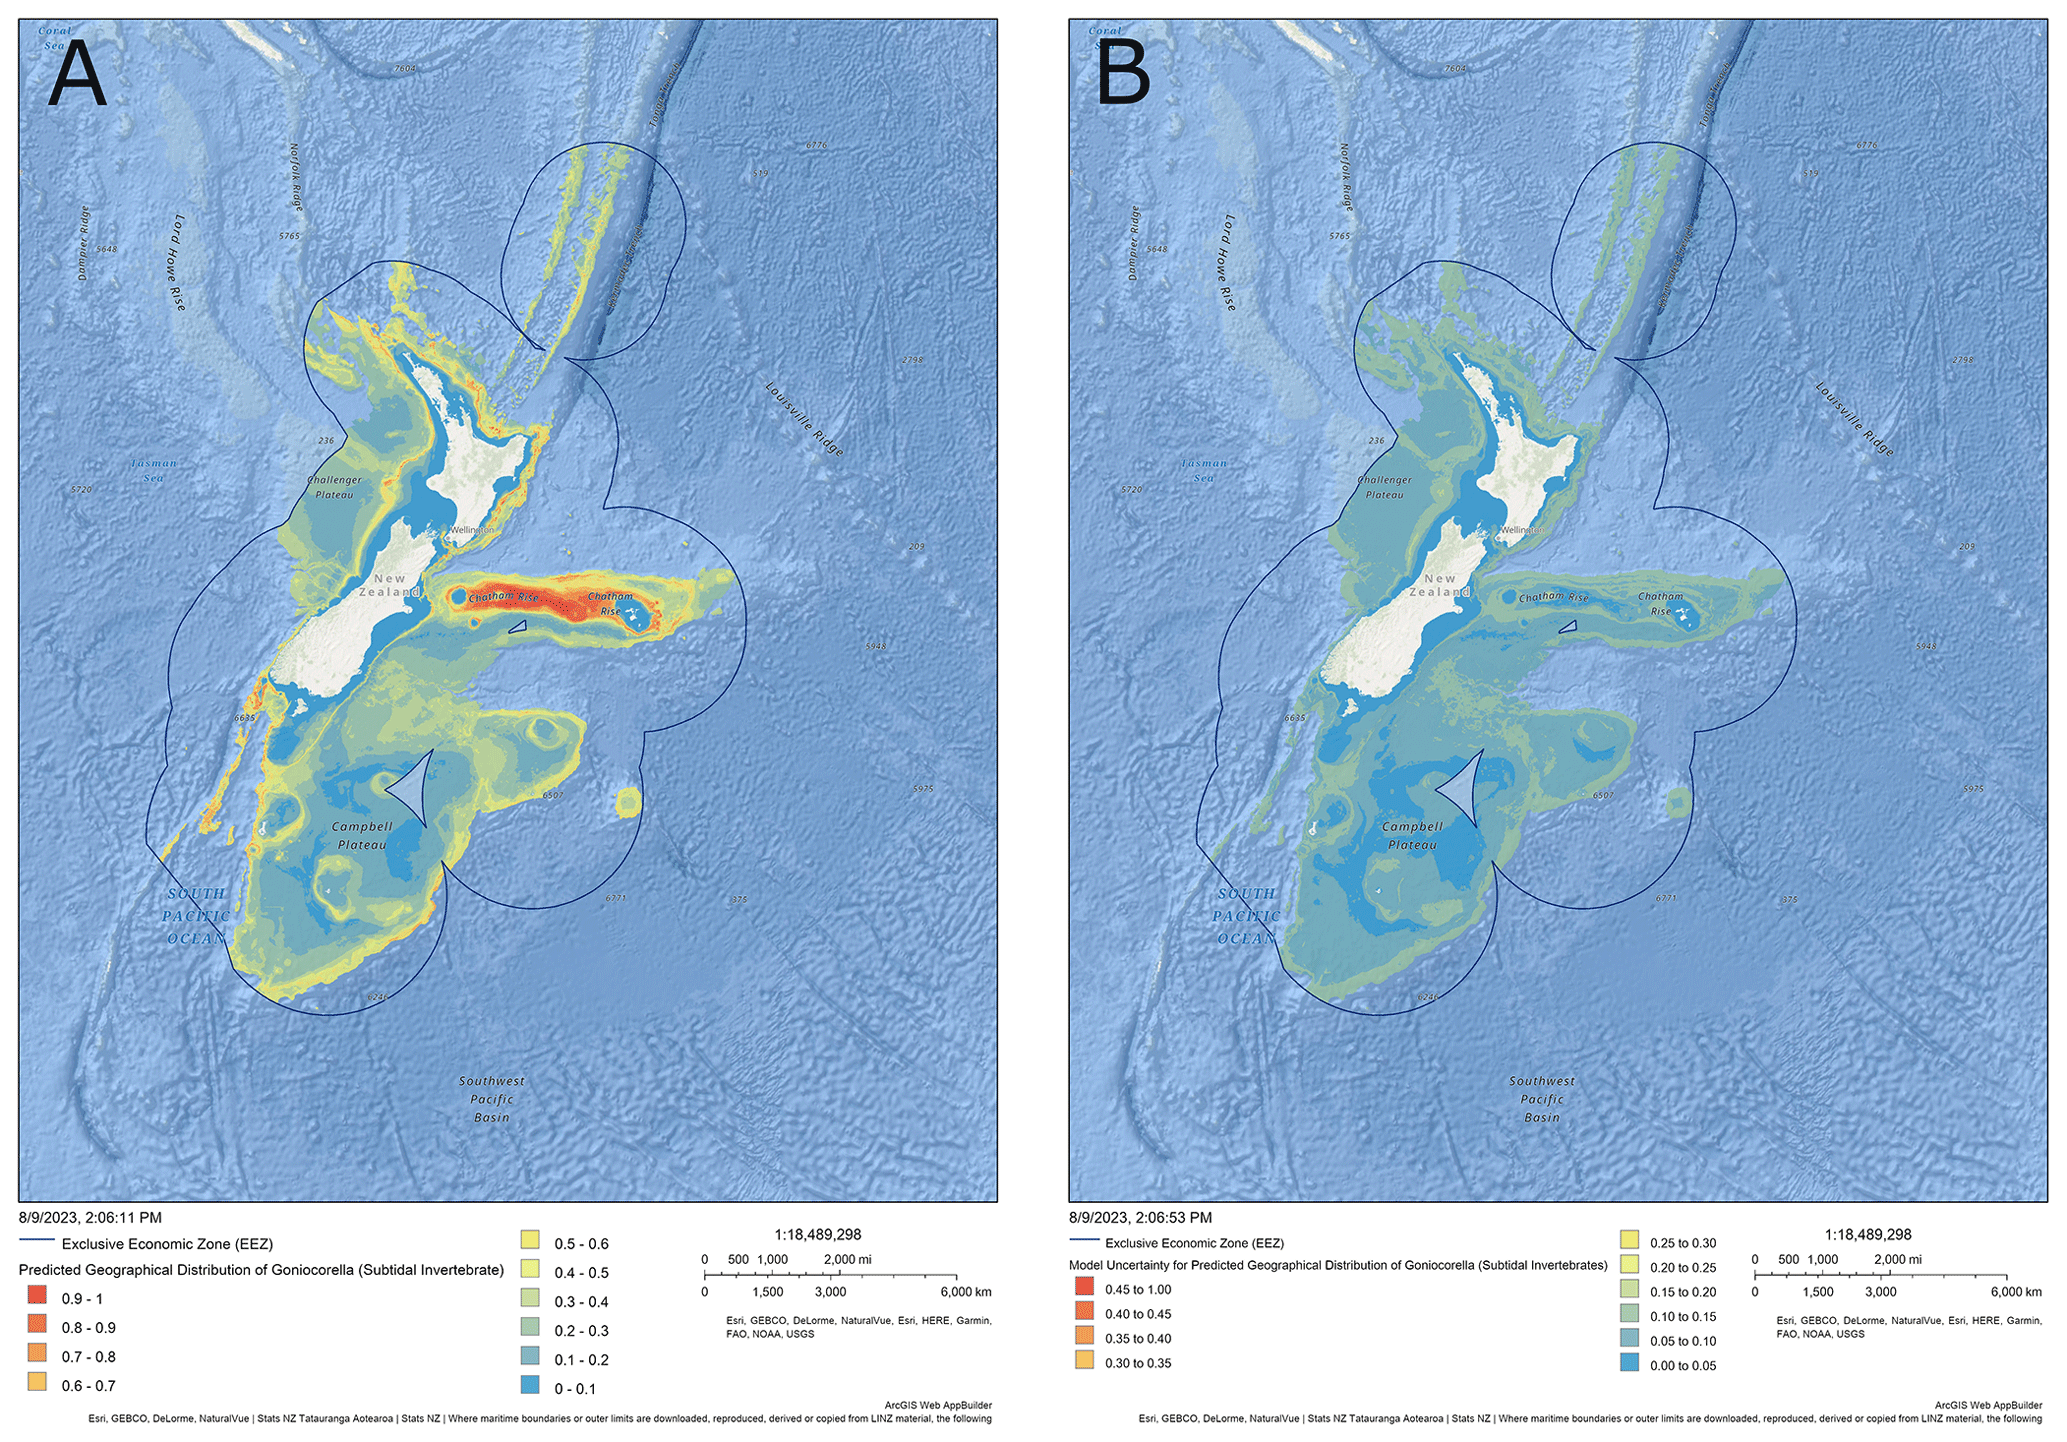
Figure 2Example output map from the atlas of seabed biodiversity for Aotearoa New Zealand as plotted in the NZ Department of Conservation's online geoportal, available at https://doc-marine-data-deptconservation.hub.arcgis.com/ (last access: 6 August 2023). The example includes (a) mean predicted habitat suitability index (HSI, 0–1) for the erect branching coral Goniocorella sp. (a subtidal invertebrate species) and (b) associated estimates of uncertainty (measured as the standard deviation of the mean HSI). The geoportal provides an easy means to explore the data, including by zooming into areas of interest (see Supplement, Part 2). Image produced under permission from the NZ Department of Conservation.
The atlas of seabed biodiversity for Aotearoa New Zealand is freely accessible via the open-access database Zenodo under https://doi.org/10.5281/zenodo.7083642 (Stephenson et al., 2022). The atlas is represented by eight ZIP folders (Table 1). Four folders of spatial predictions from the SDMs of each of four taxonomic groups (demersal fish, reef fish, subtidal invertebrates and macroalgae). A further four ZIP folders contain the associated uncertainty estimates for each SDM for each of the four taxonomic groups. Within each folder, a GeoTIFF raster file contains the associated information for each taxa, and the contents of each folder can be viewed using the “preview” function or downloaded using the “download” function (Fig. 3).
A further component of the atlas is a dataset containing the associated metadata for each spatial layer. Metadata are provided as an Excel file with a unique tab for each of the four taxonomic groups (Fig. 3). The metadata contain a wealth of information on the development and use of each layer within the atlas including statistical validation and expert appraisal scores (see Supplement, Part 1).
An additional and interactive source for the atlas is via an online GIS database which can be assessed through a web front-page: the DOC Marine Data Portal (https://doc-marine-data-deptconservation.hub.arcgis.com, last access: 4 September 2023). This source, administered by the NZ Department of Conservation, allows users to plot, interrogate and download individual layers of the atlas (see Supplement, Part 2).
Table 1Summary of the contents of data folders for the atlas of seabed biodiversity on the Zenodo database.
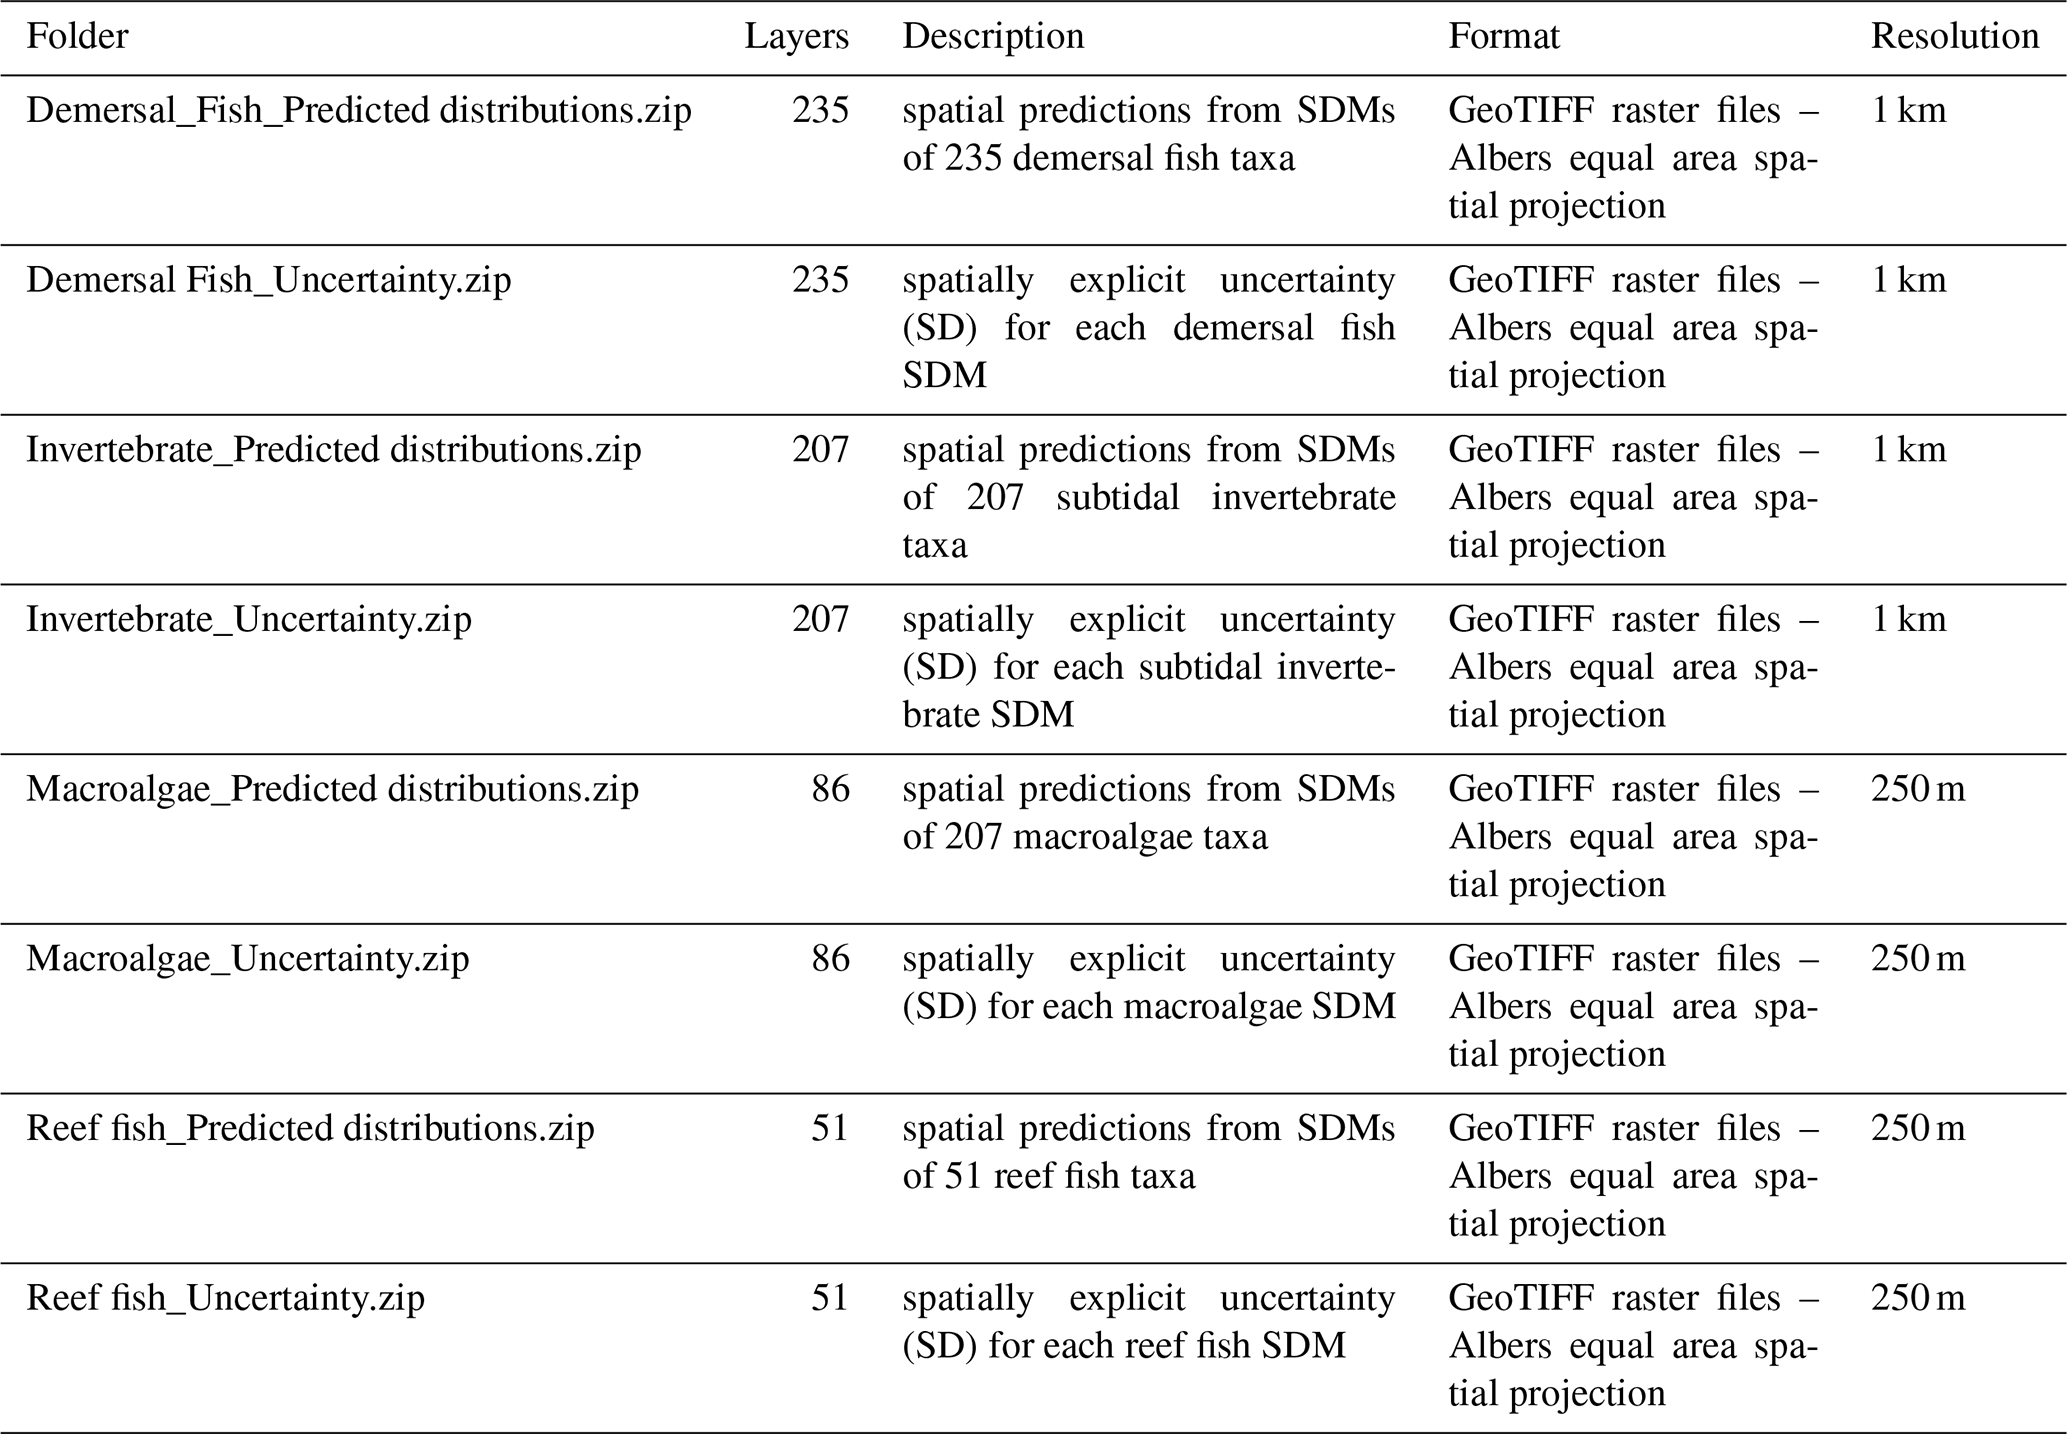
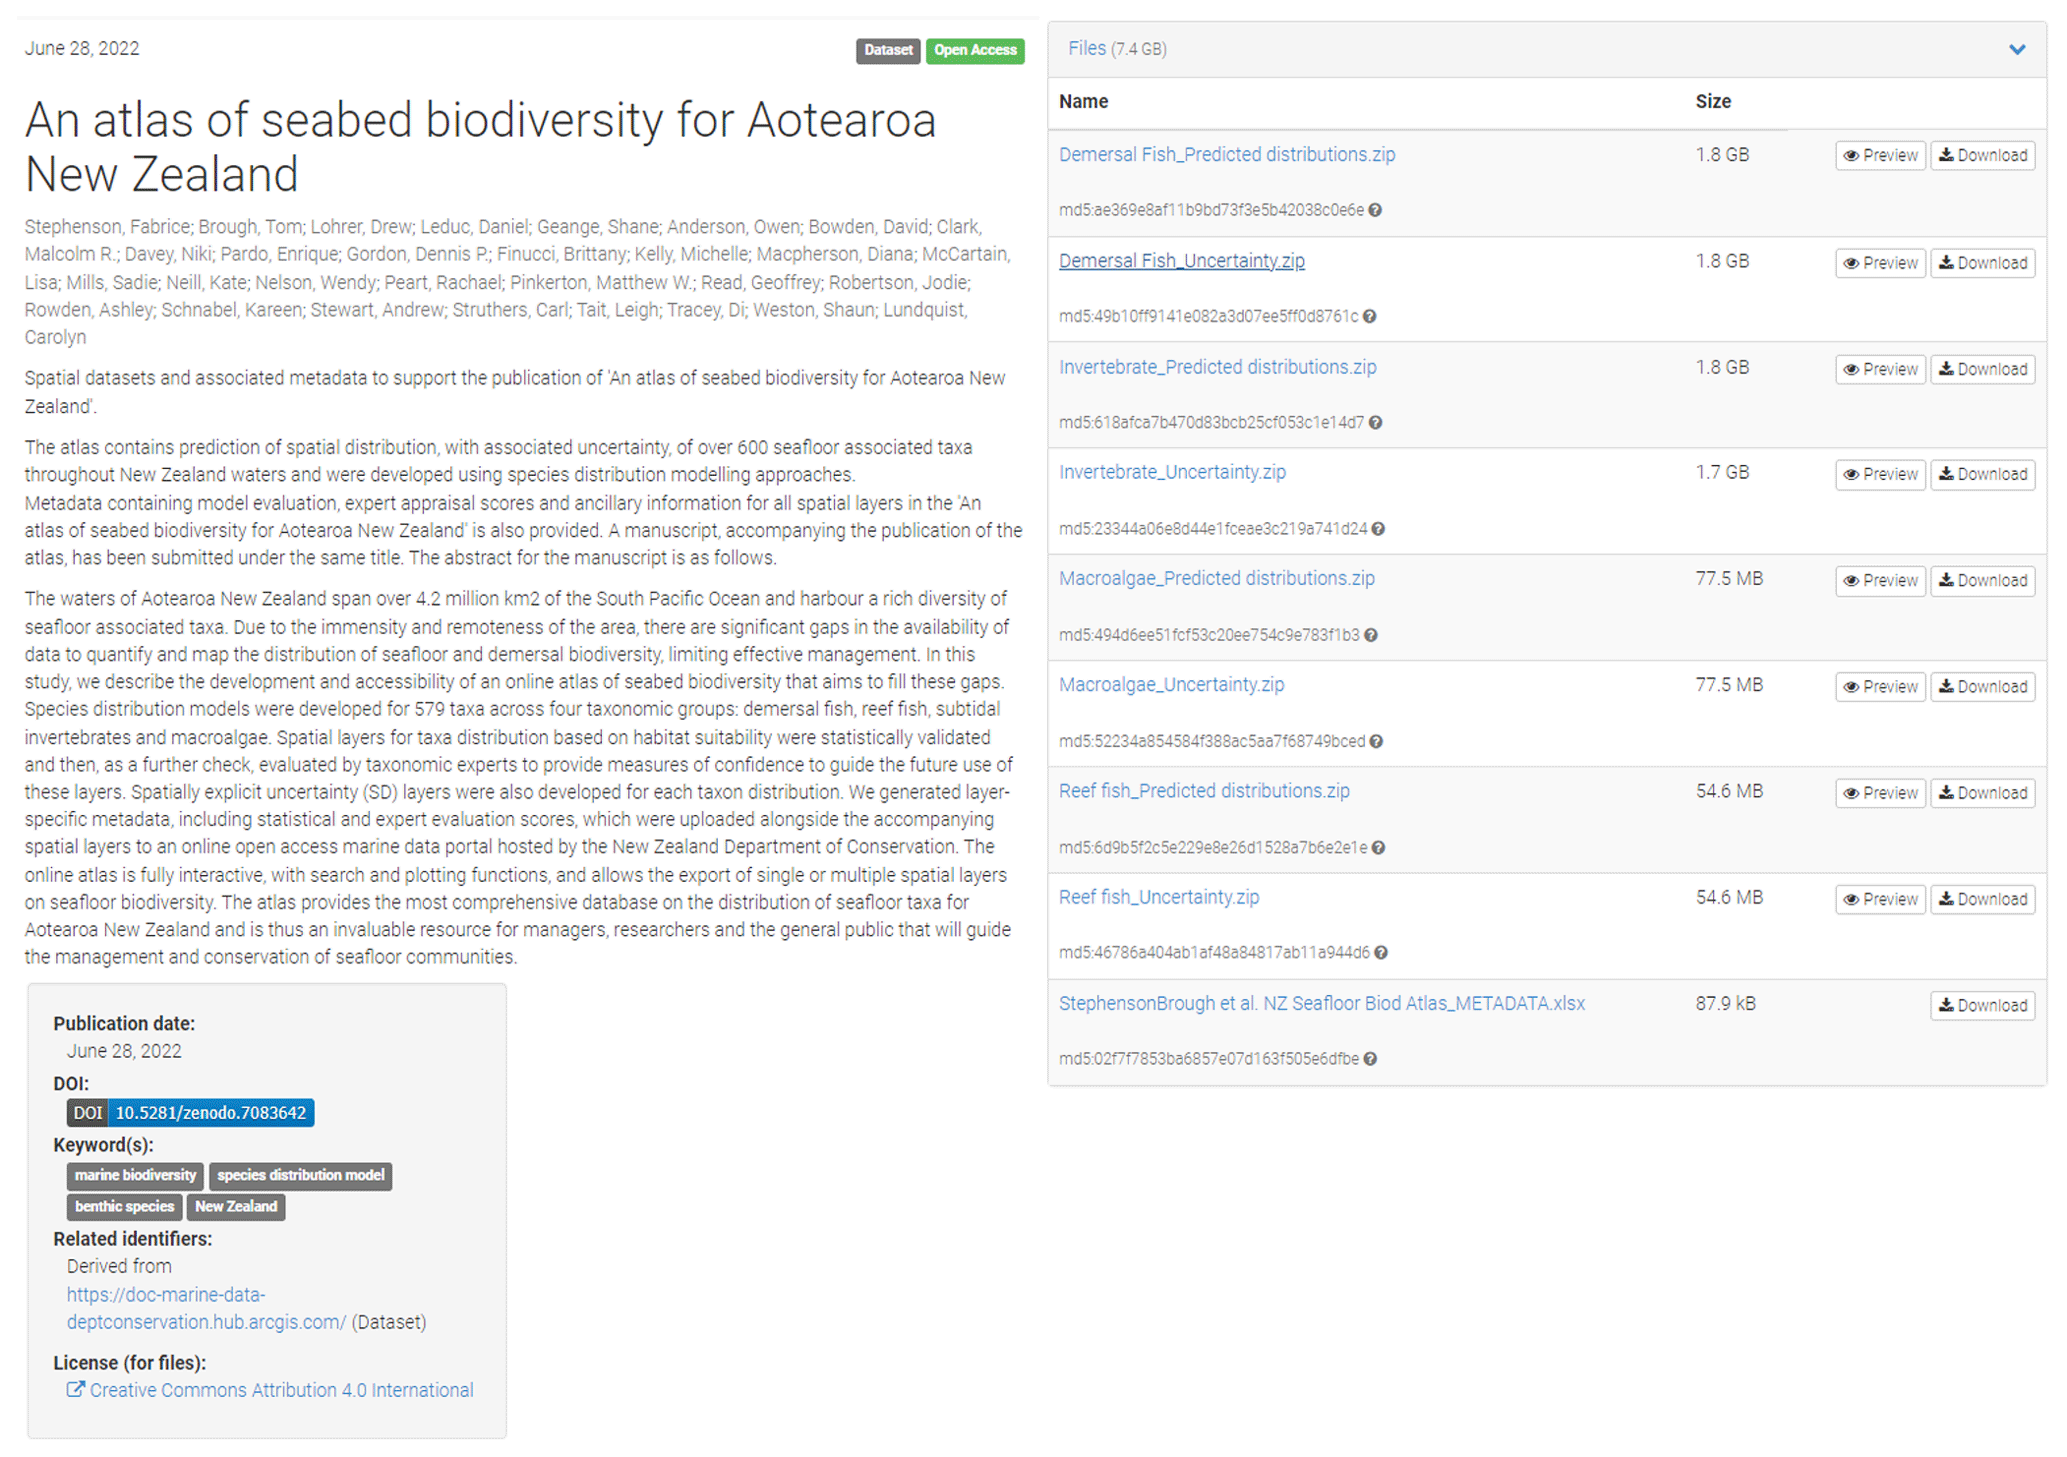
Figure 3The front end of the Zenodo database for the atlas of seabed biodiversity for Aotearoa New Zealand. Also illustrated are the atlas's eight data folders and metadata file as viewed on Zenodo. Image created under standard terms and conditions © Zenodo. Searching and downloading specific taxa (rather than the whole dataset) can be undertaken from the NZ Department of Conservation's online geoportal, available at https://doc-marine-data-deptconservation.hub.arcgis.com/ (last access: 4 September 2023).
The atlas of seabed biodiversity for Aotearoa New Zealand represents the most comprehensive freely available biodiversity information for the area to date. The atlas is composed of predicted taxon distributions, associated uncertainty estimates and comprehensive metadata for 579 taxa. This resource provides managers and decision-makers with tools to address environmental issues faced by subtidal ecosystems. The tools provide a detailed understanding of hotspots for key taxa (e.g. those with important functional roles, threatened taxa), as well as biodiversity (e.g. species richness) more generally. It should be noted, however, that the models used to develop taxa predictions are based on long-term correlations between taxa occurrence and environmental variables and do not consider temporal variability (e.g. seasonal or decadal variation) in environmental conditions or anthropogenic stressors that may influence biodiversity patterns. Thus, the models provide a temporally smoothed indication of the distribution of seafloor taxa at a broad scale, a foundation that may be built upon by future modelling approaches that incorporate temporally dynamic variables and data on the distribution of stressors.
4.1 Using the database
Like many jurisdictions, Aotearoa New Zealand is currently transitioning to an ecosystem-based management approach for the marine environment (Le Heron et al., 2020; Hewitt et al., 2018), where the impacts of resource use/stressors are appraised and mitigated across a diverse suite of ecosystem components. The availability of an open access atlas housing a significant number of biodiversity layers provides an accessible source of data layers to inform further research, management and decision-making to support ecosystem-based management. These data are particularly relevant to marine spatial planning approaches, which are useful tools for marine ecosystem-based management (Peart, 2019; Domínguez-Tejo et al., 2016). Such analyses allow for the optimisation of spatial scenarios for the conservation of biodiversity (e.g. MPA planning; Asaad et al., 2018; Zhao et al., 2020) and for resource-use/biodiversity trade-offs (e.g. siting fishing corridors/aquaculture areas; Rowden et al., 2019; Henriques et al., 2017). Spatial planning using decision support tools requires spatial layers (typically raster datasets) on the distribution of biodiversity values within a specified study area. Tools including Zonation (Moilanen et al., 2009) and Marxan (Ball et al., 2009) are then used to perform spatial prioritisation of a seascape to determine the best locations for management interventions that align with management objectives while considering the distribution of biodiversity values associated with each input layer. Thus, the layers provided by the atlas in this study represent key inputs for marine spatial planning. Users may construct spatial prioritisations using a broad suite of input layers to determine high-priority locations for biodiversity generally or select a subset of layers to represent, for example, key ecosystem functions (e.g. seafloor biogenic habitats), threatened taxa or those of cultural/recreational importance.
4.2 Metadata
An important component of the atlas is the provision of detailed metadata to guide the use of each layer. Users of the atlas can consult layer-specific metadata to make informed decisions on the applicability of a given layer for a certain analysis. The most critical pieces of information in the metadata are the expert-derived evaluation score and the statistical model evaluation score, with the former being used to inform the “use limitations” field of the metadata. These two model evaluation scores provide complementary information for a particular layer that allows users to establish decision rules around which layers are deemed suitable for further analyses. For example, if users are interested in constructing analyses to determine the best locations for the management of taxa/taxa groups, they may choose to select layers that have high statistical (Table S3 in the Supplement) and expert-derived (Table S6) evaluation scores (i.e. scores <2), with only those layers being used in further analysis. Alternatively, users may opt to use each layer in the atlas but weight their contribution to a spatial planning scenario by one or both evaluation scores. The subsequent weighting value can be applied to each layer to scale the HSI values according to the expert-derived and/or statistical evaluation values (e.g. Stephenson et al., 2021a). Within the Zonation and Marxan decision support tools, differential weighting of data layers is achieved by providing the software with the weighting values associated with each layer while coding a prioritisation. These tools then scale the HSI values automatically as part of the spatial prioritisation. If users wish to perform basic prioritisation “outside” of decision support tools, they may scale the HSI values manually using GIS or statistical software (e.g. R).
Metadata fields on the spatial resolution and the prediction domain for each taxon provide additional useful information to guide database users. The spatial resolution (in square kilometres) describes the size of the grid cells for each raster layer and will be either 1 km2 (for demersal fish and subtidal invertebrates) or 0.06 km2 (250×250 m) for reef fish and macroalgae. The prediction domain describes the extent (i.e. number of rows and columns) and distribution of cells that contain some information for a given taxa (e.g. all cells with HSI values). As mentioned above, the prediction domain is clipped to all areas within the EEZ and TS shallower than 2000 m for demersal fish and subtidal invertebrates. For reef fish and macroalgae, the domain is further clipped to a “rocky reef” layer. Users should be aware that the rocky reef layer has known inaccuracies and that many reef fish and macroalgae are not reef-obligates (i.e. they are also found over soft sediment habitats).
Each SDM in this database has an associated layer for spatially explicit uncertainty which holds important information for the utility of the SDMs. Due to limited sampling and/or uncertain taxa-environmental relationships, some regions within a predicted distribution will have higher uncertainty than others (Beale and Lennon, 2012; Elith and Leathwick, 2009). Spatial planning approaches typically account for the spatial variability in uncertainty by including uncertainty layers within a prioritisation that effectively discounts the biodiversity values of cells by their associated uncertainty value, thus reducing the contribution of areas with higher uncertainty. A similar approach may be achieved outside of decision support tools by subtracting the uncertainty layers from their associated SDM layer. The uncertainty layers, however, provide useful information on where additional sampling may be needed to improve our understanding of the distribution of individual taxa and hence their inclusion in future management planning.
4.3 Updating of the database
The development of the SDMs that underpin this database incorporated the best available information on seafloor taxa at the time of this publication; however, substantial gaps in our knowledge of some taxa and in some areas of Aotearoa New Zealand's large EEZ still exist. As such, it is anticipated that the layers in this database will be iteratively updated when new information on the distribution of seafloor-associated taxa become available (e.g. new taxa records, Fig. 1). Surveys of deeper (>2000 m) and remote areas of the EEZ are ongoing and will yield valuable new information on the presence and absence of seafloor taxa that can be used to update the SDMs. Substantial gaps in occurrence data are also apparent in shallow (<200 m) coastal habitat that should be addressed in future surveys. It is recommended that a review of the availability of new presence records for seafloor taxa be undertaken every 5 years, where an additional 50 presence records trigger the updating of a particular SDM. Further sampling can also address areas of model uncertainty and will also allow for the expansion of this database as it is anticipated that new SDMs will be developed for taxa not currently included in this database (due to having less than 50 presence locations).
Even with new data, presence–absence analyses have major limitations where managers might want to prioritise areas of high biomass or high overall biodiversity. Standardised data on taxa abundance should be recorded, which would allow for the generation of SDMs that predict the distribution of relative abundance/density that often provides a more accurate representation of biodiversity patterns (Howard et al., 2014; Young et al., 2015). It is anticipated that the database described in this publication will provide the framework and repository for a diverse suite of information on seafloor biodiversity for Aotearoa New Zealand that can be used to inform management of the marine environment. Furthermore, future iterations of databases may also seek to include programmatic API access to commonly used statistical software (e.g. R statistical software) to facilitate use from biodiversity scientists.
The Aotearoa New Zealand atlas of seafloor biodiversity (Geoportal; https://doc-marine-data-deptconservation.hub.arcgis.com, last access: 4 September 2023). Supplement: 1. Model development methods and 2. Instructions for the use of the New Zealand Department of Conservation interactive geoportal (see associated pdf) The supplement related to this article is available online at: https://doi.org/10.5194/essd-15-3931-2023-supplement.
FS, TB: conceptualisation, data curation, formal analysis, methodology, investigation, project administration, visualisation, writing – original draft preparation, writing – review and editing. DrL, DaL, SG, CL: conceptualisation, methodology, investigation, writing – review and editing. OA, DB, MRC, ND, DPG, BF, MK, DM, SM, KN, WN, RP, MHP, GBR, AR, KS, AS, CS, LT, DT: resources, validation, writing – review and editing. EP, JR, SW, LM: software, visualisation, writing – review and editing.
The contact author has declared that none of the authors has any competing interests.
Publisher's note: Copernicus Publications remains neutral with regard to jurisdictional claims in published maps and institutional affiliations.
We acknowledge the contributions of data and advice from many sources including the National Institute of Water and Atmospheric Research (NIWA) for collections data and spatial environmental variable layers, Auckland Museum Tāmaki Paenga Hira and National Museum of New Zealand Te Papa Tongarewa for providing collections data, the Department of Conservation for spatial data layers and Fisheries New Zealand for the research trawl data. We acknowledge the contribution of taxonomic expertise from a very large number of national and international colleagues, too many to individually name, that have provided decades of knowledge and the species names and identifications that we rely on for this work.
This paper was edited by Dirk Fleischer and reviewed by two anonymous referees.
Arponen, A., Moilanen, A., and Ferrier, S.: A successful community-level strategy for conservation prioritization, J. Appl. Ecol., 45, 1436–1445, 2008.
Asaad, I., Lundquist, C. J., Erdmann, M. V., Van Hooidonk, R., and Costello, M. J.: Designating Spatial Priorities for Marine Biodiversity Conservation in the Coral Triangle, Front. Marine Sci., 5, 400, https://doi.org/10.3389/fmars.2018.00400, 2018.
Asaad, I., Lundquist, C. J., Erdmann, M. V., and Costello, M. J.: An interactive atlas for marine biodiversity conservation in the Coral Triangle, Earth Syst. Sci. Data, 11, 163–174, https://doi.org/10.5194/essd-11-163-2019, 2019.
Assis, J., Tyberghein, L., Bosch, S., Verbruggen, H., Serrão, E. A., and De Clerck, O.: Bio-ORACLE v2.0: Extending marine data layers for bioclimatic modelling, Global Ecol. Biogeogr., 27, 277–284, https://doi.org/10.1111/geb.12693, 2018.
Ball, I. R., Possingham, H. P., and Watts, M.: Marxan and relatives: software for spatial conservation prioritisation, in: Spatial conservation prioritisation: Quantitative methods and computational tools, edited by: Moilanen, A., Wilson, K. A., and Possingham, H., Oxford University Press, 185–196, ISBN-10 9780199547777, 2009.
Barale, V., Dusart, J., Assouline, M., and Niceta, F.: European Atlas of the Seas: “a picture is worth a thousand words”, J. Coastal Conserv., 22, 105–113, 2018.
Beale, C. M. and Lennon, J. J.: Incorporating uncertainty in predictive species distribution modelling, Philos. T. R. Soc. Lond. B., 367, 247–258, https://doi.org/10.1098/rstb.2011.0178, 2012.
Bowden, D. A., Anderson, O. F., Rowden, A. A., Stephenson, F., and Clark, M. R.: Assessing Habitat Suitability Models for the Deep Sea: Is Our Ability to Predict the Distributions of Seafloor Fauna Improving?, Front. Marine Sci., 8, 632389, https://doi.org/10.3389/fmars.2021.632389, 2021.
Breiman, L.: Random forests, Mach. Learn., 45, 5–32, 2001.
Costello, M. J., Tsai, P., Wong, P. S., Cheung, A. K. L., Basher, Z., and Chaudhary, C.: Marine biogeographic realms and species endemicity, Nat. Commun., 8, 1057, https://doi.org/10.1038/s41467-017-01121-2, 2017.
Domínguez-Tejo, E., Metternicht, G., Johnston, E., and Hedge, L.: Marine Spatial Planning advancing the Ecosystem-Based Approach to coastal zone management: A review, Marine Policy, 72, 115–130, https://doi.org/10.1016/j.marpol.2016.06.023, 2016.
Elith, J. and Leathwick, J. R.: Species Distribution Models: Ecological Explanation and Prediction Across Space and Time, Annu. Rev. Ecol. Evol. Syst., 40, 677–697, https://doi.org/10.1146/annurev.ecolsys.110308.120159, 2009.
Elith, J., Graham, C. H., Anderson, R. P., Dudík, M., Ferrier, S., Guisan, A., Hijmans, R. J., Huettmann, F., Leathwick, J. R., Lehmann, A., Li, J., Lohmann, L. G., Loiselle, B. A., Manion, G., Moritz, C., Nakamura, M., Nakazawa, Y., Overton, J., Townsend, P., A, Phillips, S. J., Richardson, K., Scachetti-Pereira, R., Schapire, R. E., Soberón, J., Williams, S., Wisz, M. S., and Zimmermann, N. E.: Novel methods improve prediction of species' distributions from occurrence data, Ecography, 29, 129–151, https://doi.org/10.1111/j.2006.0906-7590.04596.x, 2006.
ESRI, GEBCO, Garmin, NaturalVue | ESRI, GEBCO, IHO-IOC GEBCO, Garmin, NGS: World imagery basemap, https://deptconservation.maps.arcgis.com/apps/webappviewer/index.html?id=e4a32512b53848e3a9300066f2f2dc7a&webmap=437c8c1e4f06485a9aee9f479337090c (last access: November 2022), 2022.
Ferrier, S., Manion, G., Elith, J., and Richardson, K.: Using generalized dissimilarity modelling to analyse and predict patterns of beta diversity in regional biodiversity assessment, Divers. Distrib., 13, 252–264, 2007.
Georgian, S. E., Anderson, O. F., and Rowden, A. A.: Ensemble habitat suitability modeling of vulnerable marine ecosystem indicator taxa to inform deep-sea fisheries management in the South Pacific Ocean, Fish. Res., 211, 256–274, https://doi.org/10.1016/j.fishres.2018.11.020, 2019.
Gordon, D. P., Beaumont, J., MacDiarmid, A., Robertson, D. A., and Ahyong, S. T.: Marine Biodiversity of Aotearoa New Zealand, PLoS ONE 5, e10905, https://doi.org/10.1371/journal.pone.0010905, 2010.
Hamylton, S. M. (Ed.): Spatial analysis of coastal environments, Cambridge University Press, ISBN 9781107707412, https://doi.org/10.1017/9781107707412, 2017.
Henriques, N. S., Monteiro, P., Bentes, L., Oliveira, F., Afonso, C. M. L., and Gonçalves, J. M. S.: Marxan as a zoning tool for development and economic purposed areas – Aquaculture Management Areas (AMAs), Ocean Coast. Manage., 141, 90–97, https://doi.org/10.1016/j.ocecoaman.2017.03.016, 2017.
Hewitt, J., Faulkner, L., Greenaway, A., and Lundquist, C.: Proposed ecosystem-based management principles for New Zealand, Resource Management Journal, 2018, 10–13, 2018.
Hortal, J., de Bello, F., Diniz-Filho, J. A. F., Lewinsohn, T. M., Lobo, J. M., and Ladle, R. J.: Seven shortfalls that beset large-scale knowledge of biodiversity, Annu. Rev. Ecol. Evol. Syst., 46, 523–549, 2015.
Howard, C., Stephens, P. A., Pearce-Higgins, J. W., Gregory, R. D., Willis, S. G., and McPherson, J.: Improving species distribution models: the value of data on abundance, Methods Ecol. Evol., 5, 506–513, https://doi.org/10.1111/2041-210x.12184, 2014.
Leathwick, J., Elith, J., Francis, M., Hastie, T., and Taylor, P.: Variation in demersal fish species richness in the oceans surrounding New Zealand: an analysis using boosted regression trees, Marine Ecology Progress Series, 321, 267–281, 2006.
Le Heron, E., Le Heron, R., Taylor, L., Lundquist, C., and Greenaway, A.: Remaking ocean governance in Aotearoa New Zealand through boundary-crossing narratives about ecosystem-based management, Marine Policy, 122, 104222, https://doi.org/10.1016/j.marpol.2020.104222, 2020.
Moilanen, A., Kujala, H., and Leathwick, J.: The Zonation framework and software for conservation prioritization, Spatial conservation prioritisation, 135, 196–210, 2009.
Moilanen, A., Leathwick, J. R., and Quinn, J. M.: Spatial prioritization of conservation management, Conserv. Lett., 4, 383–393, 2011.
Peart, R.: Sea Change Tai Timu Tai Pari: addressing catchment and marine issues in an integrated marine spatial planning process, Aquat. Conserv.: Mar. Freshwat. Ecosyst., 29, 1561–1573, https://doi.org/10.1002/aqc.3156, 2019.
Phillips, S. J., Anderson, R. P., and Schapire, R. E.: Maximum entropy modeling of species geographic distributions, Ecol. Model., 190, 231–259, 2006.
Rowden, A. A., Stephenson, F., Clark, M. R., Anderson, O. F., Guinotte, J. M., Baird, S. J., Roux, M. J., Wadhwa, S., Cryer, M., and Lundquist, C.: Examining the utility of a decision-support tool to develop spatial management options for the protection of vulnerable marine ecosystems on the high seas around New Zealand, Ocean Coast. Manage., 170, 1–16, https://doi.org/10.1016/j.ocecoaman.2018.12.033, 2019.
Stephenson, F., Hewitt, J. E., Torres, L. G., Mouton, T. L., Brough, T., Goetz, K. T., Lundquist, C. J., MacDiarmid, A. B., Ellis, J., and Constantine, R.: Cetacean conservation planning in a global diversity hotspot: dealing with uncertainty and data deficiencies, Ecosphere, 12, e03633, https://doi.org/10.1002/ecs2.3633, 2021a.
Stephenson, F., Rowden, A. A., Anderson, O. F., Pitcher, C. R., Pinkerton, M. H., Petersen, G., and Bowden, D. A.: Presence-only habitat suitability models for vulnerable marine ecosystem indicator taxa in the South Pacific have reached their predictive limit, ICES J. Mar. Sci., 78, 2830–2843, https://doi.org/10.1093/icesjms/fsab162, 2021b.
Stephenson, F., Brough, T., Lohrer, D., Leduc, D., Geange, S., Anderson, O., Bowden, D., Clark, M. R., Davey, N., Pardo, E., Gordon, D. P., Finucci, B., Kelly, M., Macpherson, D., McCartain, L., Mills, S., Neill, K., Nelson, W., Peart, R., Pinkerton, M. W., Read, G., Robertson, J., Rowden, A., Schnabel, K., Stewart, A., Struthers, C., Tait, L., Tracey, D., Weston, S., and Lundquist, C.: An atlas of seabed biodiversity for Aotearoa New Zealand, Zenodo [data set], https://doi.org/10.5281/zenodo.7083642, 2022.
Thomson, R. J., Hill, N. A., Leaper, R., Ellis, N., Pitcher, C. R., Barrett, N. S., and J Edgar, G.: Congruence in demersal fish, macroinvertebrate, and macroalgal community turnover on shallow temperate reefs, Ecol. Appl., 24, 287–299, 2014.
Young, M., Carr, M. H., and Robertson, M.: Application of species distribution models to explain and predict the distribution, abundance and assemblage structure of nearshore temperate reef fishes, Divers. Distrib., 21, 1428–1440, https://doi.org/10.1111/ddi.12378, 2015.
Zhao, Q., Stephenson, F., Lundquist, C., Kaschner, K., Jayathilake, D., and Costello, M. J.: Where Marine Protected Areas would best represent 30 % of ocean biodiversity, Biol. Conserv., 244, 108536, https://doi.org/10.1016/j.biocon.2020.108536, 2020.