the Creative Commons Attribution 4.0 License.
the Creative Commons Attribution 4.0 License.
 | 25 Aug 2023
Routine monitoring of western Lake Erie to track water quality changes associated with cyanobacterial harmful algal blooms
Ashley M. Burtner
Andrew C. Camilleri
Glenn Carter
Paul DenUyl
David Fanslow
Deanna Fyffe Semenyuk
Casey M. Godwin
Duane Gossiaux
Thomas H. Johengen
Holly Kelchner
Christine Kitchens
Lacey A. Mason
Kelly McCabe
Danna Palladino
Dack Stuart
Henry Vanderploeg
Reagan Errera
The western basin of Lake Erie has a history of recurrent cyanobacterial harmful algal blooms (HABs) despite decades of efforts by the United States and Canada to limit phosphorus loading, a major driver of the blooms. In response, the National Oceanic and Atmospheric Administration (NOAA) Great Lakes Environmental Research Laboratory (GLERL) and the Cooperative Institute for Great Lakes Research (CIGLR) created an annual sampling program to detect, monitor, assess, and predict HABs in western Lake Erie (WLE). Here we describe the data collected from this monitoring program from 2012 to 2021. This dataset includes observations on physicochemical properties, major nutrient fractions, phytoplankton pigments, microcystins, and optical properties for western Lake Erie. This dataset is particularly relevant for creating models, verifying and calibrating remote sensing algorithms, and informing experimental research to further understand the water quality dynamics that influence HABs in this internationally significant body of freshwater. The dataset can be freely accessed from NOAA National Centers for Environmental Information (NCEI) at https://doi.org/10.25921/11da-3x54 (Cooperative Institute for Great Lakes Research, University of Michigan and NOAA Great Lakes Environmental Research Laboratory, 2019).
- Article
(2067 KB) - Full-text XML
-
Supplement
(1616 KB) - BibTeX
- EndNote


Lake Erie is situated on the international boundary between the United States and Canada and is the smallest by volume of the five Laurentian Great Lakes. It is ecologically, culturally, and economically significant to the approximately 12.5 million people who live in its watershed. Each year Lake Erie supports nearly 14 000 t of commercial and traditional fisheries, over 33 000 000 t of freight, and over USD 1.5 million in recreation and tourism business (Sterner et al., 2020). Lake Erie has endured multiple anthropogenic stressors since European settlement in the area, most notably the draining of coastal wetlands for development of agricultural lands in the late 18th century (Allinger and Reavie, 2013). Currently, the ecological state of Lake Erie is considered poor, partially due to excess nutrient input that supports harmful algal blooms (HABs; ECCC and US EPA, 2022). These seasonal HABs are typically dominated by toxin-producing cyanobacteria, causing concern for public and ecosystem health (Watson et al., 2016). Humans can be exposed to cyanotoxins through ingestion of contaminated fish and drinking water and through inhalation and dermal exposure during recreational events such as swimming and boating (Carmichael and Boyer, 2016; Buratti et al., 2017). Cyanotoxins can also cause illness and death in aquatic and terrestrial animals (Carmichael and Boyer, 2016). The economic cost of HAB impacts in Lake Erie is estimated to be hundreds of millions of dollars each year (Smith et al., 2019).
To combat the deteriorated state of Lake Erie water quality, bi-national water resource management policies alongside scientific research and water quality monitoring efforts have been underway for decades. The Great Lakes Water Quality Agreement (GLWQA), first signed in 1972, was a commitment between the US and Canada in response to degraded water quality throughout the Great Lakes ecosystem (GLWQA, 2012). Phosphorus was found to be the key nutrient that was promoting excess phytoplankton growth (Charlton et al., 1993), and thus the GLWQA sought to limit total phosphorus input to the lakes in an attempt to reduce phytoplankton growth and biomass (Steffen et al., 2014). The 1972 Clean Water Act (CWA) was similarly enacted to regulate point-source pollution discharge, including phosphorus, into navigable waters in the United States. After the signing and implementation of the phosphorus load reduction practices outlined in the GLWQA and CWA, the water quality of Lake Erie improved and the lake experienced a period of restoration (Makarewicz and Bertram, 1991). This success was attributed to upgrades to sewage treatment plants and industrial discharges which reduced phosphorus loading from point sources by 50 % within 10 years of peak levels observed in 1968 (Charlton et al., 1993; Joosse and Baker, 2011; Steffen et al., 2014).
While the water quality of Lake Erie rebounded in the 1980s and early 1990s, by the mid-1990s and early 2000s annual HAB events were occurring in Lake Erie again, particularly in the warm, shallow western basin (Allinger and Reavie, 2013; Kane et al., 2015; Watson et al., 2016). Total phosphorus loading has been relatively stable in Lake Erie from the 1980s onward (Dolan and Chapra, 2012; Watson et al., 2016), and although point-source phosphorus loading controls had been a successful mitigation measure at one point, several anthropogenic stressors within the watershed were exacerbating the issue of poor water quality. An increase in agricultural sources of biologically available soluble nutrients, legacy phosphorus in the Lake Erie watershed, altered nutrient cycling by invasive dreissenid mussels, and climate change are thought to be primarily responsible for the HAB resurgence (Vanderploeg et al., 2001; Conroy et al., 2005; Bridoux et al., 2010; Michalak et al., 2013; Matisoff et al., 2016; Huisman et al., 2018; Van Meter et al., 2021).
The post-recovery period HABs have predominantly been composed of the cyanobacteria species Microcystis aeruginosa along with genera Anabaena, Aphanizomenon, Dolichospermum, and Planktothrix (Steffen et al., 2014; Watson et al., 2016). These cyanobacteria can produce an array of several types of phycotoxins, with the most common being a suite of hepatotoxins known as microcystins (MCs). Microcystins primarily affect the liver but can also cause adverse health effects on the kidneys, brain, and reproductive organs (Carmichael and Boyer, 2016). Phycotoxins are commonly present during Lake Erie HABs, and in August 2014 the city of Toledo, OH, drinking water supply was contaminated with MCs, leaving > 400 000 people without clean drinking water (Steffen et al., 2017).
To understand HAB events in US waterways, US Congress authorized the Harmful Algal Bloom and Hypoxia Research and Control Act in 1998 (HABHRCA; Public Law 115-423) which mandated the National Oceanic and Atmospheric Administration (NOAA) to “advance the scientific understanding and ability to detect, monitor, assess, and predict HAB and hypoxia events”. Under HABHRCA, the NOAA Great Lakes Environmental Research Lab (GLERL), NOAA National Centers for Coastal Ocean Science (NCCOS), and the Cooperative Institute for Great Lakes Research (CIGLR; formerly CILER – Cooperative Institute for Limnology and Ecosystems Research) developed an ecological forecasting system to predict HAB events in Lake Erie. Starting in 2008, researchers at these institutes began using remote sensing to monitor seasonal HABs, created a seasonal forecast system based on spring P loads, and developed models to predict short-term bloom changes to alert stakeholders and the public (Rowe et al., 2016). Products from these efforts, known as Lake Erie Harmful Algal Bloom Forecasts, are freely available during the bloom season at https://coastalscience.noaa.gov/research/stressor-impacts-mitigation/hab-forecasts/lake-erie/ (last access: 14 August 2023).
In situ sampling of the bloom was necessary to calibrate and validate the remote sensing images and models as well as measure microcystin concentrations. Sampling events were led by personnel at GLERL and CIGLR starting in 2008 and were designed to collect discrete samples within the extent of the bloom area. At first, samples were taken opportunistically within the bloom and sampling locations and analytical parameters were inconsistent. In 2009, regular sampling stations were identified based on spatial patterns of the bloom. From 2009 to 2011, in addition to opportunistic samples, nine main stations in the western basin of Lake Erie were sampled intermittently from June through October (Bertani et al., 2017; Rowland et al., 2020). While these sampling efforts initially began to complement existing research products, the experimental nature of the 2008 to 2011 sampling cruises also provided insight into creating a regular monitoring program that would support critical research and product development related to western Lake Erie HABs.
In 2012, researchers at GLERL and CIGLR, with support from the Great Lakes Restoration Initiative (GLRI), formalized a sampling regimen to monitor the spatial and temporal variability of seasonal HAB events in western Lake Erie (WLE). The establishment of this monitoring program corresponded with increased federal emphasis on evaluating trends and drivers of WLE HABs and water quality. Four monitoring stations were identified and regular surface samples were collected from May to September and analyzed for nutrient, pigment, and particulate microcystin concentrations (Figs. 1 and 2). In following years, the monitoring program evolved and expanded. New stations were added to better characterize the bloom and complement other observing systems. Sampling parameters were adjusted and added based on the needs of current research (Table 1). Results of these sampling cruises were compiled and distributed informally upon request until 2019 when the data were organized and archived on the NOAA National Centers for Environmental Information (NCEI) open-access data repository (https://www.ncei.noaa.gov/, last access: 14 August 2023).
Table 1Description of stations sampled in western Lake Erie from 2012 to 2021. Latitude and longitude (decimal degree) coordinates for each station are target locations as the boat was allowed to drift at each site during in situ sampling.
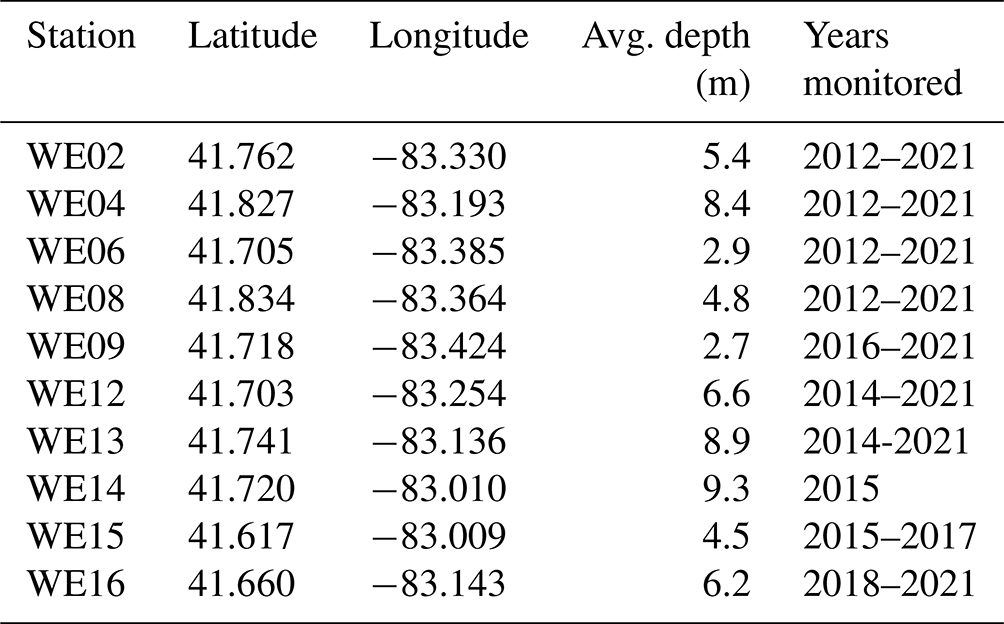
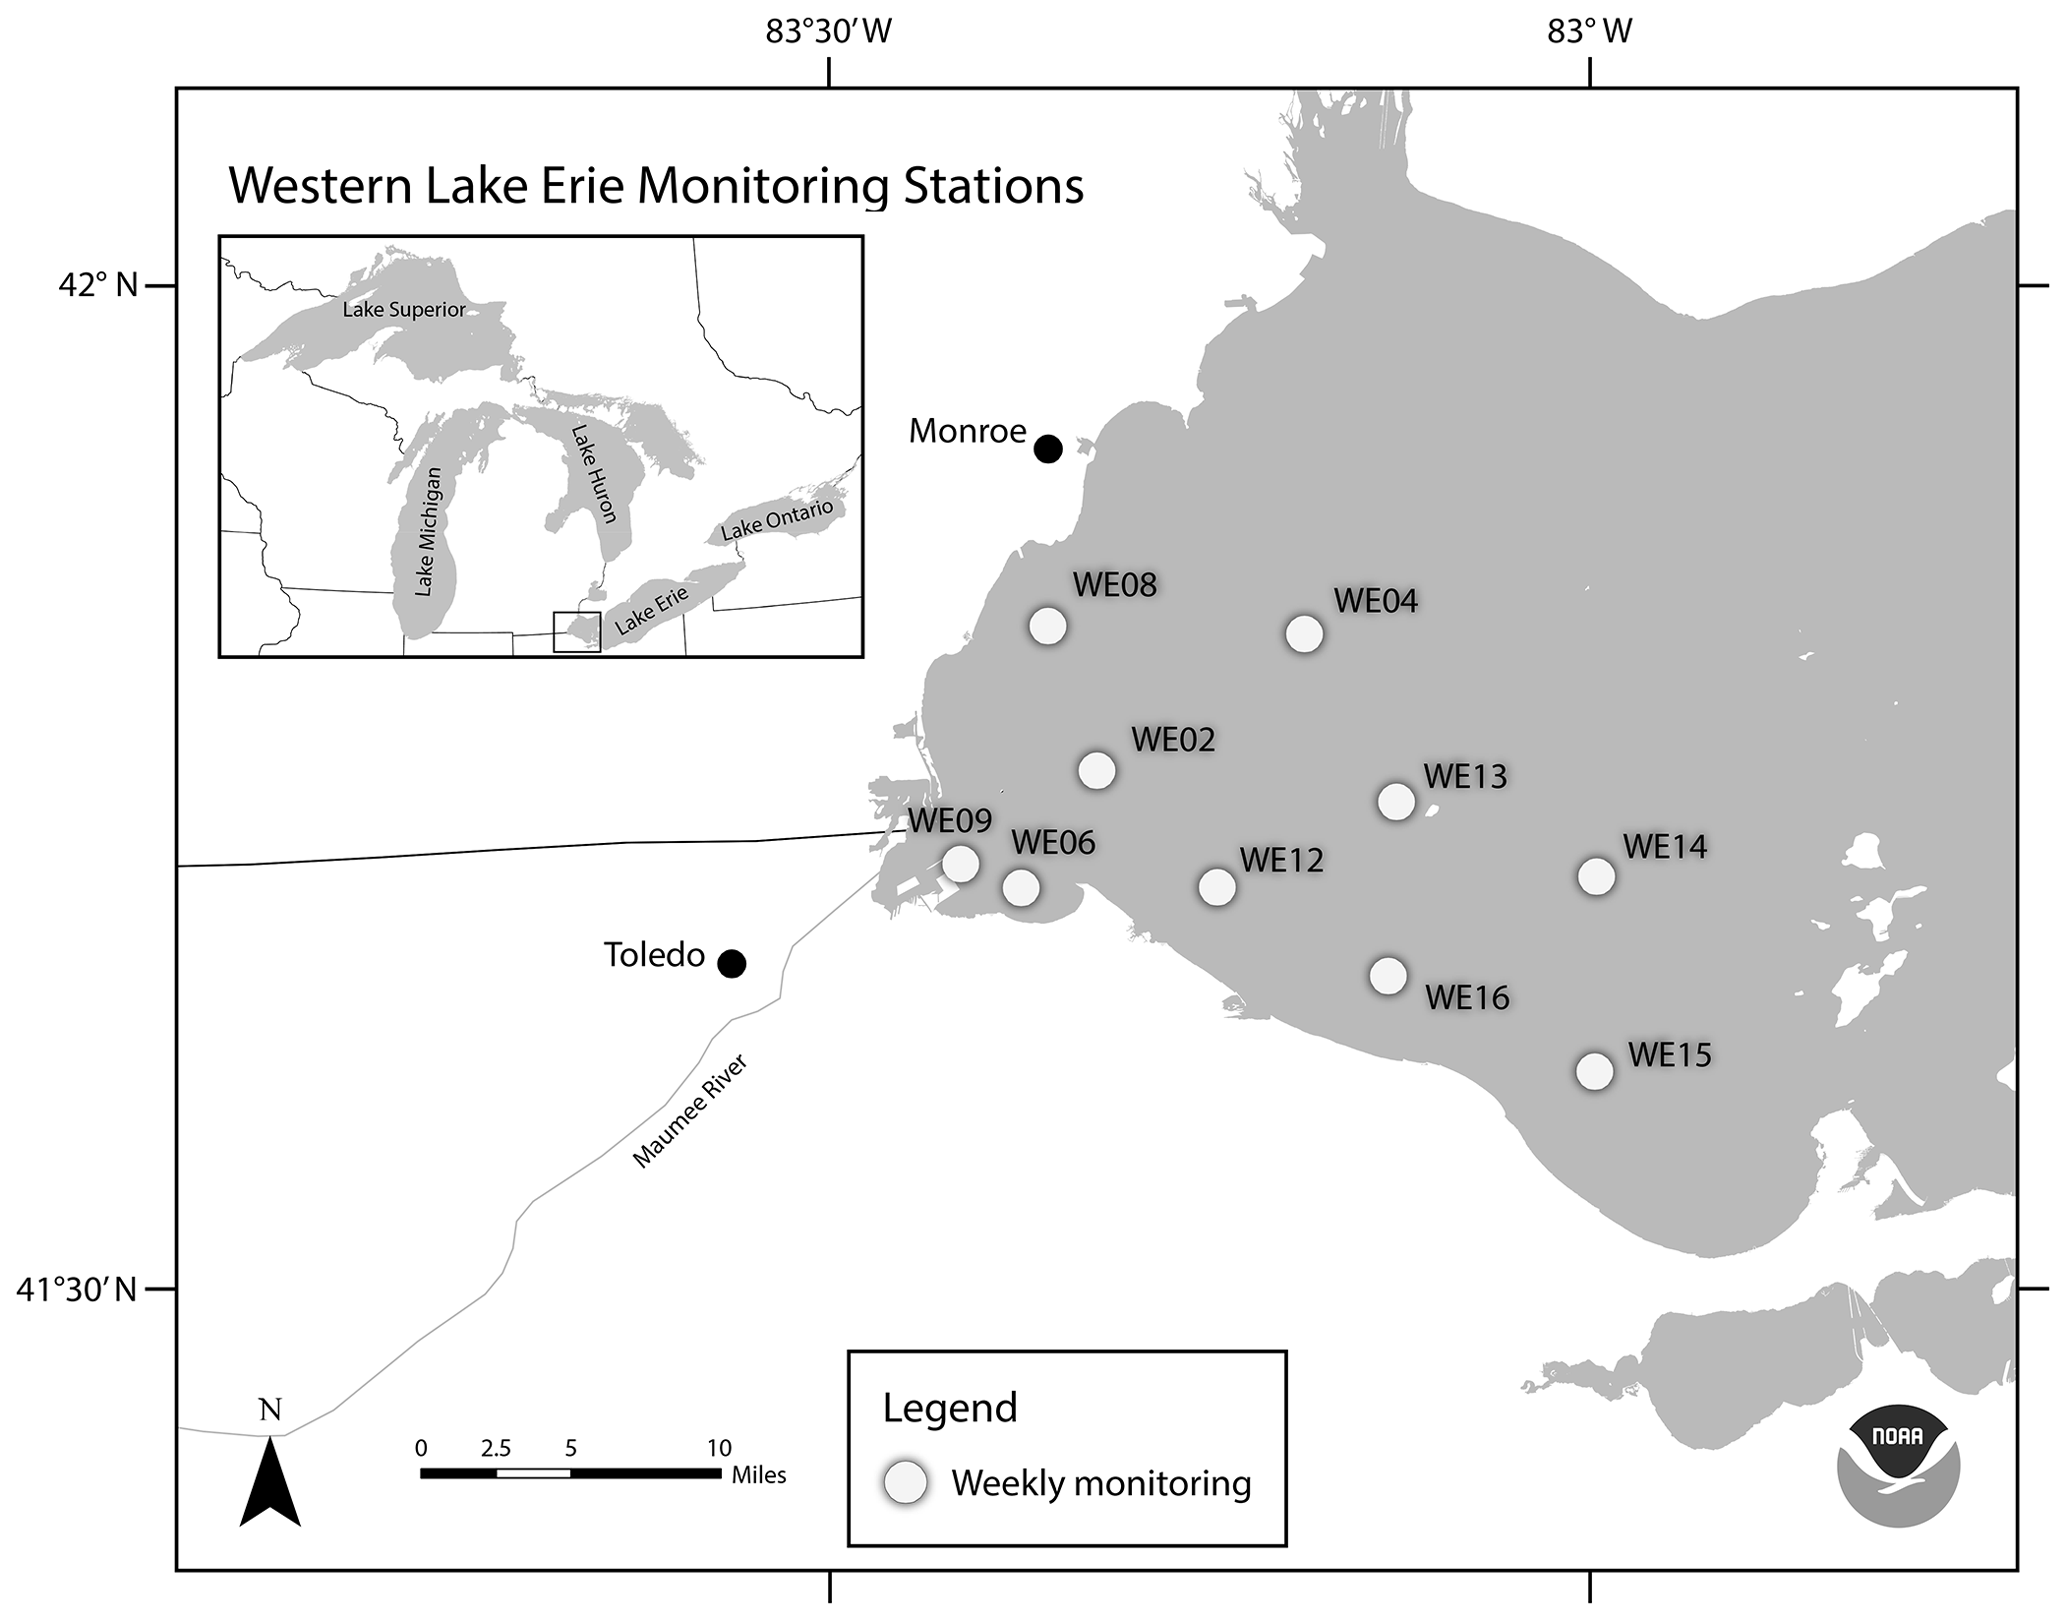
Figure 1Location of western Lake Erie water quality monitoring stations. This map was provided by NOAA for use in this publication.
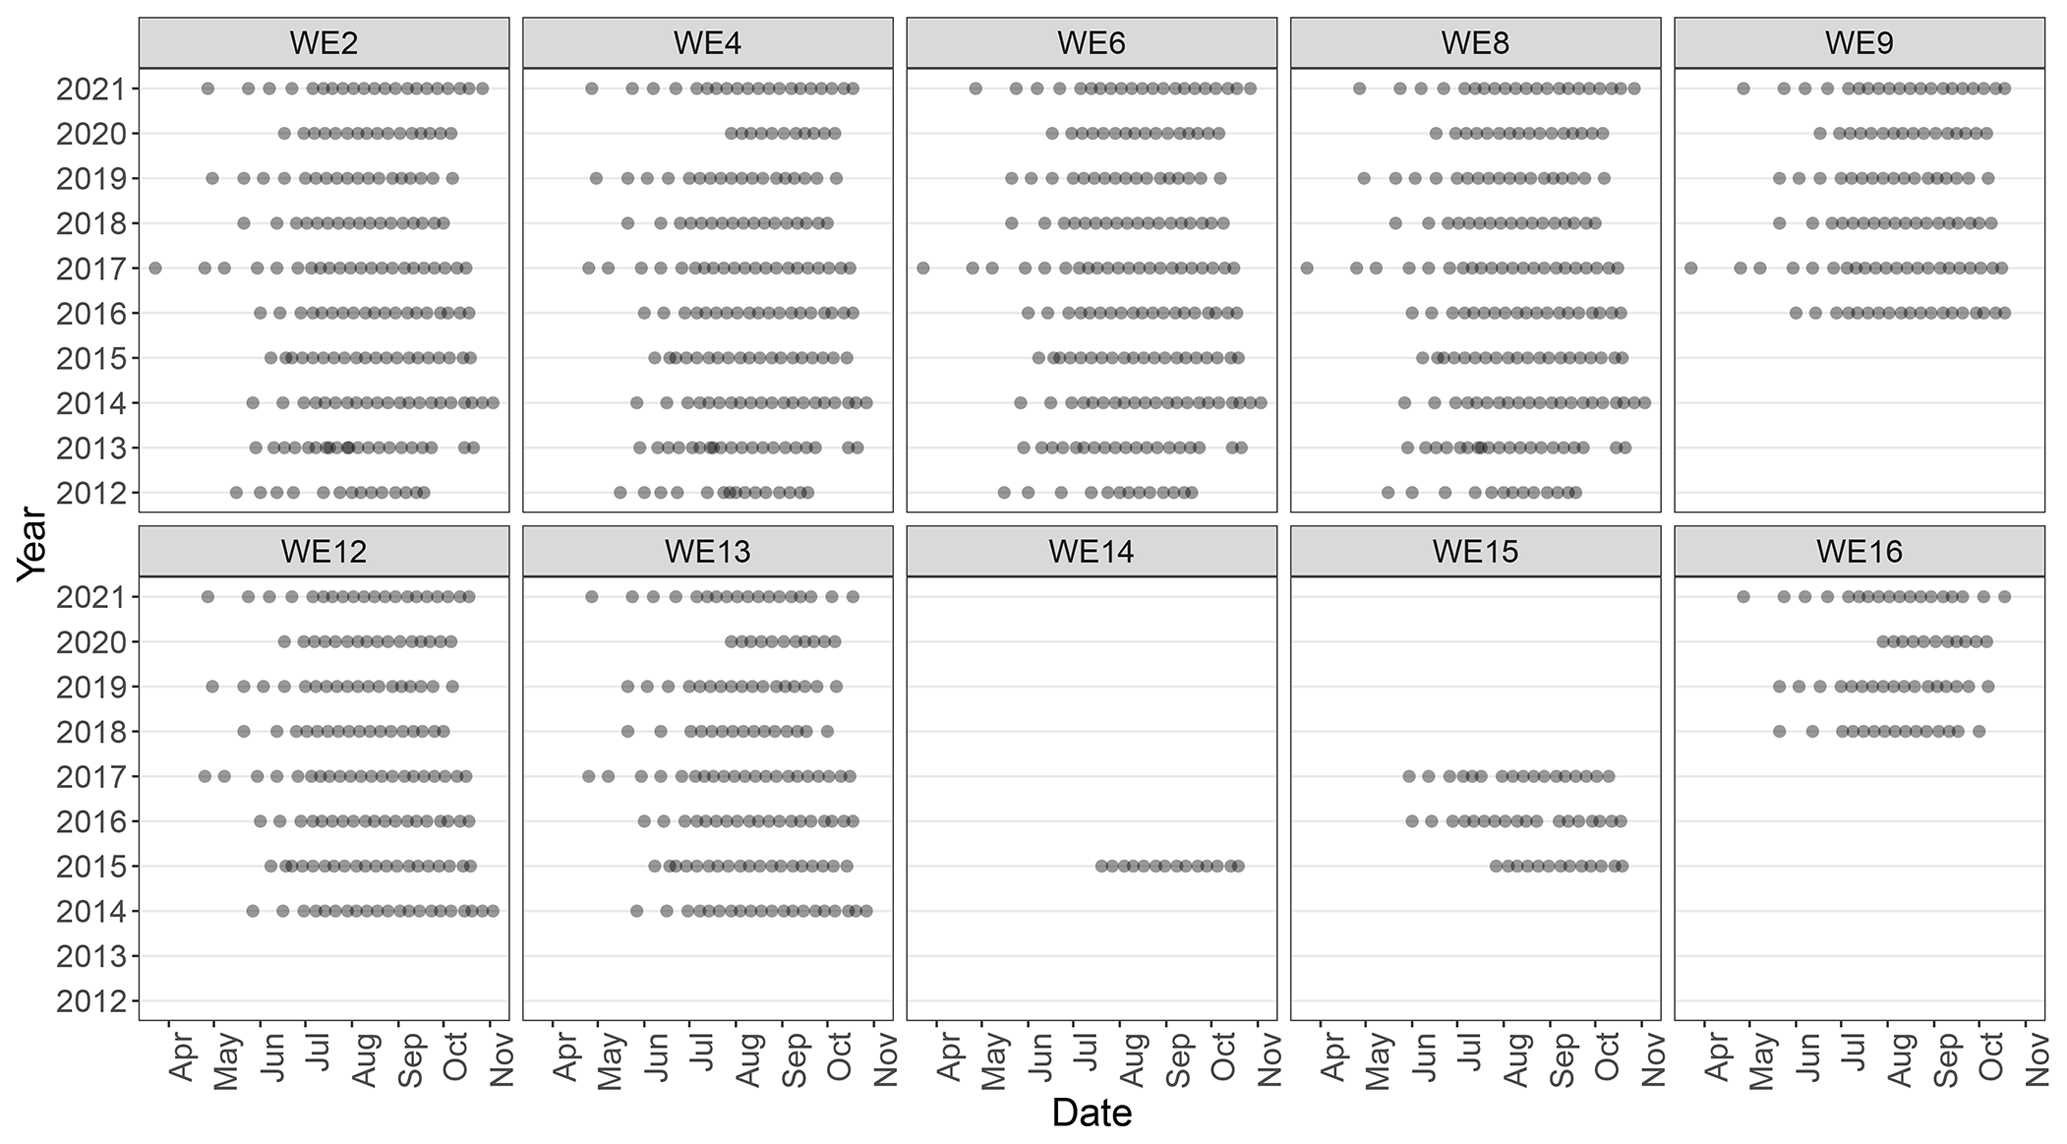
Figure 2Sampling frequency for each monitoring station for years sampled between 2012 and 2021.
Long-term monitoring of WLE is fundamental to the continual assessment of water quality changes in response to both stressors and water quality management efforts (Hartig et al., 2009, 2021). The GLERL/CIGLR monitoring data has been used by numerous researchers to develop and assess models (Rowe et al., 2016; Weiskerger et al., 2018; Fang et al., 2019; Liu et al., 2020; Qian et al., 2021; Wang and Boegman, 2021; Hellweger et al., 2022; Maguire et al., 2022), to calibrate remote sensing algorithms (Sayers et al., 2016, 2019; Avouris and Ortiz, 2019; Bosse et al., 2019; Vander Woude et al., 2019; Pirasteh et al., 2020; Xu et al., 2022), and to elucidate ecological mechanisms and complement experimental data (Cory et al., 2016; Reavie et al., 2016; Berry et al., 2017; Steffen et al., 2017; Kharbush et al., 2019, 2023; Newell et al., 2019; Den Uyl et al., 2021; Smith et al., 2021, 2022; Hoffman et al., 2022; Marino et al., 2022; Yancey et al., 2022a, b).
The objective of this paper is to inform users of the dataset “Physical, chemical, and biological water quality monitoring data to support detection of harmful algal blooms (HABs) in western Lake Erie, collected by the Great Lakes Environmental Research Laboratory and the Cooperative Institute for Great Lakes Research since 2012” by describing the data generated from this monitoring program and detailing how samples were collected and analyzed. This paper contextualizes this long-term dataset so that it can continue to be used to benefit our collective ecological knowledge of western Lake Erie.
2.1 Study site
Based on its bathymetry, Lake Erie can be divided into the eastern, central, and western basins, which in turn influence physical and biological processes (Allinger and Reavie, 2013). The data presented in this paper were collected from the western basin, which encompasses the western part of the lake to Point Pelee, ON, Canada, and Cedar Point, OH, USA (Fig. 1). The well-mixed western basin is the shallowest (maximum average depth of 11 m), warmest, and most productive of the three basins. Although it is typical for temperate WLE to have ice cover in the winter (January to March), summer (July to September) surface water temperatures often reach or exceed 25 ∘C. The western basin receives 95 % of its hydraulic inflow from the Detroit River, which connects Lake Erie hydrologically to Lake Huron via the St. Clair River and Lake St. Clair (Cousino et al., 2015). Among the other tributaries to WLE (including River Raisin, Portage River, Ottawa River, Stony Creek, Swan Creek, and Sandusky River), the Maumee River discharges into the western basin near the city of Toledo, Ohio and contributes a significant amount of sediments and nutrients to the entire Lake Erie basin (Baker et al., 2014a, b; Rowland et al., 2020; see NCWQR, 2022, for Maumee River water quality data). Nutrient and sediment loads from the Maumee River can vary with precipitation, where stormwater runoff can provide a pulse of nutrients into the basin, potentially altering cyanobacteria dynamics (Baker et al., 2014a; King et al., 2022). Land use in the Lake Erie watershed is 75 % agricultural and 11 % urban, both of which contribute to the large amounts of soluble reactive phosphorus into the basin (Mohamed et al., 2019; Myers et al., 2000).
This dataset includes water quality data from 10 monitoring stations on the United States side of WLE that were sampled from 2012 to 2021 (Figs. 1 and 2, Tables 1 and 2). The average depth of monitoring stations ranged from 2.7 m at WE9 to 9.3 m at WE14. These sites were chosen to reflect the various nutrient and hydrologic inputs and gradients into WLE, as well as represent areas of the basin that are prone to HABs. The Maumee River inflow was a major consideration in determining these sites. The initial four stations sampled in this program (WE02, WE04, WE06, and WE08) were selected because they were consistently within the WLE blooms occurring at the time. Additional sites were later added to better represent the spatial extent of HABs and to augment existing data provided by moored buoy continuous monitoring systems, advanced monitoring technologies, such as Environmental Sample Processors (Den Uyl et al., 2022), and other monitoring programs in WLE.
Table 2Summary of parameters reported in the dataset. Wind speed and wave height data are collected from moored buoy continuous monitoring systems, which provide the data in imperial units. n/a stands for not applicable.
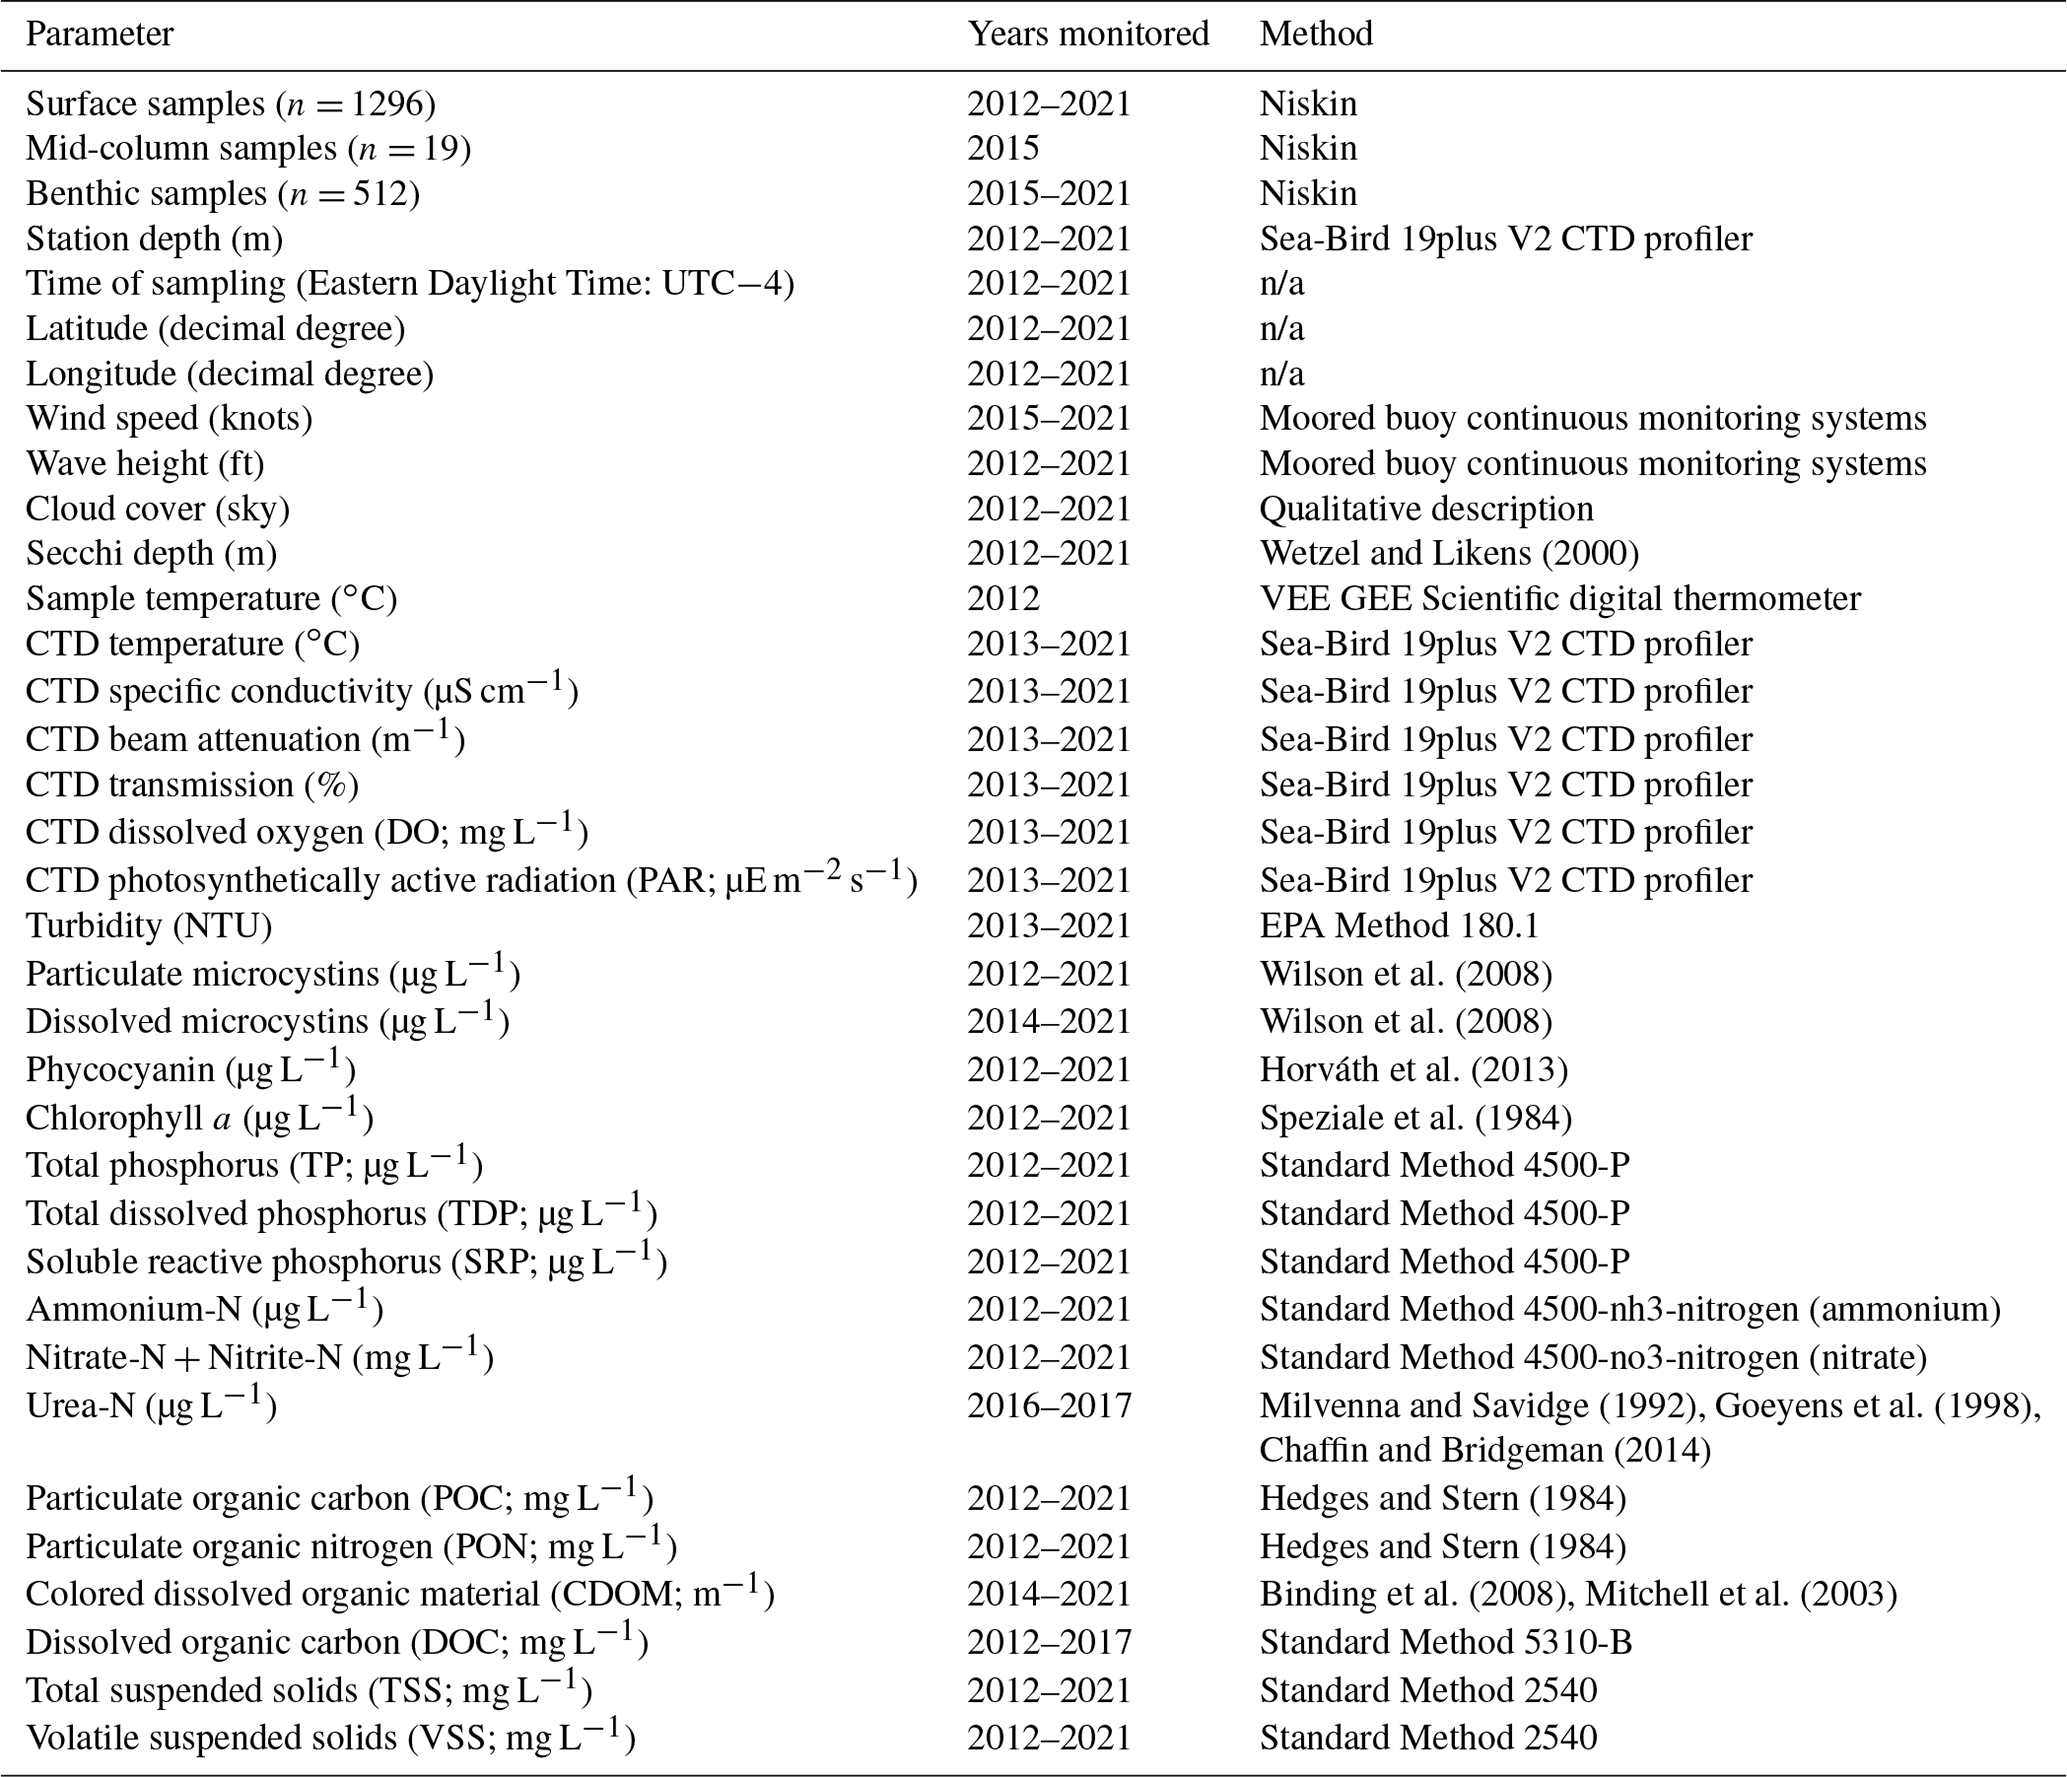
All “Standard Methods” are from Standard Methods For the Examination of Water and Wastewater from Standard Methods Committee of the American Public Health Association, American Water Works Association, and Water Environment Federation (2017).
2.2 Field sampling
Western Lake Erie discrete field sampling was accomplished using NOAA GLERL research vessels. Sampling took place during ice-free months and aimed to quantify the environmental conditions prior to, during, and at the end of the bloom (Fig. 2). Sampling stations represent approximate locations (Table 1; Fig. 1); in situ measurements and sampling were collected once the boat reached the targeted location and then proceeded to drift during sampling. The frequency and timing of those cruises varied over the first few years but has been consistent since 2017 (Fig. 2). Sampling was disrupted in 2020 due to the global COVID-19 pandemic and resulting public health restrictions. In 2020, sampling was initiated in mid-June at a reduced number of sites for select water quality parameters. In July, sampling stations and parameters were expanded and all stations and parameters were sampled and measured by August 2020. The prior standard sampling schedule resumed in April 2021.
In situ measurements for conductivity, temperature, dissolved oxygen (DO), beam attenuation, transmission, and photosynthetically active radiation (PAR) were taken with a Sea-Bird 19plus V2 conductivity, temperature, and depth (CTD) profiler attached to a hydraulic crane. Data were collected on the downcast and were reported as the mean of recorded values within ±0.5 m of the discrete sample depth. In 2012, sample temperature was taken on the boat with a VEE GEE Scientific IP67-rated digital thermometer. Sky conditions were recorded at the discretion of the field technician at each station during the sampling cruise. A Secchi disk was lowered into the water on the shaded side of the boat at each station and the depth at which the Secchi disk was no longer visible was recorded (Wetzel and Likens, 2000).
Water column samples were collected using a 5 L vertical Niskin bottle (General Oceanics model 1010). Niskin casts were evenly distributed between one or more high-density polyethylene bottles that were rinsed with site water and stored in a cooler. Three to four Niskin casts were used to fill the bottles, such that each bottle was a composite sample of the water collected. Surface samples were taken 0.75 m below the water's surface, mid-column samples were taken at approximately 4.25 m below surface, and benthic or bottom samples were taken at approximately 0.5 m above the lake bottom at each station. Surface samples were taken at all stations, while mid-column and benthic sample collection varied between sites and years. Scum samples of dense cyanobacterial accumulation on the surface of the water were collected opportunistically using a 2 L modified Van Dorn water sampler. Sampling times were reported as Eastern Daylight Time (UTC−4). Upon arrival at the laboratory, raw water samples were immediately subsampled and preserved until analysis.
Wind speed and wave height data were obtained from moored buoy continuous monitoring systems in proximity to sampling stations for a timestamp that corresponded to the time samples were collected at that station. Wave height data for all stations were obtained from the Toledo Intake Buoy (owned and maintained by LimnoTech Inc.). Wind speed data for stations WE02, WE06, WE09, WE12, WE14, WE15, and WE16 were also collected from this buoy. Data for this buoy are available through the Great Lakes Observing System (GLOS; platform ID 45165, https://seagull.glos.org/data-console/71, last access: 14 August 2023). Wind speed data for stations WE04, WE08, and WE13 were obtained from the Toledo Harbor Light no. 2 buoy (Station THLO1, owned and maintained by GLERL). Data for this buoy are available through NOAA's National Data Buoy Center (https://www.ndbc.noaa.gov/station_page.php?station=THLO1, last access: 14 August 2023).
2.3 Laboratory analysis of samples
Water collected from WLE was subsampled to make a range of analytical measurements in the laboratory (Table 2).
2.3.1 Optical properties
Turbidity was measured on raw samples using a Hach 2100AN Turbidimeter following Method 180.1 of the US EPA (1993). Colored dissolved organic material (CDOM, also defined as chromophoric dissolved organic matter) was determined by filtering lake water through an acid-rinsed 0.2 µm nuclepore polycarbonate filter into acid-washed and combusted borosilicate vials. Optical density of the filtered samples was then measured using a PerkinElmer UV/VIS Lambda 35 spectrophotometer at wavelengths from 300 to 800 nm. CDOM absorption was calculated at 400 nm (Mitchell et al., 2003; Binding et al., 2008).
Dissolved organic carbon (DOC) concentrations were determined following Standard Method 5310-B (all “Standard Methods” are drawn from Standard Methods Committee of the American Public Health Association, American Water Works Association, and Water Environment Federation, 2017). Briefly, lake water was filtered through 0.45 µm polyvinylidene difluoride membrane filters into combusted borosilicate glass vials and frozen at −20 ∘C until analysis. The filtrate was acidified with HCl and sparged with air for 6 min before being analyzed on a Shimadzu total organic carbon analyzer.
Duplicate samples for particulate organic carbon (POC) and particulate organic nitrogen (PON) were collected onto pre-combusted glass fiber filters and analyzed following Hedges and Stern (1984). Samples were stored at −20 ∘C until analysis. The filters were then acidified by fumigation with 10 % HCl and dried at 70 ∘C for 24 h before being quantified on a PerkinElmer 2400 or a Carlo-Erba 1110 CHN elemental analyzer.
Total suspended solids (TSS) and volatile suspended solids (VSS) were determined via gravimetric analysis following Standard Method 2540. A known volume of lake water was filtered through a pre-combusted, pre-weighed Whatman GF/F glass fiber filter. The filters were then dried at 60 ∘C for at least 24 h and reweighed. The difference in mass between the pre-weighed and processed filter was reported as TSS. Volatile suspended solids concentrations were quantified by combusting the filters used for TSS analysis at 450 ∘C for 4 h, weighing the combusted filters, and calculating the mass lost.
2.3.2 Nutrient fractions
Total phosphorus (TP) and total dissolved phosphorus (TDP) samples were collected in duplicate by subsampling 50 mL (2012 to 2019) or 20 mL (2020 to 2021) of lake water into acid-washed glass tubes and by filtering 20 mL of lake water through a 0.2 µm membrane filter and collecting the filtrate, respectively. Samples for TP and TDP were refrigerated until samples were digested with potassium persulfate solution and autoclaved at 121 ∘C for 30 min, modified from Standard Method 4500-P. Digested TP and TDP samples were stored at room temperature until concentrations were measured on a QuAAtro continuous segmented flow analyzer (SEAL Analytical Inc.) from 2012 to 2019 and a SEAL AA3 from 2020 to 2021 using the ascorbic acid molybdenum method as detailed by the instrument manual and Standard Method 4500-P. Analytical detection limits for the analyses were taken from the instrument manufacturer's documentation. reat Soluble reactive phosphorus (SRP), ammonium, nitrate + nitrite, and urea were each determined by filtering 12 mL of lake water through a 0.2 µm membrane filter into 15 mL centrifuge tubes during field sampling. Sample filtrates were stored at −20 ∘C upon receipt at the laboratory. Soluble reactive phosphorus, ammonium, and nitrate + nitrite concentrations were determined simultaneously on a SEAL AA3 continuous segmented flow analyzer. Soluble reactive phosphorus was measured using the ascorbic acid molybdenum method as detailed by the instrument manual and Standard Method 4500-P. Ammonium concentrations were measured using Bertholet reactions according to the instrument manual and Standard Method 4500-nh3-nitrogen. Nitrate + nitrite concentrations were measured using copper–cadmium reduction methods according to the instrument manual and Standard Method 4500-no3-nitrogen. Analytical detection limits for these inorganic nutrient analyses were taken from the instrument manufacturer's documentation. Urea samples were measured by adding diacetyl monoxime and thiosemicarbazide to the filtrate and briefly vortexing to mix, followed by adding sulfuric acid and ferric chloride to the solution and briefly vortexing to mix. Samples were then incubated in the dark for 72 h at room temperature before absorbance at 520 nm was read on a PerkinElmer UV/VIS Lambda 35 spectrophotometer. Urea concentrations were then quantified using a standard curve (Mulvenna and Savidge, 1992; Goeyens et al., 1998; Chaffin and Bridgeman, 2014). The detection limit was calculated using the standard deviation of repeated measurements.
2.3.3 Photopigments and microcystins
Particulate phycocyanin and Chlorophyll a concentrations were determined by filtering a known volume of lake water under low vacuum (< 200 mm Hg) onto 47 mm Whatman GF/F glass fiber filters (Cytiva Life Sciences). Particulate phycocyanin sample filters were stored in 15 mL conical polypropylene centrifuge tubes and Chlorophyll a sample filters were stored in amber glass vials at −20 ∘C until analysis. Analysis methods for particulate phycocyanin were derived from Horváth et al. (2013): 9 mL of phosphate buffer was added to sample tubes and samples were agitated using a shaker at 5 ∘C for 15 min at 100 rpm then vortexed for 10 s each. To encourage cell lysis, samples were subjected to three freeze/thaw cycles at −20 ∘C followed by sonication for 20 min using a Fisher FS110 H sonicator. Fluorescence of the extracted samples was measured using an AquaFluor 8000-010 fluorometer (Turner Designs) with excitation from 400 to 600 nm and an emission filter of > 595 nm. Particulate phycocyanin was calibrated annually against C-phycocyanin material from Sigma-Aldrich. Analysis methods for Chlorophyll a were derived from Speziale et al. (1984): Chlorophyll a was extracted from samples using dimethylformamide and placed into a 65 ∘C water bath for 15 min. Samples were then cooled to room temperature and vortexed for 15–20 s before being quantified using a 10AU fluorometer (Turner Designs) with excitation filter of 436 nm and emission at 680 nm. Phycocyanin and Chlorophyll a procedures were performed under low or green light to reduce pigment degradation within the cell.
Dissolved and particulate microcystins were quantified using a procedure adapted from Wilson et al. (2008). Dissolved microcystins (dMC) were determined through duplicate samples of ∼2 mL filtrate that was passed through a 0.2 µm membrane filter and stored in glass vials at −20 ∘C until analysis. Particulate microcystins (pMC) were collected by filtering a known volume of lake water onto a Whatman GF/F glass fiber filter (2012 to 2015) or a 3 µm pore size polycarbonate membrane filter (2016 to 2021). Particulate MC was then extracted from the filters. In sampling years 2012 to 2015, glass fiber filters were submerged in a glass vial containing a 75 : 25 methanol : water (MeOH H2O) solution and sonicated in an ice bath for 2 min. The samples were centrifuged for 15 min and the supernatant was transferred to a clean glass vial. An additional 5 mL of MeOH H2O was added to the filter/precipitate and the sample was incubated at −20 ∘C for 5 h. The sample was then sonicated for 2 min, centrifuged, and the supernatant was removed and added to the first extract vial. The composite supernatant was then centrifuged under a vacuum until dry. The dried extract was then stored at −20 ∘C until analysis. Particulate MC concentrations were then determined by adding 1 mL of Milli-Q water to the sample and using sonication to dissolve the dried extract. For sampling years 2016 to 2021, filters were stored in 2 mL sterile microcentrifuge tubes at −20 ∘C until analysis. During analysis, pMC were extracted from the membrane filters by adding 1 mL of Milli-Q water and subjecting samples to three freeze/thaw cycles at −20 ∘C followed by addition of Abraxis QuikLyse reagents according to the manufacturer (Eurofins/Abraxis). Particulate MC samples for all sampling years were analyzed immediately after extraction. For all sampling years, dMC and pMC concentrations were determined using a congener-independent enzyme-linked immunosorbent assay (ELISA) kit designed to detect and quantity microcystins and nodularins using the ADDA moiety (EnviroLogix brand used from 2012 to 2015; Eurofins/Abraxis microcystins/nodularins, ADDA, EPA ETV, EPA Method 546, ELISA, 96-test kit used from 2016 to 2021). Analytical detection limits for the analyses were taken from the manufacturer's documentation.
This dataset demonstrates the temporal and spatial variability in water quality parameters in western Lake Erie from 2012 to 2021. Overall, sites closest to the Maumee River inflow (i.e., WE06 and WE09) had the highest median concentrations of nutrients, sediments, pigments, and microcystins compared to sites further out in the basin (i.e., WE02, WE04, and WE13; Table 3). Stations WE06 and WE04 were sampled from the initiation of the monitoring program and consistently represented the high and low extremes of water quality observations during a given time point, respectively (Table 3); select parameters for these two sites are represented in Figs. 3 and 4. Supplement Figs. S1–S16 display the same parameters as Figs. 3 and 4 for the remaining stations.
Table 3Median values of each parameter at each monitoring station for all surface samples collected between 2012 and 2021.
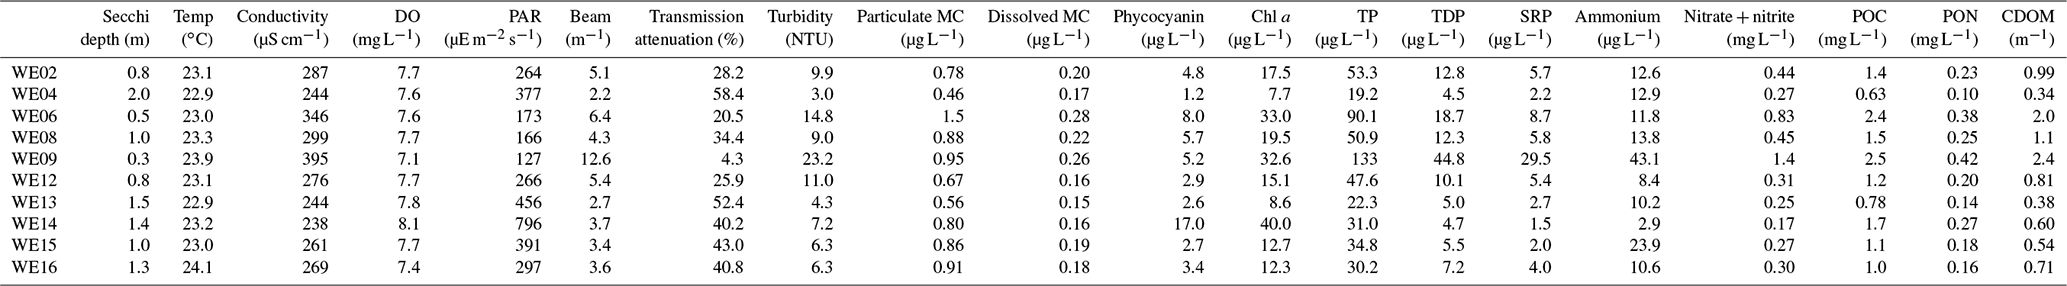
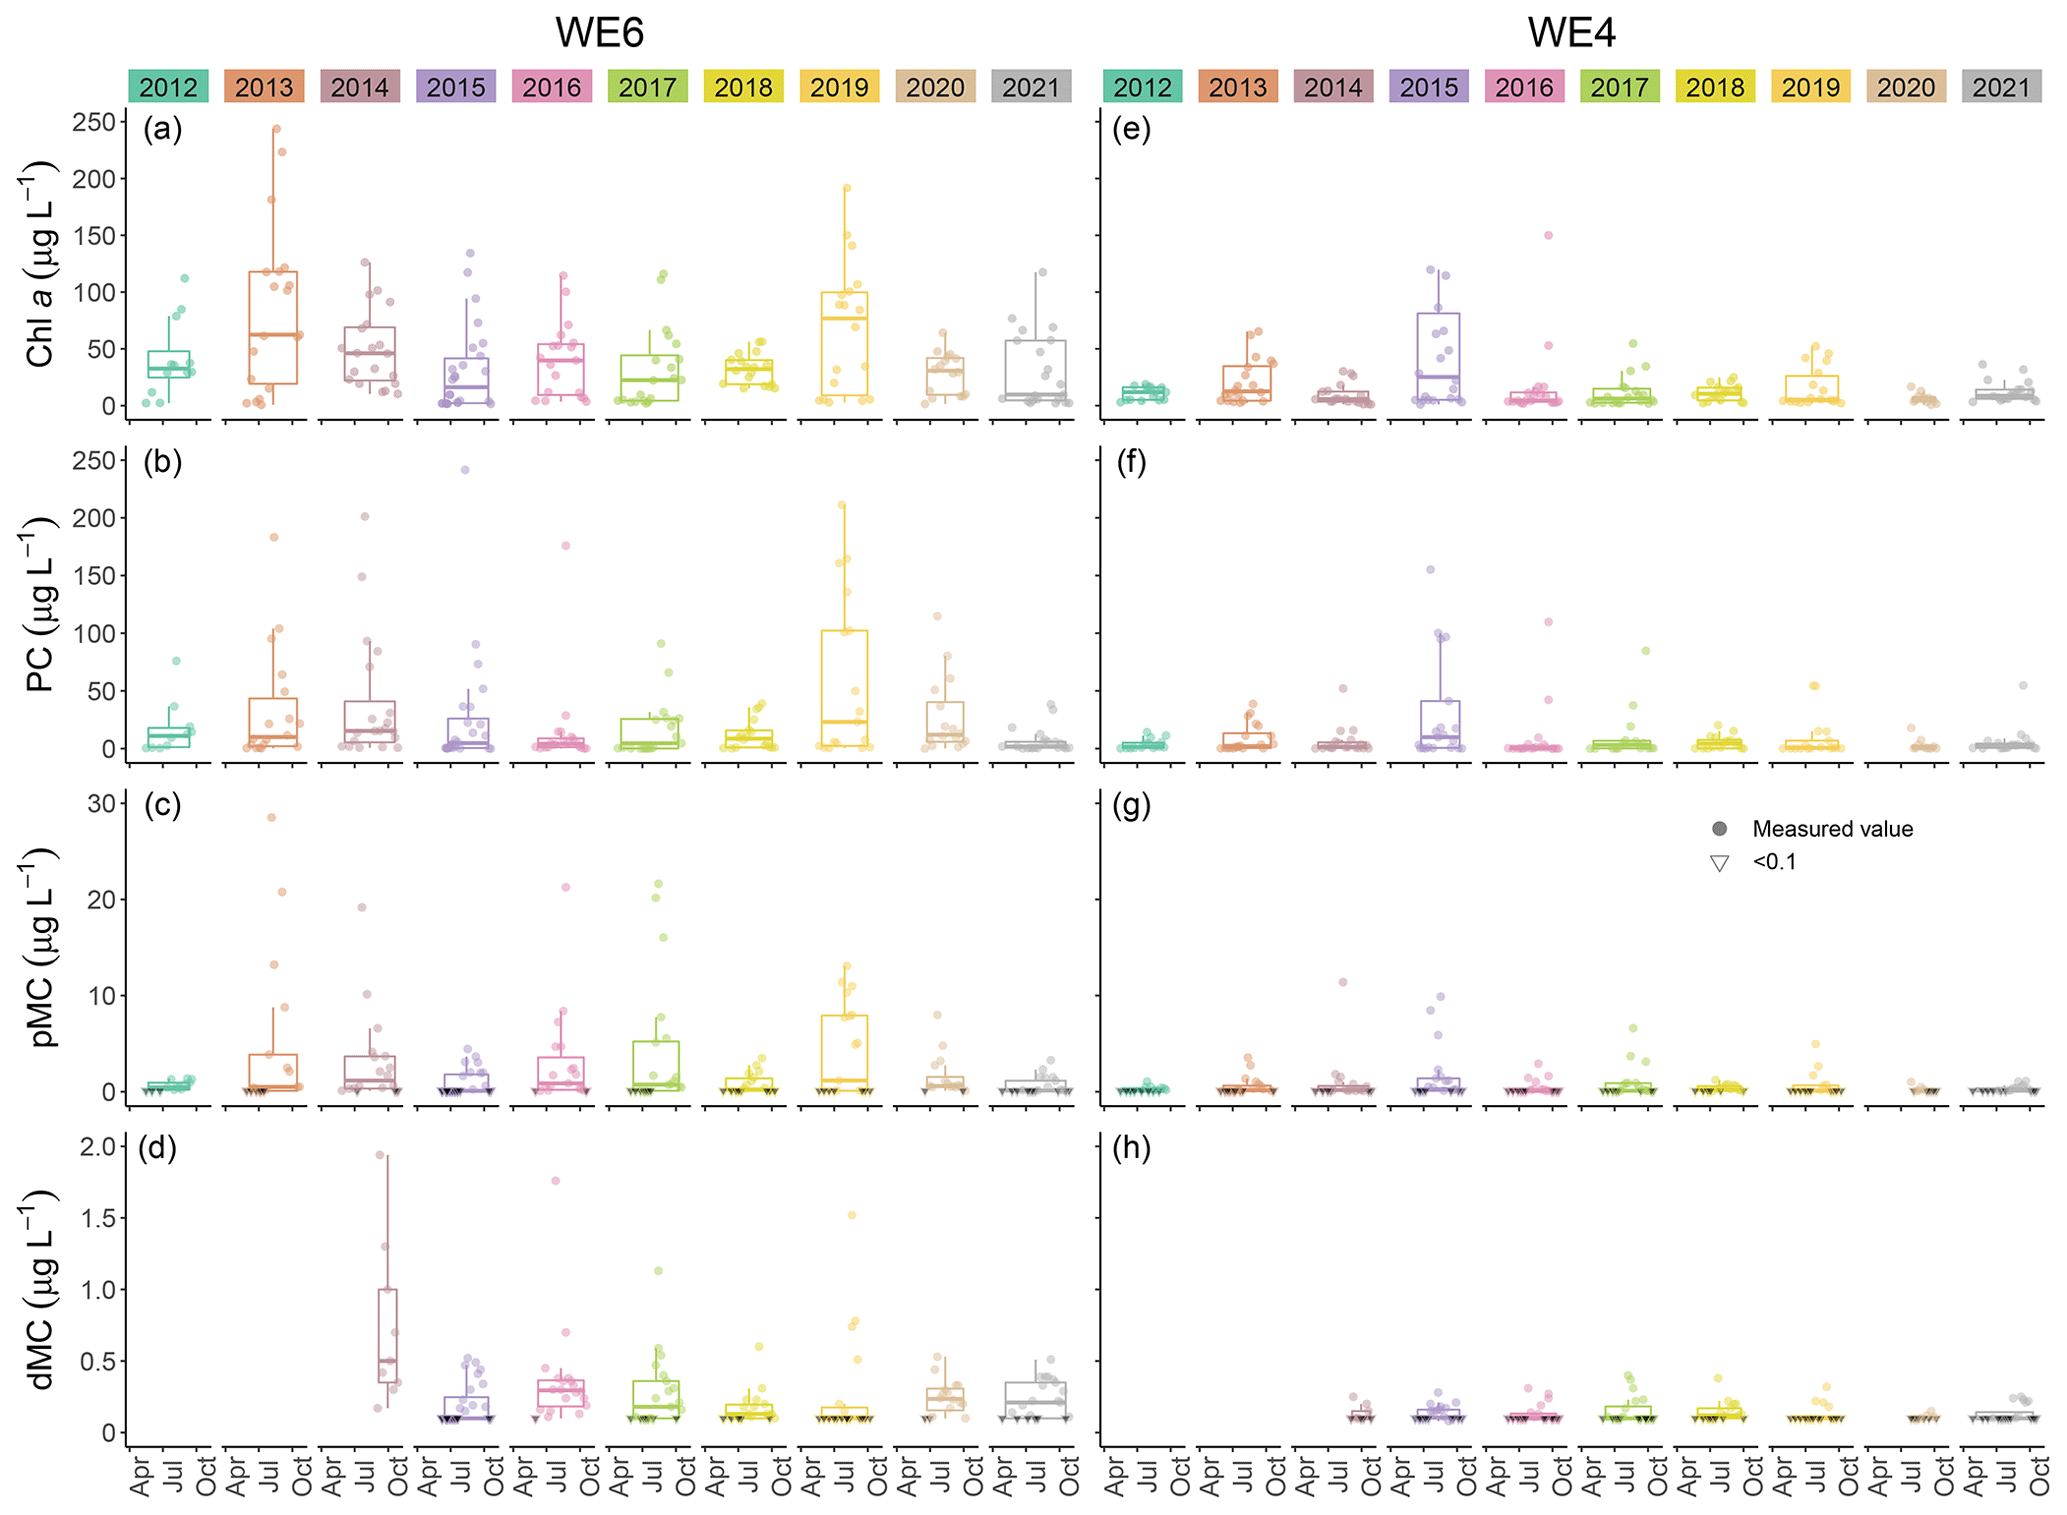
Figure 3Comparison of Chlorophyll a (Chl a), phycocyanin (PC), particulate microcystins (pMC), and dissolved microcystins (dMC) between stations WE04 and WE06 from 2012 to 2021. Boxplots represent the median and 25 % and 75 % quartiles with whiskers extending to the highest or lowest point within 1.5× the interquartile range. A scatterplot is overlaid on the boxplots.
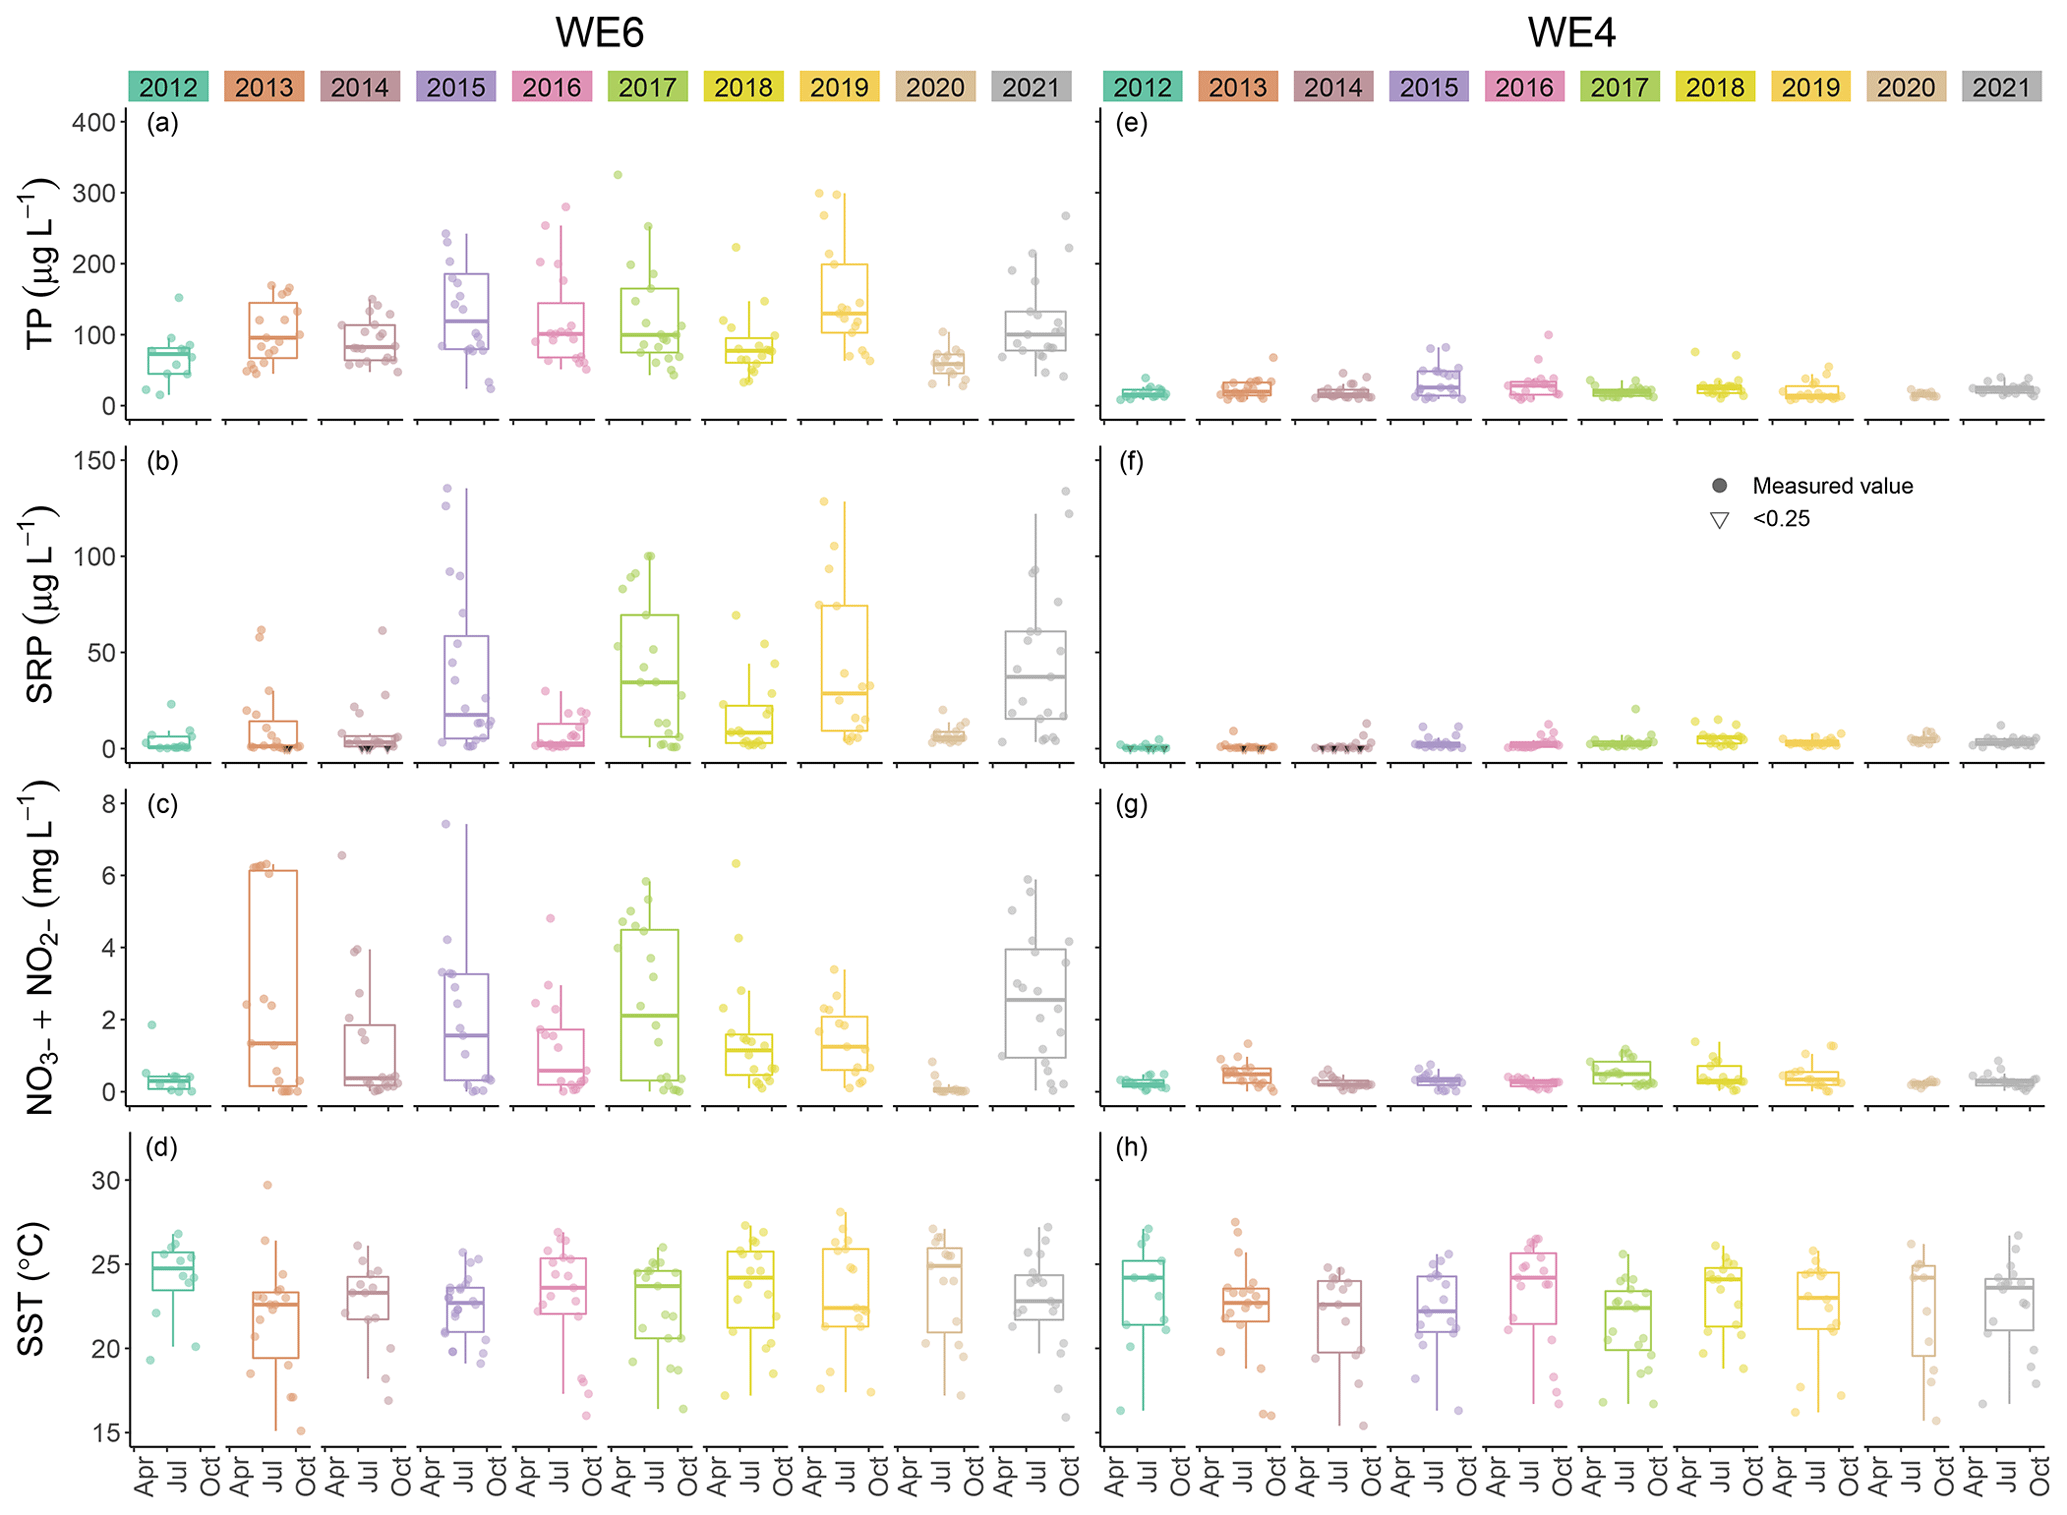
Figure 4Comparison of total phosphorus (TP), soluble reactive phosphorus (SRP), nitrate + nitrite (NO NO), and sea surface temperature (SST) between stations WE04 and WE06 from 2012 to 2021. Boxplots represent the median and 25 % and 75 % quartiles with whiskers extending to the highest or lowest point within 1.5× the interquartile range. A scatterplot is overlaid on the boxplots.
3.1 Physicochemical properties
Median surface temperatures for all samples across all years ranged from 22.9 to 24.1 ∘C, and median benthic temperatures ranged from 22.8 to 23.2 ∘C (Table 3, Fig. 4), indicating that WLE was thermally well mixed throughout the sampling period. A summary of the dataset indicates that 23.8 % of surface temperatures were ≥ 25 ∘C, and these higher temperatures all occurred from mid-June through the end of September. Bloom-forming cyanobacteria species in Lake Erie, including Microcystis spp., often reach maximum growth rates at warmer temperatures (≥ 25 ∘C) than eukaryotic phytoplankton (Steffen et al., 2014; Huisman et al., 2018). Despite having warmer temperatures that promote recurring HABs, there was only one recorded instance of hypoxia (DO < 2 mg L−1) in the dataset and it occurred at WE13 on 8 July 2019. Median DO was 7.62 mg L−1 in all surface samples and 7.02 mg L−1 in all benthic samples from 2012 to 2021 (Table 3), again indicating minimal stratification in WLE during sampling. Median conductivity from 2012 to 2021 was highest at sites WE06 and WE09, which are closest to the Maumee River input, and lowest at sites WE04 and WE13, near the middle of the basin (Table 3). WE06 and WE09 were the only sites to have median conductivity values above 300 µS cm−1.
3.2 Optical properties
Biotic and abiotic particulate concentrations and movement patterns in WLE are prone to spatial and seasonal variations and are heavily influenced by loading from the Maumee River (Prater et al., 2017; Maguire et al., 2022). Secchi depth, turbidity, and PAR measurements have been correlated with distance from Maumee Bay, where light penetration was lowest near the Maumee River (Chaffin et al., 2011). Variability in optical property measurements in WLE is also dependent on Maumee River inputs, and changes in optical properties can potentially be used in remote sensing algorithms to detect changes in water quality (Sayers et al., 2019). Median Secchi disk depth over the entire dataset was highest at WE04 and lowest at WE06 and WE09, which are closest to the Maumee River (Table 3). Other optical properties, such as PAR, beam attenuation, and transmittance also followed this spatial pattern. In a summary of all samples, median PAR measured at 0.5 m below surface was highest at WE13 and WE14 and lowest at WE09, median transmittance was highest at WE04 and lowest at WE09, and median beam attenuation and turbidity were highest at WE09 and lowest at WE04 (Table 3). Median turbidity values at each site over the 2012 to 2021 period were within the range of previously reported values in the WLE basin (Barbiero and Tuchman, 2004). Median CDOM absorbance and DOC, TSS, and VSS concentrations were again highest at WE09 and lowest at WE04 (Table 3). CDOM gradients in WLE are likewise affected by loading from the Maumee River (Cory et al., 2016), and DOC and CDOM values from this dataset have been used as predictor variables in models estimating PAR attenuation variation in WLE (Weiskerger et al., 2018).
3.3 Nutrient fractions
The Maumee River is a major contributor of nutrients to Lake Erie (Steffen et al., 2014; Kast et al., 2021). Median TP concentrations in WLE from 2012 to 2021 were lowest at WE04 and highest at WE09 (Table 3, Fig. 4). Median concentrations at each station from 2012 to 2021 were above the GLWQA Annex 4 goals for TP concentration in open waters, which is 15 µg P L−1 for WLE. This goal was met in 92 of 1275 (7.2 %) samples, and these target values were primarily recorded from stations WE04 and WE13. Sites closer to the mouth of the Maumee River had higher median TP values. While TP loading from the Maumee River tributary decreased from 1982 to 2018 (Rowland et al., 2020), the proportion of dissolved P increased (Joosse and Baker, 2011; Stow et al., 2015). Median TDP values in the WLE dataset were lowest at WE04 and highest at WE09 (Table 3), with the highest recorded value being 274 µg P L−1 at WE08 in 2015. Median SRP concentrations for each station in this dataset were lowest at WE14 and WE15 and were highest at WE09 (Table 3). The maximum recorded SRP concentration was 135.4 µg P L−1 at WE06 in 2015 (Fig. 4). Using this dataset, Newell et al. (2019) found that Maumee River loading has become more chemically reduced over time, resulting in an increased proportion of ammonium and PON compared to other nitrogen species. Median ammonium concentrations in WLE from 2012 to 2019 were lowest at WE12 and WE14 and highest at WE09 (Table 3), with a recorded maximum concentration of 2109 µg N L−1 at WE12 in 2017. Median nitrate + nitrite was lowest at WE13 and WE14 and highest at WE09 (Table 3), with a maximum recorded value of 9.5 mg N L−1 at WE09 in 2016. See Fig. 4 for a comparison of nitrate + nitrite concentrations between WE04 and WE06. Median PON concentrations were lowest at WE04 and highest at WE09 (Table 3), with a recorded maximum of 40.93 mg N L−1 at WE08 in 2015.
3.4 Photopigments and microcystins
Median extracted Chlorophyll a concentrations in surface waters from 2012 to 2021 were lowest at WE04 and highest at WE06 (Table 3, Fig. 3). The highest recorded surface concentration of Chlorophyll a was 6784 µg L−1 on 10 August 2015 at WE08 during the most severe bloom year in this dataset, according to the cyanobacteria index (CI; Wynne et al., 2013; Lunetta et al., 2015). The highest measured levels of particulate phycocyanin, pMC, and TP were also recorded at WE06 on 10 August 2015. Other notably high Chlorophyll a concentrations were measured during the severe bloom years of 2017 (532 µg L−1 at WE09 on 4 August) and 2019 (593 µg L−1 at WE09 on 5 August). Similarly, median surface particulate phycocyanin concentration for 2012 to 2021 was highest at WE06 and lowest at WE04 (Table 3, Fig. 4). The highest recorded phycocyanin value was from WE08 on 10 August 2015 (8228 µg L−1), followed by 3315 µg L−1 at WE06 in 2013, another severe bloom year.
Particulate MC concentrations had highest median concentrations at WE06 and were lowest at WE04 (Table 3, Fig. 4), similar to particulate Chlorophyll a and phycocyanin observations. The highest recorded particulate MC concentration in this dataset was from 10 August 2015 at WE08 during a severe bloom year (297 µg L−1), followed by 289 µg L−1 at WE06 in 2017 during another severe bloom year according to the CI (Wynne et al., 2013; Lunetta et al., 2015). Median dMC concentrations were highest at WE06 and lowest at WE13 (Table 3). The maximum dissolved MC in the dataset was 8.19 µg L−1 at WE09 on 05 August 2019, which correlates with high Chlorophyll a concentrations.
Although the United States does not federally enforce water quality criteria or regulations for cyanotoxins in drinking water, the US EPA has a recommended health advisory of 1.6 µg L−1 microcystins in drinking water for school-age children through adults (US EPA, 2015), while the WHO and the Ohio EPA use 1 µg L−1 microcystins as a guideline (WHO, 2020). From 2012 to 2021, 44.4 % of pMC samples in this dataset exceeded the WHO guidelines and 34.1 % exceeded the US EPA health advisory. Monitoring MC concentrations in western Lake Erie has become especially pertinent since August 2014 when the Toledo, OH, drinking water treatment plant was contaminated with microcystins in excess of 1 µg L−1 and customers were alerted to not drink their tap water until toxin levels decreased (Steffen et al., 2017). The pMC concentrations at our WLE monitoring stations varied from 1.2 to 10.1 µg L−1 on 4 August 2014 during this crisis.
The entire dataset detailed in this article can be freely accessed through the NOAA National Centers for Environmental Information (NCEI) data repository at https://doi.org/10.25921/11da-3x54 (Cooperative Institute for Great Lakes Research, University of Michigan and NOAA Great Lakes Environmental Research Laboratory, 2019). The data collection is titled “Physical, chemical, and biological water quality monitoring data to support detection of Harmful Algal Blooms (HABs) in western Lake Erie, collected by the Great Lakes Environmental Research Laboratory and the Cooperative Institute for Great Lakes Research since 2012”. The data presented in this article are available in three separate accession files within this collection: 2012 to 2018 data are available under NCEI Accession 0187718 v2.2 at https://www.ncei.noaa.gov/archive/accession/0187718 (Burtner et al., 2019), 2019 data are available under NCEI Accession 0209116 v1.1 at https://www.ncei.noaa.gov/archive/accession/0209116 (Burtner et al., 2020), and 2020 to 2021 data are available under NCEI Accession 0254720 v1.1 at https://www.ncei.noaa.gov/archive/accession/0254720 (Burtner et al., 2022). Future data will be added to this collection as they become available.
The western Lake Erie data collected and compiled by NOAA GLERL and CIGLR represent 10 years of routine water quality monitoring to detect, track, and predict cyanobacterial HAB events in an area of the Great Lakes that has experienced significant environmental degradation. This ongoing program provides a service to the region and contributes data for investigating the nuanced dynamics of potentially toxic HABs fueled by excess nutrient loading into the WLE basin.
In addition to serving the need for generating data to improve remote sensing efforts (see Sayers et al., 2016, 2019; Stumpf et al., 2016; Avouris and Ortiz, 2019; Bosse et al., 2019; Vander Woude et al., 2019; Pirasteh et al., 2020; Xu et al., 2022), this monitoring program will continue to serve stakeholders and communities in the Laurentian Great Lakes. As this program has grown, so too has the scope of application of its dataset. For instance, this dataset has assisted in assessing progress toward binational nutrient loading reduction efforts on lake basin concentrations of phosphorus. It has also been used towards determining the significance of nitrogen in bloom formation and toxicity (Gobler et al., 2016; Newell et al., 2019; Hoffman et al., 2022). Other research groups have taken advantage of this dataset to investigate microbial and algal community dynamics (Berry et al., 2017; Kharbush et al., 2019; Smith et al., 2021; Marino et al., 2022; Smith et al., 2022), the genomic diversity of cyanobacteria in the WLE basin (Yancey et al., 2022), and hydrogen peroxide production and dynamics within blooms (Cory et al., 2016; Pandey et al., 2022). We anticipate this dataset will continue to be useful for addressing the complex relationships of abiotic and biotic factors contributing to WLE HABs. Long-term monitoring programs like this one provide consistent data, which are useful for identifying patterns and variations within the ecosystem and in determining the root cause of these changes.
As the sites and parameters of this monitoring program have already changed to adapt to the needs of research, this program will continue to evolve as we consider adding parameters that encompass broader aspects of bloom dynamics. For example, lake samples can be analyzed for genomic data that will provide insights into the ability of the current phytoplankton community to produce microcystins. This decadal history has already been an invaluable resource for the research community, and it will continue to enrich our collective scientific knowledge of water quality dynamics in western Lake Erie.
The supplement related to this article is available online at: https://doi.org/10.5194/essd-15-3853-2023-supplement.
AGB prepared the manuscript, tables, and figures not otherwise attributed. AMB performed field sampling, laboratory processing, data processing, QA/QC and data management, manuscript revision, and data curation. AC performed field sampling, laboratory processing, and manuscript revision. GC performed field sampling, laboratory processing, data processing, and methodology. PD performed field sampling, laboratory processing, and manuscript revision. DF performed field sampling and laboratory processing. DFS performed field sampling, laboratory processing, and manuscript revision. CG was responsible for project administration, supervision, visualization, manuscript revision, methodology, field sampling, and sample processing. DG performed field sampling, laboratory processing, manuscript revision, and methodology. TJ was responsible for project administration, supervision, field sampling, and methodology. HK performed field sampling, laboratory processing, and manuscript revision. CK performed field sampling, laboratory processing, data processing, and manuscript revision. LAM was responsible for data curation and manuscript revision. KMC performed field sampling, laboratory processing, manuscript revision, and methodology. DP performed field sampling, laboratory processing, data processing, and manuscript revision. DS performed field sampling and data processing. HV was responsible for project administration and supervision. RE was responsible for project administration, supervision, visualization, manuscript revision, and methodology.
The contact author has declared that none of the authors has any competing interests.
Publisher’s note: Copernicus Publications remains neutral with regard to jurisdictional claims in published maps and institutional affiliations.
We thank Gabrielle Farina for preparing Fig. 1. We also thank everyone who has been involved in this monitoring program throughout the years.
Funding was awarded to the Cooperative Institute for Great Lakes Research (CIGLR) through the NOAA Cooperative Agreement with the University of Michigan (grant nos. NA17OAR4320152 and NA22OAR4320150). This is CIGLR contribution no. 1218 and NOAA-GLERL contribution no. 2024. The GLERL/CIGLR monitoring program was supported by the Great Lakes Restoration Initiative (Interagency Agreement, IAA, no. DW-013-92560501-0 CE7 Environmental Protection Agency, EPA/“Great Lakes Restoration Initiative – NOAA 2022.”).
This paper was edited by Giuseppe M. R. Manzella and reviewed by two anonymous referees.
Allinger, L. E. and Reavie, E. D.: The ecological history of Lake Erie as recorded by the phytoplankton community, J. Great Lakes Res., 39, 365–382, https://doi.org/10.1016/j.jglr.2013.06.014, 2013.
Avouris, D. M. and Ortiz, J. D.: Validation of 2015 Lake Erie MODIS image spectral decomposition using visible derivative spectroscopy and field campaign data, J. Great Lakes Res., 45, 466–479, https://doi.org/10.1016/j.jglr.2019.02.005, 2019.
Baker, D. B., Ewing, D. E., Johnson, L. T., Kramer, J. W., Merryfield, B. J., Confesor, R. B., Peter Richards, R., and Roerdink, A. A.: Lagrangian analysis of the transport and processing of agricultural runoff in the lower Maumee River and Maumee Bay, J. Great Lakes Res., 40, 479–495, https://doi.org/10.1016/j.jglr.2014.06.001, 2014a.
Baker, D. B., Confesor, R., Ewing, D. E., Johnson, L. T., Kramer, J. W., and Merryfield, B. J.: Phosphorus loading to Lake Erie from the Maumee, Sandusky and Cuyahoga rivers: The importance of bioavailability, J. Great Lakes Res., 40, 502–517, https://doi.org/10.1016/j.jglr.2014.05.001, 2014b.
Barbiero, R. P. and Tuchman, M. L.: Long-term Dreissenid Impacts on Water Clarity in Lake Erie, J. Great Lakes Res., 30, 557–565, https://doi.org/10.1016/S0380-1330(04)70371-8, 2004.
Berry, M. A., Davis, T. W., Cory, R. M., Duhaime, M. B., Johengen, T. H., Kling, G. W., Marino, J. A., Den Uyl, P. A., Gossiaux, D., Dick, G. J., and Denef, V. J.: Cyanobacterial harmful algal blooms are a biological disturbance to Western Lake Erie bacterial communities, Environ. Microbiol., 19, 1149–1162, https://doi.org/10.1111/1462-2920.13640, 2017.
Bertani, I., Steger, C. E., Obenour, D. R., Fahnenstiel, G. L., Bridgeman, T. B., Johengen, T. H., Sayers, M. J., Shuchman, R. A., and Scavia, D.: Tracking cyanobacteria blooms: Do different monitoring approaches tell the same story?, Sci. Total Environ., 575, 294–308, https://doi.org/10.1016/j.scitotenv.2016.10.023, 2017.
Binding, C. E., Jerome, J. H., Bukata, R. P., and Booty, W. G.: Spectral absorption properties of dissolved and particulate matter in Lake Erie, Remote Sens. Environ., 112, 1702–1711, https://doi.org/10.1016/j.rse.2007.08.017, 2008.
Bosse, K. R., Sayers, M. J., Shuchman, R. A., Fahnenstiel, G. L., Ruberg, S. A., Fanslow, D. L., Stuart, D. G., Johengen, T. H., and Burtner, A. M.: Spatial-temporal variability of in situ cyanobacteria vertical structure in Western Lake Erie: Implications for remote sensing observations, J. Great Lakes Res., 45, 480–489, https://doi.org/10.1016/j.jglr.2019.02.003, 2019.
Bridoux, M., Sobiechowska, M., Perez-Fuentetaja, A., and Alben, K. T.: Algal pigments in Lake Erie dreissenids, pseudofeces and sediments, as tracers of diet, selective feeding and bioaccumulation, J. Great Lakes Res., 36, 437–447, https://doi.org/10.1016/j.jglr.2010.06.005, 2010.
Buratti, F. M., Manganelli, M., Vichi, S., Stefanelli, M., Scardala, S., Testai, E., and Funari, E.: Cyanotoxins: producing organisms, occurrence, toxicity, mechanism of action and human health toxicological risk evaluation, Arch. Toxicol., 91, 1049–1130, https://doi.org/10.1007/s00204-016-1913-6, 2017.
Burnter, A., Palladino, D., Kitchens, C., Fyffe, D., Johengen, T., and Stuart, D., Fanslow, D., and Gossiaux, D.: Physical, chemical, and biological water quality data collected from a small boat in western Lake Erie, Great Lakes from 2012-05-15 to 2018-10-09 (NCEI Accession 0187718). NOAA National Centers for Environmental Information [data set], https://www.ncei.noaa.gov/archive/accession/0187718 (last access: 14 August 2023), 2019.
Burtner, A., Kitchens, C., Fyffe, D., Godwin, C., Johengen, T., Stuart, D., Errera, R., Palladino, D., Fanslow, D., and Gossiaux, D.: Physical, chemical, and biological water quality data collected from a small boat in western Lake Erie, Great Lakes from 2019-04-30 to 2019-10-07 (NCEI Accession 0209116), NOAA National Centers for Environmental Information [data set], https://www.ncei.noaa.gov/archive/accession/0209116 (last access: 14 August 2023), 2020.
Burtner, A., Kitchens, C., Carter, G., McCabe, K., Henderson, H., Godwin, C., Gossiaux, D., and Errera, R.: Physical, chemical, and biological water quality data collected from a small boat in western Lake Erie, Great Lakes from 2020-06-16 to 2021-10-27 (NCEI Accession 0254720), NOAA National Centers for Environmental Information [data set], https://www.ncei.noaa.gov/archive/accession/0254720 (last access: 14 August 2023), 2022.
Carmichael, W. W. and Boyer, G. L.: Health impacts from cyanobacteria harmful algae blooms: Implications for the North American Great Lakes, Harmful Algae, 54, 194–212, https://doi.org/10.1016/j.hal.2016.02.002, 2016.
Chaffin, J. D. and Bridgeman, T. B.: Organic and inorganic nitrogen utilization by nitrogen-stressed cyanobacteria during bloom conditions, J. Appl. Phycol., 26, 299–309, https://doi.org/10.1007/s10811-013-0118-0, 2014.
Chaffin, J. D., Bridgeman, T. B., Heckathorn, S. A., and Mishra, S.: Assessment of Microcystis growth rate potential and nutrient status across a trophic gradient in western Lake Erie, J. Great Lakes Res., 37, 92–100, https://doi.org/10.1016/j.jglr.2010.11.016, 2011.
Charlton, M. N., Milne, J. E., Booth, W. G., and Chiocchio, F.: Lake Erie Offshore in 1990: Restoration and Resilience in the Central Basin, J. Great Lakes Res., 19, 291–309, https://doi.org/10.1016/S0380-1330(93)71218-6, 1993.
Conroy, J. D., Kane, D. D., Dolan, D. M., Edwards, W. J., Charlton, M. N., and Culver, D. A.: Temporal Trends in Lake Erie Plankton Biomass: Roles of External Phosphorus Loading and Dreissenid Mussels, J. Great Lakes Res., 31, 89–110, https://doi.org/10.1016/S0380-1330(05)70307-5, 2005.
Cooperative Institute for Great Lakes Research, University of Michigan and NOAA Great Lakes Environmental Research Laboratory: Physical, chemical, and biological water quality monitoring data to support detection of Harmful Algal Blooms (HABs) in western Lake Erie, collected by the Great Lakes Environmental Research Laboratory and the Cooperative Institute for Great Lakes Research since 2012, NOAA National Centers for Environmental Information [data set], https://doi.org/10.25921/11da-3x54, 2019.
Cory, R. M., Davis, T. W., Dick, G. J., Johengen, T., Denef, V. J., Berry, M. A., Page, S. E., Watson, S. B., Yuhas, K., and Kling, G. W.: Seasonal Dynamics in Dissolved Organic Matter, Hydrogen Peroxide, and Cyanobacterial Blooms in Lake Erie, Front. Mar. Sci., 3, 54, https://doi.org/10.3389/fmars.2016.00054, 2016.
Cousino, L. K., Becker, R. H., and Zmijewski, K. A.: Modeling the effects of climate change on water, sediment, and nutrient yields from the Maumee River watershed, J. Hydrol. Reg. Stud., 4, 762–775, https://doi.org/10.1016/j.ejrh.2015.06.017, 2015.
Den Uyl, P. A., Harrison, S. B., Godwin, C. M., Rowe, M. D., Strickler, J. R., and Vanderploeg, H. A.: Comparative analysis of Microcystis buoyancy in western Lake Erie and Saginaw Bay of Lake Huron, Harmful Algae, 108, 102102, https://doi.org/10.1016/j.hal.2021.102102, 2021.
Den Uyl, P. A., Thompson, L. R., Errera, R. M., Birch, J. M., Preston, C. M., Ussler, W. I., Yancey, C. E., Chaganti, S. R., Ruberg, S. A., Doucette, G. J., Dick, G. J., Scholin, C. A., and Goodwin, K. D.: Lake Erie field trials to advance autonomous monitoring of cyanobacterial harmful algal blooms, Front. Mar. Sci., 9, 1021952, https://doi.org/10.3389/fmars.2022.1021952, 2022.
Dolan, D. M. and Chapra, S. C.: Great Lakes total phosphorus revisited: 1. Loading analysis and update (1994–2008), J. Great Lakes Res., 38, 730–740, https://doi.org/10.1016/j.jglr.2012.10.001, 2012.
ECCC – Environment and Climate Change Canada and the U.S. EPA – U.S. Environmental Protection Agency: State of the Great Lakes 2022 Technical Report, Cat No. En161-3/1E-PDF, EPA 905-R22-004, http://www.binational.net (last access: 15 August 2023), 2022.
Fang, S., Del Giudice, D., Scavia, D., Binding, C. E., Bridgeman, T. B., Chaffin, J. D., Evans, M. A., Guinness, J., Johengen, T. H., and Obenour, D. R.: A space-time geostatistical model for probabilistic estimation of harmful algal bloom biomass and areal extent, Sci. Total Environ., 695, 133776, https://doi.org/10.1016/j.scitotenv.2019.133776, 2019.
Goeyens, L., Kindermans, N., Abu Yusuf, M., and Elskens, M.: A Room Temperature Procedure for the Manual Determination of Urea in Seawater, Estuar. Coast. Shelf S., 47, 415–418, https://doi.org/10.1006/ecss.1998.0357, 1998.
Hartig, J. H., Zarull, M. A., Ciborowski, J. J. H., Gannon, J. E., Wilke, E., Norwood, G., and Vincent, A. N.: Long-term ecosystem monitoring and assessment of the Detroit River and Western Lake Erie, Environ. Monit. Assess., 158, 87–104, https://doi.org/10.1007/s10661-008-0567-0, 2009.
Hartig, J. H., Francoeur, S. N., Ciborowski, J. J. H., Gannon, J. E., Sanders, C. E., Galvao-Ferreira, P., Knauss, C. R., Gell, G., and Berk, K.: An ecosystem health assessment of the Detroit River and western Lake Erie, J. Great Lakes Res., 47, 1241–1256, https://doi.org/10.1016/j.jglr.2021.05.008, 2021.
GLWQA: Great Lakes Water Quality Agreement; Protocol Amending the Agreement Between Canada and the United States of America on Great Lakes Water Quality, 1978, as Amended on October 16, 1983 and on November 18, 1987, https://binational.net/agreement/full-text-the-2012-great-lakes-water-quality-agreement/ (last access: 21 August 2023), 2012.
Gobler, C. J., Burkholder, J. M., Davis, T. W., Harke, M. J., Johengen, T., Stow, C. A., and Van de Waal, D. B.: The dual role of nitrogen supply in controlling the growth and toxicity of cyanobacterial blooms, Harmful Algae, 54, 87–97, https://doi.org/10.1016/j.hal.2016.01.010, 2016.
Hedges, J. I. and Stern, J. H.: Carbon and nitrogen determinations of carbonate-containing solids1, Limnol. Oceanogr., 29, 657–663, https://doi.org/10.4319/lo.1984.29.3.0657, 1984.
Hellweger, F. L., Martin, R. M., Eigemann, F., Smith, D. J., Dick, G. J., and Wilhelm, S. W.: Models predict planned phosphorus load reduction will make Lake Erie more toxic, Science, 376, 1001–1005, https://doi.org/10.1126/science.abm6791, 2022.
Hoffman, D. K., McCarthy, M. J., Boedecker, A. R., Myers, J. A., and Newell, S. E.: The role of internal nitrogen loading in supporting non-N-fixing harmful cyanobacterial blooms in the water column of a large eutrophic lake, Limnol. Oceanogr., 67, 2028–2041, https://doi.org/10.1002/lno.12185, 2022.
Horváth, H., Kovács, A. W., Riddick, C., and Présing, M.: Extraction methods for phycocyanin determination in freshwater filamentous cyanobacteria and their application in a shallow lake, Eur. J. Phycol., 48, 278–286, https://doi.org/10.1080/09670262.2013.821525, 2013.
Huisman, J., Codd, G. A., Paerl, H. W., Ibelings, B. W., Verspagen, J. M. H., and Visser, P. M.: Cyanobacterial blooms, Nat. Rev. Microbiol., 16, 471–483, https://doi.org/10.1038/s41579-018-0040-1, 2018.
Joosse, P. J. and Baker, D. B.: Context for re-evaluating agricultural source phosphorus loadings to the Great Lakes, Can. J. Soil Sci., 91, 317–327, https://doi.org/10.4141/cjss10005, 2011.
Kane, D. D., Ludsin, S. A., Briland, R. D., Culver, D. A., and Munawar, M.: Ten+years gone: Continued degradation of offshore planktonic communities in U.S. waters of Lake Erie's western and central basins (2003–2013), J. Great Lakes Res., 41, 930–933, https://doi.org/10.1016/j.jglr.2015.06.002, 2015.
Kast, J. B., Apostel, A. M., Kalcic, M. M., Muenich, R. L., Dagnew, A., Long, C. M., Evenson, G., and Martin, J. F.: Source contribution to phosphorus loads from the Maumee River watershed to Lake Erie, J. Environ. Manage., 279, 111803, https://doi.org/10.1016/j.jenvman.2020.111803, 2021.
Kharbush, J. J., Smith, D. J., Powers, M., Vanderploeg, H. A., Fanslow, D., Robinson, R. S., Dick, G. J., and Pearson, A.: Chlorophyll nitrogen isotope values track shifts between cyanobacteria and eukaryotic algae in a natural phytoplankton community in Lake Erie, Org. Geochem., 128, 71–77, https://doi.org/10.1016/j.orggeochem.2018.12.006, 2019.
Kharbush, J. J., Robinson, R. S., and Carter, S. J.: Patterns in sources and forms of nitrogen in a large eutrophic lake during a cyanobacterial harmful algal bloom, Limnol. Oceanogr., 68, 803–815, https://doi.org/10.1002/lno.12311, 2023.
King, W. M., Curless, S. E., and Hood, J. M.: River phosphorus cycling during high flow may constrain Lake Erie cyanobacteria blooms, Water Res., 222, 118845, https://doi.org/10.1016/j.watres.2022.118845, 2022.
Liu, Q., Rowe, M. D., Anderson, E. J., Stow, C. A., Stumpf, R. P., and Johengen, T. H.: Probabilistic forecast of microcystin toxin using satellite remote sensing, in situ observations and numerical modeling, Environ. Model. Softw., 128, 104705, https://doi.org/10.1016/j.envsoft.2020.104705, 2020.
Lunetta, R. S., Schaeffer, B. A., Stumpf, R. P., Keith, D., Jacobs, S. A., and Murphy, M. S.: Evaluation of cyanobacteria cell count detection derived from MERIS imagery across the eastern USA, Remote Sens. Environ., 157, 24–34, https://doi.org/10.1016/j.rse.2014.06.008, 2015.
Maguire, T. J., Stow, C. A., and Godwin, C. M.: Spatially referenced Bayesian state-space model of total phosphorus in western Lake Erie, Hydrol. Earth Syst. Sci., 26, 1993–2017, https://doi.org/10.5194/hess-26-1993-2022, 2022.
Makarewicz, J. C. and Bertram, P.: Evidence for the Restoration of the Lake Erie Ecosystem: Water quality, oxygen levels, and pelagic function appear to be improving, BioScience, 41, 216–223, https://doi.org/10.2307/1311411, 1991.
Marino, J. A., Denef, V. J., Dick, G. J., Duhaime, M. B., and James, T. Y.: Fungal community dynamics associated with harmful cyanobacterial blooms in two Great Lakes, J. Great Lakes Res., 48, 1021–1031, https://doi.org/10.1016/j.jglr.2022.05.007, 2022.
Matisoff, G., Kaltenberg, E. M., Steely, R. L., Hummel, S. K., Seo, J., Gibbons, K. J., Bridgeman, T. B., Seo, Y., Behbahani, M., James, W. F., Johnson, L. T., Doan, P., Dittrich, M., Evans, M. A., and Chaffin, J. D.: Internal loading of phosphorus in western Lake Erie, J. Great Lakes Res., 42, 775–788, https://doi.org/10.1016/j.jglr.2016.04.004, 2016.
Michalak, A. M., Anderson, E. J., Beletsky, D., Boland, S., Bosch, N. S., Bridgeman, T. B., Chaffin, J. D., Cho, K., Confesor, R., Daloğlu, I., DePinto, J. V., Evans, M. A., Fahnenstiel, G. L., He, L., Ho, J. C., Jenkins, L., Johengen, T. H., Kuo, K. C., LaPorte, E., Liu, X., McWilliams, M. R., Moore, M. R., Posselt, D. J., Richards, R. P., Scavia, D., Steiner, A. L., Verhamme, E., Wright, D. M., and Zagorski, M. A.: Record-setting algal bloom in Lake Erie caused by agricultural and meteorological trends consistent with expected future conditions, P. Natl. Acad. Sci. USA, 110, 6448–6452, https://doi.org/10.1073/pnas.1216006110, 2013.
Mitchell, B. G., Kahru, M., Wieland, J., and Stramska, M.: Determination of spectral absorption coefficients of particles, dissolved material and phytoplankton for discrete water samples, in: Ocean Optics Protocols for Satellite Ocean Color Sensor Validation, Revision 4, edited by: Mueller, J. L., Fargion, G. S., and McClain, C. R., Volume IV: Inherent Optical Properties: Instruments, Characterizations, Field Measurements and Data Analysis Protocols, NASA/TM- 2003-211621, NASA Goddard Space Flight Center, Greenbelt, MD, Chap. 4, 39–64, https://ntrs.nasa.gov/api/citations/20030093642/downloads/20030093642.pdf (last access: 21 August 2023), 2003.
Mohamed, M. N., Wellen, C., Parsons, C. T., Taylor, W. D., Arhonditsis, G., Chomicki, K. M., Boyd, D., Weidman, P., Mundle, S. O. C., Cappellen, P. V., Sharpley, A. N., and Haffner, D. G.: Understanding and managing the re-eutrophication of Lake Erie: Knowledge gaps and research priorities, Freshw. Sci., 38, 675–691, https://doi.org/10.1086/705915, 2019.
Mulvenna, P. F. and Savidge, G.: A modified manual method for the determination of urea in seawater using diacetylmonoxime reagent, Estuar. Coast. Shelf S., 34, 429–438, https://doi.org/10.1016/S0272-7714(05)80115-5, 1992.
Myers, D. N., Thomas, M. A., Frey, J. W., Rheaume, S. J., and Button, D. T.: Water Quality in the Lake Erie-Lake Saint Clair Drainages Michigan, Ohio, Indiana, New York, and Pennsylvania, 1996–98: U.S. Geological Survey Circular 1203, 35 pp., https://pubs.water.usgs.gov/circ1203/ (last access: 15 August 2023), 2000.
NCWQR: Heidelberg Tributary Loading Program (HTLP) Dataset, Zenodo [data set], https://doi.org/10.5281/zenodo.6606949, 2022.
Newell, S. E., Davis, T. W., Johengen, T. H., Gossiaux, D., Burtner, A., Palladino, D., and McCarthy, M. J.: Reduced forms of nitrogen are a driver of non-nitrogen-fixing harmful cyanobacterial blooms and toxicity in Lake Erie, Harmful Algae, 81, 86–93, https://doi.org/10.1016/j.hal.2018.11.003, 2019.
Pandey, D. R., Polik, C., and Cory, R. M.: Controls on the photochemical production of hydrogen peroxide in Lake Erie, Environ. Sci. Processes Impacts, 24, 2108–2118, https://doi.org/10.1039/D2EM00327A, 2022.
Pirasteh, S., Mollaee, S., Fatholahi, S. N., and Li, J.: Estimation of Phytoplankton Chlorophyll-a Concentrations in the Western Basin of Lake Erie Using Sentinel-2 and Sentinel-3 Data, Can. J. Remote Sens., 46, 585–602, https://doi.org/10.1080/07038992.2020.1823825, 2020.
Prater, C., Frost, P. C., Howell, E. T., Watson, S. B., Zastepa, A., King, S. S. E., Vogt, R. J., and Xenopoulos, M. A.: Variation in particulate C : N : P stoichiometry across the Lake Erie watershed from tributaries to its outflow, Limnol. Oceanogr., 62, S194–S206, https://doi.org/10.1002/lno.10628, 2017.
Qian, S. S., Stow, C. A., Rowland, F. E., Liu, Q., Rowe, M. D., Anderson, E. J., Stumpf, R. P., and Johengen, T. H.: Chlorophyll a as an indicator of microcystin: Short-term forecasting and risk assessment in Lake Erie, Ecol. Indic., 130, 108055, https://doi.org/10.1016/j.ecolind.2021.108055, 2021.
Reavie, E. D., Cai, M., Twiss, M. R., Carrick, H. J., Davis, T. W., Johengen, T. H., Gossiaux, D., Smith, D. E., Palladino, D., Burtner, A., and Sgro, G. V.: Winter–spring diatom production in Lake Erie is an important driver of summer hypoxia, J. Great Lakes Res., 42, 608–618, https://doi.org/10.1016/j.jglr.2016.02.013, 2016.
Rowe, M. D., Anderson, E. J., Wynne, T. T., Stumpf, R. P., Fanslow, D. L., Kijanka, K., Vanderploeg, H. A., Strickler, J. R., and Davis, T. W.: Vertical distribution of buoyant Microcystis blooms in a Lagrangian particle tracking model for short-term forecasts in Lake Erie, J. Geophys. Res.-Oceans, 121, 5296–5314, https://doi.org/10.1002/2016JC011720, 2016.
Rowland, F. E., Stow, C. A., Johengen, T. H., Burtner, A. M., Palladino, D., Gossiaux, D. C., Davis, T. W., Johnson, L. T., and Ruberg, S.: Recent Patterns in Lake Erie Phosphorus and Chlorophyll a Concentrations in Response to Changing Loads, Environ. Sci. Technol., 54, 835–841, https://doi.org/10.1021/acs.est.9b05326, 2020.
Sayers, M., Fahnenstiel, G. L., Shuchman, R. A., and Whitley, M.: Cyanobacteria blooms in three eutrophic basins of the Great Lakes: a comparative analysis using satellite remote sensing, Int. J. Remote Sens., 37, 4148–4171, https://doi.org/10.1080/01431161.2016.1207265, 2016.
Sayers, M. J., Bosse, K. R., Shuchman, R. A., Ruberg, S. A., Fahnenstiel, G. L., Leshkevich, G. A., Stuart, D. G., Johengen, T. H., Burtner, A. M., and Palladino, D.: Spatial and temporal variability of inherent and apparent optical properties in western Lake Erie: Implications for water quality remote sensing, J. Great Lakes Res., 45, 490–507, https://doi.org/10.1016/j.jglr.2019.03.011, 2019.
Smith, D. J., Tan, J. Y., Powers, M. A., Lin, X. N., Davis, T. W., and Dick, G. J.: Individual Microcystis colonies harbour distinct bacterial communities that differ by Microcystis oligotype and with time, Environ. Microbiol., 23, 3020–3036, https://doi.org/10.1111/1462-2920.15514, 2021.
Smith, D. J., Berry, M. A., Cory, R. M., Johengen, T. H., Kling, G. W., Davis, T. W., and Dick, G. J.: Heterotrophic Bacteria Dominate Catalase Expression during Microcystis Blooms, Appl. Environ. Microbiol., 88, e02544-21, https://doi.org/10.1128/aem.02544-21, 2022.
Smith, R. B., Bass, B., Sawyer, D., Depew, D., and Watson, S. B.: Estimating the economic costs of algal blooms in the Canadian Lake Erie Basin, Harmful Algae, 87, 101624, https://doi.org/10.1016/j.hal.2019.101624, 2019.
Speziale, B. J., Schreiner, S. P., Giammatteo, P. A., and Schindler, J. E.: Comparison of N,N-Dimethylformamide, Dimethyl Sulfoxide, and Acetone for Extraction of Phytoplankton Chlorophyll, Can. J. Fish. Aquat. Sci., 41, 1519–1522, https://doi.org/10.1139/f84-187, 1984.
Standard Methods Committee of the American Public Health Association, American Water Works Association, and Water Environment Federation: Standard Methods For the Examination of Water and Wastewater, 23rd edition, Sections 2540 Solids, 4500-P Phosphorus, 4500-nh3-nitrogen (ammonia), 4500-no3-nitrogen (nitrate), 5310-B Total Organic Carbon, edited by: Lipps, W. C., Baxter, T. E., Braun-Howland, E., APHA Press, Washington, DC, ISBN 1625762402, 2017.
Steffen, M. M., Belisle, B. S., Watson, S. B., Boyer, G. L., and Wilhelm, S. W.: Status, causes and controls of cyanobacterial blooms in Lake Erie, J. Great Lakes Res., 40, 215–225, https://doi.org/10.1016/j.jglr.2013.12.012, 2014.
Steffen, M. M., Davis, T. W., McKay, R. M. L., Bullerjahn, G. S., Krausfeldt, L. E., Stough, J. M. A., Neitzey, M. L., Gilbert, N. E., Boyer, G. L., Johengen, T. H., Gossiaux, D. C., Burtner, A. M., Palladino, D., Rowe, M. D., Dick, G. J., Meyer, K. A., Levy, S., Boone, B. E., Stumpf, R. P., Wynne, T. T., Zimba, P. V., Gutierrez, D., and Wilhelm, S. W.: Ecophysiological Examination of the Lake Erie Microcystis Bloom in 2014: Linkages between Biology and the Water Supply Shutdown of Toledo, OH, Environ. Sci. Technol., 51, 6745–6755, https://doi.org/10.1021/acs.est.7b00856, 2017.
Sterner, R. W., Keeler, B., Polasky, S., Poudel, R., Rhude, K., and Rogers, M.: Ecosystem services of Earth's largest freshwater lakes, Ecosyst. Serv., 41, 101046, https://doi.org/10.1016/j.ecoser.2019.101046, 2020.
Stow, C. A., Cha, Y., Johnson, L. T., Confesor, R., and Richards, R. P.: Long-Term and Seasonal Trend Decomposition of Maumee River Nutrient Inputs to Western Lake Erie, Environ. Sci. Technol., 49, 3392–3400, https://doi.org/10.1021/es5062648, 2015.
Stumpf, R. P., Davis, T. W., Wynne, T. T., Graham, J. L., Loftin, K. A., Johengen, T. H., Gossiaux, D., Palladino, D., and Burtner, A.: Challenges for mapping cyanotoxin patterns from remote sensing of cyanobacteria, Harmful Algae, 54, 160–173, https://doi.org/10.1016/j.hal.2016.01.005, 2016.
US EPA – United States Environmental Protection Agency: Method 180.1: Determination of Turbidity by Nephelometry, Revision 2.0, edited by: O'Dell, J. W., https://www.epa.gov/sites/default/files/2015-08/documents/method_180-1_1993.pdf (last access: 15 August 2023), 1993.
US EPA – United States Environmental Protection Agency: Drinking Water Health Advisory for the Cyanobacterial Microcystin Toxins, EPA Document Number 820R15100, https://www.epa.gov/sites/default/files/2017-06/documents/microcystins-report-2015.pdf (last access: 15 August 2023), 2015.
Vander Woude, A., Ruberg, S., Johengen, T., Miller, R., and Stuart, D.: Spatial and temporal scales of variability of cyanobacteria harmful algal blooms from NOAA GLERL airborne hyperspectral imagery, J. Great Lakes Res., 45, 536–546, https://doi.org/10.1016/j.jglr.2019.02.006, 2019.
Vanderploeg, H. A., Liebig, J. R., Carmichael, W. W., Agy, M. A., Johengen, T. H., Fahnenstiel, G. L., and Nalepa, T. F.: Zebra mussel (Dreissena polymorpha) selective filtration promoted toxic Microcystis blooms in Saginaw Bay (Lake Huron) and Lake Erie, Can. J. Fish. Aquat. Sci., 58, 1208–1221, https://doi.org/10.1139/f01-066, 2001.
Van Meter, K. J., McLeod, M. M., Liu, J., Tenkouano, G. T., Hall, R. I., Van Cappellen, P., and Basu, N. B.: Beyond the Mass Balance: Watershed Phosphorus Legacies and the Evolution of the Current Water Quality Policy Challenge, Water Resour. Res., 57, e2020WR029316, https://doi.org/10.1029/2020WR029316, 2021.
Wang, Q. and Boegman, L.: Multi-Year Simulation of Western Lake Erie Hydrodynamics and Biogeochemistry to Evaluate Nutrient Management Scenarios, Sustainability, 13, 7516, https://doi.org/10.3390/su13147516, 2021.
Watson, S. B., Miller, C., Arhonditsis, G., Boyer, G. L., Carmichael, W., Charlton, M. N., Confesor, R., Depew, D. C., Höök, T. O., Ludsin, S. A., Matisoff, G., McElmurry, S. P., Murray, M. W., Peter Richards, R., Rao, Y. R., Steffen, M. M., and Wilhelm, S. W.: The re-eutrophication of Lake Erie: Harmful algal blooms and hypoxia, Harmful Algae, 56, 44–66, https://doi.org/10.1016/j.hal.2016.04.010, 2016.
Weiskerger, C. J., Rowe, M. D., Stow, C. A., Stuart, D., and Johengen, T.: Application of the Beer–Lambert Model to Attenuation of Photosynthetically Active Radiation in a Shallow, Eutrophic Lake, Water Resour. Res., 54, 8952–8962, https://doi.org/10.1029/2018WR023024, 2018.
Wetzel, R. G. and Likens G. E.: Limnological Analyses, 3rd edition, Springer New York, NY, https://doi.org/10.1007/978-1-4757-3250-4, 2000.
WHO – World Health Organization: Cyanobacterial toxins: microcystins, Background document for development of WHO Guidelines for drinking-water quality and Guidelines for safe recreational water environments, WHO/HEP/ECH/WSH/2020.6, https://apps.who.int/iris/bitstream/handle/10665/338066/WHO-HEP-ECH-WSH-2020.6-eng.pdf (last access: 15 August 2023), 2020.
Wilson, A. E., Gossiaux, D. C., Höök, T. O., Berry, J. P., Landrum, P. F., Dyble, J., and Guildford, S. J.: Evaluation of the human health threat associated with the hepatotoxin microcystin in the muscle and liver tissues of yellow perch (Perca flavescens), Can. J. Fish. Aquat. Sci., 65, 1487–1497, https://doi.org/10.1139/F08-067, 2008.
Wynne, T. T., Stumpf, R. P., Tomlinson, M. C., Fahnenstiel, G. L., Dyble, J., Schwab, D. J., and Joshi, S. J.: Evolution of a cyanobacterial bloom forecast system in western Lake Erie: Development and initial evaluation, J. Great Lakes Res., 39, 90–99, https://doi.org/10.1016/j.jglr.2012.10.003, 2013.
Xu, J., Liu, H., Lin, J., Lyu, H., Dong, X., Li, Y., Guo, H., and Wang, H.: Long-term monitoring particulate composition change in the Great Lakes using MODIS data, Water Res., 222, 118932, https://doi.org/10.1016/j.watres.2022.118932, 2022.
Yancey, C. E., Mathiesen, O., and Dick, G. J.: Transcriptionally active nitrogen fixation and biosynthesis of diverse secondary metabolites by Dolichospermum and Aphanizominom-like Cyanobacteria in western Lake Erie Microcystis blooms, bioRxiv [preprint], https://doi.org/10.1101/2022.09.30.510322 01 October 2022a.
Yancey, C. E., Smith, D. J., Den Uyl, P. A., Mohamed, O. G., Yu, F., Ruberg, S. A., Chaffin, J. D., Goodwin, K. D., Tripathi, A., Sherman, D. H., and Dick, G. J.: Metagenomic and Metatranscriptomic Insights into Population Diversity of Microcystis Blooms: Spatial and Temporal Dynamics of mcy Genotypes, Including a Partial Operon That Can Be Abundant and Expressed, Appl. Environ. Microb., 88, e02464-21, https://doi.org/10.1128/aem.02464-21, 2022b.