the Creative Commons Attribution 4.0 License.
the Creative Commons Attribution 4.0 License.
 | 10 Aug 2023
Seamless mapping of long-term (2010–2020) daily global XCO2 and XCH4 from the Greenhouse Gases Observing Satellite (GOSAT), Orbiting Carbon Observatory 2 (OCO-2), and CAMS global greenhouse gas reanalysis (CAMS-EGG4) with a spatiotemporally self-supervised fusion method
Yuan Wang
Tongwen Li
Yuanjian Yang
Siqin Zhou
Liangpei Zhang
Precise and continuous monitoring of long-term carbon dioxide (CO2) and methane (CH4) over the globe is of great importance, which can help study global warming and achieve the goal of carbon neutrality. Nevertheless, the available observations of CO2 and CH4 from satellites are generally sparse, and current fusion methods to reconstruct their long-term values on a global scale are few. To address this problem, we propose a novel spatiotemporally self-supervised fusion method to establish long-term daily seamless XCO2 and XCH4 products from 2010 to 2020 over the globe on grids of 0.25∘. A total of three datasets are applied in our study, including the Greenhouse Gases Observing Satellite (GOSAT), the Orbiting Carbon Observatory 2 (OCO-2), and CAMS global greenhouse gas reanalysis (CAMS-EGG4). Attributed to the significant sparsity of data from GOSAT and OCO-2, the spatiotemporal discrete cosine transform is considered for our fusion task. Validation results show that the proposed method achieves a satisfactory accuracy, with standard deviations of bias (σ) of ∼1.18 ppm for XCO2 and 11.3 ppb for XCH4 against Total Carbon Column Observing Network (TCCON) measurements from 2010 to 2020. Meanwhile, the determination coefficients (R2) of XCO2 and XCH4 reach 0.91 or 0.95 (2010–2014 or 2015–2020) and 0.9 (2010–2020), respectively, after fusion. Overall, the performance of fused results distinctly exceeds that of CAMS-EGG4, which is also superior or close to those of GOSAT and OCO-2. In particular, our fusion method can effectively correct the large biases in CAMS-EGG4 due to the issues from assimilation data, such as the unadjusted anthropogenic emission inventories for COVID-19 lockdowns in 2020. Moreover, the fused results present coincident spatial patterns with GOSAT and OCO-2, which accurately display the long-term and seasonal changes in globally distributed XCO2 and XCH4. The daily global seamless gridded (0.25∘) XCO2 and XCH4 from 2010 to 2020 can be freely accessed at https://doi.org/10.5281/zenodo.7388893 (Wang et al., 2022a).
- Article
(35854 KB) - Full-text XML
- BibTeX
- EndNote


As the most abundant greenhouse gases (GHGs) due to human activities, atmospheric carbon dioxide (CO2) and methane (CH4) play significant roles in climate change and directly contribute to global warming (Meinshausen et al., 2009; Montzka et al., 2011; Solomon et al., 2010; Yoro and Daramola, 2020; Shine et al., 2005). For decades, the rising anthropogenic surface emissions of CO2 and CH4 have resulted in their long-term rapid uptrends (Choulga et al., 2021; Moran et al., 2022; Lin et al., 2021; Petrescu et al., 2021), which have greatly affected the carbon cycle (Battin et al., 2009; Sjögersten et al., 2014) and ecosystem balance (Liu and Greaver, 2009; Hotchkiss et al., 2015). According to measurements from the Global Greenhouse Gas Reference Network (https://gml.noaa.gov/ccgg/, last access: 10 November 2022), annual surface CO2 and CH4 mole fractions break 412 parts per million (ppm) and 1878 parts per billion (ppb) in 2020, with increases of ∼68 ppm and 222 ppb since 1985, respectively. To mitigate global warming, the Paris Agreement (https://unfccc.int/process-and-meetings/the-paris-agreement/, last access: 10 November 2022) has indicated that the increment of temperature should not exceed 2∘ (preferably 1.5∘) by comparison with the preindustrial level. This requires all efforts from the whole of society to reach the global peak of GHG surface emissions as early as possible, especially for CO2 and CH4, to eventually create a carbon-neutral world by mid-century. Therefore, there is an urgent need to precisely and continuously monitor atmospheric CO2 and CH4 on a global scale.
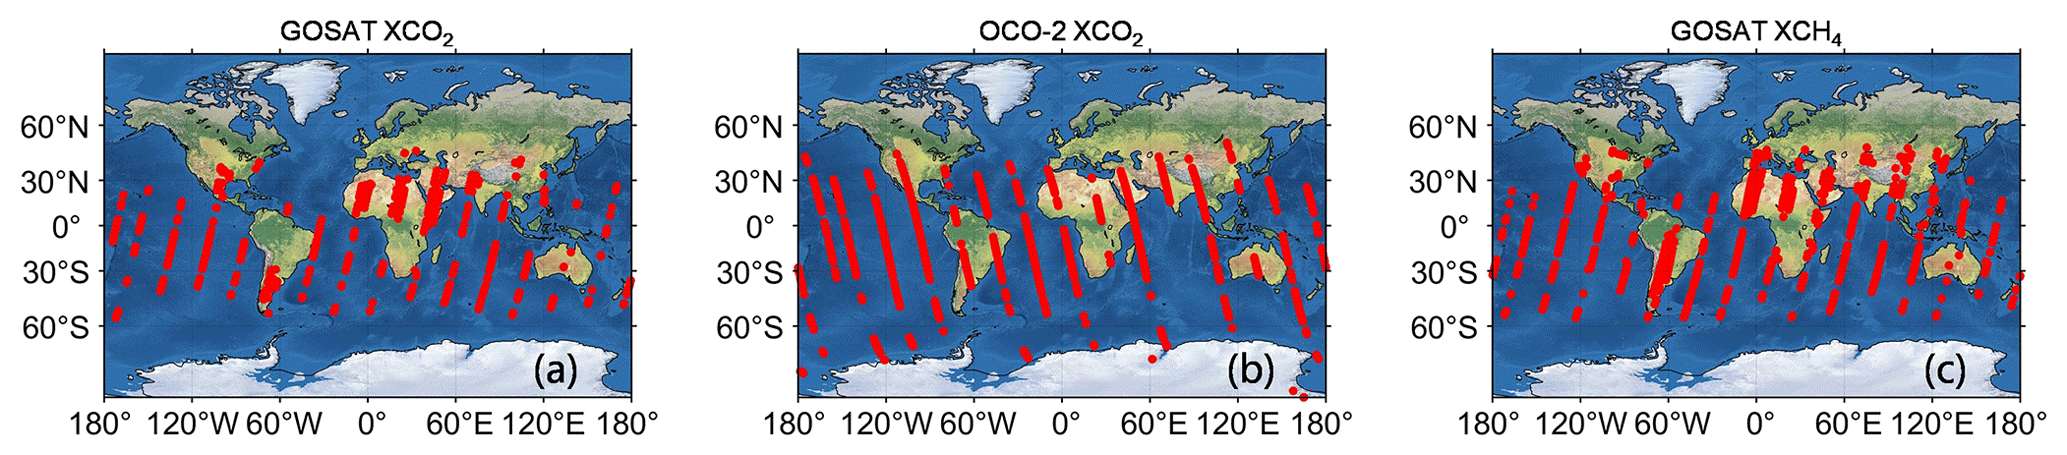
Figure 1An example of daily spatial footprints for (a) GOSAT XCO2, (b) OCO-2 XCO2, and (c) GOSAT XCH4. Red points signify the available data. Background maps are naturally shaded reliefs over the globe.
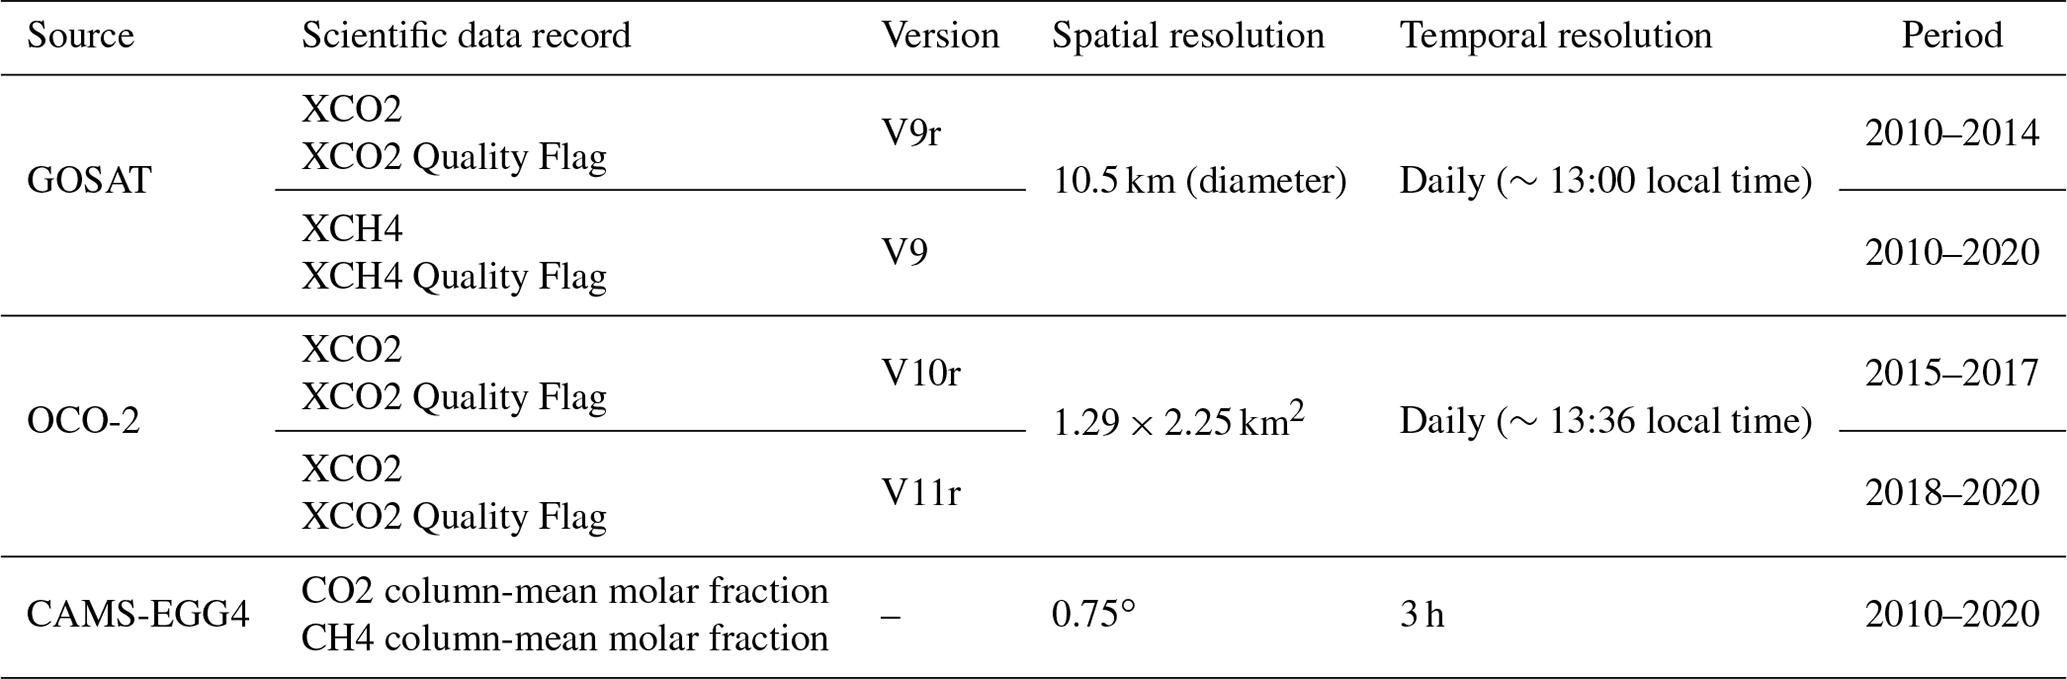
Table 1Detailed information on the datasets considered in this study.
To date, remote-sensing observations have been extensively adopted in plenty of domains (J. He et al., 2022, 2023; Wang et al., 2021, 2022b; Xiao et al., 2022, 2023; Zhou et al., 2022), which also emerged as regular techniques to acquire globe-scale atmospheric CO2 and CH4 spatial patterns (He et al., 2022a; Buchwitz et al., 2015; Bergamaschi et al., 2013). For instance, the Environmental Satellite (Envisat) can provide global column-mean dry-air mole fractions of CO2 (XCO2) and CH4 (XCH4) at a coarse resolution of 30×60 km2 with the payload of the Scanning Imaging Absorption Spectrometer for Atmospheric Cartography (Burrows et al., 1995; Beirle et al., 2018). The Thermal and Near-Infrared Sensor for carbon Observations – Fourier Transform Spectrometer on board the Greenhouse Gases Observing Satellite (GOSAT) (Hamazaki et al., 2005; Velazco et al., 2019) can produce ∼10 km XCO2 and XCH4 over the globe based on three spectral bands. Orbiting Carbon Observatory 2 and 3 (OCO-2 and OCO-3) (Crisp et al., 2017; Doughty et al., 2022) carry three-channel grating spectrometers to generate globally covered XCO2 at a much finer spatial resolution of 1.29×2.25 km2. The Carbon Dioxide Spectrometer named CarbonSpec on board the TanSat (Liu et al., 2018) of China was launched in 2016 and can accurately map the high-resolution (∼2 km) global XCO2 spatial distribution.
As for long-term observations of XCO2 and XCH4, the operational products from GOSAT and OCO-2 are widely applied in carbon-related applications, such as computing carbon fluxes (Fraser et al., 2013; Wang et al., 2019), inferring carbon sources and sinks (Deng et al., 2014; Houweling et al., 2015), quantifying CO2 and CH4 emissions (Turner et al., 2015; Hakkarainen et al., 2016), and estimating terrestrial net ecosystem exchange (Jiang et al., 2022). Nevertheless, large-scale missing data consist of the XCO2 and XCH4 products from GOSAT and OCO-2, which is attributed to the narrow swath of their observations (Crisp et al., 2017) and contamination of cloud and aerosol (Taylor et al., 2016). Seamless information on XCO2 and XCH4 can help better understand the driving factors of long-term variations of CO2 and CH4 due to surface emissions and atmospheric transport (Kenea et al., 2023; Liu et al., 2020). In addition, full-coverage XCO2 and XCH4 products are more useful for analyzing carbon source–sink dynamics (Reithmaier et al., 2021; Crosswell et al., 2017) and impacts on climate changes caused by the elevated CO2 and CH4 (Chen et al., 2021; Le Quéré et al., 2019). Hence, it is significant and essential to ensure the spatiotemporal continuity of XCO2 and XCH4 products from GOSAT and OCO-2, which is conducive to achieving the goal of carbon neutrality.
A lot of efforts have been made to generate seamless XCO2 and XCH4 products for GOSAT and OCO-2. Initially, interpolation-based methods are widely utilized, such as fixed-rank kriging interpolation (Katzfuss and Cressie, 2011), semantic kriging interpolation (Bhattacharjee et al., 2014), and space–time kriging interpolation (He et al., 2020; Li et al., 2022). However, the interpolated results are usually performed at coarse spatial resolutions (e.g., 1∘) and tend to show high uncertainties and an overly smoothed distribution due to the extreme sparsity of original data. At present, data fusion techniques (He et al., 2022a, b; Zhang et al., 2022; Zhang and Liu, 2023; Siabi et al., 2019) have emerged as new methods to acquire full-coverage products for GOSAT and OCO-2 at a high spatial resolution, which absorb advantages from multi-source data. Generally, these methods exploited machine-learning algorithms to train an end-to-end fusion function with multiple seamless data (e.g., model and reanalysis) as inputs. For example, Siabi et al. (2019) employed a multi-layer perceptron and eight environmental variables (e.g., net primary productivity and leaf area index) to map full-coverage XCO2 in Iran. He et al. (2022b) established seamless results over China using the OCO-2 XCO2 product, CarbonTracker model data, and auxiliary co-variates based on the light-gradient-boosting machine. Zhang et al. (2022) proposed a geographically weighted neural network to produce a full-coverage XCO2 product across China by fusing the datasets from OCO-2, CAMS global greenhouse gas reanalysis (CAMS-EGG4), (reanalysis), and ERA5. Zhang and Liu (2023) adopted multiple datasets, e.g., Envisat, GOSAT, OCO-2, CarbonTracker, and ERA5, and obtained a long-term seamless XCO2 product in China through a finely devised neural network.
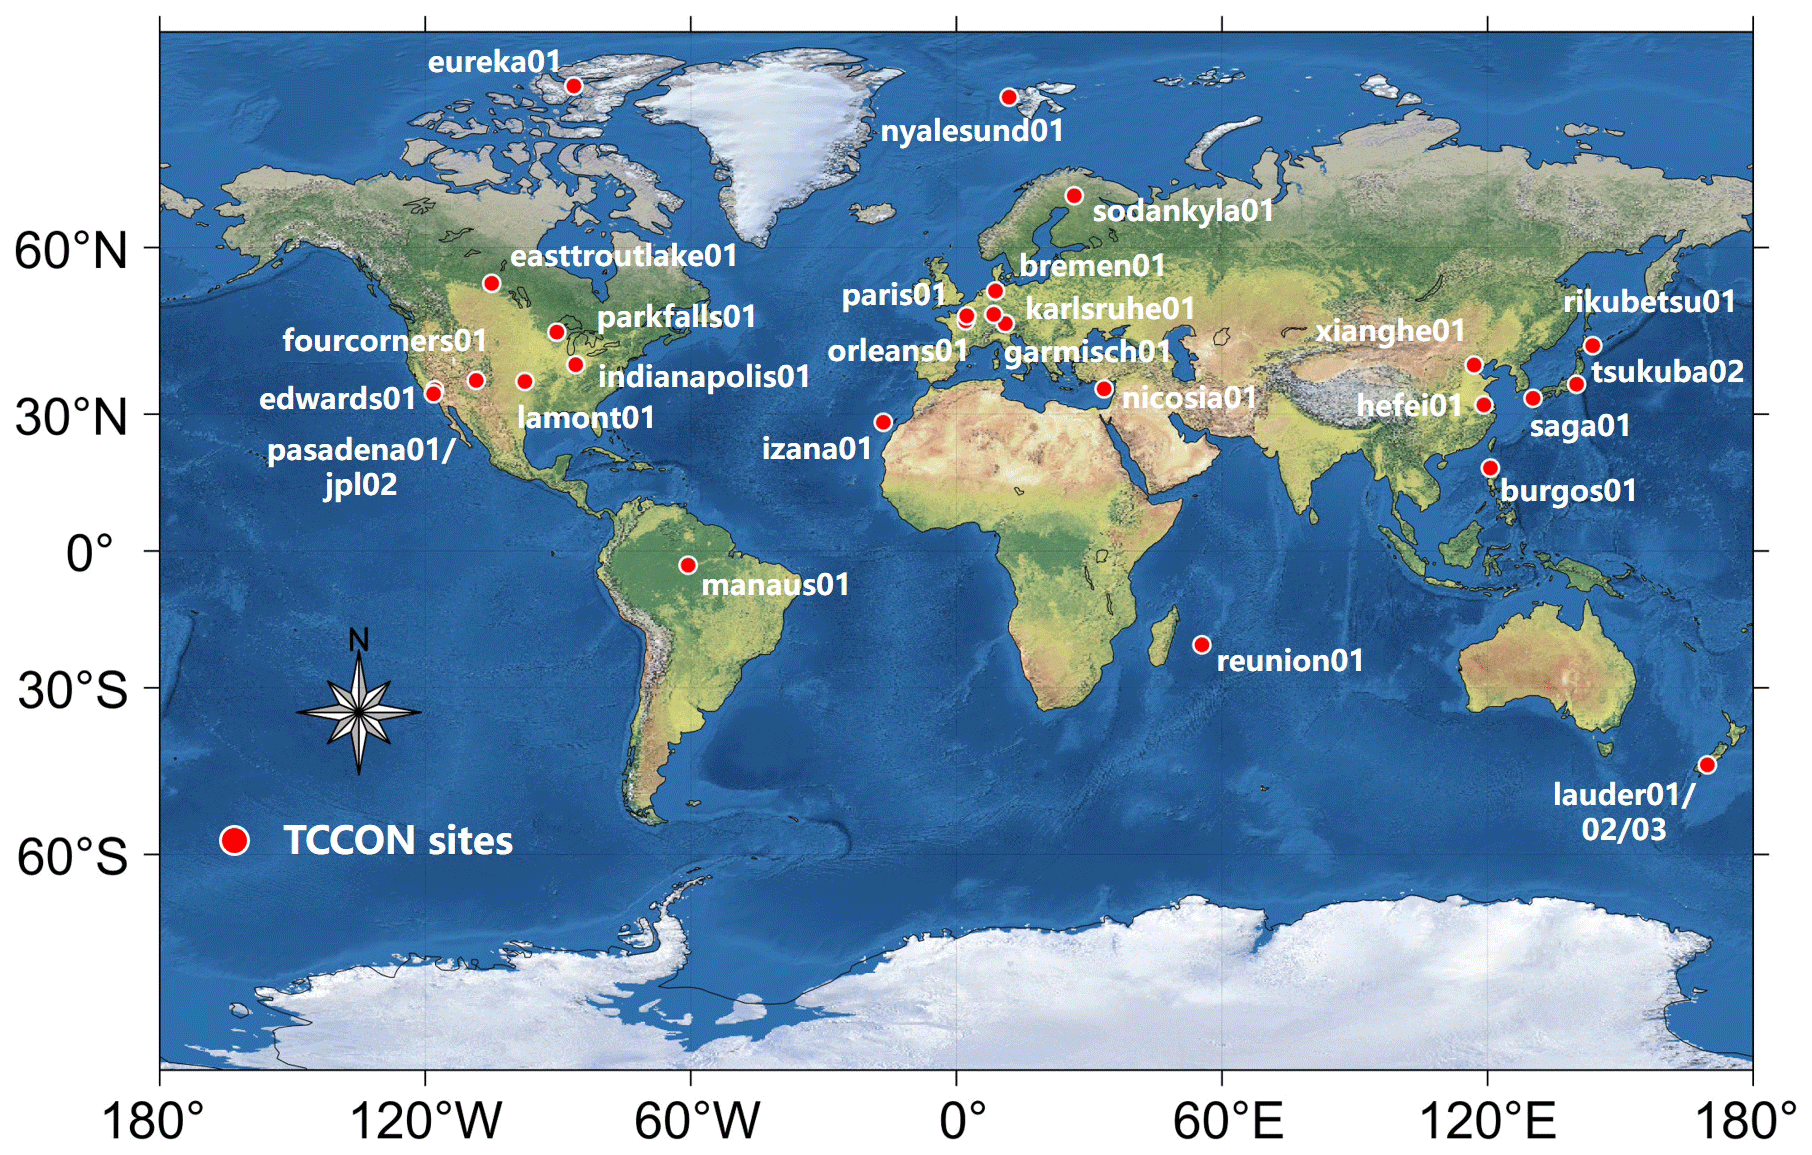
Figure 2Spatial locations of in situ stations from TCCON used in the present study. The background map is a naturally shaded relief over the globe.
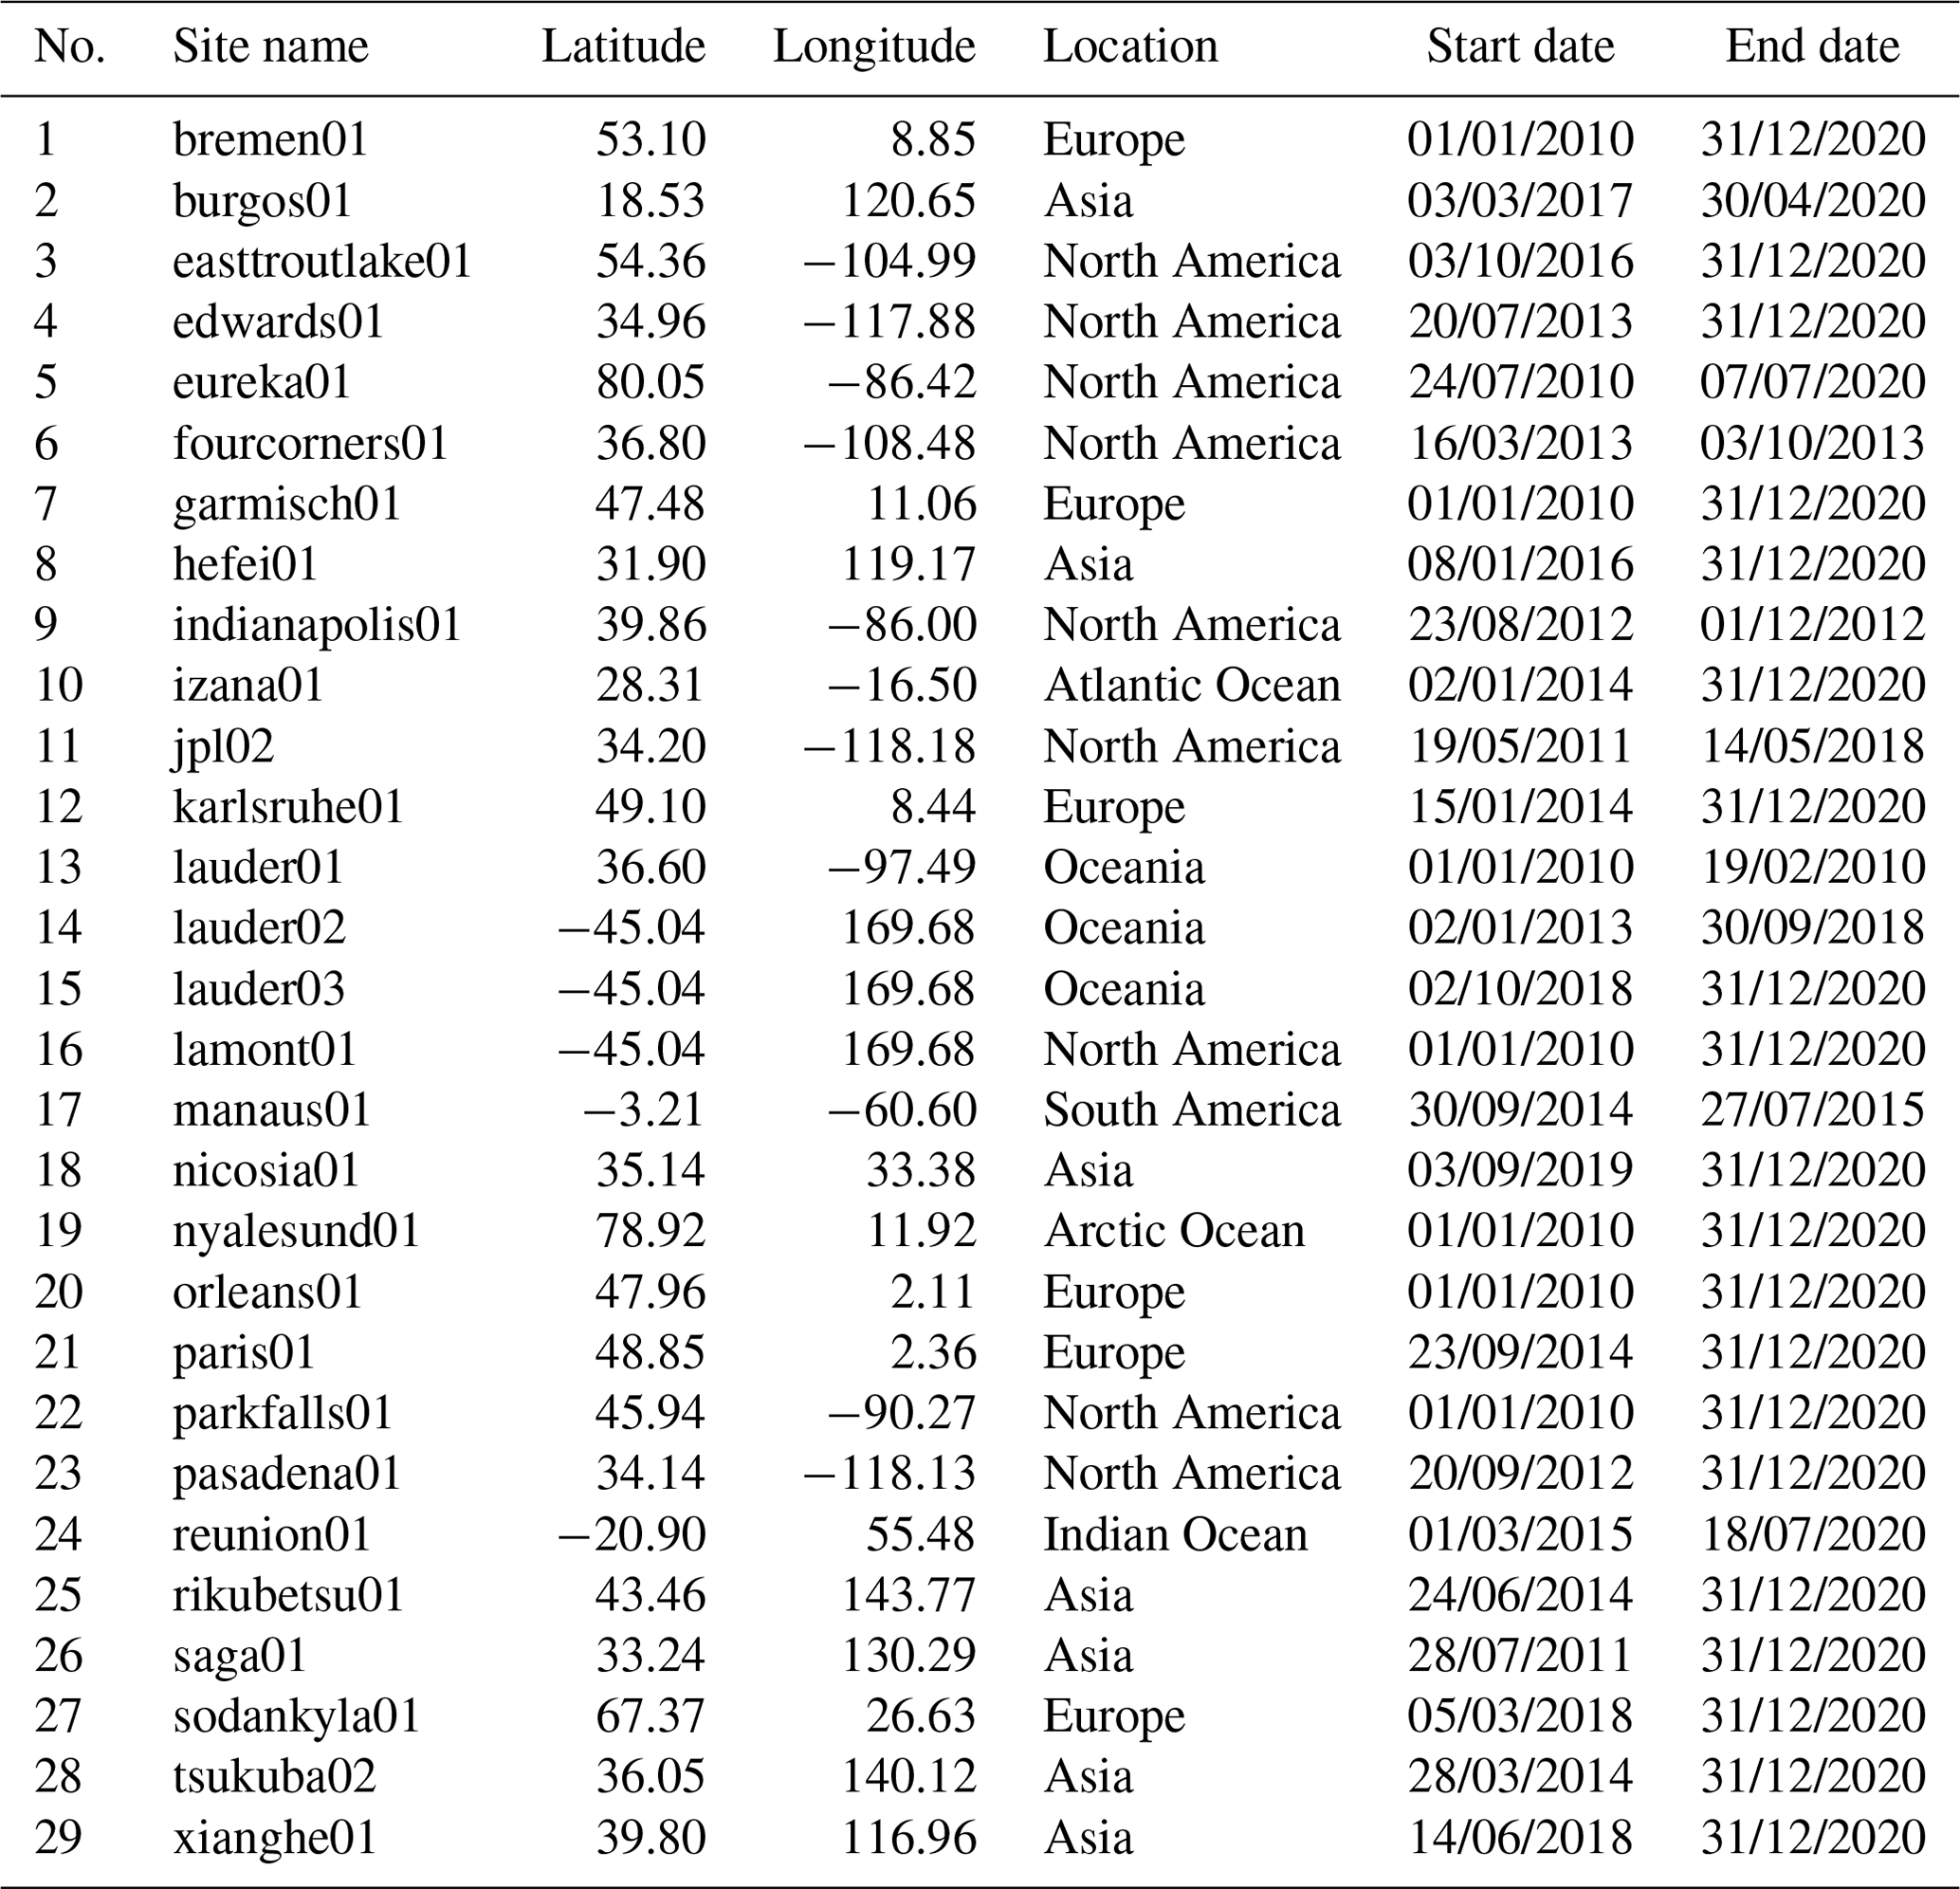
Table 2Detailed information on the TCCON in situ stations adopted in our study. No.: number.
These data fusion approaches provided high-quality results with seamless distribution and greatly enhance the data availability for GOSAT and OCO-2. Nevertheless, the application areas of currently fused products merely target local or national scales, which are insufficient for globe-scale studies. Meanwhile, existing data fusion frameworks are regarded as end-to-end functions that lack consideration for spatiotemporal self-correlation of original data (e.g., OCO-2). They normally require massive auxiliary co-variates (e.g., ERA5) as inputs and consume a large amount of time in training procedures. Moreover, only XCO2 products are taken into account, while the data fusion studies for XCH4 products are scarce. In conclusion, it is valuable and imperative to generate long-term globally distributed seamless XCO2 and XCH4 products for GOSAT and OCO-2 with an efficient data fusion method that considers the knowledge of their spatiotemporal self-correlation.
The present study focuses on generating long-term daily global seamless XCO2 and XCH4 products from 2010 to 2020 on grids of 0.25∘ via a spatiotemporally self-supervised fusion method. A total of three datasets are utilized in our study without any auxiliary co-variates, including GOSAT, OCO-2, and CAMS-EGG4. CAMS-EGG4 can provide long-term gridded full-coverage XCO2 and XCH4 datasets over the globe, which is suitable for our fusion task. Since the data from GOSAT and OCO-2 are significantly sparse in the space–time domain (see Fig. 1), the fusion procedures are difficult to perform. By contrast, the frequency domain contains comprehensive information due to its more concentrated signal distribution. Discrete cosine transform (DCT) (Rao and Yip, 2014) is an efficient algorithm to convert signals into the frequency domain. In this study, a novel self-supervised fusion method based on spatiotemporal DCT (S-STDCT) is developed for the fusion task. Details of the S-STDCT fusion method are presented in Sect. 3. Validation results show that the S-STDCT fusion method achieves a satisfactory performance. Generally, the accuracy of fused results largely exceeds that of CAMS-EGG4, which is also better than or close to those of GOSAT and OCO-2.
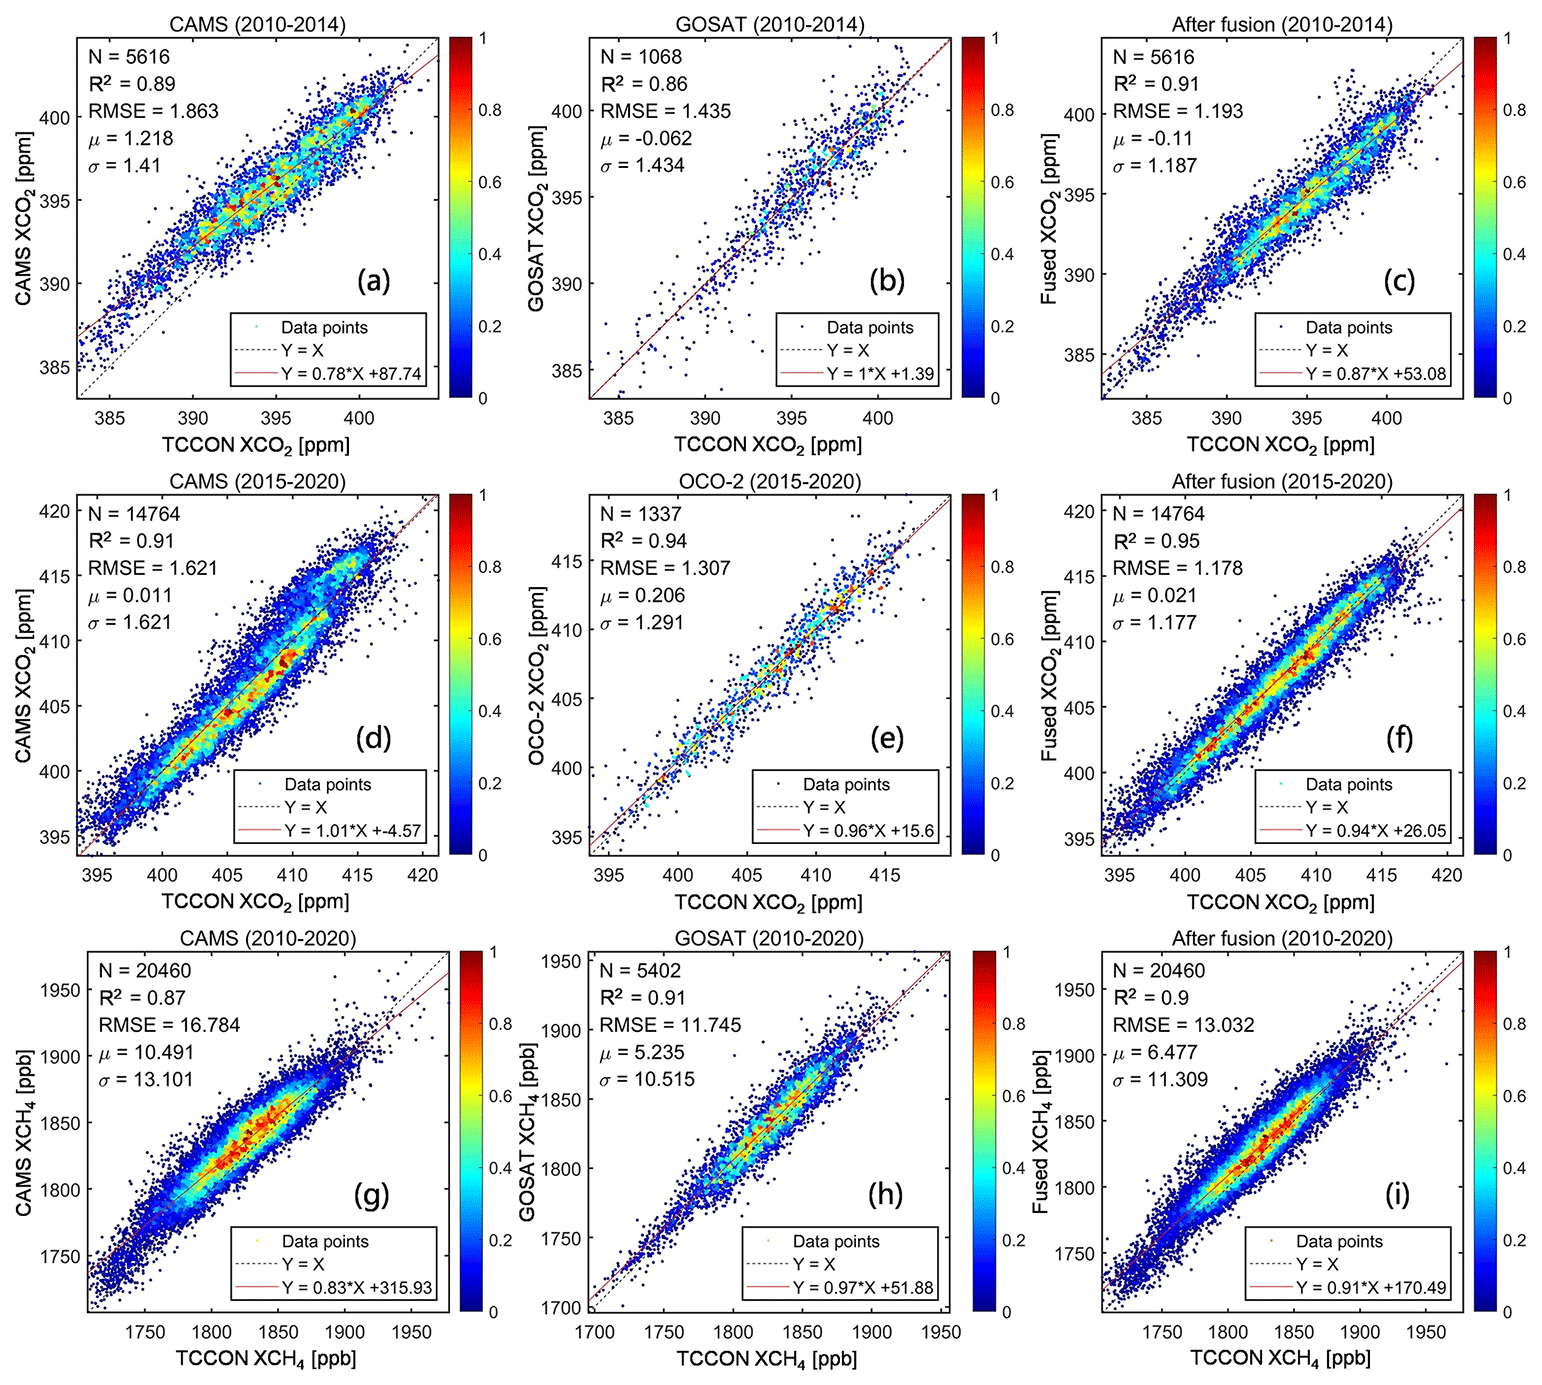
Figure 3Density scatterplots of the in situ validation results for (a, d, g) CAMS-EGG4, (b, h) GOSAT, (e) OCO-2, and (c, f, i) fused results. Black dotted and red full lines stand for the 1:1 and fitted lines, respectively. Color ramps show the normalized densities of data points. X: TCCON data; Y: CAMS-EGG4, GOSAT, OCO-2, and fused data. Unit: parts per million and parts per billion for XCO2 and XCH4, respectively, for RMSE, μ, and σ.
This paper arranges the remaining sections as follows. Section 2 describes the data records employed in our study, including the XCO2 and XCH4 from in situ stations, GOSAT, and CAMS-EGG4 and the XCO2 from OCO-2. Section 3 provides the specification of the developed S-STDCT fusion method. Section 4 presents the experiment results, which consist of elaborative validations against in situ measurements and assessments of the spatial distribution on multi-temporal scales. Finally, conclusions and future works are summarized in Sect. 5.
2.1 GOSAT XCO2 and XCH4 products
A famous XCO2 retrieval algorithm devised for GOSAT (Taylor et al., 2022), i.e., the Atmospheric CO2 Observations from Space (ACOS), employs three infrared spectral bands at ∼0.76, 1.6, and 2.0 µm, which are denoted as Oxygen-A, CO2 weak, and CO2 strong, respectively. Regarding XCH4, the latest retrieval algorithm for GOSAT from the University of Leicester was recently updated, which considers the ratio of XCH4 : XCO2 as a proxy (Parker et al., 2020). It is based on the theory that the impacts from atmospheric scattering and sensors are mostly similar for XCH4 and XCO2 in a shared absorption band at ∼1.6 µm. The GOSAT XCO2 and XCH4 products are both performed at spatial resolutions of 10.5 km (diameter) over the globe with revisit times of 3 d. In our study, the scientific data records of “XCO2” in ACOS_L2_Lite_FP (level 2, bias-corrected, V9r) and “XCH4” in UoL-GHG-L2-CH4-GOSAT-OCPR (level 2, V9) are adopted. Furthermore, the quality assurance (QA) records of “XCO2 Quality Flag” and “XCH4 Quality Flag” are exploited to filter bad data. Relevant information on the XCO2 and XCH4 products from GOSAT is shown in Table 1.
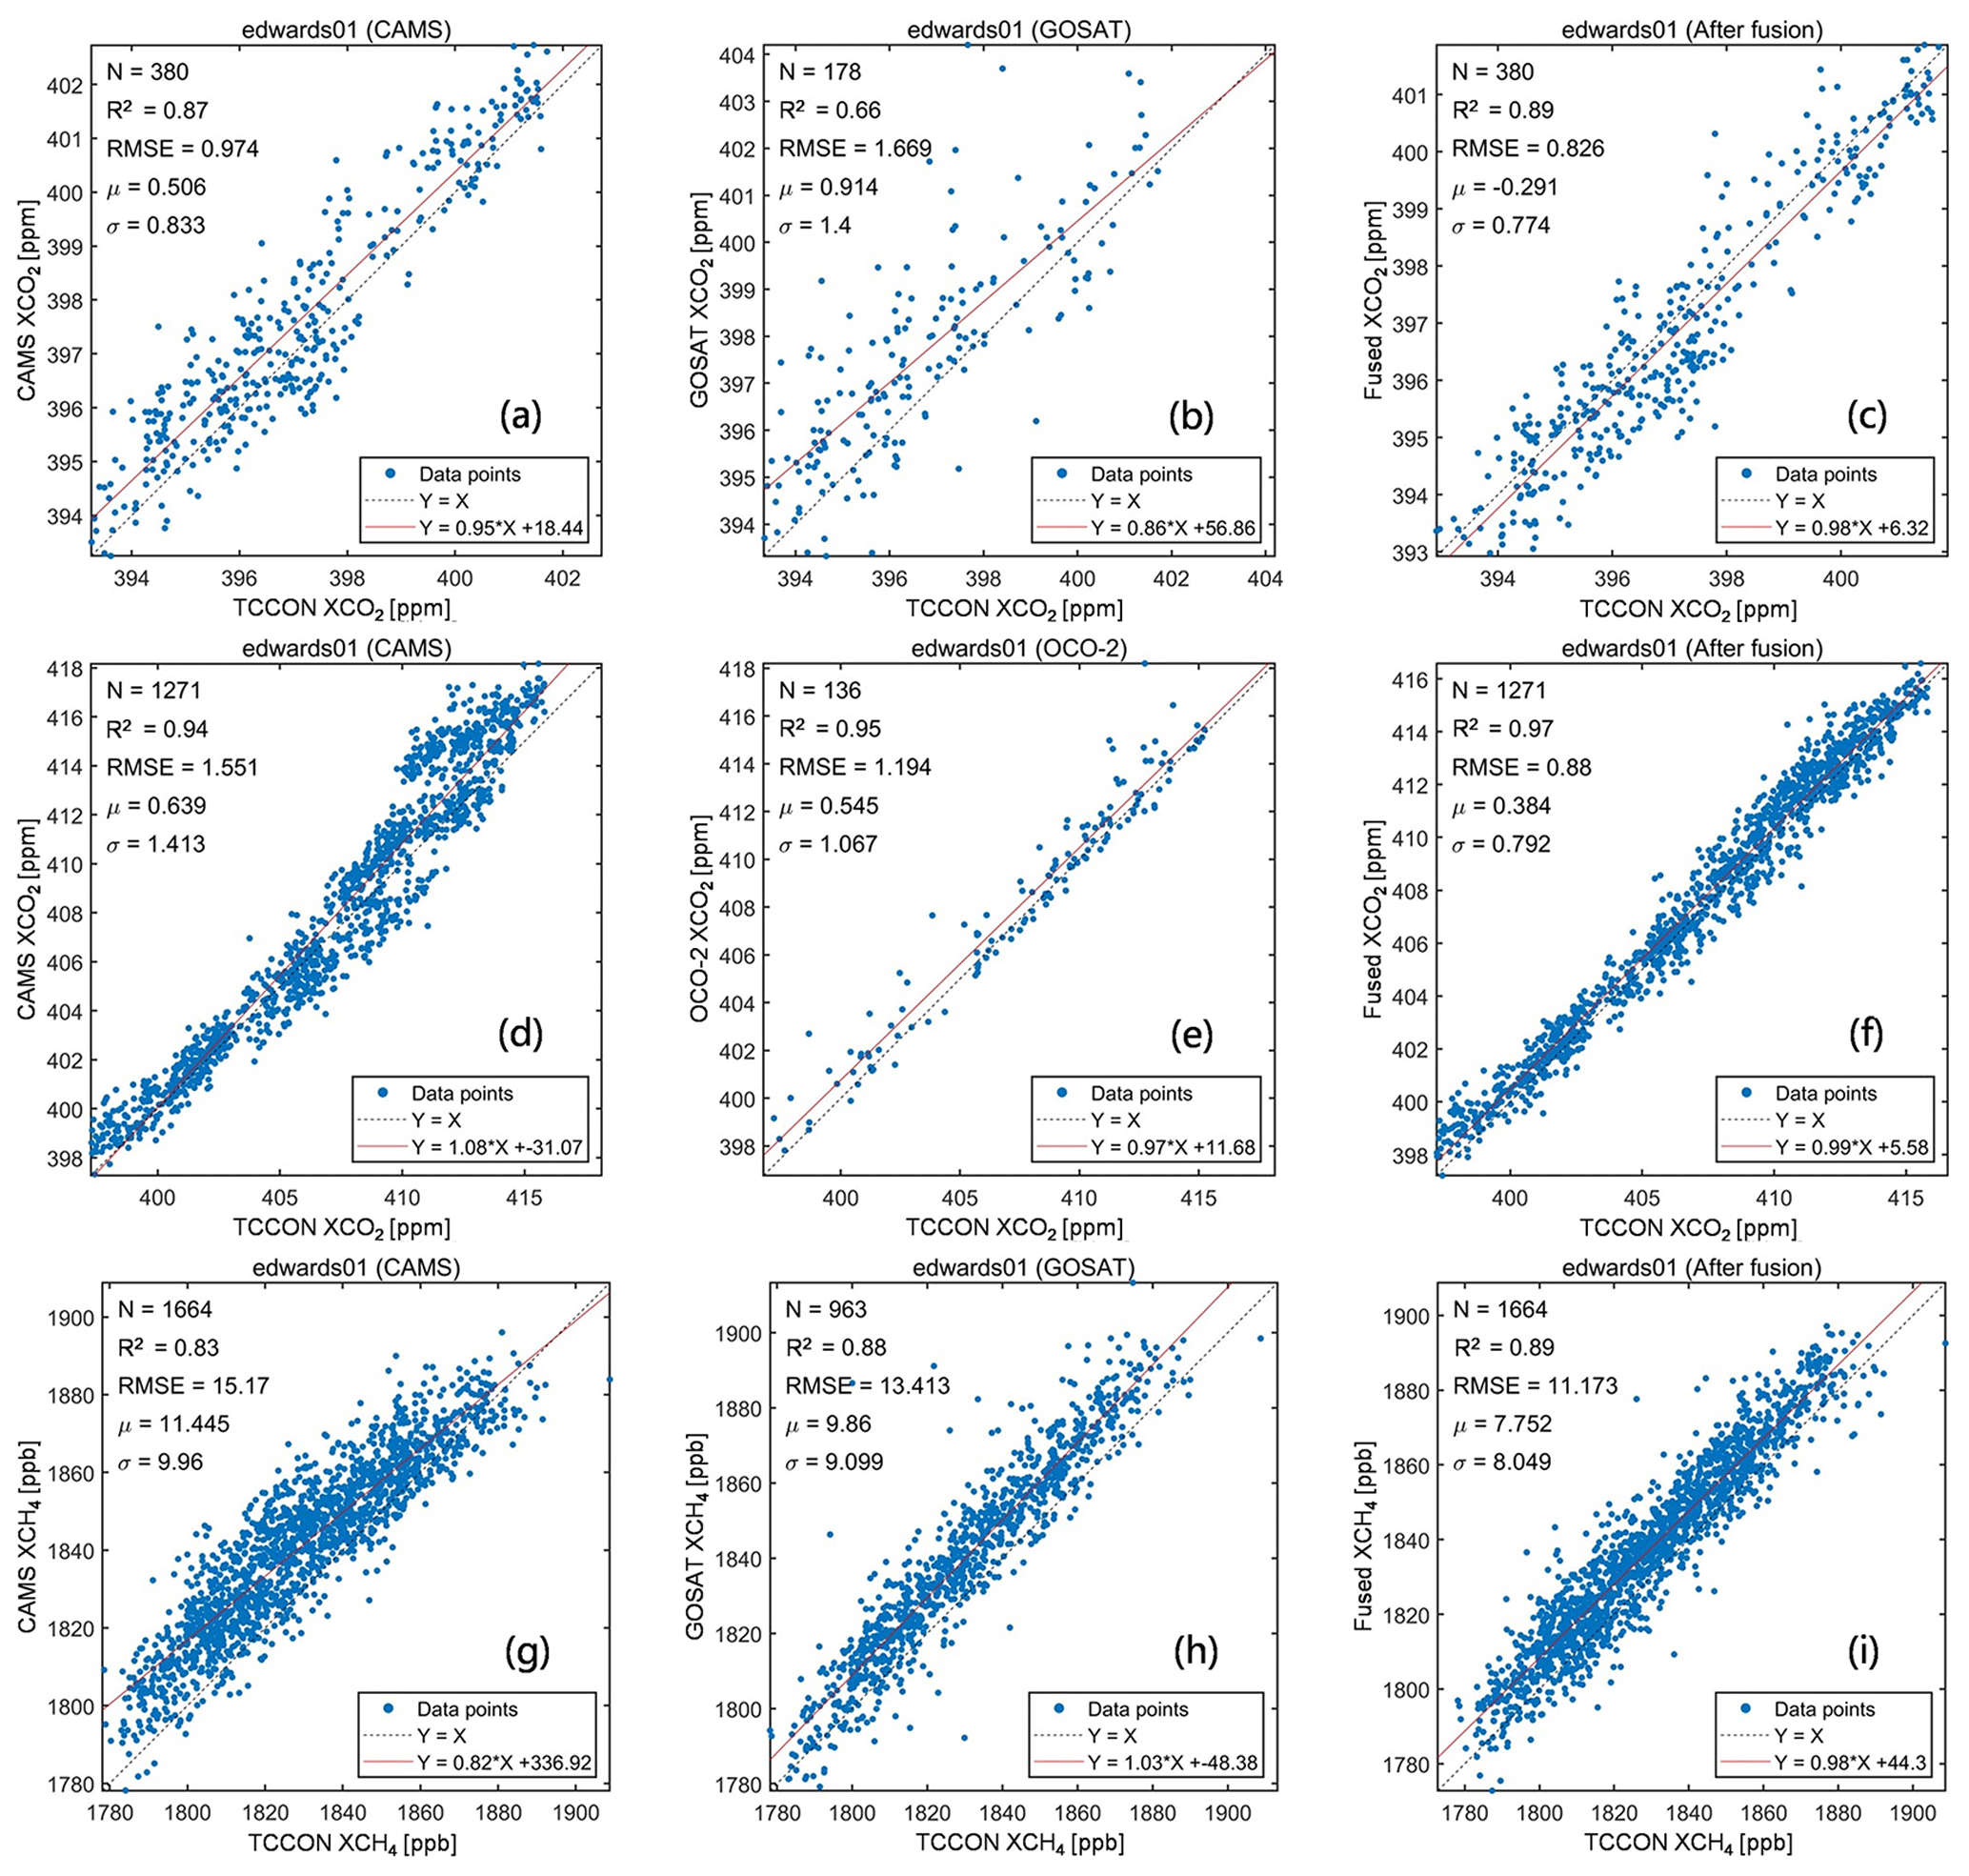
Figure 4Scatterplots of the in situ validation results for (a, d, g) CAMS-EGG4, (b, h) GOSAT, (e) OCO-2, and (c, f, i) fused results on edwards01. Black dotted and red full lines stand for the 1:1 and fitted lines, respectively. X: TCCON data; Y: CAMS-EGG4, GOSAT, OCO-2, and fused data. Unit: parts per million and parts per billion for XCO2 and XCH4, respectively, for RMSE, μ, and σ.
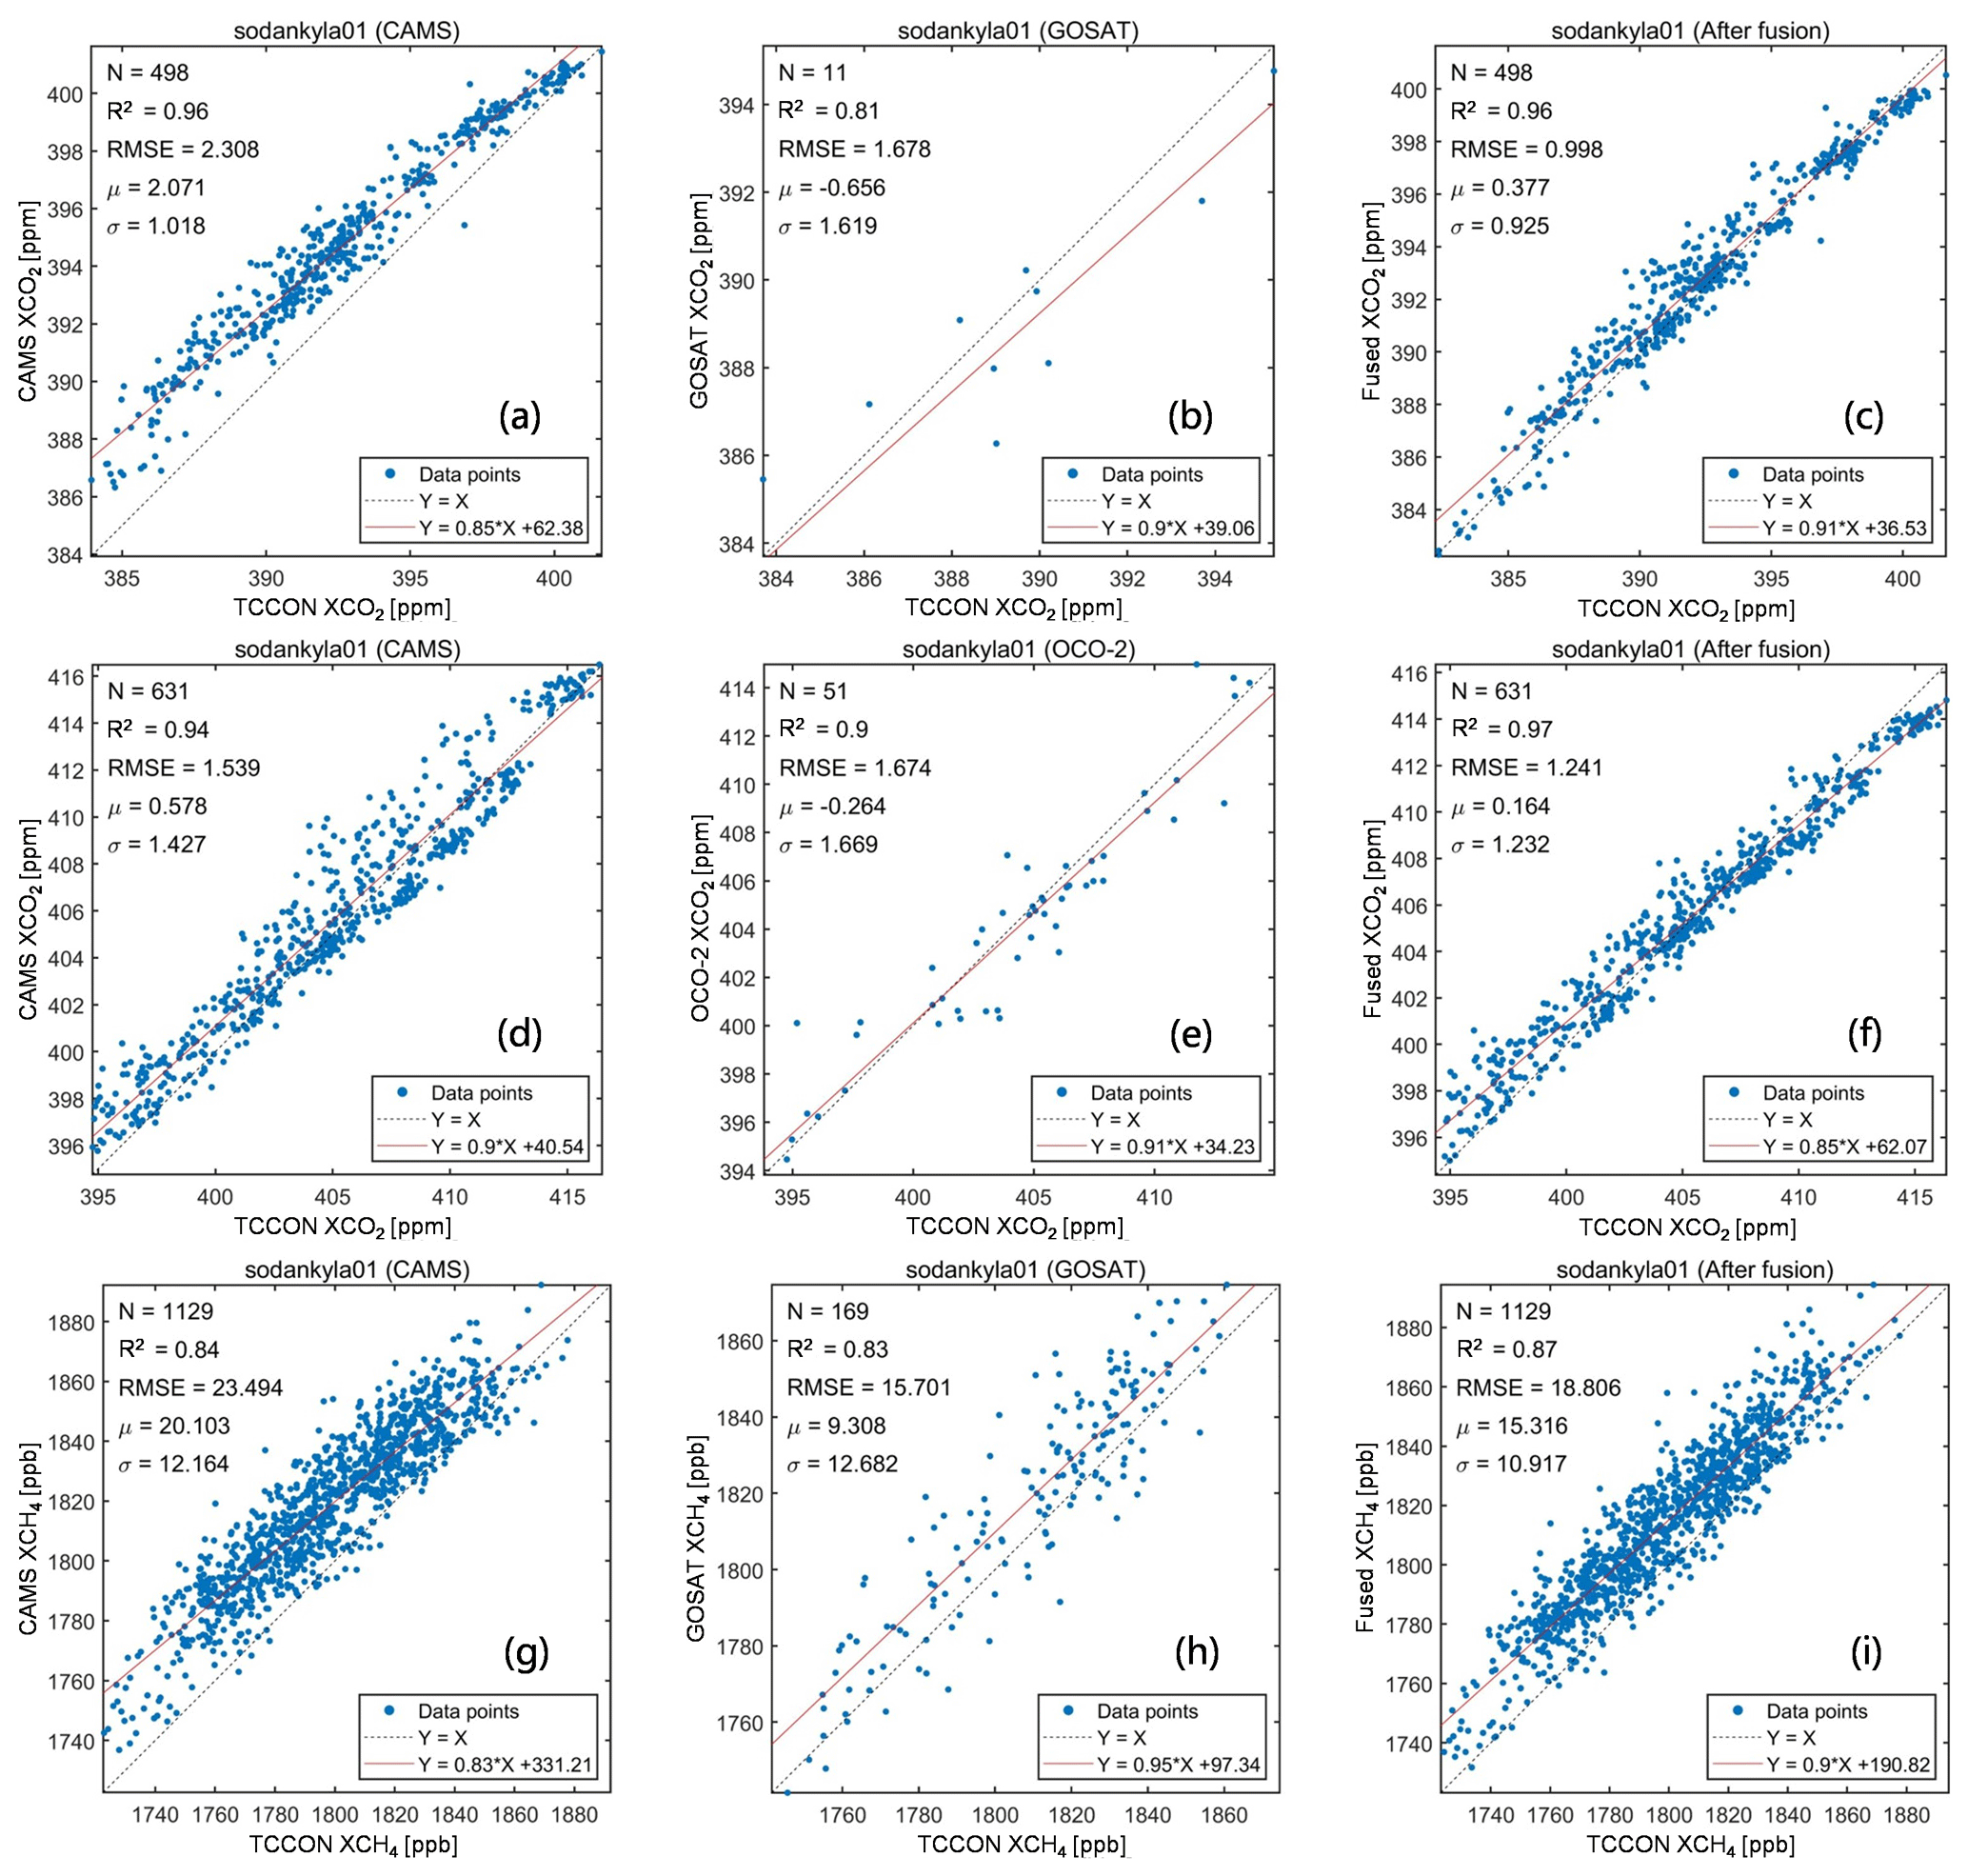
Figure 5Scatterplots of the in situ validation results for (a, d, g) CAMS-EGG4, (b, h) GOSAT, (e) OCO-2, and (c, f, i) fused results on sodankyla01. Black dotted and red full lines stand for the 1:1 and fitted lines, respectively. X: TCCON data; Y: CAMS-EGG4, GOSAT, OCO-2, and fused data. Unit: parts per million and parts per billion for XCO2 and XCH4, respectively, for RMSE, μ, and σ.
2.2 OCO-2 XCO2 product
Apart from GOSAT, the ACOS XCO2 retrieval algorithm is also applied to OCO-2 observations (Kiel et al., 2019), which utilizes the same bands of Oxygen-A, CO2 weak, and CO2 strong. OCO-2 provides a global XCO2 product at a high spatial resolution of 1.29×2.25 km2 with a revisit time of 16 d. After 2015, the XCO2 product from OCO-2 is used for fusion instead of GOSAT due to its greater number of observation counts and better accuracy. In this study, the scientific data record of XCO2 in OCO2_L2_Lite_FP (level 2, bias-corrected) is applied in the fusion with CAMS-EGG4 using the developed method. Moreover, the QA record of XCO2 Quality Flag is adopted to filter bad data. Since the OCO-2 XCO2 product of the latest version (V11r) is still being processed, data of both V10r and V11r are considered in our study. Related information on the XCO2 product from OCO-2 is given in Table 1.
2.3 CAMS-EGG4 GHG reanalysis datasets
CAMS-EGG4 has recent globally distributed operational GHG reanalysis datasets supported by the European Centre for Medium-Range Weather Forecasts (Agusti-Panareda et al., 2023). It assimilates the forecasts from the Integrated Forecasting System with multiple satellite products, which include Envisat, GOSAT, Metop-A, and Metop-B (August et al., 2012), via physical and chemistry principles. CAMS-EGG4 can generate long-term gridded seamless XCO2 and XCH4 datasets and related fields at spatial and temporal resolutions of 0.75∘ and 3 h, respectively. Unfortunately, there are a few limitations in CAMS-EGG4, such as the uncorrected anthropogenic emissions for COronaVIrus Disease 2019 (COVID-19) lockdowns, which are scheduled to be fixed by the official team in the future (Agusti-Panareda et al., 2023). It is worth noting that the XCO2 and XCH4 products from GOSAT and OCO-2 employed in this paper are not assimilated in CAMS-EGG4. In our study, the scientific data records of “CO2 column-mean molar fraction” and “CH4 column-mean molar fraction” are exploited for the fusion with GOSAT and OCO-2 through the developed method. Details of the CAMS-EGG4 datasets are provided in Table 1.
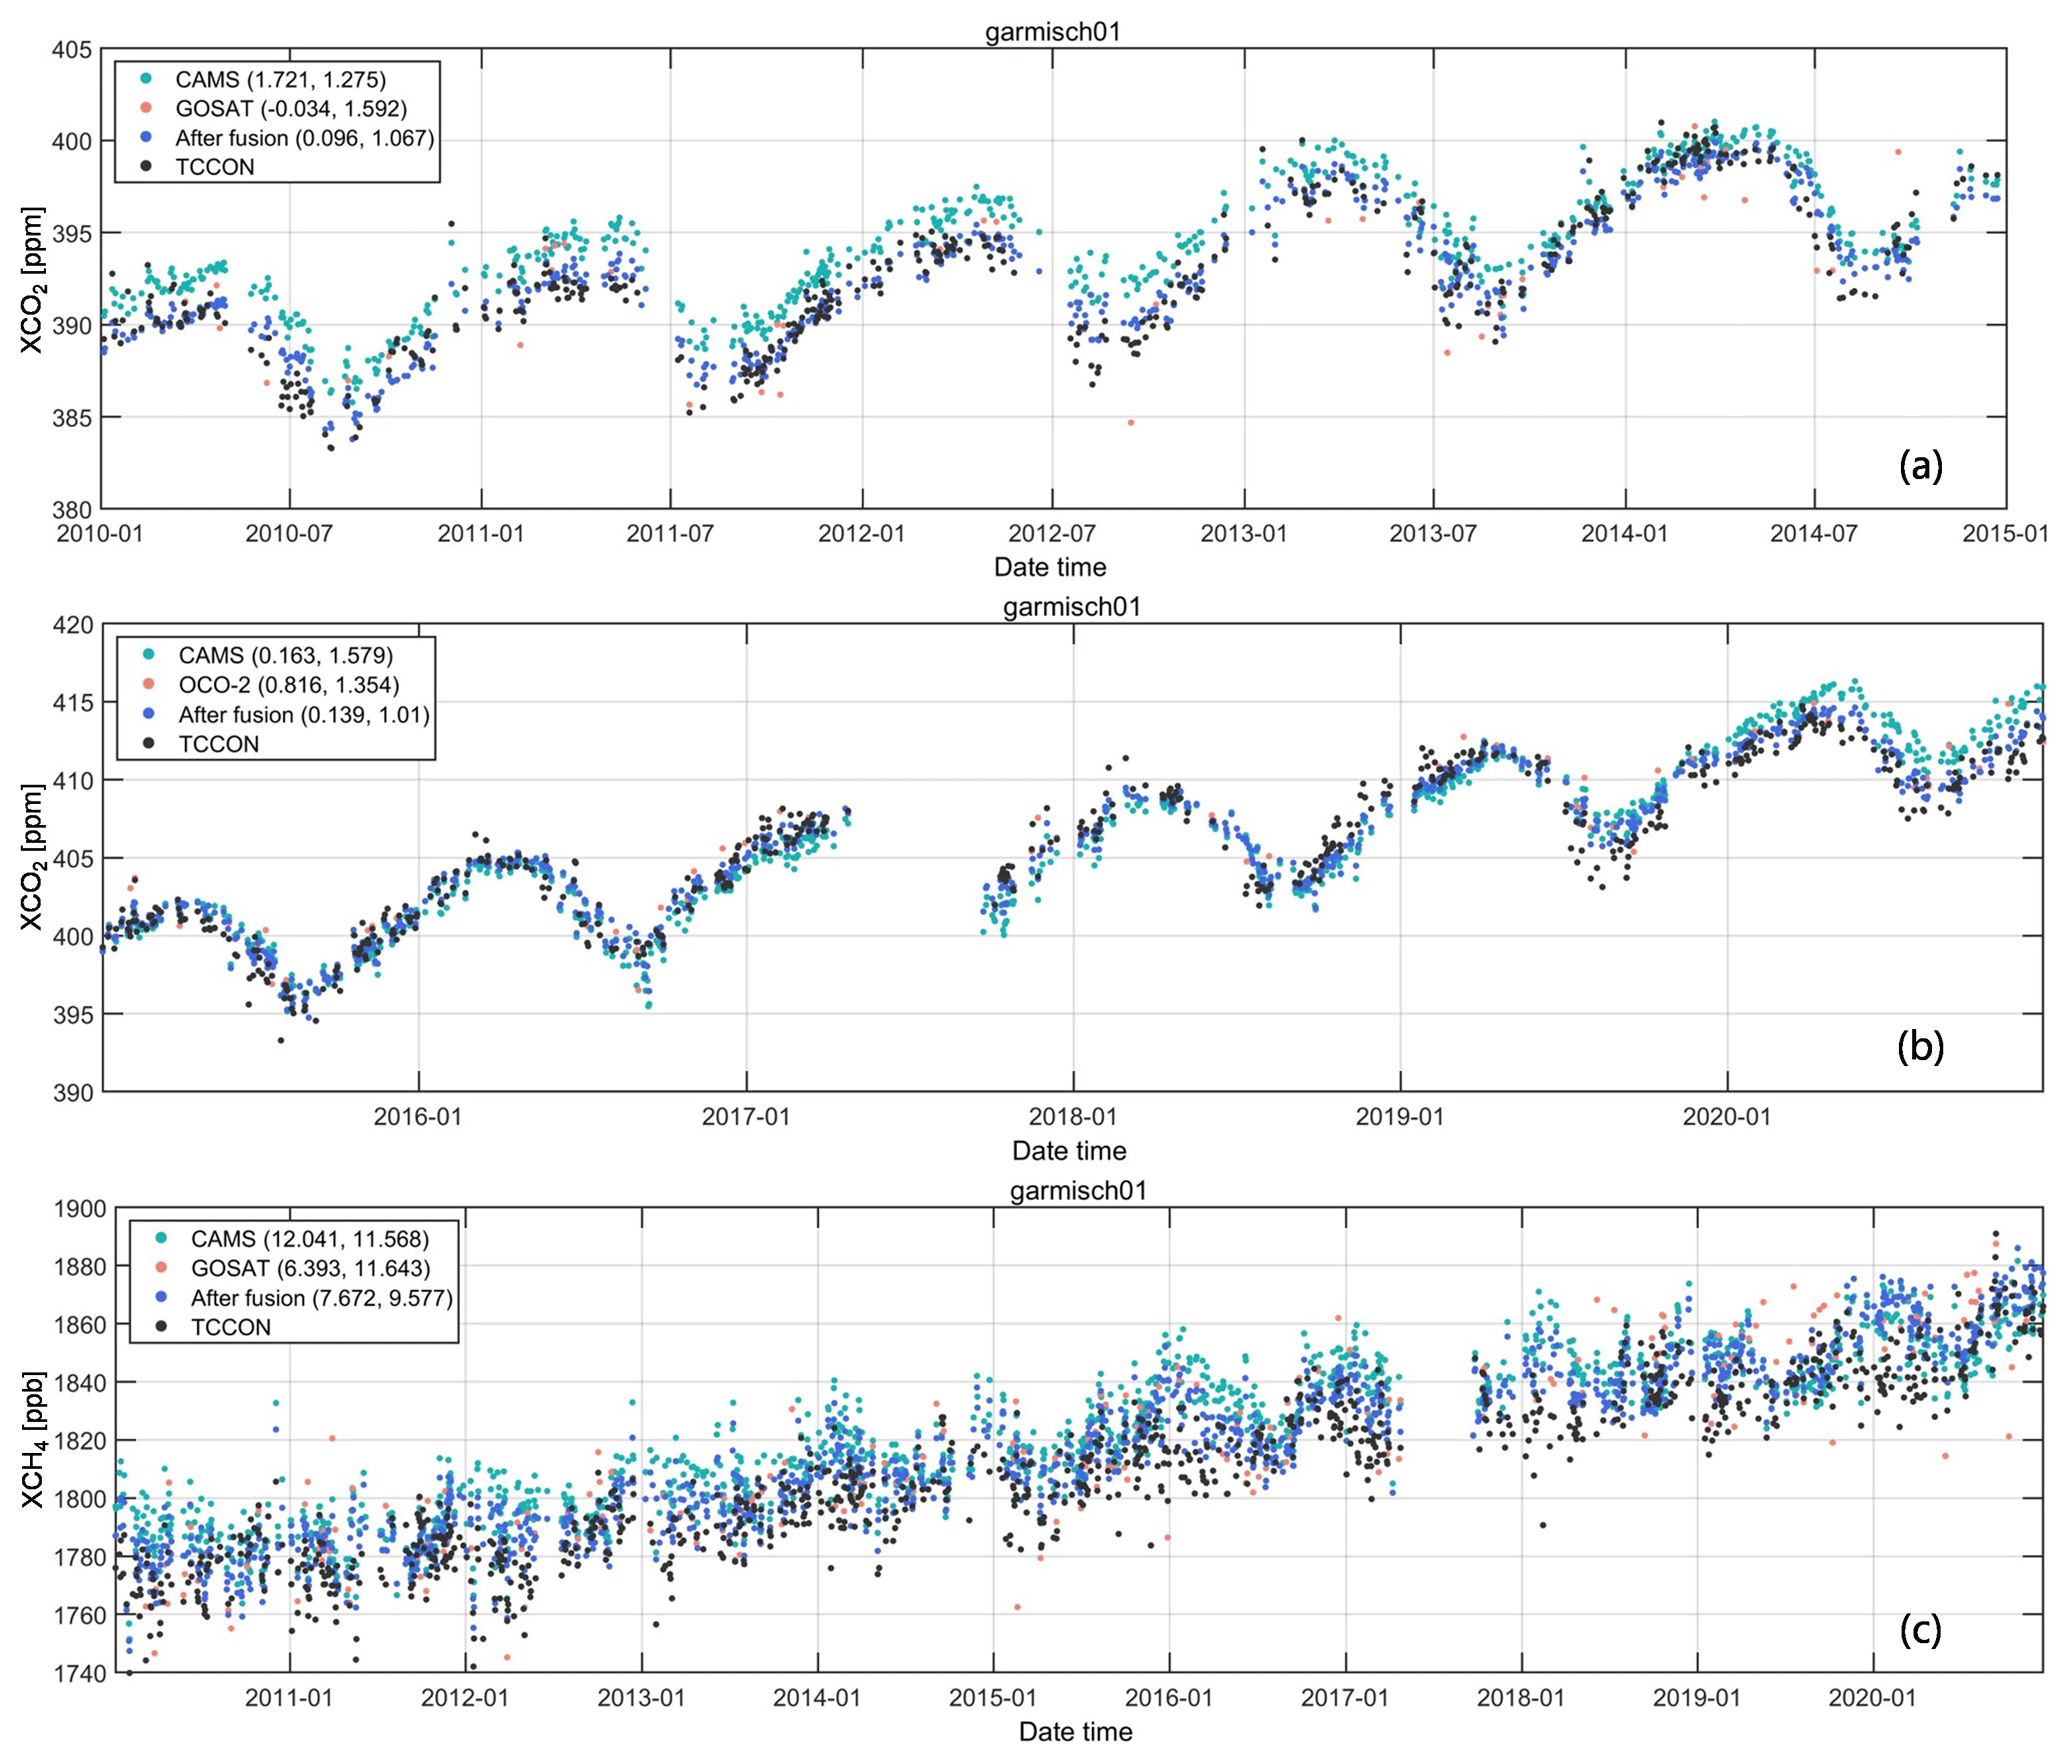
Figure 6Scatterplots of the time series for daily CAMS-EGG4, GOSAT, OCO-2, fused, and TCCON data on garmisch01. The first and second numbers in the parentheses represent μ and σ, respectively. Unit: parts per million and parts per billion for XCO2 and XCH4, respectively, for μ and σ.
2.4 Total Carbon Column Observing Network (TCCON) measurements
In our study, the XCO2 and XCH4 measurements provided by an international in situ network, which is named after TCCON (Wunch et al., 2011) (https://tccondata.org/, last access: 18 November 2022), are utilized to validate the fused results. The in situ measurements of TCCON are extensively used in the validation for the XCO2 and XCH4 products from GOSAT, OCO-2, and CAMS-EGG4 (Hong et al., 2022; Yoshida et al., 2013; Wunch et al., 2017; Wu et al., 2018; Agusti-Panareda et al., 2023). Figure 2 depicts the spatial locations of TCCON stations with the marks of white-edged red circles. The measurements of version GGG2020 (Laughner et al., 2023) from 29 stations around the world are adopted. Specific information on the stations is listed in Table 2.
3.1 Data preprocessing
Data preprocessing is an important procedure for ensuring the rationality and reliability of fused results. In this study, the value of QA =0 in XCO2 and XCH4 from GOSAT and OCO-2 is discarded, which filters the bad data. In addition, the CAMS-EGG4 XCO2 and XCH4 at a temporal resolution of 3 h are averaged in a single day to produce daily datasets. Finally, the spatial resolutions of XCO2 and XCH4 from GOSAT, OCO-2, and CAMS-EGG4 ought to be adjusted to the same value. A globally covered grid of 721×1441 (0.25∘) is employed in our study. The XCO2 and XCH4 from GOSAT, OCO-2, and CAMS-EGG4 are regridded to 0.25∘ using area-weighted aggregation (Wang et al., 2021) and inverse-distance-weighted interpolation (Mueller et al., 2004), respectively.
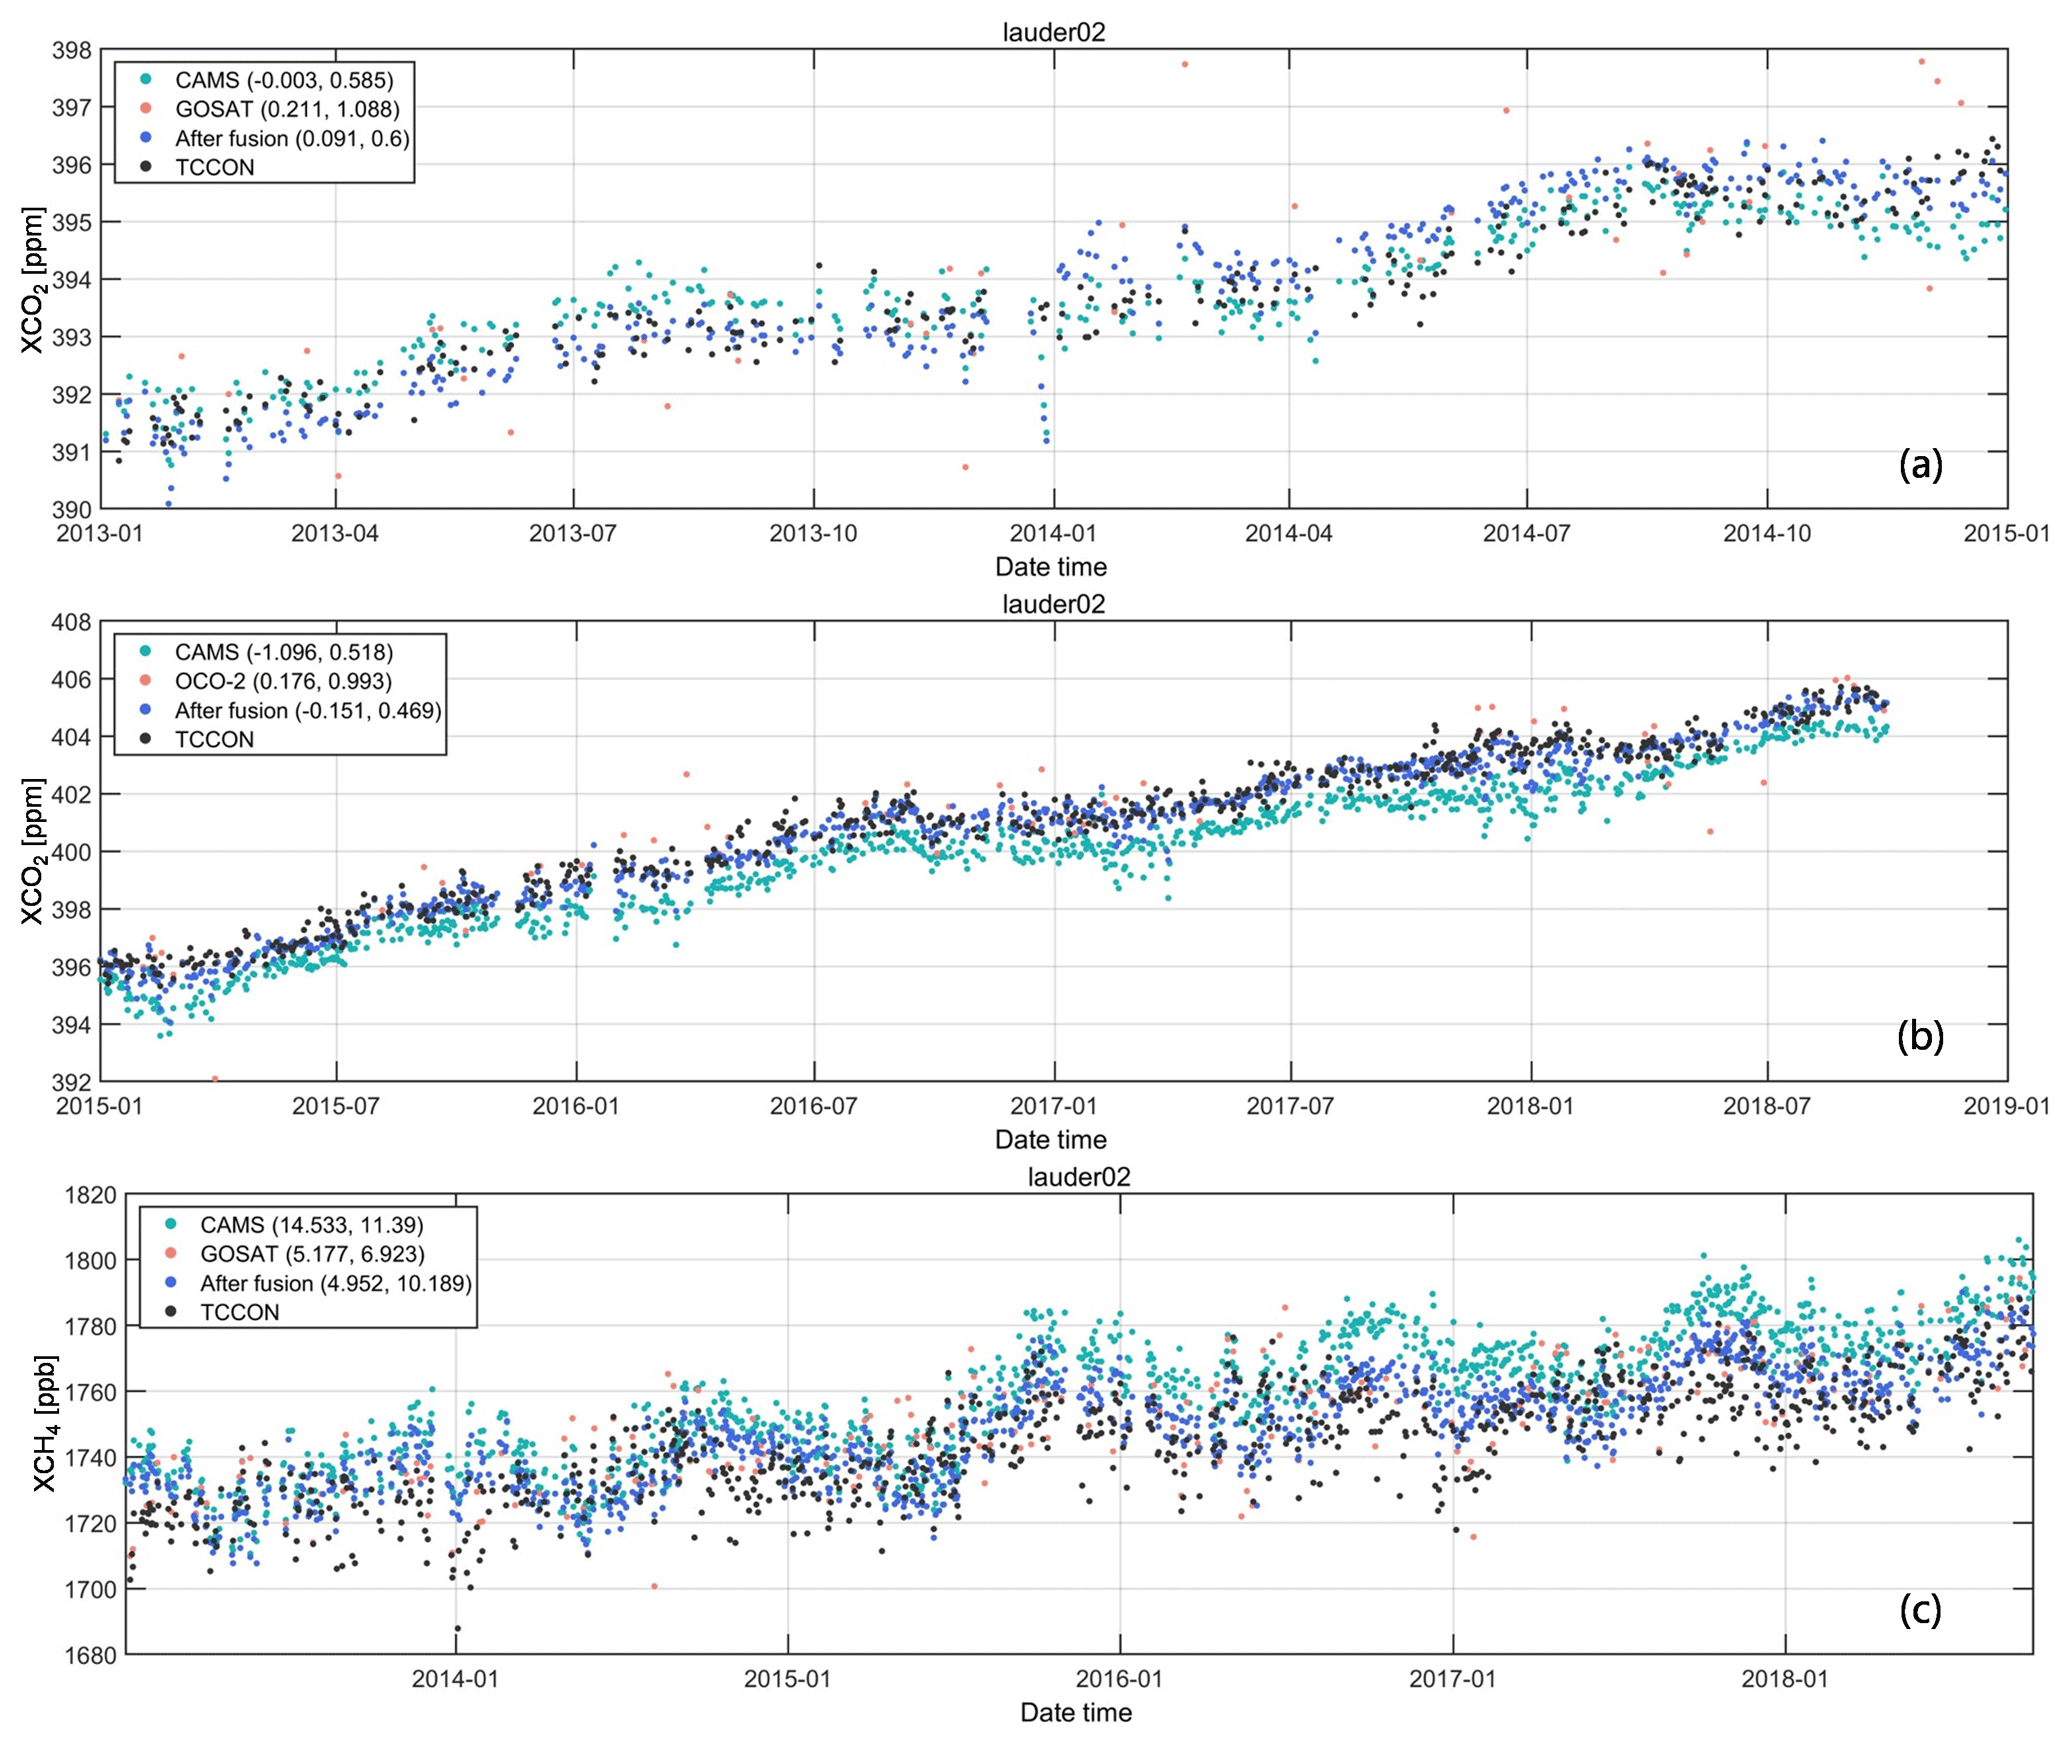
Figure 7Scatterplots of the time series for daily CAMS-EGG4, GOSAT, OCO-2, fused, and TCCON data on lauder02. The first and second numbers in the parentheses represent μ and σ, respectively. Unit: parts per million and parts per billion for XCO2 and XCH4, respectively, for μ and σ.
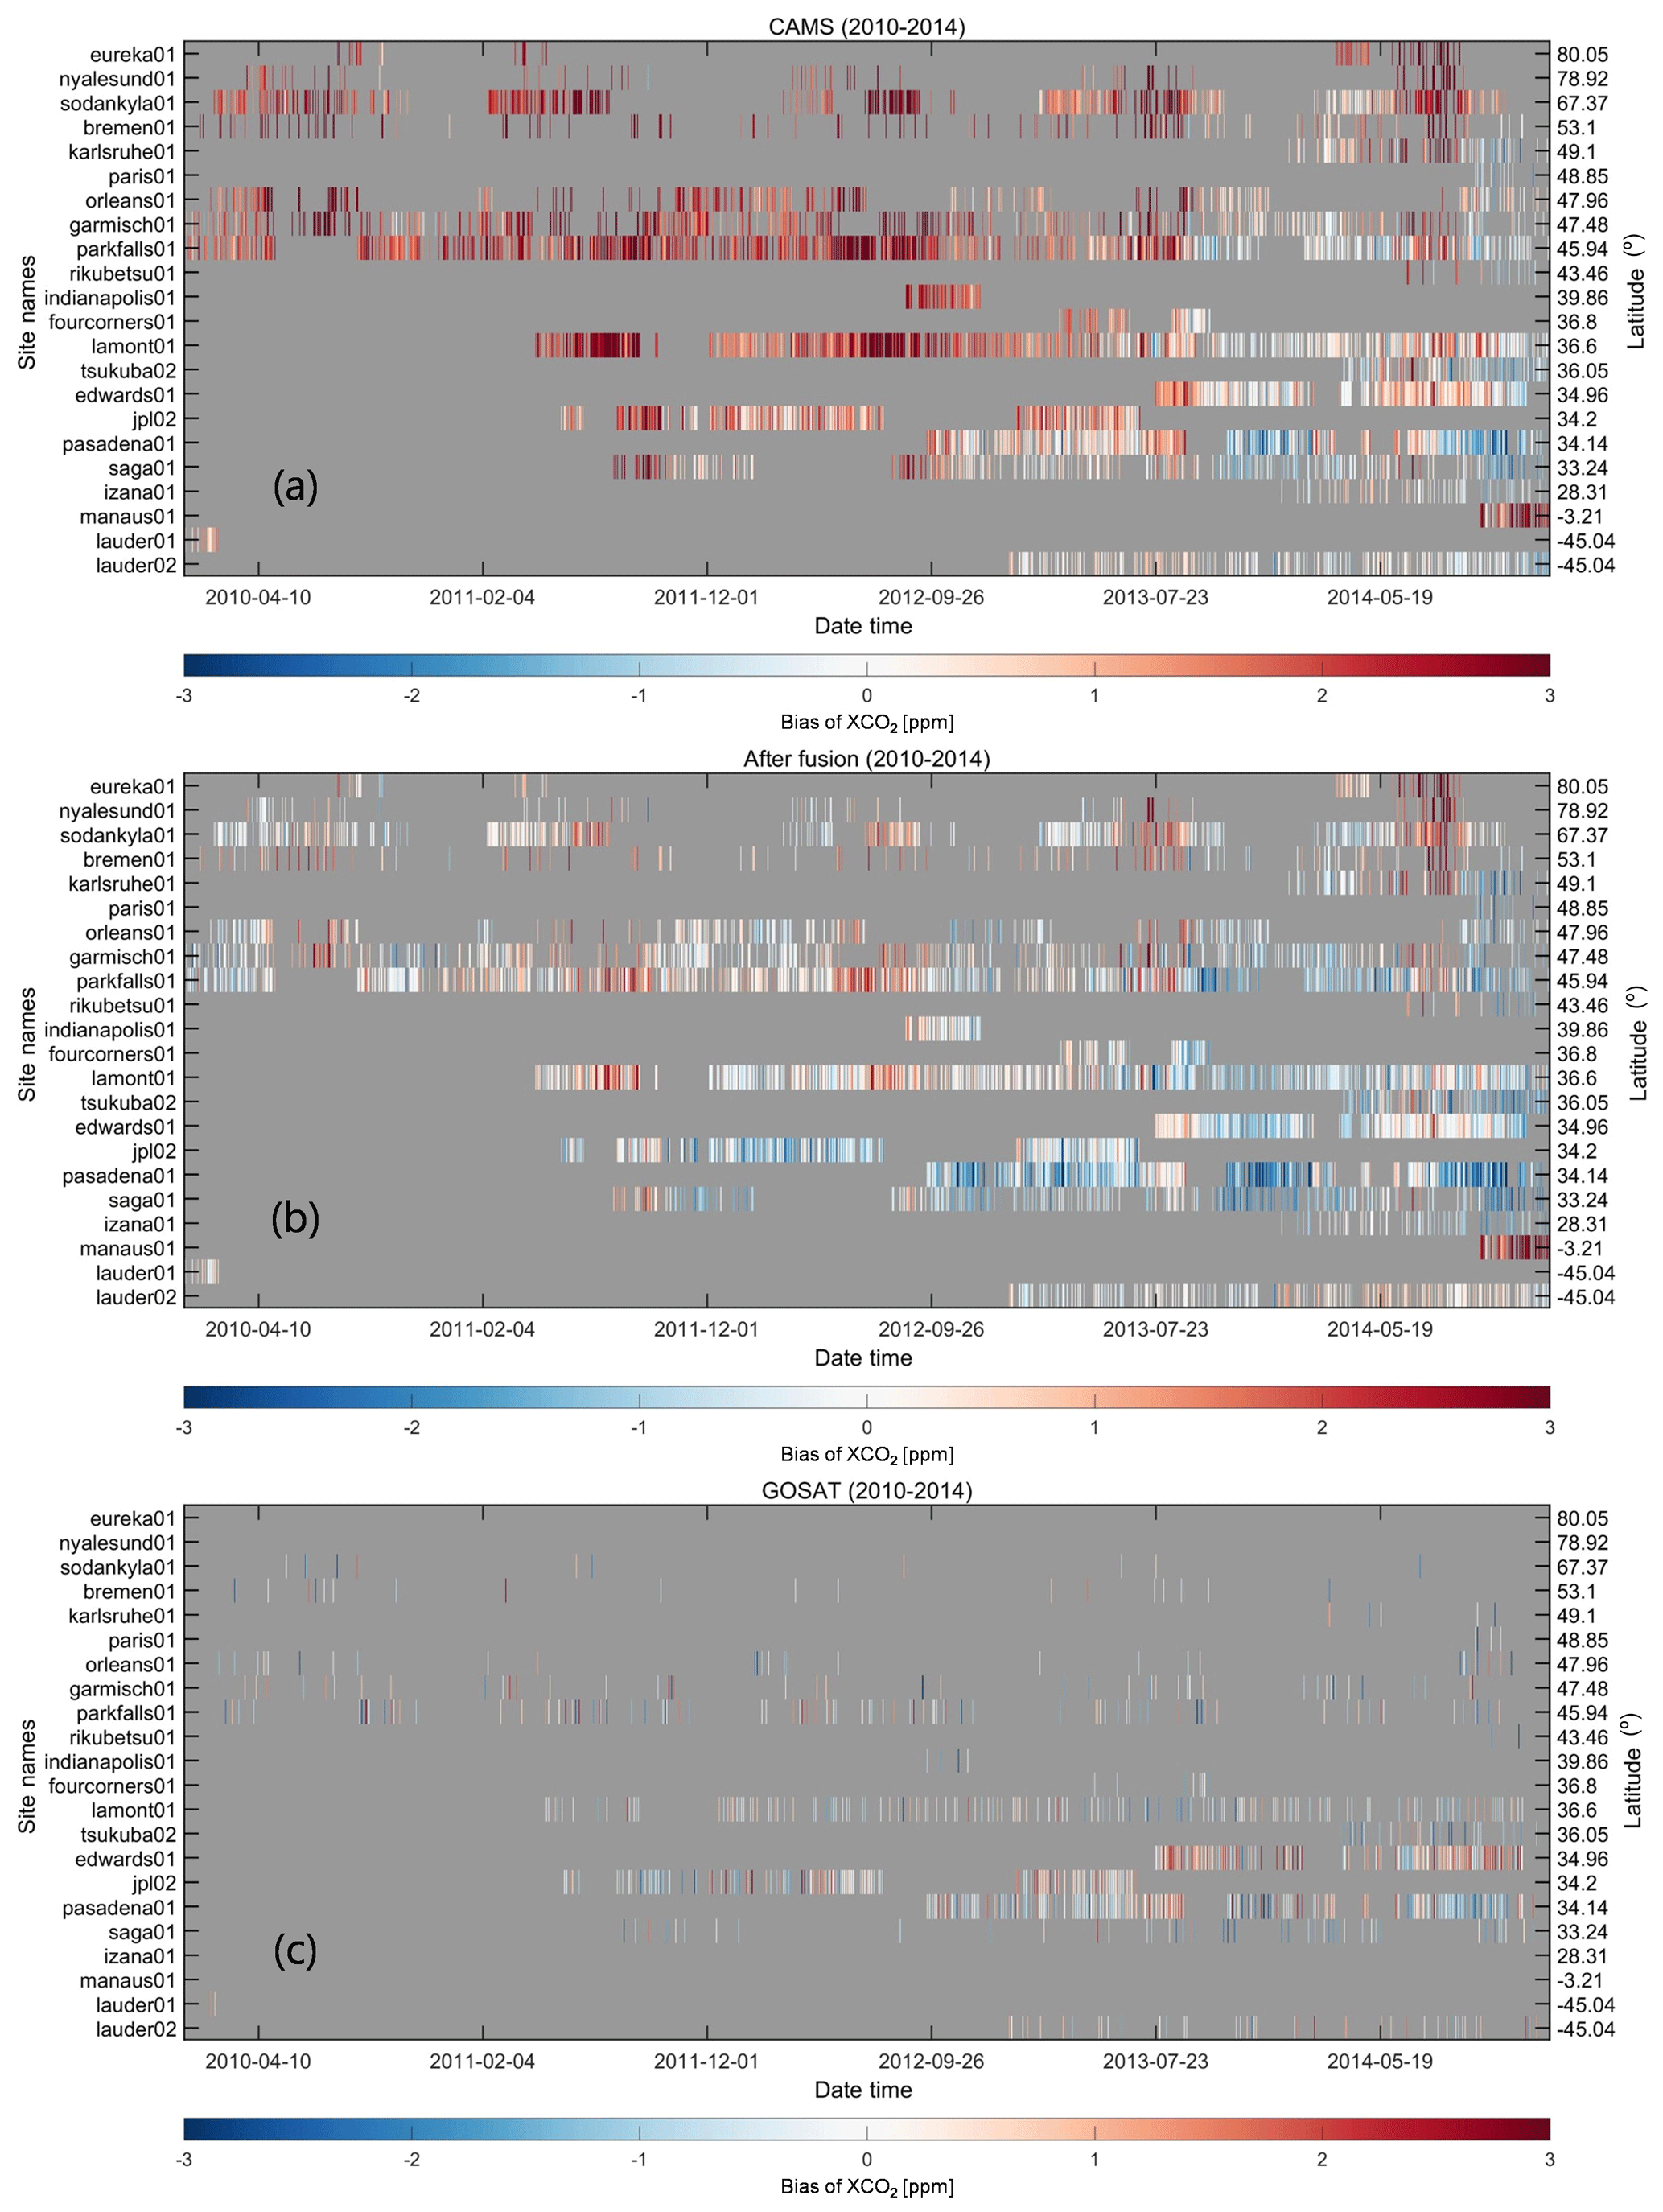
Figure 8Heat maps of the biases between daily (a) CAMS-EGG4, (b) fused, and (c) GOSAT and TCCON XCO2 over time and latitude. Color ramps stand for the biases of XCO2. Background colors (grey) indicate the missing data.
3.2 Spatiotemporally self-supervised fusion method
Since the sparsity of data from GOSAT and OCO-2 is significant in the space–time domain (see Fig. 1), it is difficult to perform fusion procedures for them. In contrast, the frequency domain is more suitable because of its concentrated signal distribution. DCT is an efficient algorithm to transform the signal into the frequency domain (Rao and Yip, 2014) that has been widely applied in image compression (Cintra and Bayer, 2011), geophysical data filtering (El-Mahallawy and Hashim, 2013), and remote-sensing data reconstruction (Wang et al., 2012; T. Wang et al., 2022a; Fredj et al., 2016; Pham et al., 2019). In our study, a novel self-supervised fusion method based on S-STDCT is developed for the fusion task, which fully adopts the spatiotemporal knowledge of self-correlation in GOSAT and OCO-2 products.
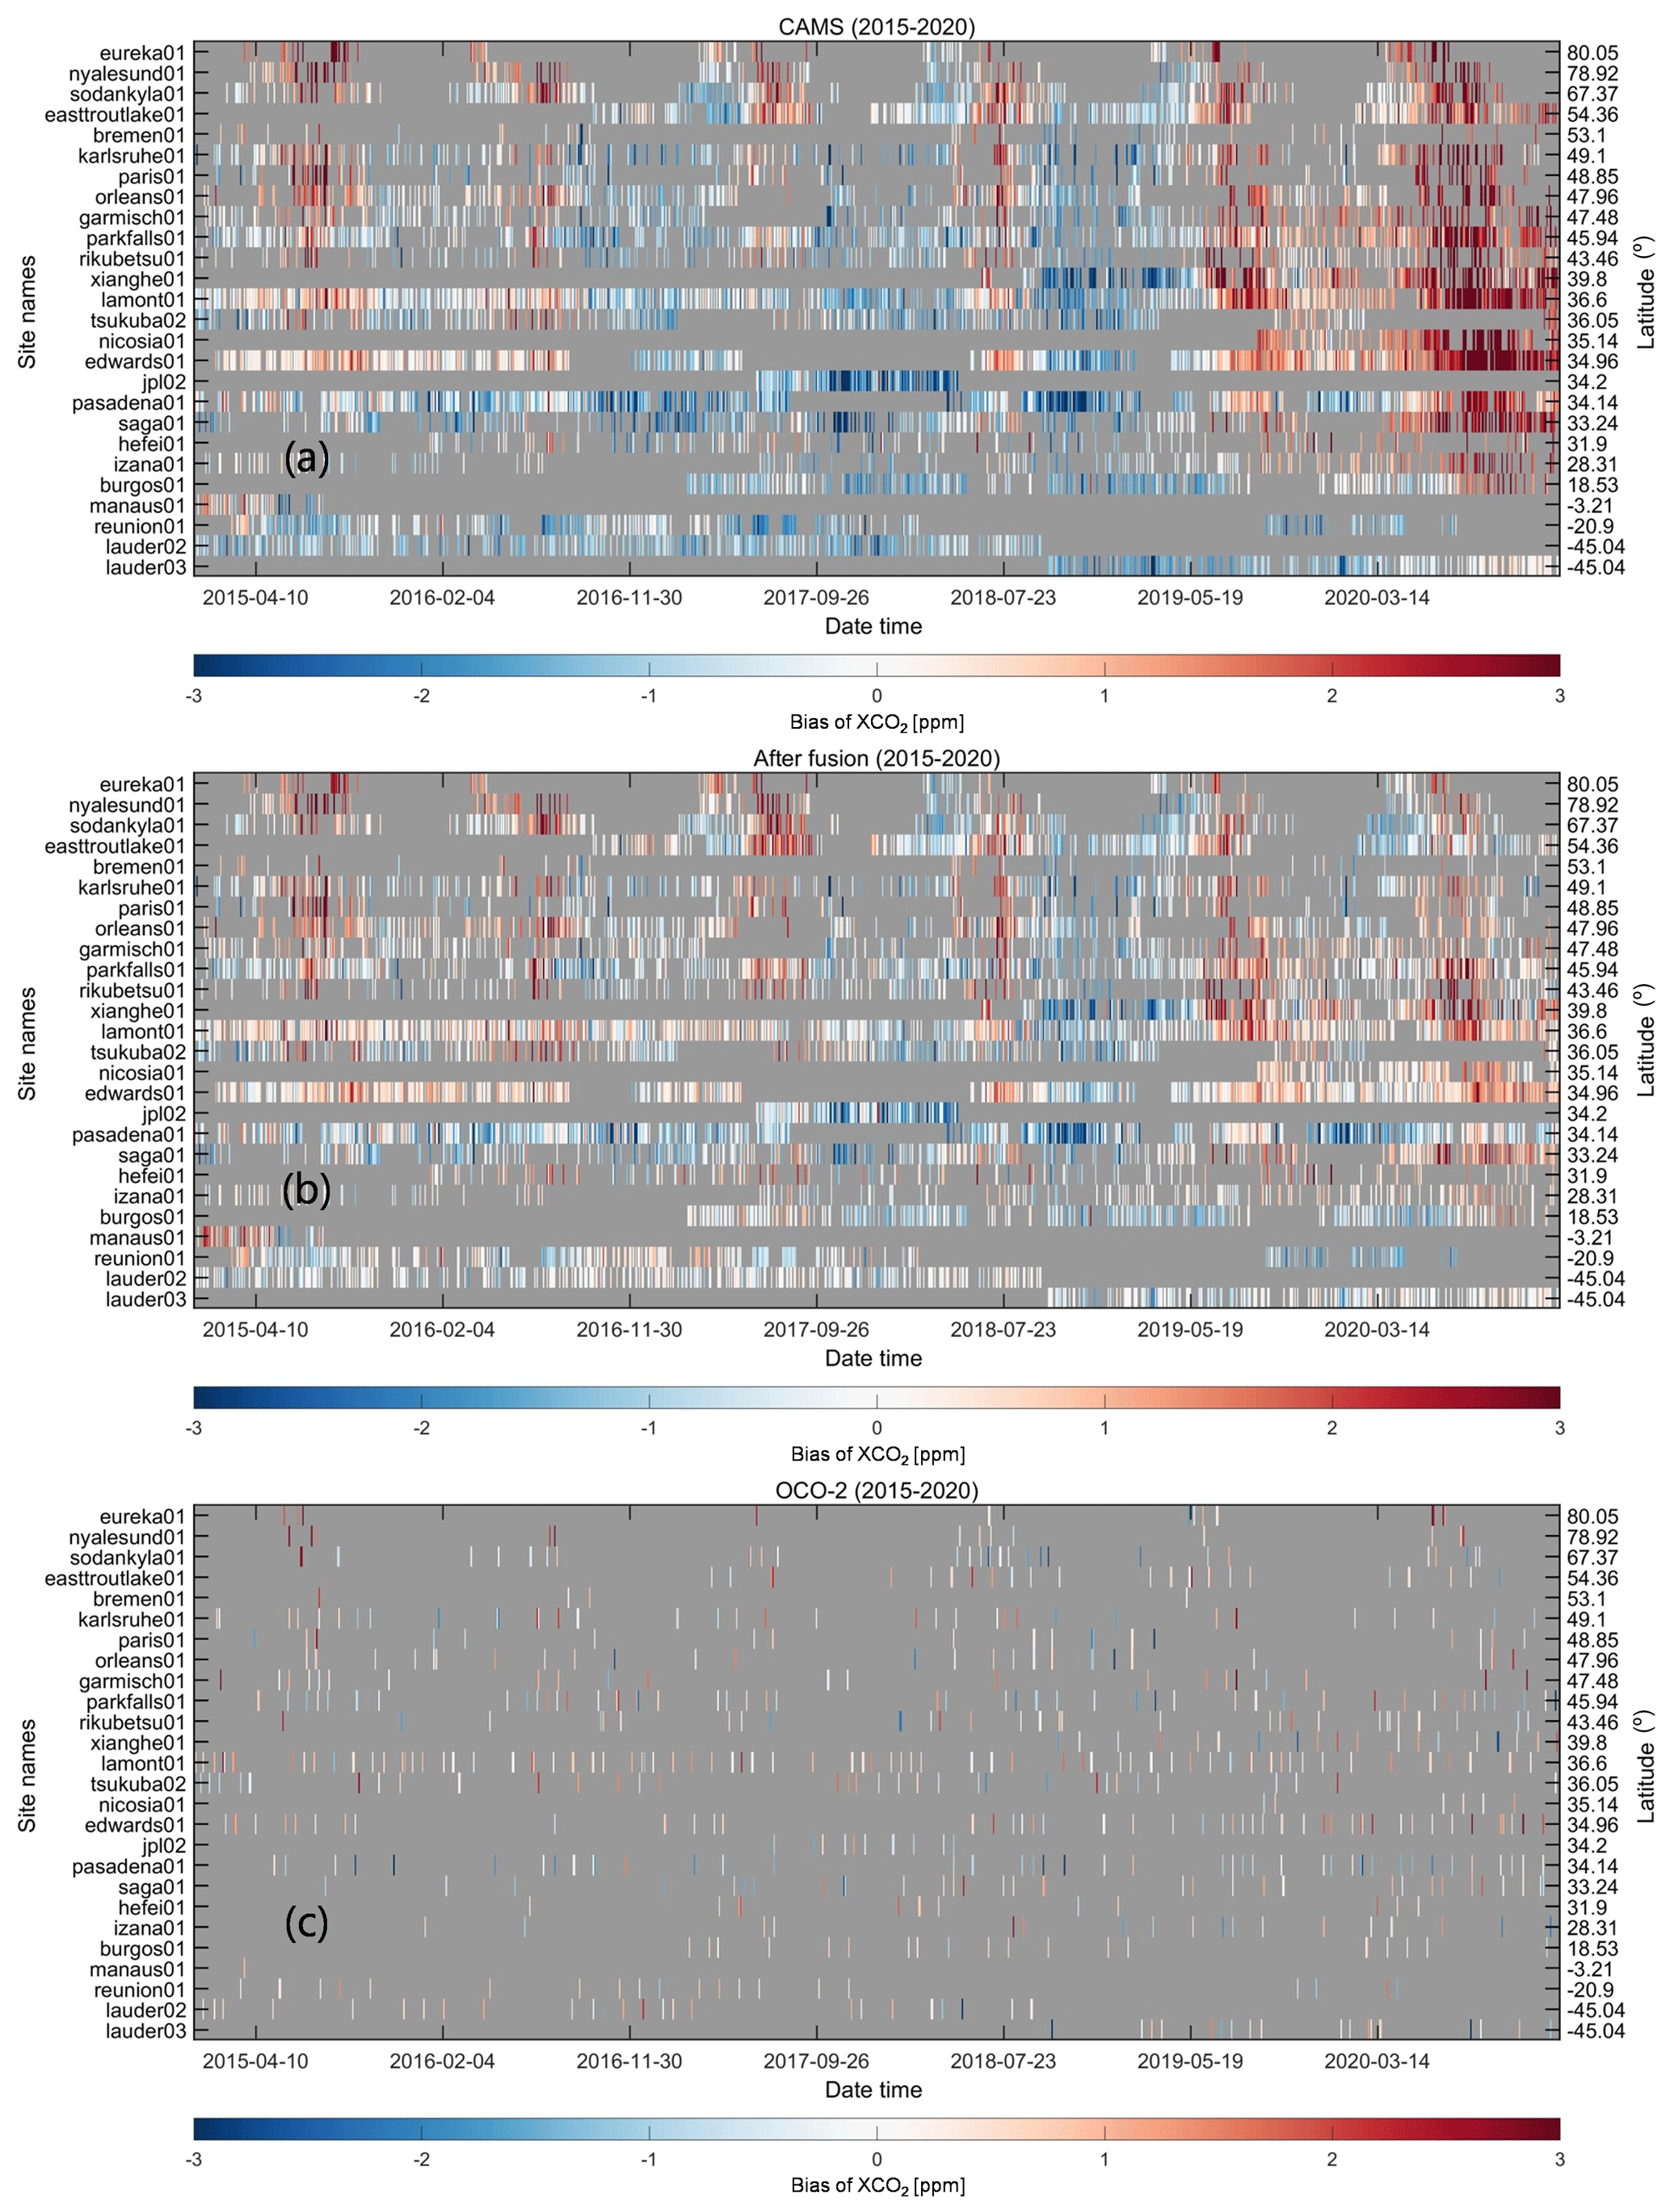
Figure 9Heat maps of the biases between daily (a) CAMS-EGG4, (b) fused, and (c) OCO-2 and TCCON XCO2 over time and latitude. Color ramps stand for the biases of XCO2. Background colors (grey) indicate the missing data.
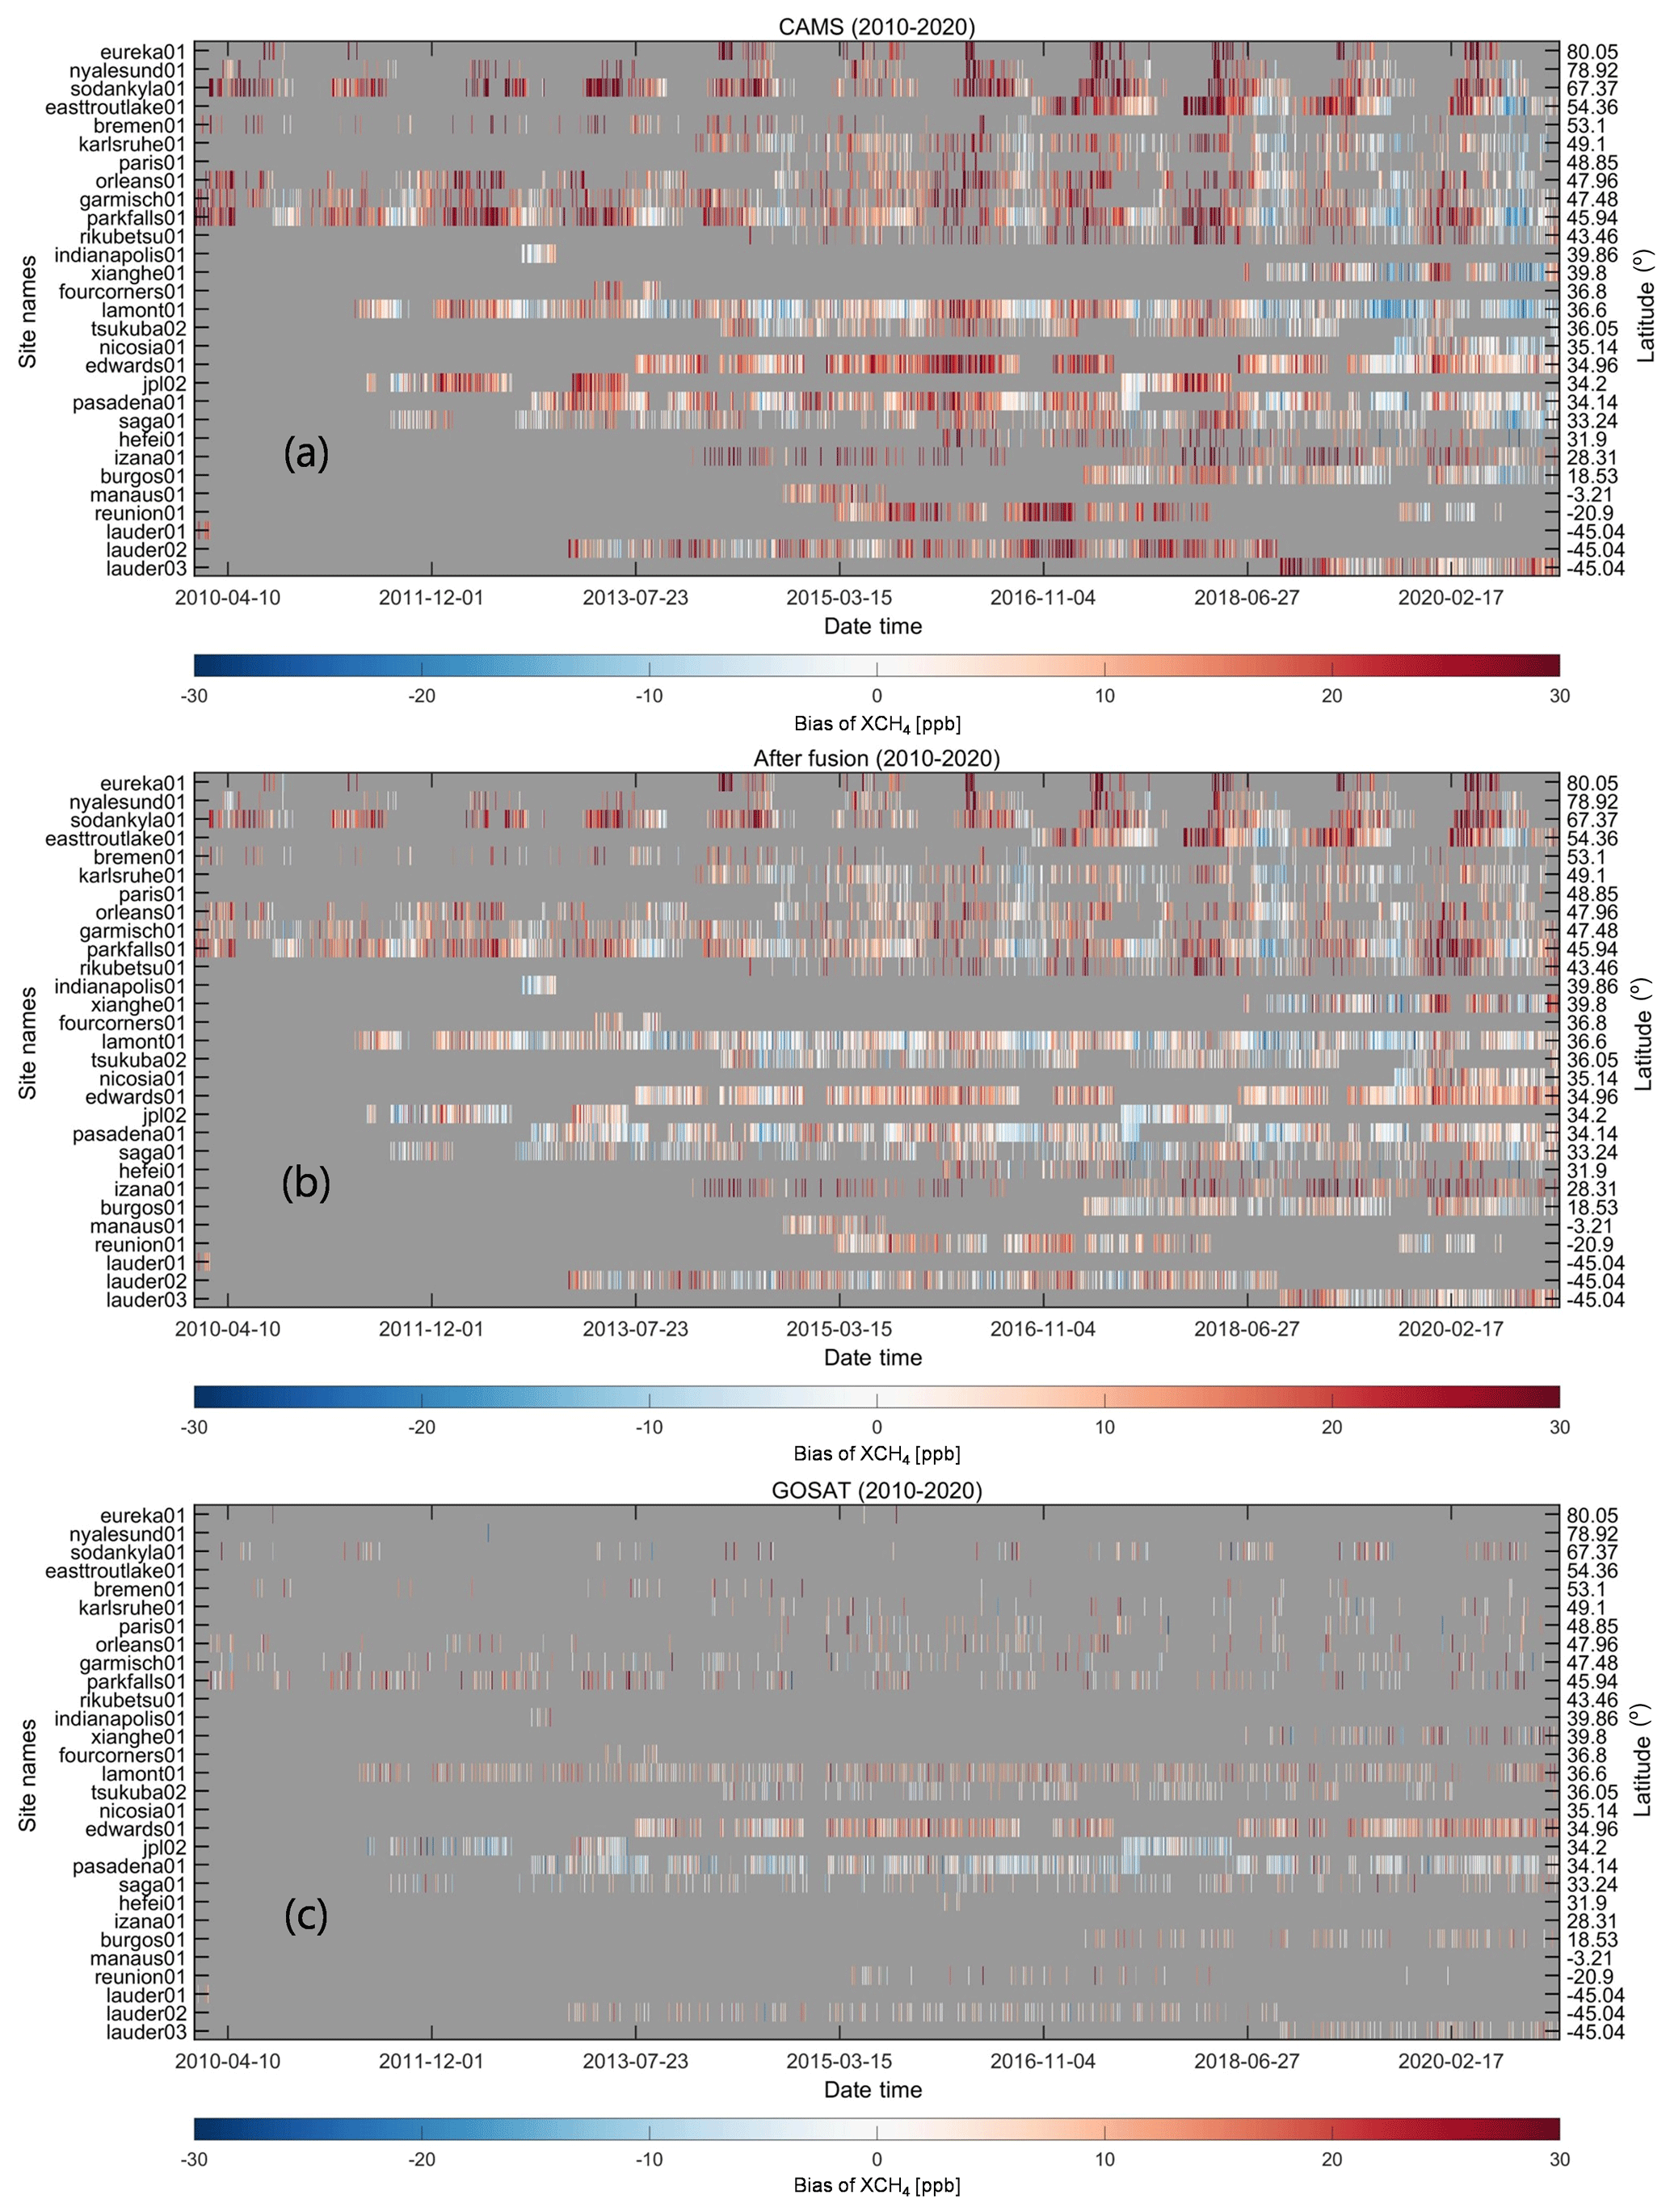
Figure 10Heat maps of the biases between daily (a) CAMS-EGG4, (b) fused, and (c) GOSAT and TCCON XCH4 over time and latitude. Color ramps stand for the biases of XCO2. Background colors (grey) indicate the missing data.
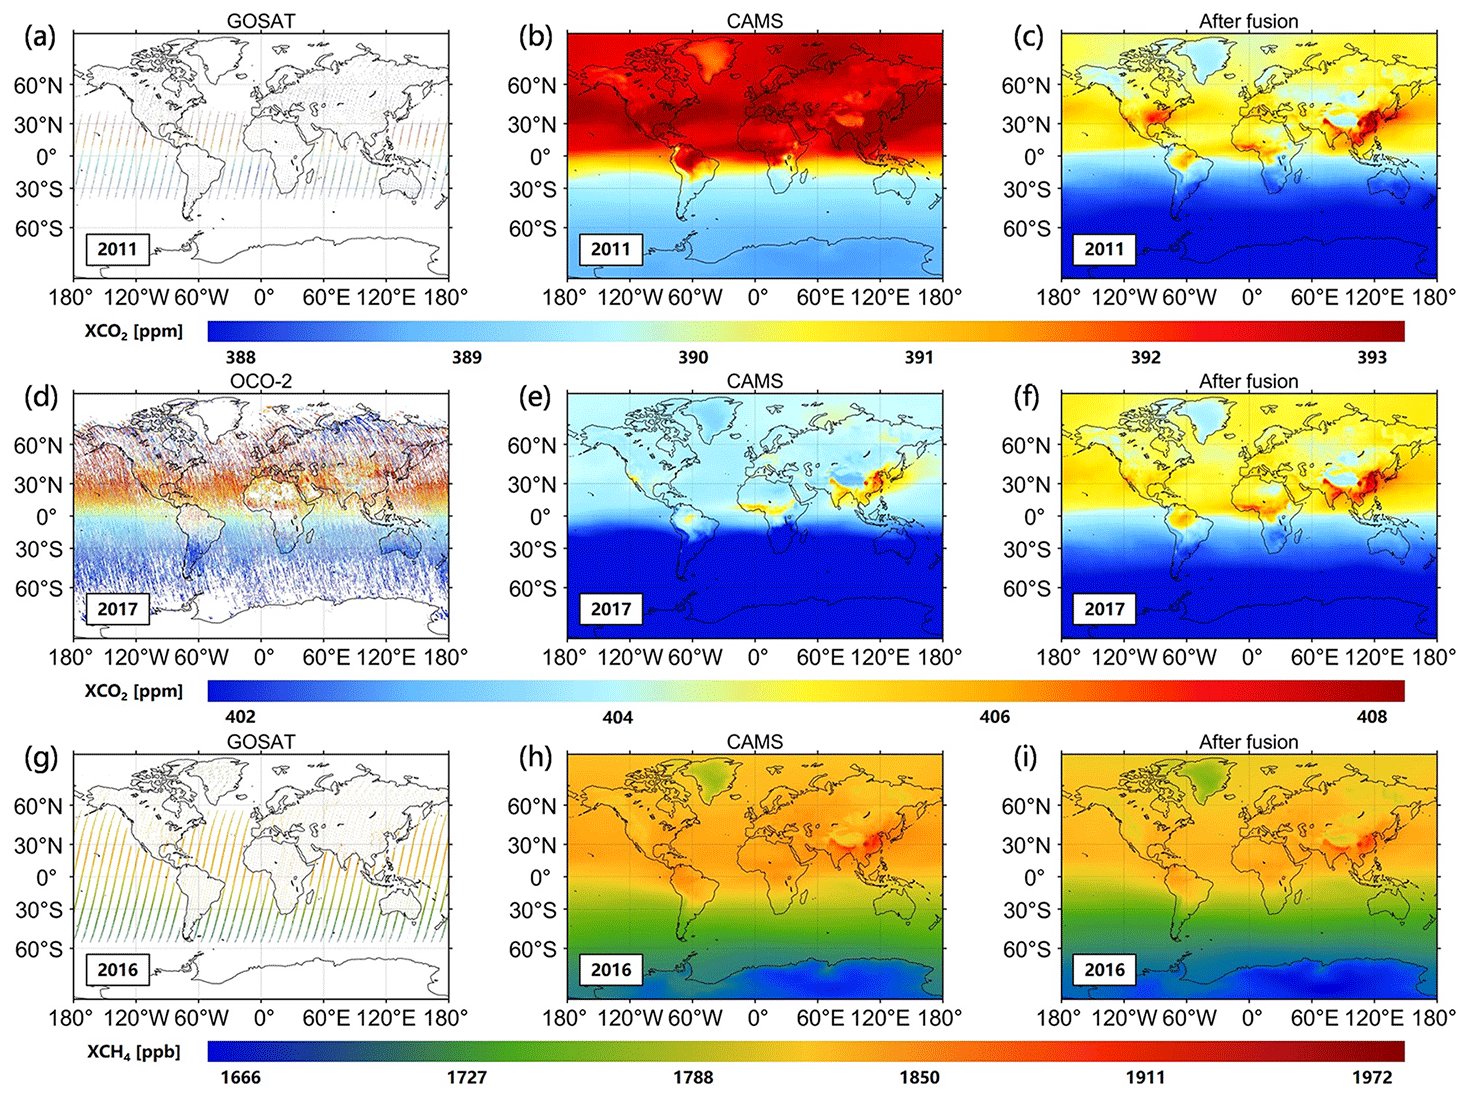
Figure 11Annual (a, g) GOSAT, (d) OCO-2, (b, e, h) CAMS-EGG4, and (c, f, i) fused XCO2 and XCH4 over the globe. Color ramps stand for the values of XCO2 and XCH4.
3.2.1 Spatiotemporal DCT
A total of eight types of DCT are proposed, among which the second type (type II) is commonly utilized due to its simple calculation and broad application range (Rao and Yip, 2014). Hence, the type-II DCT is considered in this study. The spatiotemporal DCT is a three-dimensional form (hereafter STDCT), which can be expressed as Eq. (1):
where , , . x indicates the original three-dimensional tensor. M, N, and P stand for the counts of rows (latitude), columns (longitude), and temporal sequences (d), which equal 721 (0.25∘, global grids), 1441 (0.25∘, global grids), and days of a year (365 or 366), respectively. i, j, and t represent the row, column, and temporal sequence, respectively (i∈ [0, M−1], j∈ [0, N−1], and t∈ [0, P−1]). X signifies the transformed three-dimensional tensor. u, v, and w denote the transformed coordinates in the frequency domain, which share the same ranges with i, j, and t (e.g., u∈ [0, M−1]), respectively. The inverse transformation of STDCT (hereafter ISTDCT) is provided in Eq. (2):
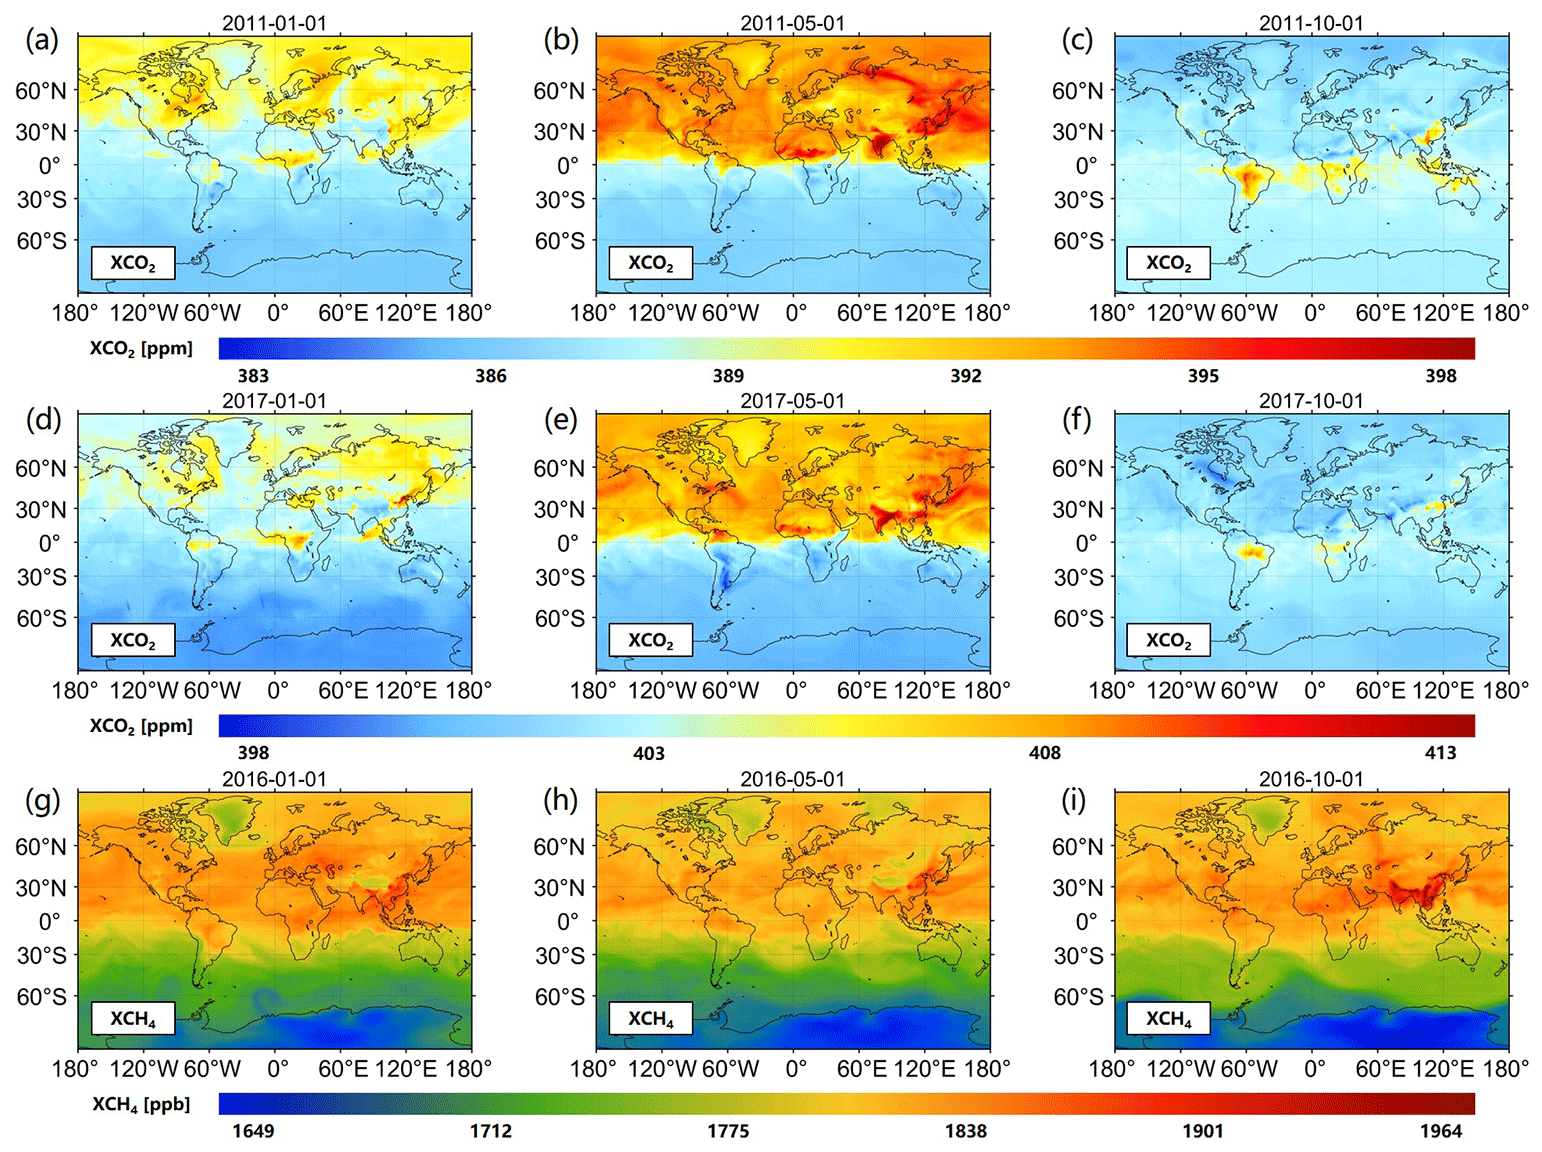
Figure 12Daily fused (a–f) XCO2 and (g–i) XCH4 over the globe. Color ramps stand for the values of XCO2 and XCH4.
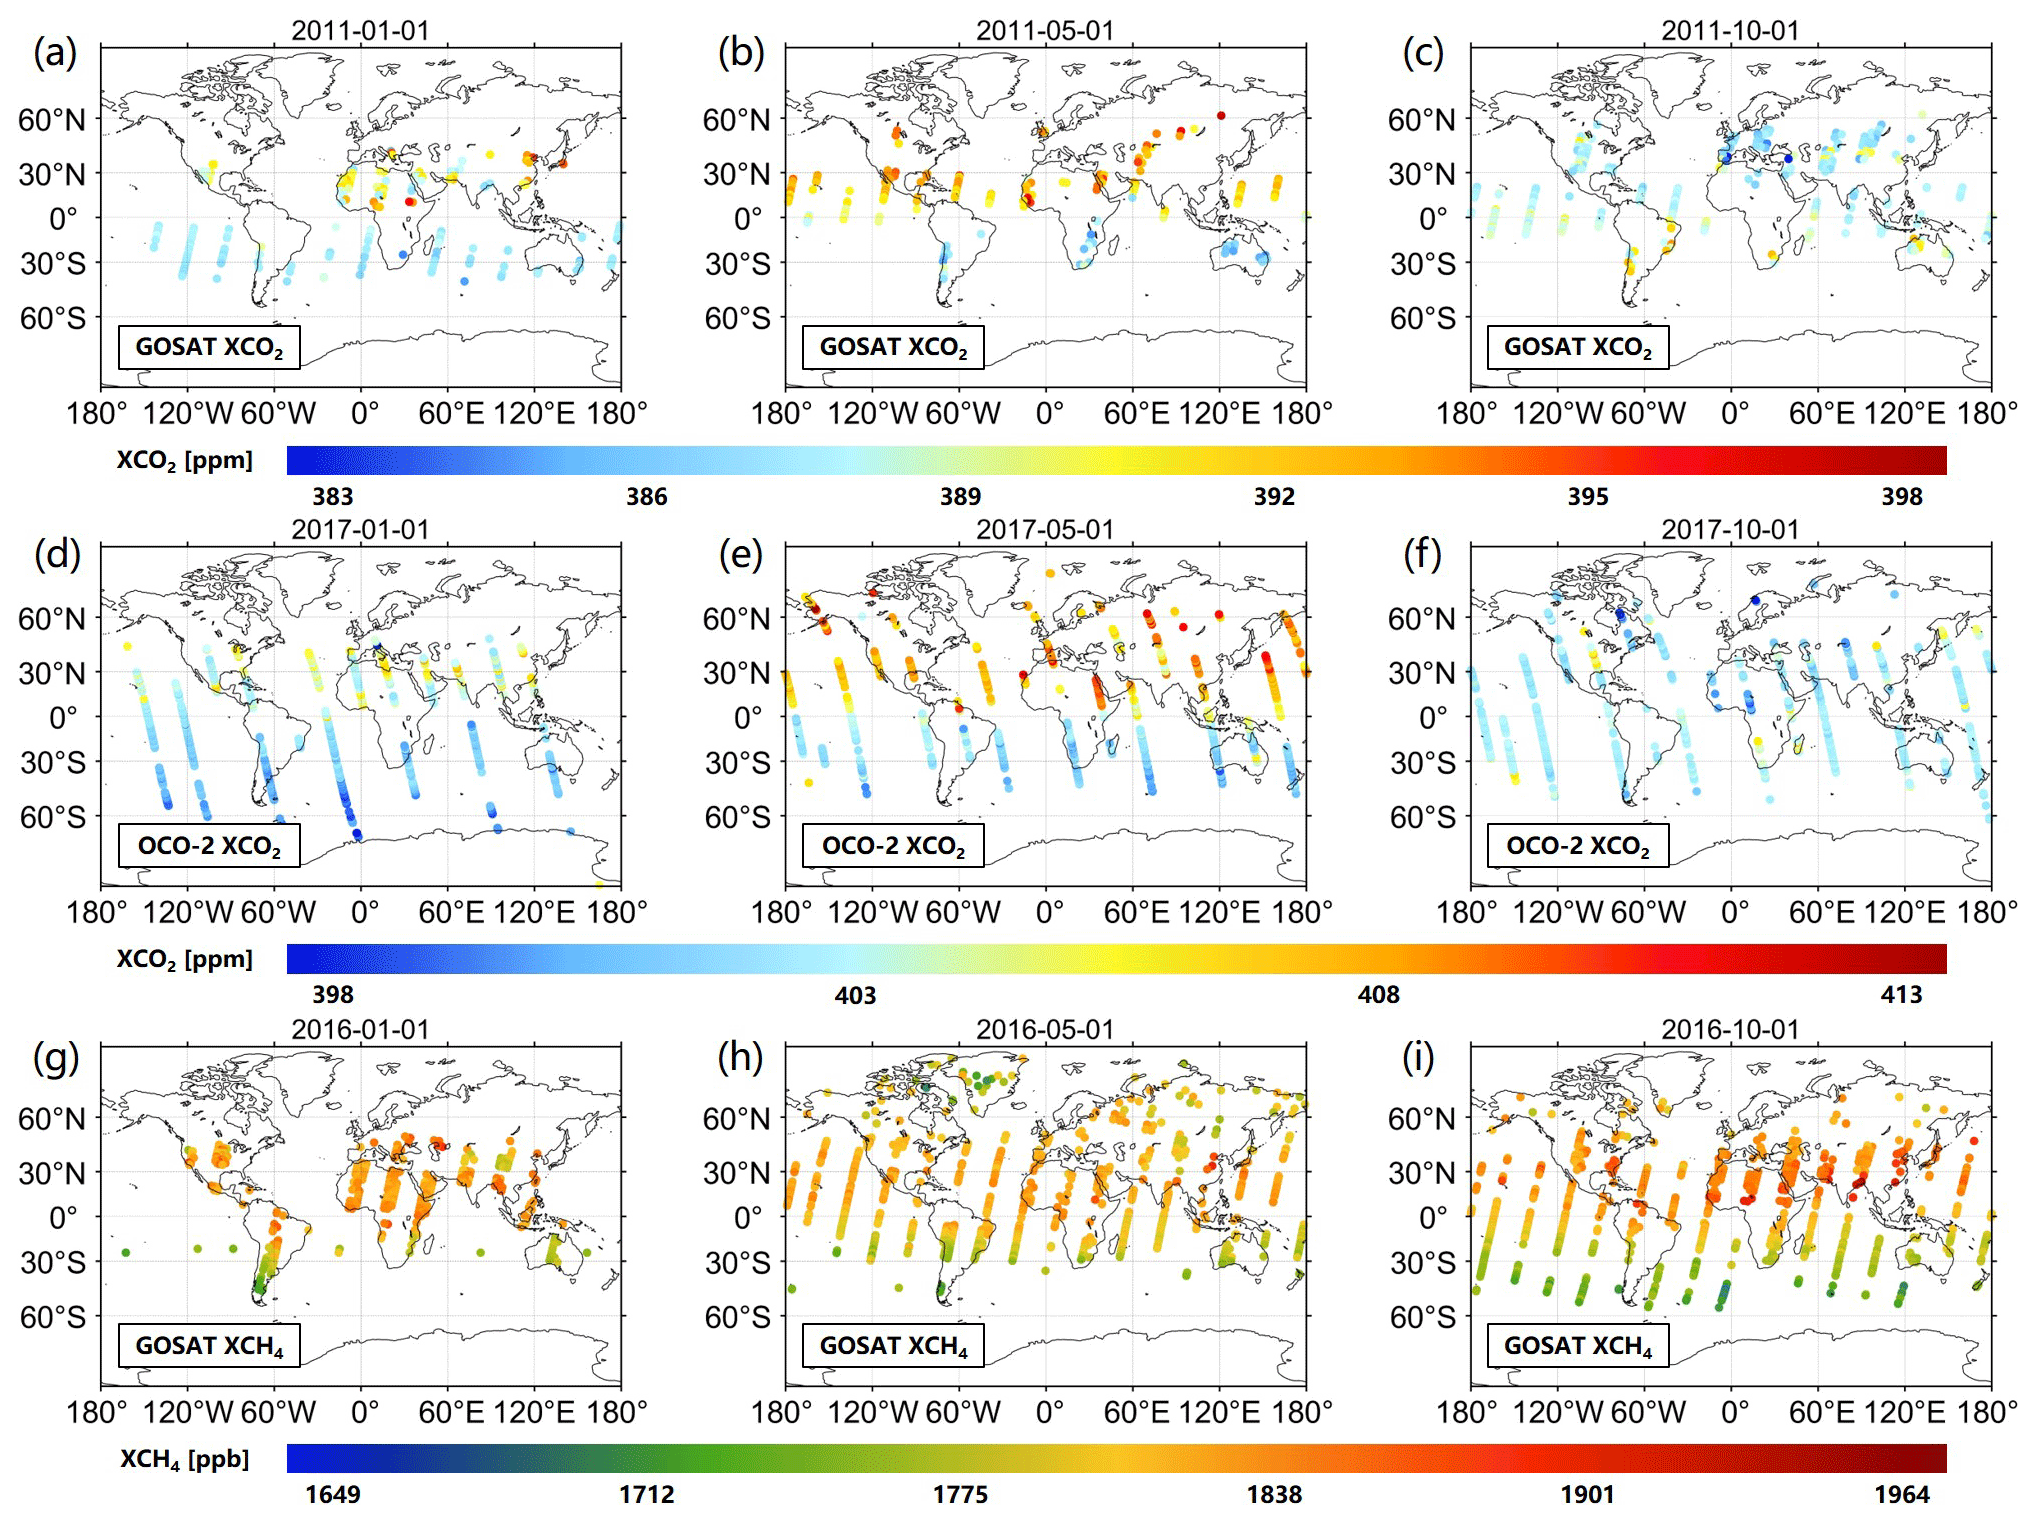
Figure 13Daily (a–c) GOSAT XCO2, (d–f) OCO-2 XCO2, and (g–i) GOSAT XCH4 over the globe. Color ramps stand for the values of XCO2 and XCH4.
3.2.2 Self-supervised fusion scheme with spatiotemporal knowledge
It has been documented that the XCO2 and XCH4 products derived from remote-sensing satellites generally present better accuracy compared to reanalysis datasets (Agusti-Panareda et al., 2023; He et al., 2022a; Parker et al., 2020). Therefore, the brand-new XCO2 and XCH4 products from GOSAT and OCO-2 are regarded as the criteria (or ground truths) that will be fused with the CAMS-EGG4 datasets. At first, a spatially and temporally varying function relationship (see Eq. 3) is hypothesized between GOSAT or OCO-2 and CAMS-EGG4 XCO2 and XCH4 values.
where XGs denotes the XCO2 and XCH4 values from GOSAT or OCO-2; XGc indicates the XCO2 and XCH4 values from CAMS-EGG4; and Row, Col, and Time represent the row (or latitude), column (or longitude), and temporal sequence, respectively. To conveniently solve this problem, Eq. (3) is simplified into the scalar product form of XGc and a spatially and temporally varying tensor (defined as δ) as shown in Eq. (4):
Afterward, the factor (i.e., δ) can be acquired using the XCO2 and XCH4 values on the grids where the GOSAT or OCO-2 and CAMS-EGG4 data are available. In our study, a self-supervised fusion scheme is introduced to solve Eq. (4) based on the spatiotemporal knowledge of self-correlation in the GOSAT and OCO-2 products. Due to the large sparsity of data from GOSAT and OCO-2 in the space–time domain, the STDCT is applied for the fusion task.
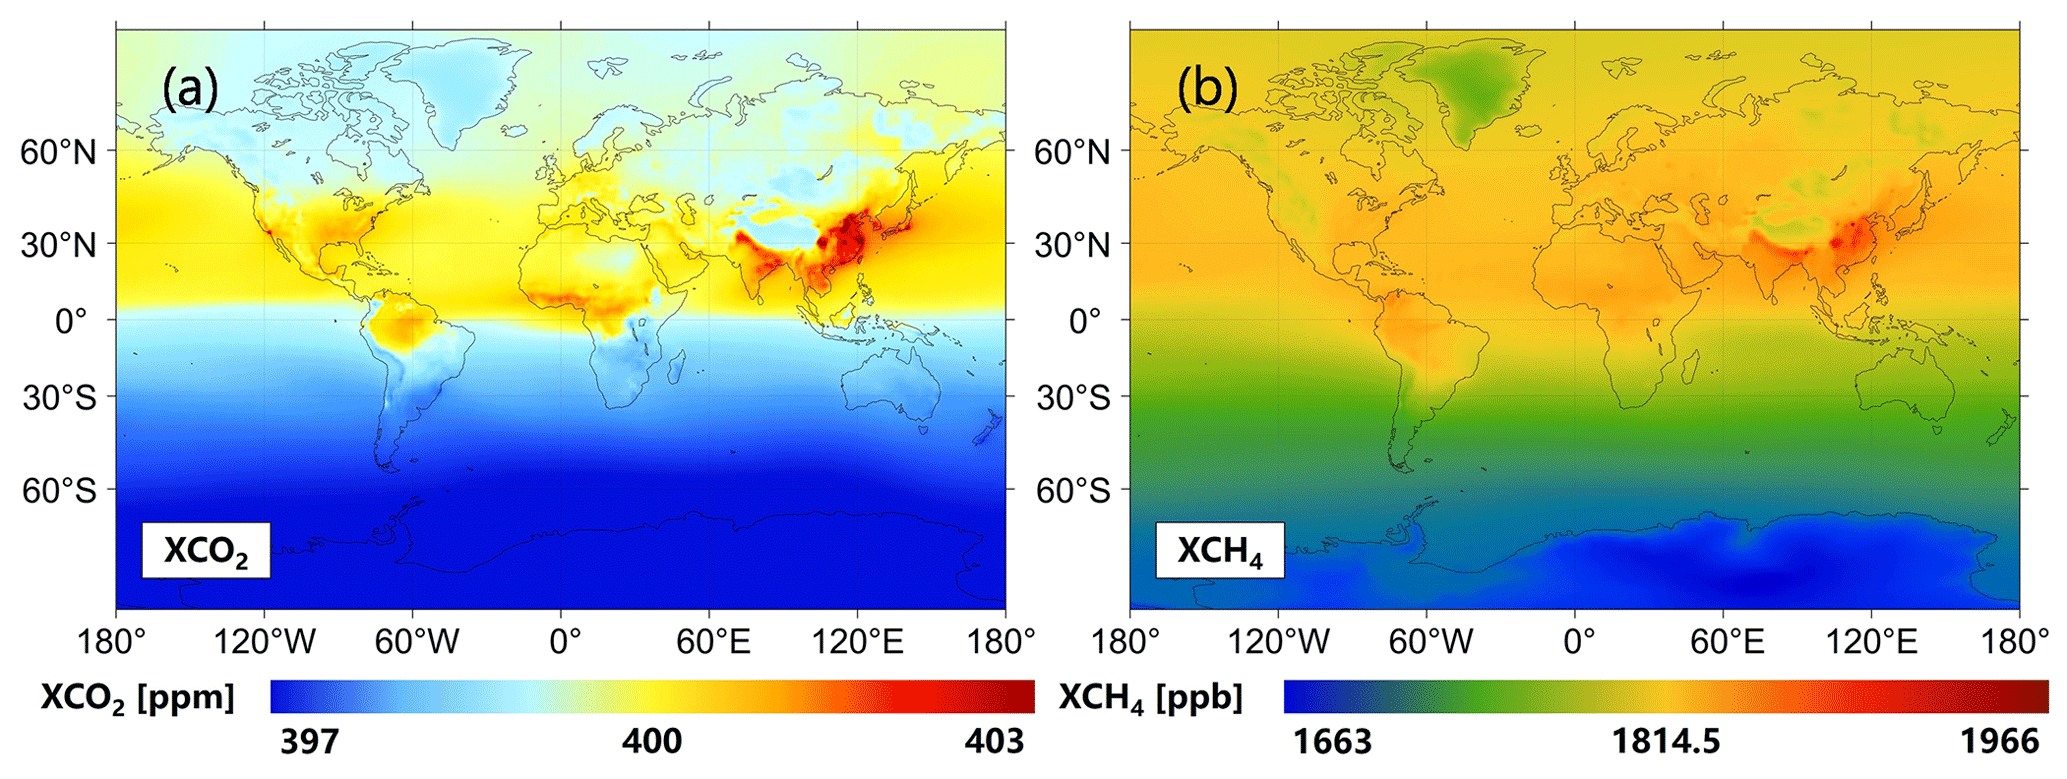
Figure 14Multi-year mean fused (a) XCO2 and (b) XCH4 from 2010 to 2020 over the globe. Color ramps stand for the values of XCO2 and XCH4.
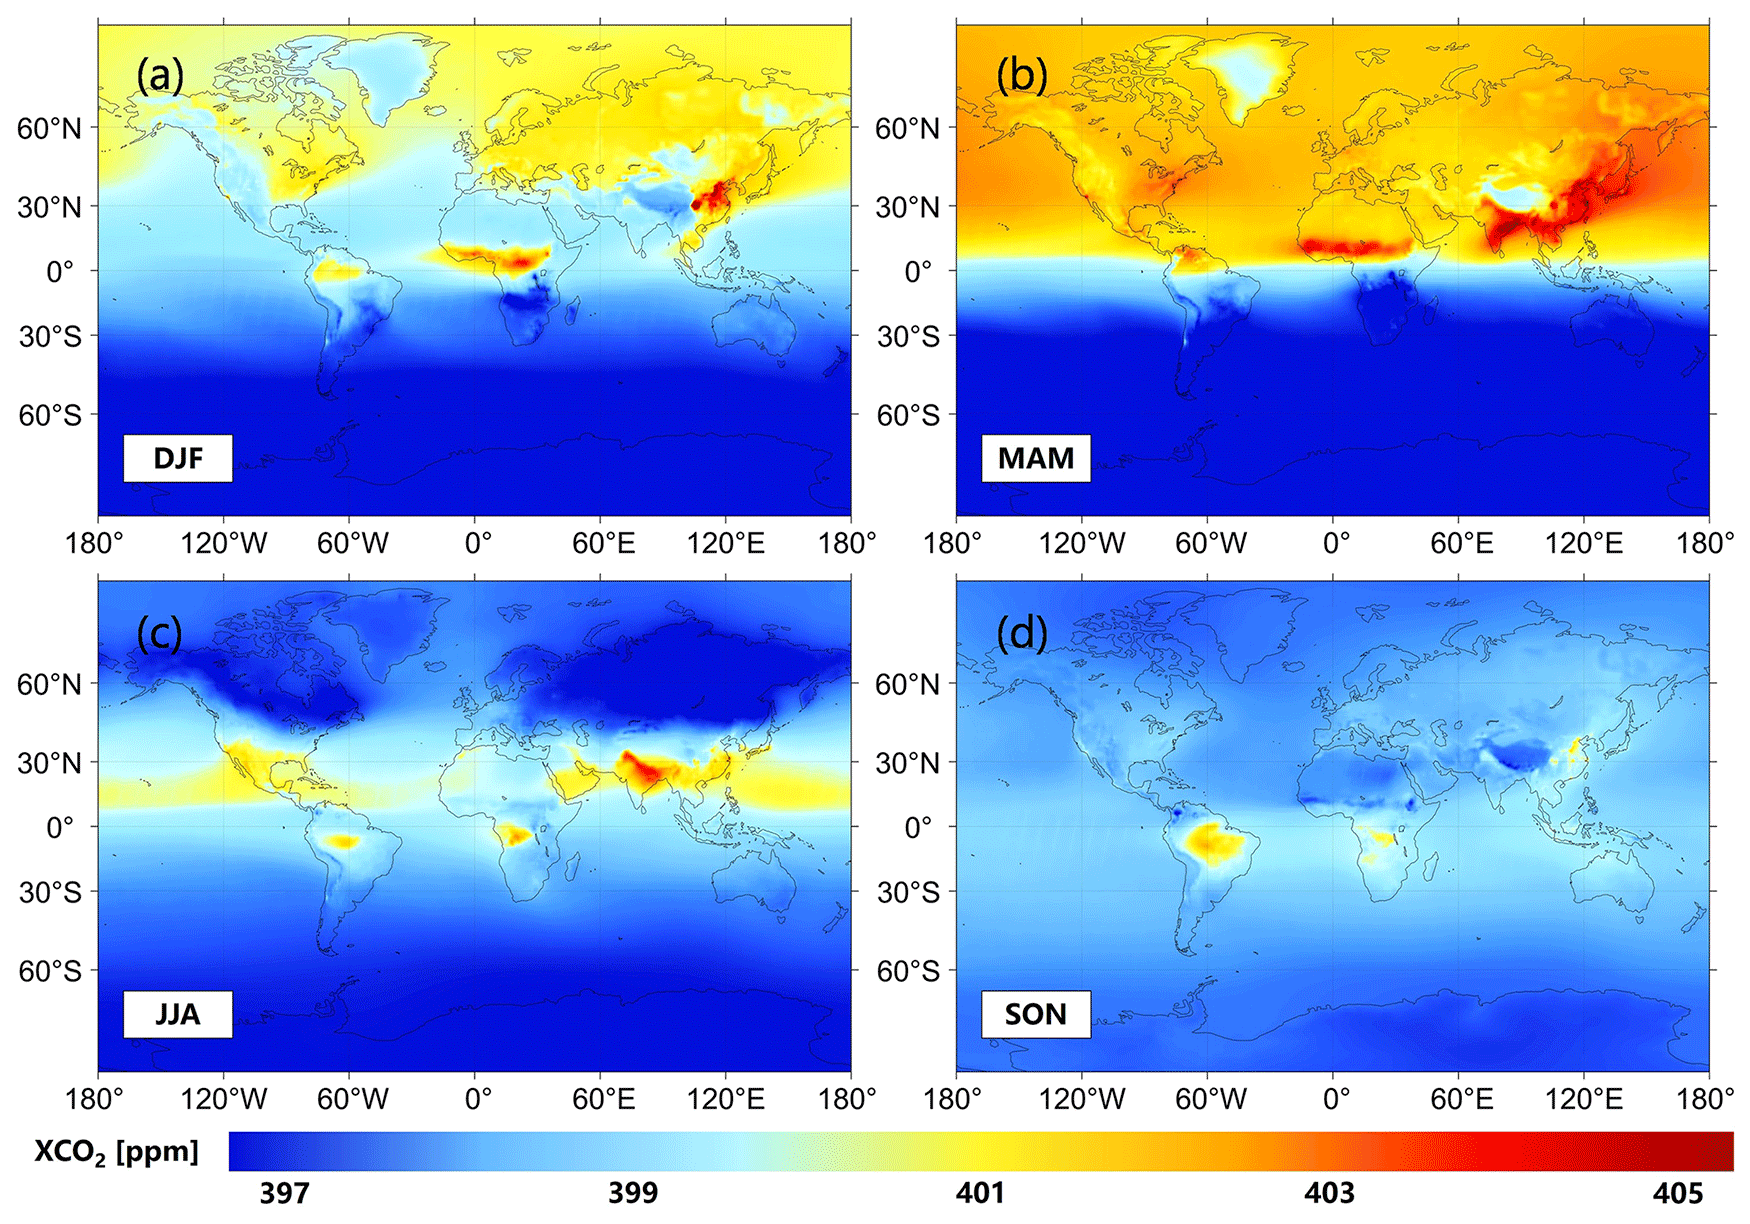
Figure 15Seasonal fused XCO2 from 2010 to 2020 over the globe. The color ramp stands for the value of XCO2. (a) DJF, (b) MAM, (c) JJA, and (d) SON denote December to February, March to May, June to August, and September to November, respectively.
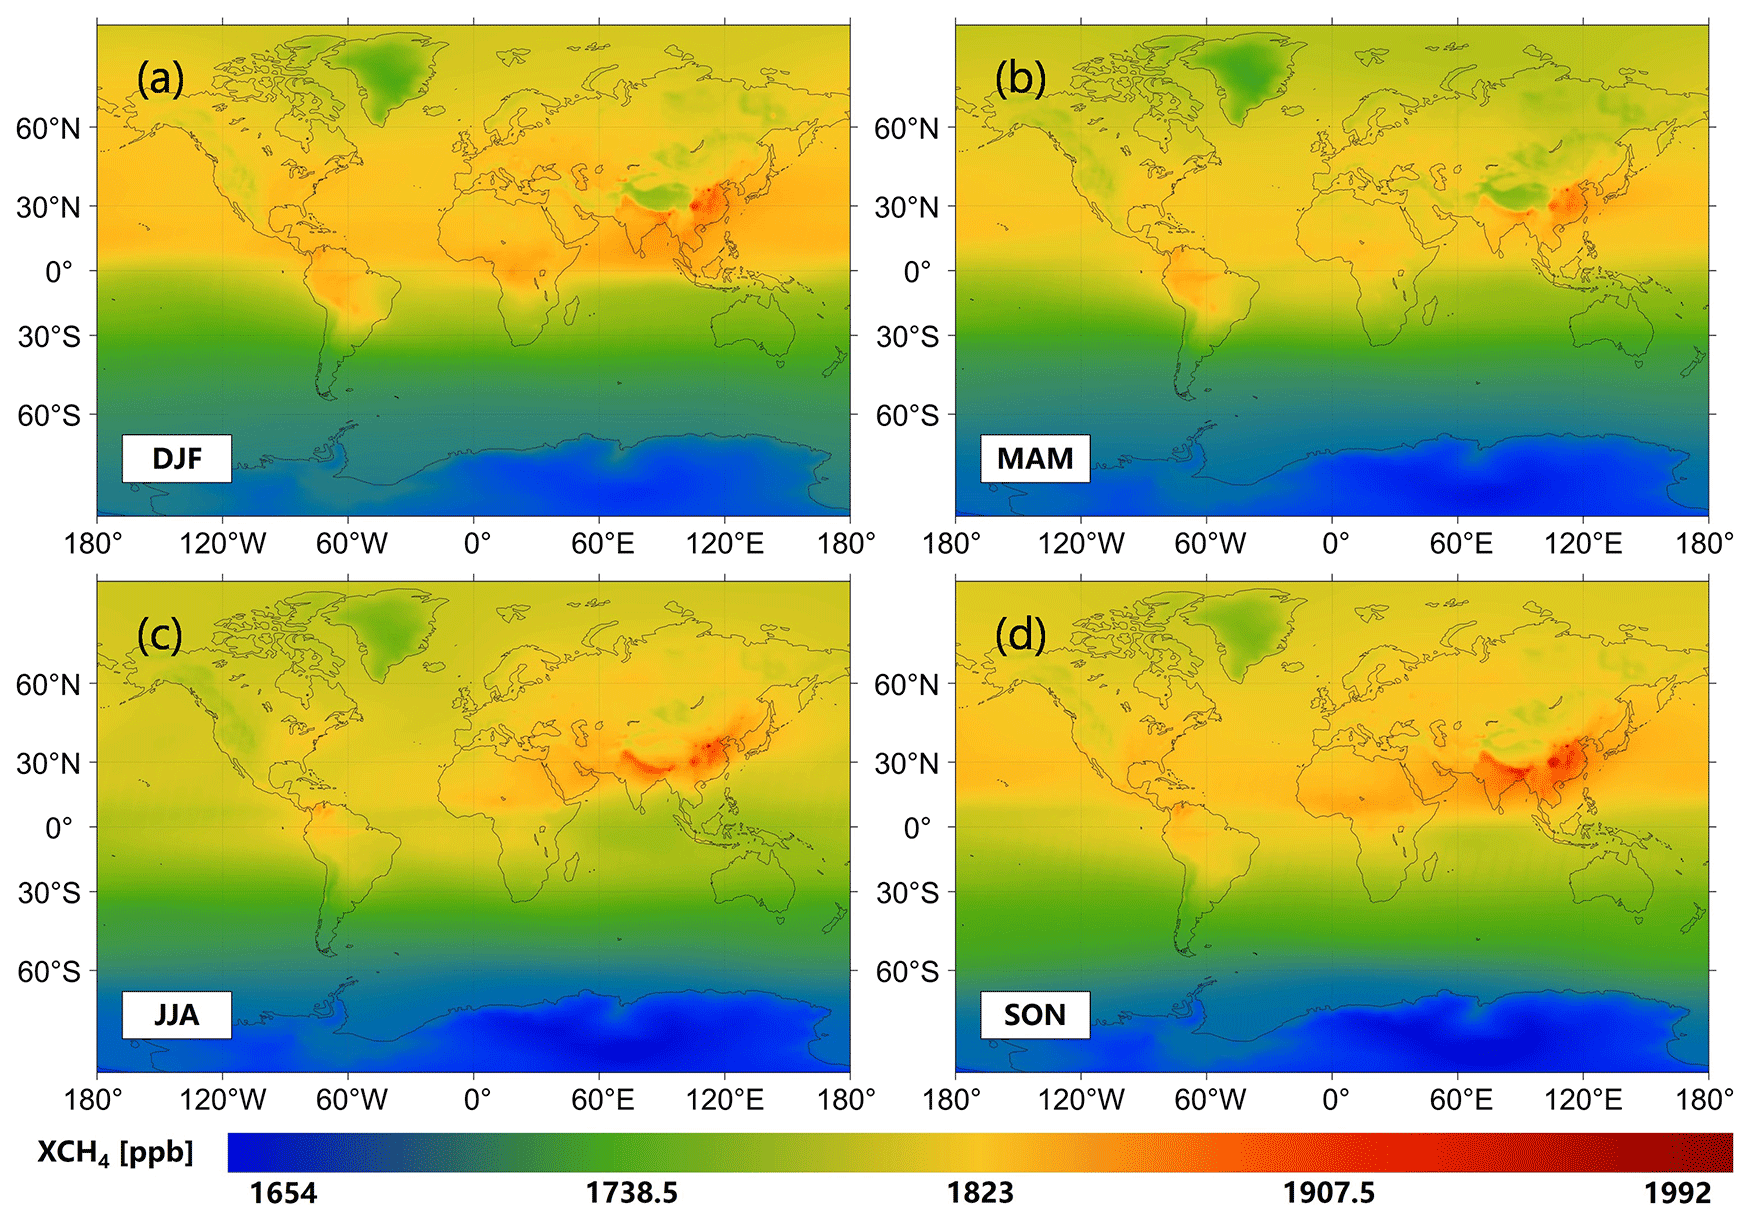
Figure 16Seasonal fused XCH4 from 2010 to 2020 over the globe. The color ramp stands for the value of XCH4. (a) DJF, (b) MAM, (c) JJA, and (d) SON.
Inspired by previous studies adopting the STDCT (Garcia, 2010; Wang et al., 2012; T. Wang et al., 2022a; Fredj et al., 2016; Pham et al., 2019), the S-STDCT fusion method searches for the spatially and temporally varying tensor, i.e., , that minimizes Eq. (5), including a residual (left) term and a smoothing (right) term.
where ∥∥ signifies the Euclidean norm; φ represents the binary mask showing whether the data are available or not; and ε and ∇2 indicate a smoothing factor and the Laplace operator, respectively. This equation can be solved by iterations via Eq. (6):
where γ is a relaxation factor to accelerate convergence. ρ indicates a three-dimensional filter related to the smoothing term, which is defined in Eq. (7):
Here, dk represents the dth value along the kth dimension (k=1, 2, and 3), and nk denotes the size of δ along the kth dimension. This means that d1, d2, and d3 stand for u, v, and w (see Eq. 1), respectively. In this study, the number of total iterations, γ, and ε are empirically configured to 100, 1.5, and a range from 103 to 10−1 (spaced with 100 intervals), respectively. It is worth noting that is initialized through the spatiotemporal nearest-neighbor interpolation. More details of the solution steps can be found in Garcia (2010).
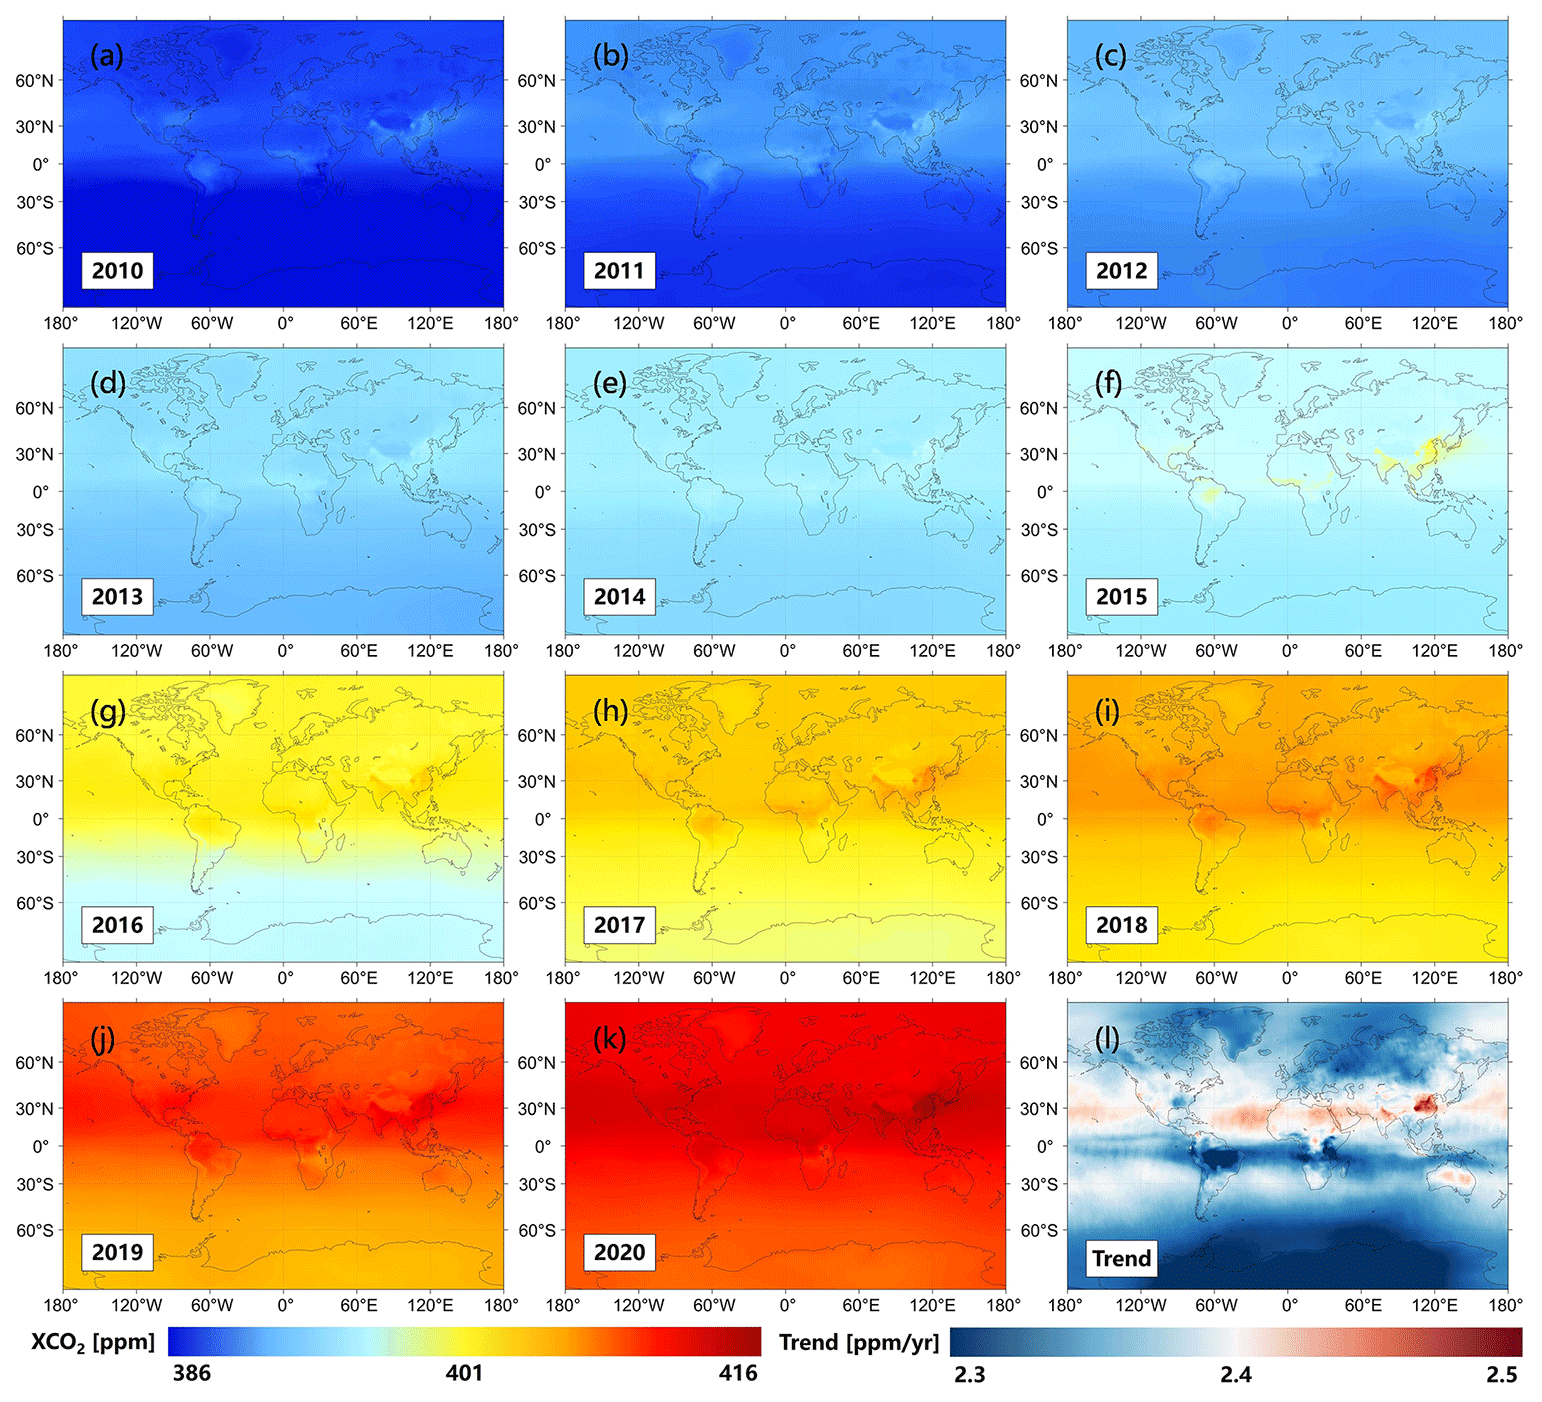
Figure 17Annual fused (a–k) XCO2 and (l) its trend from 2010 to 2020 over the globe. Color ramps stand for the values of XCO2 and its trend (“ppm / yr” means parts per million per year).
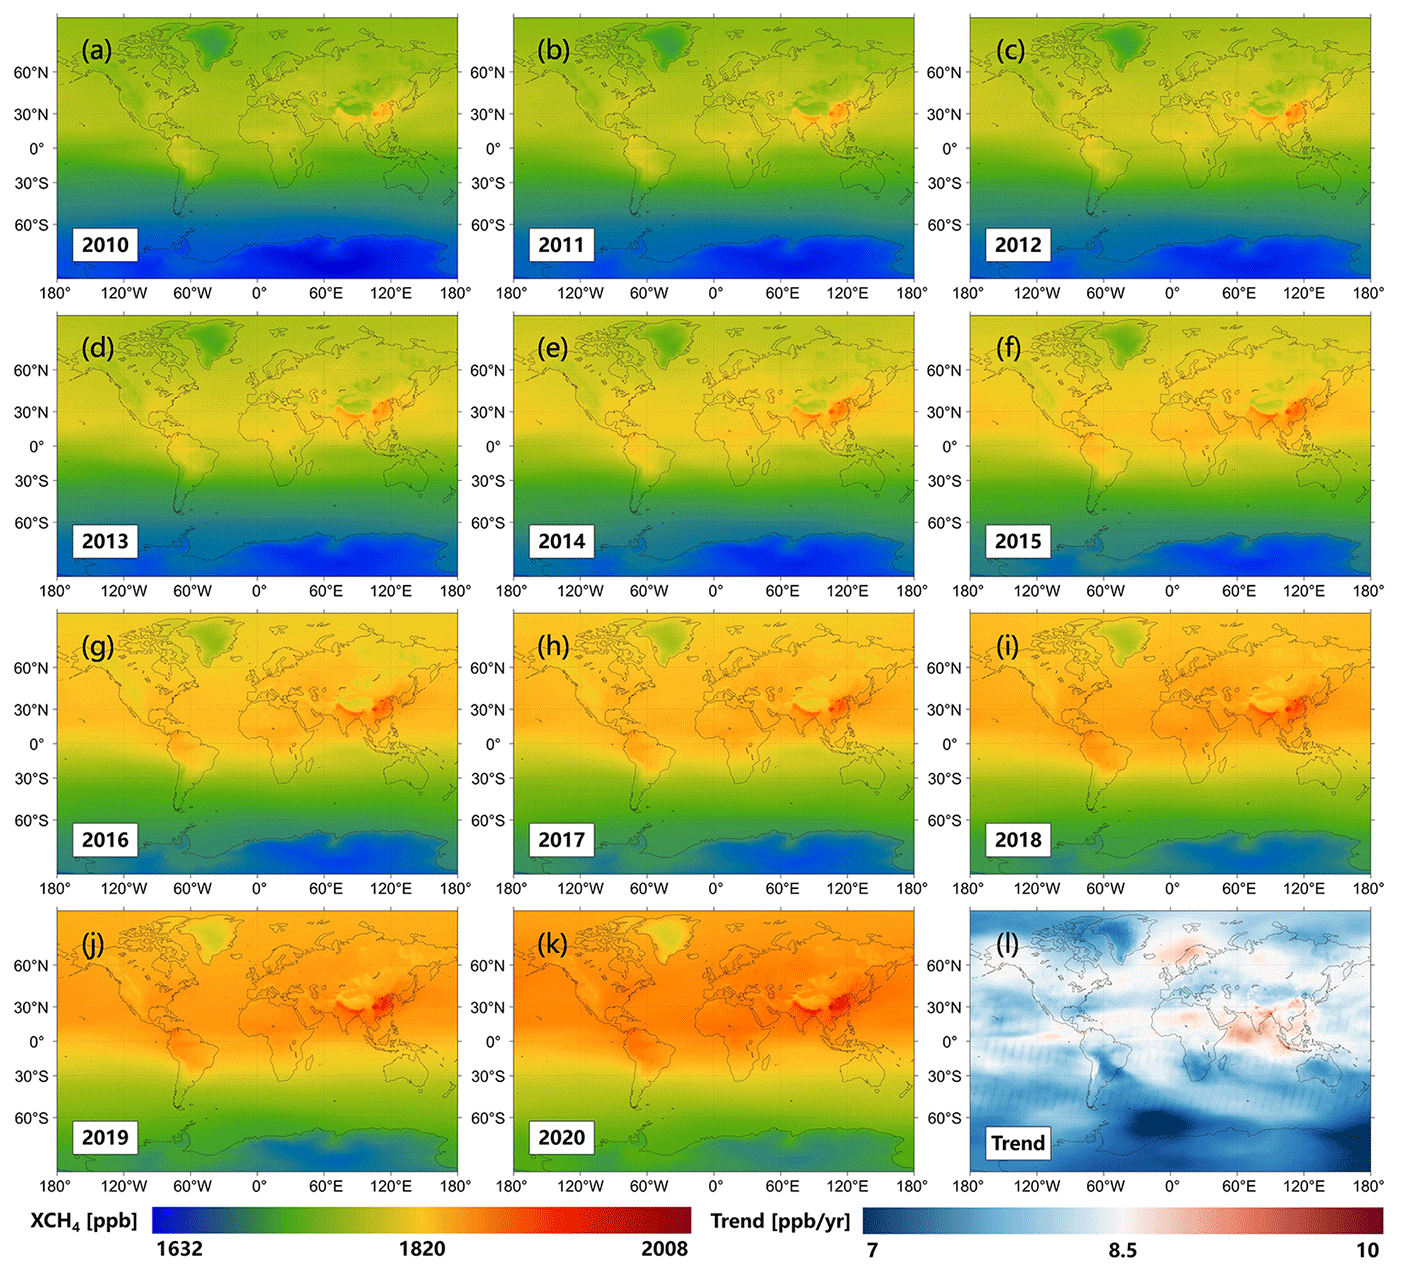
Figure 18Annual fused (a–k) XCH4 and (l) its trend from 2010 to 2020 over the globe. Color ramps stand for the values of XCH4 and its trend (“ppb / yr” means parts per billion per year).
3.3 Evaluation schemes
In our study, the evaluation schemes include in situ validations and assessments of spatial distribution. To be specific, the GOSAT, OCO-2, CAMS-EGG4, and fused XCO2 and XCH4 are validated against TCCON measurements, which consist of the comparisons for overall and individual in situ stations. The spatial distributions of the GOSAT, OCO-2, CAMS-EGG4, and fused XCO2 and XCH4 are assessed on multi-temporal scales, i.e., multi-year-mean, seasonal, and annual. A total of four metrics is exploited covering the determination coefficient (R2), root-mean-square error (RMSE), mean bias (μ), and standard deviation of bias (σ). The significance levels of p<0.01 are applied in the computations of all the metrics.
4.1 Overall in situ validation
As displayed in Fig. 2, the XCO2 and XCH4 measurements from 29 TCCON in situ stations are adopted for the validation and are evenly distributed over the globe. In this study, TCCON measurements of ±1 h on the satellite overpass times (∼13:00 and 13:36 local time; see Table 2) are co-matched with the CAMS-EGG4, GOSAT, OCO-2, and fused data around each station with a diameter of 2∘. Figure 3 depicts the overall in situ validation results for the CAMS-EGG4, GOSAT, OCO-2, and fused results. The number of data points (N) is sufficient (e.g., 1337 for OCO-2 XCO2 and 5402 for GOSAT XCH4) to support the reliability of the validation results.
As shown in Fig. 3, the XCO2 from OCO-2 and XCH4 from GOSAT perform better than those from CAMS-EGG4, with a larger R2, smaller RMSE, and smaller σ. After fusion, the XCO2 (2015–2020) and XCH4 (2010–2020) present a greatly superior accuracy compared to CAMS-EGG4, of which the RMSE (σ) improvements are 0.443 (0.444) ppm and 3.752 (1.792) ppb for XCO2 and XCH4, respectively. Meanwhile, the accuracy of the fused results is higher than and close to those of the OCO-2 XCO2 and GOSAT XCH4, respectively. This suggests that the proposed fusion method achieves a satisfactory result. Furthermore, the performance of XCO2 from GOSAT is similar to that of CAMS-EGG4. However, the fused XCO2 (2010–2014) shows higher accuracy by comparison with both CAMS-EGG4 and GOSAT, indicating the spatiotemporally local fusion ability of S-STDCT. In conclusion, our fusion method can successfully fuse the data from CAMS-EGG4 and satellites, which effectively generates GOSAT-like and OCO-2-like values.
Table 3Metrics of the individual in situ validation results for CAMS-EGG4, GOSAT, and fused XCO2. The best and second metrics are denoted with bold and underlined fonts, respectively. CAMS: CAMS-EGG4; AF: after fusion. Unit: parts per million for RMSE and σ.
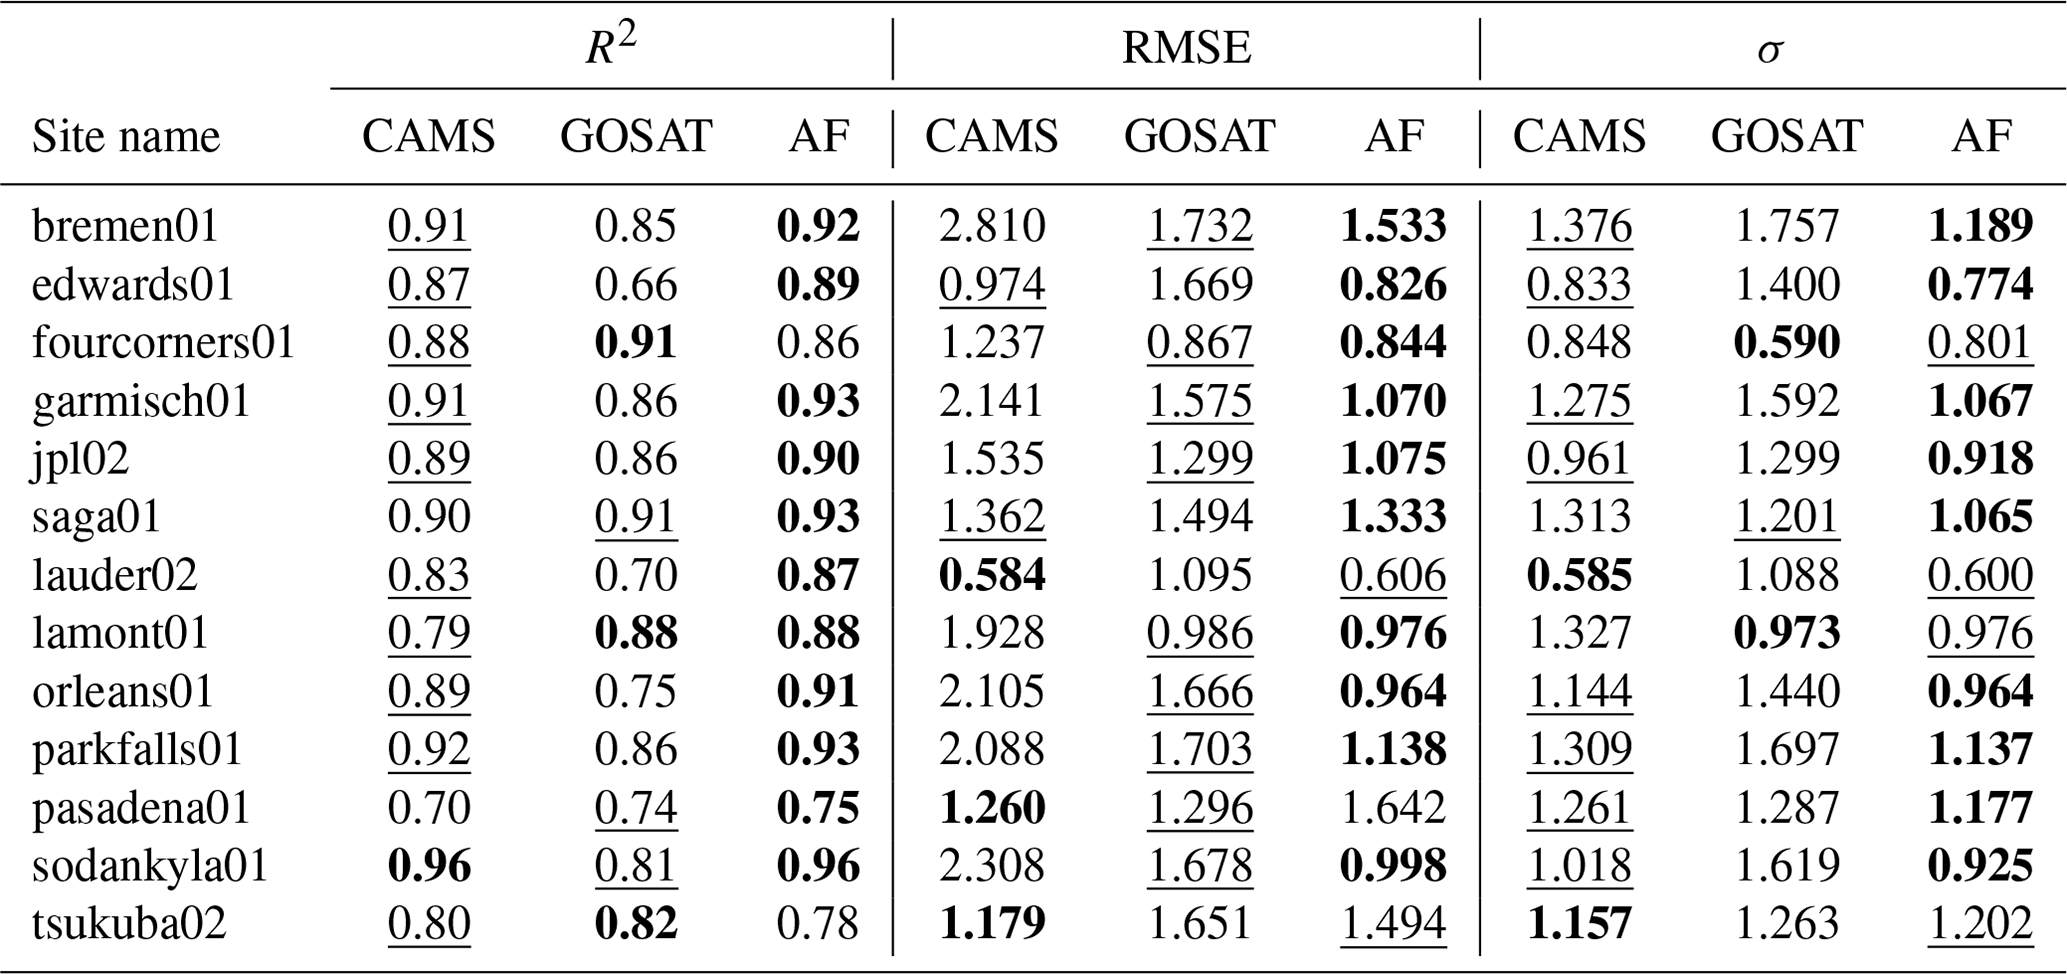
Table 4Metrics of the individual in situ validation results for CAMS-EGG4, OCO-2, and fused XCO2. The best and second metrics are denoted with bold and underlined fonts, respectively. CAMS: CAMS-EGG4; AF: after fusion. Unit: parts per million for RMSE and σ.
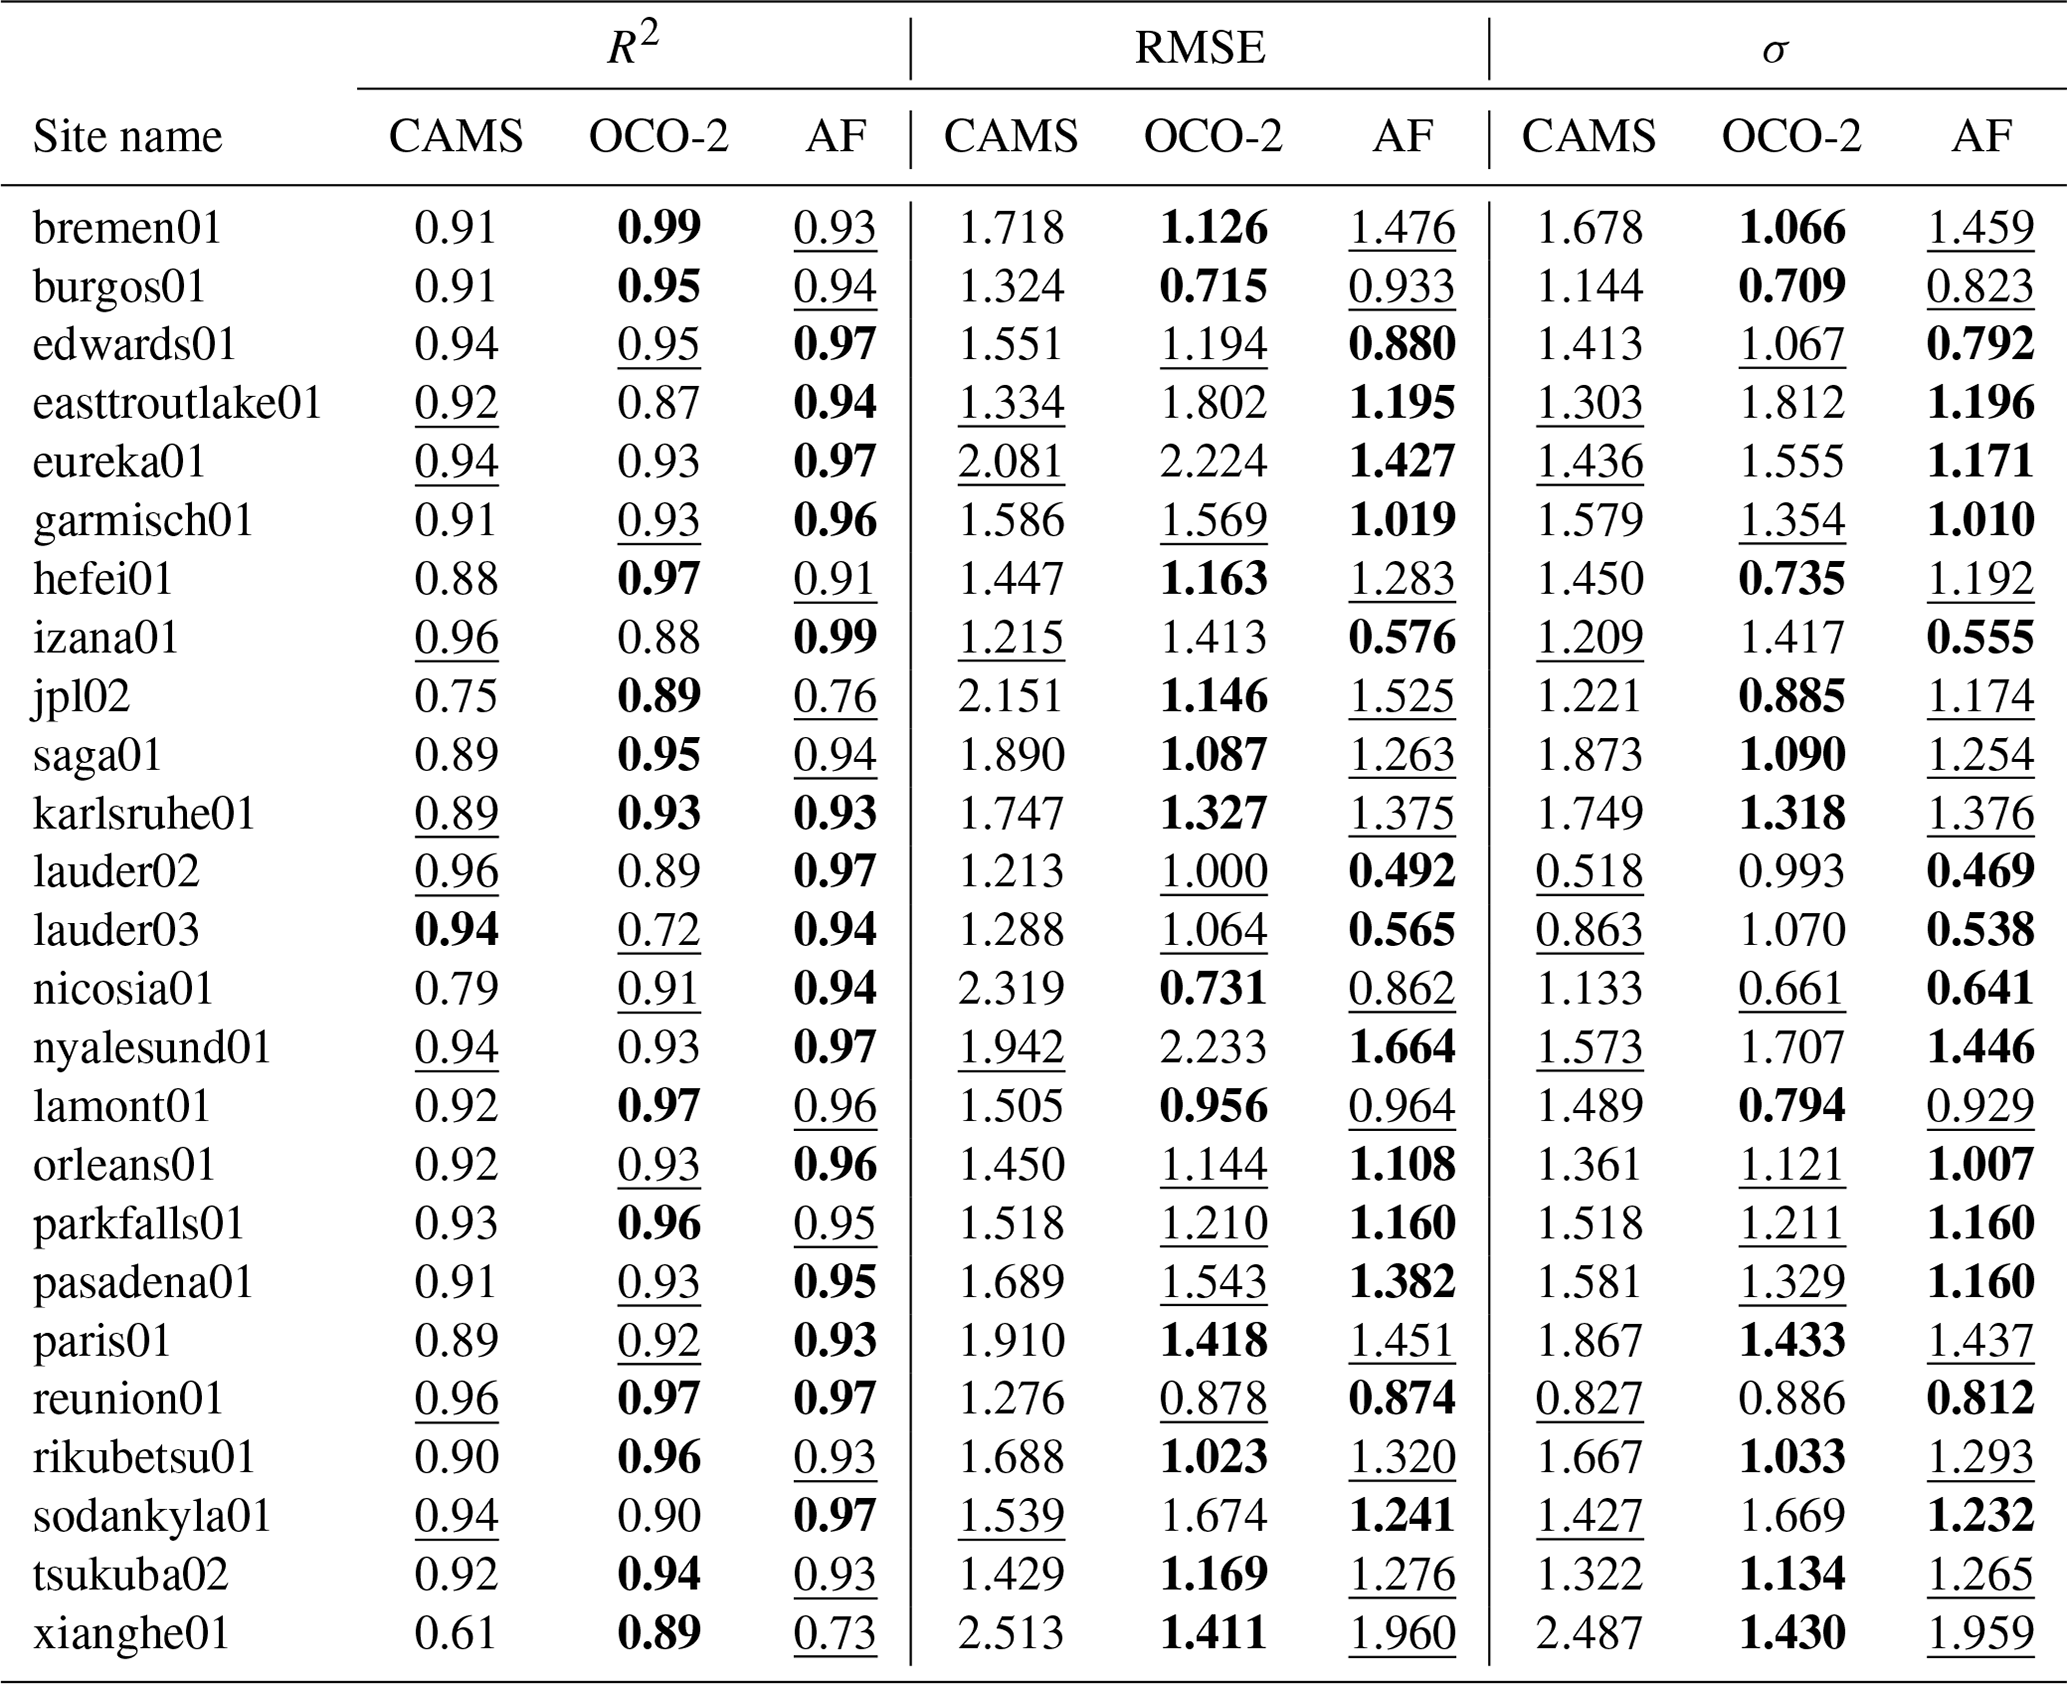
Table 5Metrics of the individual in situ validation results for CAMS-EGG4, GOSAT, and fused XCH4. The best and second metrics are denoted with bold and underlined fonts, respectively. CAMS: CAMS-EGG4; AF: after fusion. Unit: parts per billion for RMSE and σ.
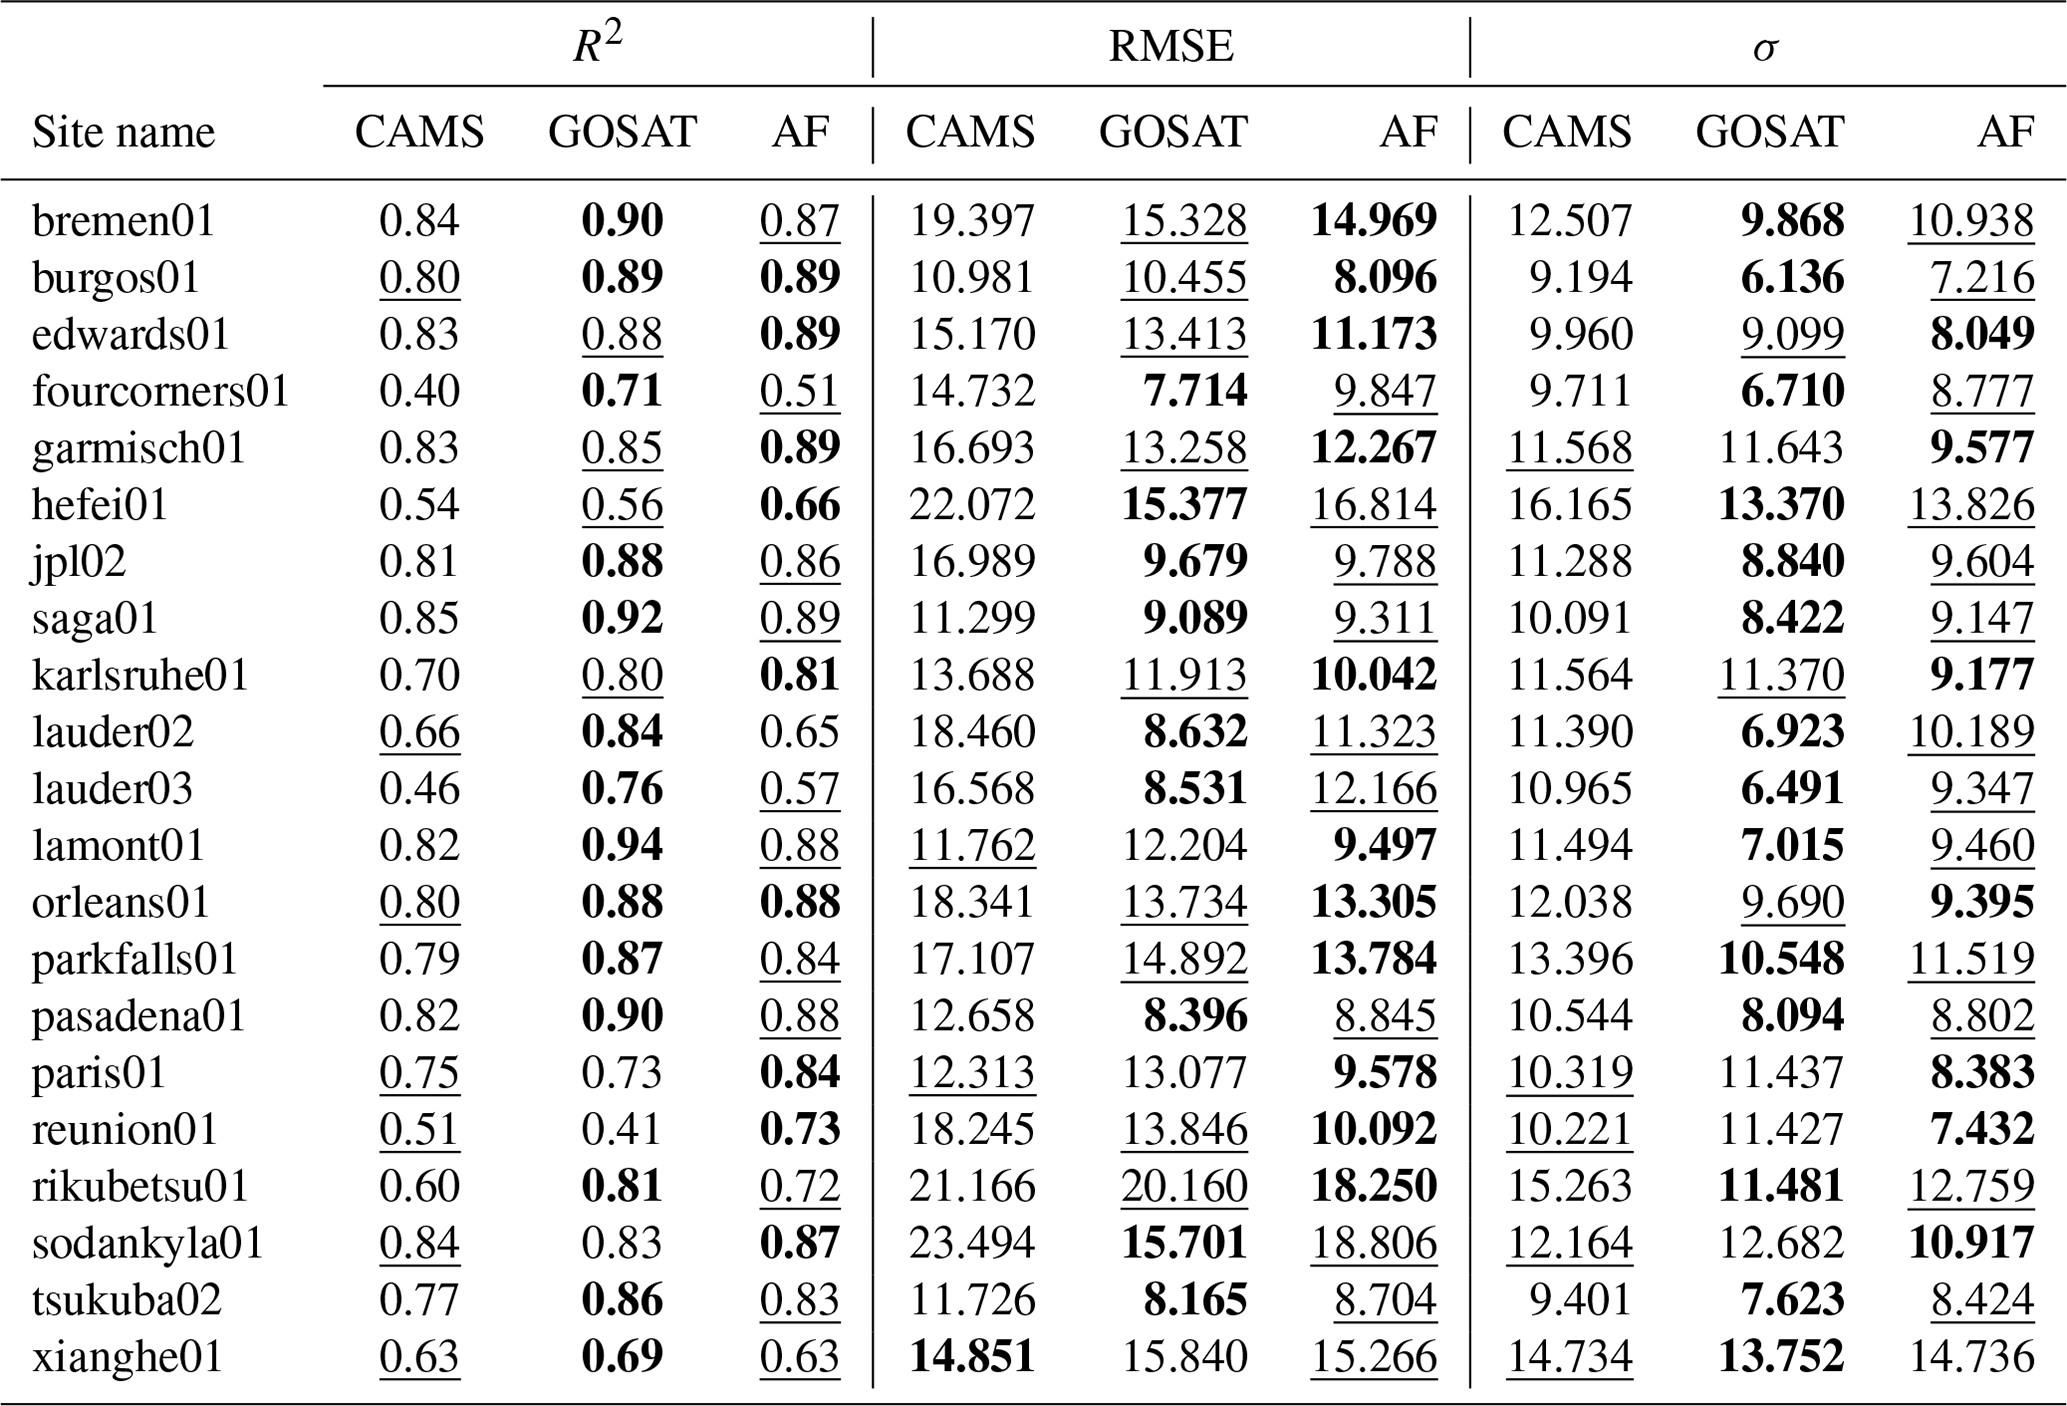
4.2 Individual in situ validation and time series
Figures 4 and 5 and Tables 3–5 show the individual in situ validation results for the CAMS-EGG4, GOSAT, OCO-2, and fused results on each TCCON in situ station. It is worth noting that only the stations where the individual validation results are significant (p level <0.01) for all the datasets (i.e., the CAMS-EGG4, GOSAT, OCO-2, and fused results) are presented. Since the space of this paper is limited, the two stations named edwards01 and sodankyla01 are selected as examples (see Figs. 4 and 5), which are located in North America and Europe, respectively. As can be seen, the fused results achieve the best performance compared to CAMS-EGG4, GOSAT, and OCO-2 on edwards01 and sodankyla01, with the R2 ranging from 0.87 to 0.97. In particular, the large overestimation of XCO2 for CAMS-EGG4 on sodankyla01 (μ=2.071 ppm) is well mitigated after fusion (μ=0.377 ppm), even for the poor data availability of GOSAT (N=11). This indicates the strong universality of the proposed fusion method. The valid individual validation results of all the stations are given in Tables 3–5. It can be observed that the performance of the fused results exceeds those of CAMS-EGG4 and GOSAT and/or OCO-2 for almost all the stations and ∼70 % of the stations, respectively.
Figures 6 and 7 demonstrate the time series for daily CAMS-EGG4, GOSAT, OCO-2, fused, and TCCON data on individual in situ stations. Similarly, two stations, i.e., garmisch01 and lauder02, are regarded as examples located in Europe and Oceania, respectively. As depicted in Fig. 6, the XCO2 from CAMS-EGG4 is markedly overestimated on garmisch01 from 2010 to 2014 and in 2020. After fusion, XCO2 presents an equal trend compared to TCCON measurements over time, with smaller μ (0.096 and 0.139 ppm) and σ (1.067 and 1.01 ppm). Meanwhile, the overestimation of CAMS-EGG4 XCH4 is also mitigated on garmisch01 through our fusion method. Regarding lauder02, Fig. 7 shows that CAMS-EGG4 generates underestimated XCO2 (2015–2019) and overestimated XCH4. The μ and σ of the fused results (e.g., 4.952 and 10.189 ppb for XCH4) are significantly improved on lauder02.
4.3 Uncertainty analyses
Figures 8–10 display the biases between daily CAMS-EGG4, fused, GOSAT, OCO-2, and TCCON data over time and latitude. As observed in Figs. 8 and 9, a large overestimation generally exists in the CAMS-EGG4 XCO2 from 2010 to 2014 and in 2020, especially before 2013 and in 2020 (>3 ppm). This is attributed to the considerable errors in the satellite data assimilated (2010–2014) and anthropogenic emissions not being modified for COVID-19 lockdowns in 2020 (Agusti-Panareda et al., 2023). After fusion, the biases of XCO2 are improved well for most TCCON in situ stations from 2010 to 2014 and in 2020, whose patterns are similar to those of the GOSAT and OCO-2 XCO2, respectively. This indicates that the proposed fusion method can effectively correct the biases in CAMS-EGG4 due to the issues from assimilation data. Meanwhile, CAMS-EGG4 generates distinctly underestimated XCO2 from 2016 to 2019 on the stations of latitude <40∘ N, which is also mitigated by the S-STDCT fusion method (see Fig. 10). Moreover, the CAMS-EGG4 XCH4 frequently presents a large positive bias (>30 ppb), while the fused XCH4 only enhances the performance on the stations of latitude <50∘ N. Improvements for the other stations require our further efforts in the future.
4.4 Assessment of spatial distribution on multi-temporal scales
Figure 11 demonstrates the comparisons of the annual GOSAT, OCO-2, CAMS-EGG4, and fused XCO2 and XCH4 over the globe. Three years are selected, i.e., 2011, 2017, and 2016. As can be seen, the fused results present coincident spatial patterns with GOSAT and OCO-2, even if the annual GOSAT and OCO-2 data are very sparse. In particular, the large overestimation and underestimation of the CAMS-EGG4 XCO2 in 2011 and 2017, respectively, are significantly modified after fusion, which is mutually confirmed with the descriptions in Sect. 4.3.
Figure 12 illustrates the examples of daily fused XCO2 and XCH4 over the globe, consisting of 3 d in 3 years. As shown, the fused results display detailed information on atmospheric CO2 and CH4 that clearly indicates their regional and global spatial patterns. In addition, incoherent or factitious spatial distributions are not observed in the fused XCO2 and XCH4. Figure 13 then provides the corresponding daily XCO2 and XCH4 from GOSAT and OCO-2 over the globe. It is worth noting that the daily satellite XCO2 and XCH4 are mapped via footprints due to their significant sparse coverage and are nearly invisible on grids of 0.25∘. As expected, the fused results present identical spatial distributions compared to the XCO2 and XCH4 from GOSAT and OCO-2. This suggests the robustness and reliability of the proposed fusion method.
Figure 14 depicts the multi-year mean fused global XCO2 and XCH4 from 2010 to 2020. Generally, the spatial patterns of XCO2 and XCH4 are divided by the Equator. The high values of XCO2 and XCH4 are mainly distributed over Asia, e.g., China and India, which is attributed to large anthropogenic emissions (Kenea et al., 2023; Liu et al., 2020; Turner et al., 2015; Hotchkiss et al., 2015). In the meantime, considerable natural emissions, e.g., wildfires (Arora and Melton, 2018), can also obviously increase the XCO2 values, such as in central Africa and northern South America. Figures 15 and 16 illustrate the seasonal fused XCO2 and XCH4, respectively, from 2010 to 2020 over the globe. As shown, seasonal changes in global XCO2 and XCH4 spatial patterns are clearly reflected in the fused results. Compared to XCH4, the global spatial patterns of XCO2 vary more drastically. This is likely driven by the spatiotemporal heterogeneity of meteorological fields (Liu et al., 2011) and different emission sources of CO2 and CH4.
Figures 17 and 18 map the annual fused global XCO2 and XCH4 from 2010 to 2020, respectively, including their trends. As observed in Fig. 17, the CO2 levels continuously increase from 2010 to 2020, with the mean XCO2 values ranging from ≤386 to ≥416 ppm. However, the trends of XCO2 only present small spatial differences (∼0.2 ppm yr−1), of which the large growth rates are primarily distributed along the Equator, especially for China (≥2.5 ppm yr−1). It is worth noting that the growth rates of XCO2 are relatively slight (≤2.3 ppm yr−1) in northern South America compared to the other regions. This is likely caused by the effects from the carbon sequestration of forests (Chazdon et al., 2016). In addition, the XCH4 values also notably rise from 2010 to 2020, of which the maximum is not less than 2008 ppb in 2020 (see Fig. 18). The large growth rates of XCH4 are mostly discovered over southern Asia and northern Europe.
The fused results can be freely accessed at https://doi.org/10.5281/zenodo.7388893 (Wang et al., 2022a). The daily global seamless gridded (0.25∘) XCO2 and XCH4 from 2010 to 2020 are stored in netCDF4 format with a file size of ∼3.5 MB for each day. The units of XCO2 and XCH4 are parts per million and parts per billion, respectively.
In our study, a novel spatiotemporally self-supervised fusion method, i.e., S-STDCT, is proposed to acquire long-term daily seamless globally distributed XCO2 and XCH4 products from 2010 to 2020 on grids of 0.25∘. A total of three datasets are adopted, i.e., GOSAT, OCO-2, and CAMS-EGG4. Since the data from GOSAT and OCO-2 are very sparse in the space–time domain, the algorithm for the frequency domain (the STDCT) is applied in the fusion task. Validation results show that the S-STDCT fusion method performs well over the globe, with σ values of ∼1.18 ppm for XCO2 and 11.3 ppb for XCH4 against TCCON measurements during 2010–2020. Meanwhile, the R2 of the fused XCO2 and XCH4 reach 0.91 or 0.95 (2010–2014 or 2015–2020) and 0.9 (2010–2020), respectively. Generally, the accuracy of fused results is distinctly superior to that of CAMS-EGG4 and also exceeds or equals those of GOSAT and OCO-2. In particular, the proposed fusion method effectively modifies the large biases in CAMS-EGG4 caused by the issues from assimilation data, such as the uncorrected anthropogenic emission inventories for COVID-19 lockdowns in 2020. In addition, the spatial patterns of fused results remain coincident with GOSAT and OCO-2, which can accurately display the long-term and seasonal changes in global XCO2 and XCH4 spatial distributions. The long-term (2010–2020) daily global seamless gridded (0.25∘) fused results are available at https://doi.org/10.5281/zenodo.7388893 (Wang et al., 2022a).
Overall, the developed fusion method generates high-quality full-coverage XCO2 and XCH4 datasets over the globe from 2010 to 2020. However, it only considers the global spatiotemporal knowledge of self-correlation in the GOSAT and OCO-2 products, without attention to local spatiotemporal information. Meanwhile, the spatial resolution and available period of fused results should be further enhanced and are devised as 0.1∘ and more than 20 years (e.g., 2000–2020), respectively. To fix these issues, we will spare no effort to work on our future studies.
YW designed the study, collected and processed the data, analyzed the results, and wrote the paper. QY and TL provided constructive comments on the paper. YY, SZ, and LZ revised the paper. All the authors contributed to the study.
The contact author has declared that none of the authors has any competing interests.
Publisher’s note: Copernicus Publications remains neutral with regard to jurisdictional claims in published maps and institutional affiliations.
The authors would like to express their gratitude to the Goddard Earth Science Data and Information Services Center for providing the GOSAT and OCO-2 XCO2 products (https://disc.gsfc.nasa.gov., last access: 20 November 2022 and 27 November 2022), the Centre for Environmental Data Analysis for providing the GOSAT XCH4 product (https://data.ceda.ac.uk, last access: 18 November 2022), the Copernicus Climate Data Store for providing the CAMS-EGG4 XCO2 and XCH4 products (https://ads.atmosphere.copernicus.eu, last access: 25 November 2022), and the Total Carbon Column Observing Network (hosted by CaltechDATA at https://tccondata.org, last access: 18 November 2022; chair: Debra Wunch) for establishing and maintaining the in situ stations.
Our work is supported by the National Key R&D Program of China (grant no. 2022YFB3903403) and the Basic and Applied Basic Research Foundation of Guangdong Province (grant no. 2021A1515110567).
This paper was edited by Yuqiang Zhang and reviewed by two anonymous referees.
Agustí-Panareda, A., Barré, J., Massart, S., Inness, A., Aben, I., Ades, M., Baier, B. C., Balsamo, G., Borsdorff, T., Bousserez, N., Boussetta, S., Buchwitz, M., Cantarello, L., Crevoisier, C., Engelen, R., Eskes, H., Flemming, J., Garrigues, S., Hasekamp, O., Huijnen, V., Jones, L., Kipling, Z., Langerock, B., McNorton, J., Meilhac, N., Noël, S., Parrington, M., Peuch, V.-H., Ramonet, M., Razinger, M., Reuter, M., Ribas, R., Suttie, M., Sweeney, C., Tarniewicz, J., and Wu, L.: Technical note: The CAMS greenhouse gas reanalysis from 2003 to 2020, Atmos. Chem. Phys., 23, 3829–3859, https://doi.org/10.5194/acp-23-3829-2023, 2023.
Arora, V. K. and Melton, J. R.: Reduction in global area burned and wildfire emissions since 1930s enhances carbon uptake by land, Nat. Commun., 9, 1326, https://doi.org/10.1038/s41467-018-03838-0, 2018.
August, T., Klaes, D., Schlüssel, P., Hultberg, T., Crapeau, M., Arriaga, A., O'Carroll, A., Coppens, D., Munro, R., and Calbet, X.: IASI on Metop-A: Operational Level 2 retrievals after five years in orbit, J. Quant. Spectrosc. Ra., 113, 1340–1371, https://doi.org/10.1016/j.jqsrt.2012.02.028, 2012.
Battin, T. J., Luyssaert, S., Kaplan, L. A., Aufdenkampe, A. K., Richter, A., and Tranvik, L. J.: The boundless carbon cycle, Nat. Geosci., 2, 598–600, https://doi.org/10.1038/ngeo618, 2009.
Beirle, S., Lampel, J., Wang, Y., Mies, K., Dörner, S., Grossi, M., Loyola, D., Dehn, A., Danielczok, A., Schröder, M., and Wagner, T.: The ESA GOME-Evolution “Climate” water vapor product: a homogenized time series of H2O columns from GOME, SCIAMACHY, and GOME-2, Earth Syst. Sci. Data, 10, 449–468, https://doi.org/10.5194/essd-10-449-2018, 2018.
Bergamaschi, P., Houweling, S., Segers, A., Krol, M., Frankenberg, C., Scheepmaker, R. A., Dlugokencky, E., Wofsy, S. C., Kort, E. A., Sweeney, C., Schuck, T., Brenninkmeijer, C., Chen, H., Beck, V., and Gerbig, C.: Atmospheric CH4 in the first decade of the 21st century: Inverse modeling analysis using SCIAMACHY satellite retrievals and NOAA surface measurements, J. Geophys. Res.-Atmos., 118, 7350–7369, https://doi.org/10.1002/jgrd.50480, 2013.
Bhattacharjee, S., Mitra, P., and Ghosh, S. K.: Spatial Interpolation to Predict Missing Attributes in GIS Using Semantic Kriging, IEEE T. Geosci. Remote, 52, 4771–4780, https://doi.org/10.1109/TGRS.2013.2284489, 2014.
Buchwitz, M., Reuter, M., Schneising, O., Boesch, H., Guerlet, S., Dils, B., Aben, I., Armante, R., Bergamaschi, P., Blumenstock, T., Bovensmann, H., Brunner, D., Buchmann, B., Burrows, J. P., Butz, A., Chédin, A., Chevallier, F., Crevoisier, C. D., Deutscher, N. M., Frankenberg, C., Hase, F., Hasekamp, O. P., Heymann, J., Kaminski, T., Laeng, A., Lichtenberg, G., De Mazière, M., Noël, S., Notholt, J., Orphal, J., Popp, C., Parker, R., Scholze, M., Sussmann, R., Stiller, G. P., Warneke, T., Zehner, C., Bril, A., Crisp, D., Griffith, D. W. T., Kuze, A., O'Dell, C., Oshchepkov, S., Sherlock, V., Suto, H., Wennberg, P., Wunch, D., Yokota, T., and Yoshida, Y.: The Greenhouse Gas Climate Change Initiative (GHG-CCI): Comparison and quality assessment of near-surface-sensitive satellite-derived CO2 and CH4 global data sets, Remote Sens. Environ., 162, 344–362, https://doi.org/10.1016/j.rse.2013.04.024, 2015.
Burrows, J. P., Hölzle, E., Goede, A. P. H., Visser, H., and Fricke, W.: SCIAMACHY–scanning imaging absorption spectrometer for atmospheric chartography, Acta Astronaut., 35, 445–451, https://doi.org/10.1016/0094-5765(94)00278-T, 1995.
Chazdon, R. L., Broadbent, E. N., Rozendaal, D. M. A., Bongers, F., Zambrano, A. M. A., Aide, T. M., Balvanera, P., Becknell, J. M., Boukili, V., Brancalion, P. H. S., Craven, D., Almeida-Cortez, J. S., Cabral, G. A. L., de Jong, B., Denslow, J. S., Dent, D. H., DeWalt, S. J., Dupuy, J. M., Durán, S. M., Espírito-Santo, M. M., Fandino, M. C., César, R. G., Hall, J. S., Hernández-Stefanoni, J. L., Jakovac, C. C., Junqueira, A. B., Kennard, D., Letcher, S. G., Lohbeck, M., Martínez-Ramos, M., Massoca, P., Meave, J. A., Mesquita, R., Mora, F., Muñoz, R., Muscarella, R., Nunes, Y. R. F., Ochoa-Gaona, S., Orihuela-Belmonte, E., Peña-Claros, M., Pérez-García, E. A., Piotto, D., Powers, J. S., Rodríguez-Velazquez, J., Romero-Pérez, I. E., Ruíz, J., Saldarriaga, J. G., Sanchez-Azofeifa, A., Schwartz, N. B., Steininger, M. K., Swenson, N. G., Uriarte, M., van Breugel, M., van der Wal, H., Veloso, M. D. M., Vester, H., Vieira, I. C. G., Bentos, T. V., Williamson, G. B., and Poorter, L.: Carbon sequestration potential of second-growth forest regeneration in the Latin American tropics, Sci. Adv., 2, e1501639, https://doi.org/10.1126/sciadv.1501639, 2016.
Chen, H., Xu, X., Fang, C., Li, B., and Nie, M.: Differences in the temperature dependence of wetland CO2 and CH4 emissions vary with water table depth, Nat. Clim. Change, 11, 766–771, https://doi.org/10.1038/s41558-021-01108-4, 2021.
Choulga, M., Janssens-Maenhout, G., Super, I., Solazzo, E., Agusti-Panareda, A., Balsamo, G., Bousserez, N., Crippa, M., Denier van der Gon, H., Engelen, R., Guizzardi, D., Kuenen, J., McNorton, J., Oreggioni, G., and Visschedijk, A.: Global anthropogenic CO2 emissions and uncertainties as a prior for Earth system modelling and data assimilation, Earth Syst. Sci. Data, 13, 5311–5335, https://doi.org/10.5194/essd-13-5311-2021, 2021.
Cintra, R. J. and Bayer, F. M.: A DCT Approximation for Image Compression, IEEE Signal Proc. Let., 18, 579–582, https://doi.org/10.1109/LSP.2011.2163394, 2011.
Crisp, D., Pollock, H. R., Rosenberg, R., Chapsky, L., Lee, R. A. M., Oyafuso, F. A., Frankenberg, C., O'Dell, C. W., Bruegge, C. J., Doran, G. B., Eldering, A., Fisher, B. M., Fu, D., Gunson, M. R., Mandrake, L., Osterman, G. B., Schwandner, F. M., Sun, K., Taylor, T. E., Wennberg, P. O., and Wunch, D.: The on-orbit performance of the Orbiting Carbon Observatory-2 (OCO-2) instrument and its radiometrically calibrated products, Atmos. Meas. Tech., 10, 59–81, https://doi.org/10.5194/amt-10-59-2017, 2017.
Crosswell, J. R., Anderson, I. C., Stanhope, J. W., Van Dam, B., Brush, M. J., Ensign, S., Piehler, M. F., McKee, B., Bost, M., and Paerl, H. W.: Carbon budget of a shallow, lagoonal estuary: Transformations and source-sink dynamics along the river-estuary-ocean continuum, Limnol. Oceanogr., 62, S29–S45, https://doi.org/10.1002/lno.10631, 2017.
Deng, F., Jones, D. B. A., Henze, D. K., Bousserez, N., Bowman, K. W., Fisher, J. B., Nassar, R., O'Dell, C., Wunch, D., Wennberg, P. O., Kort, E. A., Wofsy, S. C., Blumenstock, T., Deutscher, N. M., Griffith, D. W. T., Hase, F., Heikkinen, P., Sherlock, V., Strong, K., Sussmann, R., and Warneke, T.: Inferring regional sources and sinks of atmospheric CO2 from GOSAT XCO2 data, Atmos. Chem. Phys., 14, 3703–3727, https://doi.org/10.5194/acp-14-3703-2014, 2014.
Doughty, R., Kurosu, T. P., Parazoo, N., Köhler, P., Wang, Y., Sun, Y., and Frankenberg, C.: Global GOSAT, OCO-2, and OCO-3 solar-induced chlorophyll fluorescence datasets, Earth Syst. Sci. Data, 14, 1513–1529, https://doi.org/10.5194/essd-14-1513-2022, 2022.
El-Mahallawy, M. S. and Hashim, M.: Material Classification of Underground Utilities From GPR Images Using DCT-Based SVM Approach, IEEE Geosci. Remote S., 10, 1542–1546, https://doi.org/10.1109/LGRS.2013.2261796, 2013.
Fraser, A., Palmer, P. I., Feng, L., Boesch, H., Cogan, A., Parker, R., Dlugokencky, E. J., Fraser, P. J., Krummel, P. B., Langenfelds, R. L., O'Doherty, S., Prinn, R. G., Steele, L. P., van der Schoot, M., and Weiss, R. F.: Estimating regional methane surface fluxes: the relative importance of surface and GOSAT mole fraction measurements, Atmos. Chem. Phys., 13, 5697–5713, https://doi.org/10.5194/acp-13-5697-2013, 2013.
Fredj, E., Roarty, H., Kohut, J., Smith, M., and Glenn, S.: Gap Filling of the Coastal Ocean Surface Currents from HFR Data: Application to the Mid-Atlantic Bight HFR Network, J. Atmos. Ocean. Tech., 33, 1097–1111, https://doi.org/10.1175/JTECH-D-15-0056.1, 2016.
Garcia, D.: Robust smoothing of gridded data in one and higher dimensions with missing values, Comput. Stat. Data An., 54, 1167–1178, https://doi.org/10.1016/j.csda.2009.09.020, 2010.
Hakkarainen, J., Ialongo, I., and Tamminen, J.: Direct space-based observations of anthropogenic CO2 emission areas from OCO-2, Geophys. Rese. Lett., 43, 11400–11406, https://doi.org/10.1002/2016GL070885, 2016.
Hamazaki, T., Kaneko, Y., Kuze, A., and Kondo, K.: Fourier transform spectrometer for Greenhouse Gases Observing Satellite (GOSAT), Enabling Sensor and Platform Technologies for Spaceborne Remote Sensing, 73–80, https://doi.org/10.1117/12.581198, 2005.
He, C., Ji, M., Grieneisen, M. L., and Zhan, Y.: A review of datasets and methods for deriving spatiotemporal distributions of atmospheric CO2, J. Environ. Manage., 322, 116101, https://doi.org/10.1016/j.jenvman.2022.116101, 2022a.
He, C., Ji, M., Li, T., Liu, X., Tang, D., Zhang, S., Luo, Y., Grieneisen, M. L., Zhou, Z., and Zhan, Y.: Deriving Full-Coverage and Fine-Scale XCO2 Across China Based on OCO-2 Satellite Retrievals and CarbonTracker Output, Geophys. Res. Lett., 49, e2022GL098435, https://doi.org/10.1029/2022GL098435, 2022b.
He, J., Yuan, Q., Li, J., and Zhang, L.: PoNet: A universal physical optimization-based spectral super-resolution network for arbitrary multispectral images, Inform. Fusion, 80, 205–225, https://doi.org/10.1016/j.inffus.2021.10.016, 2022.
He, J., Yuan, Q., Li, J., Xiao, Y., Liu, D., Shen, H., and Zhang, L.: Spectral super-resolution meets deep learning: achievements and challenges, Inform. Fusion, 97, 101812, https://doi.org/10.1016/j.inffus.2023.101812, 2023.
He, Z., Lei, L., Zhang, Y., Sheng, M., Wu, C., Li, L., Zeng, Z.-C., and Welp, L. R.: Spatio-Temporal Mapping of Multi-Satellite Observed Column Atmospheric CO2 Using Precision-Weighted Kriging Method, Remote Sensing, 12, 576, https://doi.org/10.3390/rs12030576, 2020.
Hong, X., Zhang, P., Bi, Y., Liu, C., Sun, Y., Wang, W., Chen, Z., Yin, H., Zhang, C., Tian, Y., and Liu, J.: Retrieval of Global Carbon Dioxide From TanSat Satellite and Comprehensive Validation With TCCON Measurements and Satellite Observations, IEEE T. Geosci. Remote, 60, 1–16, https://doi.org/10.1109/TGRS.2021.3066623, 2022.
Hotchkiss, E. R., Hall Jr, R. O., Sponseller, R. A., Butman, D., Klaminder, J., Laudon, H., Rosvall, M., and Karlsson, J.: Sources of and processes controlling CO2 emissions change with the size of streams and rivers, Nat. Geosci., 8, 696–699, https://doi.org/10.1038/ngeo2507, 2015.
Houweling, S., Baker, D., Basu, S., Boesch, H., Butz, A., Chevallier, F., Deng, F., Dlugokencky, E. J., Feng, L., Ganshin, A., Hasekamp, O., Jones, D., Maksyutov, S., Marshall, J., Oda, T., O'Dell, C. W., Oshchepkov, S., Palmer, P. I., Peylin, P., Poussi, Z., Reum, F., Takagi, H., Yoshida, Y., and Zhuravlev, R.: An intercomparison of inverse models for estimating sources and sinks of CO2 using GOSAT measurements, J. Geophys. Res.-Atmos., 120, 5253–5266, https://doi.org/10.1002/2014JD022962, 2015.
Jiang, F., Ju, W., He, W., Wu, M., Wang, H., Wang, J., Jia, M., Feng, S., Zhang, L., and Chen, J. M.: A 10-year global monthly averaged terrestrial net ecosystem exchange dataset inferred from the ACOS GOSAT v9 XCO2 retrievals (GCAS2021), Earth Syst. Sci. Data, 14, 3013–3037, https://doi.org/10.5194/essd-14-3013-2022, 2022.
Katzfuss, M. and Cressie, N.: Tutorial on fixed rank kriging (FRK) of CO2 data, Department of Statistics, The Ohio State University, Columbus, https://documents.uow.edu.au/content/groups/public/@web/@inf/@math/documents/mm/uow175999.pdf (last access: 23 November 2022), 2011.
Kenea, S. T., Lee, H., Patra, P. K., Li, S., Labzovskii, L. D., and Joo, S.: Long-term changes in CH4 emissions: Comparing ÄCH4/ÄCO2 ratios between observation and proved model in East Asia (2010–2020), Atmos. Environ., 293, 119437, https://doi.org/10.1016/j.atmosenv.2022.119437, 2023.
Kiel, M., O'Dell, C. W., Fisher, B., Eldering, A., Nassar, R., MacDonald, C. G., and Wennberg, P. O.: How bias correction goes wrong: measurement of X affected by erroneous surface pressure estimates, Atmos. Meas. Tech., 12, 2241–2259, https://doi.org/10.5194/amt-12-2241-2019, 2019.
Laughner, J. L., Roche, S., Kiel, M., Toon, G. C., Wunch, D., Baier, B. C., Biraud, S., Chen, H., Kivi, R., Laemmel, T., McKain, K., Quéhé, P.-Y., Rousogenous, C., Stephens, B. B., Walker, K., and Wennberg, P. O.: A new algorithm to generate a priori trace gas profiles for the GGG2020 retrieval algorithm, Atmos. Meas. Tech., 16, 1121–1146, https://doi.org/10.5194/amt-16-1121-2023, 2023.
Le Quéré, C., Korsbakken, J. I., Wilson, C., Tosun, J., Andrew, R., Andres, R. J., Canadell, J. G., Jordan, A., Peters, G. P., and van Vuuren, D. P.: Drivers of declining CO2 emissions in 18 developed economies, Nat. Clim. Change, 9, 213–217, https://doi.org/10.1038/s41558-019-0419-7, 2019.
Li, L., Lei, L., Song, H., Zeng, Z., and He, Z.: Spatiotemporal Geostatistical Analysis and Global Mapping of CH4 Columns from GOSAT Observations, Remote Sensing, 14, 654, https://doi.org/10.3390/rs14030654, 2022.
Lin, X., Zhang, W., Crippa, M., Peng, S., Han, P., Zeng, N., Yu, L., and Wang, G.: A comparative study of anthropogenic CH4 emissions over China based on the ensembles of bottom-up inventories, Earth Syst. Sci. Data, 13, 1073–1088, https://doi.org/10.5194/essd-13-1073-2021, 2021.
Liu, J., Fung, I., Kalnay, E., and Kang, J.-S.: CO2 transport uncertainties from the uncertainties in meteorological fields, Geophys. Res. Lett., 38, L12808, https://doi.org/10.1029/2011GL047213, 2011.
Liu, L. and Greaver, T. L.: A review of nitrogen enrichment effects on three biogenic GHGs: the CO2 sink may be largely offset by stimulated N2O and CH4 emission, Ecol. Lett., 12, 1103–1117, https://doi.org/10.1111/j.1461-0248.2009.01351.x, 2009.
Liu, Y., Wang, J., Yao, L., Chen, X., Cai, Z., Yang, D., Yin, Z., Gu, S., Tian, L., Lu, N., and Lyu, D.: The TanSat mission: preliminary global observations, Sci. Bull., 63, 1200–1207, https://doi.org/10.1016/j.scib.2018.08.004, 2018.
Liu, Z., Liu, Z., Song, T., Gao, W., Wang, Y., Wang, L., Hu, B., Xin, J., and Wang, Y.: Long-term variation in CO2 emissions with implications for the interannual trend in PM2.5 over the last decade in Beijing, China, Environ. Pollut., 266, 115014, https://doi.org/10.1016/j.envpol.2020.115014, 2020.
Meinshausen, M., Meinshausen, N., Hare, W., Raper, S. C. B., Frieler, K., Knutti, R., Frame, D. J., and Allen, M. R.: Greenhouse-gas emission targets for limiting global warming to 2 ∘ C, Nature, 458, 1158–1162, https://doi.org/10.1038/nature08017, 2009.
Montzka, S. A., Dlugokencky, E. J., and Butler, J. H.: Non-CO2 greenhouse gases and climate change, Nature, 476, 43–50, https://doi.org/10.1038/nature10322, 2011.
Moran, D., Pichler, P.-P., Zheng, H., Muri, H., Klenner, J., Kramel, D., Többen, J., Weisz, H., Wiedmann, T., Wyckmans, A., Strømman, A. H., and Gurney, K. R.: Estimating CO2 emissions for 108 000 European cities, Earth Syst. Sci. Data, 14, 845–864, https://doi.org/10.5194/essd-14-845-2022, 2022.
Mueller, T. G., Pusuluri, N. B., Mathias, K. K., Cornelius, P. L., Barnhisel, R. I., and Shearer, S. A.: Map quality for ordinary kriging and inverse distance weighted interpolation, Soil Sci. Soc. Am. J., 68, 2042–2047, 2004.
Parker, R. J., Webb, A., Boesch, H., Somkuti, P., Barrio Guillo, R., Di Noia, A., Kalaitzi, N., Anand, J. S., Bergamaschi, P., Chevallier, F., Palmer, P. I., Feng, L., Deutscher, N. M., Feist, D. G., Griffith, D. W. T., Hase, F., Kivi, R., Morino, I., Notholt, J., Oh, Y.-S., Ohyama, H., Petri, C., Pollard, D. F., Roehl, C., Sha, M. K., Shiomi, K., Strong, K., Sussmann, R., Té, Y., Velazco, V. A., Warneke, T., Wennberg, P. O., and Wunch, D.: A decade of GOSAT Proxy satellite CH4 observations, Earth Syst. Sci. Data, 12, 3383–3412, https://doi.org/10.5194/essd-12-3383-2020, 2020.
Petrescu, A. M. R., Qiu, C., Ciais, P., Thompson, R. L., Peylin, P., McGrath, M. J., Solazzo, E., Janssens-Maenhout, G., Tubiello, F. N., Bergamaschi, P., Brunner, D., Peters, G. P., Höglund-Isaksson, L., Regnier, P., Lauerwald, R., Bastviken, D., Tsuruta, A., Winiwarter, W., Patra, P. K., Kuhnert, M., Oreggioni, G. D., Crippa, M., Saunois, M., Perugini, L., Markkanen, T., Aalto, T., Groot Zwaaftink, C. D., Tian, H., Yao, Y., Wilson, C., Conchedda, G., Günther, D., Leip, A., Smith, P., Haussaire, J.-M., Leppänen, A., Manning, A. J., McNorton, J., Brockmann, P., and Dolman, A. J.: The consolidated European synthesis of CH4 and N2O emissions for the European Union and United Kingdom: 1990–2017, Earth Syst. Sci. Data, 13, 2307–2362, https://doi.org/10.5194/essd-13-2307-2021, 2021.
Pham, H. T., Kim, S., Marshall, L., and Johnson, F.: Using 3D robust smoothing to fill land surface temperature gaps at the continental scale, Int. J. Appl. Earth Obs., 82, 101879, https://doi.org/10.1016/j.jag.2019.05.012, 2019.
Rao, K. R. and Yip, P.: Discrete Cosine Transform: Algorithms, Advantages, Applications, Academic Press, 517 pp., https://books.google.com.sg/books?id=fWviBQAAQBAJ (last access: 23 November 2022), 2014.
Reithmaier, G. M. S., Chen, X., Santos, I. R., Drexl, M. J., Holloway, C., Call, M., Álvarez, P. G., Euler, S., and Maher, D. T.: Rainfall drives rapid shifts in carbon and nutrient source-sink dynamics of an urbanised, mangrove-fringed estuary, Estuarine, Coast. Shelf Sci., 249, 107064, https://doi.org/10.1016/j.ecss.2020.107064, 2021.
Shine, K. P., Fuglestvedt, J. S., Hailemariam, K., and Stuber, N.: Alternatives to the Global Warming Potential for Comparing Climate Impacts of Emissions of Greenhouse Gases, Climatic Change, 68, 281–302, https://doi.org/10.1007/s10584-005-1146-9, 2005.
Siabi, Z., Falahatkar, S., and Alavi, S. J.: Spatial distribution of XCO2 using OCO-2 data in growing seasons, J. Environ. Manage., 244, 110–118, https://doi.org/10.1016/j.jenvman.2019.05.049, 2019.
Sjögersten, S., Black, C. R., Evers, S., Hoyos-Santillan, J., Wright, E. L., and Turner, B. L.: Tropical wetlands: A missing link in the global carbon cycle?, Global Biogeochem. Cy., 28, 1371–1386, https://doi.org/10.1002/2014GB004844, 2014.
Solomon, S., Daniel, J. S., Sanford, T. J., Murphy, D. M., Plattner, G.-K., Knutti, R., and Friedlingstein, P.: Persistence of climate changes due to a range of greenhouse gases, P. Natl. Acad. Sci. USA, 107, 18354–18359, https://doi.org/10.1073/pnas.1006282107, 2010.
Taylor, T. E., O'Dell, C. W., Frankenberg, C., Partain, P. T., Cronk, H. Q., Savtchenko, A., Nelson, R. R., Rosenthal, E. J., Chang, A. Y., Fisher, B., Osterman, G. B., Pollock, R. H., Crisp, D., Eldering, A., and Gunson, M. R.: Orbiting Carbon Observatory-2 (OCO-2) cloud screening algorithms: validation against collocated MODIS and CALIOP data, Atmos. Meas. Tech., 9, 973–989, https://doi.org/10.5194/amt-9-973-2016, 2016.
Taylor, T. E., O'Dell, C. W., Crisp, D., Kuze, A., Lindqvist, H., Wennberg, P. O., Chatterjee, A., Gunson, M., Eldering, A., Fisher, B., Kiel, M., Nelson, R. R., Merrelli, A., Osterman, G., Chevallier, F., Palmer, P. I., Feng, L., Deutscher, N. M., Dubey, M. K., Feist, D. G., García, O. E., Griffith, D. W. T., Hase, F., Iraci, L. T., Kivi, R., Liu, C., De Mazière, M., Morino, I., Notholt, J., Oh, Y.-S., Ohyama, H., Pollard, D. F., Rettinger, M., Schneider, M., Roehl, C. M., Sha, M. K., Shiomi, K., Strong, K., Sussmann, R., Té, Y., Velazco, V. A., Vrekoussis, M., Warneke, T., and Wunch, D.: An 11-year record of XCO2 estimates derived from GOSAT measurements using the NASA ACOS version 9 retrieval algorithm, Earth Syst. Sci. Data, 14, 325–360, https://doi.org/10.5194/essd-14-325-2022, 2022.
Turner, A. J., Jacob, D. J., Wecht, K. J., Maasakkers, J. D., Lundgren, E., Andrews, A. E., Biraud, S. C., Boesch, H., Bowman, K. W., Deutscher, N. M., Dubey, M. K., Griffith, D. W. T., Hase, F., Kuze, A., Notholt, J., Ohyama, H., Parker, R., Payne, V. H., Sussmann, R., Sweeney, C., Velazco, V. A., Warneke, T., Wennberg, P. O., and Wunch, D.: Estimating global and North American methane emissions with high spatial resolution using GOSAT satellite data, Atmos. Chem. Phys., 15, 7049–7069, https://doi.org/10.5194/acp-15-7049-2015, 2015.
Velazco, V. A., Deutscher, N. M., Morino, I., Uchino, O., Bukosa, B., Ajiro, M., Kamei, A., Jones, N. B., Paton-Walsh, C., and Griffith, D. W. T.: Satellite and ground-based measurements of XCO2 in a remote semiarid region of Australia, Earth Syst. Sci. Data, 11, 935–946, https://doi.org/10.5194/essd-11-935-2019, 2019.
Wang, G., Garcia, D., Liu, Y., de Jeu, R., and Johannes Dolman, A.: A three-dimensional gap filling method for large geophysical datasets: Application to global satellite soil moisture observations, Environ. Modell. Softw., 30, 139–142, https://doi.org/10.1016/j.envsoft.2011.10.015, 2012.
Wang, H., Jiang, F., Wang, J., Ju, W., and Chen, J. M.: Terrestrial ecosystem carbon flux estimated using GOSAT and OCO-2 XCO2 retrievals, Atmos. Chem. Phys., 19, 12067–12082, https://doi.org/10.5194/acp-19-12067-2019, 2019.
Wang, T., Yu, P., Wu, Z., Lu, W., Liu, X., Li, Q. P., and Huang, B.: Revisiting the Intraseasonal Variability of Chlorophyll-a in the Adjacent Luzon Strait With a New Gap-Filled Remote Sensing Data Set, IEEE T. Geosci. Remote, 60, 1–11, https://doi.org/10.1109/TGRS.2021.3067646, 2022.
Wang, Y., Yuan, Q., Li, T., Zhu, L., and Zhang, L.: Estimating daily full-coverage near surface O3, CO, and NO2 concentrations at a high spatial resolution over China based on S5P-TROPOMI and GEOS-FP, ISPRS J. Photogramm., 175, 311–325, 2021.
Wang, Y., Yuan, Q., Li, T., and Zhang, L.: Global long-term (2010–2020) daily seamless fused XCO2 and XCH4 from CAMS, OCO-2, and GOSAT, Zenodo [data set], https://doi.org/10.5281/zenodo.7388893, 2022a.
Wang, Y., Yuan, Q., Li, T., and Zhu, L.: Global spatiotemporal estimation of daily high-resolution surface carbon monoxide concentrations using Deep Forest, J. Clean. Prod., 350, 131500, https://doi.org/10.1016/j.jclepro.2022.131500, 2022b.
Wu, L., Hasekamp, O., Hu, H., Landgraf, J., Butz, A., aan de Brugh, J., Aben, I., Pollard, D. F., Griffith, D. W. T., Feist, D. G., Koshelev, D., Hase, F., Toon, G. C., Ohyama, H., Morino, I., Notholt, J., Shiomi, K., Iraci, L., Schneider, M., de Mazière, M., Sussmann, R., Kivi, R., Warneke, T., Goo, T.-Y., and Té, Y.: Carbon dioxide retrieval from OCO-2 satellite observations using the RemoTeC algorithm and validation with TCCON measurements, Atmos. Meas. Tech., 11, 3111–3130, https://doi.org/10.5194/amt-11-3111-2018, 2018.
Wunch, D., Toon, G. C., Blavier, J.-F. L., Washenfelder, R. A., Notholt, J., Connor, B. J., Griffith, D. W. T., Sherlock, V., and Wennberg, P. O.: The Total Carbon Column Observing Network, Philos. T. Roy. Soc. A, 369, 2087–2112, https://doi.org/10.1098/rsta.2010.0240, 2011.
Wunch, D., Wennberg, P. O., Osterman, G., Fisher, B., Naylor, B., Roehl, C. M., O'Dell, C., Mandrake, L., Viatte, C., Kiel, M., Griffith, D. W. T., Deutscher, N. M., Velazco, V. A., Notholt, J., Warneke, T., Petri, C., De Maziere, M., Sha, M. K., Sussmann, R., Rettinger, M., Pollard, D., Robinson, J., Morino, I., Uchino, O., Hase, F., Blumenstock, T., Feist, D. G., Arnold, S. G., Strong, K., Mendonca, J., Kivi, R., Heikkinen, P., Iraci, L., Podolske, J., Hillyard, P. W., Kawakami, S., Dubey, M. K., Parker, H. A., Sepulveda, E., García, O. E., Te, Y., Jeseck, P., Gunson, M. R., Crisp, D., and Eldering, A.: Comparisons of the Orbiting Carbon Observatory-2 (OCO-2) X measurements with TCCON, Atmos. Meas. Tech., 10, 2209–2238, https://doi.org/10.5194/amt-10-2209-2017, 2017.
Xiao, Y., Yuan, Q., He, J., Zhang, Q., Sun, J., Su, X., Wu, J., and Zhang, L.: Space-time super-resolution for satellite video: A joint framework based on multi-scale spatial-temporal transformer, Int. J. Appl. Earth Obs., 108, 102731, https://doi.org/10.1016/j.jag.2022.102731, 2022.
Xiao, Y., Yuan, Q., Jiang, K., He, J., Wang, Y., and Zhang, L.: From degrade to upgrade: Learning a self-supervised degradation guided adaptive network for blind remote sensing image super-resolution, Inform. Fusion, 96, 297–311, https://doi.org/10.1016/j.inffus.2023.03.021, 2023.
Yoro, K. O. and Daramola, M. O.: Chapter 1 – CO2 emission sources, greenhouse gases, and the global warming effect, in: Advances in Carbon Capture, edited by: Rahimpour, M. R., Farsi, M., and Makarem, M. A., Woodhead Publishing, 3–28, https://doi.org/10.1016/B978-0-12-819657-1.00001-3, 2020.
Yoshida, Y., Kikuchi, N., Morino, I., Uchino, O., Oshchepkov, S., Bril, A., Saeki, T., Schutgens, N., Toon, G. C., Wunch, D., Roehl, C. M., Wennberg, P. O., Griffith, D. W. T., Deutscher, N. M., Warneke, T., Notholt, J., Robinson, J., Sherlock, V., Connor, B., Rettinger, M., Sussmann, R., Ahonen, P., Heikkinen, P., Kyrö, E., Mendonca, J., Strong, K., Hase, F., Dohe, S., and Yokota, T.: Improvement of the retrieval algorithm for GOSAT SWIR XCO2 and XCH4 and their validation using TCCON data, Atmos. Meas. Tech., 6, 1533–1547, https://doi.org/10.5194/amt-6-1533-2013, 2013.
Zhang, L., Li, T., and Wu, J.: Deriving gapless CO2 concentrations using a geographically weighted neural network: China, 2014–2020, Int. J. Appl. Earth Obs., 114, 103063, https://doi.org/10.1016/j.jag.2022.103063, 2022.
Zhang, M. and Liu, G.: Mapping contiguous XCO2 by machine learning and analyzing the spatio-temporal variation in China from 2003 to 2019, Sci. Total Environ., 858, 159588, https://doi.org/10.1016/j.scitotenv.2022.159588, 2023.
Zhou, S., Wang, Y., Yuan, Q., Yue, L., and Zhang, L.: Spatiotemporal estimation of 6-hour high-resolution precipitation across China based on Himawari-8 using a stacking ensemble machine learning model, J. Hydrol., 609, 127718, https://doi.org/https://doi.org/10.1016/j.jhydrol.2022.127718, 2022.