the Creative Commons Attribution 4.0 License.
the Creative Commons Attribution 4.0 License.
 | 20 Jan 2023
HiTIC-Monthly: a monthly high spatial resolution (1 km) human thermal index collection over China during 2003–2020
Hui Zhang
Yongquan Zhao
Lijie Lin
Erjia Ge
Yuanjian Yang
Guicai Ning
Jing Cong
Zhaoliang Zeng
Ke Gui
Jing Li
Ting On Chan
Xiang Li
Sijia Wu
Peng Wang
Xiaoyu Wang
Human-perceived thermal comfort (known as human-perceived temperature) measures the combined effects of multiple meteorological factors (e.g., temperature, humidity, and wind speed) and can be aggravated under the influences of global warming and local human activities. With the most rapid urbanization and the largest population, China is being severely threatened by aggravating human thermal stress. However, the variations of thermal stress in China at a fine scale have not been fully understood. This gap is mainly due to the lack of a high-resolution gridded dataset of human thermal indices. Here, we generated the first high spatial resolution (1 km) dataset of monthly human thermal index collection (HiTIC-Monthly) over China during 2003–2020. In this collection, 12 commonly used thermal indices were generated by the Light Gradient Boosting Machine (LightGBM) learning algorithm from multi-source data, including land surface temperature, topography, land cover, population density, and impervious surface fraction. Their accuracies were comprehensively assessed based on the observations at 2419 weather stations across the mainland of China. The results show that our dataset has desirable accuracies, with the mean R2, root mean square error, and mean absolute error of 0.996, 0.693 ∘C, and 0.512 ∘C, respectively, by averaging the 12 indices. Moreover, the data exhibit high agreements with the observations across spatial and temporal dimensions, demonstrating the broad applicability of our dataset. A comparison with two existing datasets also suggests that our high-resolution dataset can describe a more explicit spatial distribution of the thermal information, showing great potentials in fine-scale (e.g., intra-urban) studies. Further investigation reveals that nearly all thermal indices exhibit increasing trends in most parts of China during 2003–2020. The increase is especially significant in North China, Southwest China, the Tibetan Plateau, and parts of Northwest China, during spring and summer. The HiTIC-Monthly dataset is publicly available from Zenodo at https://doi.org/10.5281/zenodo.6895533 (Zhang et al., 2022a).
- Article
(22976 KB) - Full-text XML
-
Supplement
(9669 KB) - BibTeX
- EndNote


Global climate change has brought significant challenges to human society and natural systems (Arias et al., 2021; Haines and Ebi, 2019) by inducing higher air temperature and more frequent extreme weather and climate events around the world (Arias et al., 2021; Schwingshackl et al., 2021). Heat-related disasters, e.g., heatwaves, droughts, and wildfires, are occurring more frequently and becoming more intense (Tong et al., 2021; Arias et al., 2021; Luo et al., 2022), exacerbating the thermal environment and threatening the tolerance limits of humans, animals, and plants (Raymond et al., 2020). Substantial warming and increasing extreme weather and climate events aggravate human thermal comfort and increase the exposures to uncomfortable thermal environments (Brimicombe et al., 2021), thus posing adverse impacts on public health, socio-economy, and agricultural productivities (Budhathoki and Zander, 2019; Moda et al., 2019; Tuholske et al., 2021; Sun et al., 2019; Zhao et al., 2017).
The thermal stress that human beings actually perceive is not only related to air temperature, but also jointly influenced by other environmental variables such as humidity, wind, and/or direct sunlight (Mistry, 2020; Djongyang et al., 2010). These variables alter the heat balance that maintains the core temperature of human bodies by influencing the heat exchange (e.g., radiation, convection, conduction, and evaporation) between humans and the surrounding environment (Periard et al., 2021; Stolwijk, 1975). High atmospheric humidity can exacerbate the thermal stress on human bodies by reducing evaporation from the skin through sweating when the air temperature is high (Li et al., 2018; Rogers et al., 2021; Luo and Lau, 2021). Furthermore, abnormal weather with a combination of extremely high air temperature, humidity, and/or wind can reduce labor capacity and human performance (Roghanchi and Kocsis, 2018; Lazaro and Momayez, 2020; Enander and Hygge, 1990), leading to temperature-related discomfort, stress, morbidity, and even death (Di Napoli et al., 2018; Kuchcik, 2021; Nastos and Matzarakis, 2011), particularly during heatwaves. For example, in the summer of 2017, 2018, and 2019, there were 1489, 1700, and 161 heatwave-related deaths, respectively, in the United Kingdom (Rustemeyer and Howells, 2021). Additionally, vulnerable groups including children, the elderly, chronic patients, and poor communities are at higher risk of being affected by thermal stress (Patz et al., 2005; Wang et al., 2019), which is likely to be further exacerbated as global population aging and climate warming (United Nations, 2017).
The changes and impacts of human thermal stress have attracted increasing attention in recent years (Schwingshackl et al., 2021; Krzysztof et al., 2021; Li et al., 2018; Rahman et al., 2022; Ren et al., 2022; Luo and Lau, 2021). For instance, Szer et al. (2022) estimated the impact of heat stress on construction workers based on the Universal Thermal Climate Index (UTCI). Ren et al. (2022) and Luo and Lau (2021) quantified the contribution of urbanization and climate change to urban human thermal comfort in China. Schwingshackl et al. (2021) assessed the future severity and trend of global heat stress based on Coupled Model Intercomparison Project phase 6 (CMIP6). These studies were mainly based on meteorological stations or coarse-gridded data. However, the meteorological stations are sparsely distributed (Peng et al., 2019), particularly in undeveloped and mountainous areas, which cannot reveal continuously spatial distributions of air temperature and thermal stress conditions (He et al., 2022). Additionally, existing low spatial resolution image products (Mistry, 2020; Di Napoli et al., 2020) cannot be applied to fine-scale studies because they cannot provide information with spatial details and variations. However, the changes in human thermal stress at a fine scale (e.g., 1 km×1 km) remain much less understood. This research gap is mainly inhabited by the unavailability of a high spatial resolution (high-resolution) gridded dataset of human thermal stress.
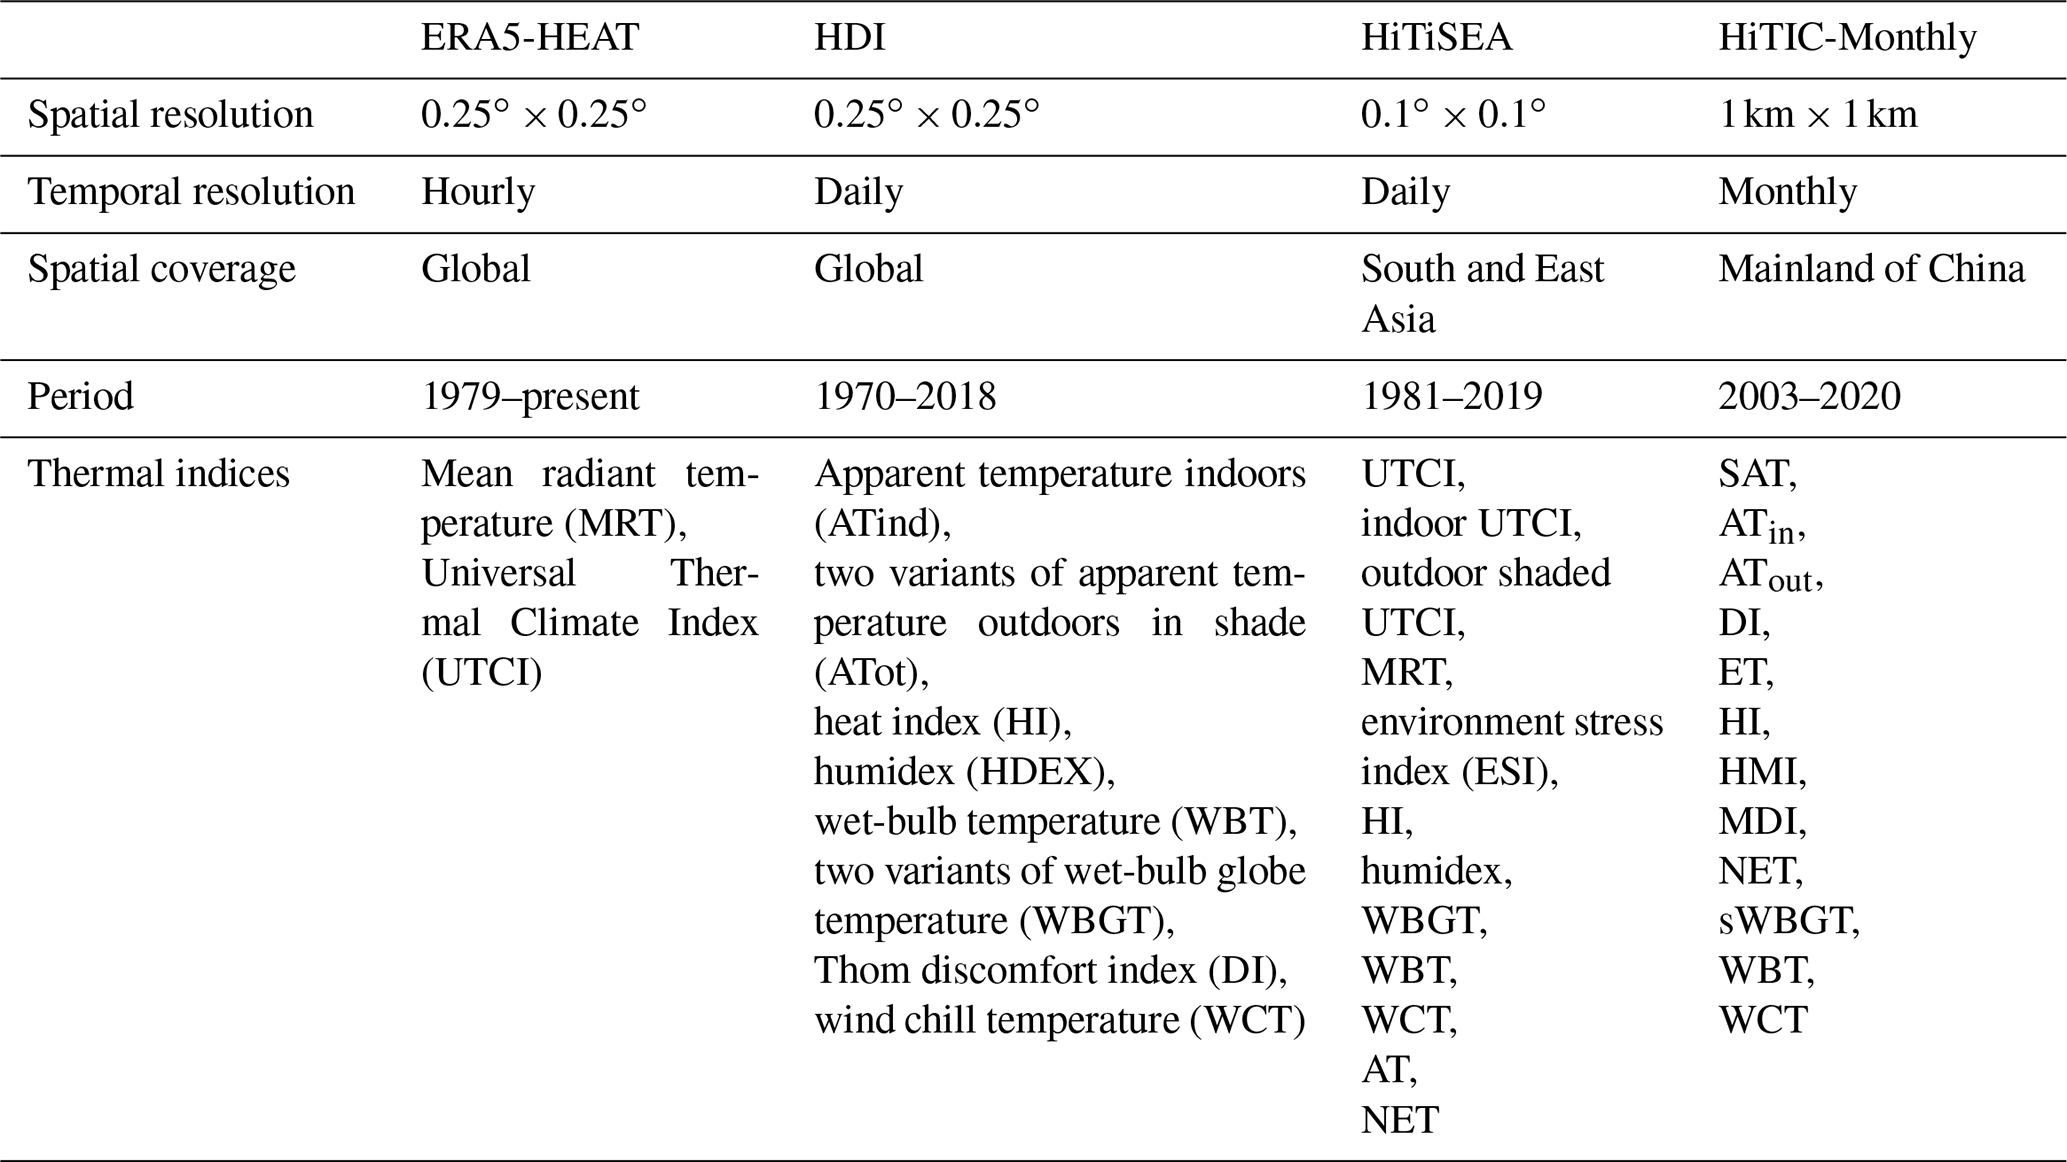
Although extensive studies have been conducted to generate high-resolution land surface temperature (LST) (such as the Land Surface Temperature in China LSTC; Zhao et al., 2020 and the global seamless land surface temperature dataset, Zhang et al., 2022b; Hong et al., 2022), or near surface air temperatures (SAT) products (such as ERA5, Copernicus Climate Change Service, 2017, TerraClimate, Abatzoglou et al., 2018, and GPRChinaTemp1km, He et al., 2022), human thermal stress datasets were generally produced at low-resolution levels, such as ERA5-HEAT (Di Napoli et al., 2020), HDI_0p25_1970_2018 (hereafter, HDI) (Mistry, 2020), and HiTiSEA (Yan et al., 2021). ERA5-HEAT was derived from ERA5 and includes two global hourly human thermal stress indices (UTCI and mean radiant temperature (MRT)) from January 1979 to the present (Di Napoli et al., 2020). The HDI dataset was generated using 3 h climate variables of the global land data assimilation system (GLDAS), and it contains 10 daily indices with a spatial resolution of , covering 90∘ N–60∘ S from 1970 to 2018 (Mistry, 2020). HiTiSEA contains 10 daily human thermal stress indices from 1981 to 2017, with a spatial resolution of over South and East Asia (Yan et al., 2021), which was derived from the ERA5-Land and ERA5 reanalysis products. However, these existing thermal index datasets have very coarse spatial resolutions. There is an urgent need for a high-resolution (e.g., 1 km) data collection of multiple human thermal stress indices.
Various indices have been proposed to measure human thermal stress, but there is no universal thermal stress index that works in all climate zones (Schwingshackl et al., 2021; Brake and Bates, 2002; Roghanchi and Kocsis, 2018; Luo and Lau, 2021). Existing human thermal stress indices considered different climate conditions, direct or indirect exposures to weather elements, human metabolism, and the local working environment (Di Napoli et al., 2020), which were designed to evaluate or quantify the comprehensive environmental pressure of meteorological factors (e.g., temperature, humidity, wind) on human bodies (Epstein and Moran, 2006). These indices are based on the thermal exchange between the human and surrounding environments or empirical relationships gained by studying human responses to various environmental factors, varying in complexity, applicability, and capacity (Staiger et al., 2019). For example, the heat index (HI) is used for meteorological service (NWS, 2011); wet-bulb temperature (WBT) is used to measure the upper physiological limit of human beings (Raymond et al., 2020); physiologically equivalent temperature (PET) and UTCI are used to estimate human thermal comfort (Varentsov et al., 2020). Therefore, a high-resolution dataset that contains different commonly used human thermal stress indices is urgently called for in global and regional studies, particularly for those with complex climate conditions (e.g., China).
China has been threatened by deteriorating thermal environments under global climate change and rapid local urbanization over the past decades (Ren et al., 2022; Luo and Lau, 2019). The changes and characteristics of human thermal stress across China have attracted extensive attention in recent years (Yan, 2013; Tian et al., 2022; Li et al., 2022). Wang et al. (2021) found that the frequency of extreme human-perceived temperature events increases in summer and decreases in winter in most urban agglomerations (UAs) of China. Li et al. (2022) showed that the frequency of thermal discomfort days in China exhibits a significant increasing trend from 1961 to 2014, and there will be more threats from thermal discomfort in the future. Therefore, a long-term and high-resolution dataset with multiple human thermal stress indices in China is of great importance for investigating detailed spatial and temporal variations of human thermal stress across the country. Such a dataset has the potential to (1) assess population exposure to extreme thermal conditions and heat-related health risks, (2) reveal the spatiotemporal evolution of human thermal stress and its influence on public health, tourism, industries, military, epidemiology, and biometeorology at a fine scale, and (3) provide policymakers with data in manipulating targeted strategies to mitigate heat stress and protect vulnerable people.
In this study, we produced a high-resolution (1 km×1 km) thermal index collection at a monthly scale (HiTIC-Monthly) in China over a long period (2003–2020). This collection contains 12 widely used human thermal indices, including surface air temperature (SAT), indoor apparent temperature (ATin), outdoor shaded apparent temperature (ATout), discomfort index (DI), effective temperature (ET), heat index (HI), humidex (HMI), modified discomfort index (MDI), net effective temperature (NET), wet-bulb temperature (WBT), simplified wet-bulb globe temperature (sWBGT), and wind chill temperature (WCT). The remainder of this paper is structured as follows. Sections 2 and 3 describe the data sources and the methodology, respectively. Section 4 presents a comprehensive analysis of the accuracies and trends of the human thermal indices. Comparisons on our products with two existing datasets are in Sect. 5, data availability is provided in Sect. 6. The main findings of this paper are summarized in Sect. 7.
2.1 Meteorological data
Daily mean surface air temperature, relative humidity, and wind speed recorded at the 2419 weather stations across China (Fig. 1) during 2003–2020 were collected from the China Meteorological Data Service Center (CMDC) at http://data.cma.cn/en (last access: 16 November 2021). All station records were subjected to strict quality control and evaluation, including homogenization based on a statistical approach (Xu et al., 2013) and evaluation of temporal inhomogeneity based on the Easterling–Peterson method (Li et al., 2004).


Figure 1Spatial distribution of meteorological stations in the mainland of China, with color shadings indicating the elevation in meters.
Table 2Equations of the human thermal indices for each station.
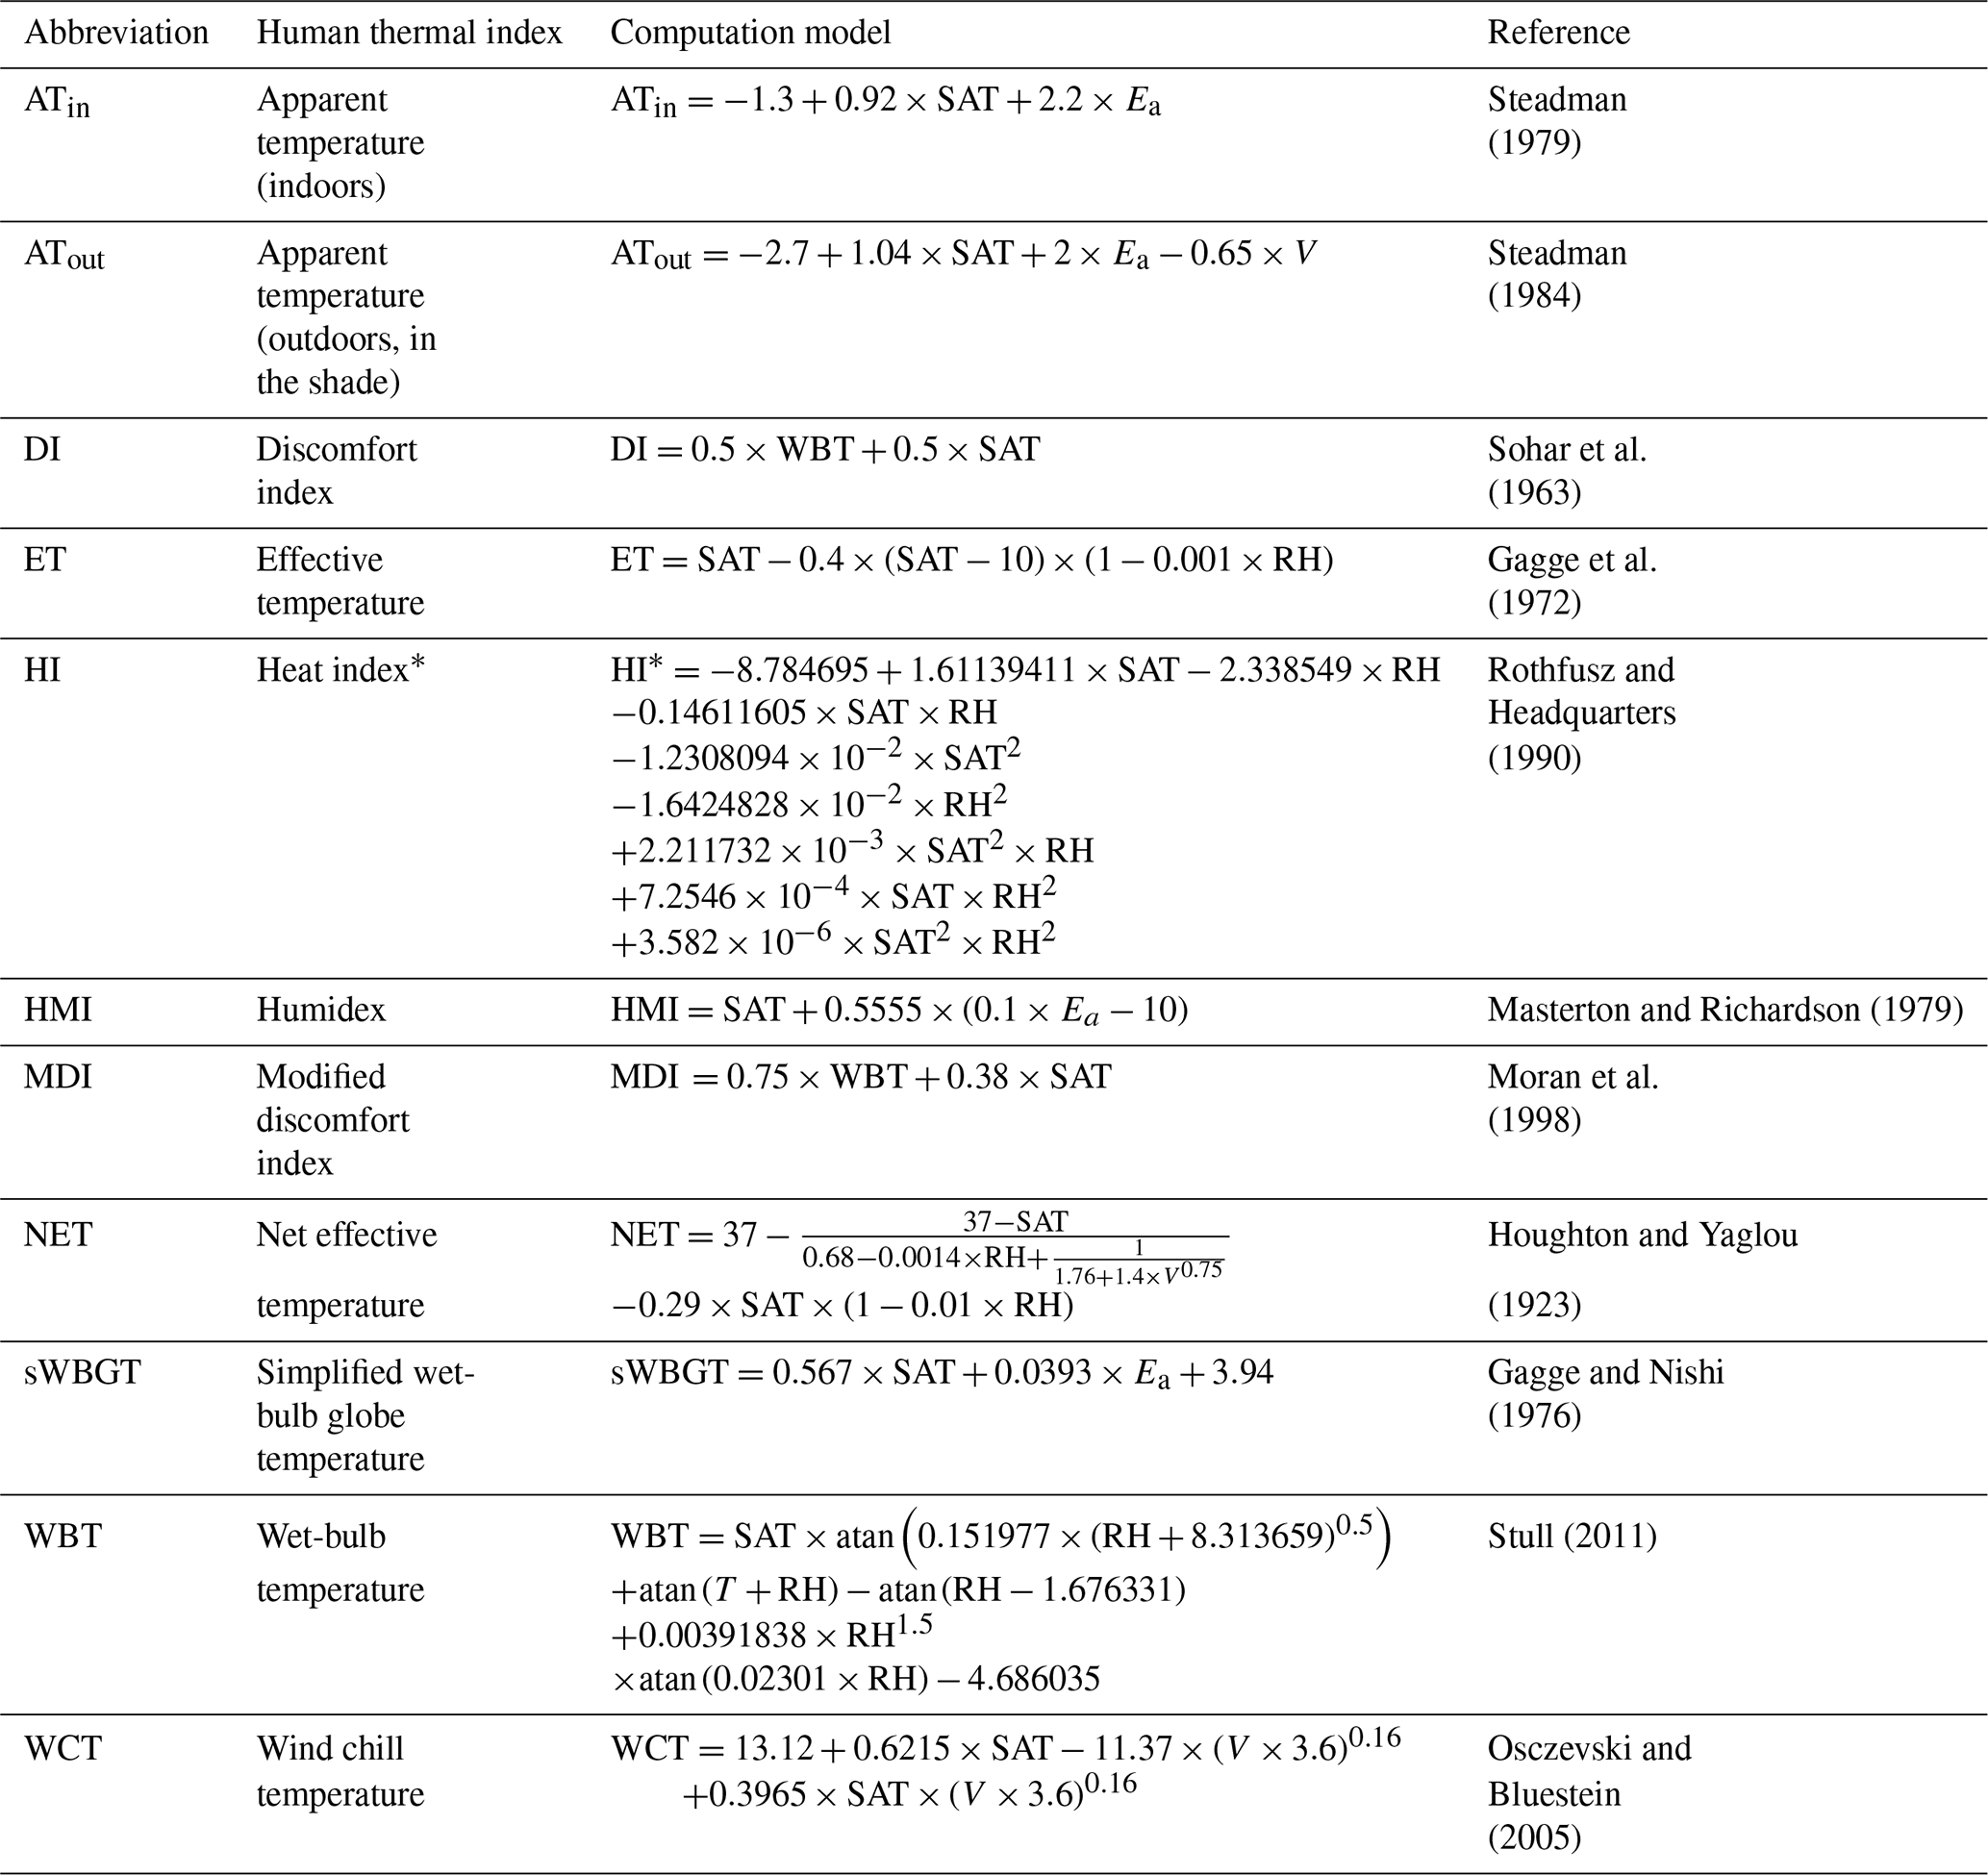
SAT is observed air temperature (∘C), RH is relative humidity (%), V is wind speed (m s−1), and Ea is actual water vapor pressure (kPa). Asterisk means that an adjustment is needed. * All units of human thermal indices in this study are in degrees Celsius (∘C).
2.2 Covariates
Human thermal stress is related to temperature, topography, land cover, population density, surface water, and vegetation (Wang et al., 2020; Rahman et al., 2022; Krzysztof et al., 2021). In this study, eight variables reflecting the changes and spatial distribution characteristics of temperature were used to predict human thermal indices (Table 1) in addition to the meteorological variables. As LST is one of the most essential parameters for predicting human thermal indices, the seamless LST dataset created by Zhang et al. (2022b) was introduced into our model training. This LST dataset used a spatiotemporal gap-filling algorithm to fill the missing or invalid value caused by clouds in the Moderate Resolution Imaging Spectroradiometer (MODIS) LST dataset (MOD11A1 and MYD11A1). It includes daily mid-daytime (13:30) and mid-nighttime (01:30) LST with 1 km spatial resolution. The mean root mean squared errors (RMSEs) of daytime and nighttime LST are 1.88 and 1.33 ∘C, respectively. We used monthly LST as one of the inputs to predict the spatial distribution of 12 thermal indices. Monthly LST values were calculated by averaging daily LST, which was obtained by averaging four observations in a day, including mid-daytime and mid-nighttime observations from ascending and descending orbits of MOD11A1 (Terra) and MYD11A1 (Aqua). More details about the LST data are described in Zhang et al. (2022b). The land cover dataset (MCD12Q1 Version 6) developed by Sulla-Menashe and Friedl (2019) based on a supervised classification method was downloaded via Google Earth Engine (GEE). The Multi-Error-Removed Improved-Terrain (MERIT) elevation dataset developed by Yamazaki et al. (2017) was downloaded from GEE. This dataset was generated after removing the errors from existing digital elevation models (DEMs), such as SRTM3 and AW3D-30m, based on multi-source satellite data and filtering algorithms. The spatial resolution of this dataset is 3 s (i.e., ∼90 m at the Equator). In addition, the slope was also extracted from the elevation data to act as the topography predictor. As the artificial surface is closely related to human activities (Zhao and Zhu, 2022), the dataset of global artificial impervious area (GAIA) produced by Gong et al. (2020) from the Google Earth Engine (GEE) was used to delineate human footprints. The overall accuracy of GAIA is greater than 90 % (Gong et al., 2020). The population dataset was downloaded from the WorldPop Project (Gaughan et al., 2013). Then, the abovementioned eight datasets were pre-processed to have the same spatial extent, projection, and spatial resolution (1 km) through image mosaicking, reprojection, resampling, clipping, aggregating, and monthly synthesizing. Moreover, year and month of the year were also used as covariates. Note that we did not include precipitation as a covariate because the precipitation data are not normally distributed. More importantly, they exhibit many zero values in many regions of China (especially in the dry season), which would increase the uncertainty of the spatial prediction.
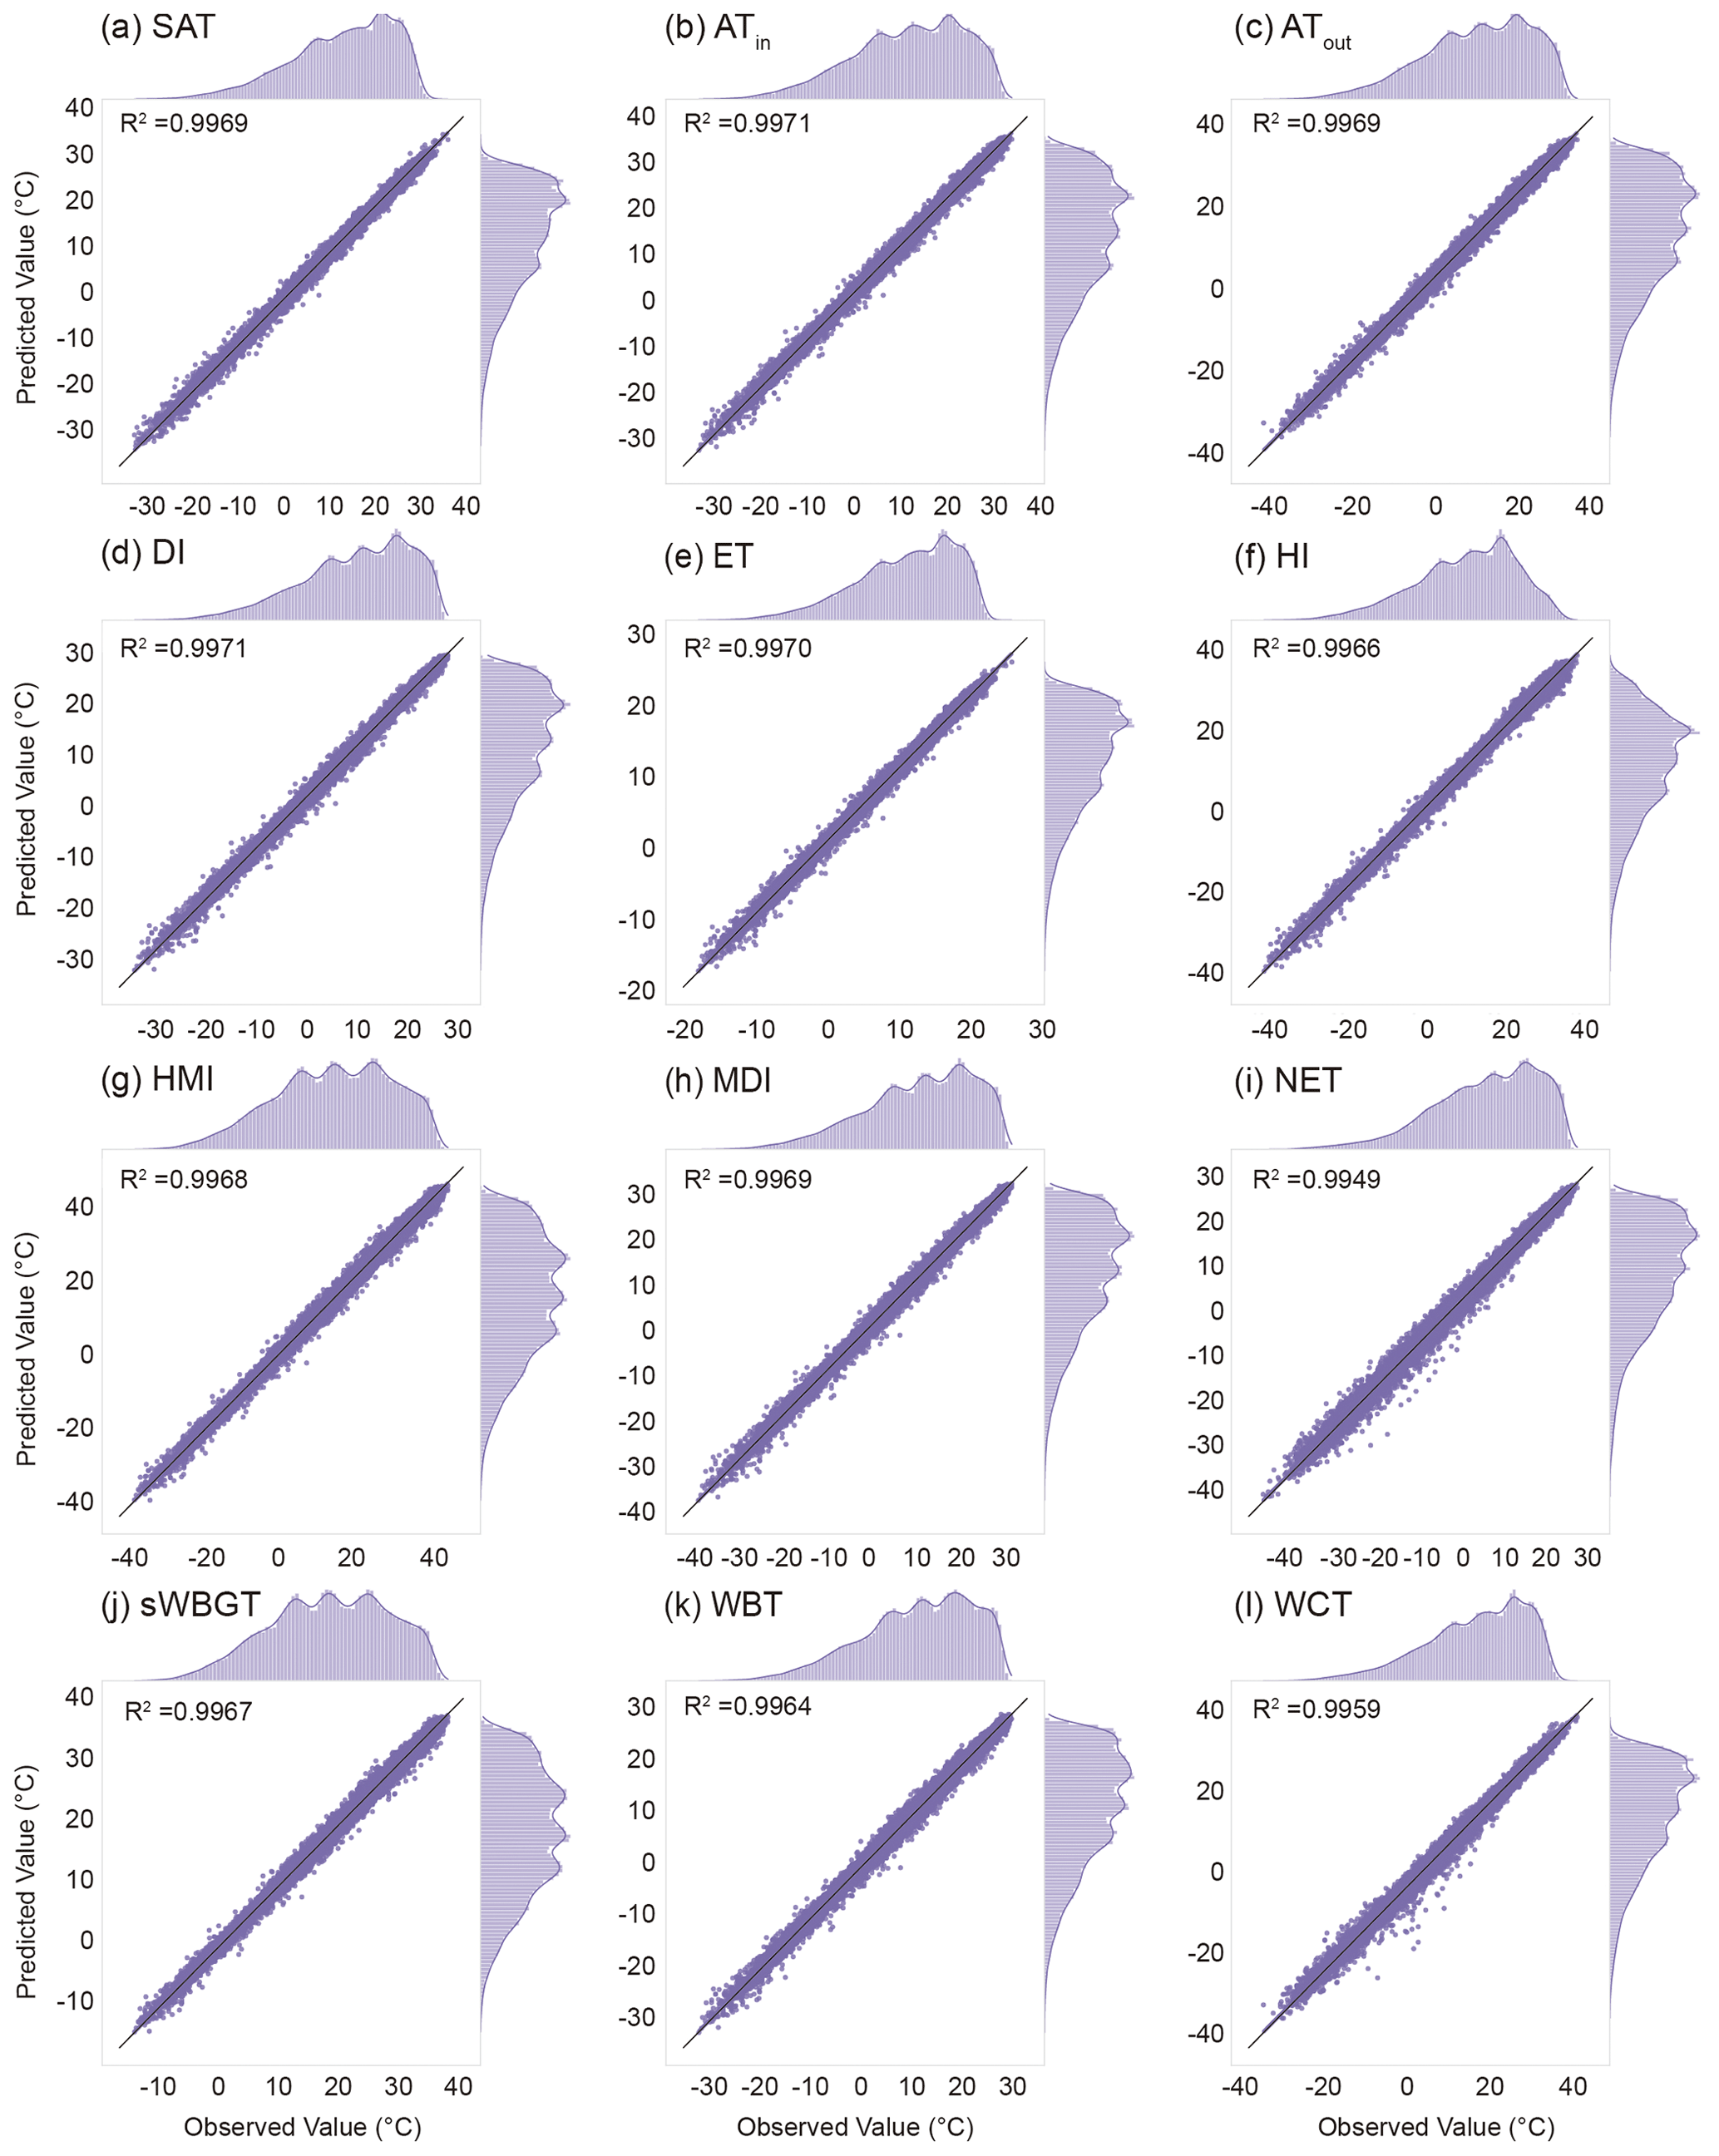
Figure 2Scatter plots of predictions versus observations of the 12 human thermal indices over the mainland of China during 2003–2020. (a) SAT, (b) ATin, (c) ATout, (d) DI, (e) ET, (f) HI, (g) HMI, (h) MDI, (i) NET, (j) sWBGT, (k) WBT, and (l) WCT.
3.1 Calculation of human thermal indices
In addition to SAT, the calculation of human thermal indices used in this study is described in Table 2. These indices are first calculated based on SAT (also simply denoted as T), relative humidity (RH), wind speed (V), and actual vapor pressure (Ea) at daily scale. Ea is derived from T and RH rather than directly observed at meteorological stations (Eqs. 1–2; Bolton, 1980). Furthermore, monthly human thermal indices were derived by averaging daily values in each month.
Here Es is saturation vapor pressure (hPa) near the surface, T (∘C) is air temperature at 2 m above the ground, and RH (%) is relative humidity at 2 m above the ground.
3.2 Prediction of human thermal indices using LightGBM
The Light Gradient Boosting Machine (LightGBM) algorithm was employed to predict human thermal indices during 2003–2020. LightGBM is one of the gradient boosting decision tree (GBDT) algorithms developed by Microsoft Research (Ke et al., 2017). This algorithm has become a very popular nonlinear machine learning algorithm due to its superior performance in machine learning competitions and efficiency (Candido et al., 2021). Its performance has been evaluated and shows desirable results in different applications, such as evapotranspiration estimation (Fan et al., 2019), land cover classification (Candido et al., 2021; Mccarty et al., 2020), air quality prediction (Su, 2020; Zeng et al., 2021; Tian et al., 2021), subsurface temperature reconstruction (Su et al., 2021), and above-ground biomass estimation (Tamiminia et al., 2021).
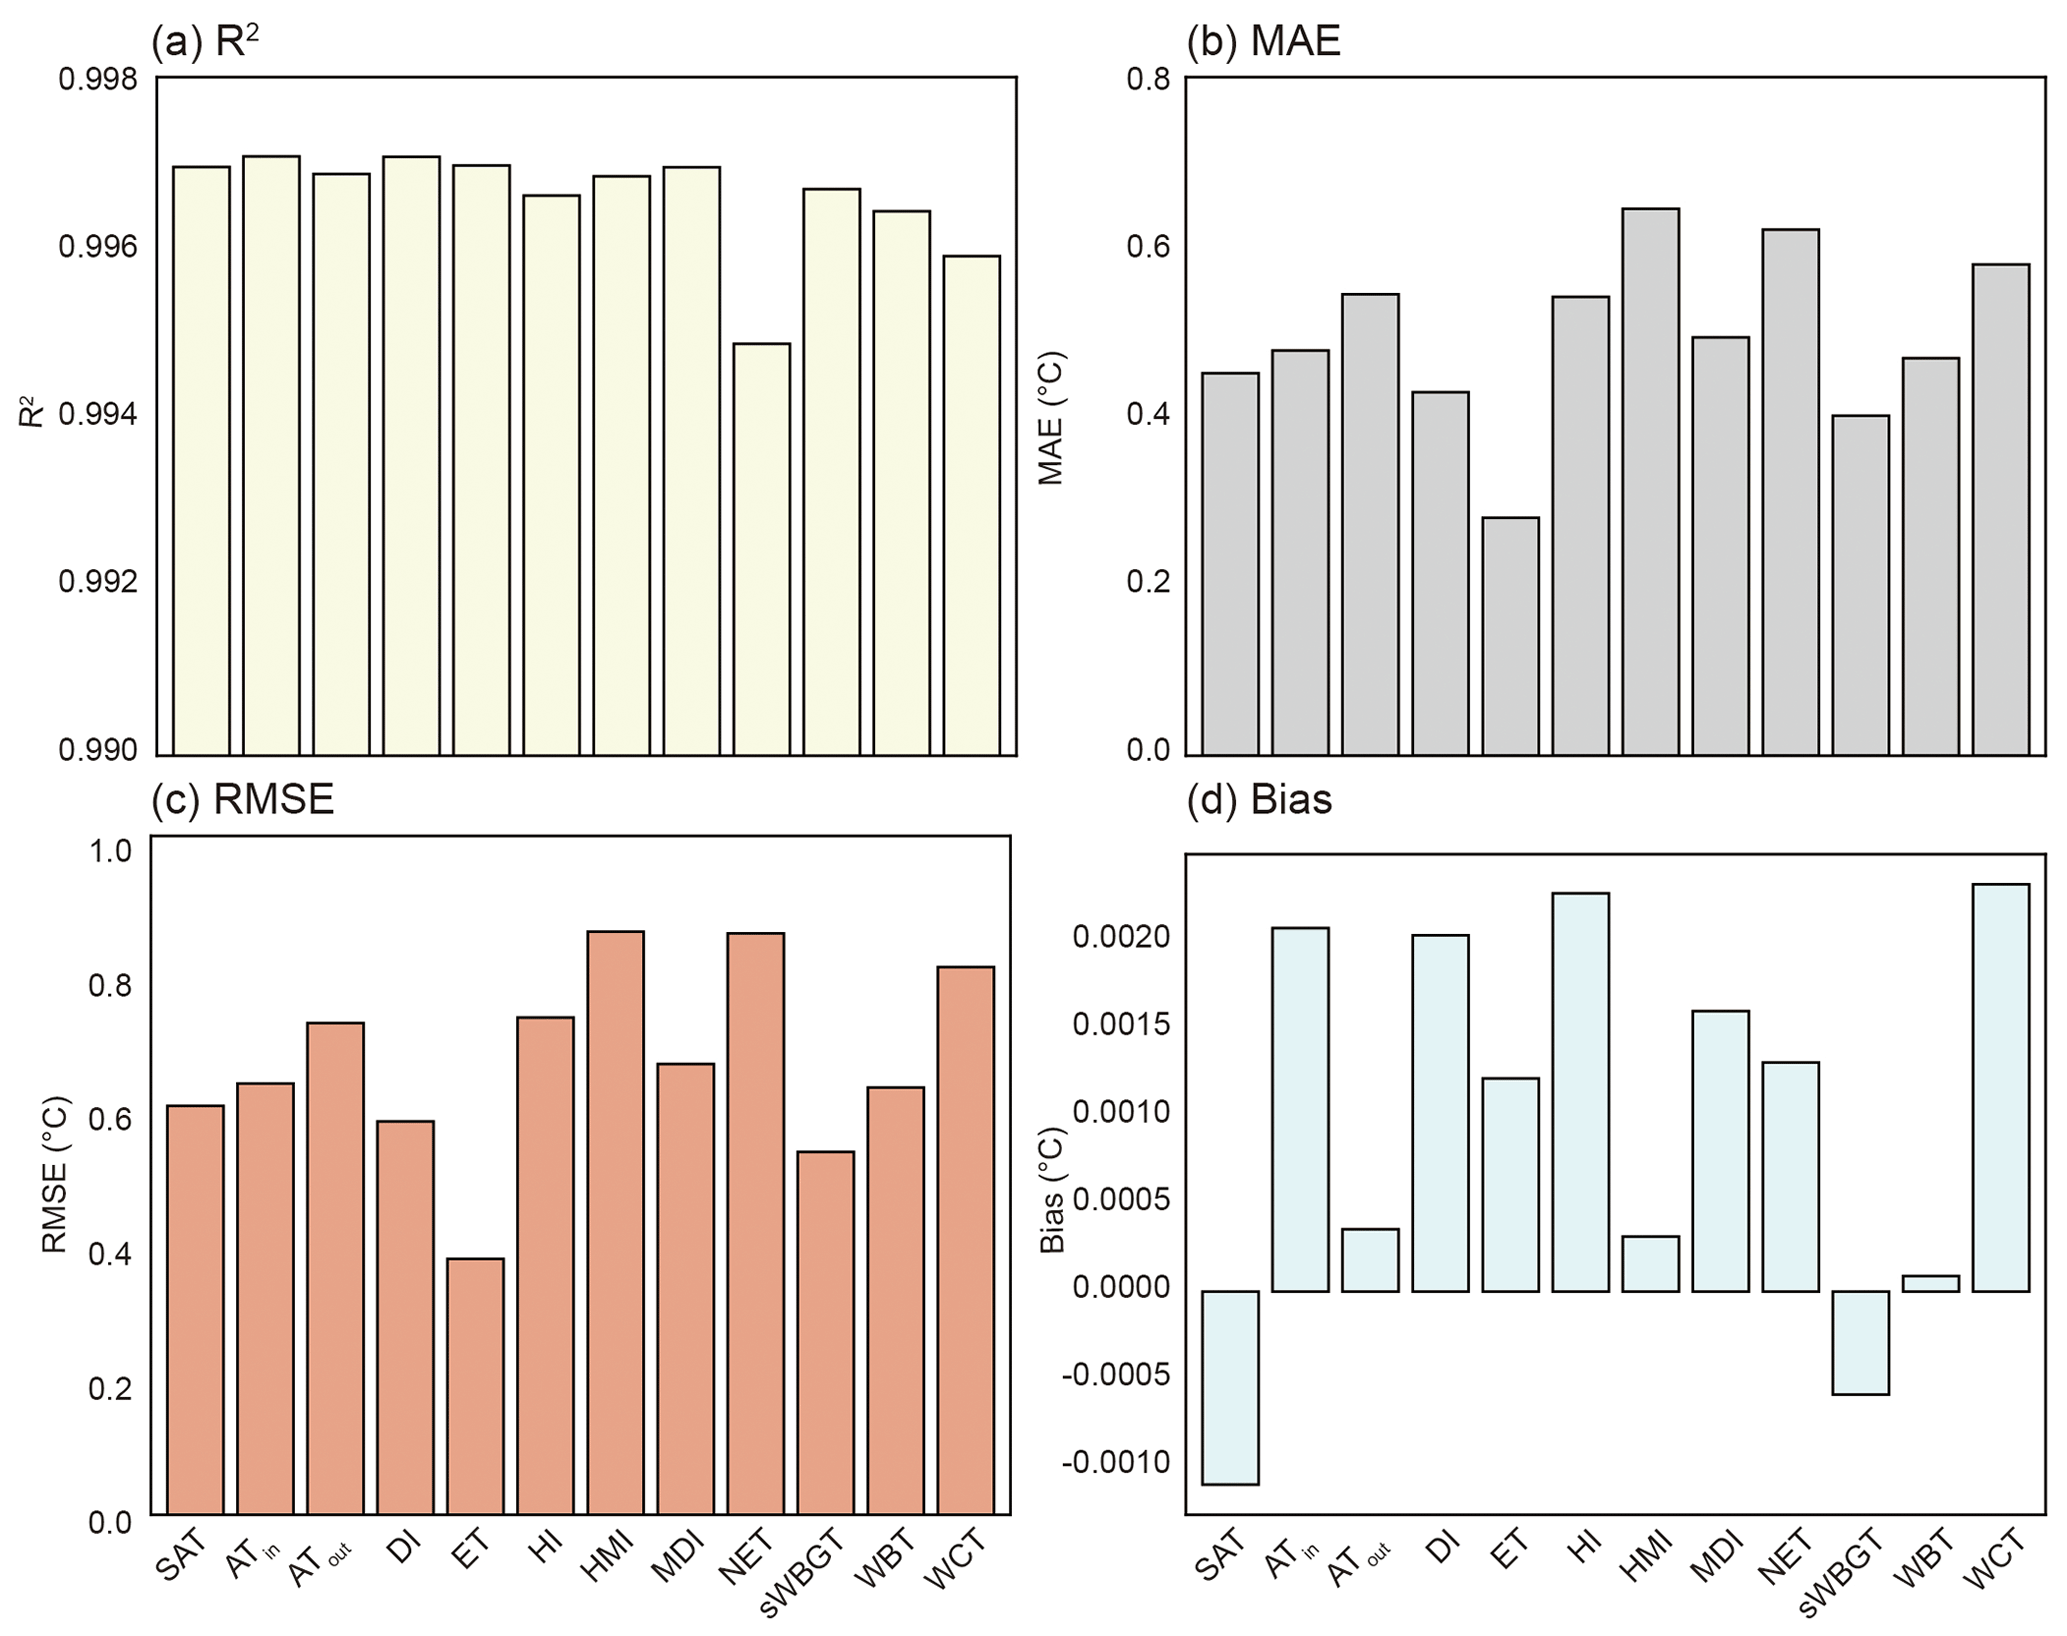
Figure 3Overall prediction accuracies of the 12 human thermal indices over the mainland of China during 2003–2020. (a) R2, (b) MAE, (c) RMSE, and (d) bias.
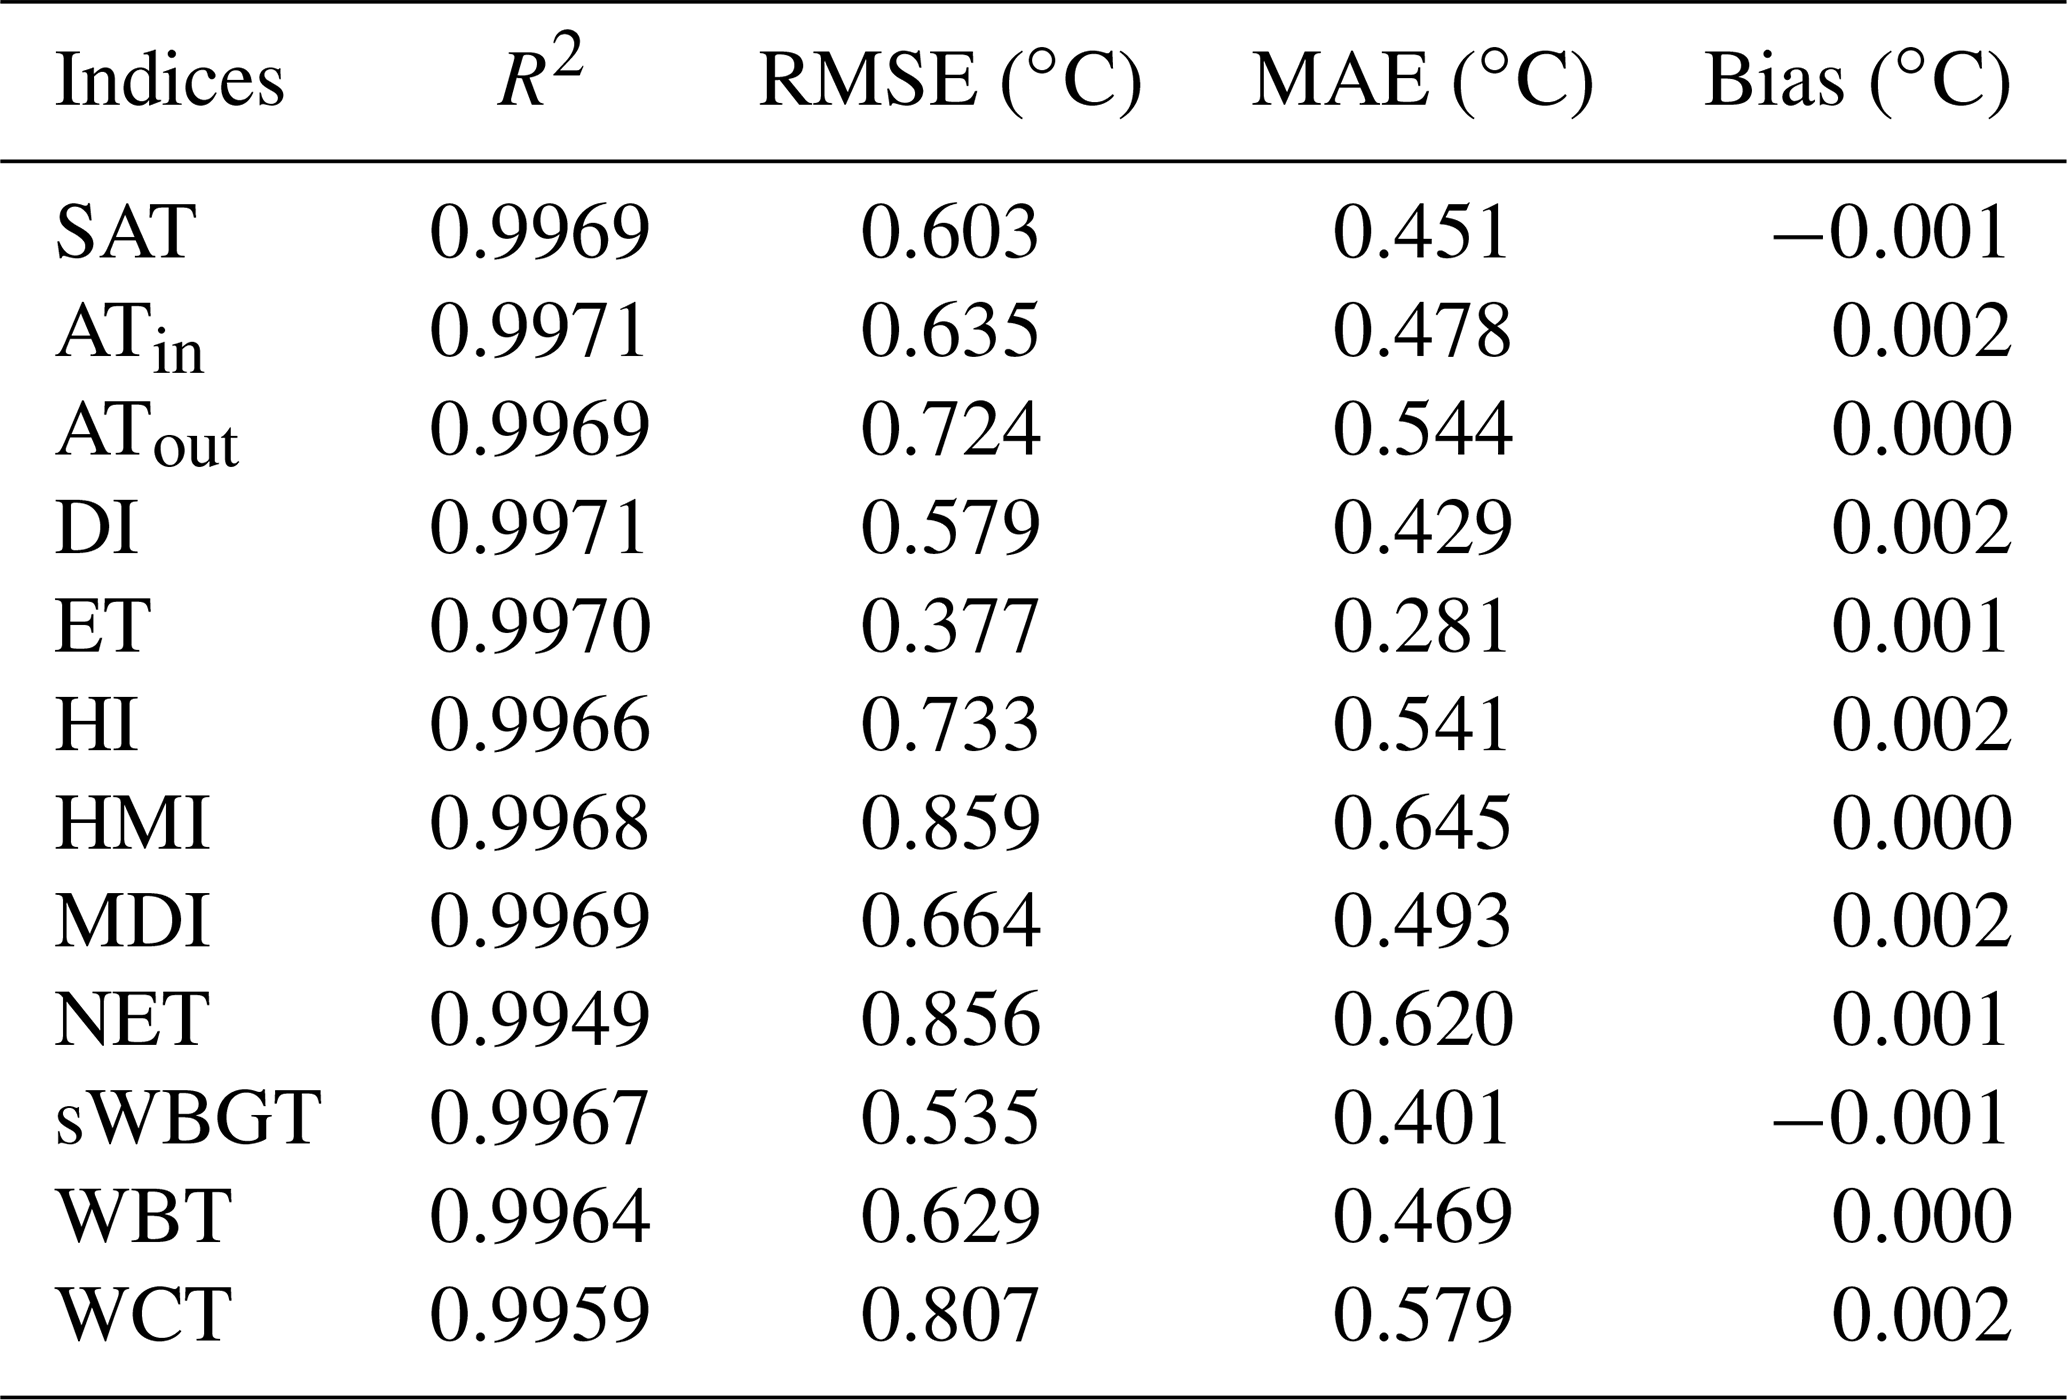
Table 3Overall prediction accuracies of the 12 human thermal indices over the mainland of China during 2003–2020.
Furthermore, LightGBM adopts the Gradient-based One-Side Sampling (GOSS) and Exclusive Feature Bundling (EFB) algorithms to improve the training speed (Su et al., 2021). Here, GOSS is used to select data instances with larger gradients and to exclude a considerable proportion of small gradient data instances (Ke et al., 2017), and EFB is used to merge features (Ke et al., 2017). Compared with traditional GBDT algorithms including eXtreme gradient boosting (XGBoost) and Stochastic Gradient Boosting (SGB), LightGBM effectively decreases the training time without reducing the accuracy (Los et al., 2021; Ke et al., 2017).
We used the Python package Scikit-Learn to perform the LightGBM training, and hyperparameters of LightGBM were tuned based on grid search methods. The observed monthly human thermal indices at the 2419 weather stations across the mainland of China during 2003–2020 were randomly classified into a training set (80 %) for hyperparameters tuning and model training and a testing set (20 %) for model evaluation.
3.3 Accuracy assessment
Four statistic metrics – namely, determination coefficient (R2), mean absolute error (MAE), RMSE, and bias (Rice, 2006) – were used to evaluate the prediction accuracy of the human thermal indices. Ranging from 0 to 1, R2 measures the proportion of variance explained by the model, representing how well the human thermal indices were predicted compared to the observations. MAE represents the average absolute error between the predictions and the observations. RMSE is the standard deviation of the residuals and is sensitive to outliers. Bias describes the differences between the predictions and the observations. These metrics are computed as follows.
where is the predicted value of human thermal indices, is the mean of the observed human thermal indices calculated from meteorological stations, and N is the number of samples.
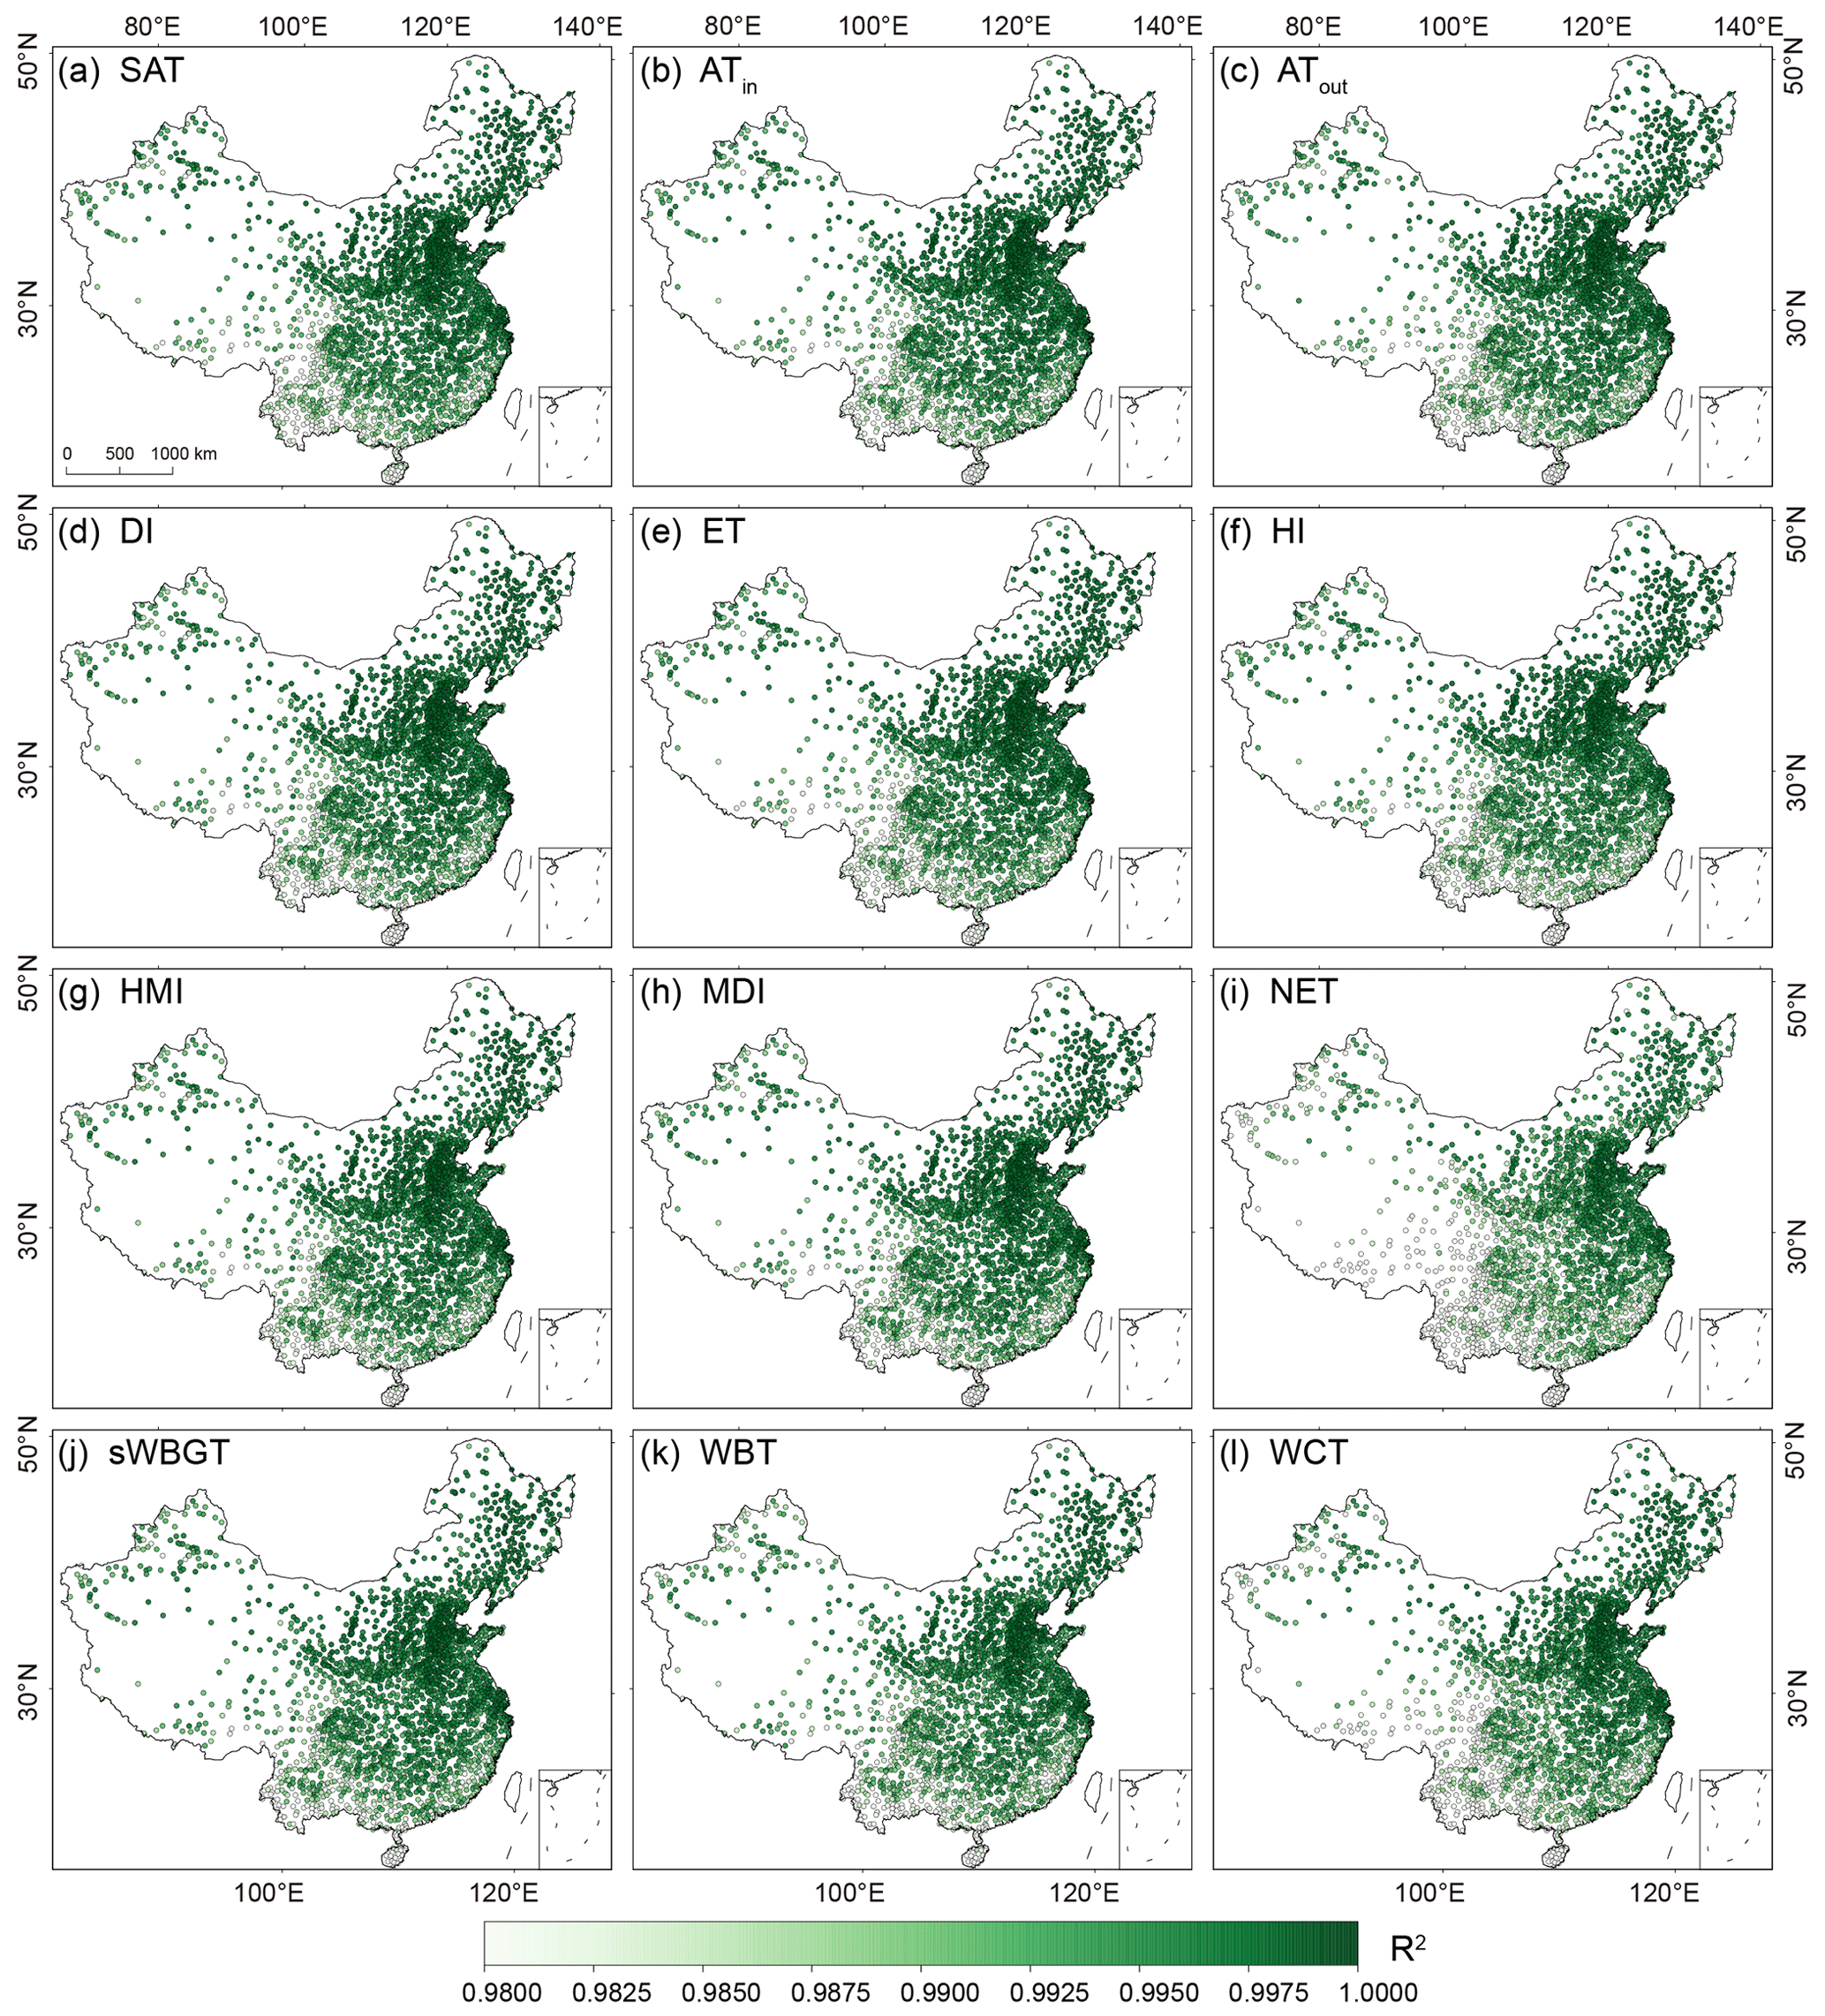
Figure 4Spatial distribution of R2 of the 12 human thermal index predictions at individual meteorological stations over the mainland of China during 2003–2020.
4.1 Evaluation of the predicted human thermal indices
4.1.1 Overall accuracy
The prediction accuracies of the 12 human thermal indices were evaluated based on the validation data introduced in Sect. 3.2. All predicted human thermal indices exhibit high accuracies. Figure 2 shows the scatter plots of the observed versus the predicted values of the 12 human thermal indices. As the figure displays, the data points of all indices are concentrated around the corresponding 1:1 line, indicating a good consistency between the observed and the predicted values. Figure 3 and Table 3 present the R2, MAE, RMSE, and bias values of 12 thermal indices during 2003–2020. The R2 values of the 12 indices are all higher than 0.99, and their RMSE, MAE, and bias are lower than 0.9, 0.7, and 0.003 ∘C, respectively. Particularly, HMI has the largest RMSE (0.859 ∘C) and MAE (0.645 ∘C), while ET shows the smallest RMSE (0.377 ∘C) and MAE (0.281 ∘C). The larger errors of NET are likely caused by the incorporation of wind speed during the computation (see Table 2). Overall, the accuracy metrics demonstrate that the 12 predicted human thermal indices are of good quality.
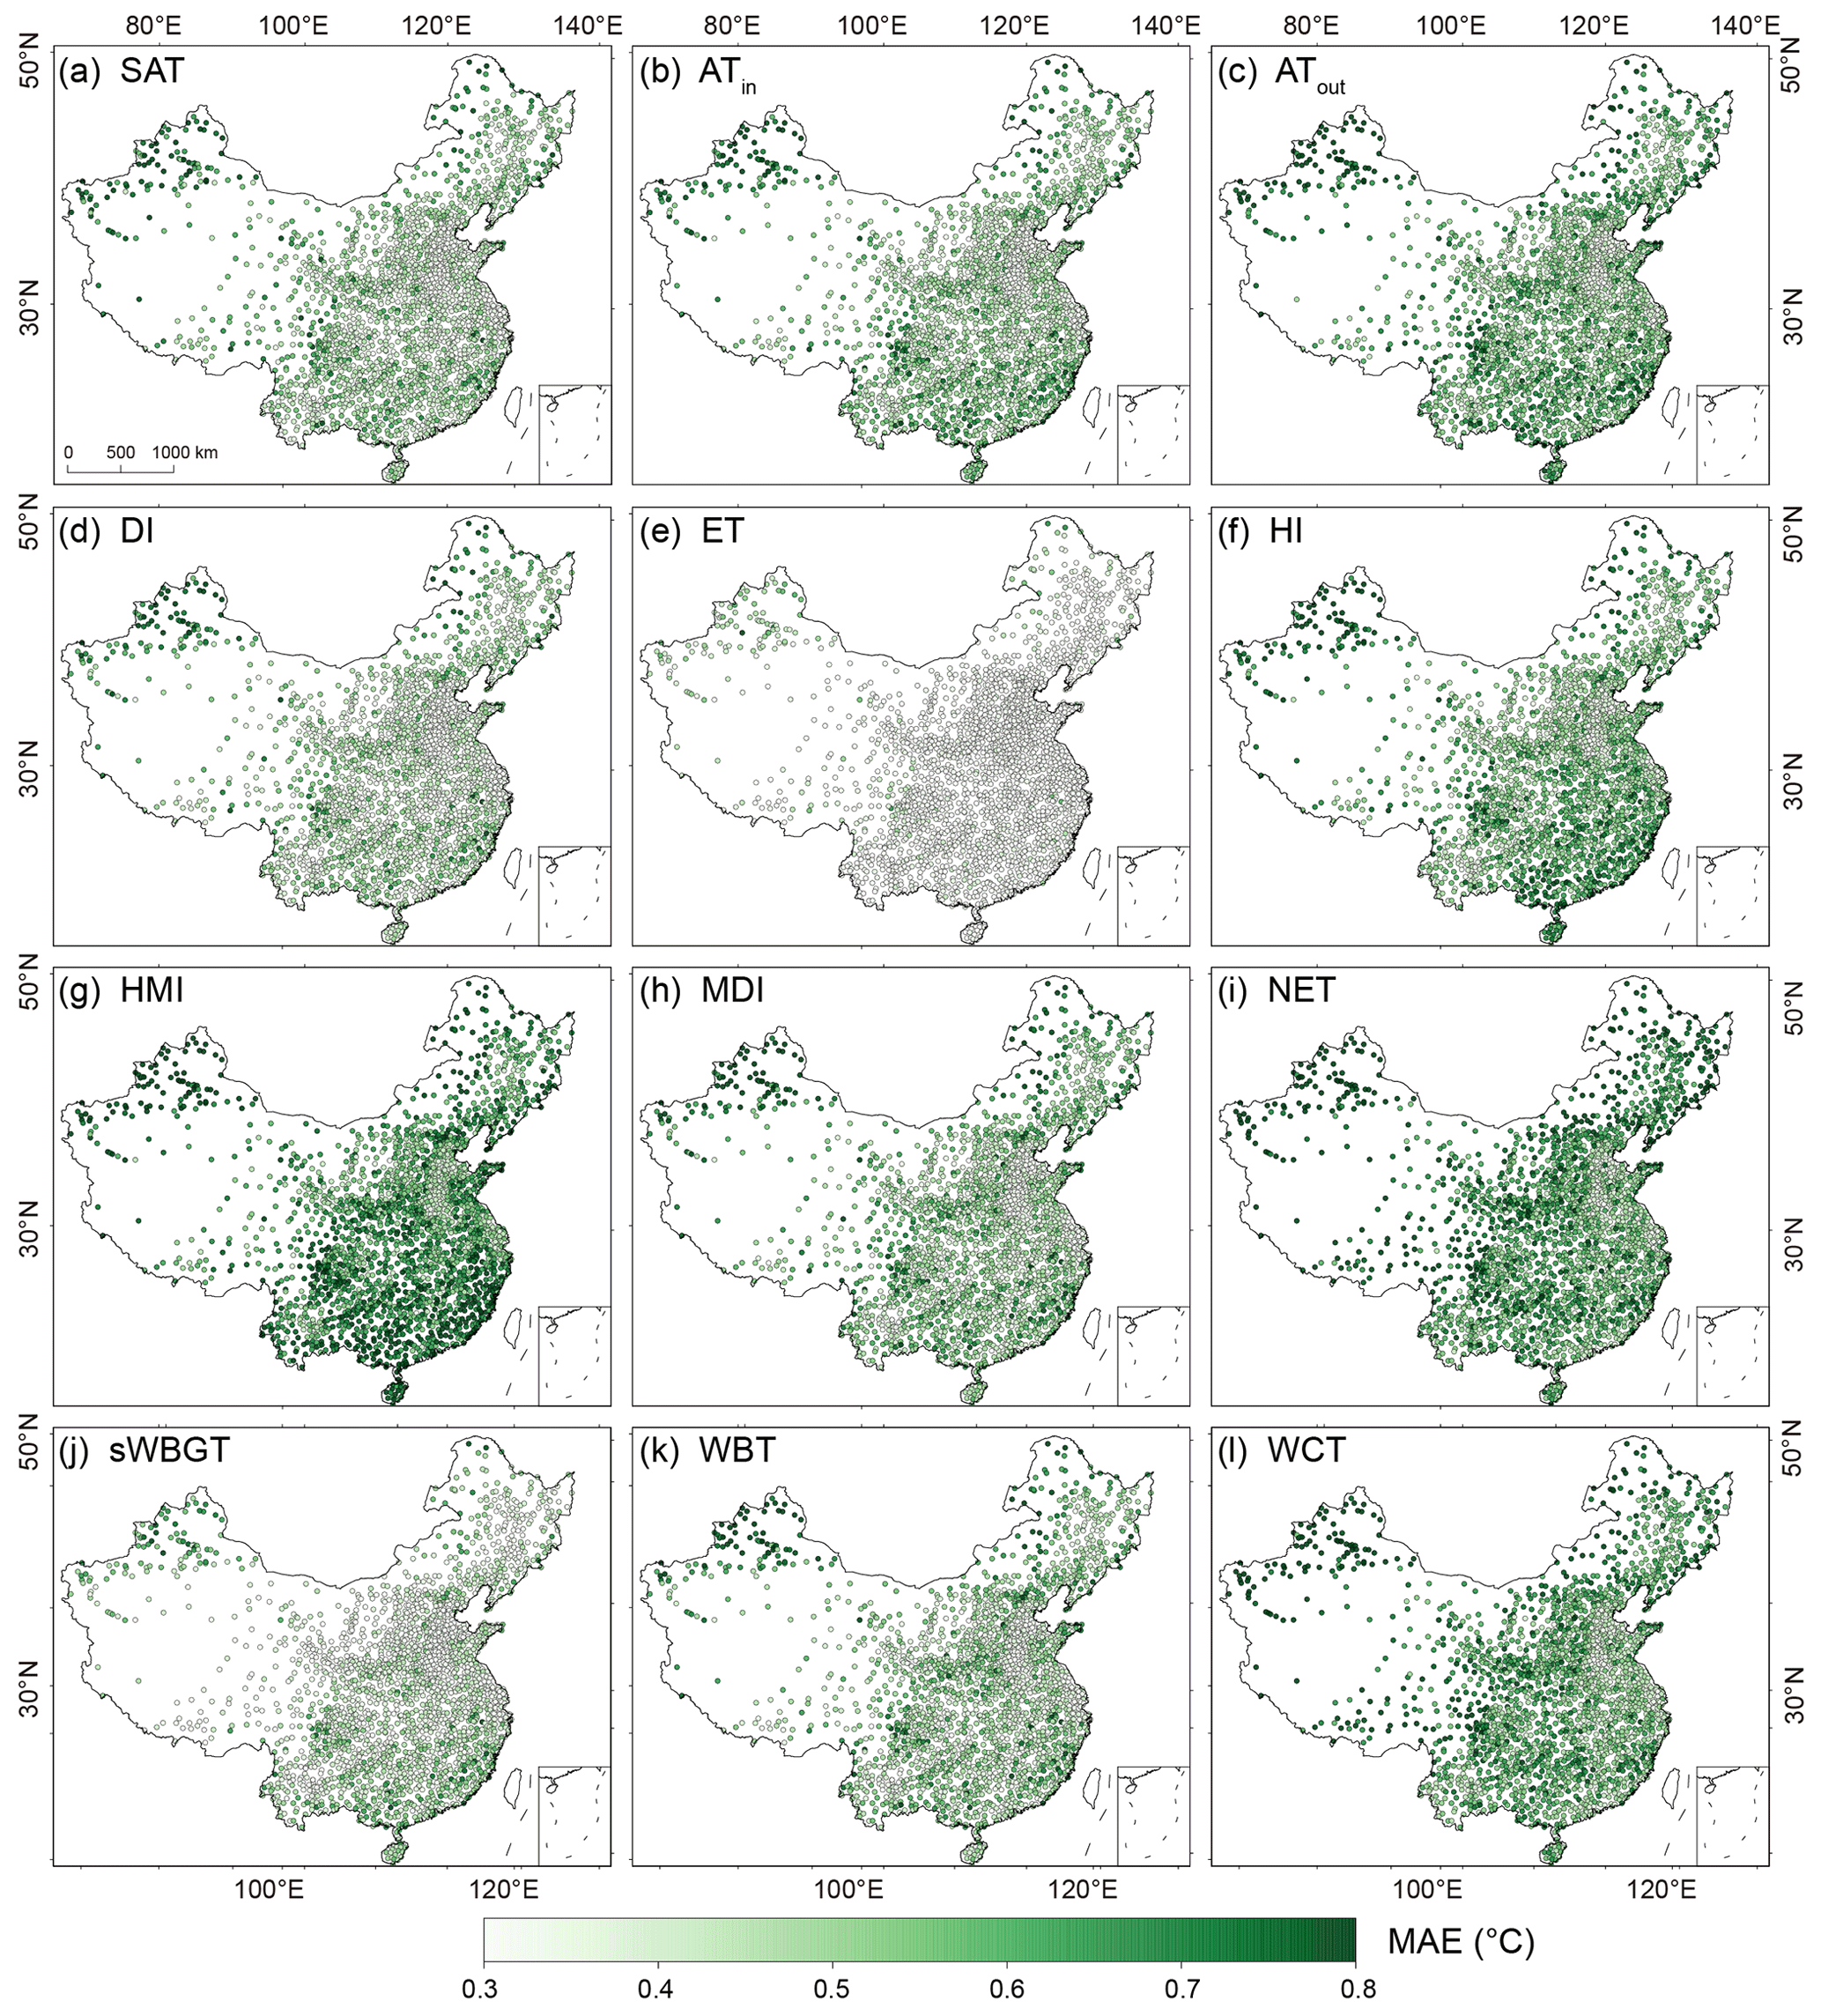
Figure 5As Fig. 4 but for MAE.

Figure 6As Fig. 4 but for RMSE.
The spatial distributions of R2, MAE, RMSE, and bias at individual stations across the mainland of China are depicted in Figs. 4–7, respectively. The predicted indices have high R2 values (i.e., >0.98, Fig. 4) at almost all stations across China, demonstrating the superiority of LightGBM. Better predictions (with higher R2) are distributed in eastern China, particularly in the North China Plain (NCP) and the Yangtze River Delta (YRD), while southwestern China (e.g., the Yunnan–Guizhou Plateau (YGP)) has relatively lower R2 values (<0.98). For MAE and RMSE, all indices have small values <1 ∘C at most stations across China. HMI has the largest MAE and RMSE values (Figs. 5g and 6g), followed by NET and WCT, and ET has the smallest MAE and RMSE values (i.e., <0.4 ∘C, Figs. 5e and 6e). The MAE and RMSE of NET and WCT decrease from northwestern to southeastern China (Figs. 5i, 5l, 6i, 6l). For other indices, small MAE and RMSE values are mainly observed in plains including NCP, while large values tend to appear in regions with complex topography, such as arid Northwest China, mountainous Northeast and South China, and the Hengduan Mountains. These differences are related to the uneven distribution of weather stations, i.e., dense in plains and coarse in complex terrain areas. The bias values range from −0.3 to 0.3 ∘C (Fig. 7). Positive bias values tend to be distributed in northern China while negative values are mainly located in the south. This spatial variability is likely caused by the generally lower temperatures in the north and higher temperatures in the south. In particular, the extremely small values in the north and the extremely large values in the south may be overestimated and underestimated to some extent, respectively, due to limited samples of extremely small and large values (compared with the rest of the samples) when training the machine learning model. The overestimation and underestimation issues caused by limited training samples of extreme values are quite common in machine learning (Wu et al., 2022; Li et al., 2020; Uddin et al., 2022; Cho et al., 2020).
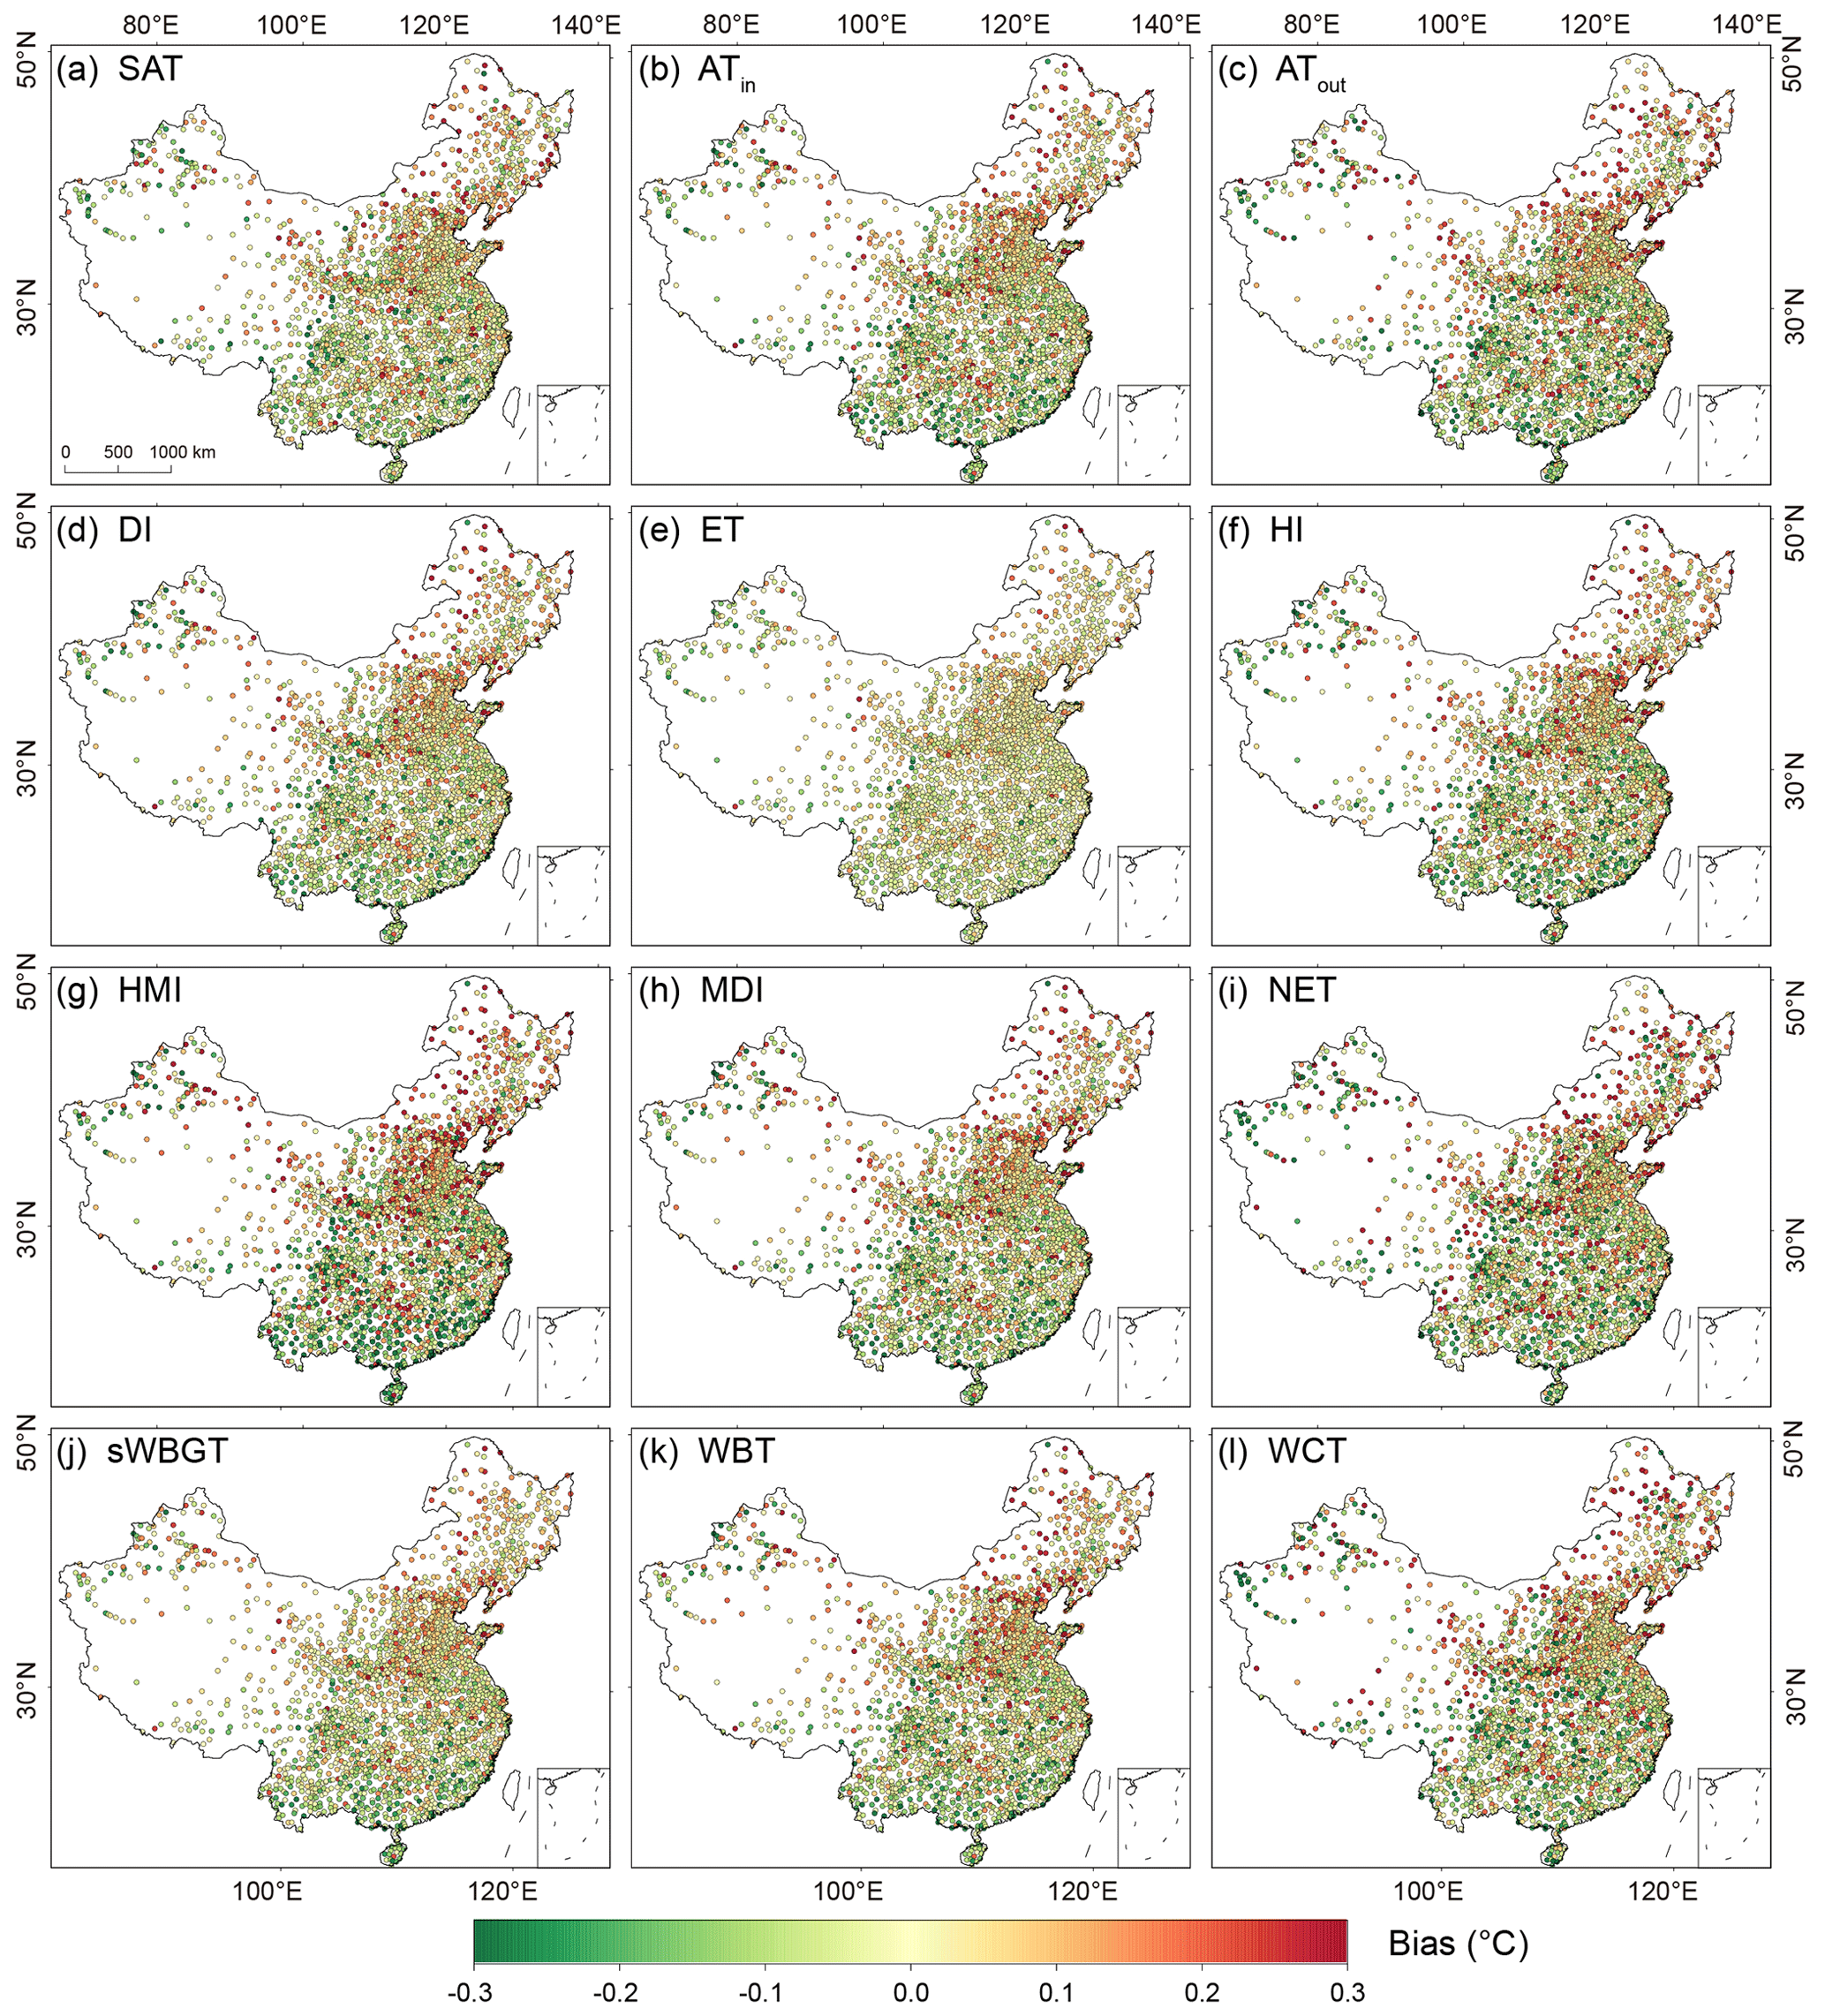
Figure 7As Fig. 4 but for bias.
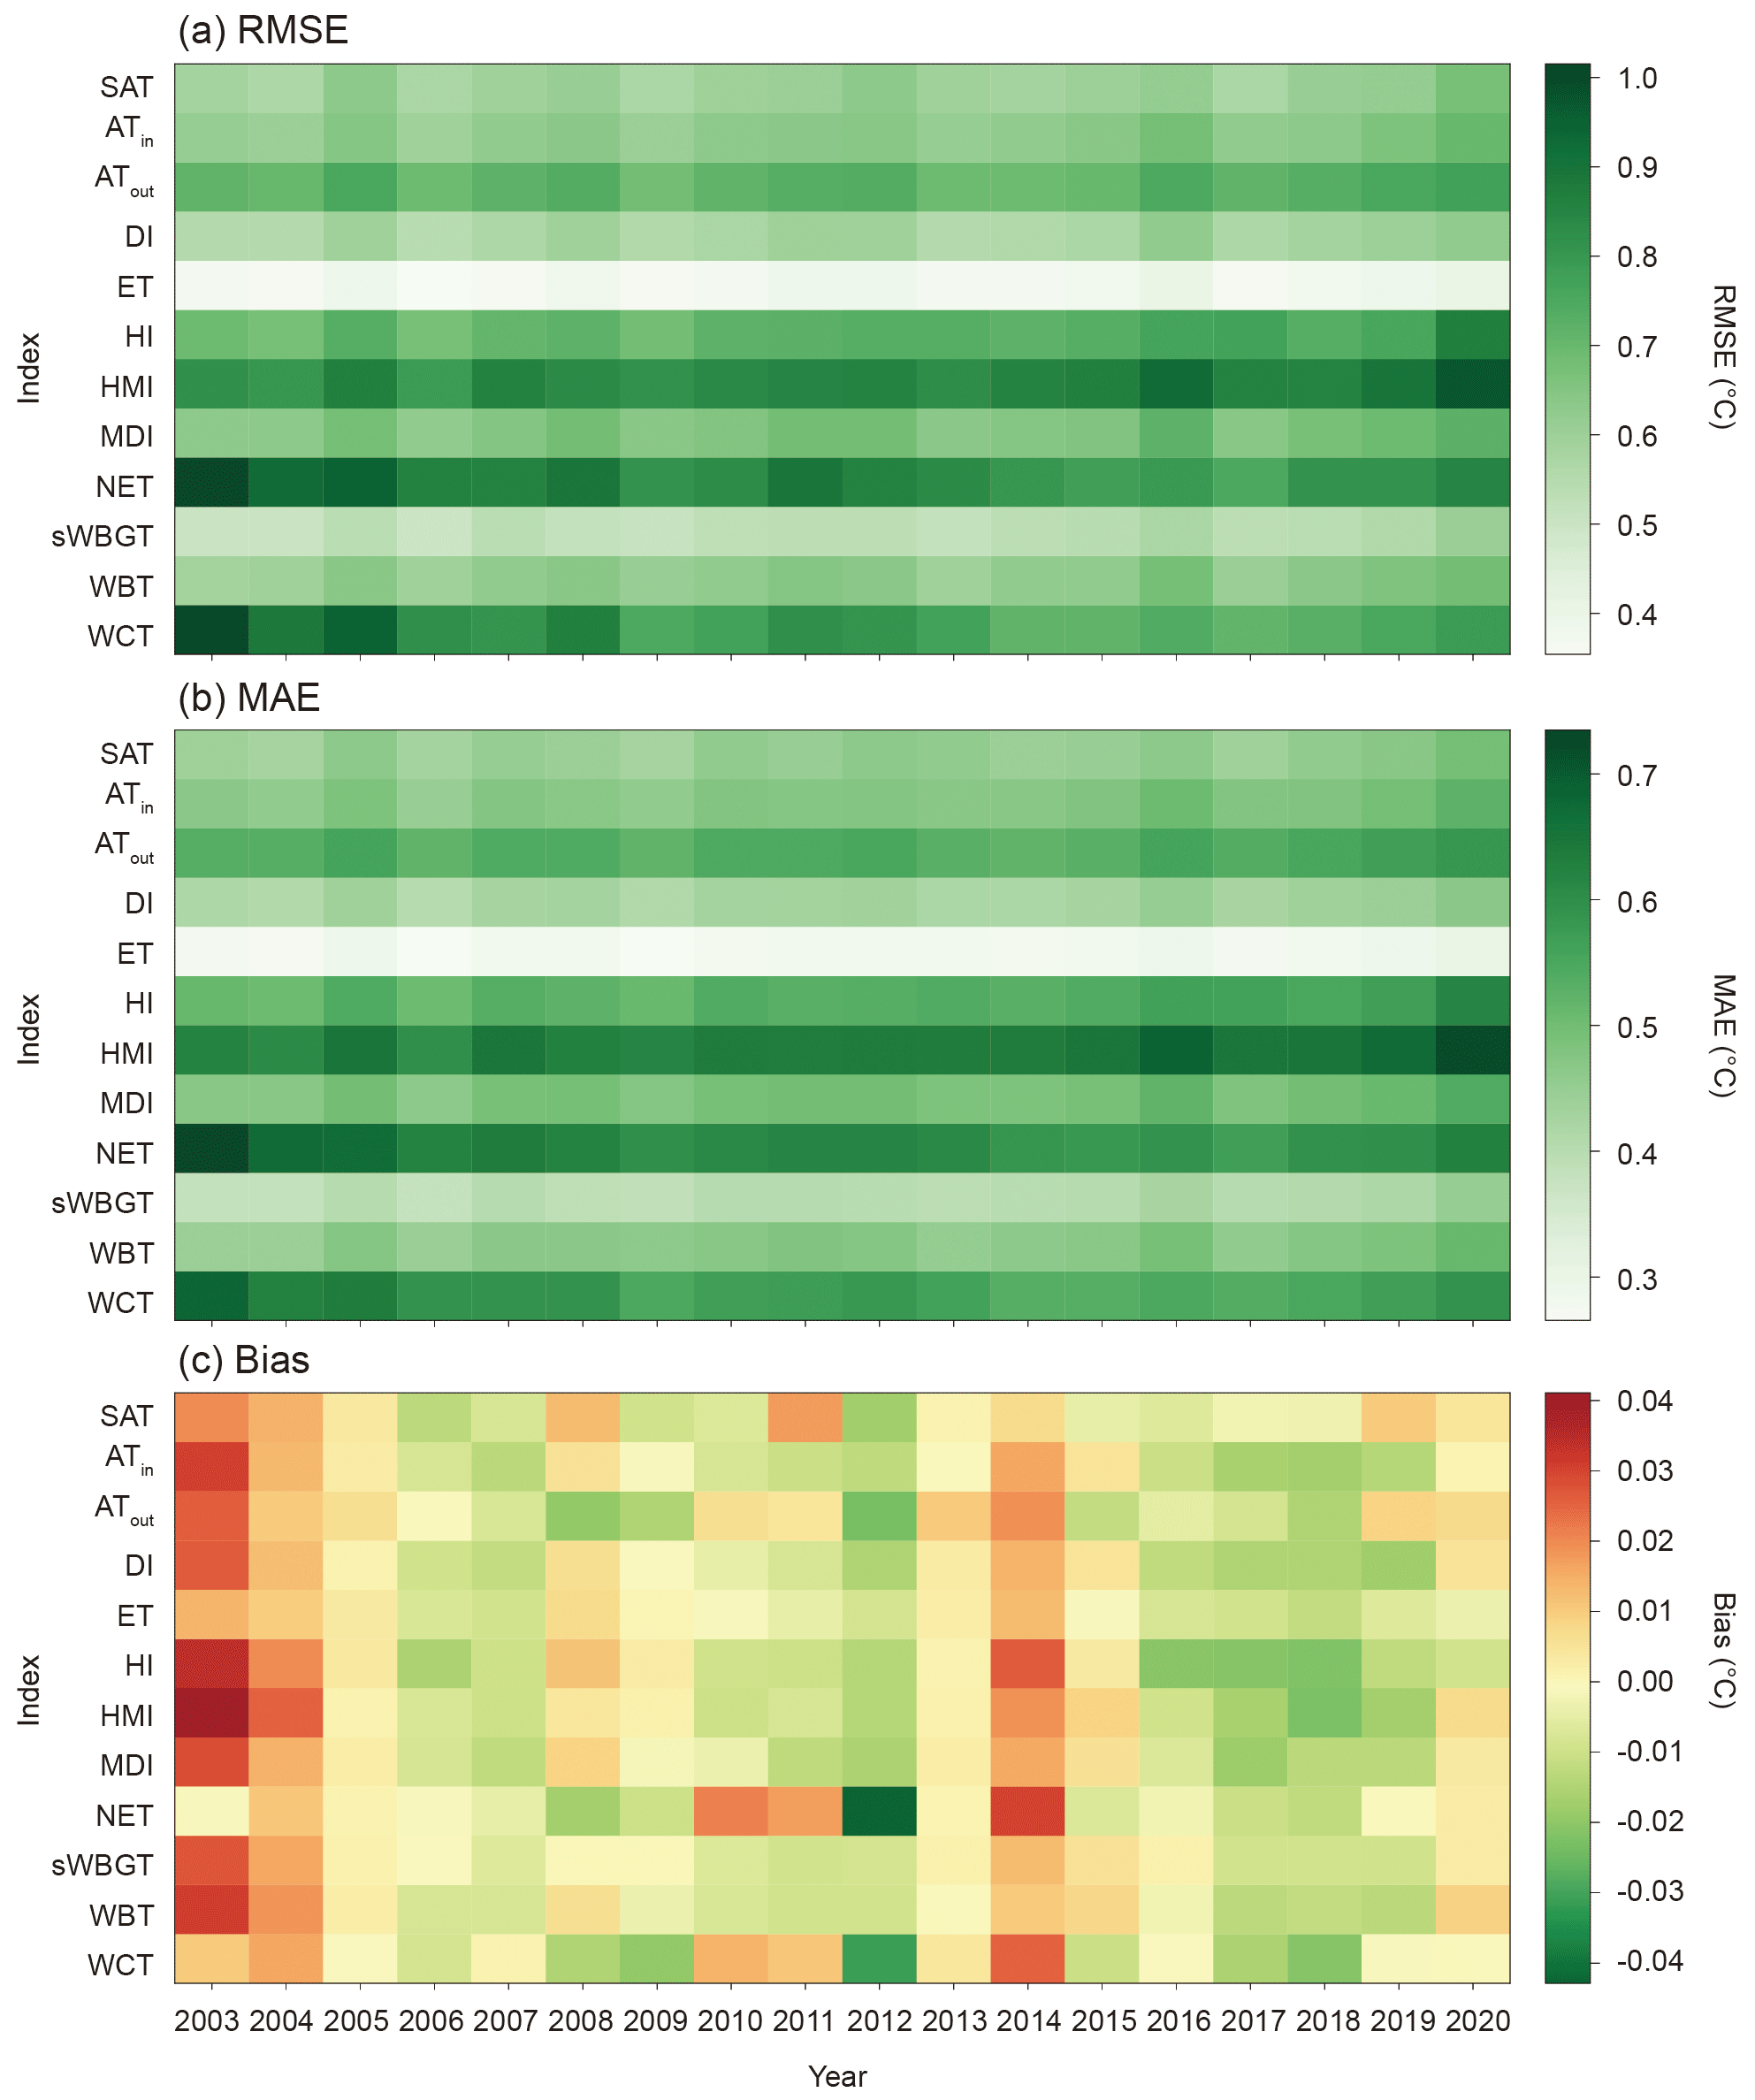
Figure 8Annual prediction accuracies of the 12 human thermal indices over the mainland of China during 2003–2020: (a) RMSE, (b) MAE, and (c) bias.
4.1.2 Annual and monthly accuracies
The annual accuracies regarding RMSE, MAE, and bias of the 12 human thermal indices during 2003–2020 are shown in Fig. 8. RMSEs and MAEs of all indices in nearly all years are less than 1.0 ∘C (Fig. 8a–b). Yearly RMSE (MAE) of ET fluctuates around 0.3 ∘C (0.2 ∘C) during 2003–2020. RMSEs (MAEs) of other indices range from 0.5 to 1.1 ∘C (0.4–0.8 ∘C) with marginal variations from year to year. Biases vary between −0.04 and 0.04 ∘C across all years. This temporal variability of the bias is related to the yearly climate variations and is characterized by a marginal overestimation of lower temperatures that mainly appeared in early periods (e.g., 2003–2005) and the underestimation of higher temperatures mostly in recent periods (e.g., 2016–2019). Under climatic warming over the past decades, the lower temperatures tended to appear in early periods while relatively higher temperatures more likely occurred in more recent periods. Extremely small values of temperature in earlier periods and the large values in the later periods may be slightly overestimated (i.e., with positive bias values) and underestimated (i.e., with negative bias values), respectively, thereby characterizing the temporal variations of the bias. Moreover, Fig. S1 in the Supplement displays the monthly RMSEs, MAEs, and biases of all human thermal indices. For RMSE, all the indices in 12 months are lower than 1.4 ∘C, and their MAEs are less than 1 ∘C. HI and HMI have relatively higher RMSE and MAE values in summer than in other seasons, whereas other indices tend to have larger errors in winter than in summer. Additionally, the magnitude of bias is smaller than 0.03 ∘C for all the indices in 12 months.
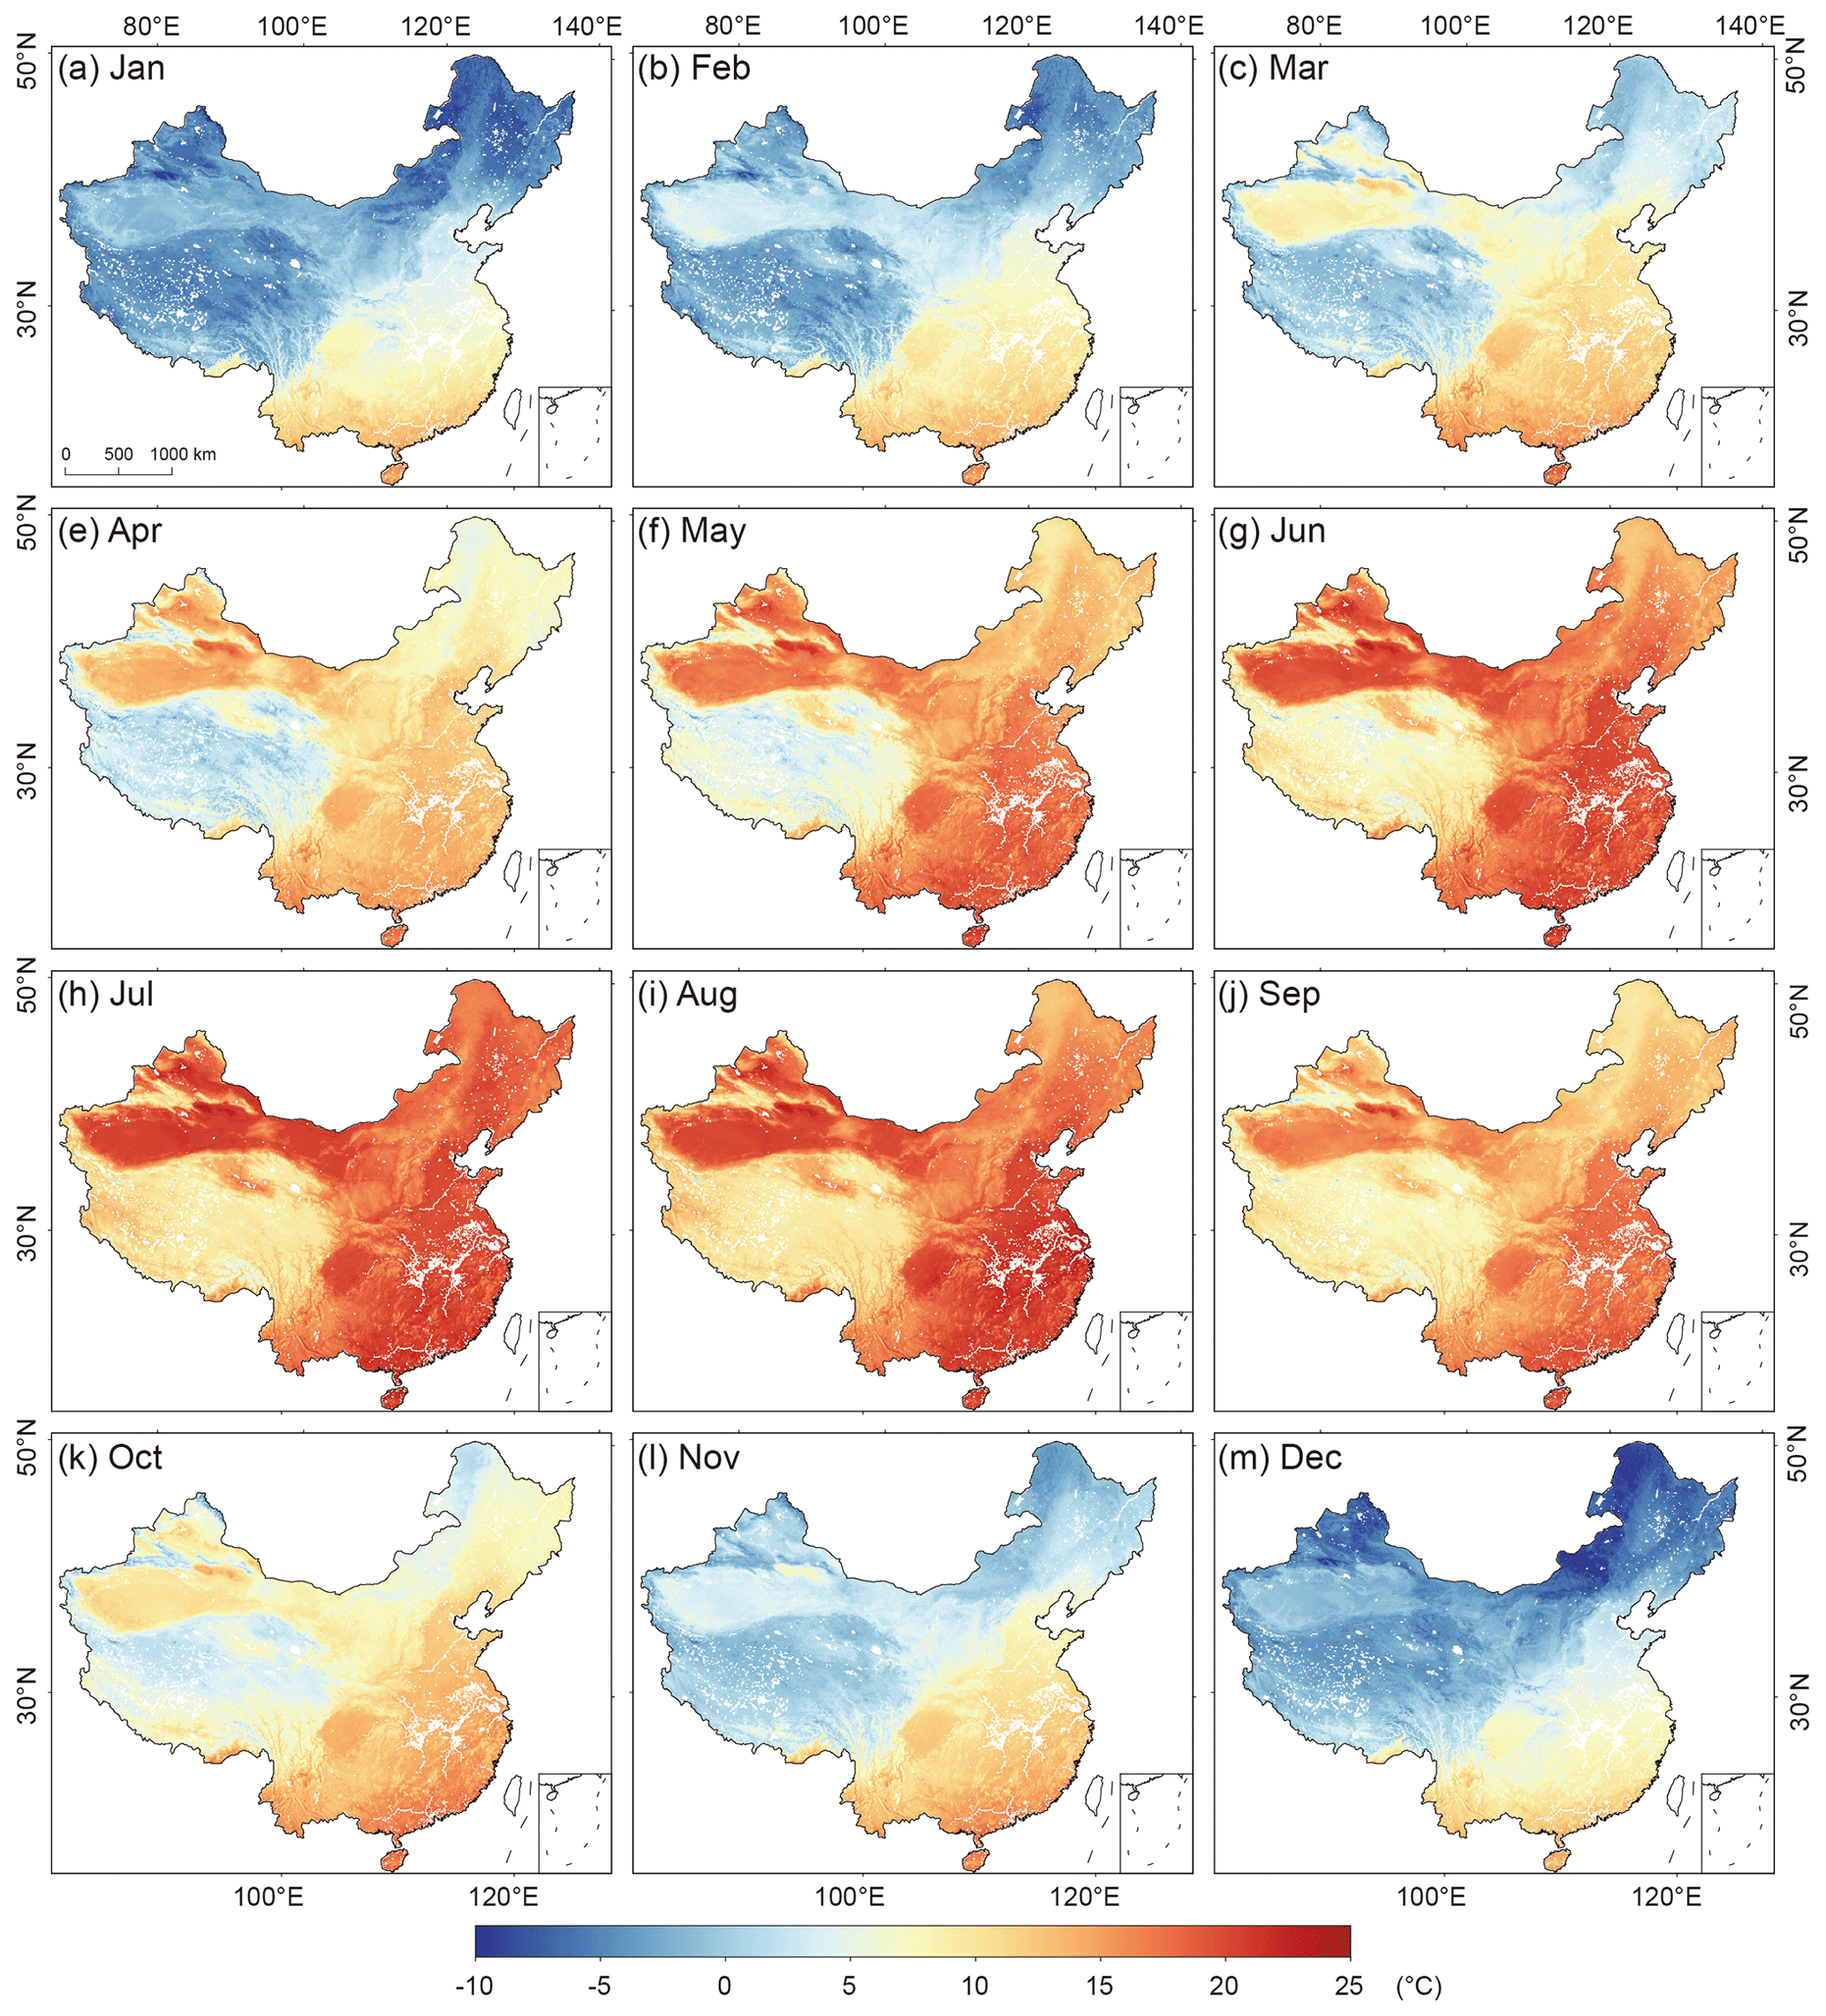
Figure 9Spatial distributions of the monthly mean ET over the mainland of China in 2020.
4.1.3 Accuracies in major urban agglomerations
More than half of the national population in China lives in cities, particularly in UAs (i.e., also known as city clusters). Here we assessed the prediction accuracies in 20 major UAs in China, which hold 62.83 % and 80.57 % of the total population and gross domestic product (GDP) of the country (Fang and Yu, 2016). These accuracy assessments are presented in Tables S1–S4 in the Supplement. As shown in Table S1, all UAs have R2 values higher than 0.9837, with an average of 0.9947. Table S2 also shows that these UAs have small RMSE values, most of which are smaller than 1 ∘C, except for the UA of northern Tian Shan in arid Northwest China. As the biggest UA in China, YRD has the lowest RMSE of 0.288 ∘C among all 20 UAs. The MAEs of the thermal indices in all UAs are smaller than 1 ∘C and with an average value of 0.477 ∘C (Table S3). The biases in the 20 UAs range from −0.160 to 0.123 ∘C (Table S4). These results suggest that all predicted human thermal indices in different UAs across China are of good quality at the local scale. It implies that our prediction model and results have great potential in evaluating local thermal environment changes (e.g., in urban areas or cities).
4.2 Spatial variations of the human thermal indices
The abovementioned assessments show that our model based on LightGBM can yield high-accuracy predictions at both national and local scales. Therefore, this model is employed to generate a high-resolution human thermal index collection at a monthly scale over China (HiTIC-Monthly) during 2003–2020. By taking monthly ET in 2020 as an example, we examined the monthly evolution of spatial patterns of the HiTIC-Monthly dataset in this subsection.
Figure 9 shows the monthly distribution of the predicted ET in 2020, which exhibits obvious seasonality with higher temperatures in summer and lower in winter. The temperature shows a significant zonal difference with colder temperatures in northern than in southern China. The temperature has a close relationship with topography and decreases with elevation, varying from plateaus to plains. The Qinghai–Tibet Plateau (TP) has the lowest temperature, while southern China, the Sichuan Basin, and the Gobi regions in Northwest China witness the highest temperatures. The distribution of temperature exhibits different patterns among the four seasons, especially between winter (e.g., January) and summer (e.g., July). In winter, the temperature increases from northern to southern areas and is the coldest in Northeast and Northwest China and the warmest on the island of Hainan. In the summer, the hottest temperature appears in the Tarim and Junggar basins of Xinjiang. The NCP region also has a high temperature in summer, which might be related to local urbanization (Liu et al., 2008) and irrigation (Kang and Eltahir, 2018).
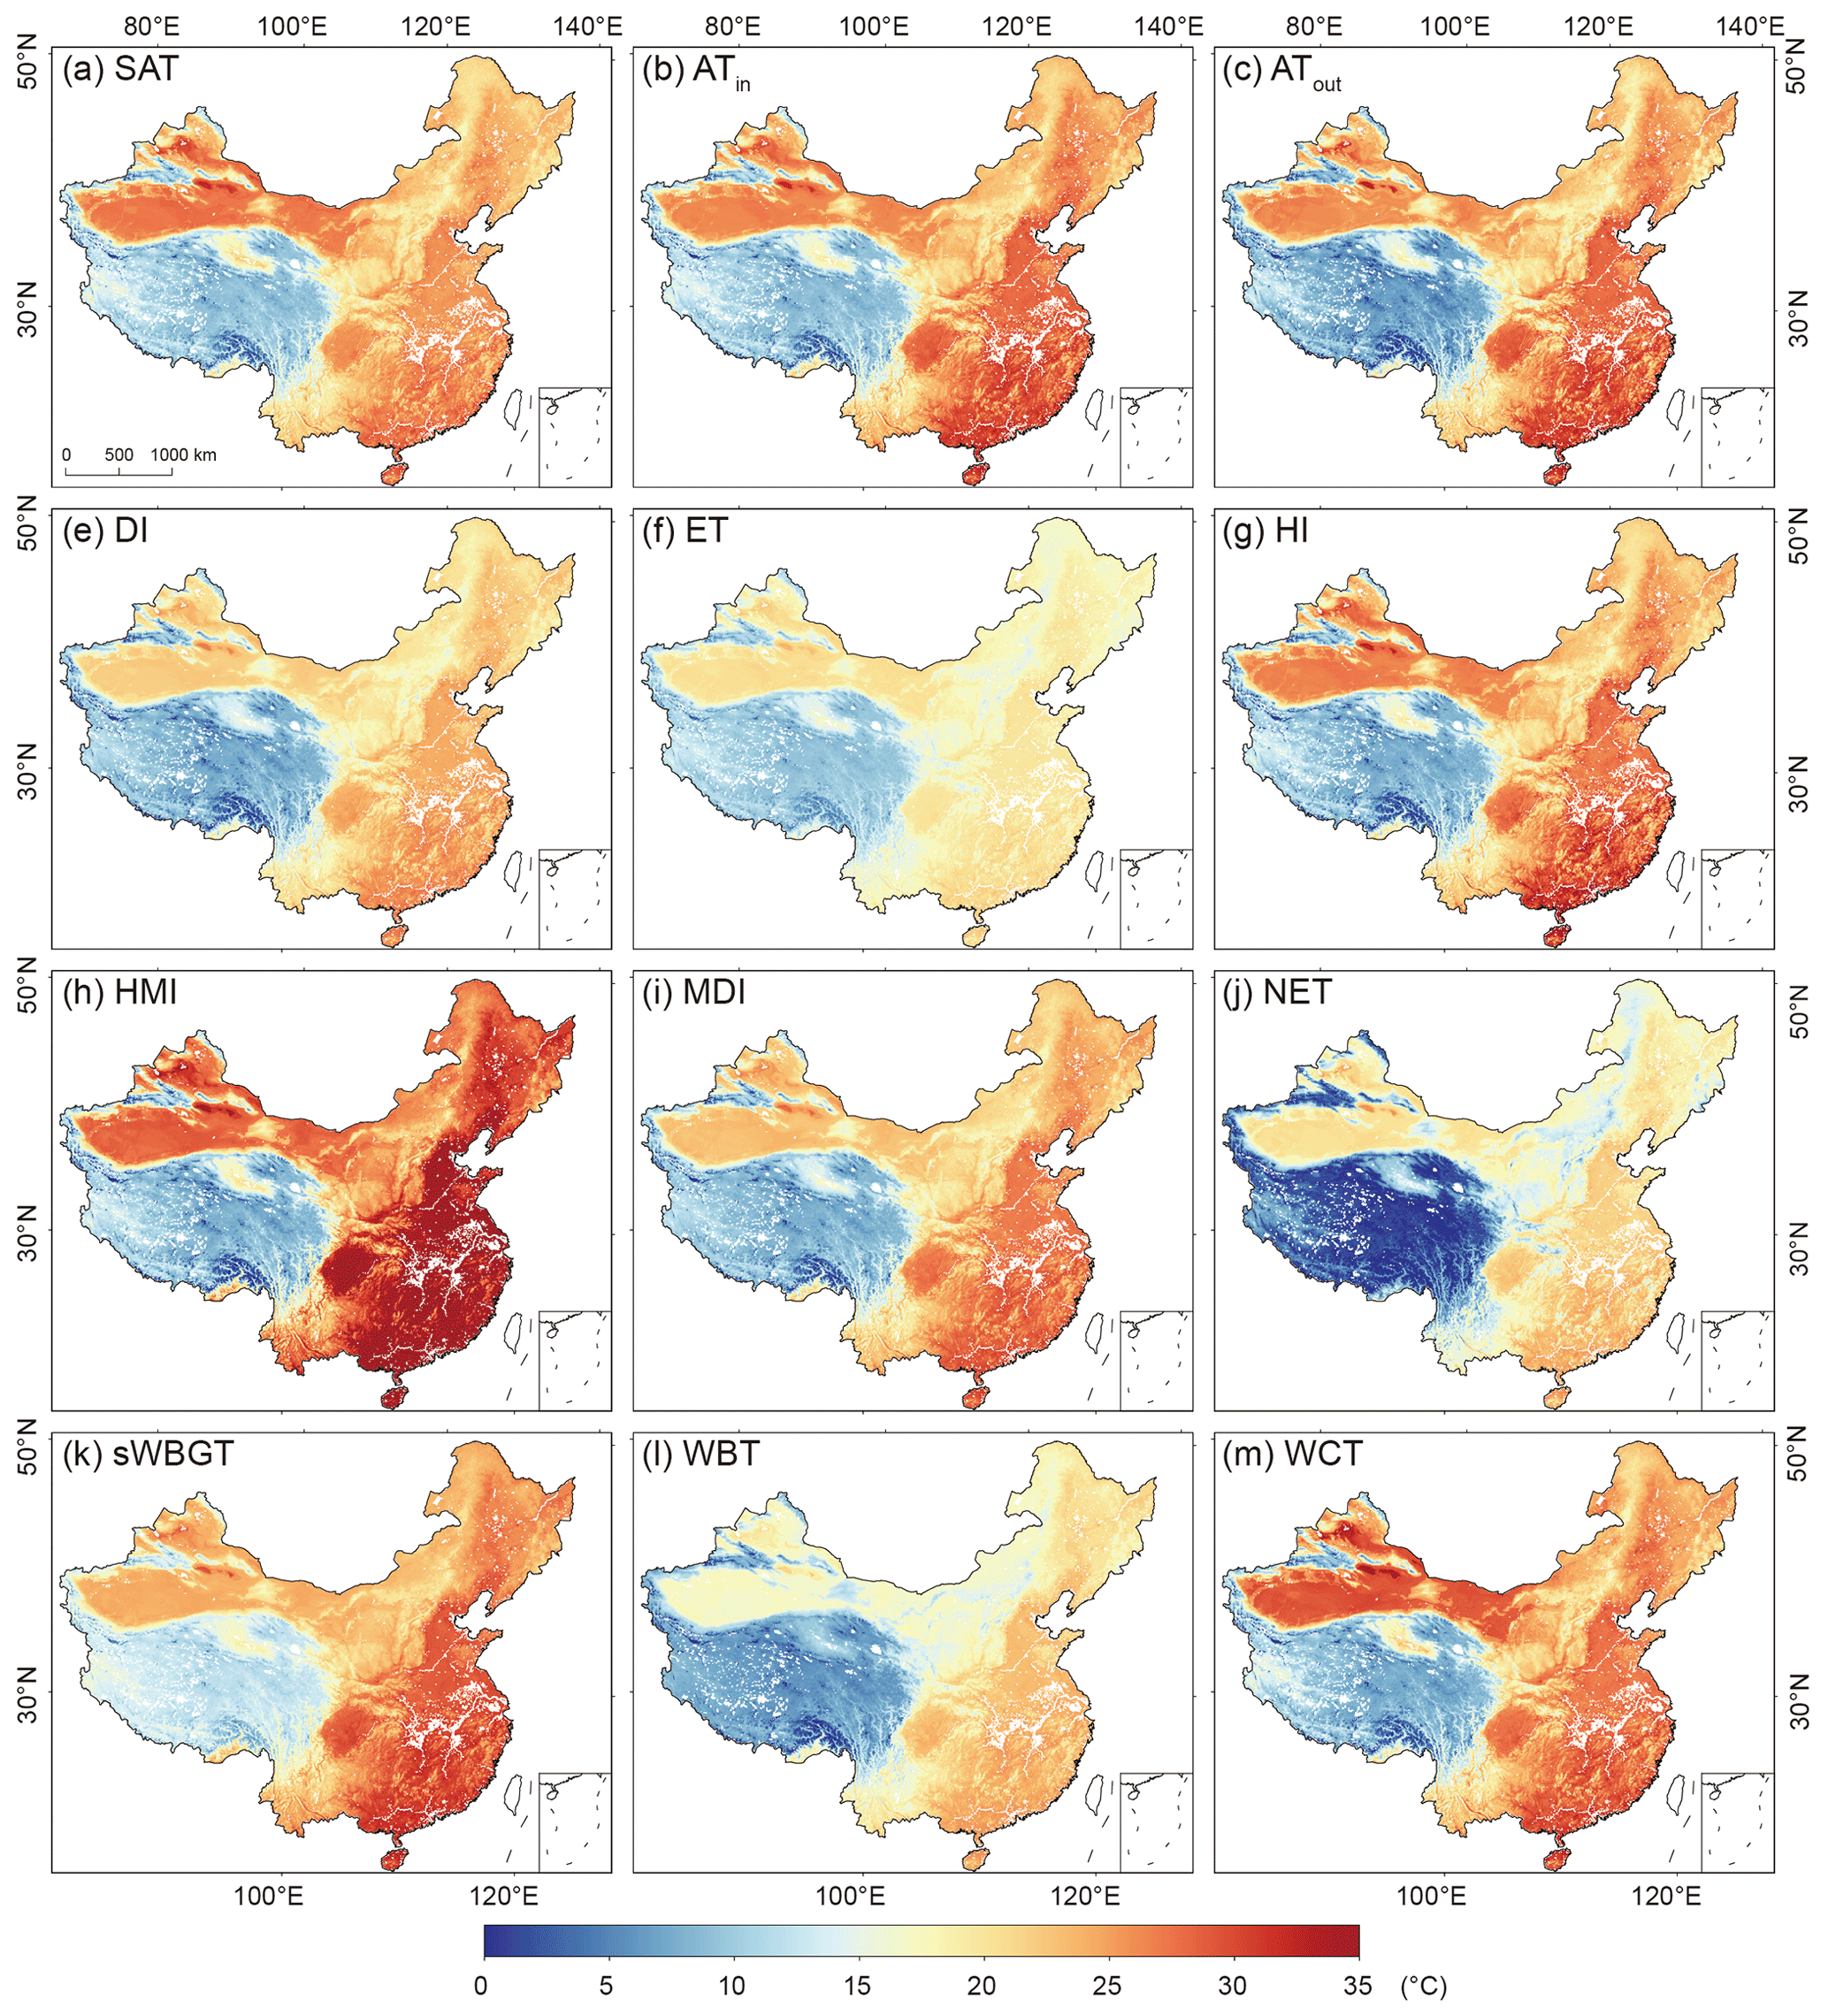
Figure 10Spatial distributions of the 12 human thermal indices over the mainland of China in July 2020.
The spatial variations of the predicted human thermal indices in summer (which is often characterized by severe heat stress) are examined in Fig. 10 by taking July 2020 as an example. As it shows, the 12 indices exhibit similar distribution patterns. There are significant differences in temperature among Northwest, northeastern, and southeastern China. Generally, the temperature decreases from the southeast to the northwest, and the southeast and northwest parts have the highest and lowest temperatures, respectively.
HMI exhibits the highest temperature while NET shows the lowest in July 2020. The dominant modes of these indices are further examined by applying the empirical orthogonal function (EOF) analysis (Figs. S10–S13). As Fig. S10 shows, the leading EOF (EOF1) of all 12 thermal indices exhibit highly consistent spatial distribution with higher values in the northern region and lower values in the south. Their temporal variations are also similar to each other (Fig. S11). The second and third EOF modes (EOF2 and EOF3) are also similar among different thermal indices (except EOF3 of NET, Figs. S11–S13). These results demonstrate the desirable quality of our products.
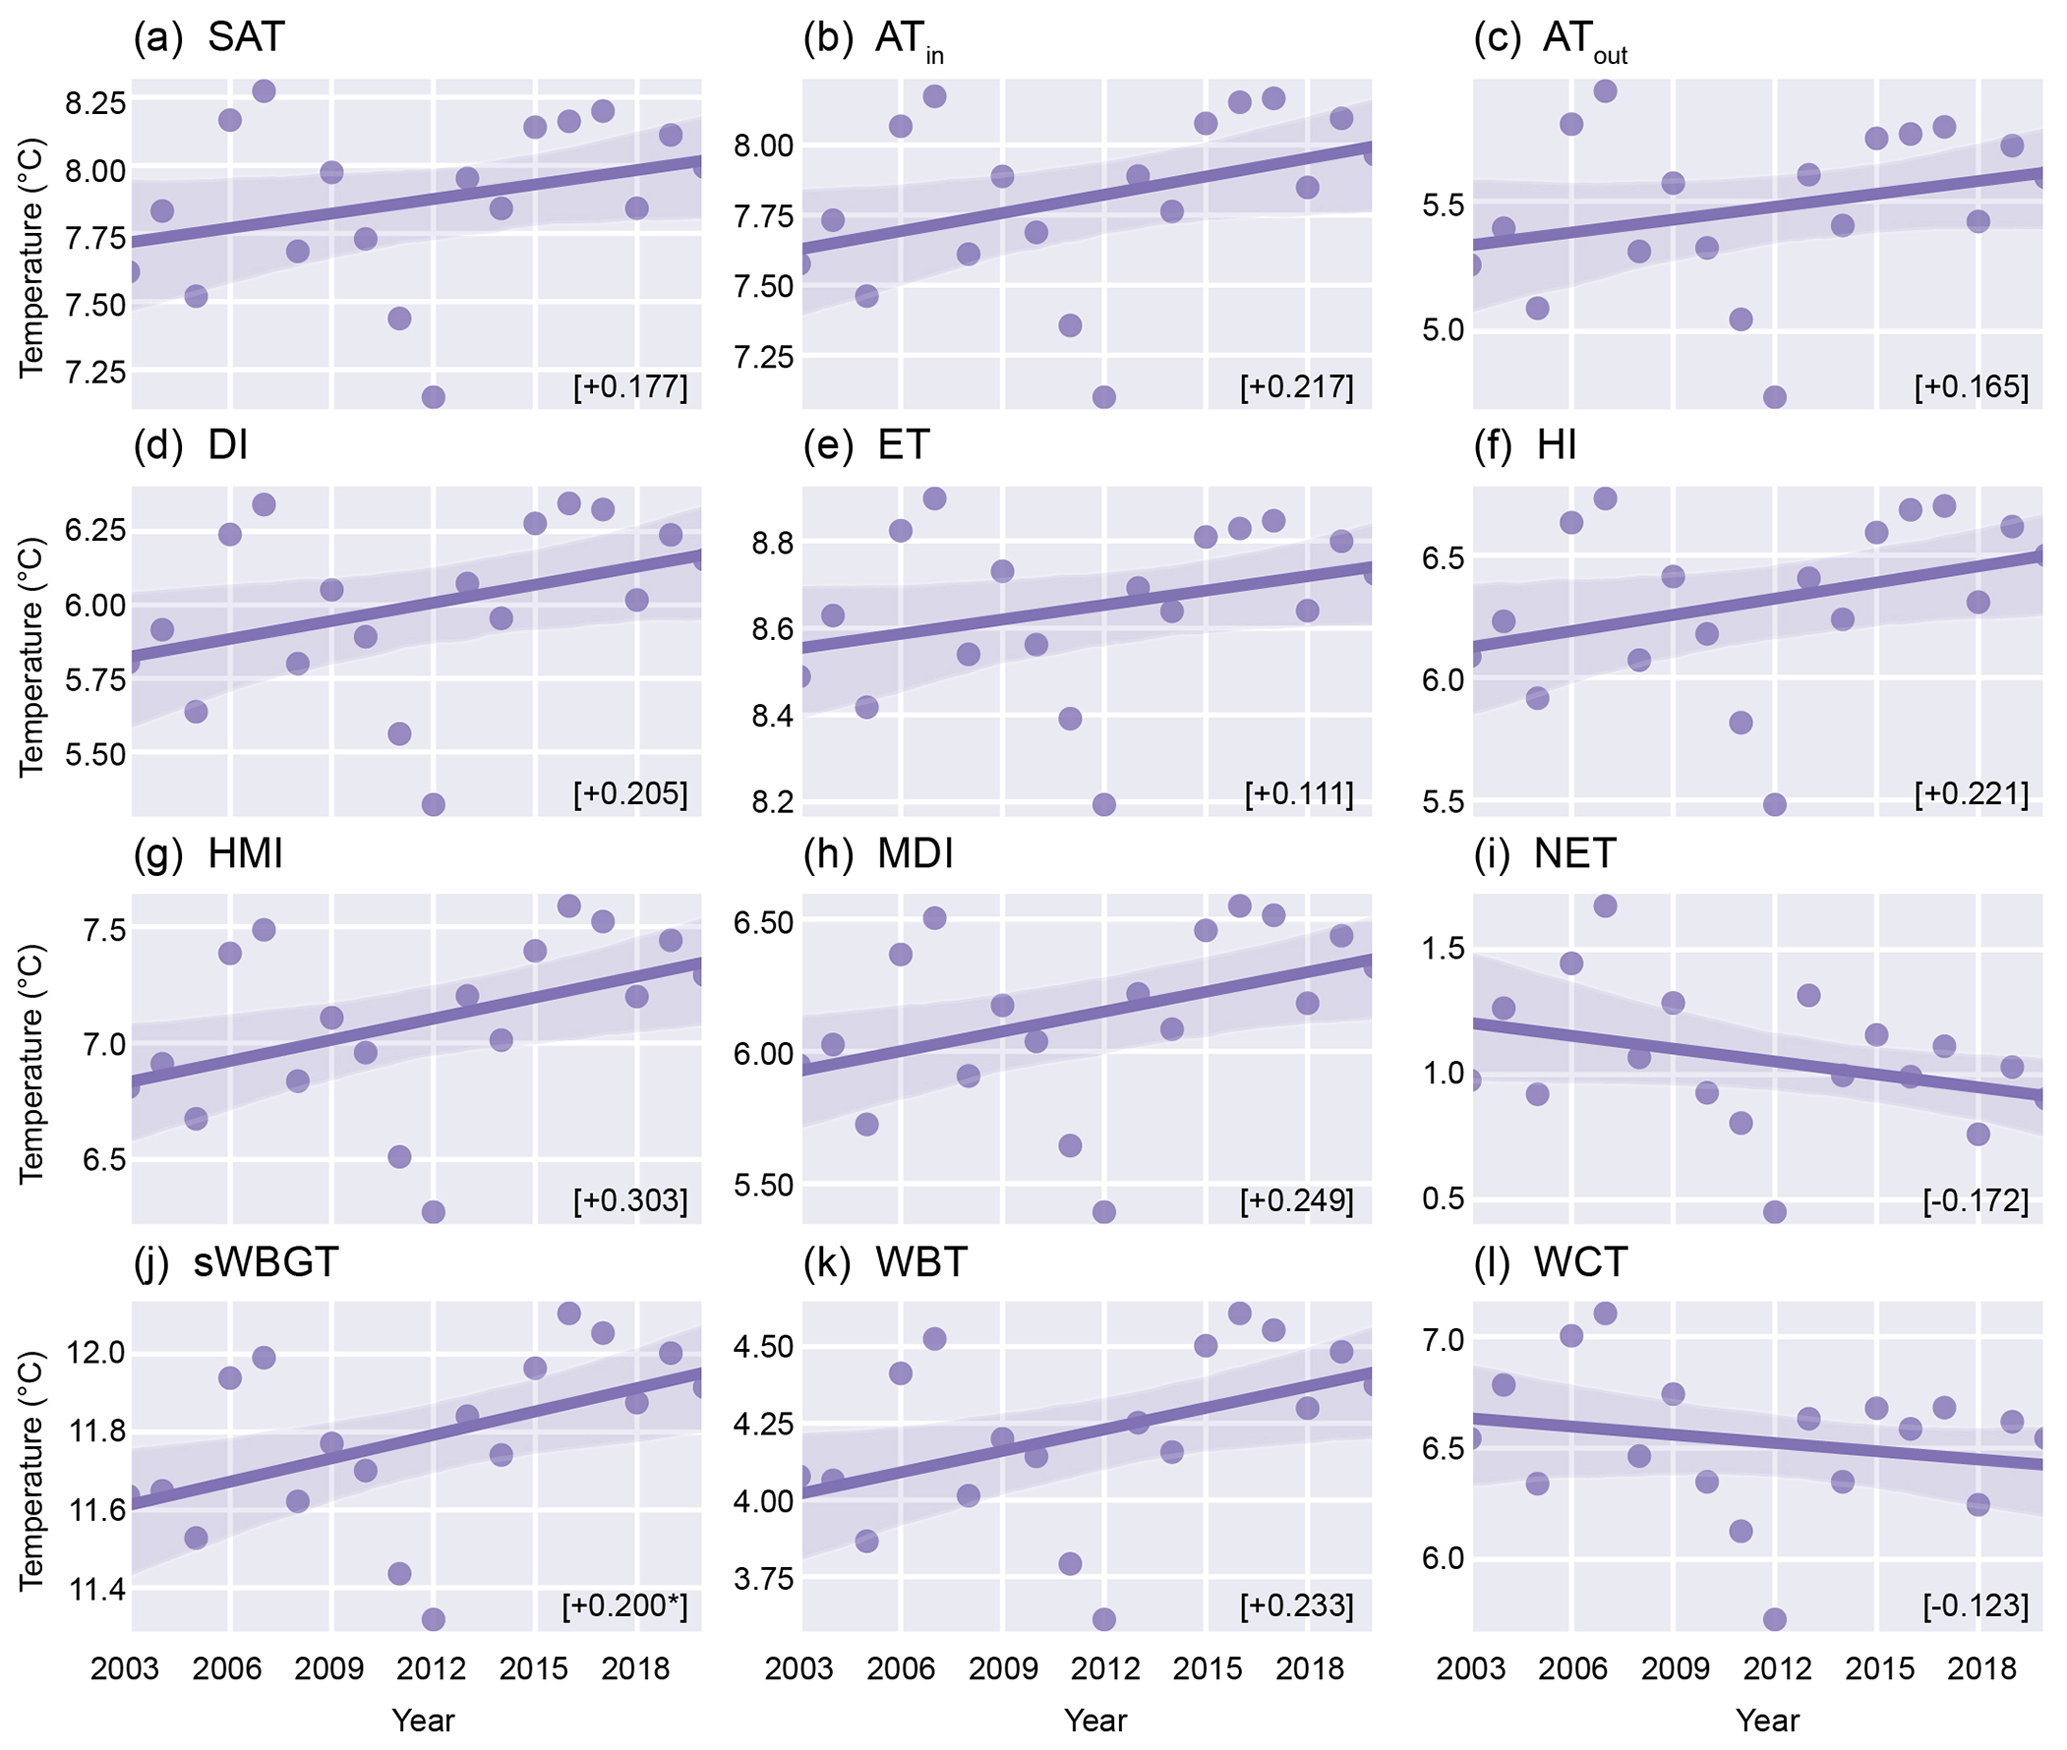
Figure 11Temporal changes of the 12 annually averaged human thermal indices over the mainland of China during 2003–2020. The line illustrates the linear trend, the number in the square bracket means the corresponding trend per decade, and the asterisk next to the number indicates that the trends are significant at the 0.05 level.
4.3 Temporal changes in the human thermal indices
The yearly evolutions of the annual mean human thermal indices during 2003–2020 are displayed in Fig. 11. Despite the interannual fluctuation in the time series, all indices exhibit upward trends except for NET and WCT, of which the decreasing trends are mainly affected by the recovering wind speed in the recent decade (Zeng et al., 2019). The fastest warming appears in HMI (0.303 ∘C per decade), and the slowest is in ET (0.111 ∘C per decade). These warming trends are stronger than the rising rate of global mean near-surface temperature (IPCC, 2021), demonstrating China as one of the severest hotspots suffering from dramatic climate warming under global change. The detailed spatial variations regarding the trends of the human thermal indices across China are further depicted in Fig. 12. Most parts of China are seen with increases in nearly all the indices during 2003–2020. These increases are especially more profound in North China, Southwest China, TP, and parts of Northwest China. The possible reasons for the prominent warming trends in North China are explained as follows. The urbanization process has been prevailing in this area, with rapid growth in the economy and population. This process is accompanied by dramatic increases in impervious surfaces and decreases in green spaces. These changes lead to warmer surface and near-surface air temperature, known as urban heat islands (UHIs), thus increasing thermal stress in this region. The urbanization effects on local heat stress have also been reported by Luo and Lau (2021). Moreover, North China has a large number of croplands with prominent irrigation activities, which may increase air humidity near the surface and exacerbate the combined effects of temperature and humidity, leading to increased heat stress (Kang and Eltahir, 2018). In addition, this area has experienced a weakening of surface wind speed (Zhang et al., 2021), which also exacerbates thermal stress, especially in NET and WCT.
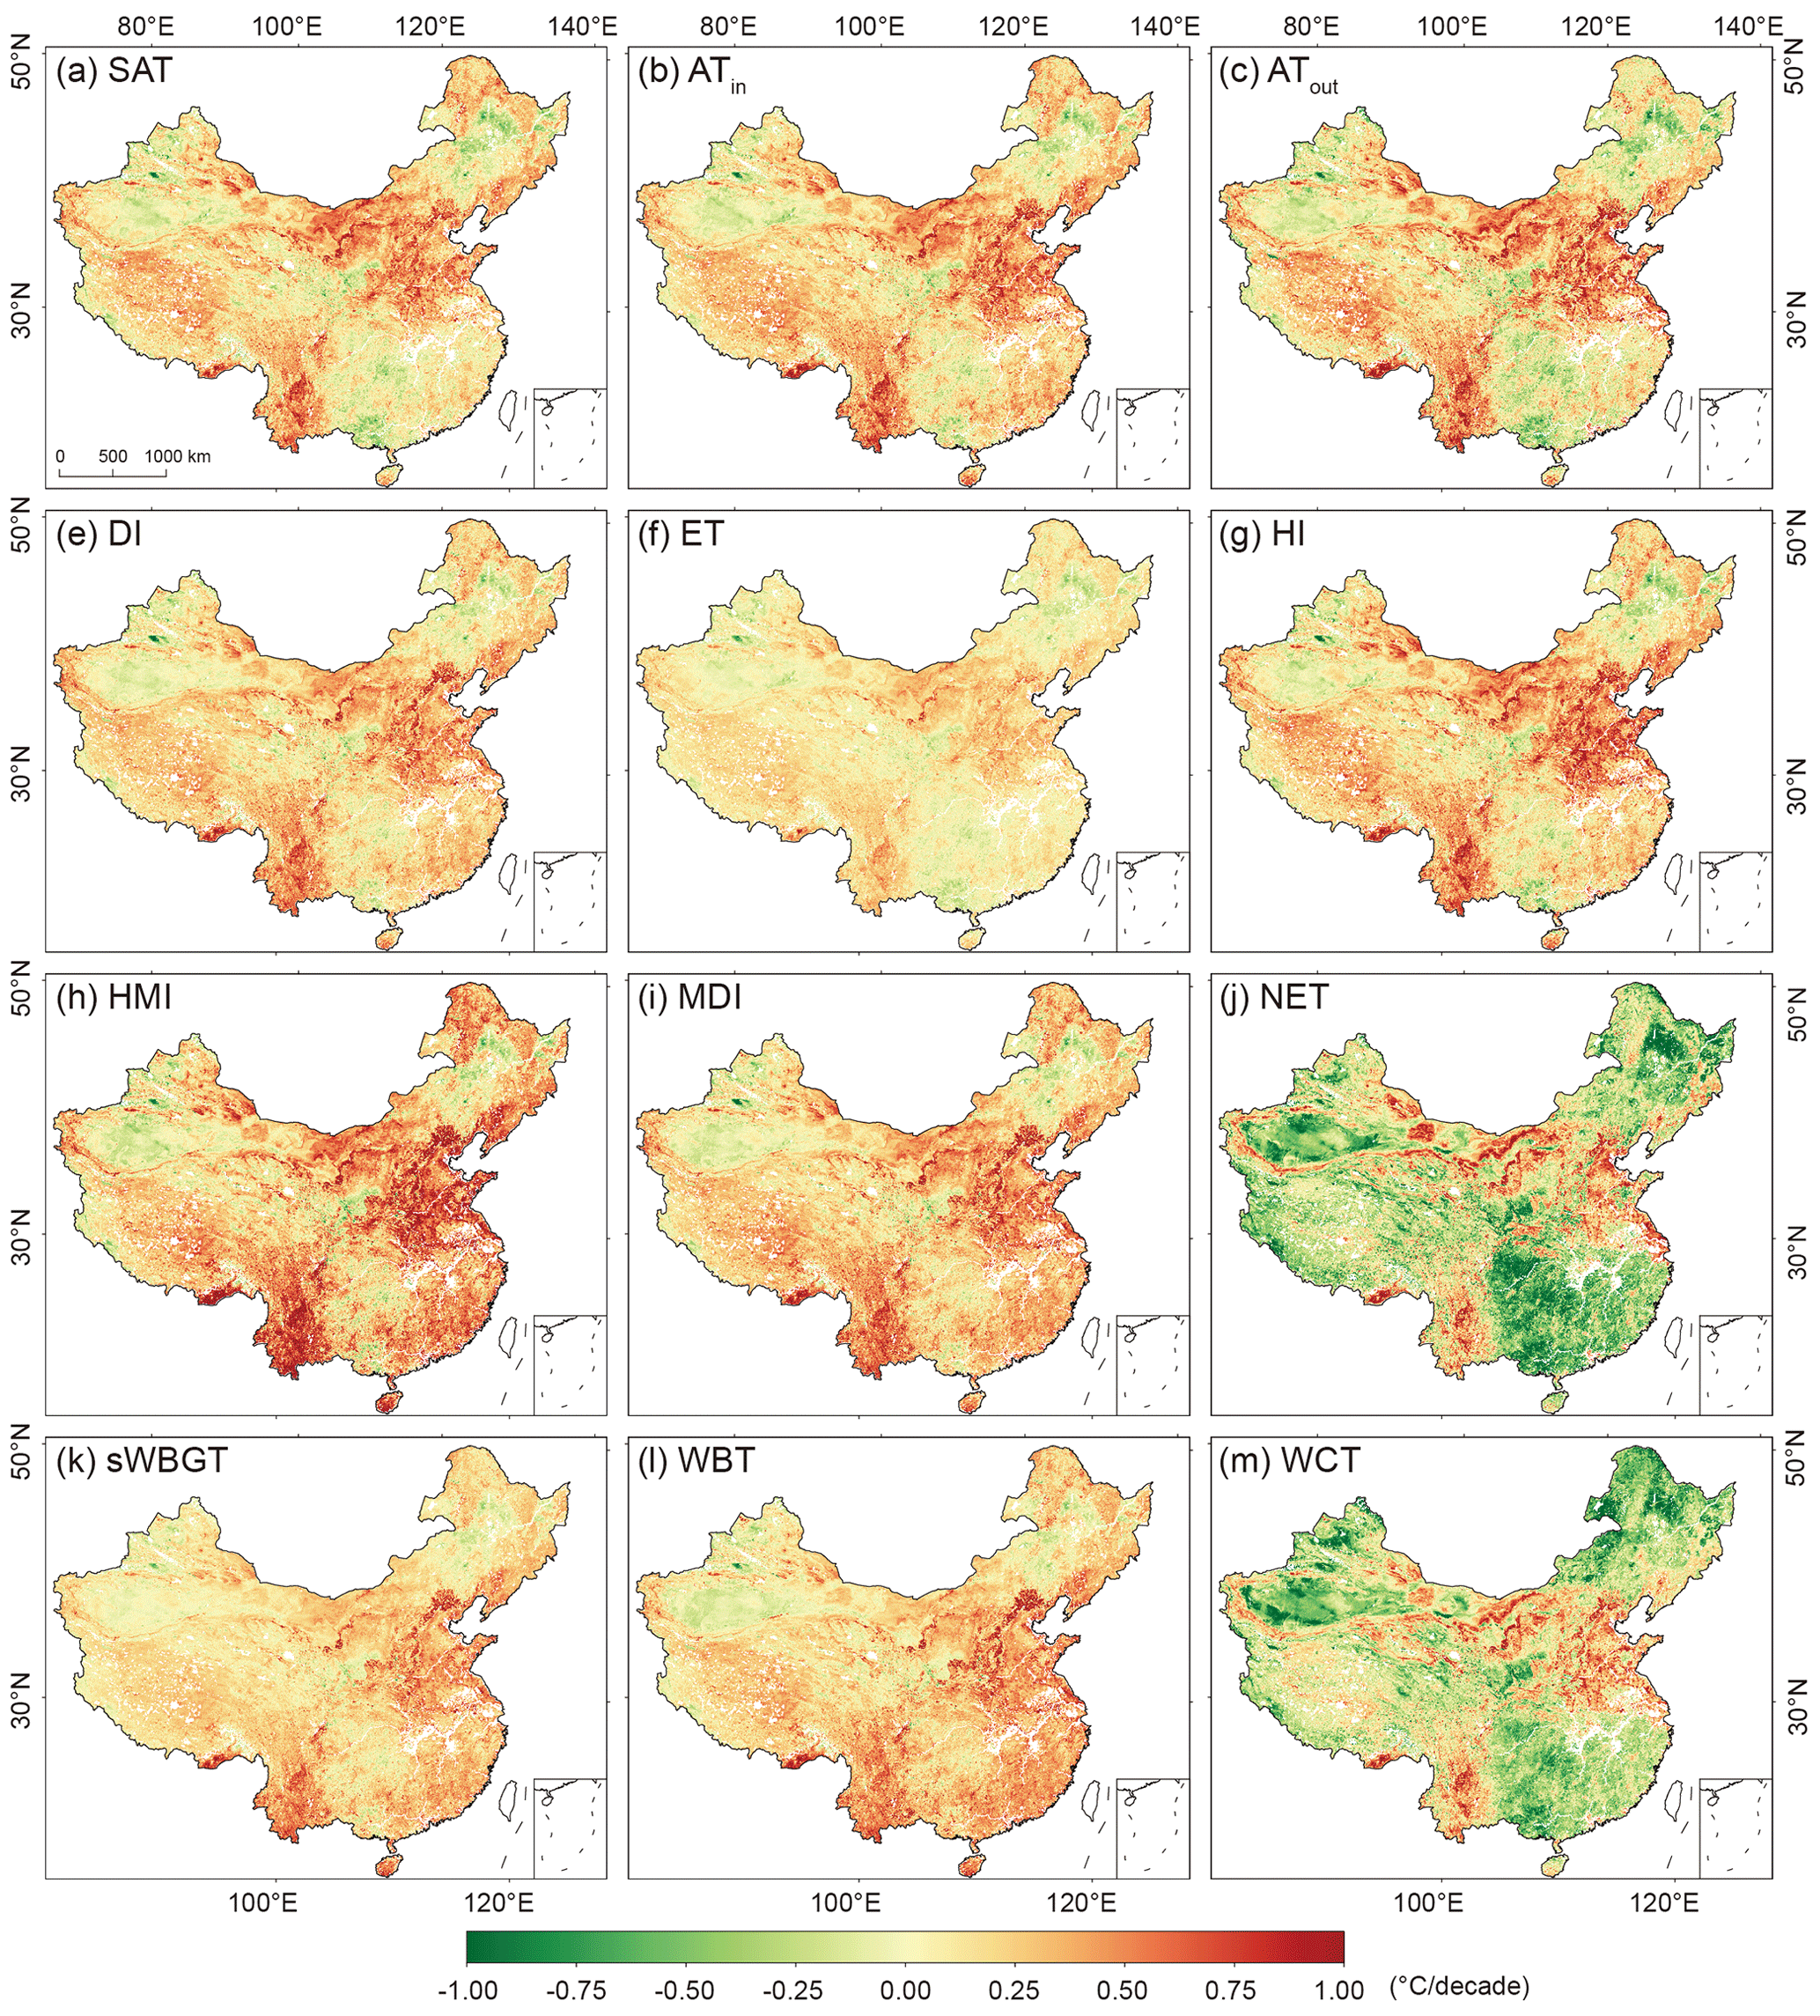
Figure 12Spatial distributions of the linear trends (unit: ∘C per decade) in the 12 annually averaged human thermal indices over the mainland of China during 2003–2020.
Furthermore, different indices have different degrees of increasing trends. HMI has the largest increasing magnitude (Fig. 12h), and ET is seen with relatively slight increases across China (Fig. 12f). The trends of NET and WCT have similar spatial distribution patterns, with large proportions having cooling trends since 2003 (Fig. 12j and l). Most parts of Xinjiang, northeastern and southern China have obvious decreasing trends, and the Inner Mongolia Plateau (IMP), NCP, eastern TP, YRD, and YGP have slightly increasing trends.
The temporal trends of the human thermal indices in different seasons were also examined (Fig. 13). The fastest warming tendency is observed in the spring season. The rising trends of spring HMI, HI, MDI, ATin, and ATout exceed 0.4 ∘C per decade, and the trends of other indices (except ET and NET) are larger than 0.3 ∘C per decade (Fig. S2). Summer also has been experiencing significant increasing trends in all indices, i.e., at a rate of >0.2 ∘C per decade (except ET and NET). The trends in summer HMI, HI, WBT, MDI, DI, sWBGT, ATin, and ATout exceed 0.3 ∘C per decade (Fig. S3). Differing from spring and summer, the human thermal indices (except WCT and NET) in the autumn season show slightly cooling trends (Fig. S4). Autumn WCT and NET have significantly strong decreasing trends, i.e., −0.349 and −0.507 ∘C per decade, respectively. Similarly strong cooling trends of WCT and NET appear in winter, i.e., −0.661 and −0.453 ∘C per decade, respectively, while other indices experience marginal long-term changes (Fig. S5).
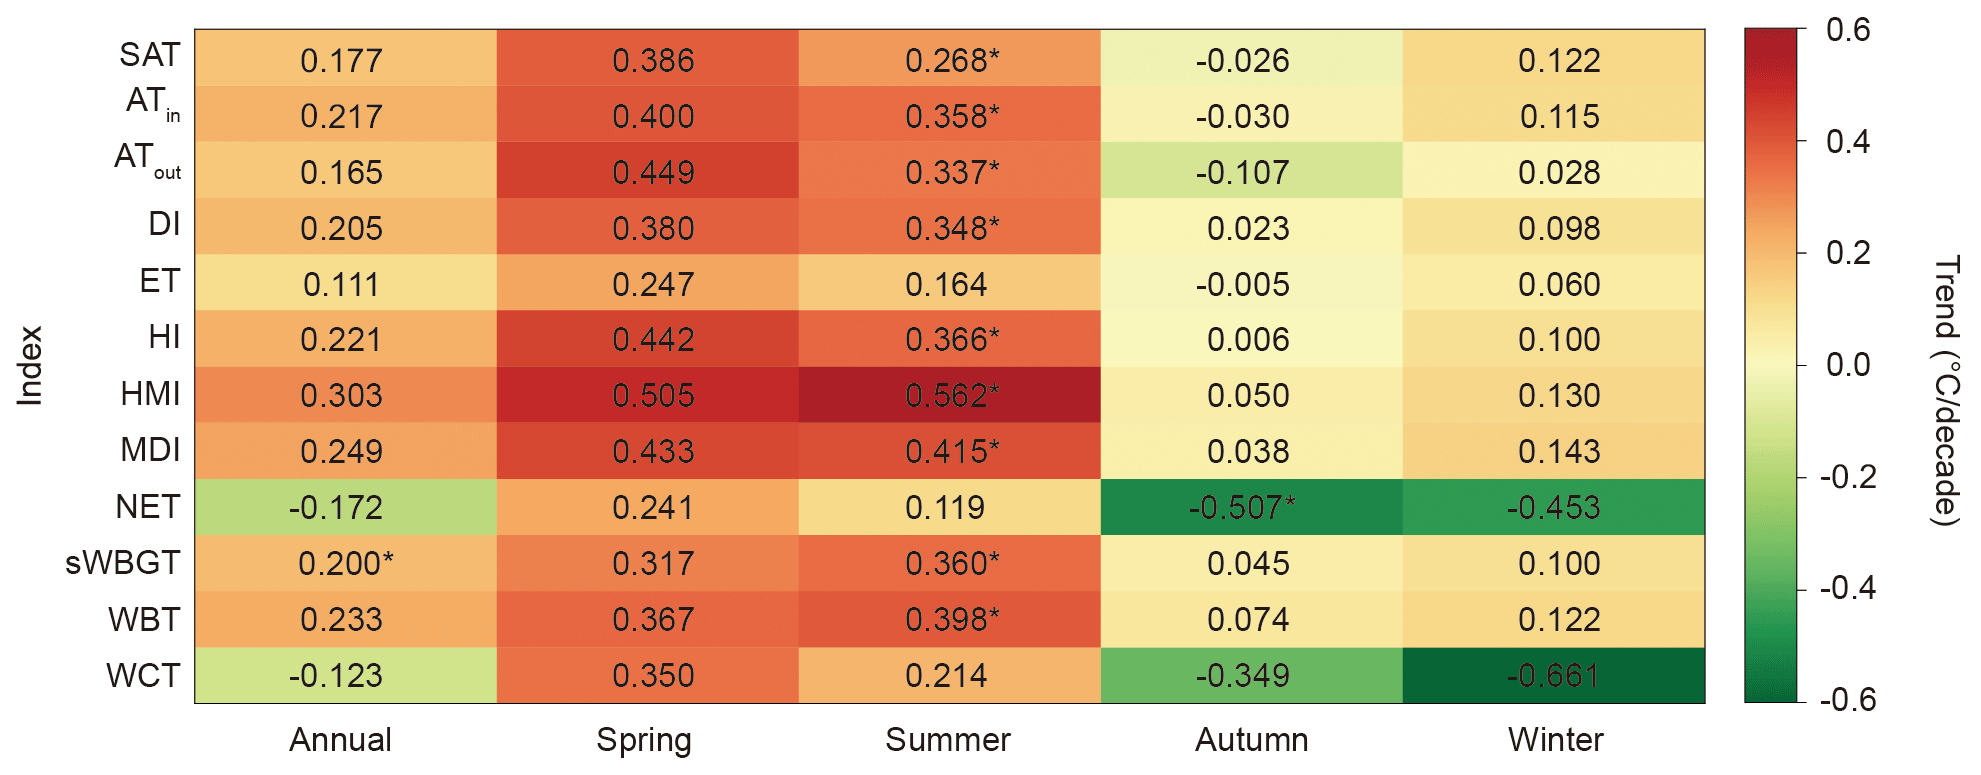
Figure 13Temporal trends of the 12 annually and seasonally averaged human thermal indices over the mainland of China during 2003–2020. The number means linear trend per decade. The asterisk indicates that the trends are significant at the 0.05 level.

Figure 14Comparison of the spatial patterns among HDI_0p25_1970_2018 (HDI), HiTiSEA, and HiTIC-Monthly for ATin over the mainland of China and its four largest UAs in July 2018: Beijing–Tianjin–Hebei (BTH), Yangtze River Delta (YRD), middle Yangtze River Valley (mYRV) and Pearl River Delta (PRD). Colored circles indicate the observed ATin values at individual meteorological stations.
Figure S6 maps the spatial patterns of the trends of summer mean human thermal indices over the mainland of China during 2003–2020. All indices show warming trends in most parts of China, particularly in NCP and TP. As one of the most densely populated regions in China, the prominent increases in thermal indices in NCP indicate that the local has been experiencing increasing threats of intensifying heat stress. Among the 12 indices, ATout, HI, NET and WCT tend to have a slight cooling trend in southeastern China. This cooling trend is consistent with the corresponding summer SAT.
The spatial distributions of the changing trends in winter across the mainland of China during 2003–2020 are depicted in Fig. S7. The trend patterns in winter are similar to that in summer to some degree. The warming trends are concentrated in Southwest China, most parts of Northwest China, and parts of East China (e.g., YRD). The cooling trends are located in TP, parts of Northeast and South China. The cooling tendencies are especially significant in Northeast China and most parts of Northwest and South China (Fig. S7j and m). Parts of central China are seen with even stronger cooling thermal comfort.
In the spring, increases in all thermal indices are observed in most parts of China (Fig. S8), particularly in northern regions, such as central Inner Mongolia, parts of NCP, and Northeast China, while parts of southern China have slight decreases. These decreases are noticeable in NET and WCT (Fig. S8j and m). In contrast to spring, the autumn season is observed with decreased thermal temperature in the north and increases in the south (e.g., Southwest China, Fig. S9).
5.1 Comparison with existing human thermal index datasets
We compared our HiTIC-Monthly with two existing datasets, i.e., HDI (Mistry, 2020) and HiTiSEA (Yan et al., 2021), which have coarser spatial resolutions of and (Table 4), respectively. We derived monthly mean ATin in July 2018 from HDI and HiTiSEA and compared them with HiTIC-Monthly over the mainland of China, with a particular highlight in the four largest UAs, including Beijing–Tianjin–Hebei (BTH), YRD, middle Yangtze River Valley (mYRV) and Pearl River Delta (PRD) (Fig. 14). The summer of 2018 was selected because it was included in all three datasets and frequent heat events occurred in this summer (Zhou et al., 2020). Generally, the three datasets depict similar spatial patterns. However, our HiTIC-Monthly dataset obviously provides more detailed and clearer spatial information on human thermal stress than the other two. Additionally, the observed ATin values at individual weather stations are also compared (Fig. 14). It can be seen that HDI and HiTISEA overestimate ATin, and such an overestimation is especially severe for HDI, while our dataset is in good agreement with the observed ATin at individual weather stations. Therefore, our predicted temperature can describe the spatial variations in the city areas well, thereby providing fundamental support for fine-scale climate studies, such as urban climate research.
5.2 Limitations and future works
There are 12 commonly used human thermal indices in the HiTIC-Monthly dataset produced in this study. Nine of these indices were computed from temperature and humidity (or water vapor) and the other three (i.e., ATout, NET, and WCT) were derived from temperature, humidity, and wind speed. In addition, other indices considering the combined effect of environmental variables such as sunlight (Blazejczyk, 1994; Fanger, 1970; Höppe, 1999; Yaglou and Minaed, 1957) were proposed, including wet-bulb globe temperature (WBGT), predicted mean vote (PMV), UTCI, physiological equivalent temperature (PET), etc. These thermal indices were not included in our study due to the lack of sunshine and radiative flux data.
Since LST is the most important variable for predicting the 11 human thermal indices, the uncertainty in the LST dataset may influence the accuracy of the human thermal indices. The LST variable in our prediction is collected from a global seamless 1 km resolution daily LST dataset (Zhang et al., 2022b). This dataset was generated based on spatiotemporal gap-filling algorithms and the MODIS LST data. It may overestimate LST in some cases because the LST under cloudy weather was filled based on the data in clear sky conditions (Zhang et al., 2022b). A high-quality LST dataset would further improve the prediction accuracy of the human thermal indices.
The human thermal indices dataset is at a monthly scale, but the temporal resolution may not be sufficient for the research of extreme weather events (e.g., heatwaves and cold spells) and related environmental health (e.g., heat-related mortality). A daily high-resolution human thermal index collection (HiTIC-Daily) will be produced and released in our future studies. In the current study, we provided the first national-level dataset over the mainland of China with multiple high-resolution human thermal indices in a monthly interval, which shows high prediction accuracies in all climate regimes across China. A global dataset of multiple human thermal indices dataset is also expected in the near future.
The high spatial resolution monthly human thermal index collection (HiTIC-Monthly) generated in this study is freely available to the public in network common data form (NetCDF) from Zenodo at https://doi.org/10.5281/zenodo.6895533 and the National Tibetan Plateau Data Center (TPDC) of China at https://data.tpdc.ac.cn/disallow/036e67b7-7a3a-4229-956f-40b8cd11871d (last access: 7 November 2022) (Zhang et al., 2022a). The human thermal indices include surface air temperature (SAT), indoor apparent temperature (ATin), outdoor shaded apparent temperature (ATout), discomfort index (DI), effective temperature (ET), heat index (HI), humidex (HMI), modified discomfort index (MDI), net effective temperature (NET), simplified wet-bulb globe temperature (sWBGT), wet-bulb temperature (WBT), and wind chill temperature (WCT). This dataset has a spatial resolution of 1 km×1 km and covers the mainland of China from 2003 to 2020, stacking by year. Each stack is composed of 12 monthly images. The unit of the dataset is 0.01 degrees Celsius (∘C), and the values are stored in an integer type (Int16) to save storage space and need to be divided by 100 to get the values in degrees Celsius when in use. The projection coordinate system is Albers equal-area conic projection. The naming rule and other detailed information can be found in “README.pdf”.
A long-term and high-resolution dataset of multiple human thermal indices is of great significance for monitoring detailed spatiotemporal changes of human thermal stress in different climate regions across China and assessing the health risks of people exposed to extreme heat at a fine scale. However, the current datasets of human thermal indices (e.g., HDI and HiTiSEA) only have coarse spatial resolutions (). In this study, we generated a dataset of monthly human thermal index collection with a high spatial resolution of 1 km over the mainland of China (HiTIC-Monthly). In this collection, 12 human thermal indices from 2003 to 2020 were predicted, including SAT, ATin, ATout, DI, ET, HI, HMI, MDI, NET, sWBGT, WBT, and WCT.
The HiTIC-Monthly dataset was produced by LightGBM based on multi-source data, including MODIS LST, DEM, land cover, population density, and impervious surface fraction. This dataset shows a desirable performance, with mean R2, RMSE, MAE, and bias of 0.996, 0.693 ∘C, 0.512 ∘C, and 0.003 ∘C, respectively. Our predictions also exhibit good agreements with the observations in both spatial and temporal dimensions. Moreover, the comparison with two existing datasets (i.e., HDI and HiTiSEA) suggests that HiTIC-Monthly has more detailed spatial information. Further investigation shows that almost all the indices show warming trends in most parts of China during 2003–2020, particularly for North China, Southwest China, TP, and parts of Northwest China. Additionally, the warming tendency is faster in spring and summer. WCT and NET show similar and strong cooling trends in autumn and winter, while other indices exhibit slight long-term changes. HiTIC-Monthly has broad applicability due to its high spatiotemporal prediction accuracy. Moreover, HiTIC-Monthly can offer significant support for studies that require fine-scale human thermal information.
The supplement related to this article is available online at: https://doi.org/10.5194/essd-15-359-2023-supplement.
ML and YZ conceptualized and designed the study. HZ collected the data, conducted the analyses, and wrote the first draft of the paper. All authors discussed the results and edited the paper.
The contact author has declared that none of the authors has any competing interests.
Publisher’s note: Copernicus Publications remains neutral with regard to jurisdictional claims in published maps and institutional affiliations.
This work was supported by the National Natural Science Foundation of China (grant no. 41871029), the Guangdong Basic and Applied Basic Research Foundation (grant no. 2019A1515011025), the National Youth Talent Support Program of China, the Pearl River Talent Recruitment Program of Guangdong Province (grant no. 2017GC010634), and the Innovation Group Project of Southern Marine Science and Engineering Guangdong Laboratory (Zhuhai) (grant no. 311021008). The authors are grateful to the editor and two reviewers, whose comments and suggestions have significantly improved the quality of our manuscript.
This research has been supported by the National Natural Science Foundation of China (grant no. 41871029), the National Key Research and Development Program of China (grant no. 2019YFC1510400), the Natural Science Foundation of Guangdong Province (grant no. 2019A1515011025), and the Guangdong Provincial Pearl River Talents Program (grant no. 2017GC010634).
This paper was edited by Qingxiang Li and reviewed by Minyan Wang and one anonymous referee.
Abatzoglou, J. T., Dobrowski, S. Z., Parks, S. A., and Hegewisch, K. C.: TerraClimate, a high-resolution global dataset of monthly climate and climatic water balance from 1958-2015, Sci. Data, 5, 170191, https://doi.org/10.1038/sdata.2017.191, 2018.
Arias, P., Bellouin, N., Coppola, E., Jones, R., Krinner, G., Marotzke, J., Naik, V., Palmer, M., Plattner, G.-K., and Rogelj, J.: Climate Change 2021: The Physical Science Basis. Contribution of Working Group14 I to the Sixth Assessment Report of the Intergovernmental Panel on Climate Change, Technical Summary, https://doi.org/10.1017/9781009157896.002, 2021.
Blazejczyk, K.: New climatological-and-physiological model of the human heat balance outdoor (MENEX) and its applications in bioclimatological studies in different scales, Zeszyty IgiPZ PAN, 28, 27–58, 1994.
Bolton, D.: The computation of equivalent potential temperature, Mon. Weather Rev., 108, 1046–1053, 1980.
Brake, R. and Bates, G.: A valid method for comparing rational and empirical heat stress indices, Ann. Occup. Hyg., 46, 165–174, https://doi.org/10.1093/annhyg/mef030, 2002.
Brimicombe, C., Di Napoli, C., Cornforth, R., Pappenberger, F., Petty, C., and Cloke, H. L.: Borderless Heat Hazards With Bordered Impacts, Earth's Future, 9, e2021EF002064, https://doi.org/10.1029/2021ef002064, 2021.
Budhathoki, N. K. and Zander, K. K.: Socio-Economic Impact of and Adaptation to Extreme Heat and Cold of Farmers in the Food Bowl of Nepal, Int. J. Environ. Res. Pub. He., 16, 1578, https://doi.org/10.3390/ijerph16091578, 2019.
Candido, C., Blanco, A. C., Medina, J., Gubatanga, E., Santos, A., Ana, R. S., and Reyes, R. B.: Improving the consistency of multi-temporal land cover mapping of Laguna lake watershed using light gradient boosting machine (LightGBM) approach, change detection analysis, and Markov chain, Remote Sensing Applications: Society and Environment, 23, 100565, https://doi.org/10.1016/j.rsase.2021.100565, 2021.
Cho, D., Yoo, C., Im, J., and Cha, D. H.: Comparative Assessment of Various Machine Learning-Based Bias Correction Methods for Numerical Weather Prediction Model Forecasts of Extreme Air Temperatures in Urban Areas, Earth Space Sci., 7, e2019EA000740, https://doi.org/10.1029/2019ea000740, 2020.
Copernicus Climate Change Service: ERA5: Fifth generation of ECMWF atmospheric reanalyses of the global climate, https://cds.climate.copernicus.eu/cdsapp#!/home, last access: 5 January 2022.
Di Napoli, C., Pappenberger, F., and Cloke, H. L.: Assessing heat-related health risk in Europe via the Universal Thermal Climate Index (UTCI), Int. J. Biometeorol., 62, 1155–1165, https://doi.org/10.1007/s00484-018-1518-2, 2018.
Di Napoli, C., Barnard, C., Prudhomme, C., Cloke, H. L., and Pappenberger, F.: ERA5-HEAT: A global gridded historical dataset of human thermal comfort indices from climate reanalysis, Geosci. Data J., 8, 2–10, https://doi.org/10.1002/gdj3.102, 2020.
Djongyang, N., Tchinda, R., and Njomo, D.: Thermal comfort: A review paper, Renewable and Sustainable Energy Reviews, 14, 2626–2640, https://doi.org/10.1016/j.rser.2010.07.040, 2010.
Enander, A. E. and Hygge, S.: Thermal stress and human performance, Scand. J. Work Env. Hea., 16, 44–50, https://doi.org/10.5271/sjweh.1823, 1990.
Epstein, Y. and Moran, D. S.: Thermal comfort and the heat stress indices, Ind. Health, 44, 388–398, https://doi.org/10.2486/indhealth.44.388, 2006.
Fan, J., Ma, X., Wu, L., Zhang, F., Yu, X., and Zeng, W.: Light Gradient Boosting Machine: An efficient soft computing model for estimating daily reference evapotranspiration with local and external meteorological data, Agr. Water Manage., 225, 105758, https://doi.org/10.1016/j.agwat.2019.105758, 2019.
Fang, C. and Yu, D.: China's new urbanization, Berlin and Beijing, Springer, https://doi.org/10.1007/978-3-662-49448-6, 2016.
Fanger, P. O.: Thermal comfort. Analysis and applications in environmental engineering, Copenhagen, Danish Technical Press, 1970.
Gagge, A. and Nishi, Y.: Physical indices of the thermal environment, edited by: Ashrae, J., United States, 18, 47–51, 1976.
Gagge, A., Stolwijk, J. A., and Nishi, Y.: An effective temperature scale based on a simple model of human physiological regulatiry response, Memoirs of the Faculty of Engineering, Hokkaido University, 13, 21–36, 1972.
Gaughan, A. E., Stevens, F. R., Linard, C., Jia, P., and Tatem, A. J.: High resolution population distribution maps for Southeast Asia in 2010 and 2015, PLoS One, 8, e55882, https://doi.org/10.1371/journal.pone.0055882, 2013.
Gong, P., Li, X., Wang, J., Bai, Y., Chen, B., Hu, T., Liu, X., Xu, B., Yang, J., Zhang, W., and Zhou, Y.: Annual maps of global artificial impervious area (GAIA) between 1985 and 2018, Remote Sens. Environ., 236, 111510, https://doi.org/10.1016/j.rse.2019.111510, 2020.
Haines, A. and Ebi, K.: The Imperative for Climate Action to Protect Health, The New England Jornal of Medicine, 380, 263–273, https://doi.org/10.1056/NEJMra1807873, 2019.
He, Q., Wang, M., Liu, K., Li, K., and Jiang, Z.: GPRChinaTemp1km: a high-resolution monthly air temperature data set for China (1951–2020) based on machine learning, Earth Syst. Sci. Data, 14, 3273–3292, https://doi.org/10.5194/essd-14-3273-2022, 2022.
Hong, F., Zhan, W., Göttsche, F.-M., Liu, Z., Dong, P., Fu, H., Huang, F., and Zhang, X.: A global dataset of spatiotemporally seamless daily mean land surface temperatures: generation, validation, and analysis, Earth Syst. Sci. Data, 14, 3091–3113, https://doi.org/10.5194/essd-14-3091-2022, 2022.
Höppe, P.: The physiological equivalent temperature–a universal index for the biometeorological assessment of the thermal environment, Int. J. Biometeorol., 43, 71–75, 1999.
Houghton, F. C. and Yaglou, C. P.: Determining equal comfortlines, ASHVE Trans., 29, 165–176, 1923.
IPCC: Climate Change 2021: The Physical Science Basis. Contribution of Working Group I to the Sixth Assessment Report of the Intergovernmental Panel on Climate Change, edited by: Masson-Delmotte, V., Zhai, P., Pirani, A., Connors, S. L., Péan, C., Berger, S., Caud, N., Chen, Y., Goldfarb, L., Gomis, M. I., Huang, M., Leitzell, K., Lonnoy, E., Matthews, J. B. R., Maycock, T. K., Waterfield, T., Yelekçi, O., Yu, R., and Zhou, B., Cambridge University Press, Cambridge, United Kingdom and New York, NY, USA, 2391 pp., 2021.
Kang, S. and Eltahir, E. A. B.: North China Plain threatened by deadly heatwaves due to climate change and irrigation, Nat. Commun., 9, 2894, https://doi.org/10.1038/s41467-018-05252-y, 2018.
Ke, G., Meng, Q., Finley, T., Wang, T., Chen, W., Ma, W., Ye, Q., and Liu, T.-Y.: Lightgbm: A highly efficient gradient boosting decision tree, Adv. Neur. In., 30, 2017.
Krzysztof, B., Pavol, N., Oleh, S., Agnieszka, H., Olesya, S., Anna, B., and Katarina, M.: Influence of geographical factors on thermal stress in northern Carpathians, Int. J. Biometeorol., 65, 1553–1566, https://doi.org/10.1007/s00484-020-02011-x, 2021.
Kuchcik, M.: Mortality and thermal environment (UTCI) in Poland-long-term, multi-city study, Int. J. Biometeorol. 65, 1529–1541, https://doi.org/10.1007/s00484-020-01995-w, 2021.
Lazaro, P. and Momayez, M.: Heat Stress in Hot Underground Mines: a Brief Literature Review, Mining, Metallurgy & Exploration, 38, 497–508, https://doi.org/10.1007/s42461-020-00324-4, 2020.
Li, J., Chen, Y. D., Gan, T. Y., and Lau, N.-C.: Elevated increases in human-perceived temperature under climate warming, Nature Climate Change, 8, 43–47, https://doi.org/10.1038/s41558-017-0036-2, 2018.
Li, Q., Liu, X., Zhang, H., Thomas C, P., and David R, E.: Detecting and adjusting temporal inhomogeneity in Chinese mean surface air temperature data, Adv. Atmos. Sci., 21, 260–268, https://doi.org/10.1007/bf02915712, 2004.
Li, W., Hao, X., Wang, L., Li, Y., Li, J., Li, H., and Han, T.: Detection and Attribution of Changes in Thermal Discomfort over China during 1961–2014 and Future Projections, Adv. Atmos. Sci., 39, 456–470, https://doi.org/10.1007/s00376-021-1168-x, 2022.
Li, Y., Li, M., Li, C., and Liu, Z.: Forest aboveground biomass estimation using Landsat 8 and Sentinel-1A data with machine learning algorithms, Sci. Rep.-UK, 10, 9952, https://doi.org/10.1038/s41598-020-67024-3, 2020.
Liu, X., Guo, J., Zhang, A., Zhou, J., Chu, Z., Zhou, Y., and Ren, G.: Urbanization Effects on Observed Surface Air Temperature Trends in North China, J. Climate, 21, 1333–1348, https://doi.org/10.1175/2007jcli1348.1, 2008.
Los, H., Mendes, G. S., Cordeiro, D., Grosso, N., Costa, H., Benevides, P., and Caetano, M.: Evaluation of Xgboost and Lgbm Performance in Tree Species Classification with Sentinel-2 Data, 2021 IEEE International Geoscience and Remote Sensing Symposium IGARSS, Brussels, Belgium, 11–16 July 2021, 5803–5806, https://doi.org/10.1109/igarss47720.2021.9553031, 2021.
Luo, M. and Lau, N.-C.: Characteristics of summer heat stress in China during 1979–2014: climatology and long-term trends, Clim. Dynam., 53, 5375–5388, https://doi.org/10.1007/s00382-019-04871-5, 2019.
Luo, M. and Lau, N. C.: Increasing Human-Perceived Heat Stress Risks Exacerbated by Urbanization in China: A Comparative Study Based on Multiple Metrics, Earth's Future, 9, e2020EF001848, https://doi.org/10.1029/2020ef001848, 2021.
Luo, M., Lau, N. C., Liu, Z., Wu, S., and Wang, X.: An Observational Investigation of Spatiotemporally Contiguous Heatwaves in China From a 3D Perspective, Geophys. Res. Lett., 49, e2022GL097714, https://doi.org/10.1029/2022gl097714, 2022.
Masterton, J. M. and Richardson, F. A.: Humidex: A Method of Quantifying Human Discomfort Due to Excessive Heat and Humidity, Downsview, Ont.: Environment Canada, Atmospheric Environment, 1979.
McCarty, D. A., Kim, H. W., and Lee, H. K.: Evaluation of Light Gradient Boosted Machine Learning Technique in Large Scale Land Use and Land Cover Classification, Environments, 7, 84, https://doi.org/10.3390/environments7100084, 2020.
Mistry, M. N.: A High Spatiotemporal Resolution Global Gridded Dataset of Historical Human Discomfort Indices, Atmosphere, 11, 835, https://doi.org/10.3390/atmos11080835, 2020.
Moda, H. M., Filho, W. L., and Minhas, A.: Impacts of Climate Change on Outdoor Workers and their Safety: Some Research Priorities, Int. J. Environ. Res. Pub. He., 16, 3458, https://doi.org/10.3390/ijerph16183458, 2019.
Moran, D., Shapiro, Y., Epstein, Y., Matthew, W., and Pandolf, K.: A modified discomfort index (MDI) as an alternative to the wet bulb globe temperature (WBGT), Environmental Ergonomics VIII, edited by: Hodgdon, J. A., Heaney, J. H., and Buono, M. J., 77–80, 1998.
Nastos, P. T. and Matzarakis, A.: The effect of air temperature and human thermal indices on mortality in Athens, Greece, Theor. Appl. Climatol., 108, 591–599, https://doi.org/10.1007/s00704-011-0555-0, 2011.
NWS: Meteorological Conversions and Calculations: Heat Index Calculator, https://www.wpc.ncep.noaa.gov/html/heatindexbody_txt.html (last access: 1 October 2021), 2011.
Osczevski, R. and Bluestein, M.: The New Wind Chill Equivalent Temperature Chart, B. Am. Meteorol. Soc., 86, 1453–1458, https://doi.org/10.1175/bams-86-10-1453, 2005.
Patz, J. A., Campbell-Lendrum, D., Holloway, T., and Foley, J. A.: Impact of regional climate change on human health, Nature, 438, 310–317, https://doi.org/10.1038/nature04188, 2005.
Peng, S., Ding, Y., Liu, W., and Li, Z.: 1 km monthly temperature and precipitation dataset for China from 1901 to 2017, Earth Syst. Sci. Data, 11, 1931–1946, https://doi.org/10.5194/essd-11-1931-2019, 2019.
Periard, J. D., Eijsvogels, T. M. H., and Daanen, H. A. M.: Exercise under heat stress: thermoregulation, hydration, performance implications, and mitigation strategies, Physiol. Rev., 101, 1873–1979, https://doi.org/10.1152/physrev.00038.2020, 2021.
Rahman, M. A., Franceschi, E., Pattnaik, N., Moser-Reischl, A., Hartmann, C., Paeth, H., Pretzsch, H., Rotzer, T., and Pauleit, S.: Spatial and temporal changes of outdoor thermal stress: influence of urban land cover types, Sci. Rep.-UK, 12, 1–13, https://doi.org/10.1038/s41598-021-04669-8, 2022.
Raymond, C., Matthews, T., and Horton, R. M.: The emergence of heat and humidity too severe for human tolerance, Sci. Adv., 6, eaaw1838, https://doi.org/10.1126/sciadv.aaw1838, 2020.
Ren, Z., Fu, Y., Dong, Y., Zhang, P., and He, X.: Rapid urbanization and climate change significantly contribute to worsening urban human thermal comfort: A national 183-city, 26-year study in China, Urban Climate, 43, 101154, https://doi.org/10.1016/j.uclim.2022.101154, 2022.
Rice, J. A.: Mathematical statistics and data analysis, Cengage Learning, 2006.
Rogers, C. D. W., Ting, M., Li, C., Kornhuber, K., Coffel, E. D., Horton, R. M., Raymond, C., and Singh, D.: Recent Increases in Exposure to Extreme Humid-Heat Events Disproportionately Affect Populated Regions, Geophys. Res. Lett., 48, e2021GL094183, https://doi.org/10.1029/2021gl094183, 2021.
Roghanchi, P. and Kocsis, K. C.: Challenges in Selecting an Appropriate Heat Stress Index to Protect Workers in Hot and Humid Underground Mines, Saf. Health Work, 9, 10–16, https://doi.org/10.1016/j.shaw.2017.04.002, 2018.
Rothfusz, L. P. and Headquarters, N. S. R.: The heat index equation (or, more than you ever wanted to know about heat index), Fort Worth, Texas: National Oceanic and Atmospheric Administration, National Weather Service, Office of Meteorology, 9023, 1990.
Rustemeyer, N. and Howells, M.: Excess Mortality in England during the 2019 Summer Heatwaves, Climate, 9, 14, https://doi.org/10.3390/cli9010014, 2021.
Schwingshackl, C., Sillmann, J., Vicedo-Cabrera, A. M., Sandstad, M., and Aunan, K.: Heat Stress Indicators in CMIP6: Estimating Future Trends and Exceedances of Impact-Relevant Thresholds, Earth's Future, 9, e2020EF001885, https://doi.org/10.1029/2020ef001885, 2021.
Sohar, E., Adar, R., and Kaly, J.: Comparison of the environmental heat load in various parts of Israel, Israel J. Exp. Med., 10, 111–115, 1963.
Staiger, H., Laschewski, G., and Matzarakis, A.: Selection of Appropriate Thermal Indices for Applications in Human Biometeorological Studies, Atmosphere, 10, 18, https://doi.org/10.3390/atmos10010018, 2019.
Steadman, R. G.: The assessment of sultriness. Part I: A temperature-humidity index based on human physiology and clothing science, J. Appl. Meteorol. Clim., 18, 861–873, 1979.
Steadman, R. G.: A universal scale of apparent temperature, J. Appl. Meteorol. Clim., 23, 1674–1687, 1984.
Stolwijk, J.: Heat exchangers between body and environment, Bibl. Radiol., 144–150, 1975.
Stull, R.: Wet-Bulb Temperature from Relative Humidity and Air Temperature, J. Appl. Meteorol. Clim., 50, 2267–2269, https://doi.org/10.1175/jamc-d-11-0143.1, 2011.
Su, H., Wang, A., Zhang, T., Qin, T., Du, X., and Yan, X.-H.: Super-resolution of subsurface temperature field from remote sensing observations based on machine learning, Int. J. Appl. Earth Obs., 102, https://doi.org/10.1016/j.jag.2021.102440, 2021.
Su, Y.: Prediction of air quality based on Gradient Boosting Machine Method, 2020 International Conference on Big Data and Informatization Education (ICBDIE), Zhangjiajie, China, 23–25 April 2020, 395–397, https://doi.org/10.1109/icbdie50010.2020.00099, 2020.
Sulla-Menashe, D. and Friedl, M.: MCD12Q1 MODIS/Terra+ Aqua Land Cover Type Yearly L3 Global 500m SIN Grid V006, NASA EOSDIS Land Processes DAAC: Sioux Falls, SD, USA, https://doi.org/10.5067/MODIS/MCD12Q1.006, 2019.
Sun, Q., Miao, C., Hanel, M., Borthwick, A. G. L., Duan, Q., Ji, D., and Li, H.: Global heat stress on health, wildfires, and agricultural crops under different levels of climate warming, Environ. Int., 128, 125–136, https://doi.org/10.1016/j.envint.2019.04.025, 2019.
Szer, I., Lipecki, T., Szer, J., and Czarnocki, K.: Using meteorological data to estimate heat stress of construction workers on scaffolds for improved safety standards, Automat. Constr., 134, 104079, https://doi.org/10.1016/j.autcon.2021.104079, 2022.
Tamiminia, H., Salehi, B., Mahdianpari, M., Beier, C. M., Johnson, L., and Phoenix, D. B.: A Comparison of Random Forest and Light Gradient Boosting Machine for Forest above-Ground Biomass Estimation Using a Combination of Landsat, Alos Palsar, and Airborne Lidar Data, Int. Arch. Photogramm., XLIV-M-3-2021, 163–168, https://doi.org/10.5194/isprs-archives-XLIV-M-3-2021-163-2021, 2021.
Tian, H., Zhao, Y., Luo, M., He, Q., Han, Y., and Zeng, Z.: Estimating PM2.5 from multisource data: A comparison of different machine learning models in the Pearl River Delta of China, Urban Climate, 35, 100740, https://doi.org/10.1016/j.uclim.2020.100740, 2021.
Tian, P., Lu, H., Li, D., and Guan, Y.: Quantifying the effects of meteorological change between neighboring days on human thermal comfort in China, Theor. Appl. Climatol., 147, 1345–1357, https://doi.org/10.1007/s00704-021-03908-2, 2022.
Tong, S., Prior, J., McGregor, G., Shi, X., and Kinney, P.: Urban heat: an increasing threat to global health, BMJ, 375, n2467, https://doi.org/10.1136/bmj.n2467, 2021.
Tuholske, C., Caylor, K., Funk, C., Verdin, A., Sweeney, S., Grace, K., Peterson, P., and Evans, T.: Global urban population exposure to extreme heat, P. Natl. Acad. Sci. USA, 118, e2024792118, https://doi.org/10.1073/pnas.2024792118, 2021.
Uddin, M. G., Nash, S., Mahammad Diganta, M. T., Rahman, A., and Olbert, A. I.: Robust machine learning algorithms for predicting coastal water quality index, J. Environ. Manage., 321, 115923, https://doi.org/10.1016/j.jenvman.2022.115923, 2022.
United Nations: World population prospects, Multimedia Library, 2017.
Varentsov, M., Shartova, N., Grischenko, M., and Konstantinov, P.: Spatial Patterns of Human Thermal Comfort Conditions in Russia: Present Climate and Trends, Weather Clim. Soc., 12, 629–642, https://doi.org/10.1175/wcas-d-19-0138.1, 2020.
Wang, C., Zhan, W., Liu, Z., Li, J., Li, L., Fu, P., Huang, F., Lai, J., Chen, J., Hong, F., and Jiang, S.: Satellite-based mapping of the Universal Thermal Climate Index over the Yangtze River Delta urban agglomeration, J. Clean. Prod., 277, 123830, https://doi.org/10.1016/j.jclepro.2020.123830, 2020.
Wang, F., Duan, K., and Zou, L.: Urbanization Effects on Human-Perceived Temperature Changes in the North China Plain, Sustainability, 11, https://doi.org/10.3390/su11123413, 2019.
Wang, P., Luo, M., Liao, W., Xu, Y., Wu, S., Tong, X., Tian, H., Xu, F., and Han, Y.: Urbanization contribution to human perceived temperature changes in major urban agglomerations of China, Urban Climate, 38, 100910, https://doi.org/10.1016/j.uclim.2021.100910, 2021.
Wu, J., Fang, H., Qin, W., Wang, L., Song, Y., Su, X., and Zhang, Y.: Constructing High-Resolution (10 km) Daily Diffuse Solar Radiation Dataset across China during 1982–2020 through Ensemble Model, Remote Sensing, 14, 3695, https://doi.org/10.3390/rs14153695, 2022.
Xu, W., Li, Q., Wang, X. L., Yang, S., Cao, L., and Feng, Y.: Homogenization of Chinese daily surface air temperatures and analysis of trends in the extreme temperature indices, J. Geophys. Res.-Atmos., 118, 9708–9720, https://doi.org/10.1002/jgrd.50791, 2013.
Yaglou, C. and Minaed, D.: Control of heat casualties at military training centers, Arch. Indust. Health, 16, 302–316, 1957.
Yamazaki, D., Ikeshima, D., Tawatari, R., Yamaguchi, T., O'Loughlin, F., Neal, J. C., Sampson, C. C., Kanae, S., and Bates, P. D.: A high-accuracy map of global terrain elevations, Geophys. Res. Lett., 44, 5844–5853, https://doi.org/10.1002/2017gl072874, 2017.
Yan, Y., Xu, Y., and Yue, S.: A high-spatial-resolution dataset of human thermal stress indices over South and East Asia, Sci. Data, 8, 1–14, https://doi.org/10.1038/s41597-021-01010-w, 2021.
Yan, Y. Y.: Human Thermal Climates in China, Phys. Geogr., 26, 163–176, https://doi.org/10.2747/0272-3646.26.3.163, 2013.
Zeng, Z., Ziegler, A. D., Searchinger, T., Yang, L., Chen, A., Ju, K., Piao, S., Li, L. Z. X., Ciais, P., Chen, D., Liu, J., Azorin-Molina, C., Chappell, A., Medvigy, D., and Wood, E. F.: A reversal in global terrestrial stilling and its implications for wind energy production, Nat. Clim. Change, 9, 979–985, https://doi.org/10.1038/s41558-019-0622-6, 2019.
Zeng, Z., Gui, K., Wang, Z., Luo, M., Geng, H., Ge, E., An, J., Song, X., Ning, G., Zhai, S., and Liu, H.: Estimating hourly surface PM2.5 concentrations across China from high-density meteorological observations by machine learning, Atmos. Res., 254, 105516, https://doi.org/10.1016/j.atmosres.2021.105516, 2021.
Zhang, G., Azorin-Molina, C., Chen, D., McVicar, T. R., Guijarro, J. A., Kong, F., Minola, L., Deng, K., and Shi, P.: Uneven Warming Likely Contributed to Declining Near-Surface Wind Speeds in Northern China Between 1961 and 2016, J. Geophys. Res.-Atmos., 126, e2020JD033637, https://doi.org/10.1029/2020jd033637, 2021.
Zhang, H., Luo, M., Zhao, Y., Lin, L., Ge, E., Yang, Y., Ning, G., Zeng, Z., Gui, K., Li, J., Chen, T. O., Li, X., Wu, S., Wang, P., and Wang, X.: HiTIC-Monthly: A Monthly High Spatial Resolution (1 km) Human Thermal Index Collection over China during 2003–2020 (1.0), Zenodo [data set], https://doi.org/10.5281/zenodo.6895533, 2022a.
Zhang, T., Zhou, Y., Zhu, Z., Li, X., and Asrar, G. R.: A global seamless 1 km resolution daily land surface temperature dataset (2003–2020), Earth Syst. Sci. Data, 14, 651–664, https://doi.org/10.5194/essd-14-651-2022, 2022b.
Zhao, B., Mao, K., Cai, Y., Shi, J., Li, Z., Qin, Z., Meng, X., Shen, X., and Guo, Z.: A combined Terra and Aqua MODIS land surface temperature and meteorological station data product for China from 2003 to 2017, Earth Syst. Sci. Data, 12, 2555–2577, https://doi.org/10.5194/essd-12-2555-2020, 2020.
Zhao, C., Liu, B., Piao, S., Wang, X., Lobell, D. B., Huang, Y., Huang, M., Yao, Y., Bassu, S., Ciais, P., Durand, J. L., Elliott, J., Ewert, F., Janssens, I. A., Li, T., Lin, E., Liu, Q., Martre, P., Muller, C., Peng, S., Penuelas, J., Ruane, A. C., Wallach, D., Wang, T., Wu, D., Liu, Z., Zhu, Y., Zhu, Z., and Asseng, S.: Temperature increase reduces global yields of major crops in four independent estimates, P. Natl. Acad. Sci. USA, 114, 9326–9331, https://doi.org/10.1073/pnas.1701762114, 2017.
Zhao, Y. and Zhu, Z.: ASI: An artificial surface Index for Landsat 8 imagery, Int. J. Appl. Earth Obs., 107, 102703, https://doi.org/10.1016/j.jag.2022.102703, 2022.
Zhou, C., Chen, D., Wang, K., Dai, A., and Qi, D.: Conditional Attribution of the 2018 Summer Extreme Heat over Northeast China: Roles of Urbanization, Global Warming, and Warming-Induced Circulation Changes, B. Am. Meteorol. Soc., 101, S71–S76, https://doi.org/10.1175/bams-d-19-0197.1, 2020.