the Creative Commons Attribution 4.0 License.
the Creative Commons Attribution 4.0 License.
 | 08 Aug 2023
Dataset of depth and temperature profiles obtained from 2012 to 2020 using commercial fishing vessels of the AdriFOOS fleet in the Adriatic Sea
Pierluigi Penna
Filippo Domenichetti
Andrea Belardinelli
Michela Martinelli
In the last decade, an enormous amount of georeferenced oceanographic data, co-located with catch information, have been collected through the use of commercial fishing vessels operating in the Adriatic Sea and belonging to the fleet monitored by the AdriFOOS (Adriatic Fishery and Oceanography Observing System) infrastructure. This document describes the dataset of depth (pressure) and temperature profiles collected by means of AdriFOOS in the period 2012–2020 (available at https://doi.org/10.17882/73008, Penna et al., 2020) and briefly illustrates the structure of this facility, the oceanographic dataset validation procedures, and some of the results achieved, and it also lists some possible operational applications. This information is of the utmost importance to provide data to feed oceanographic models and advance knowledge on climate change, as well as to improve the ecosystem approach to fishery management.
- Article
(9099 KB) - Full-text XML
-
Supplement
(1719 KB) - BibTeX
- EndNote


The valuable contribution of ships of opportunity (SOOPs) or vessels of opportunity (VOOs) in operational oceanography is already well established (e.g., ferry box systems); this approach generally allows one to take advantage of already existing commercial routes by equipping vessels with scientific instruments to collect data in areas that could not reasonably be covered (in space and time) with traditional research vessel efforts (Petersen et al., 2003; Sloyan et al., 2018; Jiang et al., 2019; Rosa et al., 2021). A recent development uses specifically designed sensors deployed from commercial fishing vessels to collect great amounts of data, useful both for operational oceanography purposes and ecosystem approaches to fisheries (Van Vranken et al., 2020).
The Ancona branch of the Institute of Marine Biological Resources and Biotechnologies of the Italian National Research Council (CNR IRBIM; formerly part of the Institute of Marine Science of CNR) carried out the Fishery Observing System (FOS) program from 2003 to 2013 aimed at using Italian fishing vessels for the collection of scientifically useful datasets (Falco et al., 2007; Martinelli et al., 2012). A sample of commercial fishing vessels, targeting small pelagic species in the northern and central Adriatic Sea (see the description of the study area in Sect. 2), was equipped with a system for the collection of information on catches, position of the fishing operation, depth, and water temperature during the haul, producing a huge amount of data useful for both oceanographic and fishery biology purposes (Carpi et al., 2015; Russo et al., 2015; Aydoğdu et al., 2016; Sparnocchia et al., 2016; Lucchetti et al., 2018). In 2012, in the framework of some national and international projects (CNR project SSD-Pesca “Sistema di Supporto alle decisioni per la gestione sostenibile della Pesca nelle regioni del Mezzogiorno d'Italia”, the Seventh Framework Programme of the European Union's (EU FP7) JERICO project “Towards a Joint European Research Infrastructure network for Coastal Observatories”, etc.), CNR started the development of a new modular Fishery and Oceanography Observing System (FOOS; Patti et al., 2016). This new assemblage of sensors for oceanographic and meteorological data currently allows the FOOS to collect more parameters, with higher accuracy and precision, and to send them in near-real time (NRT) to an on-land data center installed on a dedicated server (Martinelli et al., 2016; Sparnocchia et al., 2017). Furthermore, the FOOS is a multifunction system able to collect different types of data from the fishing operations and to send back information to the fishers (e.g., weather and sea forecasts) through an electronic logbook with ad hoc software embedded (Patti et al., 2016). The adoption of different FOOS modular setups installed on various kinds of fishing vessels, targeting different resources, allowed a spatial extension of the monitored areas in the Mediterranean Sea (see some setup examples in Patti et al., 2016).
Ancona staff of CNR IRBIM also carried out demonstrations on the FOOS use within European-funded projects (e.g., Sparnocchia et al., 2017) and contributed to the definition of best-practice procedures to be used while approaching this matter (define optimal operational conditions for each type of sensor to be used, test each sensor for offsets under traditional oceanographic operational conditions before field use on fishing gear, etc.; Martinelli et al., 2016; Möller et al., 2019). In addiction, CNR IRBIM implemented the AdriFOOS (Adriatic Fishery and Oceanography Observing System) observational infrastructure composed of a multifunctional dedicated on-land data center based in Ancona and a series of FOOSs installed on board commercial fishing vessels operating in the Adriatic Sea. Since then, the AdriFOOS on-land data center has received daily datasets of environmental parameters collected through the water column and near the seabed (temperature, salinity, etc.), together with GPS (Global Positioning System) haul tracks, catch amounts per haul, target species sizes, and meteorological information (e.g., Penna et al., 2020). AdriFOOS infrastructure has been involved in various European projects (i.e., EU FP7 JERICO “Towards a Joint European Research Infrastructure network for Coastal Observatories” and NeXOS “Next generation Low-Cost Multifunctional Web Enabled Ocean Sensor Systems Empowering Marine, Maritime and Fisheries Management” projects, H2020 JERICO NEXT “Joint European Research Infrastructure network for Coastal Observatory – Novel European eXpertise for coastal observaTories” and NAUTILOS “New Approach to Underwater Technologies for Innovative, Low-cost Ocean obServation” projects), and some collected datasets were already shared and showcased on the projects' institutional websites (e.g., http://www.jerico-ri.eu/previous-project/service-access/targeted-operation-phase/top-2-data-and-maps-from-sensors-on-board-fishing-vessels/adriatic-sea-fishery-and-oceanography-observing-system/, last access: 22 June 2023; https://www.nautilos-h2020.eu/data-portal/, last access: 22 June 2023; Puillat et al., 2014; Gaughan et al., 2015; Sparnocchia et al., 2017).
The acquisition of oceanographic data during fishing operations can be divided into three phases (see also Sect. 3.1): down-cast, horizontal profile either on the bottom or at the depth at which the fishing gear operates, and up-cast. Therefore, this methodology allows the acquisition of data profiles along the water column and measurements at the depth at which the fishing operation takes place, which often occurs close to the sea bottom. Recently, a dataset containing 14 810 depth (pressure) and temperature down-casts has been made accessible in Penna et al. (2020) in ASCII (American Standard Code for Information Interchange) and NetCDF (network common data form) formats; this was generated in the period 2012–2020 by 10 vessels belonging to the AdriFOOS fleet and one FOOS installed on board the CNR R/V Dallaporta (while carrying out experimental trawl surveys in the central Adriatic Sea; Chiarini et al., 2022). This huge amount of data could be very useful to improve the knowledge about Adriatic Sea mesoscale oceanographic processes and to detect possible shifts due to climate change; in addition this could be used to feed operational models though data assimilation and reanalysis, as already trialed in the framework of the JERICO–NEXT Project (Mourre et al., 2019).
Therefore, the main aim of this paper is to specifically describe the sensor data collection, storage, and quality assurance and control procedures applied to the depth (pressure) and temperature profiles dataset available through Penna et al. (2020). A general description of the AdriFOOS infrastructure is also provided, as well as some details on the validation and quality control applied to some of the other relevant information collected.
The Adriatic Sea is a semi-enclosed basin within the Mediterranean Sea. It is located between the Italian peninsula and the Slovenian–Croatian–Montenegro–Albanian coasts with its major axis in a northwest–southeast direction, and it is approximately 800 km long and 200 km wide (Fig. 1). The morphological differences along both directions (longitudinal and transversal) of the basin, the bathymetry, and several oceanographic properties conventionally divide it into a northern, a central, and a southern sub-basin (Artegiani et al., 1997). The northern Adriatic is the shallowest of the three basins (maximum depth around 100 m). The central and southern Adriatic (maximum depth, respectively, of 270 and 1200 m) are separated by the Pelagosa sill (160 m); another sill (800 m) separates the southern Adriatic from the Ionian Sea and is located in the Strait of Otranto (Marini et al., 2016). Circulation and water masses are strongly influenced by atmospheric conditions and mainly driven by dominant winds (NE–ENE Bora and the SE Sirocco; Orlić et al., 1994; Gačić, 1980). The general circulation is cyclonic: northward along the east coast and southward along the west coast (Poulain, 2001). Furthermore, basin-scale cyclonic eddies, called gyres, dominate the circulation of the three sub-basins and vary in intensity depending on the season (Artegiani et al., 1997).
The Po River, which flows in the northern sub-basin, represents the main buoyancy input accounting for about one-third of the total river freshwater input in the Adriatic: river runoff is particularly strong and affects the circulation and ecosystem by introducing large flows of nutrients (Marini et al., 2008). The nutrient-rich river water discharged into the northern Adriatic forms a strong surface current and a floating coastal layer that flows south along the Italian coast (Cozzi and Giani, 2011; Grilli et al., 2020).
Therefore, the Adriatic Sea is characterized by an extended continental shelf and eutrophic shallow waters in its northern–central part that make it a very productive area (Campanelli et al., 2011). Indeed the Adriatic Sea is one of the most intensively fished areas of the Mediterranean (Eigaard et al., 2017), in which about 12.5 % of the entire Mediterranean fishing fleet operates (FAO, 2020). The Adriatic indeed contributes around 22.7 % of the total Mediterranean catches (ranging between 170 000 and 180 000 t; average over 2016–2018), of which 56.8 % and 39.1 % are due, respectively, to the Italian and Croatian fleets (FAO, 2020).
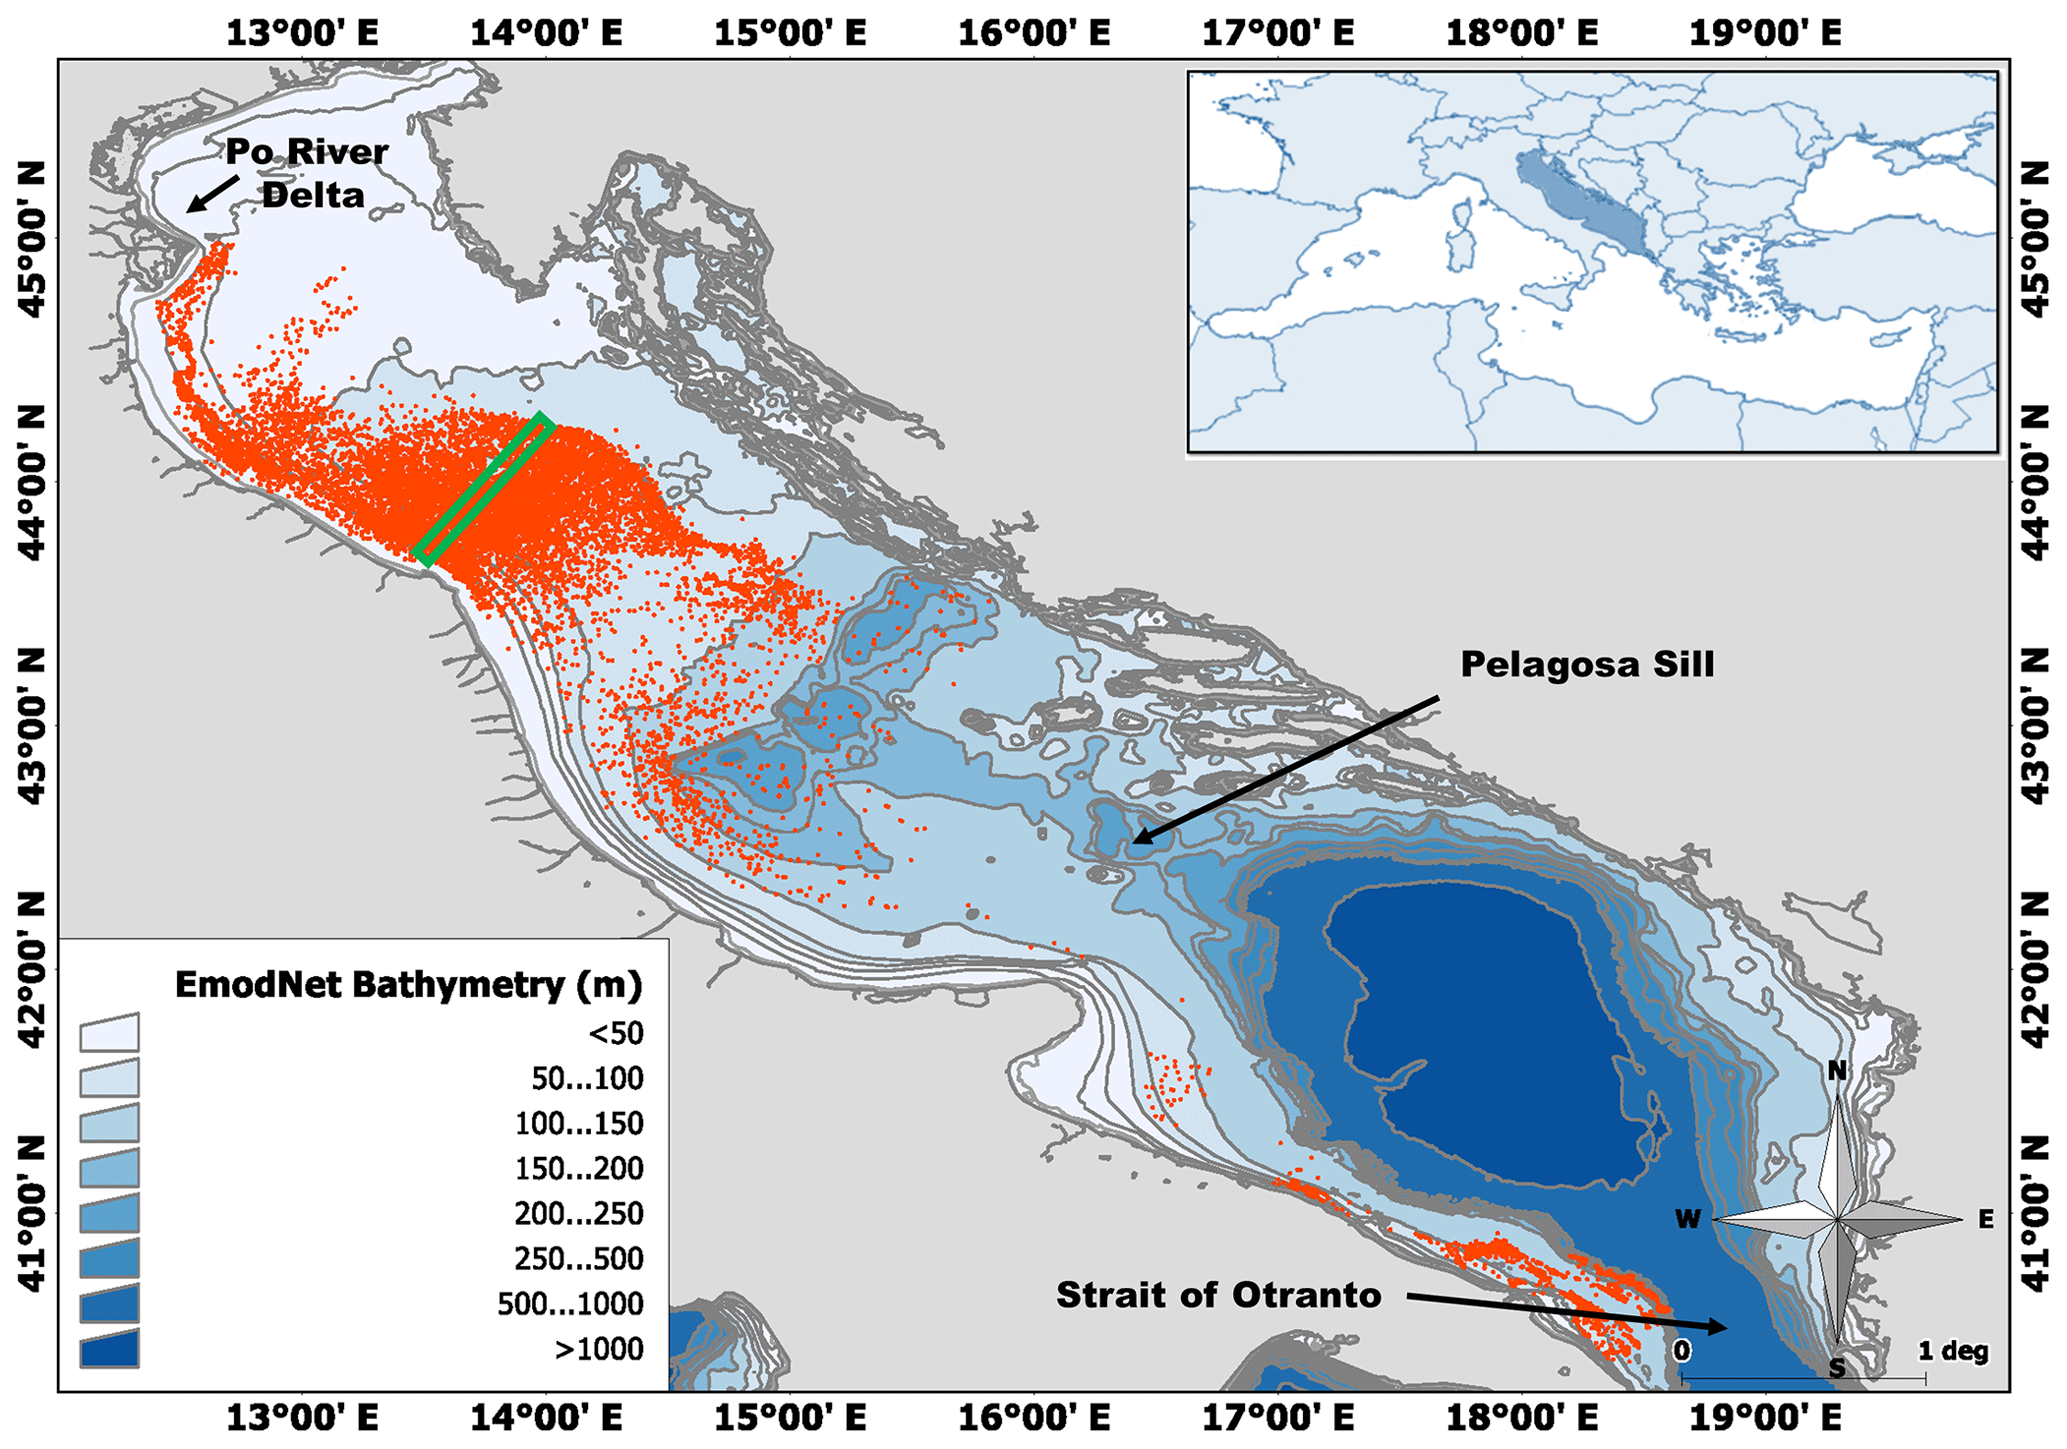
Figure 1In the top-right inset the position of the study area within the Mediterranean basin is highlighted. Red dots indicate the geolocation, and thus the spatial distribution, of the AdriFOOS down-casts belonging to the 2012–2020 dataset. The green rectangle corresponds to the section highlighted in Fig. 10. Study area mapped by means of Manifold® GIS (2022; bathymetry source: EMODnet, 2016).
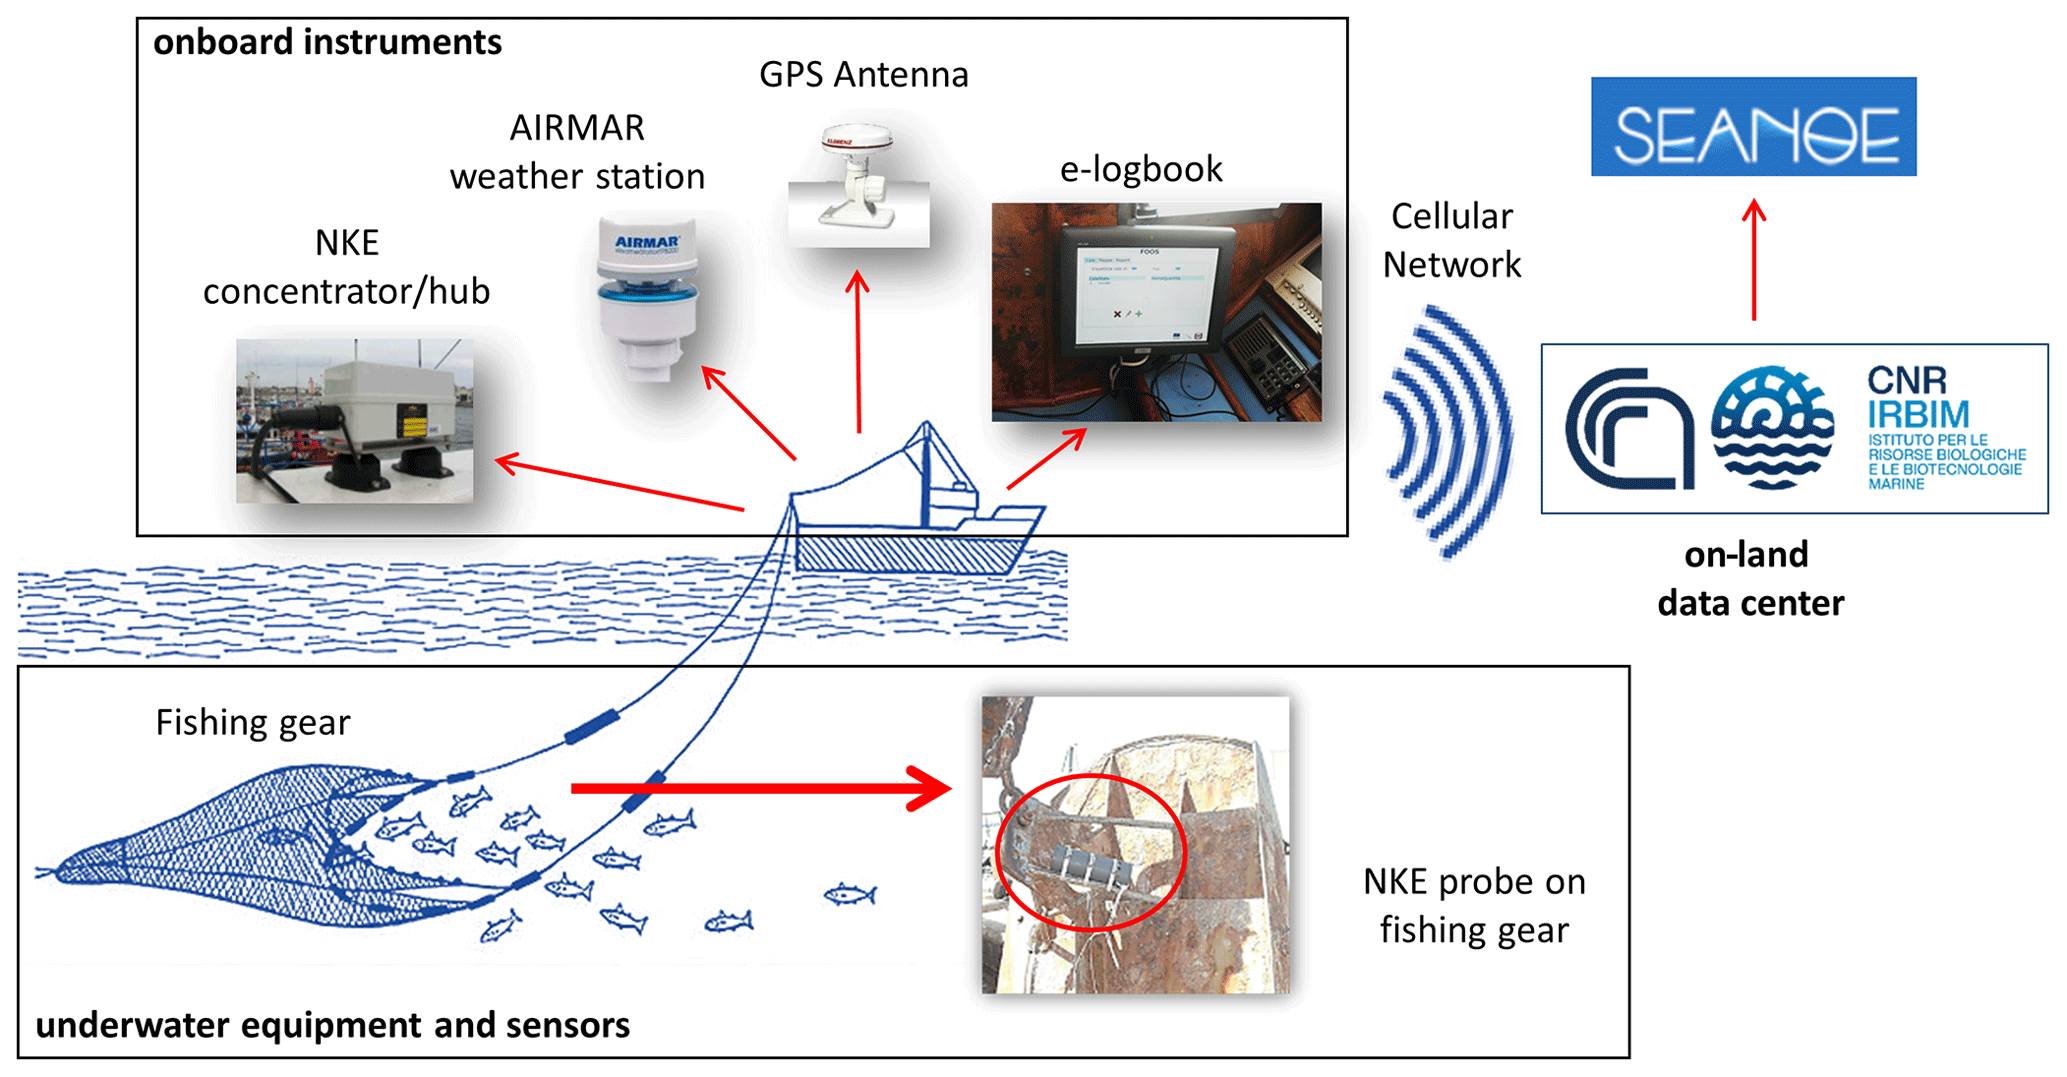
In its current configuration, AdriFOOS is composed of three functional parts: underwater sensors, onboard instruments, and an on-land data center (Fig. 2).
3.1 Underwater sensors
Since 2012, NKE (https://nke-instrumentation.com, last access: 22 June 2023), SP2T (depth–pressure and temperature), and STPS (depth–pressure, temperature, and salinity) sensors, installed on fishing gear, has ensured the acquisition of reliable data (pressure: range 0–300 dbar, accuracy 0.3 % of full scale; temperature: range −5 to 35 ∘C, accuracy ±0.05 ∘C; salinity: range 2–42 psu, accuracy ±0.1 psu) data (Martinelli et al., 2016). Their response time (0.5 s) allows the collection of temperature and salinity profiles during the fishing operations (Penna et al., 2020). However, as reported in Martinelli et al. (2016), especially during the profile phase, the salinity measurements obtained by the NKE sensors are probably strongly influenced by the operating conditions (i.e., the water flow inside the sensor) causing noisy readings that could be reduced by post-processing. The latter procedure as well as those applied to bottom datasets are not described in this paper, as salinity datasets, horizontal profiles, and up-casts as well as the weather and catch information are not included in the discussed dataset and are not yet published.
NKE probes, protected by a silicone layer, are robust enough and reliable for use on fishing gear; however, additional plastic cases are used to protect the sensors and allow them to be directly mounted on the gear in different positions, according to the fishery type (see the example of a sensor mounted on an otter door used by a bottom trawler in Fig. 3).
Since the battery consumption depends on the sampling and radio link communication frequencies and on depth and number of the fishing hauls, after a preliminary testing phase it was decided to adopt the following settings to maintain the charge of the internal battery for relatively long periods: when the sensor enters the water and exceeds a depth of 1.5 m, it starts recording with a frequency of 1 Hz for 10 min (high acquisition rate corresponding to launching of the gear and starting of the fishing operation), after which the sensor records every 1 min (continuation of the fishing operation). The recording ends when the fishing gear comes out of the water and subsequently transmits the collected data via radio link to a concentrator and hub, namely a dedicated data receiver (see Sect. 3.2). Therefore, as already described above, this methodology allows acquisition of temperature and salinity down-casts at an acquisition rate comparable to the most commonly used oceanographic profilers, horizontal profiles at the depth at which the fishing operation takes place, and some data points during the fishing gear recovery (i.e., the up-cast).
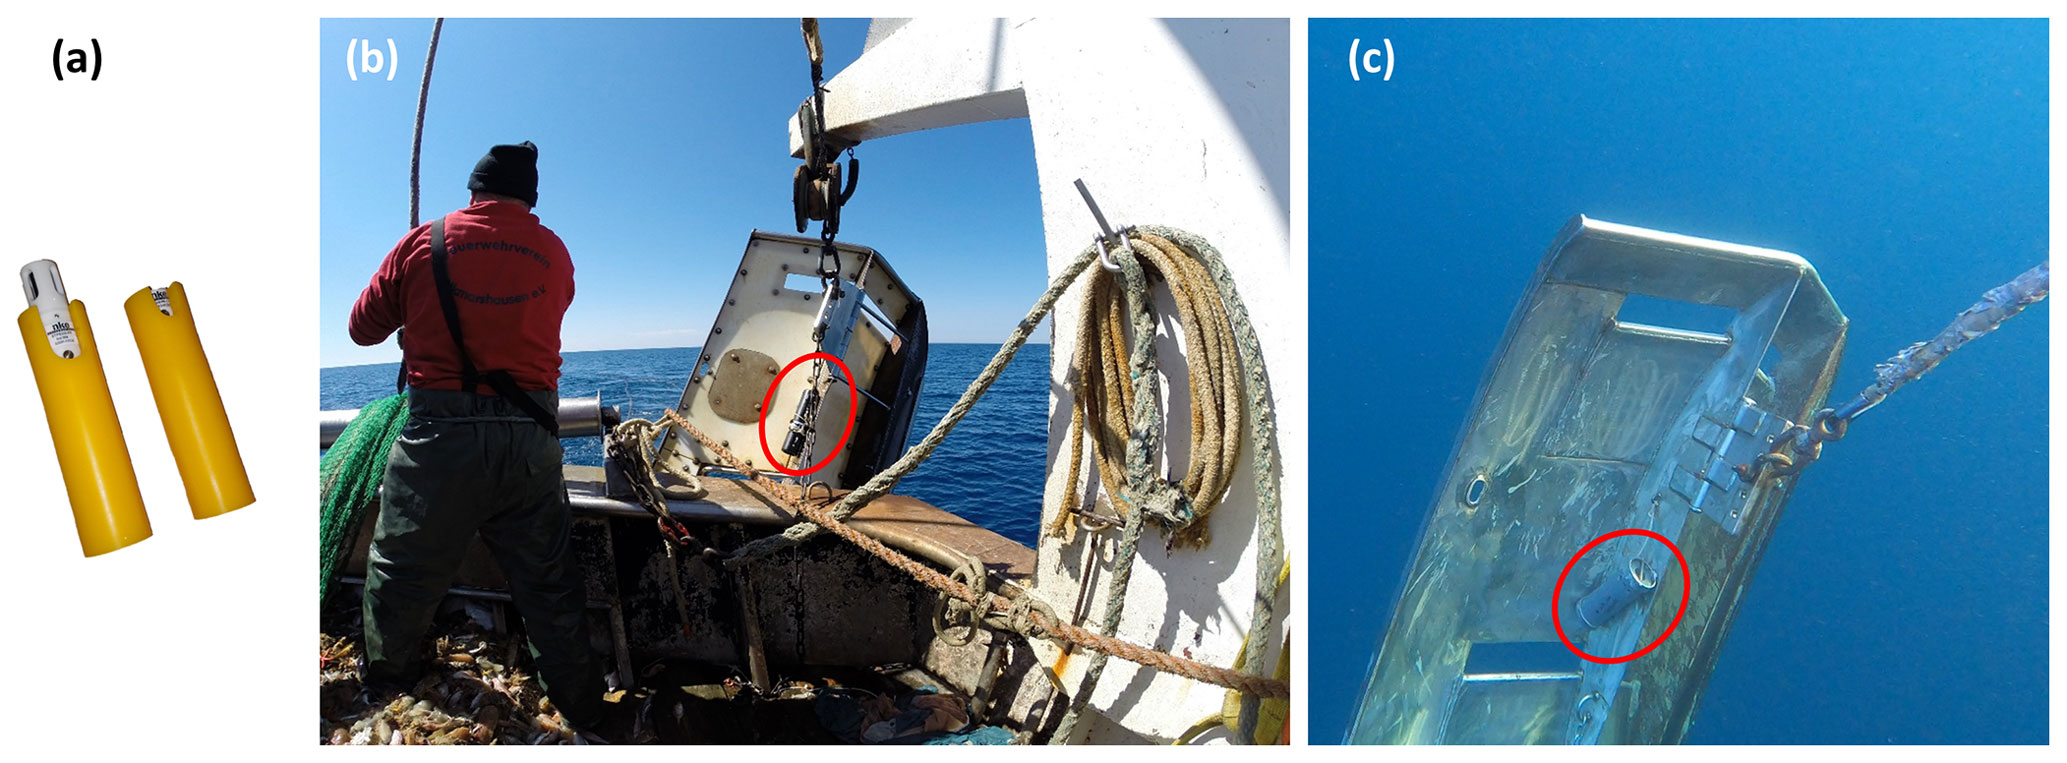
Figure 3NKE SP2T and STPS sensors inserted into yellow rubber protections supplied by the company (a) installed on the otter door of a commercial bottom trawler (b). Otter door and sensor during the fishing operation (c).
3.2 Onboard equipment
An electronic logbook (e-logbook), i.e., an Afolux Embedded x86 (model AFL-W10A-N270) fanless industrial computer incorporating a touch screen, is installed on board each fishing vessel. This is equipped with adequate hardware and software for managing communication among all devices included in the AdriFOOS architecture (Fig. 2). A Microsoft SQL Server Compact Edition database is installed on the e-logbook, allowing storage of GPS track, metocean data, and specific settings referring to each boat (fishing gear, harbor etc.), as well as acquiring catch data (i.e., species by common or dialectal names, quantity, and sizes) directly entered by the fishers through a suitable graphical user interface (GUI; Fig. 4). The latter also gives access to other functionalities such as weather forecast reports and visualization of collected environmental parameters as described below. The database also allows the storage of the GPS track and metocean data when there is no coverage of the cellular network. As soon as the cellular signal is available, a special procedure allows the data to be sent to the on-land data center.
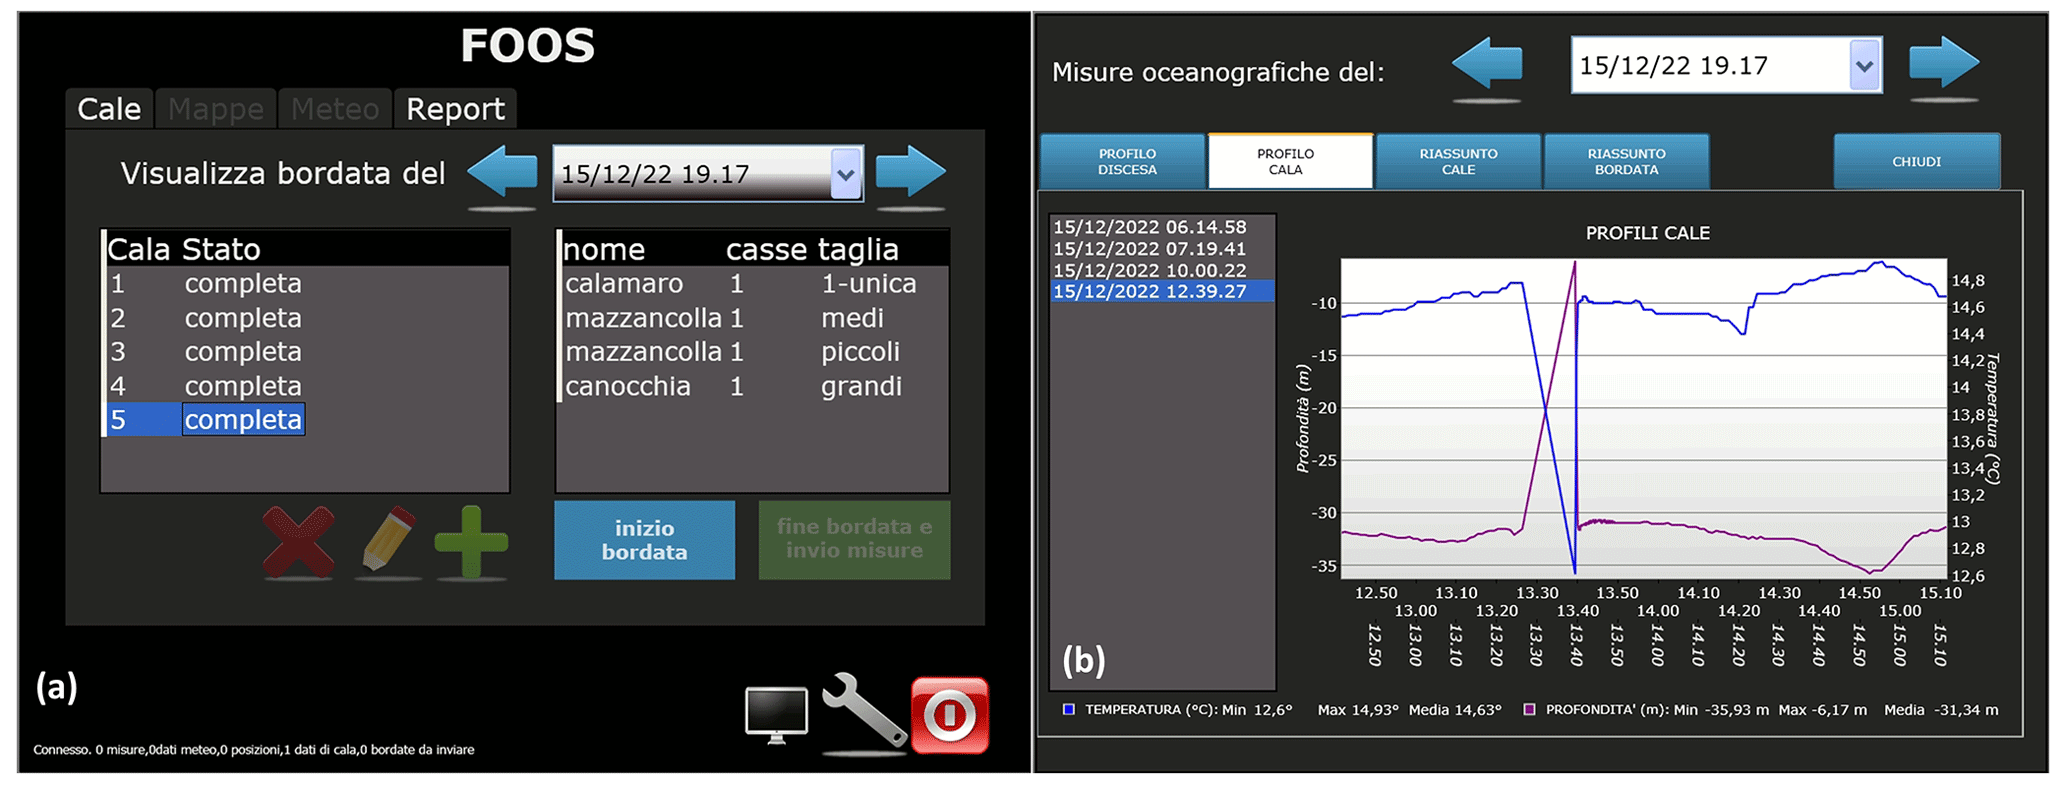
Figure 4AdriFOOS GUI used on board by fishers: screenshot examples from the catch module (a) allowing the user to enter the start and end of the trip (in Italian inizio and/or fine bordata) and caught species quantity (casse) and size (taglia) by haul (cala). The oceanographic real-time data visualization module (b) showing fished depth (purple line) and relative temperature (blue line) by haul.
A Teltonika 3G router ensuring bidirectional communication between the e-logbook and the CNR IRBIM servers via cellular network is also installed on board and connected to the e-logbook. GPRS was chosen due to low operational costs, good coverage along the Italian Adriatic coast (up to 10 nautical miles), and usually short range (up to 60 miles from the coast) and duration of the fishing trips in the monitored area (maximum of 24–48 h), which allow the ground station to receive data in NRT.
A customized NKE concentrator and hub, mounted on the higher vessel deck, record GPS positions every minute and receive data via radio link from the NKE sensors as soon as they are out of the water; this is connected through an RS232 cable to the e-logbook, and using an IP connection over point-to-point protocol (PPP) enables an internal file transfer protocol (FTP) server (every 60 s the concentrator and hub communicates their life status to the e-logbook and send a ping when not receiving data from the sensors). The GUI gives the opportunity to the fishers to directly view the hydrographic conditions linked to the performed hauls.
A compact Airmar weather station is also mounted on the deck and provides acquisition of GPS data, in situ wind speed and direction (real and apparent, automatically calculated in real time by the device), pitch and roll, air temperature, relative humidity, and barometric pressure every 60 s. This communicates also via the RS232 serial link with the e-logbook where the GUI can give access to the collected data.
A Marconi GPS antenna is as well installed on the vessel's deck and connected to the e-logbook via RS232 serial link using a standard NMEA 0183 protocol; indeed, even if redundant, this serves to avoid loss of crucial information such as GPS tracking in the case of the other instrument failure.
3.3 On-land data center
The AdriFOOS server hosts a series of services among which are the wave forecasting module, the AdriFOOS web platform, and the relational databases described in detail in the Supplement Sect. S1. The wave forecasting module directly communicates with the e-logbook GUI to provide sea forecast information to the fishers. Two databases (hereafter referred to as DBs), built by means of the ORACLE MySQL Database Service, are installed on the AdriFOOS server and contain, respectively, raw and validated data (see Sect. 4). The raw data relational DB are directly populated by data sent in NRT from the e-logbooks on board the vessels through a representational-state transfer, application program interface (REST API) based on hypertext transfer protocol (HTTP), and support transport layer security (TLS) encryption. This DB, whose structure is briefly described in the Supplement Sect. S1, allows catch and oceanographic data to be associated and georeferenced. Furthermore, a web interface (hereafter referred to as FOOSweb) is directly connected to this. Depending on the access rights, FOOSweb allows users to check the status of each FOOS and enables system administrators to carry out some validation procedures or extract data. The functionalities of FOOSweb are better described in the Supplement, which also provides access information to view a sample of the data.
As mentioned above, the different types of information collected through AdriFOOS are subject to validation through a series of quality assurance (QA) and quality control (QC) procedures applied by researchers both automatically and manually. Data received in NRT are stored in the raw data DB in which some automatic or manual procedures described below are applied (columns are available in the DB tables for specific quality flags), and once definitively validated they are transferred in a validated data DB (see DB structure in Supplement Sect. S1). Data are stored in physical units following the standard metric of the International System of Units; time and position are recorded following, respectively, the Coordinated Universal Time (UTC) and the World Geodetic System 1984 (WGS84) formats. Validated datasets include flags for each record to indicate the estimated quality of the measurement (see Sect. 4.2). Metadata are available for each dataset. A QC process is carried out on the oceanographic data according to the different acquisition phases (i.e., down-cast, horizontal profile, and up-cast). The AdriFOOS dataset 2012–2020 refers to temperature and pressure data acquired along the water column during the down-cast phase (Penna et al., 2020); therefore, the procedures applied to these data will mainly be described below.
4.1 Field test of sensors and evaluation of the offset
All the oceanographic sensors used in AdriFOOS (see characteristics in Sect. 3.1) are prior and periodically tested in the field for offsets, and their performance is compared to oceanographic-class CTD (conductivity, temperature, and depth) probes through simultaneous casting, following Martinelli et al. (2016). Where needed, the obtained offset values can be used to correct datasets in the validated data DB (see Supplement Sect. S1). In this case, the values of the oceanographic parameters are modified for each single sensor identified by its serial number. As part of the applied QA procedure, sensors that developed offsets greater than the accuracy range declared by the producer are discarded and/or sent back to the producers' facilities for recalibration.
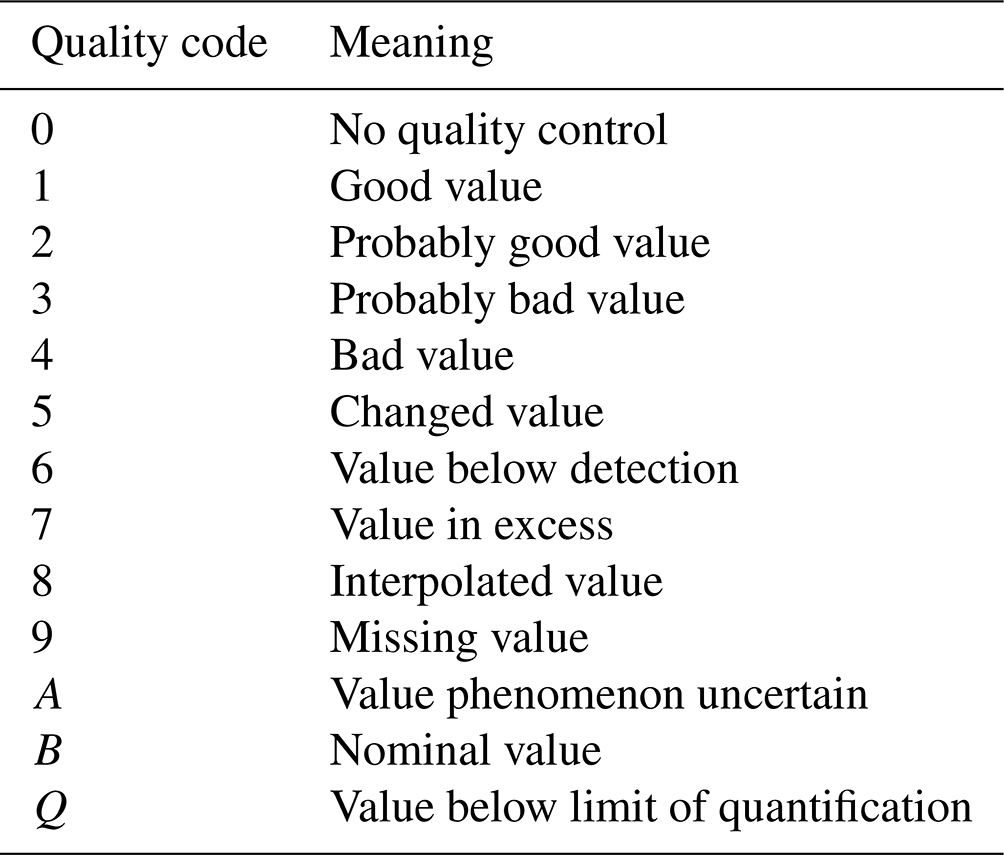
4.2 Quality flags in use
All flags used follow the standard L20 vocabulary (Seadatanet, 2022) and are reported in Table 1. The QC process is carried out on the oceanographic data according to the different acquisition phases (i.e., down-cast, horizontal profile, and up-cast). Normally, the profiling phase is fast, as the fishing gear very quickly reaches the fishing depth; thus, by adopting the first recorded GPS position (start of the haul), the acquired profile can be assimilated to a classic CTD haul. Instead, for example, the horizontal profile data collected during the fishing phase could potentially be assimilated and treated as drifter trajectories, as the GPS position is recorded at a 1 min rate.
Table 1SeaDataNet quality codes (and their meaning) used to flag records in the dataset of Penna et al. (2020).
4.3 Automatic validation procedures
The information collected by means of FOOS and stored in the raw data DB is processed following the SeaDataNet QC procedures and protocols (Seadatanet, 2010). The QC phases described below are performed automatically on the raw data by a specific ad hoc software compiled in PHP (hypertext preprocessor), which directly assigns the appropriate flag codes. Some general assumptions are applied to the dataset:
-
The QC flag value assigned by a test cannot override a higher value from a previous test.
-
Only measurements with a QC flag value of 1 can be used safely without a further check.
-
If the measurement has a QC flag value of 4, it should be rejected.
-
If any of the general information (e.g., time and location) is inconsistent, the whole profile is marked as “bad”, which means that all pressure–temperature data pairs are flagged using code 4 (which is a bad value).
The sequential automatic QC steps carried out on the dataset include the following:
-
Header detail consistency check (vessel code, cruise number, station number, instrument serial number and type, and adequate number of data points). All the codes used must be included among those stored in the corresponding tables included in the DB (see Supplement Sect. S1.1); if any of this information is inconsistent, the whole profile is marked as “bad”.
-
Impossible date–time test. The date must be between 26 November 2012 and the date of data transfer to the inland server; if the date–time data are inconsistent, the whole profile is marked as “bad”. None of the records included in the Penna et al. (2020) dataset failed the test.
-
Impossible location test. Due to some random GPS malfunctions, unfortunately, some profiles cannot be associated with any position, and in this case the data are directly deleted. Furthermore, considering that the monitored vessels work in the Adriatic Sea, latitude within the datasets must be between 40.4 and 45∘ N and longitude between 12.4 and 18.6∘ E. If any of the positions in a dataset are inconsistent, then the whole profile is marked as “bad”. None of the positions recorded in the Penna et al. (2020) dataset failed the test.
-
Global temperature range test. A filter taking into account the temperature range of the sensors in use is applied on the observed values. If any of the temperature records fail the test, this is marked as “bad”. None of the temperature records in the Penna et al. (2020) dataset failed the test.
-
Regional temperature range test. A filter taking into account the expected extreme temperatures encountered in the Adriatic Sea (5–32 ∘C) is applied on the observed values. If any of the temperature records fail the test, this is marked as “bad”. None of the temperature records in the Penna et al. (2020) dataset failed the test.
-
Pressure range test. The control range goes from −5 to 300 dbar to include any measurement in air and to take into account the maximum operating depth indicated by the manufacturer for the sensors in use. Preliminarily, fishers who normally operate at depths within the range of the sensors were selected in order to avoid measurements out of range. If any of the pressure records fail the test, this is marked as “bad”. None of the pressure values in the Penna et al. (2020) dataset failed the test.
-
Pressure increase and decrease test. The three different acquisition phases (i.e., the down-cast, horizontal profile, and up-cast) are marked with a specific internal tag within the DB. To mark a down-cast, the test requires a monotonically increasing pressure. The Penna et al. (2020) dataset includes only data marked as down-cast by this procedure.
-
Spike test. Assuming that a spike is defined by a large difference between adjacent values (Seadatanet, 2010), the algorithm used to identify it is test value = , where V2 is the measurement being tested as a spike, and V1 and V3 are the previous and next values. The test fails when the test value exceeds 1.0 ∘C, and data are flagged using code 2 (probably good value).
4.4 Visual inspections
Further controls can be manually carried out, based on the expertise of an oceanographer, directly through a web interface connected to the raw data DB (FOOSweb; see Fig. S2a in Supplement Sect. S1.3). A specific panel under the “Menu Admin” section (Fig. S2a) allows users to visualize all acquired casts. This feature was developed in order to be able to quickly verify possible sensor failures or anomalies and thus provide technical assistance as soon as possible. Furthermore, this allows checking and modifying of the quality flags derived from the automated procedures described in the previous section for every depth–temperature data pair and keep track of this process (this feature is also available for salinity profiles). Flags automatically set at code 0 (no quality control) can thus be changed semi-automatically to code 1 (good data). For the Penna et al. (2020) dataset, this feature was also used to check for highlighted spikes and adjacent values to be used for interpolation. In this case, the record flag was consequently changed to code 8 (interpolated value).
A dedicated tool was also developed to allow the export of profile datasets in the ODV (Ocean Data View) standard format (Schlitzer, 2021) and thus allows a further global visual inspection of data. In particular, the QC on the down-cast dataset of 2012–2022 was carried out according to the following steps:
-
plotting profiles collected in the same area and period to check for evident discrepancies (Fig. 5);
-
visual inspection on the profiles to identify any remaining spurious or wrong values;
-
flagging of wrong profiles.
Using this procedure, a further check on pressure records was done on the Penna et al. (2020) dataset: values between −5 and 1.5 m were detected globally and marked with flag code 4 (bad value), as the sensor is normally set to activate the acquisition after exceeding the 1.5 dbar threshold.
Figure 5 shows temperature down-casts, which, while passing the automatic checks, are evidently still invalid and consequently flagged as “bad” (i.e., the red profile and those indicated by red arrows in panel b). At this point, if necessary, data are also corrected with the offsets calculated in the field tests and, after the QC, are re-imported in the DB containing validated data.
Data that underwent the procedures described above are then ready to be exported in ODV, NetCDF, or any other type of interoperable format.
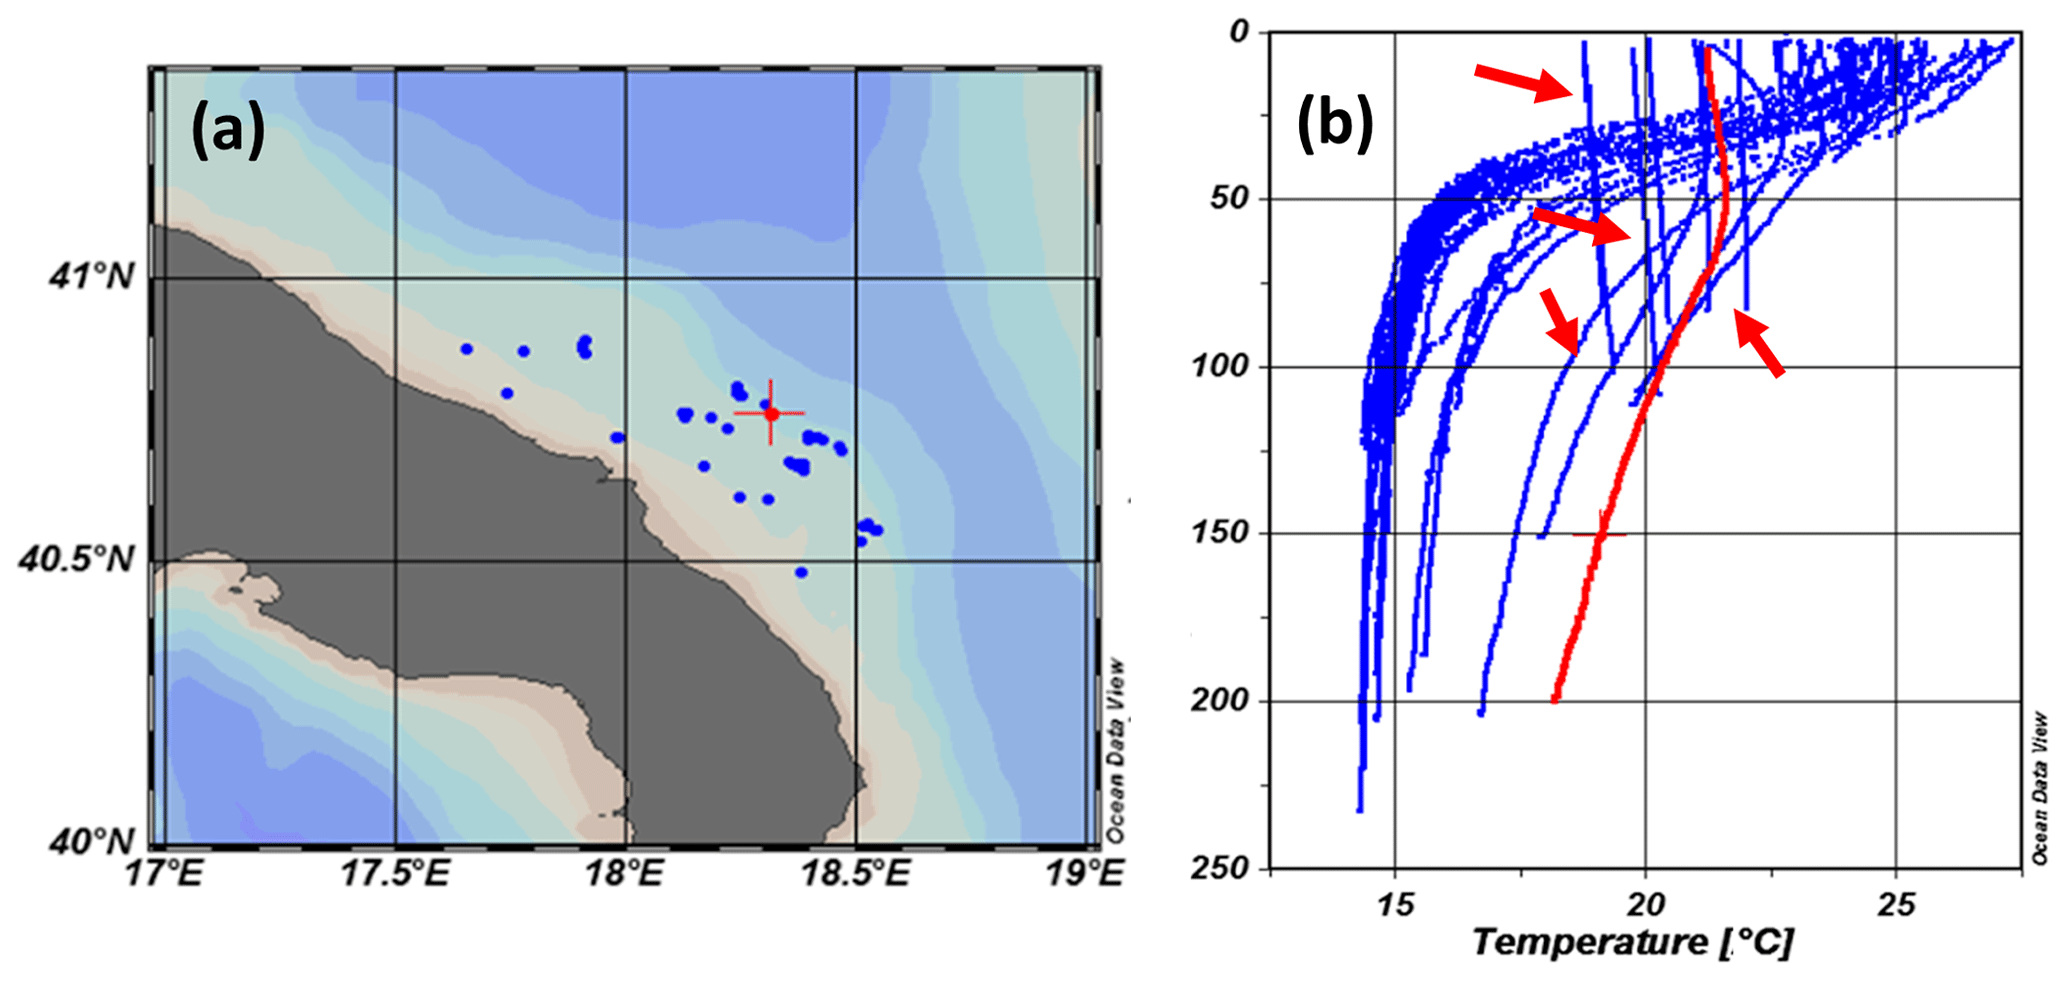
Figure 5Map of georeferenced profiles obtained by AdriFOOS in the southern Adriatic Sea for the day 24 July 2013, with one highlighted location (red cross; a) and respective depth (pressure) and temperature profile (red profile; b) by means of Ocean Data View (Schlitzer, 2021). The highlighted profile and those indicated by red arrows are flagged as “bad”.
4.5 Other quality check procedures featured in AdriFOOS
As reported above, the procedures and post-processing applied to the salinity datasets, horizontal profiles, and up-casts collected through AdriFOOS are not broadly discussed in this paper.
However, it is worth mentioning that the FOOSweb interface also embeds a “catch validation tool” whose purpose is to correctly associate by haul the data on the caught fish species with the oceanographic georeferenced information. Indeed, sometimes it may happen that these two sets of data do not correspond due to the fact that fishers were not able to enter the catch data in NRT before the start of the following hauls; in the haste of the work on board, catch can also be wrongly inserted (clearly unreliable in reference to the fishing gear or the fishing area, species reported in unsuitable quantities, etc.). In this case, through the FOOSweb (Fig. S2b) and based on their knowledge and experience, a fishery biologist can check the automatically defined fishing trip and haul definitions provided by the DB (see Supplement Sect. S1), correct the wrong associations, and QC and label (i.e., assign validation flags) each catch–haul combination.
The dataset in Penna et al. (2020) is supplied in tab-delimited text ASCII format, according to Ocean Data View SeaDataNet standards (Lowry, 2019). An example of two depth (pressure) and temperature down-casts and the header with metadata is shown in the Supplement Sect. S3. Therefore, the data files produced by AdriFOOS can be directly uploaded in the ODV software (version 4; Schlitzer, 2021) for visualization and analysis. Furthermore, the ODV standard tab-delimited ASCII text format (Lowry, 2019) contains self-described metadata (e.g., measurement ranges, producer and type of sensors, precision, and accuracy) and can be easily imported in generic database management systems (DBMSs) or GIS software. The same dataset can also be downloaded in network common data form (NetCDF, 2022) standard format. For the latter, compliance with version 1.7 of the climate and forecast (CF) metadata conventions was verified through the Integrated Ocean Observing System (IOOS) Compliance Checker Tool (https://compliance.ioos.us/index.html, last access: 22 June 2023).
The number of profiles generated by the AdriFOOS fleet during the period from 26 November 2012 to 26 February 2020 was 14 810, consisting of 942 672 depth (pressure)–temperature data pairs (Penna et al., 2020). After being subjected to QA and QC, the dataset can be considered accurate in temperature at 0.05 ∘C and ±0.3 % full scale (i.e., 300 dbar) in pressure. Table 2 summarizes the statistics calculated for each vessel, while Fig. 6 describes the quantitative spatial distribution of these depth (pressure) and temperature down-casts.
Table 2Number of profiles (station count), number of records (depth (pressure)–temperature data pairs count), space, and time span of the data collection indicated for each vessel.
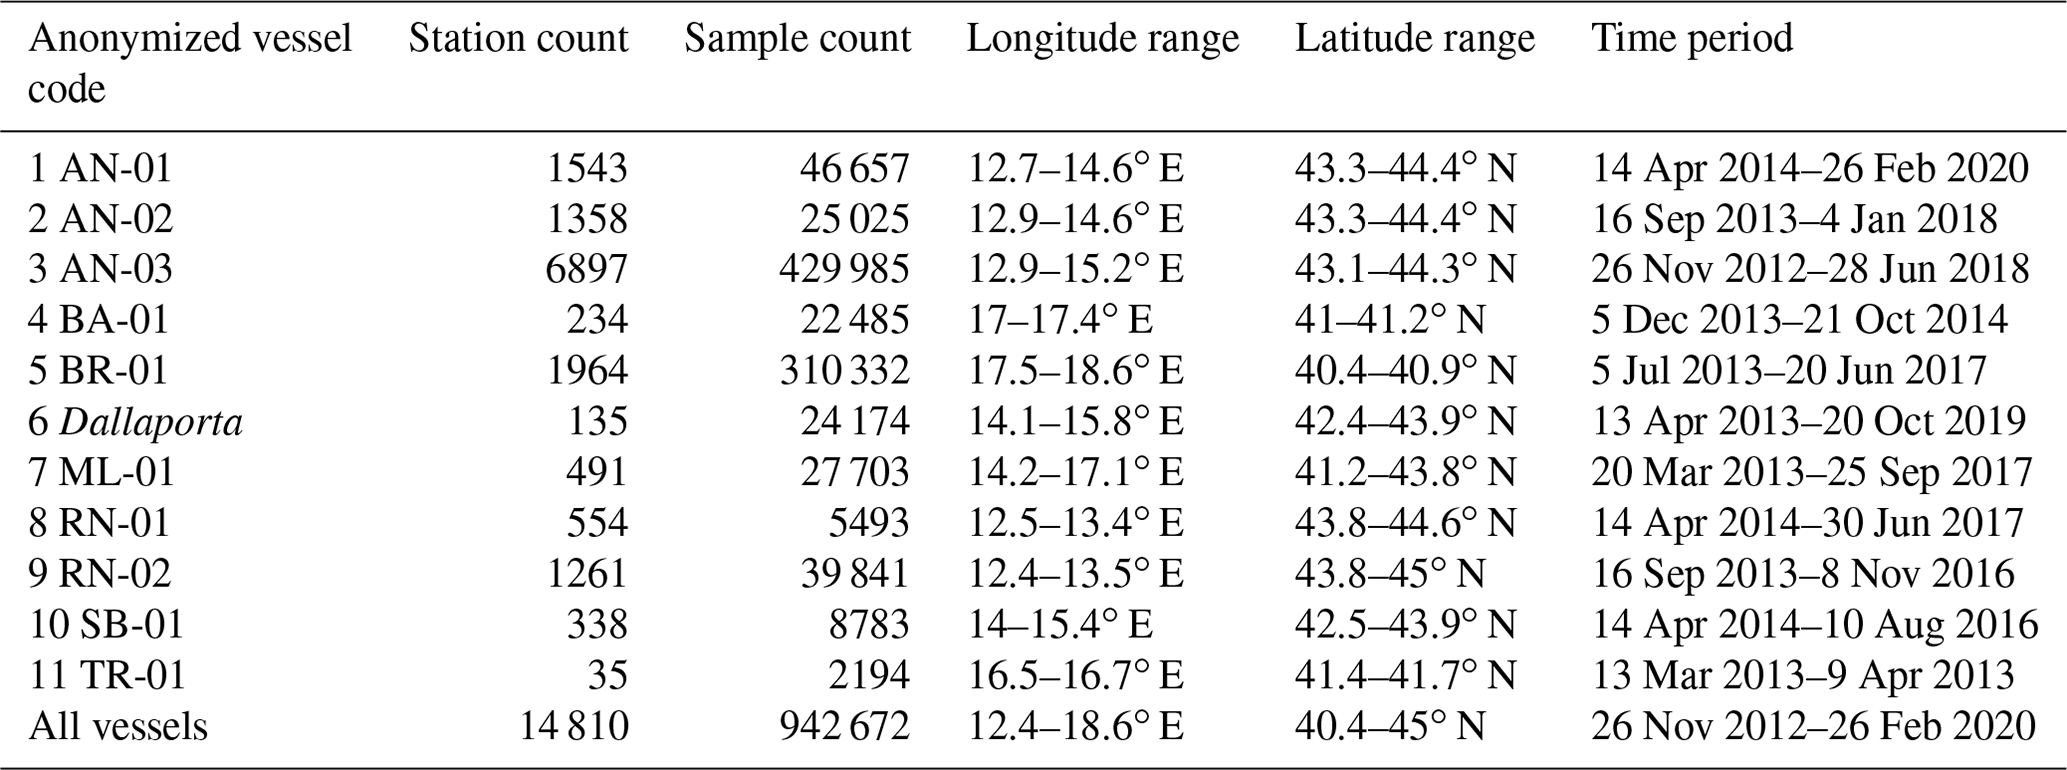
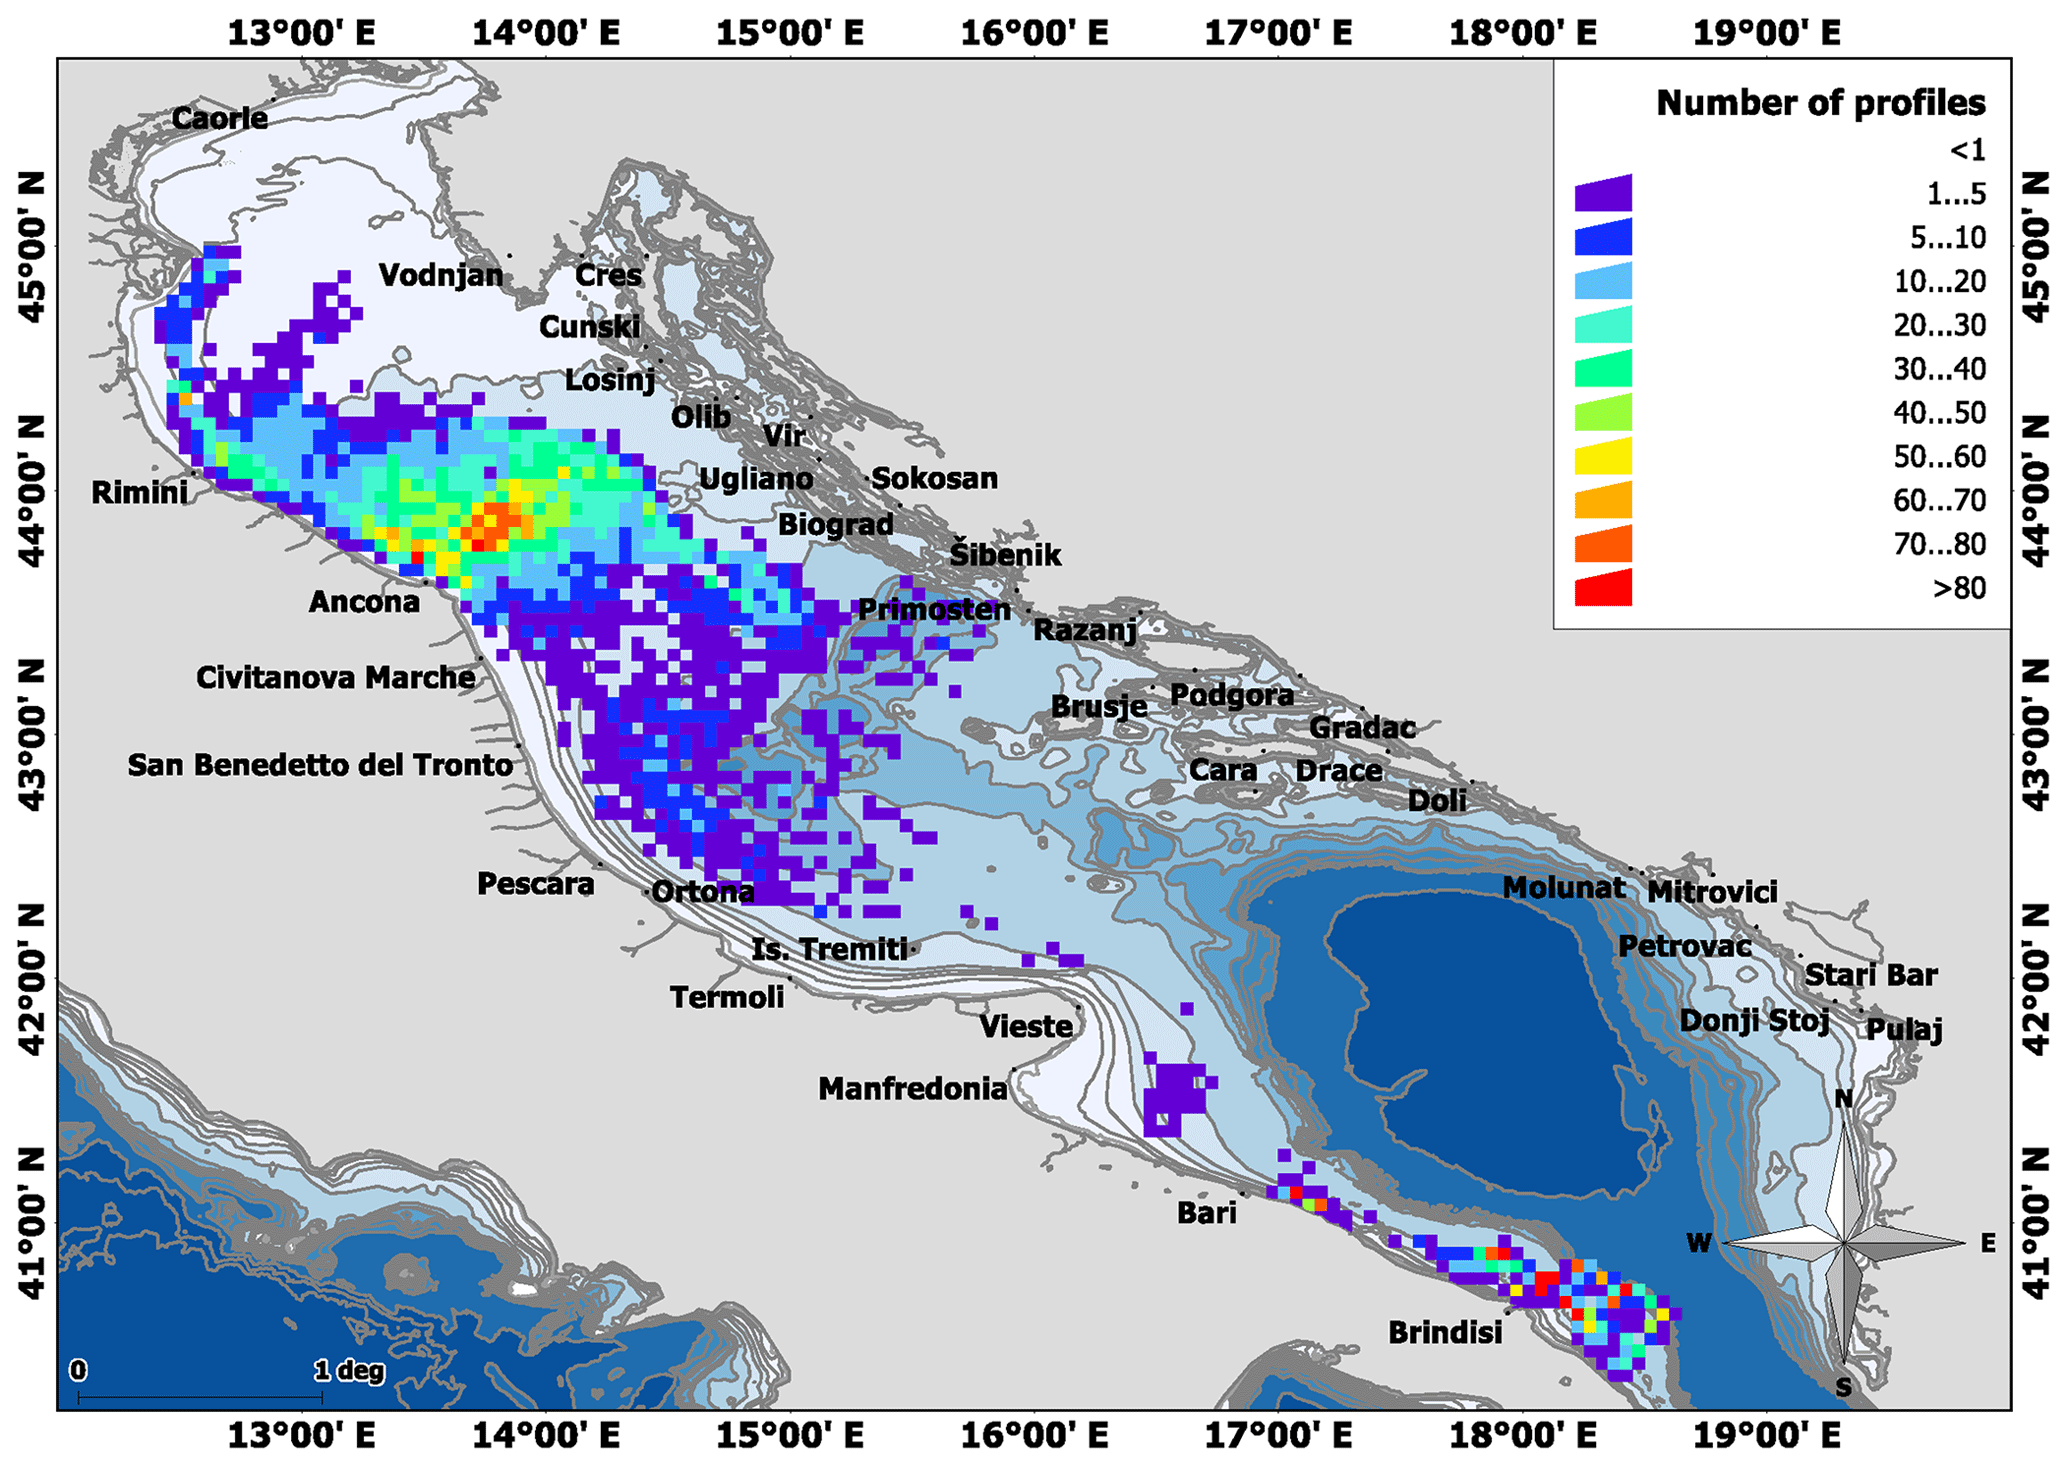
Figure 6Quantitative spatial distribution of the AdriFOOS depth (pressure) and temperature profile dataset 2012–2020 mapped by means of Manifold® GIS (2022). Bathymetry source: EMODnet (2016).
Figure 7a highlights that the highest number of profiles was recorded in 2014, 2016, and 2017, when 11 fishing boats were operational. From 2018 to 2020, unfortunately, the number of monitored vessels temporarily decreased due to a series of operational limitations (decommissioning of some of the long-term monitored vessels, difficulty in recruiting new collaborative captains, bureaucratic or funding limitations, etc.). Taking into account the days of the year, an average of about 600 depth (pressure) and temperature profiles were recorded every 2 weeks (Fig. 7b). It is evident in Fig. 7b that there is a reduction in the number of recorded profiles (hauls) during the summer season (spanning between day of year numbers 230 and 264), which could be related to the national annual temporal closure of fisheries implemented in the Adriatic Sea (30 d in a variable period every summer; FAO, 2022).
The number of pressure data points (counts) collected by AdriFOOS over the reference period 2012–2020 is shown in Fig. 8a; a higher density of records corresponds to pressure lower than 120 dbar. The quantity (counts) of pressure (depth)–temperature data pairs is shown instead in Fig. 8b; data pairs are aggregated in a pressure range between 0 and 80 dbar and a temperature range between 13 and 20 ∘C.
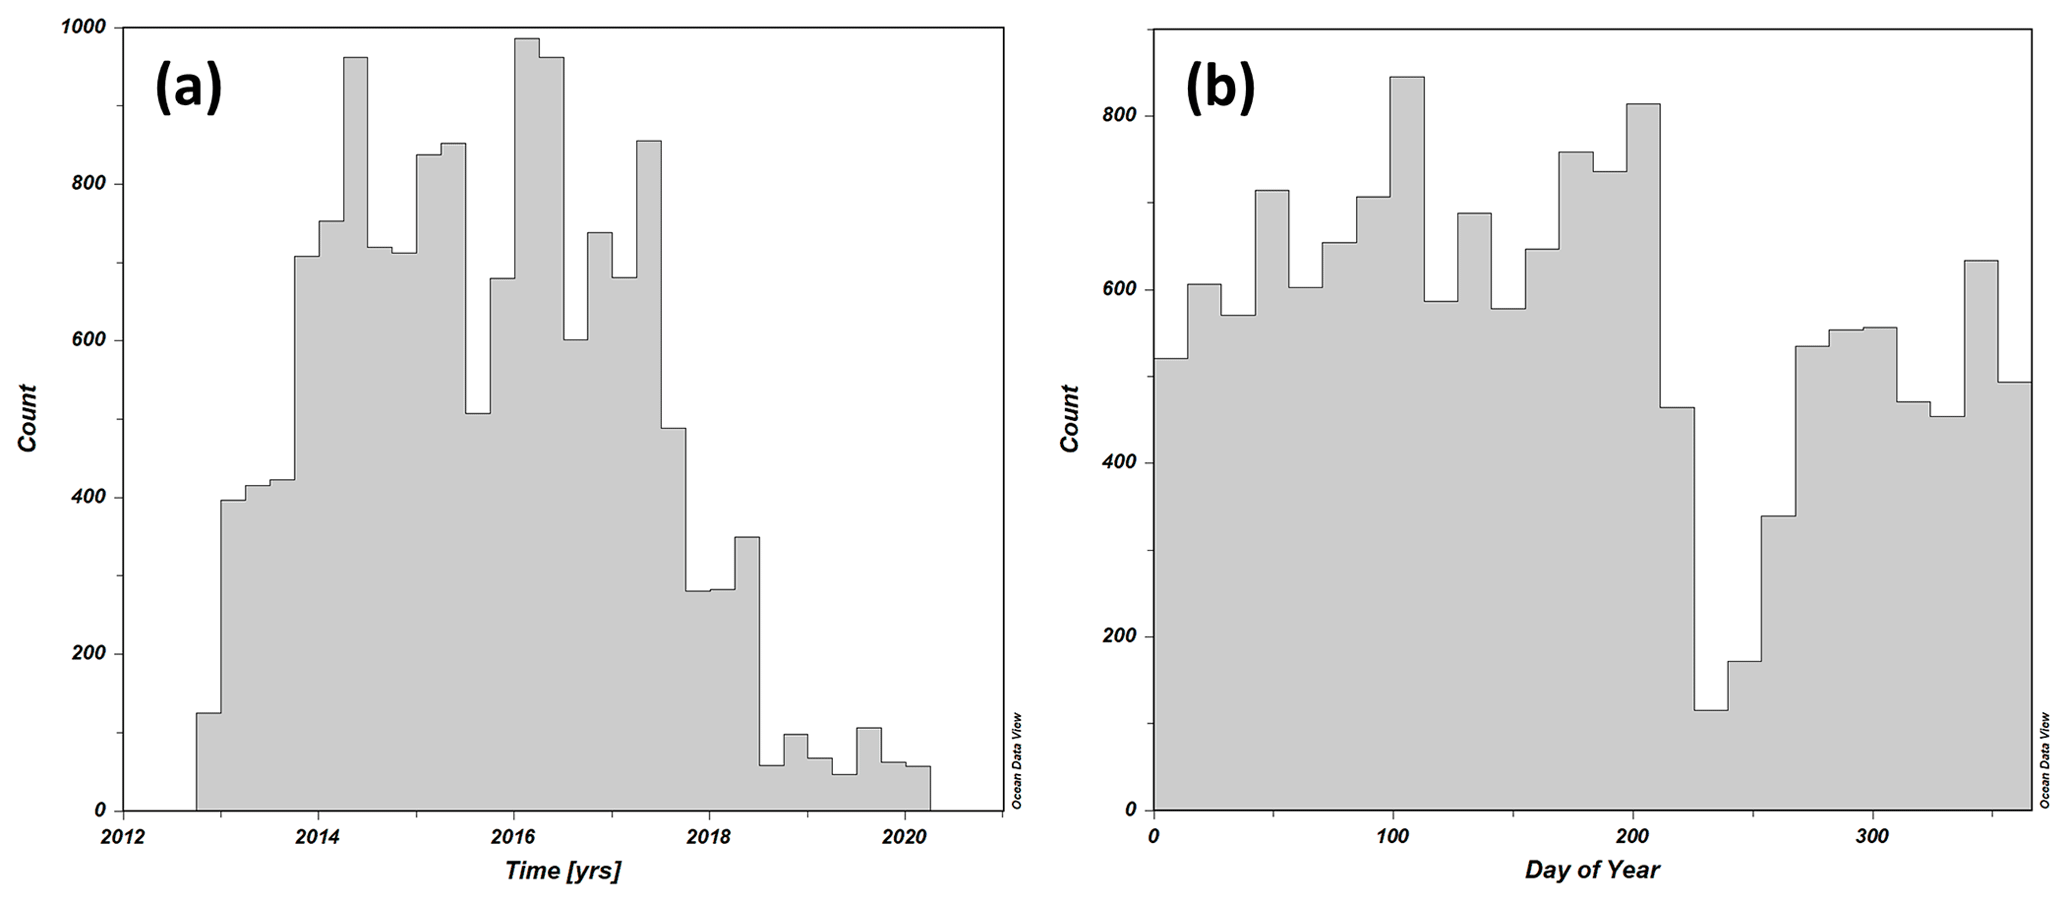
Figure 7Count of depth (pressure) and temperature profiles over years (a) and day of the year (b). Graphs generated by means of Ocean Data View (Schlitzer, 2021).
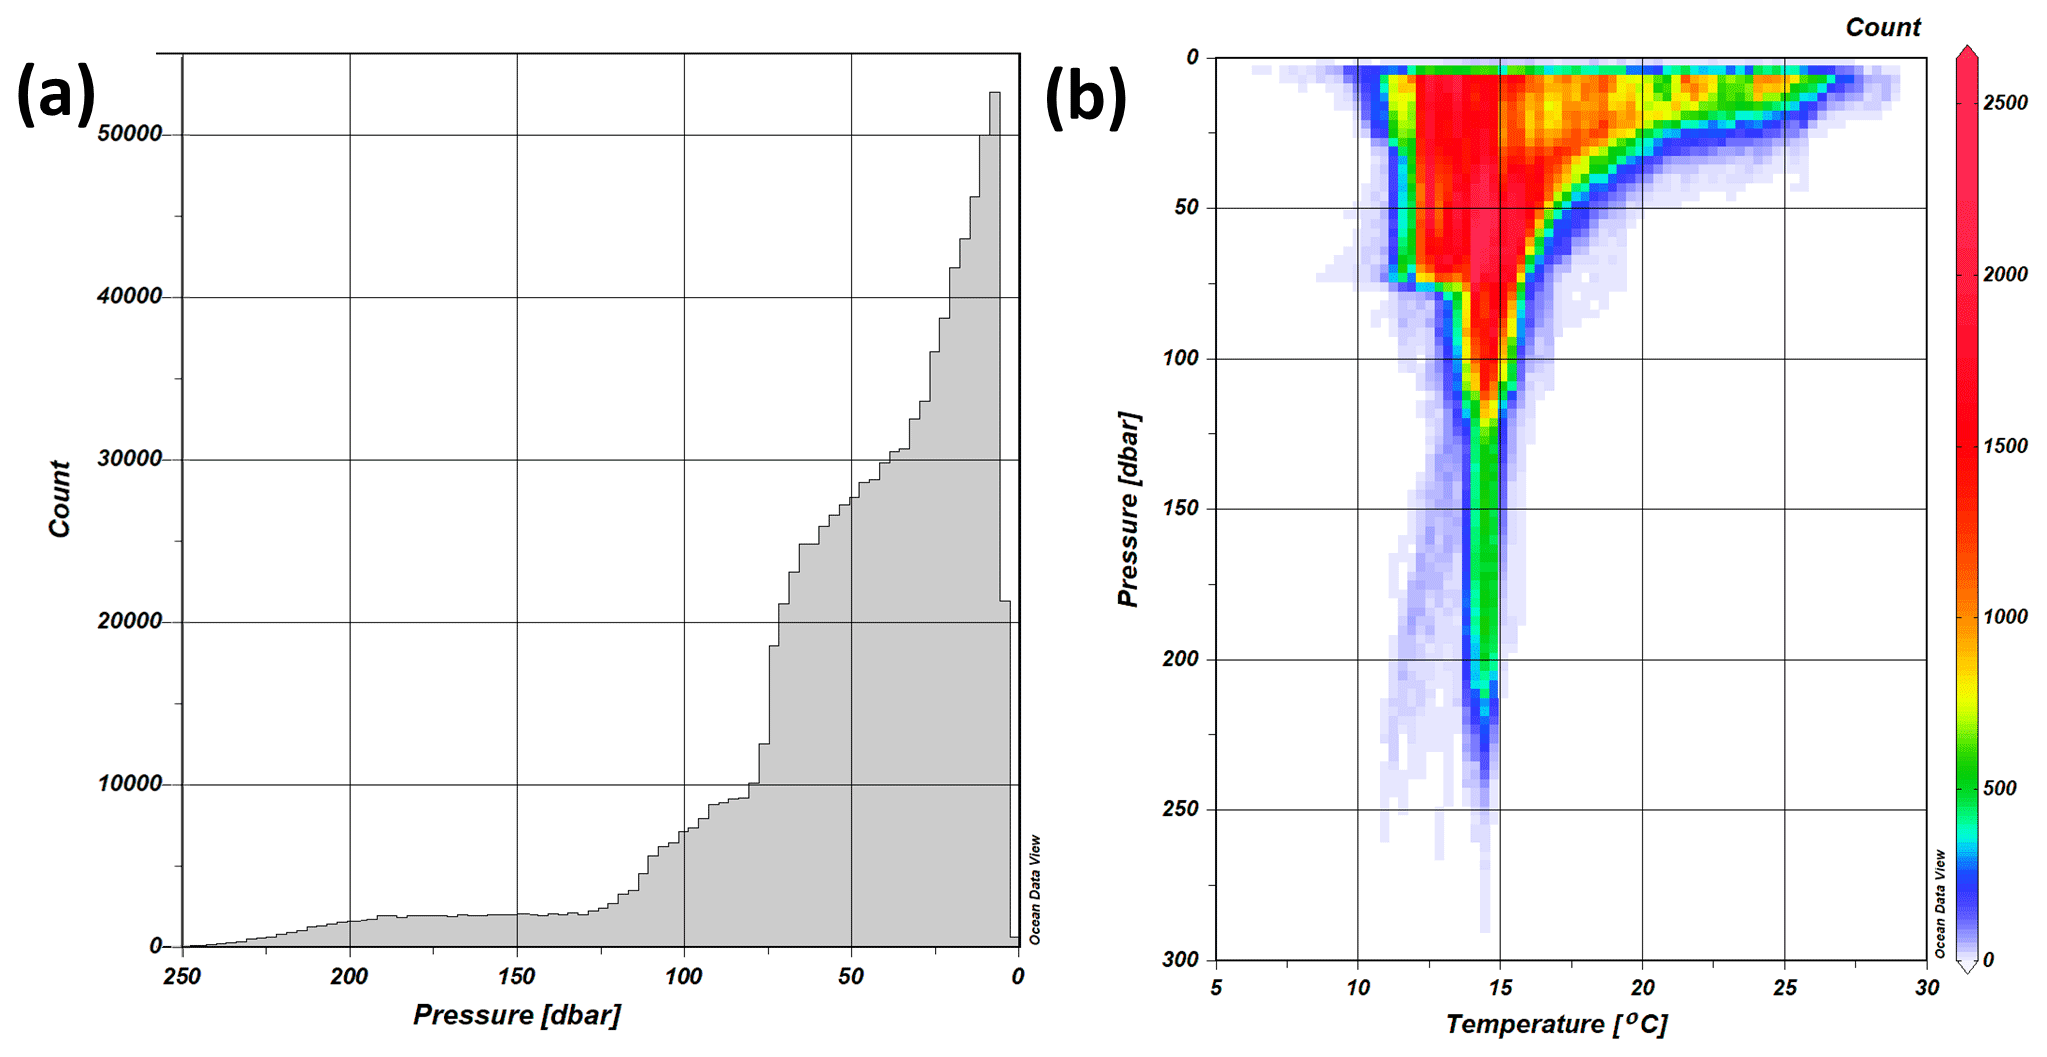
Figure 8Distribution of data collected by AdriFOOS over the reference period 2012–2020 in relation to pressure (depth) (a) and distribution of pressure (depth)–temperature pairs (b). Graphs generated by means of Ocean Data View (Schlitzer, 2021).
The seawater column oceanographic data (i.e., depth and temperature acquired during the profiling phase) described in this paper are available in the SEA scieNtific Open data Edition (SEANOE) repository at https://doi.org/10.17882/73008 (Penna et al., 2020). The dataset consists of 14 810 depth (pressure) and temperature water column down-casts recorded by the AdriFOOS infrastructure in the Adriatic Sea during commercial fishing operations. The dataset underwent QA and QC processes and is supplied in tab-delimited text ASCII format.
The first trials on the AdriFOOS infrastructure were carried out in June 2012 by means of a commercial bottom trawler belonging to the Ancona fleet. In 2014, nine vessels (five pelagic pair trawlers, two purse seiners, and two bottom trawlers) were operational in the Adriatic Sea, increasing not only the spatial extension toward the southern part of the basin but also the possibility to monitor various kinds of fisheries, if compared to systems previously in use.
Figures 9 and 10, produced through specific ODV functions (Schlitzer, 2021), show examples of oceanographic data products that may be obtained by means of AdriFOOS. The ODV embedded data-interpolating variational analysis interpolation algorithm (Troupin et al., 2019), set to automatic scale length, was used.
Figure 9 shows the sea surface temperature map obtained for the month of July 2014; it was generated by first creating an isosurface variable “temperature at first available georeferenced pressure value” and then plotting it using the surfer window template.
Figure 10 shows seasonal vertical temperature sea sections of the central Adriatic Sea obtained by AdriFOOS in 2014 obtained using the ODV section window, upon defining and selecting a sea section of about 4.7 × 100 km, ranging from the coast to open sea (Fig. 10a, red rectangle). The down casts falling within the defined section were used to create seasonal vertical temperature sections, showing the natural seasonal variability over the periods December 2013–February 2014 (winter, 4942 data pairs; Fig. 10b), March 2014–May 2014 (spring, 3279 data pairs; Fig. 10c), June 2014–August 2014 (summer, 2003 data pairs; Fig. 10d), and September 2014–November 2014 (autumn, 4481 data pairs; Fig. 10e). The temperature difference between the winter and spring seasons (December 2013–May 2014; Fig. 10b, c) is likely due to the river runoff into the northern Adriatic, which leads to a strong surface current generating a floating coastal water layer that flows toward the south along the Italian coast (Cozzi and Giani, 2011; Grilli et al., 2020). A well-pronounced thermocline occurring in the summer season is instead evident in Fig. 10d, highlighting the stratification of the water column: a temperature of about 25 ∘C in the first 20 m gradually decreases to 14–15 ∘C near the sea bottom. In autumn, this stratification slowly disappears and a mixing of the water column is evident at least up to 50 km from the coast, as shown in Fig. 10e.
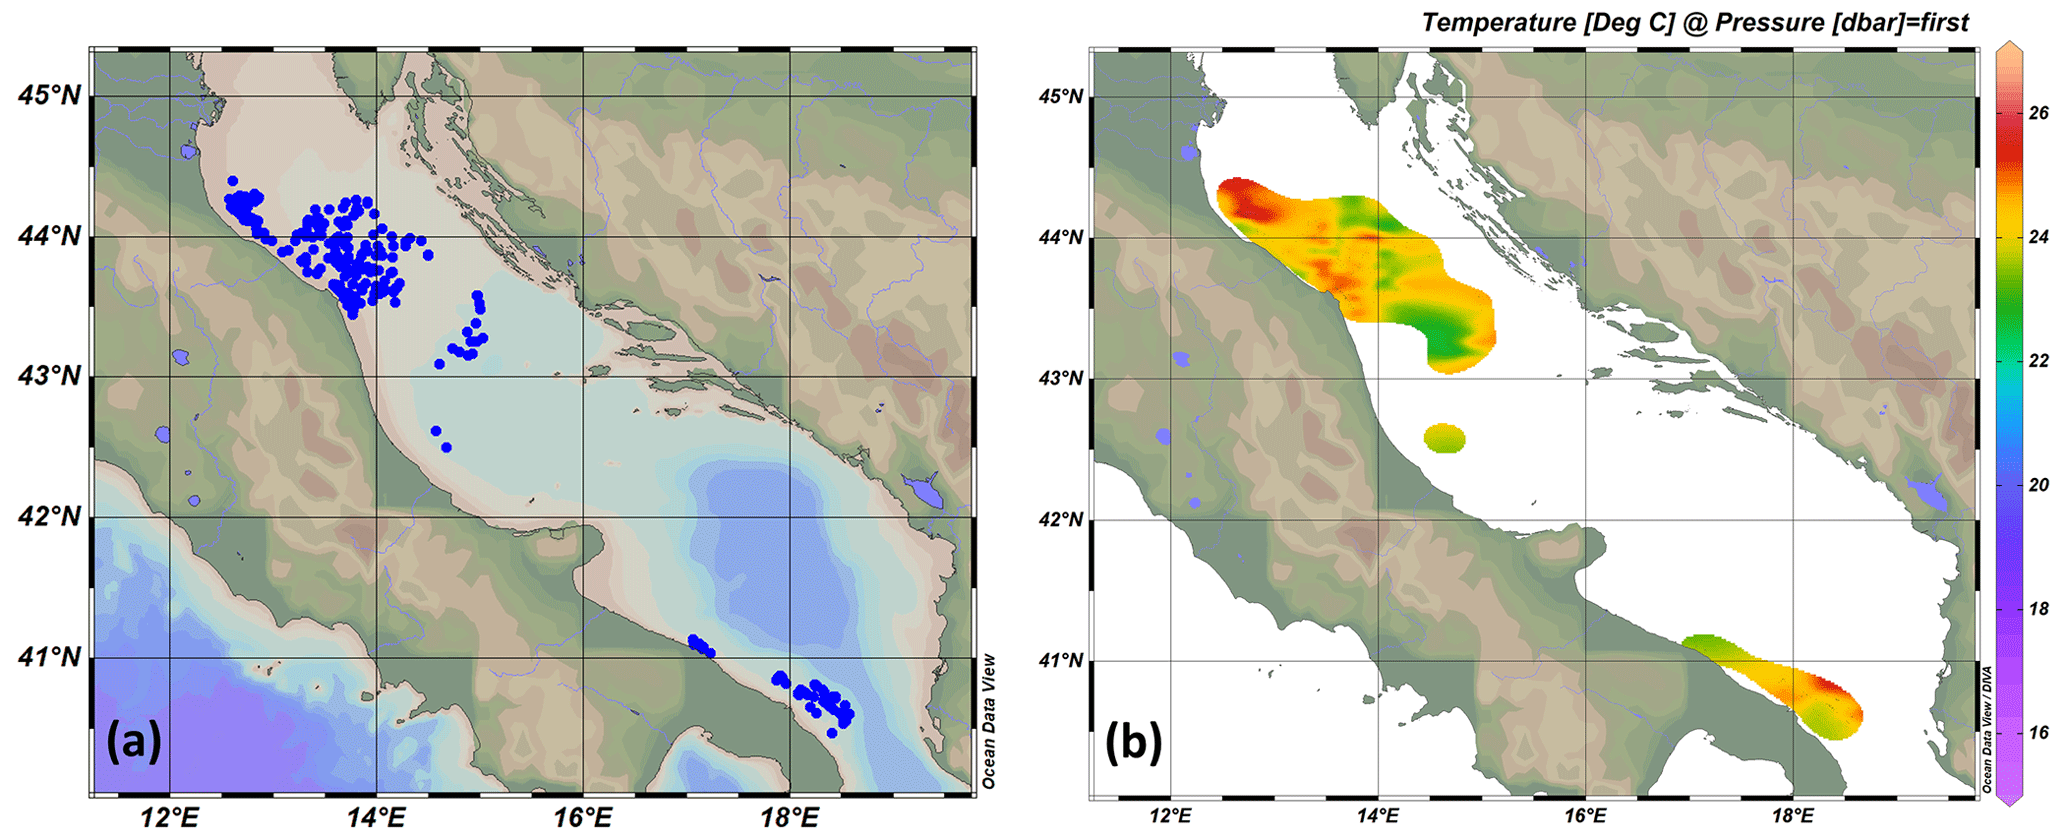
Figure 9Map of georeferenced casts in the Adriatic Sea (a) and derived sea surface temperature (SST) horizontal map (b) obtained by AdriFOOS for July 2014 (up refers to the north). Maps generated using Ocean Data View (Schlitzer, 2021).
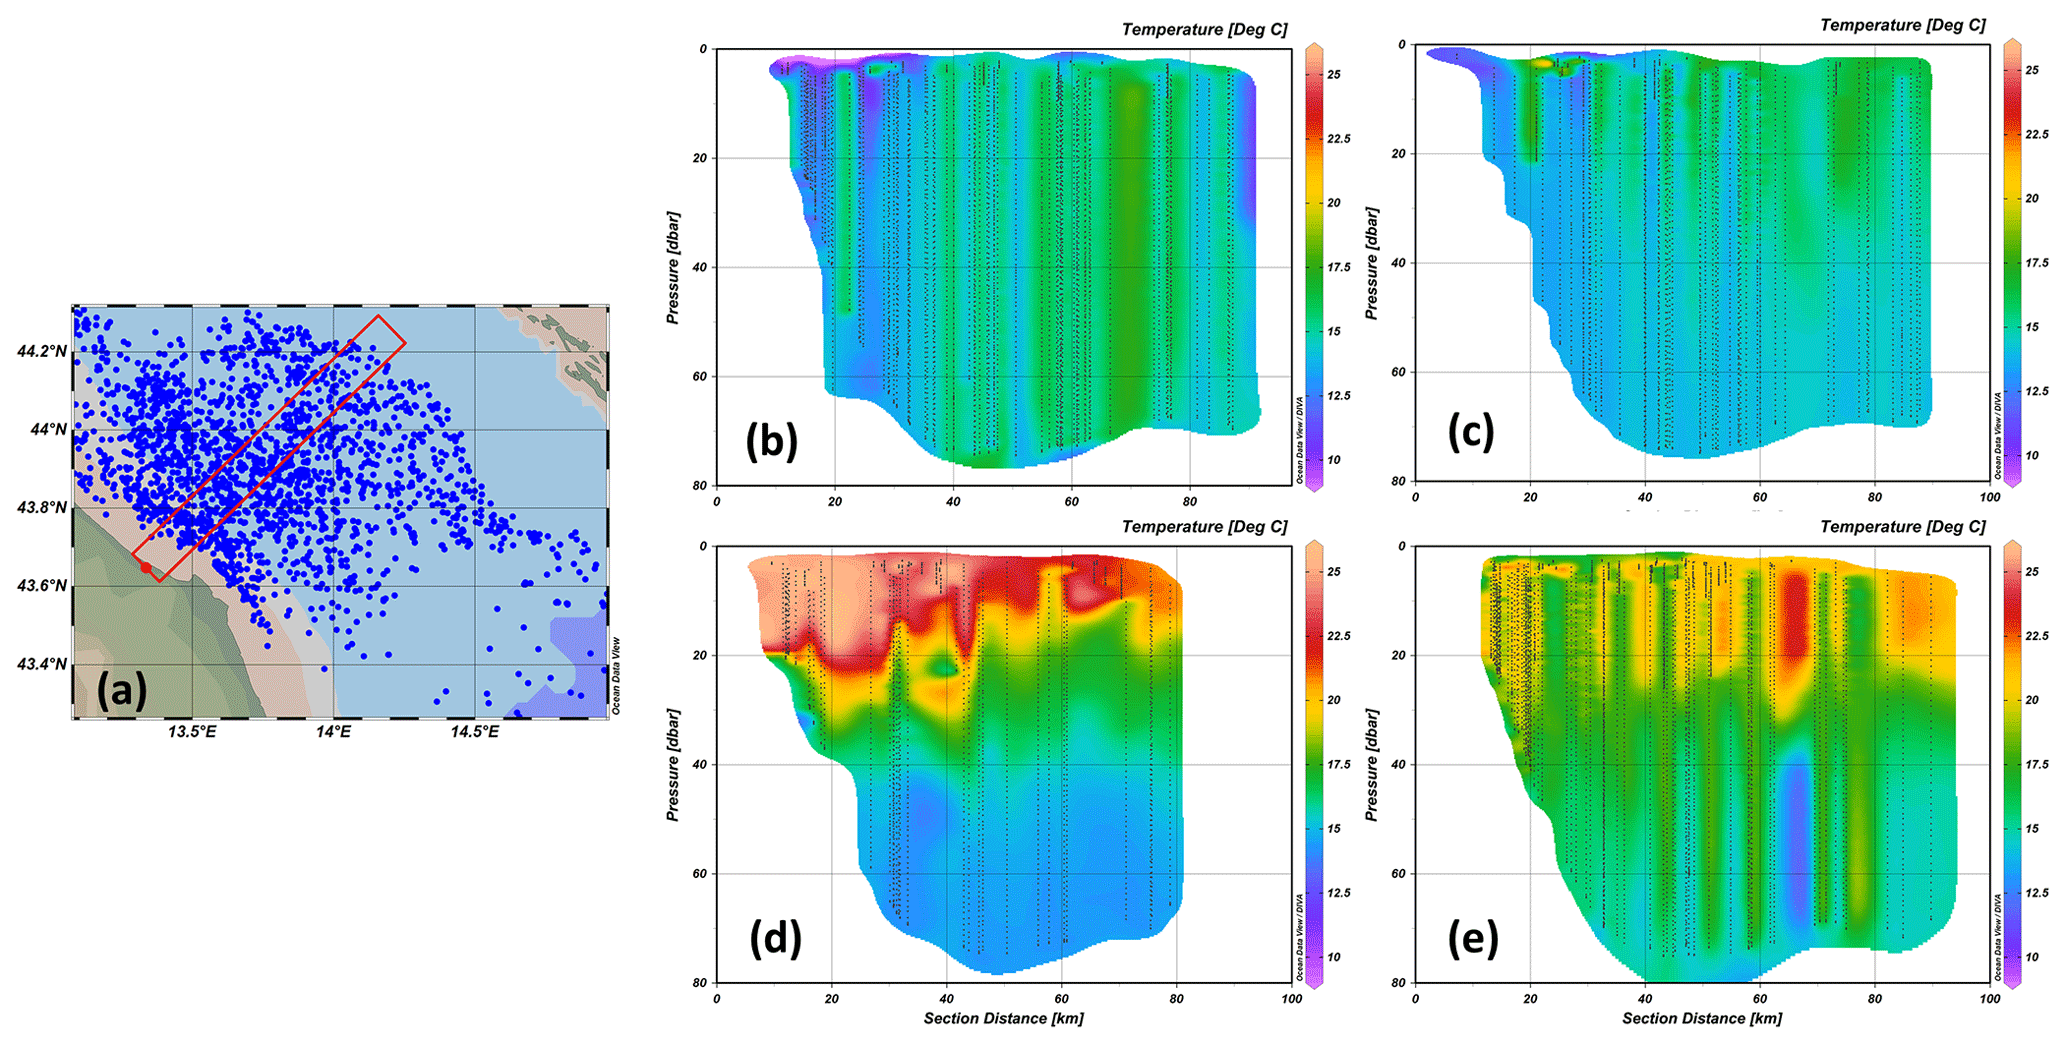
Figure 10Map of georeferenced casts obtained by AdriFOOS in 2014 in the northern Adriatic Sea with a section highlighted (red rectangle). (a) Derived seasonal vertical temperature section for winter (b), spring (c), summer (d), and autumn (e). Map and plots generated by means of Ocean Data View (Schlitzer, 2021).
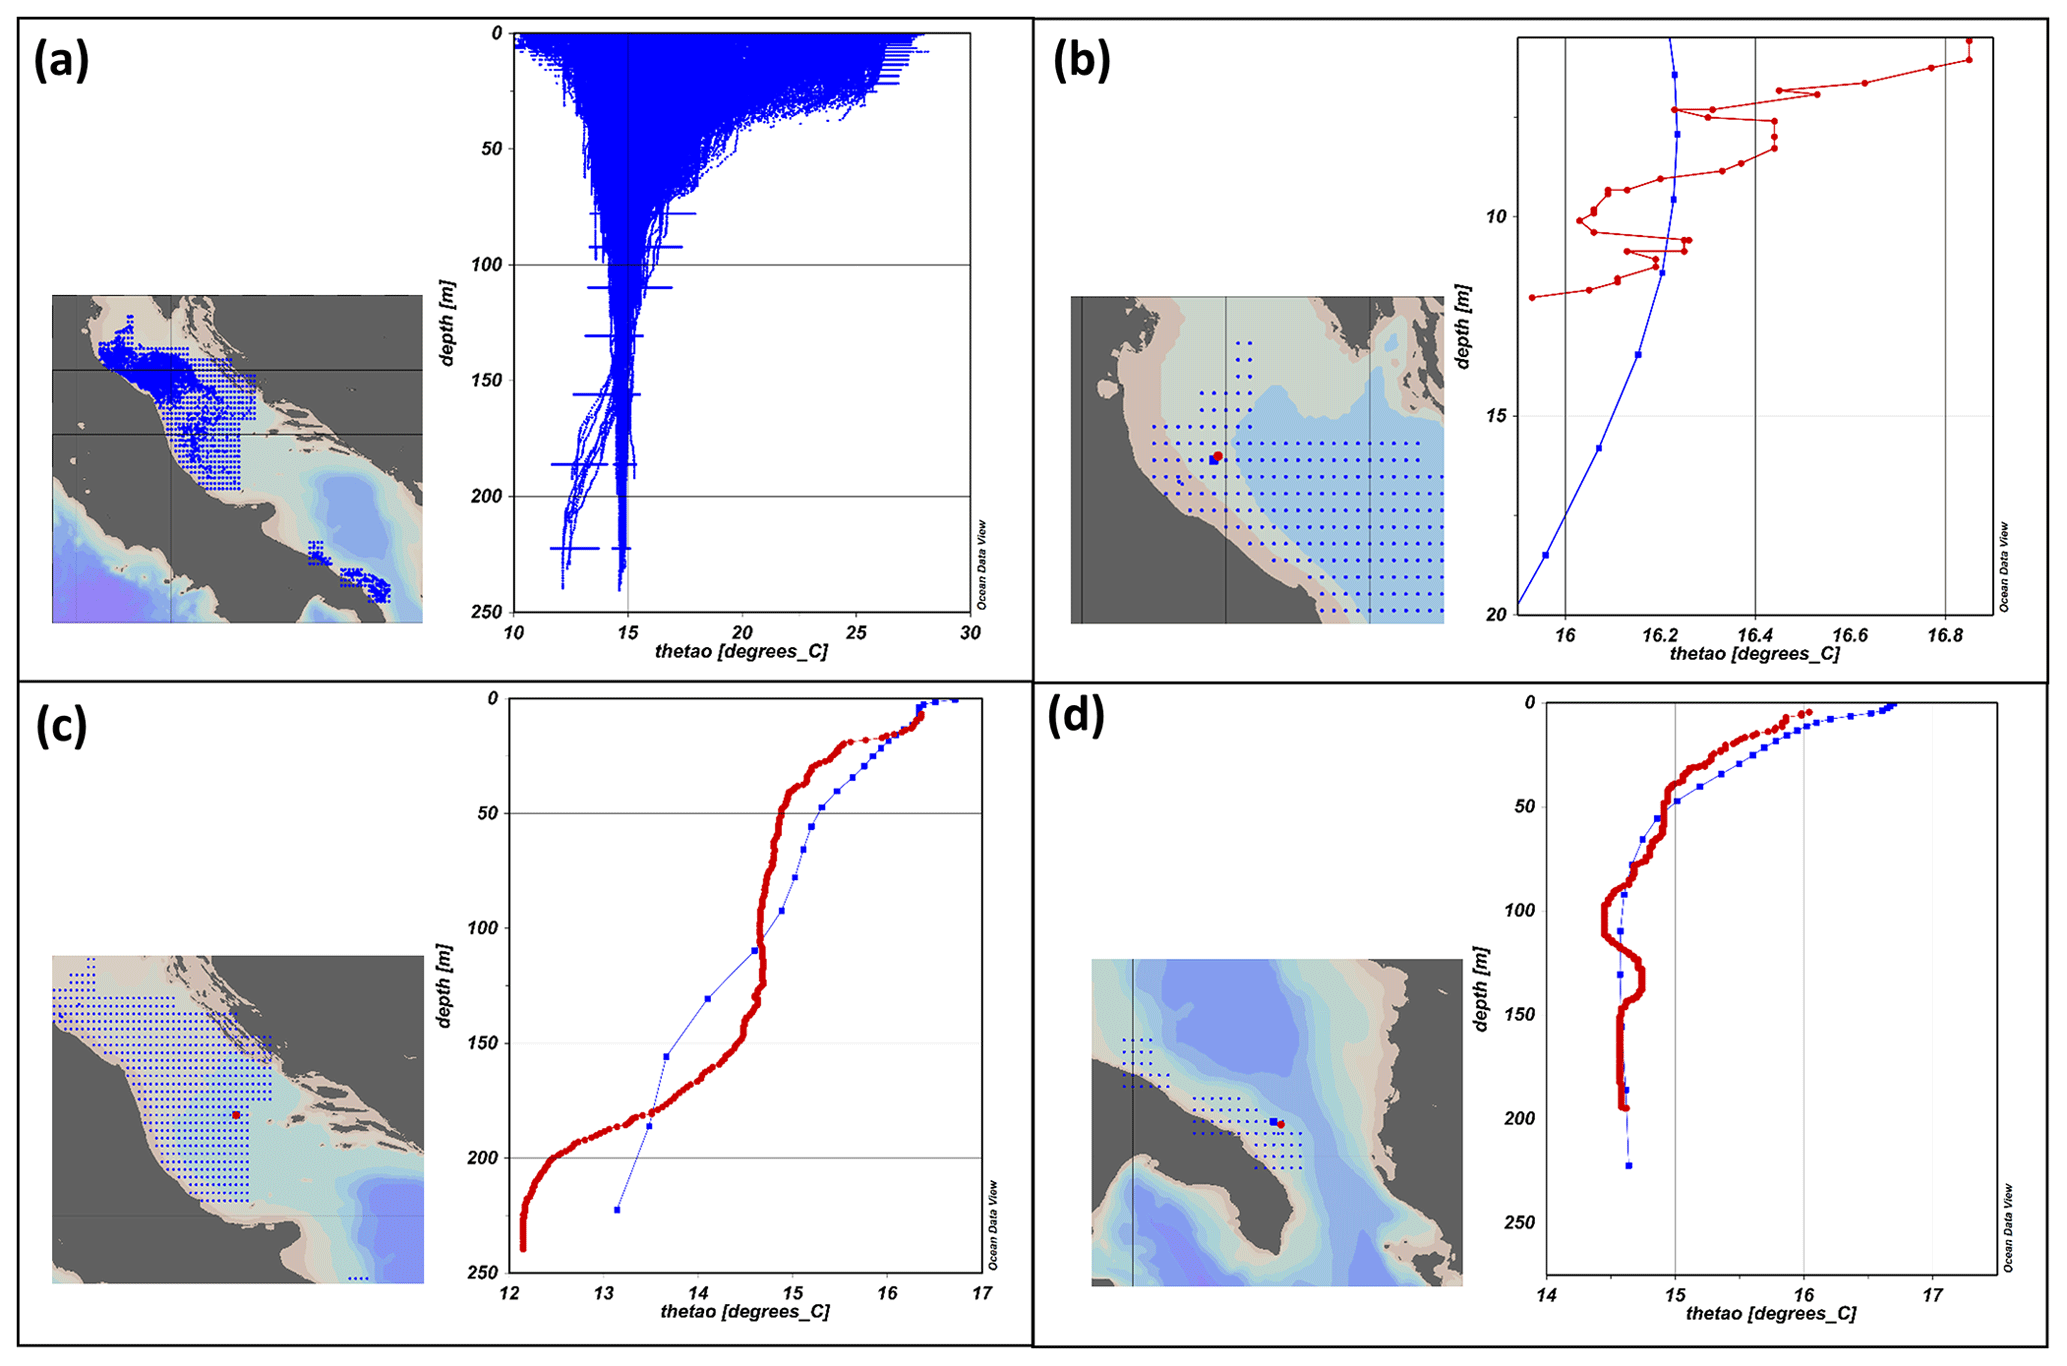
Figure 11Maps and plots of georeferenced AdriFOOS down-casts (red profile) compared to the CMES dataset (blue profiles): scatterplot of all the 2014 in situ observed and modeled data (a), down-casts selected for comparison in the northern (b; 2 May 2014), central (c; 2 May 2014), and southern (d; 28 April 2014) Adriatic Sea sub-basins.
A use case generated using the ODV scatter template function is displayed in Fig. 11, which shows a comparison between the AdriFOOS down-casts of the year 2014 and those provided by Copernicus Marine Service (CMEMS, 2022) for the same area and period (day) in the Global Ocean Physics Reanalysis dataset (GLORYS12V1, 2022) in which daily averaged data are calculated. An ODV merged data collection was specifically created to carry out this comparison (find more details on adopted assumptions and procedures in Sect. S2 of the Supplement).
AdriFOOS data fall in general within the temperature range resulting from the model (Fig. 11a). As an example, some adjacent AdriFOOS down-casts (in red) and CMEMS stations (in blue) corresponding to the same day were selected in the three Adriatic sub-basins (Fig. 11b–d). Despite the formal difference in the considered variables, the plots for the northern (Fig.11b), central (Fig. 11c), and southern (Fig. 11d) sub-basins are useful to check the correspondence between in situ and modeled data. Probably due to the presence of rivers with large flows, such as the Po River, discrepancies are particularly evident in the northern basin (Fig. 11b), while they tend to decrease in the central basin (Fig. 11c). The vertical structure of the water column seems to be more correctly represented by the data calculated by the model only in the southern basin (Fig. 11d).
Although it is beyond the main scope of this data description paper, the comparison between in situ observed and modeled data represents an interesting exercise highlighting the potential of the validated dataset produced by the AdriFOOS infrastructure. The AdriFOOS validated datasets indeed have the potential to feed oceanographic models in NRT, and, as also previously highlighted by assimilation experiments (e.g., Aydo˘gdu et al., 2016; Mourre et al., 2019), they can substantially contribute to improving their outputs, as well as being useful for reanalysis of historical data.
Furthermore, thanks to the collaboration with other European institutions and small and medium-sized enterprises (SMEs) and to the participation in various European-funded projects (i.e., JERICO, NeXOS, and JERICO NEXT), AdriFOOS is currently also an internationally recognized test platform for new oceanographic sensors designed for fishing gear use; AdriFOOS infrastructure is indeed currently involved in the EU H2020 NAUTILOS project as a validation and demonstration platform for sensors able to collect various parameters (i.e., dissolved oxygen and fluorescence sensors) and to transmit NRT data using various methods (Pieri et al., 2021).
Besides, it is well known that fish distributions and stock sizes are linked to environmental variables (e.g., temperature, salinity, oxygen, and chlorophyll) and their changes in time and space, with subsequent influence on fishery sustainability and economy. Therefore, catch data also obtained by AdriFOOS can directly be put in relation to the values of environmental parameters collected at the same place, depth, and time of the fishing event. In the near future, the refinement of the AdriFOOS catch and bottom parameter datasets and their inclusion in species abundance and distribution models (e.g., Carpi et al., 2015; Chiarini et al., 2022) will allow increased knowledge of fish spatial movements as well as of the influence of environmental drivers and climate change on their distribution, abundance, and status of exploitation of a resource. This is of utmost relevance in the framework of an ecosystem approach to fishery management.
The supplement related to this article is available online at: https://doi.org/10.5194/essd-15-3513-2023-supplement.
Conceptualization, MM and PP; data curation, MM and PP; formal analysis, MM and PP; funding acquisition, AB and MM; investigation, AB, FD, MM, and PP; methodology, AB, MM, and PP; project administration, MM; software, MM and PP; supervision, AB, MM, and PP; validation, MM and PP; visualization, MM and PP; and writing – original draft preparation, FD, MM, and PP.
The contact author has declared that none of the authors has any competing interests.
Publisher’s note: Copernicus Publications remains neutral with regard to jurisdictional claims in published maps and institutional affiliations.
The authors are grateful to Camilla Sofia Croci, Diego Bonura, Fabrizio Moro, Lorenzo Zacchetti, and Stefano Guicciardi for their professional skills in supporting the AdriFOOS development and their valuable help in testing the infrastructure equipment and carrying out the validation procedures. The authors would also like to thank the crews of the fishing vessels of the AdriFOOS fleet for their contribution.
The AdriFOOS platform has been developed and maintained actively thanks to the participation of the following projects: (i) CNR's Decision Support System for Sustainable Fisheries Management in the Regions of Southern Italy (SSD-Pesca), (ii) Towards a Joint European Research Infrastructure Network for Coastal Observatories (JERICO EU FP7 (grant no. 262584)), (iii) Next Generation Web-Enabled Sensors for the Monitoring of a Changing Ocean (NeXOS EU FP7 (grant no. 614102)), (iv) Joint European Research Infrastructure network for Coastal Observatory – Novel European eXpertise for coastal observaTories (JERICO NEXT EU H2020 (grant no. 654410)), and (v) New Approach to Underwater Technologies for Innovative, Low-cost Ocean obServation (NAUTILOS EU H2020 (grant no. 101000825)).
This paper was edited by Giuseppe M. R. Manzella and reviewed by two anonymous referees.
Artegiani, A., Bregant, D., Paschini, E., Pinardi, N., Raicich, F., and Russo, A.: The Adriatic Sea General Circulation. Part I: Air–Sea Interactions and Water Mass Structure, J. Phys. Oceanogr., 27, 1492–1514, 1997.
Aydoğdu, A., Pinardi, N., Pistoia, J., Martinelli, M., Belardinelli, A., and Sparnocchia, S.: Assimilation Experiments for the Fishery Observing System in the Adriatic Sea, J. Mar. Syst., 162, 126–136, https://doi.org/10.1016/j.jmarsys.2016.03.002, 2016.
Campanelli, A., Grilli, F., Paschini, E., and Marini, M.: The influence of an exceptional Po River flood on the physical and chemical oceanographic properties of the Adriatic Sea, Dynam. Atmos. Oceans, 52, 284e297, do:10.1016/j.dynatmoce.2011.05.004, 2011.
Carpi, P., Martinelli, M., Belardinelli, A., Russo, A., Arneri, E., Coluccelli, A., and Santojanni, A.: Coupling an oceanographic model to a Fishery Observing System through mixed models: the importance of fronts for anchovy in the Adriatic Sea, Fish. Oceanogr., 24, 521–532, https://doi.org/10.1111/fog.12126, 2015.
Chiarini, M., Guicciardi, S., Angelini, S., Tuck, I. D., Grilli, F., Penna, P., Domenichetti, F., Canduci, G., Belardinelli, A., Santojanni, A., Arneri, E., Milone, N., Medvešek, D., Isajlović, I., Vrgoč, N., and Martinelli, M.: Accounting for environmental and fishery management factors when standardising CPUE data from a scientific survey: A case study for Nephrops norvegicus in the Pomo Pits area (Central Adriatic Sea), PLoS ONE, 17, e0270703, https://doi.org/10.1371/journal.pone.0270703, 2022.
CMEMS: Copernicus Marine Service (or Copernicus Marine Environment Monitoring Service), https://marine.copernicus.eu/, last access: 23 December 2022.
Cozzi, S. and Giani, M.: River water and nutrient discharges in the Northern Adriatic Sea: Current importance and long term changes, Cont. Shelf Res., 31, 1881–1893, 2011.
Eigaard, O. R., Bastardie, F., Hintzen, N. T., Buhl-Mortensen, L., Buhl-Mortensen, P., Catarino, R., Dinesen, G. E., Egekvist, J., Fock, H. O., Geitner, K., Gerritsen, H. D, González, M. M., Jonsson, P., Kavadas, S., Laffargue, P., Lundy, M., Gonzalez-Mirelis, G., Nielsen, J. R., Papadopoulou, N., Posen, P. E., Pulcinella, J., Russo, T., Sala, A., Silva, C., Smith, C. J., Vanelslander, B., and Rijnsdorp, A. D.: The footprint of bottom trawling in European waters: distribution, intensity, and seabed integrity, ICES J. Mar. Sci., 74, 847–865, https://doi.org/10.1093/icesjms/fsw194, 2017.
EMODnet: EMODnet Bathymetry Consortium, EMODnet Digital Bathymetry (DTM 2016), https://doi.org/10.12770/c7b53704-999d-4721-b1a3-04ec60c87238, 2016.
Falco, P., Belardinelli, A., Santojanni, A., Cingolani, N., Russo, A., and Arneri, E.: An observing system for the collection of fishery and oceanographic data, Ocean Sci., 3, 189–203, https://doi.org/10.5194/os-3-189-2007, 2007.
FAO: The State of Mediterranean and Black Sea Fisheries 2020, General Fisheries Commission for the Mediterranean, Rome, https://doi.org/10.4060/cb2429en, 2020.
FAO: National fisheries closures, https://www.fao.org/gfcm/data/maps/nfclosures/en/, last access: 19 December 2022.
Gačić M.: Some characteristics of the response of the Adriatic Sea coastal region to the atmospheric forcing, Acta Adriat., 21, 239–254, 1980.
Gaughan, P., Nolan, G., Puillat, I, Farcy, P., Mowlem, M., Seppala, J., Seppo, K., Martinelli, M., Coppola, L., Delauney, L., Guicciardi, S., Penna, P., Belardinelli, A., Croci, C., Domenichetti, F., Santojanni, A., Paschini, E., and Sparnocchia, S.: WP10 Deliverable 10.4 – Report on Potential New Sensors (Fishing Vessels and Voluntary Opportunity Ships), JERICO (Towards a Joint European Research Infrastructure network for Coastal Observatories) EU FP7 project, https://www.jerico-ri.eu/download/filebase/jerico_fp7/deliverables/D10.4-Report-on-Potential-New-Sensors-Fishing-Vessels-and-Voluntary-Opportunity.pdf (last access: 22 June 2023), 2015.
GLORYS12V1: CMEMS Global Ocean Physics Reanalysis, Copernicus [data set], https://doi.org/10.48670/moi-00021, 2022.
Grilli, F., Accoroni, S., Acri, F., Bernardi Aubry, F., Bergami, C., Cabrini, M., Campanelli, A., Giani, M., Guicciardi, S., Marini, M., Neri, F., Penna, A., Penna, P., Pugnetti, A., Ravaioli, M., Riminucci, F., Ricci, F., Totti, C., Viaroli, P., and Cozzi, S.: Seasonal and Interannual Trends of Oceanographic Parameters over 40 Years in the Northern Adriatic Sea in Relation to Nutrient Loadings Using the EMODnet Chemistry Data Portal, Water, 12, 2280, https://doi.org/10.3390/w12082280, 2020.
Jiang, Z. P., Yuan, J., Hartman, S. E., and Fan, W.: Enhancing the observing capacity for the surface ocean by the use of Volunteer Observing Ship, Acta Oceanol. Sin., 38, 114–120, https://doi.org/10.1007/s13131-019-1463-3, 2019.
Lowry, R., Fichaut, M., Schlitzer, R., Maudire, G., and Bregent, S.: SeaDataNet. Datafile formats. ODV, MEDATLAS, NETCDF, DELIVERABLE D8.5, https://doi.org/10.13155/56547, 2019.
Lucchetti, A., Belardinelli, A., D'Andrea, L., Marčeta, B., Martinelli, M., Russo, T., Keč, V.Č., Zorica, B., and Virgili, M.: Small pelagic purse seines in the Adriatic Sea: A spatial analysis and technical overview in relation to Mediterranean Regulation provisions, Mar. Policy, 98, 104–114, https://doi.org/10.1016/j.marpol.2018.09.031, 2018.
Manifold®: Geographic Information System System Release 8, https://manifold.net/doc/mfd8/index.htm, last access: 13 December 2022.
Marini, M., Jones, B. H., Campanelli, A., Grilli, F., and Lee, C. M.: Seasonal variability and Po River plume influence on biochemical properties along western Adriatic coast, J. Geophys. Res., 113, C05S90, https://doi.org/10.1029/2007JC004370, 2008
Marini, M., Maselli, V., Campanelli, A., Foglini, F., and Grilli, F.: Role of the Mid-Adriatic deep in dense water interception and modification, Mar. Geol., 375, 5–14, https://doi.org/10.1016/j.margeo.2015.08.015, 2016.
Martinelli, M., Falco, P., Belardinelli, A., Cingolani, N., Arneri, E., Russo, A., and Santojanni, A.: Fishery observing system (FOS): a tool for collecting oceanographic data and data on fish in the Adriatic, in: Oceanografia Operativa in Italia Verso Una Gestione Sostenibile Del Mare, edited by: Oddo, P., Coppini, G., Sorgente, R., Cardin, V., and Reseghetti, F., Quaderni di Arpa, 277–284, ISBN 978-88-87854-29-9, 2012.
Martinelli, M., Guicciardi, S., Penna, P., Belardinelli, A., Croci, C., Domenichetti, F., Santojanni, A., and Sparnocchia, S.: Evaluation of the oceanographic measurement accuracy of different commercial sensors to be used on fishing gears, Ocean Eng., 111, 22–33, https://doi.org/10.1016/j.oceaneng.2015.10.037, 2016.
Möller, K. O., Petersen, W., Nair, R., Greenwood, N., Read, C., Laes-Huon, A., Daniel, A., Bakker, K., Blandfort, D., Gehrung, M., Ylöstalo, P., Haraguchi, L., Ruohola, J., Karlson, B., Artigas, F., Lizon, F., Thyssen, M., Wacquet, G., Ntoumas, M., Créach, V., Jaccard, P., Delauney, L., Seppälä, J., King, A. L., Sørensen, K., Marty, S., Willstrand, A. W., Laakso, L., Cantoni, C., Petersen, W., Voynova, Y., and Martinelli, M.: Report on Best Practice in the utilization of sensors used for measuring nutrients, biology related optical properties,variables of the marine carbonate system, and for coastal profiling, JERICO-NEXT Deliverable D2.5.Version 1.0. Brest, France, IFREMER, JERICO-NEXT-WP2-D2.5-100919-V1.0, 65 pp., https://doi.org/10.25607/OBP-898, 2019.
Mourre, B., Hernández-Lasheras, J., Juza, M., Reyes, E., Aguiar, E., Heslop, E., Orfila, A., Tintoré, J., Vitorino, J., Korres, G., Perivoliotis, L. , Mpouma, E., Doumas, M., Ferrer, L., Rubio, A., Mader, J., Ciliberti, S., Jansen, E., Coppini, G., Griffa, A., Berta, M., Martinelli, M., Penna, P., Sparnocchia, S., Laakso, L., Björkqvist, J. V., Wedhe, H., Karlson, B., Axell, L., and Aneborg, L.: Chapter 8, Operational oceanography and coastal forecasting, in: JERICO-NEXT JRAP Synthesis and contribution to the strategy for the future, edited by: Gremare, A., Puillat, I., Karlson, B., Artigas, F., Nizzetto, L., Rubio, A., Laakso, L., Mourre, B., JERICO-NEXT-WP4-D4.5-220919-V5.0, https://doi.org/10.13155/68871, 2019.
NetCDF: Network Common Data Form, https://www.unidata.ucar.edu/software/netcdf/, last access: 13 December 2022.
Orlić M., Kuzmi M., and Pasari Z.: Response of the Adriatic Sea to the Bora and Scirocco forcing, Cont. Shelf Res., 14, 91–116, https://doi.org/10.1016/0278-4343(94)90007-8, 1994.
Patti, B., Martinelli, M., Aronica, S., Belardinelli, A., Penna, P., Bonanno, A., Basilone, G., Fontana, I., Giacalone, G., Gallì, N. G., Sorgente, R., Angileri, I. V. M., Croci, C., Domenichetti, F., Bonura, D., Santojanni, A., Sparnocchia, S., D'Adamo, R., Marini, M., Fiorentino, F., and Mazzola, S.: The Fishery and Oceanography Observing System (FOOS): a tool for oceanography and fisheries science, J. Oper. Oceanogr., 9, s99–s118, https://doi.org/10.1080/1755876X.2015.1120961, 2016.
Penna, P., Belardinelli, A., Croci C. S., Domenichetti, F., and Martinelli, M.: AdriFOOS Depth/Temperature profiles dataset 2012–2020, SEANOE [data set], https://doi.org/10.17882/73008, 2020.
Petersen, W., Petschatnikov, M., Schroeder, F., and Colijn, F.: FerryBox systems for monitoring coastal waters, edited by: Dahlin, H., Flemming, N. C., Nittis, K., and Petersson S. E., Elsev. Oceanogr. Serie., 69, 325–333, https://doi.org/10.1016/S0422-9894(03)80052-1, 2003.
Pieri, G., Ntoumas, M., Martinelli, M., Chatzinikolaou, E., Martins, F., Novellino, A., Dimitrova, N., Keller, K., Raimund, S., King, A., Smerdon, A., Mazza, M., Malarde, D., Cocco, M., Torres, A., Triantafyllou, G., Sá, S., Bebianno, M., Sparnocchia, S., Trond, K., and Lusher, A.: New technology improves our understanding of changes in the marine environment. In Proceedings of the 9th EuroGOOS International Conference, EuroGOOS, Online Streaming Virtual Conference, 3–5 May 2021, 500–508, https://doi.org/10.13155/83160, 2021.
Poulain P. M.: Adriatic Sea surface circulation as derived from drifter data between 1990 and 1999, J. Mar. Syst., 29, 3–32, 2001.
Puillat, I., Farcy, P., and Beaume, N.: JERICO. Interim Periodic Activity Report. 2nd, JERICO-WP11-PERIODIC-M36-300614-V2, https://archimer.ifremer.fr/doc/00215/32593/ (last access: 13 December 2022), 2014.
Rosa, T. L., Piecho-Santos, A. M., Vettor, R., and Guedes Soares, C.: Review and Prospects for Autonomous Observing Systems in Vessels of Opportunity, J. Mar. Sci. Eng., 9, 366, https://doi.org/10.3390/jmse9040366, 2021.
Russo, T., Pulcinella, J., Parisi, A., Martinelli, M., Belardinelli, A., Santojanni, A., Cataudella, S., Colella, S., and Anderlini, L.: Modelling the strategy of mid-water trawlers targeting small pelagic fish in the Adriatic Sea and its drivers, Ecol. Modell., 300, 102–113, https://doi.org/10.1016/j.ecolmodel.2014.12.001, 2015.
Schlitzer, R.: Ocean Data View, ePIC [software], https://odv.awi.de (last access: 13 December 2022), 2021.
Seadatanet: Pan-European infrastructure for ocean & marine data management, Seadatanet qc manual, https://www.seadatanet.org/content/download/596/file/SeaDataNet_QC_procedures_V2_(May_2010).pdf (last access: 13 December, 2022), 2010.
Seadatanet: Pan-European infrastructure for ocean & marine data management, BODC VOCAB LIBRARY, L20 (Seadatanet Measurand Qualifier Flags), http://seadatanet.maris2.nl/v_bodc_vocab_v2/browse.asp?order=conceptid&formname=search&screen=0&lib=l20, last access: 13 December, 2022.
Sloyan, B. M., Roughan, M., and Hill, K.: The global ocean observing system, in “New Frontiers in Operational Oceanography”, edited by: Chassignet, E., Pascual, A., Tintoré, J., and Verron, J., GODAE OceanView, 75–90, https://doi.org/10.17125/gov2018.ch03, 2018.
Sparnocchia, S., Nair, R., Petihakis, G., Aydoğdu, A., Dobricic, S., Farcy, P., Martinelli, M., and Petersen, W.: Petit de la Villeon, L., An interlinked coastal observatory network for Europe, J. Oper. Oceanogr., 9, s193–s201, https://doi.org/10.1080/1755876X.2015.1114808, 2016.
Sparnocchia, S., Martinelli, M., Del Rio, J., Belardinelli, A., Penna, P., Domenichetti, F., Campanelli, A., Toma, D. M., Martinez, E., and Nogueras, M.: D9.3– Mediterranean Sea Demonstration Report: Report on demonstration of sensor systems in the Mediterranean, FP7 Ocean 2013 NeXOS project “Next generation Low-Cost Multifunctional Web Enabled Ocean Sensor Systems Empowering Marine, Maritime and Fisheries Management”, https://www.nexosproject.eu/sites/default/files/170831-NXS-WPX_D.9.3-v.1.4_29082017_Final.pdf (last access: 22 June 2023), 2017.
Troupin, C., Watelet, S., Ouberdous, M., Sirjacobs, D., Alvera-Azcárate, A., Barth, A., Toussaint, M. E., and Beckers, J. M.: Data Interpolating Variational Analysis User Guide, Zenodo, https://doi.org/10.5281/zenodo.836723, 2019.
Van Vranken, C. H., Vastenhoud, B. M., Manning, J. P., Plet-Hansen, K. S., Jakoboski, J., Gorringe, P., and Martinelli, M.: Fishing Gear as a Data Collection Platform: Opportunities to Fill Spatial and Temporal Gaps in Operational Sub-Surface Observation, Front. Mar. Sci., 7, 485512, https://doi.org/10.3389/fmars.2020.485512, 2020.