the Creative Commons Attribution 4.0 License.
the Creative Commons Attribution 4.0 License.
 | 02 Aug 2023
Network for the Detection of Atmospheric Composition Change (NDACC) Fourier transform infrared (FTIR) trace gas measurements at the University of Toronto Atmospheric Observatory from 2002 to 2020
Shoma Yamanouchi
Stephanie Conway
Kimberly Strong
Orfeo Colebatch
Erik Lutsch
Sébastien Roche
Jeffrey Taylor
Cynthia H. Whaley
Aldona Wiacek
Nineteen years of atmospheric composition measurements made at the University of Toronto Atmospheric Observatory (TAO; 43.66∘ N, 79.40∘ W; 174 m a.s.l.) are presented. These are retrieved from Fourier transform infrared (FTIR) solar absorption spectra recorded with an ABB Bomem DA8 spectrometer from May 2002 to December 2020. The retrievals have been performed for 14 species: O3, HCl, HF, HNO3, CH4, C2H6, CO, HCN, N2O, C2H2, H2CO, CH3OH, HCOOH, and NH3 using the SFIT4 algorithm. The measurements have been archived in the Network for the Detection of Atmospheric Composition Change (NDACC) data repository in Hierarchical Data Format version 4 (HDF4) files following the Generic Earth Observation Metadata Standard (GEOMS) and are also publicly available on Borealis, the Canadian Dataverse Repository (https://doi.org/10.5683/SP2/VC8JMC, Yamanouchi et al., 2022). In this paper, we describe the instrumentation, the retrieval strategy, the vertical sensitivity of the retrievals, the quality assurance process, and the error analysis of the TAO FTIR measurements and present the current version of the time series.
- Article
(13198 KB) - Full-text XML
- BibTeX
- EndNote


The University of Toronto Atmospheric Observatory (TAO) was established in 2001 in downtown Toronto, Ontario, Canada (43.66∘ N, 79.40∘ W) at 174 m above sea level (m a.s.l.). The site was established to provide long-term high-quality measurements of trace gases for short-term and long-term scientific studies, satellite validation, and model comparisons and assessments. Due to its urban location, measurements made at TAO are affected by the densely populated area of the city of Toronto and its surroundings; Toronto is the fourth largest city in North America, and the Greater Toronto Area is the center of Canada's largest population, which was 6.2 million in the 2021 census (Statistics Canada, 2022). Measurements are also affected by the industrial centers of the northeastern United States (Whaley et al., 2015). TAO is thus ideally located for the detection of tropospheric pollutants and is also well suited for monitoring midlatitude stratospheric ozone, related species and greenhouse gases (Wiacek et al., 2007; Yamanouchi et al., 2021b). In addition, the site is well positioned to detect midlatitude polar intrusion events as shown in Whaley et al. (2013) and transported wildfire plumes (Lutsch et al., 2016; Yamanouchi et al., 2020)
The primary instrument at TAO is the ABB Bomem DA8, a high-resolution Fourier transform infrared (FTIR) spectrometer, which has been acquiring daily measurements of solar absorption spectra since May 2002, weather permitting. In March 2004, the TAO site became part of the Network for the Detection of Atmospheric Composition and Change (NDACC, De Mazière et al., 2018), affiliated with its InfraRed Working Group (IRWG), filling the North American midlatitude gap in the network of FTIR stations. As a station in the NDACC IRWG, the following trace gases are routinely retrieved from the TAO solar absorption spectra: O3, HCl, HF, HNO3, CH4, C2H6, CO, HCN, and N2O. In addition, a number of other trace gases are retrieved as research products and are also archived, including C2H2, H2CO (Vigouroux et al., 2018), CH3OH, HCOOH (Franco et al., 2021), NH3 (Dammers et al., 2016; Yamanouchi et al., 2021a), and OCS (carbonyl sulfide) (Hannigan et al., 2022b). Finally a small number of species are retrieved as research products but on an event basis and are not yet included in the public archive, including CCl4, NO, and NO2. Select species retrieved at TAO (currently CH4, CO, H2CO, and O3) are also contributed to the Copernicus Atmospheric Monitoring Service (CAMS) rapid delivery (RD) system (https://atmosphere.copernicus.eu/, last access: 4 July 2023). Rapid delivery species are archived within 1 month of making measurements, and consolidated datasets are archived with NDACC annually. Descriptions of the instrument, retrievals, and studies using TAO measurements can be found in Wiacek (2006), Taylor (2008), Whaley (2014), and Yamanouchi (2021).
TAO measurements have been included in multiple publications. They have been used to study meso-thermospheric NO (Wiacek et al., 2006), the time evolution of HCl and HF total-column abundances (Kohlhepp et al., 2012), the transport of biomass burning plumes (Griffin et al., 2013; Palmer et al., 2013; Lutsch et al., 2016, 2020; Yamanouchi et al., 2020), midlatitude polar vortex intrusions (Whaley et al., 2013) and pollution events (Whaley et al., 2015), emissions associated with oil and natural gas extraction (Franco et al., 2016; Tzompsa-Sosa et al., 2017), increases in atmospheric methane (Bader et al., 2017), and the impact of COVID-19-related emissions reductions on free-tropospheric ozone (Steinbrecht et al., 2021) and on CO, CO2, and CH4 (You et al., 2021). Trends of all species retrieved at TAO (from 2002 to 2019) were presented in Yamanouchi et al. (2021a). Furthermore, TAO FTIR data have been used for instrument inter-comparisons (Wunch et al., 2007; Taylor et al., 2008; Sun et al., 2020; Yamanouchi et al., 2021b) and the evaluation of chemical reanalysis of CO in a coupled chemistry–climate model (Gaubert et al., 2016). In addition, TAO measurements have been used in the validation of data products from satellite missions, including ACE (Mahieu et al., 2005, 2008; Clerbaux et al., 2008; De Mazière et al., 2008; Kerzenmacher et al., 2008; Strong et al., 2008; Dupuy et al., 2009), SCIAMACHY (Dils et al., 2006), OSIRIS (Taylor et al., 2007), IASI (Dammers et al., 2016; Franco et al., 2020), CrIS (Dammers et al., 2017), MOPITT (Buchholz et al., 2017), GOSAT (Olsen et al., 2017), and TROPOMI (Vigouroux et al., 2020; Sha et al., 2021).
This paper is organized as follows. In Sect. 2, the TAO facility, and in particular the FTIR instrument used to measure the time series presented in this work, is described. In Sect. 3, the data analysis procedure, error characterization, and quality control method used to process the solar absorption spectra are detailed. Finally in Sect. 4, the time series of O3, HCl, HF, HNO3 (four stratospheric NDACC species), CH4, C2H6, CO, HCN, N2O (five tropospheric NDACC species), C2H2, H2CO, CH3OH, HCOOH, and NH3 (five research products) retrieved at TAO over the last 19 years are presented.
2.1 TAO FTIR spectrometer
The primary instrument at the University of the Toronto Atmospheric Observatory is the TAO DA8, a high-resolution research-grade Fourier transform infrared spectrometer that measures solar absorption spectra in the mid-infrared (Wiacek et al., 2007). The instrument is installed in a laboratory on the 16th floor of the Burton Tower in the Department of Physics. The TAO FTIR spectrometer is coupled to a dedicated heliostat on the rooftop above the laboratory, which directs the solar beam through an opening to the instrument. A description of the solar tracker follows in Sect. 2.2.
The DA8 FTIR spectrometer was manufactured by ABB Bomem Inc. and features an improved mirror design to increase the stability of the optical alignment. The arrangement includes a dynamically aligned mirror mounted below the interferometer's moving mirror to maintain alignment of the optics, mitigating any off-axis motion of the moving mirror. This optical design fixes the optical axis through the beam splitter and sets in place the focal point at the detector as shown in Fig. 1.
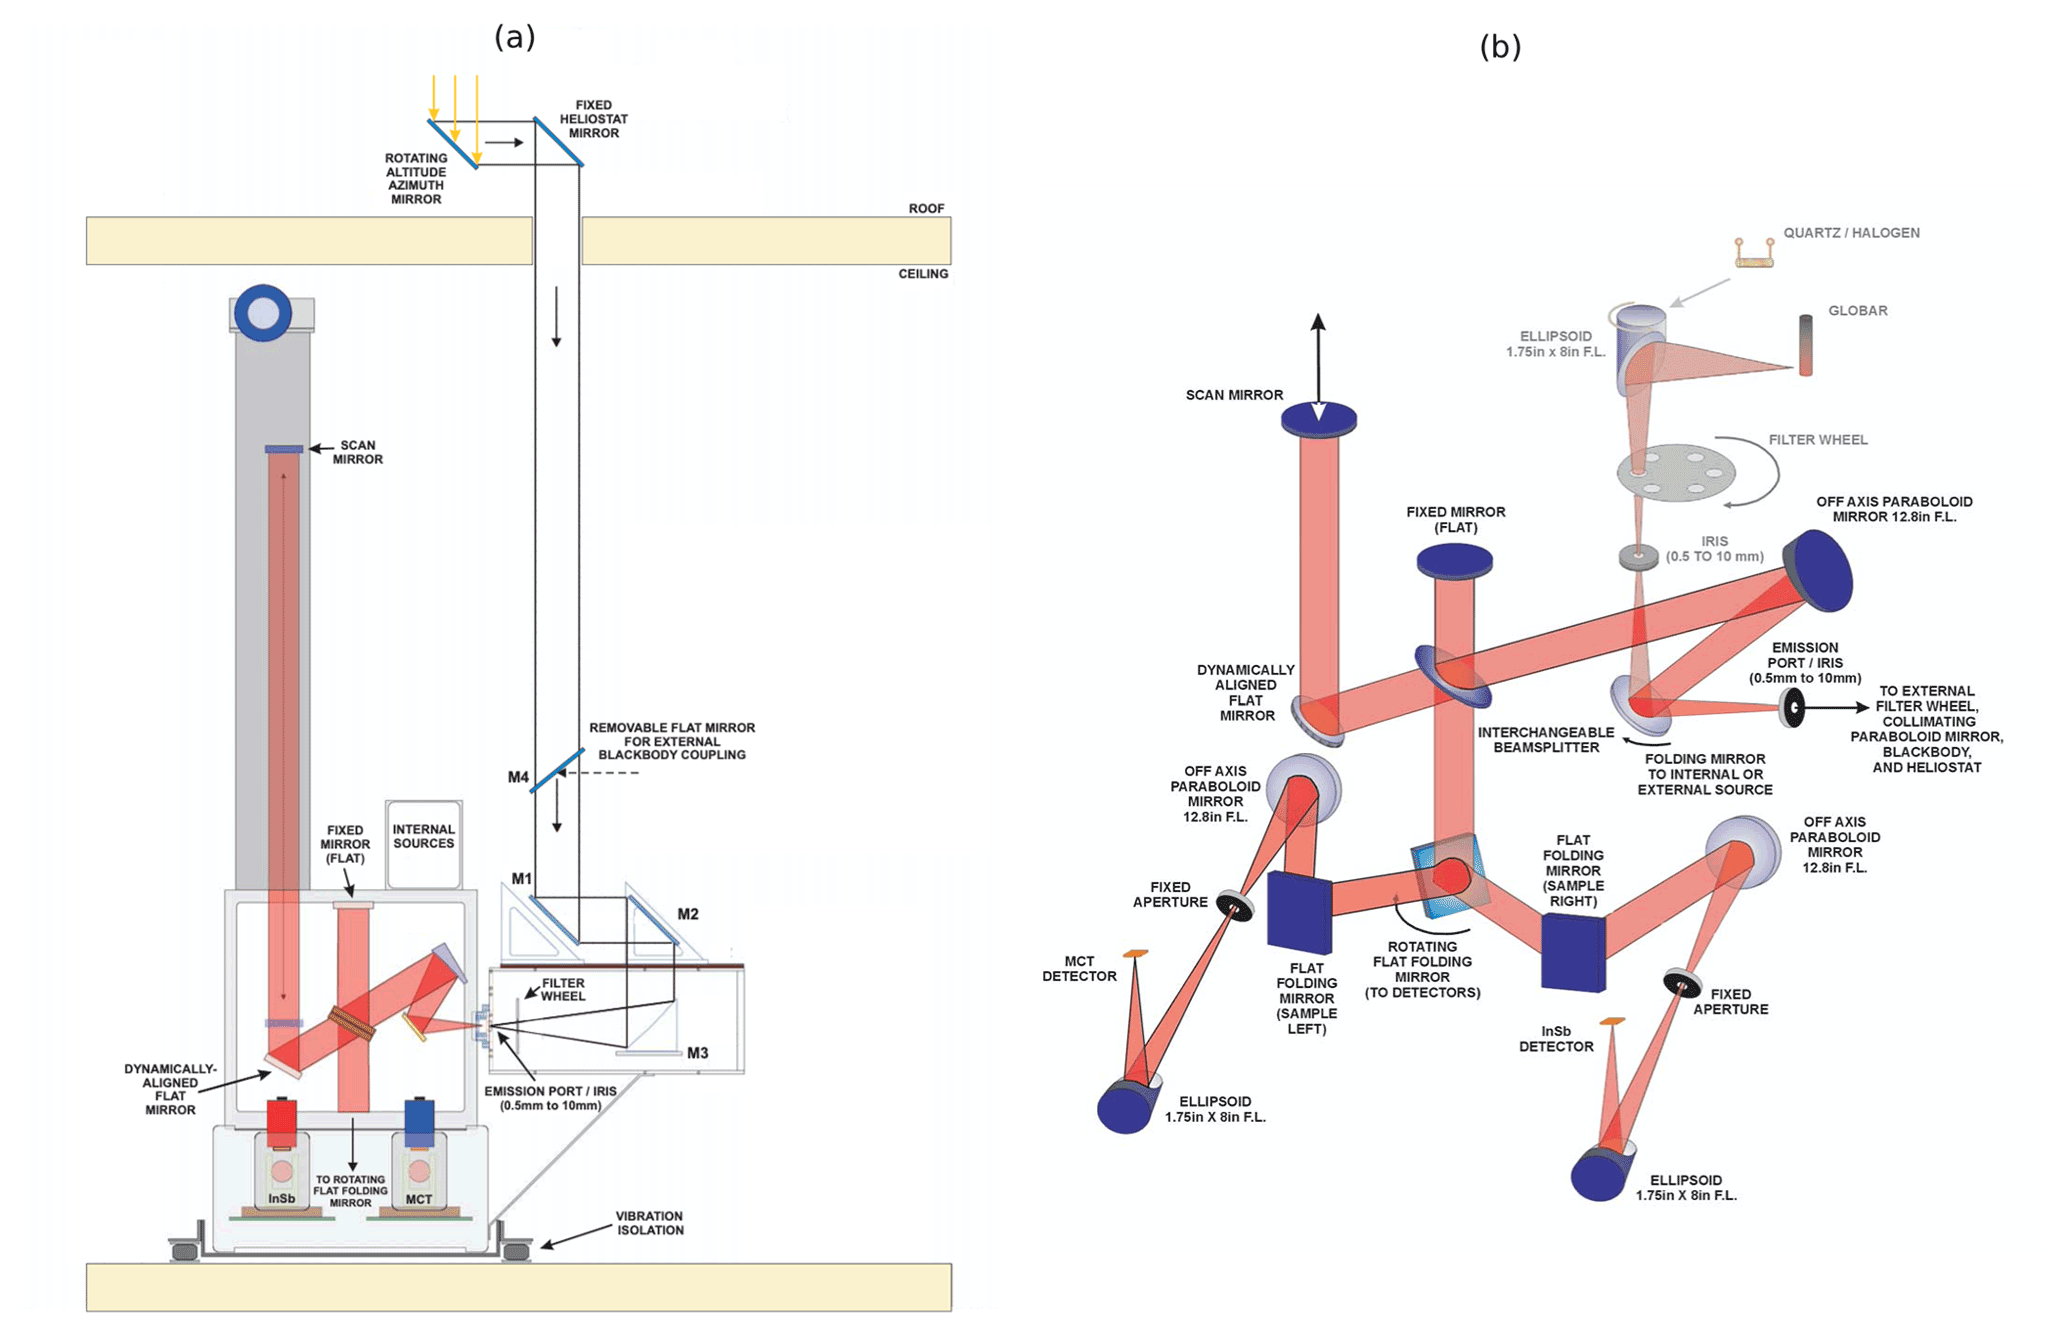
Figure 1(a) The FTIR spectrometer and solar tracker installation at TAO: mirrors M1, M2, and M3 couple the heliostat optics to the DA8 and M4 is a removable mirror. (b) The optical layout of the DA8 FTIR: a moving folding mirror selects between the emission port used for solar absorption measurements and internal sources (shown in gray). Figures taken from Wiacek (2006), adapted from ABB Bomem Inc. facility schematics.
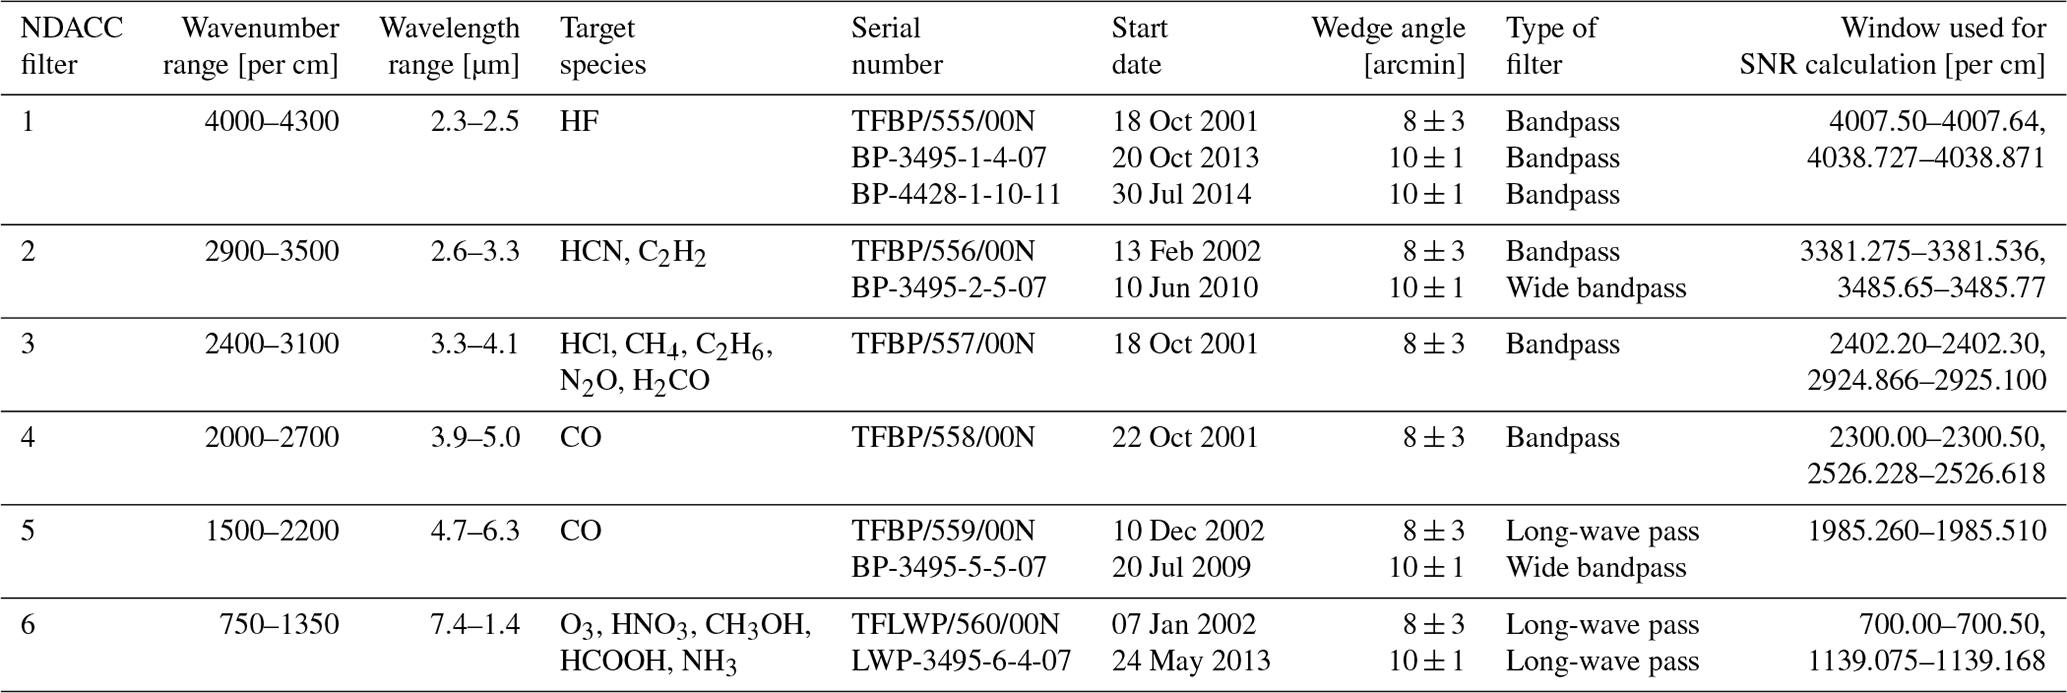
The FTIR spectrometer has a maximum optical path difference of 250 cm, corresponding to a maximum apodized resolution of 0.004 per centimeter. It is equipped with a KBr beam splitter and two detectors (InSb and HgCdTe, abbreviated MCT for mercury cadmium telluride), which together provide spectral coverage from 700 to 4300 per centimeter. This region is routinely measured using the six standard NDACC IRWG optical interference bandpass filters mounted on a filter wheel. The characteristics of these filters, including their spectral coverage and the trace gases commonly measured with each, the substrate, the wedge angle, and manufacturer, are detailed in Table 1. Measurements are made sequentially through these filters (and corresponding detectors) over the course of the day. A recent study by Blumenstock et al. (2021) has quantified the channeling features associated with optical components used by NDACC FTIR instruments and found that the TAO system has a channeling fringe with a frequency of about 3 per centimeter due to the InSb detector window but is less affected than other sites by channeling associated with the construction of the KBr beam splitter. TAO FTIR solar absorption spectra are recorded throughout the day in a semi-autonomous manner with operator involvement for start-up, shutdown, and monitoring tasks. Due to the dependence on clear-sky conditions, FTIR measurements are typically limited to 80 to 100 d yr−1 with some bias towards the summer months. Since 28 February 2014 the scan speed of the FTIR spectrometer has been increased from 0.5 to 1 cm s−1, which has resulted in a larger number of measurements per day. Integration time has decreased from 20 to 10 min (further details can be found in Sect. 3.2). Testing was performed prior to this change and no discernible impact on measured spectra or retrievals was found when the scan speed was increased.
Table 1NDACC IRWG bandpass filter set used at TAO. All filters were manufactured by Northumbria Optical Coatings Limited.
The optical alignment of the TAO FTIR spectrometer is assessed by monitoring its instrument line shape (ILS). The ILS is determined on a routine basis by the analysis of measurements with a calibrated low-pressure HBr gas cell (HBr NDACC cell no. 13 from 2002 to 2012 and cell no. 48 from 2012 to present) using the LINEFIT version 14 retrieval algorithm described by Hase et al. (1999). Until recently, the ILS has been monitored using the InSb detector and an internal source, so the light path differs slightly from that of the solar beam used in atmospheric measurements. Since 2019, ILS measurements have been made using the same optical path as the solar measurements, using either the sun or a globar as the source. The ILS is determined as follows. First a reference spectrum is recorded at a resolution of 0.004 per centimeter. Then the HBr gas cell is placed in the beam path inside the evacuated sample compartment and a second spectrum is recorded. The transmission spectrum is calculated by taking the ratio of the HBr spectrum and the reference spectrum, thus eliminating any systematic features. This transmission spectrum is fitted to optimize the modulation efficiency and the phase error as a function of optical path distance (OPD) until the residuals are minimized.
The quality of the ILS is described by its modulation efficiency and phase error. The time series of retrieved modulation efficiency, along with the value at the maximum OPD of 250 cm, is plotted Fig. 2. The LINEFIT retrieval algorithm assumes the modulation efficiency at 0 cm is 1, and so values can be larger than 1. The modulation efficiency curves differ significantly, indicating variable instrument alignment. In general, the modulation efficiency has improved in recent years due to efforts to realign the DA8; however, there are two periods with particularly low modulation efficiency with values at maximum OPD near 0.4: mid-2009 and mid-2012 to mid-2013. These low modulation efficiency values, which correspond to an ILS that differs significantly from the ideal, have not had a notable effect on the retrieved total columns and profiles for any of the species presented in this work, save for the period between 6 December 2007 and 30 March 2009, which is discussed below. Unfortunately, no ILS measurements were made during this period. Attempts to model the modulation efficiency by including it as a fitting parameter in the retrieval have resulted in unphysical values for the modulation efficiency, even when highly constrained, and no notable improvement in the retrievals.
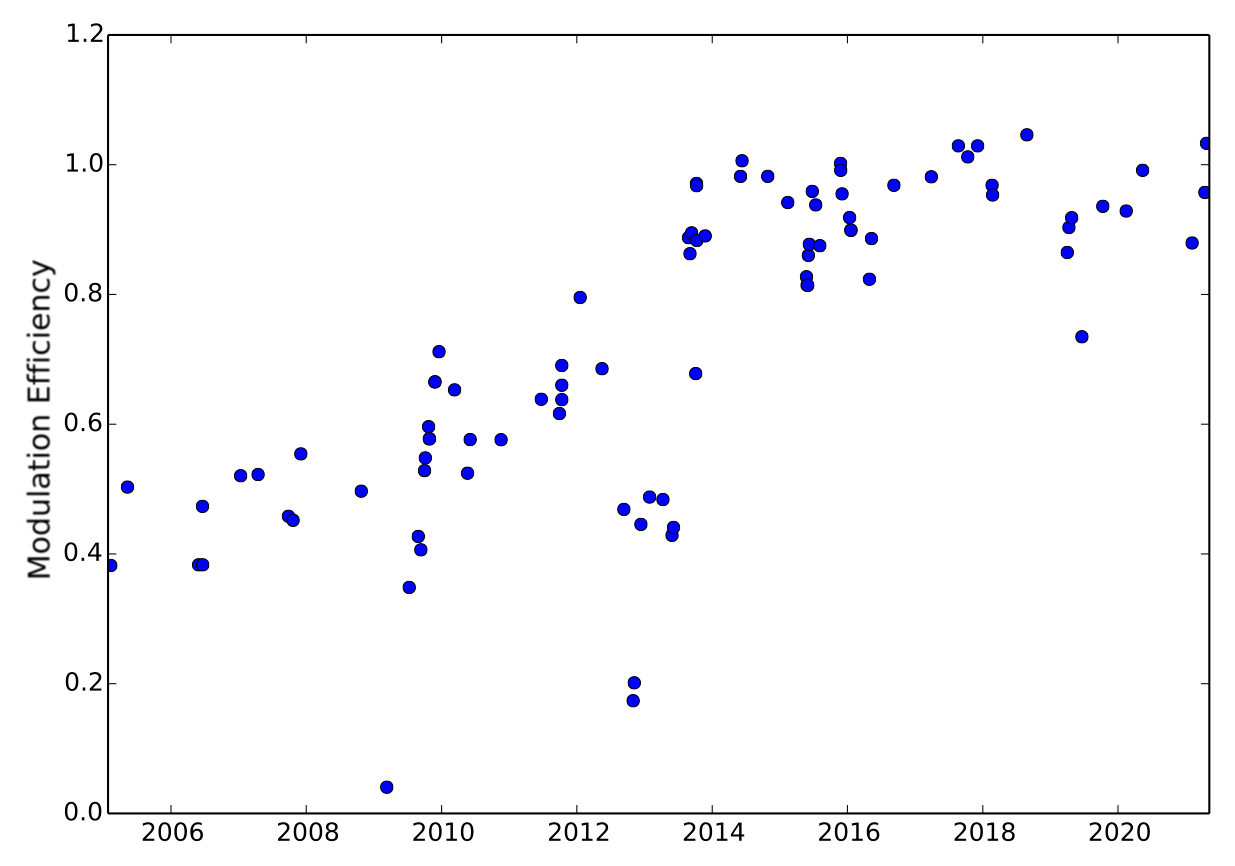
Figure 2Time series of TAO DA8 line shape modulation efficiency at the maximum OPD of 250 cm.
More recently, with fine adjustments to the optical configuration of the FTIR spectrometer, the modulation efficiency has been maintained closer to 1, yet there are curves where over-modulation occurs near 60 cm, indicating a minor shear error in the alignment. The phase error curves, shown in Fig. 3, generally show an initial decrease in value and then increase to a peak before decreasing again. Most phase error curves vary between 0 and 0.06 with a few outliers. Since mid-2013, the phase error has been fairly consistent, which along with the improved modulation efficiency suggests that alignment issues have been resolved. A recent instrument line shape measurement is shown in Fig. 3.
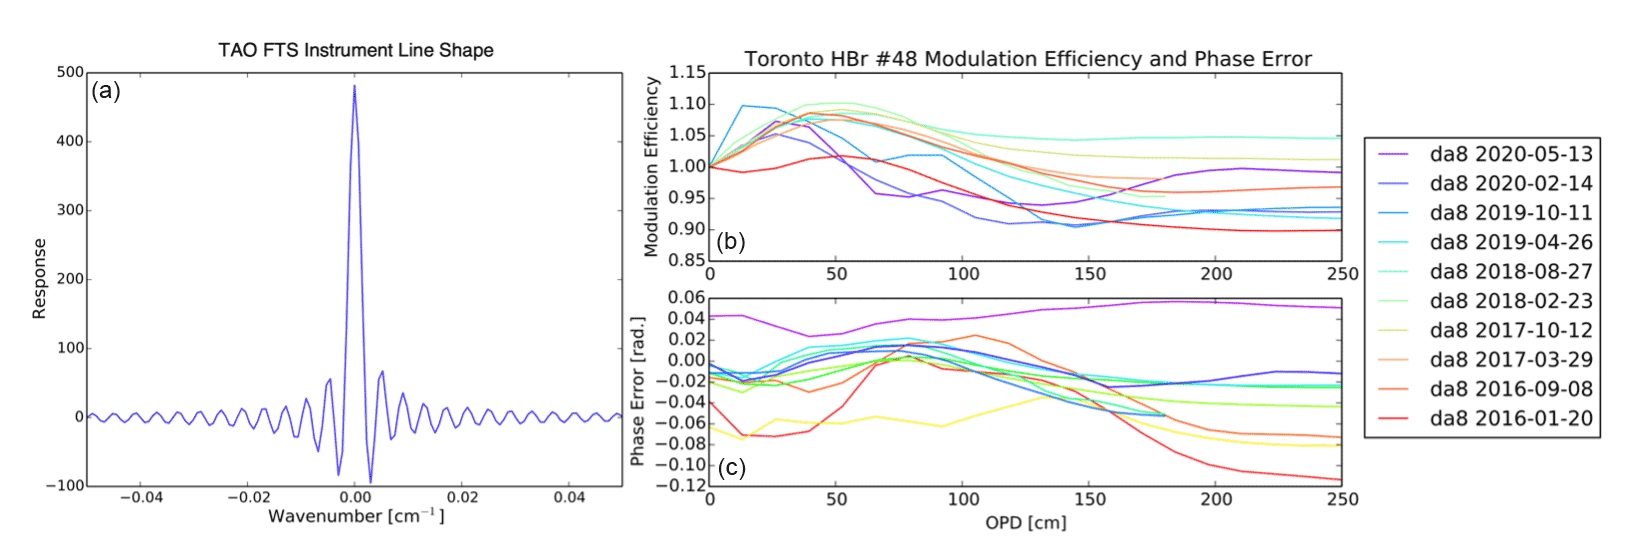
Figure 3TAO DA8 solar instrument line shape (a) (taken on 13 May 2020), modulation efficiency (b), and phase error (c) (various measurements from 2016 to 2020 shown), with HBr cell no. 48 at 0.004 per centimeter resolution, obtained using LINEFIT v14.5.
The measurements from 6 December 2007 to 30 March 2009 are affected by an instrument artifact, which appears to be due to instrument misalignment and gives rise to anomalous profile retrievals that are particularly notable for CH4. Total columns can be adjusted by adding an interpolated offset as in Bader et al. (2017); however, profiles remain atypical. Efforts to correct for this misalignment during the retrievals have not been successful, and so CH4 retrievals for this period are no longer archived and retrievals of other gases for this period should be used with caution.
2.2 Heliostat
In 2001, an altitude–azimuth heliostat (manufactured by AIM Controls Inc.) was installed on the roof above the FTIR laboratory to direct the solar beam to the DA8 spectrometer. The heliostat's mobile mirror rotates in both azimuth and altitude (elevation) to follow the sun, directing the solar beam to a fixed mirror that reflects it into the laboratory, to two flat folding mirrors, a 90∘ off-axis parabolic mirror, and finally through the filter wheel and into the entrance aperture of the FTIR spectrometer as shown in Fig. 1a. The AIM Controls heliostat operated in both active and passive solar tracking modes from 2002 to 2014. In the passive mode, the heliostat used ephemeris calculations to track the position of the sun. In the active mode, four photodiodes were used to keep the solar beam centered. This active tracking system had reliability and accuracy issues, and over time it increasingly required operator intervention to ensure the stability of the solar beam alignment on the entrance aperture of the FTIR spectrometer. The nominal pointing accuracy, determined by the distribution of altitude and azimuth corrections that must be applied to the moving mirror to keep the solar beam aligned and provided by AIM Controls, was better than 60 arcsec. However, this pointing accuracy degenerated over time and by 2014 it had degraded to approximately 200 arcsec (0.056∘). Figure 4a shows the distribution of corrections for 1 d of measurements using this quadrant diode system; different clusters are the result of manually adjusting the alignment after the solar beam drifted or was obstructed by clouds. Figure 4b shows the distribution of corrections at one position.
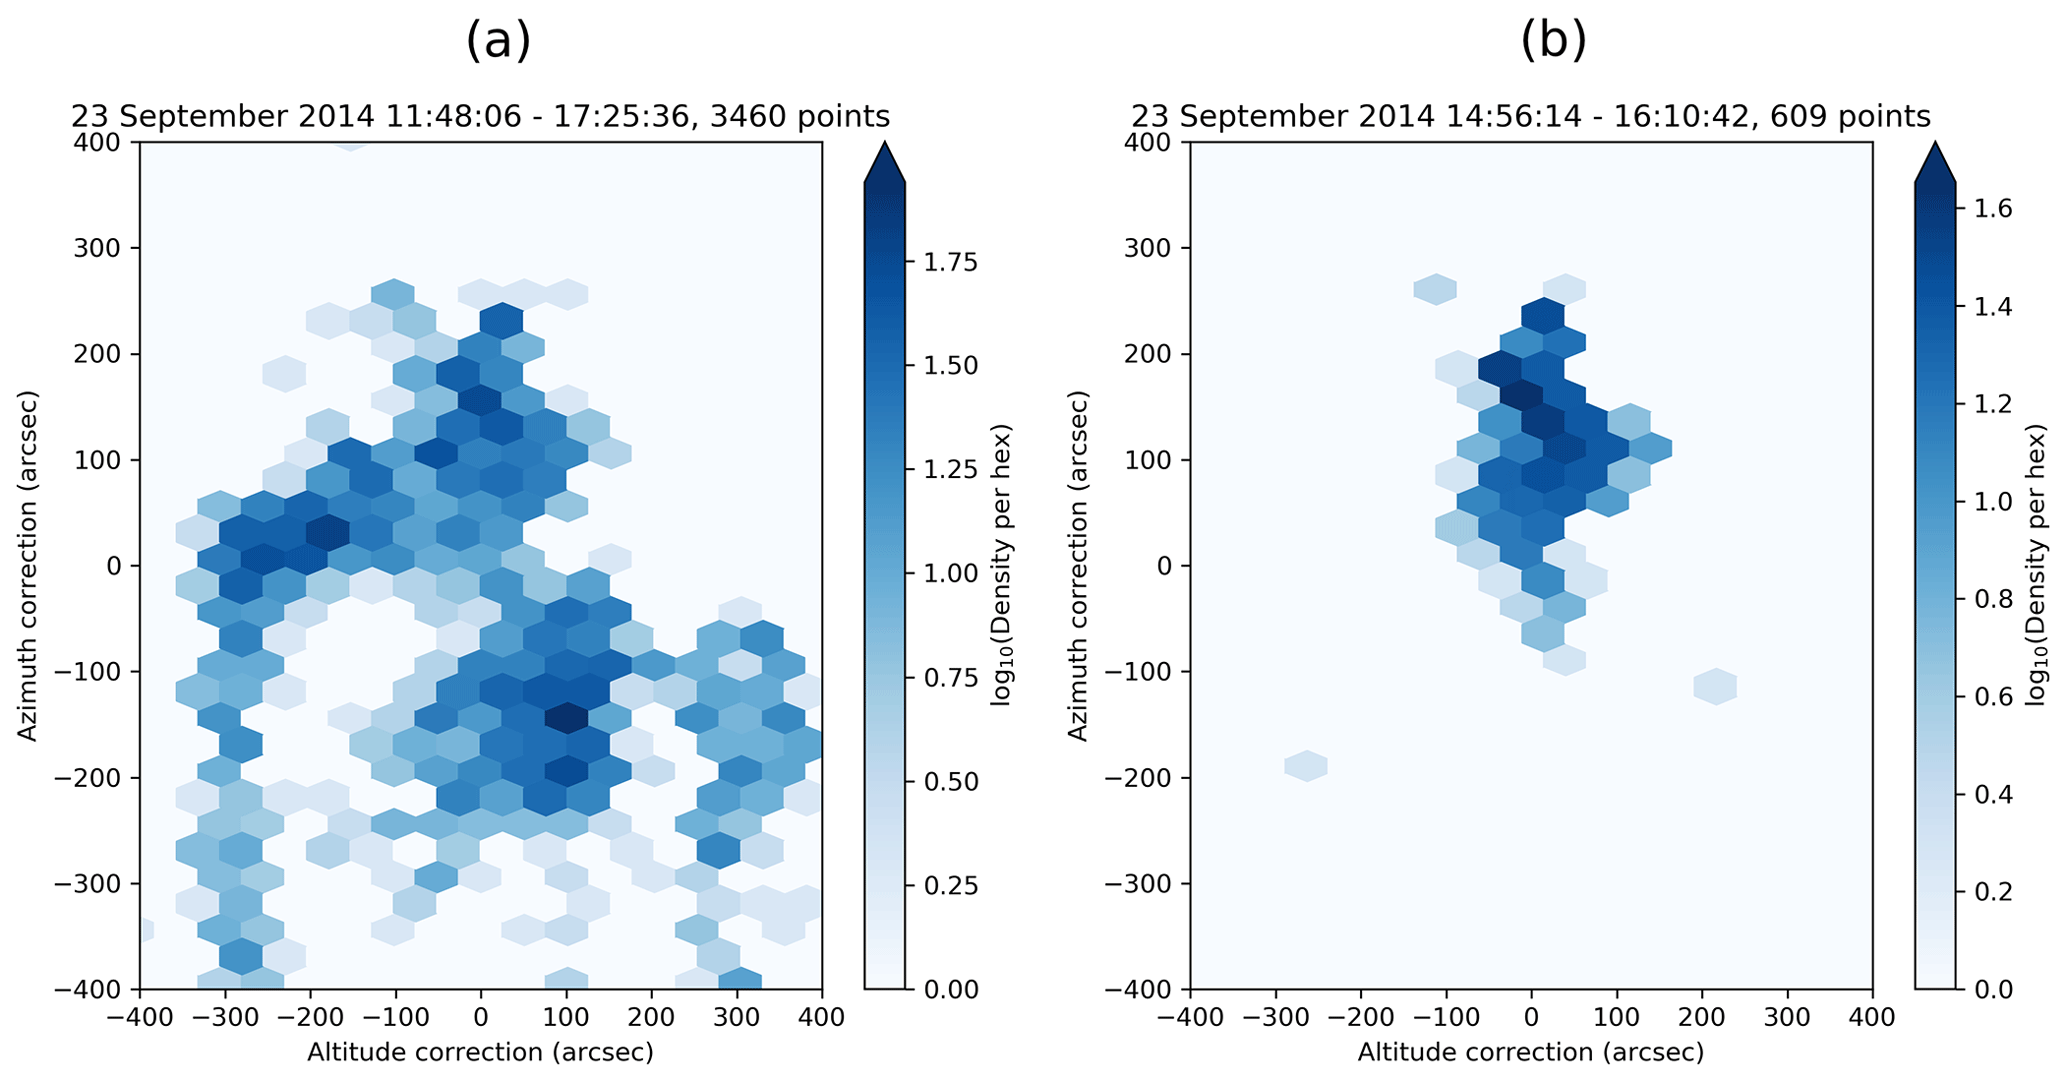
Figure 4Solar tracker azimuth and altitude corrections for the original quadrant diode active tracking system during a day of testing in September 2014: (a) for an entire day including manual realignments and (b) at a single position.
On 2 September 2014, a new active tracking system was implemented: the Community Solar Tracker (CST, Franklin, 2015). Instead of four photodiodes, a charge-coupled device (CCD) camera intercepts a portion of the solar beam, and the solar image is used for tracking. It has been shown that such a system can achieve better pointing accuracy than a quadrant diode (Gisi et al., 2011). The CST active tracking software was adapted to the optics of TAO. Images of the sun are processed with an ellipse-fitting algorithm that determines the center position of the solar disk. With this information, it is possible to calculate the azimuth and altitude corrections necessary to maintain the center of the disk at the desired position to keep the solar beam aligned. The resulting pointing accuracy, as seen in Fig. 5, is better than ∼ 30 arcsec (Yamanouchi, 2021), a significant improvement on the previous active tracking system. Direct comparison of the photodiode system and the active CST solar tracker is not possible due to differences in modes of operation. However, the standard deviation (1σ) in solar line shifts (calculated from CO retrievals) decreased from 3.99 × 10⁻³ per centimeter (2002–2014) to 1.96 × 10⁻³ per centimeter (2014–2019 after switching to the camera solar-disk-fitting system; see Fig. 6) (Yamanouchi, 2021). Solar line shifts are caused by the tracker failing to point at the center of the sun, resulting in Doppler shifting of the incoming solar radiation, and thus provide a measure of tracking performance.
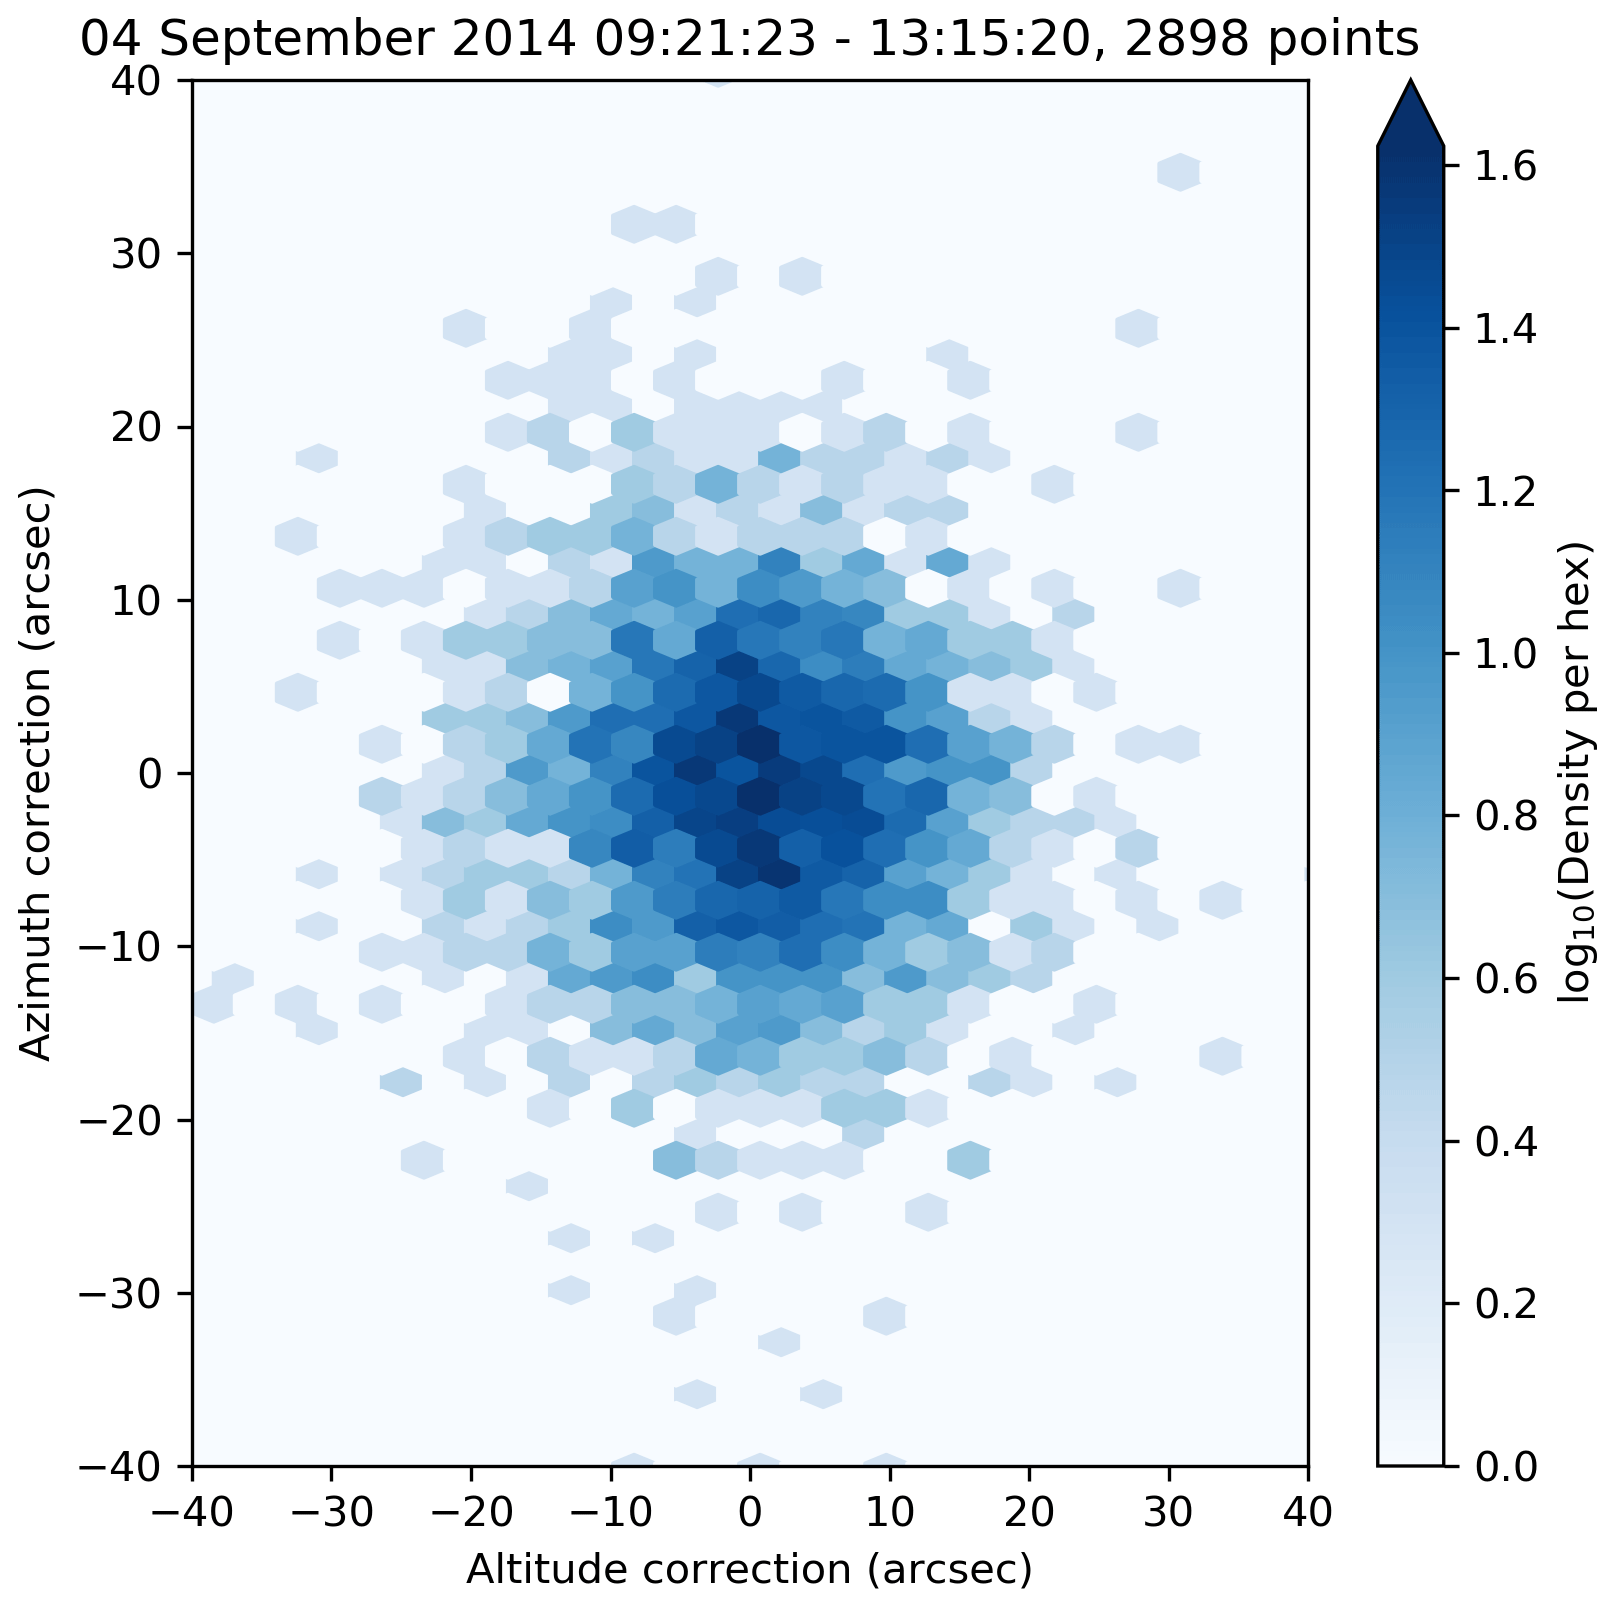
Figure 5Solar tracker azimuth and altitude corrections for the new CST active tracking system shortly after installation in September 2014.
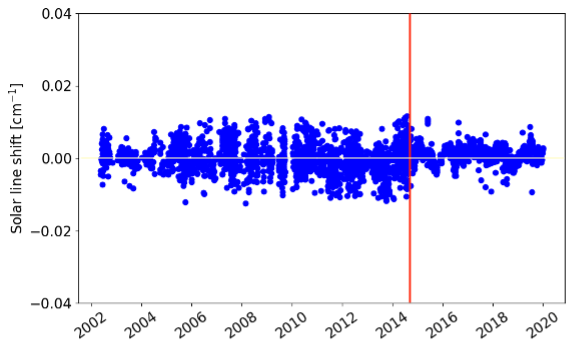
Figure 6Time series of the solar line shift (per centimeter) from CO retrievals from 2002 to 2019. The red line indicates 2 September 2014, when the solar tracker was upgraded to the CST system. Figure taken from Yamanouchi (2021).
2.3 Complementary instruments at TAO
In addition to the FTIR spectrometer, TAO hosts several instruments which record complementary measurements on a regular basis. Local meteorological parameters, such as temperature, humidity, wind speed and direction, precipitation, and solar irradiance are measured by a commercially available weather station (Vantage Pro Plus manufactured by Davis Instruments Corp.). Current and previously recorded conditions are publicly available (http://www.atmosp.physics.utoronto.ca/wstat/index.htm, last access: 4 July 2023). In addition, temperature and pressure measurements (with nominal accuracies of ±0.2 ∘C and ±0.15 hPa, respectively) have been recorded by a PTU300/PTB330 Class A temperature and pressure sensor manufactured by Vaisala since March 2013. Ozone total columns were measured by an Environment and Climate Change Canada (ECCC) Brewer spectrophotometer from March 2005 to January 2016. These measurements can be accessed through the World Ozone and Ultraviolet Data Centre (http://www.woudc.org, last access: 4 July 2023). The Brewer spectrophotometer was replaced by an ECCC Pandora UV–visible spectrometer in July 2016; these data are available through the Pandonia Global Network (http://data.pandonia-global-network.org/, last access: 4 July 2023, instrument number 109, station “St. George”). An open-path FTIR system was installed in November 2017 and has been running nearly continuously since then (Byrne et al., 2020; You et al., 2021). Finally, solar irradiance is measured by a Kipp & Zonen CM3 pyranometer, operated by ECCC.
TAO has hosted additional instruments for shorter periods: an ECCC Picarro gas analyzer was used to measure ambient levels of O3, CO2, CH4, and water vapor from November 2013 to January 2015 and a very high-frequency (VHF) lightning detector was in use between 2008 and 2010 (Abreu et al., 2010). Other instruments have been deployed intermittently between field campaigns, including a Systeme d'Analyse par Observations Zenithales (SAOZ, http://saoz.obs.uvsq.fr/, last access: 4 July 2023) and the University of Toronto Ground-Based Spectrometer (UT-GBS), which uses differential optical spectroscopy to retrieve O3, NO2, and BrO (Fraser, 2008).
3.1 Retrieval strategy
Total and partial columns of O3, HCl, HF, HNO3, CH4, C2H6, CO, HCN, N2O, C2H2, H2CO, CH3OH, HCOOH, and NH3 are retrieved from the TAO FTIR solar absorption measurements using the optimal estimation method (OEM) as formulated in Rodgers (1976, 1990, 2000) and implemented in the SFIT4 v0.9.4.4 retrieval code (https://wiki.ucar.edu/display/sfit4/Infrared+Working+Group+Retrieval+Code,+SFIT, last access: 4 July 2023).
SFIT4 couples OEM with a non-linear Newtonian iteration scheme to optimize the spectral fit in the given microwindows based on the HIgh-resolution TRANsmission (HITRAN) 2008 spectral line list (Rothman et al., 2009). CH4 retrievals have been studied extensively by Sussmann et al. (2011), who recommended the Tikhonov regularization approach (Tikhonov, 1963; Twomey, 1963) instead of OEM. The TAO CH4 retrievals follow the approach outlined in Tikhonov (1963) with the tuning parameter, α, optimized to yield a value of 2 for the median degrees of freedom for signal (DOFS, defined as the trace of the averaging kernel matrix by Rodgers, 2000, and discussed in more detail below). N2O is also retrieved using the Tikhonov regularization approach to minimize oscillations in the retrieved profile (Angelbratt et al., 2011); however, in the case of N2O, α is optimized for a median DOFS of 3.
Temperature and pressure profiles used in the retrieval are obtained from the US National Centers for Environmental Prediction (NCEP) meteorological data product (calculated for each NDACC site and available at https://www-air.larc.nasa.gov/missions/ndacc/data.html?NCEP=ncep-list, last access: 4 July 2023).
The early TAO FTIR measurements were evaluated during a number of ground-based and satellite measurement comparisons (Wiacek et al., 2007; Wunch et al., 2007; Taylor et al., 2007, 2008). Some retrieval parameters have since been updated, such as the a priori profiles, which are now based on the mean profile of a 40-year Whole Atmosphere Community Climate Model (WACCM) run (Marsh et al., 2013). The exception to this is NH3; the a priori profile for NH3 was based on the a priori profile used at the NDACC site in Bremen (Dammers et al., 2015), which was obtained from balloon-based measurements (Toon et al., 1999). The a priori profiles for each species are shown in red, along with all retrieved profiles from 2002 to 2020 in gray, on both linear and log scales in Fig. 7.
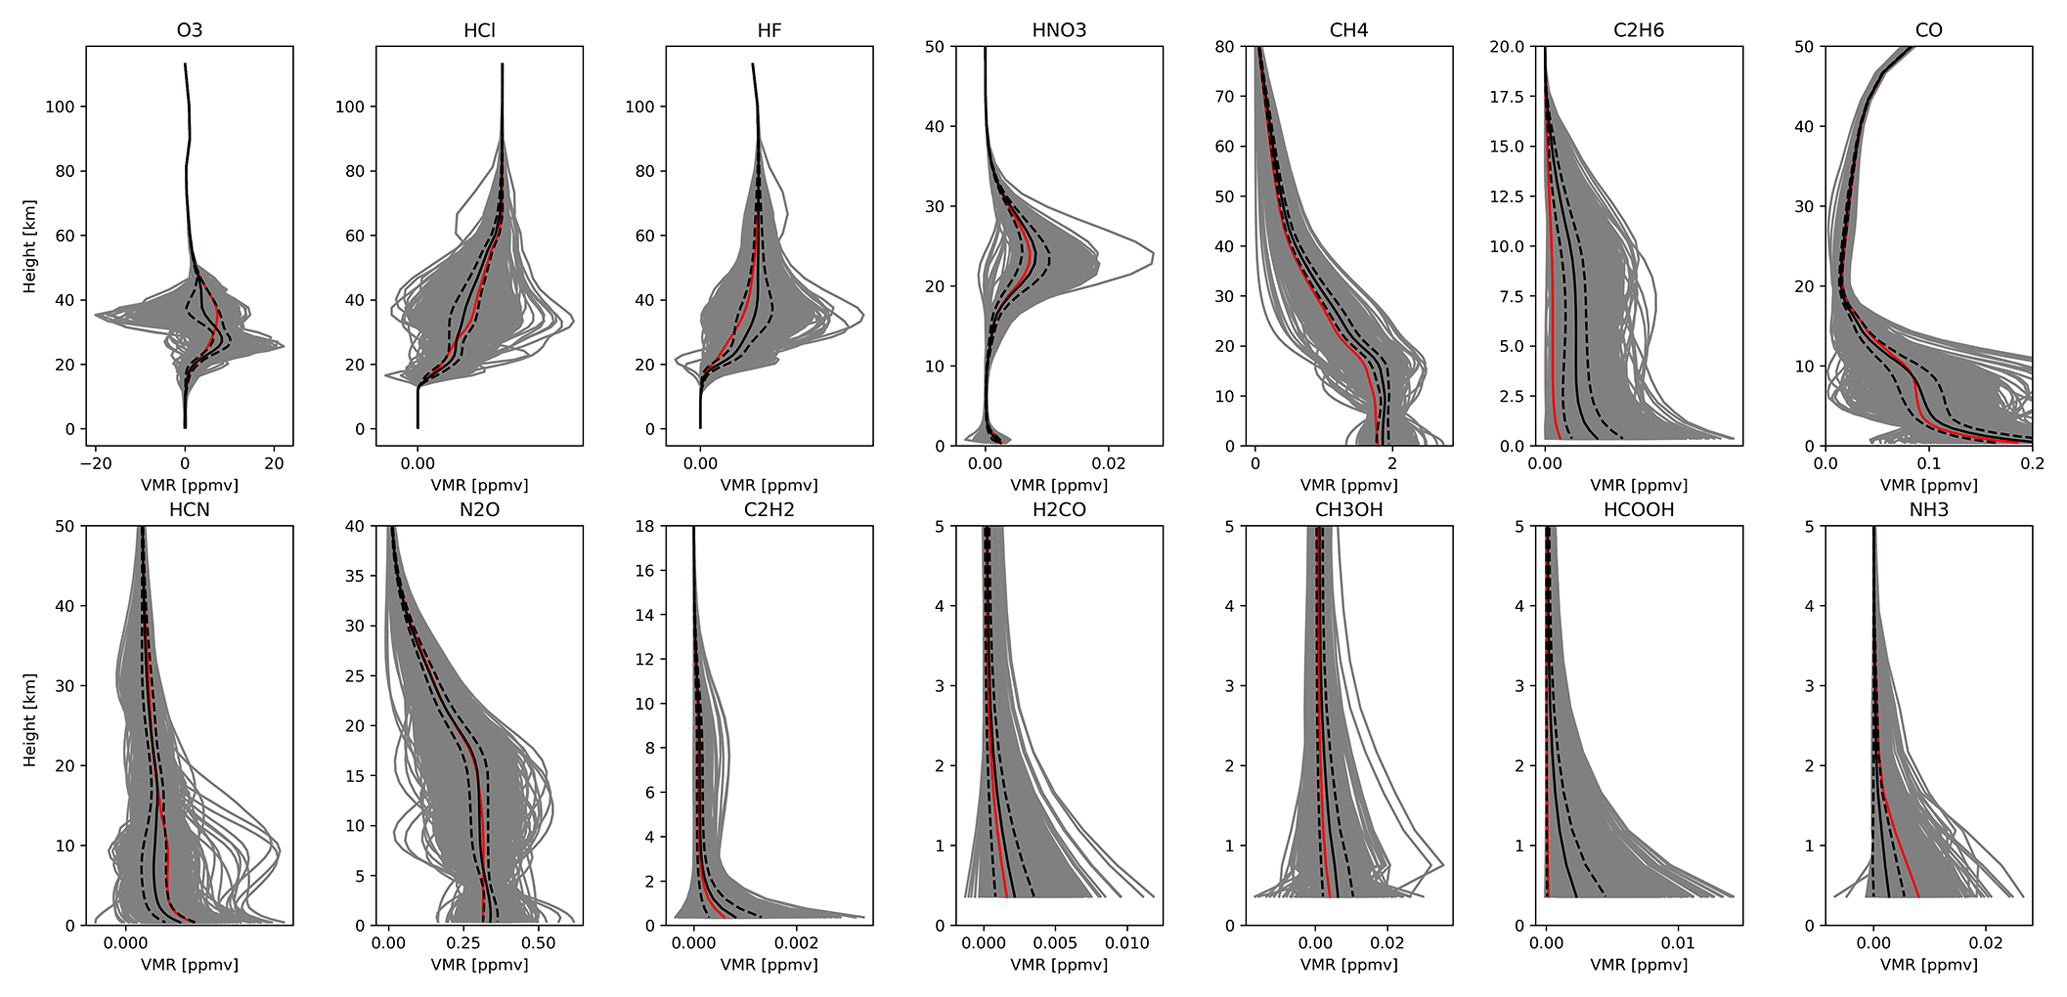
Figure 7Retrieved profiles of O3, HCl, HF, HNO3, CH4, C2H6, CO, HCN, N2O, C2H2, H2CO, CH3OH, HCOOH, and NH3 from 2002 to 2020. The mean profile is plotted in black with the two black dashed lines corresponding to ±1σ standard deviation from the mean. The a priori profile is plotted as a red line.
The spectral microwindows have also been updated as recommended by the NDACC IRWG harmonization initiative. Typical measured (Obs) and modeled (Calc) spectra, along with the contributions of the primary and interfering gases, are shown in Figs. 8 to 21. Efforts were made to reduce systematic features in the residuals; however, in some cases this was not entirely successful. For both species retrieved using Tikhonov regularization (CH4 and N2O), it is expected that there may be features in the residuals because of the smoothness constraint imposed on the retrieved profile as part of this approach. Consequently, the peaks of the lines are typically not well fitted for either of these species. Additionally the solar lines in the CO microwindows and one of the O3 lines in the second CO microwindow are not well fitted in the majority of the spectra; however, other than increasing the root mean square (rms) spectral fit error, these features have little effect on the retrieved CO profile.
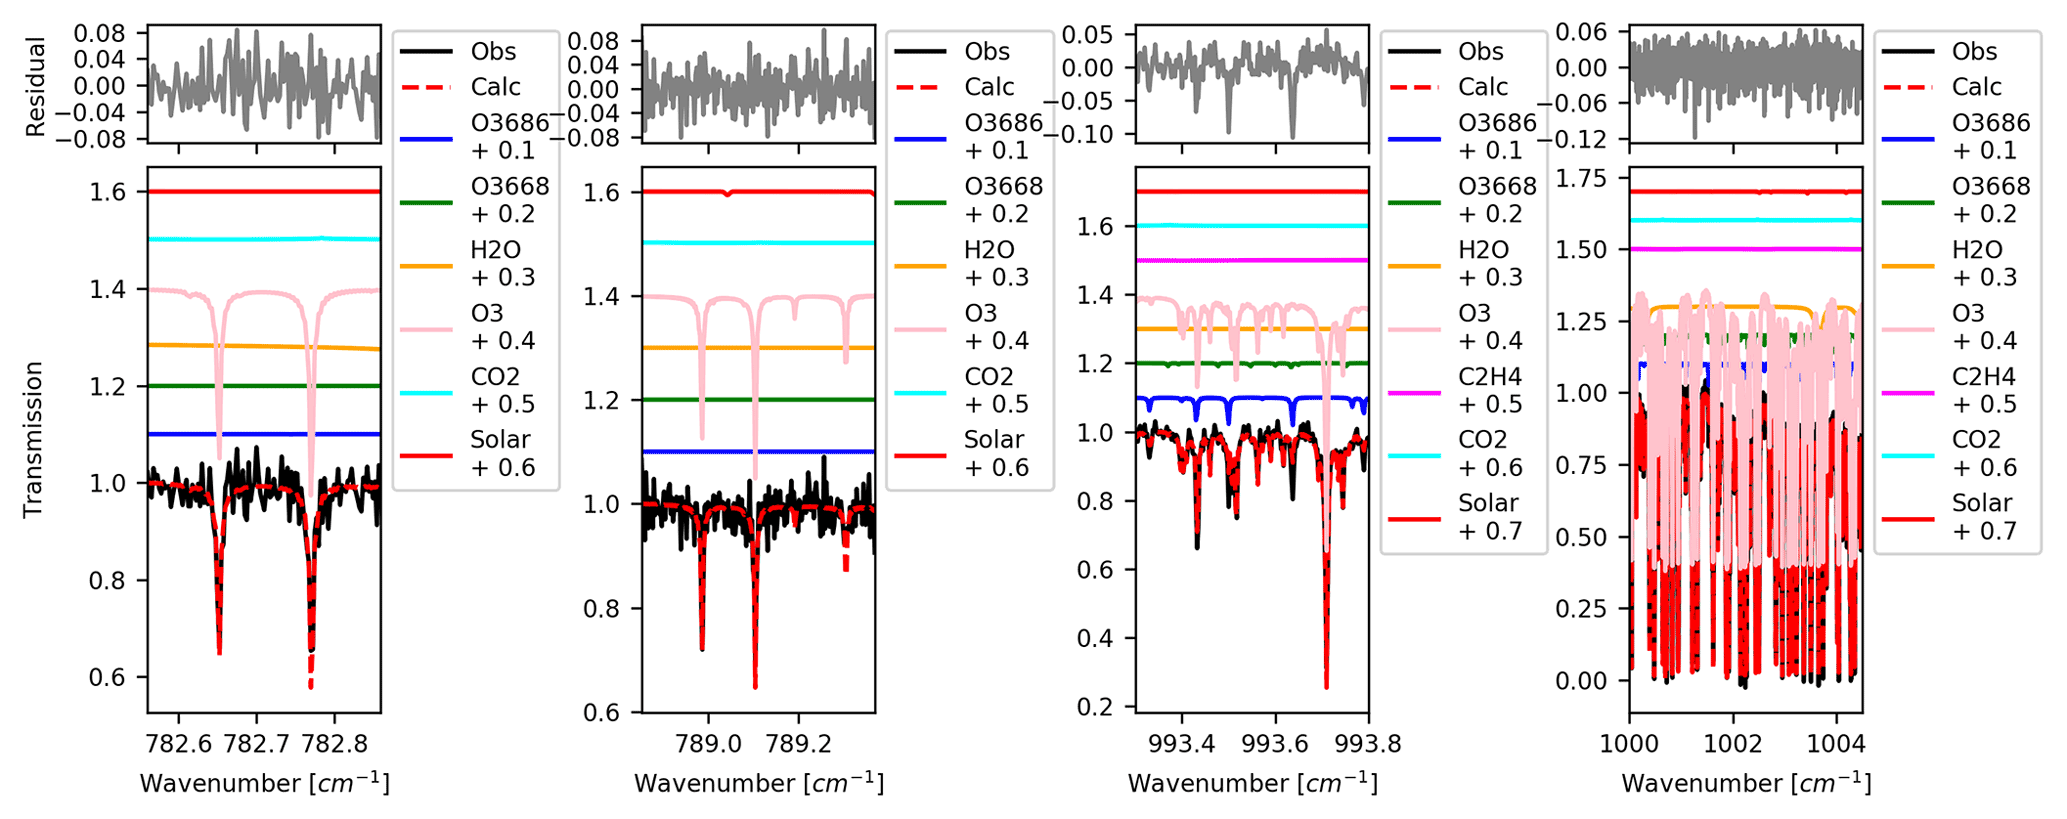
Figure 8Sample fit (Calc) and residual (upper panels) for the O3 fitting microwindows for a TAO FTIR transmission spectrum (Obs) recorded at 17:04:42 UTC on 11 January 2019. The contributions of all species in the state vector are plotted separately (lower panels) and are offset to improve the clarity of the figure.
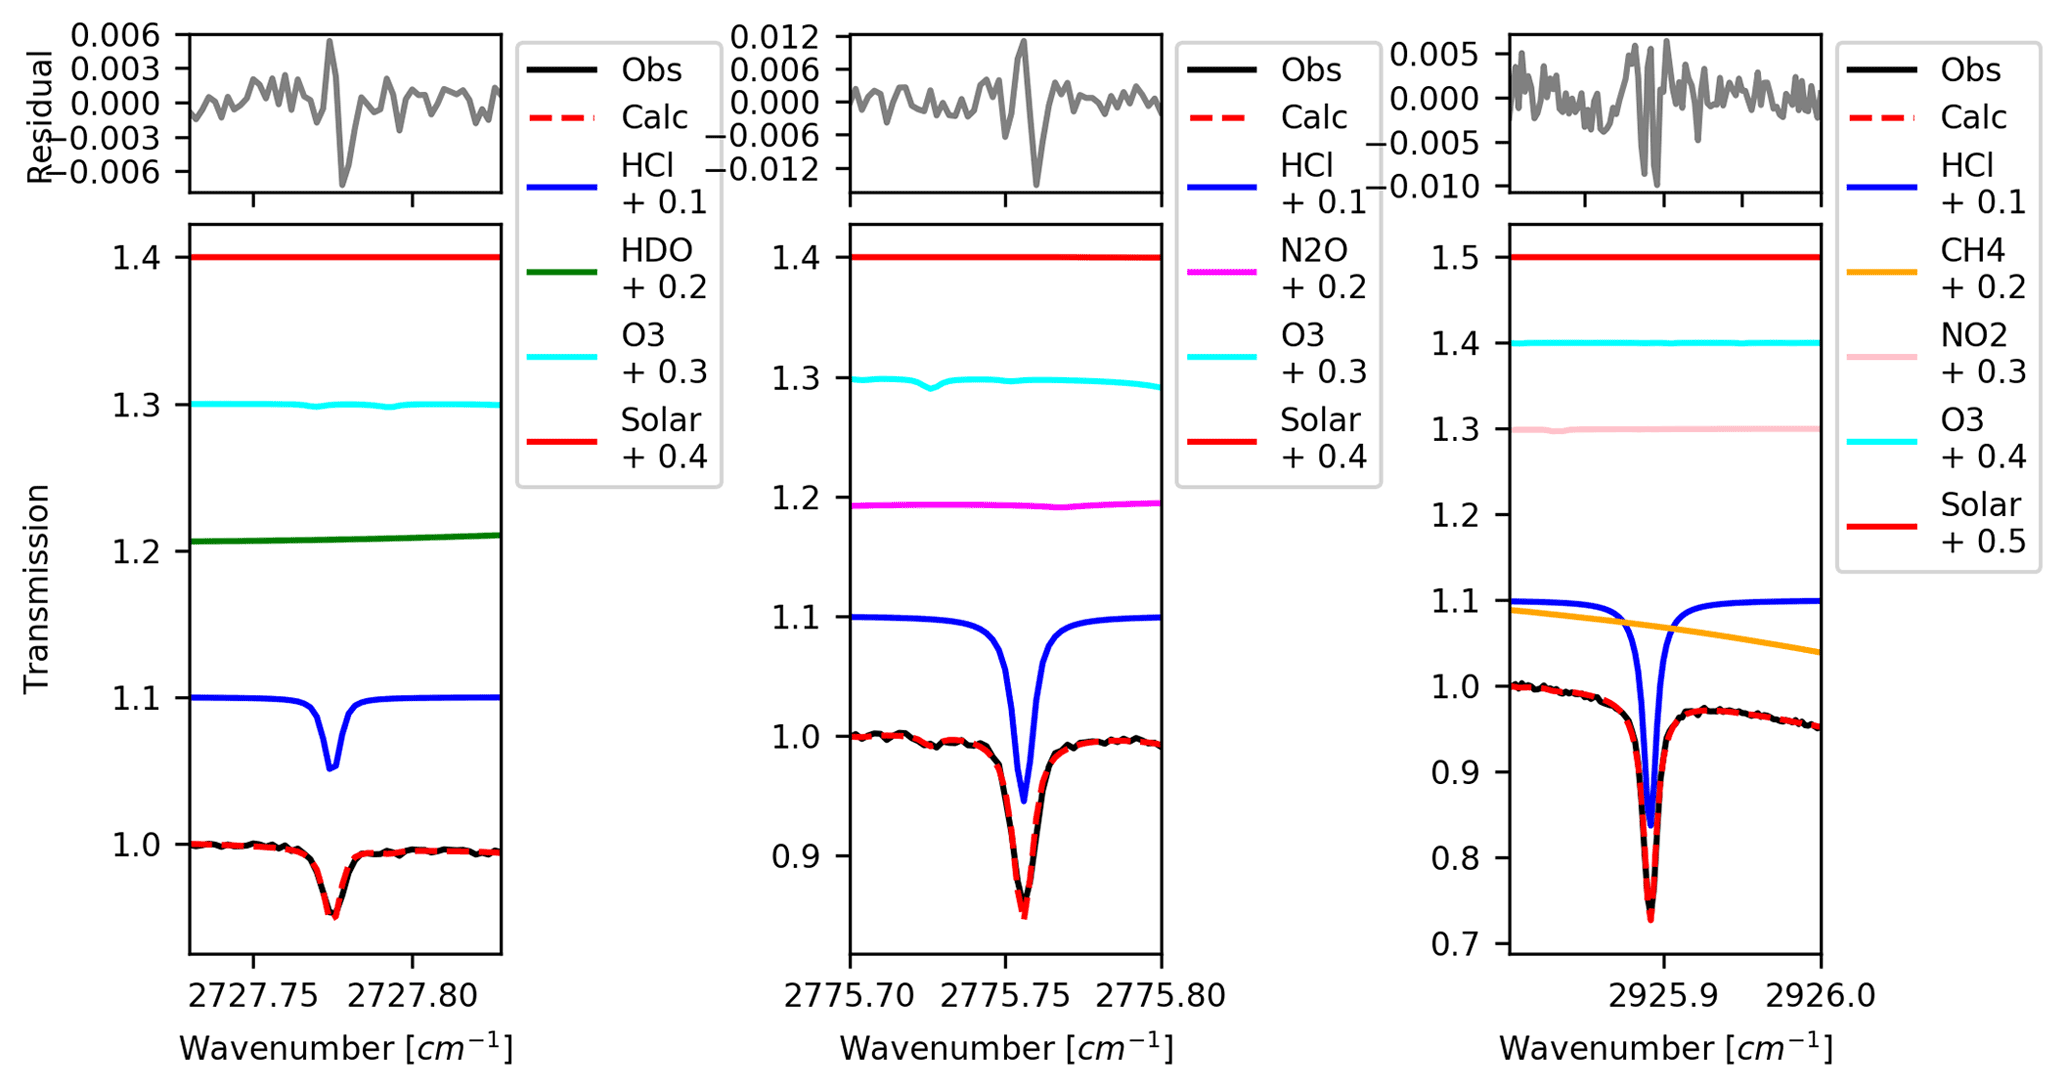
Figure 9Same as Fig. 8 but for HCl using a spectrum recorded at 16:36:54 UTC on 11 January 2019.
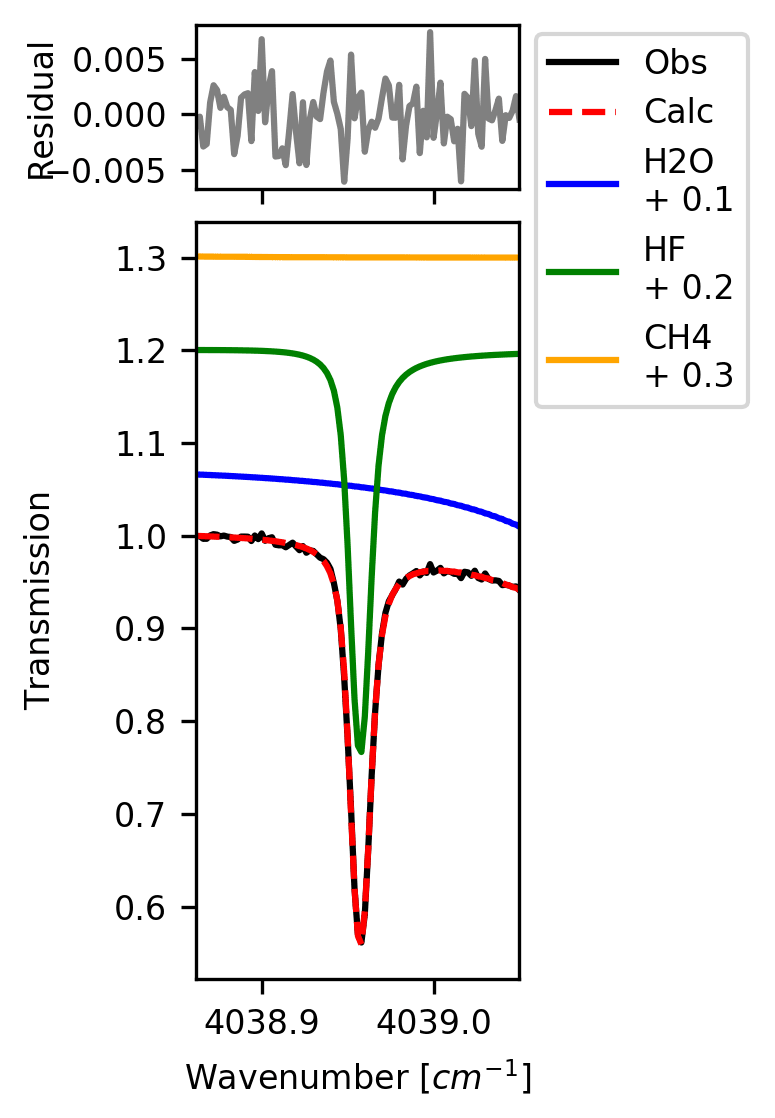
Figure 10Same as Fig. 8 but for HF using a spectrum recorded at 17:31:50 UTC on 11 January 2019.
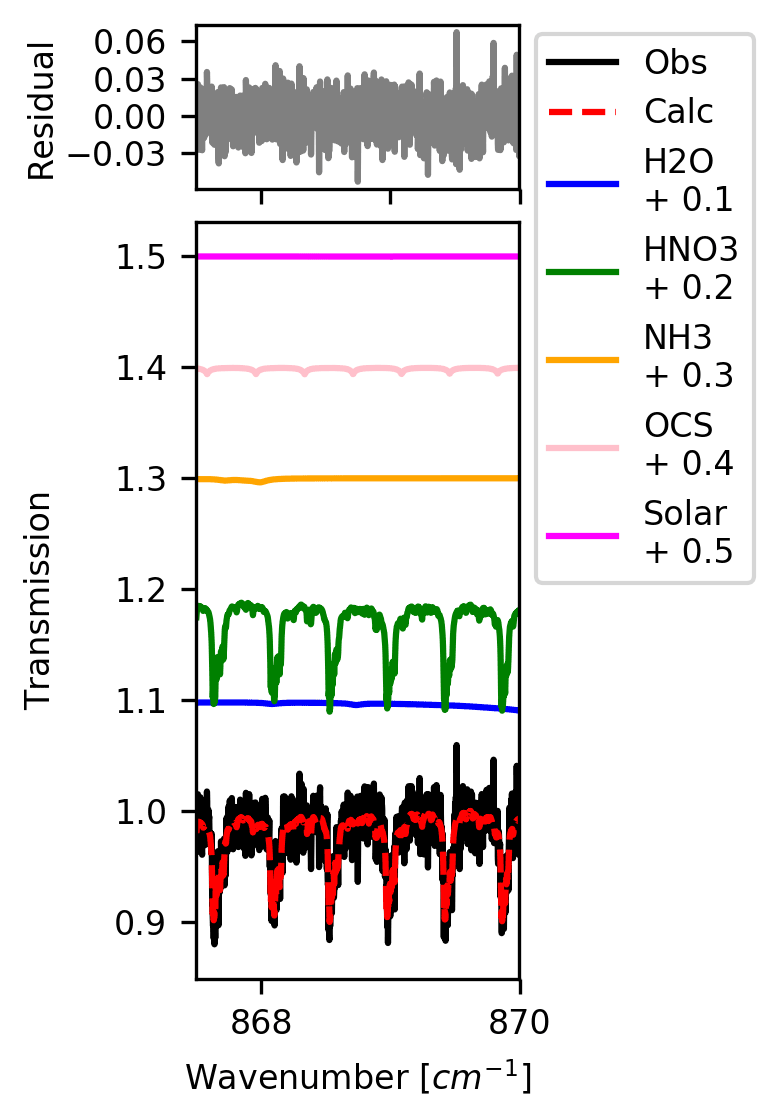
Figure 11Same as Fig. 8 but for HNO3 using a spectrum recorded at 19:48:59 UTC on 11 January 2019.
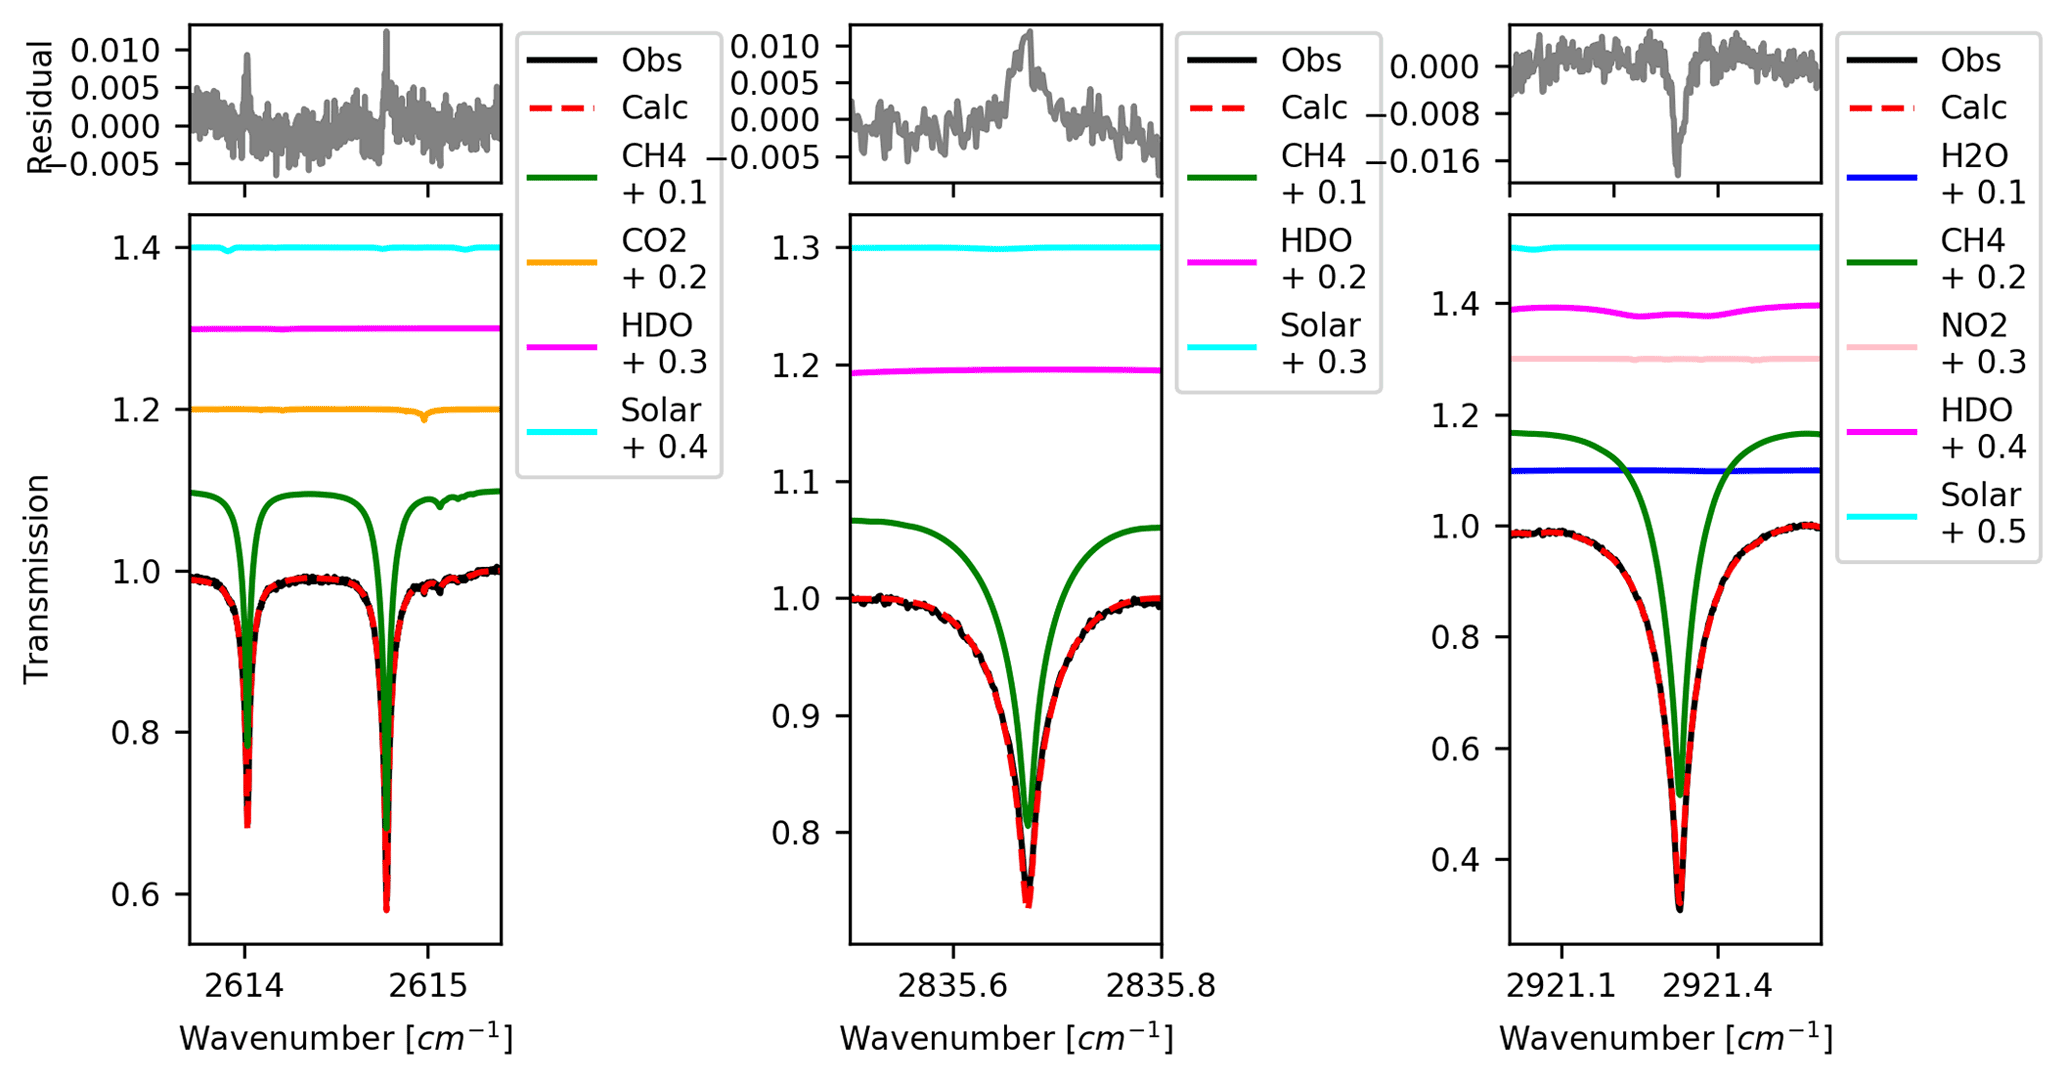
Figure 12Same as Fig. 8 but for CH4 using a spectrum recorded at 16:36:54 UTC on 11 January 2019.
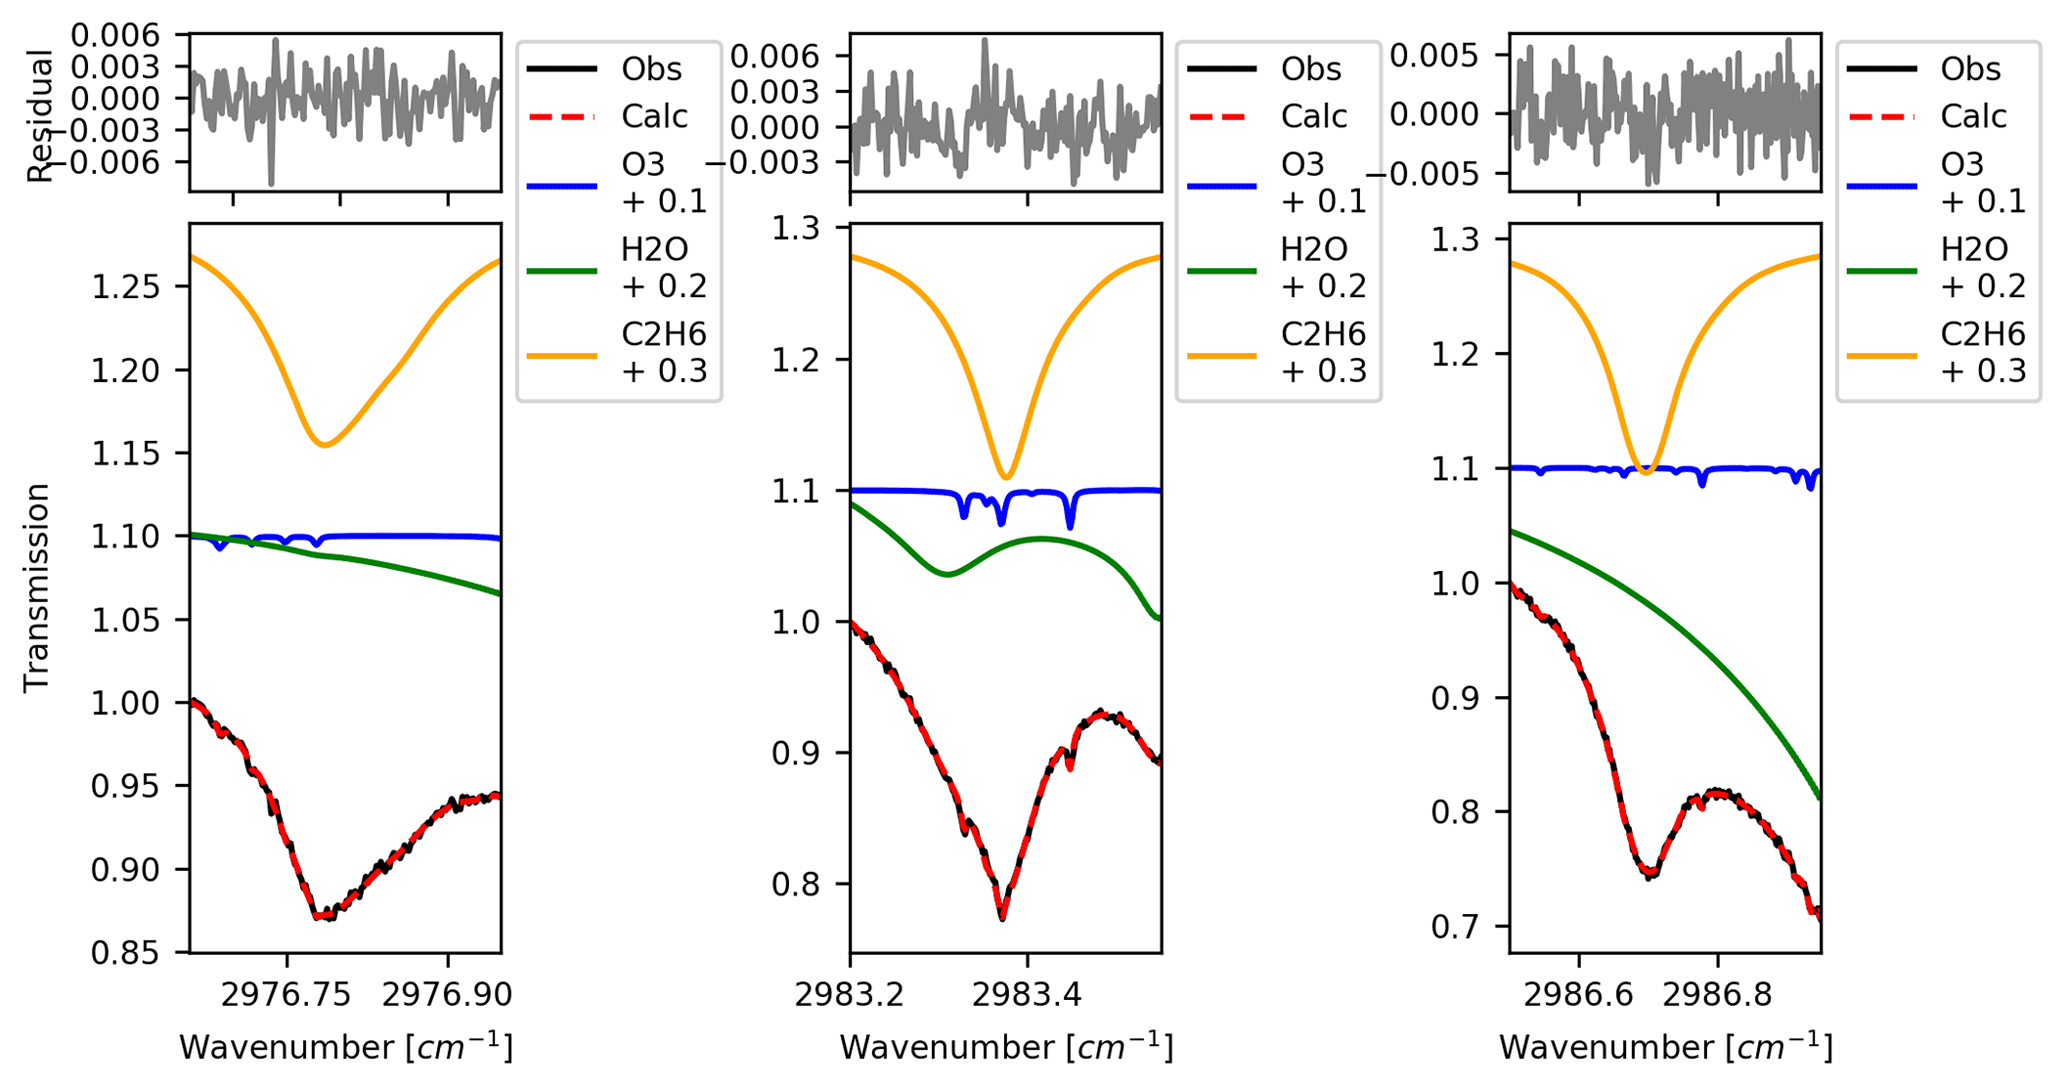
Figure 13Same as Fig. 8 for C2H6, using a spectrum recorded at 16:36:54 UTC on 11 January 2019.
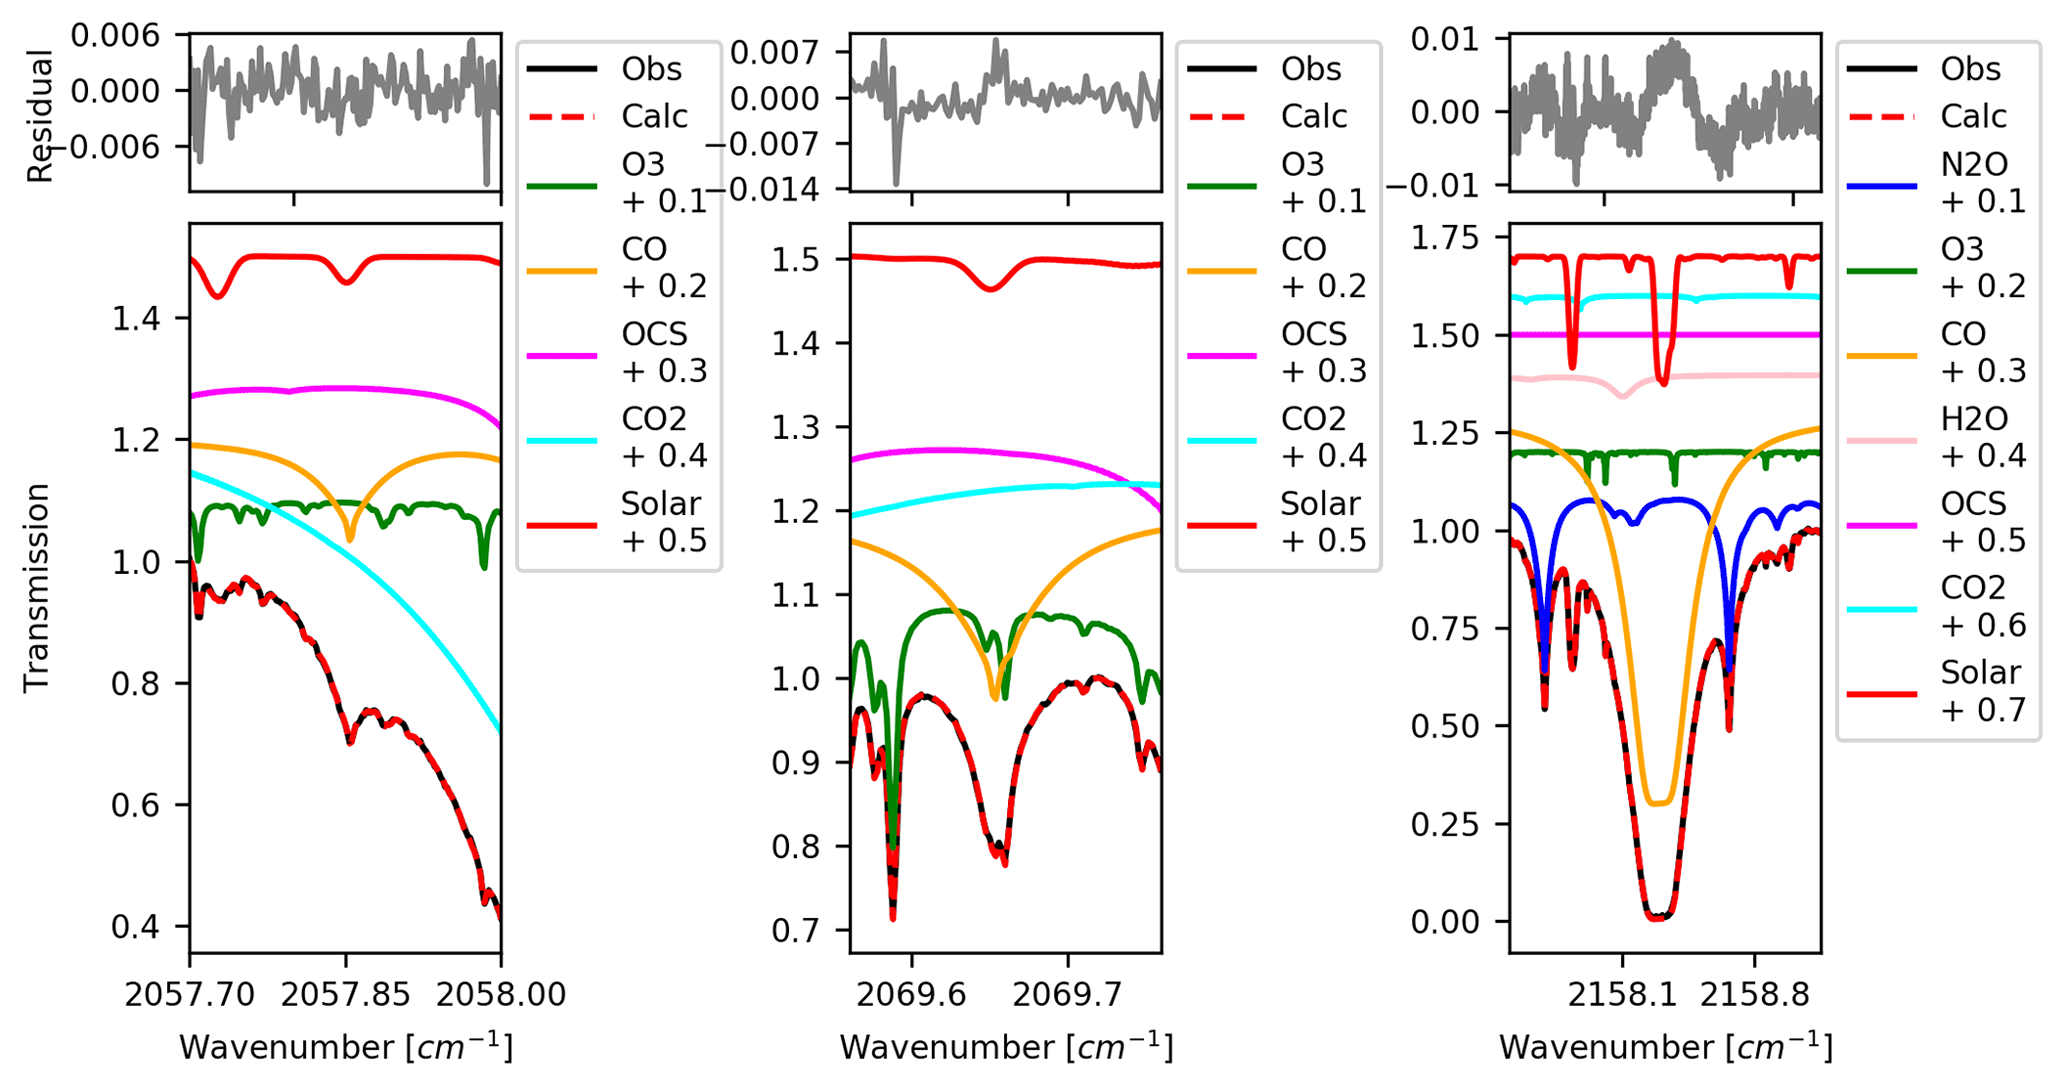
Figure 14Same as Fig. 8 for CO, using a spectrum recorded at 16:50:37 UTC on 11 January 2019.
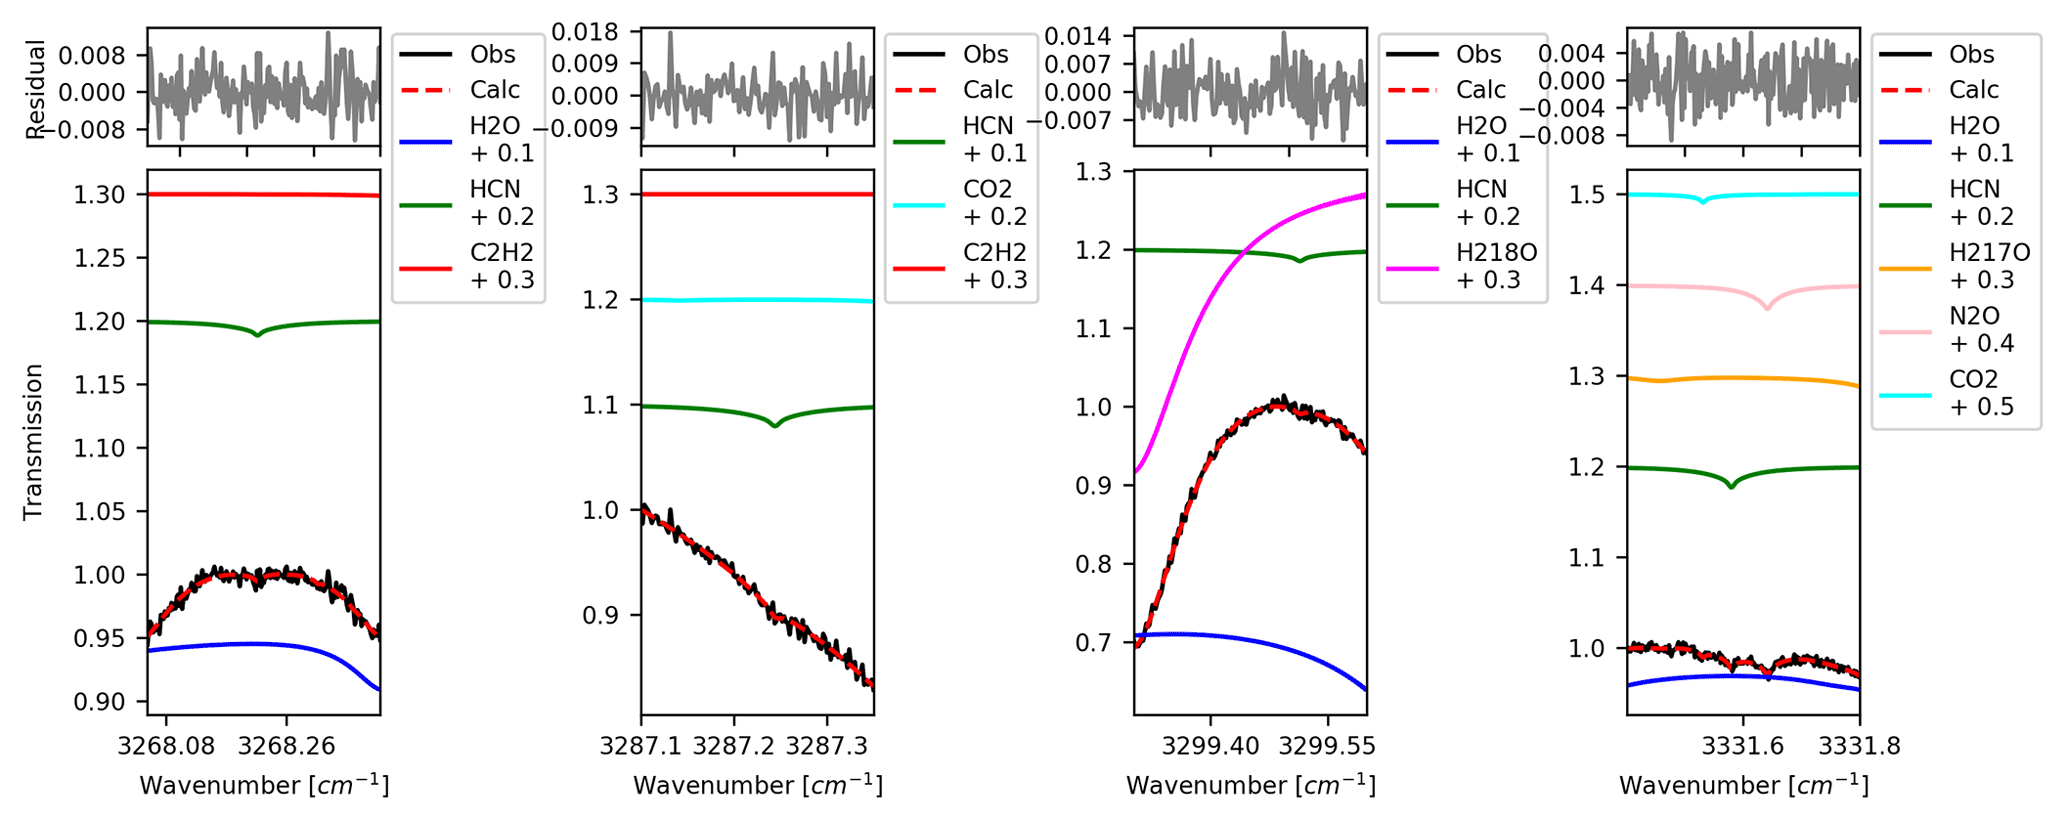
Figure 15Same as Fig. 8 but for HCN, using a spectrum recorded at 16:07:45 UTC on 15 July 2019.
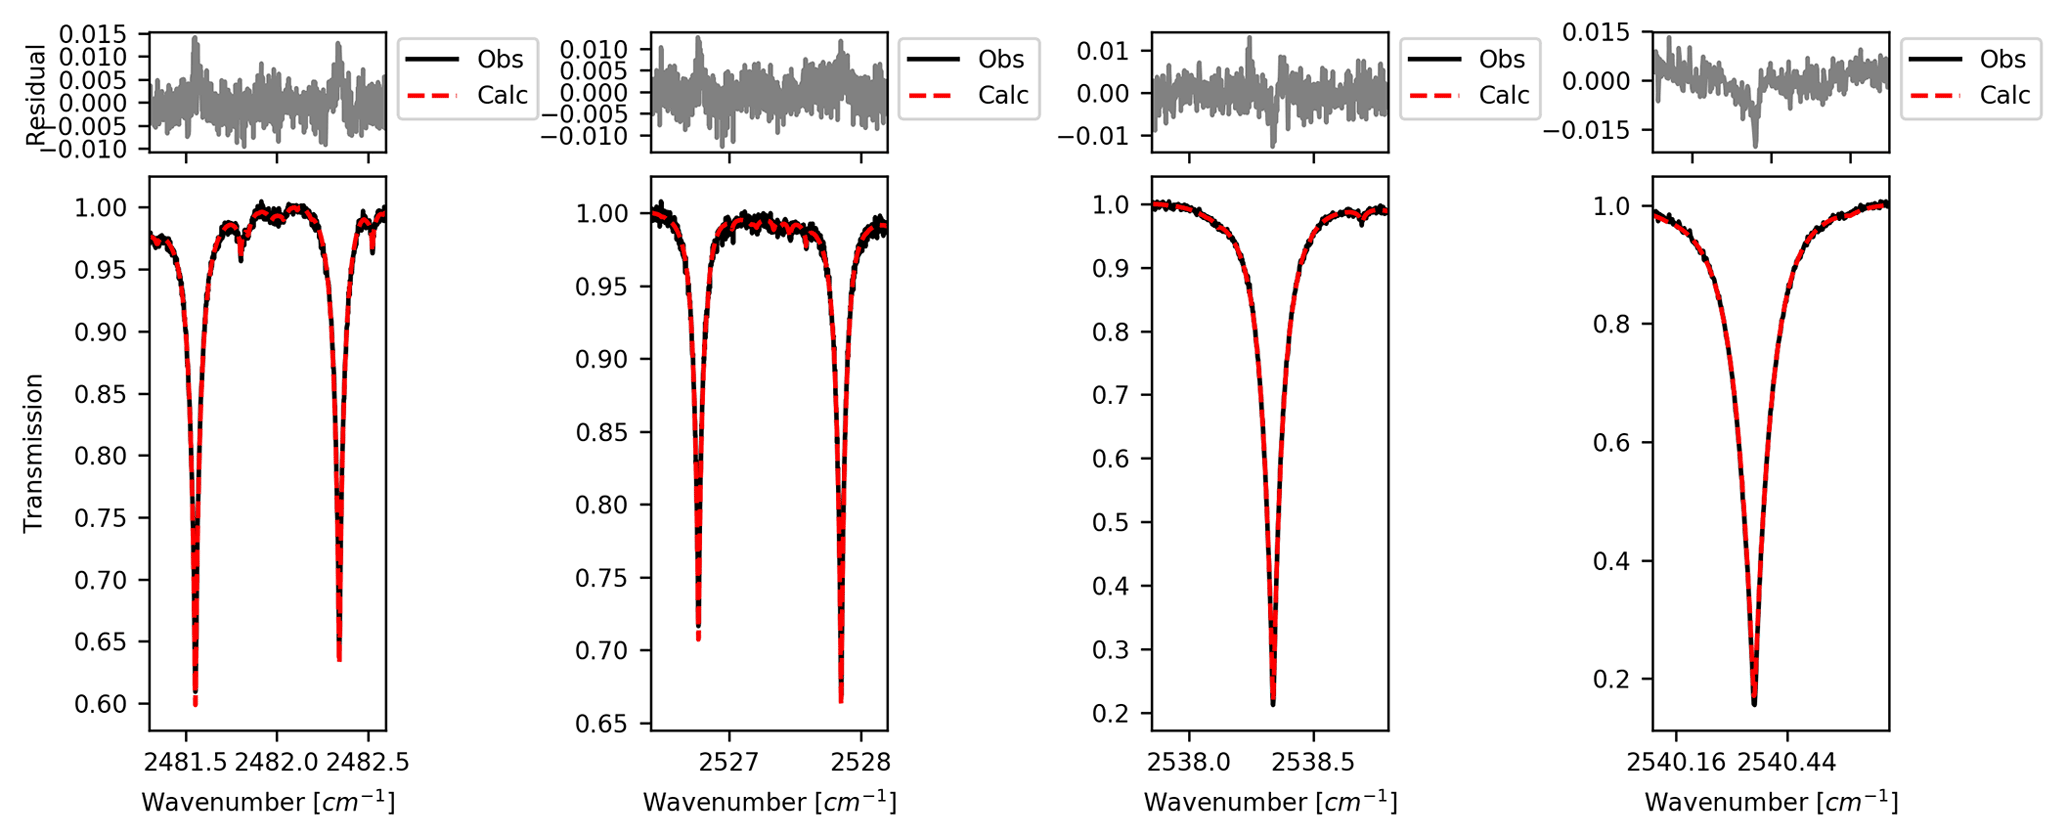
Figure 16Same as Fig. 8 but for N2O using a spectrum recorded at 14:55:17 UTC on 15 July 2019. Since no interfering species are retrieved, solely the observed and calculated spectra are plotted.
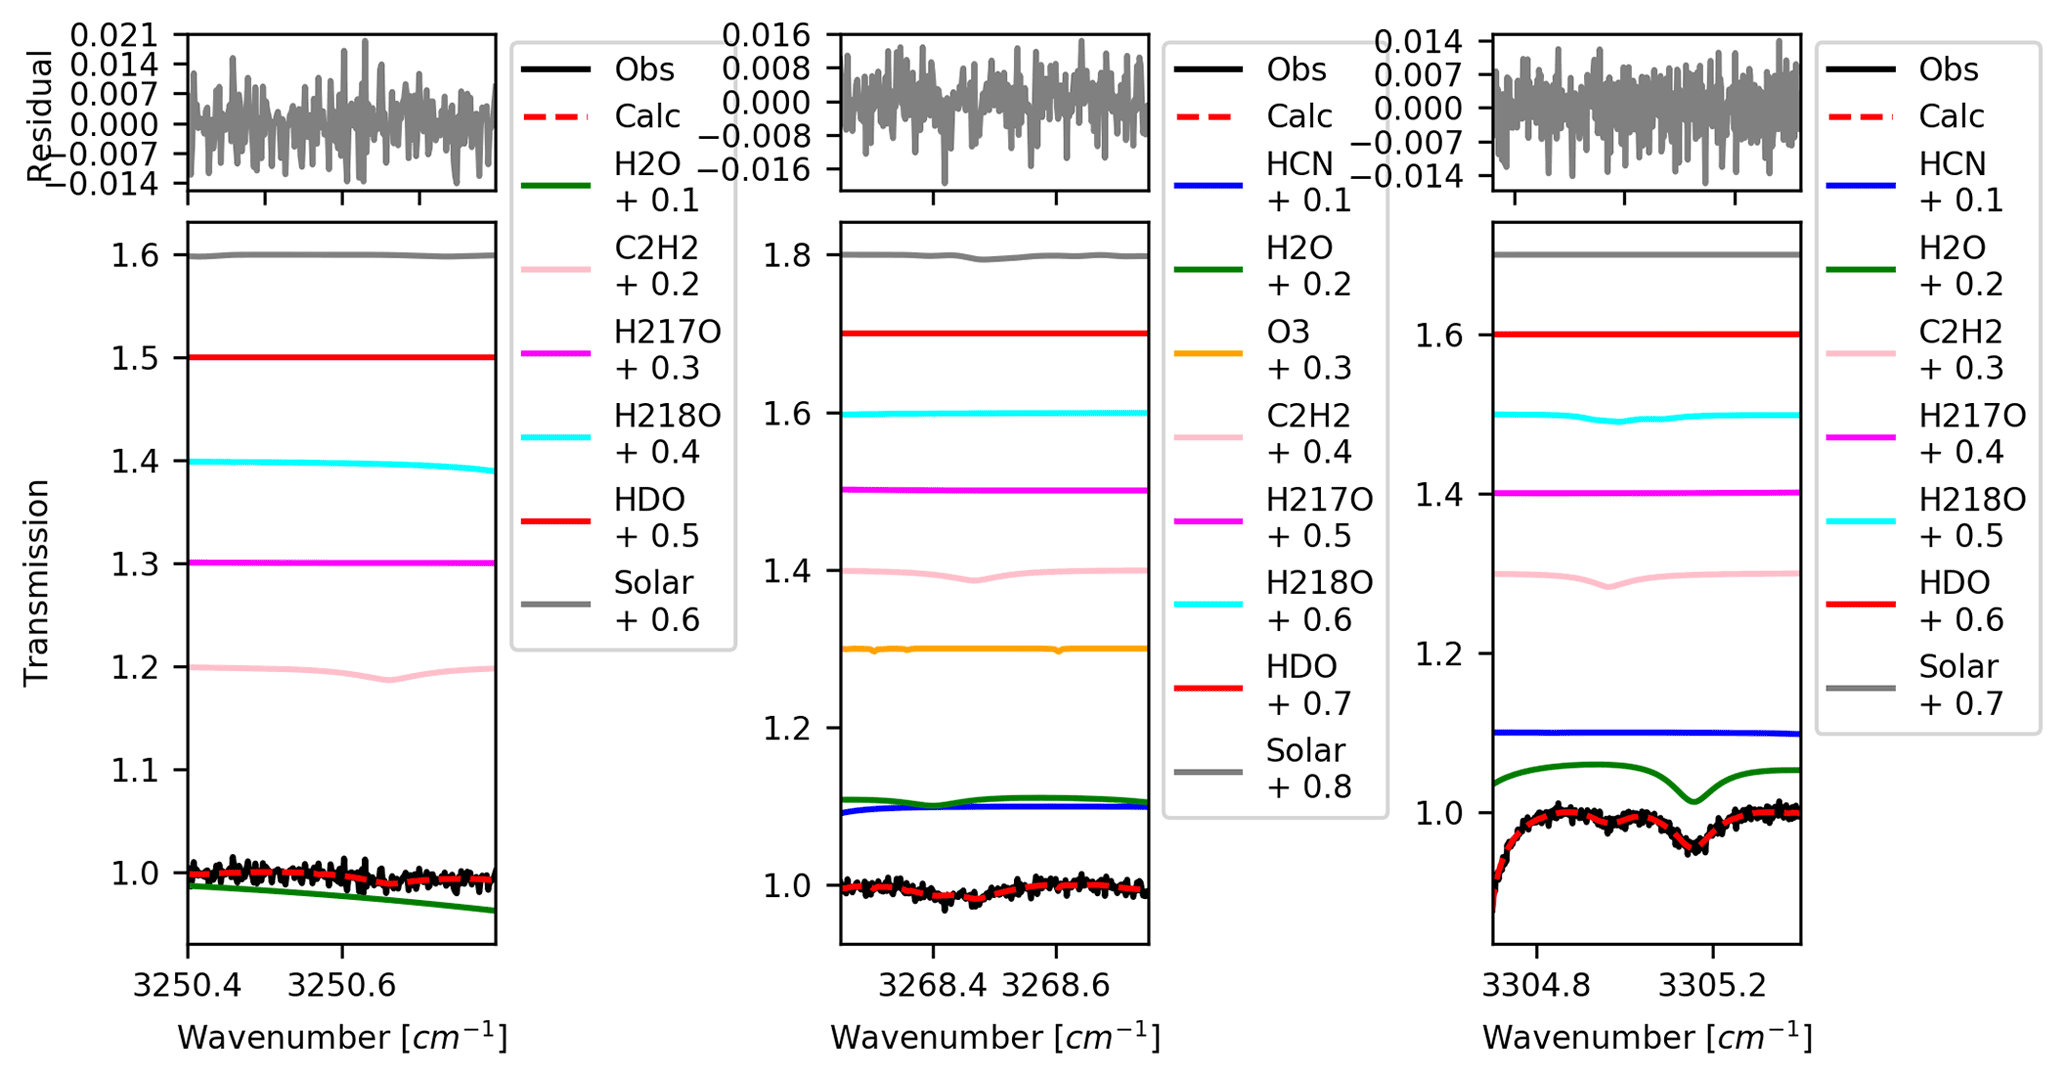
Figure 17Same as Fig. 8 but for C2H2, using a spectrum recorded at 17:18:07 UTC on 11 January 2019.
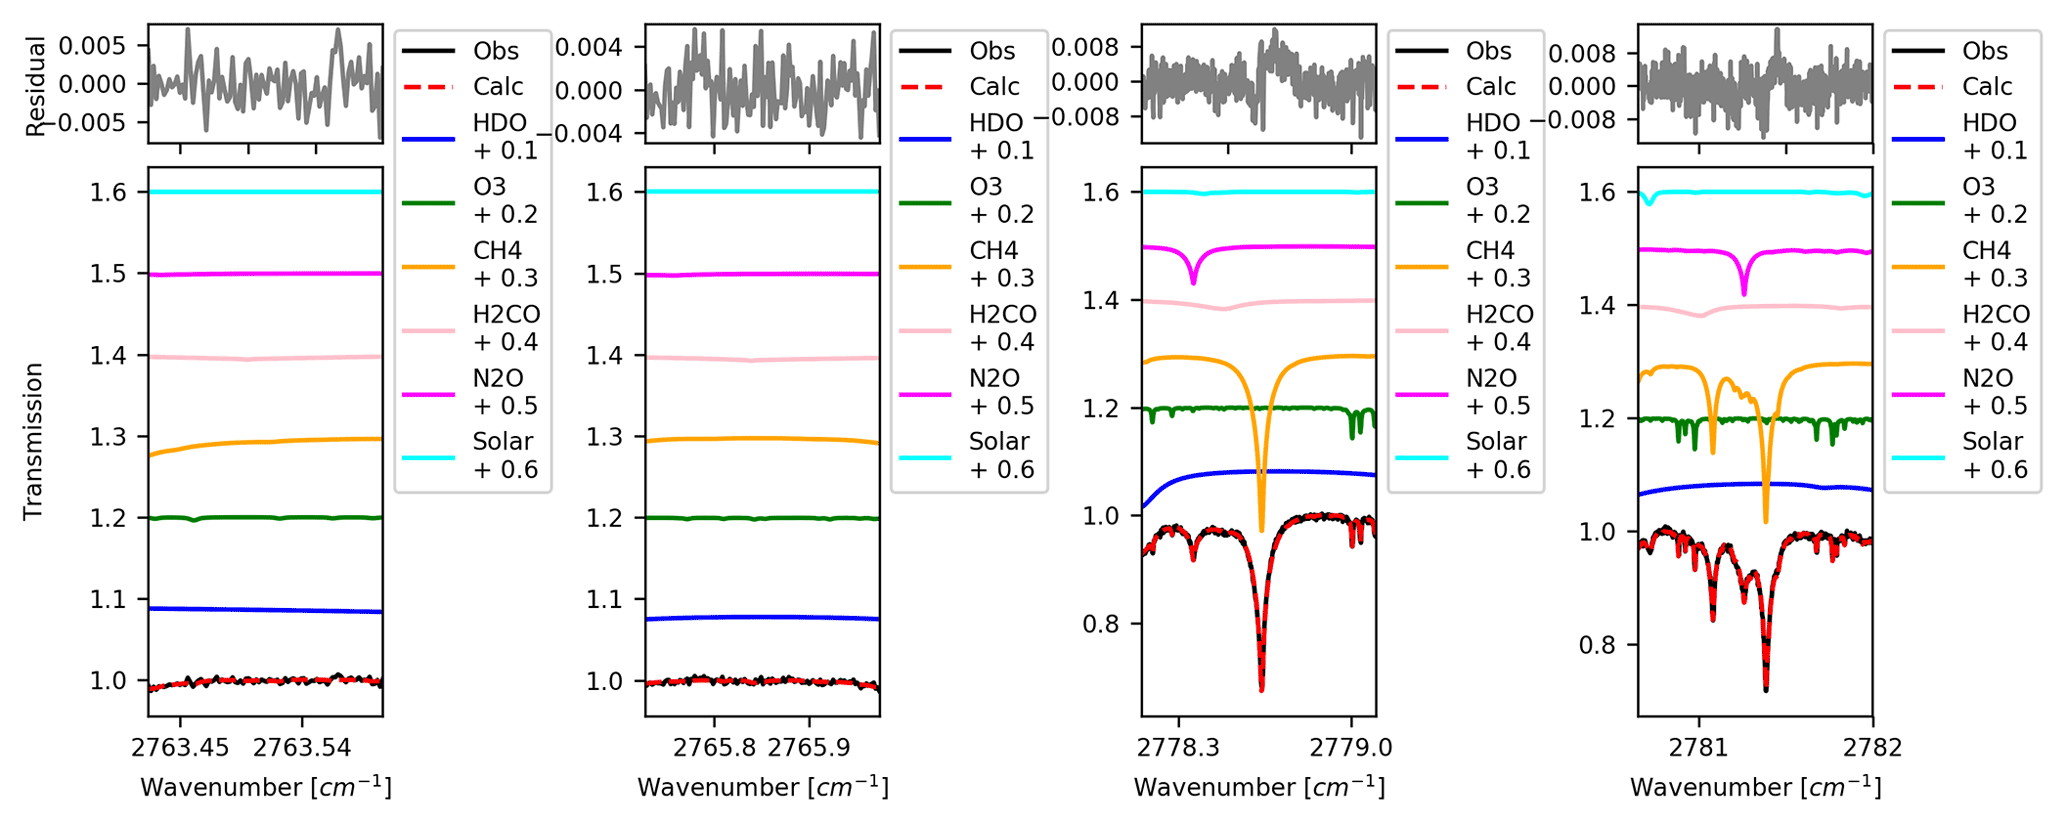
Figure 18Same as Fig. 8 but for H2CO, using a spectrum recoded at 15:55:17 UTC on 15 July 2019.
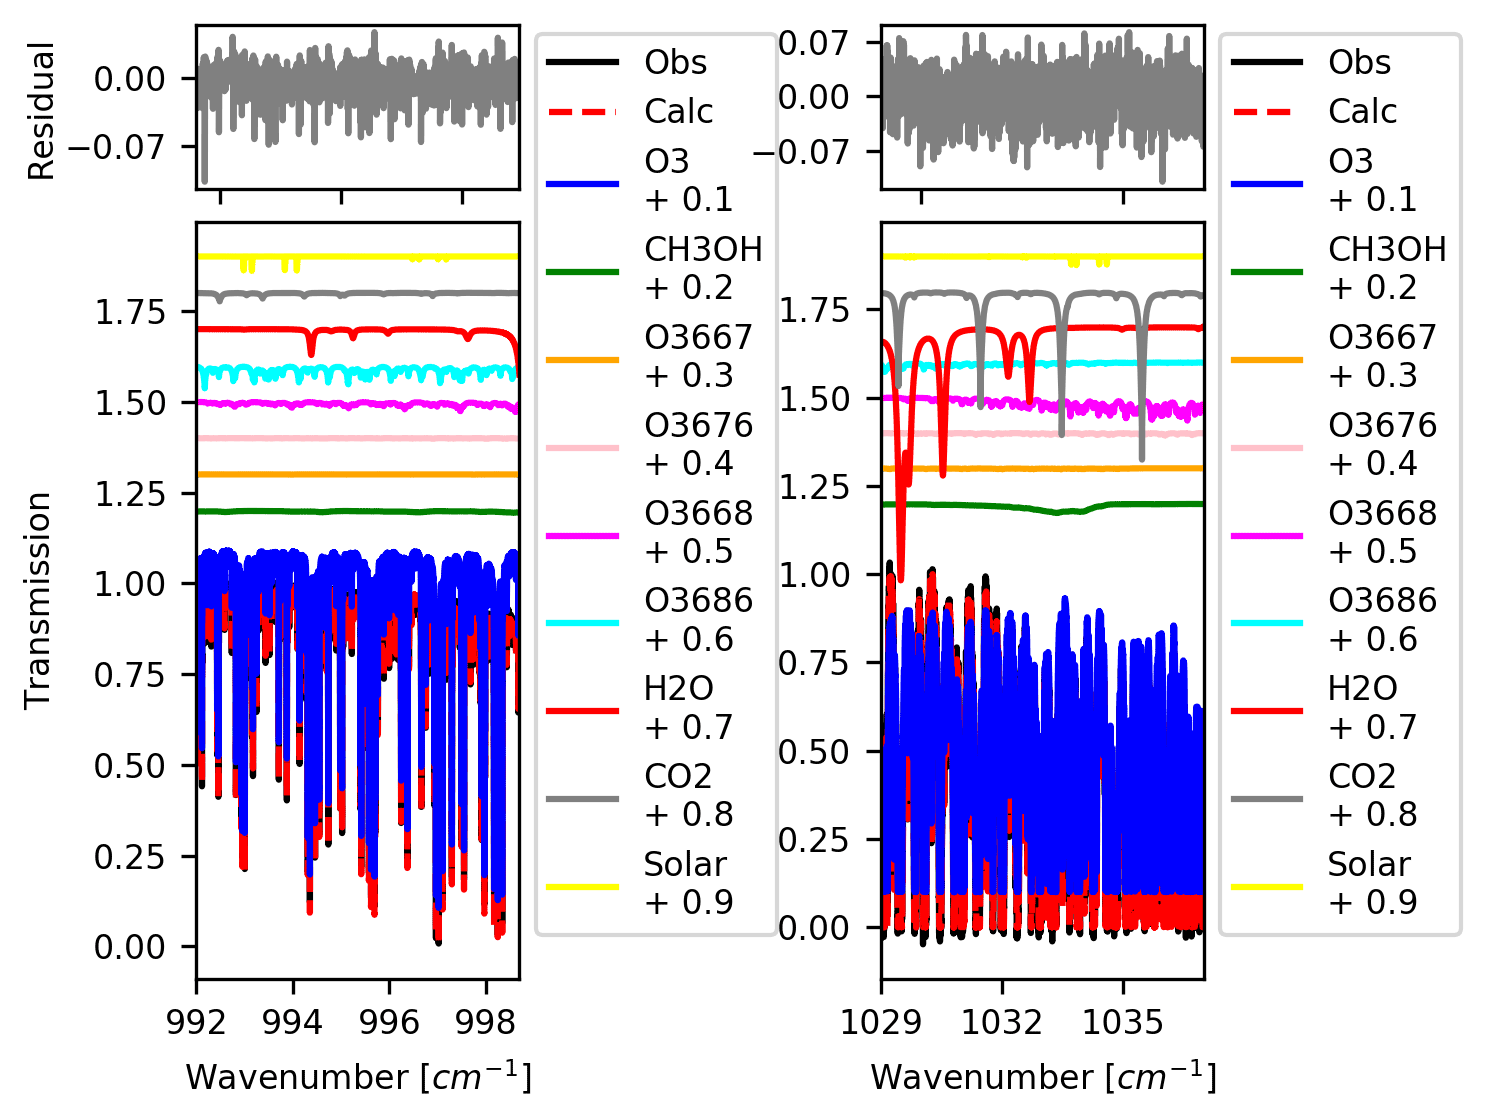
Figure 19Same as Fig. 8 but for CH3OH, using a spectrum recorded at 15:54:25 UTC on 15 July 2019.
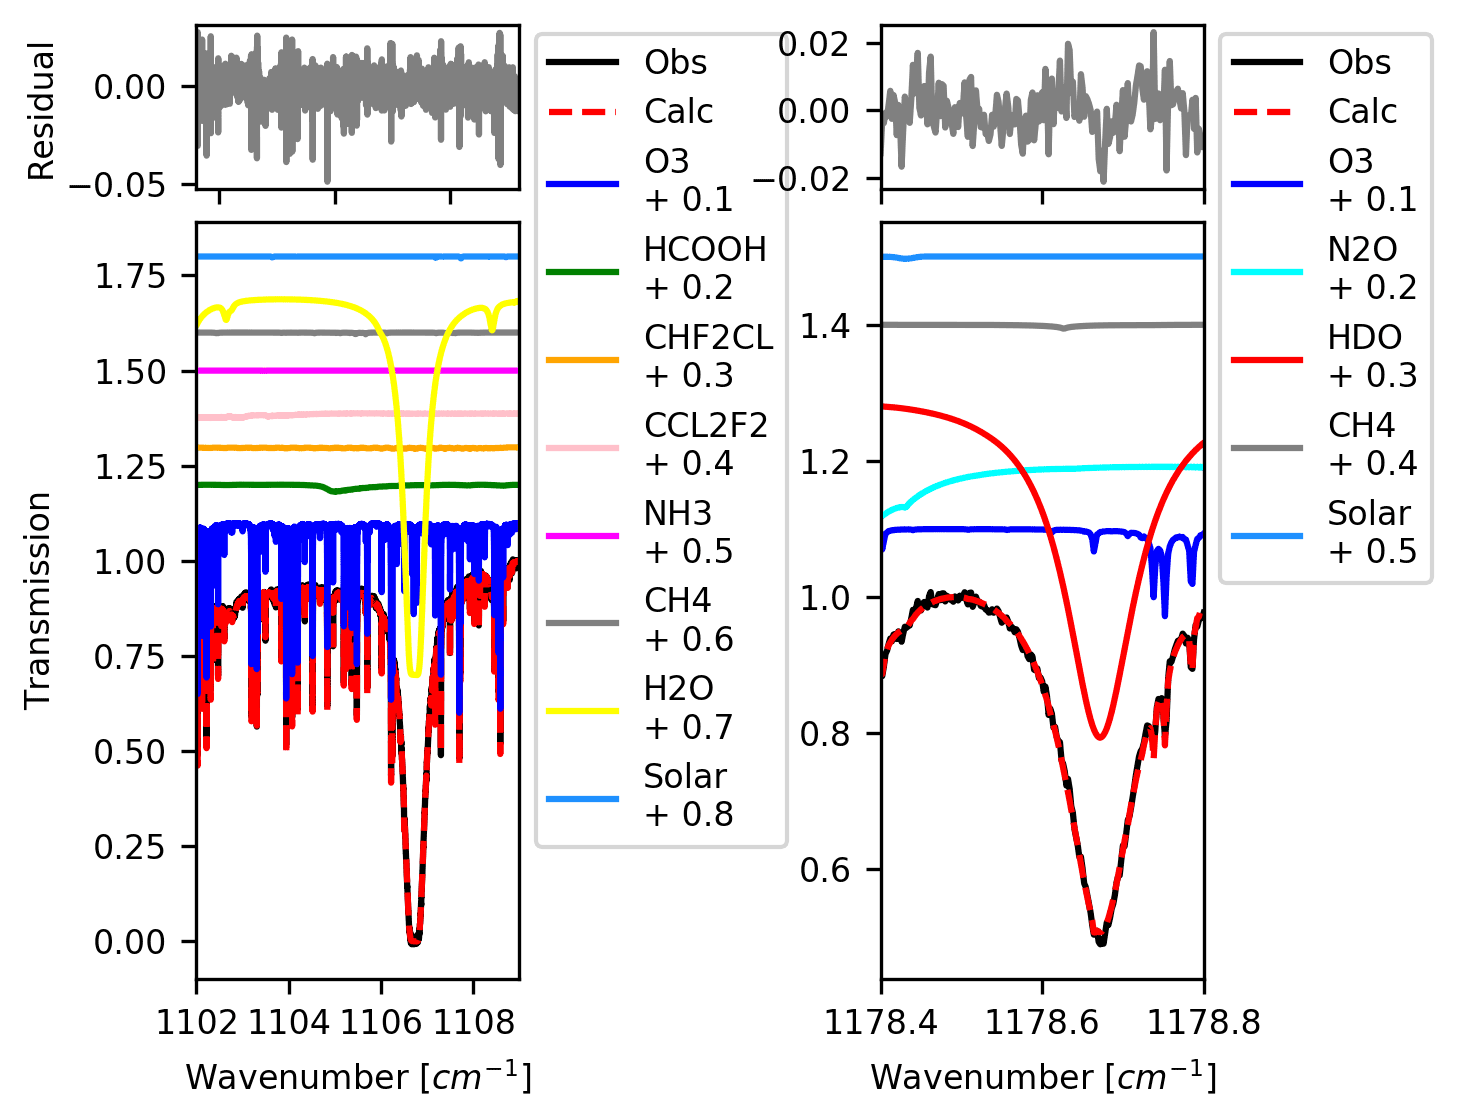
Figure 20Same as Fig. 8 but for HCOOH, using a spectrum recorded at 15:54:25 UTC on 15 July 2019.
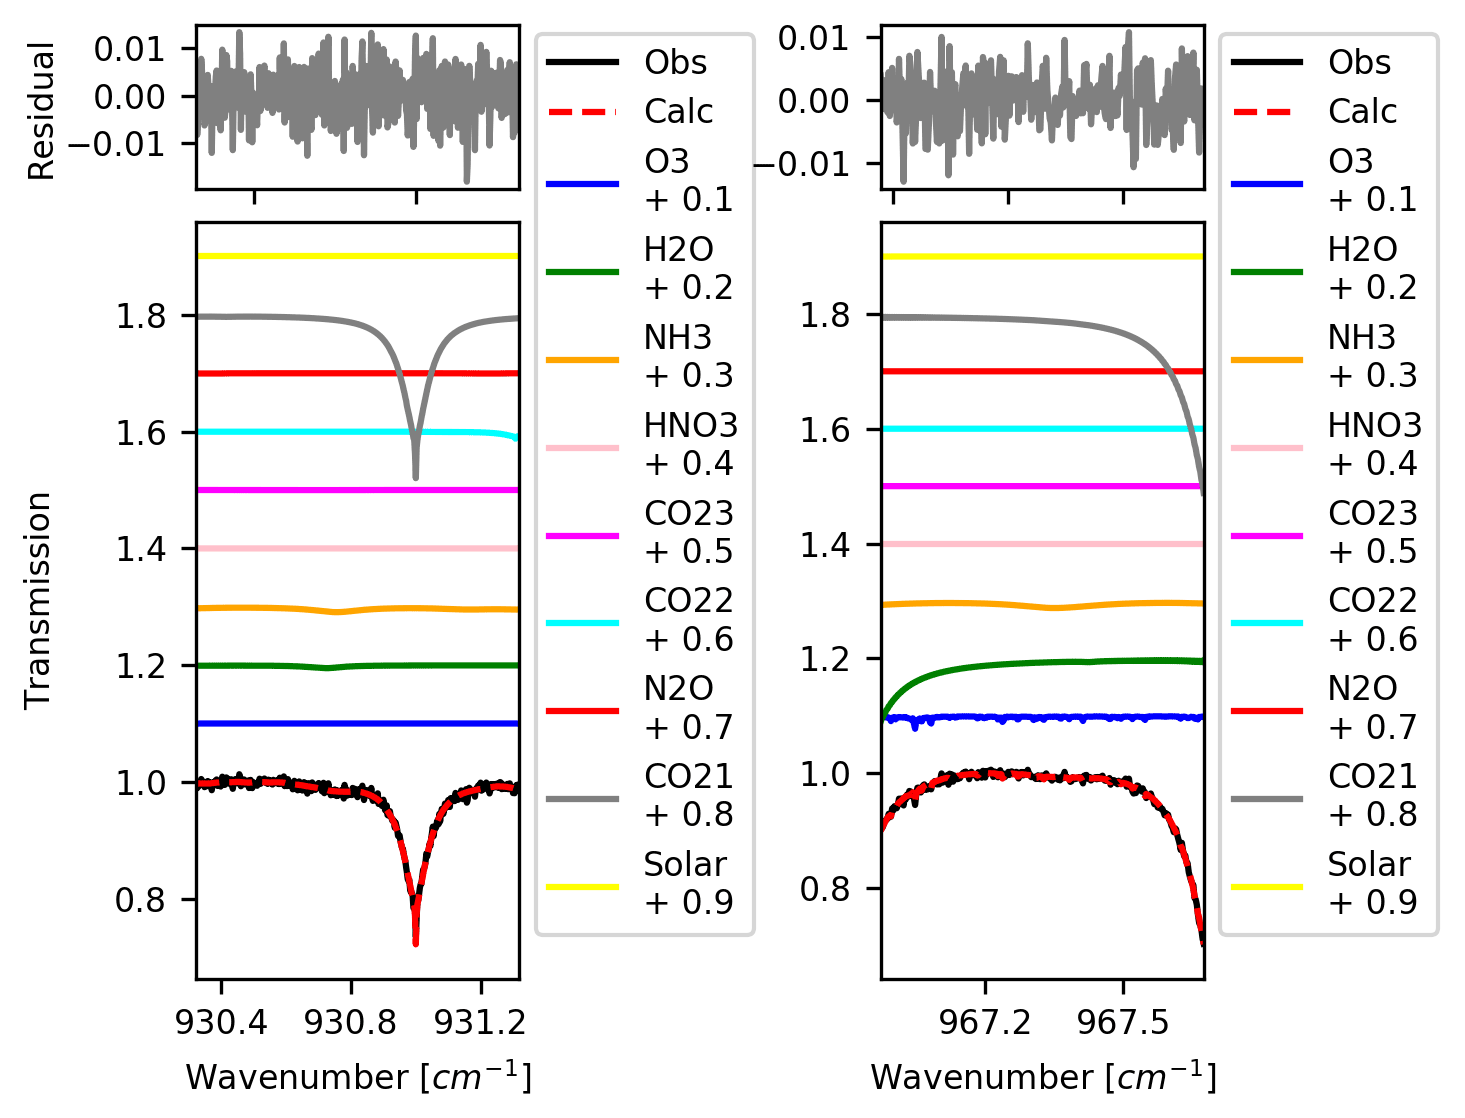
Figure 21Same as Fig. 8 but for NH3, using a spectrum recorded at 15:54:25 UTC on 15 July 2019.
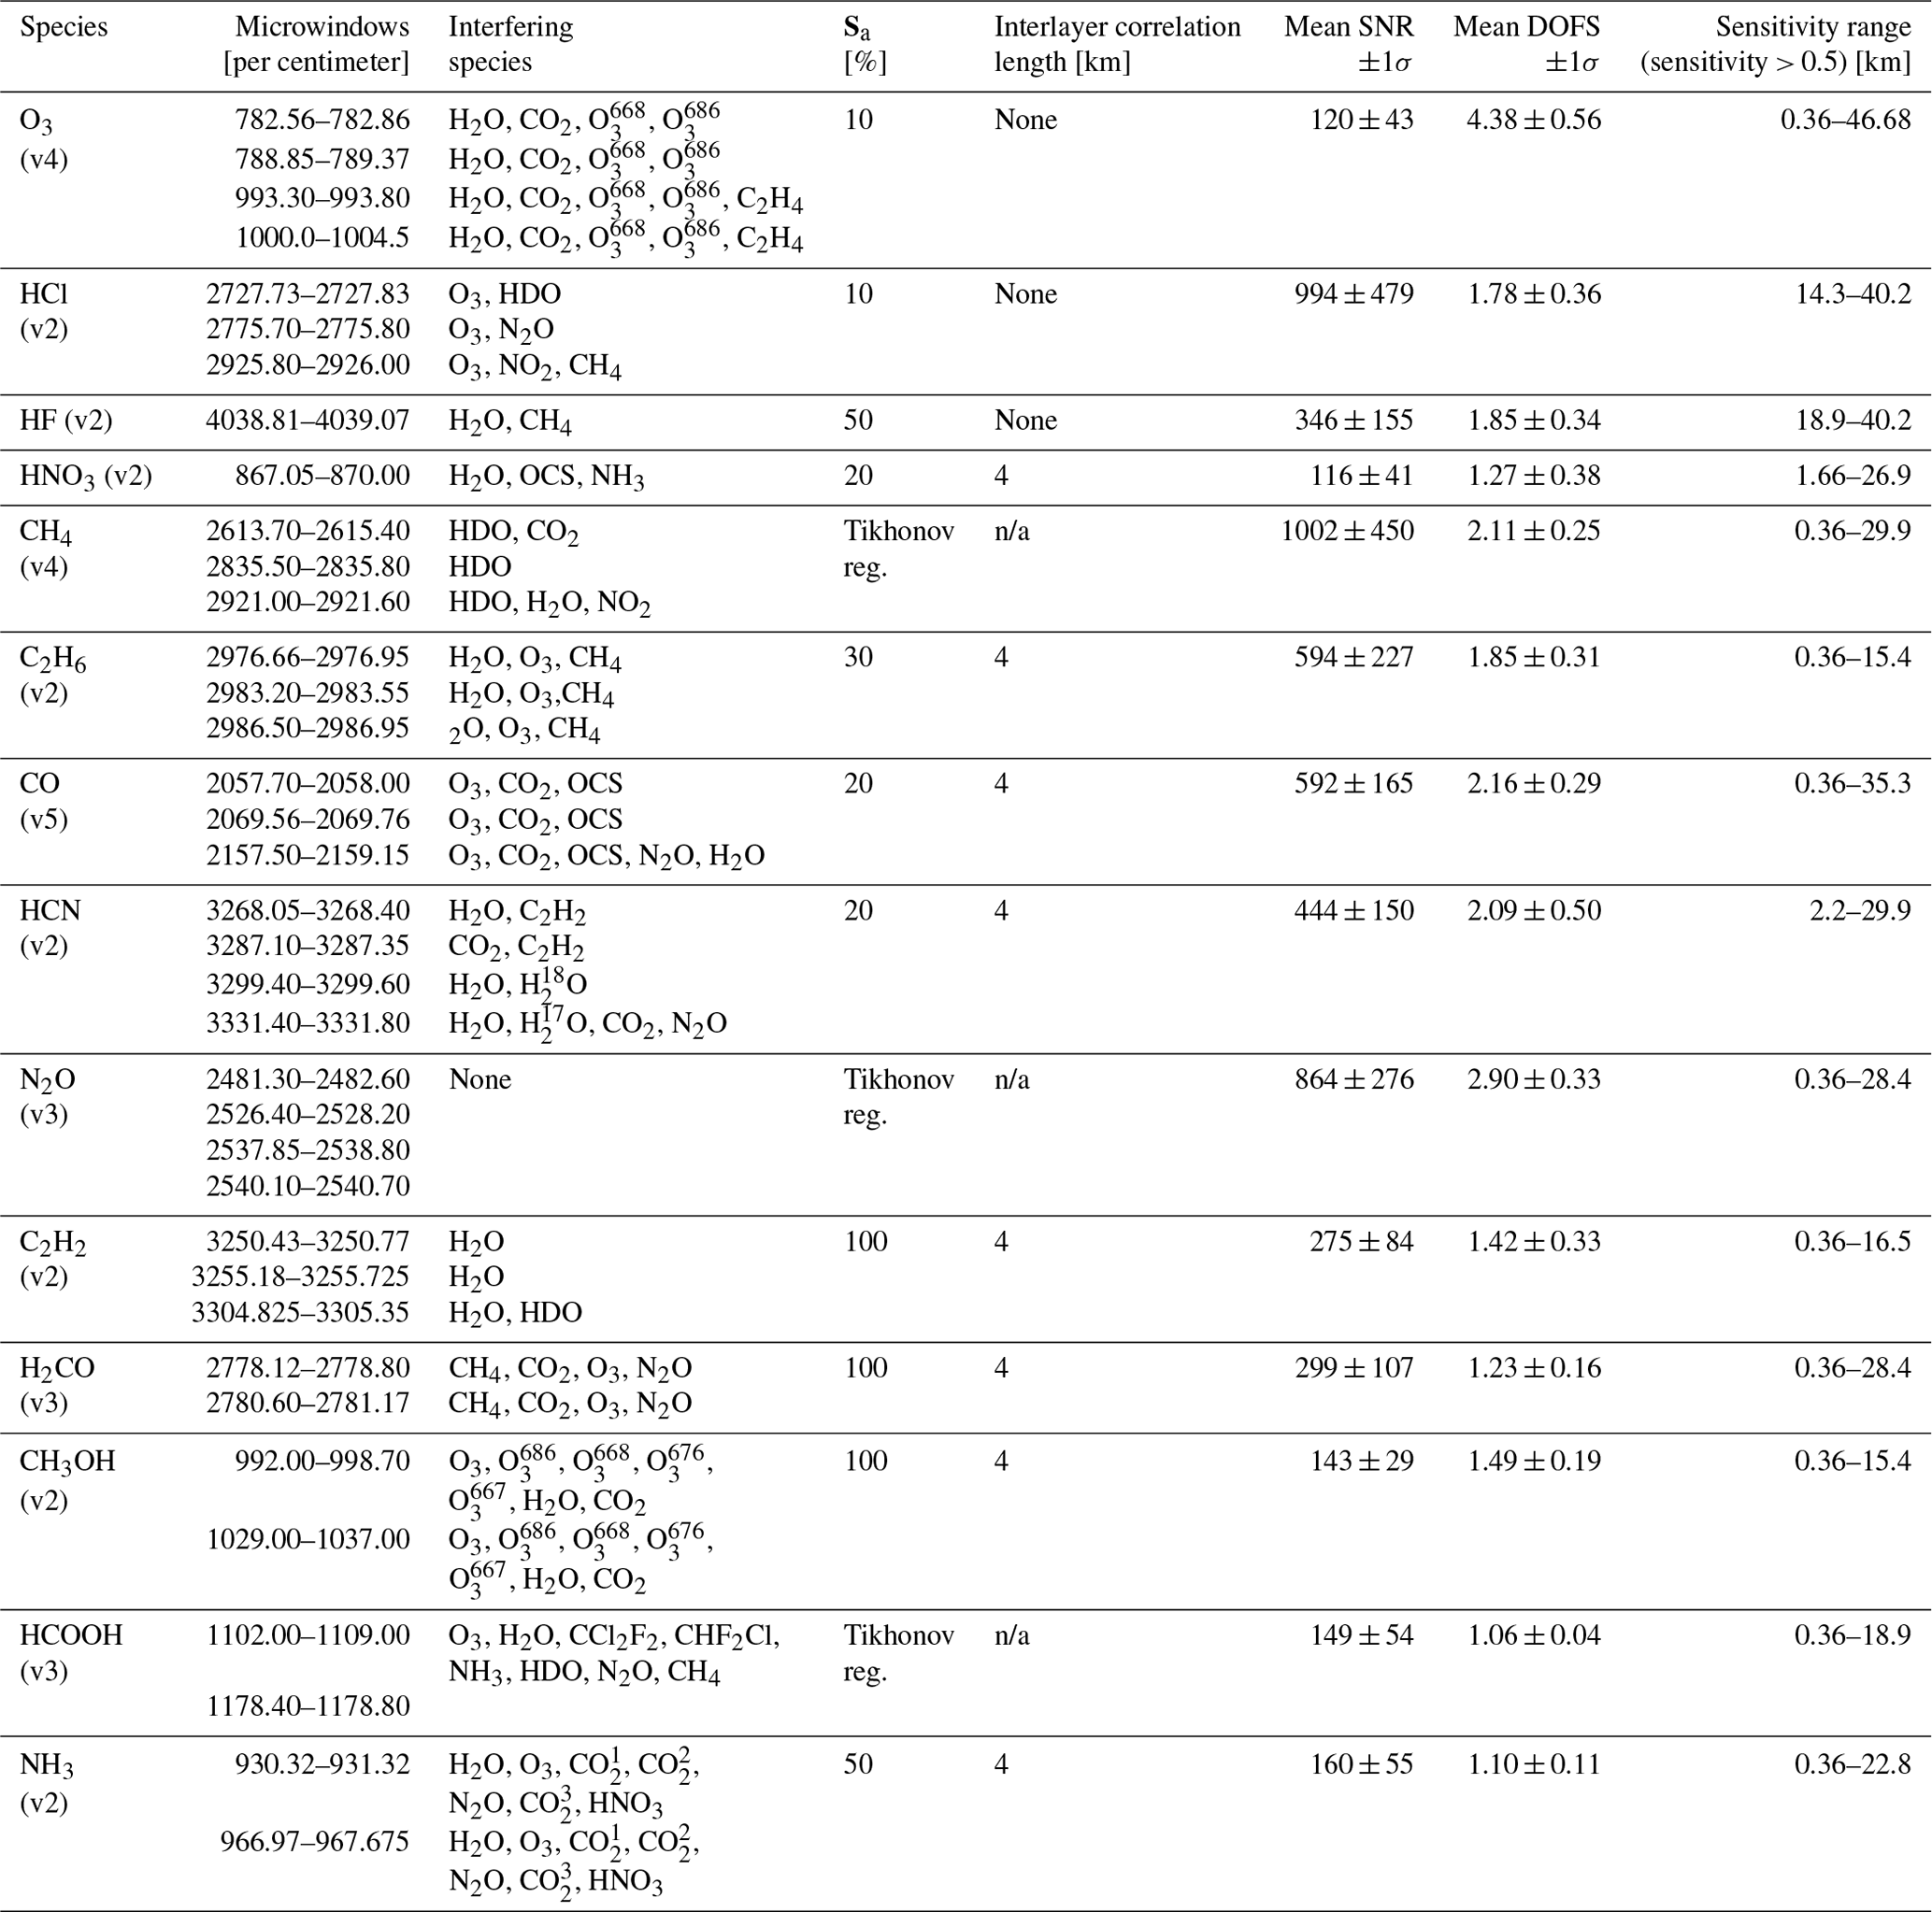
Table 2 lists the microwindows, interfering gases, retrieval parameters (descriptions of the a priori and measurement covariance matrices), and the resulting mean DOFSs for the total columns and the sensitivity range of the retrieved profiles over the entire dataset.
Table 2Summary of fitting parameters for TAO FTIR retrievals. Mean DOFSs are for the entire 2002–2020 dataset, and mean SNR is calculated with 1 year of data from 2019. The version numbers in the first column indicate the accompanying version of the data archived on Borealis and currently archived in the NDACC data repository. n/a – not applicable.
All retrieved profiles for the NDACC stratospheric species (O3, HCl, HF, HNO3), the NDACC tropospheric species (CH4, C2H6, CO, HCN, N2O), and the research products (C2H2, H2CO, CH3OH, HCOOH, NH3) are plotted in gray in Fig. 7. The profiles are retrieved on a 48-layer grid that spans from 0 to 120 km as prescribed by NDACC. The impact of vertical discretization of the atmosphere on modeled transmission spectra in the mid-infrared range was previously investigated by Wiacek and Strong (2008), who found that while systematic differences in modeled transmissions can be seen in most gases retrieved at TAO, some gases (such as O3) are more affected by vertical discretization than others.
The retrieval starts with the creation of a model atmosphere using meteorological information and a priori profiles of the target species, and interfering species, if any. The initial spectra for the selected microwindows (see Table 1) are calculated using the forward model, which encapsulates the physics of the measurement, i.e., the relationship at each height between gas concentration, optical depth, and transmission. This is calculated on a line-by-line basis assuming a Voigt line shape and accounting for instrumental line shape effects. Then, the profile of the trace gas of interest is iteratively adjusted; at each iteration step, the profile to be retrieved is adjusted, and the spectrum is calculated and compared to the measured spectrum. This iterative process is repeated until the calculated and measured spectra converge. Convergence criteria are determined by examining the chi-squared (χ2) value of the root mean square (rms) of the difference between the calculated and measured spectra.
The signal-to-noise ratio (SNR) of the measurements is the ratio of the maximum signal in the selected microwindow to the noise level for each spectrum (the standard deviation of the zero-level signal in a microwindow) and provides a measure of the quality of the spectrum. The SNR is used to define the diagonal elements of the measurement covariance matrix: Sε, i.e., Sεii= 1SNR2 (Wiacek et al., 2007). SNR is calculated individually for each of the filters discussed in Sect. 2.1, and the spectral windows used to calculate the SNR for each filter are listed in Table 1. The mean SNR for the set of microwindows used for the retrievals for each species is included in Table 2.
The a priori covariance matrix, Sa can be directly specified in the input files for running SFIT4. This matrix should capture the natural variability in the profile of the retrieved species and can be used as a tuning parameter of the retrieval. Sa is typically a diagonal matrix, with the diagonal elements defined as the expected spread in the trace gas profile for that particular region of the atmosphere. It is usually expressed as a percentage value. In some cases, it also includes off-diagonal elements that are determined by the interlayer correlation length. The interlayer correlation is modeled as an exponential function with a half-width equal to the correlation length and is included in Table 2. A correlation length of 4 km is typically used in these retrievals and is an average value derived from the HALogen Occulatation Experiement (HALOE) climatology (Wiacek et al., 2007). Off-diagonal elements are added to a priori covariance matrix primarily for tropospheric species or in cases for which the inclusion of these elements results in notable improvement to the smoothness of the retrieved profile, without affecting total-column values.
The averaging kernels characterize the sensitivity of the retrieved profile to the true profile and provide information about the vertical resolution of the retrievals (Rodgers, 2000). The rows of the averaging kernel matrix, A, are plotted for all 14 species in Fig. 22. In the top row of Fig. 22, the volume mixing ratio averaging kernels are plotted in units of ppmv / ppmv. The averaging kernels can also be used to define the independent partial columns that can be derived from the FTIR measurements. The trace of the averaging kernel matrix is referred to as the degrees of freedom for signal and determines the number of independently resolved pieces of information present in retrieved profile. The mean DOFSs for all retrieved profiles from 2002 to 2020 for each species are listed in the seventh column of Table 2.
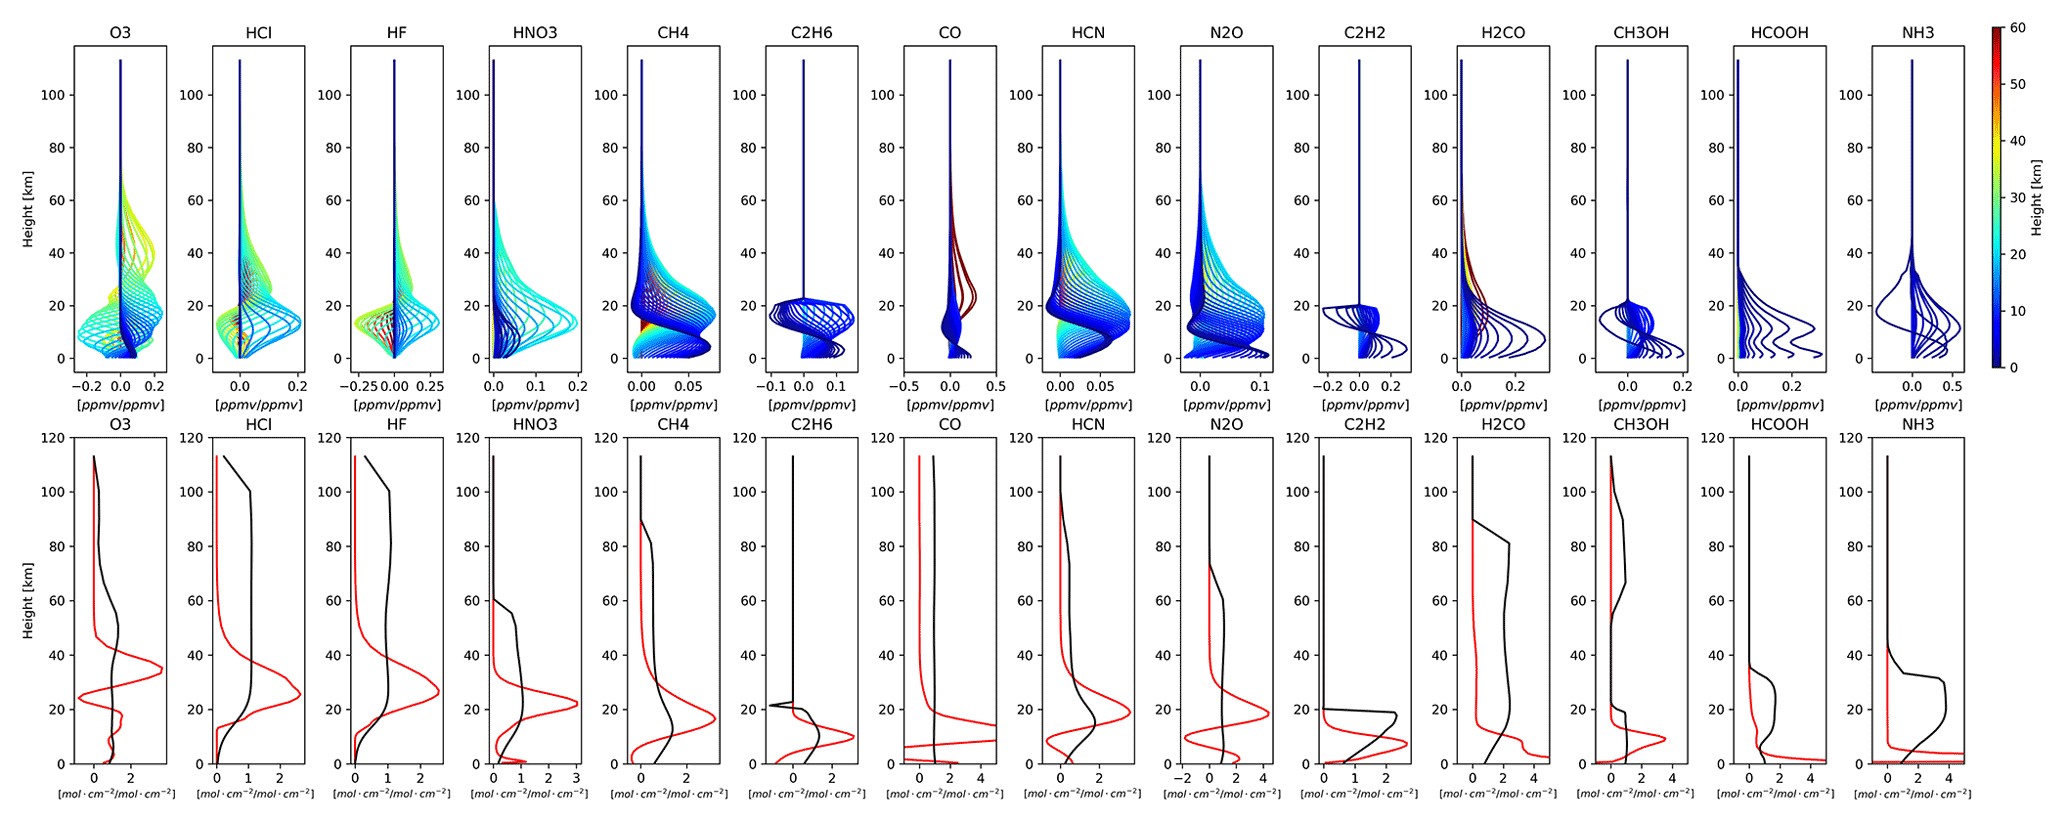
Figure 22Mean averaging kernels for O3, HCl, HF, HNO3, CH4, C2H6, CO, HCN, N2O, C2H2, H2CO, CH3OH, HCOOH, and NH3 from 2002 to 2020. Top row: Averaging kernels in ppmv / ppmv units. Bottom row: Sensitivity in red and the total-column averaging kernel in black in molec. cm−2 / molec. cm−2 units.
In the bottom row of Fig. 22, the so-called “sensitivity” profiles (Vigouroux et al., 2008), and the total-column averaging kernels are plotted in units of molec. cm−2 / molec. cm−2. The sensitivity at a given height is the sum of the elements in the row of the corresponding averaging kernel. In the OEM formulation, the sensitivity describes the balance between information provided by the measurement and information derived from the a priori. A value of 1 indicates that the retrieved state is completely independent of the a priori, while a value of 0 indicates the opposite. An ideal sensitivity profile would be 1 at all heights. The sensitivity profiles for the species retrieved at TAO all show regions of independence from the a priori profile. Regions where the sensitivity is greater than 0.5 for each species are listed in the final column of Table 2. In these regions, more than 50 % of the retrieved profile information comes from the measurement.
3.2 Error analysis
The uncertainties in each retrieved atmospheric profile are determined following the methodology presented in Rodgers (1976, 1990). The measurement error (Sm) and forward model errors (Sf) are calculated as described in those references:
where Sε is the previously introduced measurement covariance matrix, Kb is Jacobian matrix for the vector of forward model parameters, b, and Sb is the covariance error matrix for b. G is the gain matrix:
where Sa is the a priori covariance matrix previously alluded to and K is the weighting function matrix that relates the measurement state to the true state, i.e., the forward model discussed previously.
The forward model errors considered here are the solar zenith angle error (Ssza), the line parameter errors (Sline), and the temperature profile errors. For each forward model error, a covariance matrix is created to describe the best estimate of uncertainty in the parameter. These forward model covariance matrices are discussed below. The interference error (Sint), described in Rodgers and Connor (2003) as the error that accounts for uncertainties in the simultaneously retrieved interfering gases and retrieval parameters (Sret) such as wavelength shift, background slope, solar line shift, and phase error, is included in our error calculation.
The smoothing error Ss is not included in the error calculation as per the recommendation of the NDACC IRWG. The smoothing error describes the error induced by using a finite layering grid and thus is considered to be intrinsic with this method of retrieval (von Clarmann, 2014). Data users can calculate the smoothing error as appropriate for their application using the following equation:
where A is the averaging kernel, archived with every retrieval; I is the identity matrix; and Sx is the covariance matrix of the true atmospheric state around the mean state. Sx can be estimated based on climatology.
The errors are divided into two types: systematic (Ssys) and random errors (Sran). Measurement error, solar zenith angle error, retrieval parameter error, and the interference error are considered to be random and the line parameter errors are considered to be systematic. The temperature error has both a random (Stemp_r) and a systematic (Stemp_s) component. The total systematic and random errors are determined by adding all components in quadrature, and both the covariance matrix and total-column uncertainty (in molec. cm−2) for each of these components of the total error are included in the archived Hierarchical Data Format (HDF) files:
The solar zenith angle (SZA) uncertainty relates to the calculation of the air mass, as the SZA describes the line of sight of the instrument and thus the path of the light through the atmosphere. For the air mass calculation, it is assumed that the solar tracker is pointing directly at the center of the sun. There are three aspects to this error: the uncertainty in the SZA calculation (which is based on the measurement time), the uncertainty in the pointing of the solar tracker, and the change in the SZA over the scan time of the measurement. To achieve a higher SNR, four spectra are averaged (co-added), resulting in a total scan time of 20 min at 0.5 cm s−1 (scanning speed from 2001 to 7 March 2014) and 10 min at 1 cm s−1 (scanning speed from 8 March 2014 to 2016). In 20 min, the average change in SZA throughout the day, averaged across the entire year at the Toronto site is 0.86∘, and in 10 min the average change is 0.43∘. The uncertainty caused by the variation in the SZA outweighs any uncertainty caused by the two other aspects of this error. Thus a variance of 0.86∘ is used for the solar zenith angle uncertainty from 2001 to 7 March 2014 and 0.43∘ from 8 March 2014 to 2020.
Three values describe the line parameters in the forward model, each with its own uncertainty: the line intensity, the temperature dependence uncertainty, and the pressure-broadened half-width. The uncertainties in the respective covariance matrices are based on the errors provided in HITRAN. When an uncertainty range is given in HITRAN 2008 (Rothman et al., 2009), the average of the range is used, and when no value is provided, an uncertainty of 20 % is assumed. The line parameter uncertainties for each species are listed in Table 3. For CO, CH4, and O3, the uncertainty analyses were done using a consolidated methodology (standardized by NCAR; https://github.com/NCAR/sfit-processing-environment, last access: 4 July 2023) to meet the standards set for contributing to the CAMS RD system.
Table 3HITRAN 2008 parameter uncertainties used for the error analysis (Rothman et al., 2009), for all archived species. For CO, CH4, and O3, the retrievals were done using the CAMS RD retrieval methodology (see Sect. 3.2 for more details).
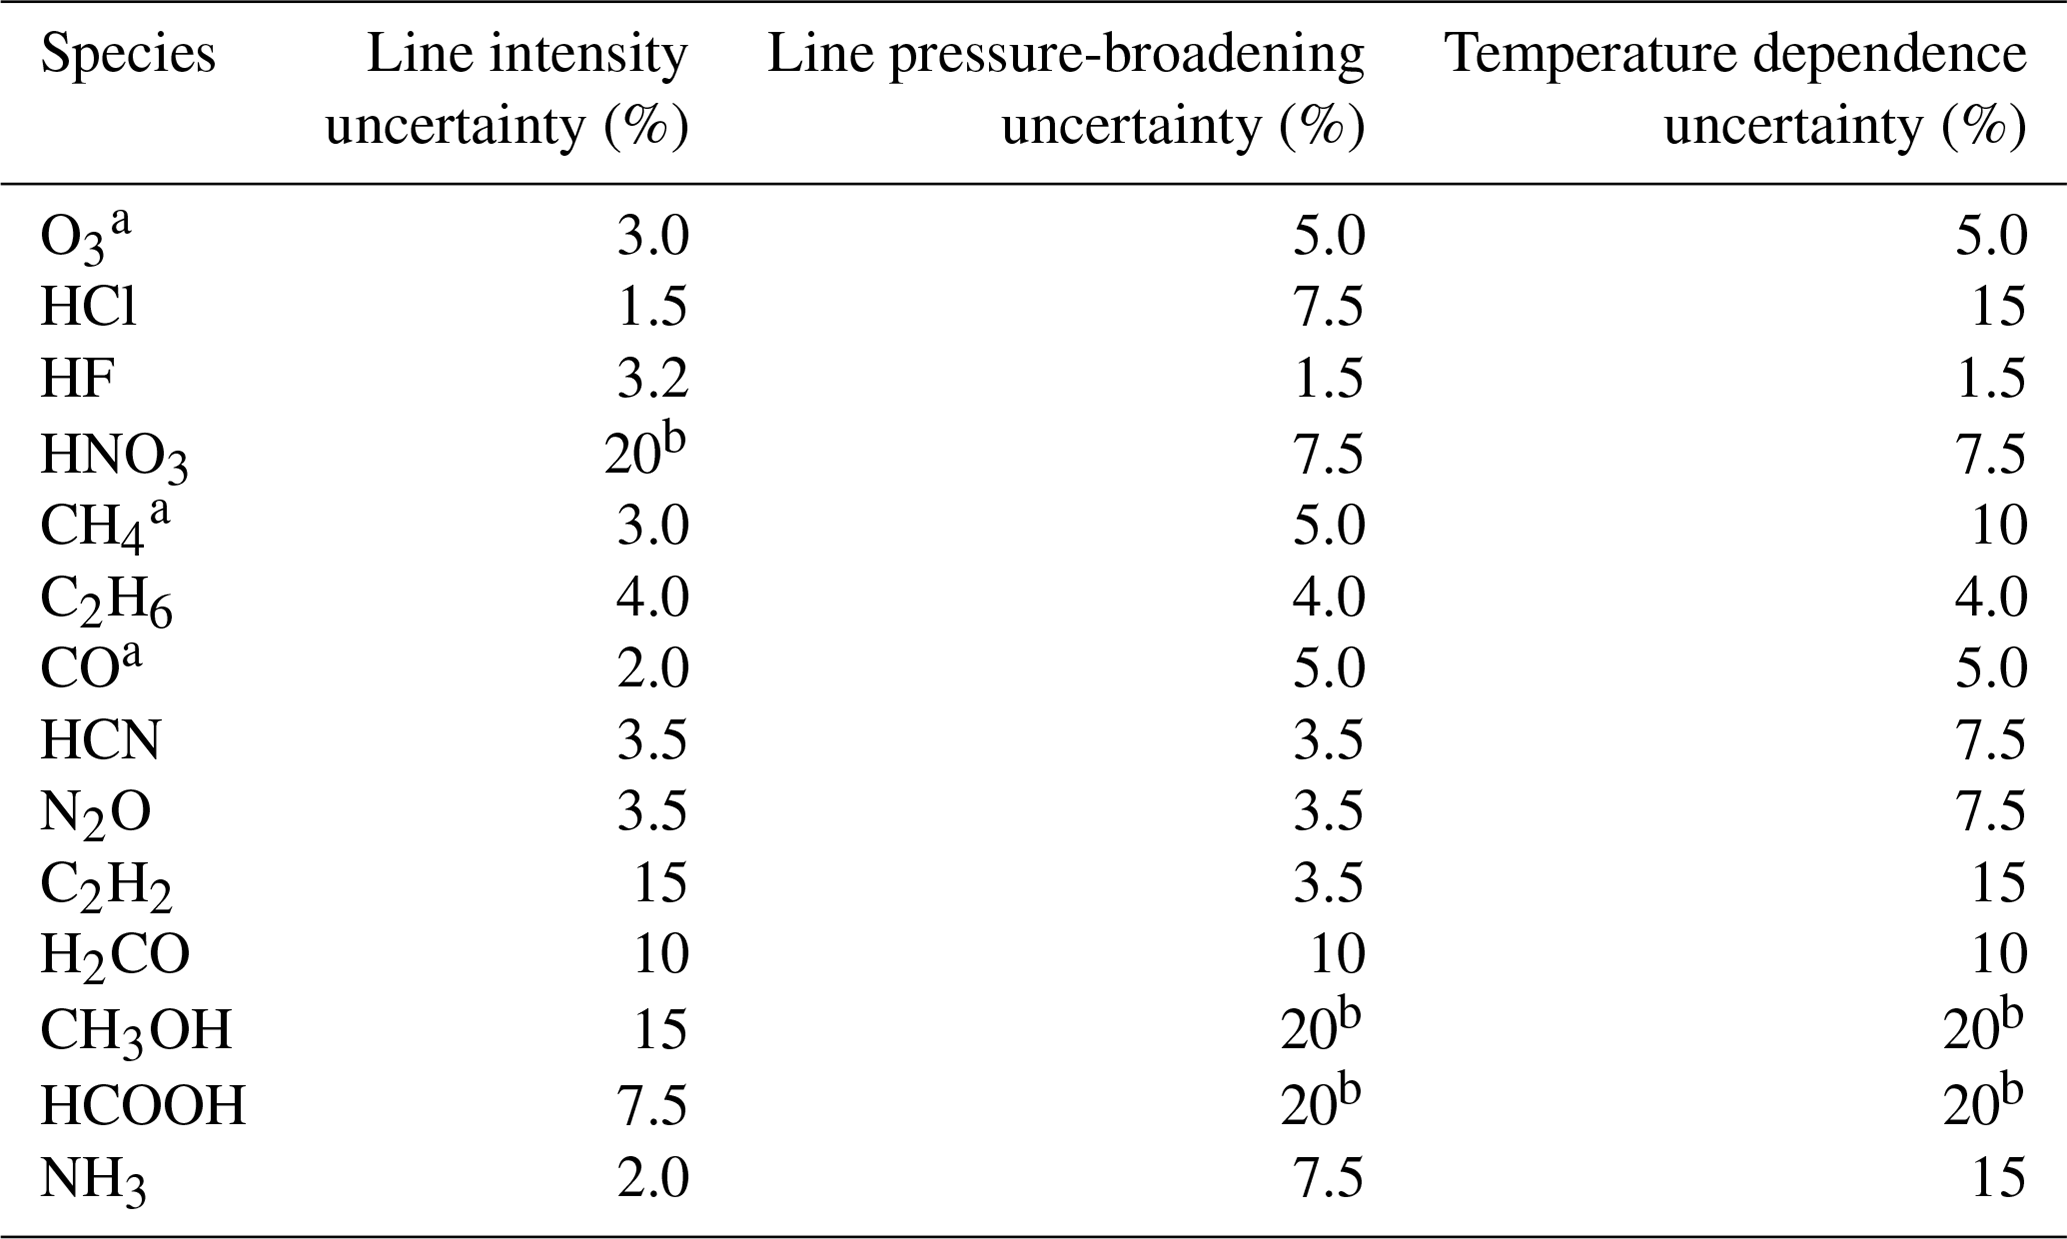
a CAMS RD retrieval methodology. b Assumed value.
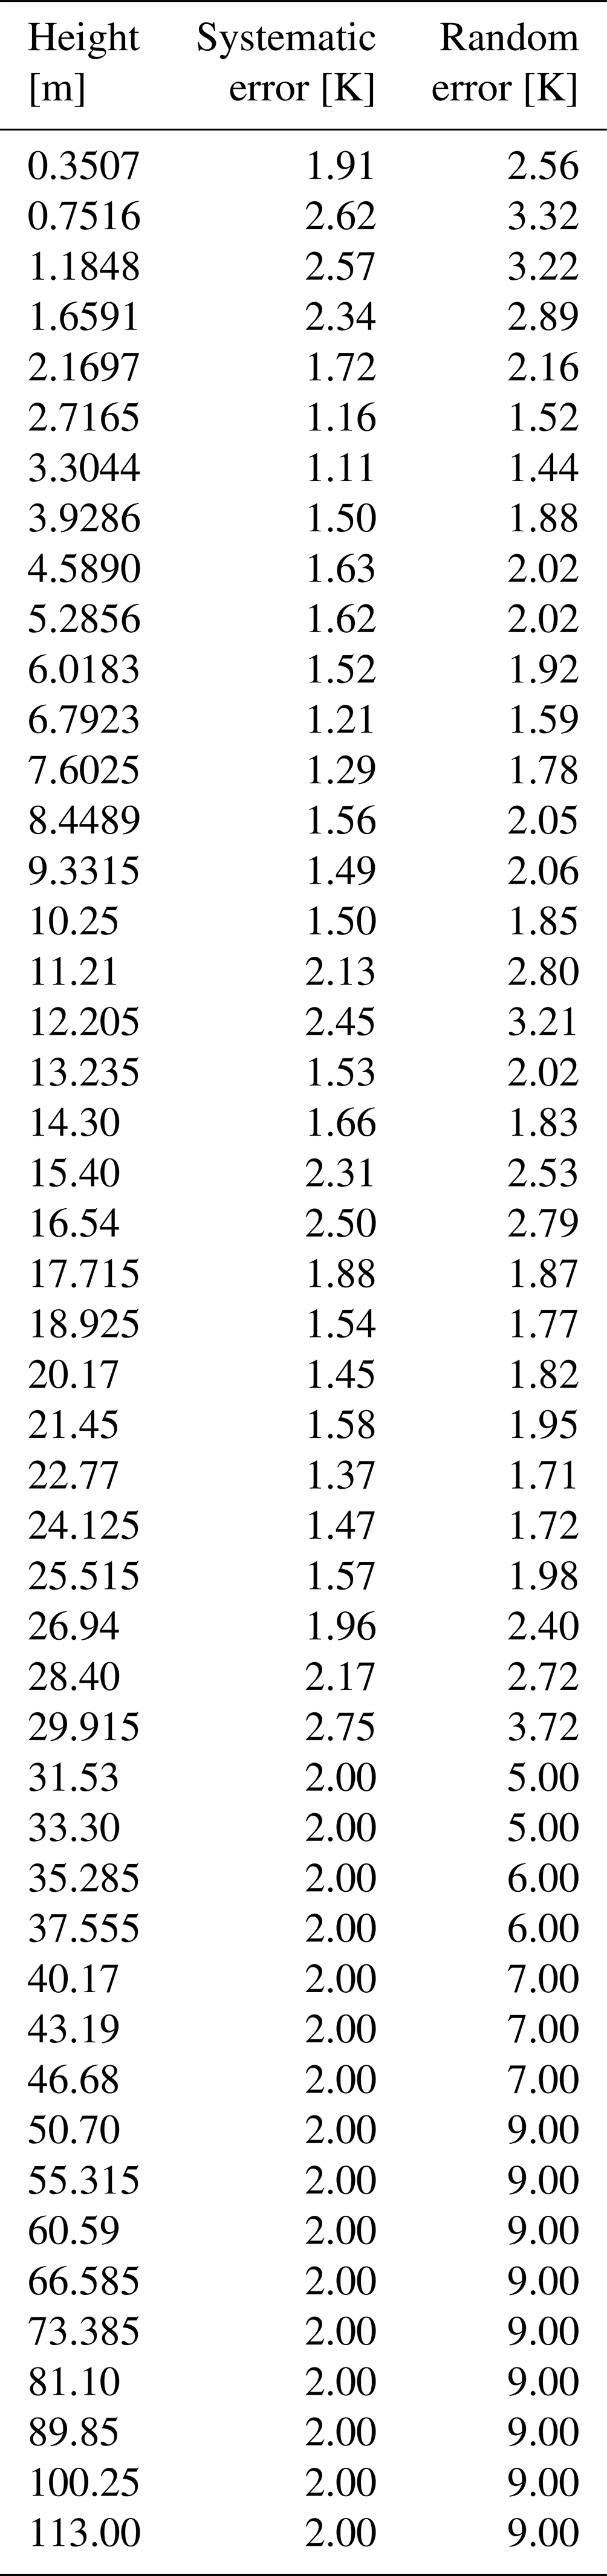
As mentioned above, the temperature error has both a systematic and a random component, thus requiring both systematic and random covariance matrices. The uncertainty in the NCEP temperature profile used in the retrieval is determined by comparing all the radiosonde measurements for a given year to the daily NCEP profile at Toronto corresponding to the radiosonde launch date. The average difference is taken as the systematic uncertainty and the standard deviation of the differences as the random uncertainty. The nearest radiosonde site to TAO is the Buffalo Niagara International airport (42.56∘ N, 78.44∘ W; 215 m a.s.l.), 145 km away and across Lake Ontario, and the measurements compared are for the year 2010. Radiosonde temperature measurement accuracies decrease above 30 km (Luers and Eskridge, 1995); therefore, we use the mean value for the systematic error from 0.55 to 29.14 km for the systematic error and the NCEP error for the random error above this height. The calculated values at 0.174 km were replaced with mean uncertainties from 0.55 to 29.14 km in an attempt to mitigate the effect of the difference in location between the radiosonde measurement and the NCEP profile. The resulting systematic and random forward model temperature uncertainties can be found in Table 4.
Table 4Systematic and random forward model temperature uncertainties, derived from comparison between NCEP daily temperature profiles at Toronto and radiosonde data from Buffalo for 2010, used for error analysis.
Vertical profiles of the mean systematic and random errors from 2019 are shown in Fig. 23 for each gas, along with profiles of the individual error terms as described above. For some species, one of the sources of error clearly dominates, such as the SZA uncertainty for CH4, while for others, such as O3, all the sources of error are of the same order of magnitude. Since the error profiles presented here are based solely on the diagonal variance terms of the error covariance matrices, it is most useful to view them qualitatively: they can be used to get a sense of the magnitude of the errors, the scope of the different uncertainty sources, and the height regimes that are most uncertain. An interlayer correlation length is used to model the off-diagonal elements of the error matrices, as is the case for the a priori covariance matrix. The full error covariance matrices (one for systematic errors and one for random errors) are provided in the HDF file for each measurement and should be used to calculate the estimated errors for the total and partial columns.
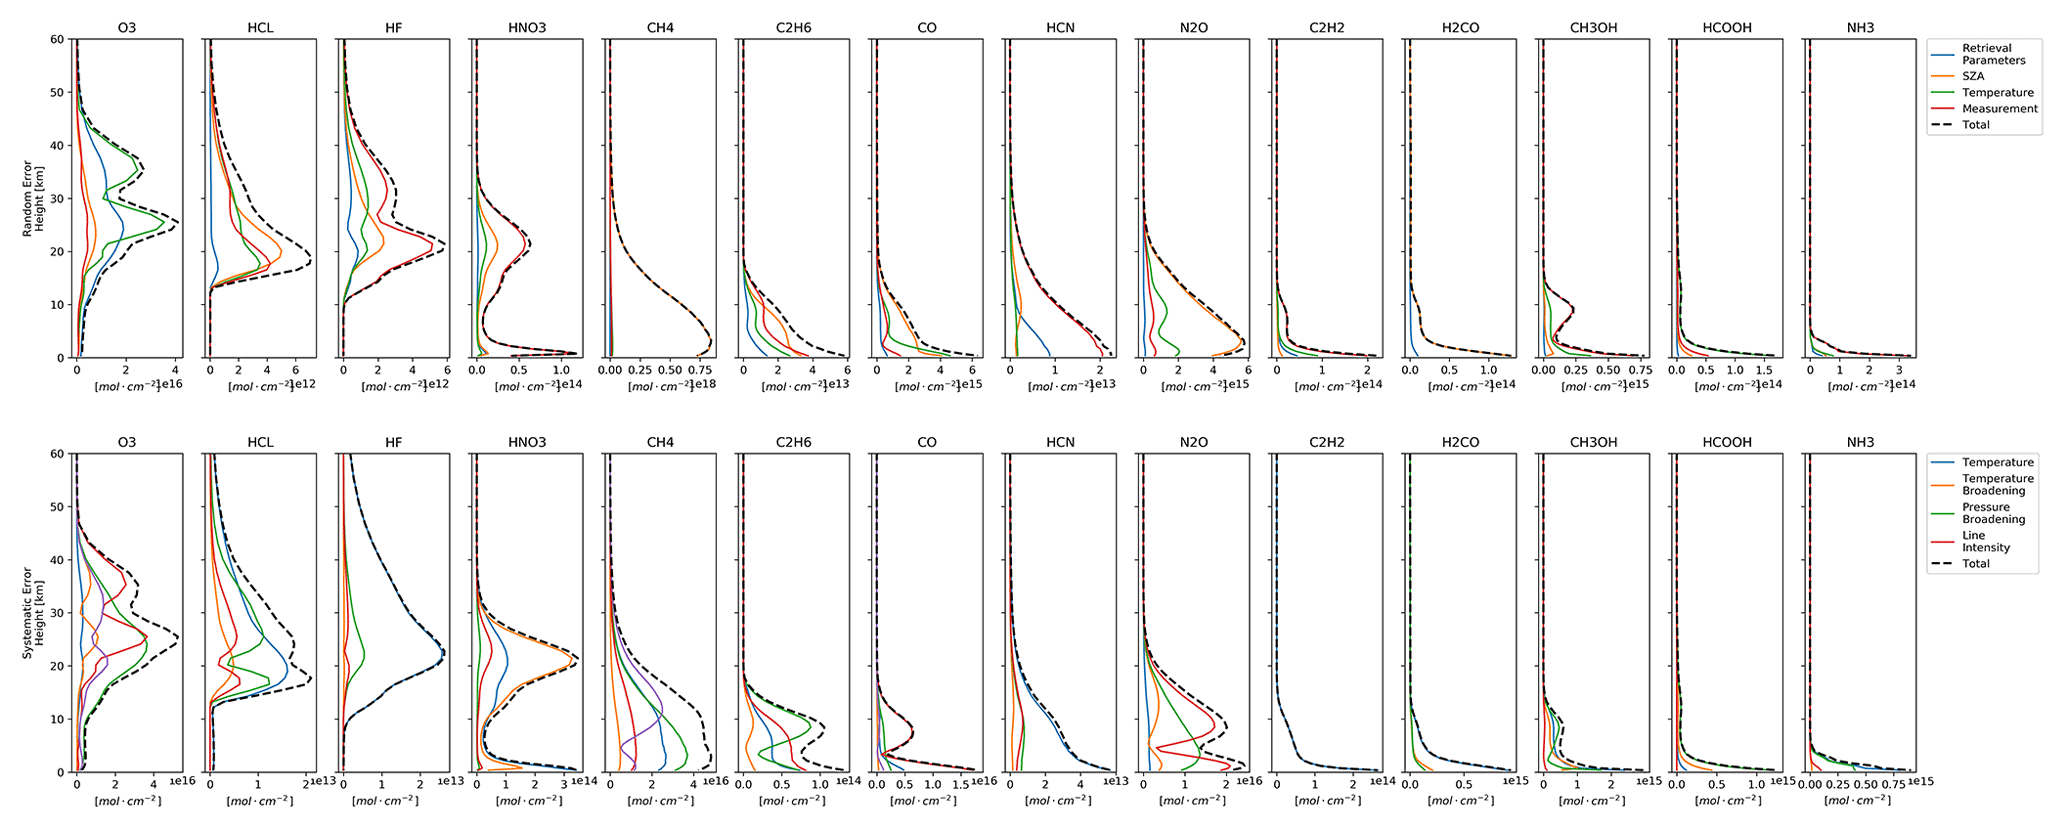
Figure 23Mean systematic and random error profiles (diagonal elements of Ssys and Sran) of O3, HCl, HF, HNO3, CH4, C2H6, CO, HCN, N2O, C2H2, H2CO, CH3OH, HCOOH, and NH3 from 2019. Upper panels: Retrieval parameter, SZA, random temperature, and measurement error comprising the random uncertainty. Lower panels: Systematic temperature, line intensity, and temperature-broadening and pressure-broadening error comprising the systematic error.
3.3 Quality assurance
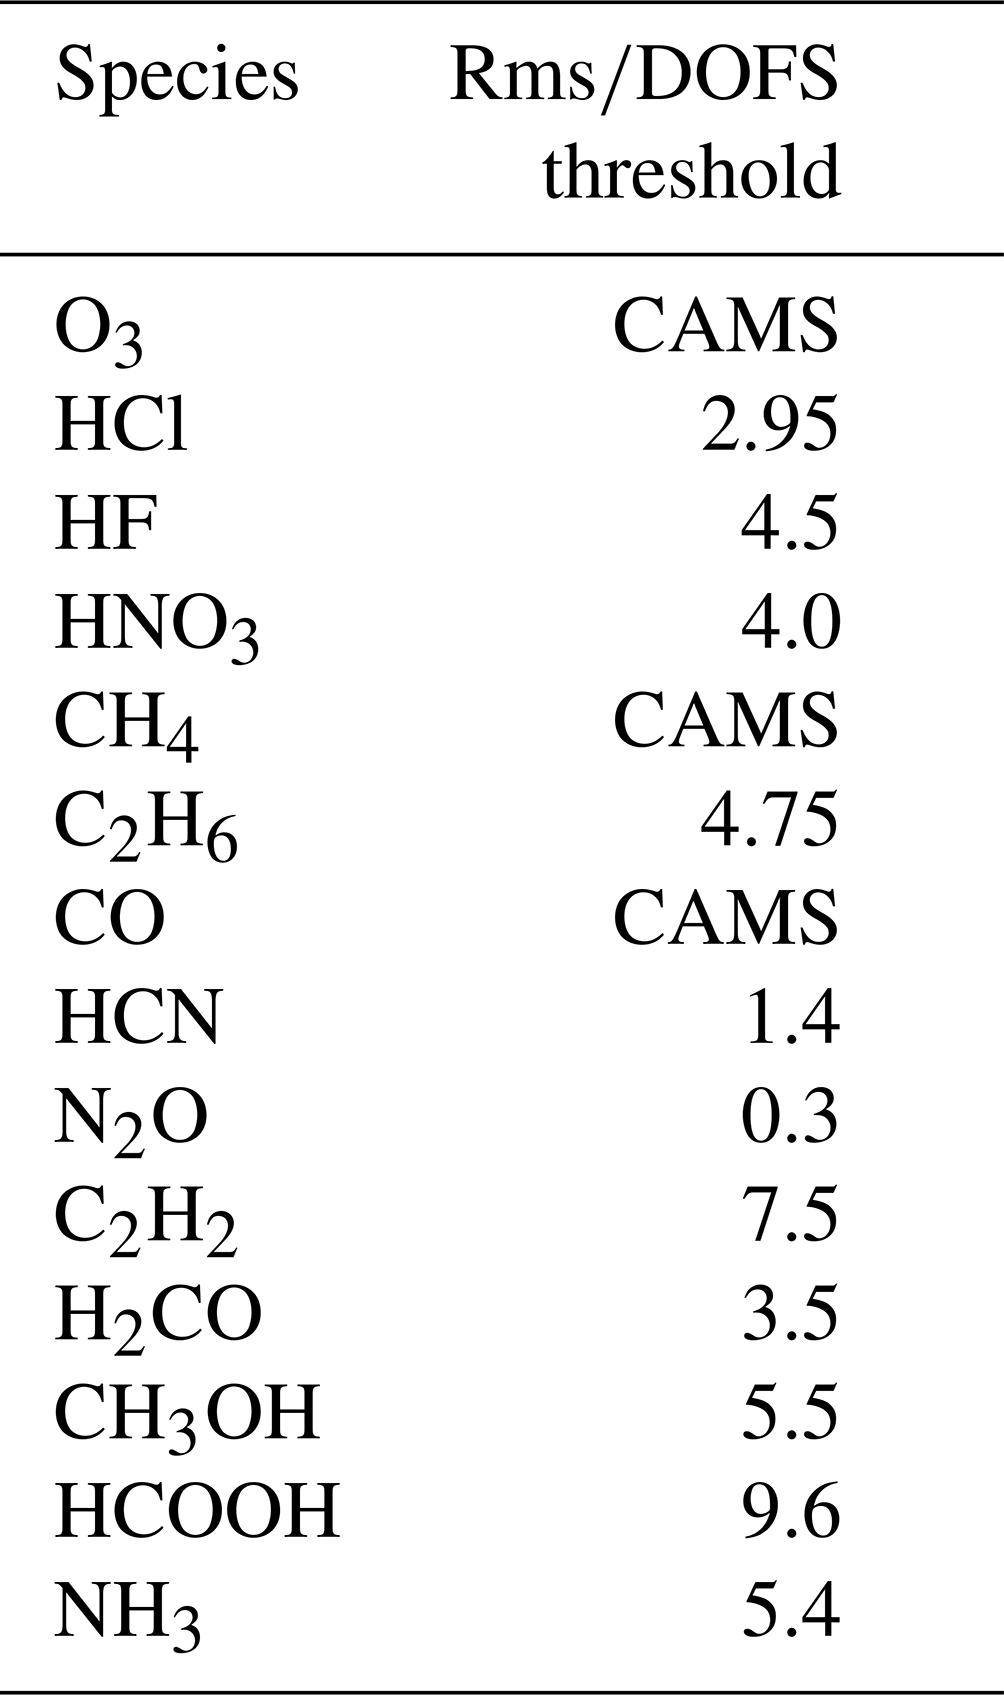
Quality assurance is the final step in the data processing. Any filtering is a trade-off between maintaining data quality and rejecting measurements that could be indicative of atmospheric processes that occur infrequently or are associated with particular events such as biomass burning events and stratospheric ozone intrusions. For each gas in this dataset, a threshold is defined to remove measurements that are exceptional in terms of large root-mean-square (rms) spectral fit error or a small DOFS. A large rms may indicate that the retrieval scheme failed to capture the shape of the spectrum, resulting in an erroneous total column or may simply indicate a particularly noisy spectrum. Smaller than average DOFSs are, in most cases, associated with low-quality measurements and thus should be rejected. To filter based on both of these criteria, we apply a quality threshold based on the ratio of the rms to the DOFS such that retrievals for which the ratio is greater than the threshold are discarded. Additional advantages of such a filter are detailed in Sussmann et al. (2011).
For each species, a series of threshold values were tested and a value was selected which removed results with large rms residuals and/or small DOFSs and with anomalous total columns that did not correlate with other results either from the species in question or other species; the chosen values can be found in Table 5. For CH4, CO, and O3, filtering is not performed, but further quality control is done to meet the standards set by CAMS (submitted files must pass an automated quality assurance filter, which examines retrieved parameters, including the retrieved column profile, water profile, and averaging kernels). For H2CO, the filtering is still used.
Table 5Quality assurance thresholds applied to TAO FTIR retrievals.
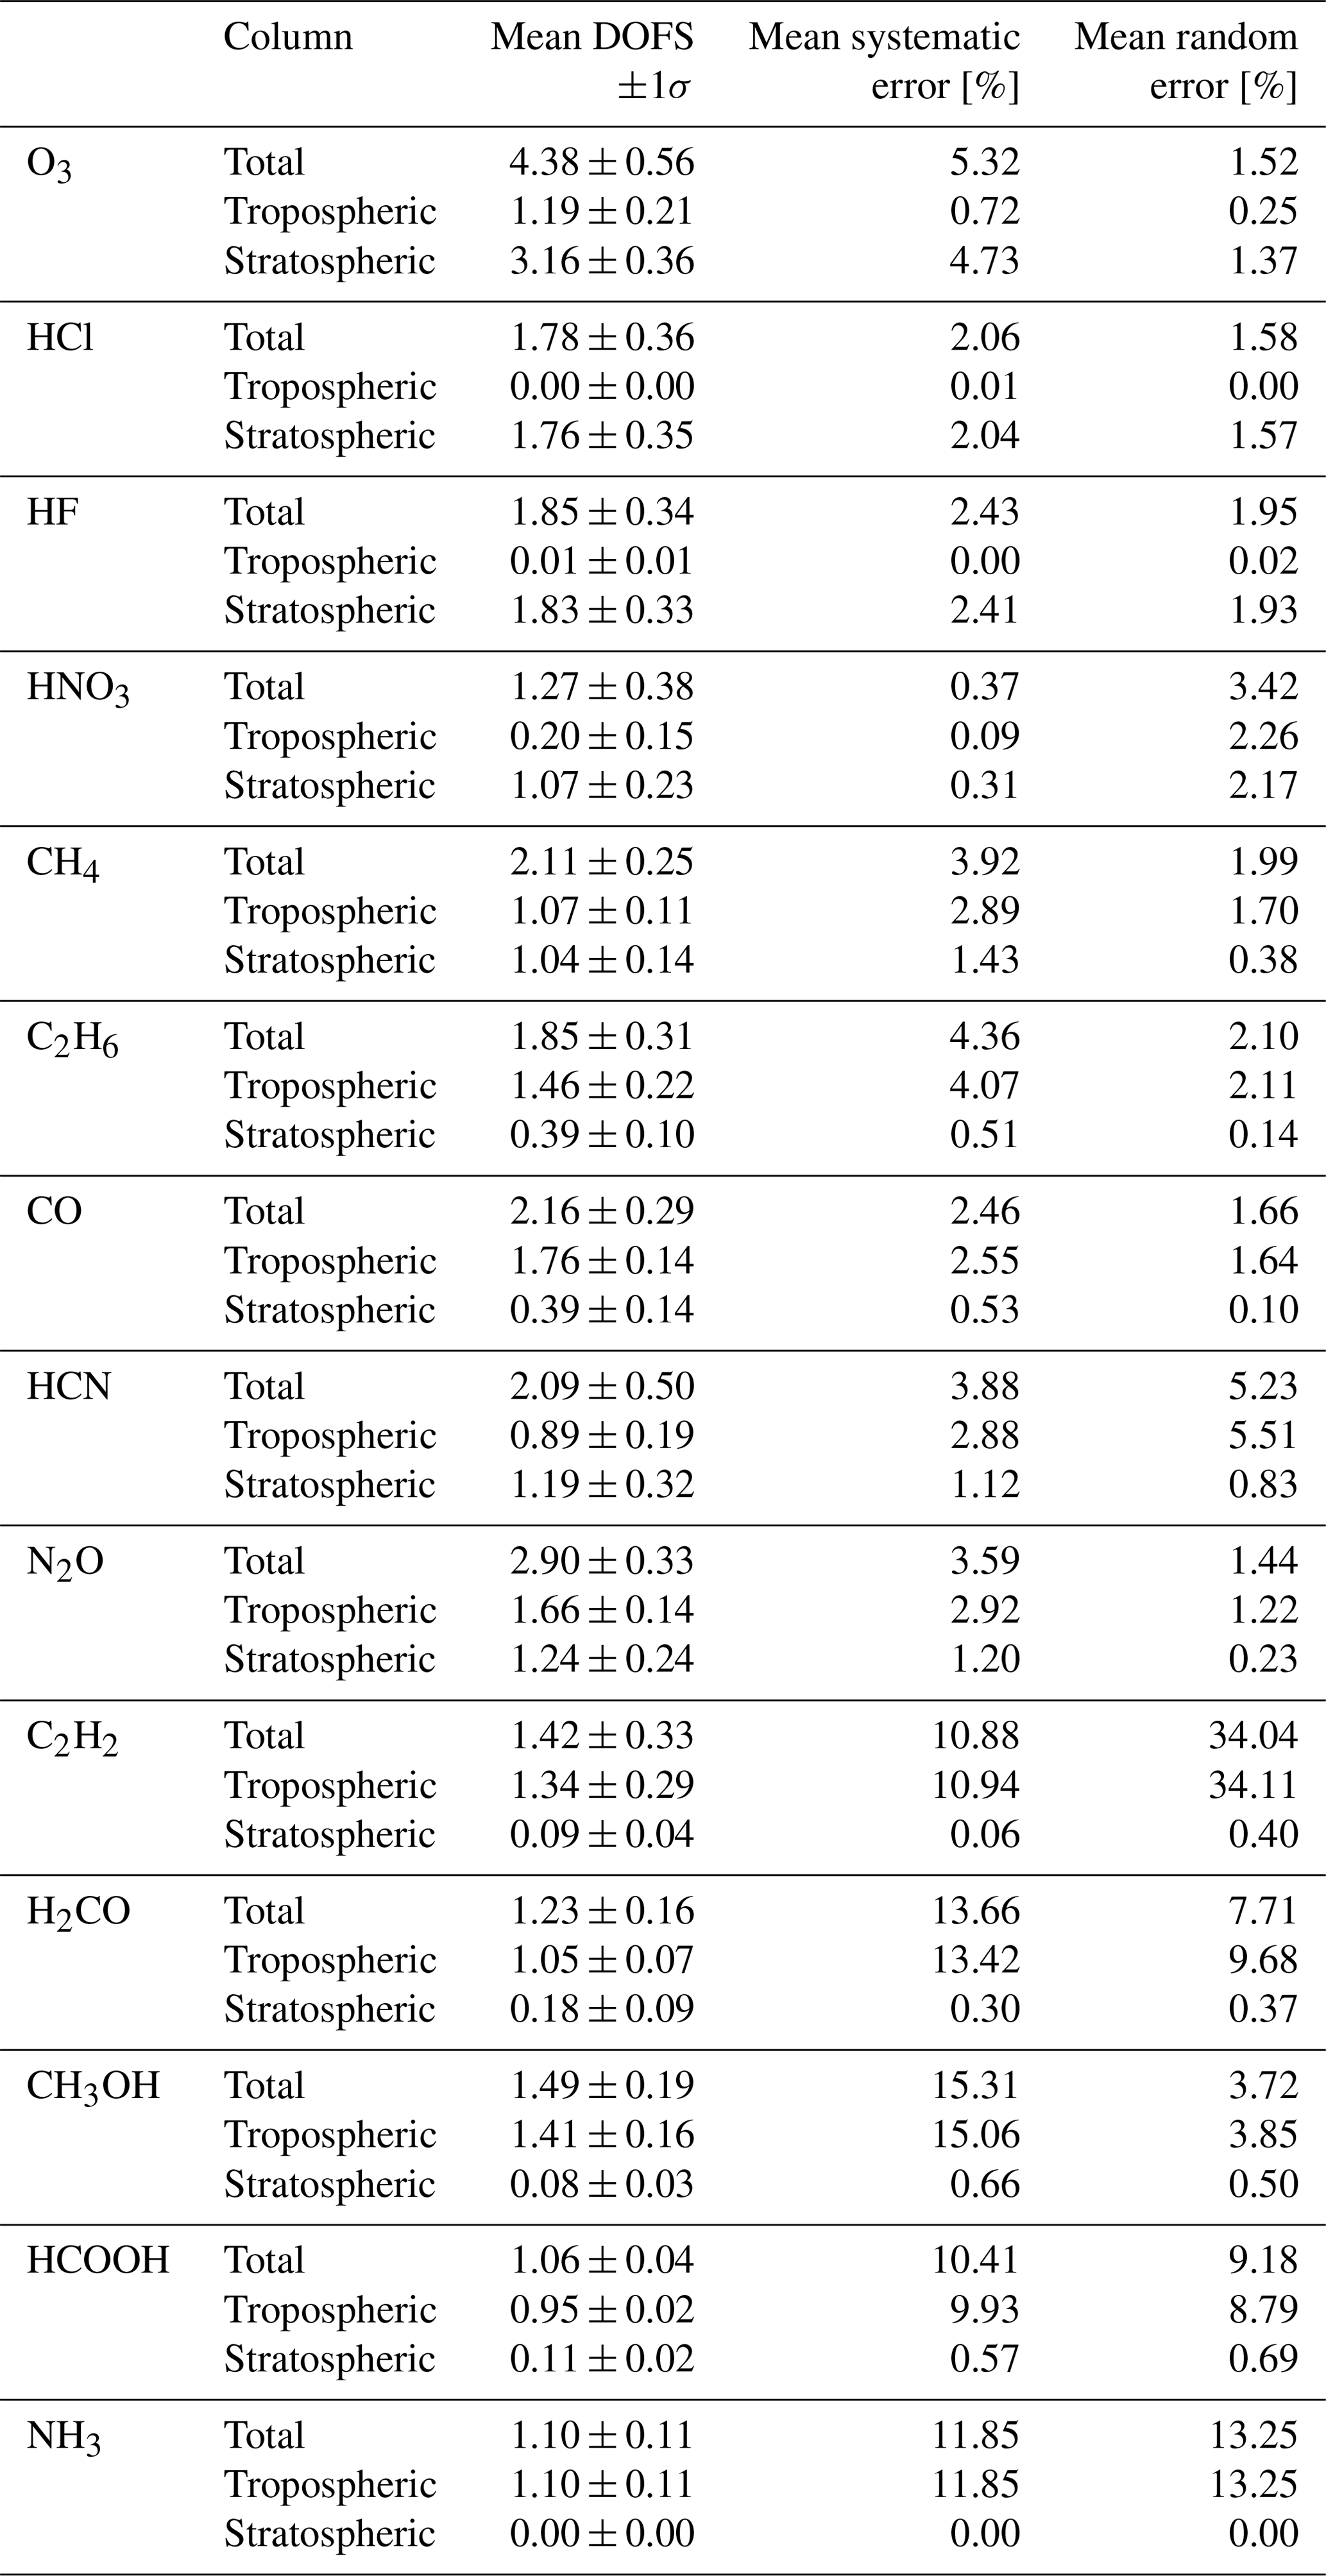
This section presents the archived time series for the species routinely retrieved from TAO FTIR solar spectra, following the sequence of NDACC stratospheric species, NDACC tropospheric species, and research products. Outliers in all the time series were examined but were not rejected unless there were issues with the spectral fit or the retrieved profile was deemed unphysical. The information content of the total columns and tropospheric and stratospheric partial columns (i.e., the mean DOFS and systematic and tropospheric errors) from 2002 to 2020 is listed in Table 6.
Table 6Mean total- and partial-column DOFSs and systematic and random errors for the entire time series, as described in Sect. 3.2.
Datasets are archived as HDF (Hierarchical Data Format; https://www.hdfgroup.org/, last access: 4 July 2023) files. For each species, the files are separated by year (typically, datasets are archived annually). If improvements are made to the retrieval, datasets may be updated on the NDACC archival server and the version number of the file may be incremented.
4.1 Ozone
The TAO total-column time series of ozone (O3) from 2002 to 2020, shown in Fig. 24a, is dominated by the stratospheric partial column. The stratospheric partial column contains the majority of the information, with average degrees of freedom for signal (DOFSs) of 3.16, but there is also sensitivity in the troposphere, with a DOFS of 1.19. The mean DOFS for the total column is 4.38 and the mean systematic and random errors are 5.32 % and 1.52 %, respectively. The tropospheric measurements have been examined by Whaley et al. (2015), who analyzed O3 air pollution events in Toronto to identify their local, regional, and long-range sources using the GEOS-Chem model. The seasonal cycle in Fig. 24b shows the relative monthly mean from 2002 to 2020, calculated by normalizing the monthly means by the respective annual mean over the 2002–2020 dataset; e.g., January 2003 data are normalized by the annual mean from 2003, and so on, and all January mean values are then averaged. The observed seasonal cycle exhibits a spring maximum when transport is dominant, and a fall minimum when photochemical loss dominates. The Brewer–Dobson circulation transports O3 produced in the tropics to the midlatitudes to high-latitudes, where it descends (Butchard, 2014), increasing midlatitude O3 over the course of the winter, while photochemical ozone loss reduces O3 during the summer. Outliers in the O3 total columns, seen in Fig. 24c, are likely signatures of dynamic variability over Toronto, some of which were attributed to polar vortex intrusions by Whaley et al. (2013).
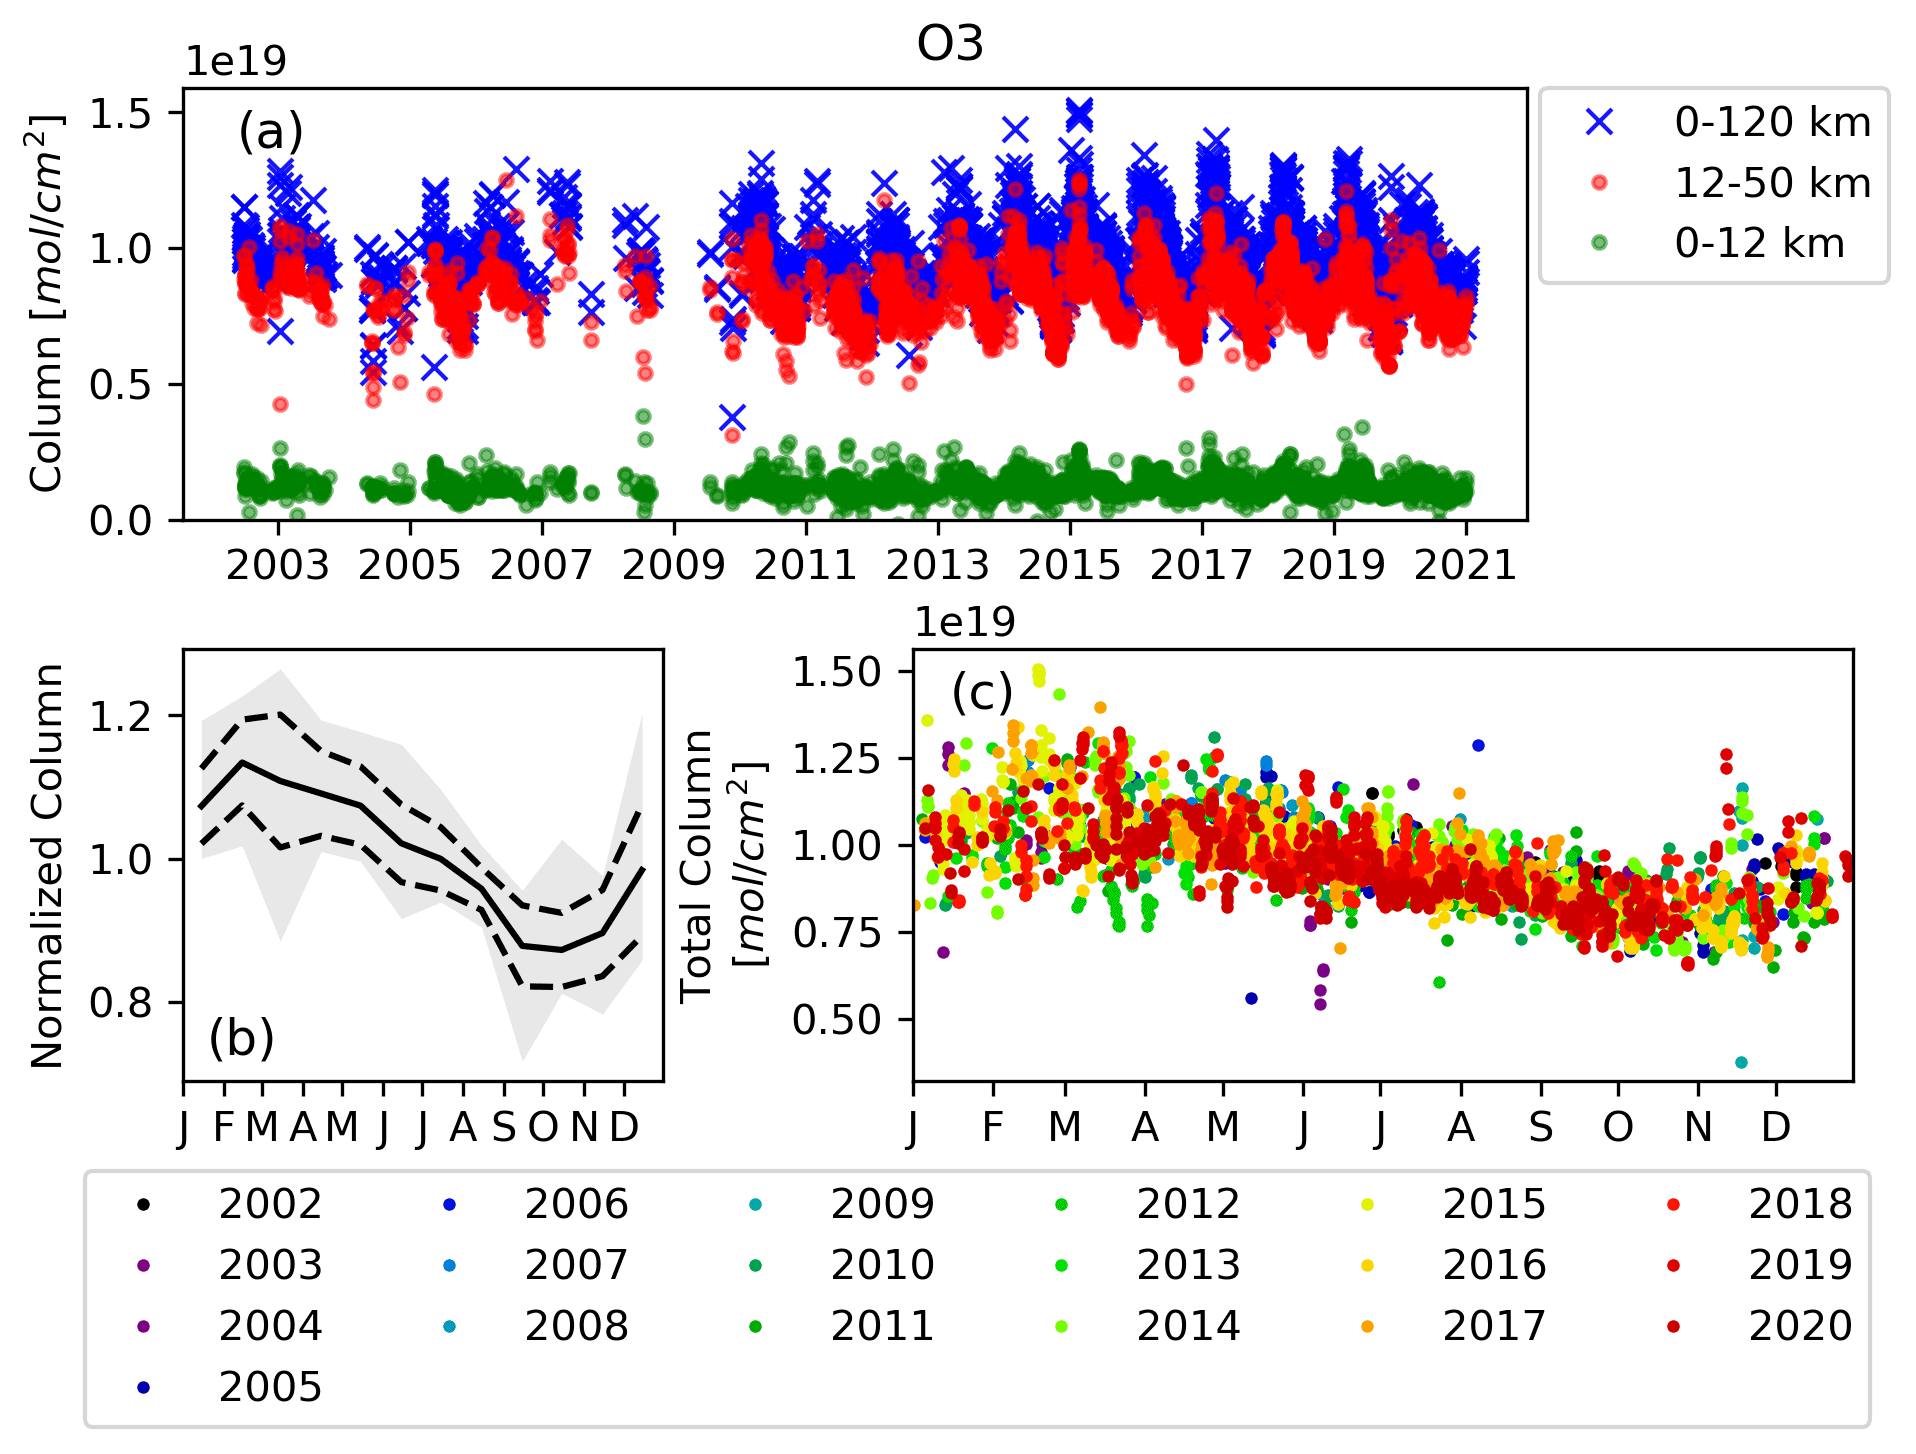
Figure 24O3 measurements at TAO from 2002–2020. (a) The total-column (blue) and stratospheric (red) and tropospheric (green) partial-column time series. (b) Mean relative monthly means, calculated by normalizing the monthly means with the respective annual mean over the 2002–2020 dataset and averaging (e.g., January 2003 data are normalized by the annual mean from 2003, and so on, and all January mean values are then averaged). The range (min–max) is shaded in gray, and ±1σ is indicated by the dashed line. (c) The annual cycle, showing all total-column measurements, color-coded by year.
4.2 Hydrogen chloride
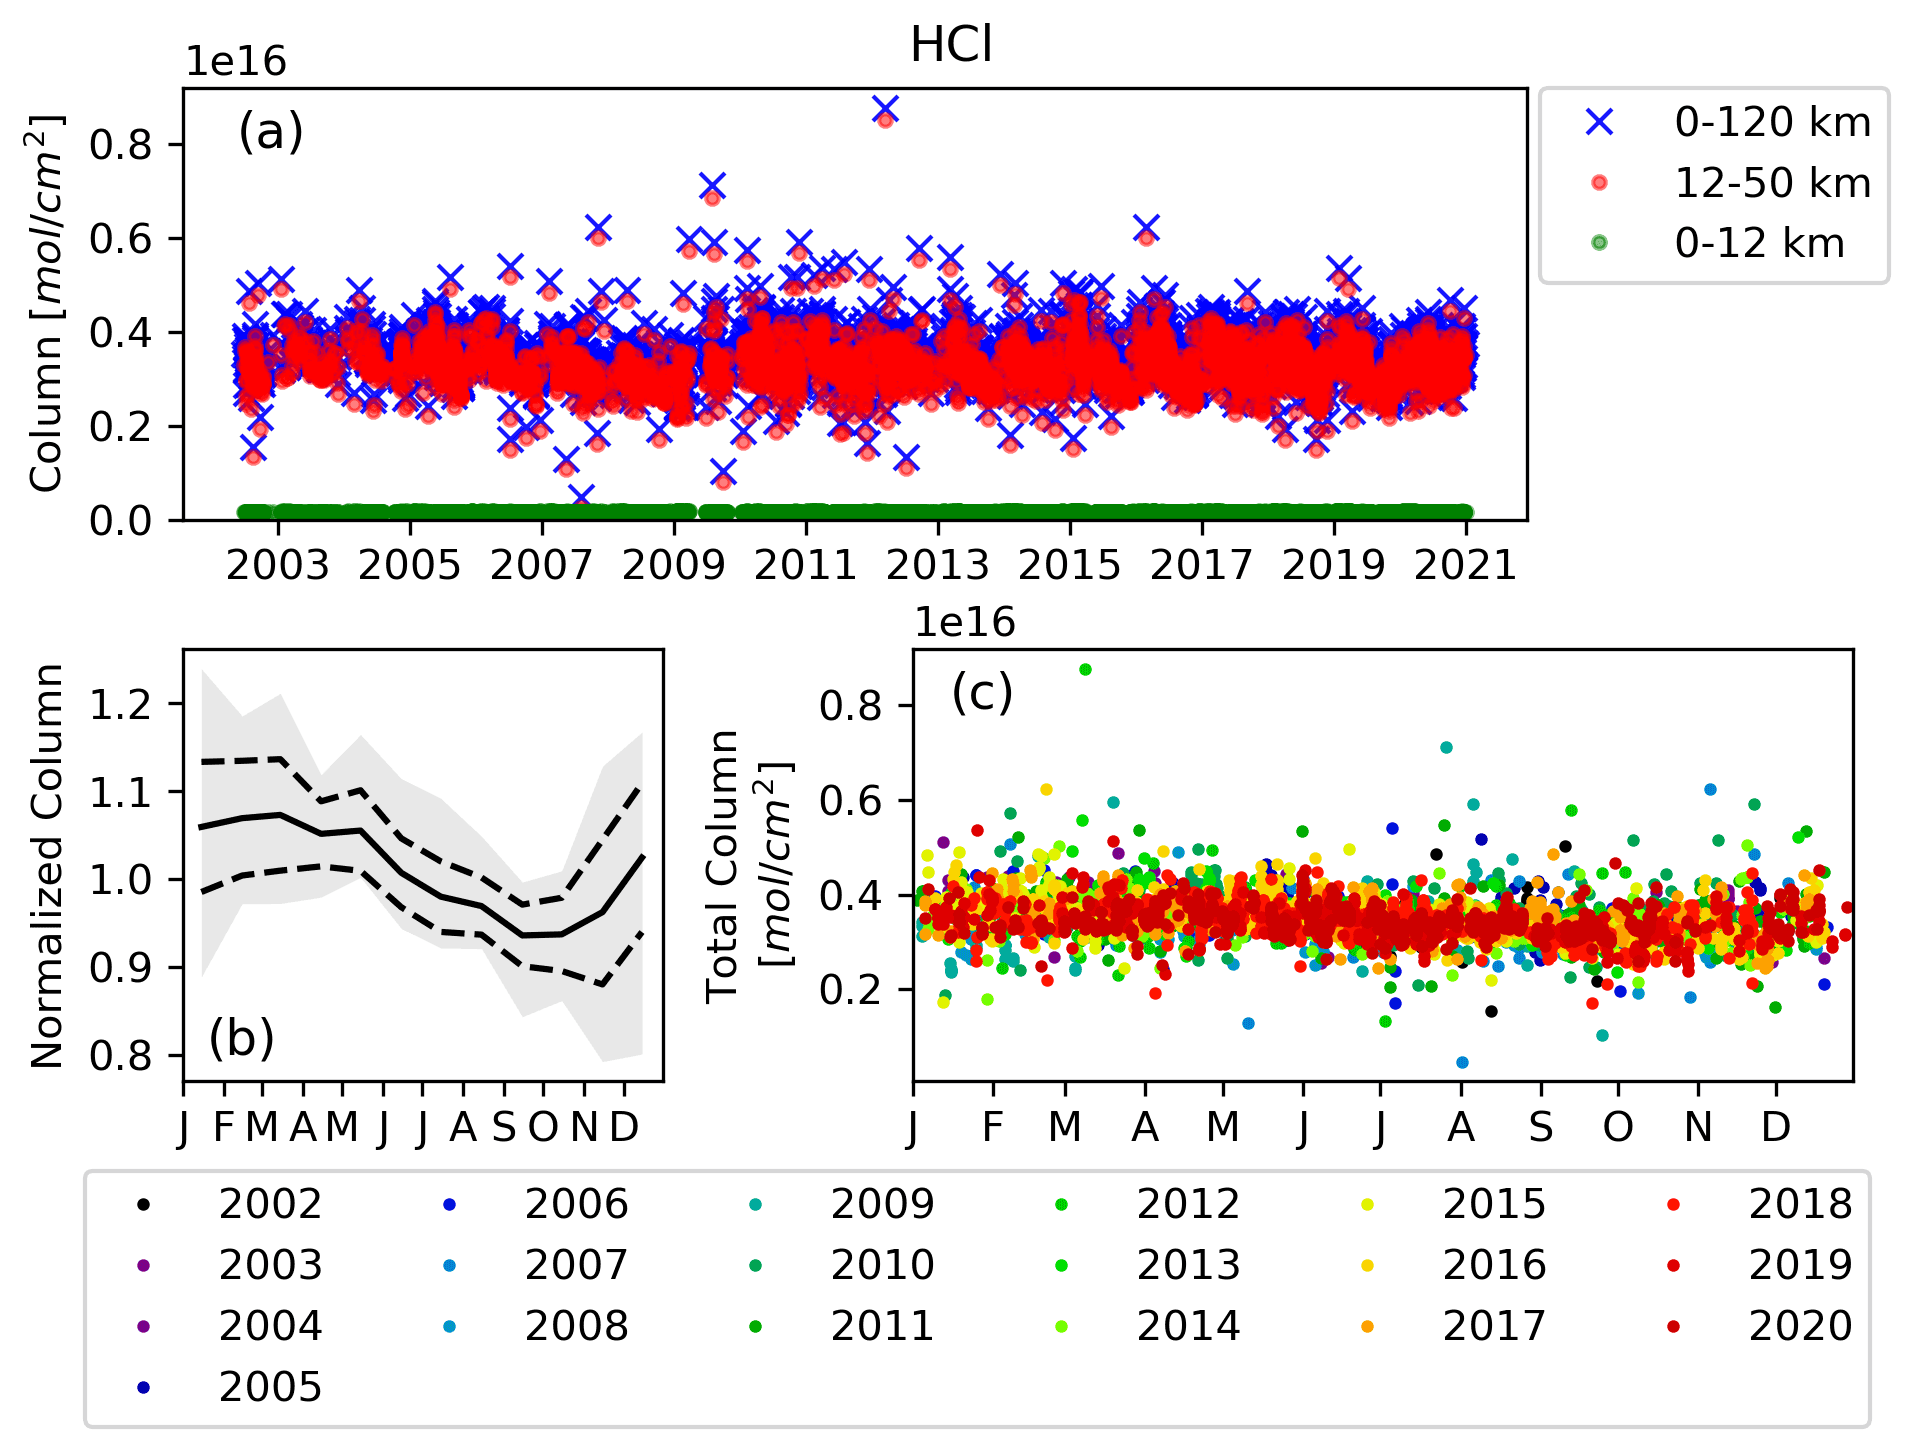
The main source of hydrogen chloride (HCl) in the middle atmosphere is the photodissociation of chlorofluorocarbons (CFCs) and hydrochlorofluorocarbons (HCFCs). There is also natural background HCl from the ocean release of CH3Cl. HCl is a chlorine reservoir species and plays a role in the catalytic ozone destruction cycle. The stratospheric partial columns, shown in Fig. 25a (red), are almost the same as the total columns (blue), having near-identical mean DOFSs (1.76 and 1.78), while the tropospheric columns contain no information (DOFS of 0). The mean systematic and stratospheric errors are also nearly identical between the total and stratospheric columns: 2.06 % and 2.04 % for the mean systematic error and 1.58 % and 1.57 % for the mean random error, which is dominated by the SZA error. The seasonal cycle, seen most clearly in Fig. 25b, is driven by tropopause height, with a minimum when the tropopause height is at its highest, in summer and a maximum when the tropopause height is at its lowest, in winter (Kohlhepp et al., 2012). The time series was examined in Kohlhepp et al. (2012). The variability in the HCl measurements, seen Fig. 25c, has been investigated, and many of these enhancement events correspond to intrusions of polar vortex air, as studied by Whaley et al. (2013).
4.3 Hydrogen fluoride
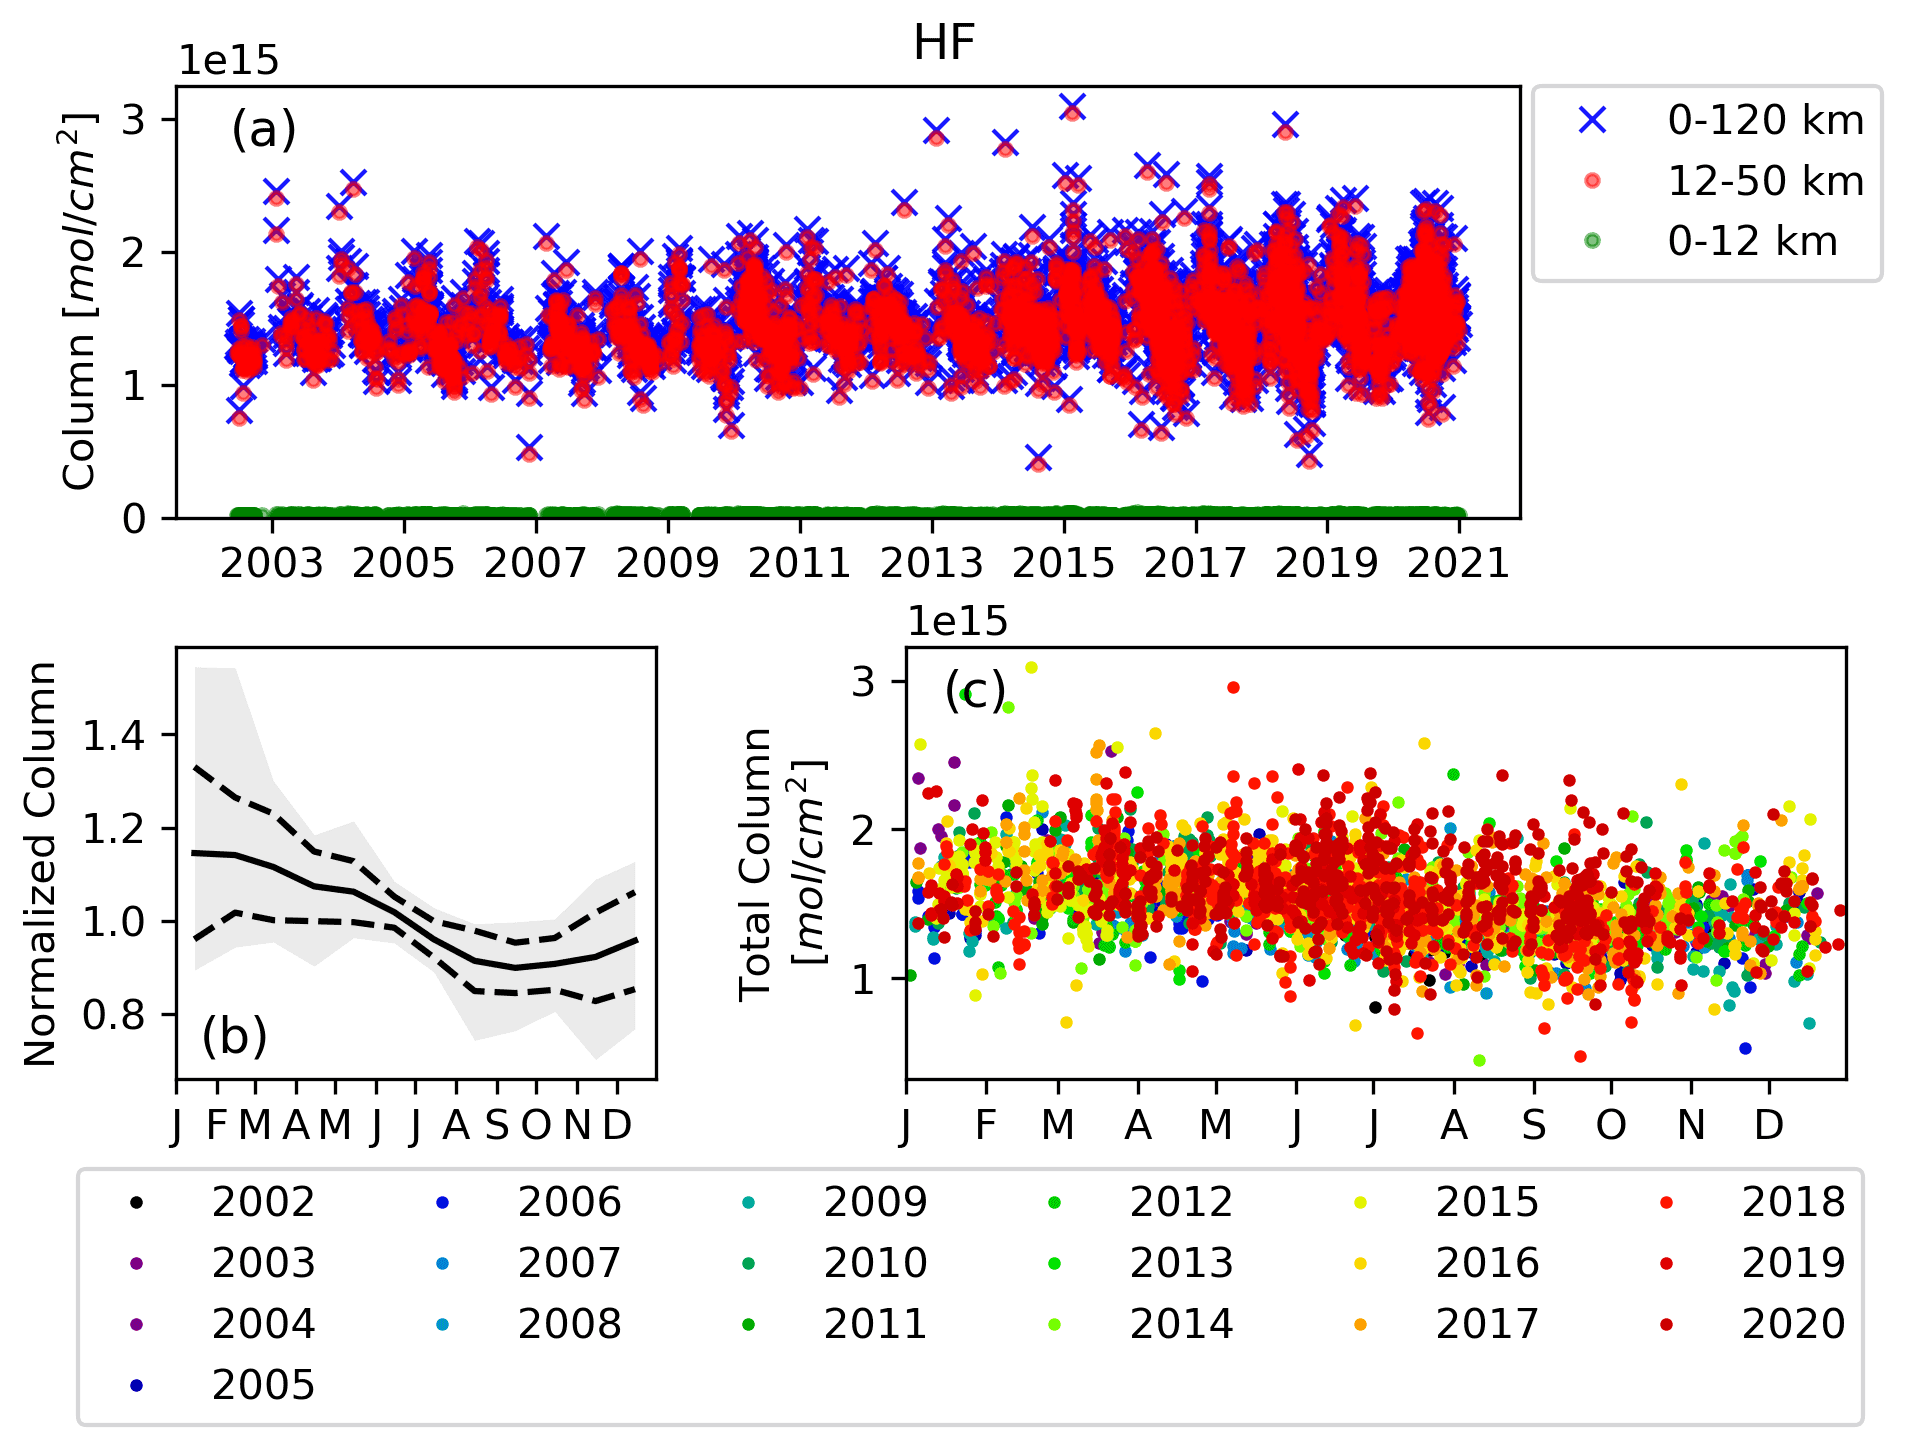
Much like hydrogen chloride, hydrogen fluoride (HF) is a stratospheric species which has photodissociation of CFCs and HCFCs as its source, and thus HF is a good indicator of anthropogenic activity (Kohlhepp et al., 2012). The FTIR measurement has no sensitivity to the troposphere (mean DOFS of 0.01); thus, the stratospheric partial-column measurements, plotted in red in Fig. 26a, are almost identical to the total-column measurements. Consequently, the total columns and stratospheric columns have similar mean DOFSs (1.85 and 1.83). The total-column systematic error is predominantly due to temperature, with a mean error of 2.43 %, and the total-column random error has similar contributions from all sources with a mean of 1.95 %. The seasonal cycle is also driven by the tropopause height (Kohlhepp et al., 2012). Since HF has a lifetime exceeding 10 years, the variability in the measurements is indicative of stratospheric dynamics. Enhancements of HF can be used to identify polar intrusion events as in Whaley et al. (2013), with events typically occurring at least twice per year. The TAO HF measurement time series has previously been examined in Kohlhepp et al. (2012), who discussed the decrease in HCl and ClONO2 emissions from 2000–2009 due to the restrictions of anthropogenic chlorine source gases under the Montreal Protocol and the increase in HF as fluorine emissions are not explicitly restricted. A recent study using TAO data from 2002–2019 found a positive trend in the HF total columns at a rate of 0.59 ± 0.11 % yr−1 (Yamanouchi et al., 2021a).
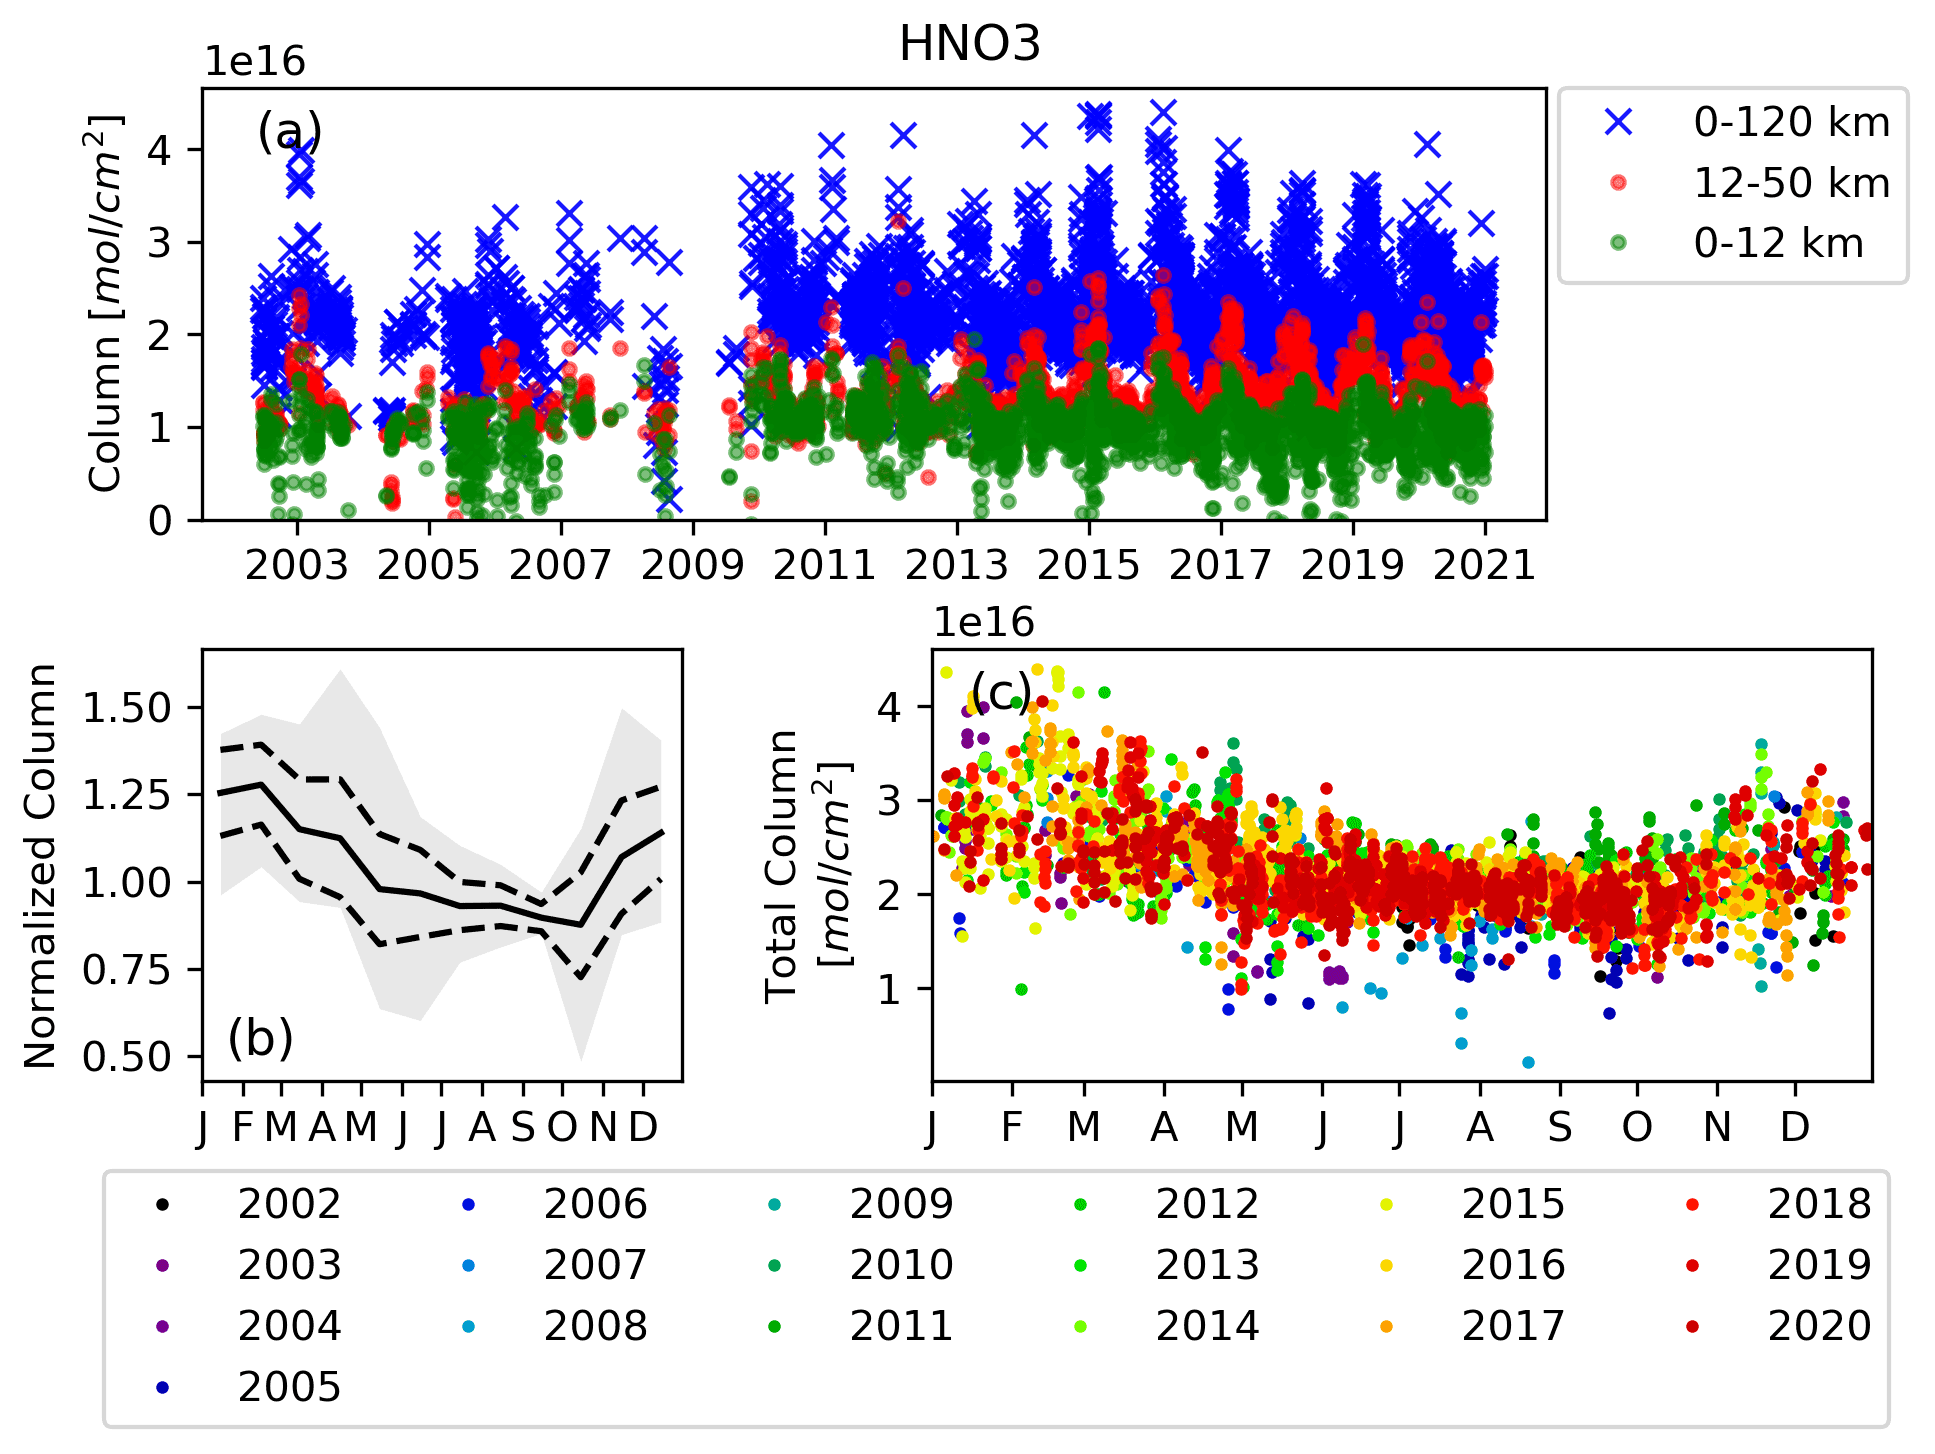
4.4 Nitric acid
Nitric acid (HNO3) is a reservoir species for nitrogen in the stratosphere and plays an important role in stratospheric ozone chemistry by sequestering reactive NOx radicals, thus reducing the destruction of ozone (e.g., Jacob, 1999). This sequestration occurs when HNO3 is produced via the oxidation of NOx by OH. HNO3 is ultimately converted back to NOx by reactions with OH or by photolysis. HNO3 can be removed from the stratosphere by transport to the troposphere, where it is scavenged by precipitation. The HNO3 total-column time series is shown in blue in Fig. 27a, and the mean DOFS is 1.27. The mean systematic and random errors for the HNO3 total-column retrieval are 0.37 % and 3.42 %, respectively; the systematic error is dominated by the spectroscopic error, while the largest component of the random error is the measurement error. The TAO FTIR measurements are predominantly sensitive to the stratosphere (red) with a mean DOFS of 1.07, while the mean DOFSs in the troposphere are 0.21. HNO3 has a seasonal cycle, seen in Fig. 27b, with a winter maximum and a summer minimum. The variability in the HNO3 measurements increases in winter as seen in Fig. 27c, in agreement with model predictions for a midlatitude site presented in Toohey et al. (2007).
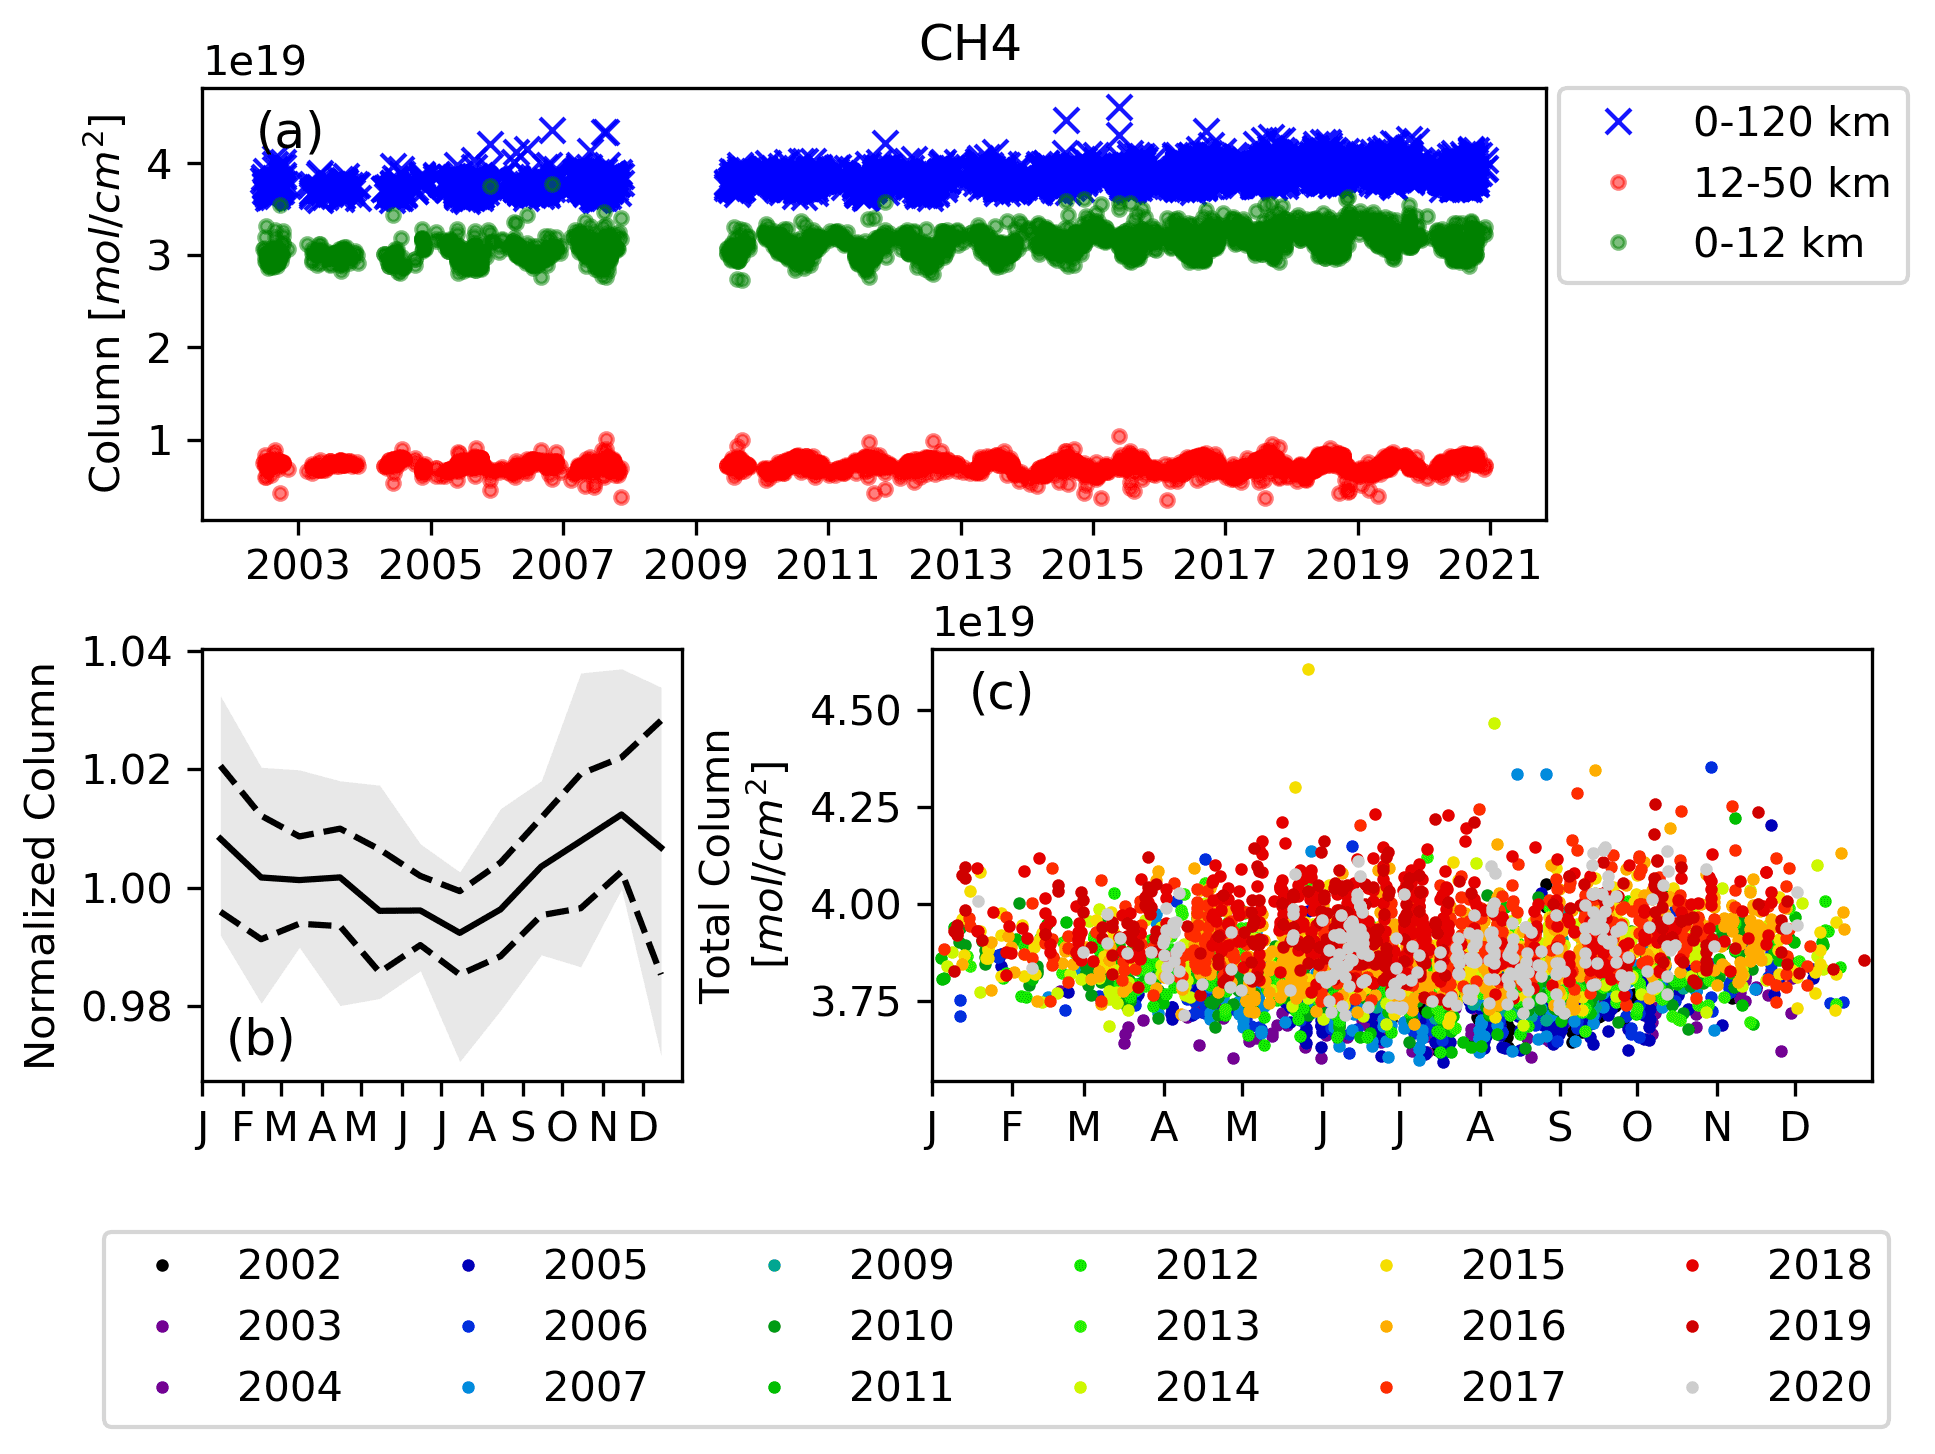
4.5 Methane
The time series of methane (CH4) over Toronto is shown in Fig. 28a. The FTIR measurements have a DOFS of ∼ 1 in both the troposphere and the stratosphere (mean DOFS of 1.09 and 1.06, respectively), and the total mean DOFS is 2.11. The mean systematic error is on the total columns is 3.92 % and is primarily due to the temperature error. The mean random error in the total columns is lower, at 1.99 %, and is dominated by the SZA error. CH4 is the most abundant hydrocarbon in the atmosphere (IPCC, 2013) and is long-lived with a lifetime of between 9 and 12 years. It is lost at a faster rate in the summer due to oxidation by OH. Due to its many sources and sinks, the amplitude of the CH4 seasonal cycle is small and is not visible in the TAO total-column time series, indicated by the flat mean relative monthly mean time series shown in Fig. 28b. The TAO CH4 time series has been examined by Bader et al. (2017), who describe the recent increase in CH4 during the 2005–2014 period. Yamanouchi et al. (2021a) found a positive trend of 0.41 % yr−1± 0.03 % yr−1 in the TAO CH4 total column from 2009 to 2019.
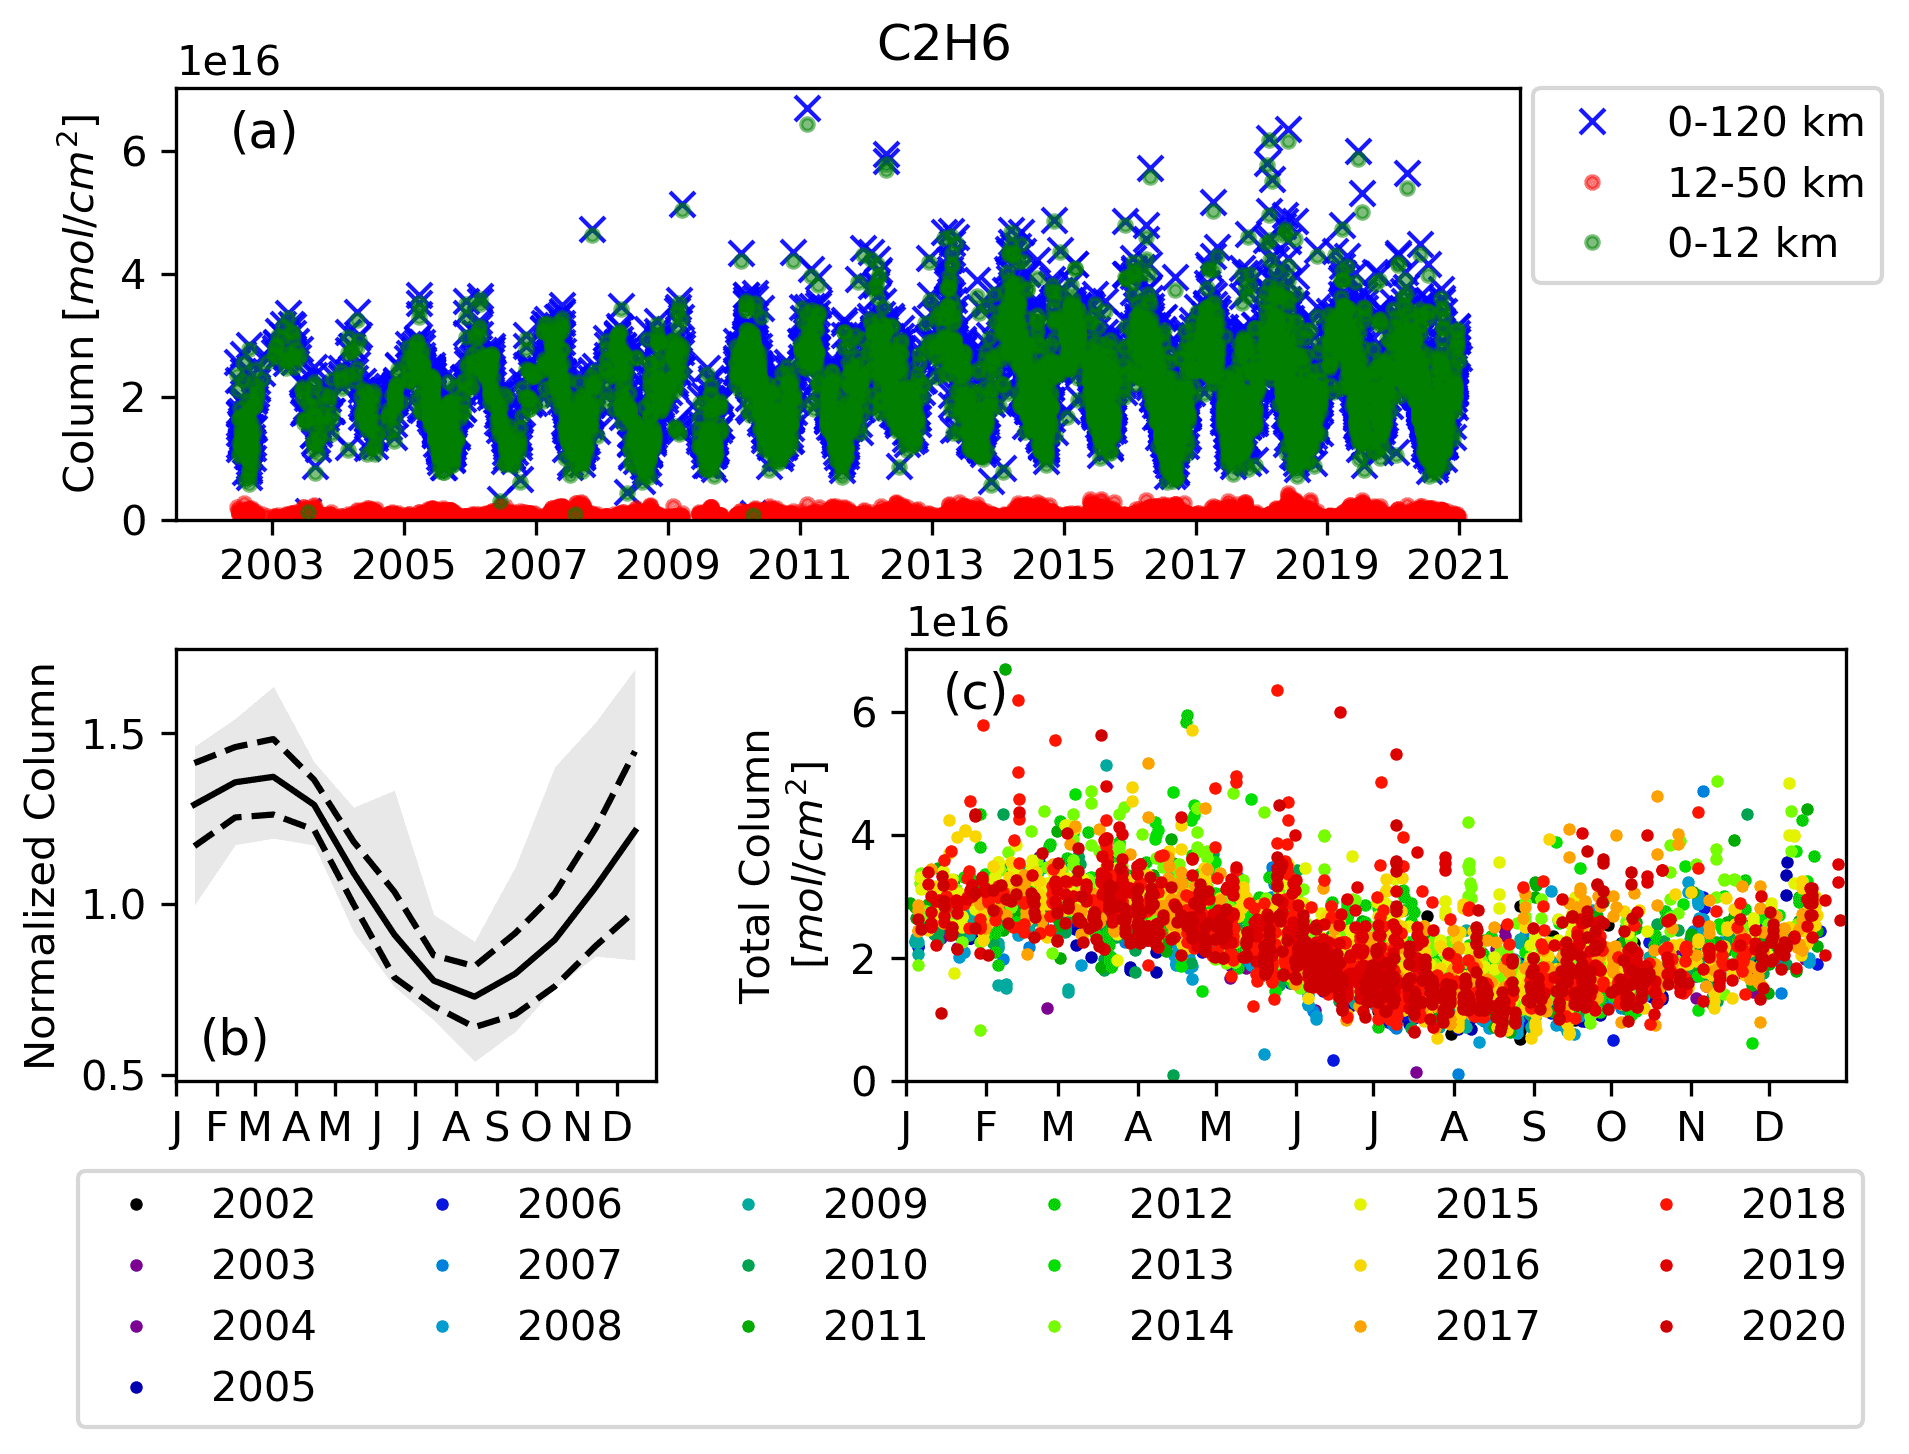
4.6 Ethane
Ethane (C2H6) is moderately long-lived in the atmosphere, with a lifetime of about 2 months (Rudolph, 1995). The time series of TAO C2H6 total columns is shown in blue in Fig. 29a, along with the stratospheric (red) and tropospheric (green) partial columns. The sensitivity of the TAO C2H6 FTIR measurements is mostly tropospheric (mean DOFS of 1.85); however, there is some sensitivity in the lower stratosphere (mean DOFS of 0.39 in the stratosphere), which is difficult to discern in the figure as the stratospheric partial columns are significantly smaller than the total and tropospheric columns. Consequently, the mean systematic error (4.36 %) and random error (2.10 %) on the total columns are primarily from the troposphere. The seasonal cycle is driven by OH oxidation, and thus a winter maximum and summer minimum can be seen in the plot of the mean relative monthly means in Fig. 29b. TAO measurements of C2H6 have been used to study the effects of oil and natural gas extraction on ethane and methane emissions in North America (Franco et al., 2016). Isolated C2H6 events, such as the one used to identify a biomass burning plume that passed over Toronto on 21 July 2011 during the 2011 summer BORTAS campaign (Griffin et al., 2013), can be seen in Fig. 29c, where all the measurements for all years have been plotted from January to December and are color-coded by year. The BORTAS event is partly obscured by comparable total-column values of C2H6 in 2014.
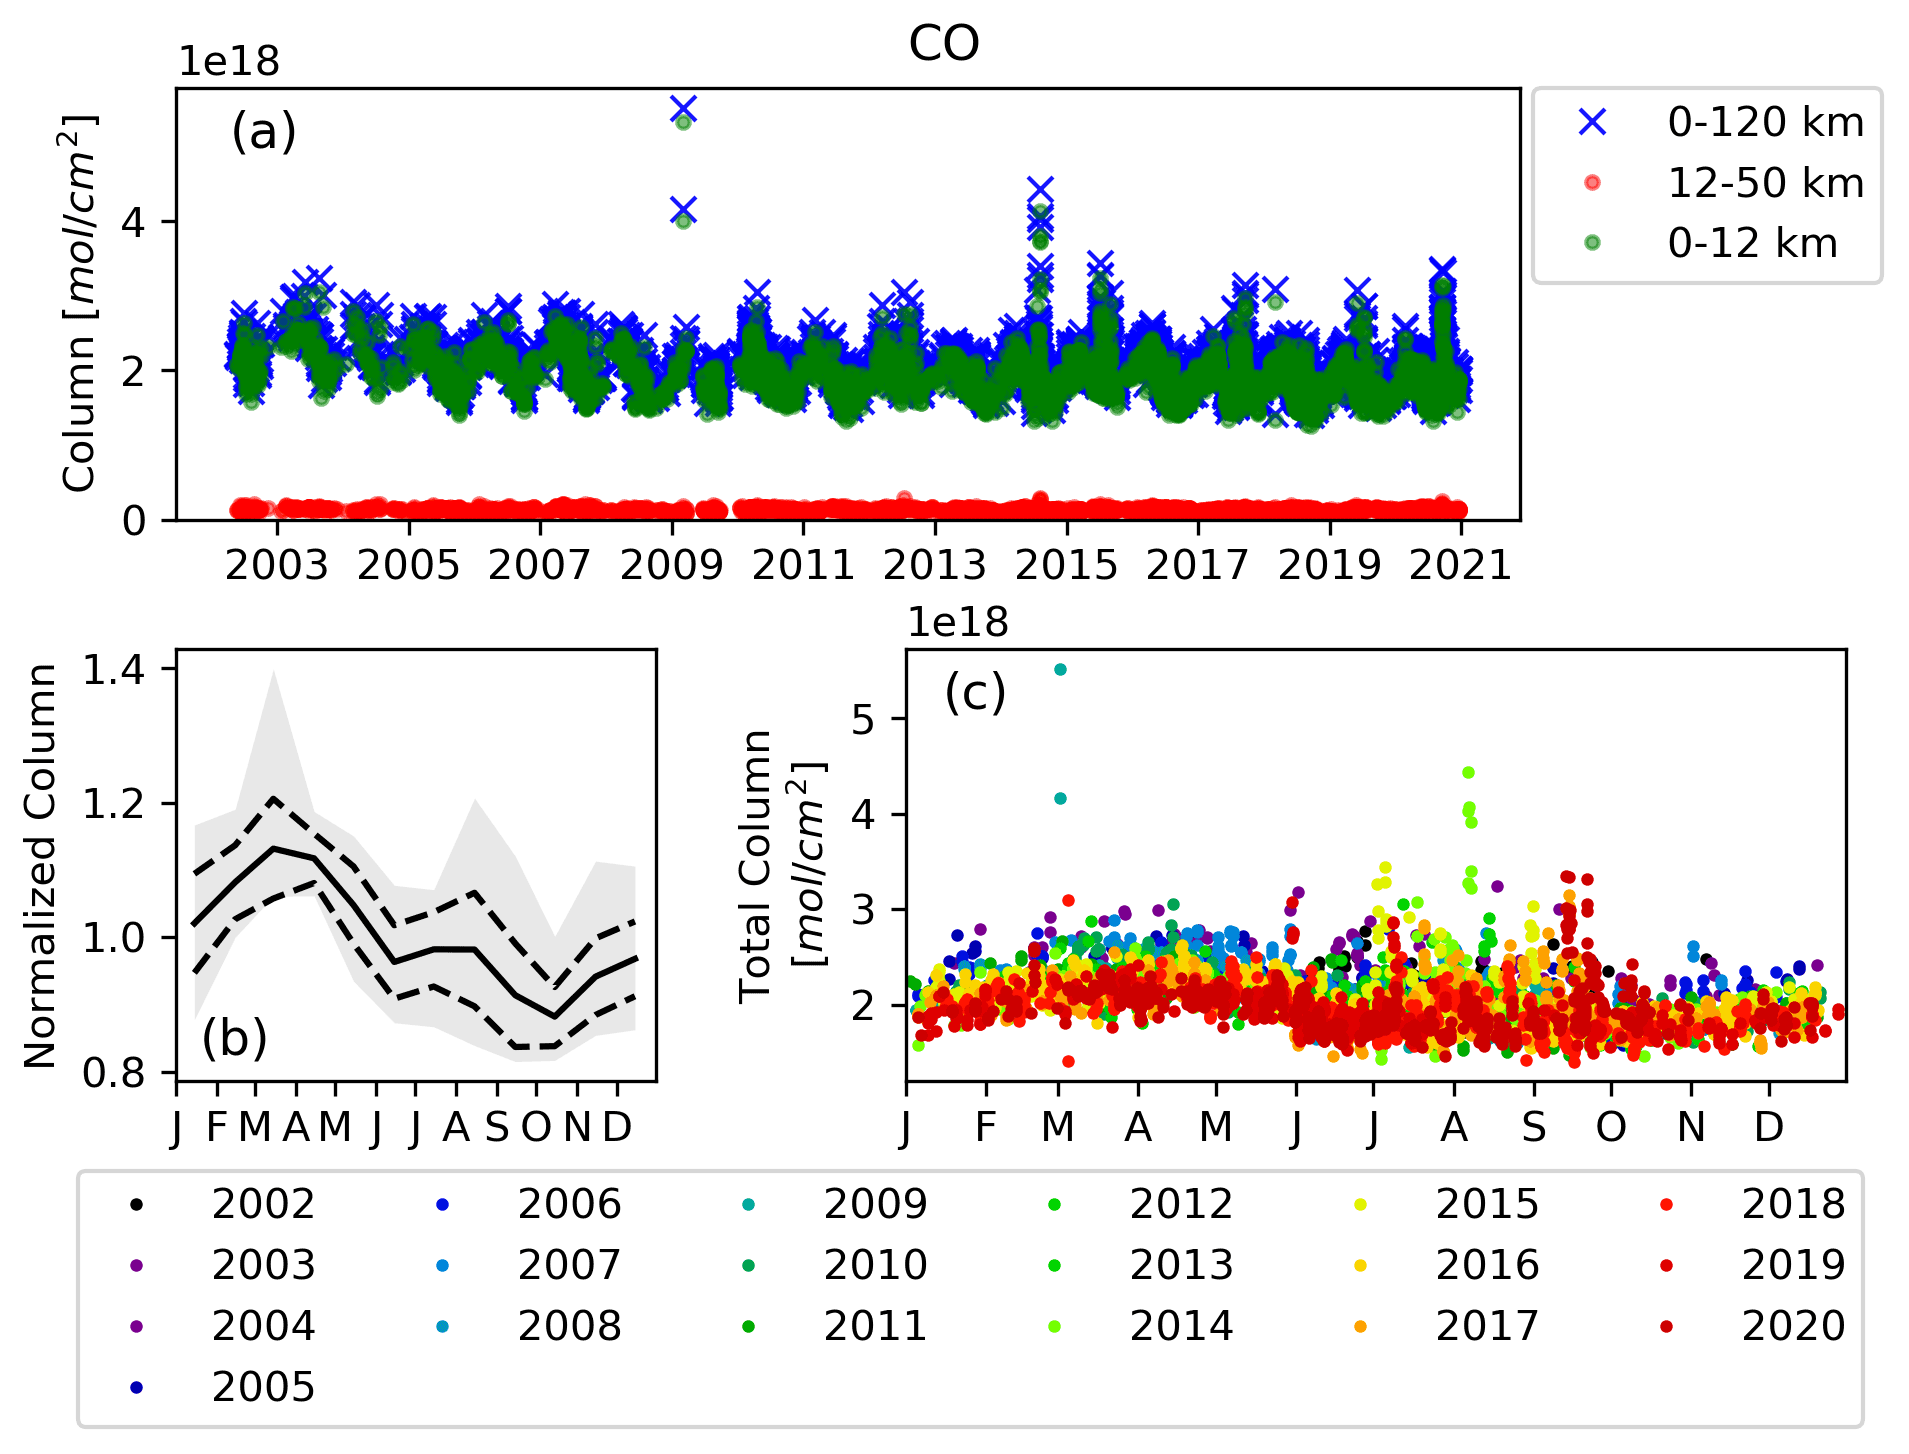
4.7 Carbon monoxide
The time series of carbon monoxide (CO) total columns, shown in Fig. 30a, is dominated by the troposphere, where CO concentrations are largest; thus, the tropospheric column measurements differ only slightly from the total column. The FTIR CO retrieval does have some sensitivity in the stratosphere (mean DOFS of 0.39), but the sensitivity is largely tropospheric (mean DOFS of 1.18), and the mean DOFS of the total column is 2.16. This sensitivity in the troposphere makes CO a useful indicator for biomass burning events (Griffin et al., 2013). The total-column random error, with a mean of 1.66 %, is principally composed of the line intensity error. The mean systematic error in the total columns is 2.46 %. The main sink of CO in the atmosphere, as with CH4 and C2H6, is oxidation by OH. Consequently, the seasonal cycle is similar to those of CH4 and C2H6, but because CO is a by-product of hydrocarbon oxidation, the summer minimum is slightly delayed as seen in Fig. 30b. A secondary source of CO is fossil fuel combustion. The TAO CO time series has been used to study urban ozone pollution events (Whaley et al., 2015) to evaluate the Community Atmosphere Model with Chemistry (CAM-Chem) assimilation of Measurement of the Pollution in the Troposphere (MOPITT) measurements (Gaubert et al., 2016) and to validate MOPITT data (Buchholz et al., 2017). TAO CO columns have been used to identify biomass burning plumes transported overhead (Lutsch et al., 2016, 2020; Yamanouchi et al., 2020).
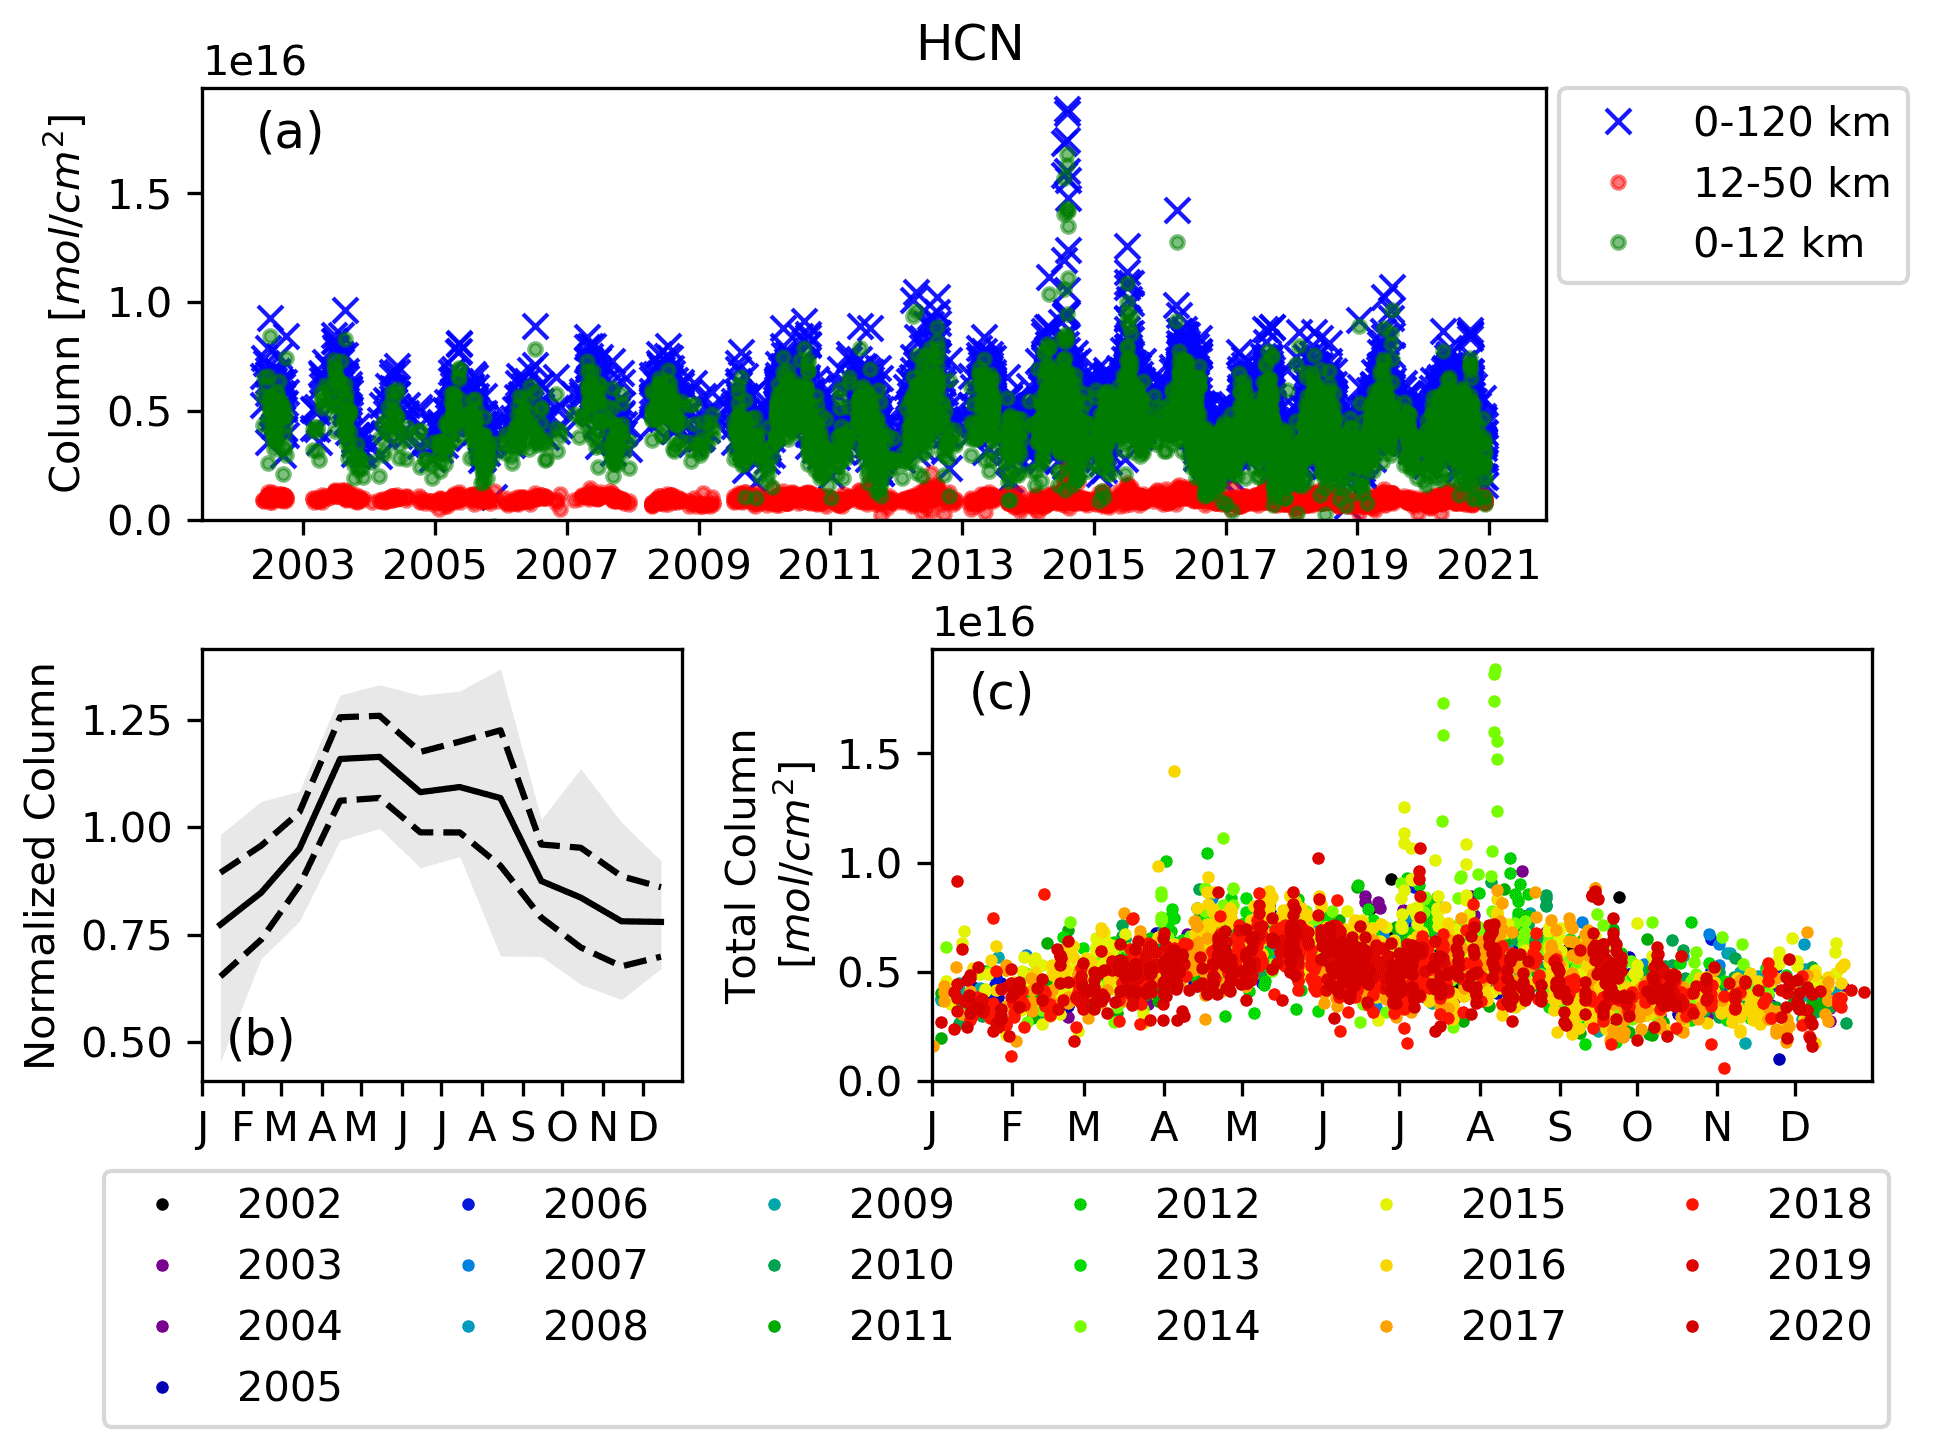
4.8 Hydrogen cyanide
Hydrogen cyanide is mainly emitted by biomass burning, although urban emission from vehicles (Baum et al., 2007) is also significant. The FTIR retrieval has sensitivity in the troposphere and stratosphere, with mean DOFSs of 0.89 and 1.19, respectively, and the mean DOFS of the total column is 2.09. The HCN time series is shown in Fig. 31a. The concentrations of HCN are much higher in the troposphere, so the tropospheric measurements, shown in green, dominate the total column. The total-column mean random error is 5.23 % and is predominantly measurement error. The total-column mean systematic error is 3.88 % and is dominated by the temperature dependence error. The seasonal cycle, shown in Fig. 31b, is characterized by a peak in summer of varying amplitude, which is consistent with the variable biomass burning source, and a winter minimum. Individual enhancement events, seen in the time series in Fig. 31c, are indicators of biomass burning events. The large enhancement in summer 2014 was due to transport from the Northwest Territories fires as shown by Lutsch et al. (2016).
4.9 Nitrous oxide
Nitrous oxide (N2O) is the fourth most important anthropogenic greenhouse gas (IPCC, 2013), but thus far emissions of N2O are not controlled. N2O has many sources: the ocean, soils, biomass burning, chemical fertilizers, and livestock (Jacob, 1999). With the phasing out of CFCs under the Montreal Protocol and its subsequent amendments, it has become the most important ozone-depleting substance (Ravishankara et al., 2009). N2O is long-lived, with a lifetime of approximately 114 years. It is transported up to the stratosphere, where it is lost through photodissociation and oxidation to N2 or oxidation to NO, contributing to the loss of O3 by the NOx-catalyzed mechanism (Bates and Hays, 1967; Crutzen, 1970; McElroy and McConnell, 1971). The FTIR measurements have sensitivity both in the stratosphere (mean DOFS of 1.24) and the troposphere (mean DOFS of 1.66), with the total- and partial-column time series plotted in Fig. 32a. The mean total-column DOFS is 2.90. For the total columns, the mean systematic error is 3.59 % and is dominated by line intensity error, while the mean random error is 1.44 %, which is principally composed of the SZA error. The TAO total-column measurements of N2O show no seasonal cycle, but a seasonal cycle does exist in the stratospheric partial columns, shown in Fig. 32b, and has been examined in Whaley et al. (2013). Diminished total columns values, shown Fig. 32c, have been used to identify midlatitude polar vortex intrusions in Whaley et al. (2013).
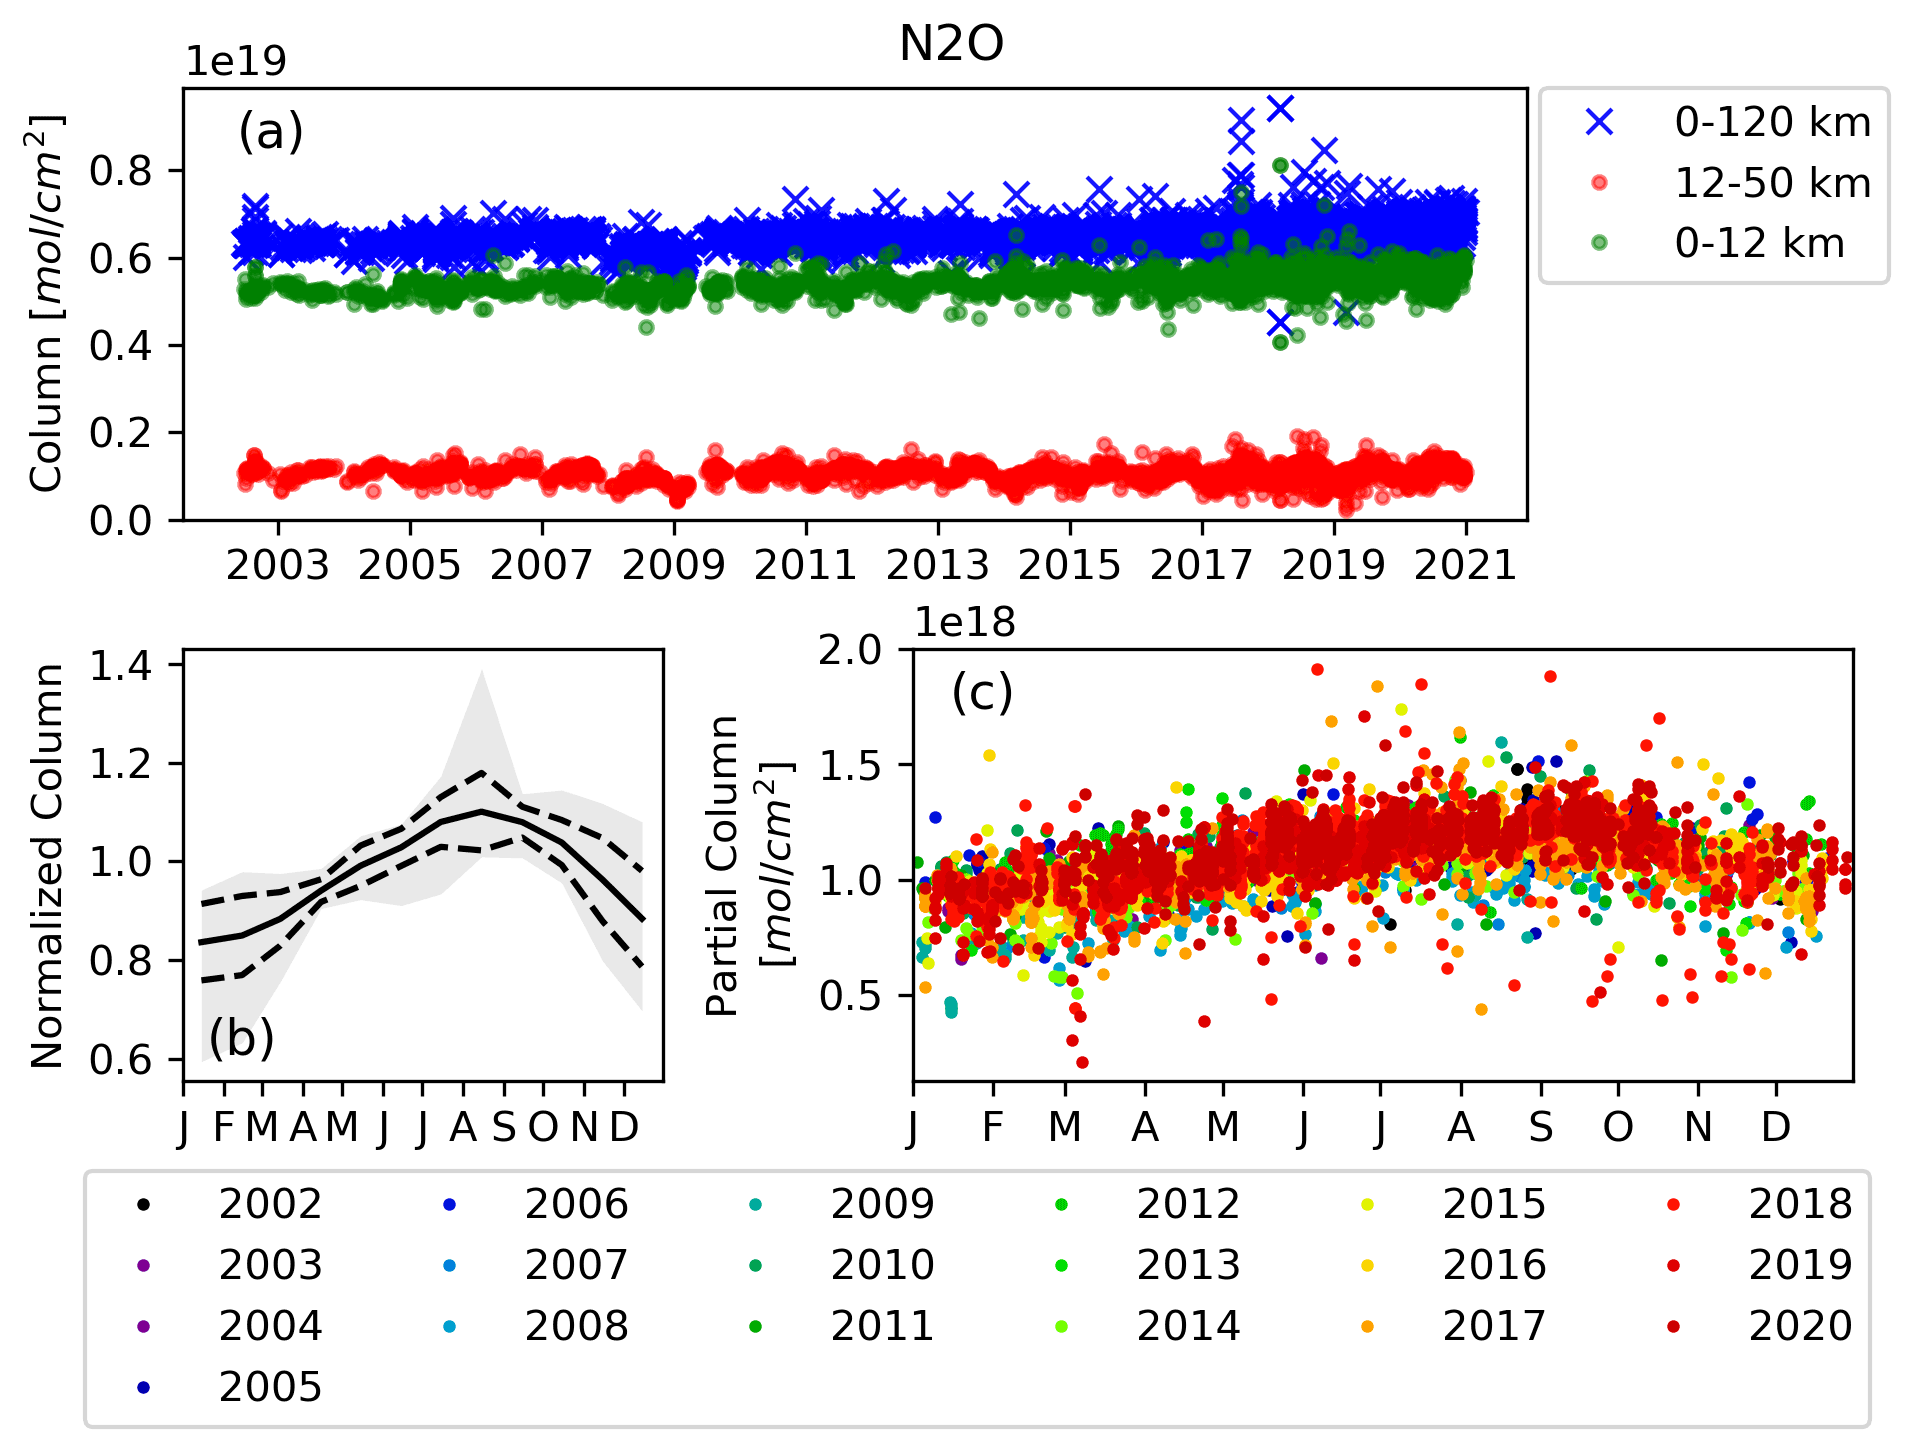
Figure 32Same as Fig. 24 but for N2O, except for (b) and (c), where the monthly stratospheric partial columns are plotted and the range of mean monthly values are shaded in gray to illustrate the seasonal cycle in the stratospheric partial column.
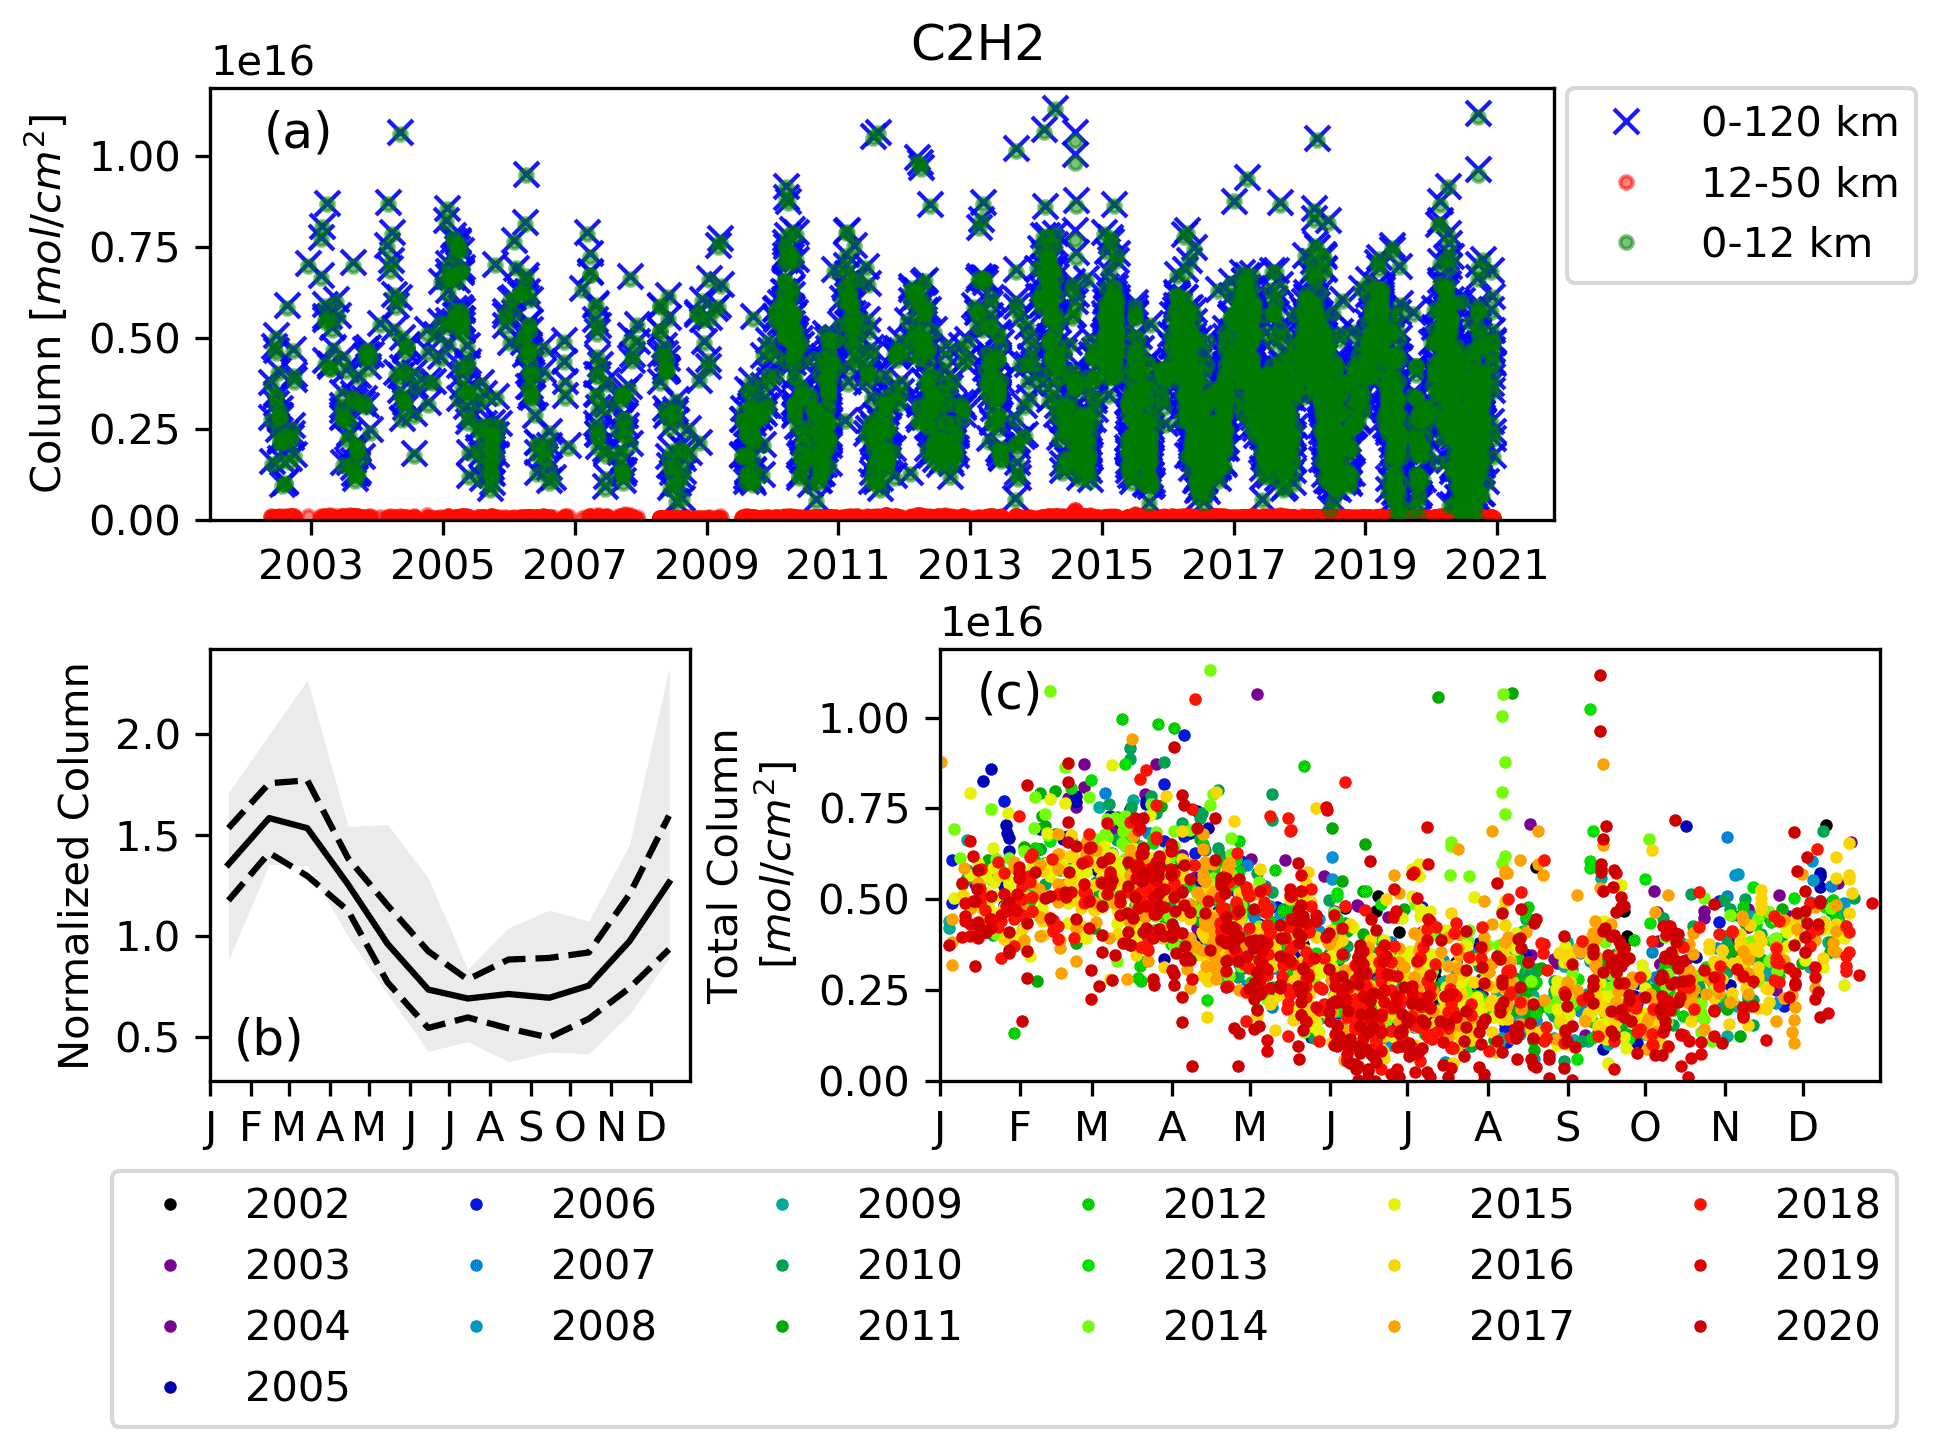
4.10 Acetylene
The main sources of acetylene (C2H2) are combustion of fossil fuels, biofuel use, and biomass burning (Xiao et al., 2007, and references therein). The total columns of C2H2 measured at TAO, shown in Fig. 33a, are dominated by the tropospheric partial columns, with a mean total DOFS of 1.42 and a mean tropospheric DOFS of 1.34. The total-column mean random error is 34.04 %, which is primarily the measurement error. The systematic error in the total columns is smaller, with a mean of 10.88 %, principally composed of temperature dependence error. Unlike CO and HCN, biomass burning emissions of C2H2 are generally not observed in the time series for Toronto. Although the lifetime of C2H2, approximately 2 weeks (Xiao et al., 2007), is sufficiently long to support transport of biomass burning emissions, its abundance during these events is low and difficult to detect within the C2H2 total columns at Toronto, which are dominated by anthropogenic sources that account for most of the variability seen in Fig. 33c. The seasonal cycle of C2H2, shown in Fig. 33b, has a minimum in the summer months as a result of its destruction by oxidation by OH. Maximum total columns are observed in the winter months when the production of OH is minimal due to decreased ozone photolysis.
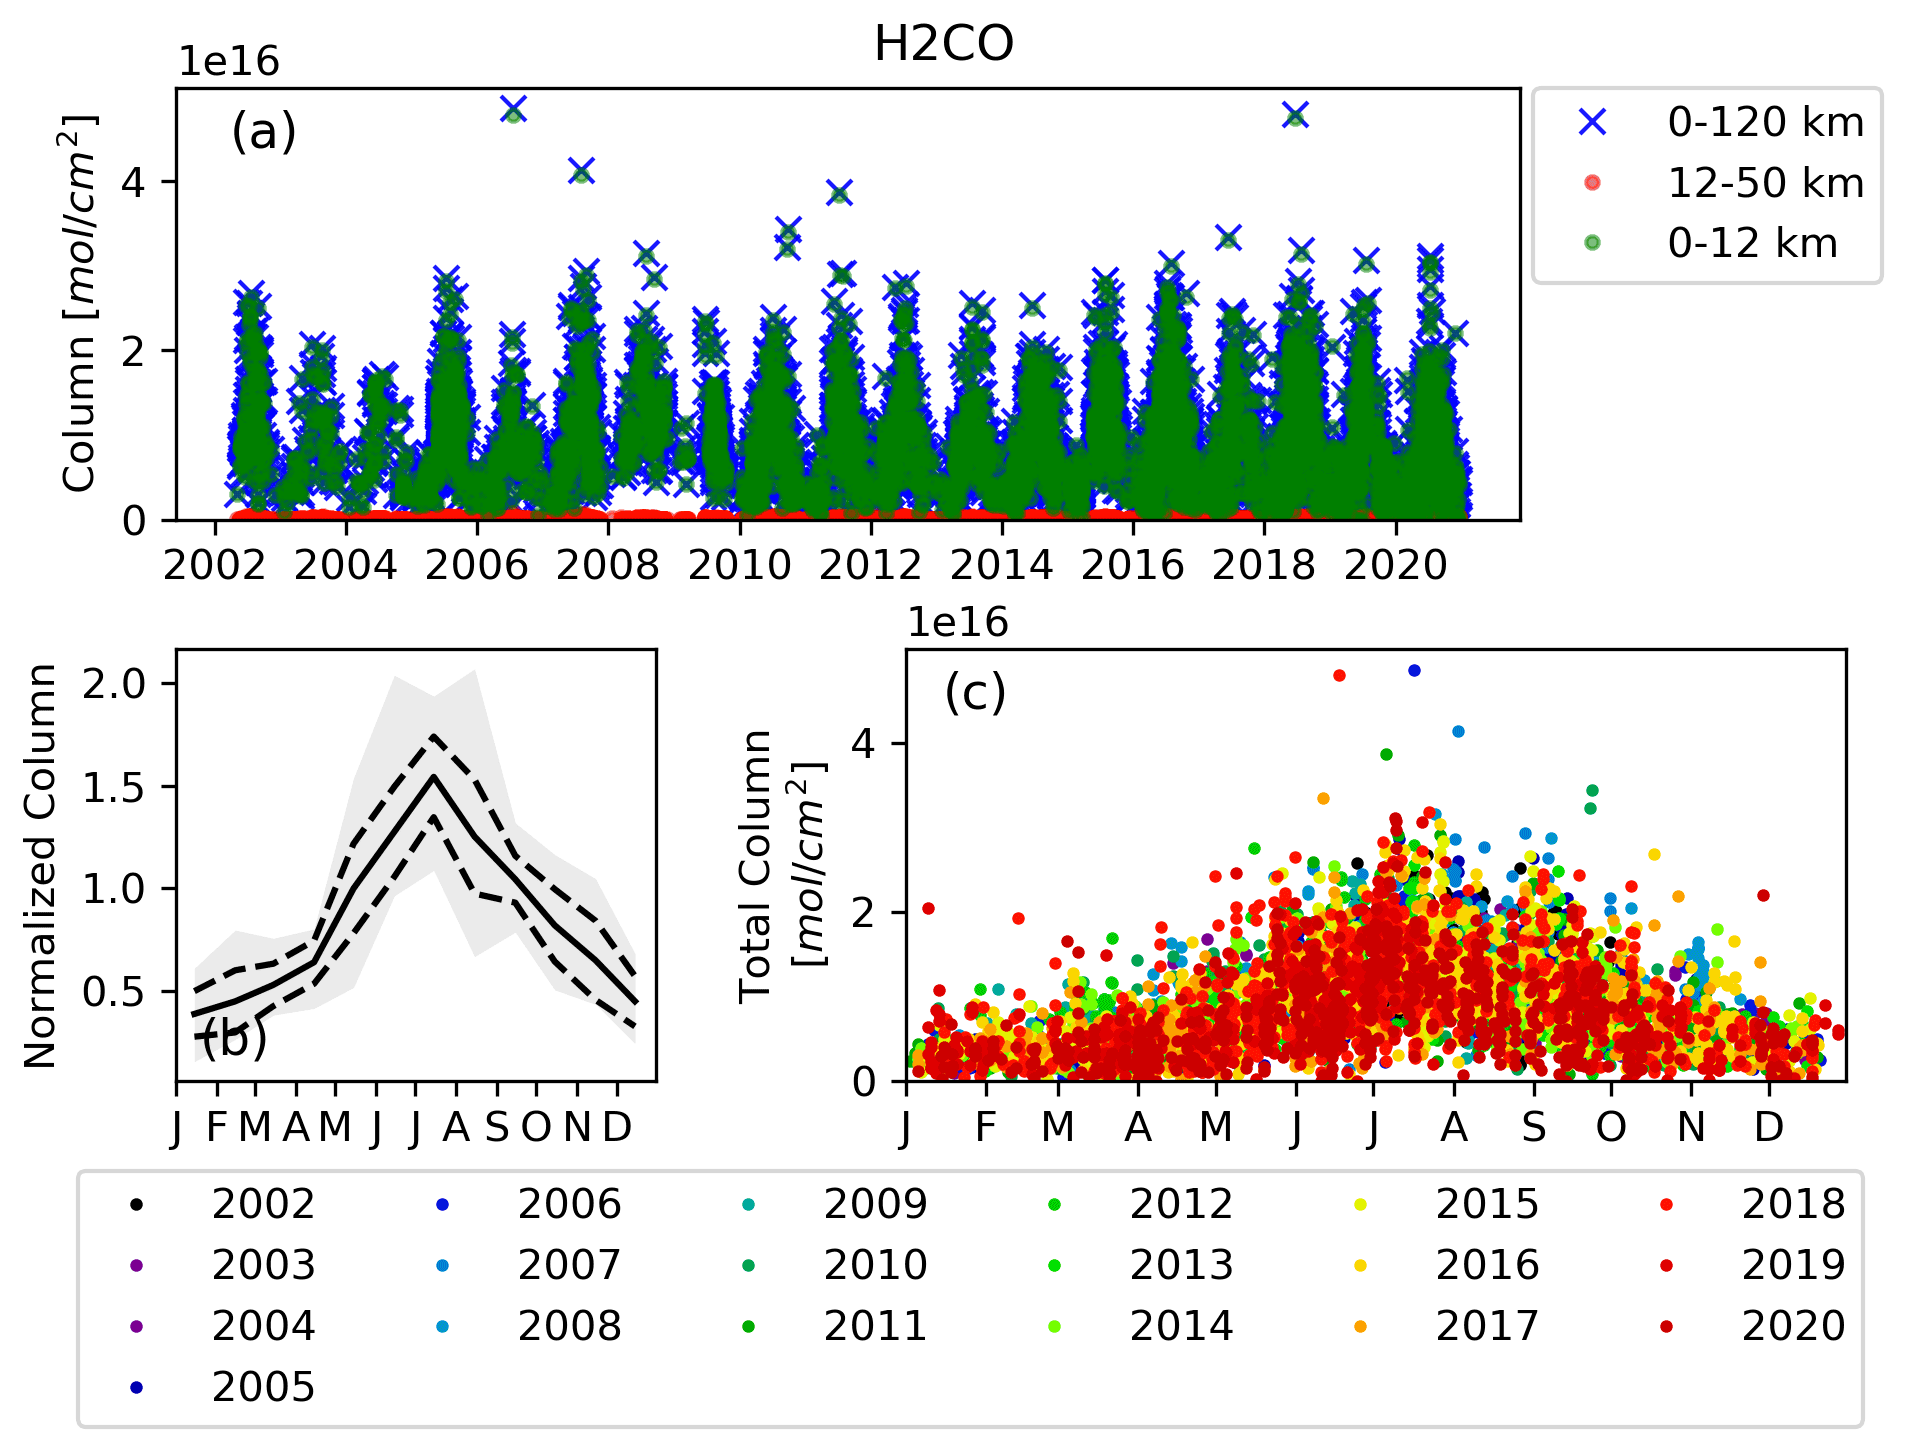
4.11 Formaldehyde
Formaldehyde (H2CO) is produced by the oxidation of CH4 and volatile organic compounds (VOCs). It reacts rapidly with OH and has a lifetime of several hours. It is an important species for understanding photo-oxidation pathways of the atmosphere (Jones et al., 2009). The total column of H2CO (mean DOFS of 1.23) is almost entirely located in the troposphere (mean DOFS of 1.07) as shown in Fig. 34a. The mean systematic error in the total columns is 13.66 %, principally composed of line intensity error, and the total-column mean random error is 7.71 %, primarily composed of SZA error. The seasonal cycle of H2CO at Toronto, shown in Fig. 34b, is mainly driven by its production by the oxidation of CH4 and VOCs, which are emitted by plants and vegetation in the summer months as well as by fossil fuels. H2CO concentrations are highly variable, due to its short lifetime, ranging from total columns of 1015 to 1016 molec. cm−2, as can be seen in Fig. 34c.
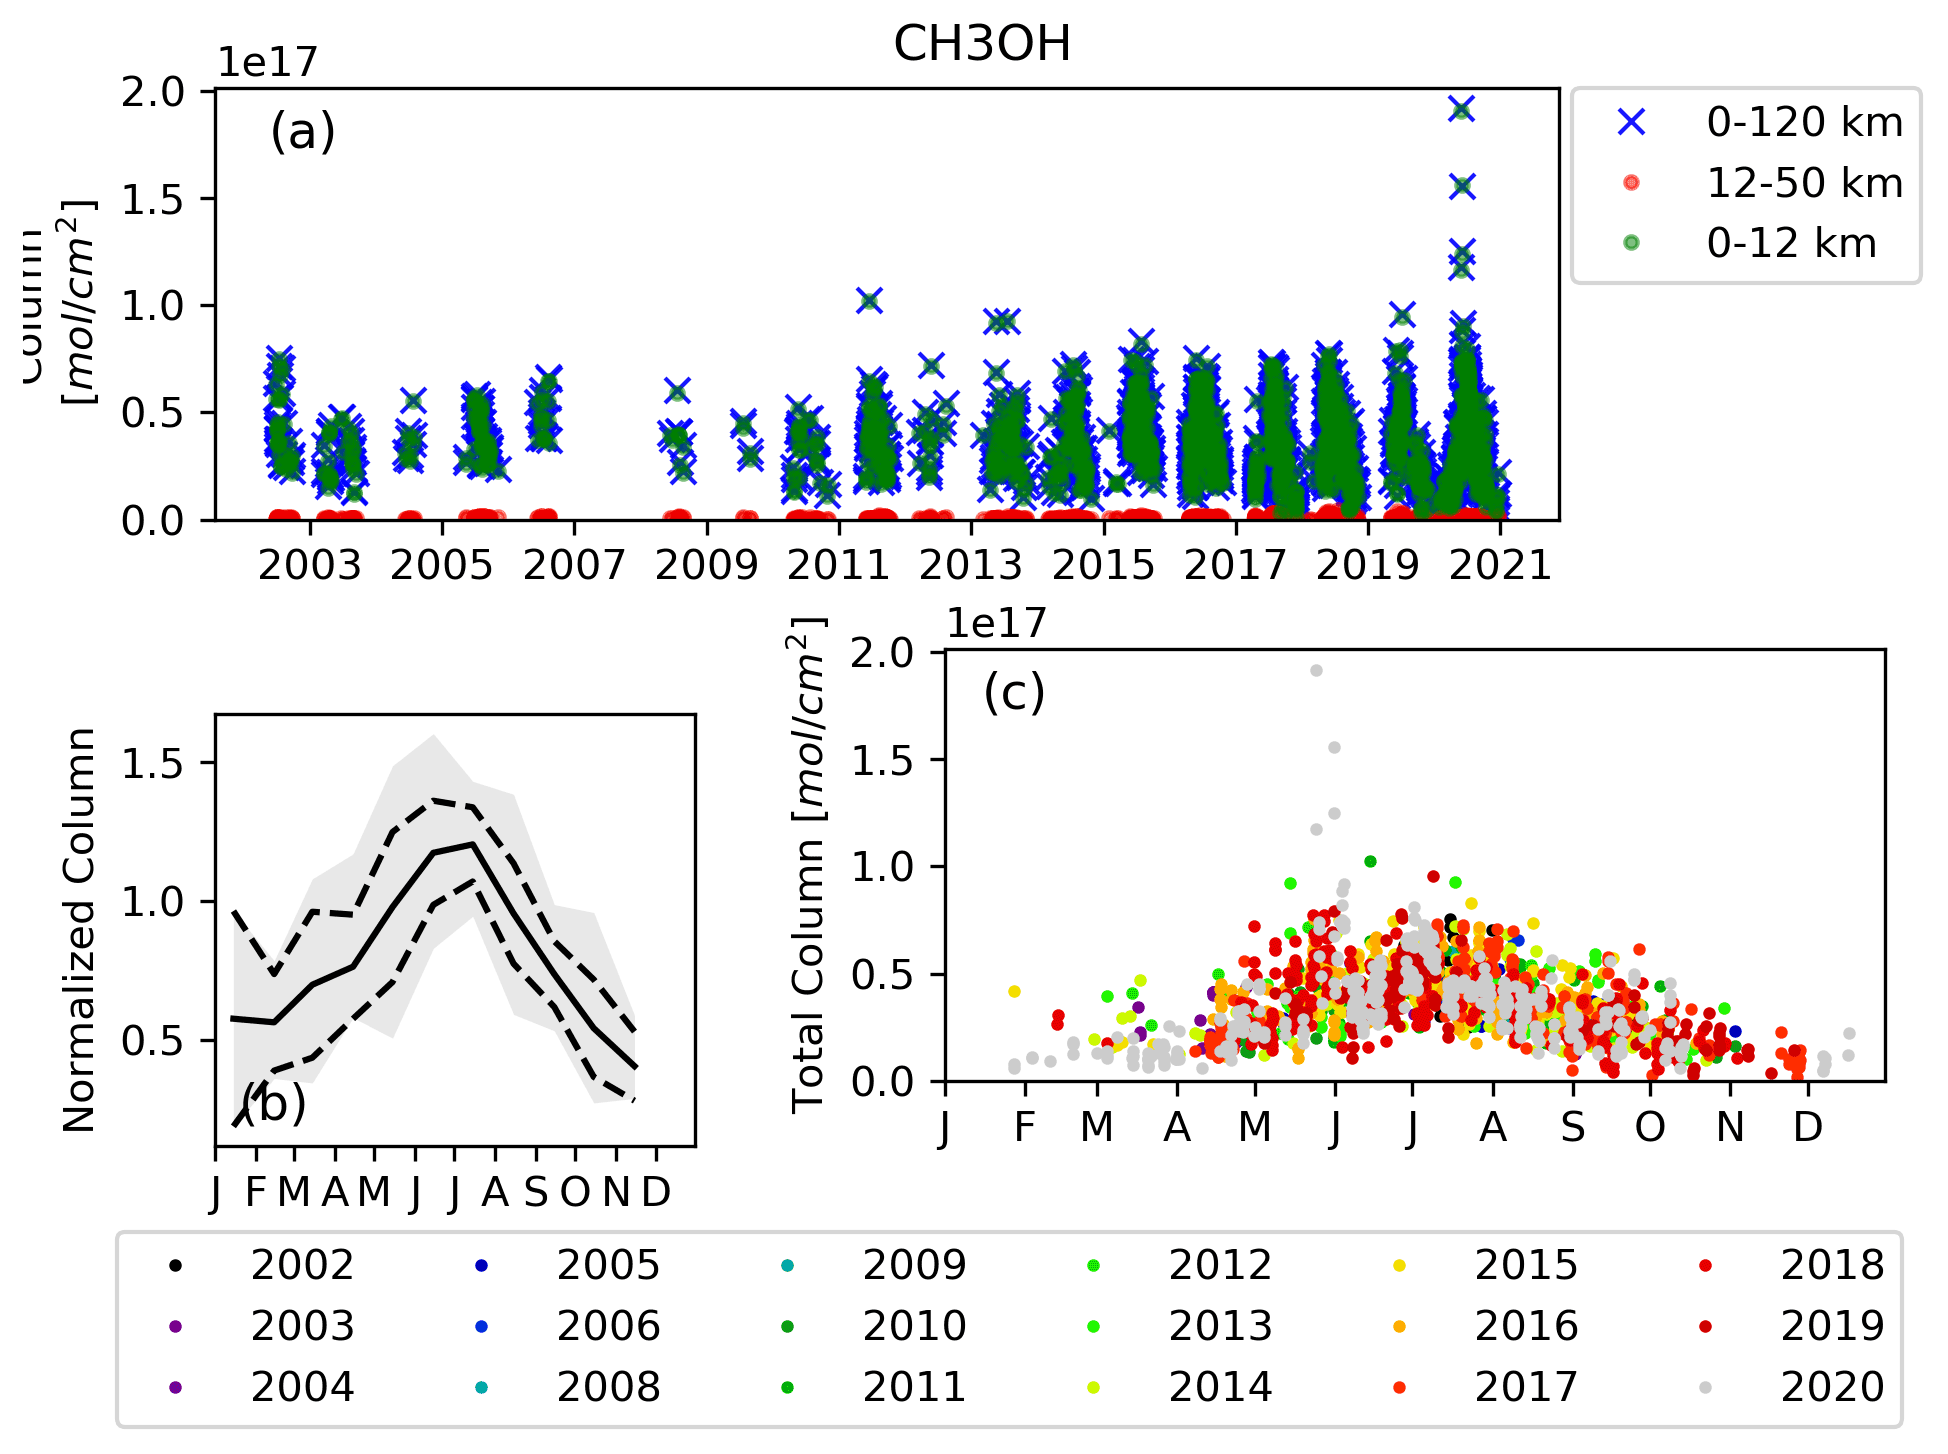
4.12 Methanol
Methanol (CH3OH) is one of the most abundant non-methane volatile organic gases in the atmosphere (Jacob et al., 2005) and is an important precursor for the formation of CO and H2CO (Hu et al., 2011, and references therein). Methanol is relatively short-lived with a lifetime ranging from several days in the boundary layer (Heikes et al., 2002) to several weeks on a global scale (Jacob et al., 2005; Stavrakou et al., 2011). The total columns of CH3OH, shown in Fig. 35a, are dominated by the tropospheric partial column. Accordingly, the mean DOFS of the total column is 1.49, and the mean DOFS of the tropospheric partial column is only slightly lower at 1.41. For total columns, the mean systematic error is 15.31 % and the mean random error is 3.72 %. The seasonal cycle at Toronto, plotted in Fig. 35b, shows increasing total columns from the spring to summer months, falling below the detection limit in winter. This seasonal cycle is due to natural and biogenic sources of CH3OH, while the main loss is due to reaction with OH.
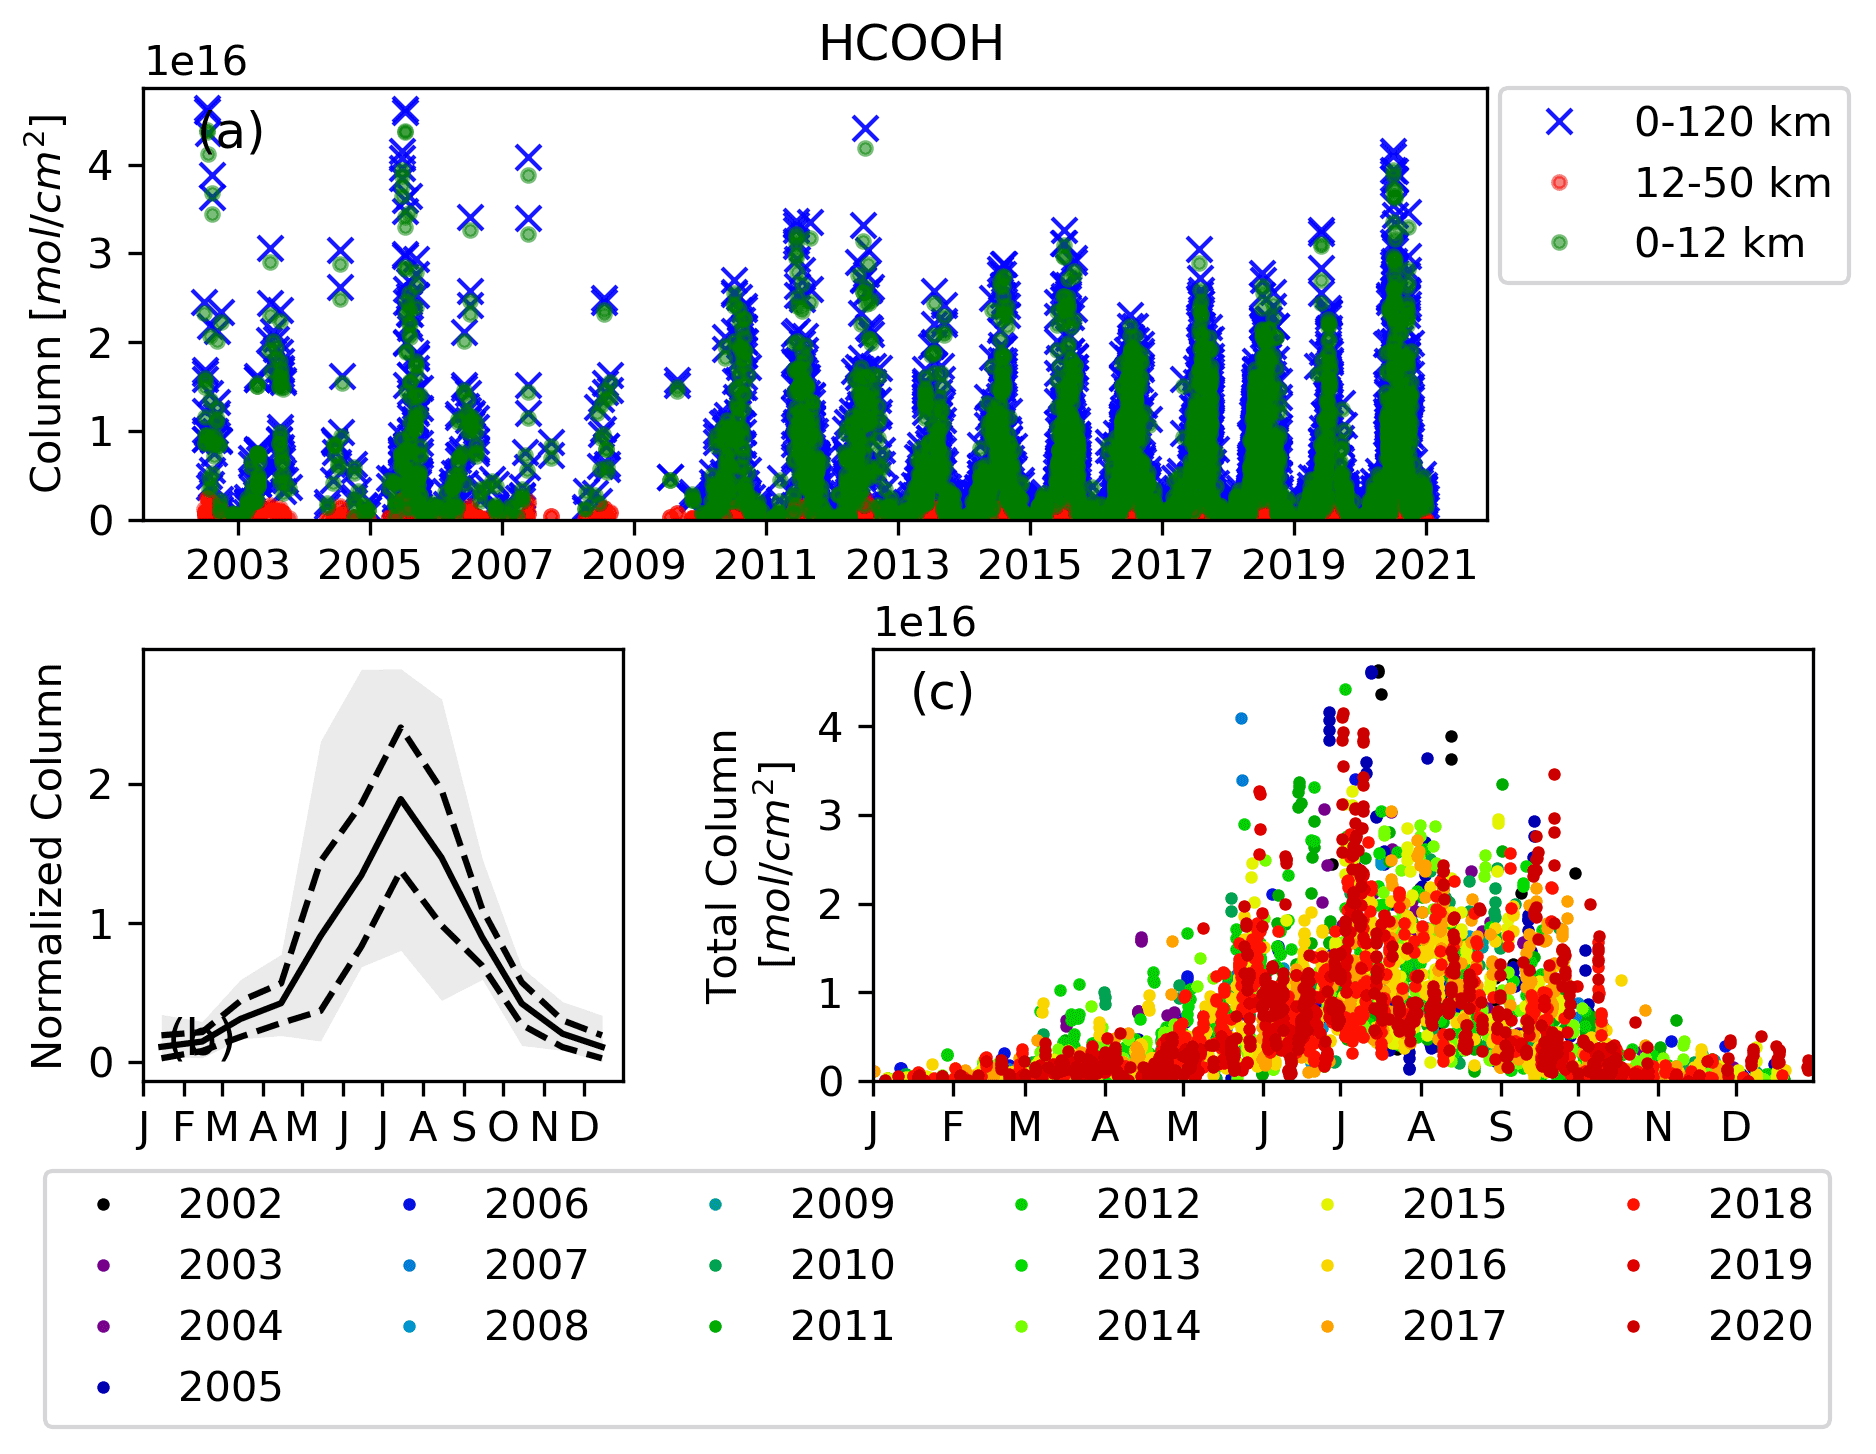
4.13 Formic acid
Formic acid (HCOOH) is produced mainly by photochemical oxidation of volatile organic compounds (Millet et al., 2015; Franco et al., 2021) and is the second most abundant global organic acid in the atmosphere (Zander et al., 2010). It is also emitted directly by vegetation (Kesselmeier and Staudt, 1999; Kesselmeier, 2001) and biomass burning (Goode et al., 2000). The main sinks of formic acid are its reaction with OH and both dry and wet deposition (Stavrakou et al., 2012). The atmospheric lifetime of HCOOH is relatively short and has been estimated to be on the order of 3 or 4 d (Paulot et al., 2011). The total columns of HCOOH at Toronto (mean DOFS of 1.06), shown in Fig. 36a, are mostly tropospheric (mean DOFS of 0.95). For total columns, the mean systematic error is 10.41 % and the mean random error is 9.18 %. The high-percentage mean errors are due to errors in small total-column amounts. The random error is dominated by the retrieval parameter error. The seasonal cycle of HCOOH at Toronto, shown in Fig. 36b, is driven by biogenic emissions as observed by the sharp increase in the total columns during the summer months. Due to the short lifetime of HCOOH, long-range transport of biomass burning emissions is likely not an important source of HCOOH at Toronto, making attribution of enhancements, seen in the time series plot in Fig. 36c, to biomass burning events difficult (Yamanouchi et al., 2020).
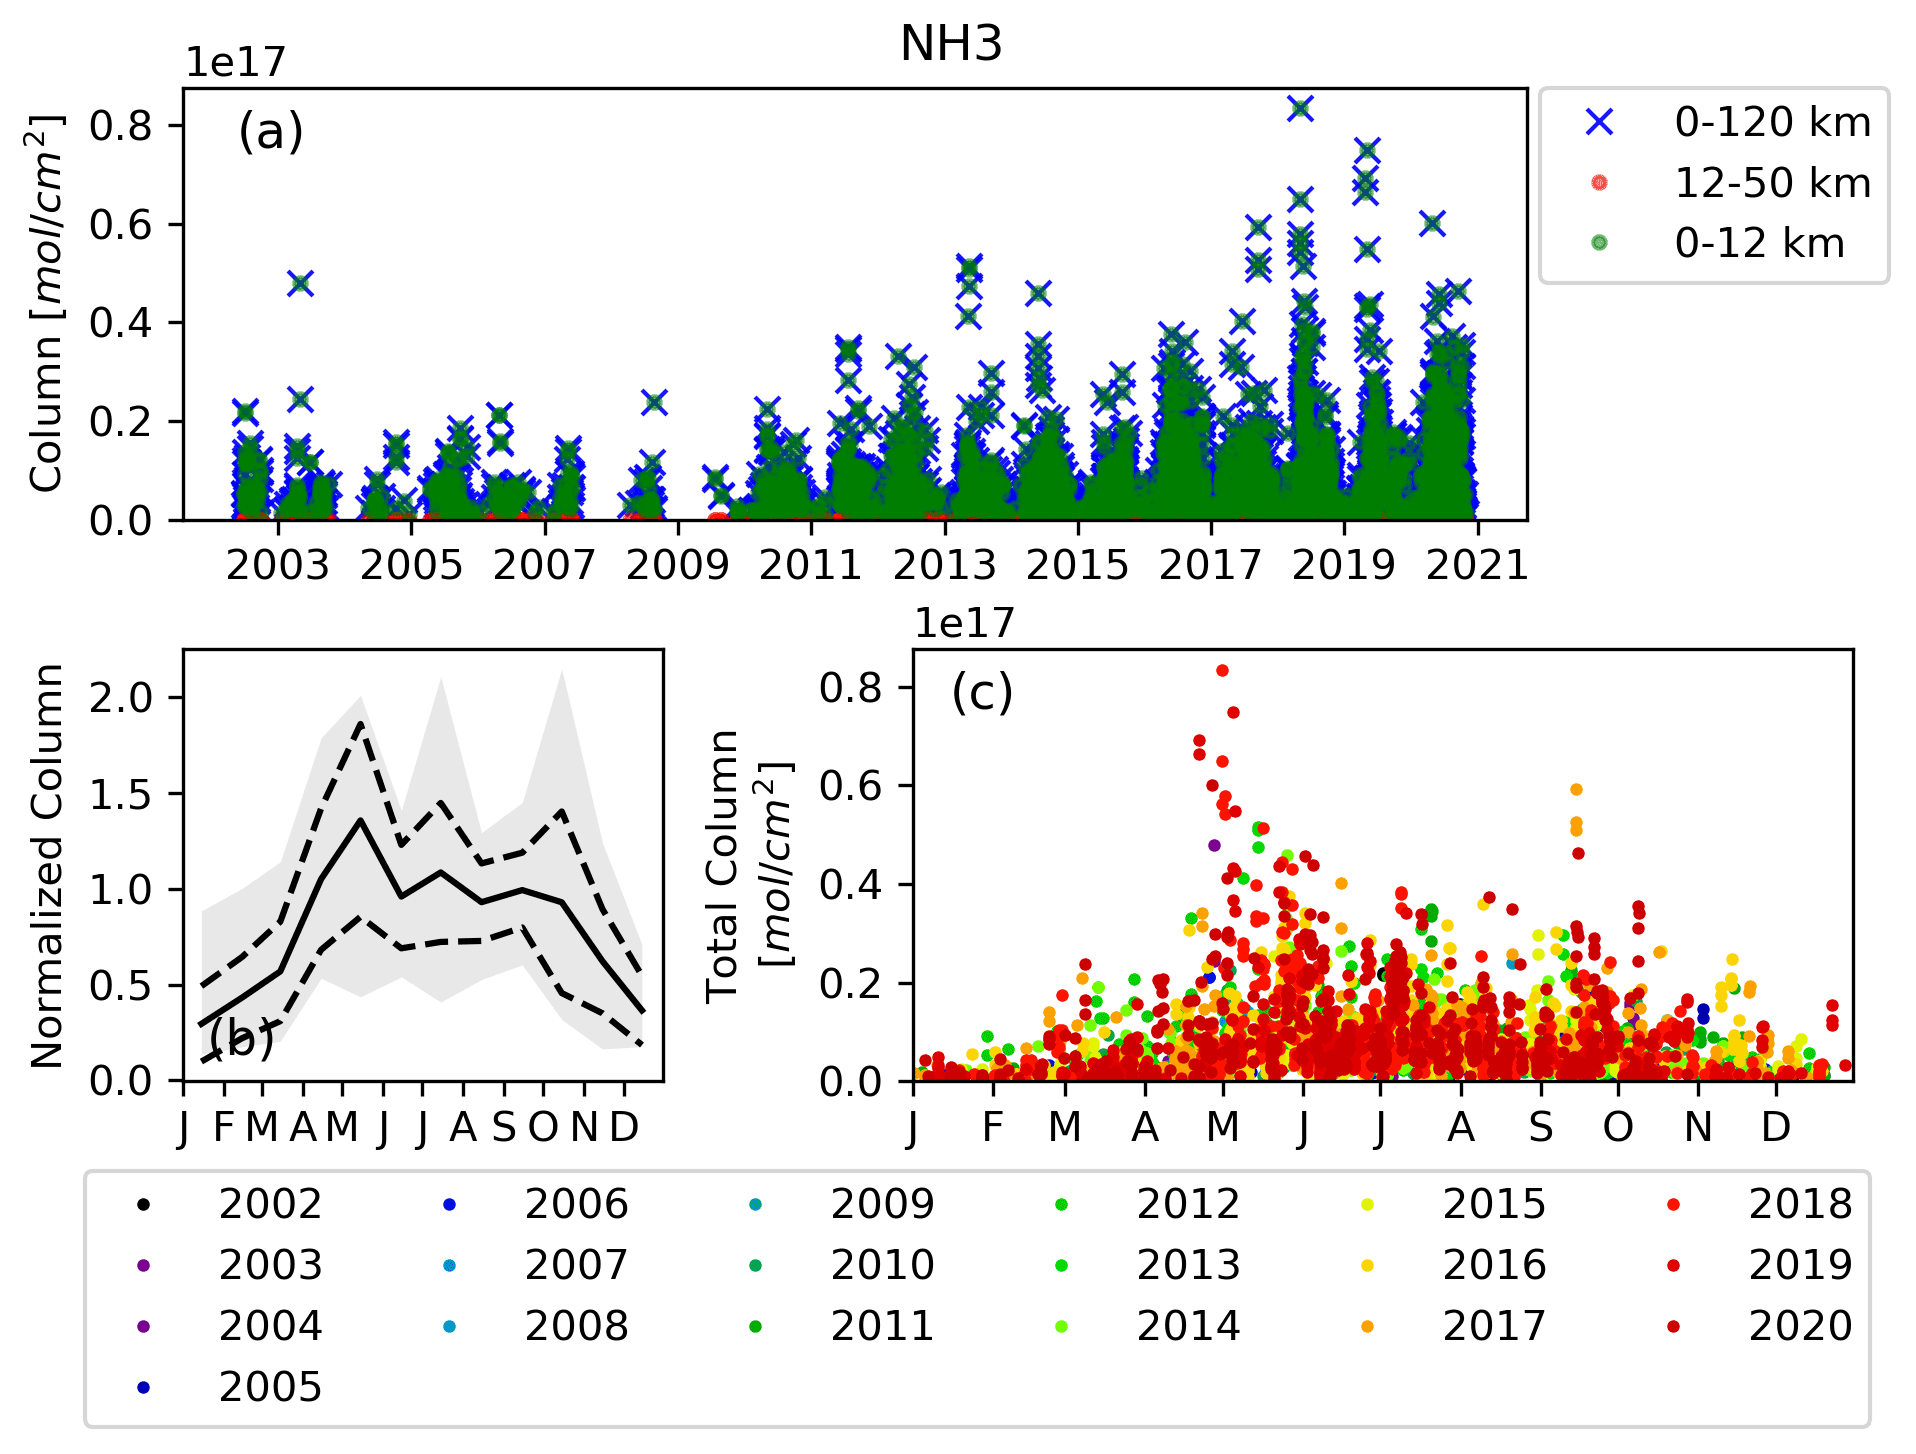
4.14 Ammonia
Ammonia (NH3) is highly reactive and soluble, and it is the most abundant alkaline trace gas. It reacts rapidly with other trace gases to contribute to aerosol formation (Hertel et al., 2012) and therefore has notable effects on air quality (Pope et al., 2009; Erisman et al., 2011). The main sources of NH3 are agricultural emissions, biogenic sources, and fossil fuel use. Biomass burning also contributes to considerable emissions of NH3 (e.g., Bouwman et al., 1997). The FTIR time series of NH3, shown in Fig. 37a, is only sensitive to the boundary layer and troposphere, where NH3 is most abundant. The mean DOFS for NH3, which is primarily contained within the tropospheric partial column, is 1.10. The total-column mean systematic error is 11.85 %, and the total-column mean random error is 13.25 %. The systematic error is primarily measurement error, and the random error is primarily temperature dependence error. Similarly to HCCOH, these high-percentage errors reflect the small total columns of NH3 that occur throughout the time series. The time series of NH3 total columns at Toronto show a weak seasonal cycle, as seen in Fig. 37b. Yamanouchi et al. (2021b) have shown that TAO total-column NH3 has a similar seasonality to surface NH3 measurements. Although NH3 columns are largest in the summer months, its emissions are episodic as seen in Fig. 37c. The short lifetime of ammonia, ranging from 1 to 5 d (Warneck, 1988), also contributes to its variability. Biomass burning is an important source of NH3, but its short lifetime makes long-range transport of NH3 to Toronto infrequent. However, in August 2014, enhancements of NH3 along with simultaneous enhancements of CO, HCN, and C2H6 were observed and attributed to fires in the Northwest Territories, as discussed by Lutsch et al. (2016). Toronto NH3 measurements have also been used to validate the Infrared Atmospheric Sounding Interferometer (IASI) NH3 product (Dammers et al., 2016) and CrIS (Cross-track Infrared Sounder) NH3 retrieval column and profile measurements (Dammers et al., 2017).
The TAO FTIR data are regularly archived in the NDACC data repository at https://www-air.larc.nasa.gov/missions/ndacc/data.html?station=toronto.tao/hdf/ftir/ (last access: 4 July 2023), and the data presented in this work are available on Borealis, the Canadian Dataverse Repository at https://doi.org/10.5683/SP2/VC8JMC (Yamanouchi et al., 2022).
The SFIT4 retrieval code is available at https://wiki.ucar.edu/display/sfit4 (Hannigan et al., 2022a).
This work describes the 19-year trace gas time series derived from high-resolution FTIR solar absorption spectra recorded at the University of Toronto Atmospheric Observatory. The instrumentation is described, along with the retrieval strategy, error analysis, and quality assurance methods. The following nine trace gases are retrieved regularly as part of the NDACC IRWG: O3, HCl, HF, HNO3, CH4, C2H6, CO, HCN, and N2O. Additionally, C2H2, H2CO, CH3OH, HCOOH, and NH3 are retrieved routinely. Total-column measurements, retrieved profiles, averaging kernels, error values, and error covariance matrices, along with retrieved or a priori water vapor columns and profiles depending on the retrieval strategy, are included in the Generic Earth Observation Metadata Standard (GEOMS) HDF data files that are archived in the NDACC data repository and on Borealis, the Canadian Dataverse Repository. In addition to the total-column time series, partial-column time series can be calculated based on the information provided, allowing users to study the different layers of the atmosphere. These data products have been included in a number of studies since routine measurements began in 2002 and can continue to be used to gain a better understanding of the dynamics, chemistry, and evolution of the atmosphere over Toronto, Ontario, Canada.
SY, SC, and KS conceived this study. AW, JT, CHW, SC, SY, EL, SR, and OC operated the TAO FTIR and contributed to data acquisition and earlier analyses. SY performed the SFIT4 retrievals, following on from previous work by SC and EL. SC wrote an early version of the paper, and SY wrote the final version. All of the authors discussed the results and reviewed and provided commentary on the paper. KS was responsible for funding acquisition and management of TAO.
The contact author has declared that none of the authors has any competing interests.
Publisher's note: Copernicus Publications remains neutral with regard to jurisdictional claims in published maps and institutional affiliations.
Funding for this work was provided by the Natural Sciences and Engineering Research Council of Canada (including the NSERC CREATE Training Program in Technologies for Exo-Planetary Science), the Canadian Space Agency, and Environment and Climate Change Canada. The TAO measurements have been supported in the past by the Canadian Foundation for Climate and Atmospheric Sciences, ABB Bomem Inc., the Canada Foundation for Innovation, the Ontario Research and Development Challenge Fund, the Premier's Research Excellence Award, and the University of Toronto. The CST active tracking software was adapted to work with TAO optics by Yi Gao, Orfeo Colebatch, and Sèbastien Roche. We also wish to thank the many students, postdocs, and interns who have contributed to TAO data acquisition over the last 2 decades.
This research has been supported by the Natural Sciences and Engineering Research Council of Canada (grant nos. RGPIN-2019-06979 and CREATE-482699-2016) and Environment and Climate Change Canada (grant no. GCXE19S039).
This paper was edited by Iolanda Ialongo and reviewed by Frank Hase and one anonymous referee.
Abreu, D., Chandan, D., Holzworth, R. H., and Strong, K.: A performance assessment of the World Wide Lightning Location Network (WWLLN) via comparison with the Canadian Lightning Detection Network (CLDN), Atmos. Meas. Tech., 3, 1143–1153, https://doi.org/10.5194/amt-3-1143-2010, 2010.
Angelbratt, J., Mellqvist, J., Blumenstock, T., Borsdorff, T., Brohede, S., Duchatelet, P., Forster, F., Hase, F., Mahieu, E., Murtagh, D., Petersen, A. K., Schneider, M., Sussmann, R., and Urban, J.: A new method to detect long term trends of methane (CH4) and nitrous oxide (N2O) total columns measured within the NDACC ground-based high resolution solar FTIR network, Atmos. Chem. Phys., 11, 6167–6183, https://doi.org/10.5194/acp-11-6167-2011, 2011.
Bader, W., Bovy, B., Conway, S., Strong, K., Smale, D., Turner, A. J., Blumenstock, T., Boone, C., Collaud Coen, M., Coulon, A., Garcia, O., Griffith, D. W. T., Hase, F., Hausmann, P., Jones, N., Krummel, P., Murata, I., Morino, I., Nakajima, H., O'Doherty, S., Paton-Walsh, C., Robinson, J., Sandrin, R., Schneider, M., Servais, C., Sussmann, R., and Mahieu, E.: The recent increase of atmospheric methane from 10 years of ground-based NDACC FTIR observations since 2005, Atmos. Chem. Phys., 17, 2255–2277, https://doi.org/10.5194/acp-17-2255-2017, 2017.
Bates, D. R. and Hays, P. B.: Atmospheric nitrous oxide, Planet. Space Sci., 15, 189–197, https://doi.org/10.1016/0032-0633(67)90074-8, 1967.
Baum, M. M., Moss, J. A., Pastel, S. H., and Poskrebyshev, G. A.: Hydrogen cyanide exhaust emissions from in-use motor vehicles, Environ. Sci. Technol., 41, 857–862, https://doi.org/10.1021/es061402v, 2007.
Blumenstock, T., Hase, F., Keens, A., Czurlok, D., Colebatch, O., Garcia, O., Griffith, D. W. T., Grutter, M., Hannigan, J. W., Heikkinen, P., Jeseck, P., Jones, N., Kivi, R., Lutsch, E., Makarova, M., Imhasin, H. K., Mellqvist, J., Morino, I., Nagahama, T., Notholt, J., Ortega, I., Palm, M., Raffalski, U., Rettinger, M., Robinson, J., Schneider, M., Servais, C., Smale, D., Stremme, W., Strong, K., Sussmann, R., Té, Y., and Velazco, V. A.: Characterization and potential for reducing optical resonances in Fourier transform infrared spectrometers of the Network for the Detection of Atmospheric Composition Change (NDACC), Atmos. Meas. Tech., 14, 1239–1252, https://doi.org/10.5194/amt-14-1239-2021, 2021.
Bouwman, A. F., Lee, D. S., Asman, W. A. H., Dentener, F. J., Van Der Hoek, K. W., and Olivier, J. G. J.: A global high-resolution emission inventory for ammonia, Global Biogeochem. Cy., 11, 561–587, https://doi.org/10.1029/97GB02266, 1997.
Buchholz, R. R., Deeter, M. N., Worden, H. M., Gille, J., Edwards, D. P., Hannigan, J. W., Jones, N. B., Paton-Walsh, C., Griffith, D. W. T., Smale, D., Robinson, J., Strong, K., Conway, S., Sussmann, R., Hase, F., Blumenstock, T., Mahieu, E., and Langerock, B.: Validation of MOPITT carbon monoxide using ground-based Fourier transform infrared spectrometer data from NDACC, Atmos. Meas. Tech., 10, 1927–1956, https://doi.org/10.5194/amt-10-1927-2017, 2017.
Butchart, N.: The Brewer-Dobson circulation, Rev. Geophys., 52, 157–184, https://doi.org/10.1002/2013RG000448, 2014.
Byrne, B., Strong, K., Colebatch, O., You, Y., Wunch, D., Ars, S., Jones, D. B. A., Fogal, P., Mittermeier, R. L., Worthy, D., and Griffith, D. W. T.: Monitoring Urban Greenhouse Gases Using Open-Path Fourier Transform Spectroscopy, Atmos. Ocean, 58, 25–45, https://doi.org/10.1080/07055900.2019.1698407, 2020.
Clerbaux, C., George, M., Turquety, S., Walker, K. A., Barret, B., Bernath, P., Boone, C., Borsdorff, T., Cammas, J. P., Catoire, V., Coffey, M., Coheur, P.-F., Deeter, M., De Mazière, M., Drummond, J., Duchatelet, P., Dupuy, E., de Zafra, R., Eddounia, F., Edwards, D. P., Emmons, L., Funke, B., Gille, J., Griffith, D. W. T., Hannigan, J., Hase, F., Höpfner, M., Jones, N., Kagawa, A., Kasai, Y., Kramer, I., Le Flochmoën, E., Livesey, N. J., López-Puertas, M., Luo, M., Mahieu, E., Murtagh, D., Nédélec, P., Pazmino, A., Pumphrey, H., Ricaud, P., Rinsland, C. P., Robert, C., Schneider, M., Senten, C., Stiller, G., Strandberg, A., Strong, K., Sussmann, R., Thouret, V., Urban, J., and Wiacek, A.: CO measurements from the ACE-FTS satellite instrument: data analysis and validation using ground-based, airborne and spaceborne observations, Atmos. Chem. Phys., 8, 2569–2594, https://doi.org/10.5194/acp-8-2569-2008, 2008.
Crutzen, P. J.: The influence of nitrogen oxides on the atmospheric ozone content, Q. J. Roy. Meteor. Soc., 96, 320–325, https://doi.org/10.1002/qj.49709640815, 1970.
Dammers, E., Vigouroux, C., Palm, M., Mahieu, E., Warneke, T., Smale, D., Langerock, B., Franco, B., Van Damme, M., Schaap, M., Notholt, J., and Erisman, J. W.: Retrieval of ammonia from ground-based FTIR solar spectra, Atmos. Chem. Phys., 15, 12789–12803, https://doi.org/10.5194/acp-15-12789-2015, 2015.
Dammers, E., Palm, M., Van Damme, M., Vigouroux, C., Smale, D., Conway, S., Toon, G. C., Jones, N., Nussbaumer, E., Warneke, T., Petri, C., Clarisse, L., Clerbaux, C., Hermans, C., Lutsch, E., Strong, K., Hannigan, J. W., Nakajima, H., Morino, I., Herrera, B., Stremme, W., Grutter, M., Schaap, M., Wichink Kruit, R. J., Notholt, J., Coheur, P.-F., and Erisman, J. W.: An evaluation of IASI-NH3 with ground-based Fourier transform infrared spectroscopy measurements, Atmos. Chem. Phys., 16, 10351–10368, https://doi.org/10.5194/acp-16-10351-2016, 2016.
Dammers, E., Shephard, M. W., Palm, M., Cady-Pereira, K., Capps, S., Lutsch, E., Strong, K., Hannigan, J. W., Ortega, I., Toon, G. C., Stremme, W., Grutter, M., Jones, N., Smale, D., Siemons, J., Hrpcek, K., Tremblay, D., Schaap, M., Notholt, J., and Erisman, J. W.: Validation of the CrIS fast physical NH3 retrieval with ground-based FTIR, Atmos. Meas. Tech., 10, 2645–2667, https://doi.org/10.5194/amt-10-2645-2017, 2017.
De Mazière, M., Vigouroux, C., Bernath, P. F., Baron, P., Blumenstock, T., Boone, C., Brogniez, C., Catoire, V., Coffey, M., Duchatelet, P., Griffith, D., Hannigan, J., Kasai, Y., Kramer, I., Jones, N., Mahieu, E., Manney, G. L., Piccolo, C., Randall, C., Robert, C., Senten, C., Strong, K., Taylor, J., Tétard, C., Walker, K. A., and Wood, S.: Validation of ACE-FTS v2.2 methane profiles from the upper troposphere to the lower mesosphere, Atmos. Chem. Phys., 8, 2421–2435, https://doi.org/10.5194/acp-8-2421-2008, 2008.
De Mazière, M., Thompson, A. M., Kurylo, M. J., Wild, J. D., Bernhard, G., Blumenstock, T., Braathen, G. O., Hannigan, J. W., Lambert, J.-C., Leblanc, T., McGee, T. J., Nedoluha, G., Petropavlovskikh, I., Seckmeyer, G., Simon, P. C., Steinbrecht, W., and Strahan, S. E.: The Network for the Detection of Atmospheric Composition Change (NDACC): history, status and perspectives, Atmos. Chem. Phys., 18, 4935–4964, https://doi.org/10.5194/acp-18-4935-2018, 2018.
Dils, B., De Mazière, M., Müller, J. F., Blumenstock, T., Buchwitz, M., de Beek, R., Demoulin, P., Duchatelet, P., Fast, H., Frankenberg, C., Gloudemans, A., Griffith, D., Jones, N., Kerzenmacher, T., Kramer, I., Mahieu, E., Mellqvist, J., Mittermeier, R. L., Notholt, J., Rinsland, C. P., Schrijver, H., Smale, D., Strandberg, A., Straume, A. G., Stremme, W., Strong, K., Sussmann, R., Taylor, J., van den Broek, M., Velazco, V., Wagner, T., Warneke, T., Wiacek, A., and Wood, S.: Comparisons between SCIAMACHY and ground-based FTIR data for total columns of CO, CH4, CO2 and N2O, Atmos. Chem. Phys., 6, 1953–1976, https://doi.org/10.5194/acp-6-1953-2006, 2006.
Dupuy, E., Walker, K. A., Kar, J., Boone, C. D., McElroy, C. T., Bernath, P. F., Drummond, J. R., Skelton, R., McLeod, S. D., Hughes, R. C., Nowlan, C. R., Dufour, D. G., Zou, J., Nichitiu, F., Strong, K., Baron, P., Bevilacqua, R. M., Blumenstock, T., Bodeker, G. E., Borsdorff, T., Bourassa, A. E., Bovensmann, H., Boyd, I. S., Bracher, A., Brogniez, C., Burrows, J. P., Catoire, V., Ceccherini, S., Chabrillat, S., Christensen, T., Coffey, M. T., Cortesi, U., Davies, J., De Clercq, C., Degenstein, D. A., De Mazière, M., Demoulin, P., Dodion, J., Firanski, B., Fischer, H., Forbes, G., Froidevaux, L., Fussen, D., Gerard, P., Godin-Beekmann, S., Goutail, F., Granville, J., Griffith, D., Haley, C. S., Hannigan, J. W., Höpfner, M., Jin, J. J., Jones, A., Jones, N. B., Jucks, K., Kagawa, A., Kasai, Y., Kerzenmacher, T. E., Kleinböhl, A., Klekociuk, A. R., Kramer, I., Küllmann, H., Kuttippurath, J., Kyrölä, E., Lambert, J.-C., Livesey, N. J., Llewellyn, E. J., Lloyd, N. D., Mahieu, E., Manney, G. L., Marshall, B. T., McConnell, J. C., McCormick, M. P., McDermid, I. S., McHugh, M., McLinden, C. A., Mellqvist, J., Mizutani, K., Murayama, Y., Murtagh, D. P., Oelhaf, H., Parrish, A., Petelina, S. V., Piccolo, C., Pommereau, J.-P., Randall, C. E., Robert, C., Roth, C., Schneider, M., Senten, C., Steck, T., Strandberg, A., Strawbridge, K. B., Sussmann, R., Swart, D. P. J., Tarasick, D. W., Taylor, J. R., Tétard, C., Thomason, L. W., Thompson, A. M., Tully, M. B., Urban, J., Vanhellemont, F., Vigouroux, C., von Clarmann, T., von der Gathen, P., von Savigny, C., Waters, J. W., Witte, J. C., Wolff, M., and Zawodny, J. M.: Validation of ozone measurements from the Atmospheric Chemistry Experiment (ACE), Atmos. Chem. Phys., 9, 287–343, https://doi.org/10.5194/acp-9-287-2009, 2009.
Erisman, J. W., Galloway, J., Seitzinger, S., Bleeker, A., and Butterbach-Bahl, K.: Reactive nitrogen in the environment and its effect on climate change, Curr. Opin. Env. Sust., 3, 281–290, https://doi.org/10.1016/j.cosust.2011.08.012, 2011.
Franco, B., Mahieu, E., Emmons, L. K., Tzompa-Sosa, Z. A., Fischer, E. V., Sudo, K., Bovy, B., Conway, S., Griffin, D., Hannigan, J. W., Strong, K., and Walker, K. A.: Evaluating ethane and methane emissions associated with the development of oil and natural gas extraction in North America, Environ. Res. Lett., 11, 044010, https://iopscience.iop.org/article/10.1088/1748-9326/11/4/044010, 2016.
Franco, B., Clarisse, L., Stavrakou, T., Müller, J.-F., Taraborrelli, D., Hadji-Lazaro, J., Hannigan, J. W., Hase, F., Hurtmans, D., Jones, N., Lutsch, E., Mahieu, E., Ortega, I., Schneider, M., Strong, K., Vigouroux, C., Clerbaux, C., and Coheur, P.-F.: Spaceborne measurements of formic and acetic acids: A global view of the regional sources, Geophys. Res. Lett., 47, e2019GL086239, https://doi.org/10.1029/2019GL086239, 2020.
Franco, B., Blumenstock, T., Cho, C., Clarisse, L., Clerbaux, C., Coheur, P.-F., De Mazière, M., De Smedt, I., Dorn, H.-P., Emmerichs, T., Fuchs, H., Gkatzelis, G., Griffith, D. W. T., Gromov, S., Hannigan, J. W., Hase, F., Hohaus, T., Jones, N., Kerkweg, A., Kiendler-Scharr, A., Lutsch, E., Mahieu, E., Novell, A., Reimer, D., Rosanka, S., Ortega, I., Paton-Walsh, C., Pommier, A., Pozzer, A., Sander, R., Schneider, M., Strong, K., Tillmann, R., Van Roozendael, M., Vereecken, L., Vigouroux, C., Wahner, A., and Taraborrelli, D.: Ubiquitous atmospheric production of organic acids mediated by cloud droplets, Nature, 593, 233–237, https://doi.org/10.1038/s41586-021-03462-x, 2021.
Franklin, J. E.: Solar Absorption Spectroscopy at the Dalhousie Atmospheric Observatory, PhD thesis, Dalhousie University, Canada, http://hdl.handle.net/10222/64642 (last access: 4 July 2023), 2015.
Fraser, A. C.: Arctic and Midlatitude Stratospheric Trace Gas Measurements Using Ground-based UV-visible Spectroscopy, PhD thesis, University of Toronto, Canada, https://hdl.handle.net/1807/17301 (last access: 4 July 2023), 2008.
Gaubert, B., Arellano Jr., A. F., Barré, J., Worden, H. M., Emmons, L. K., Tilmes, S., Buchholz, R. R., Wiedinmyer, C., Martínez-Alonso, S., Raeder, K., Collins, N., Anderson, J. L., Vitt, F., Edwards, D. P., Andreae, M. O., Hannigan, J. W., Petri, C., Strong, K., and Jones, N.: Towards a chemical reanalysis in a coupled chemistry-climate model: An evaluation of MOPITT CO assimilation and its impact on tropospheric composition, J. Geophys. Res.-Atmos., 121, 7310–7343, https://doi.org/10.1002/2016JD024863, 2016.
Gisi, M., Hase, F., Dohe, S., and Blumenstock, T.: Camtracker: a new camera controlled high precision solar tracker system for FTIR-spectrometers, Atmos. Meas. Tech., 4, 47–54, https://doi.org/10.5194/amt-4-47-2011, 2011.
Goode, J. G., Yokelson, R. J., Ward, D. E., Susott, R. A., Babbitt, R. E., Davies, M. A., and Hao, W. M.: Measurements of excess O3, CO2, CO, CH4, C2H4, C2H2, HCN, NO, NH3, HCOOH, CH3COOH, HCHO, and CH3OH in 1997 Alaskan biomass burning plumes by airborne Fourier transform infrared spectroscopy (AFTIR), J. Geophys. Res., 105, 22147–22166, https://doi.org/10.1029/2000JD900287, 2000.
Griffin, D., Walker, K. A., Franklin, J. E., Parrington, M., Whaley, C., Hopper, J., Drummond, J. R., Palmer, P. I., Strong, K., Duck, T. J., Abboud, I., Bernath, P. F., Clerbaux, C., Coheur, P.-F., Curry, K. R., Dan, L., Hyer, E., Kliever, J., Lesins, G., Maurice, M., Saha, A., Tereszchuk, K., and Weaver, D.: Investigation of CO, C2H6 and aerosols in a boreal fire plume over eastern Canada during BORTAS 2011 using ground- and satellite-based observations and model simulations, Atmos. Chem. Phys., 13, 10227–10241, https://doi.org/10.5194/acp-13-10227-2013, 2013.
Hannigan, J. W, Palm, M., Ortega, I., and Langerock, B.: Infrared Working Group Retrieval Code, SFIT [code], https://wiki.ucar.edu/display/sfit4/, last access: 15 November 2022a.
Hannigan, J. W., Ortega, I., Shams, S. B., Blumenstock, T., Campbell, J. E., Conway, S., Flood, V., Garcia, O., Griffith, D., Grutter, M., Hase, F., Jeseck, P., Jones, N., Mahieu, E., Makarova, M., De Mazière, M., Morino, I., Murata, I., Nagahama, T., Nakijima, H., Notholt, J., Palm, M., Poberovskii, A., Rettinger, M., Robinson, J., Röhling, A. N., Schneider, M., Servais, C., Smale, D., Stremme, W., Strong, K., Sussmann, R., Te, Y., Vigouroux, C., and Wizenberg, T.: Global atmospheric OCS trend analysis from 22 NDACC stations, J. Geophys. Res.-Atmos., 127, e2021JD035764, https://doi.org/10.1029/2021JD035764, 2022b.
Hase, F., Blumenstock, T., and Paton-Walsh, C.: Analysis of the instrumental line shape of high-resolution Fourier transform IR spectrometers with gas cell measurements and new retrieval software, Appl. Opt., 38, 3417–3422, https://doi.org/10.1364/AO.38.003417, 1999.
Hertel, O., Skjøth, C. A., Reis, S., Bleeker, A., Harrison, R. M., Cape, J. N., Fowler, D., Skiba, U., Simpson, D., Jickells, T., Kulmala, M., Gyldenkærne, S., Sørensen, L. L., Erisman, J. W., and Sutton, M. A.: Governing processes for reactive nitrogen compounds in the European atmosphere, Biogeosciences, 9, 4921–4954, https://doi.org/10.5194/bg-9-4921-2012, 2012.
Heikes, B. G., Chang, W., Pilson, M. E. Q., Swift, E., Singh, H. B., Guenther, A., Jacob, D. J., Field, B. D., Fall, R., Riemer, D., and Brand, L.: Atmospheric methanol budget and ocean implication, Global Biogeochem. Cy., 16, 1133, https://doi.org/10.1029/2002GB001895, 2002.
Hu, L., Millet, D. B., Mohr, M. J., Wells, K. C., Griffis, T. J., and Helmig, D.: Sources and seasonality of atmospheric methanol based on tall tower measurements in the US Upper Midwest, Atmos. Chem. Phys., 11, 11145–11156, https://doi.org/10.5194/acp-11-11145-2011, 2011.
IPCC: Working Group 1: Climate Change 2013: the Physical Science Basis, Fifth Assessment Report of the Intergovernmental Panel on Climate Change (IPCC), Cambridge University Press, ISBN 978-1-107-05799-1, 2013.
Jacob, D. J.: Introduction to Atmospheric Chemistry, Princeton University Press, ISBN 9780691001852, 1999.
Jacob, D. J., Field, B. D., Li, Q., Blake, D. R., de Gouw, J., Warneke, C., Hansel, A., Wisthaler, A., Singh, H. B., and Guenther, A.: Global budget of methanol: Constraints from atmospheric observations, J. Geophys. Res., 110, D08303, https://doi.org/10.1029/2004JD005172, 2005.
Jones, N. B., Riedel, K., Allan, W., Wood, S., Palmer, P. I., Chance, K., and Notholt, J.: Long-term tropospheric formaldehyde concentrations deduced from ground-based fourier transform solar infrared measurements, Atmos. Chem. Phys., 9, 7131–7142, https://doi.org/10.5194/acp-9-7131-2009, 2009.
Kerzenmacher, T., Wolff, M. A., Strong, K., Dupuy, E., Walker, K. A., Amekudzi, L. K., Batchelor, R. L., Bernath, P. F., Berthet, G., Blumenstock, T., Boone, C. D., Bramstedt, K., Brogniez, C., Brohede, S., Burrows, J. P., Catoire, V., Dodion, J., Drummond, J. R., Dufour, D. G., Funke, B., Fussen, D., Goutail, F., Griffith, D. W. T., Haley, C. S., Hendrick, F., Höpfner, M., Huret, N., Jones, N., Kar, J., Kramer, I., Llewellyn, E. J., López-Puertas, M., Manney, G., McElroy, C. T., McLinden, C. A., Melo, S., Mikuteit, S., Murtagh, D., Nichitiu, F., Notholt, J., Nowlan, C., Piccolo, C., Pommereau, J.-P., Randall, C., Raspollini, P., Ridolfi, M., Richter, A., Schneider, M., Schrems, O., Silicani, M., Stiller, G. P., Taylor, J., Tétard, C., Toohey, M., Vanhellemont, F., Warneke, T., Zawodny, J. M., and Zou, J.: Validation of NO2 and NO from the Atmospheric Chemistry Experiment (ACE), Atmos. Chem. Phys., 8, 5801–5841, https://doi.org/10.5194/acp-8-5801-2008, 2008.
Kesselmeier, J.: Exchange of short-chain oxygenated volatile organic compounds (VOCs) between plants and the atmosphere: A compilation of field and laboratory studies, J. Atmos. Chem., 39, 219–233, https://doi.org/10.1023/A:1010632302076, 2001.
Kesselmeier, J. and Staudt, M.: Biogenic volatile organic compounds (VOC): An overview on emission, physiology and ecology, J. Atmos. Chem., 33, 23–88, https://doi.org/10.1023/A:1006127516791, 1999.
Kohlhepp, R., Ruhnke, R., Chipperfield, M. P., De Mazière, M., Notholt, J., Barthlott, S., Batchelor, R. L., Blatherwick, R. D., Blumenstock, Th., Coffey, M. T., Demoulin, P., Fast, H., Feng, W., Goldman, A., Griffith, D. W. T., Hamann, K., Hannigan, J. W., Hase, F., Jones, N. B., Kagawa, A., Kaiser, I., Kasai, Y., Kirner, O., Kouker, W., Lindenmaier, R., Mahieu, E., Mittermeier, R. L., Monge-Sanz, B., Morino, I., Murata, I., Nakajima, H., Palm, M., Paton-Walsh, C., Raffalski, U., Reddmann, Th., Rettinger, M., Rinsland, C. P., Rozanov, E., Schneider, M., Senten, C., Servais, C., Sinnhuber, B.-M., Smale, D., Strong, K., Sussmann, R., Taylor, J. R., Vanhaelewyn, G., Warneke, T., Whaley, C., Wiehle, M., and Wood, S. W.: Observed and simulated time evolution of HCl, ClONO2, and HF total column abundances, Atmos. Chem. Phys., 12, 3527–3556, https://doi.org/10.5194/acp-12-3527-2012, 2012.
Luers, J. K. and Eskridge, R. E.: Temperature corrections for VIZ and Vaisala radiosondes, J. Appl. Meteorol., 34, 1241–1253, https://doi.org/10.1175/1520-0450(1995)034<1241:TCFTVA>2.0.CO;2, 1995.
Lutsch, E., Dammers, E., Conway, S., and Strong, K.: Long-range Transport of NH3, CO, HCN and C2H6 from the 2014 Canadian Wildfires, Geophys. Res. Lett., 43, 8286–8297, https://doi.org/10.1002/2016GL070114, 2016.
Lutsch, E., Strong, K., Jones, D. B. A., Blumenstock, T., Conway, S., Fisher, J. A., Hannigan, J. W., Hase, F., Kasai, Y., Mahieu, E., Makarova, M., Morino, I., Nagahama, T., Notholt, J., Ortega, I., Palm, M., Poberovskii, A. V., Sussmann, R., and Warneke, T.: Detection and attribution of wildfire pollution in the Arctic and northern midlatitudes using a network of Fourier-transform infrared spectrometers and GEOS-Chem, Atmos. Chem. Phys., 20, 12813–12851, https://doi.org/10.5194/acp-20-12813-2020, 2020.
Mahieu, E., Zander, R., Duchatelet, P., Hannigan, J. W., Coffey, M. T., Mikuteit, S., Hase, F., Blumenstock, T., Wiacek, A., Strong, K., Taylor, J. R., Mittermeier, R., Fast, H., Boone, C. D., McLeod, S. D., Walker, K. A., Bernath, P. F., and Rinsland, C. P.: Comparisons Between ACE and Ground-Based Measurements of Stratospheric HCl and ClONO2 Loadings at Northern Latitudes, Geophys. Res. Lett., 32, L15S08, https://doi.org/10.1029/2005GL022396, 2005.
Mahieu, E., Duchatelet, P., Demoulin, P., Walker, K. A., Dupuy, E., Froidevaux, L., Randall, C., Catoire, V., Strong, K., Boone, C. D., Bernath, P. F., Blavier, J.-F., Blumenstock, T., Coffey, M., De Mazière, M., Griffith, D., Hannigan, J., Hase, F., Jones, N., Jucks, K. W., Kagawa, A., Kasai, Y., Mebarki, Y., Mikuteit, S., Nassar, R., Notholt, J., Rinsland, C. P., Robert, C., Schrems, O., Senten, C., Smale, D., Taylor, J., Tétard, C., Toon, G. C., Warneke, T., Wood, S. W., Zander, R., and Servais, C.: Validation of ACE-FTS v2.2 measurements of HCl, HF, CCl3F and CCl2F2 using space-, balloon- and ground-based instrument observations, Atmos. Chem. Phys., 8, 6199–6221, https://doi.org/10.5194/acp-8-6199-2008, 2008.
Marsh, D. R., Mills, M. J., Kinnison, D. E., Lamarque, J.-F., Calvo, N., and Polvani, L. M.: Climate change from 1850 to 2005 simulated in CESM1 (WACCM), J. Climate, 26, 7372–7391, https://doi.org/10.1175/JCLI-D-12-00558.1, 2013.
McElroy, M. B. and McConnell, J. C.: Nitrous Oxide: A Natural Source of Stratospheric NO, J. Atmos. Sci., 28, 1095–1098, https://doi.org/10.1175/1520-0469(1971)028<1095:NOANSO>2.0.CO;2, 1971.
Millet, D. B., Baasandorj, M., Farmer, D. K., Thornton, J. A., Baumann, K., Brophy, P., Chaliyakunnel, S., de Gouw, J. A., Graus, M., Hu, L., Koss, A., Lee, B. H., Lopez-Hilfiker, F. D., Neuman, J. A., Paulot, F., Peischl, J., Pollack, I. B., Ryerson, T. B., Warneke, C., Williams, B. J., and Xu, J.: A large and ubiquitous source of atmospheric formic acid, Atmos. Chem. Phys., 15, 6283–6304, https://doi.org/10.5194/acp-15-6283-2015, 2015.
Olsen, K. S., Strong, K., Walker, K. A., Boone, C. D., Raspollini, P., Plieninger, J., Bader, W., Conway, S., Grutter, M., Hannigan, J. W., Hase, F., Jones, N., de Mazière, M., Notholt, J., Schneider, M., Smale, D., Sussmann, R., and Saitoh, N.: Comparison of the GOSAT TANSO-FTS TIR CH4 volume mixing ratio vertical profiles with those measured by ACE-FTS, ESA MIPAS, IMK-IAA MIPAS, and 16 NDACC stations, Atmos. Meas. Tech., 10, 3697–3718, https://doi.org/10.5194/amt-10-3697-2017, 2017.
Palmer, P. I., Parrington, M., Lee, J. D., Lewis, A. C., Rickard, A. R., Bernath, P. F., Duck, T. J., Waugh, D. L., Tarasick, D. W., Andrews, S., Aruffo, E., Bailey, L. J., Barrett, E., Bauguitte, S. J.-B., Curry, K. R., Di Carlo, P., Chisholm, L., Dan, L., Forster, G., Franklin, J. E., Gibson, M. D., Griffin, D., Helmig, D., Hopkins, J. R., Hopper, J. T., Jenkin, M. E., Kindred, D., Kliever, J., Le Breton, M., Matthiesen, S., Maurice, M., Moller, S., Moore, D. P., Oram, D. E., O'Shea, S. J., Owen, R. C., Pagniello, C. M. L. S., Pawson, S., Percival, C. J., Pierce, J. R., Punjabi, S., Purvis, R. M., Remedios, J. J., Rotermund, K. M., Sakamoto, K. M., da Silva, A. M., Strawbridge, K. B., Strong, K., Taylor, J., Trigwell, R., Tereszchuk, K. A., Walker, K. A., Weaver, D., Whaley, C., and Young, J. C.: Quantifying the impact of BOReal forest fires on Tropospheric oxidants over the Atlantic using Aircraft and Satellites (BORTAS) experiment: design, execution and science overview, Atmos. Chem. Phys., 13, 6239–6261, https://doi.org/10.5194/acp-13-6239-2013, 2013.
Paulot, F., Wunch, D., Crounse, J. D., Toon, G. C., Millet, D. B., DeCarlo, P. F., Vigouroux, C., Deutscher, N. M., González Abad, G., Notholt, J., Warneke, T., Hannigan, J. W., Warneke, C., de Gouw, J. A., Dunlea, E. J., De Mazière, M., Griffith, D. W. T., Bernath, P., Jimenez, J. L., and Wennberg, P. O.: Importance of secondary sources in the atmospheric budgets of formic and acetic acids, Atmos. Chem. Phys., 11, 1989–2013, https://doi.org/10.5194/acp-11-1989-2011, 2011.
Pope, C. A., Ezzati, M., and Dockery, D. W.: Fine-Particulate Air Pollution and Life Expectancy in the United States, New England Journal of Medicine, 360, 376–386, https://doi.org/10.1056/NEJMsa0805646, 2009.
Ravishankara, A., Daniel, J., and Portmann, R.: Nitrous oxide (N2O): The dominant ozone-depleting substance emitted in the 21st century, Science, 326 123–125, https://doi.org/10.1126/science.1176985, 2009.
Rodgers, C. D.: Retrieval of atmospheric temperature and composition from remote measurements of thermal radiation, Rev. Geophys. Space Ge., 14, 609–624, https://doi.org/10.1029/RG014i004p00609, 1976.
Rodgers, C. D.: Characterization and Error Analysis of Profiles Retrieved From Remote Sounding Measurements, J. Geophys. Res., 95, 5587–5595, https://doi.org/10.1029/JD095iD05p05587, 1990.
Rodgers, C. D.: Inverse Methods for Atmospheric Sounding, World Scientific, https://doi.org/10.1142/3171, 2000.
Rodgers, C. D. and Connor, B. J.: Intercomparison of remote sounding instruments, J. Geophys. Res., 108, 4116, https://doi.org/10.1029/2002JD002299, 2003.
Rothman, L. S., Gordon, I. E., Barbe, A., Benner, D. C., Bernath, P. F., Birk, M., Boudon, V., Brown, L. R., Campargue, A., Champion, J.-P., Chance, K., Coudert, L. H., Danaj, V., Devi, V. M., Fally, S., Flaud, J.-M., Gamache, R. R., Goldmanm, A., Jacquemart, D., Kleiner, I., Lacome, N., Lafferty, W. J., Mandin, J.-Y., Massie, S. T., Mikhailenko, S. N., Miller, C. E., Moazzen-Ahmadi, N., Naumenko, O. V., Nikitin, A. V., Orphal, J., Perevalov, V. I., Perrin, A., Predoi-Cross, A., Rinsland, C. P., Rotger, M., Simeckova, M., Smith, M. A. H., Sung, K., Tashkun, S. A., Tennyson, J., Toth, R. A., Vandaele, A. C., and Vander Auwera, J.: The HITRAN 2008 molecular spectroscopic database, J. Quant. Spectrosc. Ra., 110, 533–572, https://doi.org/10.1016/j.jqsrt.2009.02.013, 2009.
Rudolph, J.: The tropospheric distribution and budget of ethane, J. Geophys. Res., 100, 11369–11381, https://doi.org/10.1029/95JD00693, 1995.
Russell, J. M., Gordley, L. L., Park, J. H., Drayson, S. R., Hesketh, W. D., Cicerone, R. J., Tuck, A. F., Frederick, J. E., Harries, J. E., and Crutzen, P. J.: The Halogen Occultation Experiment, J. Geophys. Res., 98, 10777–10797, https://doi.org/10.1029/93JD00799, 1993.
Sha, M. K., Langerock, B., Blavier, J.-F. L., Blumenstock, T., Borsdorff, T., Buschmann, M., Dehn, A., De Mazière, M., Deutscher, N. M., Feist, D. G., García, O. E., Griffith, D. W. T., Grutter, M., Hannigan, J. W., Hase, F., Heikkinen, P., Hermans, C., Iraci, L. T., Jeseck, P., Jones, N., Kivi, R., Kumps, N., Landgraf, J., Lorente, A., Mahieu, E., Makarova, M. V., Mellqvist, J., Metzger, J.-M., Morino, I., Nagahama, T., Notholt, J., Ohyama, H., Ortega, I., Palm, M., Petri, C., Pollard, D. F., Rettinger, M., Robinson, J., Roche, S., Roehl, C. M., Röhling, A. N., Rousogenous, C., Schneider, M., Shiomi, K., Smale, D., Stremme, W., Strong, K., Sussmann, R., Té, Y., Uchino, O., Velazco, V. A., Vigouroux, C., Vrekoussis, M., Wang, P., Warneke, T., Wizenberg, T., Wunch, D., Yamanouchi, S., Yang, Y., and Zhou, M.: Validation of methane and carbon monoxide from Sentinel-5 Precursor using TCCON and NDACC-IRWG stations, Atmos. Meas. Tech., 14, 6249–6304, https://doi.org/10.5194/amt-14-6249-2021, 2021.
Statistics Canada: 2021 Census of Population: Toronto, Census metropolitan area, https://www12.statcan.gc.ca/census-recensement/2021/as-sa/fogs-spg/page.cfm?dguid=2021S0503535&lang=E&topic=1, last access: 15 November 2022.
Stavrakou, T., Guenther, A., Razavi, A., Clarisse, L., Clerbaux, C., Coheur, P.-F., Hurtmans, D., Karagulian, F., De Mazière, M., Vigouroux, C., Amelynck, C., Schoon, N., Laffineur, Q., Heinesch, B., Aubinet, M., Rinsland, C., and Müller, J.-F.: First space-based derivation of the global atmospheric methanol emission fluxes, Atmos. Chem. Phys., 11, 4873–4898, https://doi.org/10.5194/acp-11-4873-2011, 2011.
Stavrakou, T., Müller, J. F., Peeters, J., Razavi, A., Clarisse, L., Clerbaux, C., Coheur, P. F., Hurtmans, D., De Maziere, M., Vigouroux, C., Deutscher, N. M., Griffith, D. W. T., Jones, N., and Paton-Walsh, C.: Satellite evidence for a large source of formic acid from boreal and tropical forests, Nat. Geosci., 5, 26–30, https://doi.org/10.1038/ngeo1354, 2012.
Steinbrecht, W., Kubistin, D., Plass-Dülmer, C., Davies, J., Tarasick, D. W., Gathen, P., Deckelmann, H., Jepsen, N., Kivi, R., Lyall, N., Palm, M., Notholt, J., Kois, B., Oelsner, P., Allaart, M., Piters, A., Gill, M., Van Malderen, R., Delcloo, A. W., Sussmann, R., Mahieu, E., Servais, C., Romanens, G., Stübi, R., Ancellet, G., Godin-Beekmann, S., Yamanouchi, S., Strong, K., Johnson, B., Cullis, P., Petropavlovskikh, I., Hannigan, J. W., Hernandez, J.-L., Diaz Rodriguez, A., Nakano, T., Chouza, F., Leblanc, T., Torres, C., Garcia, O., Röhling, A. N., Schneider, M., Blumenstock, T., Tully, M., Paton-Walsh, C., Jones, N., Querel, R., Strahan, S., Stauffer, R. M., Thompson, A. M., Inness, A., Engelen, R., Chang, K.-L., and Cooper, O. R.: COVID-19 crisis reduces free tropospheric ozone across the Northern Hemisphere, Geophys. Res. Lett., 48, e2020GL091987, https://doi.org/10.1029/2020GL091987, 2021.
Strong, K., Wolff, M. A., Kerzenmacher, T. E., Walker, K. A., Bernath, P. F., Blumenstock, T., Boone, C., Catoire, V., Coffey, M., De Mazière, M., Demoulin, P., Duchatelet, P., Dupuy, E., Hannigan, J., Höpfner, M., Glatthor, N., Griffith, D. W. T., Jin, J. J., Jones, N., Jucks, K., Kuellmann, H., Kuttippurath, J., Lambert, A., Mahieu, E., McConnell, J. C., Mellqvist, J., Mikuteit, S., Murtagh, D. P., Notholt, J., Piccolo, C., Raspollini, P., Ridolfi, M., Robert, C., Schneider, M., Schrems, O., Semeniuk, K., Senten, C., Stiller, G. P., Strandberg, A., Taylor, J., Tétard, C., Toohey, M., Urban, J., Warneke, T., and Wood, S.: Validation of ACE-FTS N2O measurements, Atmos. Chem. Phys., 8, 4759–4786, https://doi.org/10.5194/acp-8-4759-2008, 2008.
Sun, Y., Liu, C., Zhang, L., Palm, M., Notholt, J., Yin, H., Vigouroux, C., Lutsch, E., Wang, W., Shan, C., Blumenstock, T., Nagahama, T., Morino, I., Mahieu, E., Strong, K., Langerock, B., De Mazière, M., Hu, Q., Zhang, H., Petri, C., and Liu, J.: Fourier transform infrared time series of tropospheric HCN in eastern China: seasonality, interannual variability, and source attribution, Atmos. Chem. Phys., 20, 5437–5456, https://doi.org/10.5194/acp-20-5437-2020, 2020.
Sussmann, R., Forster, F., Rettinger, M., and Jones, N.: Strategy for high-accuracy-and-precision retrieval of atmospheric methane from the mid-infrared FTIR network, Atmos. Meas. Tech., 4, 1943–1964, https://doi.org/10.5194/amt-4-1943-2011, 2011.
Taylor, J. R.: Assessment of Trace Gas Observations from the Toronto Atmospheric Observatory, Ph.D. thesis, Department of Physics, University of Toronto, Canada, https://hdl.handle.net/1807/17305 (last access: 4 July 2023), 2008.
Taylor, J. R., Strong, K., McLinden, C. A., Degenstein, D. A., and Haley, C. S.: Comparison of OSIRIS Stratospheric O3 and NO2 Measurements with Ground-based Fourier Transform Spectrometer Measurements at the Toronto Atmospheric Observatory, Can. J. Phys., 85, 1301–1316, https://doi.org/10.1139/p07-144, 2007.
Taylor, J. R., Wunch, D., Midwinter, C., Wiacek, A., Drummond, J. R., and Strong, K.: An extended intercomparison of simultaneous ground-based Fourier transform spectrometer measurements at the Toronto Atmospheric Observatory, J. Quant. Spectrosc. Ra., 109, 2244–2260, https://doi.org/10.1016/j.jqsrt.2008.03.011, 2008.
Tikhonov, A. N.: Regularization of Ill-Posed Problems, Doklady Akademi Nauk USSR, 151, 49–52, 1963.
Toohey, M., Quine, B. M., Strong, K., Bernath, P. F., Boone, C. D., Jonsson, A. I., McElroy, C. T., Walker, K. A., and Wunch, D.: Balloon-borne radiometer measurements of Northern Hemisphere mid-latitude stratospheric HNO3 profiles spanning 12 years, Atmos. Chem. Phys., 7, 6075–6084, https://doi.org/10.5194/acp-7-6075-2007, 2007.
Toon, G. C., Blavier, J.-F., Sen, B., Margitan, J. J., Webster, C. R., May, R. D., Fahey, D., Gao, R., Del Negro, L., Proffitt, M., Elkins, J., Romashkin, P. A., Hurst, D. F., Oltmans, S., Atlas, E., Schauffler, S., Flocke, F., Bui, T. P., Stimpfle, R. M., Bonne, G. P., Voss, P. B., and Cohen, R. C.: Comparison of MkIV balloon and ER-2 aircraft measurements of atmospheric trace gases, J. Geophys. Res., 104, 26779–26790, https://doi.org/10.1029/1999JD900379, 1999.
Twomey, S.: On the numerical solution of Fredholm integral equations of the first kind by the inversion of the linear system produced by quadrature, J. Assoc. Comput. Mach., 10, 97–101, https://doi.org/10.1145/321150.321157, 1963.
Tzompa-Sosa, Z. A., Mahieu, E., Franco, B., Keller, C. A., Turner, A. J., Helmig, D., Fried, A., Richter, D., Weibring, P., Walega, J., Yacovitch, T. I., Herndon, S. C., Blake, D. R., Hase, F., Hannigan, J. W., Conway, S., Strong, K., Schneider, M., and Fischer, E. V.: Revisiting global fossil fuel and biofuel emissions of ethane, J. Geophys. Res.-Atmos., 122, 2493–2512, https://doi.org/10.1002/2016JD025767, 2017.
von Clarmann, T.: Smoothing error pitfalls, Atmos. Meas. Tech., 7, 3023–3034, https://doi.org/10.5194/amt-7-3023-2014, 2014.
Vigouroux, C., De Mazière, M., Demoulin, P., Servais, C., Hase, F., Blumenstock, T., Kramer, I., Schneider, M., Mellqvist, J., Strandberg, A., Velazco, V., Notholt, J., Sussmann, R., Stremme, W., Rockmann, A., Gardiner, T., Coleman, M., and Woods, P.: Evaluation of tropospheric and stratospheric ozone trends over Western Europe from ground-based FTIR network observations, Atmos. Chem. Phys., 8, 6865–6886, https://doi.org/10.5194/acp-8-6865-2008, 2008.
Vigouroux, C., Bauer Aquino, C. A., Bauwens, M., Becker, C., Blumenstock, T., De Mazière, M., García, O., Grutter, M., Guarin, C., Hannigan, J., Hase, F., Jones, N., Kivi, R., Koshelev, D., Langerock, B., Lutsch, E., Makarova, M., Metzger, J.-M., Müller, J.-F., Notholt, J., Ortega, I., Palm, M., Paton-Walsh, C., Poberovskii, A., Rettinger, M., Robinson, J., Smale, D., Stavrakou, T., Stremme, W., Strong, K., Sussmann, R., Té, Y., and Toon, G.: NDACC harmonized formaldehyde time series from 21 FTIR stations covering a wide range of column abundances, Atmos. Meas. Tech., 11, 5049–5073, https://doi.org/10.5194/amt-11-5049-2018, 2018.
Vigouroux, C., Langerock, B., Bauer Aquino, C. A., Blumenstock, T., Cheng, Z., De Mazière, M., De Smedt, I., Grutter, M., Hannigan, J. W., Jones, N., Kivi, R., Loyola, D., Lutsch, E., Mahieu, E., Makarova, M., Metzger, J.-M., Morino, I., Murata, I., Nagahama, T., Notholt, J., Ortega, I., Palm, M., Pinardi, G., Röhling, A., Smale, D., Stremme, W., Strong, K., Sussmann, R., Té, Y., van Roozendael, M., Wang, P., and Winkler, H.: TROPOMI–Sentinel-5 Precursor formaldehyde validation using an extensive network of ground-based Fourier-transform infrared stations, Atmos. Meas. Tech., 13, 3751–3767, https://doi.org/10.5194/amt-13-3751-2020, 2020.
Warneck, P.: Chemistry of the Natural Atmosphere, Academic Press, ISBN 0127356304, 1988.
Whaley, C.: Improvements to our Understanding of Toronto-Area Atmospheric Composition, Ph.D. thesis, Department of Physics, University of Toronto, Canada, https://hdl.handle.net/1807/68411 (last access: 4 July 2023), 2014.
Whaley, C., Strong, K., Adams, C., Bourassa, A. E., Daffer, W. H., Degenstein, D. A., Fast, H., Fogal, P. F., Manney, G. L., Mittermeier, R. L., Pavlovic, B., and Wiacek, A.: Using FTIR measurements of stratospheric composition to identify mid-latitude polar vortex intrusions over Toronto, J. Geophys. Res.-Atmos., 118, 12766–12783, https://doi.org/10.1002/2013JD020577, 2013.
Whaley, C. H., Strong, K., Jones, D. B. A., Walker, T. W., Jiang, Z., Henze, D. K., Cooke, M., McLinden, C. A., Pommier, M., Mittermeier, R. L., and Fogal, P. F.: Improvements to our understanding of urban ozone air pollution: Sources of Toronto-area ozone during poor air quality events, J. Geophys. Res., 120, 11368–11390, https://doi.org/10.1002/2014JD022984, 2015.
Wiacek, A.: First Trace Gas Measurements Using Fourier Transform Infrared Solar Absorption Spectroscopy at the University of Toronto Atmospheric Observatory, Ph.D. thesis, Department of Physics, University of Toronto, Canada, https://librarysearch.library.utoronto.ca/permalink/01UTORONTO_INST/14bjeso/alma991106405283106196 (last access: 4 July 2023), 2006.
Wiacek, A. and Strong, K.: Effects of Vertical Grid Discretization in Infrared Transmission Modeling, J. Quant. Spectrosc. Ra., 109, 2463–2490, https://doi.org/10.1016/j.jqsrt.2008.03.015, 2008.
Wiacek, A., Jones, N. B., Strong, K., Taylor, J. R., Mittermeier, R. L., and Fast, H.: First detection of meso-thermospheric nitric oxide (NO) by ground-based FTIR solar absorption spectroscopy, Geophys. Res. Lett., 33, L03811, https://doi.org/10.1029/2005GL024897, 2006.
Wiacek, A., Taylor, J. R., Strong, K., Saari, R., Kerzenmacher, T., Jones N. B., and Griffith, D. W. T.: Ground-Based Solar Absorption FTIR Spectroscopy: Characterization of Retrievals and First Results from a Novel Optical Design Instrument at a New NDACC Complementary Station, J. Atmos. Ocean. Tech., 24, 432–448, https://doi.org/10.1175/JTECH1962.1, 2007.
Xiao, Y., Jacob, D., and Turquety, S.: Atmospheric acetylene and its relationship with CO as an indicator of air mass age, J. Geophys. Res.-Atmos., 112, D12305, https://doi.org/10.1029/2006JD008268, 2007.
Wunch, D., Taylor, J. R., Fu, D., Bernath, P., Drummond, J. R., Midwinter, C., Strong, K., and Walker, K. A.: Simultaneous ground-based observations of O3, HCl, N2O, and CH4 over Toronto, Canada by three Fourier transform spectrometers with different resolutions, Atmos. Chem. Phys., 7, 1275–1292, https://doi.org/10.5194/acp-7-1275-2007, 2007.
Yamanouchi, S.: Long-term Analysis of Toronto-Area Atmospheric Composition, PhD thesis, University of Toronto, Toronto, Ontario, Canada, https://hdl.handle.net/1807/106479 (last access: 4 July 2023), 2021.
Yamanouchi, S., Strong, K., Lutsch, E., and Jones, D. B. A.: Detection of HCOOH, CH3OH, CO, HCN, and C2H6 in Wildfire Plumes Transported Over Toronto Using Ground-Based FTIR Measurements From 2002–2018, J. Geophys. Res.-Atmos., 125, e2019JD031924, https://doi.org/10.1029/2019JD031924, 2020.
Yamanouchi, S., Strong, K., Colebatch, O., Conway, S., Jones, D. B. A., Lutsch, E., and Roche, S.: Atmospheric trace gas trends obtained from FTIR column measurements in Toronto, Canada from 2002–2019, Environ. Res. Commun., 3 051002, https://doi.org/10.1088/2515-7620/abfa65, 2021a.
Yamanouchi, S., Viatte, C., Strong, K., Lutsch, E., Jones, D. B. A., Clerbaux, C., Van Damme, M., Clarisse, L., and Coheur, P.-F.: Multiscale observations of NH3 around Toronto, Canada, Atmos. Meas. Tech., 14, 905–921, https://doi.org/10.5194/amt-14-905-2021, 2021b.
Yamanouchi, S., Conway, S., Strong, K., Colebatch, O., Lutsch, E., Roche, S., Taylor, J., Whaley, C., and Wiacek, A.: Replication Data for: NDACC FTIR trace gas measurements at the University of Toronto Atmospheric Observatory from 2002–2020, Borealis [data set], https://doi.org/10.5683/SP2/VC8JMC, Borealis V1, 2022.
You, Y., Byrne, B., Colebatch, O., Mittermeier, R. L., Vogel, F., and Strong, K.: Quantifying the impact of the COVID-19 pandemic restrictions on CO, CO2, and CH4 in downtown Toronto using open-path Fourier transform spectroscopy, Atmosphere, 12, 848, https://doi.org/10.3390/atmos12070848, 2021.
Zander, R., Duchatelet, P., Mahieu, E., Demoulin, P., Roland, G., Servais, C., Auwera, J. V., Perrin, A., Rinsland, C. P., and Crutzen, P. J.: Formic acid above the Jungfraujoch during 1985–2007: observed variability, seasonality, but no long-term background evolution, Atmos. Chem. Phys., 10, 10047–10065, https://doi.org/10.5194/acp-10-10047-2010, 2010.