the Creative Commons Attribution 4.0 License.
the Creative Commons Attribution 4.0 License.
 | 27 Jul 2023
HIPPO environmental monitoring: impact of phytoplankton dynamics on water column chemistry and the sclerochronology of the king scallop (Pecten maximus) as a biogenic archive for past primary production reconstructions
Valentin Siebert
Brivaëla Moriceau
Lukas Fröhlich
Bernd R. Schöne
Erwan Amice
Beatriz Beker
Kevin Bihannic
Isabelle Bihannic
Gaspard Delebecq
Jérémy Devesa
Morgane Gallinari
Yoan Germain
Émilie Grossteffan
Klaus Peter Jochum
Thierry Le Bec
Manon Le Goff
Céline Liorzou
Aude Leynaert
Claudie Marec
Marc Picheral
Peggy Rimmelin-Maury
Marie-Laure Rouget
Matthieu Waeles
Julien Thébault
As part of the HIPPO (HIgh-resolution Primary Production multi-prOxy archives) project, environmental monitoring was carried out between March and October 2021 in the Bay of Brest. The aim of this survey was to better understand the processes which drive the incorporation of chemical elements into scallop shells and their links with phytoplankton dynamics. For this purpose, biological samples (scallops and phytoplankton) as well as water samples were collected in order to analyze various environmental parameters (element chemical properties, nutrients, chlorophyll a, etc.). Given the large number of parameters that were measured, only the major results are presented and discussed here. However, the whole dataset, which has been made available, is much larger and can potentially be very useful for other scientists performing sclerochronological investigations, studying biogeochemical cycles or conducting various ecological research projects. The dataset is available at https://doi.org/10.17882/92043 (Siebert et al., 2023).
- Article
(4816 KB) - Full-text XML
- BibTeX
- EndNote


Primary producers form the foundation of marine food webs, control population sizes at higher trophic levels and influence fish stock recruitment (Chassot at al., 2010). Marine photoautotrophic organisms are responsible for nearly half of global net primary production and fix substantial amounts of carbon (Field et al., 1998). Despite their key role in the functioning of marine ecosystems and the global climate, past primary production dynamics and mechanisms controlling them have not been well characterized (Boyce et al., 2010), especially for time intervals prior to instrumental recording and significant anthropological disturbances of biogeochemical cycles. Available data sources on changes in marine primary production do not provide the necessary temporal resolution, are too short to determine long-term trends and do not cover the entirety of photoautotroph taxa. To compensate for this lack of past data, biogenic archives have been interrogated, such as bivalve shells, to track the past dynamics of primary production. It has already been shown that some bivalve species incorporate trace elements into their skeletal structures (made of calcite or aragonite) and that the observed trends follow the patterns of the dynamics of primary producers in the water column (e.g., Stecher et al., 1996; Barats et al., 2009; Thébault et al., 2009; Doré et al., 2020). In particular, the king scallop, Pecten maximus can record these signals at a daily scale, allowing high-resolution temporal reconstructions (Chauvaud et al., 1998; Thébault and Chauvaud, 2013; Fröhlich et al., 2022a). The research project HIPPO aims to better understand these environmental proxies and to develop new tracers and integrate them in a multi-proxy approach. For this purpose, environmental monitoring with a high temporal resolution was set up in 2021 in the Bay of Brest (France). Here, an overview of the physical, biological and chemical parameters of the seawater is presented along with geochemical data of king scallop shells. All data were obtained during the HIPPO survey.

Figure 1(a) Sampling location of the HIPPO monitoring area: Lanvéoc (red dot; adapted from Thébault et al., 2022). (b) Hourly depth variations recorded with NKE/Sambat probes deployed at the seafloor at Lanvéoc in 2021.
The Bay of Brest is a semi-enclosed, macrotidal marine ecosystem of 180 km2 with a westward connection to the Iroise Sea via a deep (40 m max. depth) and narrow (2 km width) strait. Freshwater inputs are brought from the east via two main rivers, the Aulne in the south and the Élorn in the north of the bay (Fig. 1a). The study was carried out between early March and mid-October 2021, with a total of 38 cruises off Lanvéoc (48∘17′39′′ N, 4∘27′12′′ W), a site located in the southern part of the Bay of Brest (France, Fig. 1a). This site was chosen for its status as a no-fishing and no-hunting zone, allowing for undisturbed monitoring. Moreover, this site has been the subject of scientific surveys in the past conducted by the Laboratory of Marine Environmental Sciences (LEMAR – UMR 6539) and the observatory service of the European Institute for Marine Studies (IUEM). Lanvéoc is characterized by shallow waters (from approx. 8 to 15 m depending on the tide, with a mean depth of approx. 11.5 m recorded at mid-tide) and a seafloor made up of sandy and silty sediment, with significant amounts of large-sized biogenic detritus (shells, maerl).
Water samples from the surface (1 m deep) and bottom (approx. 20 cm above the sediment) were collected twice a week between 16 March and the end of June 2021 and once a week thereafter until mid-October 2021. No sampling was conducted during August, leading to a lack of data for this month. Several biological, chemical and physical parameters were measured in these seawater samples; an exhaustive list is given in Table 1, which can be found at the end of this article. For samples dedicated to trace element measurement, a 5 L Teflon-coated GO-FLO sampling bottle was used. For the measurements of all other parameters, seawater was collected in a 5 L or an 8 L Niskin bottle. In addition to seawater sampling, two NKE/Sambat probes were alternately deployed to track high-frequency physical parameters (CTDO2FluoTurbpH; measurements every 20 min). For example, tidal dynamics were assessed in the Bay of Brest by recording the water depth at Lanvéoc (Fig. 1b). The two major episodes of near-maximum tidal range occurred around 30 March (tidal range: 7.15 m) and 28 April (tidal range: 7.00 m). Two other instruments were deployed to track particle dynamics and chemistry: an imaging sensor, the Underwater Vision Profiler 6 (UVP6) and a sediment trap. The settings used, specific to each instrument, will be described further below.
In addition to seawater sampling, 2640 age-class 1 specimens of the king scallop, Pecten maximus (whose growth ceases only during the winter season), were placed on the sediment surface on 21 February 2021, before the beginning of the HIPPO monitoring phase. These individuals came from the Tinduff hatchery (located in Plougastel-Daoulas, in the eastern part of the Bay of Brest) and were derived from a very limited number of spawners, and were thus genetically closely related. To assess the impact of the sediment on the incorporation of the different trace elements into their shells (calcite), 360 specimens were placed in a cage located 1 m above the seafloor, devoid of any sediment. During each cruise, five shells were collected directly from the sediment (when possible) and five others from the cage to analyze the soft tissues (gills, mantles, digestive glands and muscles) for element chemical composition. At the end of the monitoring interval (on 11 October 2021), a larger number of bivalves was collected to establish a growth and element chemical time series for 2021.
3.1 Physical data
To monitor some of the physical and chemical parameters in the water column, two NKE/Sambat probes were alternately deployed at the seafloor at Lanvéoc. Throughout the year, they recorded water depth (Fig. 1b), temperature, salinity, pH, fluorescence and dissolved oxygen concentration (DO) every 20 min. Figure 2 shows the signals obtained for each parameter after removing data windows in which sensors showed malfunctions or recorded outliers, hence the lack of data for some variables for some time intervals. Water temperature increased from approx. 10 ∘C in March to 18 ∘C in August, remaining stable at this value until the end of September before decreasing slightly until the end of the monitoring. Simultaneously but more rapidly, salinity increased from March (approx. 32 psu) to May (approx. 34.3 psu), caused by lower freshwater inflow from the Aulne due to a gradual decrease of its flow rate during spring (Aulne flow data are available on HydroFrance website: https://www.hydro.eaufrance.fr, last access: 16 March 2022). Afterward, the salinity remained stable around a value of 34.5 psu until 14 October. While a gradual increase of DO (8.2 to 11.2 mg L−1) and pH (7.96 to 8.22) was detected between January and mid-April/early May, chlorophyll concentration (deduced from fluorescence) showed a more abrupt increase during the first 2 weeks of April from 2.5 to 9.44 µg L−1. This time interval coincides with the first increase in phytoplankton cell concentration (see Sect. 3.3.1) and was followed by a significant decrease in the recorded values for DO, chlorophyll and pH, which ended in late May, just before the onset of the main diatom bloom of the year (see Sect. 3.3.1). These decreases in DO and pH values were probably related to the end of the spring bloom, when respiration activity in the water column intensified. The increased consumption of oxygen would have been accompanied by a release of CO2, which probably contributed to the decrease in pH. For the rest of the year, DO and pH remained at a stable value that oscillated around 8.5 mg L−1 and 8.05, respectively. However, fluorescence showed a flat background interrupted by sharp, narrow peaks, especially in June when the main diatom bloom was recorded, which would have been accompanied by a higher rate of photosynthesis, explaining the elevated fluorescence.
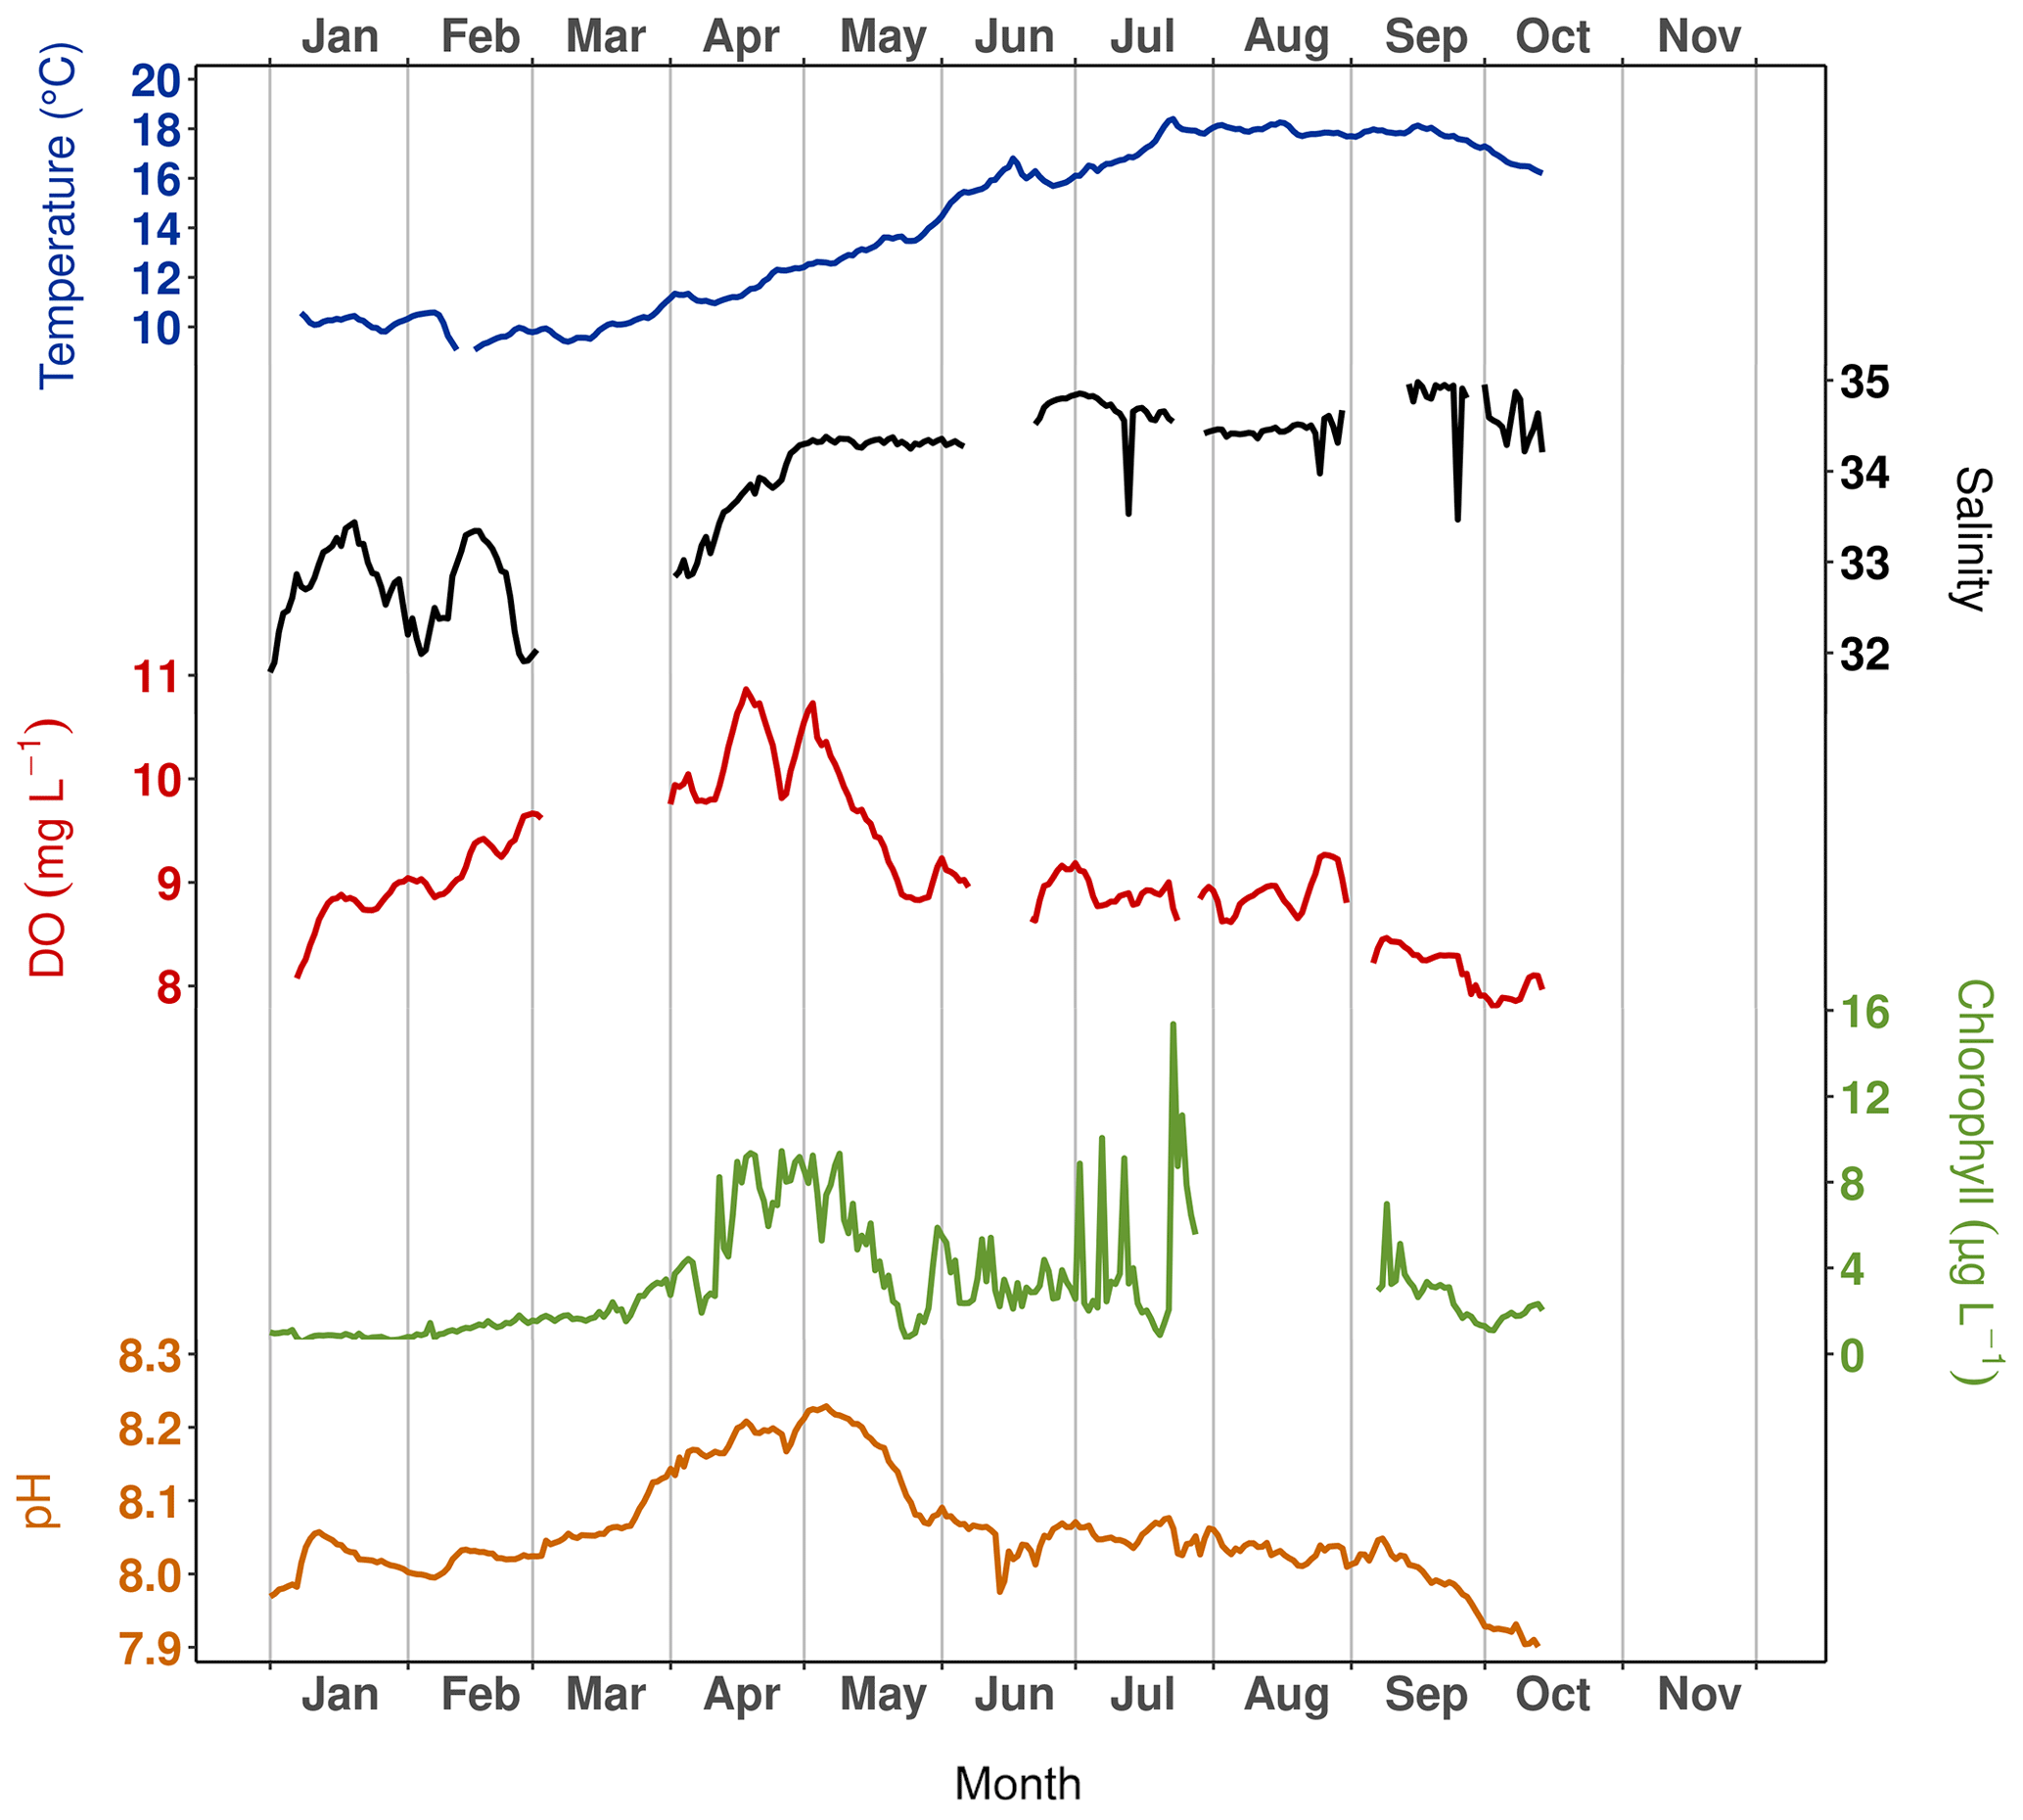
Figure 2Temperature, salinity and dissolved oxygen (DO) and chlorophyll concentrations computed from fluorescence and pH recorded with a NKE/Sambat probe deployed at the seafloor at Lanvéoc during 2021.
3.2 Nutrients
Concentrations of ammonium (NH), nitrate (NO), nitrite (NO), silicate (Si(OH)4) and phosphate (PO) were measured during the HIPPO monitoring scheme. For NH concentration measurements, 100 mL glass vials were filled with seawater and immediately stored at −20 ∘C. To measure the other nutrients, 1 L of water was filtered through a 0.6 µm polycarbonate filter (Merck) within 3 h of sampling. The filtered water was recovered in 15 mL polypropylene tubes and stored at 4 ∘C for Si(OH)4 measurement and at −20 ∘C for NO, NO and PO analyses. Then, the concentrations of all nutrients were measured with an AA3 HR SEAL-Bran+Luebbe AutoAnalyzer following the colorimetric (for NO, NO, Si(OH)4 and PO) or fluorimetric (for NH) methods of Aminot and Kérouel (2007). Concentrations of Si(OH)4, PO and dissolved inorganic nitrogen (DIN; measured as the sum of NH, NO and NO) reached their maximum on 7 February at the sea surface (Fig. 3). Times of low nutrient concentrations were detected based on the half-saturation constant for nutrient uptake (Km), since nutrient concentrations below this constant correspond to stressful conditions that limit phytoplankton development (Del Amo et al., 1997). In the Bay of Brest, these constants equal 2.0 µmol L−1 for DIN and Si(OH)4 and 0.2 µmol L−1 for PO (Del Amo et al., 1997).
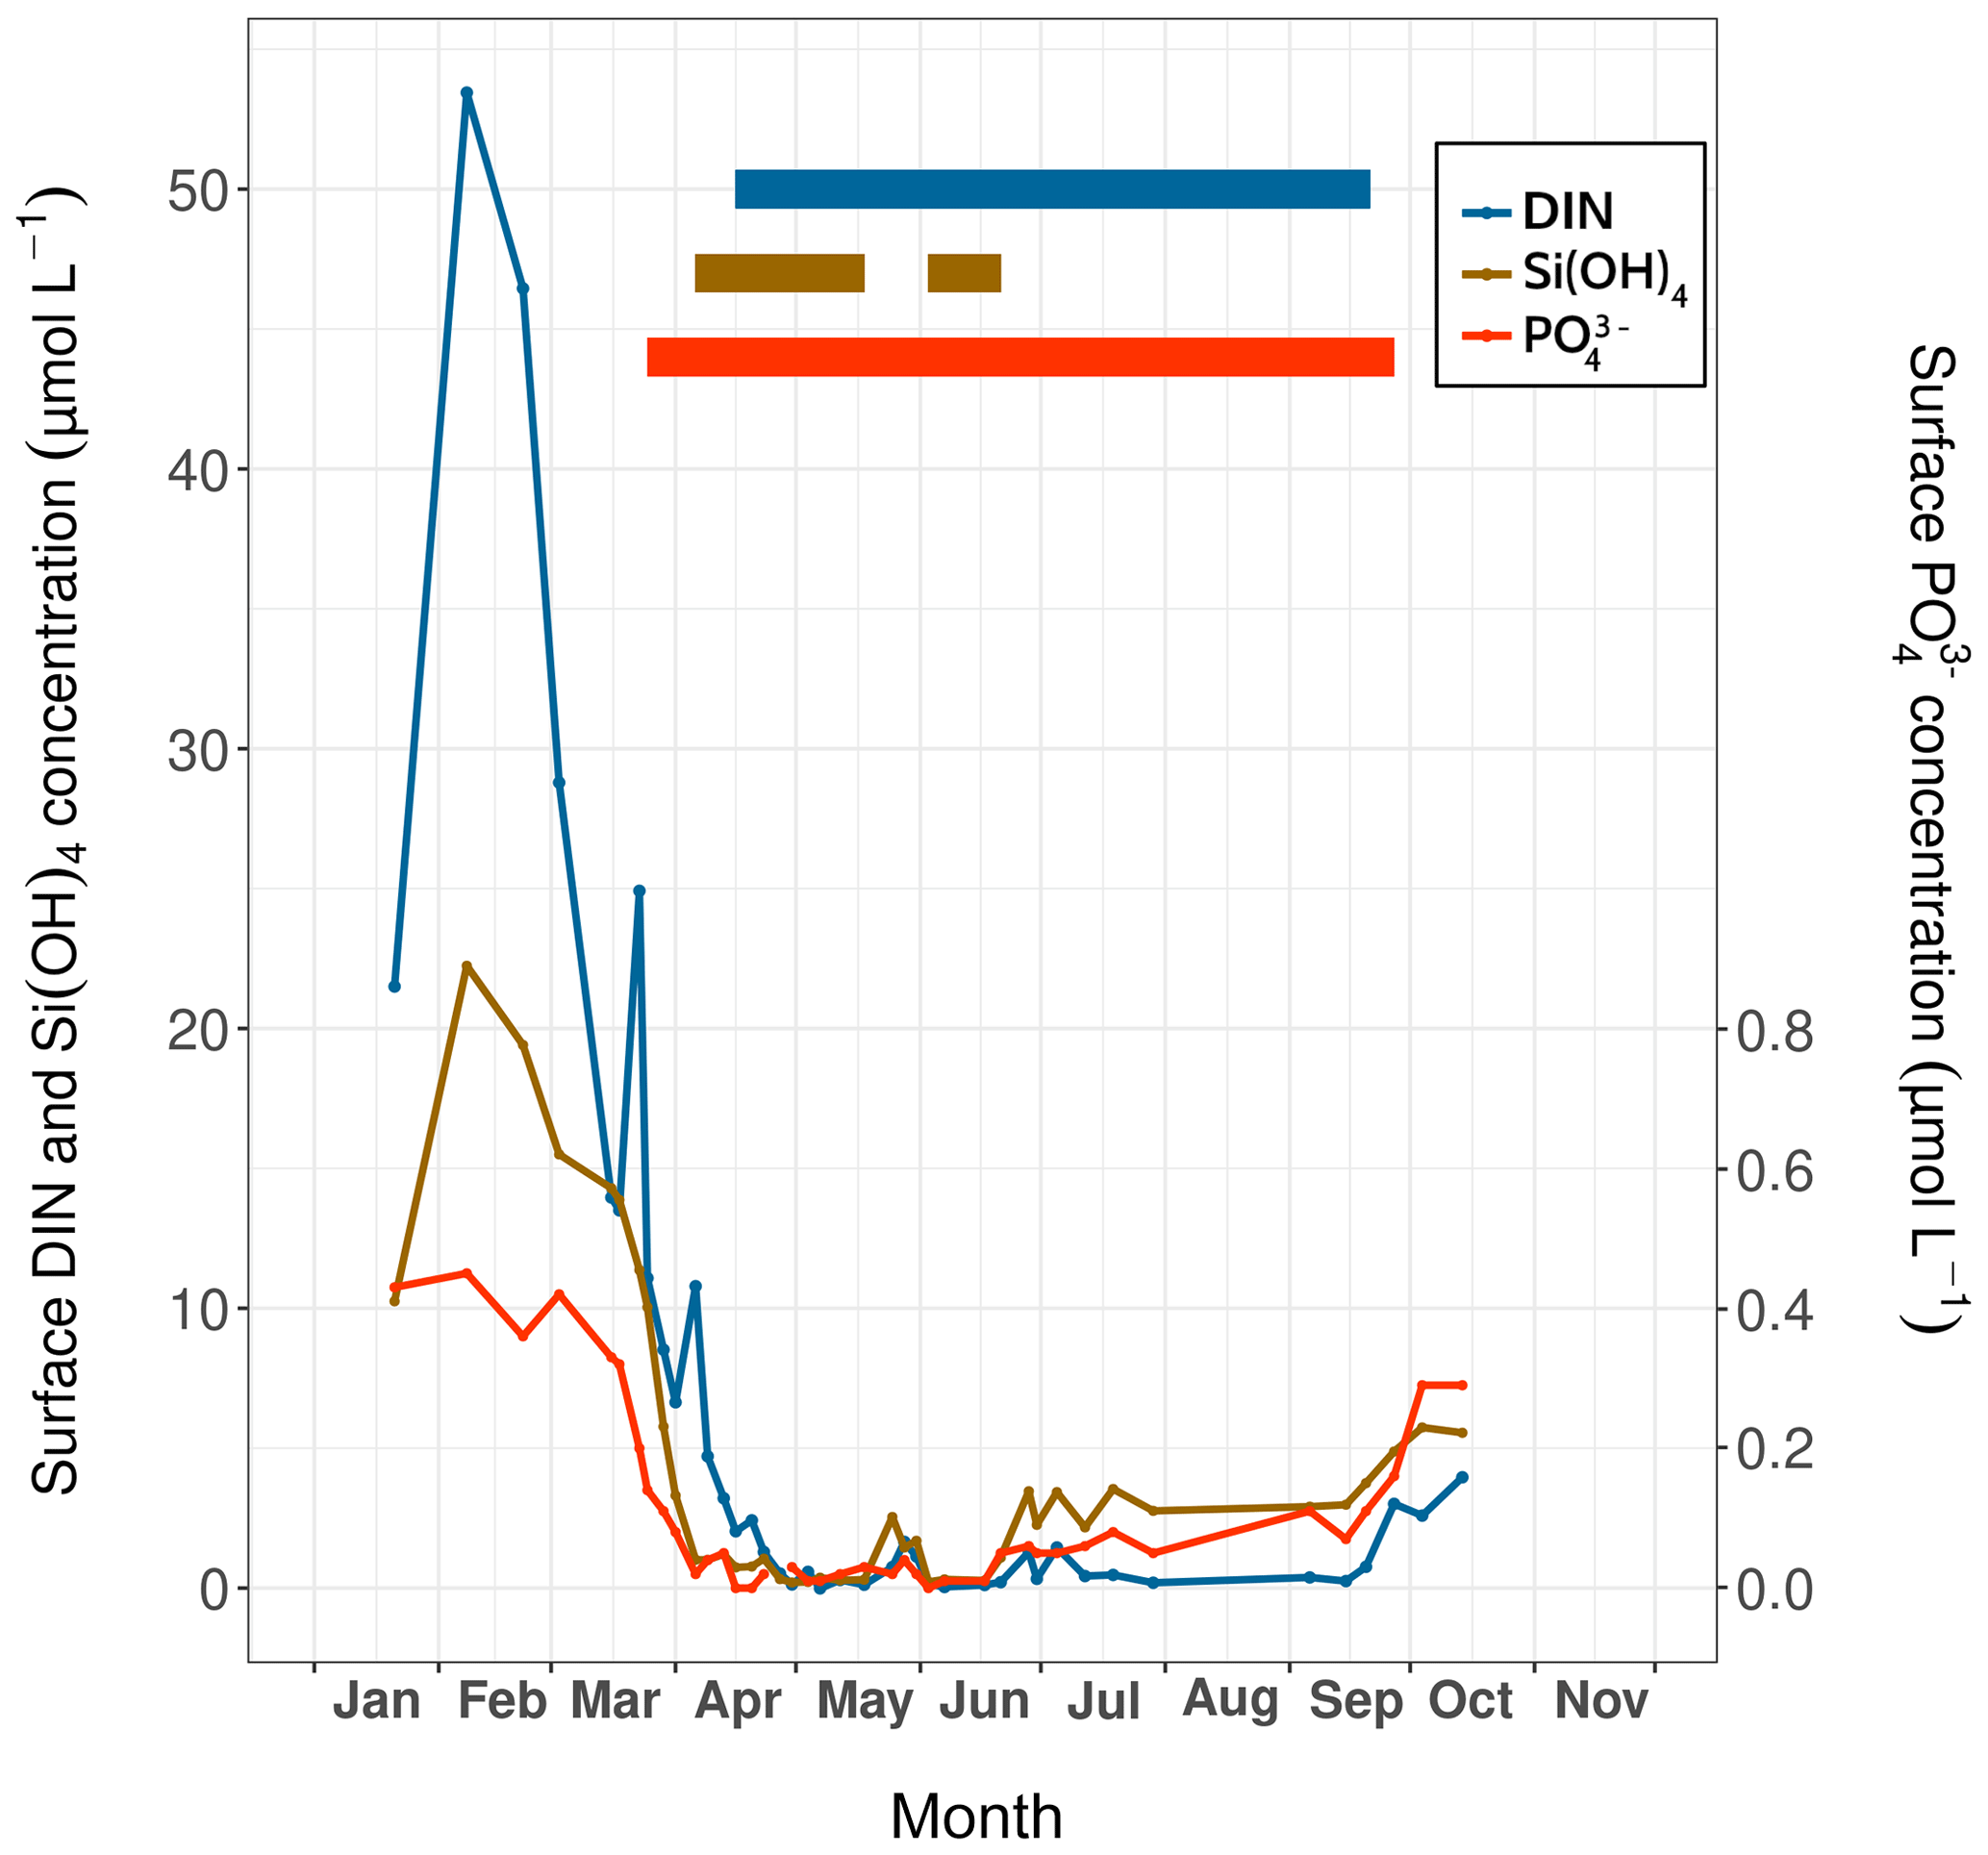
Figure 3Surface nutrient concentrations (DIN, silicates and phosphates) over time measured at Lanvéoc during 2021; their respective periods of limitation (thick solid lines) are indicated.
Based on this method, PO proved to be the first limiting nutrient, with concentrations that dropped below the Km as of 25 March, corresponding to the timing of the first increase in phytoplankton cells of the year (see Sect. 3.3.1). Si(OH)4 was the second limiting nutrient and had the shortest limitation interval (from 6 April to 21 June), which was interrupted by a slight enrichment in silicate at the end of May. Thereafter, silicate concentrations gradually increased until the end of the monitoring episode. DIN fell to limiting values 3 weeks after PO values became limiting, lasting from mid-April until mid-September. At the end of September, DIN and PO concentrations began to rise until the end of the experiment (Fig. 3).
3.3 Phytoplankton and organic matter dynamics
3.3.1 Phytoplankton taxonomy and counting
For phytoplankton determination and counts, a 250 mL glass bottle was carefully filled with surface water through a silicon tube to avoid turbulence and disintegration of phytoplankton cells. Phytoplankton cells were immediately fixed in 2 mL of acidic Lugol's iodine solution and stored in a dark and cold (4 ∘C) place to avoid UV damage and evaporation. The identification of phytoplankton taxa as well as the calculation of the respective cell concentrations were performed within 1 month of sample collection using an aliquot of 50 mL of the water sample, employed to fill a sedimentation column combined with a plate chamber (Hydro-Bios Kiel), according to the Utermöhl methods (Edler and Elbrächter, 2010). After 24 h, the phytoplankton cells settled onto a glass microscope slide and were identified and counted using an inverted microscope (Axio Observer.A1, ZEISS).
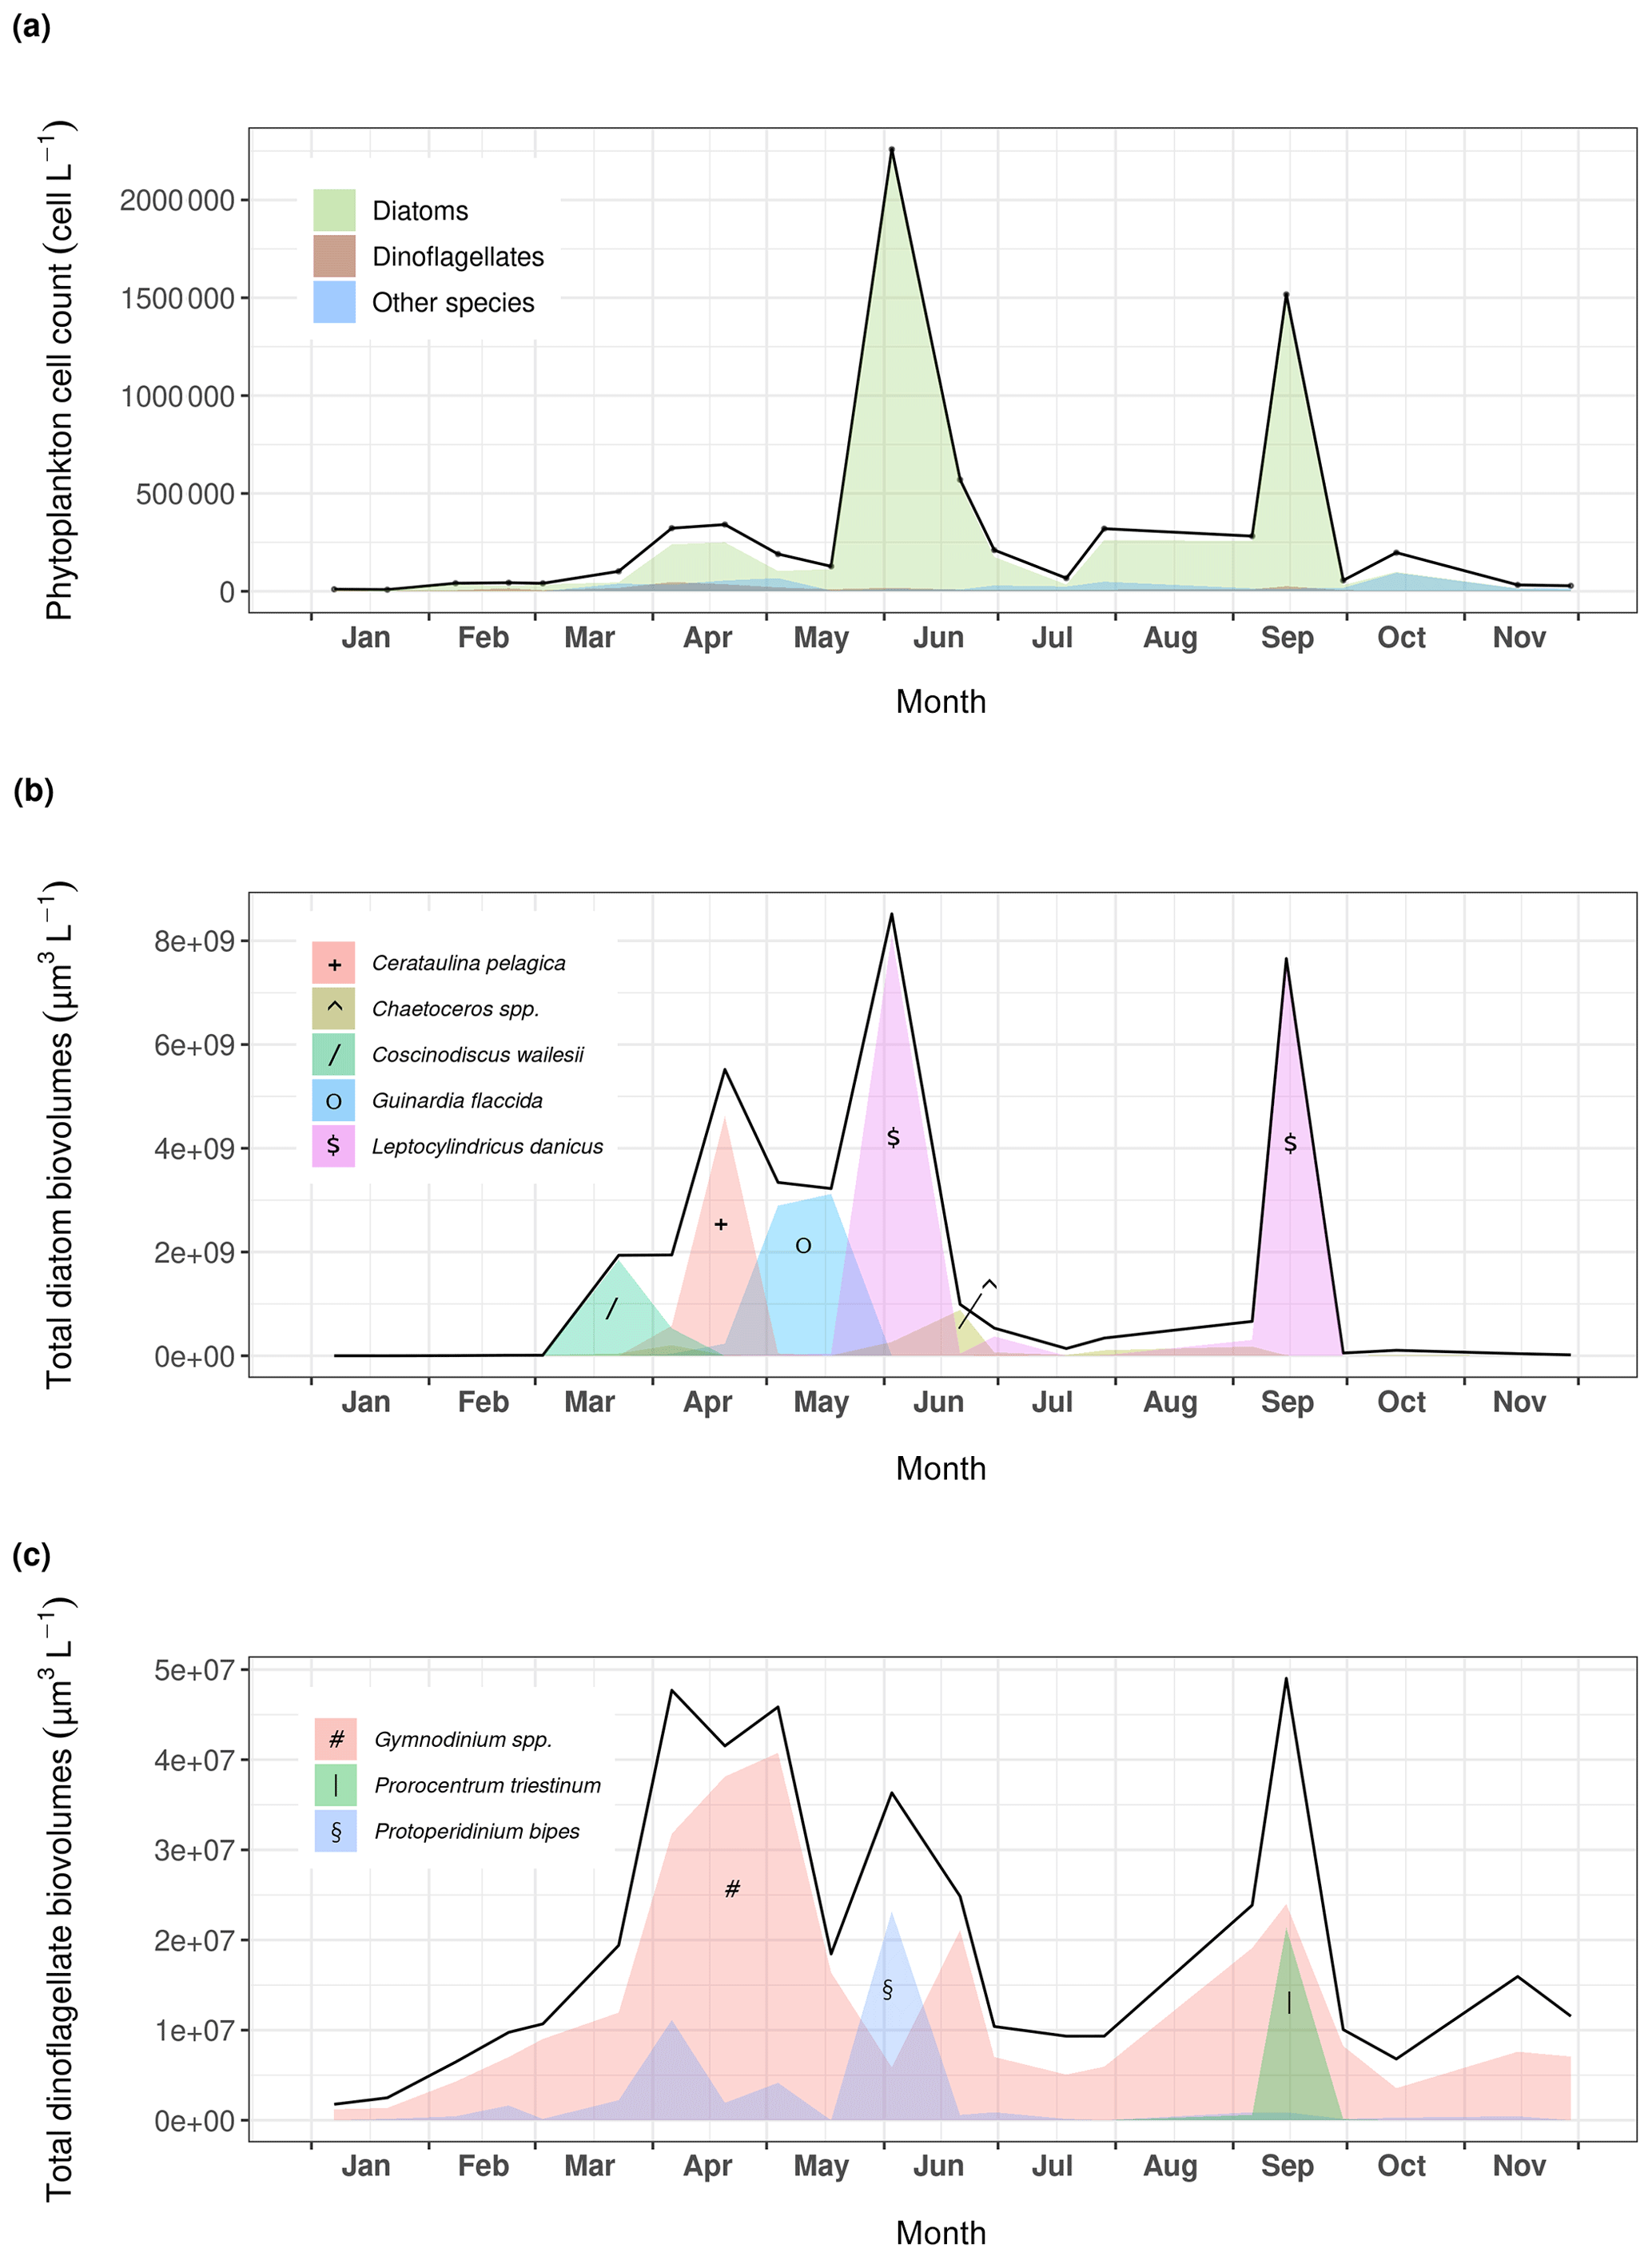
Figure 4(a) Phytoplankton dynamics recorded at Lanvéoc in 2021. Relative presence of the main (b) diatom and (c) dinoflagellate species expressed as cell biovolumes.
Phytoplankton communities at Lanvéoc were predominantly composed of diatom species, which represented 87 % of the counted cells in the total phytoplankton samples from 2021 (Fig. 4). Although the most dominant diatoms in the Bay of Brest are usually Chaetoceros spp. (e.g., Lorrain et al., 2000; Thébault et al., 2022), the two main blooms of 2021 mainly consisted of Leptocylindrus danicus and occurred on 3 June (68 % of total phytoplankton) and 15 September (95 % of total phytoplankton). A smaller increase in the number of microalgal cells involving other species was also observed in mid-spring, caused by the presence of Cerataulina pelagica and Guinardia spp. cells (Fig. 4a). This minor increase was particularly visible considering the biovolume of the species present (Fig. 4b), calculated with the equations provided in Smayda (1965). A succession of several diatom blooms was observed involving different species, such as Coscinodiscus wailesii, Cerataulina pelagica and Guinardia flaccida, which reached maximum abundances on 23 March, 20 April and 18 May, respectively, while L. danicus remained the dominant diatom species (Fig. 4b). Dinoflagellates were mainly represented by three species, i.e., Gymnodinium spp., which showed three blooms, on 4 May, 17 July and 15 September, as well as Protoperidinium bipes and Prorocentrum triestinum, which bloomed on 2 June and on 15 September, respectively (Fig. 4c). Potential causes for bloom decay are given in Sect. 3.3.2.
3.3.2 Organic matter analyses
Seawater samples dedicated to chlorophyll a (Chl), pheophytin (Pheo), particulate organic carbon and nitrogen (POC and PON, respectively) and biogenic silica (BSi) analyses were collected from the surface and bottom waters using a 5 L or a 8 L Niskin bottle. Some samples for the bottom layer were collected using a syringe for a few dates (collecting strategy is specified in the dataset). Water samples were filtered through glass fiber filters (GF/F, Whatman) and pre-combusted for 4 h in a muffle furnace at 450 ∘C for Chl, Pheo, POC and PON measurements. BSi samples were analyzed after filtering seawater through 0.6 µm polycarbonate (Merck) filters. For each parameter, the filters were stored in an appropriate setting, i.e., POC/PON and BSi samples in a dark and dry place, and Chl and Pheo samples were kept at −80 ∘C. POC and PON concentrations were measured with a carbon–hydrogen–nitrogen (CHN) elemental analyzer using the combustion method (Thermo Fisher Flash 2000; Aminot and Kérouel, 2004). In addition, the BSi content was determined using protocols adapted from Ragueneau and Tréguer (1994). Chl and Pheo were extracted in 6 mL of 90 % acetone and kept in the dark at 4 ∘C for 12 h. Samples were then centrifuged and fluorescence was measured with a Turner AU-10 fluorimeter using the equation provided in Lorenzen (1966).
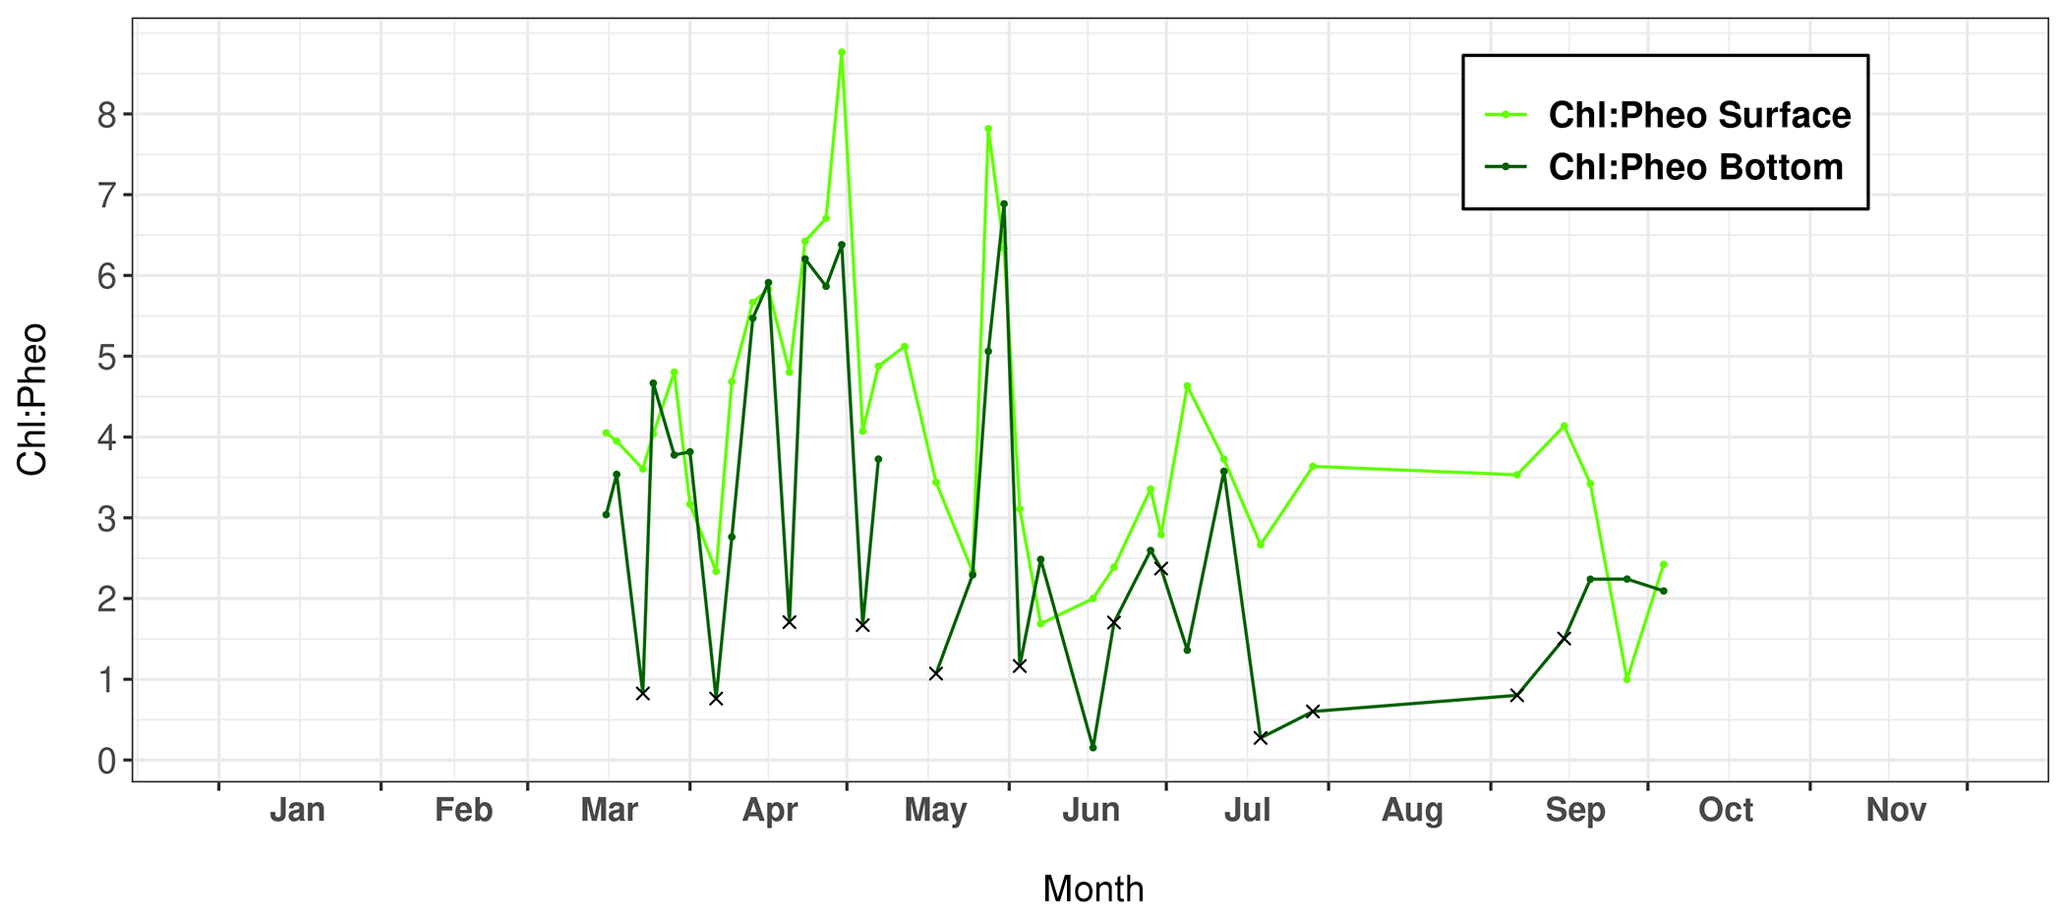
Figure 5Variations in the chlorophyll a : pheophytin ratio (Chl : Pheo) measured in surface and bottom layers of the water column at Lanvéoc during 2021. Crosses indicate seawater sampled with a bottom syringe.
The calculation of the Chl : Pheo ratio can be used to determine the freshness of the phytoplankton in the water column. According to Savoye (2001), a ratio below 1 indicates degraded organic matter, which can be considered detrital if the value drops below 0.5, and a ratio greater than 2 describes fresh phytoplankton. At Lanvéoc in 2021, the physiological state of the phytoplankton was rather good because the ratio was always higher than 1 for the surface layer (Fig. 5), with the exception of samples from 7 June and 27 September. In bottom waters, this value occasionally fell below 2, and even below 1, i.e., on 23 March (0.82), 6 April (0.76), 20 April (1.71), 4 May (1.67) and 18 May (1.07), contemporaneously with increases in phytoplankton cells (Fig. 4). Moreover, during the main phytoplankton bloom of the year (3 June), a Chl : Pheo value below 2 was also recorded in bottom waters (1.16 on 6 June) and the minimum value was recorded a few days later (0.15), on 17 June. Between 19 July and 6 September, a time interval of low Chl : Pheo values was recorded in the bottom layer. These results indicate a degradation of phytoplankton cells that occurred after specific blooms or more generally during summer. The reason behind this degradation may be the natural deterioration of cells due to a decrease in nutrient levels, having been consumed by the blooms (Fig. 3), or intense grazing activities by zooplankton or heterotrophic dinoflagellates that directly impact Chl concentrations.
3.4 Trace element measurements
Seawater samples for trace element measurements were collected with 5 L Teflon-coated GO-FLO bottles (Teflon prevents element adsorption on the bottle walls) in surface and bottom waters. Approximately 1 L of water was filtered through 0.45 µm MF-Millipore™ mixed cellulose ester filters (Merck). The filters were then air-dried and stored in 30 mL PTFE vials (Savillex, Minnetonka, MN, USA) until analysis of particulate trace elements. The filtered water was recovered in 15 mL polypropylene (PP) tubes and stored at (4 ∘C) until analysis of the dissolved trace elements. Before use, filters and PP tubes were cleaned with HNO3 solutions (pH 1) made from Suprapur HNO3 65 % (Merck, Darmstadt, Germany) and thoroughly rinsed with ultrapure water. PTFE vials were cleaned at 80 ∘C for 3 h with concentrated HNO3 and H2O2 as for filter digestion and then thoroughly rinsed with ultrapure water.
For trace element analysis of the particulate matter, filter digestions were carried out at 80 ∘C for 3 h in closed 30 mL-PTFE screw-cap vials (Savillex, Minnetonka, MN, USA) by adding 2 mL of HNO3 65 % (Merck, Darmstadt, Germany) and 500 µL of Suprapur 30 % hydrogen peroxide (H2O2; Merck, Darmstadt, Germany). The elemental analyses were then conducted on diluted mixtures (2.3 % HNO3) with an X-series II, quadrupole inductively coupled plasma mass spectrometer (Q-ICP-MS; Thermo Scientific) and, for Ca, P, Zn and Al specifically, with a Horiba Jobin Yvon Ultima 2 ICP – optical emission spectrometry (ICP-OES) device operating at the Pôle Spectrométrie Océan (Plouzané, France). Measurement of elemental concentration within the dissolved fraction was carried out with a sector field ICP-MS (Element XR, Thermo Scientific) operating at Ifremer (with the exception of Ca and Al again, which were measured with an ICP-OES). Since the salt matrix of seawater samples can affect chemical measurements, samples were diluted 100 times with 2 % HNO3 prior to the measurement. All particulate and dissolved concentrations shown in the present study were above detection limits. The data obtained by ICP-MS and ICP-OES were also corrected for machine drift by inserting multi-element standard solutions every two samples. A certified reference material, NASS-6 seawater (National Research Council, Canada), and a standard solution prepared from a multi-element solution (1 ppb; VWR Chemicals and Prolabo) were used in order to assess the accuracy of measurements in the dissolved and the particulate phase, respectively.
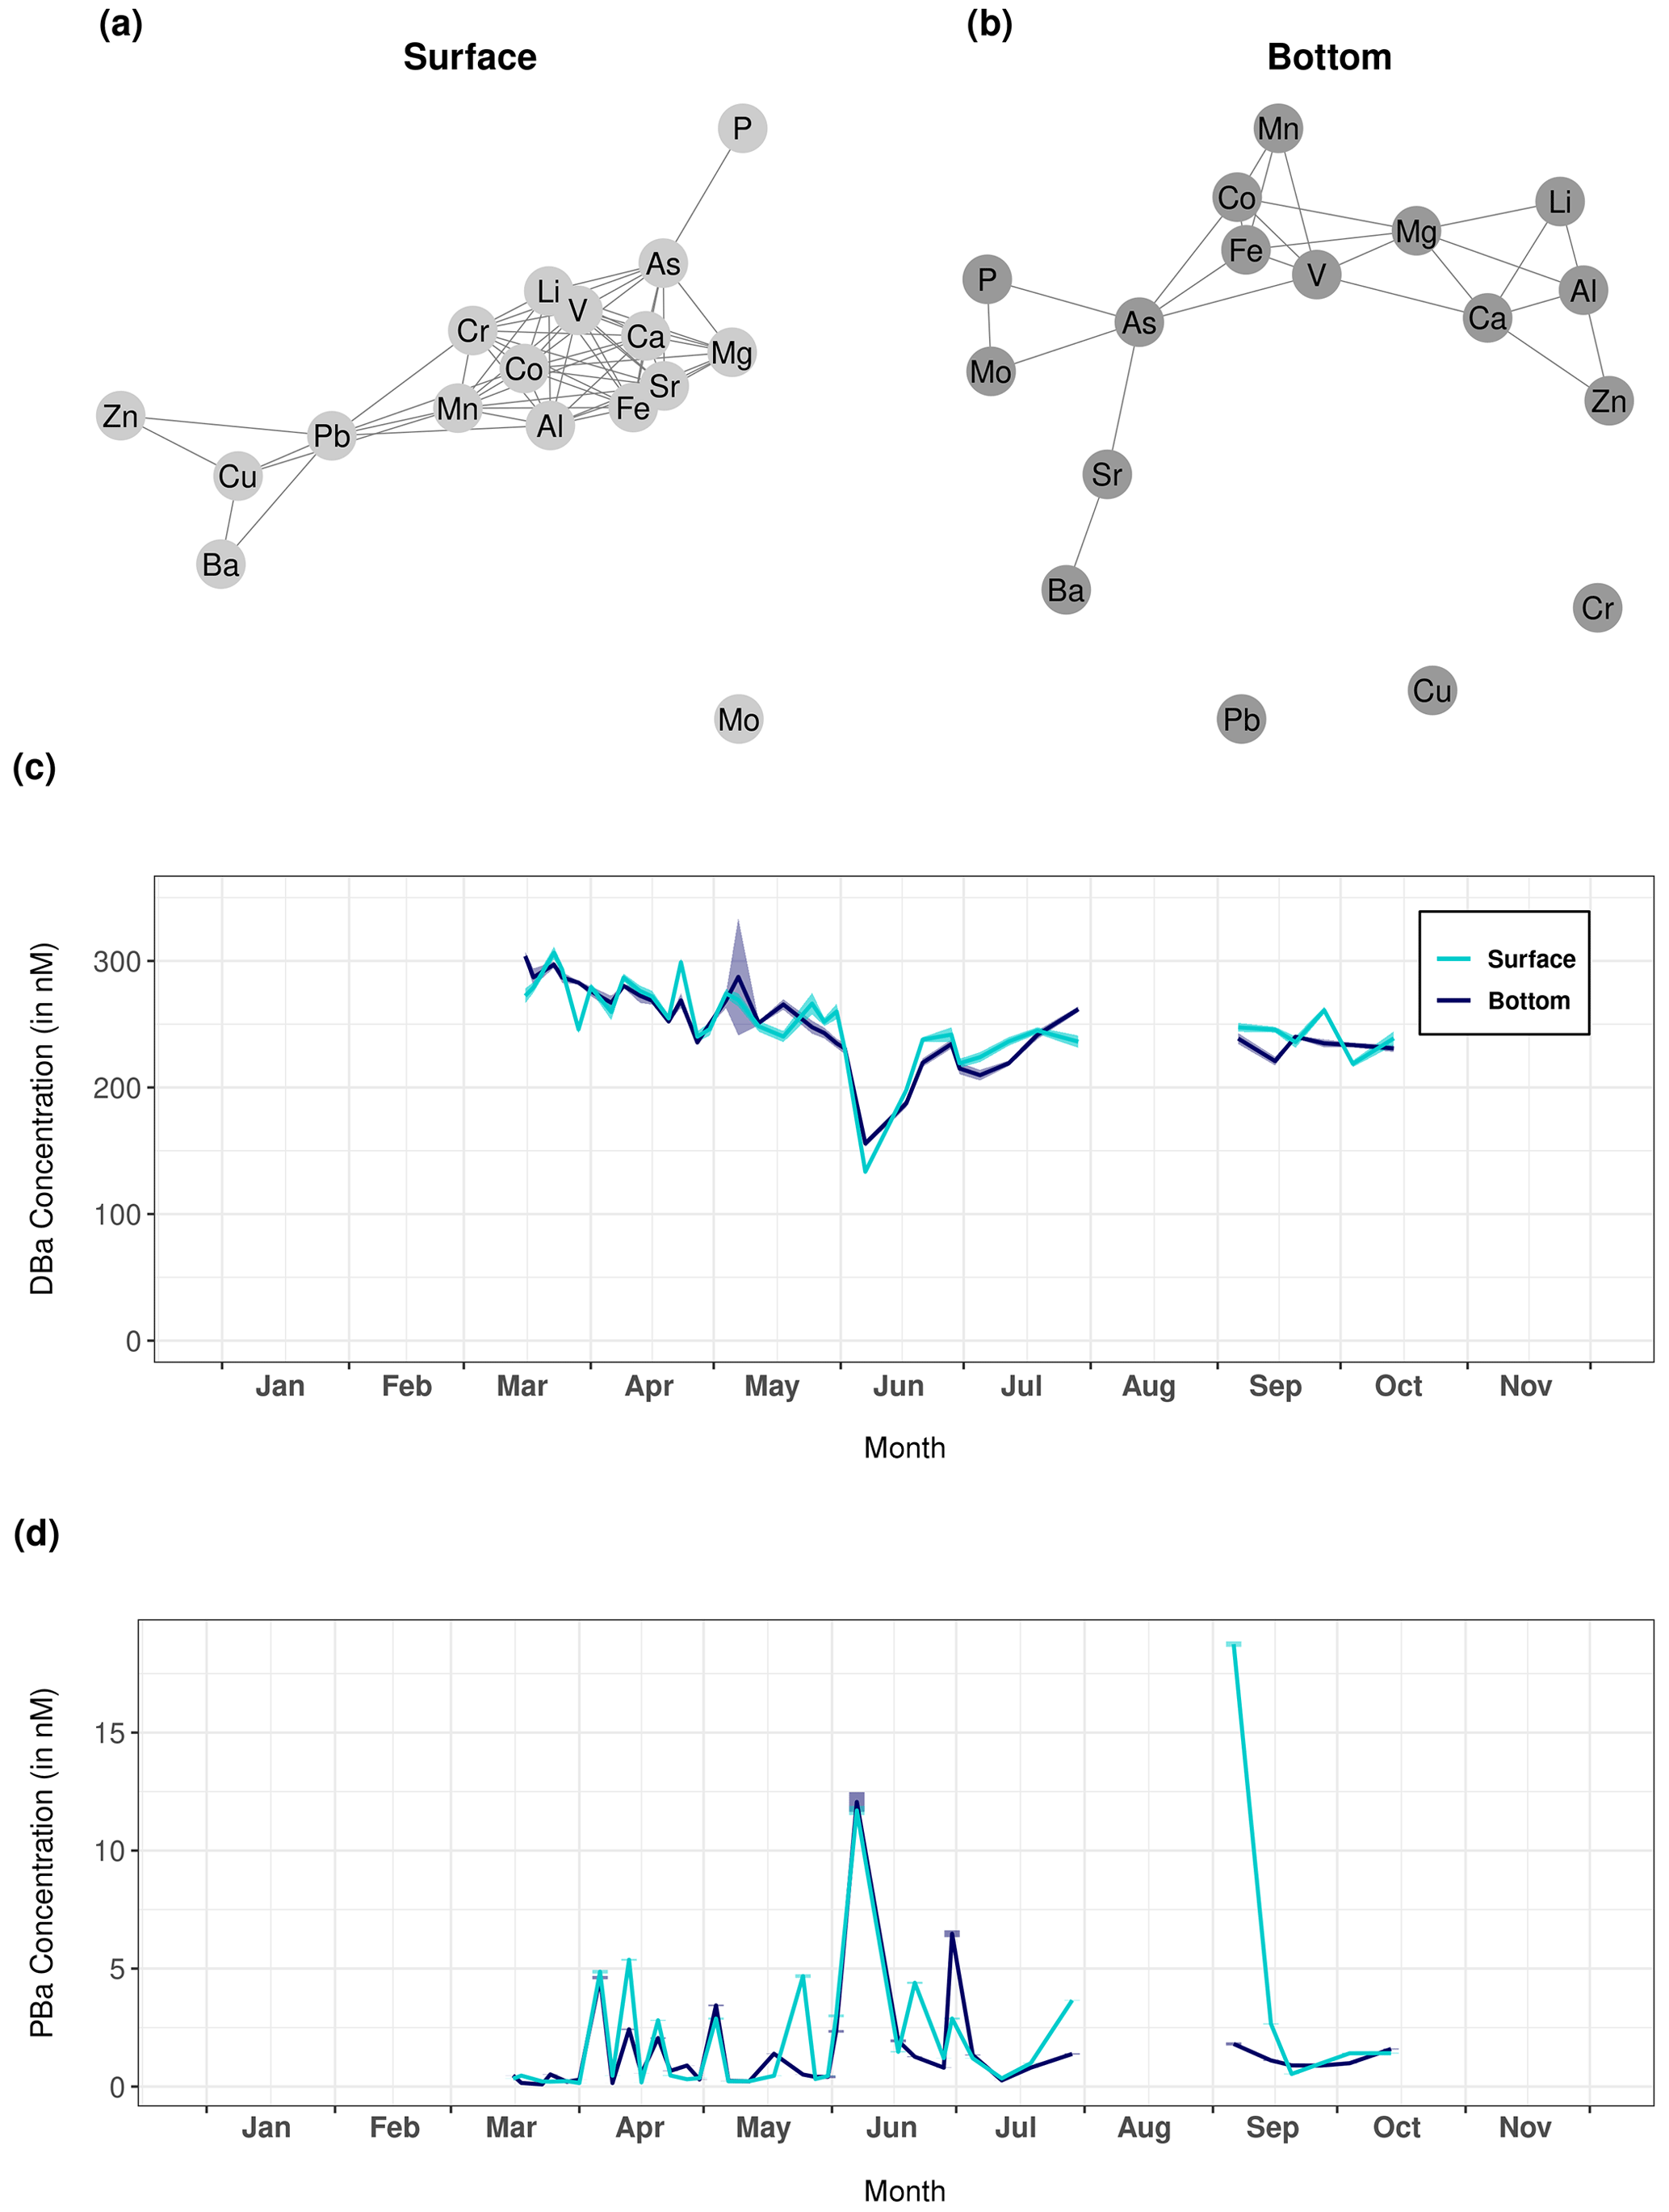
Figure 6Network graphs showing Pearson correlations between each measured trace element of the particulate fraction in (a) surface and (b) bottom waters. Only significant correlations with a coefficient greater than 0.62 are shown on these graphs. (c) Dissolved and (d) particulate barium (DBa and PBa, respectively) recorded at Lanvéoc during 2021 in surface and bottom waters.
The network graphs show the Pearson correlations between all the trace elements measured in the particulate fraction of the surface and bottom water samples obtaining during HIPPO monitoring (Fig. 6a and b, respectively). The element dynamics in the water column were clearly different between the surface layer and bottom water, i.e., the measured elements appeared strongly correlated with each other in surface water but not in the bottom water. In surface water, only Mo and Cd were not correlated with any other element, unlike Ca, Mg, V, Li, Co, Mn, Fe, Sr and Al, which formed a strongly intercorrelated group. It is worth mentioning here that a cluster appears around particulate vanadium in both water layers. Vanadium, an essential element for phytoplankton cells (Moore et al., 1996), was significantly correlated with other elements also essential for microalgae, such as Fe, Mn and Co, which are involved in several enzyme systems (Whitfield, 2001). By contrast, Ba and Sr showed patterns that differed from the other elements, and both elements were only correlated to each other in bottom water.
The temporal changes in particulate and dissolved Ba (Fig. 6c and d) showed interesting patterns. After the main bloom of L. danicus in early June 2021, concentrations of Ba in the dissolved phase (DBa) drastically decreased, while concentrations of particulate barium (PBa) strongly increased, both in surface and in bottom waters. Ba is not known to have any biological function for diatoms, but may be adsorbed on their frustules (Dehairs et al., 1980; Fisher et al., 1991; Sternberg et al., 2005). Therefore, the findings suggest a transition of Ba from the dissolved to the particulate phase during the bloom, associated with an adsorption of Ba onto diatom frustules. An alternative explanation includes the occurrence of Acantharea or Coccolithophoridae, known to adsorb Ba on their skeletons, which are mainly composed of Sr or Ca respectively (Michaels, 1991; Bernstein et al., 1992; Langer et al., 2009). The affinity between Ba and Sr is reflected in their significant correlation only in the bottom layer (see Fig. 6b). No adequate method was available to prove the presence of Acantharea and Coccolithophoridae in 2021 in the Bay of Brest, although cells of the latter have been observed in this region in the past, mainly in bottom water.
3.5 Particle dynamics and composition
3.5.1 Aggregation episodes
Under stress conditions, such as limitation in nutrients that had previously been entirely consumed during a bloom or changes in temperature, phytoplankton cells are known to excrete extracellular polymeric substances (EPSs), which are precursors to transparent exopolymer particles (TEPs) that favor the formation of aggregates (Alldredge et al., 1993; Passow, 2002a). These aggregates often terminate the bloom and export the phytoplankton out of the euphotic layer to the deep oceanic layer in the open ocean, or toward the sediment (and benthic organisms) in coastal ecosystems. Particles were sized and counted using a UVP6, a compact autonomous underwater imaging system (Picheral et al., 2021). This instrument has been designed for intermittent profile measurements in the water column, but here the intention was to determine particle dynamics at the sediment–water interface as a continuous time series. The design of the UVP6 was therefore modified to meet the needs of the present study. To minimize turbulence, particle resuspension and natural light variation, which can alter image quality and particle detection, the objective and the light source were integrated into an opaque cylinder. This cylinder is completely closed on the bottom to avoid taking pictures of resuspended particles rising from the sediment. To ensure constant hydrodynamics within the cylinder and attenuate horizontal fluxes, a 1×1 cm mesh was added, covering the top of the cylinder. This device was deployed at the seafloor on 16 March 2021. Every hour, the UVP6 acquired two types of data. Firstly, a picture was taken every 20 s for 30 min to measure particle sizes and to calculate concentrations according to size class (from 80.6 µm to 26 mm, divided into 25 size classes). The data are available from the ECOTAXA server (https://ecotaxa.obs-vlfr.fr, last access: 24 July 2023). Secondly, the UVP6 took full high-resolution images every 2 s for 3 min to calculate particle trajectories and settling velocities. Due to the colossal size of these images, they are not available on SEANOE but are available upon request.
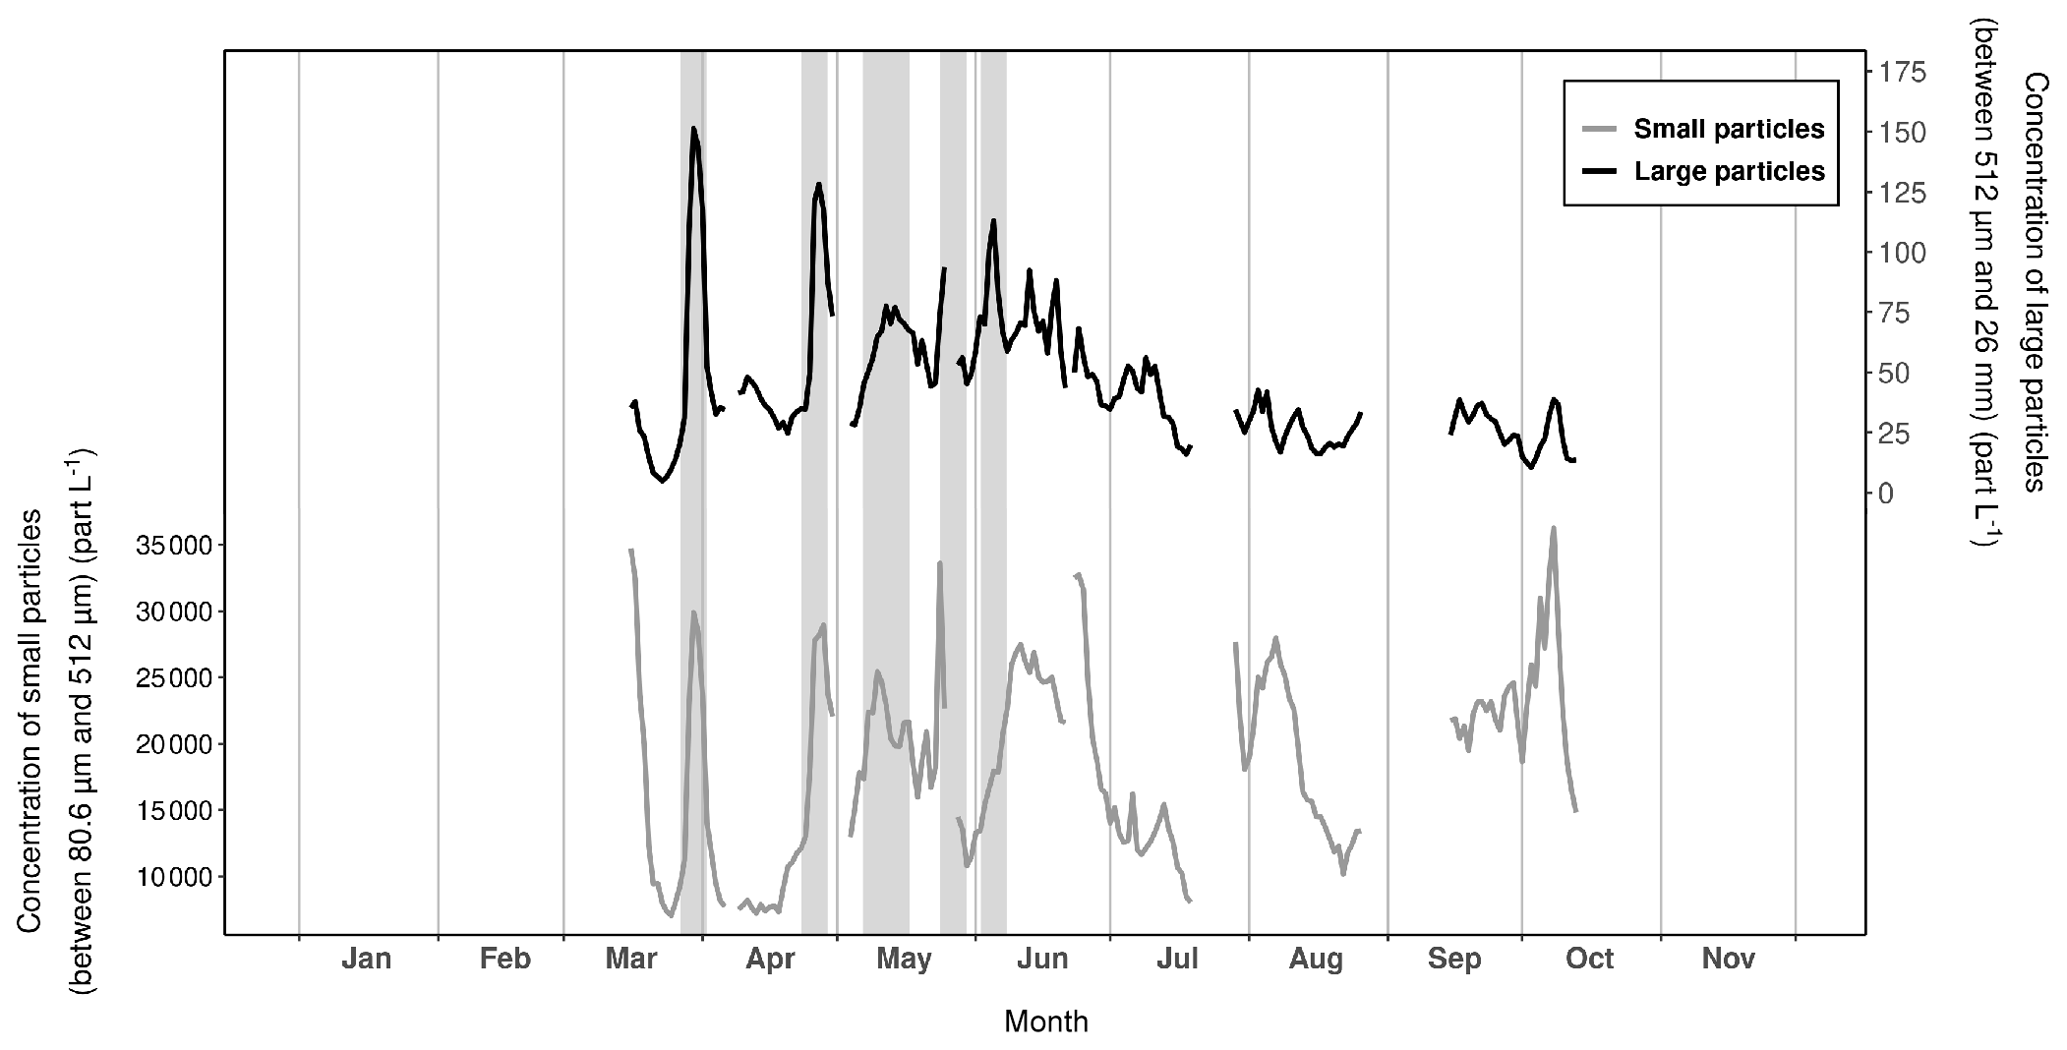
Figure 7Variations in the daily mean particle concentrations recorded with the UVP6 imaging sensor at Lanvéoc during 2021. The dark lines represent the concentration of large particles between 512 µm and 4.10 mm (equivalent spherical diameter, ESD) and the gray lines show the concentration of smaller particles, ranging from 50.8 to 512 µm (ESD). Gray shaded areas denote aggregation events.
Figure 7 shows the temporal variation of small particles (daily sum of the mean concentration of particles ranging from 80.6 to 512 µm in size) and large particles (daily sum of the mean concentration of particles ranging from 512 µm to 26 mm in size). Several aggregation periods were detected by isolating peaks in large particle concentrations whose amplitudes were at least twice as large as the minimum values at the base of each peak. Based on this method, one incomplete and four complete episodes of aggregation were identified from these time series. The first episode took place on 30 March, the second on 27 April and the third on 13 May; the fourth (incomplete) episode was recorded between 26 and 28 May (incomplete due to the removal of the UVP6 to recover data and reload the battery) and, finally, the last episode occurred on 6 June (Fig. 7). Each of these episodes were preceded by a phytoplankton bloom of a few days' length, characterized by different species (Fig. 4b and c). The first aggregation episode may have resulted from the collapse of the first bloom of C. wailesii due to the onset of PO limitation (Fig. 3). After this first aggregation event, N and P were almost constantly in growth-limiting concentrations. A second period of Si(OH)4 limitation started in early June, corresponding to the last episode of aggregation recorded during the spring and summer. In contrast, the other aggregation events may have been triggered by other parameters. For instance, in their competition for resources, some mixotrophic dinoflagellate species such as Gymnodinium spp. or Protoperidinium bipes (whose populations expanded in late March, mid-May or early June for example; Fig. 4c) are known to excrete compounds toxic to other microalgae, causing an allelopathic effect and therefore cell lysis and aggregation (e.g., Legrand et al., 2003; Band-Schmidt et al., 2020).
3.5.2 Sediment trap data
A HYDRO-BIOS Multi Sediment Trap with 12 collecting bottles (total volume: 290 mL) was deployed during the survey to analyze the chemical composition of the particles that sedimented at the seafloor. The catchment area of this model was 153.86 cm2 with a rotation frequency of every 3 d (between 2 March and 25 May) and every 4 d (between 26 May and 29 July). Before deployment, each bottle was poisoned to prevent biological activity and thus degradation of the organic matter. Sedimenting material was analyzed for the trace element composition, as well as POC, PON and BSi. Protocols used for these measurements are described in Sect. 3.3.2 and 3.4. Before filtration, the samples were shaken (to break up the aggregates) and passed through a 1 mm mesh sieve to remove big particles and avoid clogging the filters.
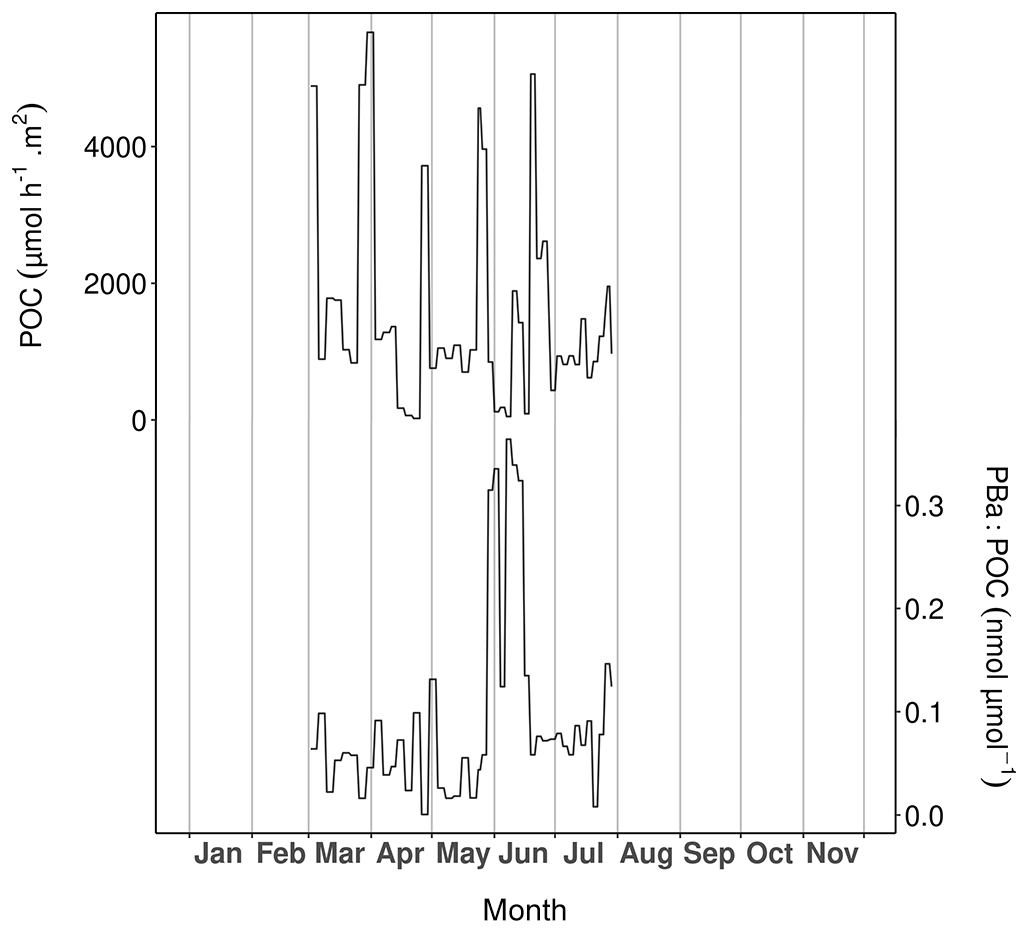
Figure 8Particulate organic carbon (POC; upper curve) and particulate barium-to-POC ratio (PBa : POC; lower curve) measured in the sediment trap samples at Lanvéoc in 2021.
In total, five complete episodes of high carbon flux were recorded at Lanvéoc: during 28–31 March (5672.57 ), 26–29 April (3719.93 ), 26–28 May (4562.25 ), 10–12 June (1887.20 ) and 19–21 June (5031.75 ; Fig. 8). The average POC transport values outside these events oscillated around 700 . During late March, late April and late May, POC transport peaks occurred at the same time as the aggregation episodes recorded with the UVP6, but the two other transport peaks did not occur at the same time as the aggregation peaks (Fig. 7). These results validate the signals obtained with the UVP6 and thus the deployment method of the present experiment. Furthermore, these findings highlight the role of aggregate dynamics in the transport of particulate carbon to the sediment–water interface. However, not all carbon transport events were caused by aggregation episodes, but sometimes simply by the development and the subsequent decay of phytoplankton cells. Based on the calculation of the PBa : POC ratio, Fig. 8 shows the time intervals during which an enrichment in the particulate Ba flux was recorded. PBa : POC was relatively low during most of the year, with a baseline value between approx. 0.01 and 0.1 nmol µmol−1. This baseline was interrupted by a large peak that occurred between 28 May and 16 June, reaching its maximum value (0.36 nmol µmol−1) over 6–9 June. At the same time, the largest diatom bloom of the year occurred (Fig. 4), as well as the subsequent aggregation episode (Fig. 7) and the main phytoplankton degradation event (Fig. 5). As stated in Sect. 3.4, Ba can be adsorbed onto diatom frustules, explaining the peak observed in the water column as well as the high Ba flux that occurs at cell decay after a bloom.
3.6 Shell data
As described in Sect. 2, a large number of shells were collected during this monitoring study. Here, only results are presented from shells collected at the end of the monitoring period, which were used to produce the growth and trace element time series for 2021.
3.6.1 Growth rate
The P. maximus specimens collected during this study were all treated in the same way, whether collected directly from the sediment surface or the cage. After collection, individuals were dissected and soft tissues (gills, mantles, digestive glands and muscles) were freeze-dried for further element chemical analyses. Left (flat) valves were gently cleaned with tap water using a nylon brush and rinsed ultrasonically for 3 min with deionized water. The outer surfaces of left valves were imaged under reflected light using a Canon EOS 600 DSLR camera coupled with a Wild Heerbrugg binocular microscope equipped with a Schott VisiLED MC 1000 light source (sectoral dark field). Because the specimens were collected alive, the last growth line visible on the outer margin was formed immediately prior to the collection date. This allows each increment to be placed into an accurate temporal framework by counting the daily increments from the ventral margin toward the umbo because king scallops produce growth lines on a daily basis (Chauvaud et al., 1998).
The average growth rate calculated from six specimens collected from the sediment surface ranged from 69.8 to 220.6 µm d−1 with a March–October average value of 171.3 µm d−1 (Fig. 9). From the onset of the growth period, growth rate gradually increased and reached a maximum value in early June. However, this increasing trend was interrupted by a slow-growth episode between 26 April and 5 May. This decline in growth rate has been observed in previous studies of king scallops from the Bay of Brest but does not occur every year (e.g., Chauvaud et al., 1998; Fröhlich et al., 2022b, a). The slow-growth phase occurred after the main bloom of Gymnodinium spp., a dinoflagellate known to produce toxic blooms (Fig. 4c; Daranas et al., 2001), and after an aggregation episode (Fig. 7). These two phenomena combined may explain the drop in shell production rate, because scallops may decrease the filtration rate during stressful conditions.
3.6.2 Geochemical analyses
Geochemical analyses were performed according to protocols described in Fröhlich et al. (2022a, b). The element chemical content of the shells was measured at the Max Planck Institute for Chemistry (Mainz, Germany) using a laser ablation (NewWave Research UP-213 Nd:YAG) – ICP-MS (Thermo Fisher Element 2) system. In total, slabs of six shells (three specimens from the sediment and three from the cage deployed 1 m above the sediment) were analyzed. Table 2 gives an exhaustive list of the elements that were measured in the present study. Laser scans were completed on every daily growth line (a.k.a. stria), by running the laser in line scan mode on the outer shell surface perpendicular to the growth direction and parallel to the growth line (Fig. 9a). Within each stria, measurements were completed using a laser spot diameter of 80 µm at a constant speed of 5 µm s−1. Prior to sample ablation and measurement, each sample was pre-ablated (100 µm spot size with a speed of 80 µm s−1) to remove potential contaminants. Results are expressed as molar element-to-calcium ratios because 43Ca was used as an internal standard. Chemical data were placed into an accurate temporal context by means of growth pattern analysis.
Figure 10 presents the data of shells collected directly on the sediment (sediment specimens) and 1 m above (cage specimens). The profiles recorded in the shells are characterized by a baseline whose values were different according to whether the shells came from the sediment (approx. 1 µmol mol−1 on average) or from the cage (approx. 2 µmol mol−1 on average). These baselines were interrupted by two major peaks that occurred at approximately the same moment between sediment and cage specimens, although their amplitudes differed slightly. The first peak occurred around 7 or 8 June (sediment shells: 9.50 µmol mol−1, cage shells: 6.34 µmol mol−1), and the second around 2 July (4.91 µmol mol−1 and 3.10 µmol mol−1, respectively). Furthermore, a third, smaller peak occurred on 30 July (2.72 µmol mol−1), exclusively in sediment shells. Ba content recorded in P. maximus shells followed more or less the same pattern as the PBa measured in bottom waters at Lanvéoc, where two major peaks were also observed at the beginning of June and July (Fig. 6d). Moreover, the relative amplitudes of these peaks were also similar, since the first peak was approximately twice as high as the second one. Nonetheless, other smaller PBa peaks occurred in bottom waters throughout the monitoring phase, for instance, in April (Fig. 6d), and did not coincide with any increase in shells (Fig. 10).
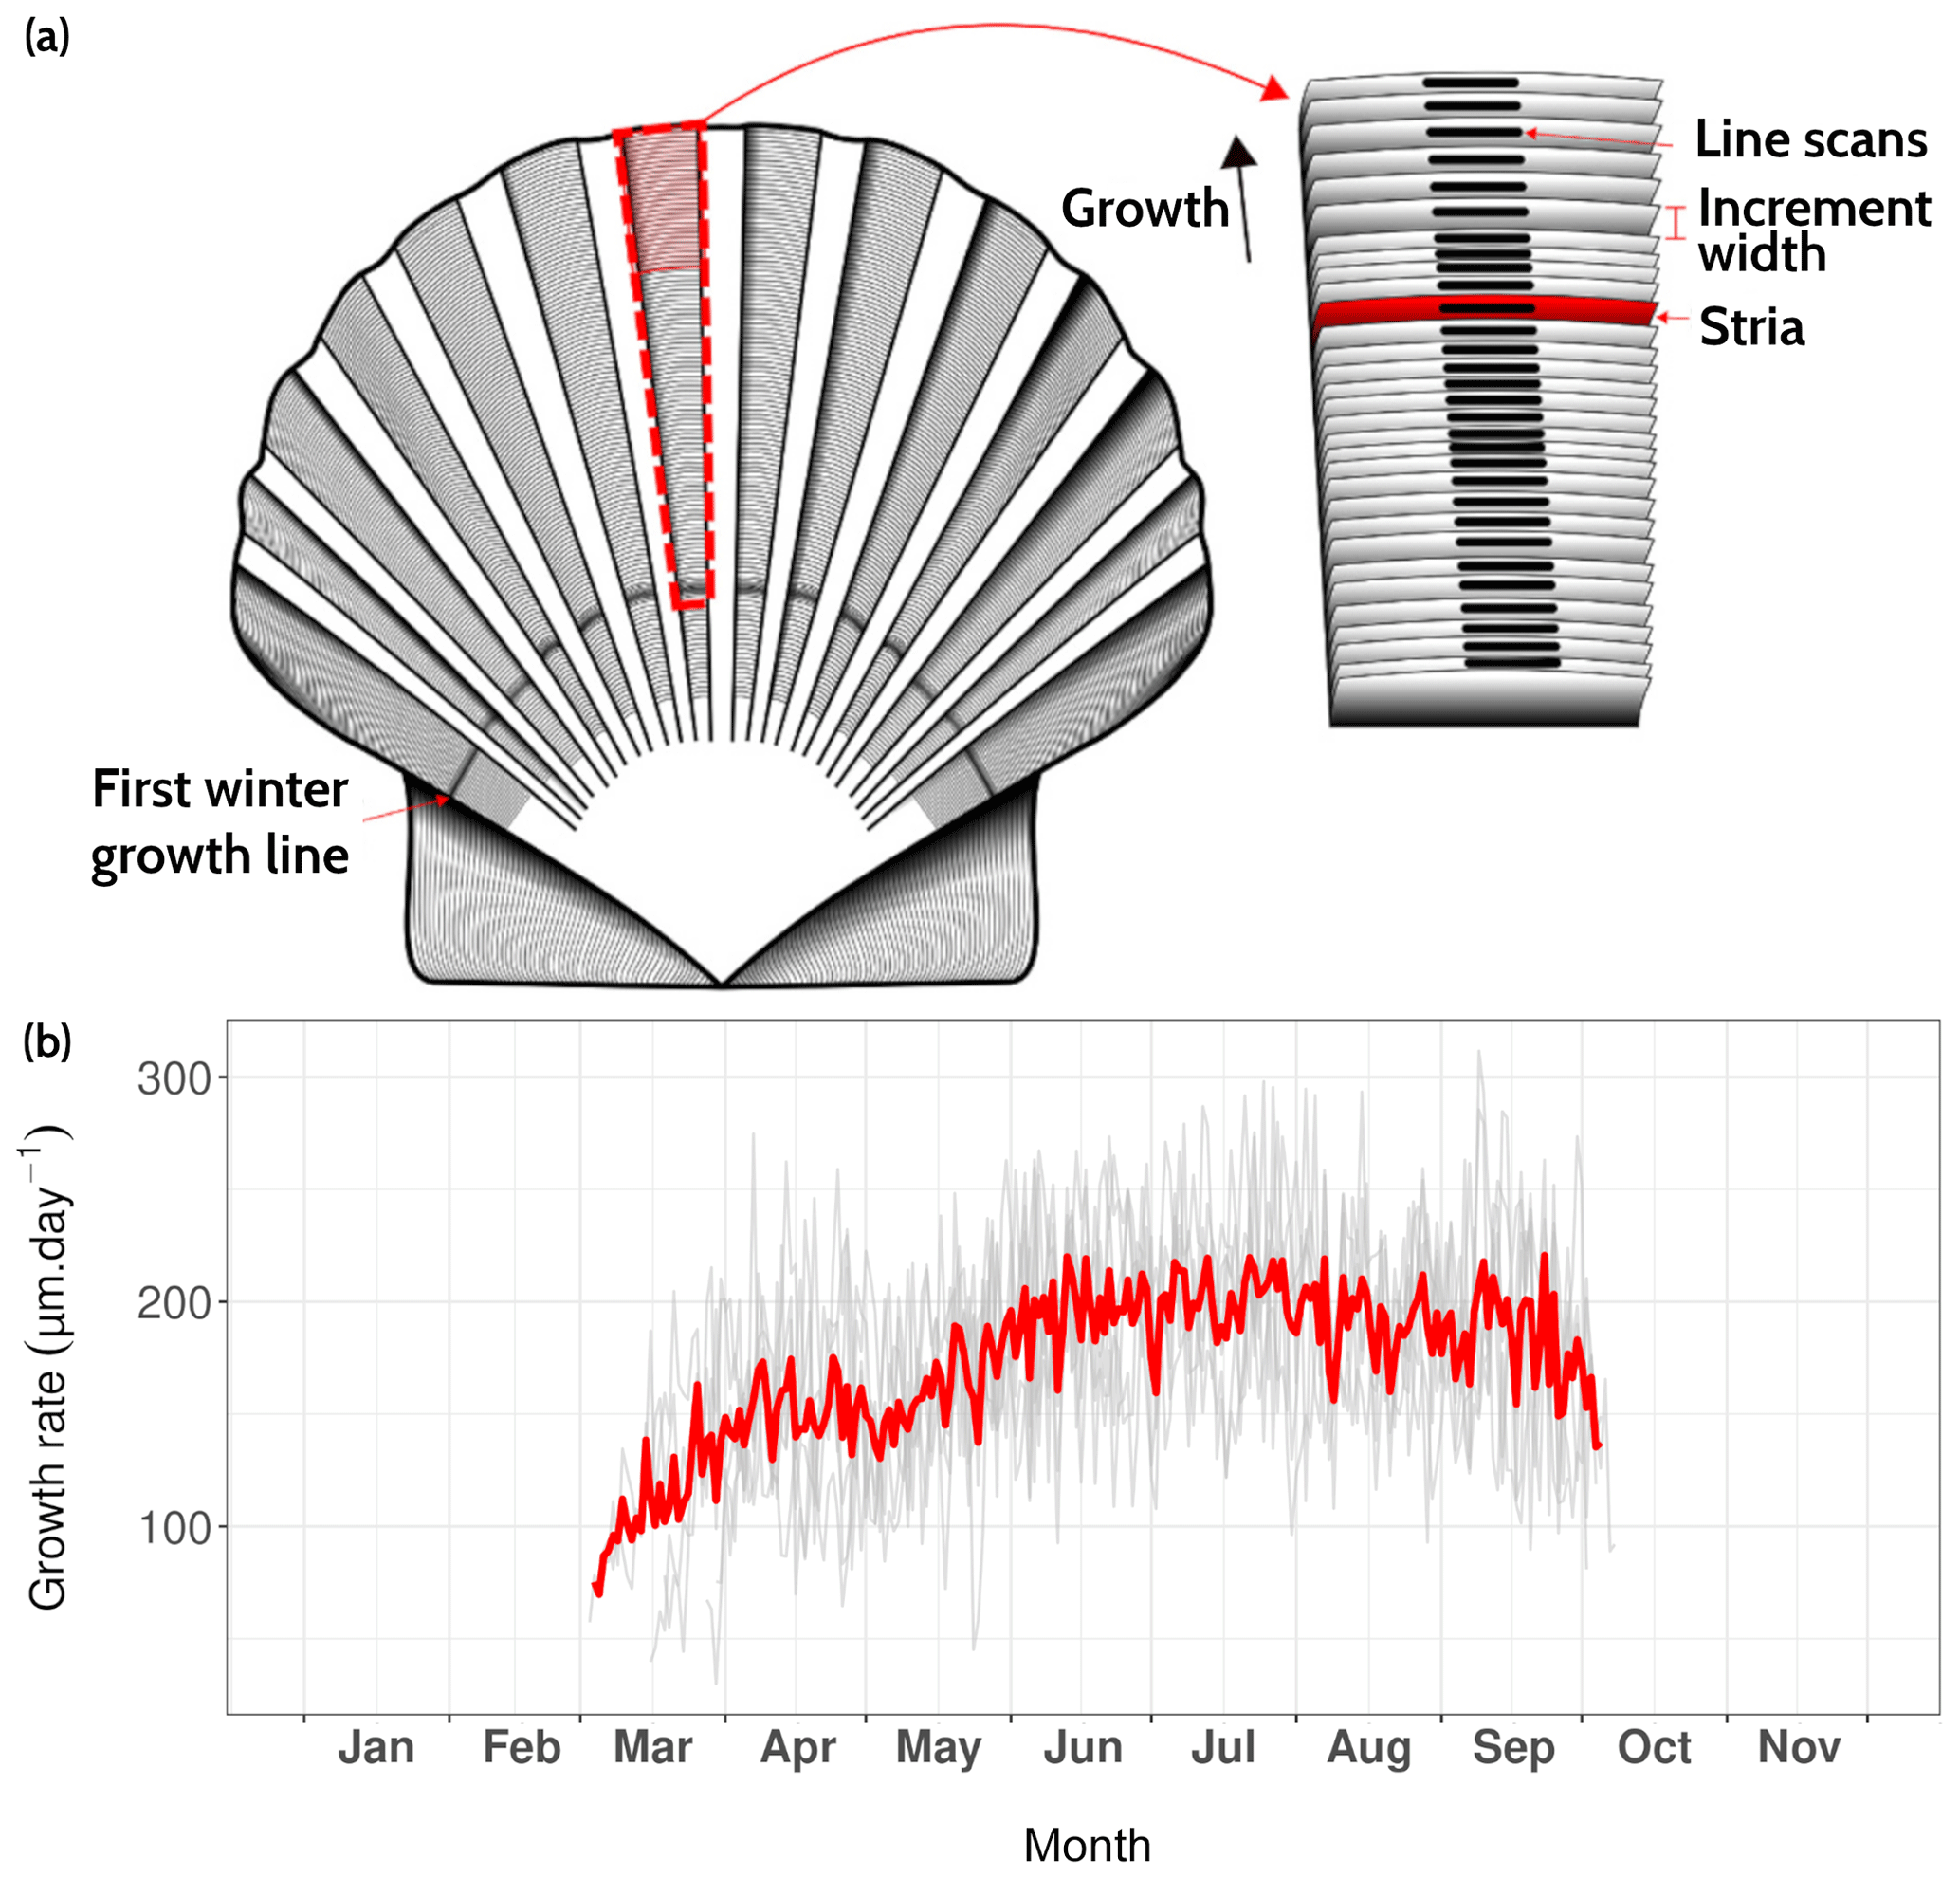
Figure 9(a) Surface of Pecten maximus shell (left valve), showing growth patterns (increments and lines, a.k.a. “striae”) as well as the sampling strategy for trace element measurements via LA-ICP-MS (“line scans”; from Fröhlich et al., 2022b). (b) Average daily growth rate (red curve) calculated from six specimens (gray curves) that were collected alive at Lanvéoc from the sediment surface.
Figure 10Average signals measured in shells of P. maximus that were collected from the sediment surface (blue curve, n=3) and 1 m above the substrate (red curve, n=3). The abundances of Chaetoceros spp. (dark green areas) and L. danicus (light green areas) are also shown.
Previous studies have suggested that of P. maximus shells can serve as a proxy for primary productivity (Barats et al., 2009) or species-specific blooms of phytoplankton (Fröhlich et al., 2022b). In the present study, the main shell peak occurred during the main diatom peak, mainly represented by L. danicus, and during the main episode of Ba transport toward the sediment (Fig. 8). The second shell peak occurred a few days after a Chaetoceros spp. bloom. However, the third Ba peak recorded in sediment shells did not align with any diatom bloom. Fröhlich et al. (2022b) suggested an average time lag between diatom blooms and shell Ba peaks of 8 to 12 d, which corresponds more or less to the observations of the present study. However, the sampling frequency for phytoplankton determination was not sufficient to track the exact timing of the blooms.
The dataset used in this article is available at https://doi.org/10.17882/92043 (Siebert et al., 2023).
Table 1List of environmental parameters measured at Lanvéoc in 2021 during the HIPPO monitoring. POC and PON are particulate organic carbon and nitrogen, respectively; BSi is biogenic silica.
Table 2List of parameters measured within the shells of Pecten maximus collected at Lanvéoc in 2021.
In this article, only an overview of the results gathered during the HIPPO monitoring conducted at Lanvéoc during 2021 is presented. The dataset helps in better understanding the links between phytoplankton dynamics, water column chemistry and the incorporation of trace elements into the shells of P. maximus. However, the dataset also contains information useful for other topics of interest. Tables 1 and 2 compile all variables that have been made available for other scientists on the SEANOE platform (https://doi.org/10.17882/92043 – Siebert et al., 2023). Moreover, the hypotheses and assumptions given in this paper, as well as other topics that have not been mentioned, will be the focus of several articles that are currently in preparation.
The HIPPO monitoring was initially designed by JT and BRS, the leader of the project. VS, BM and JT performed the preparation of the environmental survey, with the help of several authors of this publication. During the monitoring, EA, TLB, IB, EG, JT and VS dived at Lanvéoc to collect seawater samples as well as shell materials. For several parameters, filtration prior to measurement was conducted by VS and GD. POC and PON analyses were performed by JD. Nutrients were measured by MLG, with the exception of ammonium, which was measured by EG. Finally, chlorophyll a and pheophytin were measured by IB and biogenic silica by MG and KB. AL is in charge of the Lanvéoc observatory, where several environmental parameters have been recorded twice monthly for a few years. In the framework of this observatory's work, GD performed phytoplankton identification and counting. BB calculated the specific biovolume of phytoplankton cells. Trace element measurement was performed by VS, accompanied by MW in sample preparation, and by MLR, YG and CL in the ICP-MS and ICP-OES analysis sessions. LF prepared the shells for LA-ICP-MS measurement, performed the measurement with KPJ and processed the data. LF also acquired the daily growth rate data on the P. maximus specimens. The deployment of the UVP6 was made possible thanks to the work of MP, who designed the instrument and kindly lent it to the team for this monitoring activity. MP also helped process the data alongside CM. PRM prepared and set up the Sambat/NKE probes and discharged and processed the data. Finally, VS gathered all the data that were obtained for all parameters. VS led the writing of the article. All authors contributed critically to the drafts and gave final approval for publication.
The contact author has declared that none of the authors has any competing interests.
Publisher's note: Copernicus Publications remains neutral with regard to jurisdictional claims in published maps and institutional affiliations.
We warmly thank Brigitte Stoll from the Max Planck Institute (Mainz) for help with the LA-ICP-MS analyses. We are also very grateful to the crew of the Albert Lucas for their involvement in this environmental monitoring activity and their support during the cruises. Moreover, we wish to thank the Plateau d'analyse chimique des paramètres de base de l'environnement marin (PACHIDERM) as well as the Pôle Spectrométrie Océan (PSO) for the measurements of the various chemical parameters.
This survey has been performed within the framework of the French–German collaborative project HIPPO (HIgh-resolution Primary Production multi-prOxy archives).
This research has been supported by the Agence Nationale de la Recherche (grant no. ANR-18-CE92-0036-01), the Deutsche Forschungsgemeinschaft (grant no. SCHO 793/21) and the Région Bretagne.
This paper was edited by Giuseppe M. R. Manzella and reviewed by Andrew Johnson and Niels de Winter.
Alldredge, A., Passow, U., and Logan, B.: The abundance and significance of a class of large, transparent organic particles in the ocean, Deep-Sea Res. Pt. I, 40, 1131–1140, https://doi.org/10.1016/0967-0637(93)90129-Q, 1993. a
Aminot, A. and Kérouel, R.: Hydrologie des écosystèmes marins: paramètres et analyses, Editions Quae and Ifremer, ISBN 2844331335, 2004. a
Aminot, A. and Kérouel, R.: Dosage automatique des nutriments dans les eaux marines: méthodes en flux continu, Editions Quae and Ifremer, ISBN 978-2-7592-0023-8, 2007. a
Band-Schmidt, C., Zumaya-Higuera, M., López-Cortés, D., Leyva-Valencia, I., Quijano-Scheggia, S., and Hernández-Guerrero, C.: Allelopathic effects of Margalefidinium polykrikoides and Gymnodinium impudicum in the growth of Gymnodinium catenatum, Harmful algae, 96, 101846, https://doi.org/10.1016/j.hal.2020.101846, 2020. a
Barats, A., Amouroux, D., Chauvaud, L., Pécheyran, C., Lorrain, A., Thébault, J., Church, T. M., and Donard, O. F. X.: High frequency Barium profiles in shells of the Great Scallop Pecten maximus: a methodical long-term and multi-site survey in Western Europe, Biogeosciences, 6, 157–170, https://doi.org/10.5194/bg-6-157-2009, 2009. a, b
Bernstein, R., Byrne, R., Betzer, P., and Greco, A.: Morphologies and transformations of celestite in seawater: The role of acantharians in strontium and barium geochemistry, Geochim. Cosmochim. Ac., 56, 3273–3279, https://doi.org/10.1016/0016-7037(92)90304-2, 1992. a
Boyce, D., Lewis, M., and Worm, B.: Global phytoplankton decline over the past century, Nature, 466, 591–596, https://doi.org/10.1038/nature09268, 2010. a
Chassot, E., Bonhommeau, S., Dulvy, N., Mélin, F., Watson, R., Gascuel, D., and Le Pape, O.: Global marine primary production constrains fisheries catches, Ecol. Lett., 13, 495–505, https://doi.org/10.1111/j.1461-0248.2010.01443.x, 2010. a
Chauvaud, L., Thouzeau, G., and Paulet, Y.M.: Effects of environmental factors on the daily growth rate of Pecten maximus juveniles in the Bay of Brest (France), J. Exp. Mar. Biol. Ecol., 227, 83–111, https://doi.org/10.1016/S0022-0981(97)00263-3, 1998. a, b, c
Daranas, A., Norte, M., and Fernández, J.: Toxic marine microalgae, Toxicon (Oxford), 39, 1101–1132, https://doi.org/10.1016/S0041-0101(00)00255-5, 2001. a
Dehairs, F., Chesselet, R., and Jedwab, J.: Discrete suspended particles of barite and the barium cycle in the open ocean, Earth Planet. Sc. Lett., 49, 528–550, https://doi.org/10.1016/0012-821X(80)90094-1, 1980. a
Del Amo, Y., Le Pape, O., Tréguer, P., Quéguiner, B., Ménesguen, A., and Aminot, A.: Impacts of high-nitrate freshwater inputs on macrotidal ecosystems. I. Seasonal evolution of nutrient limitation for the diatom-dominated phytoplankton of the Bay of Brest (France), Mar. Ecol. Prog. Ser., 161, 213–224, https://doi.org/10.3354/meps161213, 1997. a, b
Doré, J., Chaillou, G., Poitevin, P., Lazure, P., Poirier, A., Chauvaud, L., Archambault, P., and Thébault, J.: Assessment of in Arctica islandica shells as a proxy for phytoplankton dynamics in the Northwestern Atlantic Ocean, Estuar. Coast. Shelf Sci., 237, 106628, https://doi.org/10.1016/j.ecss.2020.106628, 2020. a
Edler, L. and Elbrächter, M.: The Utermöhl method for quantitative phytoplankton analysis, Microscopic and molecular methods for quantitative phytoplankton analysis, 110, 13–20, 2010. a
Field, C., Behrenfeld, M., Randerson, J., and Falkowski, P.: Primary production of the biosphere: integrating terrestrial and oceanic components, Science, 281, 237–240, https://doi.org/10.1126/science.281.5374.237, 1998 a
Fisher, N., Guillard, R., and Bankston, D.: The accumulation of barium by marine phytoplankton grown in culture, J. Mar. Res., 49, 339–354, https://doi.org/10.1357/002224091784995882, 1991. a
Fröhlich, L., Siebert, V., Huang, Q., Thébault, J., Jochum, K., and Schöne, B. R.: Deciphering the potential of , Mo/Ca and Li/Ca profiles in the bivalve shell Pecten maximus as proxies for the reconstruction of phytoplankton dynamics, Ecol. Indic., 141, 109121, https://doi.org/10.1016/j.ecolind.2022.109121, 2022a. a, b, c
Fröhlich, L., Siebert, V., Walliser, E., Thébault, J., Jochum, K. P., Chauvaud, L., and Schöne, B. R.: profiles in shells of Pecten maximus – A proxy for specific primary producers rather than bulk phytoplankton, Chem. Geol., 593, 120743, https://doi.org/10.1016/j.chemgeo.2022.120743, 2022b. a, b, c, d, e
Langer, G., Nehrke, G., Thoms, S., and Stoll, H.: Barium partitioning in coccoliths of Emiliania huxleyi, Geochim. Cosmochim. Ac., 73, 2899–2906, https://doi.org/10.1016/j.gca.2009.02.025, 2009. a
Legrand, C., Rengefors, K., Fistarol, G., and Graneli, E.: Allelopathy in phytoplankton-biochemical, ecological and evolutionary aspects, Phycologia, 42, 406–419, https://doi.org/10.2216/i0031-8884-42-4-406.1, 2003. a
Lorenzen, C.: A method for the continuous measurement of in vivo chlorophyll concentration, Deep-Sea Res., 13, 223–227, https://doi.org/10.1016/0011-7471(66)91102-8, 1966. a
Lorrain, A., Paulet, Y., Chauvaud, L., Savoye, N., Nézan, E., and Guérin, L.: Growth anomalies in Pecten maximus from coastal waters (Bay of Brest, France): relationship with diatom blooms, J. Mar. Biolog. Assoc. U.K., 80, 667–673, https://doi.org/10.1017/S0025315400002496, 2000. a
Michaels, A.: Acantharian abundance and symbiont productivity at the VERTEX seasonal station, J. Plankton Res., 13, 399–418, https://doi.org/10.1093/plankt/13.2.399, 1991. a
Moore, R., Webb, M., Tokarczyk, R., and Wever, R.: Bromoperoxidase and iodoperoxidase enzymes and production of halogenated methanes in marine diatom cultures, J. Geophys. Res.-Oceans, 101, 20899–20908, https://doi.org/10.1029/96JC01248, 1996. a
Passow, U.: Transparent exopolymer particles (TEP) in aquatic environments, Prog. Oceanogr., 55, 287–333, https://doi.org/10.1016/S0079-6611(02)00138-6, 2002a. a
Picheral, M., Catalano, C., Brousseau, D., Claustre, H., Coppola, L., Leymarie, E., Coindat, J., Dias, F., Fevre, S., Guidi, L., Irisson, J.O., Legendre, L., Lombard, F., Mortier, L., Penkerch, C., Rogge, A., Schmechtig, C., Thibault, S., Tixier., T., Waite., A., Stemmann, L.: The Underwater Vision Profiler 6: an imaging sensor of particle size spectra and plankton, for autonomous and cabled platforms, Limnol. Oceanogr.-Methods, 20, 115–129, https://doi.org/10.1002/lom3.10475, 2021. a
Ragueneau, O. and Tréguer, P.: Determination of biogenic silica in coastal waters: applicability and limits of the alkaline digestion method, Mar. Chem., 45, 43–51, https://doi.org/10.1016/0304-4203(94)90090-6, 1994. a
Savoye, N.: Origine et transfert de matière organique particulaire dans les écosystèmes littoraux macrotidaux (PhD), Université de Bretagne Occidentale, France, 324 pp., 2001. a
Siebert, V., Moriceau, B., Fröhlich, L., Schöne, B. R., Amice, E., Beker, B., Bihannic, K., Bihannic, I., Delebecq, G., Devesa, J., Gallinari, M., Germain, Y., Grossteffan, É., Jochum, K. P., Lebec, T., Le Goff, M., Leynaert, A., Liorzou, C., Marec, C., Picheral, M., Rimmelin-Maury, P., Rouget, M. L., Waeles, M., and Thébault, J.: HIPPO environmental monitoring: Impact of phytoplankton dynamics on water column chemistry and the sclerochronology of the king scallop (Pecten maximus) as a biogenic archive for past primary production reconstructions, SEANOE [data set], https://doi.org/10.17882/92043, 2023. a, b
Smayda, T.: A quantitative analysis of the phytoplankton of the Gulf of Panama II. On the relationship between C14 assimilation and the diatom standing crop, Inter-American Tropical Tuna Commission Bulletin, 9, 465–531, 1965. a
Stecher, H., Krantz, D., Lord, C., Luther, G., and Bock, K.: Profiles of strontium and barium in Mercenaria mercenaria and Spisula solidissima shells, Geochim. Cosmochim. Ac., 60, 3445–3456, https://doi.org/10.1016/0016-7037(96)00179-2, 1996. a
Sternberg, E., Tang, D., Ho, T., Jeandel, C., and Morel, F.: Barium uptake and adsorption in diatoms, Geochim. Cosmochim. Ac., 69, 2745–2752, https://doi.org/10.1016/j.gca.2004.11.026, 2005. a
Thébault, J. and Chauvaud, L.: Li/Ca enrichments in great scallop shells (Pecten maximus) and their relationship with phytoplankton blooms, Palaeogeogr. Palaeoclimatol., 373, 108–122, https://doi.org/10.1016/j.palaeo.2011.12.014, 2013. a
Thébault, J., Chauvaud, L., L'Helguen, S., Clavier, J., Barats, A., Jacquet, S., Pécheyran, C., and Amouroux, D.: Barium and molybdenum records in bivalve shells: Geochemical proxies for phytoplankton dynamics in coastal environments?, Limnol. Oceanogr., 54, 1002–1014, https://doi.org/10.4319/lo.2009.54.3.1002, 2009. a
Thébault, J., Jolivet, A., Waeles, M., Tabouret, H., Sabarot, S., Pécheyran, C., Leynaert, A., Jochum, K., Schöne, B., Fröhlich, L., Siebert, V., Amice, E., and Chauvaud, L.: Scallop shells as geochemical archives of phytoplankton-related ecological processes in a temperate coastal ecosystem, Limnol. Oceanogr., 67, 187–202, https://doi.org/10.1002/lno.11985, 2022. a, b
Whitfield, M.: Interactions between phytoplankton and trace metals in the ocean: Adv. Mar. Biol., 41, 3–128, https://doi.org/10.1016/S0065-2881(01)41002-9, 2001. a