the Creative Commons Attribution 4.0 License.
the Creative Commons Attribution 4.0 License.
 | 26 Jul 2023
Decadal growth in emission load of major air pollutants in Delhi
Saroj Kumar Sahu
Poonam Mangaraj
Gufran Beig
The Indian capital megacity of Delhi is reeling under deteriorating air quality, and control measures are not yielding any significant changes, mainly due to a poor understanding of sources of emissions; hence, priority option in mitigation planning is lacking. In this paper, we have made an attempt to develop a spatially resolved technological high-resolution gridded () emission inventory for eight major pollutants of the Delhi region where high-resolution activity data of all possible major and unattended minor sources are generated by organizing a mega-campaign involving hundreds of volunteers. It is for the first time that we are able to estimate the decadal growth in emissions of various pollutants by comparing newly developed 2020 emissions with SAFAR (System of Air Quality and Weather Forecasting and Research) emissions of 2010 using the identical methodology and quantum of activity data. The estimated annual emissions for PM2.5, PM10, CO, NOx, VOC, SO2, BC, and OC over the Delhi National Capital Region (NCR) are estimated to be 123.8, 243.6, 799.0, 488.9, 730.0, 425.8, 33.6, and 20.3 Gg yr−1, respectively, for the year 2020. The decadal growth (2010–2020) in PM2.5 and PM10 is found to be marginal at 31 % and 3 %, respectively. The maximum growth is found to be in the transport sector followed by the industrial and other sectors. Maximum decadal growth found for the pollutants BC, OC, and NOx is 57 %, 34 %, and 91 %, respectively. The decadal shift of sectorial emissions with changing policies is examined. The complete dataset is available on Zenodo at https://doi.org/10.5281/zenodo.7715595 (Sahu et al., 2023).
- Article
(10218 KB) - Full-text XML
- BibTeX
- EndNote


Clean air is a basic need for a healthy life, but air pollution has emerged as a global emergency where cities are more vulnerable due to high population density. Asian megacities are even more polluted than before and have drawn global attention (IPCC, 2000; Molina and Molina, 2004; Permadi et al., 2018). Air quality in the Indian megacity Delhi makes headlines across the print and media with the onset of the winter months (Beig et al., 2021; India Today, 2022). Worldwide, air pollution is a widespread problem and a major contemporary public health threat. Air pollutants are treated like a modern-day curse due to their association with premature mortality, and disease burden has a significant impact on low-income developing countries, especially India. Air pollution emerged as the fourth leading risk factor contributing to disease burden and early death worldwide (HEI, 2019, 2020). The Global Burden of Disease (GBD) reported that ∼4.9 million premature deaths across the globe occur because of air pollution (Stanaway et al., 2018; Manisalidis et al., 2020). People from any geographical region could suffer from its adverse impacts irrespective of the place of origin (Akimoto, 2003). Certainly, Indian urban areas have emerged as one of the places most adversely affected by pollution, as well as by global health risks (Down to Earth, 2015; GBD, 2018). A total of 22 cities of the world's 30 most polluted cities are in India, from which Delhi, the capital of India, has topped the ranking for consecutive years, with its annual particulate matter (PM2.5) level being nearly 10 times the WHO's permissible limits and with the city being intricately caught in the toxic web of air quality and health-based standards (UNEP, 2019; World Air Quality Report, 2019, 2020). This led to alarming levels of air quality index (AQI) in the national capital megacity Delhi; these levels have brought about first-ever large-scale media and political attention in recent years. No doubt the megacities have emerged as a better place to live, but at the same time, they are prone to degrading air quality due to an elevated concentration of particulate matter (PM) (Molina et al., 2004; Beig et al., 2020; Sahu et al., 2011, 2021). Combating megacity air pollution has become the utmost challenge due to a poor understanding of the complexity of air pollution sources and its dynamic mixture of both natural and anthropogenic sources.
Numerous studies have constantly manifested higher rates of respiratory and cardiovascular diseases in megacities due to alarming pollution levels, whereby the school-going students and older generation are the most largely affected (Sahu et al., 2011, Mangaraj et al., 2022a, b). Delhi's worse air quality during winter months is also linked with stubble burning in Punjab and Haryana (Beig et al., 2019, 2020). The government introduced odd–even vehicle plying on roads to reduce the impact of emission loads (Transport Department, Govt. of Delhi, 2019). However, the impact was not significant. The blame game keeps on running from one agency or state to another, where each one has its independent opinion on how to combat the rising level of pollutants in Delhi. Despite many initiatives from stakeholders, Delhi air has shown no sign of improvement and has drawn the attention of global researchers. Understanding the complexity of pollution sources and their magnitude in a megacity is essential for air quality studies, as well as for regional atmospheric chemistry and climate points of view (Li et al., 2017). However, identification of the unattended sources and their precise quantification becomes challenging due to the diversity of contributing major and minor sources along with the complexity of the technology being used during combustion activities. The problem becomes even more complex due to the heterogeneity of pollution sources and their temporal variation. A comprehensive high-resolution emission inventory (EI) may solve this because EIs are critical research and regulatory tools used to address the air pollution issues in many cities. Moreover, the surface emission is the most sensitive input data for chemical transport models in terms of understanding the impact of emissions on atmospheric chemistry on different scales, from urban to regional and from national to global (Sahu et al., 2011; Mangaraj et al., 2022a, b).
There is a limited amount of comprehensive and detailed studies that focus on Delhi emission estimation, but each study has some or other limitation. So far, many attempts, like those of NEERI (National Environmental Engineering Research Institute) (2010), Guttikunda and Calori (2013), and TERI (The Energy and Resources Institute) and ARAI (The Automotive Research Association of India) (2018), have failed to get a concrete alternative to get rid of this air quality issue. In order to frame appropriate mitigation strategies to curb air pollution load in the megacity Delhi, we have identified the new emerging sources and have estimated the pollutant load from all possible major and minor sectors responsible for the emission of various pollutants directly or indirectly. Unlike the previous studies, the present study is unique in that it targets 17 organized and unorganized sectors that are responsible directly or indirectly for changing air quality in Delhi National Capital Regions (NCRs). The present findings provide a comprehensive assessment of sources of air pollutants and their magnitude, which have shifted with changing policies in the last decade. One of the main objectives behind developing this reliable high-resolution () gridded emission inventory of eight major pollutants over a domain of 70 km×65 km covering Delhi and its adjacent NCR region for the base year 2020 (i.e., April 2019 to March 2020) is not only to frame the desired mitigation strategy to combat air pollutant issues but also to understand the decadal growth of emissions over the same region under the flagship of the SAFAR (System of Air Quality and Weather Forecasting and Research) program of the Ministry of Earth Sciences (MoES). It will also be an integral input to air-quality-forecasting-based modeling studies aimed at understanding the regional atmospheric chemistry.
Sources of emissions, activity data, and emission factors
The megacity Delhi (Fig. 1), the capital of India, which is designated as the National Capital Territory region (NCT), is located towards the northern part of the country, straddling the Yamuna River. This megacity is stretched over an area of 1484 km2 and shares borders with Uttar Pradesh in the east and Haryana in the other directions. It is situated at an elevation of ∼216 m above sea level at 28.7041∘ N, 77.1025∘ E. The NCT of Delhi is divided into nine districts. The estimated population of the megacity Delhi is 28.5 million, making it the largest metropolitan area in India. The overgrown population density of Delhi has led to the expansion of the city and an increase in the use of energy and fossil fuels associated with alarming levels of air pollution and health risks.
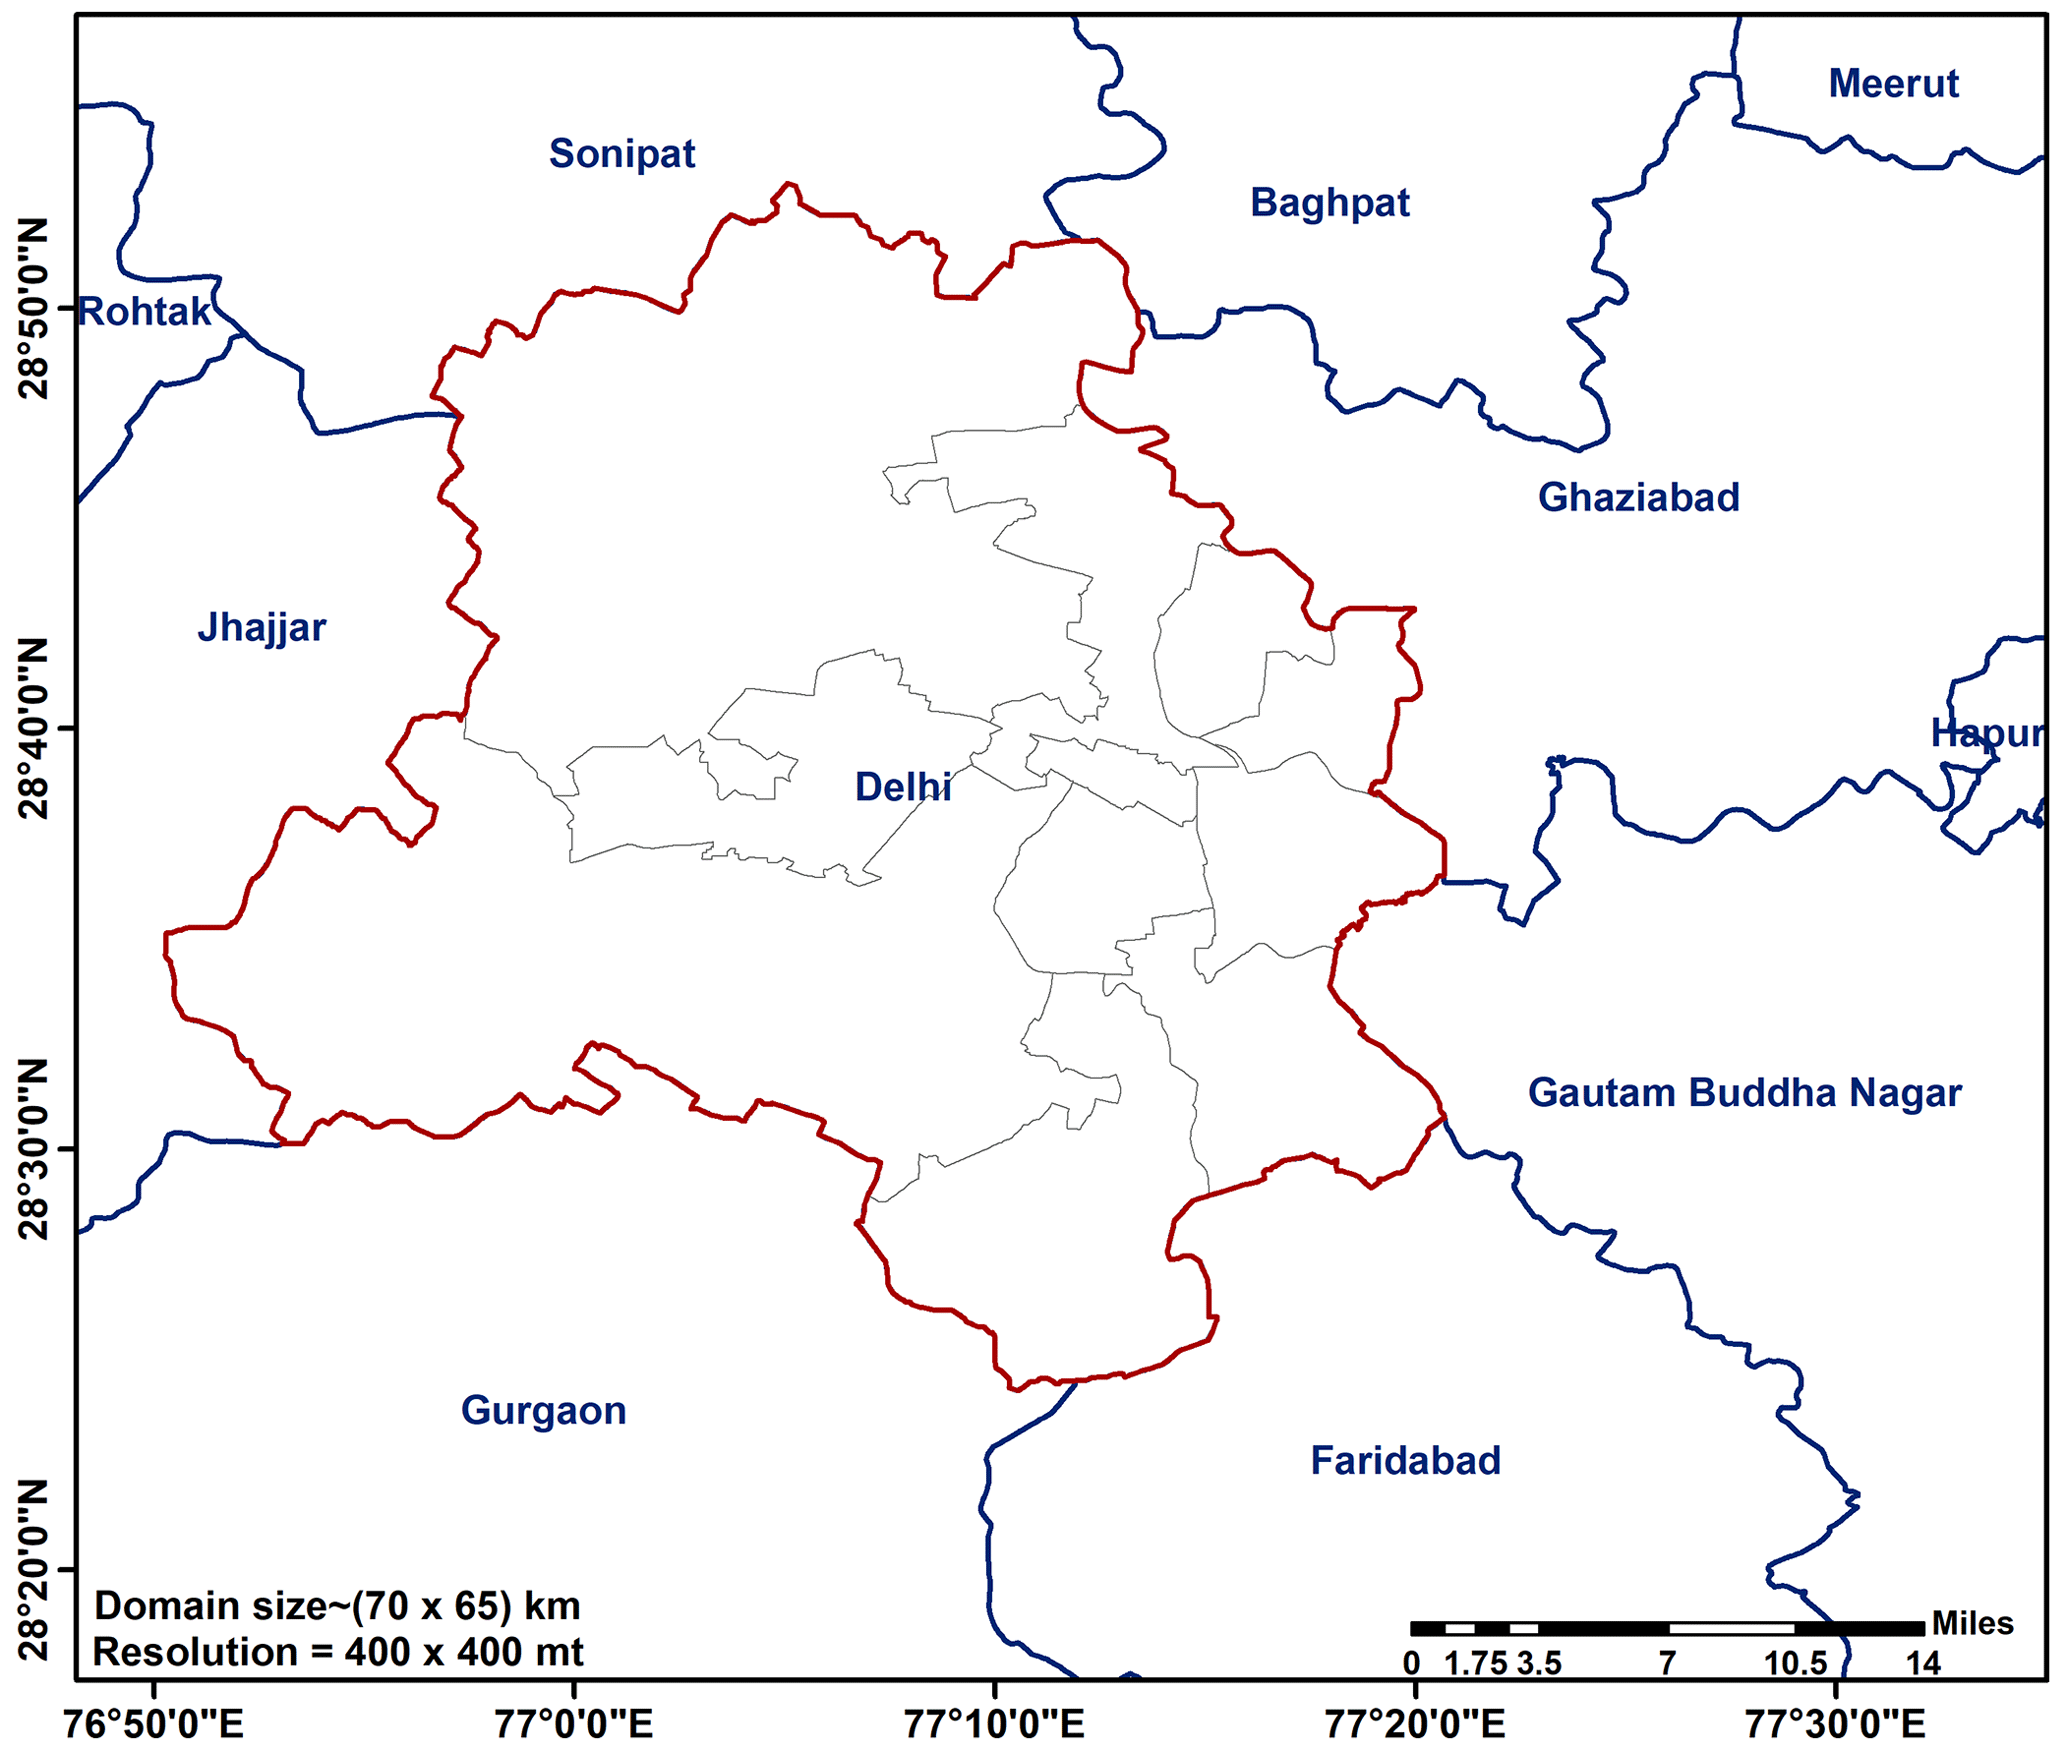
Figure 1Domain of interest.
In order to meet the objective of developing an authentic emission inventory, the collection of primary activity data is of great significance. In the present attempt, for the first time, 17 minor and major sectors responsible for the direct or indirect emission of pollutants have been taken into account in the emission estimation process. To understand the emission practices, the primary-activity data were generated through a 3-month-long extensive emission campaign (SAFAR-Delhi, 2018) carried out over Delhi and the surrounding NCRs in 2018 (Fig. 2). This initiative was undertaken by the Indian Institute of Tropical Meteorology (IITM, Pune) in collaboration with the School of Planning and Architecture (SPA-Delhi) and Utkal University under the Ministry of Earth Sciences (MoES)'s project SAFAR. In order to serve the purpose of understanding the complex source of pollutants, primary-activity data play a great role in building a high-resolution gridded emission inventory, which has to be generated through a comprehensive field campaign only. This is a unique attempt to collect micro-level primary-activity data like the type of fuel used; the quantity of fuel being used in various technologies in various sectors like slums, residential cooking, the brick industry, construction sites, street vending, and large hotels; vehicle loads around tourist sites, railway stations, shopping malls, large hospitals, large schools or colleges, traffic junctions, and airports; biomass and/or crop residue burning; crematorium-related burning; the use of cow dung as an alternative fuel for cooking; road dust; construction-related activities; open waste burning; the use of diesel generators for commercial purposes; and the activity of mobile towers. Apart from traditionally dominating sectors like transport, windblown road dust, industry, thermal power plants, and the residential sector, there are several unattended minor sectors, which collectively make a relatively significant contribution to air pollution issues in Delhi. Apart from this, the most important objective is to check the authenticity and accuracy of the existing secondary data collected from various government agencies and reports, as well as to fill the data gap. For the same purpose, ∼150 students from various universities and colleges put an extensive amount of time, equating to ∼40 000 h, and painstaking effort towards compiling a comprehensive and robust activity database under the supervision of a group of scientists and experts. This will help to better understand not only all the possible major and minor sources, but also the prevailing changing trend in the megacity Delhi and its surrounding regions. The generated data will play an instrumental role in understanding the changing trend of the source of pollutants in the last decade.
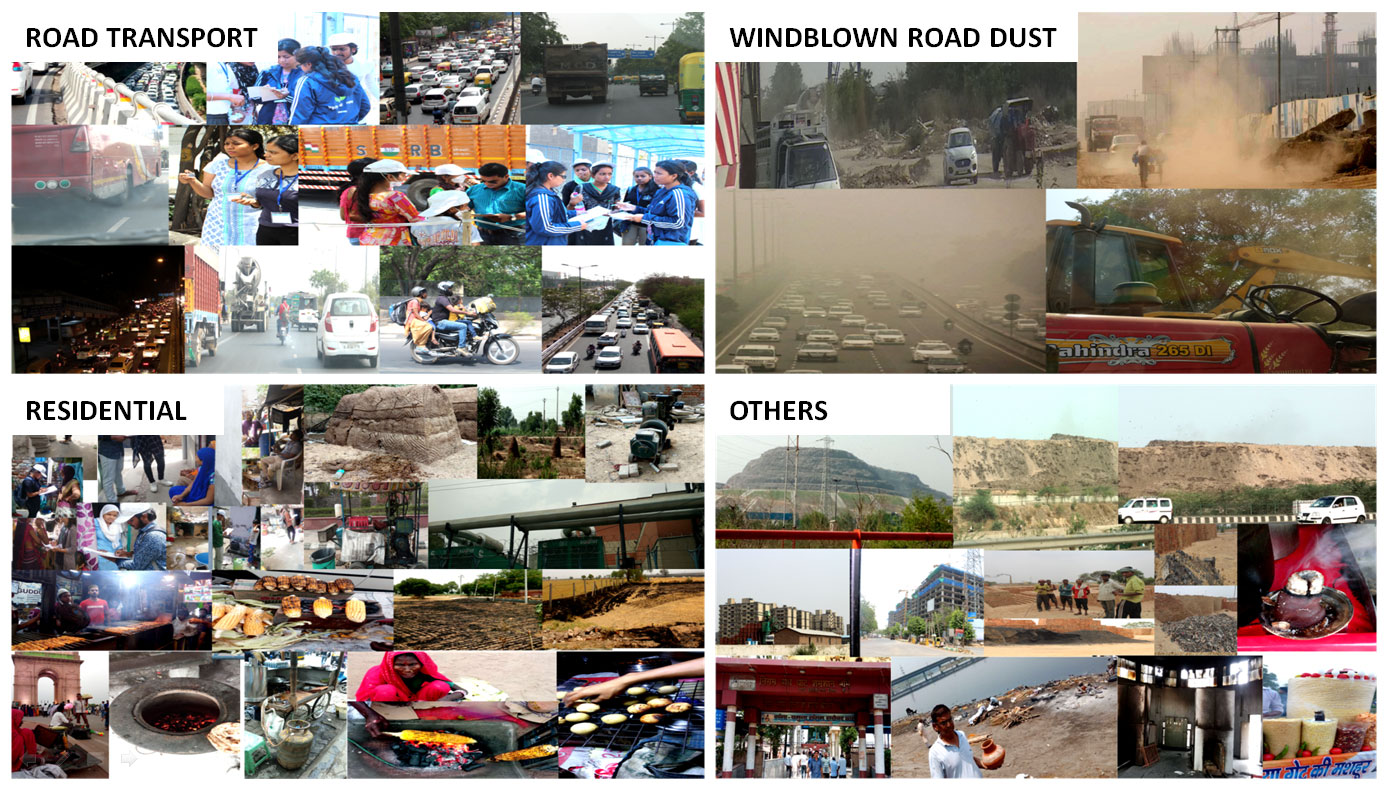
We have compiled all 17 sources into the following five major sectors: (a) transport, (b) windblown road dust, (c) industry, (d) residential (including the following sub-sectors: households, slums, street vendors, crop residue burning, cow dung, and diesel generators), and (e) others (including the following sub-sectors: municipal solid-waste burning; construction; incense sticks, mosquito coils, and cigarettes; and crematoriums).
(a) Transport
Delhi has been witnessing a consistent increase in the number of motor vehicles in recent years. As of March 2020, it has been home to approximately 13.3 million registered vehicles (MoRTH, 2020), a number which has grown 2-fold and 4-fold in last 1 and 2 decades, respectively (Sahu et al., 2011; SAFAR-Delhi, 2010). In the transport sector, vehicles have been classified broadly into the following eight categories: two wheelers (2Ws), three wheelers (3Ws), buses, personal cars, commercial cars, light commercial vehicles (LCVs), heavy commercial vehicles (HCVs), and miscellaneous vehicles (MSLVs). Overall, the relative contribution by 2Ws was highest at ∼56 %, followed by personal cars at ∼23 %, commercial cars at ∼17 %, 3Ws and buses at ∼3 %, and the rest of the vehicle categories at the remaining 2 %. In 1998, the Supreme Court of India sanctioned a rule for all the transport systems of Delhi to be run by compressed natural gas (CNG) in order to deal with the increase in vehicular emissions. Delhi, as of now, has ∼1 million vehicles running on CNG, constituted by ∼26 % CNG 3Ws, 67 % CNG cars, and 7 % CNG buses. The government has been concerned about the air pollution crisis in Delhi for a long time, and therefore Bharat Stage-IV (BS-IV) emission norms were implemented in Delhi in 2010 before any were implemented throughout the rest of the nation in 2017. BS-IV has been implemented in Delhi since 2018 but was proposed for implementation in other cities by April 2020. The National Automobile Scrapping policy was introduced in India on 13 August 2021 to reduce India's vehicular air pollution, with effect from 25 September 2021 (MoRTH, 2021). Lately, the transport department of Delhi passed an order for diesel vehicles more than 10 years old to be deregistered automatically from January 2022. At the same time, the calculation tally found that a fraction of the fleet registered during 2000–2010 might still be active on the roads of Delhi in 2020 despite the phasing-out process. The present area of interest has a road network of ∼2450 km of major roads and ∼31 000 km of minor roads. The manual-vehicle counts were computed over 87 survey locations (Fig. 3a) in Delhi and its surrounding NCR regions to identify the density of vehicles (Fig. 3b), and composition according to vehicle age was also estimated (Fig. 3c).
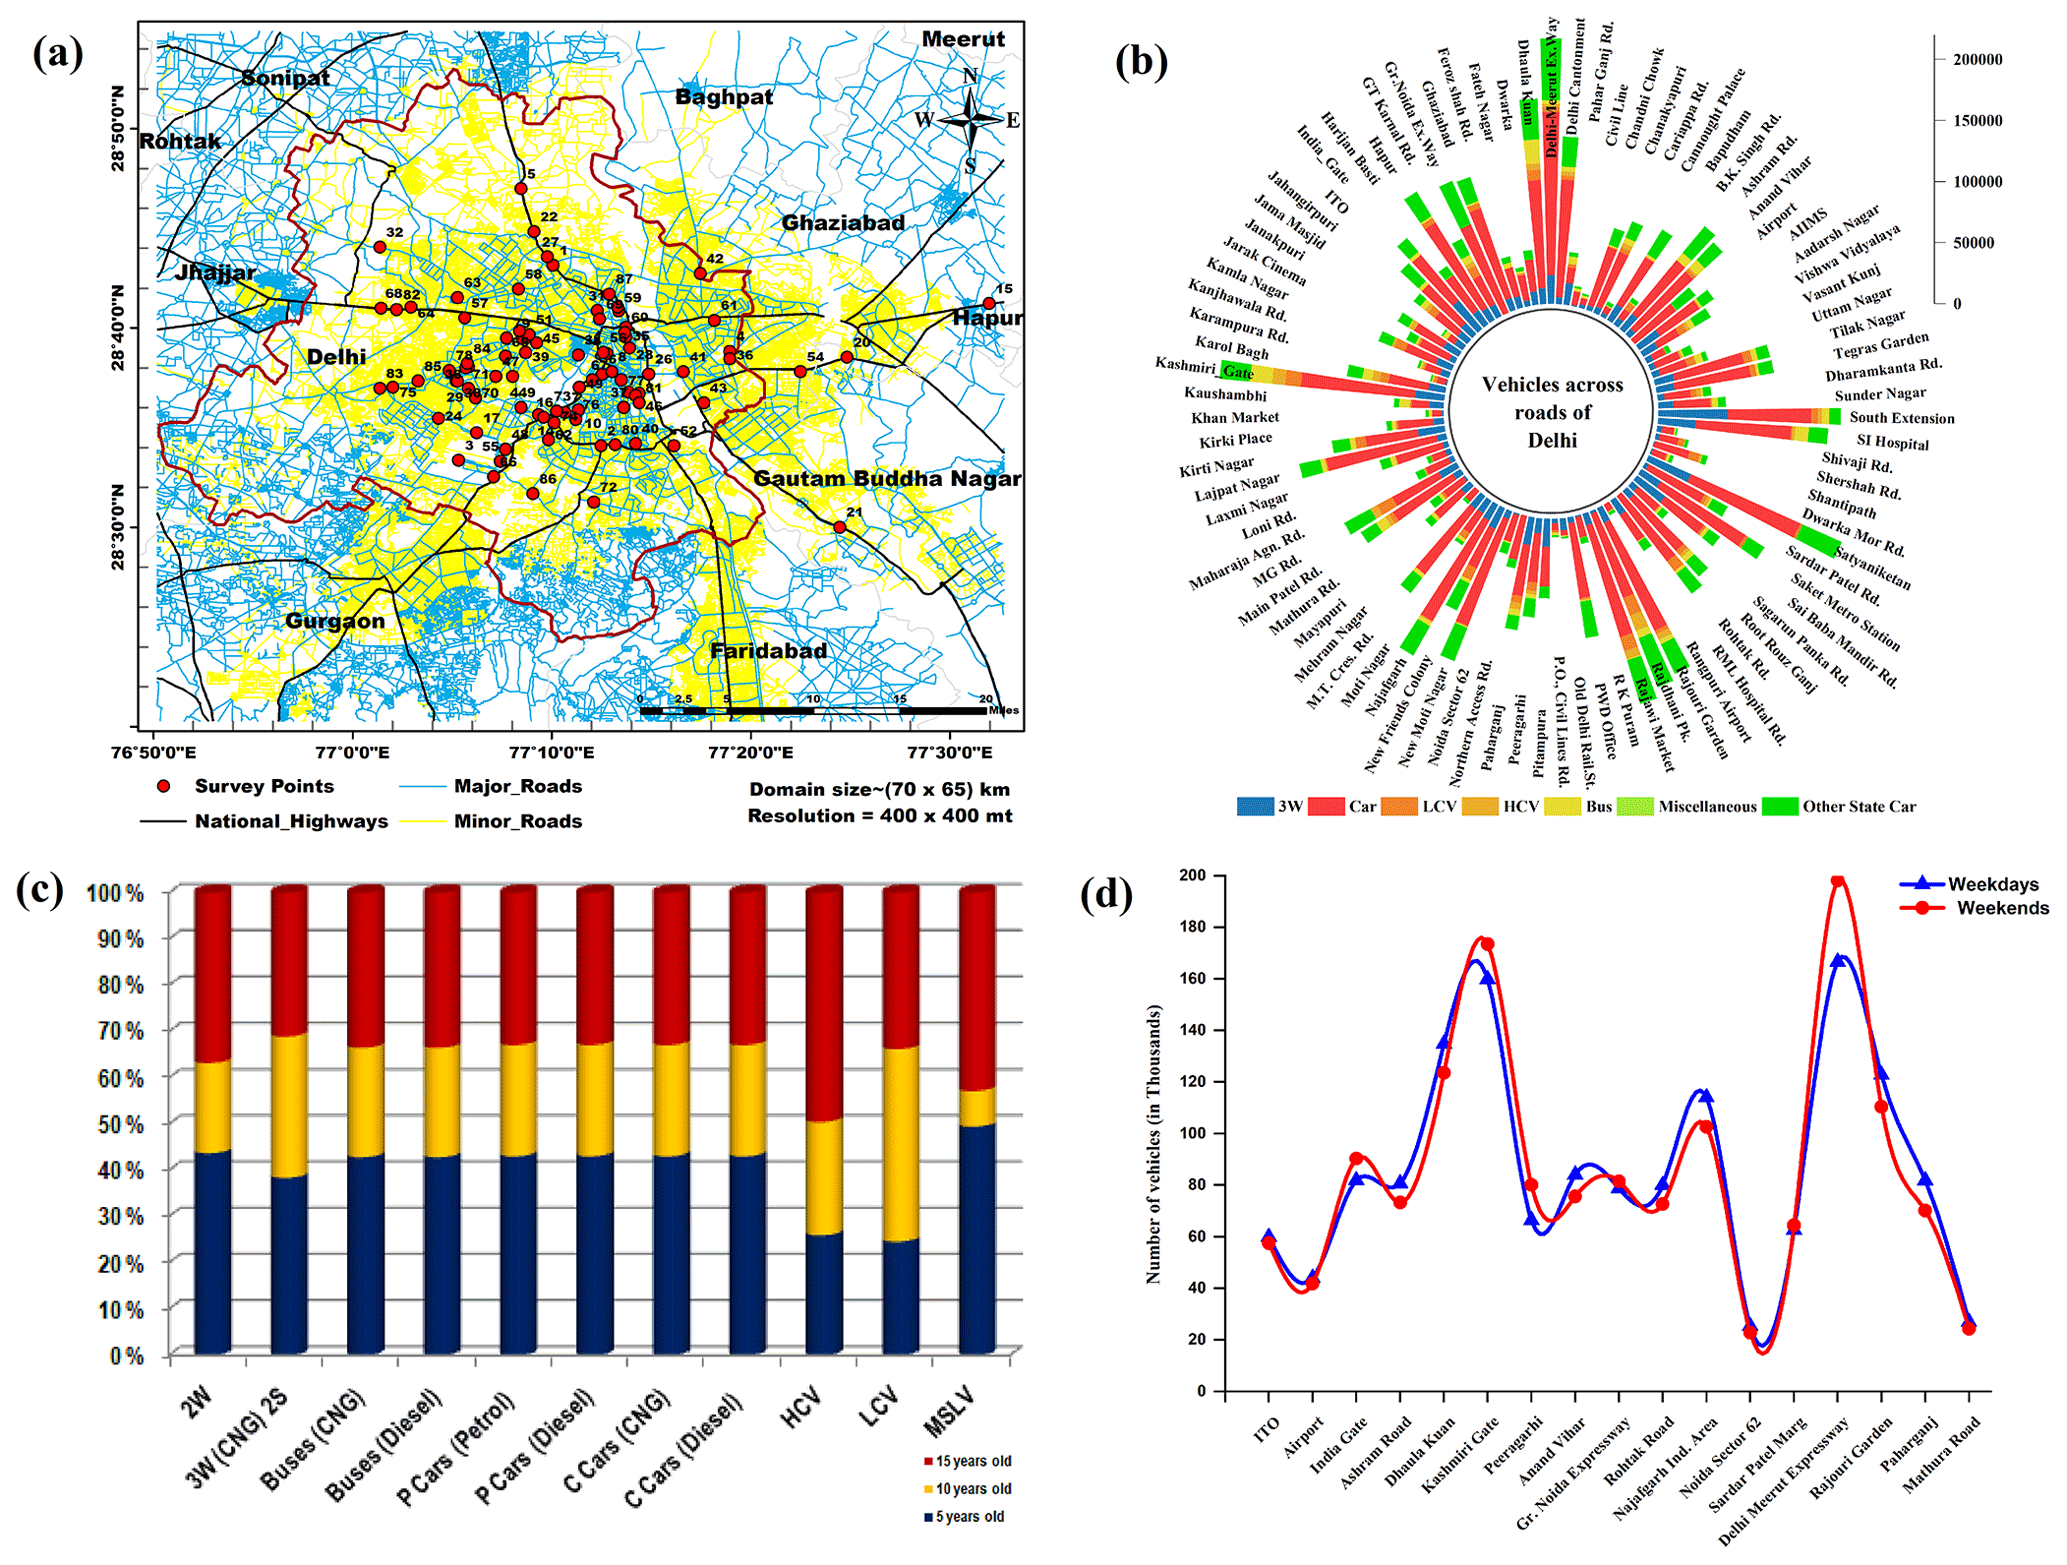
Figure 3(a) Survey locations for primary-activity data for transport sector in the Delhi NCR; (b) category-wise vehicle density on various roads across the Delhi NCR; (c) age-wise vehicle category; (d) comparison of vehicle density on weekdays and weekends on major roads of Delhi.
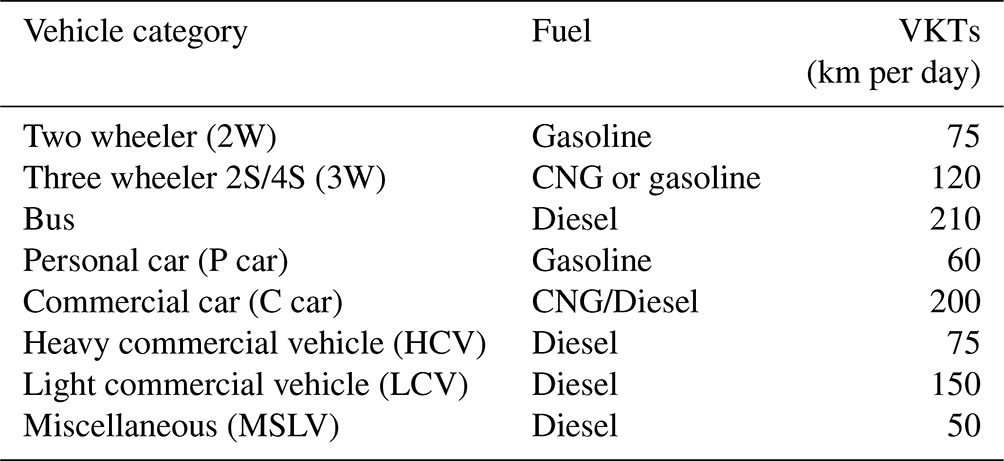
The enumerating task was carried out for both weekdays and weekends with the help of digital click counters. The counting task was carried out continuously for around 14–16 h d−1. Vehicle density was recorded to be as high as around 110 000–160 000 during weekdays on many major roads, as shown in Fig. 3d. However, it was observed that vehicle number increased over weekends on a couple of roads like India Gate Circle, Chandni Chowk, and Lajpat Nagar. High vehicular densities of more than 100 000 d−1 were observed on roads like Delhi Meerut Expressway, Dhaula Kuan, Peeragarhi, Ashram Road, and South Extension Airport Road. Delhi is surrounded by other populous states like Uttar Pradesh, Haryana, and Punjab, which are directly or indirectly linked with various activities across the Delhi NCR region. Therefore, the other-state cars contribute as much as nearly 40 % on the majority of well-known busy roads in Delhi. An approximate amount of 2600 samples was collected for the random survey with several real-time diverse data like fuel consumption pattern, hours of usage, vehicle density, vehicle kilometers traveled (VKTs) per day, and type of fuel used. The real-time VKTs generated during random survey are depicted in Table 1.
Table 1Vehicle-category-specific VKTs collected during field survey.
(b) Windblown
Delhi has a huge and dense road network, but certainly not all the roads are maintained. The road condition of Delhi was observed keenly. The roads joining towards the outskirts of the city were found to be worn out and lead to huge dust load. At the same time, a random survey on different roads was undertaken in order to assess the driving cycle or pattern of different vehicle categories. The other-state car contributes as much as nearly 40 %–50 % on the majority of well-known busy roads in Delhi. Due to the rise in the number of vehicles, the average speed of vehicles is found to be decreasing (i.e., 18–25 km h−1 on most of the major roads and 35–55 km h−1 on airport roads and a few more important roads). The average weight–age of vehicles in Delhi was determined based on vehicle category and its composition, which was estimated to be 1.23 t. The number of precipitation days in Delhi is hardly 50 d, with an annual rainfall of just 547 mm (Rainfall Statistics of India, 2019); therefore, the soil moisture content over the study area was determined to be just 6 %. The paved-to-unpaved-road ratio was closely monitored, and ∼40 % of roads were found to be unpaved with broken road shoulders and poor infrastructure, and the rest (∼60 %) were considered to be paved. The silt load on these roads was estimated to be 10 % for paved roads and 12 % for unpaved roads, which was comparatively better than any other cities in India. The resuspension of dust load increases with increasing vehicle weight and speed. The average vehicle weight and mean vehicle speed derived from fleet composition running on the road were determined from field surveys across many roads along with the number of precipitation days and moisture content to arrive at the total dust load over the study area.
(c) Industry
In the case of industry, this is one of the most diverse sectors, with more than 3182 industries scattered over the Delhi NCR, where the largest fraction is very unorganized industry with no or limited fuel activity data followed by a small fraction of organized industry. The Central Pollution Control Board (CPCB) and the Delhi Pollution Control Committee (DPCC) have classified the polluting industries of Delhi into the following three categories: red (highly polluting), orange (moderately polluting), and green (non-polluting). The red-category industries are strictly banned within the Delhi city; however, orange-category industries are allowed to operate. There is no comprehensive database for all industries with their technological details. As per the primary survey, large numbers of unorganized small industries were found to be confined over the eastern, southeastern, and southwestern parts of the Delhi region. Central Delhi has, relatively speaking, a very low number of industries in comparison to other parts of the city. The spatial distribution of the diverse range of small, medium, and large industries is depicted in Fig. 4. Major industries include engineering industries with a frequency of 546, machine and tool industries with a frequency of 169, electrical industries with a frequency of 175, iron and steel industries with a frequency of 114, etc. Most of the detailed information on industrial areas, fuel consumption patterns, production capacity, etc. has been collected from the DPCC. The fuels used in these industries include low-sulfur heavy stock (LSHS), light diesel oil (LDO), high-speed diesel (HSD), liquid petroleum gas (LPG), natural gas (NG), and coal.
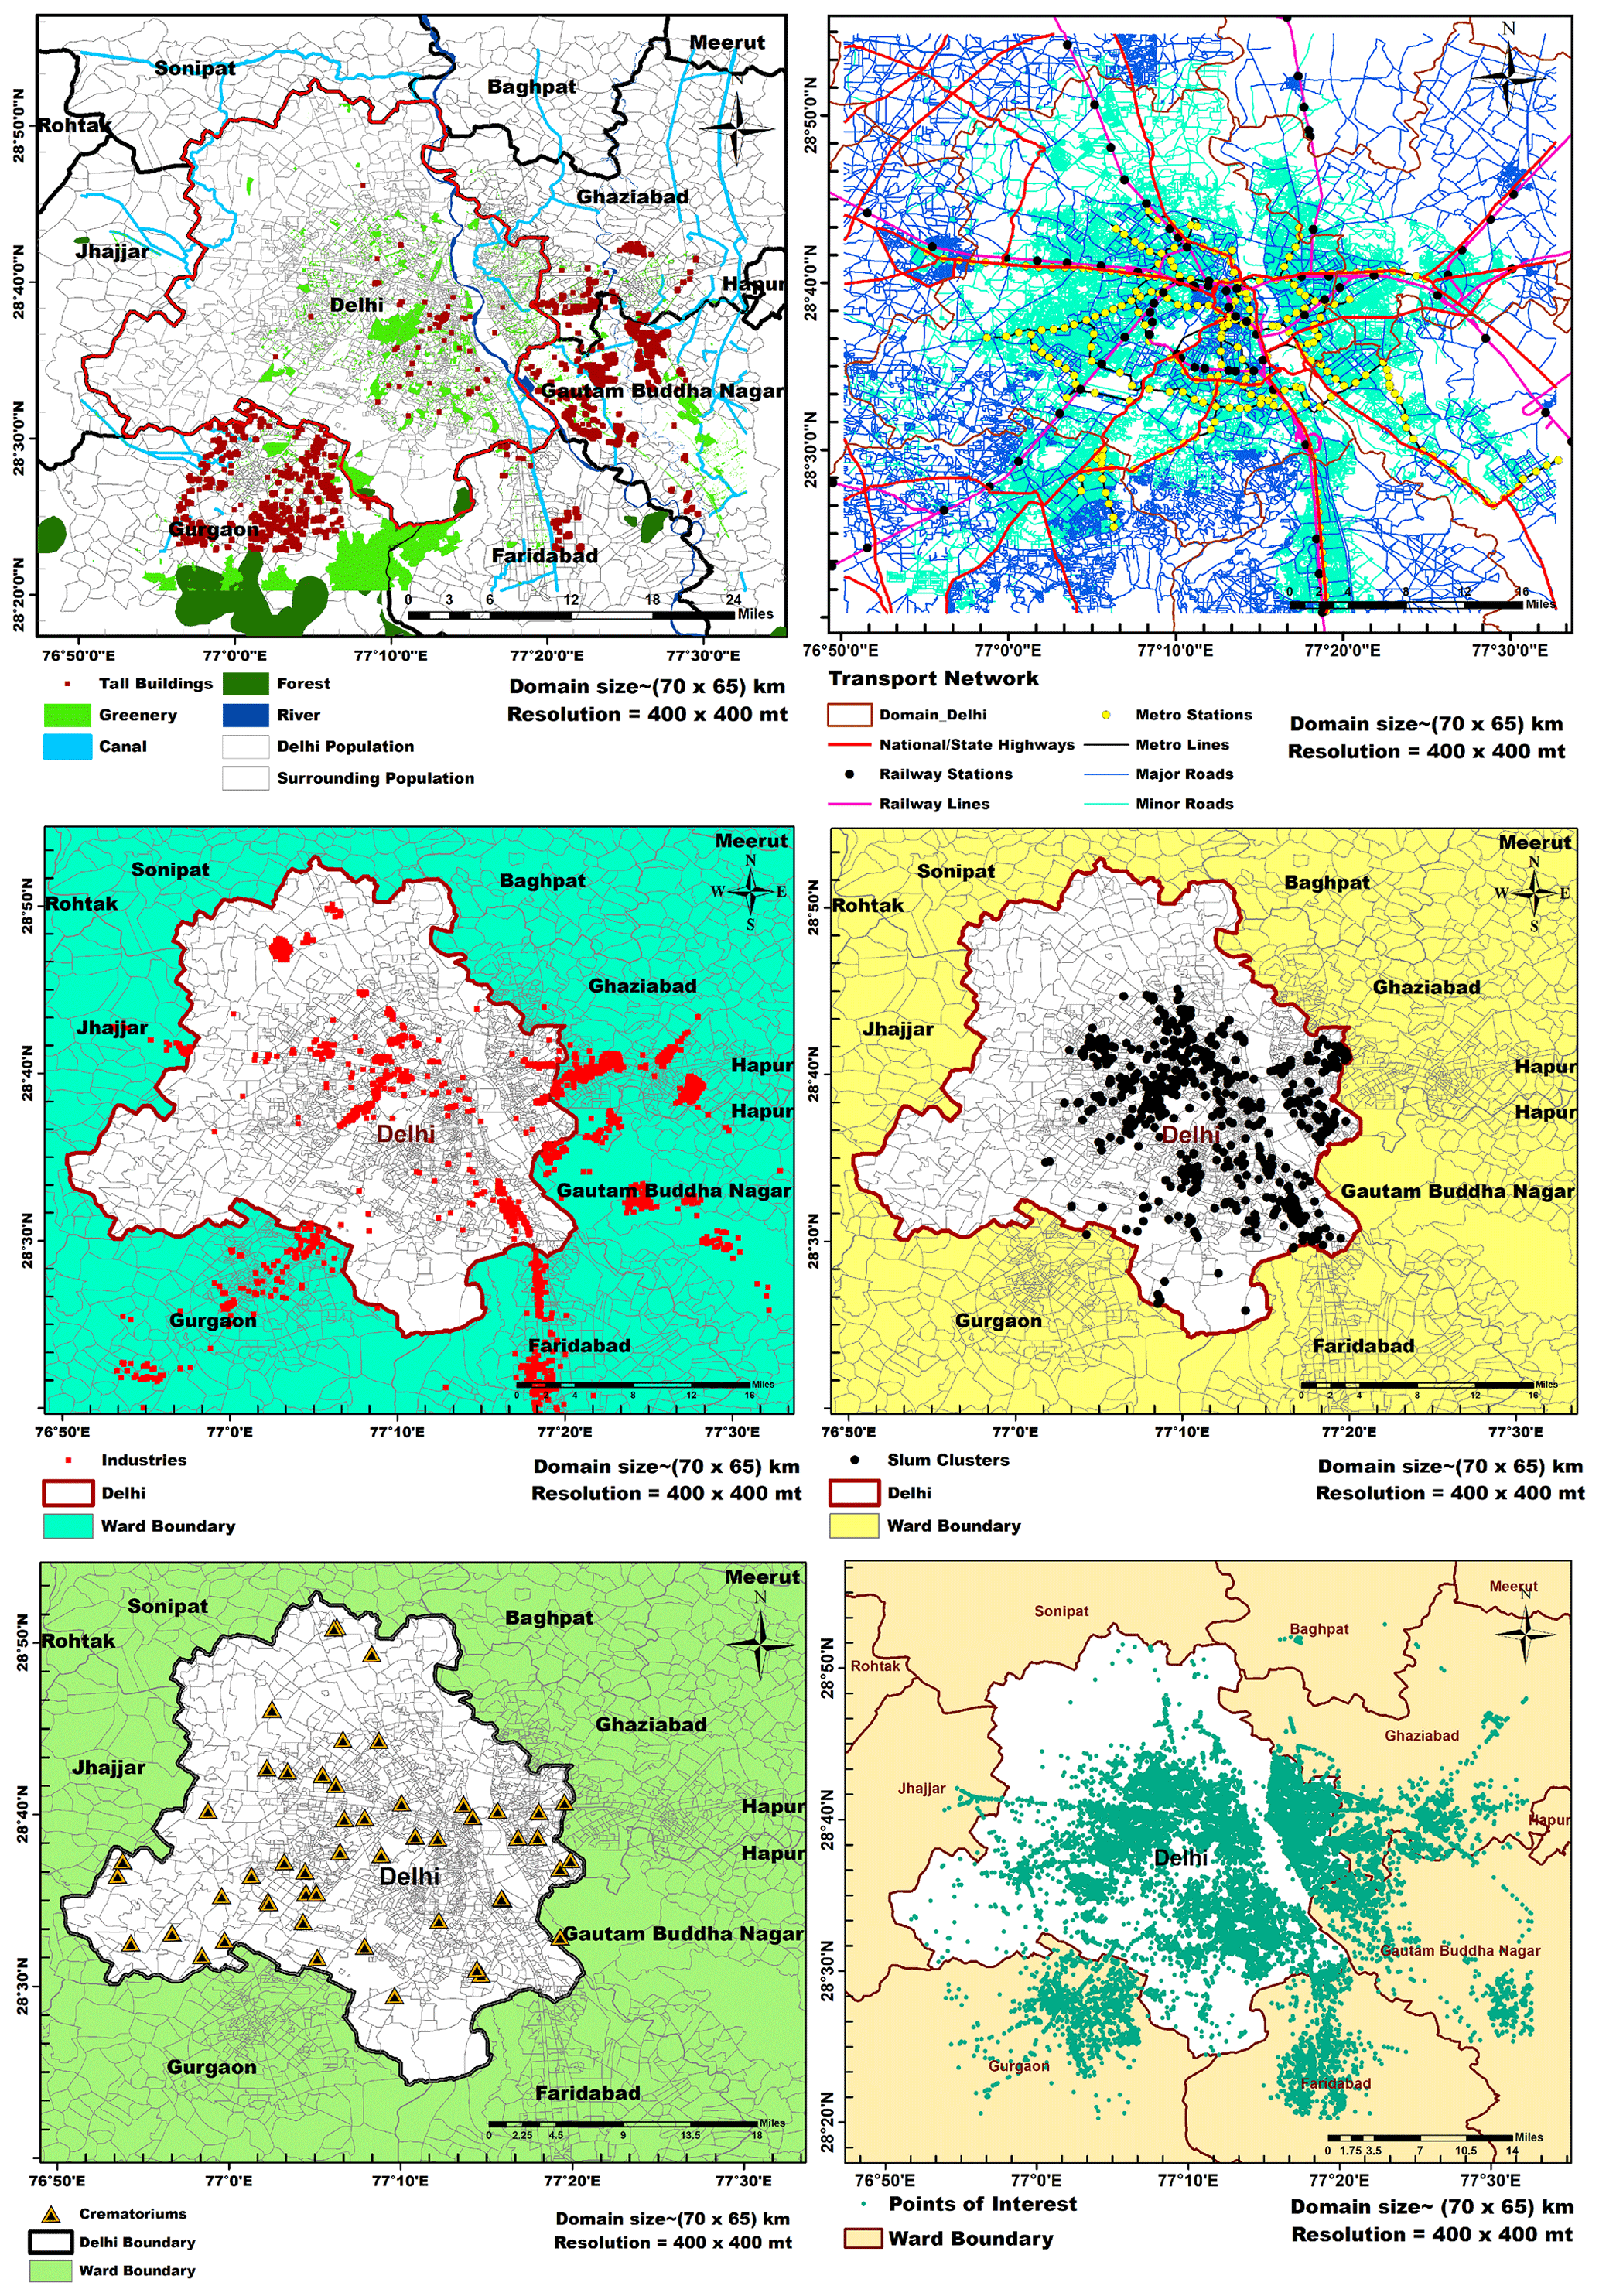
Figure 4Land use and land cover with spatial surrogates over the megacity Delhi and its NCRs.
(d) Residential
Delhi's estimated population was ∼22.7 million, which, within a decade, increased to a total population of ∼30.2 million (2020), and Delhi is known as the first most populous city of India and the second most populous city of the world. According to the Ministry of Housing and Urban Poverty Alleviation, Govt. of India, around 13 %–14 % of Delhi's population lives in slums. The Delhi Urban Shelter Improvement Board (2019) reported ∼675 clusters of slum in Delhi. The actual slum population data are very uncertain. During the field survey, nearly 187 locations were covered to collect over 3000 samples over slum clusters confined to the central, eastern, and southeastern parts of Delhi. The total population is estimated to be distributed over 4 million households, with an average household size of five. The cooking-fuel activity data collected confirm the changing trend in cooking fuel used in Delhi slums in last decade. Unlike traditional fuels like wood, dung, ad bio-fuel, LPG is being widely used as a main fuel, accounting for around 95 %, followed by wood at 3 % and coal at 2 %. In winter, the relative contribution of wood as fuel increases (for heating of water). This indicates that there is excellent penetration of government awareness and promotion of LPG connections in slum pockets. Apart from this, it came to be noticed that people residing in the outskirts of Delhi were using cow dung as fuel for heating and cooking purposes, especially during winters. The mixture of generated agricultural residue with cow dung and raw materials like biomass and coal dust is still being used for domestic cooking in the peripherals of Delhi and its adjoining districts. The mixture is dried and molded into circular shapes, with the curvature being staked to the walls and left for sunbathing, referred to as “uplah” in the local language. Later, they are piled up into mounds to be preserved for months and are used as an alternative for domestic fuels. As per the survey, a single household of five to six members uses approximately 30 kg of cow dung per month as a source of fuel for cooking and heating of water in winter.
With changing lifestyles and eating habits, vending in the megacity Delhi is made up of up to ∼500 000 street vendors, who are well scattered all across the city. Nearly 1653 samples of cooking-fuel activities were collected by interacting with people working in various hotels, restaurants, and street-vending positions to know the exact situation prevailing in Delhi NCR regions, where the coal and wood are combusted using traditional approaches and traditional stoves. A large proportion of these street vendors were certified under the regional municipal corporations and were situated at permanent vending zones; on the other hand, many of these vendors were found to be unauthorized ones who kept shifting from one place to another. During the field survey, it was observed that LPG is being predominantly used as a source of fuel by the street vendors (i.e., 83 %) followed by coal (15 %) and wood (2 %). Few street-vending zones were found to be predominantly using coal for tandoor-food-making activities, especially near tourist places like India Gate, Jam Masjid, and Lal Qila. Kerosene is found not to be in use as a primary source of fuel for cooking activities. However, crop residue burning is not prominent in the core urban region of Delhi, but the peri-urban areas towards the northeastern fringes hold less cultivated cropland. Hence, crop residue burning in the urban region is of little significance. The activity data with respect to cultivated area and amount are taken from government portals like ICAR (Indian Council of Agricultural Research), MoSPI (Ministry of Statistics and Programme Implementation), the Ministry of Agriculture and Farmers' Welfare, and the paid site of Indiastat. The approach used for estimating the total crop residue generated and the fraction burned is adopted from Sahu et al. (2021).
Due to load shedding, diesel generator (DG) sets as a source of power backup are increasingly frequent in commercial establishments and apartments. In most parts of Delhi, having 1–2 h of power failure is quiet common in summer. Besides that, DG sets are also used in base transceiver stations (BTSs). According to the Department of Telecommunication (DoT; 2019), Delhi has more than 26 000 telecom towers, which have ∼1 lakh BTSs that run with DG sets as a constant or substitute source of power. A common BTS is equipped with a 12–25 kWh DG set, which, on average, consumes ∼9000–12 000 L of diesel annually (Sahu et al., 2015). For estimating the number of diesel generator sets in commercial premises, the ratio of generator sets to population was taken, and the total number of commercial establishments in Delhi and their spatial locations were assembled from paid sources. The total emission from the DG sector was based on the number of diesel generator sets and power failure hours.
(e) Other
The Indira Gandhi International Airport is the primary international airport of India, spread over an area of 2066 ha and situated 9.9 mi (15.93 km) from the city center of New Delhi. It is the busiest airport in India and the sixth busiest airport in Asia in terms of passenger traffic. According to the bulletin of Indira Gandhi International Airport, in the calendar year of 2019–2020, it witnessed traffic of ∼67 million passengers and 450 012 aircraft movements. The landing–take-off (LTO) cycle, which happens below the altitude of ∼1000 m (3000 ft) basically, contributes to the air pollution. The activity data of aircraft movement and passenger traffic are collected from government reports of the Directorate General of Civil Aviation (DGCA) (2020) and the Ministry of Civil Aviation (2020).
According to the Delhi Pollution Control Committee, Delhi generates ∼11 144 t of municipal solid waste (MSW) per day on average, which is dumped over three uncontrolled and unlined landfill sites of Delhi i.e., Ghazipur, Bhalaswa, and Okhla dump yards (DPCC, 2020). Ghazipur landfill is the largest dump yard located towards the eastern perimeters of Delhi, covering an area of ∼28.32 ha; it receives around 2500–3500 metric tonnes of solid waste every day. Many print and news reports have also reported on the unexpected overflowing of waste at the Ghazipur landfill site. The Bhalsawa landfill is situated to the northwest of the megacity Delhi; it covers an area of ∼14.56 ha, where, every day, ∼2000–3000 t of waste is dumped. The dumping ground of Okhla is yet another landfill site with area an of ∼18.61 ha; it receives at least ∼1500–2000 t of dumped waste every day despite the site having been declared exhausted in 2010. The Okhla zones covered in waste collection include the southern and central zones, as well as Najafgarh and the Delhi Cantonment Board (DCB).
Delhi has three operational waste-to-energy (WTE) plants with a total waste intake capacity of ∼5250–5750 t per day (TPD) at three locations in Delhi, namely Ghazipur, Bawana, and Okhla. The waste-to-energy plant installed in Ghazipur has an installed capacity of 12 MW and processes ∼ 1300–1350 TPD. The Bawana integrated MSW plant processes ∼2000–2300 TPD of solid waste, with an installed capacity of 24 MW. The Okhla WTE plant has an installed capacity of 16 MW and processes ∼1950 t of municipal solid waste per day. Another WTE plant with a processing capacity of ∼2000 TPD is proposed for Tehkhand and another for Ghonda Gujran. After the commission of these two proposed WTE plants, the total capacity would likely be increased from 5750 TPD to at least 8450 TPD in the upcoming future. Potentially, these WTE plants processing waste for energy generation reduce the volume of landfills while providing a renewable source of energy. Limited evidence has been put forward that well-planned and well-operated WTE plants might be significant in reducing adverse health impacts due to fewer perilous emissions when compared to the burning of waste at landfills; on the other hand, poorly fed WTE plants potentially emit particulate matter and strenuous toxins that pose severe health risks (Cole-Hunter et al., 2020). A recent study reported that, so far, in India, only 23 % of the total generated municipal solid waste is treated by various processing plants, and approximately 43 % of waste is dumped. The remaining 34 % is allowed to burn openly at the landfill site itself in order to prevent spilling over (Sharma et al., 2019). There are three WTE plants installed within the megacity Delhi, and quite evidently, it processes ∼22 % of the total MSW generated annually; therefore, it is estimated that only 48 % of the total MSW is dumped, and the leftover 30 % is burned right away on the dumping site, which contributes to the air pollution issues in Delhi.
Along the same lines, construction activities in Delhi are also one of the significant contributors to particulate matter emission in Delhi. Construction activities include demolition, site preparation, and removal of debris. During the survey, at least 20 construction sites were observed, of which some of the major sites are the DDA housing sector 19-B; GH project sector 10; Megamall sector 14; DDA Housing sector 16-B; Bhagwati CGHS sector 22, Dwarka; Sarita Vihar Metro enclave; Maharani Bagh flyover; and Naraina flyover. HCVs and multi-utility vehicles like bulldozers, tractors, scrapers, and compactors are involved in the loading and unloading of construction materials, the preparation of sites, and the demolition and disposal of debris, which, in a certain way, contribute to the dust load. Additional information on the area and duration of construction activities was procured from the Public Works Department (PWD) (2020) and the Delhi Development Authority (DDA) (2020). In the case of the brick kilns industry, which is very much confined to the outskirts of Delhi areas like the Jhajjar, Faridabad, and Ghaziabad regions, where there is a cluster of kiln industries (e.g., approximately 300 brick kilns in Jhajjar region). Operation of these brick kilns is very seasonal in nature as their peak business months are between December to June. It is also noticed that approximately 10 t of coal or 13 t of tudi and/or rubber are being used to produce 1 lakh's worth of bricks using semi-zig-zag technology. The sector is widely scattered in a highly unorganized manner, and it is observed that coal (∼70 %) is used as the primary fuel followed by tudi (i.e., mustard husk) (∼25 %) and rubber, other biomass, waste, etc. (∼5 %) as an alternative fuel.
The practice of using incense sticks, mosquito coils, and/or cigarettes (IMC) has remained an unattended sector and is a vitally significant source of indoor air pollution and also contributes moderately to outdoor air pollution. The use of incense sticks in festivals and holy places is common in India. Besides that, during the field survey, it was observed that the maximum amount of street vendors (this includes both food zones and non-food zones) of Delhi, as well as small-scale dhabas, use incense sticks during business hours. The composition of incense sticks is responsible for the continuous smoldering. It comprises resin, charcoal, and wood dust mixed together and wrapped into thin sticks made from coconut leaves or bamboo. Generally, incense sticks are comprised of 45 % biomass, 25 % wooden chips or bakhoor, 15 % coal, and 15 % resin or jigit (Cohen et al., 2013; Kumar et al., 2014) and are responsible for the emission of hazardous mixtures of pollutants, causing indoor air pollution as well. It is very astonishing that most street vendors, dhabas, and hotels light incense sticks or cake during business hours. Also, mosquito coils have been widely used by the low- and middle-income-grade households (Kumar et al., 2014), especially in slum zones, which was quite fascinating to observe during the field survey. The smoldering of the contents of coils, namely biomass, wood dust, and charcoal, release deadly pollutants that are responsible for acute respiratory infections. Similarly, the smoking of cigarettes and tobacco has caused over 10 million fatalities every year in India. In fact, India has been declared home to at least 120 million smokers by the World Health Organization (WHO). The estimated emissions for these sectors were based upon the activity data of household populations and street vendors in terms of their per-capita consumption.
Open-air funeral pyres as the traditional system of cremating human bodies is a widely held custom in southern Asian countries, especially in India and Nepal (Chakrabarty et al., 2013) as the population of Hindu religion constitutes the majority. During the field campaign, around 62 crematoriums were surveyed, where it was found that only 6 crematoriums were observed to be using modern electrical burning methods as compared to 56 crematoriums using the traditional method of burning of wood. The pyre is built by using roughly ∼450–550 kg of wood along with assorted materials, such as shells of coconut, cow dung, camphor, and pure ghee or clarified butter. The dead body is basically placed on top of the pyre, and the flaming process is carried out, taking around 4 to 6 h. As stated by the vital statistics of the Municipal Corporation of Delhi (MCD), the crude death rate for Delhi was reported as 6.51 per 1000 people in 2020. No authentic data were accessible regarding the number of dead bodies cremated every day or annually except for in a few crematoriums. So, the emission estimation was based on the population statistics of religious data from the census from crematoriums, annual death rate, number of deaths, and the quantity of wood used. Later, the emission was spatially allocated to the respective crematorium grids. The land use and land cover pattern with activity data incorporated is highlighted in Fig. 4.
Emission factors (EFs) are the most critical and sensitive components for building a reliable emission inventory, and the selection of an appropriate regional sector-specific technological emission factor is the most crucial and challenging task and should be validated through scientific judgments and acceptability. A dynamic EF can epitomize a better scenario for transport emissions, especially in a developing country like India, where the usage of vehicles is much longer as compared to developed countries. Based on our best judgment, in some cases, the EFs for aging vehicle types are derived by averaging out the EFs given for the 10-year-old and 15-year-old vehicle categories. There are a few EFs which are adopted from other countries due to a lack of indigenous EFs. Although many uncertainties prevail in the development of emission inventories due to the sensitivity of EFs, the present effort is directed towards the best possible estimate by including EFs already adopted by several authenticated reports and experiments conducted by certified agencies of government and by government-authorized non-government and autonomous agencies, which provide the best estimates for EFs; these are referred to in our latest studies (Mangaraj et al., 2022a, b) and are taken into account in this present study.
2.1 Calculation
The total emission, i.e., the sum of emissions from all individual sectors, is expressed by Eq. (1) with respect to a particular pollutant. Most of a sector's emission is estimated using the Intergovernmental Panel on Climate Change (IPCC) tier-2 approach. In the absence of activity data, the tier-1 approach is adopted for a few sectors. In the case of the transport sector, the EFs are defined on the basis of kilometers traveled, which is highly sensitive to the technology and age of vehicles. In the presence of country-specific technological EFs for the transport sector, as developed by ARAI, it is highly useful to prove the estimation. The emissions from the transport sector have been calculated as per the Eq. (2). In case of road dust emission, the method is adopted from the widely used AP-42 of USEPA (United States Environmental Protection Agency) (Eqs. 3 and 4) using the country-specific parameters like silt load, moisture content, number of precipitation days, and average vehicular weight.
2.1.1 Equations used
In the above equation, r, s, and t refer to sector, fuel type, and technology, respectively; TE refers to the total emission; FU refers to the sector- and fuel-specific amount; Ef refers to technology-specific EFs; A refers to the fraction of fuel for a sector with particular technology, where for each fuel and sector.
In the above equation, Et refers to the total emission of a compound, Vhl refers to the number of vehicles per type, Dl refers to the distance traveled in a year per different vehicle type, and Efl,km refers to the emission of compounds by vehicle type per driven kilometer.
For paved-road dust
In the above equation, Ep refers to the particulate emission factor (with units matching the units of k), k refers to the particle size multiplier for the particle size range and units of interest, st refers to the road surface silt loading (grams per square meter) (g m2), wt refers to the average weight (t) of the vehicles traveling on the road, pt refers to the number of wet days with at least 0.254 mm (0.01 in.) of precipitation during the averaging period, and N refers to the number of days in the averaging period (e.g., 365 for annual, 91 for seasonal, and 30 for monthly).
For unpaved-road dust
In the above equation, Eup refers to the size-specific emission factor (lb per VMT); st refers to the surface material silt content (%); m refers to the surface material moisture content (%); VS refers to the mean vehicle speed (mph); C refers to the emission factor for a 1980s vehicle fleet exhaust, brake wear, and tire wear; pt refers to the number of days in a year with at least 0.254 mm (0.01 in.) of precipitation; and k, a, c, and d are empirical constants
2.2 Spatial allocation of emissions
The Geographical Information System (GIS) organizes the geographic data from various sources and is a key in allowing these tools to transform large, spatially uniform emission datasets into systematic thematic layers used for developing gridded emission inventories. A high-resolution land use and land cover (LULC) digital database over the megacity of Delhi is used to improve the spatial distribution of emissions from various sectors. Before the inputting of calculated emissions into the GIS environment, several preliminary tasks like geo-referencing, digitization, and building of an attribute activity database are undertaken. A GIS-based statistical approach is developed to spatially distribute the emissions across the Delhi NCR. Different layers of spatial proxies have been taken into account to grid the emission values to the required resolution () for each sector, which can be used as tool for further analysis. The basic spatial features are points, lines, and polygons; layers of road networks, national and state highways, and major and minor roads; population densities of villages and districts; the urban spread of the grid; and a database on the economic activity of hospitals, market complexes, industrial estates, hotels, residential blocks, etc. These spatial features are used as proxies to determine the emissions both spatially and temporally, whereby grid-level emissions are allocated by overlaying the facility location layer with the grid cell layer and aggregating the facility points in each cell covering the Delhi NCR.
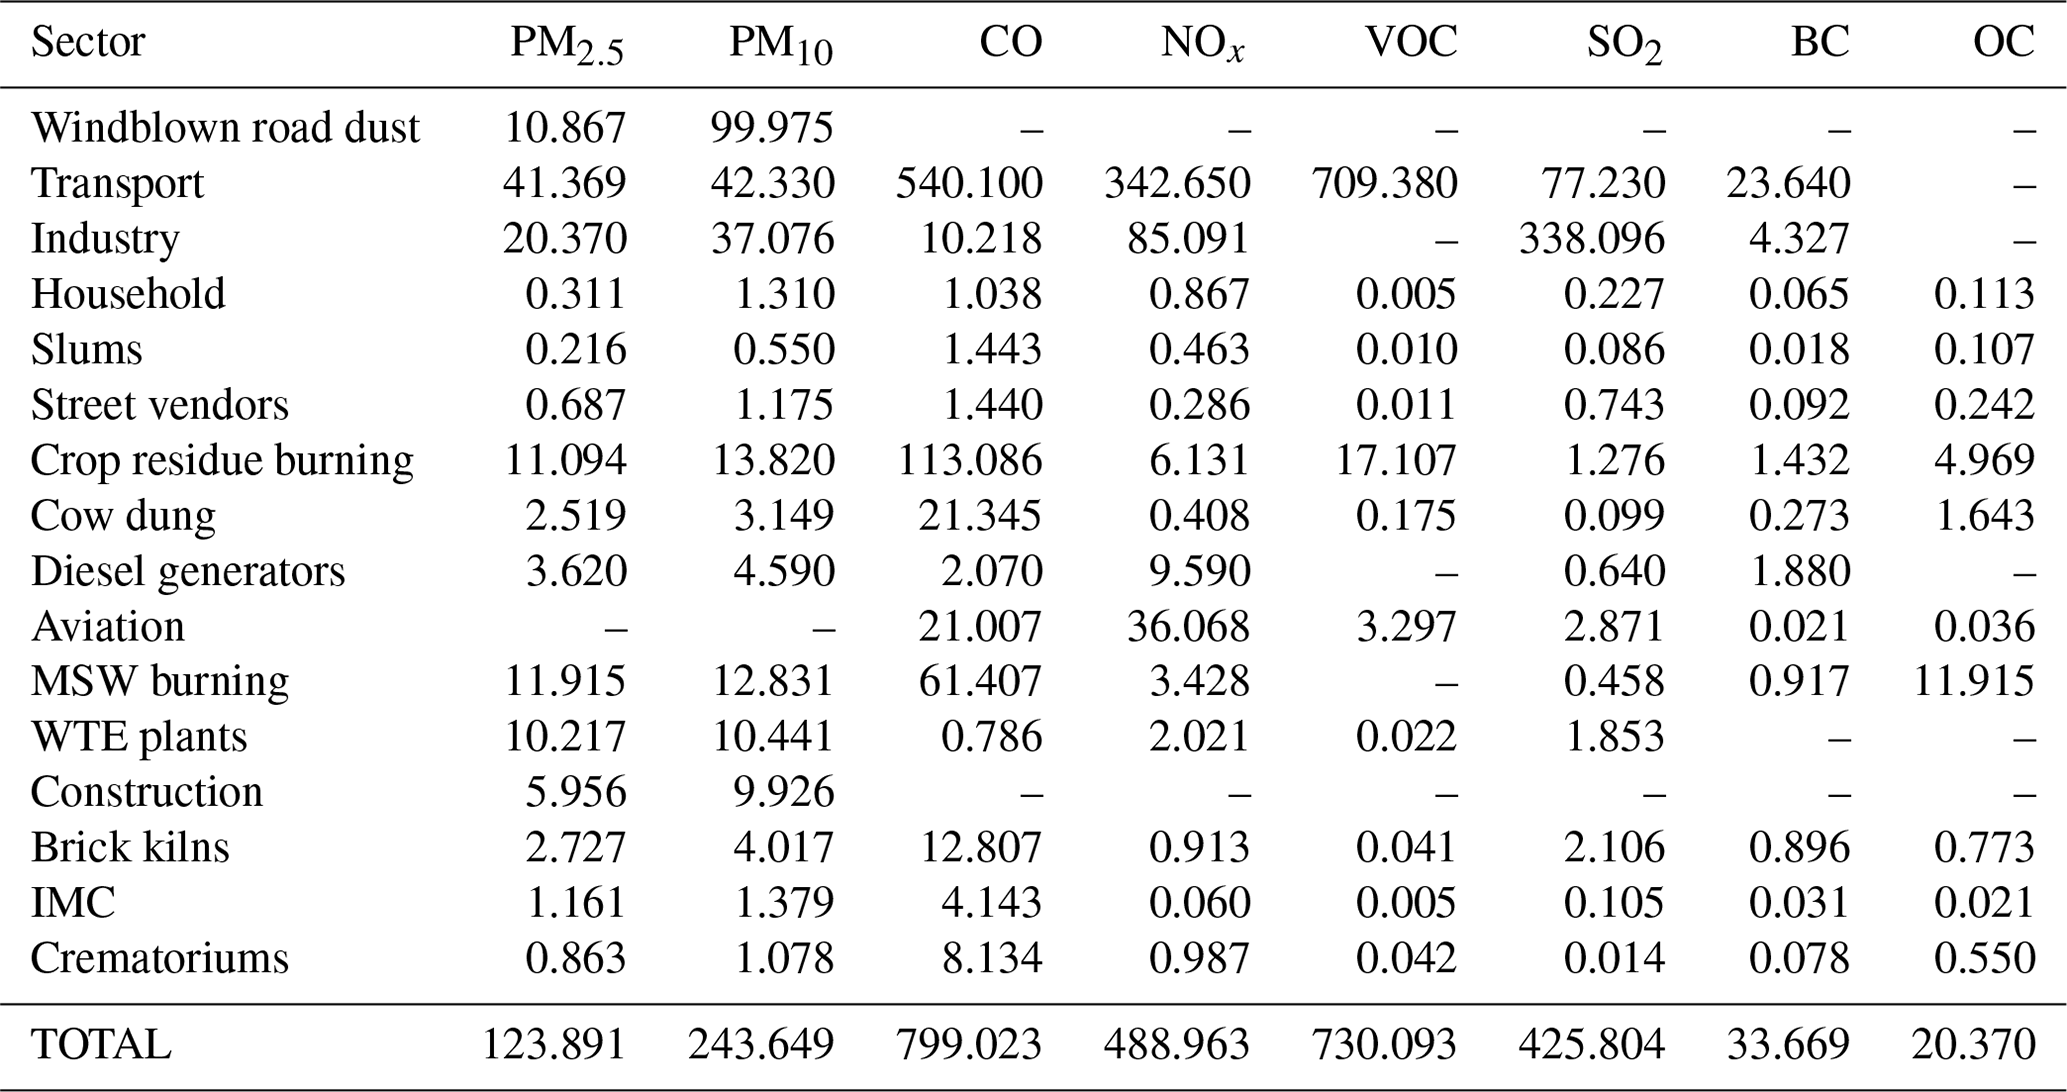
The developed emission inventories for major air pollutants like PM2.5, PM10, CO, NOx, SO2, VOC, BC, and OC covering the Delhi NCR in 2020 are calculated to be 123.8, 243.6, 799.0, 488.9, 730.0, 425.8, 33.6, and 20.3 Gg yr−1, respectively. The sector-wise total emission of pollutants across the Delhi NCR is provided in Table 2. Also, a dataset has been provided at https://doi.org/10.5281/zenodo.7715595 (Sahu et al., 2023) for gridded pollutant-wise sectorial spatial distributions. Keeping the space constraint in mind, comprehensive analysis of the spatial distribution of PM10 and CO is elaborated upon further.
Table 2Pollutant-wise and sector-specific total emission across the Delhi NCR.
3.1 Anthropogenic PM10 emission in Delhi NCR
The total PM10 emission across the Delhi NCR is estimated to be 243.6 Gg yr−1, where windblown dust emerged as the largest source (99.9 Gg yr−1) followed by the traditionally dominating sectors like the transport sector (42.3 Gg yr−1) and the industry sector (37.0 Gg yr−1). It is also noticed that crop residue burning (13.8 Gg yr−1) and municipal solid-waste burning (12.8 Gg yr−1) in open areas along with waste-to-energy plants (10.4 Gg yr−1) are emerging as the largest sources of particulate matter across the city.
High emissions on the order of 1000–6000 and 120–1000 t per grid per year are found over central, eastern, northern, some southern, and southeastern fringes of Delhi, confined to national highways and many major and busy roads, as shown in Fig. 5. Moderate emissions on the order of just 30–120 t per grid per year are well scattered across the study regions. It has been noted that the central and eastern Delhi regions are of the most highly polluted regions. A recent rising trend of vehicle numbers along with vehicles from surrounding states on Delhi roads in the last 10 year has put tremendous pressure on road network expansion, leading to heavy traffic congestion. All major traffic junctions are experiencing high emission loads. However, the highest-emitting grids, on the order of ∼1300–6000 t per grid per year, are also found in small patches driven by sources like WTE plants and industrial practices followed by municipal solid-waste burning as well. It has been found that the Okhla region is one of the highly polluted hotspots where WTE plants, municipal solid-waste burning, and windblown road dust are the dominating sectors responsible for elevated PM10 emissions. The next dominating hotspots identified in the Bawana and Ghazipur regions are dominated by large point sources like the WTE plants, with ∼2566 and 1704 t per grid per year, respectively. Furthermore, Anand Parbat (∼1300–1700 t per grid per year), the Badli industrial area (∼648 t per grid per year), the Wazirpur industrial area (∼508 t per grid per year), the Mayapuri industrial area (∼400–500 t per grid per year), and the Rohini industrial area (∼481 t per grid per year) are some of the industrial dominating hotspots. It is noticed that coal is predominantly used as fuel in both the organized and unorganized industrial sector, followed by diesel. Dense major road networks across these regions have led to slow-moving traffic congestion; moreover, these roads are concurrent with the major junctions of industrial area, and they tend to witness the large movement of heavy-weighted HCVs and LCVs for the supply of raw materials and goods. The continuous movement of these vehicles undoubtedly is responsible for the broken and worn-out roads. Besides that, this vehicle-induced turbulence and poor road condition are the leading factors accountable for road dust resuspension on the order of ∼150–750 t per grid per year, making it the second dominating sector overall. The gross weight of the HCVs and LCVs also affects their speed while carrying the goods, which intensifies the vehicular exhaust emission too, which is why the transport sector is the third dominating sector with ∼70–300 t per grid per year. High vehicular density over many busy roads is the main cause of high particulate emission due to a moderate vehicular speed of ∼25 km h−1. This speed increases towards the outskirts of the city. The load of windblown road dust depends on vehicle speed; therefore, the traffic congestion leading to a decrease in average vehicle speed in Delhi is regarded as one of the important factors that lead to suppressing the windblown dust, but at the same time, it increases the transport emission due to traffic congestion. Apart from this, heavy commercial vehicles loaded beyond their carrying capacity cause resuspension of road dust, which results in severe particulate pollution. Moreover, a significant amount of vehicle fleet plying over the megacity Delhi belongs to other states, where the share of the personal and commercial cars (taxis) can go as high as ∼30 %–40 % on various road types.
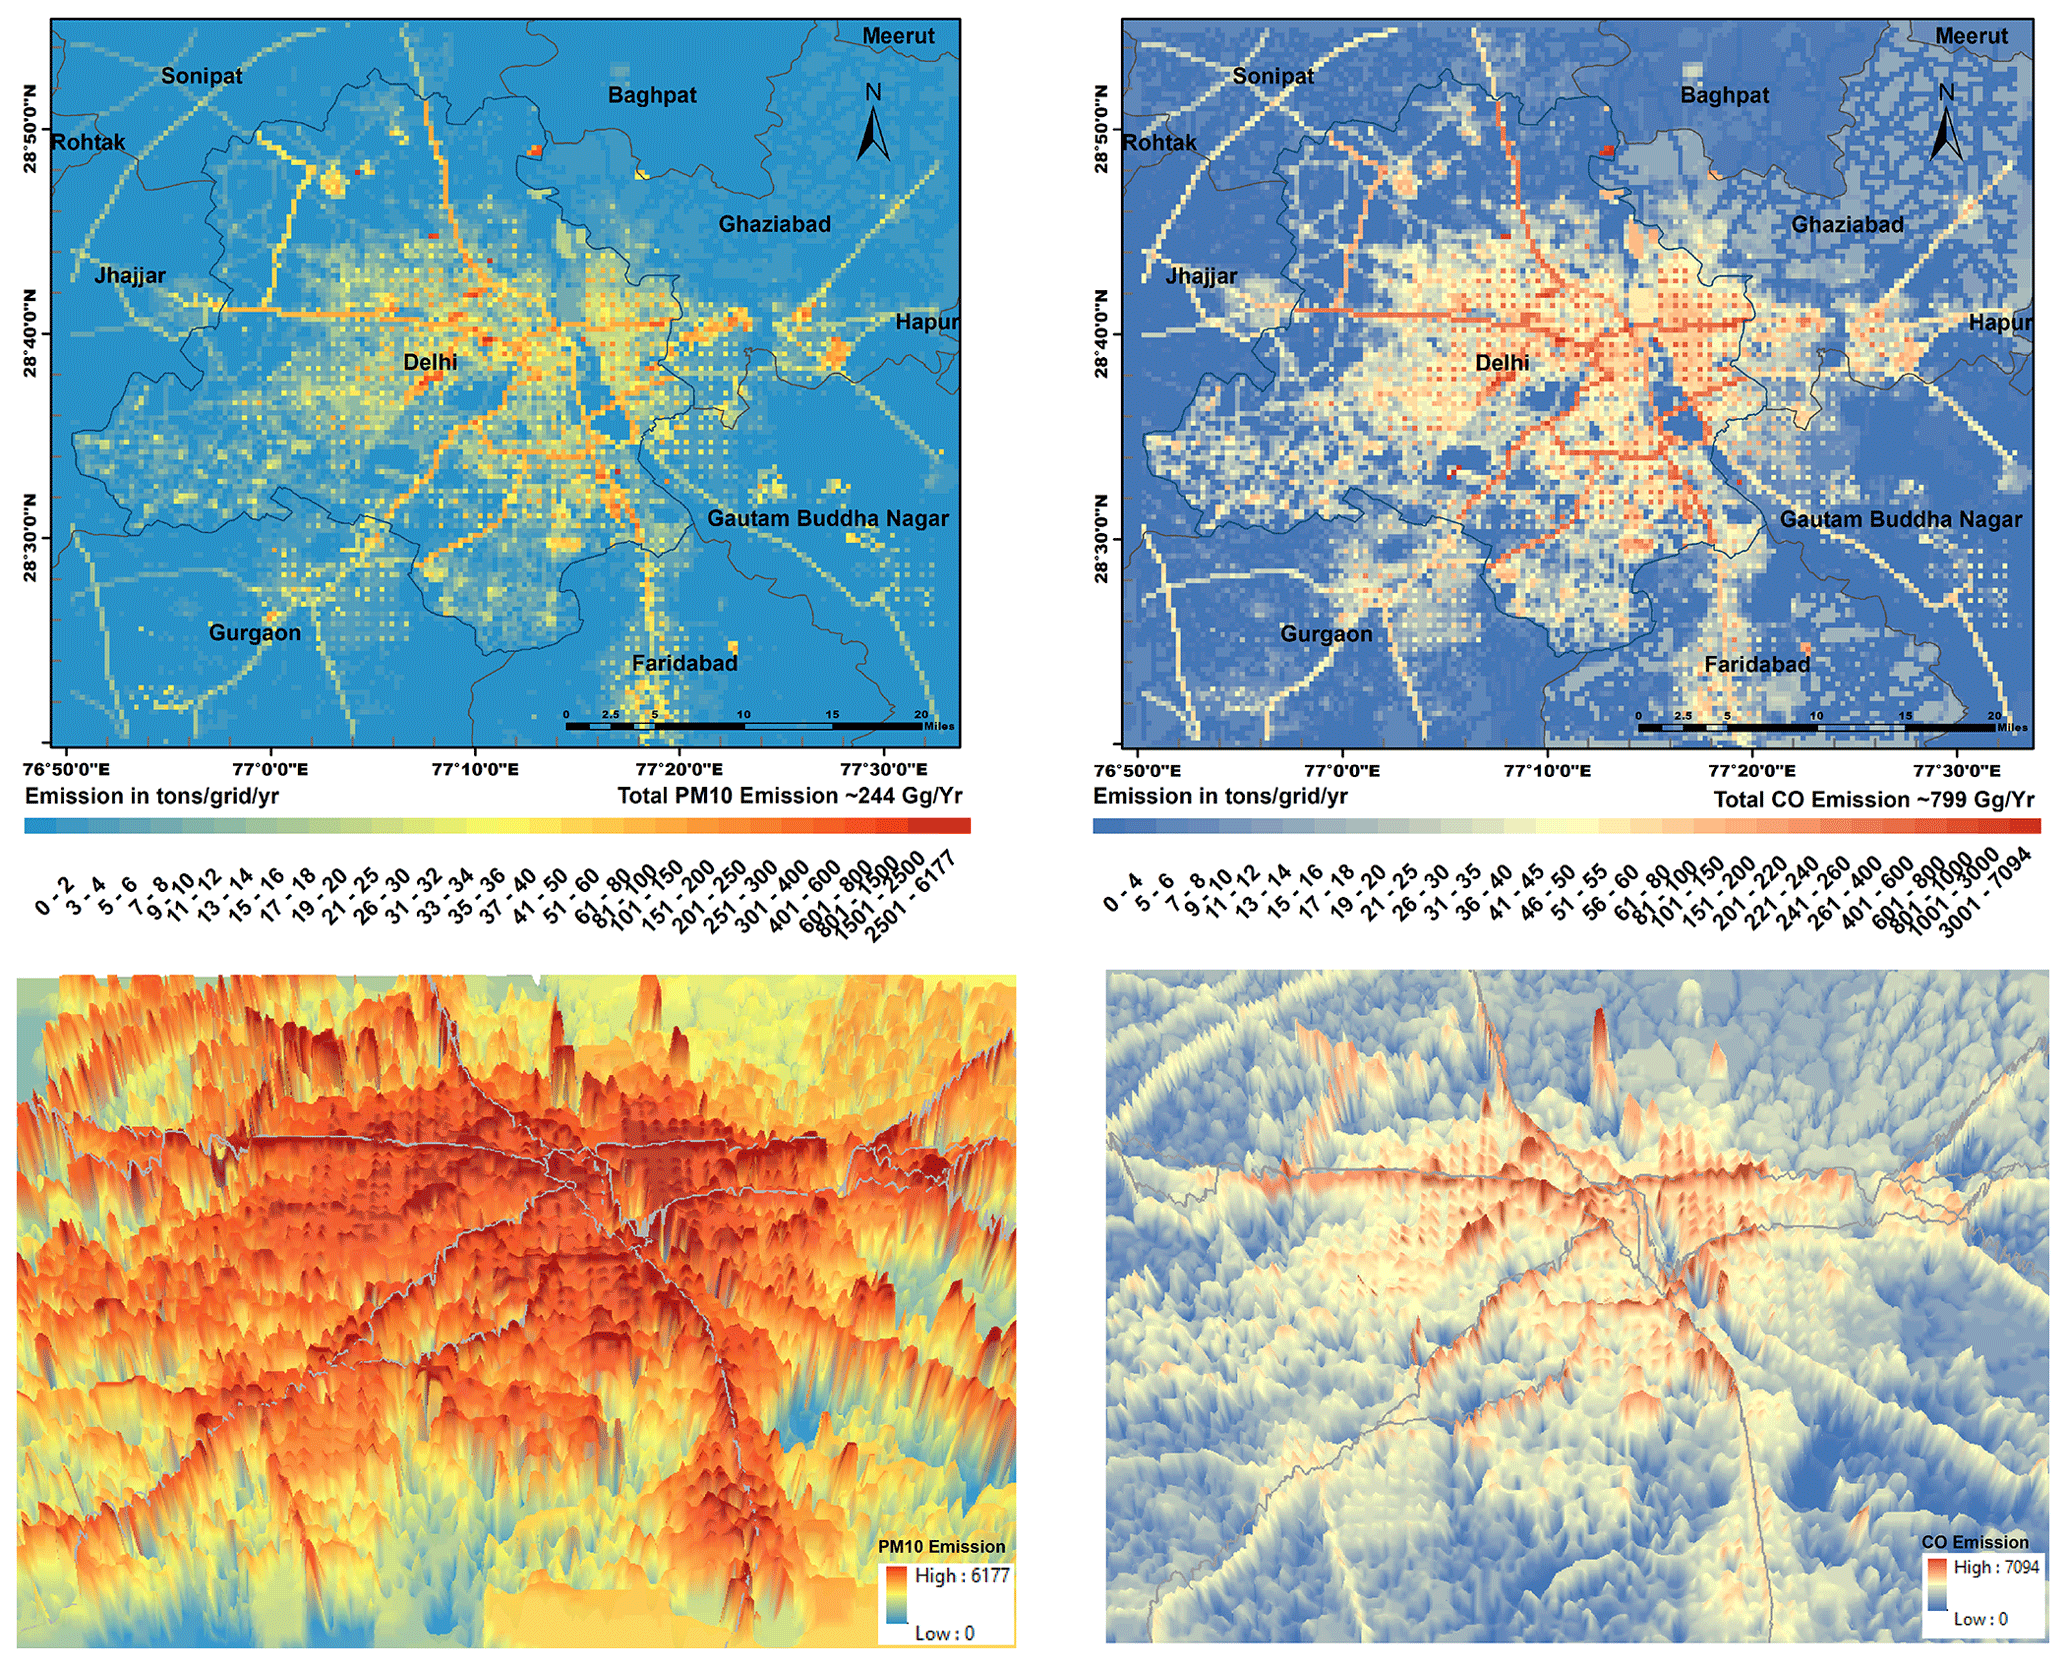
Figure 5Spatial distribution of PM10 and CO load across the Delhi NCR region.
3.2 Anthropogenic CO emissions in Delhi NCR
The estimated total CO emission from all the sources is found to be around 799.02 Gg yr−1. The relative contributions of CO from the transport, industrial, residential, and other sector are estimated to be 67.5 % (540 Gg yr−1), 1.2 % (10.21 Gg yr−1), 17.5 % (140.42 Gg yr−1), and 13.5 % (108.28 Gg yr−1), respectively. The spatial pattern as shown in Fig. 5 depicts that CO emission hotspots on the order of 750–6500 t per grid per year are found over the large region of central, eastern, and southeastern Delhi, along with few more over surrounding NCR regions like Noida, Gurgaon, Gaziabad, and Faridabad. The transport sector is the dominating source in the above discussed regions due to the high population and dense road network driving high vehicular activities. The estimated emission from transport is found to be around 540.10 Gg yr−1, where the petrol-driven vehicles emit more CO as compared to diesel and CNG vehicles. The petrol vehicles are mostly personal vehicles in India; however, the vehicle numbers have gone up nearly 2-fold in Delhi during the last 10 years, contributing more than 80 % of the total CO emissions. Commercial vehicle growth contributes less to CO emission. Most of the major traffic junctions downtown are highly polluted by transport-related CO emission (∼1200–1800 t yr−1). Most of the CO-emitting industrial zones in Delhi are more confined to central and eastern Delhi and a few more specific regions on the outskirts of Delhi.
The second most dominant source is the residential sector, where major slum clusters contribute significantly. The regions are more confined to the central, eastern, and southeastern parts of Delhi and a few surrounding regions. It is also found that a highly dense population with middle- and lower-income groups makes up the above-discussed areas too, with associated slum cooking, residential cooking, street venders, commercial cooking, etc. Non-technological, soil-fuel-based cooking practices in slum areas drive high CO emission. Moreover, the slum population located in eastern and central Delhi is dense and aggravates CO emission further. A relatively low emission of the order of 25–150 t yr−1 is found on the outskirts of Delhi and in adjacent districts like Rotak, Jhajjar, and Gauttam Budhanagar. Low population density along with agricultural land cover are the main reasons for the low emission of CO. Collectively, the street vendor cooking and commercial cooking contribute a significant amount of CO emission in densely populated regions and are uniformly scattered over a large area. Similar hotspots are also identified over the Noida, Gurgaon, and Faridabad regions surrounding Delhi, where an emission on the order 1000–1500 t yr−1 is found.
3.3 Decadal change in emissions (2010–2020)
The shifting of emission sources and its trend over the years is vital for assessing the impact of air pollution, especially in megacities. The present estimated PM10 emission is compared with our own previous estimation for the base year 2010 (SAFAR-Delhi, 2010) for same domain; it is clearly concluded that the effective net increase in PM10 emission over the last decade is just ∼3 %. This small growth could be due to various new policies being adopted by the government which directly or indirectly influence emissions. At the same time, there are a couple of shifts in sectorial emission loads, as well as the addition of new unorganized sectors in the 2020 emission estimation. If you look at the sector-specific change, then there are significant shifts in the emission pattern that require attention. It can be observed that there has been an increase of 39 % in the emission load from the transport sector as compared to a 36 % increase in the industrial sector during the same period. In the case of windblown road dust emissions, there is a decrease of 23 %, as shown in Fig. 7. Due to the penetration of LPG in slums, the cooking-related emission is improved significantly, as is also the case in the residential sector. The rise in the number of vehicles with an increase in the spread of road networks turned out to be the major cause along with the overburdening of four-wheeler cars, where the contribution of other-state cars is significant. However, there is an increase in traffic congestion, but better paved-road conditions and road shoulder maintenance have resulted in a decrease in emission load from windblown road dust in the last decade. The discontinuation (permanent closure) of the thermal power plants in Delhi has resulted in the exclusion of thermal power plants as a sector contributing to the total emission load.
As far as the residential sector is concerned, there has been a rapid reduction in its relative contribution. The decrease in the number of slums in Delhi when compared to the 2010 period has resulted in a reduction in the consumption of cooking fuels, which shows a significant decline of 31 % in residential PM10 load. Primarily, the awareness among the people led to the penetration of LPG in slum areas, street vending, households, etc., which reduced the emissions to a great extent. However, emissions from other sectors have made a significant contribution to the present PM10 load. The new emerging sectors like WTE plants; MSW burning; crematoriums; the use of incense sticks, mosquito coils, and cigarettes; and construction were not considered in the previous report in 2010, and so the relative contribution has increased significantly. This decadal change in emissions is also observed in the case of CO with a similar trend, except in the residential sector, where there is a substantial decreasing trend, as shown in Fig. 6. A summary of the growth trend for all the pollutants is shown in Table 3.
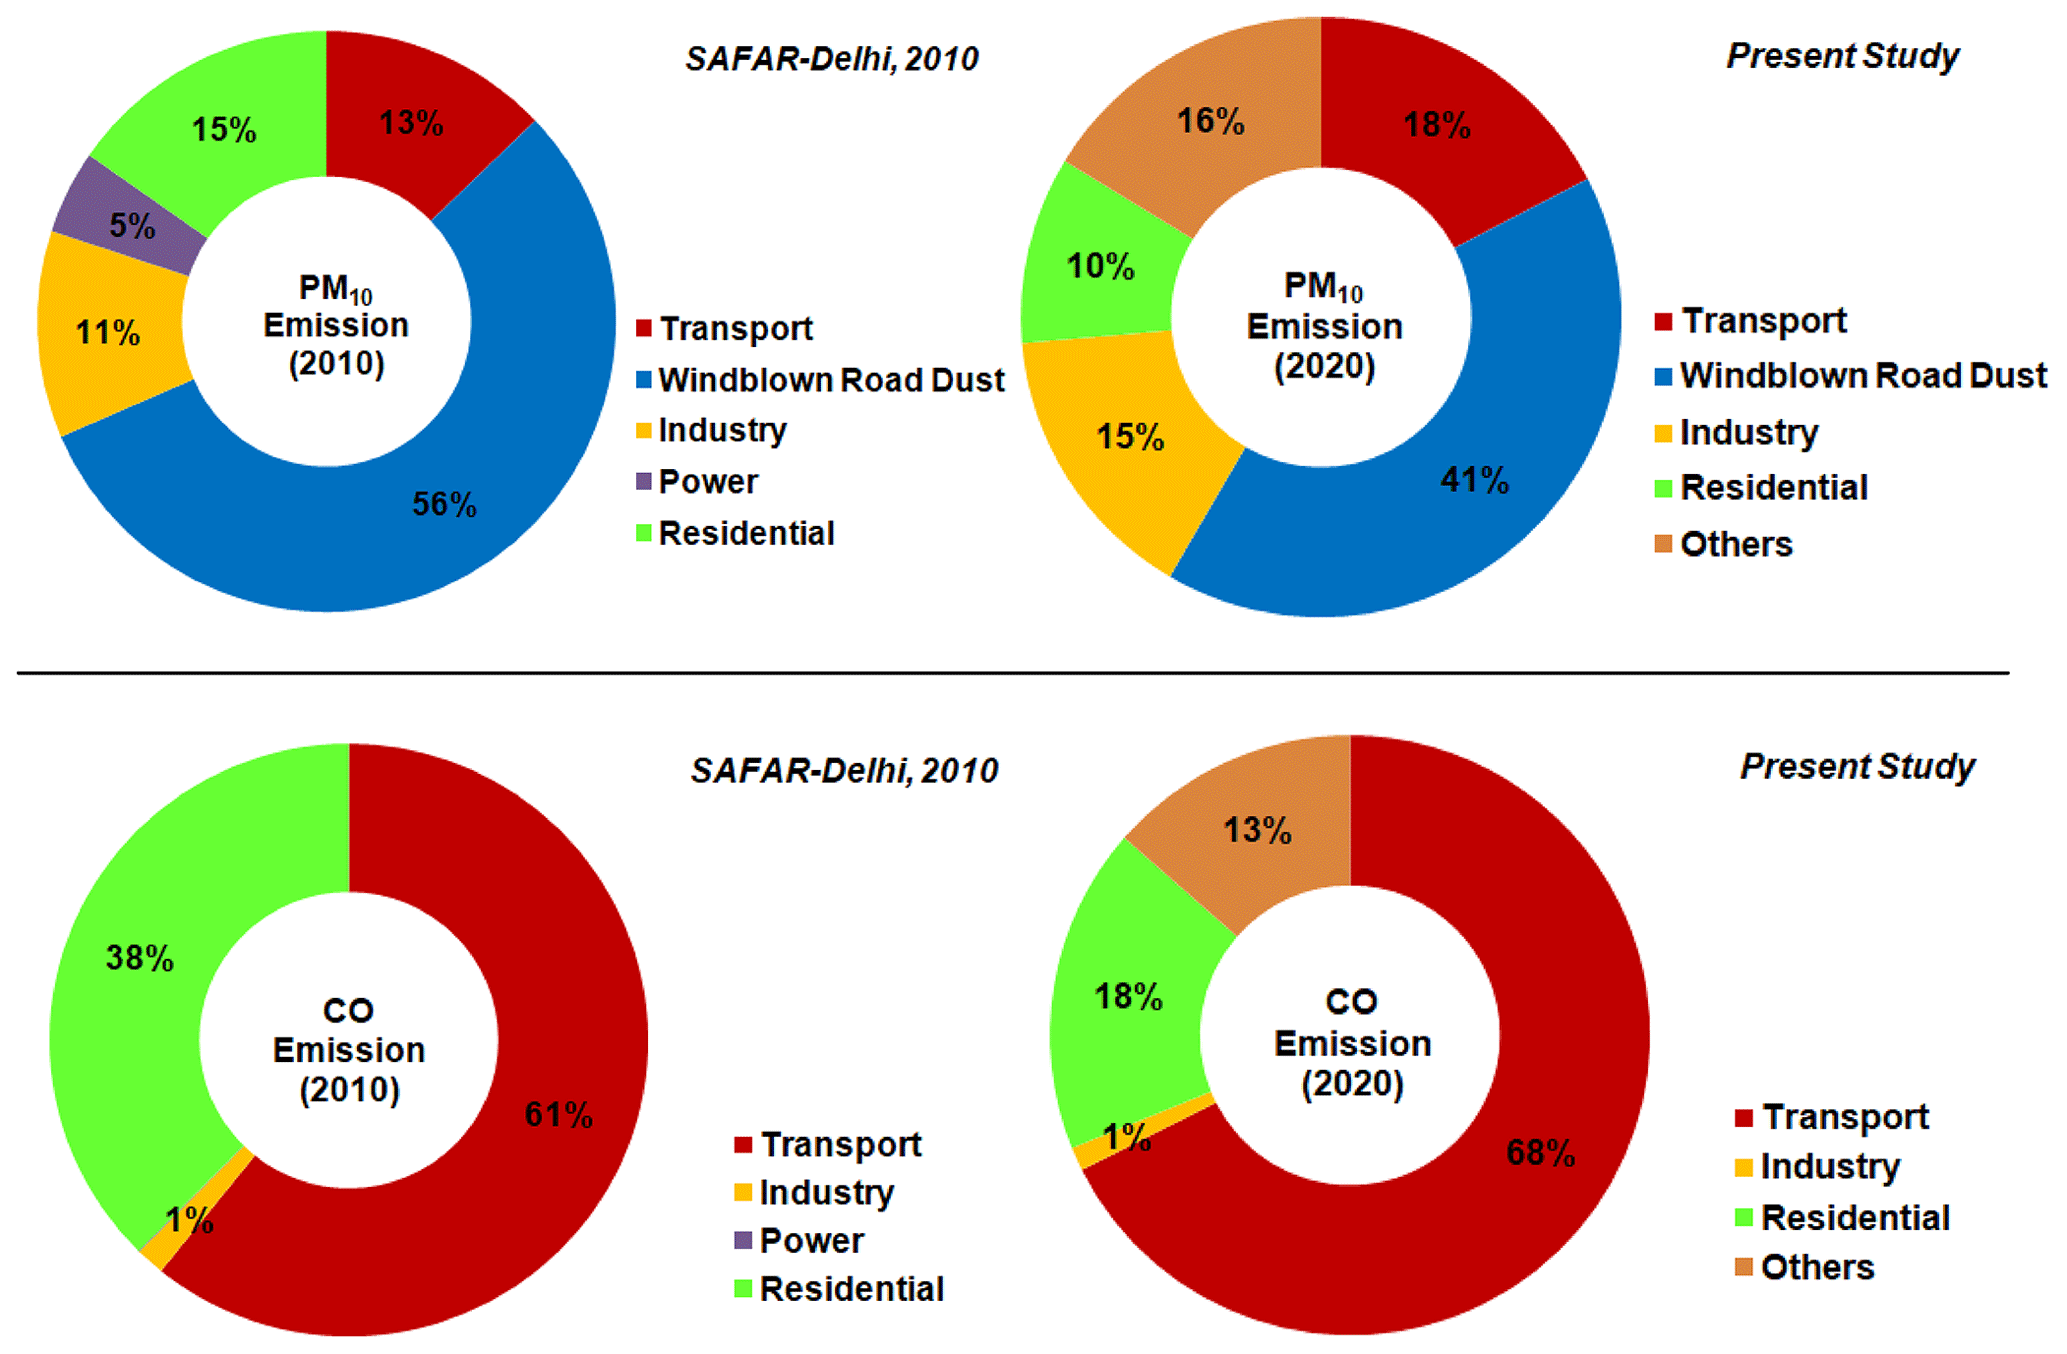
Table 3Comparison of sectorial emissions during 2010 and 2020.
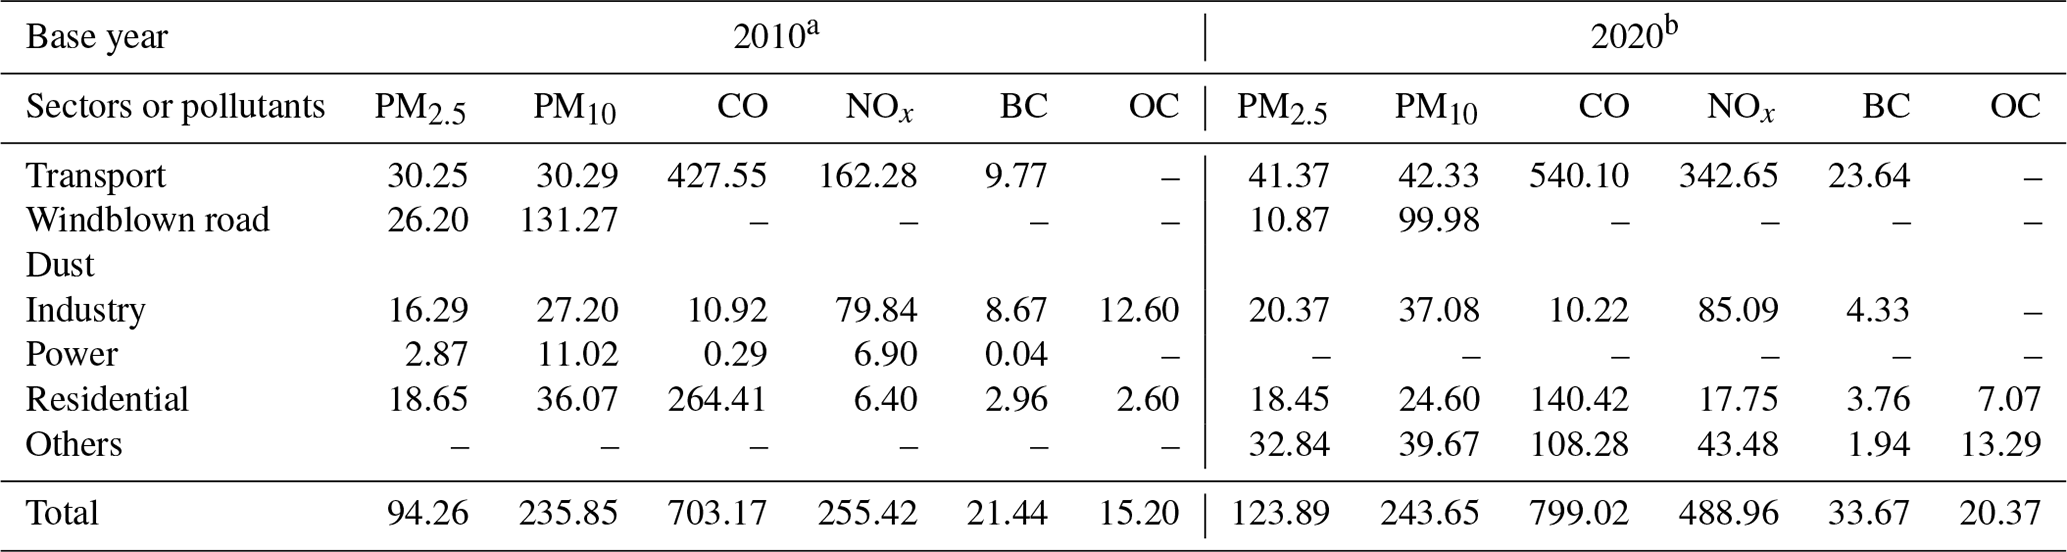
a SAFAR-Delhi (2010); b Present study. All emissions in Gg yr−1.
3.4 Uncertainty in emissions and limitations
Emission inventories may have errors due to activity data and EF gaps. Therefore, the collection of data and the evaluation of uncertainties are unambiguously linked. We have made an attempt to estimate the uncertainty in the sectorial emissions, for which error propagation was calculated by following the Monte Carlo methodology. The factors included for uncertainty estimation include the (a) emission factors used, (b) activity data collection, (c) proxy data used, (d) data gaps leading to approximation, and (e) efficiency of emission control. Uncertainty estimation for the transport sector seems to be very complex as it involves fuel-specific technological vehicle categories that are diverse in terms of emission factors according to the age of vehicles. In the case of transport, the disparity between activity data and VKTs is not much as a robust ground survey was performed. Therefore, the contribution of vehicular emissions to the gross uncertainty is the least, with a maximum uncertainty of ±23 %. Emission from windblown road dust has heterogeneous factors like the speed of the vehicle along with its weight, soil moisture content, and silt load. These modulating factors are responsible for defining the emission load and their combined uncertainty range of ±33 %. The residential or domestic emission source comprises per capita fuel-induced activity data and corresponding emission factors, and so the combined uncertainty in this sector is ±28 %. The industrial sector has the highest disparity in terms of secondary activity data, and the availability of relevant technological emission factors is the key factor for a higher uncertainty level of ±41 %. The sources belonging to other sectors comprise several minor unorganized sources, which make comparatively less contribution to the total emission and have a high uncertainty of ±47 %. The gross uncertainty in the inventory is estimated to be around ±29 %, which is found to be in an acceptable range. As of today, no comprehensive study has been done to determine the uncertainty for the emission inventory of Delhi. This is the first approach to do the same, and in accordance with our best scientific judgment, it can be said that the present surface emission dataset, in terms of both quality and quantity, has the least errors. The emission inventory's limitation lies in various steps, like limited access to industrial information like the one fuel quantity used in various techniques. Similarly, the exact number of other-state vehicles plying in the megacity is very uncertain, and a better approach is needed to improve the estimation. There are many unorganized sectors like street vendors, small-scale waste burning across the local level, silt load on various roads, and driving conditions that vary with road type and condition. Still, we believe the kind of micro-level activity data used are better than any other earlier inventories developed over the study region.
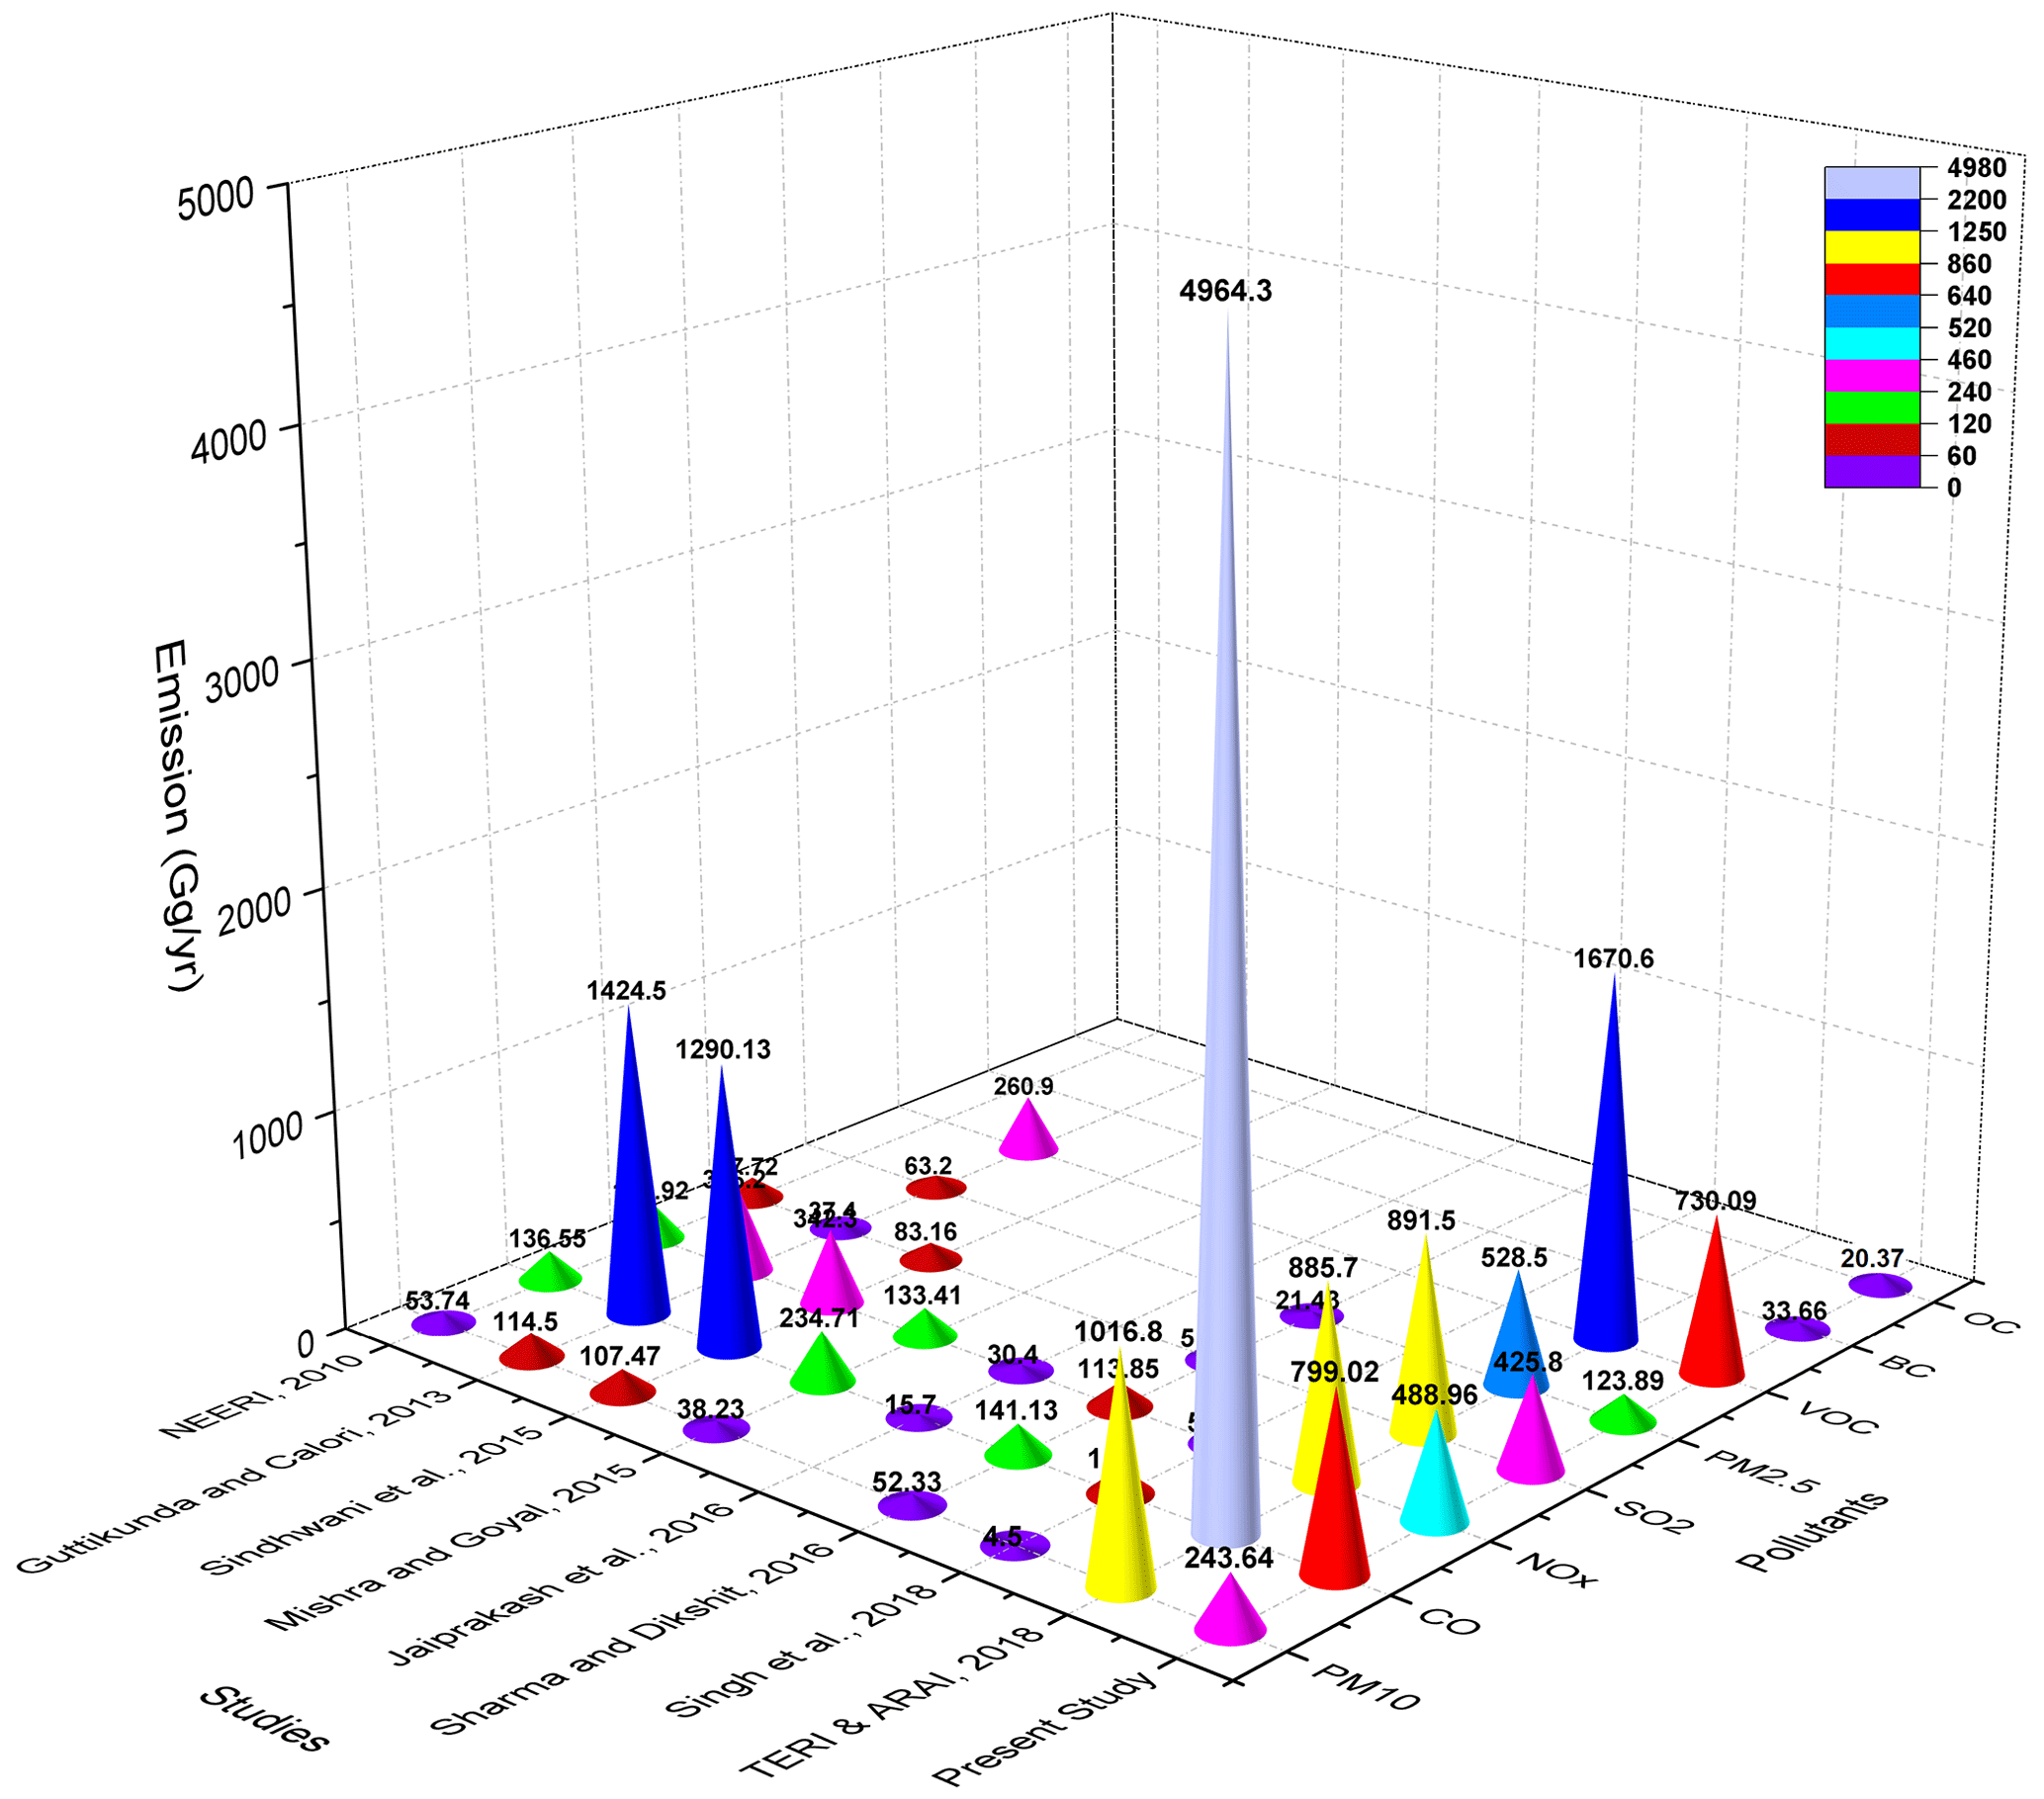
3.5 Inter-comparison among studies
In this section, a comparative analysis of the present study in relation to the past studies is taken into account and has been elaborated upon. As mentioned earlier, Delhi has been in the spotlight where air quality issues are concerned. Here, the present study is compared with eight studies done previously over Delhi. In 2010, NEERI presented a sector-wise emission inventory at a 2 km resolution covering the metropolitan area of Delhi for the base year 2007, targeting only four pollutants (PM10, SO2, NOx, and CO). The calculated emissions were found to be 147, 268, 460, and 374.1 t d−1, respectively. Guttikunda and Calori (2013) worked on the National Capital Territory (NCT) region that includes Delhi and its suburbs (Gurgaon, Noida, Faridabad, and Ghaziabad) over an area of 6400 km2 at a ∼1 km resolution. This was done for the base year 2010 for PM, SO2, NOx, CO, and VOCs. It includes sectors of re-suspended road dust, construction, vehicular exhausts, domestic cooking, power plants, industries, brick kilns, diesel generator sets, and waste burning. About 35 % of the total PM10 emission is contributed by the transport sector and road dust, and around 37 % is contributed by the major point sources (brick kilns, industries, and power plants). It has been highlighted that brick kilns located outside the city affect the city air to some extent, but the origin of certain sources like diesel generator sets, waste burning, and construction remains unclear, specifically whether they have been influenced by the surrounding areas or not. In addition, the domain of interest is around 69 % of the total area of Delhi, which is huge, and therefore it does not give a clear representation of the exact emissions prevailing in Delhi. Sindhwani et al. (2015) estimated PM10, CO, NOx, and SO2 emissions in the Delhi NCR that comprises the neighboring states of Haryana and Uttar Pradesh. This study was done in the year 2010 at a 2 km×2 km resolution. The estimated total emissions for PM10, CO, NOx, and SO2 were 107.47, 1290.13, 342.30, and 83.16 Gg yr−1, respectively. The contribution of sectors like road transport, road dust, and domestic sources altogether makes up ∼47 % of total PM10 emissions. A quantitative assessment of only three pollutants, i.e., PM, NOx, and CO, was carried out for the Delhi urban area for the base year 2010 by Mishra and Goyal (2015). The major contributors included vehicles, industries, power plants, the domestic sector, and dust. The CO and NOx emissions from the transport sector (210.83 and 92 kt, respectively) were found to be the largest contributors, followed by the domestic sector. Road dust (25.50 kt) made a significant contribution to PM, while vehicles, industries, and power plants made approximately equal contributions. Similarly, Jaiprakash et al. (2016) reported an experimental-based study focusing specifically on vehicular emissions (CO, CO2, and NOx) in Delhi for the base year 2012. The study estimated an on-road tailpipe measurement of 14 passenger cars of different types of fuel and vintage and reported that the shares of diesel, gasoline, and CNG in relation to the total CO, CO2, and NOx emissions were on the order of , , and , respectively. These studies are majorly lacking in terms of accounting for the impactful active sources like commercial cooking (street vendors), crematoriums, WTE plants, crop residue burning, and many more, which makes this inventory insignificant for further use.
Sharma and Dikshit (2016) attempted a comprehensive study of PM10, PM2.5, NOx, SO2, and CO in Delhi, focusing on ∼14 sources for the base year 2014 (November 2013–June 2014) at a 2 km resolution. The results showed that road dust (56 %), concrete batching (10 %), industrial sources (10 %), and vehicles (9 %) are the major contributors to PM10 emissions. Though the study involved site sampling for a few of the sectors, it also lacked an absolute sampling number (limitation), and most of the activity data were collected from secondary sources. Singh et al. (2018) attempted the estimation of emissions from the road transport sector of the NCT Delhi for the base year 2010. The study stated that major roads contributed to more than 50 % of the total PM emissions. When specifically focusing on limited pollutants, which most importantly include PM, this study has certain limitations in terms of non-exhaust emissions (vehicular dust resuspension) from road transport, which is a significant contributor to the city's PM10 load. Thereafter, TERI and ARAI (2018) initiated a source apportionment study for identifying sources responsible for PM2.5 and PM10 in the Delhi NCR and developed a coarse-resolution (4 km×4 km) emission inventory of a few pollutants (PM, NOx, SO2, CO, and non-methane volatile organic compounds – NMVOCs) for 2016. The results stated that, in the case of PM10, road dust and construction dust contributed significantly, where the contribution of dust from surrounding regions was comparatively higher in summers, which reduced the proportion of major sectors in the PM10 emission load.
Taken as a whole, a large disparity is found between the reported past studies and present emission estimations, as shown in Fig. 7. The basic reasons for these variations point towards the differences in the sectors being focused on; the activity data being considered in the past works in conjunction with the use of technological emission factors are also an additional concern. The base years and the domain considered differ significantly from each other. As the sources of emission and hence the evolution of a region tend to change with time, upgrading an emission inventory is the most fundamental segment to be taken care of. As a consequence, this present study has premeditated all such important factors in the most potent ways to build up this gridded surface emission dataset. In addition to this, unlike the previous works, this study is the first-ever ultra-high-resolution gridded (∼400 m) emission dataset targeting eight major pollutants for the latest base year, 2020. This new dataset could be a valuable element in air quality management (mitigation strategies) and air quality modeling, which is why it is believed to be more reliable data.
3.6 Mitigation strategy using developed emission
An emission inventory acts as a fundamental tool for both policymakers and scientific communities in terms of mitigation strategies in combating air pollution in any cities. In the present study, the developed sensitive piece of a surface-gridded emission database is unique in many ways and will pave a path to understanding the air quality issues in the megacity Delhi. For the same reason, a thorough analysis has been made to identify the contribution of major sectors to the high-emitting polluted zones across Delhi. Following that, a number of hotspot regions were identified, as shown in Fig. 8a, from which the top 10 hotspots were identified along with first three dominating sectors significantly affecting the air over the hotspots, as shown in Fig. 8b. From this, PM10 is considered to be one of the dominating pollutants in modulating urban air quality. In one of the applications to the developed emission inventories, sector-specific control strategies are recommended based on the input of available activity data and emission factors, which would possibly benefit the policymakers and help in the improvement of megacity air quality. The 10 most dominating hotspots are identified with the relative contribution of three major sectors in descending order, as identified in the table to follow. Each area mentioned against each megacity below is accompanied by several color codes which denote a specific sector associated with the pollution; note that TRN refers to transport, WB refers to windblown road dust, IND refers to industry, TPP refers to thermal power plants, SLM refers to slums, MSW refers to municipal solid-waste burning, DG refers to diesel generators, WTE refers to waste-to-energy plants, RES refers to residential, ad CON refers to construction.
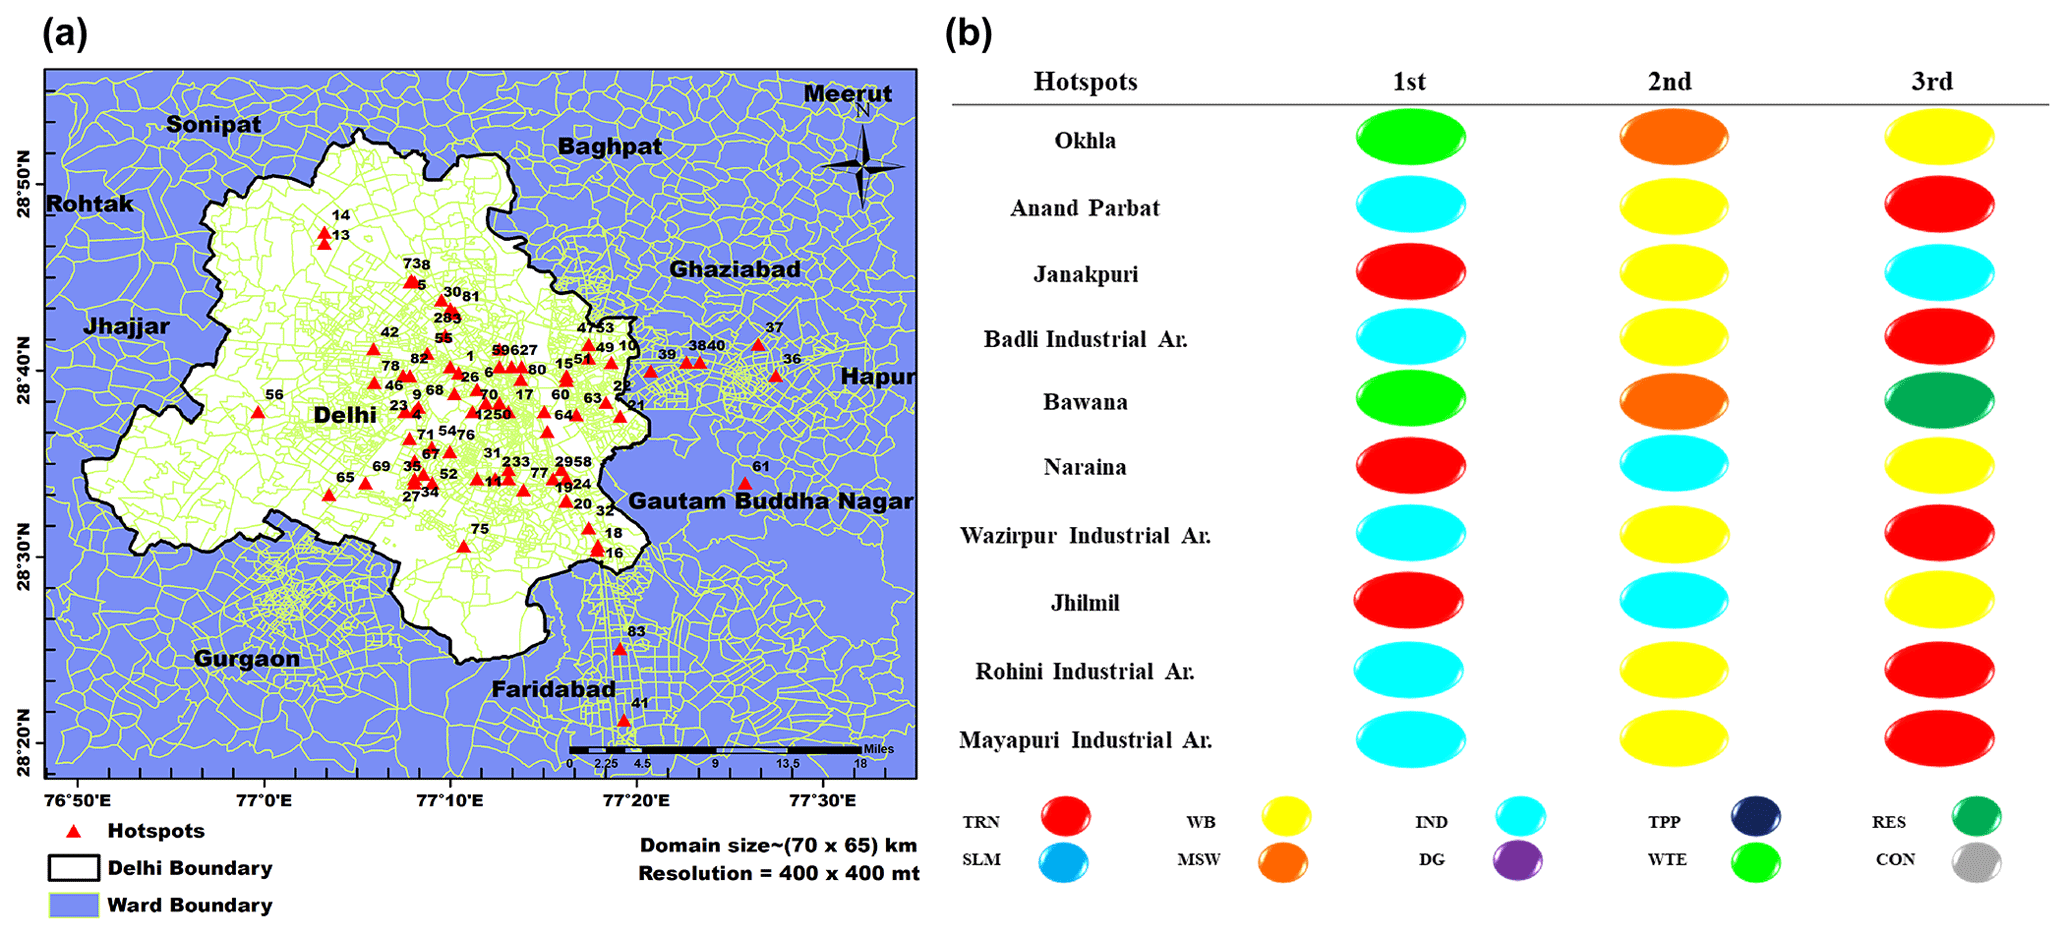
Figure 8(a) Hotspots across the Delhi NCR domain, with (b) the first three dominating sectors affecting the air over the hotspots.
Based on the analysis of each hotspot, as delineated in Fig. 8, the mitigation strategy can be framed accordingly to control the emissions at the source through various approaches on the ground. Apart from this, a few sector-specific, generalized recommendations have been listed below for all the megacities:
- (a)
The discarding of aging vehicles (more than 10 years old), especially the commercial-vehicle and heavy-commercial-vehicle categories, from the system followed by fast traffic movement along with enhanced penetration of electric vehicles can reduce the transport-related emissions significantly. The heavy and light commercial (diesel) vehicles together contribute ∼40 %–50 % of the road transport emissions, considering which, strict implementation of BS-VI norms needs to be applied.
- (b)
Vehicles from surrounding states or regions play a significant role, where the average low traffic speed on major roads is the cause of the elevated emission of pollutants across the megacity; thus, a similar stringent vehicular policy has to be implemented in the surrounding states of Delhi too.
- (c)
Major identified roads in the megacity need road diversions in order to reduce the vehicle density, which will ultimately increase the speed of vehicles and will reduce the emission load from tailpipes.
- (d)
Flexible office hours and work-from-home culture could be an alternative approach to reduce traffic congestion and, at the same time, will increase the average speed of vehicles and will result in an associated reduction in emissions.
- (e)
In order to reduce the impact of silt load, road shoulders must be repaired at regular intervals to avoid impaired and fractured ways. A similar approach should be adopted around the outskirts of Delhi too. The road shoulders should be cleaned periodically.
- (f)
More stringent standards for both large- and small-scale industries along with better solid-fuel and fossil fuel utilization should be implemented.
- (g)
Open burring at municipal solid-waste dumping sites should be replaced with other approaches like vermi-composting, natural decomposition, or mulching and the encouragement of WTE plants.
- (h)
Slum clusters should be better penetrated by LPG-based cooking-fuel usage to discourage the use of solid fuels like wood, cow dung, and coal.
- (i)
Construction sites should properly handle materials while conducting loading and unloading procedures.
- (j)
The limited use of diesel-based DG sets in unorganized industries and commercial and private zones could potentially help reduce the emissions further.
The emission dataset can be accessed through the open-access data repository https://doi.org/10.5281/zenodo.7715595 (Sahu et al., 2023). The dataset is presented in .shp file format, covering the Delhi NCR region at a domain size of 70 km×65 km.
Present megacities are facing pressing air quality challenges in southern Asia due to a variety of individual regional sources and changing policies; therefore, the present study is an attempt to decode the understanding of the present air quality over the megacity Delhi through an ultra-fine emission inventory for 2020. This is considered to be an essential component not only to address the mitigation plan towards improving megacity air quality, but also to understand the decadal change (2010–2020) in emission patterns in the megacity Delhi and the surrounding NCR. The decadal change with changing government policies and action plans has modulated the emissions from various unattended sources. However, a single strategy alone cannot tackle the elevated air pollution issues in the Delhi NCR. A mixture of policy measures well adapted to a domain's hotspot-specific, source-specific strategies is imperative to improve air quality. The developed surface emission dataset provides every such detail and can be considered to be robust in all the terms.
SKS conceived the present idea, and PM wrote the whole paper and analyzed the data. GB provided useful discussions and suggested a conclusion.
The contact author has declared that none of the authors has any competing interests.
Publisher's note: Copernicus Publications remains neutral with regard to jurisdictional claims in published maps and institutional affiliations.
The authors acknowledge the Ministry of Earth Science, Govt. of India, for partial support through the QUISARC project. This full research work did not receive any specific grant from funding agencies in the public, commercial, or not-for-profit sectors.
This research has been supported by the Ministry of Earth Sciences (grant no. MoES/Indo-Nor/PS-10/2015).
This paper was edited by Bo Zheng and reviewed by Kanhu Charan Pattnayak and one anonymous referee.
Akimoto, H.: Global air quality and pollution, Science, 302, 1716–1719, https://doi.org/10.1126/science.1092666, 2003.
Beig, G., Srinivas, R., Parkhi, N. S., Carmichael, G. R., Singh, S., Sahu, S. K., Rathod, A., and Maji, S.: Anatomy of the winter 2017 air quality emergency in Delhi, Sci. Total Environ., 681, 305–311, https://doi.org/10.1016/j.scitotenv.2019.04.347, 2019.
Beig, G., Sahu, S. K., Singh, V., Tikle, S., Sobhana, S. B., Gargeva, P., Ramakrishna, K., Rathod, A., and Murthy, B. S.: Objective evaluation of stubble emission of North India and quantifying its impact on air quality of Delhi, Sci. Total Environ., 709, 136126, https://doi.org/10.1016/j.scitotenv.2019.136126, 2020.
Beig, G., Sahu, S. K., Anand, V., Bano, S., Maji, S., Rathod, A., Korhale, N., Sobhana, S. B., Parkhi, N., Mangaraj, P., Srinivas, R., Peshin, S. N., Singh, S., Latha, R., Shinde, R., and Trimbake, K.: India's Maiden air quality forecasting framework for megacities of divergent environments: The SAFAR-project, Environ. Modell. Softw., 145, 105204, https://doi.org/10.1016/j.envsoft.2021.105204, 2021.
Chakrabarty, R. K., Pervez, S., Chow, J. C., Watson, J. G., Dewangan, S., Robles, J., and Tian, G.: Funeral pyres in South Asia: Brown carbon aerosol emissions and climate impacts, Environ. Sci. Tech. Let., 1, 44–48, https://doi.org/10.1021/ez4000669, 2013.
Cohen, R., Sexton, K. G., and Yeatts, K. B.: Hazard assessment of United Arab Emirates (UAE) incense smoke, Sci. Total Environ., 458, 176–86, https://doi.org/10.1016/j.scitotenv.2013.03.101, 2013.
Cole-Hunter, T., Johnston, F. H., Marks, G. B., Morawska, L., Morgan, G. G., Overs, M., Porta-Cubas, A., and Cowie, C. T.: The health impacts of waste-to-energy emissions: a systematic review of the literature, Environ. Res. Lett., 15, 123006, https://doi.org/10.1088/1748-9326/abae9f, 2020.
DDA (Delhi Development Authority): Annual Report 2019–20, https://dda.gov.in/sites/default/files/Annual_Report_2019-20_English.pdf (last access: 12 June 2021), 2020.
Delhi Urban Shelter Improvement Board: List of JJ Bastis, https://delhishelterboard.in/main/wp-content/uploads/2019/10/JJBastisList675.pdf (last access: 15 April 2020), 2019.
DGCA (Directorate General of Civil Aviation): Handbook on Civil Aviation Statistics 2019–20, https://www.dgca.gov.in/digigov-portal/?page=4252/4205/sericename, last access: 12 June 2020.
DoT (Department of Telecommunications): Telecom Statistics of India. Economics Research Unit Ministry of Communications, Government of India, New Delhi, https://dot.gov.in/sites/default/files/Telecom Statistics India-2019.pdf?download=1 (last access: 5 September 2021), 2019.
Down to Earth: https://www.downtoearth.org.in/coverage/when-will-india-be-able-to-control-pollution--17950 (last access: 8 June 2022), 2015.
DPCC (Delhi Pollution Control Committee): Status of Solid Waste Management in Delhi, https://www.dpcc.delhigovt.nic.in/solidwastemanagement, last access: 15 March 2020.
GBD (Global Burden of Disease): Burden of disease from the joint effects of household and ambient air pollution for 2016. Version 2. Summary of results, World Health Organization, Geneva Switzerland, https://cdn.who.int/media/docs/default-source/air-quality-database/aqd-2018/ap_joint_effect_bod_results_may2018.pdf (last access: 9 June 2020), 2018.
Guttikunda, S. and Calori, G.: A GIS based emissions inventory at 1 km×1 km spatial resolution for air pollution analysis in Delhi, India, Atmos. Environ., 67, 101–111, https://doi.org/10.1016/j.atmosenv.2012.10.040, 2013.
HEI (Health Effects Institute): State of Global Air/2019. A special report on global exposure to air pollution and its disease burden, ISSN 2578-6873, https://www.stateofglobalair.org/sites/default/files/soga_2019_report.pdf (last access: 10 September 2020), 2019.
HEI (Health Effects Institute): State of Global Air/2020. A special report on global exposure to air pollution and its health impacts, ISSN 2578-6873, https://www.stateofglobalair.org/, last access: 14 September 2020.
India Today: Air quality worsens in Delhi with onset of winter, “severe” in Noida, https://www.indiatoday.in/india/story/air-quality-worsens-delhi-onset-of-winter-severe-category-noida- 2303441-2022-11-30, last access: 30 November 2022.
IPCC (Intergovernmental Panel on Climate Change): Special Report on Emissions Scenarios, ISBN 0-521-80081, https://www.ipcc.ch/report/emissions-scenarios/ (last access: 27 April 2021), 2000.
Jaiprakash, Habib, G., Kumar, A., Sharma, A., and Haider, M.: On-road emissions of CO, CO2, and NOx from four wheeler and emission estimates for Delhi, J. Environ. Sci., 53, 39–47, https://doi.org/10.1016/j.jes.2016.01.034, 2016.
Kumar, R., Gupta, N., Kumar, D., Mavi, A. K., Singh, K., and Kumar, M.: Monitoring of indoor particulate matter during burning of mosquito coil, incense sticks and dhoop, Indian Journal of Allergy, Asthma and Immunology, 28, 68–73, https://doi.org/10.4103/0972-6691.140770, 2014.
Li, L., Maher, K., Navarre-Sitchler, A., Druhan, J., Meile, C., Lawrence, C., Moore, J., Perdrial, J., Sullivan, P., Thompson, A., Jin, L., Bolton, E. W., Brantley, S. L., Dietrich, W. E., Mayer, K. U., Steefel, C. I., Valocchi, A., Zachara, J., Kocar, B., Mcintosh, J., Tutolo, B. M., Kumar, M., Sonnenthal, E., Bao, C., and Beisman, J.: Expanding the role of reactive transport models in critical zone processes, Earth-Sci. Rev., 165, 280–301, https://doi.org/10.1016/j.earscirev.2016.09.001, 2017.
Mangaraj, P., Sahu, S. K., Beig, G., and Samal, B.: Development and assessment of inventory of air pollutants that deteriorate air quality in Indian Megacity Bengaluru, J. Clean. Prod., 360, 132209, https://doi.org/10.1016/j.jclepro.2022.132209, 2022a.
Mangaraj, P., Sahu, S. K., Beig, G., and Yadav, R.: A comprehensive high-resolution gridded emission inventory of anthropogenic sources of air pollutants in Indian megacity Kolkata, SN Appl. Sci., 4, 117, https://doi.org/10.1007/s42452-022-05001-3, 2022b.
Manisalidis, I., Stavropoulou, E., Stavropoulos, A., and Bezirtzoglou, E.: Environmental and Health Impacts of Air Pollution: A Review, Front. Public Health, 8, 14, https://doi.org/10.3389/fpubh.2020.00014, 2020.
Ministry of Civil Aviation: Annual Report 2019–20, https://www.civilaviation.gov.in/sites/default/files/annual-report-2019-2020.pdf, last access: 12 June 2020.
Mishra, D. and Goyal, P.: Quantitative Assessment of the Emitted Criteria Pollutant in Delhi Urban Area, Aerosol Air Qual. Res., 15, 1601–1612, https://doi.org/10.4209/aaqr.2014.05.0104, 2015.
Molina, L. T., Molina, M. J., Slott, R. S., Kolb, C. E., Gbor, P. K., Meng, F., Singh, R. B., Galvez, O., Sloan, J. J., Anderson, W. P., Tang, X., Hu, M., Xie, S., Shao, M., Zhu, T., Zhang, Y. H., Gurjar, B. R., Artaxo, P. E., Oyola, P., Gramsch, E., Hidalgo, D., and Gertler, A. W.: Air Quality in Selected Megacities, J. Air Waste Manage., 54, 1–73, https://doi.org/10.1080/10473289.2004.10471015, 2004.
Molina, M. J. and Molina, L. T.: Megacities and Atmospheric Pollution, J. Air Waste Manage., 54, 644–680, https://doi.org/10.1080/10473289.2004.10470936, 2004.
MoRTH (Ministry of Road Transport and Highways): Annual Report 2019–20, https://www.morth.nic.in/, last access: 11 September 2020.
MoRTH (Ministry of Road Transport and Highways, Government of India): Notification. G. S. R. 653(E), The Gazette of India: Extraordinary [Part II – Sect. 3(i)], Ministry of Road Transport and Highways, Government of India, New Delhi, India, https://morth.nic.in/Circulars-Notifications-related-to-Vehicle-Scrapping-Policy, last access: 21 December 2021.
NEERI (National Environmental Engineering Research Institute): Air Quality Monitoring, Emission Inventory & Source Apportionment Studies for Delhi, https://cpcb.nic.in/displaypdf.php?id=RGVsaGkucGRm (last access: 21 February 2020), 2010.
Permadi, D. A., Kim Oanh, N. T., and Vautard, R.: Integrated emission inventory and modeling to assess distribution of particulate matter mass and black carbon composition in Southeast Asia, Atmos. Chem. Phys., 18, 2725–2747, https://doi.org/10.5194/acp-18-2725-2018, 2018.
PWD (Public Works Department): Road and Building Construction Works, https://www.pwddelhi.gov.in/Home/ProjectProgress?pwd=Tg3814v+U9lMV5dBcmZueR/JLRTSNPoIqdU52zWDuaG5M+Um4MKP/xsb5s6WOV9t, last access: 12 June 2020.
Rainfall Statistics of India: Hydromet Division, Indian Meteorological Department, Lodi Road, New Delhi, Report No. MoES/IMD/HS/RAINFALL REPORT/30, http://hydro.imd.gov.in/hydrometweb/(S(k1llxc451oipskqly0iiwv55))/PRODUCTS/Publications/Rainfall%20Statistics%20of%20India%20-%202019/Rainfall%20Statistics%20of%20India%20-%202019.pdf, (last access: 15 August 2020), 2019.
SAFAR-Delhi-2010: Development of High Resolution Emission Inventory for National Capital Region Delhi, Ministry of Earth Sciences, Govt. of India, Special Scientific Report, SAFAR-2010A, http://safar.tropmet.res.in/source.pdf (last access: 1 September 2022), 2010.
SAFAR-Delhi-2018: SAFAR-High Resolution Emission Inventory of Megacity Delhi 2018. Ministry of Earth Sciences, Govt. of India, Special Scientific Report, SAFAR-Delhi-2018A, ISSN 0252-1075, http://safar.tropmet.res.in/source.pdf (last access: 1 September 2022), 2018.
Sahu, S. K., Beig, G., and Parkhi, N. S.: Emissions inventory of anthropogenic PM2.5 and PM10 in Delhi during Commonwealth Games 2010, Atmos. Environ., 45, 6180–6190, https://doi.org/10.1016/j.atmosenv.2011.08.014, 2011.
Sahu, S. K., Beig, G., and Parkhi, N.: High Resolution Emission Inventory of NOx and CO for Mega City Delhi, India, Aerosol Air Qual. Res., 15, 1137–1144, https://doi.org/10.4209/aaqr.2014.07.0132, 2015.
Sahu, S. K., Mangaraj, P., Beig, G., Samal, A., Pradhan, C., Dash, S., and Tyagi, B.: Quantifying the high resolution seasonal emission of air pollutants from crop residue burning in India, Environ. Pollut., 286, 117165, https://doi.org/10.1016/j.envpol.2021.117165, 2021.
Sahu, S. K., Mangaraj, P., and Beig, G.: Gridded Surface Emission Data for Delhi-NCR, Version V2, Zenodo [data set], https://doi.org/10.5281/zenodo.7715595, 2023.
Sharma, G., Sinha, B., Pallavi, Hakkim, H., Chandra, B. P., Kumar, A., and Sinha, V.: Gridded Emissions of CO, NOx, SO2, CO2, NH3, HCl, CH4, PM2.5, PM10, BC, and NMVOC from Open Municipal Waste Burning in India, Environ. Sci. Technol., 53, 4765–4774, https://doi.org/10.1021/acs.est.8b07076, 2019.
Sharma, M. and Dikshit, O.: Comprehensive Study on Air Pollution and Green House Gases (GHGs) in Delhi, https://cerca.iitd.ac.in/uploads/Reports/1576211826iitk.pdf (last access: 5 September 2022), 2016.
Sindhwani, R., Goyal, P., Kumar, S., and Kumar, A.: Anthropogenic Emission Inventory of Criteria Air Pollutants of an Urban Agglomeration – National Capital Region (NCR), Delhi, Aerosol Air Qual. Res., 15, 1681–1697, https://doi.org/10.4209/aaqr.2014.11.0271, 2015.
Singh, V., Sahu, S. K., Kesarkar, A. P., and Biswal, A.: Estimation of high resolution emissions from road transport sector in a megacity Delhi, Urban Climate, 26, 109–120, https://doi.org/10.1016/j.uclim.2018.08.011, 2018.
Stanaway, J. D., Afshin, A., Gakidou, E., et al.: Global, regional, and national comparative risk assessment of 84 behavioural, environmental and occupational, and metabolic risks or clusters of risks for 195 countries and territories, 1990–2017: a systematic analysis for the Global Burden of Disease Study 2017, Lancet, 392, 1923–1994, https://doi.org/10.1016/S0140-6736(18)32225-6, 2018.
TERI (The Energy and Resources Institute) and ARAI (The Automotive Research Association of India): Source Apportionment of PM2.5 & PM10 of Delhi NCR for Identification of Major Sources, https://www.teriin.org/sites/default/files/2018-08/Report_SA_AQM-Delhi-NCR_0.pdf (last access: 17 February 2022), 2018.
Transport Department, Govt. of Delhi: https://transport.delhi.gov.in/ (last access: 15 February 2023), 2019.
UNEP (United Nations Environment Programme): Air Pollution in Asia and the Pacific: Science-based solutions, ISBN 978-92-807-3725-7, https://wedocs.unep.org/20.500.11822/26861 (last access: 8 February 2022), 2019.
World Air Quality Report: Region & City PM2.5 Ranking, https://www.iqair.com/world-most-polluted-cities/world-air-quality-report-2019-en.pdf (last access: 8 February 2022), 2019.
World Air Quality Report: Region & City PM2.5 Ranking, https://www.iqair.com/world-most-polluted-cities/world-air-quality-report-2020-en.pdf (last access: 10 February 2022), 2020.