the Creative Commons Attribution 4.0 License.
the Creative Commons Attribution 4.0 License.
 | 10 Jul 2023
Past and future discharge and stream temperature at high spatial resolution in a large European basin (Loire basin, France)
Hanieh Seyedhashemi
Florentina Moatar
Jean-Philippe Vidal
Dominique Thiéry
This paper presents retrospective simulations (1963–2019) and future projections (1976–2100) of daily time series of discharge and stream temperature for 52 278 reaches (median length of 1.3 km) over the Loire River basin (105 km2) in France, using a physical process-based thermal model coupled with a semi-distributed hydrological model. Retrospective simulations are based on the 8 km gridded Safran meteorological reanalysis over France. Twenty-first century projections are based on a subset of the 8 km gridded and bias-corrected DRIAS-2020 dataset over France. The discharge and stream temperature dataset stands out from existing ones thanks to its large scale and its high spatial resolution and the use of a physical process-based thermal model. The whole dataset is freely available and can be downloaded in NetCDF format from https://doi.org/10.57745/LBPGFS (Seyedhashemi et al., 2022a).
- Article
(5418 KB) - Full-text XML
-
Supplement
(855 KB) - BibTeX
- EndNote


Stream (water) temperature (Tw) is a critical parameter affecting the eutrophication of water bodies (Minaudo et al., 2018; Le Moal et al., 2019; Zhao et al., 2022), a wide range of biogeochemical processes (Ouellet et al., 2020), and the life cycle (Elliott and Elliott, 2010) and spatial distribution of aquatic organisms (Cox and Rutherford, 2000; Morales-Marín et al., 2019; Picard et al., 2022). Recent evidence suggests the worldwide rise in this critical parameter due to climate change over the past decades (e.g., Moatar and Gailhard, 2006; Orr et al., 2015; Arora et al., 2016; Michel et al., 2020; Seyedhashemi et al., 2022b), which is also anticipated to continue in the future (e.g., Kwak et al., 2017; Carlson et al., 2017; Seixas et al., 2018; Du et al., 2019; Lee et al., 2020; Piotrowski et al., 2021; Michel et al., 2022). However, missing continuous long-term Tw data at a large scale over the past (Nelson and Palmer, 2007; Webb et al., 2008; Arora et al., 2016) has limited our understanding of large-scale controlling factors and spatio-temporal variability of thermal regimes and of the impacts of such a variability on stream ecosystems in light of climate change (Hannah and Garner, 2015).
To overcome the lack of Tw data and to understand how the thermal regime responds to the climate change, physically-based, or deterministic, models can be used (Dugdale et al., 2017). These models simulate and project Tw dynamics through a heat budget, accounting for energy exchanges and effects of landscape characteristics on energy transfer (Sinokrot et al., 1995; Webb and Walling, 1997; Yearsley, 2009; van Vliet et al., 2013; Beaufort et al., 2016b). Depending on the input data, these models can be run at different temporal resolution and spatial scales, ranging from small streams to large rivers (Dugdale et al., 2017). The outputs of these models allow detecting past and future changes in rivers' thermal regimes and exploring the influence of hydroclimatic – i.e., air temperature (Ta) and discharge (Q) – and basin drivers on such changes (see recent studies: e.g., Seyedhashemi et al., 2022b; Michel et al., 2022). For example, Seyedhashemi et al. (2022b), using a physical process-based thermal model, found that Tw increased faster than air temperature over the past recent decades and attributed such an increase in Tw to the increase in Ta and decrease in Q. They also found the greatest increase in large rivers, while riparian shading mitigated the increase in Tw in small mountainous streams. Additionally, climate-induced changes in Tw could also help us to predict the vulnerability of aquatic species to climate change (Lee et al., 2020).
This paper, using outputs of the 1-D Temperature-NETwork (T-NET) physical process-based thermal model coupled with the EROS semi-distributed hydrological model, presents daily time series of Q and Tw from the past to future at the reach scale over the Loire River basin (105 km2), one of the largest in Europe. EROS and daily Q data are presented in Sect. 2. T-NET and daily Tw data are presented in Sect. 3. Although the time series of both Q and Tw are available for the whole year, here, data description is mostly focused on the June to August months (hereafter referred to as summer); the time of the year which is crucial for the survival (Steel et al., 2017), growth, and migration of aquatic communities (Arevalo et al., 2020). Note that a part of retrospective simulations has also been previously commented on by Seyedhashemi et al. (2022b).
2.1 Principles and input data of EROS
EROS is a semi-distributed hydrological model which simulates daily discharge at the outlet of 368 homogeneous (with respect to land use and geology) sub-basins for the Loire River basin (see Fig. 1). At the outlet of each sub-basin, the water balance is modeled by a lumped model using three reservoirs (see Fig. S2 in the Supplement of Seyedhashemi et al., 2022b) and a routing function for propagation across sub-basins. To reconstruct daily Q at the sub-basin outlets (“Retrospective simulations” in Fig. 1), EROS uses daily air temperature (Ta in ∘C), precipitation (P in mm) and potential evapotranspiration (ET0 in mm) computed with the Penman–Monteith equation (Allen et al., 1998). These meteorological data are provided by the 8 km gridded Safran atmospheric reanalysis (Quintana-Segui et al., 2008; Vidal et al., 2010) released by Météo-France (see Fig. 1) and then averaged over each sub-basin. Finally, to have daily Q at the reach scale, simulated Q at the sub-basin outlets is redistributed along the river network inside each sub-basin according to each reach drainage area (through a routine in T-NET).
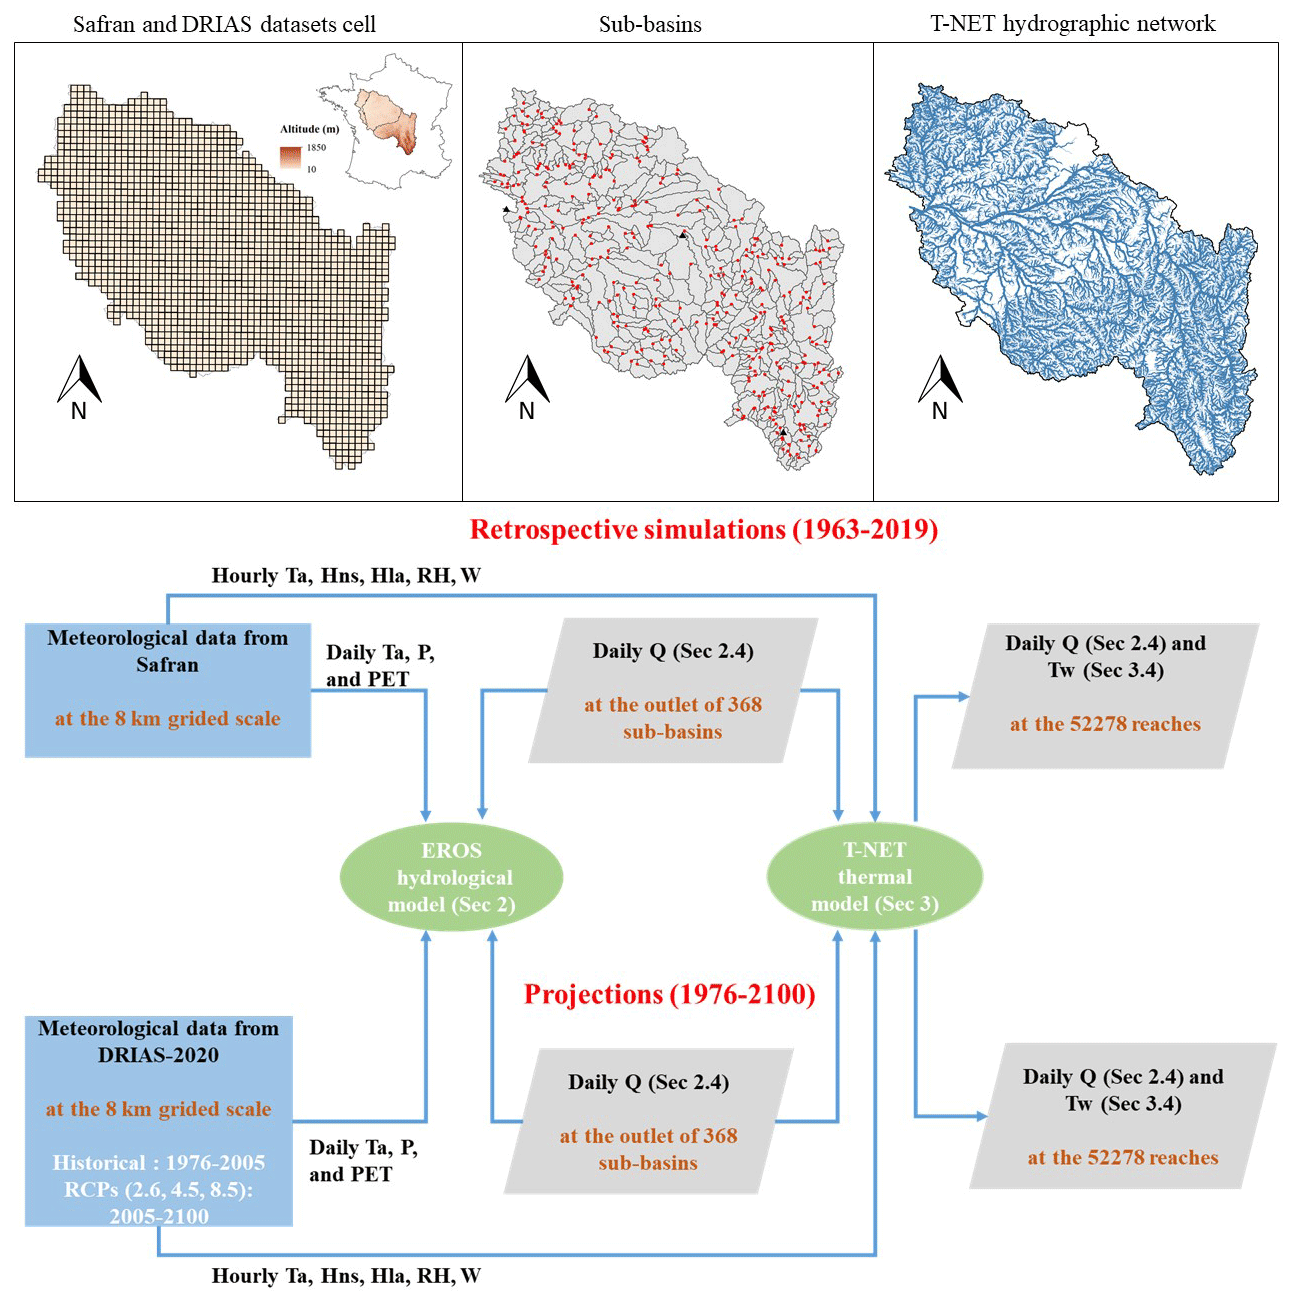
Figure 1Synthetic diagram showing the methodology of retrospective simulations and projections of daily Q and Tw over the Loire River basin as well as the spatial resolution of input data in each step. The red circles in the map of sub-basins show the outlets of 368 sub-basins, while the three black triangles show the position of sub-basin examples in the southern (L'Allier at Monistrol-d'Allier), the middle (L'Arnon at Méreau (Pont de Méreau)), and the northern part (La Loire at Montjean) of the basin used in the text.
2.2 Calibration and validation of EROS
EROS had been calibrated over 1974–2018 to maximize the number of discharge near-natural observations, with 1971–1974 used for the warm-up. The calibration optimized all unknown parameters (soil capacity, recession times, and propagation times) through maximizing the Nash–Sutcliffe efficiency (NSE) criterion on the square root of discharge and minimizing the overall bias (see Seyedhashemi et al., 2022b). Seyedhashemi et al. (2022b) validated and assessed the performance of the EROS through computing seasonal and annual relative biases, together with Nash–Sutcliffe efficiency on Q, ln (Q), and over the 1963–2019 period. In a majority of calibration stations (75 %), and stations on the French Reference Hydrometric Network (83 %), NSE is >0.7 for all Q, ln (Q), and . EROS performed well at the annual scale (median relative bias of 0 %), while it slightly underestimated winter (−6.27 %) and spring Q (−3.47 %) and overestimated summer (+34.7 %) and autumn Q (+20.9 %) (see Fig. S6 of Seyedhashemi et al., 2022b). Such an overestimation in Q over summer and autumn was attributed to the fact that EROS does not consider the influence of water abstractions and impoundments. Moreover, significant spatial correlation (p<0.05) between seasonal Q trends in retrospective simulation against observations at hydrometric stations with long-term continuous daily data were also noted (see Fig. S10 of Seyedhashemi et al., 2022b).
2.3 Projections (1976–2100)
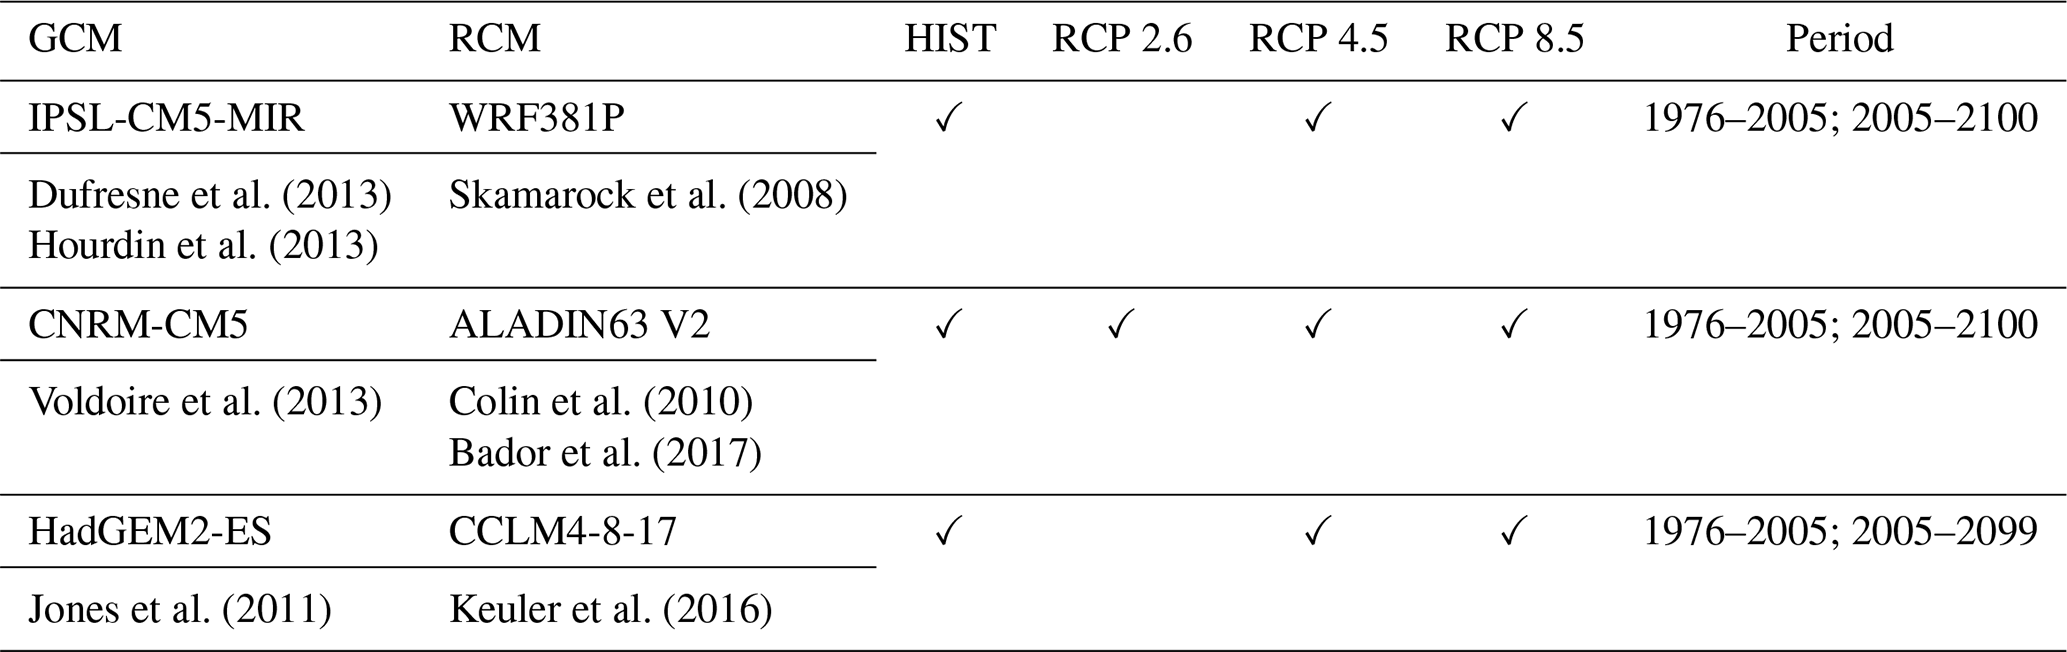
For future projections of daily Q, EROS uses meteorological data provided by the DRIAS-2020 climate projection dataset, which has been released over France through the DRIAS portal (see http://www.drias-climat.fr/, last access: 3 July 2023) (Soubeyroux et al., 2020). It comprises an ensemble of climate projections under three Representative Concentration Pathways (RCPs) used in the fifth IPCC Assessment Report (Core Writing Team et al., 2015) derived from the larger EUROCORDEX dataset using regional climate models (RCMs) over Europe. This ensemble is downscaled over France to the 8 km Safran grid and bias corrected with respect to the Safran reanalysis data with the ADAMONT method (Verfaillie et al., 2017). In this study a subset of three contrasted future climate models (GCMs–RCMs) are used to sample the dispersion of the full ensemble of 12 GCM–RCM projections from the DRIAS-2020 dataset. The three future climate models include a warm and wet couple of models (IPSL-CM5A–MRWRF381P), an intermediate one (CNRM-CM5-LR–ALADIN63), and a hot and dry couple (HadGEM2–CCLM4-8-17).
All three selected future climate models (GCMs–RCMs) include RCP 4.5 and 8.5, which are intermediate and extreme scenarios corresponding to a plausible representation of the future behavior of human societies. The CNRM-CM5-LR–ALADIN63 model also includes RCP 2.6. Therefore, the projections are conducted under seven projections in total. For each GCM–RCM, two periods are considered: (1) the period with GCMs forced by historical concentrations in greenhouse gases between 1976 and 2005, and (2) the projection part using RCPs as forcings, which extends from 2005 to 2100 (see Table 1 and projections in Figs. 1 and S1). It should be noted that, although selected projections start in the 1950s, the hydrological model in the current study is forced from the 1970s onwards.
Dufresne et al. (2013)Skamarock et al. (2008)Hourdin et al. (2013)Voldoire et al. (2013)Colin et al. (2010)Bador et al. (2017)Jones et al. (2011)Keuler et al. (2016)Table 1GCMs, RCMs, and RCPs used in the current study. More information can be found at http://www.drias-climat.fr/.
Daily Ta, P, and potential evapotranspiration (PET) provided by these seven projections are integrated into EROS. It then produces daily Q under each projection over the historical period (1976–2005) and the future (2005–2100) (“Projections” in Fig. 1). Note that PET in DRIAS-2020 is computed by a Penman–Monteith equation using a proxy for radiation (calculated by maximum and minimum Ta), in order to use neither GCM–RCM radiation nor Safran radiation for the bias correction (see http://www.drias-climat.fr/accompagnement/sections/310 for PET calculation in projections). This PET equation is therefore slightly different from the one used for calibrating EROS. Note also that EROS is calibrated and run under present land cover and land use.
To assess future projections of Q in the present day and their biases, we consider daily Q retrospective simulations (under Safran reanalysis) at the sub-basin outlets as the reference data and compare them with projections under the DRIAS-2020 dataset over the 1976–2005 summer period. The 1976–2005 period is the reference period used to correct the biases of climate projections with respect to Safran in the DRIAS-2020 dataset.
2.4 Data description over the summer period (June–August)
2.4.1 Retrospective simulation (1963–2019)
Trends in Q over the 1963–2019 period are highly variable in magnitude and direction across the basin, with decreasing Q in the southern part of the basin (in the Massif Central up to −16 % per decade) and increasing Q in the remaining parts of the basin (see Fig. 3 of Seyedhashemi et al., 2022b). Similarly, a retrospective simulation in Fig. 2 shows a decrease in summer Q for a sub-basin in the southern part, while the same variable is relatively stationary at the other two sub-basins in the middle and northern part. Seyedhashemi et al. (2022b) also found that the seasonal and annual anomalies of Q show a relatively stationary evolution with −100 % to 150 % values in summer across the basin (their Fig. S17).
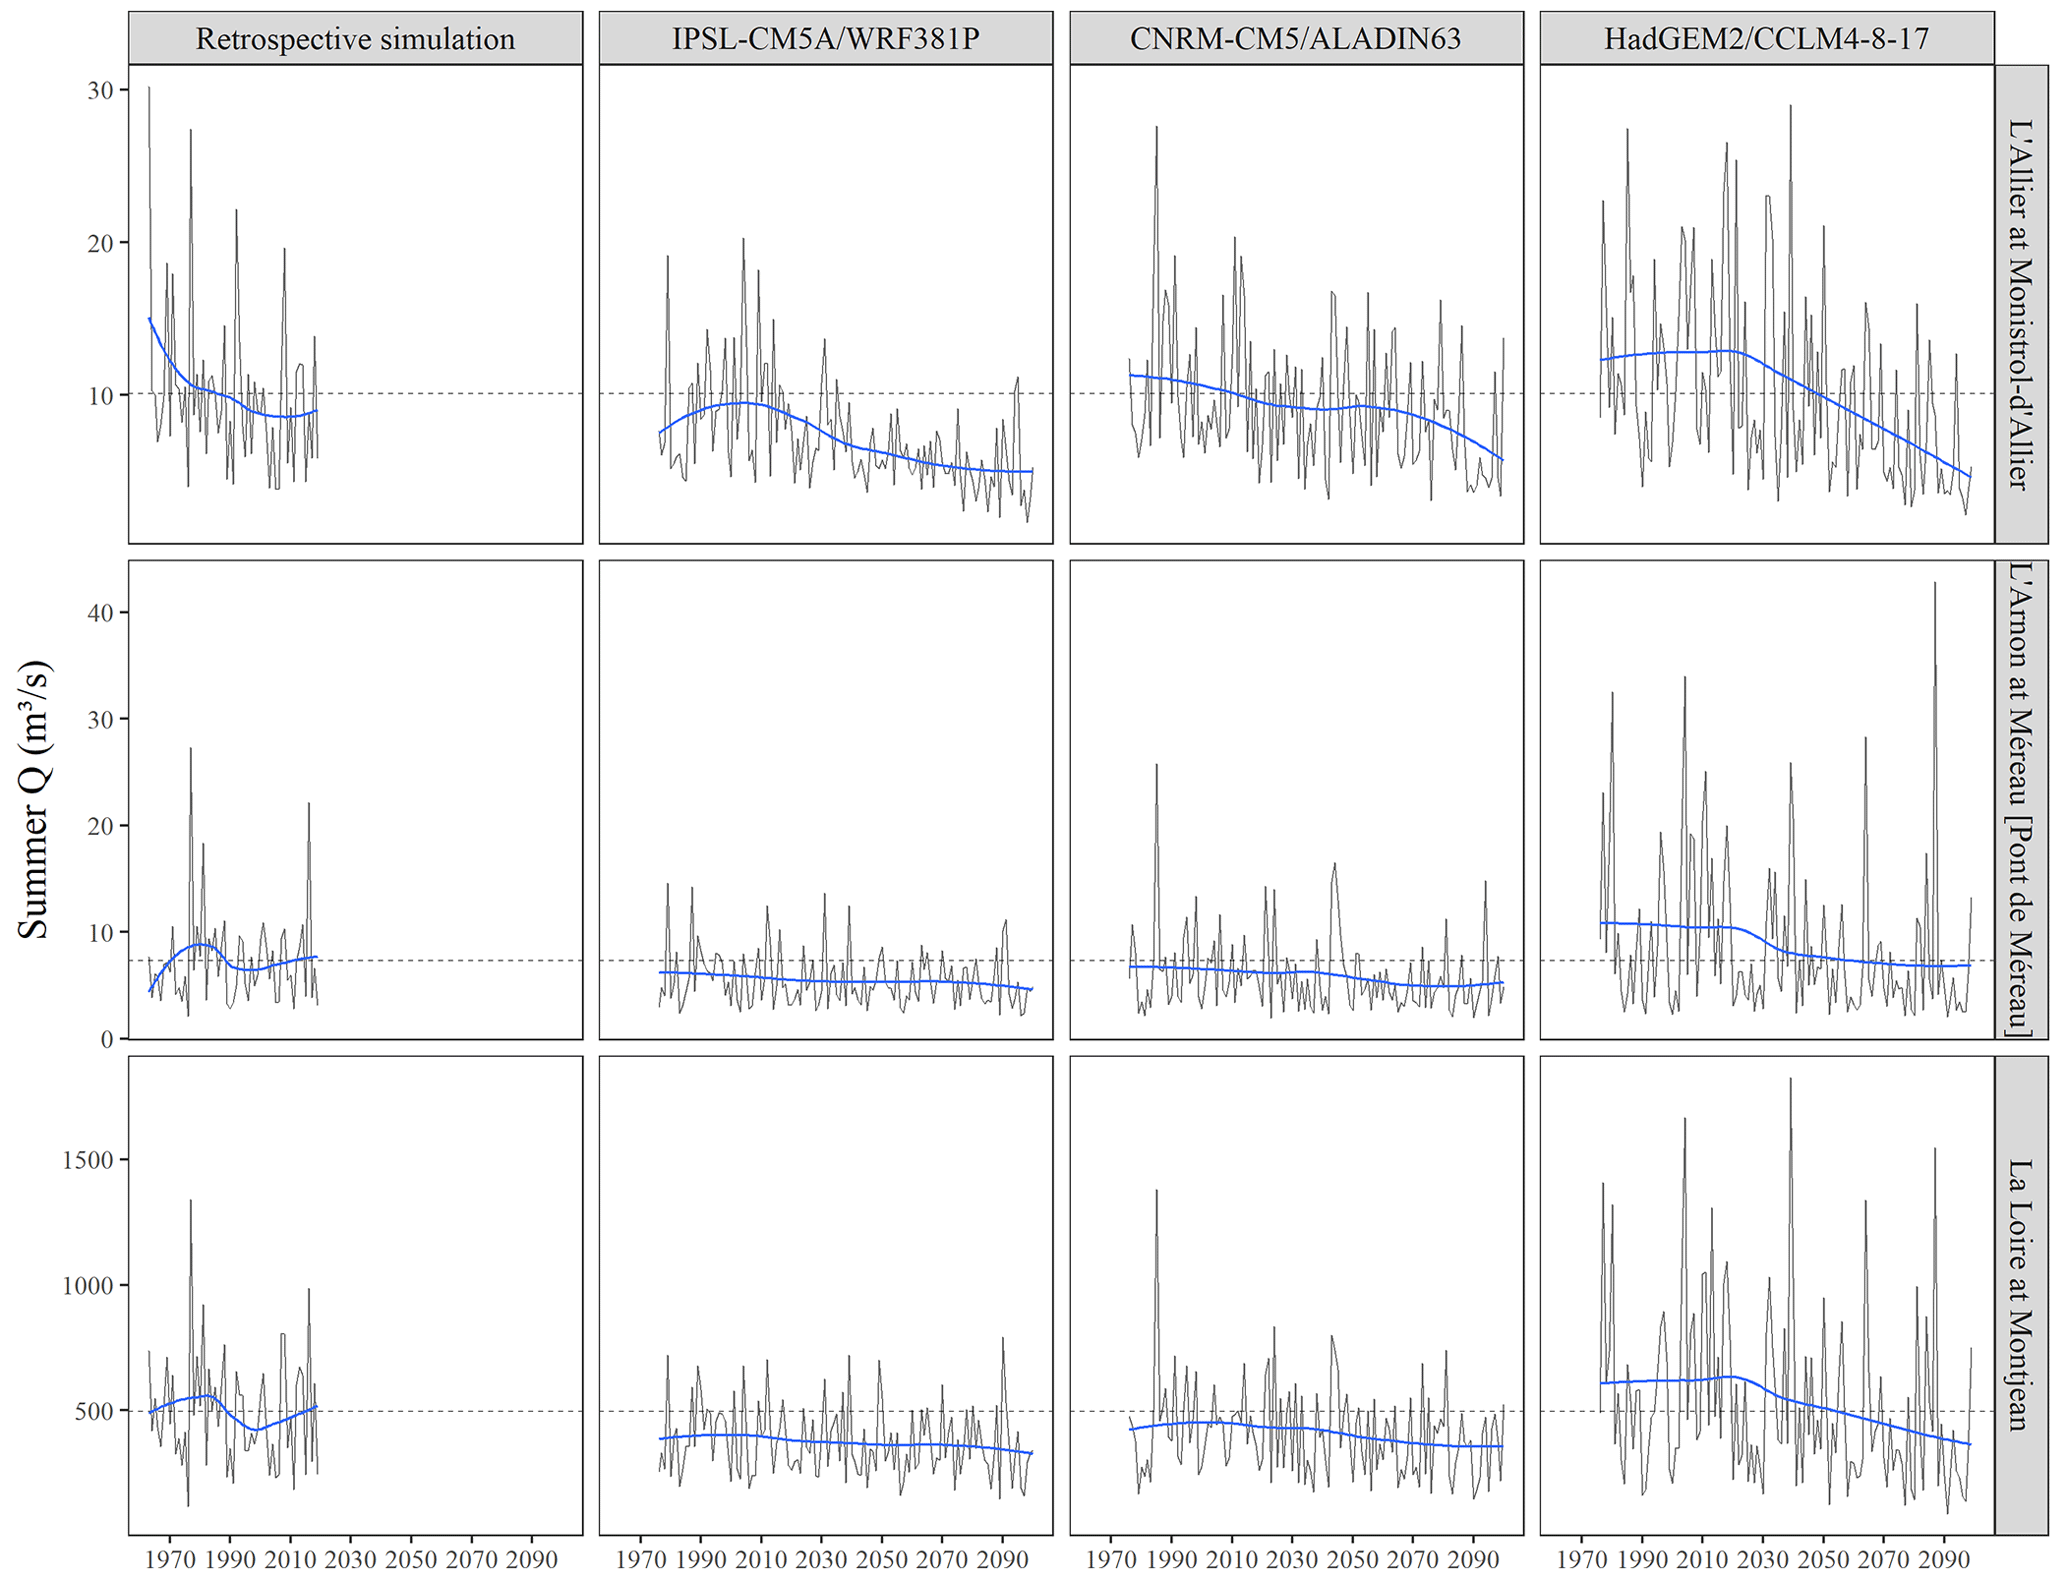
Figure 2Summer Q in retrospective simulations and projections under RCP 8.5 for three sub-basins in the southern (L'Allier at Monistrol-d'Allier), middle (L'Arnon at Méreau (Pont de Méreau)), and northern part (La Loire at Montjean) of the Loire basin as shown in Fig. 1. The dashed line represents the average of summer Q in the retrospective simulation over the 1963–2019 period. Blue lines roughly show the temporal evolution using local regression models. It should be noted that EROS performs well in reconstructing daily Q at the outlet of these three sub-basins (see Fig. S8 of Seyedhashemi et al., 2022b).
2.4.2 Projections (1976–2100)
Projections underestimate summer Q (up to −45 % depending on the GCM–RCM) mainly in the middle and north part of the basin and overestimate summer Q in the southern part of the basin (Fig. 3). An overestimation can be found over the whole basin for HadGEM2–CCLM4-8-17. Such differences between simulations and projections can be due to differences in PET calculation between the retrospective simulation and projections, as well as the specifics of the bias-correction method (Soubeyroux et al., 2020).
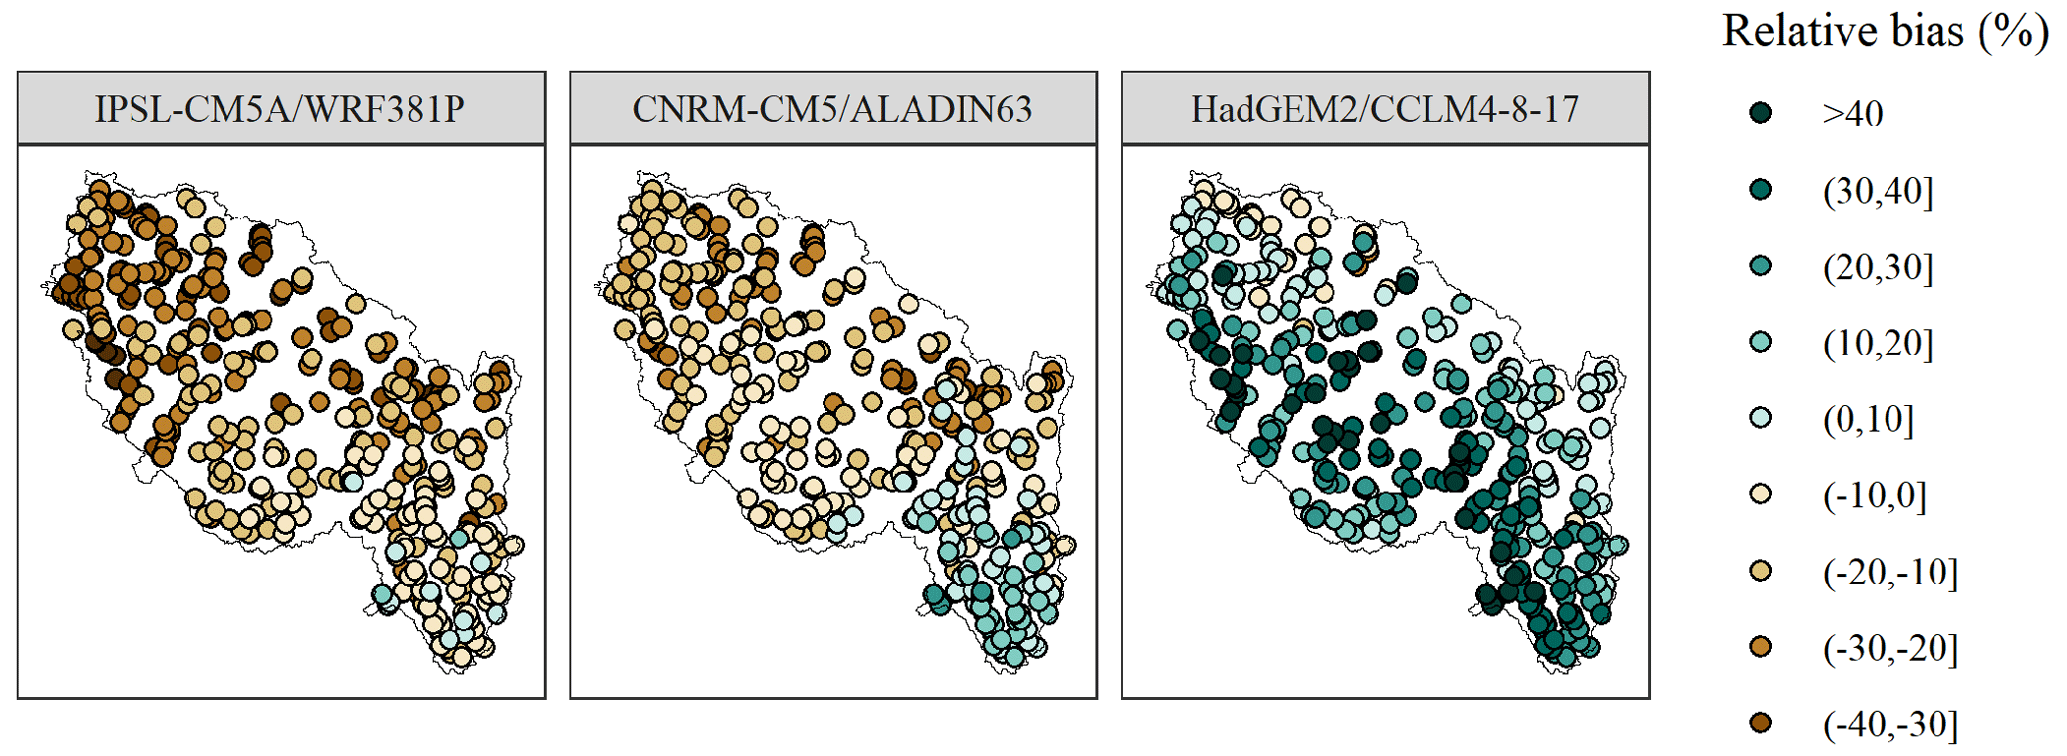
Figure 3Map of relative biases between summer Q in projections and in the retrospective simulation at the outlet of 368 sub-basins over the 1976–2005 period.
In the southern (L'Allier at Monistrol-d'Allier) and northern parts (La Loire at Montjean) of the basin, summer Q is decreasing in 21st century projections regardless of the GCM–RCM, with the largest decrease for HadGEM2–CCLM4-8-17 (Fig. 2). However, such a decrease is limited in the middle part of the basin (L'Arnon at Méreau (Pont de Méreau)). Figure 4 shows that for IPSL-CM5A–MRWRF381P, there is a north-to-south and increase-to-decrease gradient in the middle of the century (2040–2069) with respect to the present time (1990–2019) under RCP 8.5. There is also a decrease in the downstream part of the basin for HadGEM2–CCLM4-8-17 and to a lesser extent for CNRM-CM5-LR–ALADIN63. However, for the latter, an increase in summer Q is observed in some parts in the south, while for HadGEM2–CCLM4-8-17, a decrease in summer Q is projected for the whole basin with the greatest decrease in the southern part (Fig. 4).
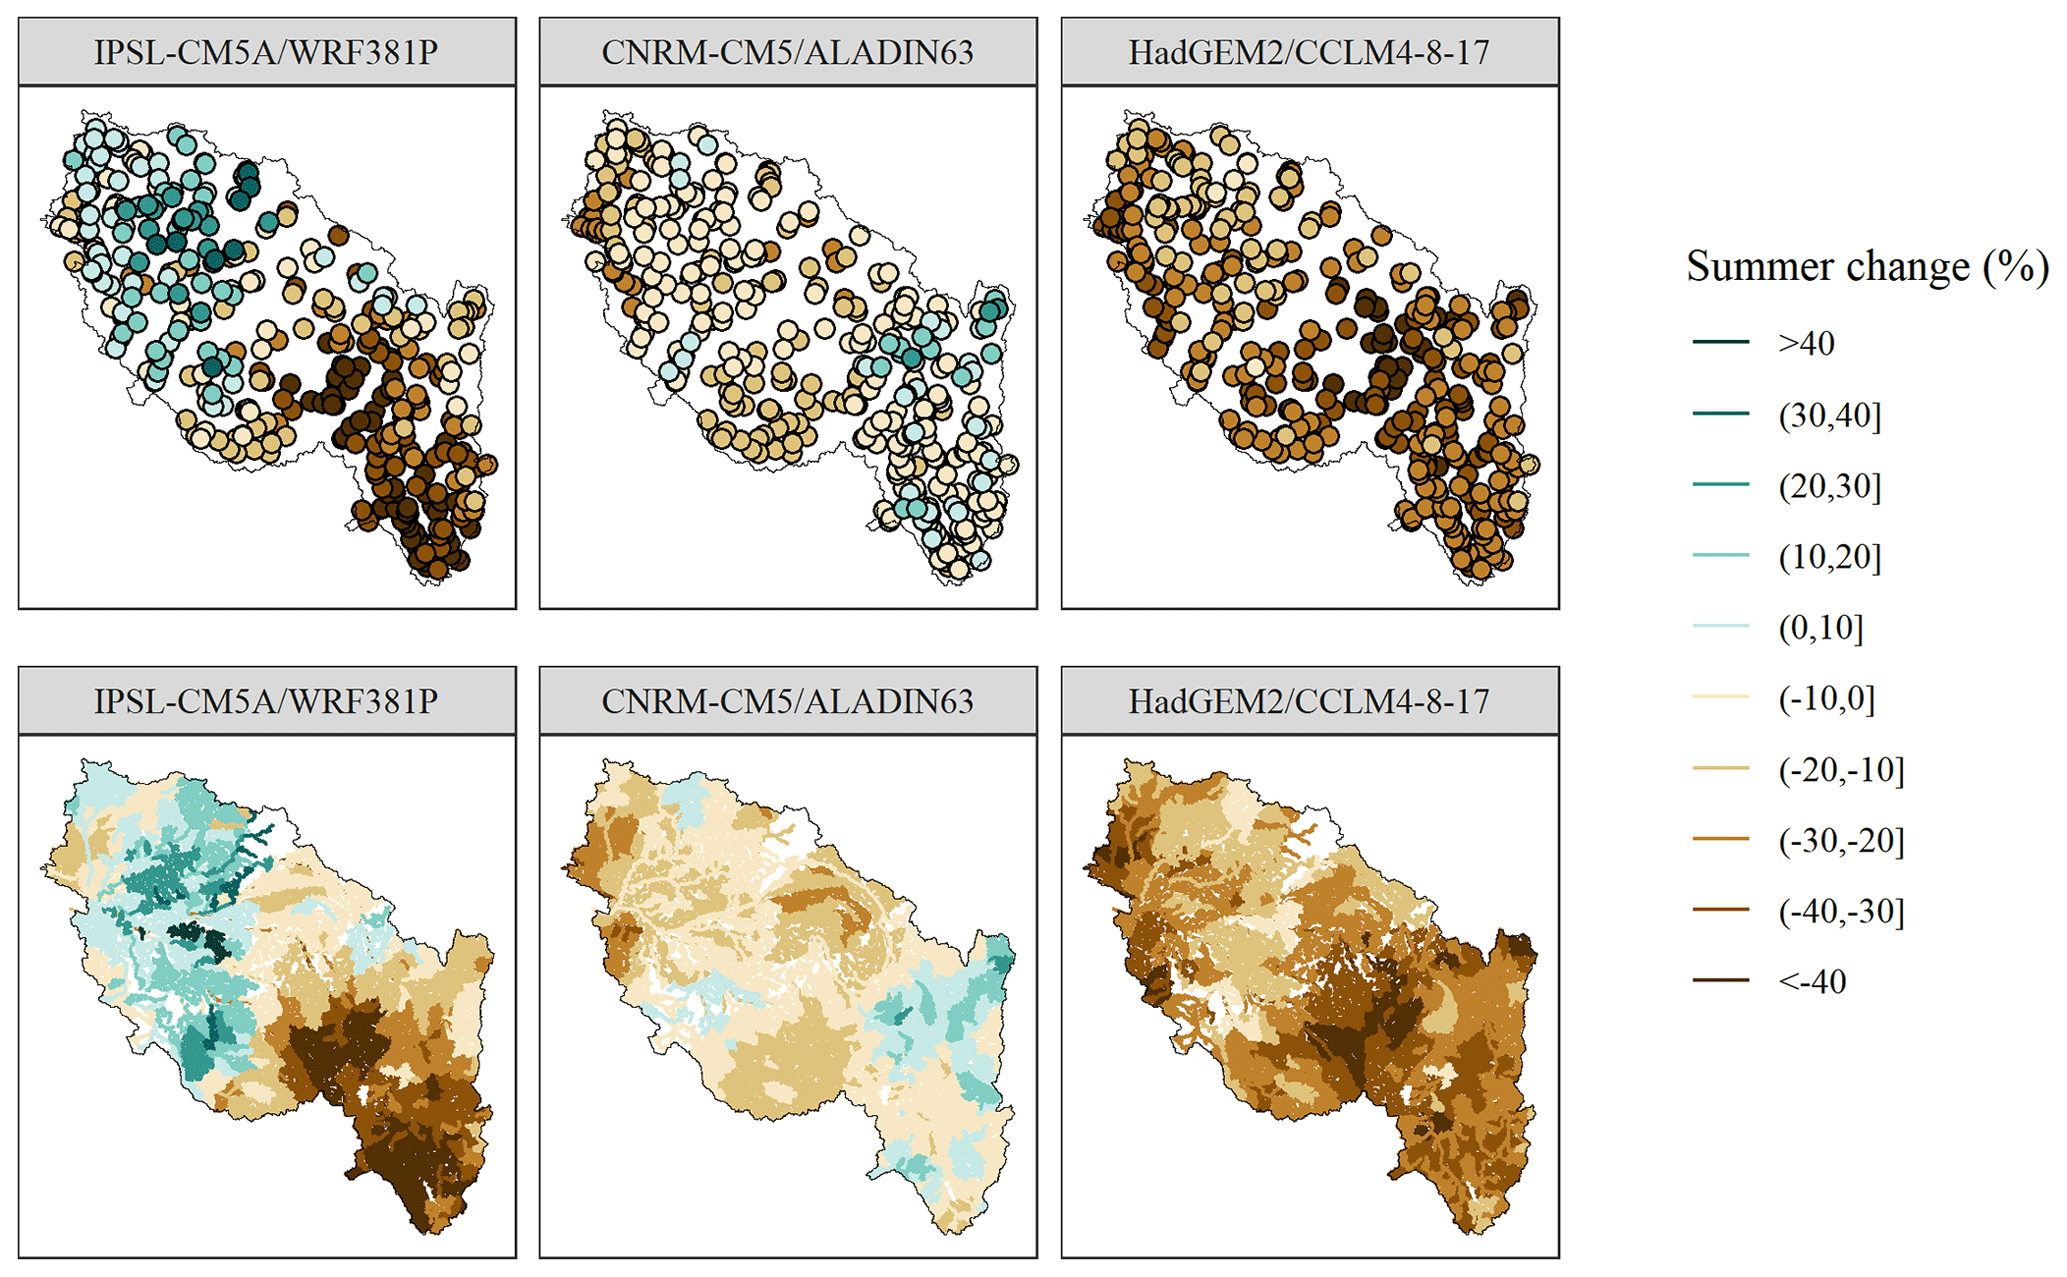
Figure 4Changes in summer Q with respect to the 1990–2019 period in the middle of the century (2040–2069) for all GCMs–RCMs under RCP 8.5 at the outlet of 368 sub-basins and at the reach scale (for 52 278 reaches).
Under RCP 8.5, the annual regime of projected Q will also be different from one GCM–RCM to another and from one sub-basin to another (see Fig. S2). For instance, at a sub-basin in the southern part of the basin (L'Allier at Monistrol-d'Allier), the highest Q is projected by HadGEM2–CCLM4-8-17 over spring, while this happens over winter for IPSL-CM5A–MRWRF381P for a northern sub-basin (La Loire at Montjean). Nevertheless, for both sub-basins, the annual regime of Q for HadGEM2–CCLM4-8-17 under RCP 8.5 shows that the low-flow period lasts longer (even until fall) compared to the other two model combinations.
3.1 Principles and input of T-NET
To estimate daily Tw for 52 278 reaches (median length of 1.3 km) over the Loire River basin, T-NET calculates the equilibrium temperature and solves the local heat budget while assuming steady-state conditions and accounting for confluence thermal signal mixing with respect to discharges. The equilibrium temperature is defined as the temperature at which the total heat fluxes at the water body is 0 (see Eqs. 1 and 2 of Beaufort et al., 2016a). The heat fluxes include net solar radiation, atmospheric longwave radiation, longwave radiation emitted from the surface water, evaporative heat flux, convective heat flux, and groundwater flux. T-NET also simulates the Tw longitudinal variation and upstream–downstream thermal propagation through water travel time (TT).
To compute the six heat fluxes and the water travel time for each reach, Q at the reach scale is used in a hydraulic geometry model assuming a rectangular river section to simulate water depth (H), width (W), and velocity (V). Then, to estimate hourly Tw at each reach, T-NET uses these estimated Q, H, W, and TT (the ratio of reach length to water velocity) as well as Ta, shortwave net solar radiation (Hns), longwave radiation (Hla), specific humidity (RH), wind velocity (W), and riparian shading (as a function of vegetation density, solar elevation angle, tree height, river width, and phonology) at an hourly time step (see Seyedhashemi et al., 2022b, for more detailed information). Meteorological variables such as Ta, Hns, Hla, RH, and W are provided by the 8 km Safran grid (see Fig. 1). All reaches within a grid cell are attributed meteorological data values for that cell. For reaches flowing through more than one grid cell, meteorological variables are weighted by the relative length of the reach within each grid cell (Seyedhashemi et al., 2022b). Finally, hourly outputs of T-NET are averaged on a daily scale to have daily Tw.
3.2 Validation of T-NET
Unlike EROS, T-NET does not have any free parameters, and hence it is not calibrated. A validation was already done by Seyedhashemi et al. (2022b) over the 2010–2014 period at 67 near-natural observational stations with continuous daily data, which were also weakly influenced by impoundments (spotted through the “thermal signatures” approach in Seyedhashemi et al., 2021). A small underestimation in seasonal Tw (median range: −0.29 to +0.15 ∘C) on large rivers was found (see Fig. S9 of Seyedhashemi et al., 2022b). Indeed, 3 % to 83 % of stations (resp. 50 % to 100 %) on small and medium (resp. large) rivers had an RMSE < 1 ∘C across seasons (see their Fig. S9, bottom panel). A significant spatial correlation between seasonal and annual Tw trends in retrospective simulations against observations was also found at Tw stations with long-term continuous daily data (see Fig. S11 of Seyedhashemi et al., 2022b). At the seasonal and annual scales, a strong temporal coherence and agreement between observations and reconstruction were also found for the four stations along the main stem of the Loire River with the long-term data (see Fig. 2 Seyedhashemi et al., 2022b).
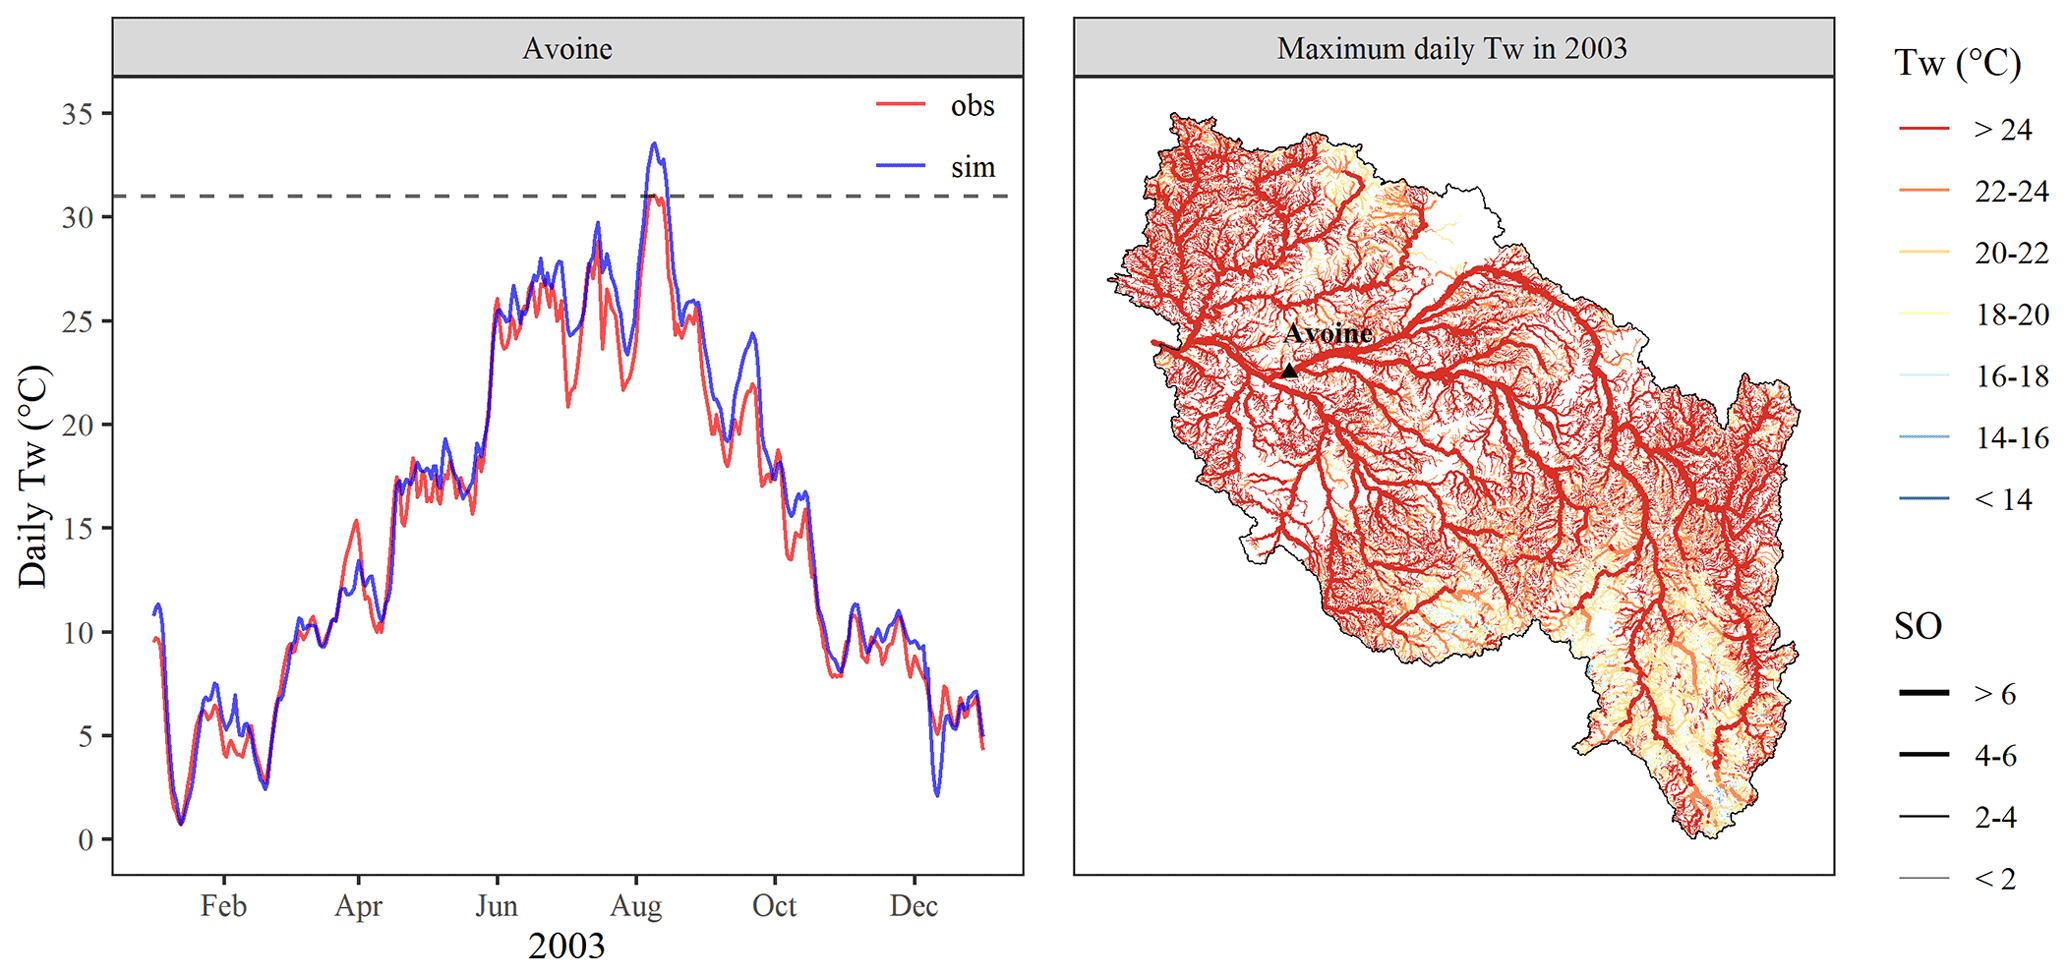
Figure 5Observed and simulated daily Tw at Avoine on the downstream part of the Loire River in 2003. The dashed line shows the maximum daily Tw over observed data at Avoine. The map of simulated maximum daily Tw in 2003 for all 52 278 reaches is also presented with the line size showing the Strahler order (SO) of the reach. The black triangle shows the position of Avoine on the Loire River.
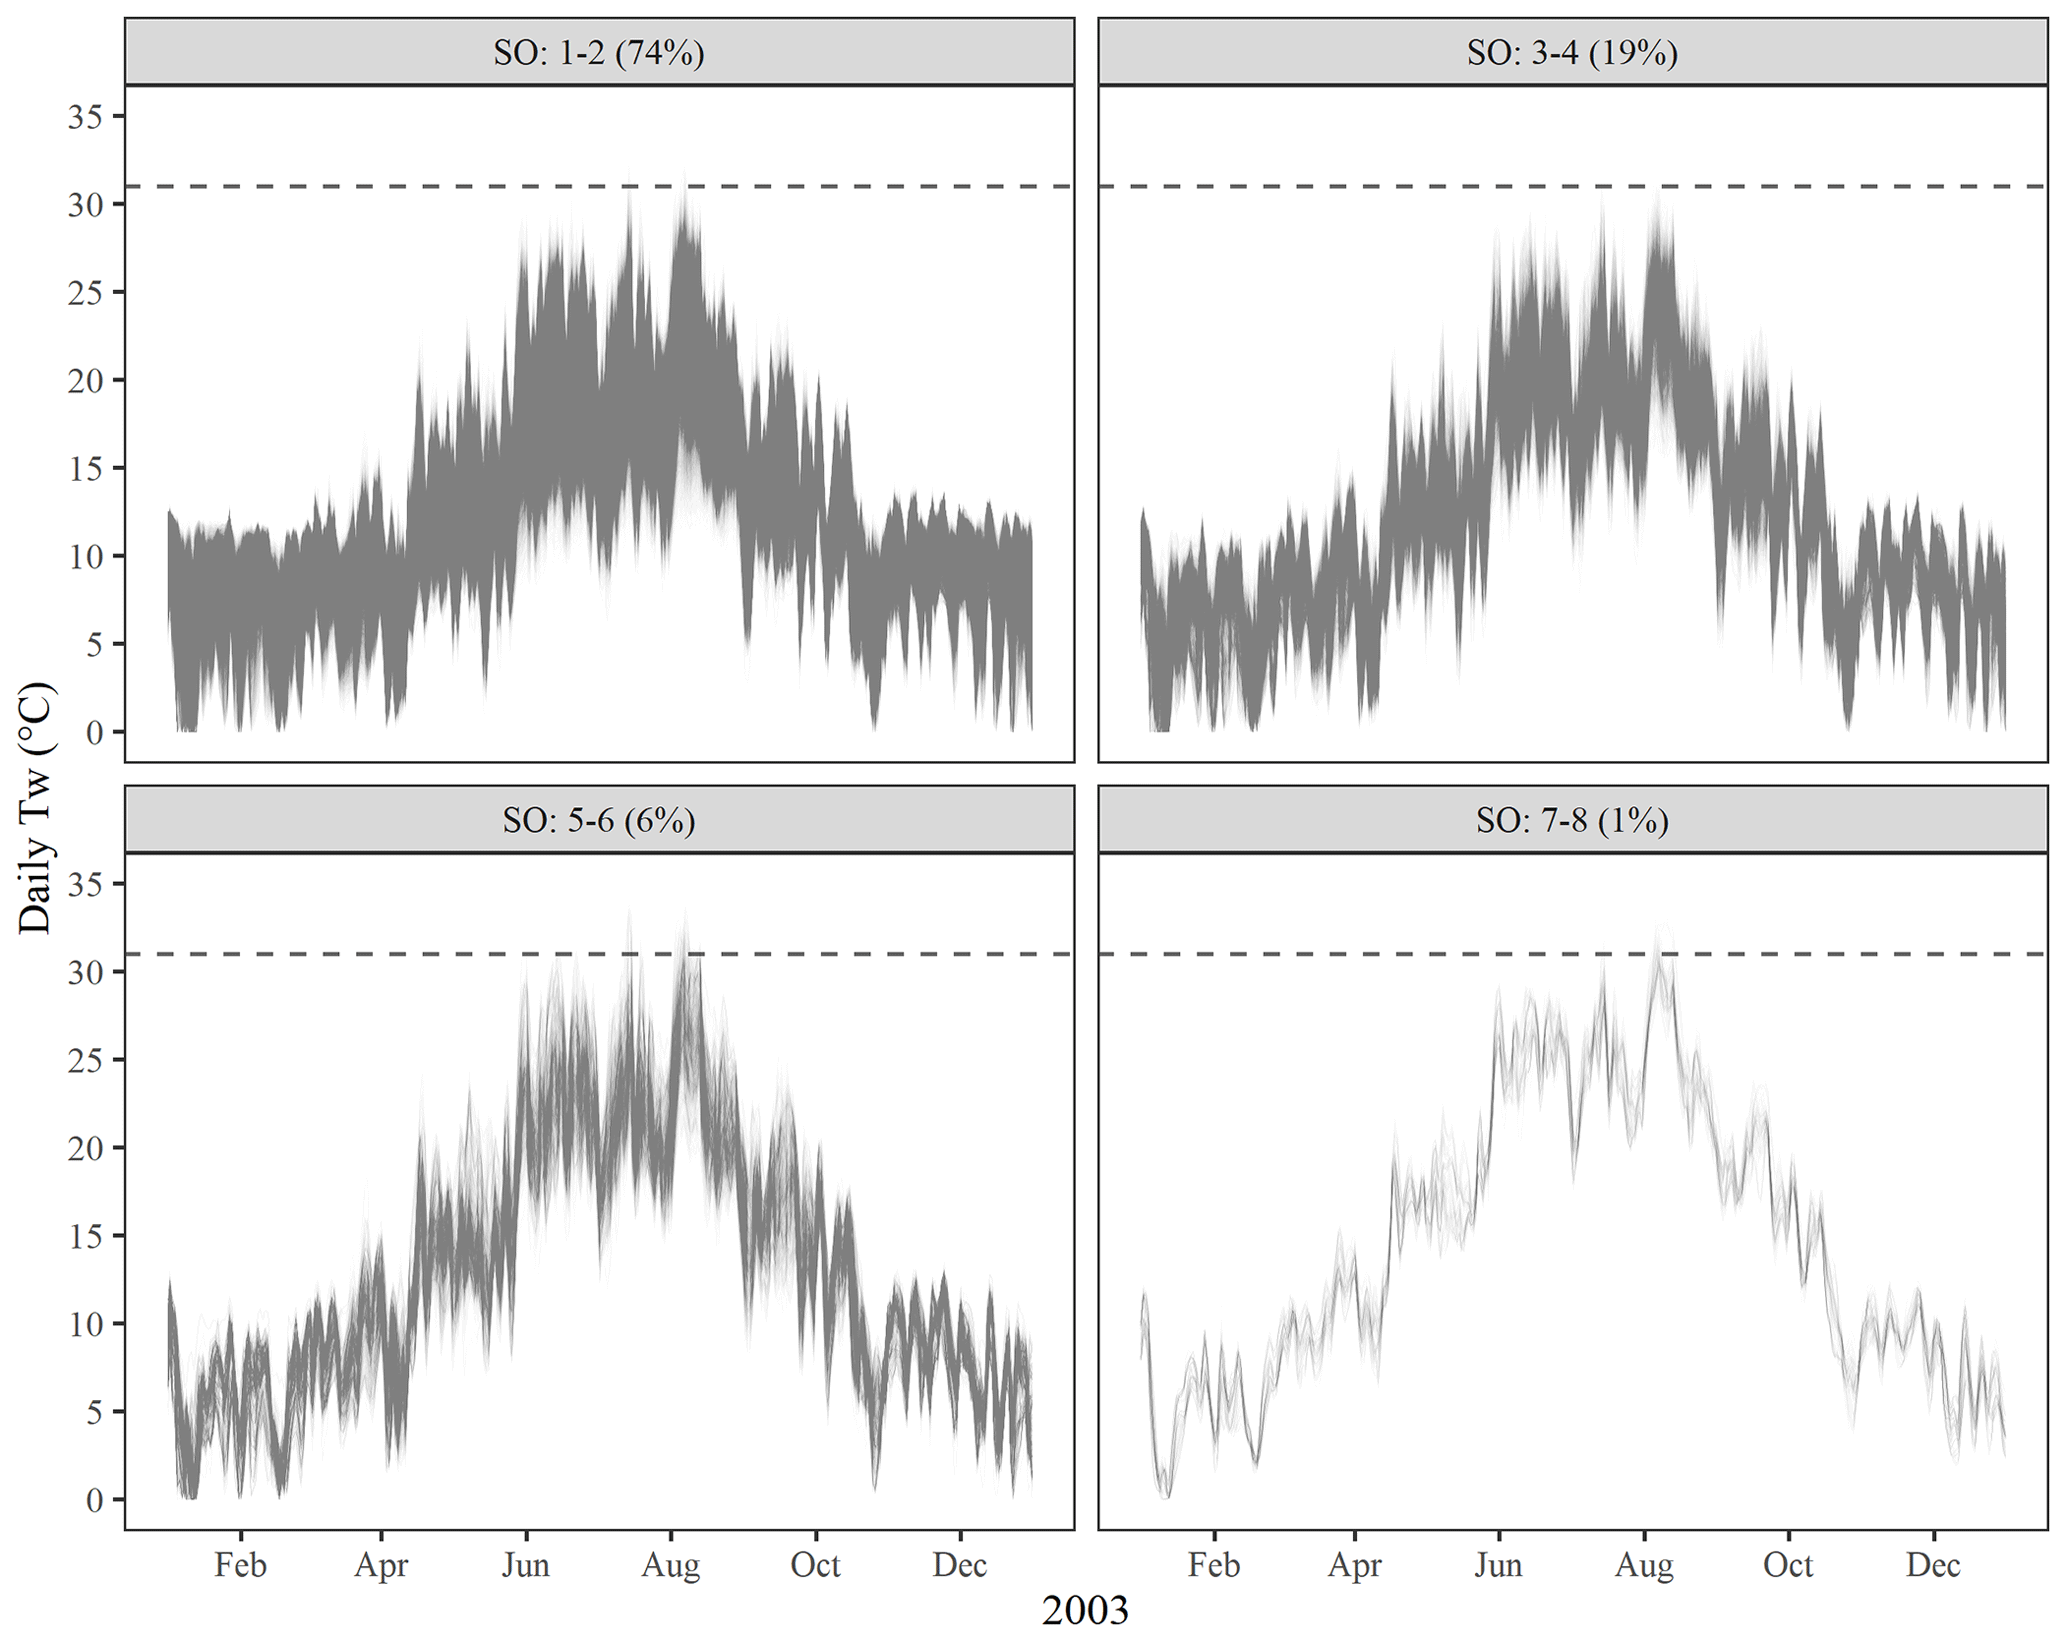
Figure 6Simulated daily Tw for reaches with different SOs in 2003. Each curve corresponds to the daily Tw time series of 1 of the 52 278 reaches in the basin. The dashed line shows the maximum observed daily Tw at Avoine on the Loire River (see Fig. 5), which is a large river with an SO ≥7. Panel titles give the percentage of reaches within each SO class.
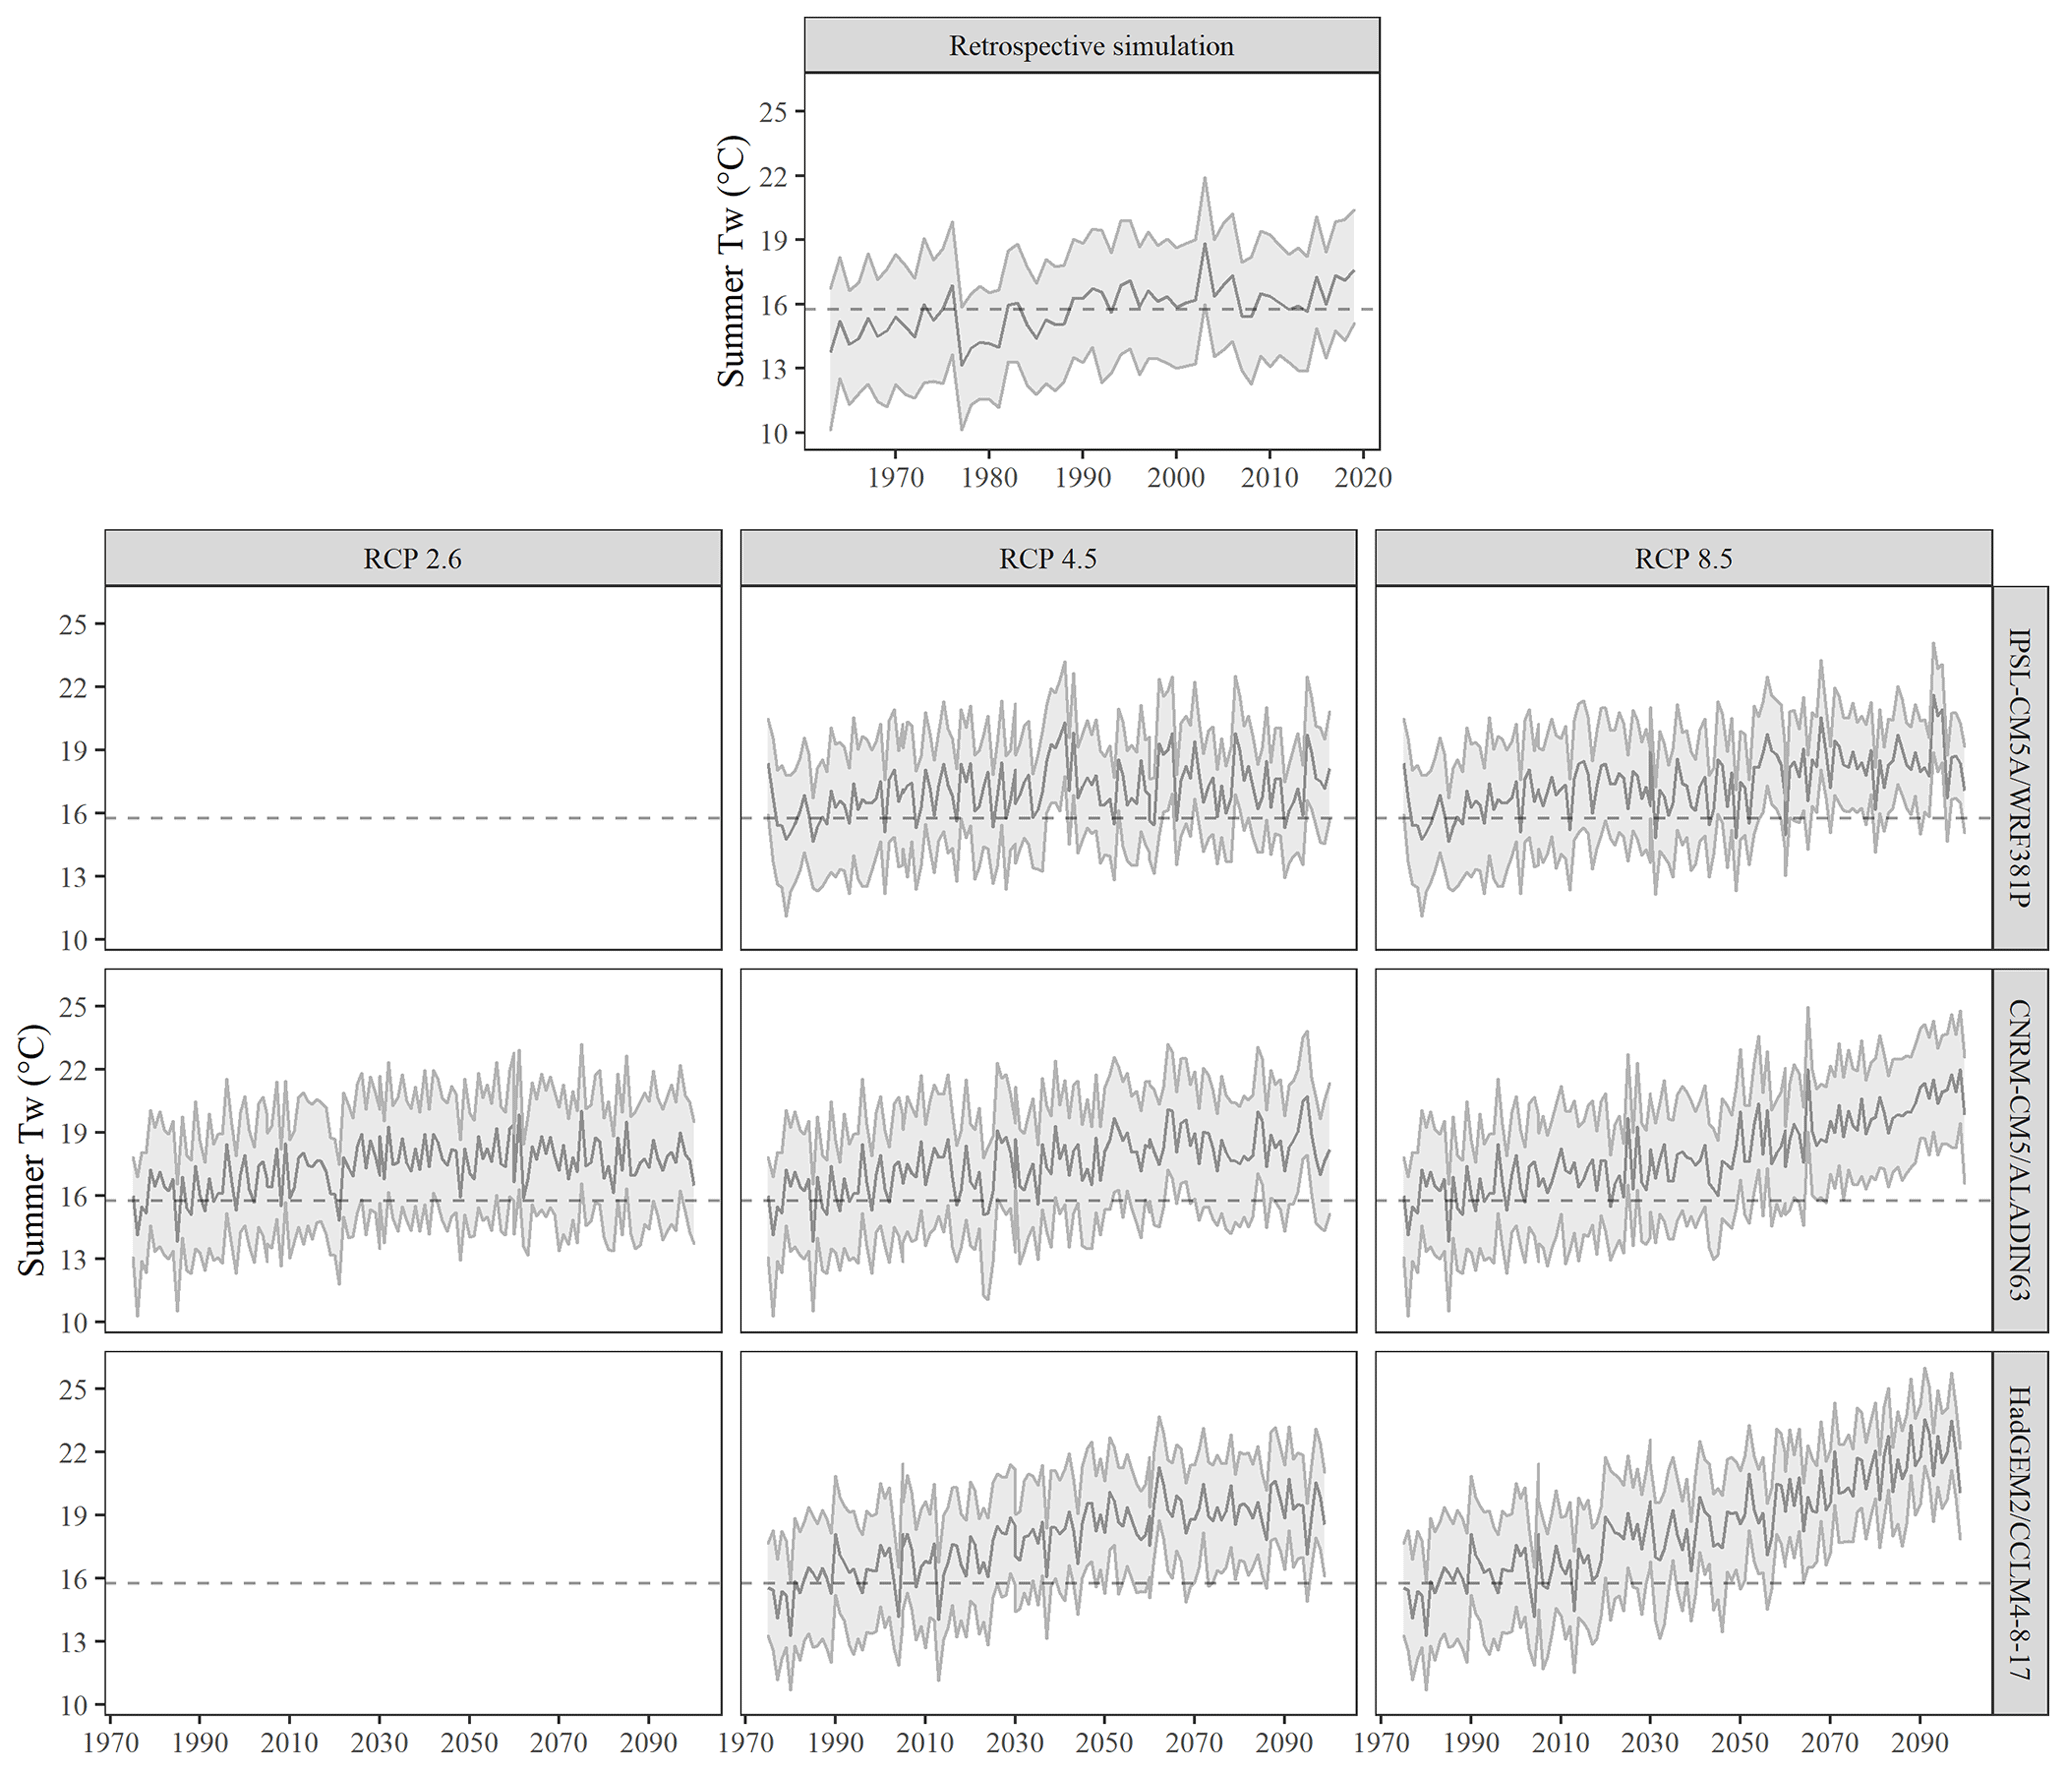
Figure 7Time series of summer Tw in retrospective simulation and projections. The solid line and shaded area represent the median and the 10th–90th percentile band over all 52 278 reaches, respectively. The dashed lines show the average of the median summer Tw values (solid line) in the retrospective simulation over the 1963–2019 period.
Figure 5 also shows a good performance of T-NET in reconstructing daily Tw at the Avoine on the Loire River (uninfluenced by human impacts) in 2003, the hottest year in the recent period (Moatar and Gailhard, 2006; Bustillo et al., 2014; Seyedhashemi et al., 2022b). Although there is a small bias (0.7 ∘C) between simulations and observations over the year, an overestimation in simulation (2.5 ∘C) is observed at the day with maximum daily Tw.
The maximum observed daily Tw at Avoine in 2003 is 31 ∘C (see Fig. 5). Such a value is expected to be seen at rivers with low velocity and shallow water, which are mainly large rivers (OS ≥7) like the river of Avoine station. However, all of 470 reaches with at least 1 d with Tw>31 ∘C in 2003 are not located on large rivers (see Fig. 6). Of these reaches, 57 % have a Strahler order between 5 and 6, and 12 % have a Strahler order less than 5, indicating an overestimation in maximum daily Tw (see Fig. 6).
3.3 Projections (1976–2100)
For future projections of daily Tw (see Fig. 1), T-NET uses the meteorological variables (Ta, Hns, Hla, RH, and W) at the hourly step under seven projections described in Sect. 2.3 (see also Table 1). Like EROS, T-NET is run under present land cover and land use. To assess future projections of Tw in the present day, we follow the same approach as for Q (see Sect. 2.3). We consider daily Tw retrospective simulations (under Safran reanalysis) for 52 278 reaches as the reference data and compare them with projections from the DRIAS-2020 dataset over the 1976–2005 summer period.
3.4 Data description over the summer period (June–August)
3.4.1 Retrospective simulation (1963–2019)
An increase in Tw was detected for almost all reaches in all seasons (mean of +0.38 ∘C per decade) over 1963–2019 by Seyedhashemi et al. (2022b) with a median increase in summer Tw over the basin of +0.44 ∘C per decade (i.e., +2.5 ∘C over the whole 1963–2019 period). Such a consistent increase in summer Tw in retrospective simulations can be also seen in Fig. 7. Nevertheless, only 14 % of reaches in retrospective simulations have an average summer Tw > 18∘C (Fig. 8). In 2003, the hottest year in the recent periods, the majority of reaches (76 %) have a maximum daily Tw>22 ∘C, and 49 % of reaches show a maximum daily Tw>24 ∘C (Fig. 5).
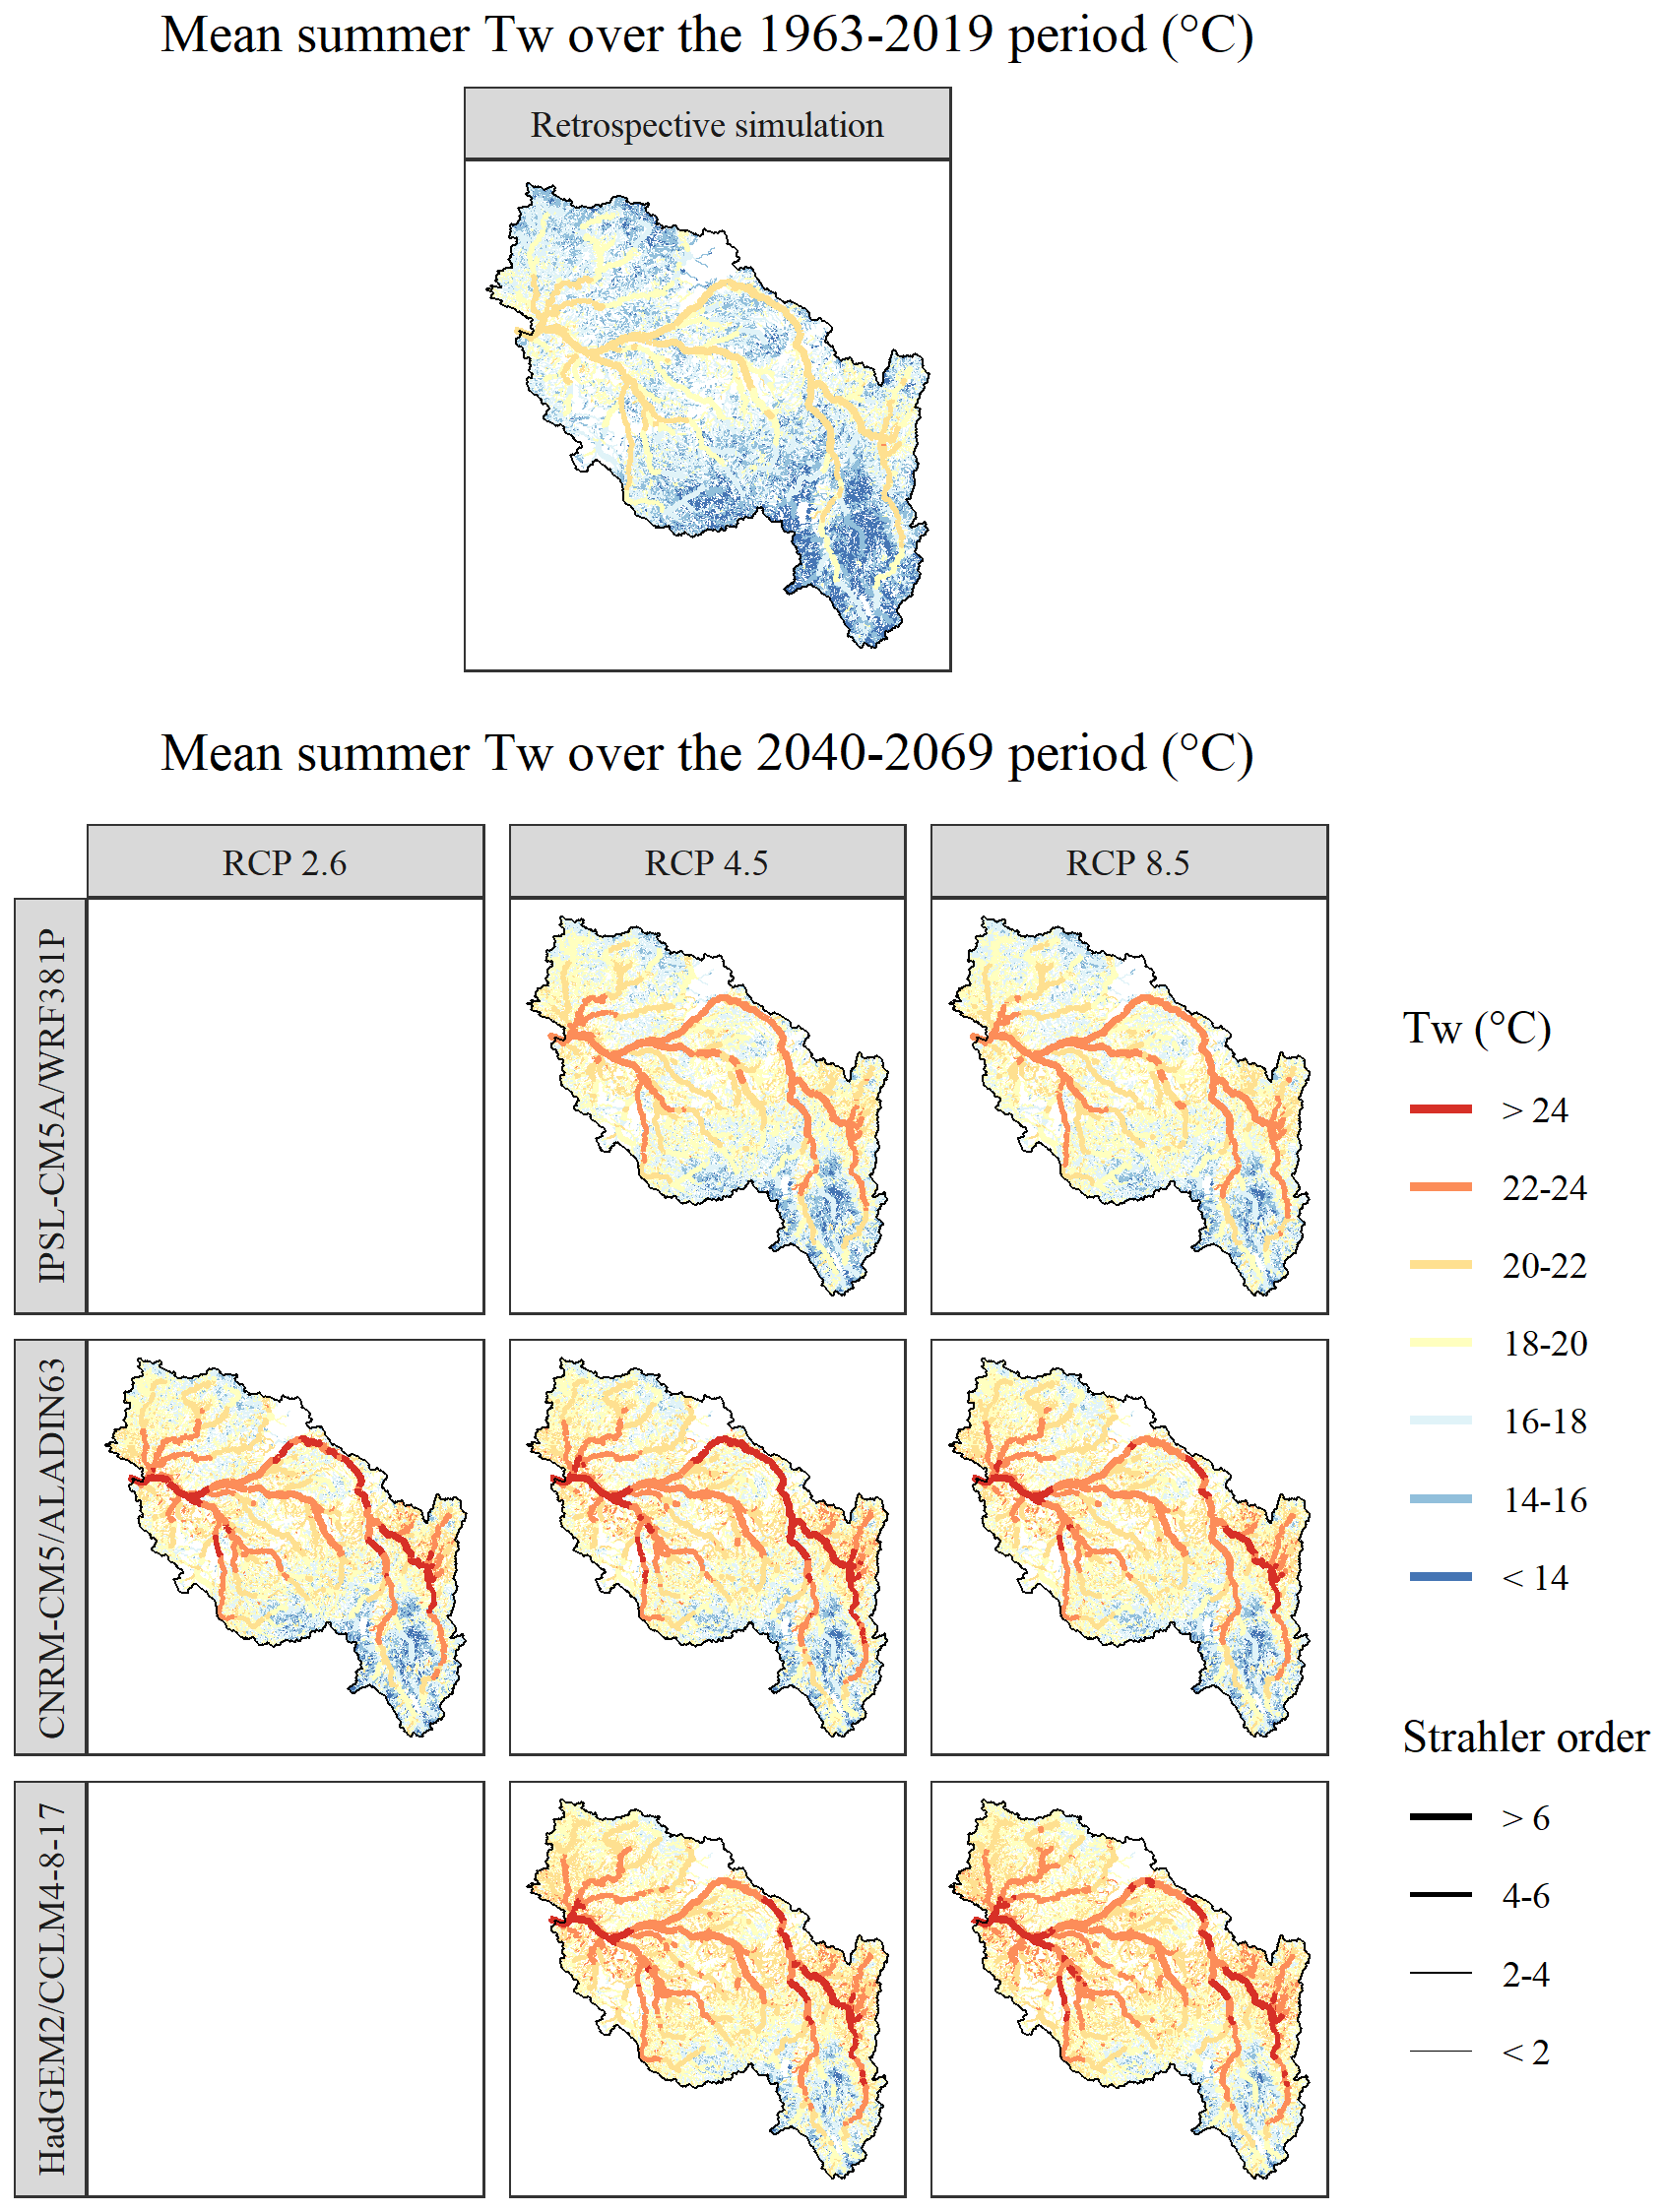
Figure 8Spatial variability of average summer Tw in the retrospective simulation over the 1963–2019 period and in projections for all GCMs–RCMs under RCP 8.5 in the middle of the century (2040–2069). Figure S3 presents corresponding results at the end of the century (2070–2099).
3.4.2 Projections (1976–2100)
There is a slight overestimation of Tw across GCMs–RCMs over 1976–2005 (median bias of 0.2–0.4 ∘C, and see Fig. 9). The interquartile range (IQR) remains small (0.2 ∘C) and similar across GCMs–RCMs. Across GCMs–RCMs, the largest biases are found in the northeast part of the basin and in some middle reaches. The underestimation in Tw occurs partially for reaches in the higher altitudes mostly for HadGEM2–CCLM4-8-17 (Fig. 9).
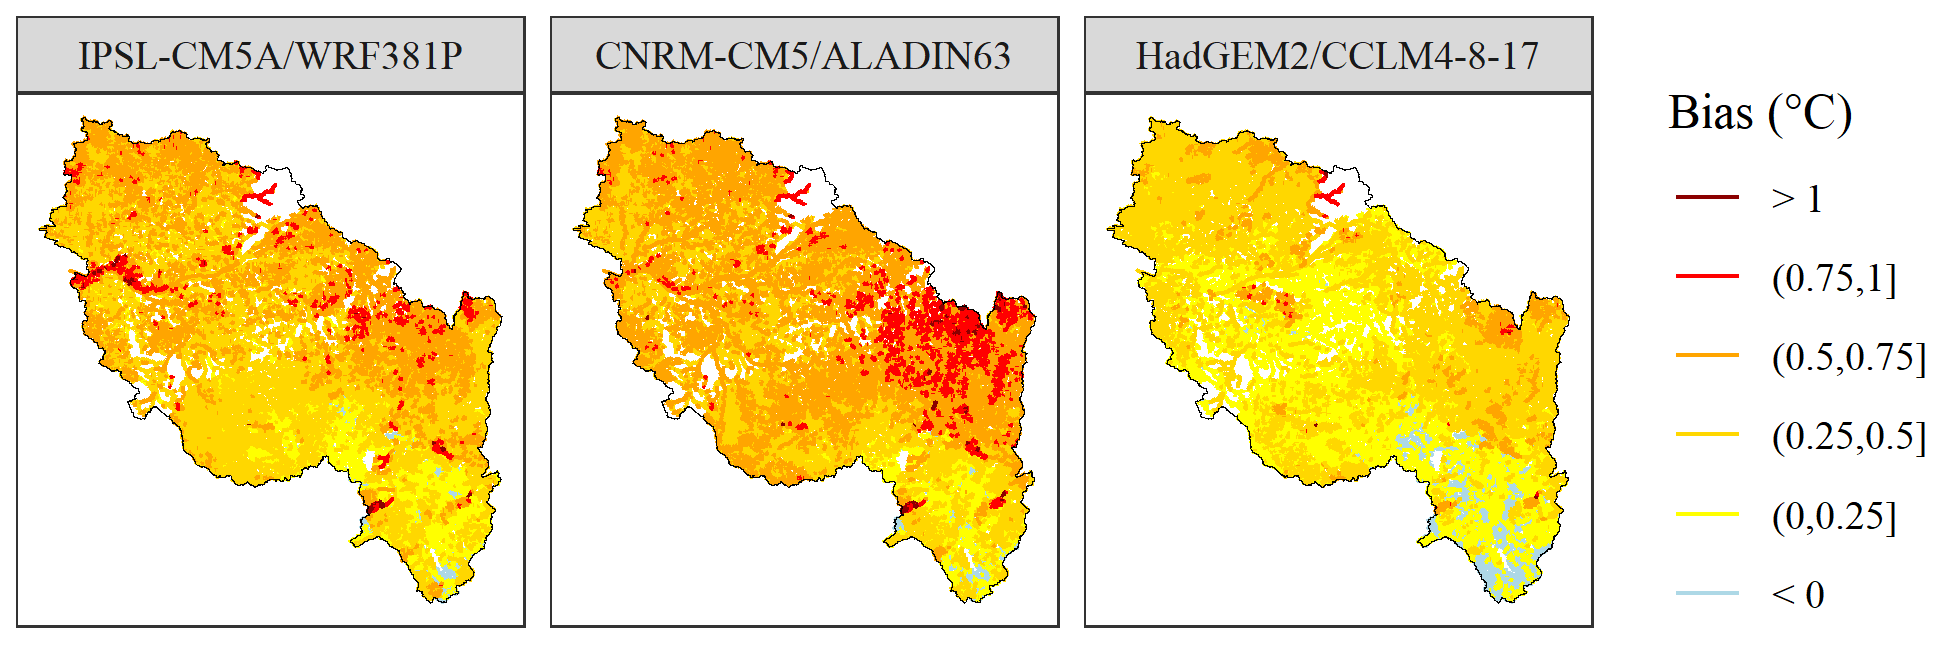
Figure 9Map of summer Tw biases between projections and the retrospective simulation over the 1976–2005 period.
Time series of all reaches under all GCMs–RCMs show a consistent increase in summer Tw from the past to future under RCP 8.5 (Fig. 7). Under this RCP, the median of summer anomalies over the basin at the end of the century with respect to the 1963–2019 ranges between 5.8 and 7.8 ∘C depending on the GCMs–RCMs. Conversely, summer Tw under RCP 2.6 and 4.5 is more stable after 2050 (Fig. 7). Nevertheless, under these two RCPs, anomalies from 2050 onwards are yet quite large (the median over the basin is 4.2 to 4.7 ∘C depending on GCMs–RCMs and RCP). These overall conclusions are exemplified in Fig. S3.
Figure 8 shows a considerable increase in mean summer Tw in the middle of the century (2040–2069) compared to the retrospective simulation over the 1963–2019 period. Only 14 % of reaches have a mean summer Tw>18 ∘C over the 1963–2019 period, while in the middle of century, their number is expected to reach 42 %–73 % depending on the GCM–RCM and RCP. Indeed, the frequency of reaches with Tw>18 ∘C is increasing (57 %–96 % of reaches) towards the end of the century, with the exception of IPSL-CM5A–MRWRF381P under RCP 4.5 and CNRM-CM5-LR–ALADIN63 under RCP 2.6 (see Fig. S4). For the three selected sub-basins, an increase in the frequency of days Tw>25 ∘C is also found towards the end of the century regardless of GCM–RCM under RCP 8.5, with the largest values at the end of the century (>50 d; see Fig. S5).
Daily Q and Tw for the retrospective simulation over the 1963–2019 period and for the seven projections over the 1976–2100 period are available for the T-NET hydrographic network (52 278 reaches) under the Attribution-NonCommercial 4.0 International (CC-BY-NC 4.0) in NetCDF file format through https://doi.org/10.57745/LBPGFS (Seyedhashemi et al., 2022a). Ta and other meteorological variables corresponding to each reach can be extracted from the closest grid cell (to the reach) of the Safran reanalysis and the DRIAS-2020 projection dataset. Safran is available upon request from Météo-France for research purposes. The DRIAS-2020 dataset is freely available from the French national Climate Services Portal DRIAS – Les futurs du Climat at http://www.drias-climat.fr/commande (Ministère de la Transition Écologique, 2023).
This data paper presented and described daily Q and Tw reconstructions over the 1963–2019 period as well as projections over the 1976–2100 period for 52 278 reaches over the Loire River basin (105 km2) using a physical process-based T-NET thermal model coupled with the EROS hydrological model.
Daily Q and Tw are projected under three contrasted downscaled and bias-corrected climate projections (GCMs–RCMs) including warm and wet (IPSL-CM5A–MRWRF381P), intermediate (CNRM-CM5-LR–ALADIN63), and hot and dry (HadGEM2–CCLM4-8-17) models from the DRIAS-2020 dataset (Soubeyroux et al., 2020), under three Representative Concentration Pathways (RCPs) from the fifth report of IPCC (Core Writing Team et al., 2015). All of these three GCM–RCMs were run under RCP 4.5 and RCP 8.5, and CNRM-CM5-LR–ALADIN63 was also run under RCP 2.6.
The potential applications of the proposed dataset over the past and future are manifold. This can be employed to understand spatio-temporal variability in Q and Tw, to assess the synchronicity of extremes (following e.g., Arismendi et al., 2013; Arevalo et al., 2020; Seyedhashemi et al., 2023), to better explain and predict the possible spatial distribution of aquatic communities (following, e.g., Picard et al., 2022, who used this specific dataset), and to assess the various stresses on freshwater habitat due to climate change (e.g., Lee et al., 2020).
The supplement related to this article is available online at: https://doi.org/10.5194/essd-15-2827-2023-supplement.
HS developed the dataset and prepared the paper. DT ran the EROS model and provided discharge data for both the past and future. All co-authors contributed to the paper.
The contact author has declared that none of the authors has any competing interests.
Publisher’s note: Copernicus Publications remains neutral with regard to jurisdictional claims in published maps and institutional affiliations.
The authors would like to thank Météo-France for providing the Safran reanalysis data.
This work was performed in the course of a doctoral project at the University of Tours, funded by the European Regional Development Fund (Fonds Européen de développement Régional-FEDER), POI FEDER Loire (grant no. 2017-EX001784), Le plan Loire grandeur nature, AELB (Agence de l’eau Loire-Bretagne), INRAE (Institut National de Recherche pour l’Agriculture, l’alimentation et l’Environnement), and EDF (Hynes team).
This paper was edited by Giuseppe M. R. Manzella and reviewed by Vadim Grigoriev and two anonymous referees.
Allen, R. G., Pereira, L. S., Raes, D., and Smith, M.: Crop Evapotranspiration – Guidelines for computing crop water requirements, FAO Irrigation and Drainage Paper 56, FAO, https://appgeodb.nancy.inra.fr/biljou/pdf/Allen_FAO1998.pdf (last access: 3 July 2023), 1998. a
Arevalo, E., Lassalle, G., Tétard, S., Maire, A., Sauquet, E., Lambert, P., Paumier, A., Villeneuve, B., and Drouineau, H.: An innovative bivariate approach to detect joint temporal trends in environmental conditions: Application to large French rivers and diadromous fish, Sci. Total Environ., 748, 141260, https://doi.org/10.1016/j.scitotenv.2020.141260, 2020. a, b
Arismendi, I., Safeeq, M., Johnson, S. L., Dunham, J. B., and Haggerty, R.: Increasing synchrony of high temperature and low flow in western North American streams: double trouble for coldwater biota?, Hydrobiologia, 712, 61–70, https://doi.org/10.1007/s10750-012-1327-2, 2013. a
Arora, R., Tockner, K., and Venohr, M.: Changing river temperatures in northern Germany: trends and drivers of change, Hydrol. Process., 30, 3084–3096, https://doi.org/10.1002/hyp.10849, 2016. a, b
Bador, M., Terray, L., Boe, J., Somot, S., Alias, A., Gibelin, A.-L., and Dubuisson, B.: Future summer mega-heatwave and record-breaking temperatures in a warmer France climate, Environ. Res. Lett., 12, 074025, https://doi.org/10.1088/1748-9326/aa751c, 2017. a
Beaufort, A., Curie, F., Moatar, F., Ducharne, A., Melin, E., and Thiéry, D.: T-NET, a dynamic model for simulating daily stream temperature at the regional scale based on a network topology, Hydrol. Process., 30, 2196–2210, https://doi.org/10.1002/hyp.10787, 2016a. a
Beaufort, A., Moatar, F., Curie, F., Ducharne, A., Bustillo, V., and Thiéry, D.: River temperature modelling by Strahler order at the regional scale in the Loire River basin, France, River Res. Appl., 32, 597–609, https://doi.org/10.1002/rra.2888, 2016b. a
Bustillo, V., Moatar, F., Ducharne, A., Thiéry, D., and Poirel, A.: A multimodel comparison for assessing water temperatures under changing climate conditions via the equilibrium temperature concept: case study of the Middle Loire River, France, Hydrol. Process., 28, 1507–1524, https://doi.org/10.1002/hyp.9683, 2014. a
Carlson, A. K., Taylor, W. W., Hartikainen, K. M., Infante, D. M., Beard, T. D., and Lynch, A. J.: Comparing stream-specific to generalized temperature models to guide salmonid management in a changing climate, Rev. Fish Biol. Fisher., 27, 443–462, https://doi.org/10.1007/s11160-017-9467-0, 2017. a
Colin, J., Déqué, M., Radu, R., and Somot, S.: Sensitivity study of heavy precipitation in Limited Area Model climate simulations: influence of the size of the domain and the use of the spectral nudging technique, Tellus A, 62, 591–604, https://doi.org/10.1111/j.1600-0870.2010.00467.x, 2010. a
Core Writing Team, Pachauri, R. K., and Meyer, L. A. (Eds.): Climate change 2014: synthesis report. Contribution of Working Groups I, II and III to the fifth assessment report of the Intergovernmental Panel on Climate Change, IPCC, https://www.ipcc.ch/site/assets/uploads/2018/02/SYR_AR5_FINAL_full.pdf (last access: 3 July 2023), 2015. a, b
Cox, T. J. and Rutherford, J. C.: Predicting the effects of time-varying temperatures on stream invertebrate mortality, New Zeal. J. Mar. Fresh., 34, 209–215, https://doi.org/10.1080/00288330.2000.9516927, 2000. a
Du, X., Shrestha, N. K., and Wang, J.: Assessing climate change impacts on stream temperature in the Athabasca River Basin using SWAT equilibrium temperature model and its potential impacts on stream ecosystem, Sci. Total Environ., 650, 1872–1881, https://doi.org/10.1016/j.scitotenv.2018.09.344, 2019. a
Dufresne, J.-L., Foujols, M.-A., Denvil, S., Caubel, A., Marti, O., Aumont, O., Balkanski, Y., Bekki, S., Bellenger, H., Benshila, R., and and Bony, S.: Climate change projections using the IPSL-CM5 Earth System Model: from CMIP3 to CMIP5, Clim. Dynam., 40, 2123–2165, https://doi.org/10.1007/s00382-012-1636-1, 2013. a
Dugdale, S. J., Hannah, D. M., and Malcolm, I. A.: River temperature modelling: A review of process-based approaches and future directions, Earth-Sci. Rev., 175, 97–113, https://doi.org/10.1016/j.earscirev.2017.10.009, 2017. a, b
Elliott, J. and Elliott, J.: Temperature requirements of Atlantic salmon Salmo salar, brown trout Salmo trutta and Arctic charr Salvelinus alpinus: predicting the effects of climate change, J. Fish Biol., 77, 1793–1817, https://doi.org/10.1111/j.1095-8649.2010.02762.x, 2010. a
Hannah, D. M. and Garner, G.: River water temperature in the United Kingdom: changes over the 20th century and possible changes over the 21st century, Prog. Phys. Geogr., 39, 68–92, https://doi.org/10.1177/0309133314550669, 2015. a
Hourdin, F., Foujols, M.-A., Codron, F., Guemas, V., Dufresne, J.-L., Bony, S., Denvil, S., Guez, L., Lott, F., Ghattas, J., and Braconnot, P.: Impact of the LMDZ atmospheric grid configuration on the climate and sensitivity of the IPSL-CM5A coupled model, Clim. Dynam., 40, 2167–2192, https://doi.org/10.1007/s00382-012-1411-3, 2013. a
Jones, C. D., Hughes, J. K., Bellouin, N., Hardiman, S. C., Jones, G. S., Knight, J., Liddicoat, S., O'Connor, F. M., Andres, R. J., Bell, C., Boo, K.-O., Bozzo, A., Butchart, N., Cadule, P., Corbin, K. D., Doutriaux-Boucher, M., Friedlingstein, P., Gornall, J., Gray, L., Halloran, P. R., Hurtt, G., Ingram, W. J., Lamarque, J.-F., Law, R. M., Meinshausen, M., Osprey, S., Palin, E. J., Parsons Chini, L., Raddatz, T., Sanderson, M. G., Sellar, A. A., Schurer, A., Valdes, P., Wood, N., Woodward, S., Yoshioka, M., and Zerroukat, M.: The HadGEM2-ES implementation of CMIP5 centennial simulations, Geosci. Model Dev., 4, 543–570, https://doi.org/10.5194/gmd-4-543-2011, 2011. a
Keuler, K., Radtke, K., Kotlarski, S., and Lüthi, D.: Regional climate change over Europe in COSMO-CLM: Influence of emission scenario and driving global model, Meteorol. Z., 25, 121–136, https://doi.org/10.1127/metz/2016/0662, 2016. a
Kwak, J., St-Hilaire, A., Chebana, F., and Kim, G.: Summer season water temperature modeling under the climate change: case study for Fourchue River, Quebec, Canada, Water, 9, 346, https://doi.org/10.3390/w9050346, 2017. a
Le Moal, M., Gascuel-Odoux, C., Ménesguen, A., Souchon, Y., Étrillard, C., Levain, A., Moatar, F., Pannard, A., Souchu, P., Lefebvre, A., and and Pinay, G.: Eutrophication: A new wine in an old bottle?, Sci. Total Environ., 651, 1–11, https://doi.org/10.1016/j.scitotenv.2018.09.139, 2019. a
Lee, S.-Y., Fullerton, A. H., Sun, N., and Torgersen, C. E.: Projecting spatiotemporally explicit effects of climate change on stream temperature: A model comparison and implications for coldwater fishes, J. Hydrol., 588, 125066, https://doi.org/10.1016/j.jhydrol.2020.125066, 2020. a, b, c
Michel, A., Brauchli, T., Lehning, M., Schaefli, B., and Huwald, H.: Stream temperature and discharge evolution in Switzerland over the last 50 years: annual and seasonal behaviour, Hydrol. Earth Syst. Sci., 24, 115–142, https://doi.org/10.5194/hess-24-115-2020, 2020. a
Michel, A., Schaefli, B., Wever, N., Zekollari, H., Lehning, M., and Huwald, H.: Future water temperature of rivers in Switzerland under climate change investigated with physics-based models, Hydrol. Earth Syst. Sci., 26, 1063–1087, https://doi.org/10.5194/hess-26-1063-2022, 2022. a, b
Minaudo, C., Curie, F., Jullian, Y., Gassama, N., and Moatar, F.: QUAL-NET, a high temporal-resolution eutrophication model for large hydrographic networks, Biogeosciences, 15, 2251–2269, https://doi.org/10.5194/bg-15-2251-2018, 2018. a
Ministère de la Transition Écologique: DRIAS Les futurs du climat, Ministère de la Transition Écologique [data set], http://www.drias-climat.fr/commande, last access: 3 July 2023. a
Moatar, F. and Gailhard, J.: Water temperature behaviour in the River Loire since 1976 and 1881, Comptes Rendus Geoscience, 338, 319–328, https://doi.org/10.1016/j.crte.2006.02.011, 2006. a, b
Morales-Marín, L., Rokaya, P., Sanyal, P., Sereda, J., and Lindenschmidt, K.: Changes in streamflow and water temperature affect fish habitat in the Athabasca River basin in the context of climate change, Ecol. Model., 407, 108718, https://doi.org/10.1016/j.ecolmodel.2019.108718, 2019. a
Nelson, K. C. and Palmer, M. A.: Stream temperature surges under urbanization and climate change: data, models, and responses 1, J. Am. Water Resour. A., 43, 440–452, https://doi.org/10.1111/j.1752-1688.2007.00034.x, 2007. a
Orr, H. G., Simpson, G. L., des Clers, S., Watts, G., Hughes, M., Hannaford, J., Dunbar, M. J., Laizé, C. L., Wilby, R. L., Battarbee, R. W., and and Evans, R.: Detecting changing river temperatures in England and Wales, Hydrol. Process., 29, 752–766, https://doi.org/10.1002/hyp.10181, 2015. a
Ouellet, V., St-Hilaire, A., Dugdale, S. J., Hannah, D. M., Krause, S., and Proulx-Ouellet, S.: River temperature research and practice: Recent challenges and emerging opportunities for managing thermal habitat conditions in stream ecosystems, Sci. Total Environ., 736, 139679, https://doi.org/10.1016/j.scitotenv.2020.139679, 2020. a
Picard, C., Floury, M., Seyedhashemi, H., Morel, M., Pella, H., Lamouroux, N., Buisson, L., Moatar, F., and Maire, A.: Direct habitat descriptors improve the understanding of the organization of fish and macroinvertebrate communities across a large catchment, PloS one, 17, e0274167, https://doi.org/10.1371/journal.pone.0274167, 2022. a, b
Piotrowski, A. P., Osuch, M., and Napiorkowski, J. J.: Influence of the choice of stream temperature model on the projections of water temperature in rivers, J. Hydrol., 601, 126629, https://doi.org/10.1016/j.jhydrol.2021.126629, 2021. a
Quintana-Segui, P., Le Moigne, P., Durand, Y., Martin, E., Habets, F., Baillon, M., Canellas, C., Franchisteguy, L., and Morel, S.: Analysis of near-surface atmospheric variables: Validation of the SAFRAN analysis over France, J. Appl. Meteorol. Climatol., 47, 92–107, https://doi.org/10.1175/2007JAMC1636.1, 2008. a
Seixas, G. B., Beechie, T. J., Fogel, C., and Kiffney, P. M.: Historical and Future Stream Temperature Change Predicted by a Lidar-Based Assessment of Riparian Condition and Channel Width, J. Ame. Water Resour. A., 54, 974–991, https://doi.org/10.1111/1752-1688.12655, 2018. a
Seyedhashemi, H., Moatar, F., Vidal, J.-P., Diamond, J. S., Beaufort, A., Chandesris, A., and Valette, L.: Thermal signatures identify the influence of dams and ponds on stream temperature at the regional scale, Sci. Total Environ., 766, 142667, https://doi.org/10.1016/j.scitotenv.2020.142667, 2021. a
Seyedhashemi, H., Moatar, F., Vidal, J.-P., and Thiéry, D.: Past and future discharge and stream temperature at high spatial resolution in a large European basin (Loire basin, France), Data INRAE [data set], https://doi.org/10.57745/LBPGFS, 2022a. a, b
Seyedhashemi, H., Vidal, J.-P., Diamond, J. S., Thiéry, D., Monteil, C., Hendrickx, F., Maire, A., and Moatar, F.: Regional, multi-decadal analysis on the Loire River basin reveals that stream temperature increases faster than air temperature, Hydrol. Earth Syst. Sci., 26, 2583–2603, https://doi.org/10.5194/hess-26-2583-2022, 2022b. a, b, c, d, e, f, g, h, i, j, k, l, m, n, o, p, q, r, s, t
Seyedhashemi, H., Drouineau, H., Maire, A., and Moatar, F.: Joint temporal trends in river discharge and temperature over the past 57 years in a large European basin: implications for diadromous fish, EGU General Assembly 2023, Vienna, Austria, 24–28 Apr 2023, EGU23-7598, https://doi.org/10.5194/egusphere-egu23-7598, 2023. a
Sinokrot, B., Stefan, H., McCormick, J., and Eaton, J.: Modeling of climate change effects on stream temperatures and fish habitats below dams and near groundwater inputs, Climatic Change, 30, 181–200, https://doi.org/10.1007/BF01091841, 1995. a
Skamarock, W. C., Klemp, J. B., Dudhia, J., Gill, D. O., Barker, D. M., Wang, W., and Powers, J. G.: A description of the Advanced Research WRF version 3. NCAR Technical note-475+ STR, http://citeseerx.ist.psu.edu/viewdoc/download?doi=10.1.1.484.3656&rep=rep1&type=pdf (last access: 3 July 2023), 2008. a
Soubeyroux, J.-M. Bernus, S., Corre, L., Drouin, A., Dubuisson, B., Etchevers, P., Gouget, V., Josse, P., Kerdoncuff, M.,Samacoits, R., and Tocque, F.: Les nouvelles projections climatiques de référence DRAIS 2020 pour la Métropole, Tech. rep., Météo France, http://www.drias-climat.fr/document/rapport-DRIAS-2020-red3-2.pdf (last access: 3 July 2023), 2020. a, b, c
Steel, E. A., Beechie, T. J., Torgersen, C. E., and Fullerton, A. H.: Envisioning, quantifying, and managing thermal regimes on river networks, BioScience, 67, 506–522, https://doi.org/10.1093/biosci/bix047, 2017. a
van Vliet, M. T., Franssen, W. H., Yearsley, J. R., Ludwig, F., Haddeland, I., Lettenmaier, D. P., and Kabat, P.: Global river discharge and water temperature under climate change, Glob. Environ. Change, 23, 450–464, https://doi.org/10.1016/j.gloenvcha.2012.11.002, 2013. a
Verfaillie, D., Déqué, M., Morin, S., and Lafaysse, M.: The method ADAMONT v1.0 for statistical adjustment of climate projections applicable to energy balance land surface models, Geosci. Model Dev., 10, 4257–4283, https://doi.org/10.5194/gmd-10-4257-2017, 2017. a
Vidal, J.-P., Martin, E., Franchistéguy, L., Baillon, M., and Soubeyroux, J.-M.: A 50-year high-resolution atmospheric reanalysis over France with the Safran system, Int. J. Climatol., 30, 1627–1644, https://doi.org/10.1002/joc.2003, 2010. a
Voldoire, A., Sanchez-Gomez, E., y Mélia, D. S., Decharme, B., Cassou, C., Sénési, S., Valcke, S., Beau, I., Alias, A., Chevallier, M., and and Déqué, M.: The CNRM-CM5. 1 global climate model: description and basic evaluation, Clim. Dynam., 40, 2091–2121, https://doi.org/10.1007/s00382-011-1259-y, 2013. a
Webb, B. and Walling, D.: Complex summer water temperature behaviour below a UK regulating reservoir, Regulated Rivers: Research & Management: An International Journal Devoted to River Research and Management, 13, 463–477, https://doi.org/10.1002/(SICI)1099-1646(199709/10)13:5<463::AID-RRR470>3.0.CO;2-1, 1997. a
Webb, B. W., Hannah, D. M., Moore, D. R., Brown, L. E., and Nobilis, F.: Recent advances in stream and river temperature research, Hydrol. Process., 22, 902–918, https://doi.org/10.1002/hyp.6994, 2008. a
Yearsley, J. R.: A semi-Lagrangian water temperature model for advection-dominated river systems, Water Resour. Res., 45, https://doi.org/10.1029/2008WR007629, 2009. a
Zhao, F., Zhan, X., Xu, H., Zhu, G., Zou, W., Zhu, M., Kang, L., Guo, Y., Zhao, X., Wang, Z., and and Tang, W.: New insights into eutrophication management: Importance of temperature and water residence time, J. Environ. Sci., 111, 229–239, https://doi.org/10.1016/j.jes.2021.02.033, 2022. a