the Creative Commons Attribution 4.0 License.
the Creative Commons Attribution 4.0 License.
 | 09 Jun 2023
An investigation of the global uptake of CO2 by lime from 1930 to 2020
Longfei Bing
Mingjing Ma
Lili Liu
Jiaoyue Wang
Le Niu
Fengming Xi
A substantial amount of CO2 is released into the atmosphere from the process of the high-temperature decomposition of limestone to produce lime. However, during the lifecycle of lime production, the alkaline components of lime will continuously absorb CO2 from the atmosphere during use and waste disposal. Here, we adopt an analytical model describing the carbonation process to obtain regional and global estimates of carbon uptake from 1930 to 2020 using lime lifecycle use-based material data. The results reveal that the global uptake of CO2 by lime increased from 9.16 Mt C yr−1 (95 % confidence interval, CI: 1.84–18.76 Mt C) in 1930 to 34.84 Mt C yr−1 (95 % CI: 23.50–49.81 Mt C) in 2020. Cumulatively, approximately 1444.70 Mt C (95 % CI: 1016.24–1961.05 Mt C) was sequestered by lime produced between 1930 and 2020, corresponding to 38.83 % of the process emissions during the same period, mainly contributed from the utilization stage (76.21 % of the total uptake). We also fitted the missing lime output data of China from 1930 to 2001, thus compensating for the lack of China's lime production (cumulative 7023.30 Mt) and underestimation of its carbon uptake (467.85 Mt C) in the international data. Since 1930, lime-based materials in China have accounted for the largest proportion (about 63.95 %) of the global total. Our results provide data to support including lime carbon uptake into global carbon budgets and scientific proof for further research of the potential of lime-containing materials in carbon capture and storage. The data utilized in the present study can be accessed at https://doi.org/10.5281/zenodo.7896106 (Ma et al., 2023).
- Article
(3100 KB) - Full-text XML
-
Supplement
(516 KB) - BibTeX
- EndNote


According to the latest report (sixth assessment) of the Intergovernmental Panel on Climate Change (IPCC), anthropogenic activities are responsible for the unprecedented increase in the concentration of CO2 in the atmosphere, which reached 415 ppm in 2021 (Lan et al., 2023). In 2019, approximately 24 % (14 Gt CO2-eq.) of the net global anthropogenic emissions originated from industrial sources, and lime production was the second highest industrial source after cement production (IPCC, 2021; Shan et al., 2016). Similar to cement, lime is mainly produced via the heating of limestone (CaCO3) in a kiln at temperatures of 900–1200 ∘C. The CO2 generated during this process is commonly released into the atmosphere (Greco-Coppi et al., 2021). During limestone decomposition, fossil fuel combustion, which is used to provide energy for the process, is an indirect source of CO2, but this is often accounted for in the energy sector (IPCC, 2021).
The enormous quantity of lime produced in the world (∼427 Mt in 2020; USGS, 2022b) is mainly employed in the following sectors (Fig. 1): (1) chemical industry, such as for the production of precipitated calcium carbonate (PCC), manufacturing of paper, and refining of sugar; (2) environmental remediation/treatment, including water treatment, acid mine drainage, and flue gas desulfurization; (3) metallurgical industry, for instance as a fluxing agent in the production of iron and steel; and (4) construction industry for building materials including lime mortar and lime-stabilized soil–asphalt mixtures (USGS, 2022b). Many lime-based materials, including wastes produced in different industries, reabsorb some of the released CO2 and thereby sequester CO2 throughout the lime cycle (carbonation), owing to the unstable calcium oxide in these materials (Cizer et al., 2012a). According to Renforth (2019), approximately 34 % of lime can directly or indirectly remove CO2 from the atmosphere and absorb CO2 during the utilization stage. The carbonation process can be described using the following reactions:
Carbonation proceeds progressively from the exterior to the interior of lime-containing materials via the diffusion of CO2 into particles, followed by its reaction with hydration products of calcium oxide (Cizer et al., 2012b; Despotou et al., 2016). Therefore, carbonation can be considered a mineralization technology for carbon capture, utilization, and storage (CCUS) (Lai et al., 2021; Snæbjörnsdóttir et al., 2020). Samari et al. (2020) indicated that lime-based materials have been proposed as solid sorbents in direct air capture (DAC) technologies (extracting CO2 directly from the atmosphere). In practice, however, because of material and environmental factors, only 70 %–80 % of the CaO in lime can be converted into CaCO3 (Bhatia and Perlmutter, 1983). In previous studies, the carbonation process and factors influencing its rate (Ma et al., 2019), as well as strategies for improving the sequestration of carbon using lime-containing materials under controlled laboratory conditions (Pan et al., 2012; Baciocchi, 2017), have been examined. Pan et al. (2020), for instance, estimated the CO2 reduction potential of lime-based solid wastes (e.g., lime mud, red mud, and iron and steel slags) in mineralization technologies and highlighted a substantial potential for the storage of CO2 in these wastes. The maximum achievable carbonation capacity of these solid wastes via direct mineralization is approximately 310 Mt of CO2 per year. Renforth (2019) estimated the global potential of CO2 uptake through carbonation of lime and related alkaline materials up to the year 2100 (approximately 2.9–8.5 Gt of CO2 per year) and indicated that this process can substantially mitigate CO2 emissions during manufacturing of the associated materials. However, existing studies are limited to estimation of the carbon reduction potential via accelerated carbonation instead of carbon sequestration throughout the lime cycle under realistic conditions.
In the present study, a carbon sequestration analytical model was utilized to evaluate the global uptake of CO2 by lime-containing materials during the three stages (production, use, and waste disposal) of the lime cycle from 1930 to 2020. The aims were to highlight the magnitude of the lime carbon sink on a global scale and to estimate the net CO2 emission associated with the production of lime. In addition, characteristics of the uptake of CO2 by lime and the contribution to the carbon cycle were examined. The present study significantly improves the global carbon uptake model and provides theoretical support for the utilization of lime-containing materials in carbon capture and storage (CCS).
2.1 Lime production, resource usage proportion, and treatment
In this study, China and the United States (USA) were considered individually, while all other producers were grouped together as “rest of the world” (ROW). The global lime production data came from Lime Statistics and Information (USGS, 2022b), but the data did not include the statistics of China's lime production between 1963 and 1984. In addition, the statistical value of China's lime production from 1985 to 2001 was underestimated compared with the actual value (Cao et al., 2019), which meant that the statistical data of global lime production during 1963–2001 were significantly less than the actual production (Fig. 2b). The lime production data of China in this study were obtained from the China Construction Material Industry Yearbook (2022). Considering that lime production data are available for the United States since 1930, which is much earlier than the recorded data for China and the ROW, we filled gaps in the data using fitting methods, thereby extending the timescale of the study to 1930.
First, we fitted China's lime production. The only source of China's lime production statistics is the China Construction Material Industry Yearbook, which records the lime production data from 1996 to 2020, of which the data from 2015 to 2018 are missing; in addition, the statistical yearbook introduces the use of lime in various industries. From this, we know that the production of lime in construction, steel, calcium carbide, and alumina in the downstream sector of lime accounts for more than 90 % of lime production. Therefore, we collected data on China's cement production (1930–2020), the completed area of housing in the whole society (1963–2020), steel production (1949–2020), calcium carbide production (1949–2020), and alumina production (1954–2020), and we fitted them to the lime production data. Taking China's lime production as the dependent variable, the stepwise linear regression method was used to construct a regression model. Since the completed area data of houses in the whole society was only available from 1963, the model predicted lime production data from 1963 to 1995. Then, through the ARIMA (0,1,0) model, with external control variables including the steel production, calcium carbide production, and cement production, we fitted the lime production in China from 1949 to 1962 (the steel and calcium carbide production data were only extended to 1949). Finally, we used the ARIMA (2,2,0) model without external control variables to fit the lime production in China from 1930 to 1948. From this, we obtained the fitted lime production data for China from 1930 to 2020 (Fig. 2a). Fitted coefficients of regression models and ARIMA models are shown in the Supplement, SI-2 Data 4.
After obtaining the Chinese lime production data, we corrected the global lime production data from the USGS from 1930 to 2020 (Fig. 2b). The AutoRegressive Integrated Moving Average (ARIMA (1,0,0)) model was then used to fit the global lime production from 1930 to 1962 with global alumina production, steel production, and cement production as external control variables.
Relatedly, according to data that were obtained from the USGS, approximately 15 %–42 % of lime resources in the USA are utilized in the chemical industry (mainly for petroleum refining and glass and rubber product production), whereas 30 %–51 % are employed in metallurgy (primarily in the production of crude steel), 5 %–14 % are used in the construction industry (principally for the production of lime stabilized soil and lime motor), and approximately 8 %–43 % are applied in environmental protection and other fields. In the ROW, data on the usage of lime resources in different sectors including industry were mostly obtained from publications (see the Supplement, SI-2 Data 9 and SI-3 Data 1).
2.2 Estimation of emissions from processes
Regarding industrial processes, lime production is the second-highest source of carbon emissions after cement production; thus, its contribution cannot be ignored (Shan et al., 2016). CO2 emissions from lime production are mainly linked to the calcination stage, during which calcium oxide (CaO or quicklime) is formed from the decomposition of limestone by heat (Despotou et al., 2016). Lime comes from the decomposition of limestone in a shaft or rotary kiln, and the carbon emission of this industrial process can be estimated from using the IPCC method (IPCC, 2006). Considering the availability of lime production data, “Method 1” (multiplication of the regional lime production by the CO2 emission factor) from the 2006 IPCC Guidelines for National Greenhouse Gas Inventories was utilized to calculate CO2 emissions from lime production processes in the present study, and this can be expressed as follows:
where CEl,i is the annual CO2 emissions, ml,i represents the production of the lime industry, and EFl denotes the CO2 emission factor associated with the lime production process. “l” refers to different types of lime use, including PCC, sugar making, lime-stabilized soil, and lime mortar, and i refers to different years.
Emission factors for the lime industry processes were determined using the composition of raw materials and the production technology. In the present study, 0.77, 0.683, and 0.75 t CO2 per tonne of lime produced were adopted as emission factors for the US, China, and ROW, respectively (IPCC, 2006). Emission factors for the USA and ROW were according to the IPCC guidelines, whereas that for China was from the National Development and Reform Commission of China.
2.3 Assessments of uptake during the lime cycle
Lime materials, which remove CO2 from the atmosphere, belong to the following stages of the lime cycle: (1) production, (2) service, and (3) waste disposal (Fig. 1). Therefore, the CO2 uptake by lime (Cl,total) was calculated using the following formula:
where Cl,pro, Cl,ser, and Cl,wd are the uptake components during the production, service, and waste disposal stages, respectively. The uptake of CO2 in different stages of the lime cycle is examined subsequently.
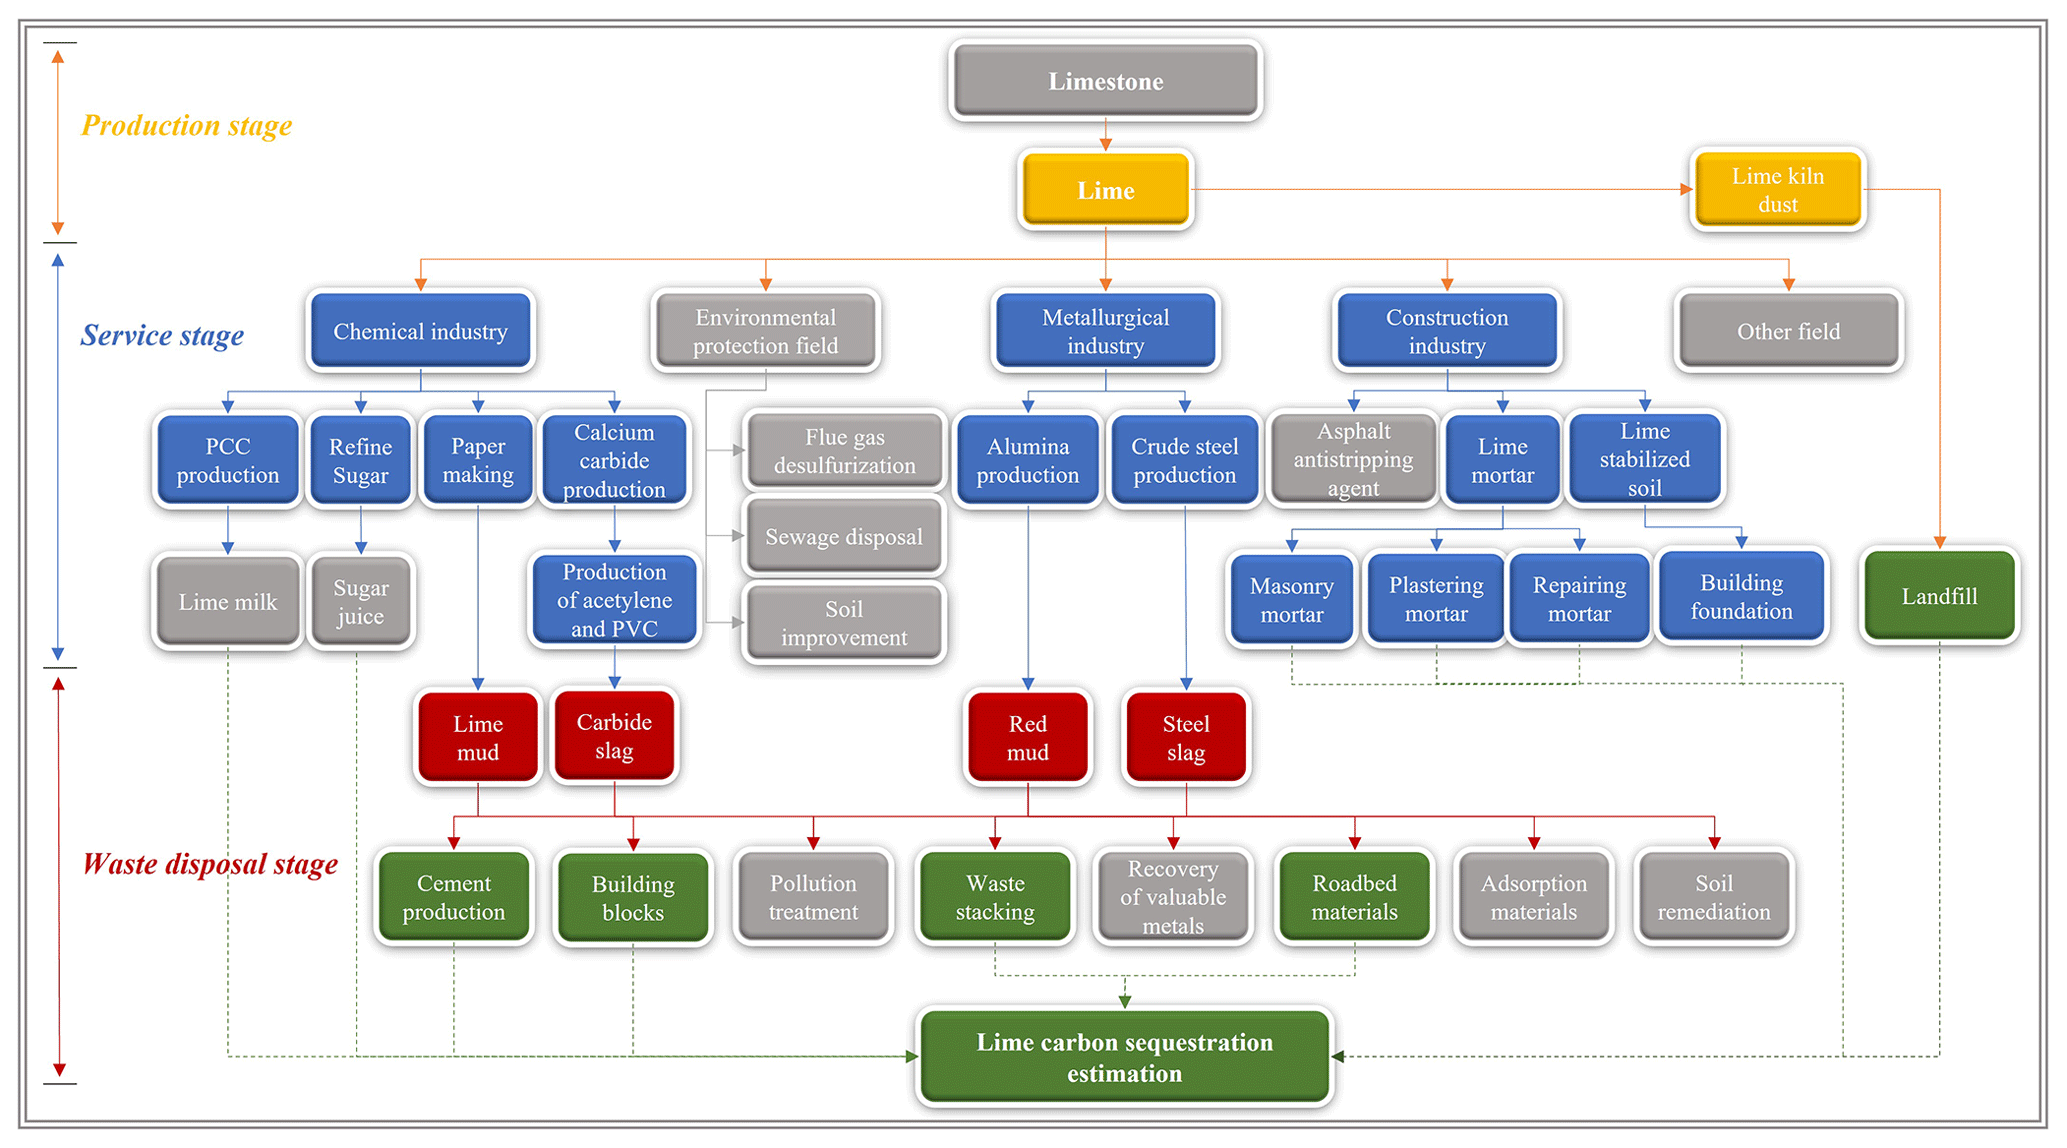
Figure 1System boundary for the sequestration of carbon by lime. Solid arrows represent the material flow, and dashed arrows indicate the carbon flow. (Yellow, blue, and red represent lime-based materials with carbon absorption capacity and their associated production processes, spanning from initial production through usage and waste disposal. Gray represents materials, production processes, or disposal methods with little carbon absorption capacity. Green represents the disposal method for lime-based waste that possesses carbon absorption potential.)
2.3.1 Assessment of uptake during the production stage
The carbon sink of the lime production stage refers to the uptake of CO2 by lime kiln ash, and this can be quantified using the following expression:
where ml,i is the quantity of lime produced, rlkd represents the output rate of lime kiln ash, denotes the concentration of CaO in dust, γlkd is the rate of conversion of CaO to CaCO3 in dust, and MCaO and MC are molar masses of CaO and C, which in the present study are 56 and 12 g mol−1, respectively.
2.3.2 Assessment of uptake during the service stage
Processes that can absorb CO2 in the lime utilization stage principally comprise the production of precipitated calcium carbonate (PCC, Cpcc,i), carbonation sugar (SUG, Csug,i), lime-stabilized soil (LSS, Clss,i), and lime mortar (MOR, Cmor,i). The uptake of CO2 in this stage can be calculated as follows:
-
PCC and SUG.
PCC is produced via the hydration of high-calcium quicklime, followed by a reaction of the resulting slurry and CO2 (Wang et al., 2002), and this reaction can be represented as follows: . According to the law of conservation of mass, the uptake of CO2 by lime in PCC can be calculated as follows:
where L1 is the proportion of lime that is used in the chemical industry, a1 is the proportion of lime utilized in the chemical industry that is associated with PCC, and is the concentration of CaO in lime. Similar to the principle of the carbon sink in the production of PCC, the uptake of CO2 linked to the production of carbonation sugars (SUG) can be calculated using the following expression:
where a2 is the proportion of lime used in the production of SUG in industry, and fsug is the proportion of sugar produced using the lime-refining method.
-
LSS.
Under wet conditions, the carbonation rate of an LSS is approximately between 70 %–80 % over a duration of 3 months (Liu et al., 2018a). Therefore, it is assumed that LSS can be carbonated within a year, and the uptake of CO2 by LSS is quantified using the following expression:
where L2 is the proportion of lime used in the construction sector, a3 represents the proportion of lime employed in LSS in the construction sector, and γlss is the rate of conversion of CaO to CaCO3 in LSS.
-
MOR.
MOR is mostly used for the plastering of interior walls, with a typical thickness of 20 mm (Almanac of China building materials industry, 2023). Under natural conditions, the estimated carbonation rate of MOR is 1 mm d−0.5 (Ventol et al., 2011). Therefore, according to Fick's law of diffusion, a year is insufficient for the complete carbonation of a MOR layer. Consequently, the uptake of CO2 by MOR is calculated using the following expressions:
where L2 is the proportion of lime used in the construction sector, a4 denotes the proportion of lime in MOR that is utilized in the construction sector, fmor,i represents the carbonation ratio of MOR in the ith year, γmor is the rate of conversion of CaO to CaCO3 in MOR, dmor,i represents the depth of carbonation of MOR in the ith year, kmor denotes the rate of carbonation of MOR, tmor is the duration of carbonation of MOR, and dT is the thickness of MOR.
2.3.3 Assessment of uptake during the waste disposal stage
Lime employed in the production of paper, aluminum, calcium carbide, and steel generates by-products including lime mud (LM, CLM,i), red mud (RM, CRM,i), carbide slag (CS, Ccs,i), and steel slag (SS, Css,i), respectively. The alkaline component (CaO) in these wastes absorbs CO2 under natural conditions.
-
LM and RM.
Lime mud particles that are involved in the production of paper are usually fine and evenly distributed (Ma et al., 2021). In fact, particles <40 µm account for 93 %, and the associated water contents range from 39 % to 60 % (Qin et al., 2015). However, as a paste, the penetration of CO2 to react with the lime mud is limited. Consequently, a year is usually insufficient for the complete carbonation of lime mud.
Red mud is also characterized by fine particles as well as a porous structure, high specific surface area, and good stability in water (Wang et al., 2019). Similar to the principle of the carbon sink for lime mud, a year is insufficient for the complete carbonation of red mud (Liu et al., 2018a). The amount of CO2 absorbed by lime in lime mud and red mud can be calculated using the following expression:
where εm,ij denotes the mass of CaO in wastes (m,j= lime mud or red mud) that can be carbonated in year i; mp,ij is the quantity of paper and paperboard/alumina that are produced in the ith year, where “p” is the production; rm,ij is the output rate of waste j; and represents the concentration of CaO in waste j.
According to Fick's law of diffusion, the depth of carbonation of waste j (dm,ij) can be obtained from the carbonation rate (km,j) and carbonation time (ti) using the following equations:
where Rm,ij represents the fraction of waste j that is carbonated in the ith year, hm,j is the height of the waste j pile, and tm,j is the duration of the yard of the waste j. Accordingly,
where Cm,ij is the uptake of CO2 uptake of waste j during the ith year, denotes the utilization rate of waste j, and γm,j is the rate of conversion of CaO to CaCO3 in lime mud.
-
CS.
Carbide slag comprises particles that are dominantly between 10–50 µm, which usually contain moderate amounts of water (Lin et al., 2006). Stacking for approximately 15 d can reduce the concentration of CaO by approximately 50 % (Hao et al., 2013). The uptake of CO2 by CS can be calculated using the following expressions:
where εcs,i is the mass of CaO in CS in the ith year, a5 denotes the proportion of lime in calcium carbide that is utilized in the chemical industry, represents the output of calcium carbide per tonne of lime input, rcs is the output rate of CS, is the concentration of CaO in CS, is the utilization rate of CS, and γcs is the rate of conversion CaO to CaCO3 in CS.
-
SS.
SS cannot be carbonated within a year, because its hydration commonly requires more than 4 years (Wang and Yan, 2010). In the present study, the SS particle was approximated as a uniformly densified sphere. The fraction (Rs,i) of SS that is carbonated can be estimated using the following expressions (Xi et al., 2016):
where Dss,i is the maximum diameter of SS that completes carbonation in the ith year, dss,i represents the depth of carbonation of SS in the ith year, kss is the rate of carbonation of SS, ti is the carbonation duration, and D is the diameter of SS. a and b represent the corresponding minimum and maximum diameters of SS particles in a given size distribution. The annual carbonation of SS (Css,i) can then be calculated using the following expressions:
where εss,i is the mass of CaO in SS in the ith year, ms,i represents the mass of crude steel that was produced in the ith year, rss is the output rate of SS, is the concentration of CaO content in SS, is the ratio of SS utilized as stacking and roadbed material, and γss is the rate of conversion of CaO to CaCO3 in SS.
2.4 Calculation of annual and cumulative uptakes
Even though the uptake of carbon can be estimated using alkaline materials in different stages of the lime cycle, the global and regional CO2 absorption values were obtained via the aggregation of all alkaline materials. In global and regional carbon sink accounting, parameters such as the production of lime, proportion of lime utilized in different sectors, diffusion or carbonation coefficient, output rate, concentration of CaO, conversion ratio of CaO to CaCO3, particle size distribution, and height of lime or red mud pile (among others) were utilized as inputs for the model (see the Supplement, SI-3 Data 1). Basically, for the uptake of CO2 in year ti, the cumulative uptake of CO2 in year ti minus that for year ti−1 can be obtained from the following expression:
This allows the contribution of the annual uptake of carbon to the total carbonation to be calculated.
2.5 Uncertainty analysis
We identified 16 groups of impact factors associated with the estimation of lime process carbon emission and carbon sequestration, which included 115 input-specific parameters, each with a specific statistical distribution (see the Supplement, SI-3 Data 1). Due to the difficulty in obtaining the true values of the parameters, we employed the Monte Carlo approach recommended by the 2006 IPCC Guidelines for National Greenhouse Gas Inventories to access the uncertainties for the carbon emission and removal of lime materials. We fed the statistical characteristics of the 115 variables into our models, and the simulated carbon emission and removal results were obtained through a 10 000 iteration Monte Carlo simulation. Subsequently, statistical analysis was then performed to derive the median and the corresponding lower and upper bounds of the 95 % confidence intervals (CI) for the carbon uptake and emission of lime materials.
3.1 Aggregated regional and global emissions from the production of lime
The lime yield of various countries is shown in Fig. 2a. To compensate for the underestimation of carbon sink and carbon emissions caused by the lack of data as much as possible (Cao et al., 2019), different data interpolation methods and parameters (as mentioned in the Sect. 2.1) were adopted to fit the lime output for 1930–1948, 1949–1962, and 1963–1995. The different interpolation methods and parameters led to changes in the uncertainty range, as shown in Fig. 2a, which was reflected in the sudden change of data in the node years of piecewise fitting (such as 1948, 1949, and 1963).
Considering the shortcomings of the global lime output statistics, this paper has made corresponding corrections to the global lime output data based on China's lime output data (Fig. 2b). From 1930 to 2001, the cumulative value of compensated global lime production in this study is 7023.30 Mt from the missing data of China. Since 2001, the lime production in this study is a slightly lower than that of USGS, due to the different reference sources of Chinese data. In general, the global lime output fluctuated and increased over time from 139.62 Mt in 1930 to 394.93 Mt in 2019. In the early 1930s, the lime output decreased slightly, which may be due to the impact of the Great Depression and the closure of many factories, resulting in a decrease in the global lime output. In 2020, affected by COVID-19, the lime production dropped slightly to 391.64 Mt (USGS: 427 Mt).
Figure 2c shows the estimated CO2 emissions from lime production processes in China, the USA, ROW, and at a global scale from 1930 to 2020. According to our calculations, the global process CO2 emissions increased from 27.39 Mt C yr−1 (95 % Confident Interval, CI: 8.87–46.86 Mt C) in 1930 to 75.73 Mt C yr−1 (95 % CI: 69.18–82.33 Mt C) in 2020. In the early 1930s, carbon emissions slightly declined due to the impact of lime production and its uncertainty. The uncertainty of lime output can be transferred to the final simulation results of lime carbon emissions. The greater uncertainty of the parameters will lead to greater uncertainty in the simulation results. The results of the 10 000 iteration Monte Carlo simulation show the change trend (Fig. 2c). On a global scale, emissions doubled from 44.63 Mt C yr−1 in 2002 to 75.73 Mt C yr−1 in 2020. During this period (2002–2018), the average annual rate of increase was 2.98 %, which was significantly higher than the rate for 1930–2002 (0.68 %). The cumulative emissions of CO2 from 1930 to 2020 were 3720.16 Mt C (95 % CI: 3166.18–4287.43 Mt C). Emissions decreased in 2009, which was likely caused by the global financial crisis in 2008, during which downstream lime industries experienced severe problems, such as excess produce, low production quantities, and stiff competition (Dong et al., 2010).
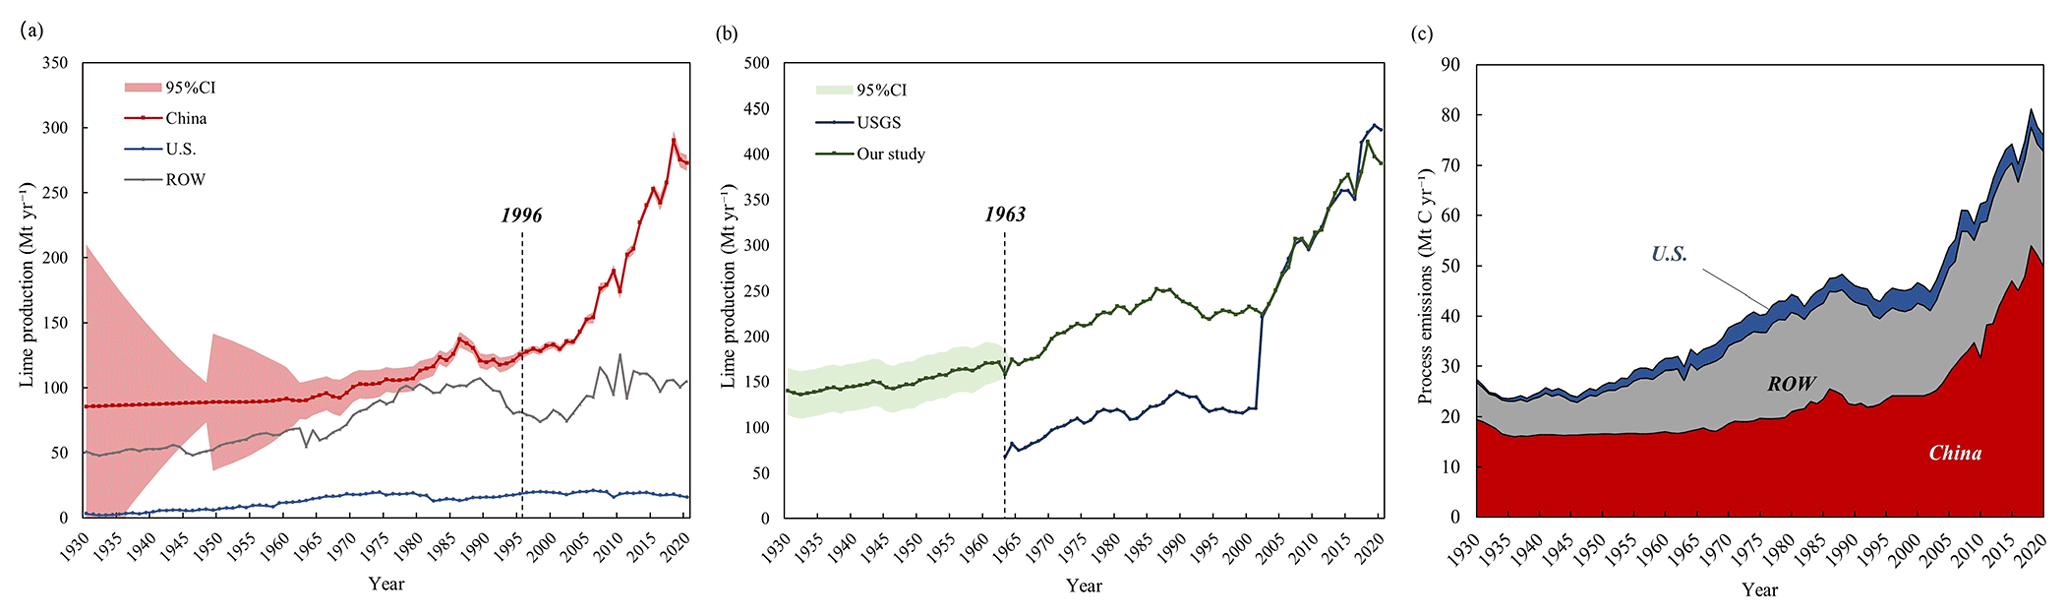
Figure 2(a) Lime production in different countries or regions from 1930 to 2020. Shadows represent uncertainty ranges. CI: Confidence interval. (b) Global lime production from 1930 to 2020. (c) Annual CO2 emissions from industrial processes.
CO2 emissions from 1930 to 2020 in China account for approximately half of the global total. China was primarily responsible for the increase in the global emission from lime production processes during the studied period. In China, from 1930 to 2020, the average annual lime process CO2 emission was 23.08 Mt C yr−1, with 1.06 % average annual growth rate. Notably, a rapid global increase in CO2 emissions started in 2002. From 2002 to 2020, the average annual growth rate of carbon emissions from lime was 4.03 %, which was far higher than that of 1930 to 2001 (0.32 %). This was mainly due to the steady growth of China's macro economy after 2002. This finding was consistent with estimates from studies on the uptake of carbon by cement carbon based on similar approaches (Cui et al., 2019). These results are closely linked to the development of downstream sectors of the lime industry in China, such as the iron and steel, light and chemical, and construction and materials industries (Shan et al., 2016). In 2020, CO2 emissions in China from lime production processes reached 49.93 Mt C yr−1 (95 % CI: 44.18–55.94 Mt C), and the cumulative emission was 2100.39 Mt C (95 % CI: 1606.96–2620.93 Mt), accounting for 56.33 % of the global total. The current figure exceeds the 46.91 Mt C yr−1 forecasted for 2020 by Tong et al. (2019), which can be attributed primarily to the emission reduction scenarios they considered, assuming a technology penetration rate of 5 % for CCUS (carbon capture, utilization, and storage) in China by 2020. However, it is important to note that as of 2020, CCU technology was seldom employed in China's lime industry. Therefore, the actual amount of carbon emissions produced by lime manufacturing is likely to be higher than in the scenario considered by Tong et al. (2019). Thus, our calculations are reasonable.
In the USA, from 1930 to 2020, CO2 emissions from lime production processes remained at around 2.72 Mt C yr−1, and the cumulative emissions by 2020 were approximately 247.30 Mt C, which represents 6.63 % of the global total. This relatively low value is because of a fairly stable production of lime in the USA and significant import of lime from Canada (USGS, 2022b). Relatedly, for the ROW, the cumulative emission was 1380.77 Mt C, which represents 37.03 % of the global total.
3.2 Lime uptake of carbon by regions
According to the lime carbon sequestration model, the global uptake of CO2 by lime-containing materials increased from 9.16 Mt C (95 % CI: 1.84–18.76 Mt C) in 1930 to 34.84 Mt C (95 % CI: 23.50–49.81 Mt C) in 2020, representing an average annual growth rate of 1.50 % (Fig. 3a). Figure 3b shows the annual uptake of CO2 in different regions, where the area represents the cumulative uptake in each region under natural conditions. In the early 1930s, the carbon sink of lime was affected by the uncertainty of lime production parameters, and the trend was slightly decreased, which was similar to the change of carbon emissions in lime industrial process. Cumulatively, 1444.70 Mt C (95 % CI: 1016.24–1961.05 Mt C) was sequestered by lime-containing materials between 1930 and 2020. This means that 38.83 % of CO2 emissions from the production process of calcining limestone process were offset by lime carbon uptake at the same stage (1930–2020). The highest sequestration was in China (∼63.95 %, 918.41 Mt C) because of the associated high production of lime materials (China Statistical Yearbook, 2022), followed by the ROW (∼34.35 %, 474.35 Mt C) and US (∼3.01 %, 43.28 Mt C). China's lime carbon sink is greatly affected by lime production, so its change is actually similar to that of lime production. The change of China's lime carbon sink was not obvious before the 20th century, fluctuating around 7.95 Mt C yr−1. Until 2002, the total amount of carbon sink increased year by year with the increase of lime production. As seen in Fig. 3a, in China, lime carbon uptake increased from 10.52 Mt C in 2002 to 24.46 Mt C in 2020. Taking into account the data from 1930 to 2001 that we have fitted, we have compensated for the underestimation of China's lime carbon sink (cumulative 467.85 Mt C). Affected by COVID-19, the amount of China's lime carbon sink decreased in 2020 compared with that in 2019 (about 24.94 Mt C). For other regions, lime carbon sinks in the United States (from 0.08 Mt C in 1930 to 0.66 Mt C in 2020) and the ROW (from 1.49 Mt C in 1930 to 9.24 Mt C in 2020) showed an overall trend of increasing over time.
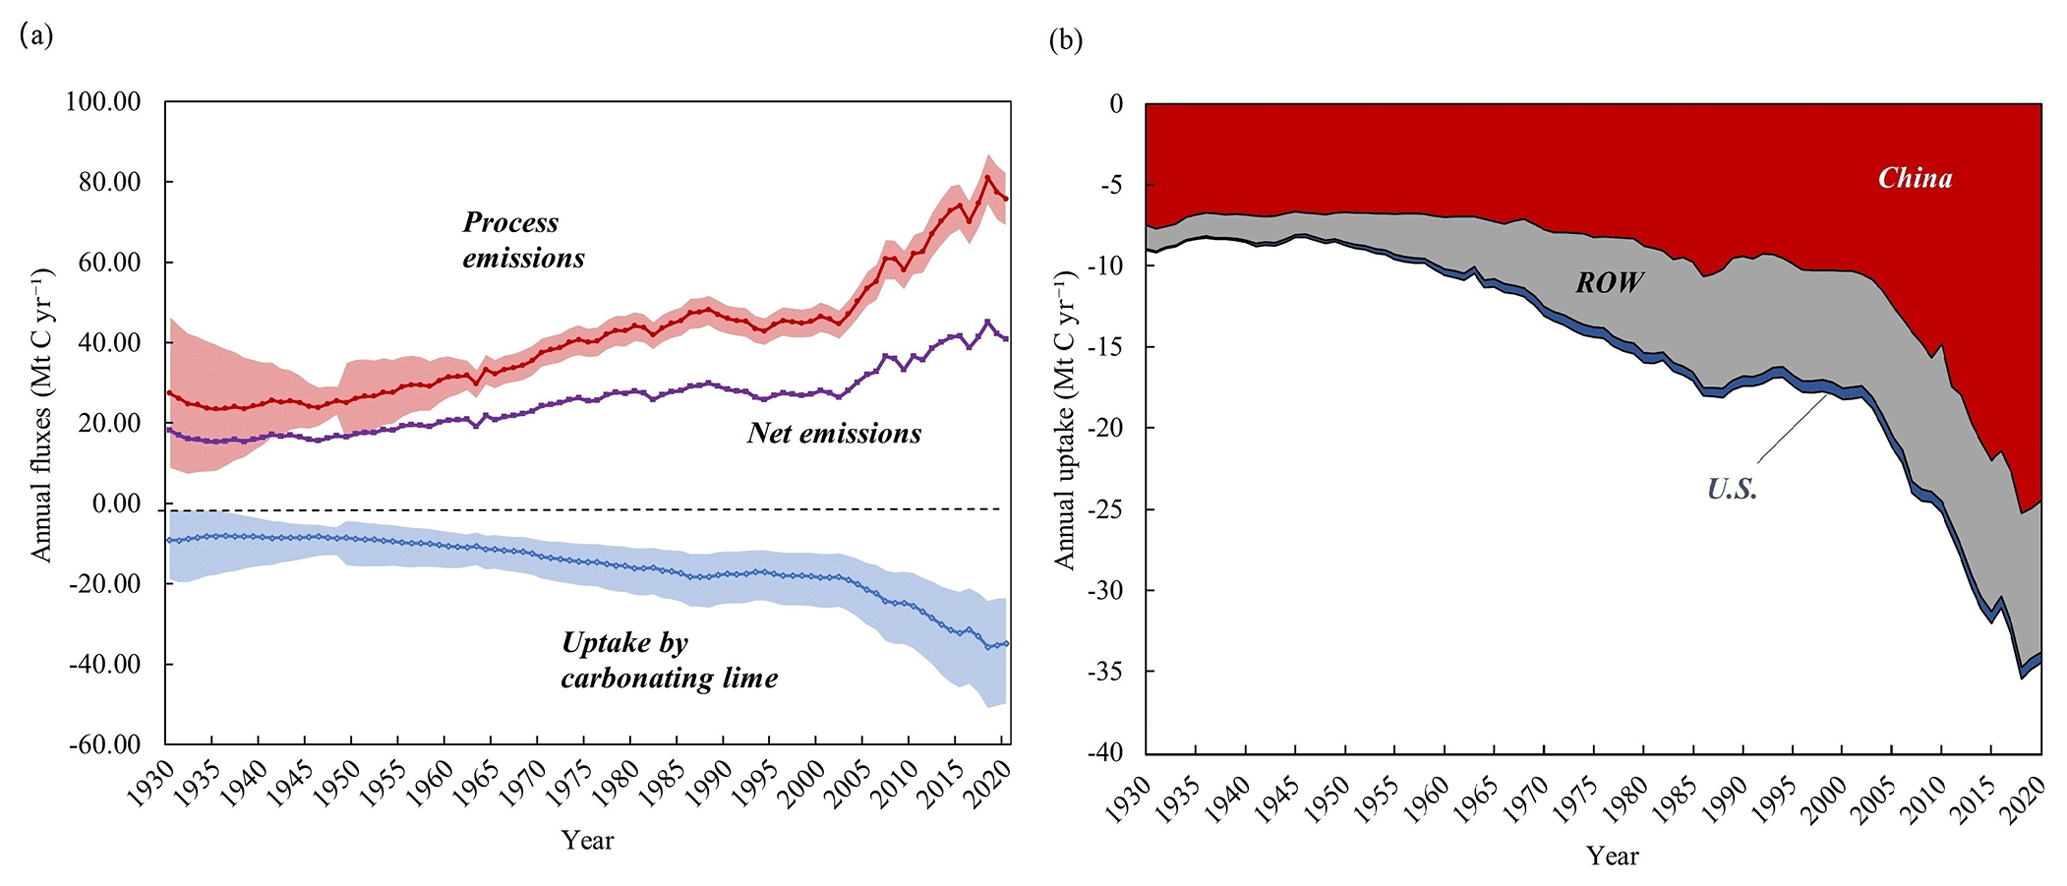
Figure 3(a) Net lime emissions from 1930 to 2020. Shadows represent uncertainty ranges. (b) Annual uptake of carbon dioxide by lime in different regions. ROW: rest of the world.
The cumulative uptakes of CO2 by lime materials in different regions are displayed in Fig. 4. Notably, the top three lime-containing materials (LSS, MOR, and SS) accounted for 82.73 % of the total global CO2 uptake by lime. Regarding China, the cumulative uptake of CO2 by all lime materials was 918.41 Mt C, and the amount of CO2 that was removed by LSS (487.15 Mt C) exceeded the sum removed by all other materials. In the USA, the uptake was dominated by carbonating SS, LSS, and SUG. The cumulative carbon sink values of these three materials were 14.80, 7.26, and 6.69 Mt C, respectively. In the ROW, SS (175.72 Mt C), LSS (125.05 Mt C), and MOR (61.67 Mt C) were the top three materials.
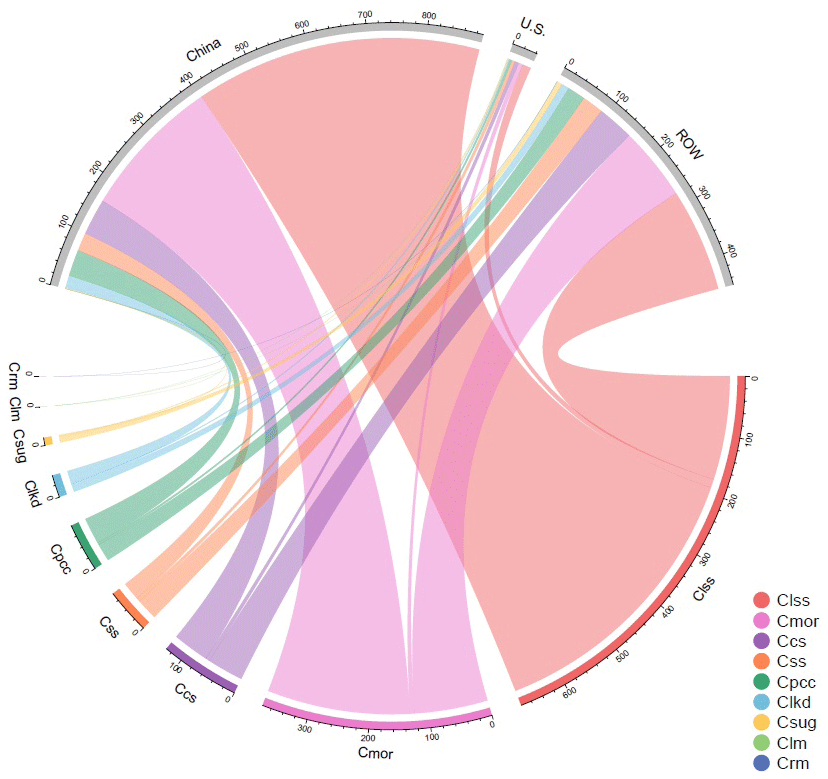
Figure 4Cumulative uptake of CO2 uptake by lime-containing materials in different regions. ROW: rest of the world, Ccs: CO2 uptake by carbide slag, Clkd: CO2 uptake by lime kiln dust, Clss: CO2 uptake by lime-stabilized soil, Cmor: CO2 uptake by lime mortar, Cpcc: CO2 uptake by Precipitated calcium carbonate, Crm: CO2 uptake by red mud, Css: CO2 uptake by steel slag, Csug: CO2 uptake by carbonation sugar, and Clm: CO2 uptake by lime mud.
3.3 Uptake of CO2 in different stages of the lime cycle
Among the stages of the lime cycle, the service stage accounted for the highest uptake of CO2 (1076.97 Mt C) from 1930 to 2020, representing 76.21 % of the total. The uptake of CO2 during the production and waste disposal stages were 36.95 and 299.19 Mt C, respectively (Fig. 5).
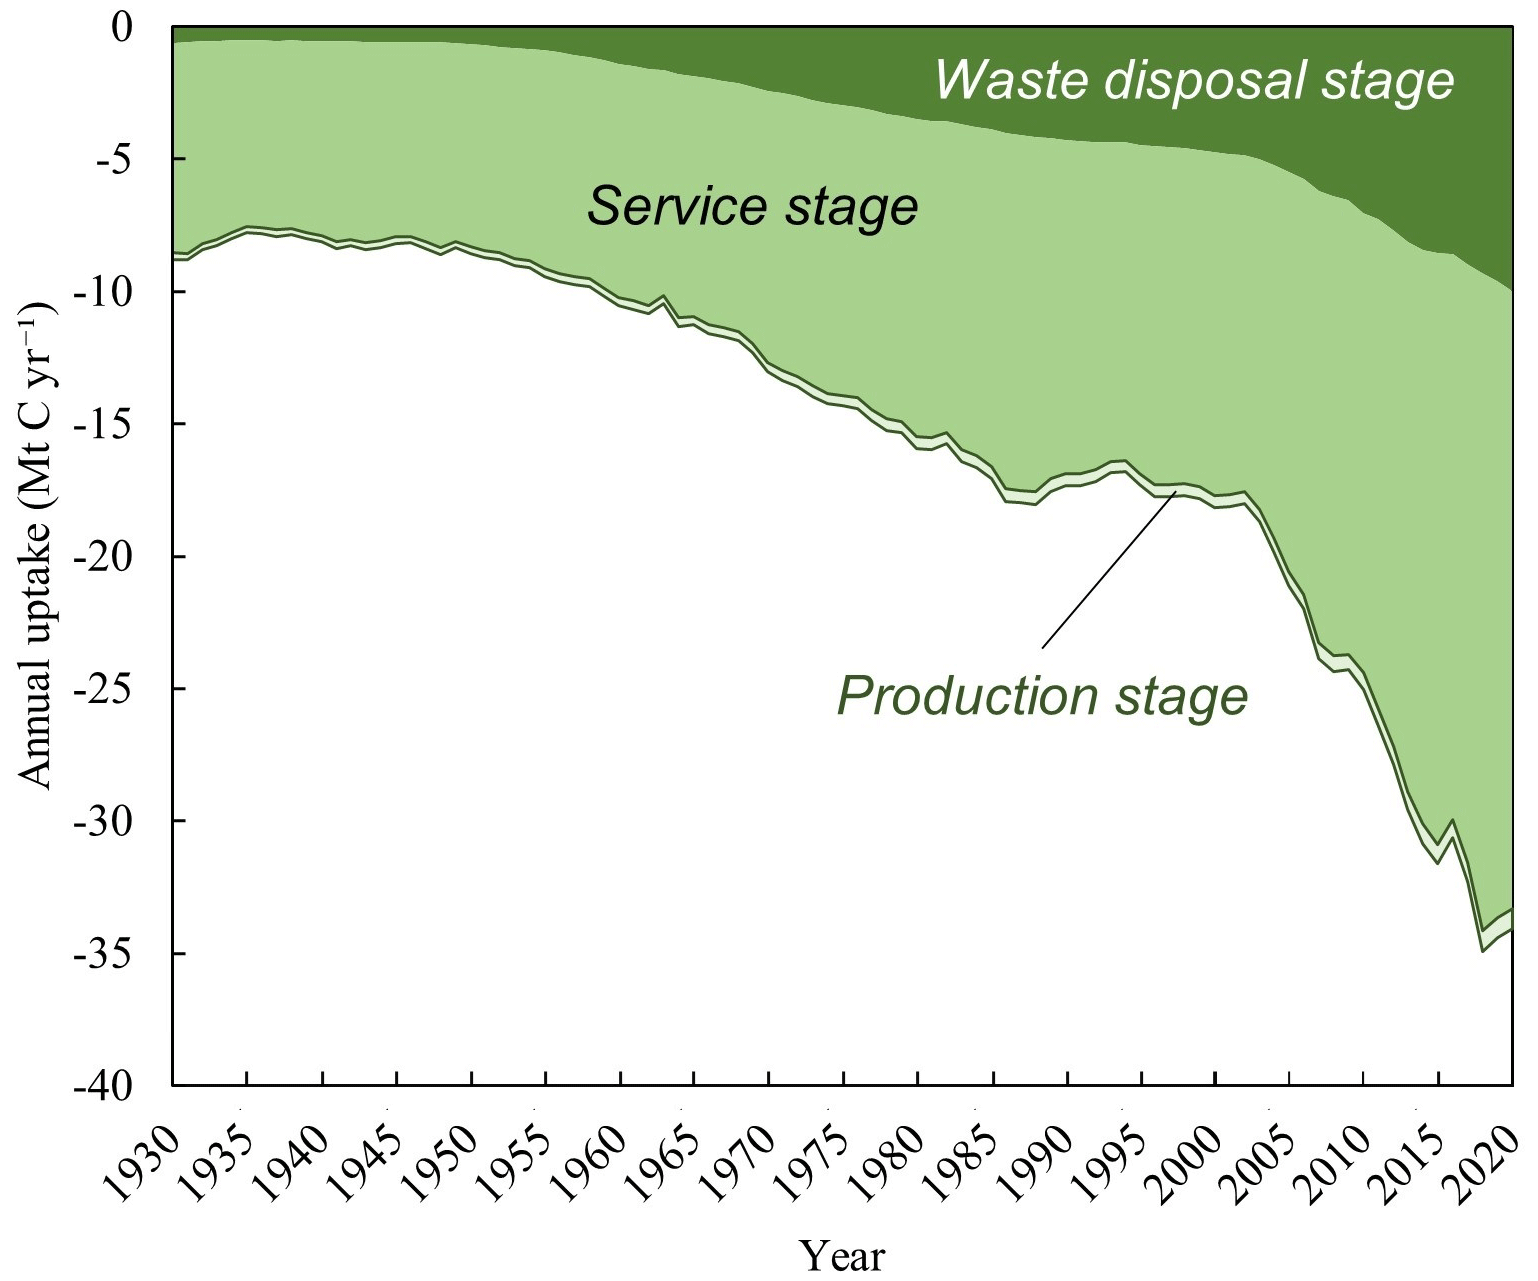
Since 1930, the production stage is associated with a significant output of lime kiln dust (LKD), which is a by-product of the production of lime. The uptake of CO2 by LKD in 2020 was 0.74 Mt C. This contribution is attributed to the development of the lime industry and increase in the disposal of LKD in landfills (Latif et al., 2015). The concentration of CaO in the ash of lime kilns is approximately 54.88 %; thus, this continuously absorbs CO2 in landfills (Bobicki et al., 2012).
The annual and cumulative uptake of carbon by lime materials during the service stage varied significantly, but these produced the following trend: LSS > MOR > PCC > SUG (Table 1). As commonly used building materials, LSS and MOR correspondingly removed 629.43 and 316.89 Mt C. Considering the consumption of lime in the construction sector over the past five decades and its increasing utilization worldwide, especially in China and other developing countries, its uptake of CO2 will certainly increase in the future (Renforth, 2019). The carbon fixation amounts of PCC and SUG of 84.98 and 45.68 Mt C, respectively, are accounting for <10 % of the total uptake during the utilization stage.
Table 1Summary of the global uptake of CO2 by lime-containing materials in different stages of its cycle.
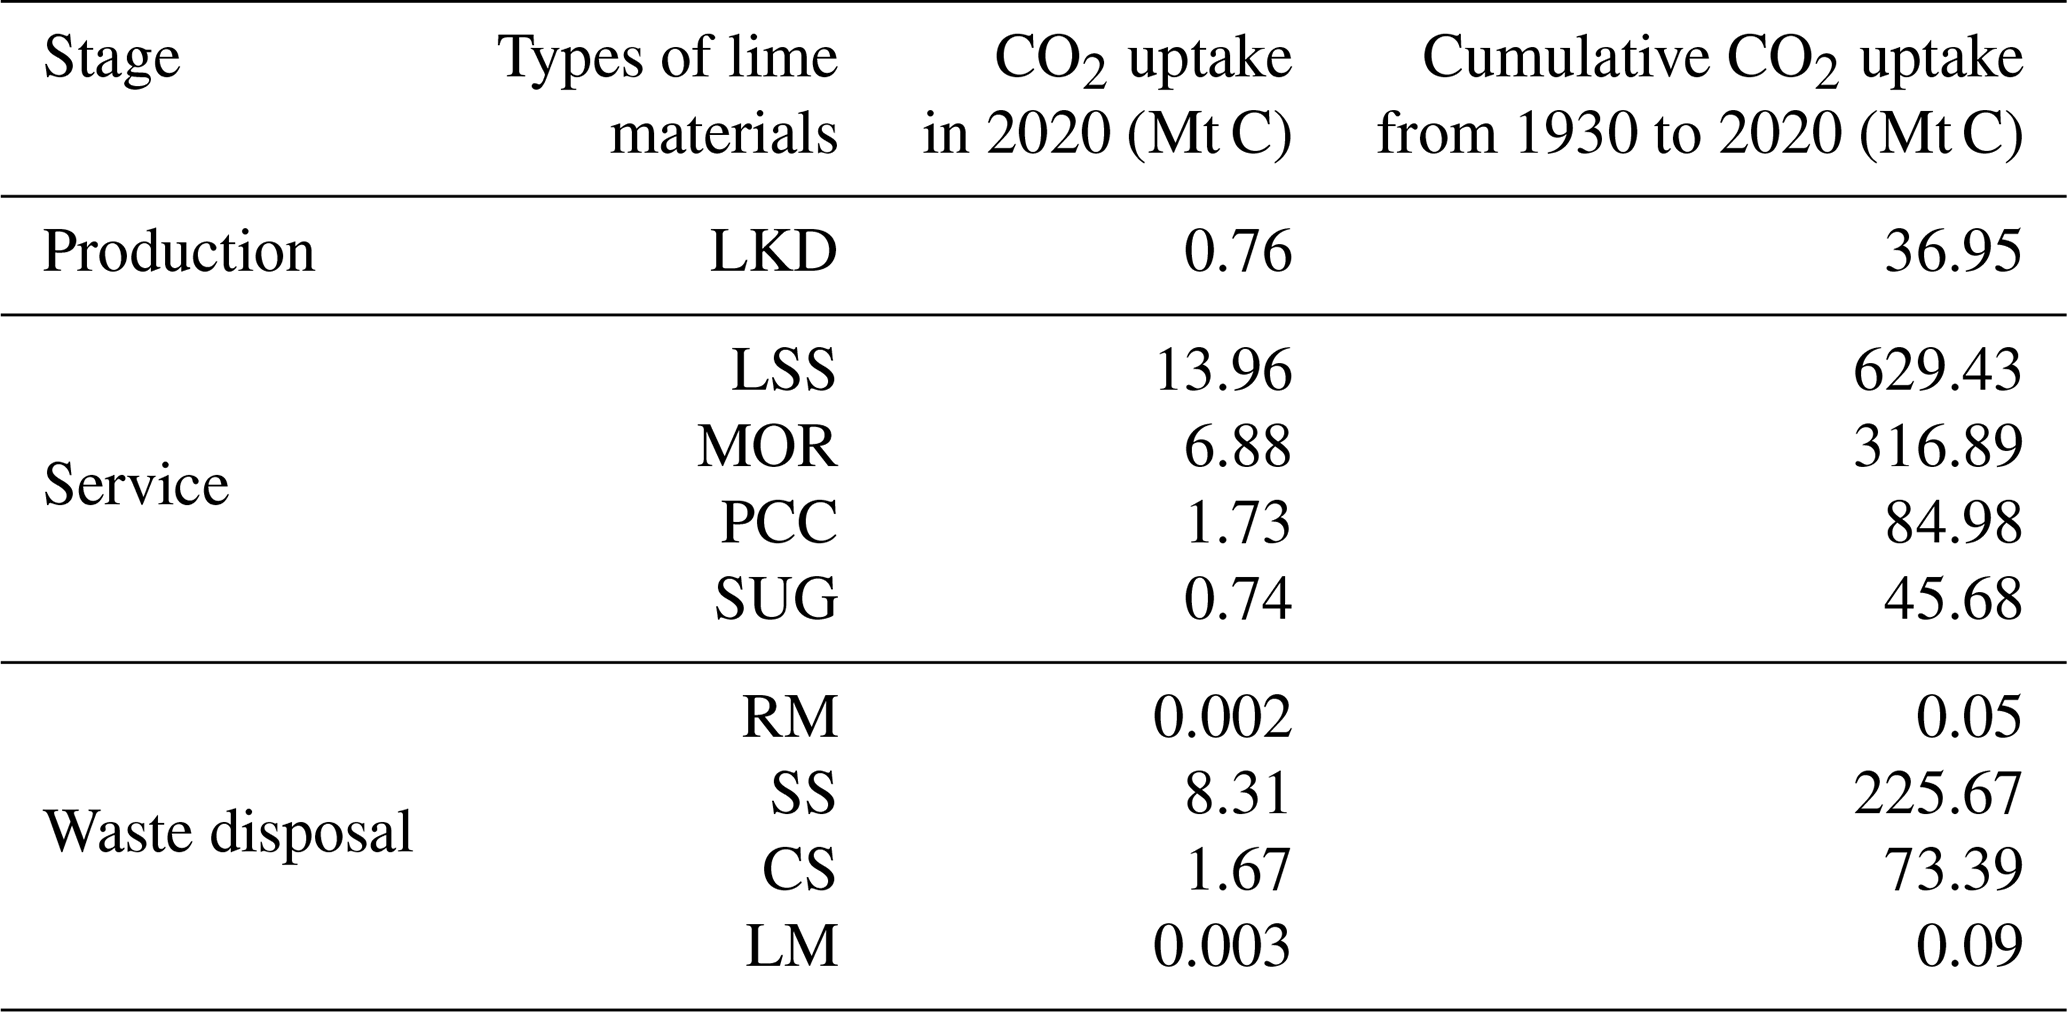
LKD: lime kiln dust, LSS: lime-stabilized soil, PCC: precipitated calcium carbonate, SUG: carbonation sugar, RM: red mud, SS: steel slag, CS: carbide slag, LM: lime mud.
Regarding the waste disposal stage, CO2 absorption was mainly associated with carbonation of SS (Table 1). The cumulative uptake estimated in the present study was 225.67 Mt C. The iron and steel industry, which is a basic industry in industrialized countries, produces approximately 180–270 Mt of SS annually (USGS, 2022a). However, the alkaline content of SS is due to the large amount of lime used in the iron- and steel-making process. Therefore, SS sequesters a large amount of CO2 in stockpiles and as roadbed material (Bobicki et al., 2012). Owing to its elevated concentration of Ca(OH)2, high specific surface area, and efficient carbonation process, CS is linked to the sequestration of approximately 73.39 Mt C (Huang et al., 2004; Hao et al., 2013). The total uptake of RM and LM is approximately 0.14 Mt C (Table 1). This low uptake is assigned to the high content of water in these wastes, which hinders the diffusion of CO2 into their particles under exposure.
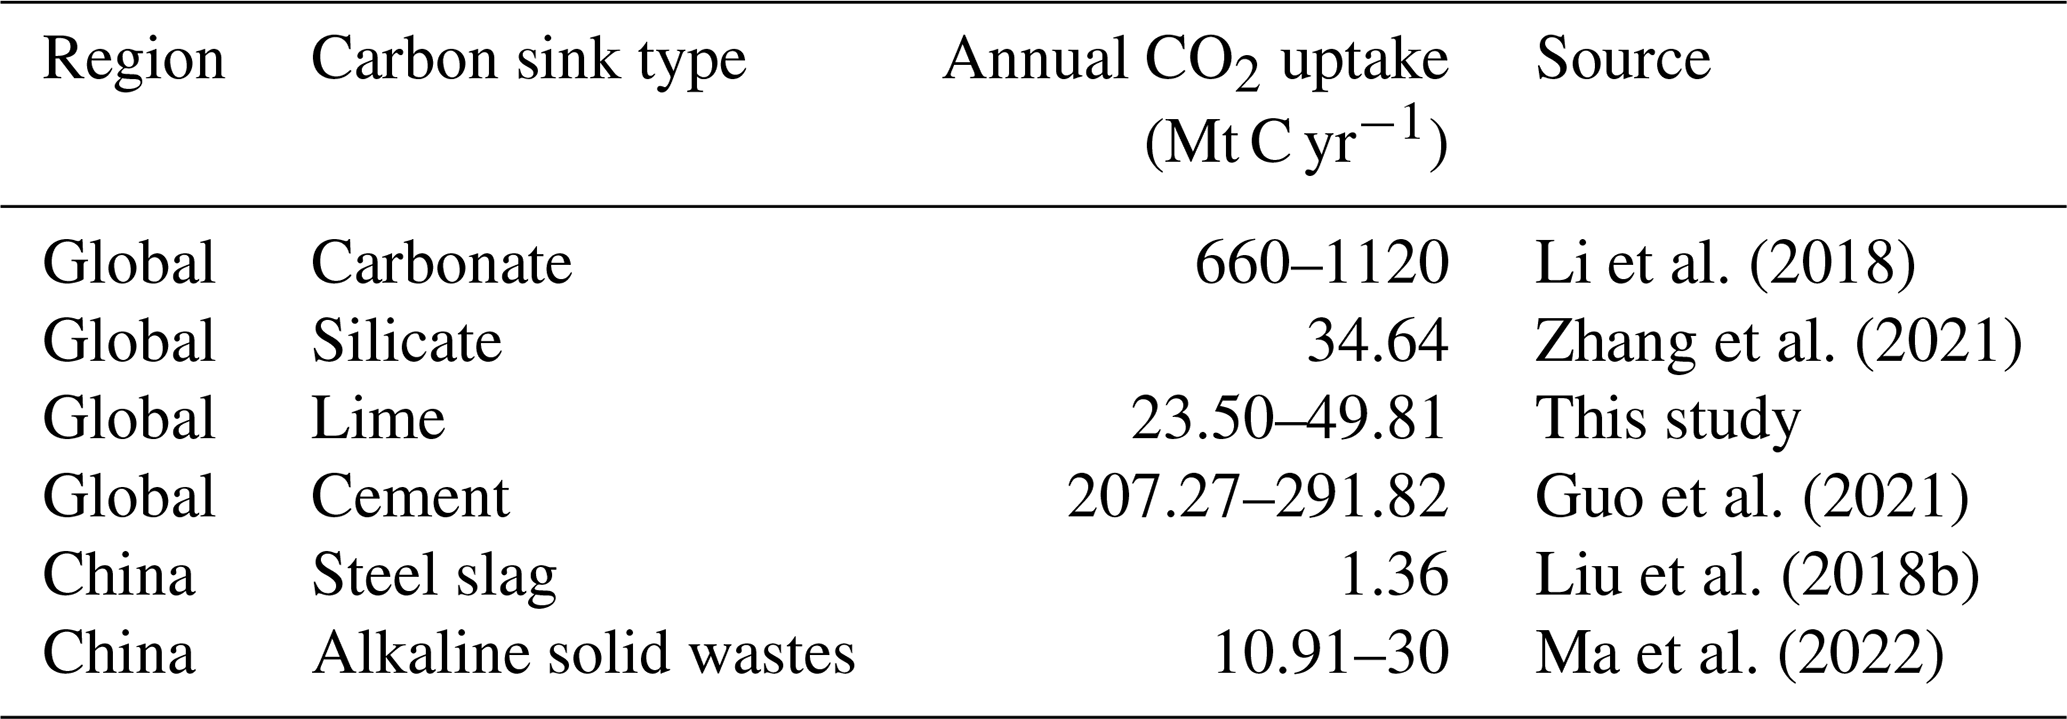
Table 2Comparison of CO2 uptake by different types of materials.
Although the national greenhouse gas inventories guideline involves methods for quantifying CO2 emissions that are linked to lime production processes, carbon sequestration of lime was not considered in the IPCC (IPCC, 2006). According to the analysis conducted in the present study, the uptake by lime-containing materials rapidly increased from 1930 to 2020 in all stages of the lime cycle. In 2020, the global uptake of CO2 by lime was equivalent to 1.02 % of the global industrial process emissions of CO2; therefore, neglecting this sink caused an overestimation of the global carbon emission from industrial processes. The carbon sink increases over time, but this increase is due to an increase in production. It seems that both the increase in the sink and the emissions are proportional to each other. Our research results on carbon emissions and carbon absorption are significantly impacted by lime production. However, due to the lack of available data on annual lime production in China and worldwide during the early years, we used fitting methods to fill the gap of lime production and estimate it up to 1930. The statistically inferred 95 % confidence interval was then used as the uncertainty range for lime production. To incorporate this uncertainty range into the accounting model for carbon sequestration and carbon emissions, we used Monte Carlo simulations, and after 10 000 iterations we obtained the final accounting results for carbon sequestration and carbon emissions. Therefore, from the interpolation of production data to the final accounting of carbon sinks and carbon emissions, all potential sources of uncertainty have been fully considered in the accounting process. Thus, this is a crucial way to obtain lime carbon sink and carbon emissions data from 1930 to 2020 under current data conditions. However, as our understanding of basic data and the mechanisms of lime production, carbon sequestration, and carbon emissions deepens and as we improve our activity level data, such as lime-based material utilization, waste stacking, and recycling rates, and optimize carbonation parameters under different exposure conditions, there is still considerable potential for improving the accuracy of long time series lime material carbon sequestration and carbon emission accounting.
Regarding the global carbon cycle, lime's annual carbon uptake is estimated to be approximately 1.09 % of the average global land carbon sink from 2010 to 2020, which was approximately 3.18 Gt C yr−1 (Friedlingstein et al., 2022). This indicates that CO2 uptake by lime contributes to the global carbon cycle and should be taken into account for better accuracy in national emission inventories. Therefore, if the lime sink is incorporated, the global carbon budget, which already includes data for carbon sinks of the ocean, land, and cement, can be improved.
To further illustrate the function of lime as a carbon sink, the results obtained in the present study were compared with data for the uptake of CO2 by materials containing different minerals (Table 2). Rocks containing silicate and carbonate minerals are abundant in nature and are continuously extracting CO2 from the atmosphere. According to recent studies, the annual average amounts of carbon sequestered by natural carbonate and silicate minerals are 890 and 34.64 Mt C yr−1 (Li et al., 2018; Zhang et al., 2021). However, the weathering of these minerals resulting in sequestration of CO2 from the atmosphere occurs over a timescale of at least 104 years (Berner et al., 1983).
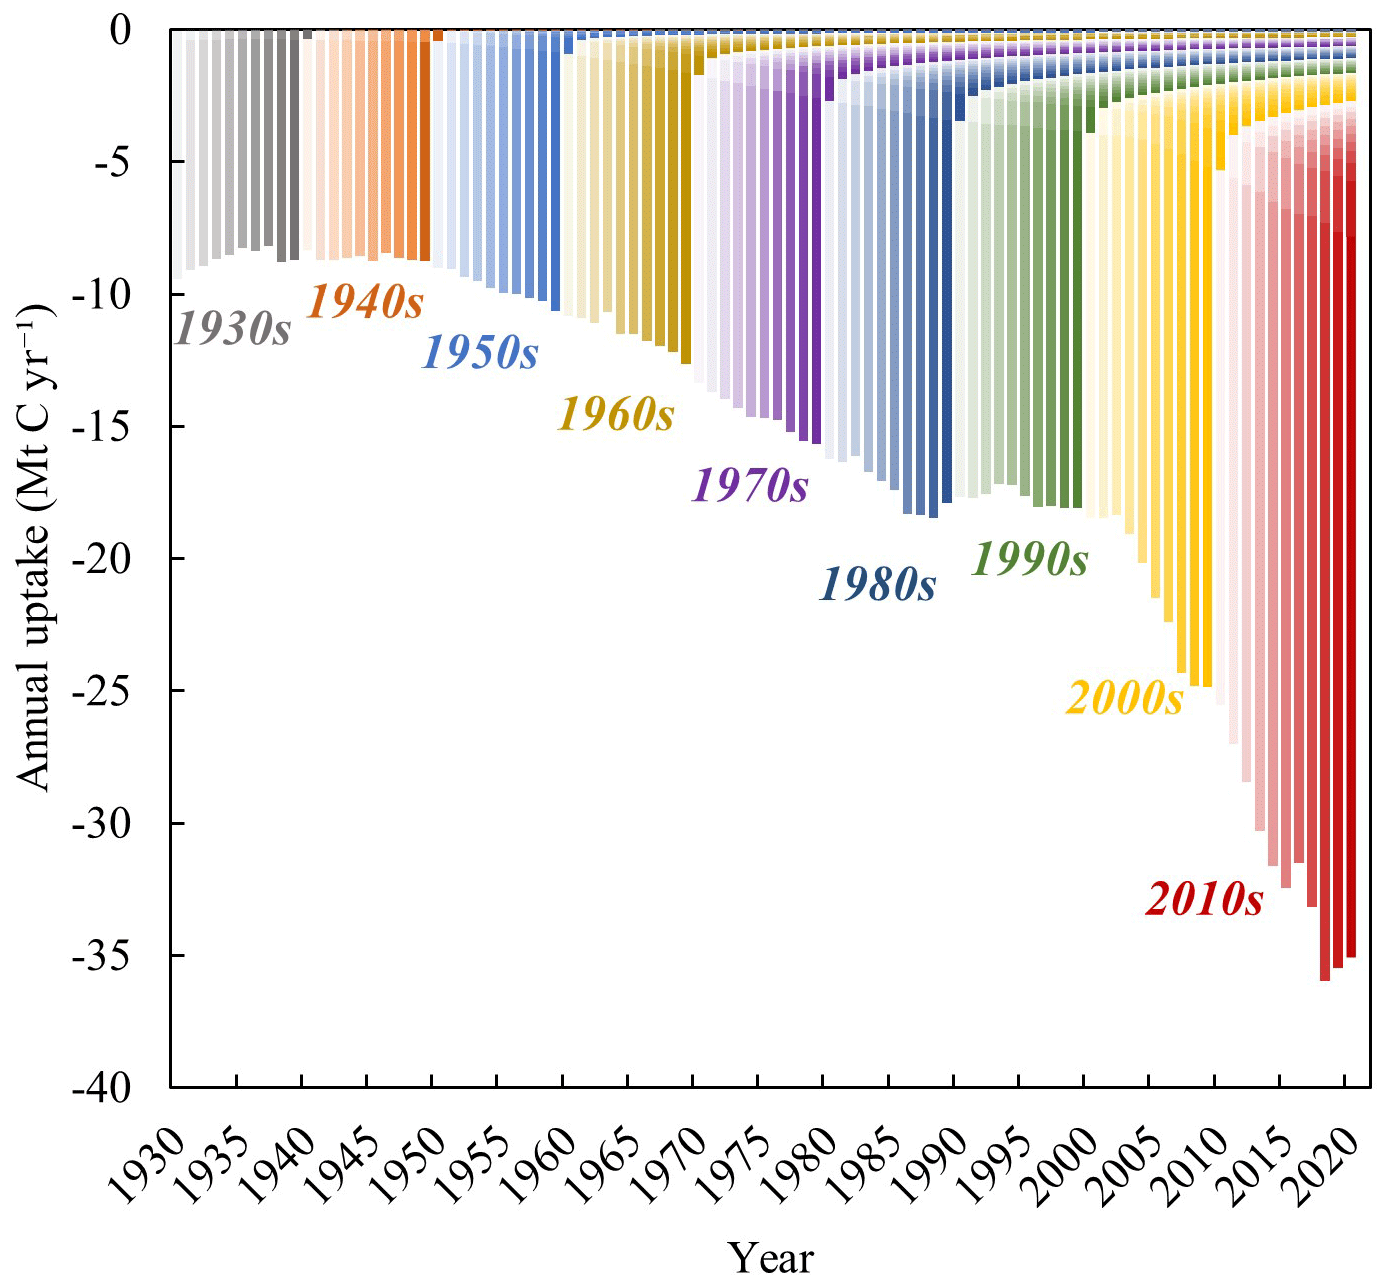
Figure 6Worldwide annual uptake of atmospheric CO2 by lime, disaggregated by years of production.
Obviously, compared to natural carbonate and silicate minerals, the carbonation process involving alkaline materials produced by human activities, such as cement, SS and other solid wastes, is relatively faster under natural conditions (Berner et al., 1983). Lime materials, such as MOR and SS, similar to cement and natural materials, also remove CO2 from the atmosphere for several years or decades (Fig. 6). The uptake of CO2 in each year includes lime materials that were generated or consumed in previous and current years: the former accounts for 15.59 % of the total uptake, whereas the latter accounts for 84.41 %. These results contrast with those obtained for the cement carbon sink, where most of the carbon absorption is linked to previous years. This difference is attributed to the higher calcium content, smaller particle size, and more active chemical properties of lime materials. These characteristics suggest that lime-containing materials, especially LKD and SS, are suitable for carbon capture and storage via mineralization. Furthermore, conducting optimization studies on carbonation parameters under different exposure conditions and exploring the feasibility of employing CCUS technology for lime-based materials could significantly advance research on lime carbon sequestration and mitigate impacts of CO2 emissions (Pan et al., 2020).
All the original datasets of CO2 uptake by lime are available at https://doi.org/10.5281/zenodo.7896106 (Ma et al., 2023). This dataset contains three data files, including lime material production and uses, lime carbon emission and uptake results, and the uncertainty of lime carbon emission and uptake.
-
SI-1 Lime carbon emission and uptake results, 1930–2020
- –
Data 1. Annual carbon uptake by lime material and region
- –
Data 2. Global carbon uptake by lime material and stage
- –
Data 3. Global carbon uptake by region
- –
Data 4. Annual global carbon uptake by lime material and relevant lag time, 1930 to 2020
- –
Data 5. Cumulative process CO2 emissions from lime production by region and category, 1930 to 2020
- –
Data 6. Global process CO2 emissions from lime production and carbon uptake by lime materials carbonation from 1930 to 2020
- –
-
SI-2 Lime material production and uses, 1930–2020
- –
Data 1. Lime production by region, 1930 to 2020
- –
Data 2. Estimated production of lime in China, 1930 to 2020
- –
Data 3. Estimated global lime production, 1930 to 2020
- –
Data 4. Parameters of lime production fitting model
- –
Data 5. Paper and paperboard production by region, 1930 to 2020
- –
Data 6. Steel production by region, 1930 to 2020
- –
Data 7. Alumina production by region, 1930 to 2020
- –
Data 8. Output rate by material
- –
Data 9. Estimates of lime used for different industries by region
- –
-
SI-3 Uncertainty of lime carbon emission and uptake, 1930–2020
- –
Data 1. Variables considered in the uptake uncertainty analysis using a Monte Carlo method
- –
Data 2. The uncertainty of CO2 emissions from lime production
- –
Data 3. The uncertainty of lime carbon uptake
- –
In the present study, a carbon sequestration model was utilized to quantify the global uptake of CO2 by lime-containing materials from 1930 to 2020. The national greenhouse gas inventories guideline and global carbon budgets could be improved by accounting for lime uptake, which can offset approximately 38 % of emissions from industrial lime processes. The main findings of the present study are summarized below.
Global CO2 uptake from lime production processes increased from 9.16 Mt C yr−1 in 1930 to 34.84 Mt C yr−1 in 2020. However, the cumulative uptake of CO2 by lime-containing materials (1444.70 Mt C) offset approximately 38.83 % of these emissions. The uptake was highest in China (918.41 Mt C; 63.95 % of global total) because of the associated elevated production and consumption of lime in recent decades. Uptake values in the ROW and USA were 474.35 and 43.28 Mt C, respectively.
The uptake of CO2 by lime-containing materials varied significantly at different stages of the lime cycle. In the utilization stage, lime-containing materials, especially LSS and MOR, contributed the most to the total lime carbon sink (1076.97 Mt C). This was followed by sequestration in lime materials (mainly SS and CS) during the waste disposal stage (299.19 Mt C), whereas the production stage was associated with 36.95 Mt C. The sinks associated with the lime lifecycle should not be neglected; instead, they should be taken into account in future studies of the carbon cycle.
Historically, weathering of lime-containing materials was thought to occur over a large timescale. In the present study, it was revealed that approximately 15.59 % of the annual uptake of CO2 originated from lime that was produced in previous decades; therefore, this absorption potential cannot be ignored. In the future, carbon capture and storage can be improved via the use of lime-containing materials (e.g., SS and LKD).
The supplement related to this article is available online at: https://doi.org/10.5194/essd-15-2431-2023-supplement.
LB and MM designed the study and prepared the paper with assistance from FX, JW, and LL. LL and MM performed the analyses, with the help of FX and LB on the analytical approaches. MM and LN performed the post-processing and analysis of the data as well as the review of the paper. LL and LB established the lime carbon sink accounting database, whereas LB and FX wrote the code and performed simulations of the datasets, with assistance from LL, MM, and LN. FX conceptualized and supervised the study.
The contact author has declared that none of the authors has any competing interests.
Publisher's note: Copernicus Publications remains neutral with regard to jurisdictional claims in published maps and institutional affiliations.
Longfei Bing, Mingjing Ma, and Fengming Xi acknowledge funding from the National Natural Science Foundation of China (grant no. 41977290), CAS President's International Fellowship Initiative (grant no. 2017VCB0004), Youth Innovation Promotion Association, Chinese Academy of Sciences (grant nos. 2020201 and Y202050), Liaoning Xingliao Talents Project (grant no. XLYC1907148), and Natural Science Foundation of Liaoning Province (grant no. 2021-MS-025).
This research has been supported by the National Natural Science Foundation of China (grant no. 41977290), the Natural Science Foundation of Liaoning Province (grant no. 2021-MS-025), and the Youth Innovation Promotion Association (grant nos. Y202050 and 2020201).
This paper was edited by Kuishuang Feng and reviewed by Hélène Peiro and one anonymous referee.
Almanac of China building materials industry, https://www.yearbookchina.com/naviBooklist-n3020013348-1.html, last access: 6 June 2023.
Baciocchi, R.: Carbonation of Industrial Residues for CCUS: Fundamentals, Energy Requirements and Scale-up Opportunities, CO2 Summit III: Pathways to Carbon Capture, Utilization, and Storage Deployment, ECI Symposium Series, https://dc.engconfintl.org/co2_summit3/15 (last access: 8 June 2023), 2017.
Berner, R. A., Lasaga, A. C., and Garrels, R. M.: The carbonate-silicate geochemical cycle and its effect on atmospheric carbon dioxide over the past 100 million years, Am. J. Sci., 283, 641–683, https://doi.org/10.2475/AJS.283.7.641, 1983.
Bhatia, S. and Perlmutter, D.: Effect of the product layer on the kinetics of the CO2-lime reaction, AIChE Journal, 29, 79–86, https://doi.org/10.1002/AIC.690290111, 1983.
Bobicki, E. R., Liu, Q., Xu, Z., and Zeng, H.: Carbon capture and storage using alkaline industrial wastes, Prog. Energ. Combust., 38, 302–320, https://doi.org/10.1016/J.PECS.2011.11.002, 2012.
Cao, Z., Liu, G., Duan, H., Xi, F., and Yang, Y.: Unravelling the mystery of Chinese building lifetime: A calibration and verification based on dynamic material flow analysis, Appl. Energ., 238, 442–452, https://doi.org/10.1016/j.apenergy.2019.01.106, 2019.
China Construction Material Industry Yearbook, https://data.cnki.net/yearBook/single?id=N2022040143 (last access: 27 May 2022), 2022
China Statistical Yearbook: https://data.stats.gov.cn/easyquery.htm?cn=C01, last access: 27 May 2022.
Cizer, Ö., Rodriguez-Navarro, C., Ruiz-Agudo, E., Elsen, J., van Gemert, D., and van Balen, K.: Phase and morphology evolution of calcium carbonate precipitated by carbonation of hydrated lime, J. Mater. Sci., 47, 6151–6165, https://doi.org/10.1007/s10853-012-6535-7, 2012a.
Cizer, Ö., van Balen, K., Elsen, J., and van Gemert, D.: Real-time investigation of reaction rate and mineral phase modifications of lime carbonation, Constr. Build. Mater., 35, 741–751, https://doi.org/10.1016/J.CONBUILDMAT.2012.04.036, 2012b.
Cui, D., Deng, Z., and Liu, Z.: China's non-fossil fuel CO2 emissions from industrial processes, Appl. Energ., 254, 113537, https://doi.org/10.1016/J.APENERGY.2019.113537, 2019.
Despotou, E., Shtiza, A., Schlegel, T., and Verhelst, F.: Literature study on the rate and mechanism of carbonation of lime in mortars/Literaturstudie über Mechanismus und Grad der Karbonatisierung von Kalkhydrat im Mörtel, Mauerwerk, 20, 124–137, https://doi.org/10.1002/DAMA.201500674, 2016.
Dong, Y., Yupin, W., Wang, W., and Dehai, L.: Demonstration Analysis of Chinese Construction Industry Output under Global Financial Crisis, Sci. Technol. Manag. Res., 30, 72–75, 2010.
Friedlingstein, P., O'Sullivan, M., Jones, M. W., Andrew, R. M., Gregor, L., Hauck, L., Le Quéré, C., Luijkx, I. T., Olsen, A., Peters, G. P., Peters, W., Pongratz, J., Schwingshackl, C., Sitch, S., Canadell, J. G., Ciais, P., Jackson, R. B., Alin, S., Alkama, R., Arneth, A., Arora, V. K., Bates, N. R., Becker, M., Bellouin, N., Bittig, H. C., Bopp, L., Chevallier, F., Chini, L. P., Cronin, M., Evans, W., Falk, S., Feely, R. A., Gasser, T., Gehlen, M., Gkritzalis, T., Gloege, L., Grassi, G, Gruber, N., Gürses, Ö, Harris, I., Hefner, M., Houghton, R. A., Hurtt, G. C., Iida, Y., Ilyina, T., Jain, A. T., Jersild, A., Kadono, K., Kato, E., Kennedy, D., Klein Goldewijk, K., Knauer, J., Korsbakken, J. I., Landschützer, P., Lefèvre, N., Lindsay, Keith., Liu, J., Marland, G., Mayot, N., McGrath, M. J., Metzl, N., Monacci, N. M., Munro, D. R., Nakaoka, S.-I., Niwa, Y., O'Brien, K., Ono, T., Palmer, P. I., Pan, N., Pierrot, D., Pocock, K., Poulter, B., Resplandy, L., Robertson, E., Rödenbeck, C., Rodriguez, C., Rosan, T. M., Schwinger, J., Séférian, R., Shutler, J. D., Skjelvan, I., Steinhoff, T., Sun, Q., Sutton, A. J., Sweeney, C., Takao, S., Tanhua, T., Tans, P. P., Tian, X., Tian, H., Tilbrook, B., Tsujino, H., Tubiello, F., van der Werf, G. R., Walker, A. P., Wanninkhof, R., Whitehead, C., Wranne, A., Wright, R. M., Yuan, W., Yue, C., Yue, X., Zaehle, S., Zeng, J., Zheng, B., and Zhu, L.: Supplemental data of the Global Carbon Budget 2022, ICOS-ERIC Carbon Portal [data set], https://doi.org/10.18160/GCP-2022, 2022.
Greco-Coppi, M., Hofmann, C., Ströhle, J., Walter, D., and Epple, B.: Efficient CO2 capture from lime production by an indirectly heated carbonate looping process, Int. J. Greenh. Gas Contr., 112, 103430, https://doi.org/10.1016/J.IJGGC.2021.103430, 2021.
Guo, R., Wang, J., Bing, L., Tong, D., Ciais, P., Davis, S. J., Andrew, R. M., Xi, F., and Liu, Z.: Global CO2 uptake by cement from 1930 to 2019, Earth Syst. Sci. Data, 13, 1791–1805, https://doi.org/10.5194/essd-13-1791-2021, 2021.
Hao, J., Jiang, X., Yang, H., Yang, S., and Li, Z.: Research Progress and Application of Carbide Slag, Guangzhou Chemical Industry, 41, 45–46, 2013.
Huang, C., Deng, Y., Xing, X., and Lu, J.: Comprehensive utilization of carbide slag, Journal of Jiaozuo Institute of Technology (Natural Science), 23, 143–146, 2004.
IPCC: IPCC guidelines for national greenhouse gas inventories, Institute for Global Environmental Strategies (IGES), Hayama (Japan), 2006.
IPCC: Climate Change 2021: The Physical Science Basis. Contribution of Working Group I to the Sixth Assessment Report of the Intergovernmental Panel on Climate Change, Cambridge University Press, Cambridge, 2021.
Lai, Q. T., Habte, L., Thriveni, T., Seongho, L., and Ahn, J. W.: COVID-19 Impacts on Climate Change – Sustainable Technologies for Carbon Capture Storage and Utilization (CCUS), Minerals, Metals and Materials Series, 23–28, https://doi.org/10.1007/978-3-030-65257-9_3, 2021.
Lan, X., Tans, P., and Thoning, K. W.: Trends in globally-averaged CO2 determined from NOAA Global Monitoring Laboratory measurements, Version 2023-06, https://doi.org/10.15138/9N0H-ZH07, 2023.
Latif, M. A., Naganathan, S., Razak, H. A., and Mustapha, K. N.: Performance of Lime Kiln Dust as Cementitious Material, Proced. Eng., 125, 780–787, https://doi.org/10.1016/J.PROENG.2015.11.135, 2015.
Li, H., Wang, S., Bai, X., Luo, W., Tang, H., Cao, Y., Wu, L., Chen, F., Li, Q., Zeng, C., and Wang, M.: Spatiotemporal distribution and national measurement of the global carbonate carbon sink, Sci. Total Environ., 643, 157–170, https://doi.org/10.1016/j.scitotenv.2018.06.196, 2018.
Lin, Q., Wang, X., Cao, J., and Zhang, J.: Preparation of Nanosized Calcium Carbonate from Calcium Carbide Residue, Guizhou Chemical Industry, 3, 5–7, 2006.
Liu, L. L., Ling, J. H., Li, T., Wang, J. Y., and Xi, F. M.: Review of lime carbon sink, Chinese J. Appl. Ecol., 29, 327–334, 2018a.
Liu, L. L., Wang, J., Bing, L., Ling, J., Xu, M., and Xi, F.: Analysis of carbon sink of steel slag in China, Chinese J. Appl. Ecol., 29, 3385–3390, 2018b.
Ma, J., Chen, Y., Xu, D., Xu, F., Xue, S., Fan, B., Liu, D. K., and Ma, S.: Effects of Particle Size difference between White Mud and Limestone on Desulfurization Performance, Journal of Chinese Society of Power Engineering, 6, 497–504, 2021.
Ma, M., Bing, L., Liu, L., Wang, J., Niu, L., and Xi, F.: Global uptake of CO2 by lime from 1930 to 2020, Zenodo [data set], https://doi.org/10.5281/zenodo.7896106, 2023.
Ma, M. J., Ma, M. J., Xi, F. M., Ling, J. H., Ling, J. H., Wang, J. Y., and Quan, S. M.: Research progress on mineral carhonation of carbon dioxide, Chinese J. Ecol., 38, 3854–3863, https://doi.org/10.13292/J.1000-4890.201912.002, 2019.
Ma, M., Guo, R., Bing, L., Wang, J., Yin, Y., Zhang, W., Niu, L., Liu, Z., and Xi, F.: Quantitative analysis of CO2 uptake by alkaline solid wastes in China, J. Clean. Prod., 363, 132454, https://doi.org/10.1016/j.jclepro.2022.132454, 2022.
Pan, S. Y., Chang, E. E., and Chiang, P.-C.: CO2 capture by accelerated carbonation of alkaline wastes: a review on its principles and applications, Aerosol Air Qual. Res., 12, 770–791, 2012.
Pan, S. Y., Chen, Y. H., Fan, L. S., Kim, H., Gao, X., Ling, T. C., Chiang, P. C., Pei, S. L., and Gu, G.: CO2 mineralization and utilization by alkaline solid wastes for potential carbon reduction, Nat. Sustain., 3, 399–405, https://doi.org/10.1038/s41893-020-0486-9, 2020.
Qin, J., Cui, C., Cui, X., Hussain, A., Yang, C., and Yang, S.: Recycling of lime mud and fly ash for fabrication of anorthite ceramic at low sintering temperature, Ceram. Int., 41, 5648–5655, https://doi.org/10.1016/J.CERAMINT.2014.12.149, 2015.
Renforth, P.: The negative emission potential of alkaline materials, Nat. Commun., 10, 1–8, https://doi.org/10.1038/s41467-019-09475-5, 2019.
Samari, M., Ridha, F., Manovic, V., Macchi, A., and Anthony, E. J.: Direct capture of carbon dioxide from air via lime-based sorbents, Mitigation and Adaptation Strategies for Global Change, 25, 25–41, https://doi.org/10.1007/s11027-019-9845-0, 2020.
Shan, Y., Liu, Z., and Guan, D.: CO2 emissions from China's lime industry, Appl. Energ., 166, 245–252, https://doi.org/10.1016/j.apenergy.2015.04.091, 2016.
Snæbjörnsdóttir, S., Sigfússon, B., Marieni, C., Goldberg, D., Gislason, S. R., and Oelkers, E. H.: Carbon dioxide storage through mineral carbonation, Nat. Rev. Earth Environ., 1, 90–102, https://doi.org/10.1038/s43017-019-0011-8, 2020.
Tong, Q., Zhou, S., Guo, Y., Zhang, Y., and Wei, X.: Forecast and Analysis on Reducing China's CO2 Emissions from Lime Industrial Process, Int. J. Environ. Res. Public He., 16, 500, https://doi.org/10.3390/IJERPH16030500, 2019.
USGS: Iron and Steel Slag Statistics and Information, https://www.usgs.gov/centers/national-minerals-information-center/iron-and-steel-slag-statistics-and-information, last access: 27 May 2022a.
USGS: Lime Statistics and Information, https://www.usgs.gov/centers/national-minerals-information-center/lime-statistics-and-information, last access: 26 May 2022b.
Ventol, L., Vendrell, M., Giraldez, P., and Merino, L.: Traditional organic additives improve lime mortars: New old materials for restoration and building natural stone fabrics, Constr. Build. Mater., 25, 3313–3318, https://doi.org/10.1016/J.CONBUILDMAT.2011.03.020, 2011.
Wang, L., Sun, N., Tang, H., and Sun, W.: A review on comprehensive utilization of red mud and prospect analysis, Minerals, 9, 362, https://doi.org/10.3390/MIN9060362, 2019.
Wang, Q. and Yan, P.: Characteristic of hydration products of steel slag, Journal of the Chinese Ceramic society, 38, 1731–1734, https://doi.org/10.14062/j.issn.0454-5648.2010.09.030, 2010.
Wang, Q., Shen, F., Luo, M., and Li, X.: Progress and Application of Calcium Carbonate Produced by Precipitation Method, Mater. Sci. Eng., 20, 306–312, 2002.
Xi, F., Davis, S. J., Ciais, P., Crawford-Brown, D., Guan, D., Pade, C., Shi, T., Syddall, M., Lv, J., Ji, L., Bing, L., Wang, J., Wei, W., Yang, K. H., Lagerblad, B., Galan, I., Andrade, C., Zhang, Y., and Liu, Z.: Substantial global carbon uptake by cement carbonation, Nat. Geosci., 9, 880–883, https://doi.org/10.1038/ngeo2840, 2016.
Zhang, S., Bai, X., Zhao, C., Tan, Q., Luo, G., Wang, J., Li, Q., Wu, L., Chen, F., Li, C., Deng, Y., Yang, Y., and Xi, H.: Global CO2 Consumption by Silicate Rock Chemical Weathering: Its Past and Future, Earth's Future, 9, 5, https://doi.org/10.1029/2020EF001938, 2021.
carbon neutraltarget.