the Creative Commons Attribution 4.0 License.
the Creative Commons Attribution 4.0 License.
 | 01 Jun 2023
RC4USCoast: a river chemistry dataset for regional ocean model applications in the US East Coast, Gulf of Mexico, and US West Coast
Sang-Ki Lee
Charles A. Stock
Andrew C. Ross
Laure Resplandy
Samantha A. Siedlecki
Filippos Tagklis
Joseph E. Salisbury
A historical dataset of river chemistry and discharge is presented for 140 monitoring sites along the US East Coast, the Gulf of Mexico, and the US West Coast from 1950 to 2022. The dataset, referred to here as River Chemistry for the U.S. Coast (RC4USCoast), is mostly derived from the Water Quality Database of the US Geological Survey (USGS) but also includes river discharge from the USGS's Surface-Water Monthly Statistics for the Nation and the U.S. Army Corps of Engineers. RC4USCoast provides monthly time series as well as long-term averaged monthly climatological patterns for 21 variables including alkalinity and dissolved inorganic carbon concentration. It is mainly intended as a data product for regional ocean biogeochemical models and carbonate chemistry studies in the US coastal regions. Here we present the method to derive RC4USCoast and briefly describe the rivers' carbonate chemistry patterns. The dataset is publicly available at https://doi.org/10.25921/9jfw-ph50 (Gomez et al., 2022).
- Article
(4537 KB) - Full-text XML
-
Supplement
(5119 KB) - BibTeX
- EndNote


Riverine fluxes of water, nutrients, alkalinity, and carbon exert a significant impact on the coastal ocean margins, modulating patterns in primary production, dissolved oxygen, calcium carbonate saturation, bottom acidification, and air–sea carbon fluxes (e.g., Rabouille et al., 2008; Cai et al., 2011; Siedlecki et al. 2017; Moore-Maley et al., 2018; Xie et al., 2020; Liu et al., 2021). During the last decade or so, there has been an increasing interest in better understanding and quantifying the influence of river inputs on the coastal ecosystems of the United States. This is reflected in a growing number of ocean biogeochemical (BGC) modeling studies addressing river-induced ocean patterns (e.g., Fennel et al., 2011, 2013; Laurent et al., 2017; Siedlecki et al. 2017, 2021; Hood et al., 2021; Gomez et al., 2021). Ocean BGC models need realistic inputs of river-water properties to properly simulate coastal ecosystem responses to river runoff, but the availability of these inputs is usually limited (e.g., Kearney et al., 2021). A few existing data products contain estimates of riverine carbon and/or nutrients based on empirical or dynamic river export models (e.g., Mayorga et al., 2010; Li et al., 2017, 2019; Lacroix et al., 2021; Regnier et al., 2022). These products were mainly developed for global budget analysis, and consequently they often lack sufficient spatial resolution to allow for the study of ecosystem dynamics at a regional scale or have significant regional biases. Motivated by the necessity of high-resolution river chemistry data for regional ocean BGC models, here we present the River Chemistry for the U.S. Coast (RC4USCoast) database, a compilation of historical river chemistry and discharge records derived from the US Geological Survey (USGS).
The RC4USCoast database contains historical river chemistry records from 140 USGS monitoring stations retrieved from the Water Quality Database of the National Water Information System (Alexander et al., 1998; https://nwis.waterdata.usgs.gov/usa/nwis/qwdata, last access: 7 March 2023). We use a set of stations similar to those used in Stets and Striegl (2012), who selected stations based on the availability of water quality records and proximity to river mouths. These monitoring stations correspond to 52 rivers in the US East Coast, 53 rivers in the Gulf of Mexico, and 35 rivers in the US West Coast (Fig. 1; Table S1 in the Supplement). It is worth noting that Stets and Striegl (2012) reported average inorganic and organic carbon flux (g C yr−1) and yield (g C m−2 yr−1) for the selected USGS stations, but they did not provide a dataset with the riverine concentration of carbon. Therefore, RC4USCoast advances by providing integrated information of the riverine concentration of dissolved inorganic carbon (DIC) and alkalinity (Sect. 2.1), and (where available) additional inorganic and organic nutrients relevant for coastal water quality (Sect. 2.2) for those stations.
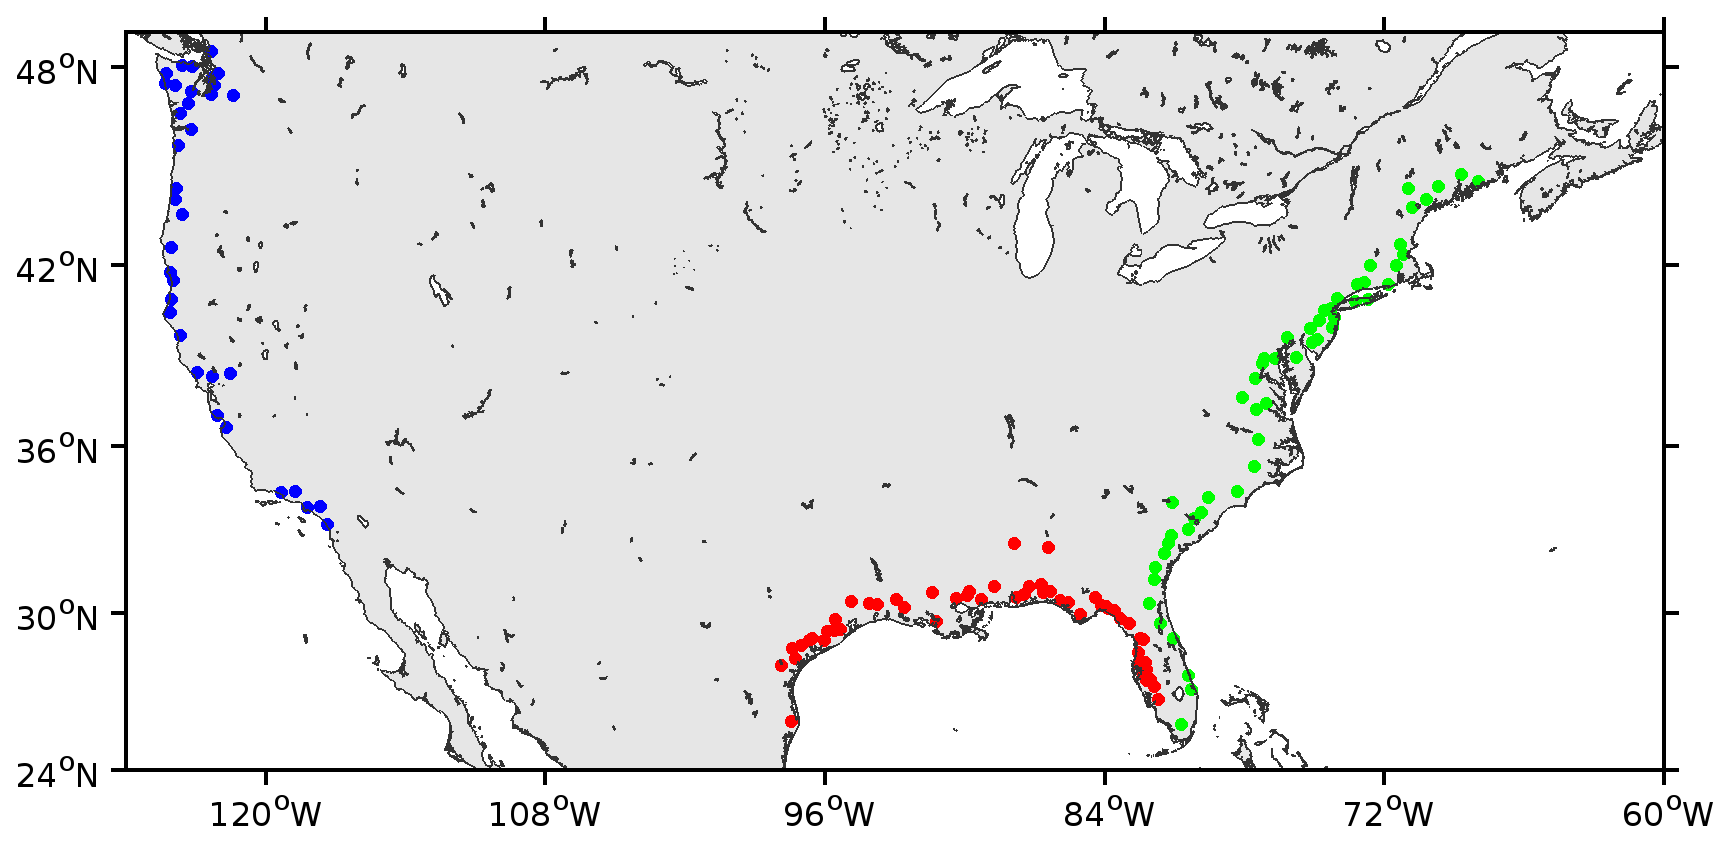
Figure 1USGS stations used to derive river chemistry patterns. Green, red, and blue dots correspond to rivers discharging to the US East Coast, Gulf of Mexico, and US West Coast, respectively.
2.1 Carbonate chemistry
RC4USCoast includes a river carbonate chemistry dataset with monthly series and climatological data for alkalinity, pH field, pH laboratory, DIC, and dissolved organic carbon (DOC) (Table 1). To this effect, we processed more than 64 000 records of calcium carbonate (CaCO3) and bicarbonate (HCO3), 60 000 pH field and laboratory records, and 9000 DOC records. Due to the substantially smaller number of DIC measurements (∼ 1000) compared to those of alkalinity and pH, we derived DIC from alkalinity, pH, and water temperature using the CO2SYS program for CO2 system calculations (van Heuven et al., 2011). Following Stets and Striegl (2012), we assumed that (i) particulate inorganic carbon is small; thus, filtered and unfiltered measurements of alkalinity are nearly the same, and (ii) organic alkalinity represents a small fraction of total alkalinity. A comparison between filtered and unfiltered measurements of alkalinity does not show significant differences (Fig. 2a); thus, biases associated with the first assumption are negligible. The second assumption is required, because including the organic alkalinity fraction in the total alkalinity term used to derive DIC leads to some DIC overestimation. This could be a problem in low-alkalinity rivers with high concentrations of organic matter, as the latter contains anionic functional groups that can contribute to alkalinity (Hunt et al., 2011). Stets and Striegl (2012) discussed this issue further and showed that organic alkalinity usually represents less than 10 % of total alkalinity in US rivers and thus not producing important biases in the DIC calculations. Consistently, a comparison between measured DIC and the calculated DIC reveals a good agreement, with no evident bias in the residuals of the least squares model (Fig. 2b).
Table 1Carbon system variables in the RC4USCoast dataset.
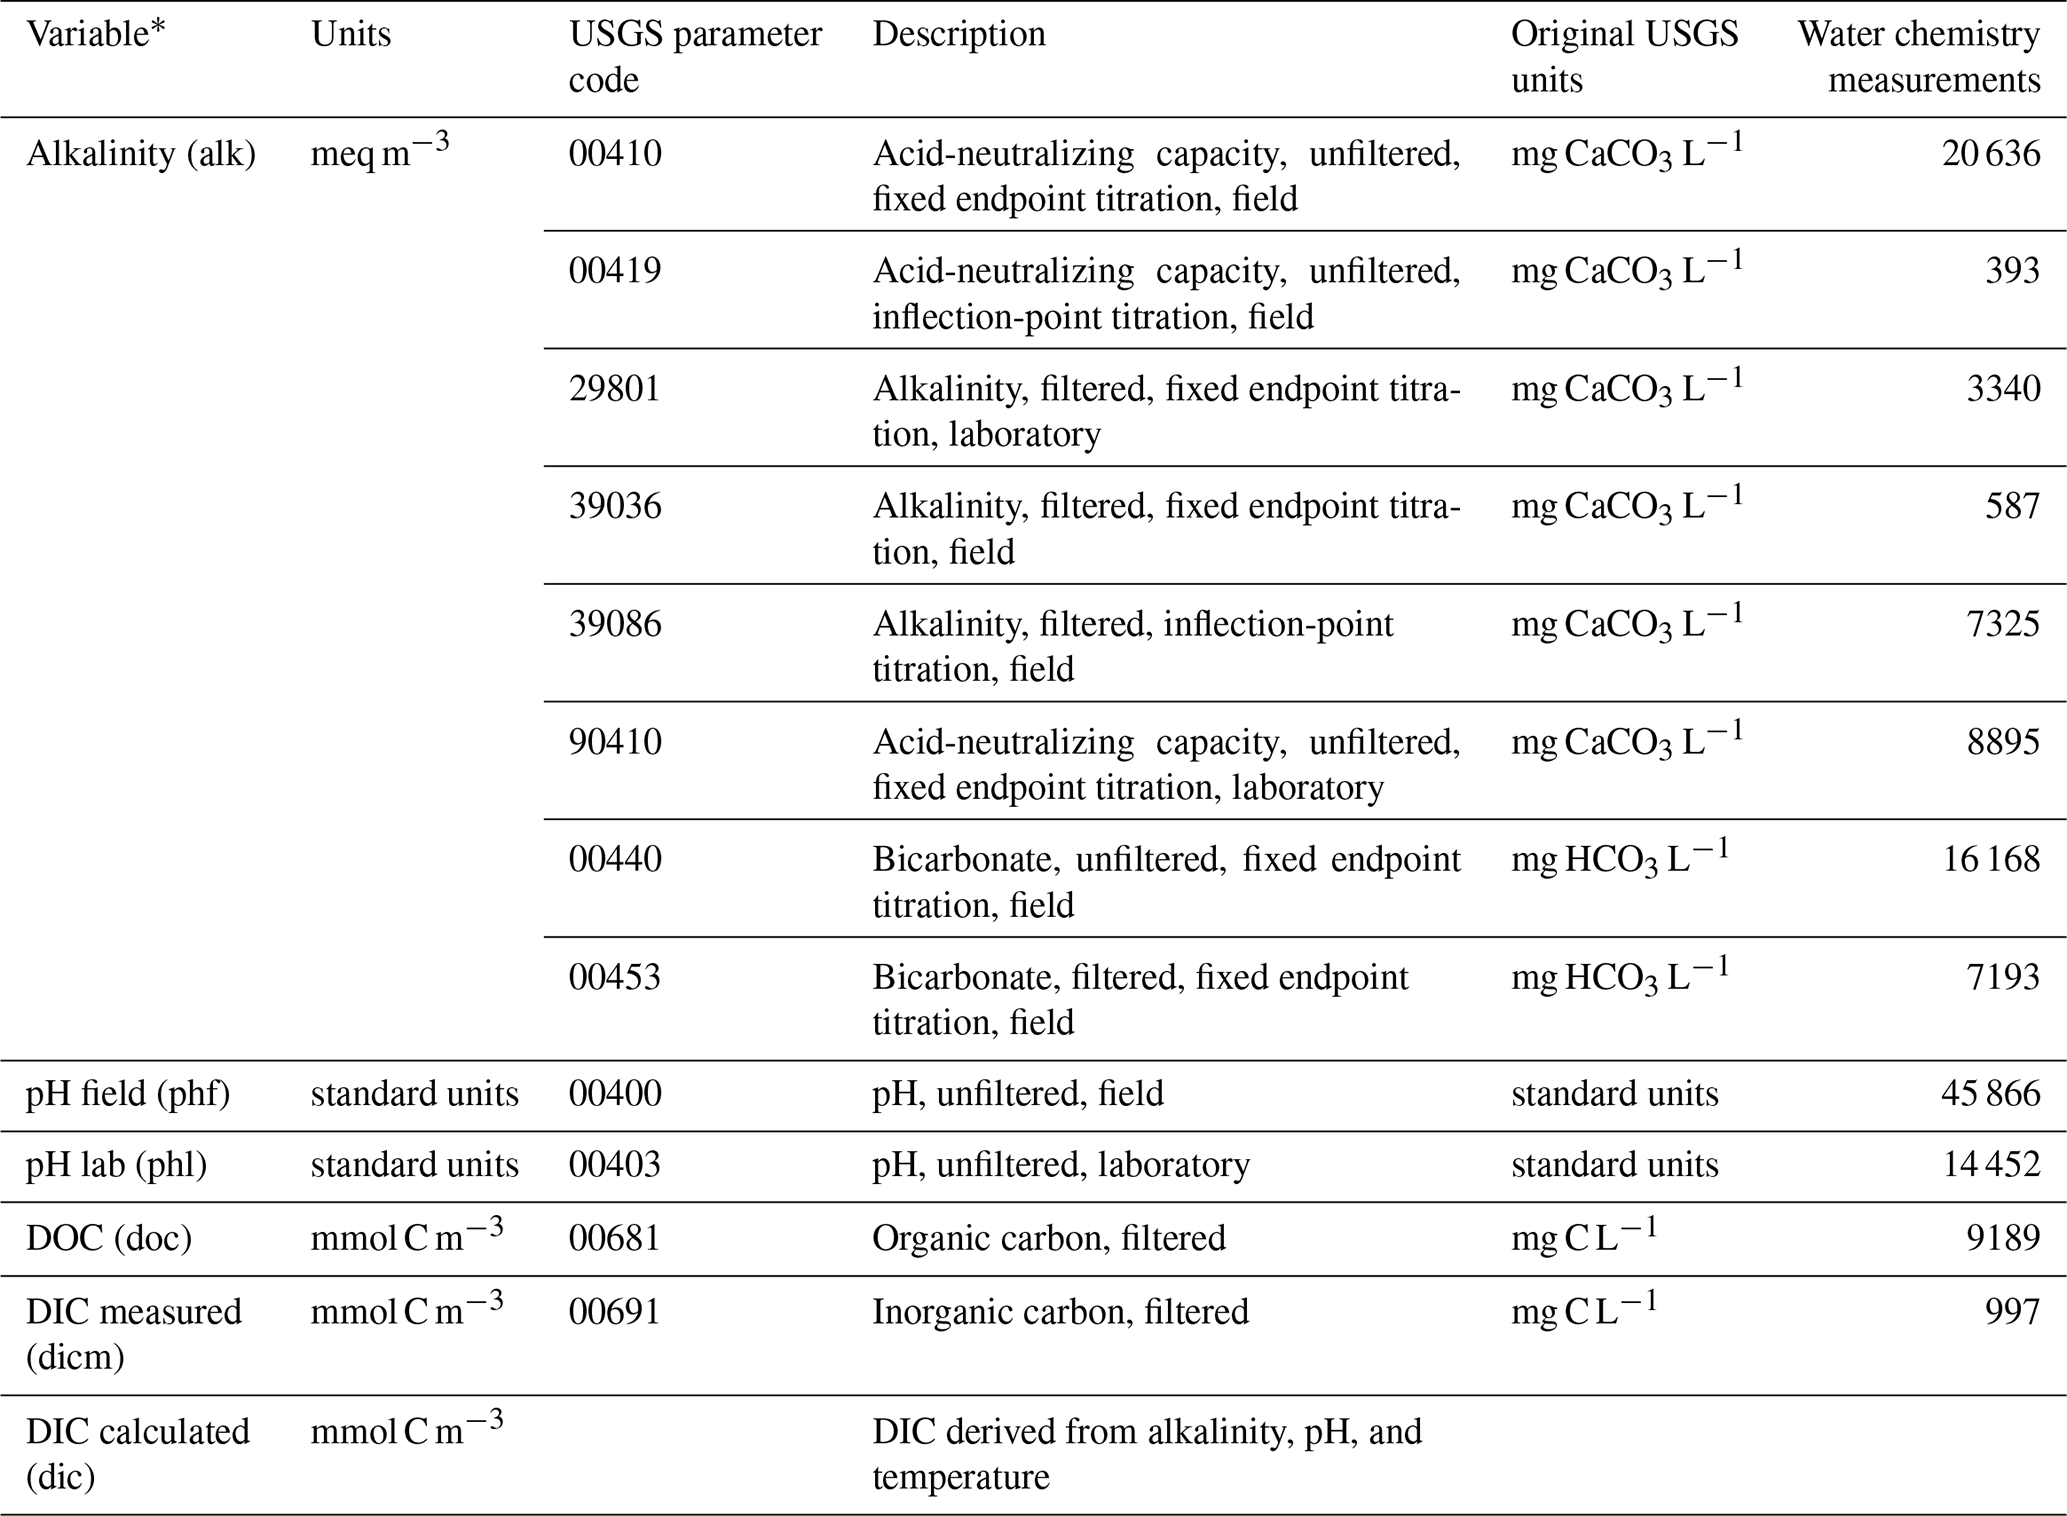
* The abbreviated names of the variables indicated in parenthesis (in first column) are used in the netCDF files.
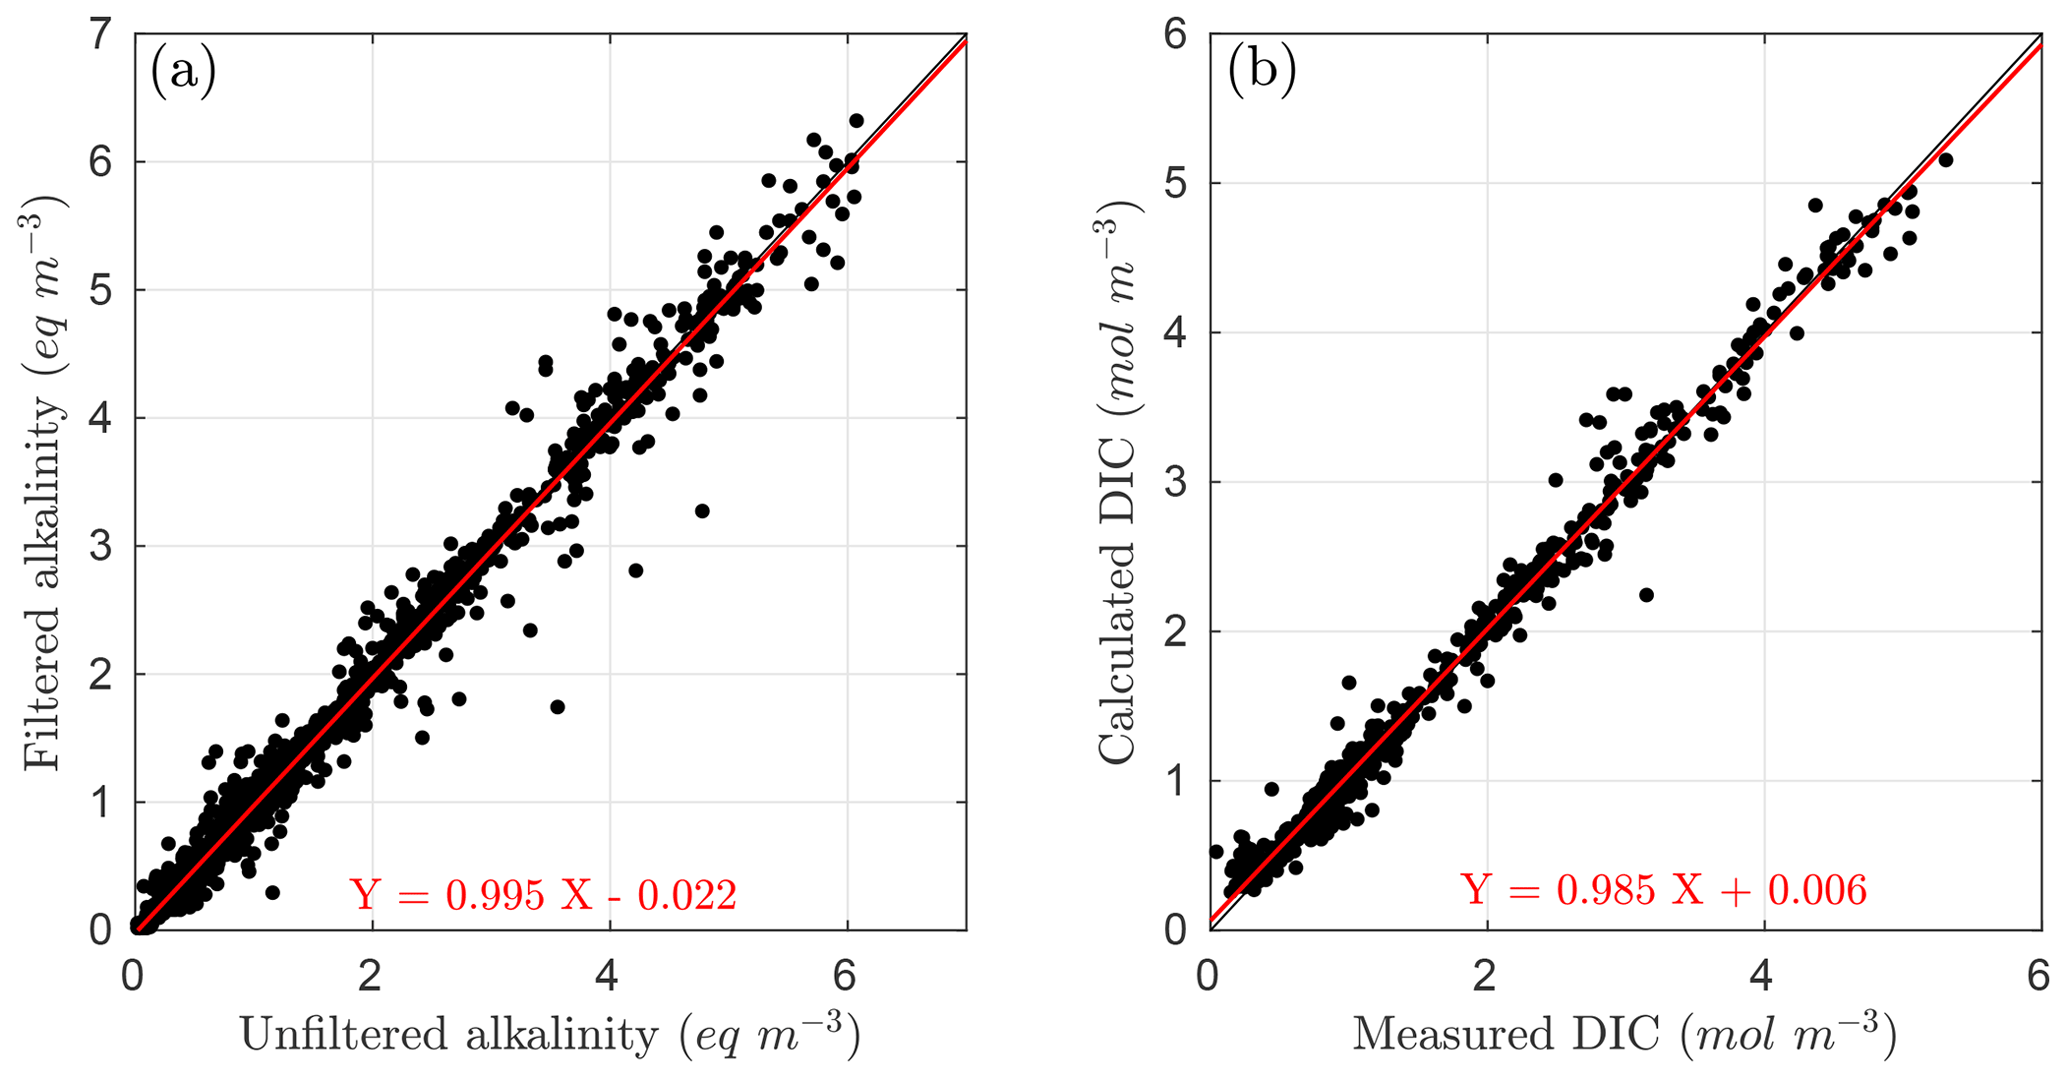
Figure 2Data comparison. (a) Filtered vs. unfiltered alkalinity; (b) measured vs. calculated DIC. Calculated DIC was derived from alkalinity, pH, and temperature measurements.
2.2 Other chemistry variables
The RC4USCoast database also contains a set of variables that describe the runoff of nitrogen, phosphorus, and silica (Table 2), including monthly time series of nitrate (NO3), nitrate plus nitrite (NO3 plus NO2), ammonia (NH4), organic nitrogen plus ammonia (orgN), dissolved organic nitrogen (DON), total nitrogen (TN), phosphate (PO4), total phosphorus (TP), and silicon dioxide (SiO2). For orgN, TN, and TP, we generated two independent datasets for unfiltered and filtered water samples (the former containing both dissolved and particulate material and the latter only dissolved material). For NO3, NO3 plus NO2, NH4, and PO4, we considered the USGS parameters for filtered water samples. In addition to these inorganic and organic nutrients, we also included dissolved oxygen (DO) and water temperature in the database.
Table 2Additional variables in the RC4USCoast dataset.
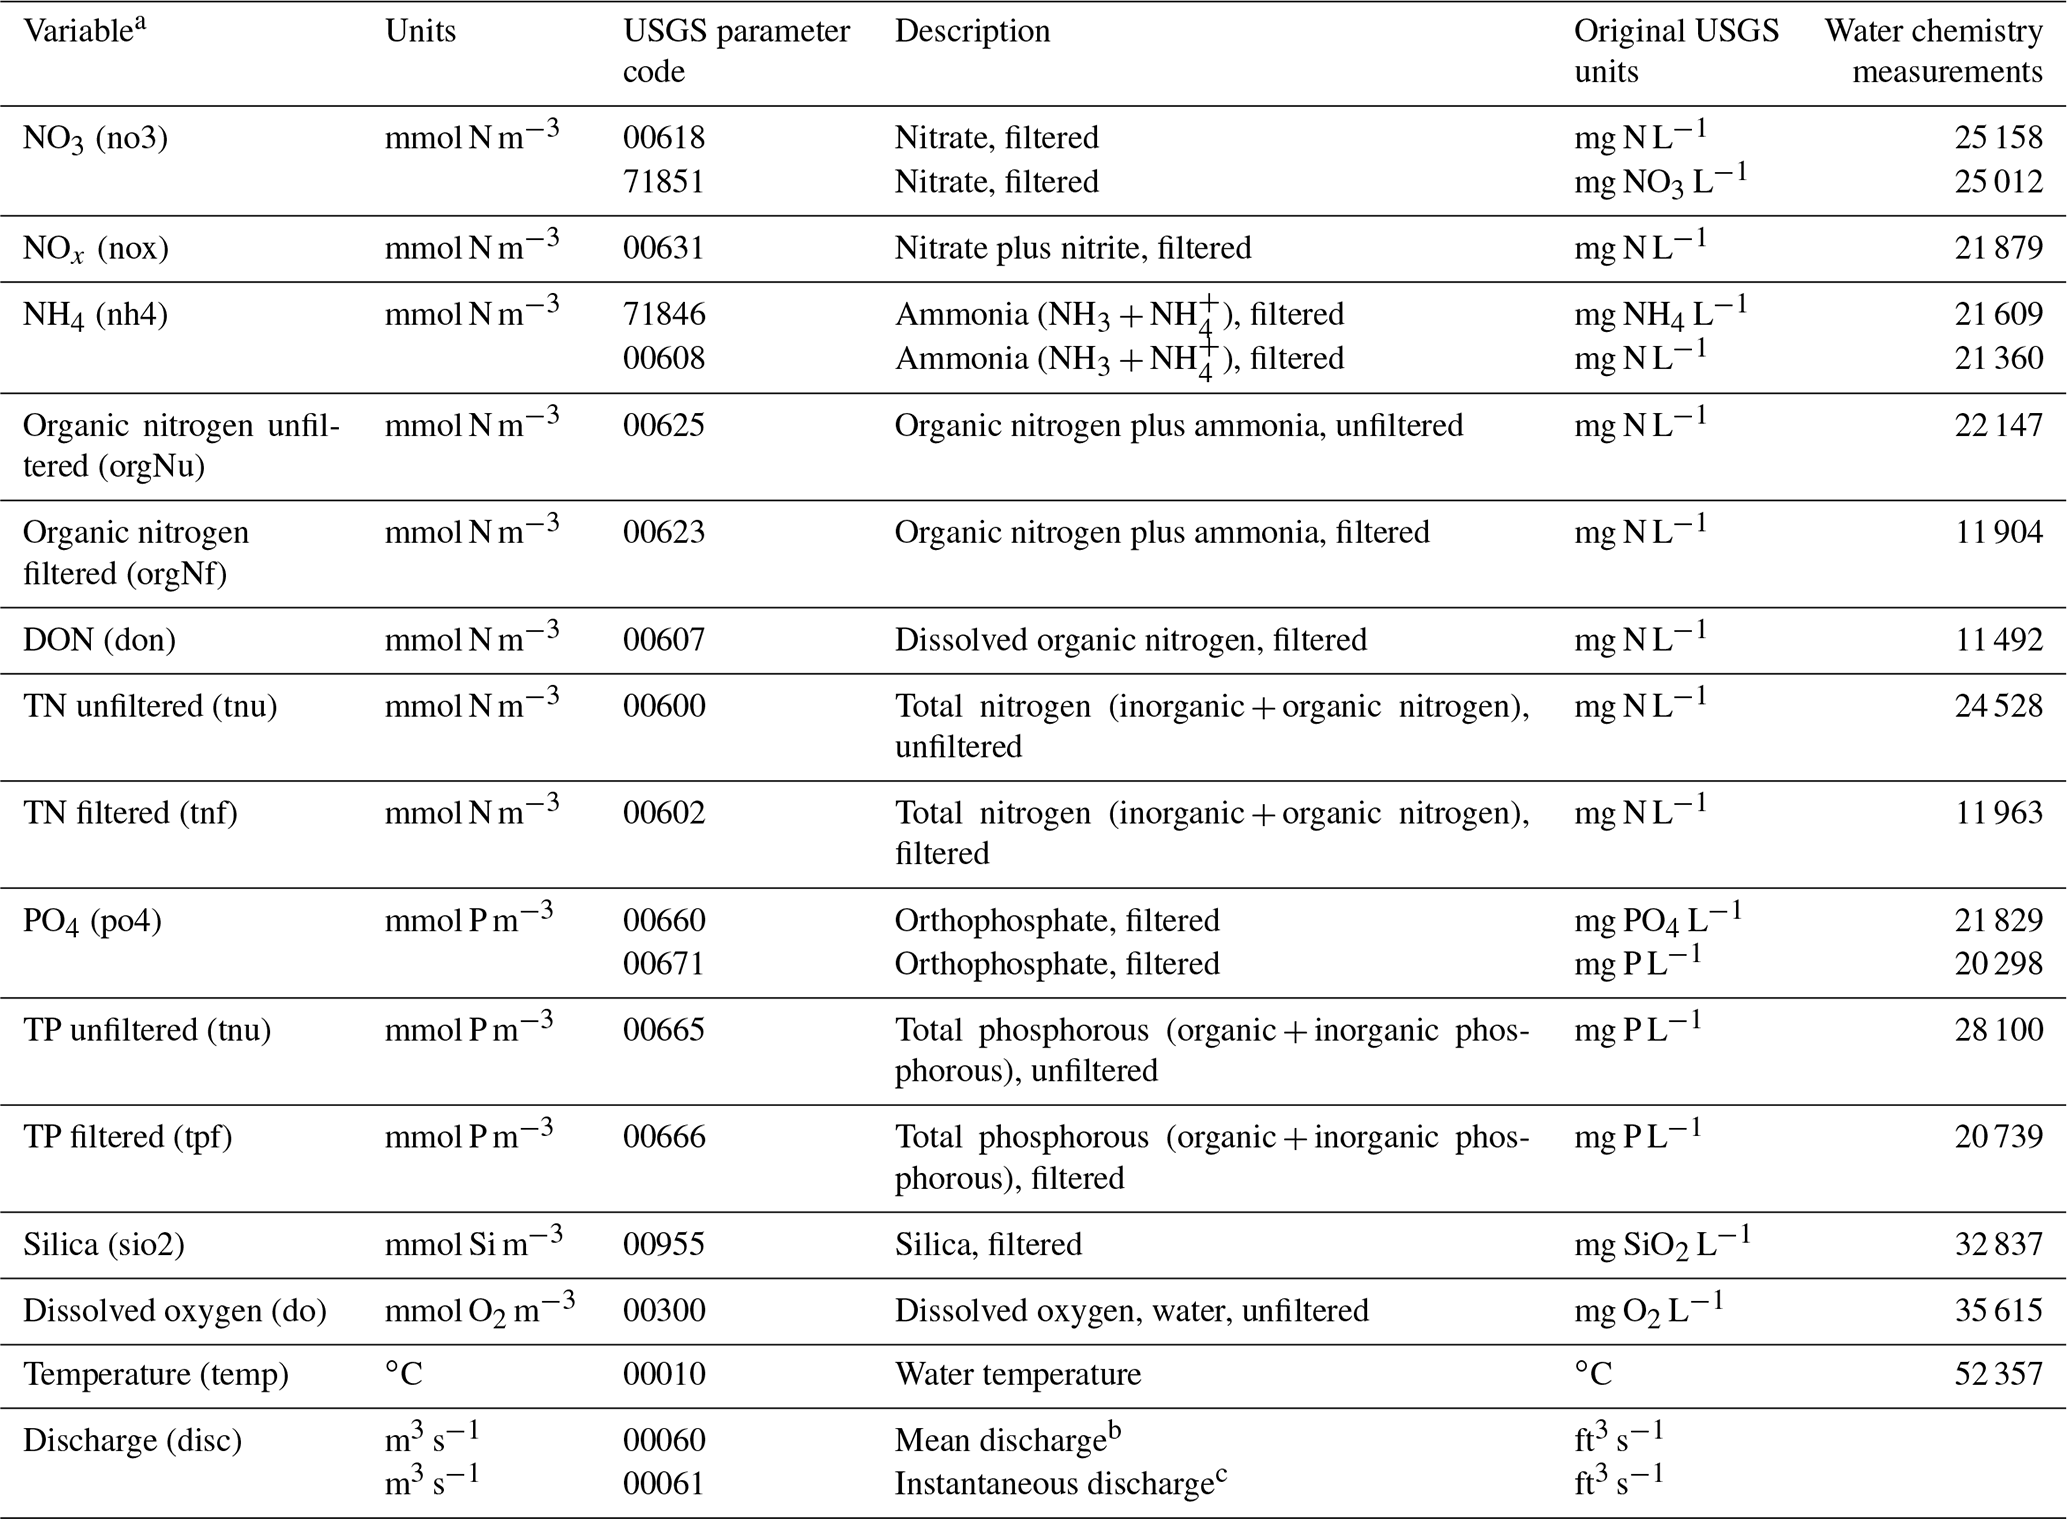
a The abbreviated names of the variables indicated in parenthesis (in first column) are used in the netCDF files. b Averaged discharge from the USGS Surface-Water Monthly Statistics for the Nation was used for all rivers excepting the Mississippi–Atchafalaya (U.S. Army Corps of Engineers) and those listed in footnote c. c Instantaneous discharge from the USGS Water Quality Database was used for the Charles, James, Weeki Washee, and Rio Grande rivers.
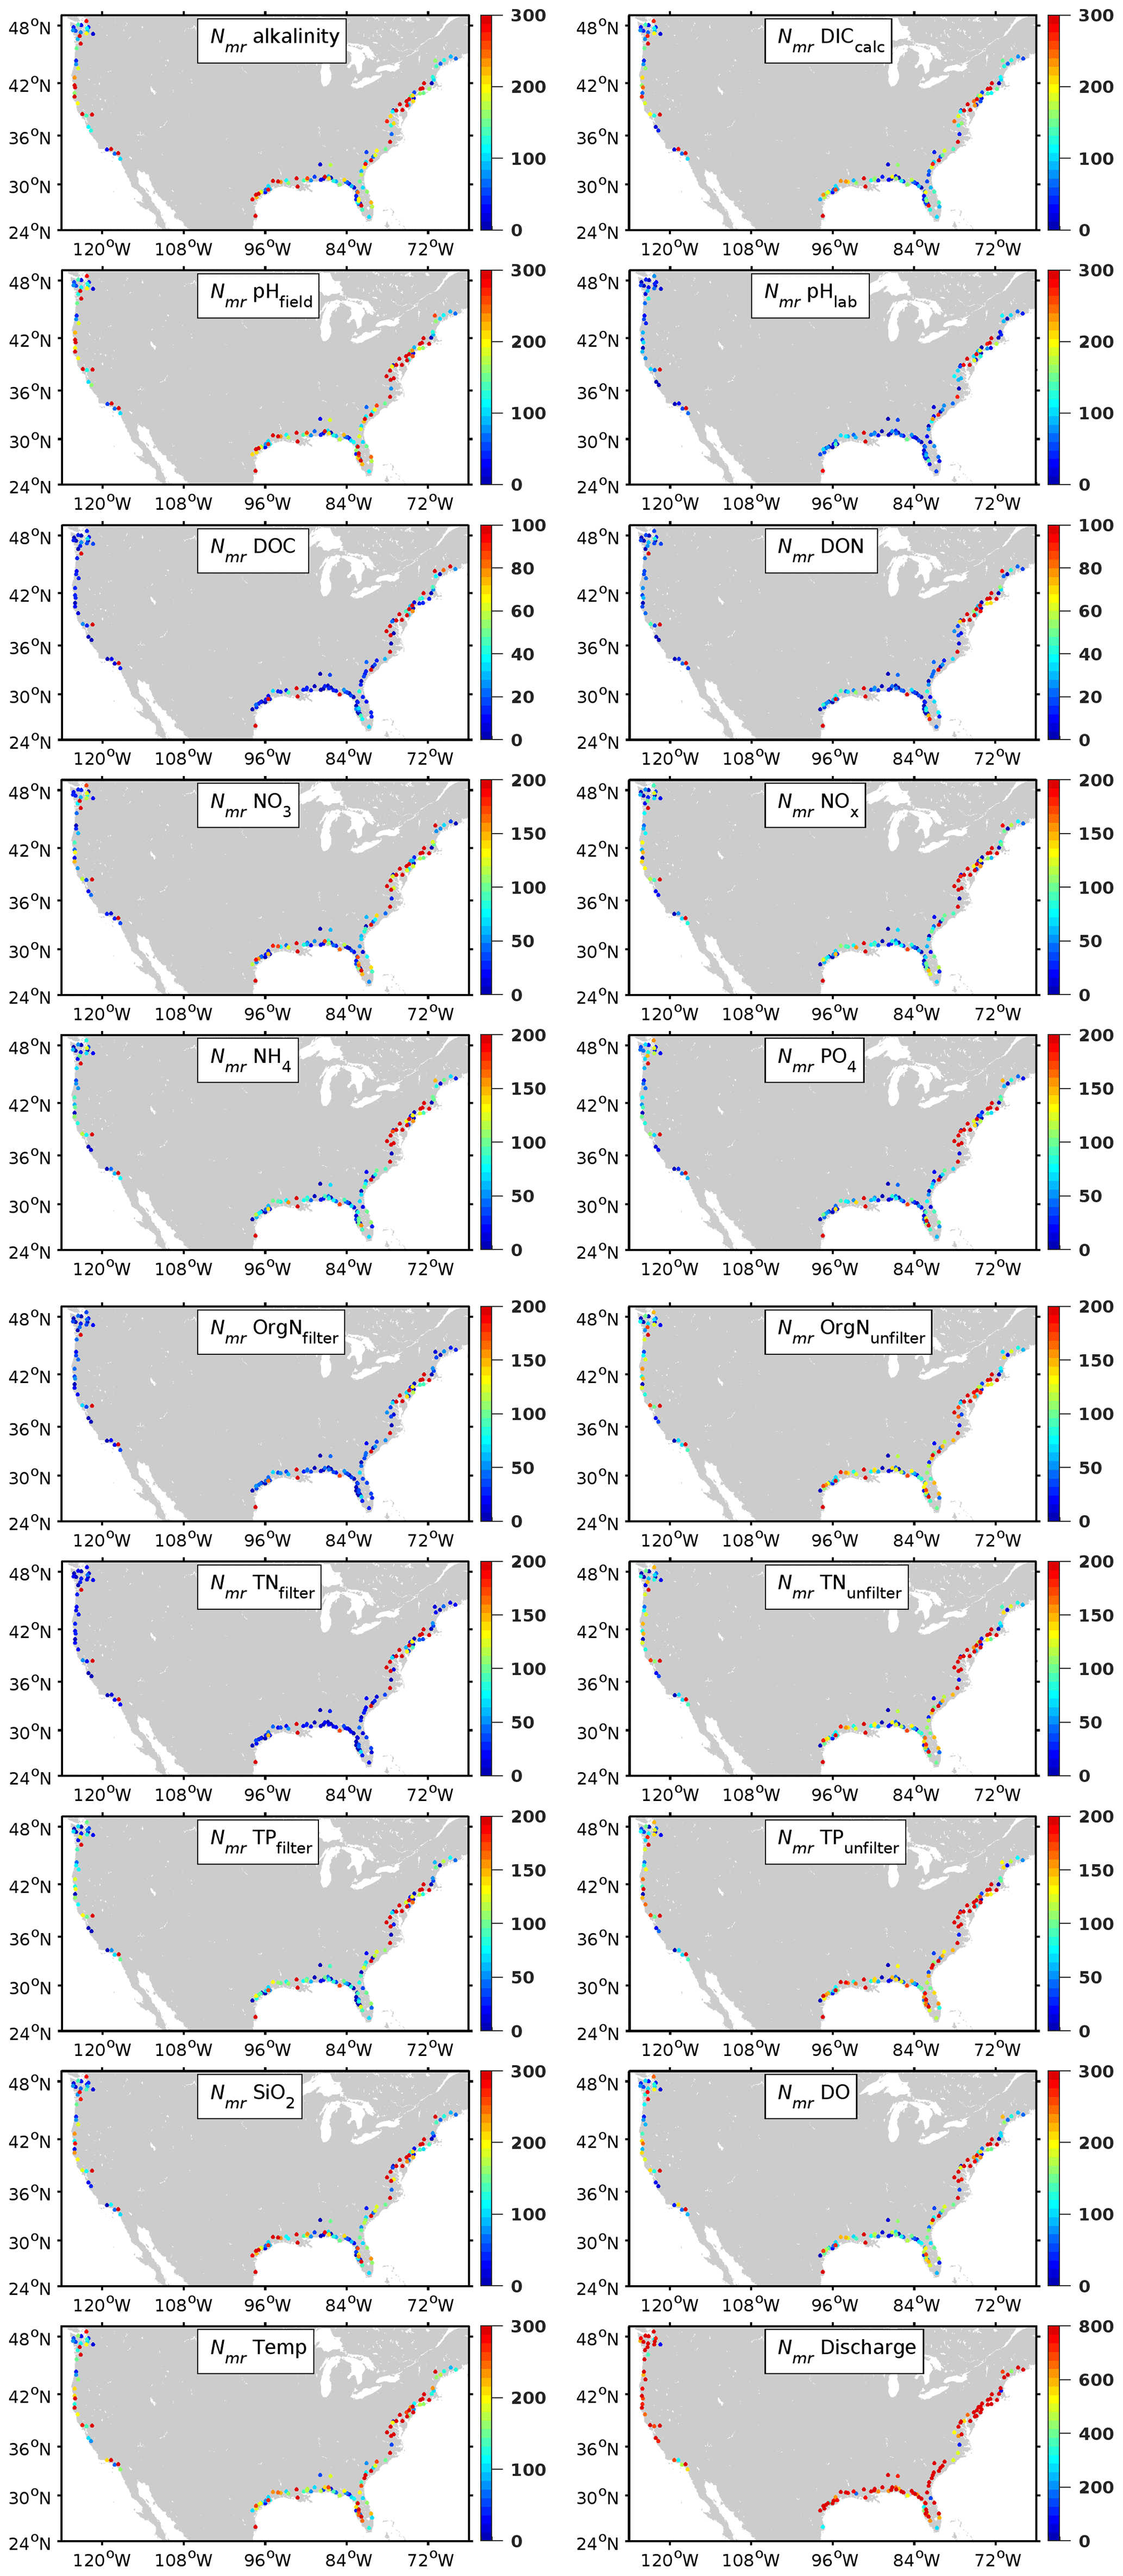
Figure 3Number of monthly records (Nmr) in the dataset time series (1950–2022). The color bar range may vary between panels. Variable description is in Tables 1 and 2.
2.3 River discharge
To provide a longer set of river discharge records than those available in the USGS Water Quality Database, we used monthly average data from the USGS Surface-Water Monthly Statistics for the Nation database (https://waterdata.usgs.gov/nwis/monthly, last access: 15 March 2023). Similarly, for the Mississippi and Atchafalaya rivers, we used records from the U.S. Army Corps of Engineers (USACE; https://rivergages.mvr.usace.army.mil, last access: 15 March 2023). Specifically, we retrieved the Mississippi discharge at the USACE's station 01100 (Tarbert Landing) and the Atchafalaya discharge at station 03045 (Simmesport). For a few rivers (Charles, James, Weeki Washee, and Rio Grande) where monthly discharge was not available in the USGS Surface-Water Monthly Statistics for the Nation database or the USACE records, we used discharge from the USGS Water Quality Database.
2.4 Database generation
Information for the selected river stations includes the RC4USCoast river ID, the original USGS site ID, the USGS site's longitude and latitude, and an approximate longitude and latitude for the river mouth (Fig. S1 in the Supplement). A few rivers flow to other larger rivers, as described in Table S1. The assigned mouth location in those cases corresponds to the mouth of the major stream discharging to the ocean. For example, the dataset contains the Alabama and Tombigbee rivers, which converge to the Mobile River, so the associated river mouth for those two rivers is the Mobile mouth (30.7∘ N, 88.0∘ W).
To the extent it was possible given data availability, we calculated monthly time series for all variables and all river sites over the period 1950–2022. Temporal data gaps were kept unfilled. In the Water Quality Database, river properties are characterized by a set of parameters, each associated with a specific measurement type. As indicated in Tables 1 and 2, we used eight parameters to derive alkalinity; two parameters to derive NO3, NH4, and PO4; and one parameter for the remaining variables: pH field, pH laboratory, DOC, measured DIC, NO3 plus NO2, SiO2, DO, temperature, and the filtered and unfiltered concentration of orgN, TN, and TP. Using more than one parameter for alkalinity, NO3, NH4, and PO4 was a reasonable option to improve the spatiotemporal representation of the patterns, as concentration differences between parameters, during overlapping periods, were minor and did not reveal evident biases (Figs. S2 and S3 in the Supplement). Conversion factors were applied to present alkalinity in milliequivalent m−3 (meq m−3), the carbon-based variables (DIC, DOC) in mmol C m−3, the nitrogen-based variables (NO3, NO3 plus NO2, NH4, orgN, TN) in mmol of N m−3, the phosphorous-based variables (PO4 and TP) in mmol of P m−3, silica in mmol of SiO2 m−3, and dissolved oxygen in mmol of O2 m−3. To ensure data quality, outliers, defined here as river chemistry values above and below 3.5 standard deviations from the median, were removed. Maximum alkalinity (and calculated DIC) values were limited to 8000 meq (mmol) m−3. pH records below 3.5 or above 10 units were discarded. Additionally, an upper threshold of 3.5 was used for the DIC-to-alkalinity ratio (DIC:Alk ratio), based on values reported by Moore-Maley et al. (2018). Calculated DIC records linked to DIC:Alk ratios greater than 3.5 were then removed. This was a very minor fraction of the total monthly DIC records (3.7 %), mainly associated with low-alkalinity values in the Toms, Satilla, St. Marys, and Blackwater rivers.
Except for river discharge, which had average temporal coverage of 85 %, the USGS time series had significant data gaps as the parameter's monitoring had a limited number of years, and/or the parameter's measurements were not performed at a regular frequency. Figure 3 displays the number of records (data density) in the monthly time series for each site. We omitted measured DIC, which was present at a low number in only 10 % of the stations. The density maps reveal large differences among rivers and variables. Monitoring stations with the most complete chemistry records were linked to rivers flowing to the Mid-Atlantic Bight, the Mississippi and Atchafalaya, and a limited number of major rivers on the West Coast and Texas coast. The greatest data density was for water temperature, pH field, and alkalinity, with medians of 176, 170, and 149 records (over the 140 sites), respectively, followed by dissolved oxygen, silica, and calculated DIC, with medians of 138, 134, and 124 records, respectively. At the other end, variables with low data density were DON and DON, with medians of 21 and 14 records, respectively.
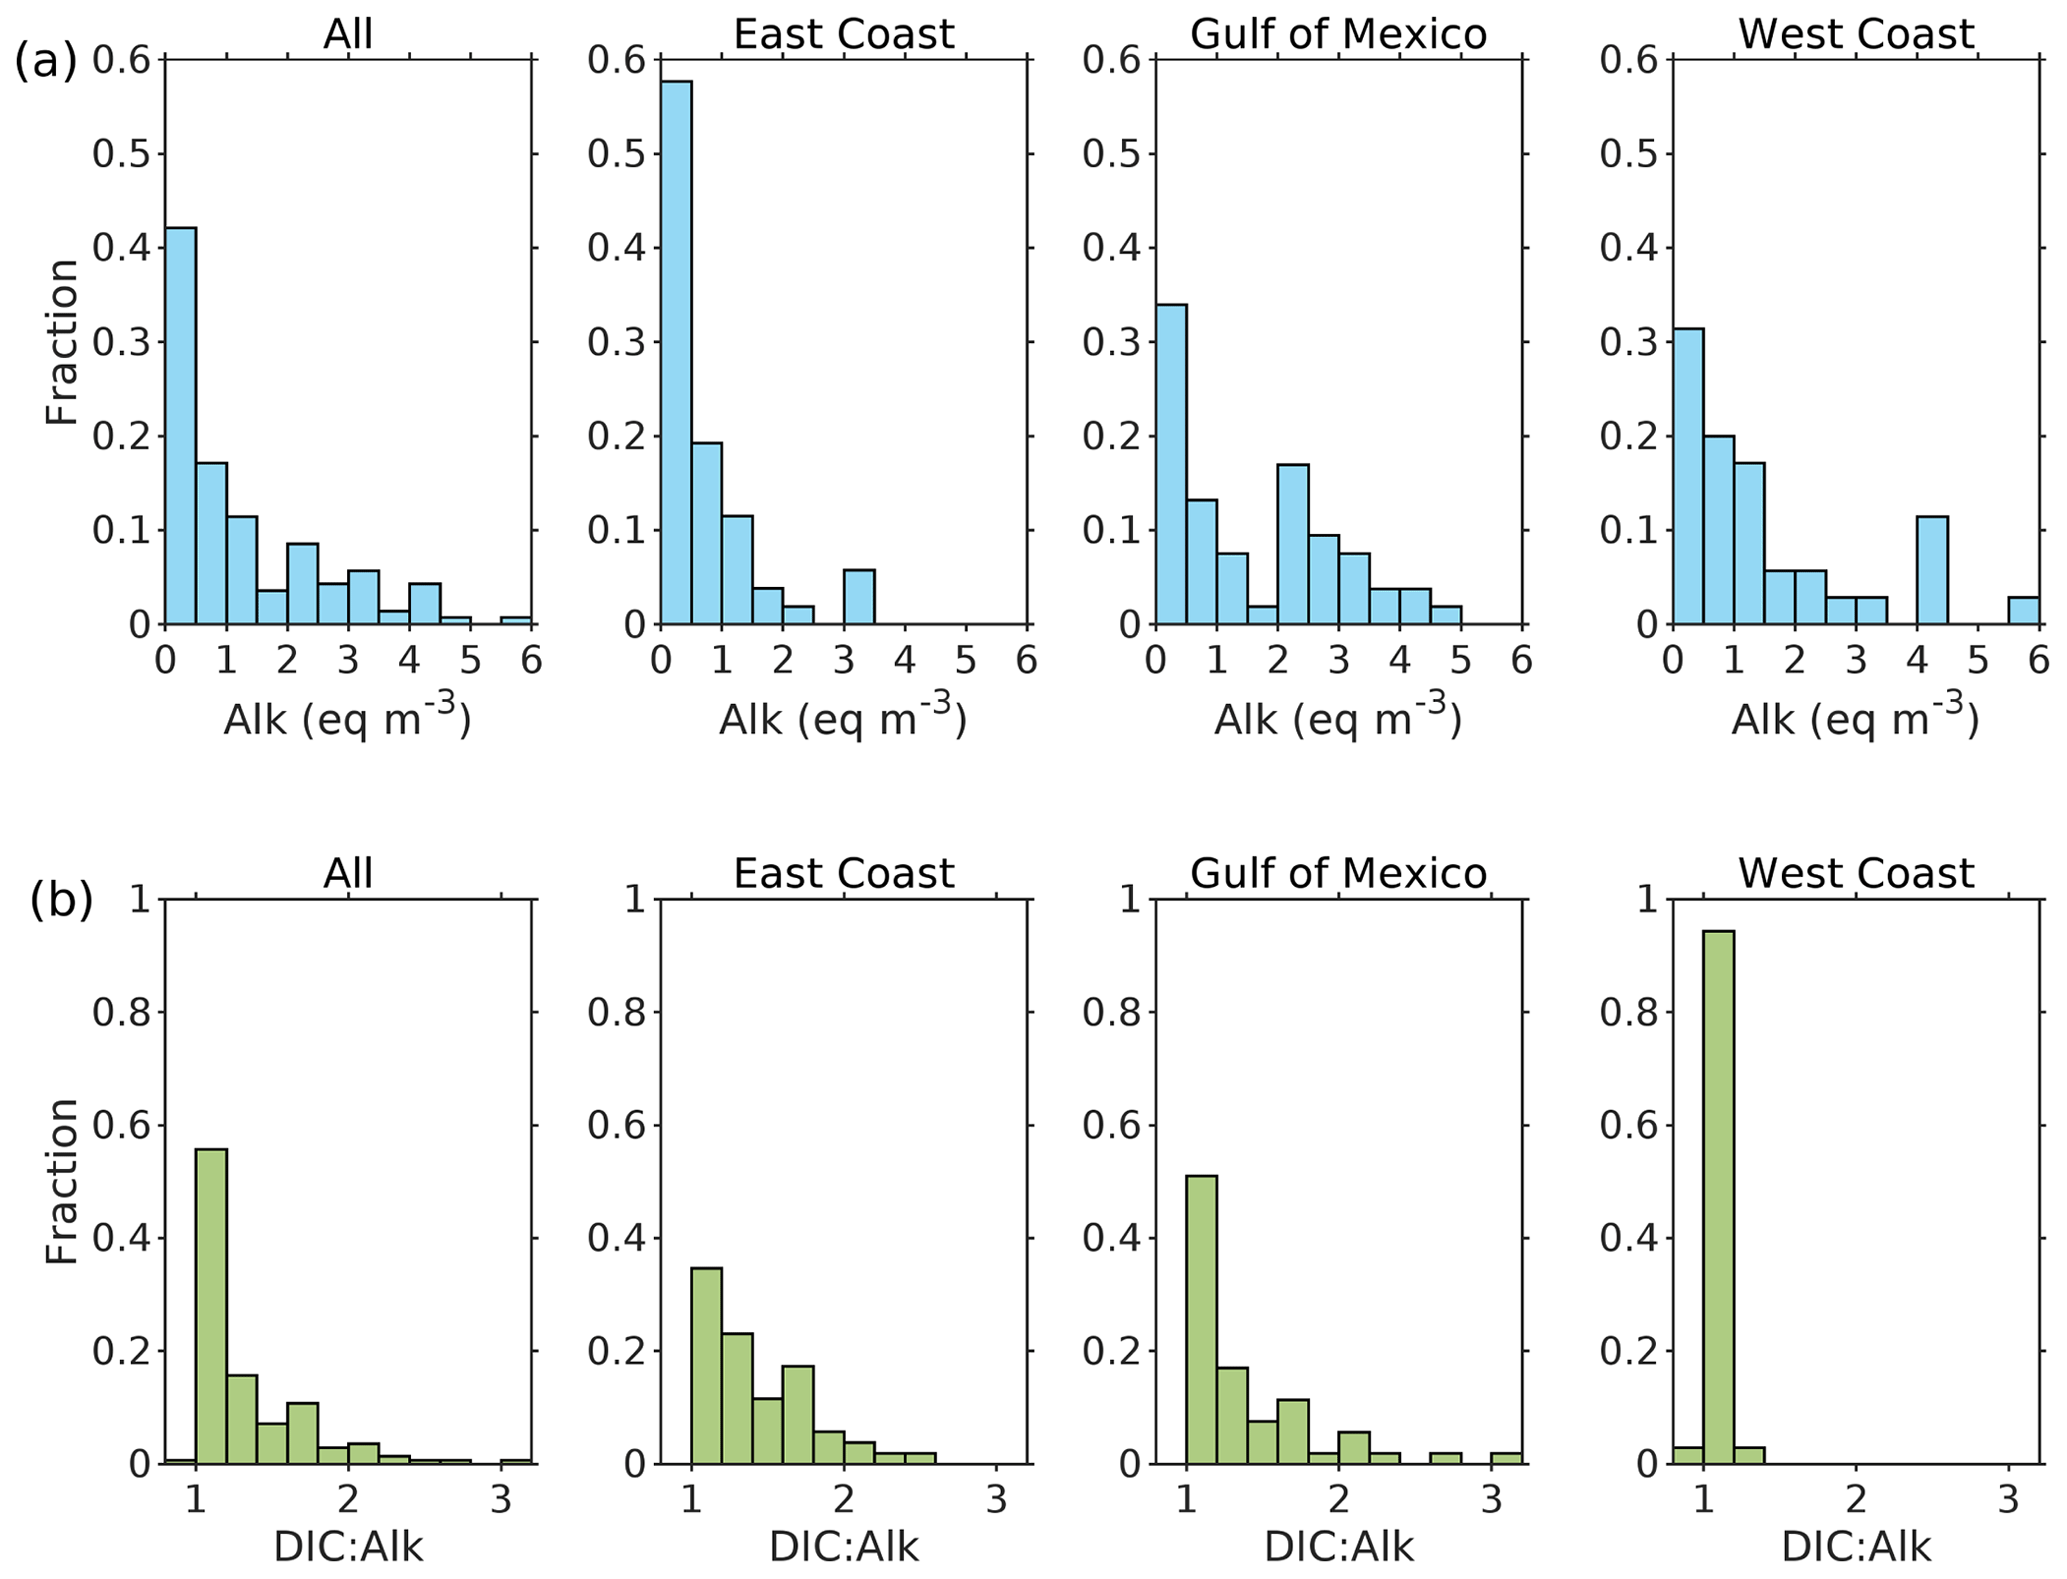
Figure 4Frequency histogram derived from the long-term site-averaged (a) alkalinity and (b) DIC-to-alkalinity (DIC:Alk) ratio for all rivers (All) and for rivers discharging at the East Coast, Gulf of Mexico, and West Coast.
To complement the time series and provide a ready-to-use dataset for ocean biogeochemical model applications with no data gaps, we generated monthly climatologies using all data during 1950–2022. We also generated climatologies for the 1950–1989 and 1990–2022 periods, as a way to represent temporal variation in the climatological pattern. We considered those multidecadal periods, as the temporal coverage in the river chemistry dataset did not resolve well decadal variability for all sites. To ensure a minimum number of observations to derive the monthly climatologies, for each variable and station we calculated the number of records per calendar month. If the median value of this record count (over the 12 months) was less than five or any month had no data, then the monthly climatology was substituted by the long-term annual average.
A brief description of the carbon system variables in the RC4USCoast database (based on alkalinity and calculated DIC) is provided in the following section. Mean patterns for other variables are shown in the Supplement (Fig. S4).
The site-averaged alkalinity concentration ranges from 40 meq m−3 (Blackwater) to 5605 meq m−3 (Santa Clara). The frequency distribution for this variable displays a positive skewness with a median of 662 meq m−3 and 42 % of the values lower than 500 meq m−3 (Fig. 4a). The largest fraction of low-alkalinity (<500 meq m−3) rivers is on the East Coast, especially for rivers flowing to the Gulf of Maine and South Atlantic Bight (Fig. 5a). On the other hand, the largest fraction of high-alkalinity (>2000 meq m−3) rivers is in the Gulf of Mexico (Fig. 4a), mainly clustered over the Texas and western Florida coasts (Fig. 5a). Along the West Coast, there is a clear meridional gradient in river alkalinity, with the highest values in Southern California and the lowest in Oregon and Washington (Fig. 5a).
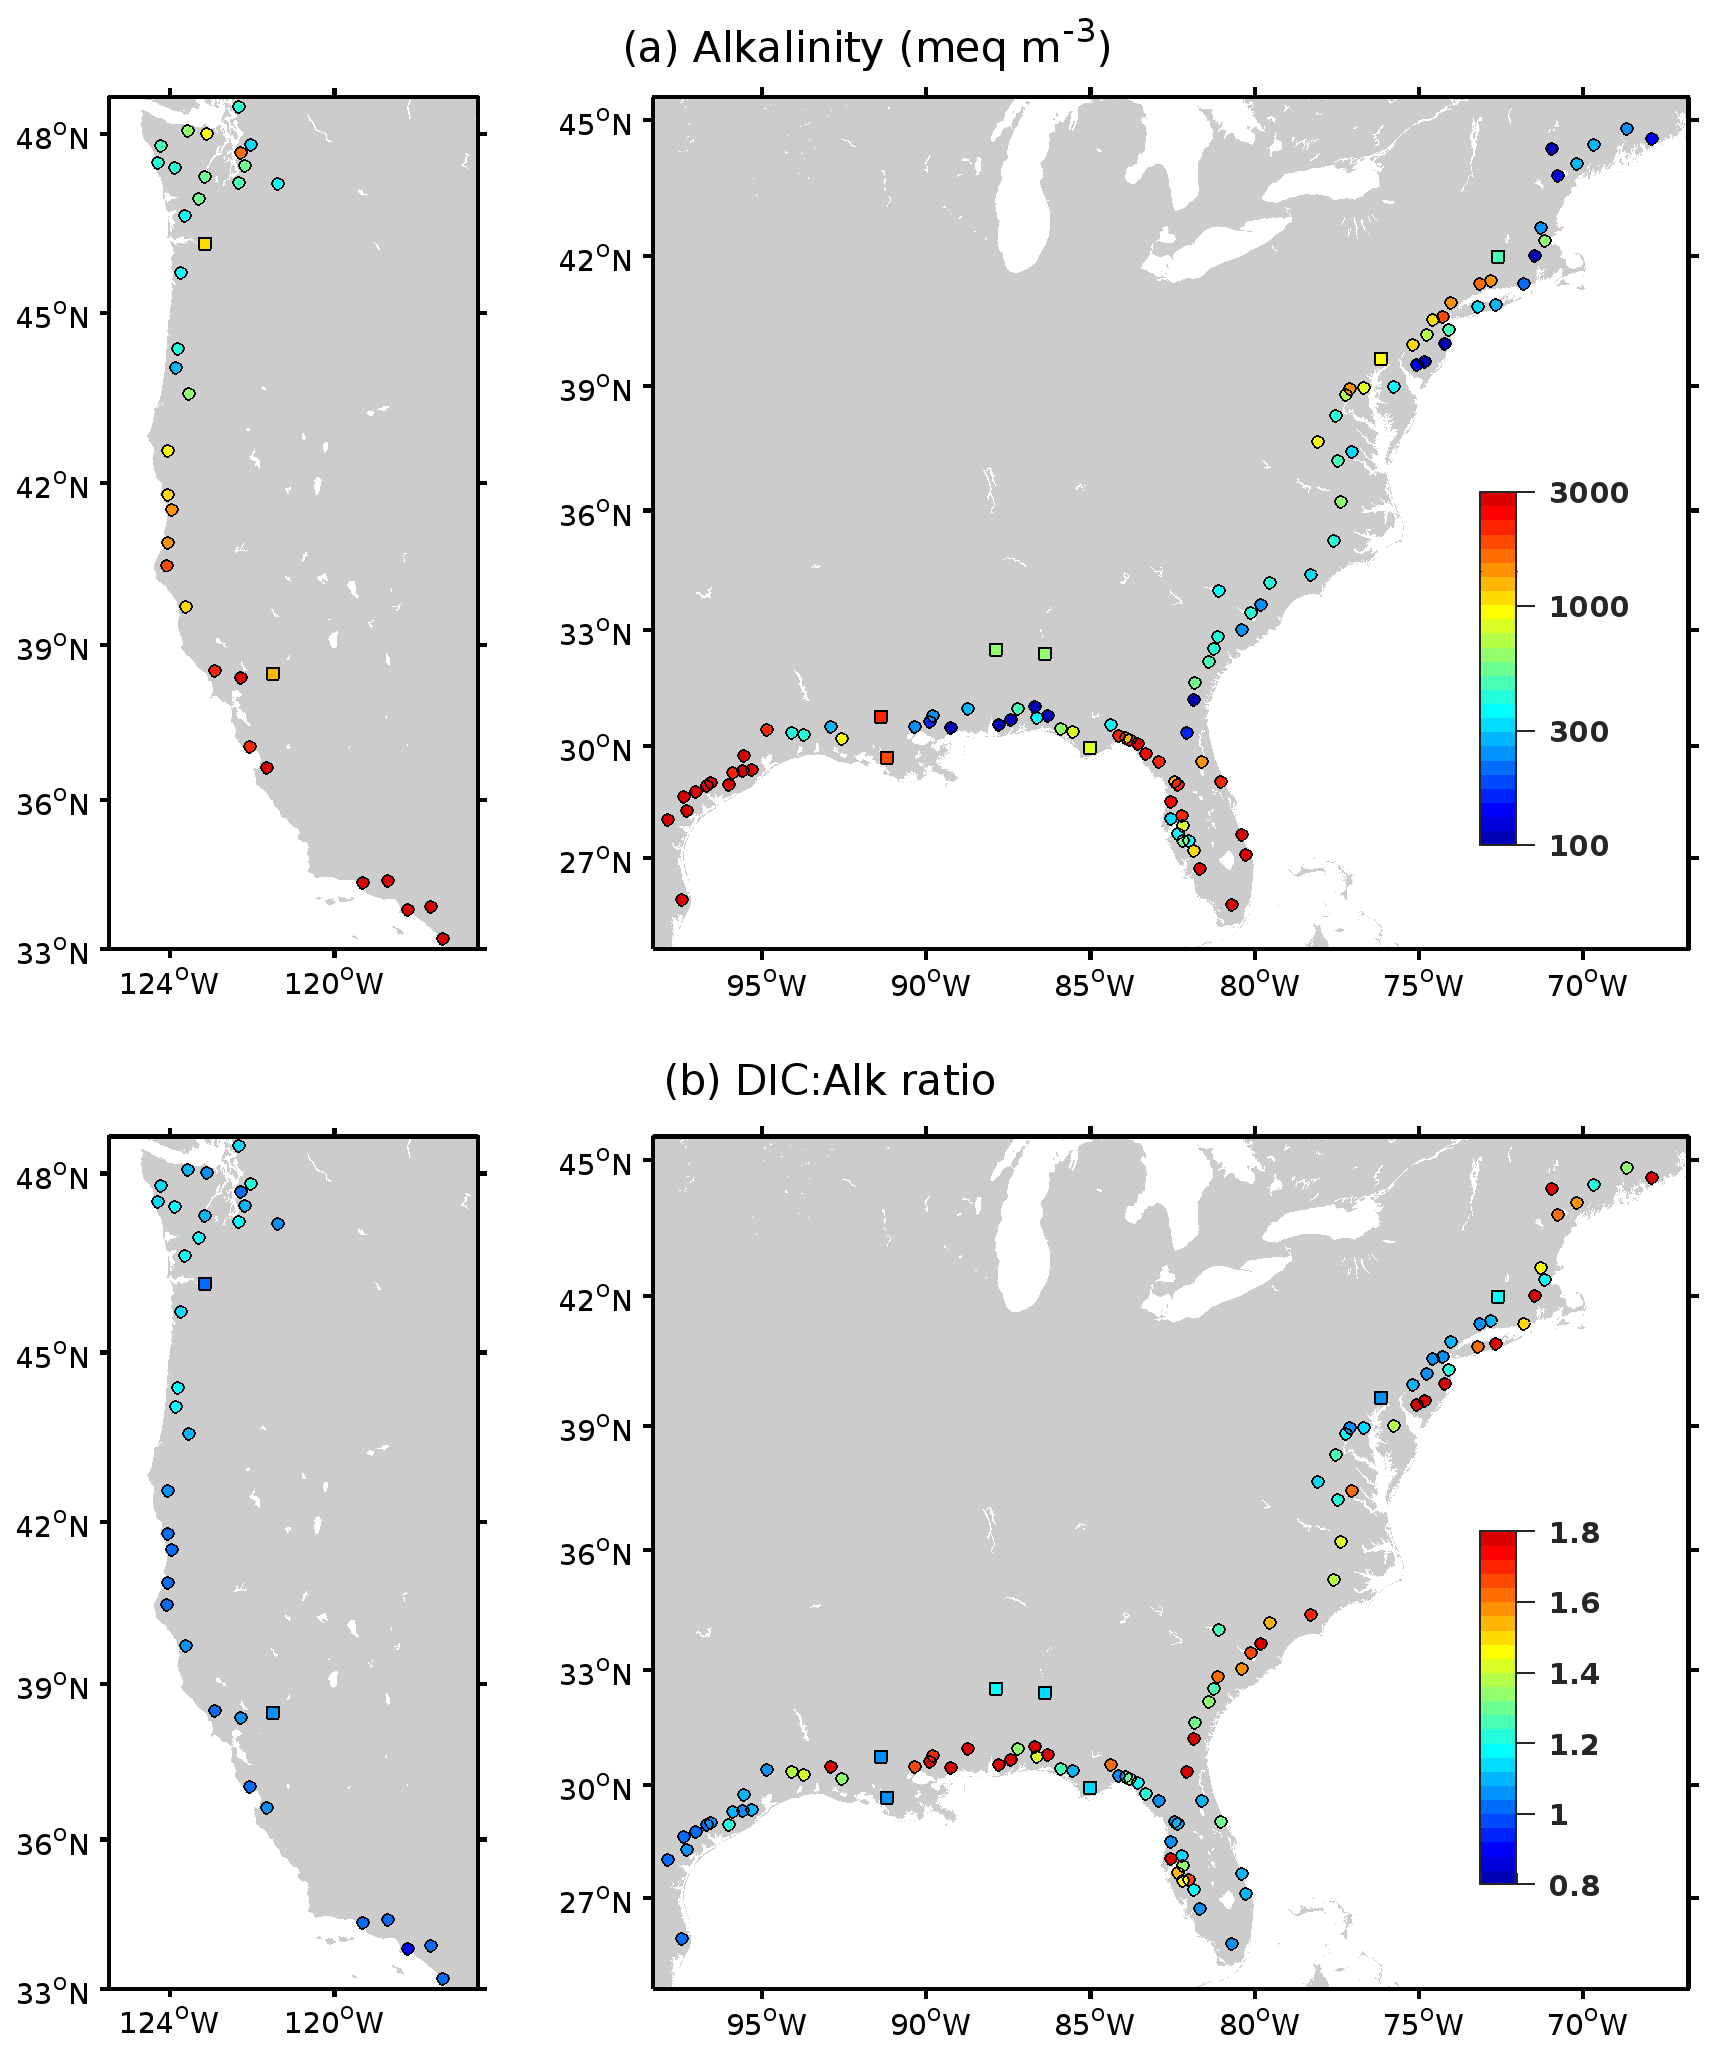
Figure 5Long-term mean (colored dots and squares) of the river (a) alkalinity and (b) DIC-to-alkalinity ratio. Squares (dots) represent river stations with a mean discharge greater (smaller) than 500 m3 s−1. Color bar in (a) is in log scale.
The average river DIC concentration shows a very similar spatial pattern to the average river alkalinity, as both variables are highly correlated (r=0.99; Fig. S5 in the Supplement). However, DIC tends to be greater than alkalinity, which is reflected in an average DIC:Alk ratio of 1.33 over the 140 stations. Like alkalinity, the frequency distribution of the site averaged DIC:Alk ratios has a positively skewed distribution (Fig. 4b), with a median of 1.17, and minimum and maximum values of 0.92 (Los Angeles) and 3.09 (Shoal), respectively. Rivers with the lowest DIC:Alk ratios are in the West Coast, where DIC is on average 8 % greater than alkalinity (Fig. 5b). Large DIC:Alk ratios are mainly associated with low-alkalinity rivers, and the opposite is true for high-alkalinity rivers. Indeed, the relationship between these two variables has a clear linear pattern for alkalinities below ∼ 500 meq m−3, where the mean DIC:Alk ratio decreases 0.234 units per every 100 meq alkalinity increase (Fig. 6a). Moreover, we found that the standard deviation of the DIC:Alk ratio (SDDIC:Alk) is inversely linked to the mean alkalinity (Fig. 6b). Most rivers with a mean alkalinity below 200 meq m−3 have a SDDIC:Alk greater than 0.4, whereas most rivers with a mean alkalinity above 1000 meq m−3 have a SDDIC:Alk lower than 0.2.
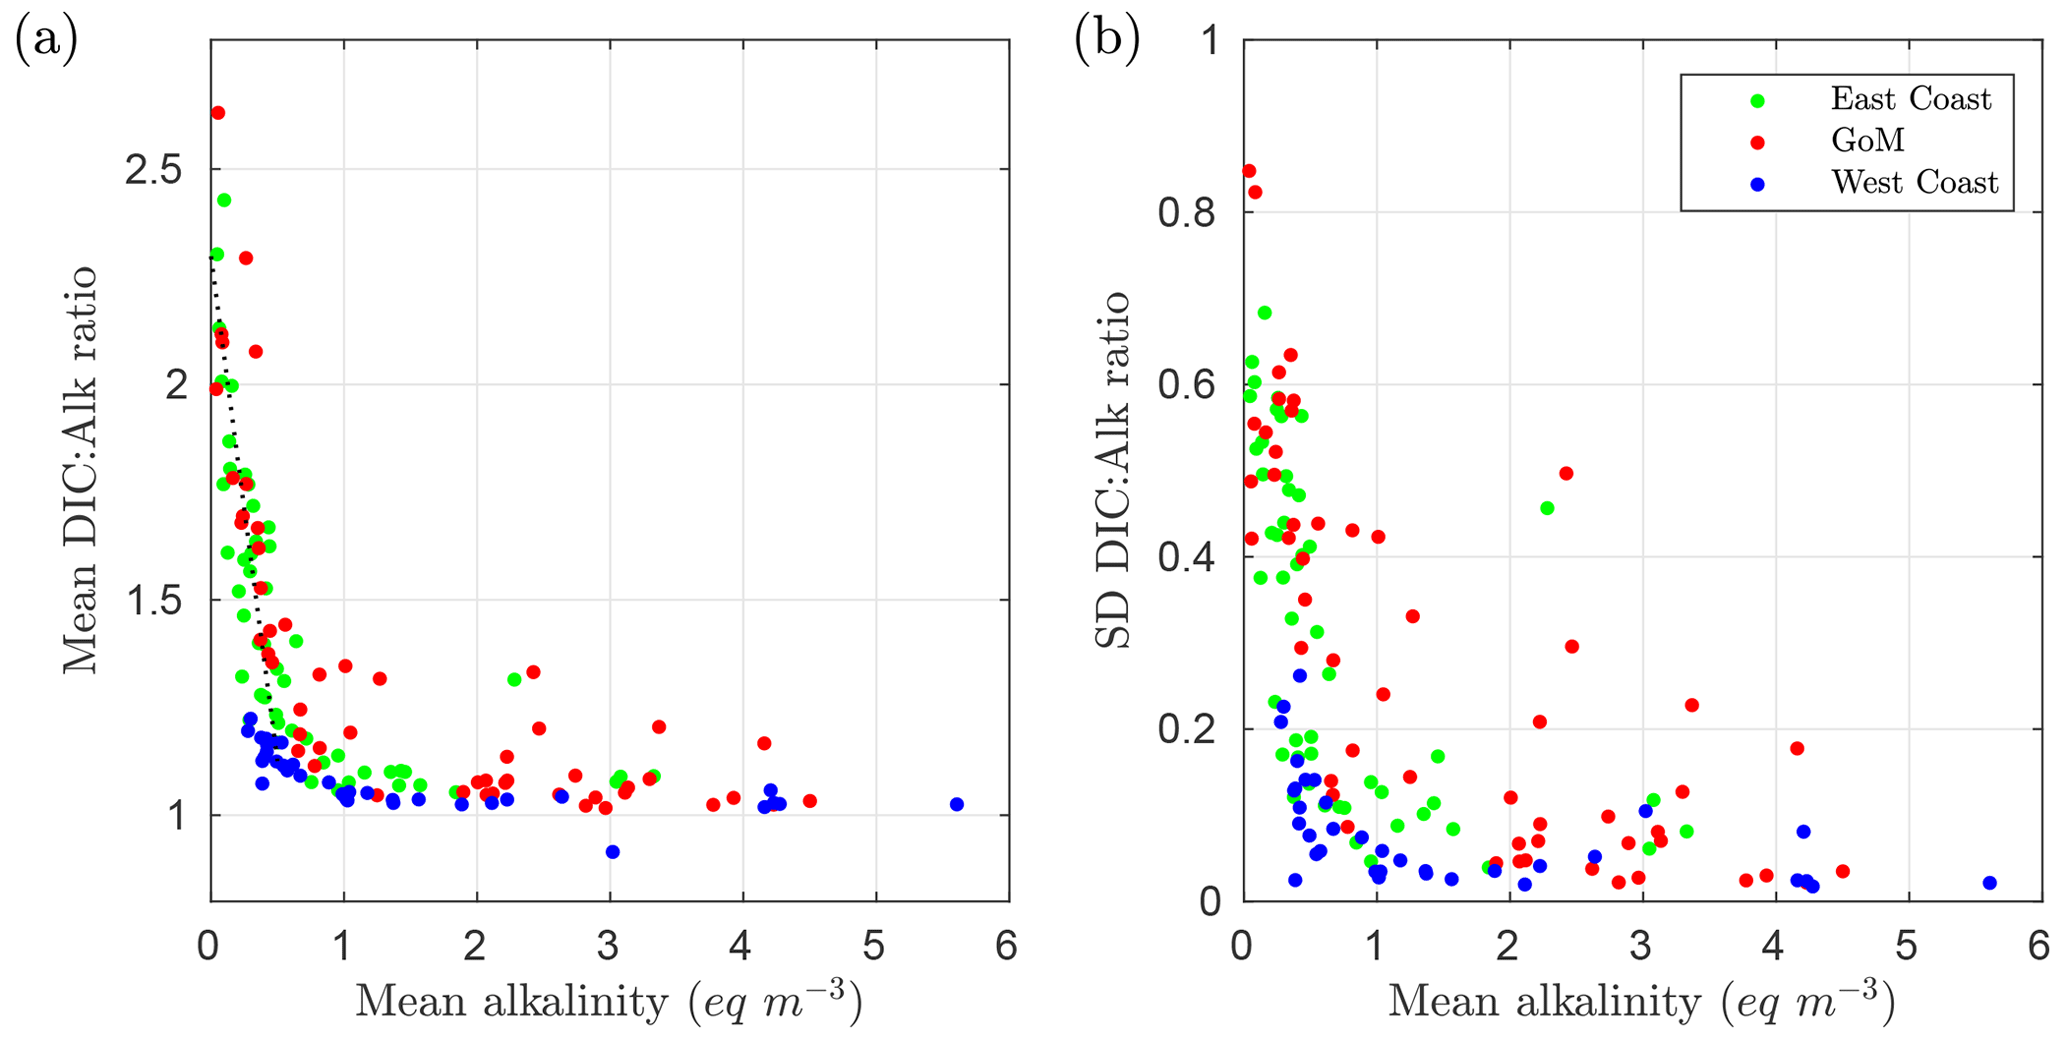
Figure 6Between-river variability in the DIC-to-alkalinity (DIC:Alk) ratio as a function of alkalinity: (a) mean DIC:Alk ratio vs. mean alkalinity; (b) standard deviation of the DIC:Alk ratio vs. mean alkalinity. Each dot represents one of 140 rivers in the dataset. Green, red, and blue dots depict the rivers flowing to the East Coast, Gulf of Mexico, and West Coast, respectively.
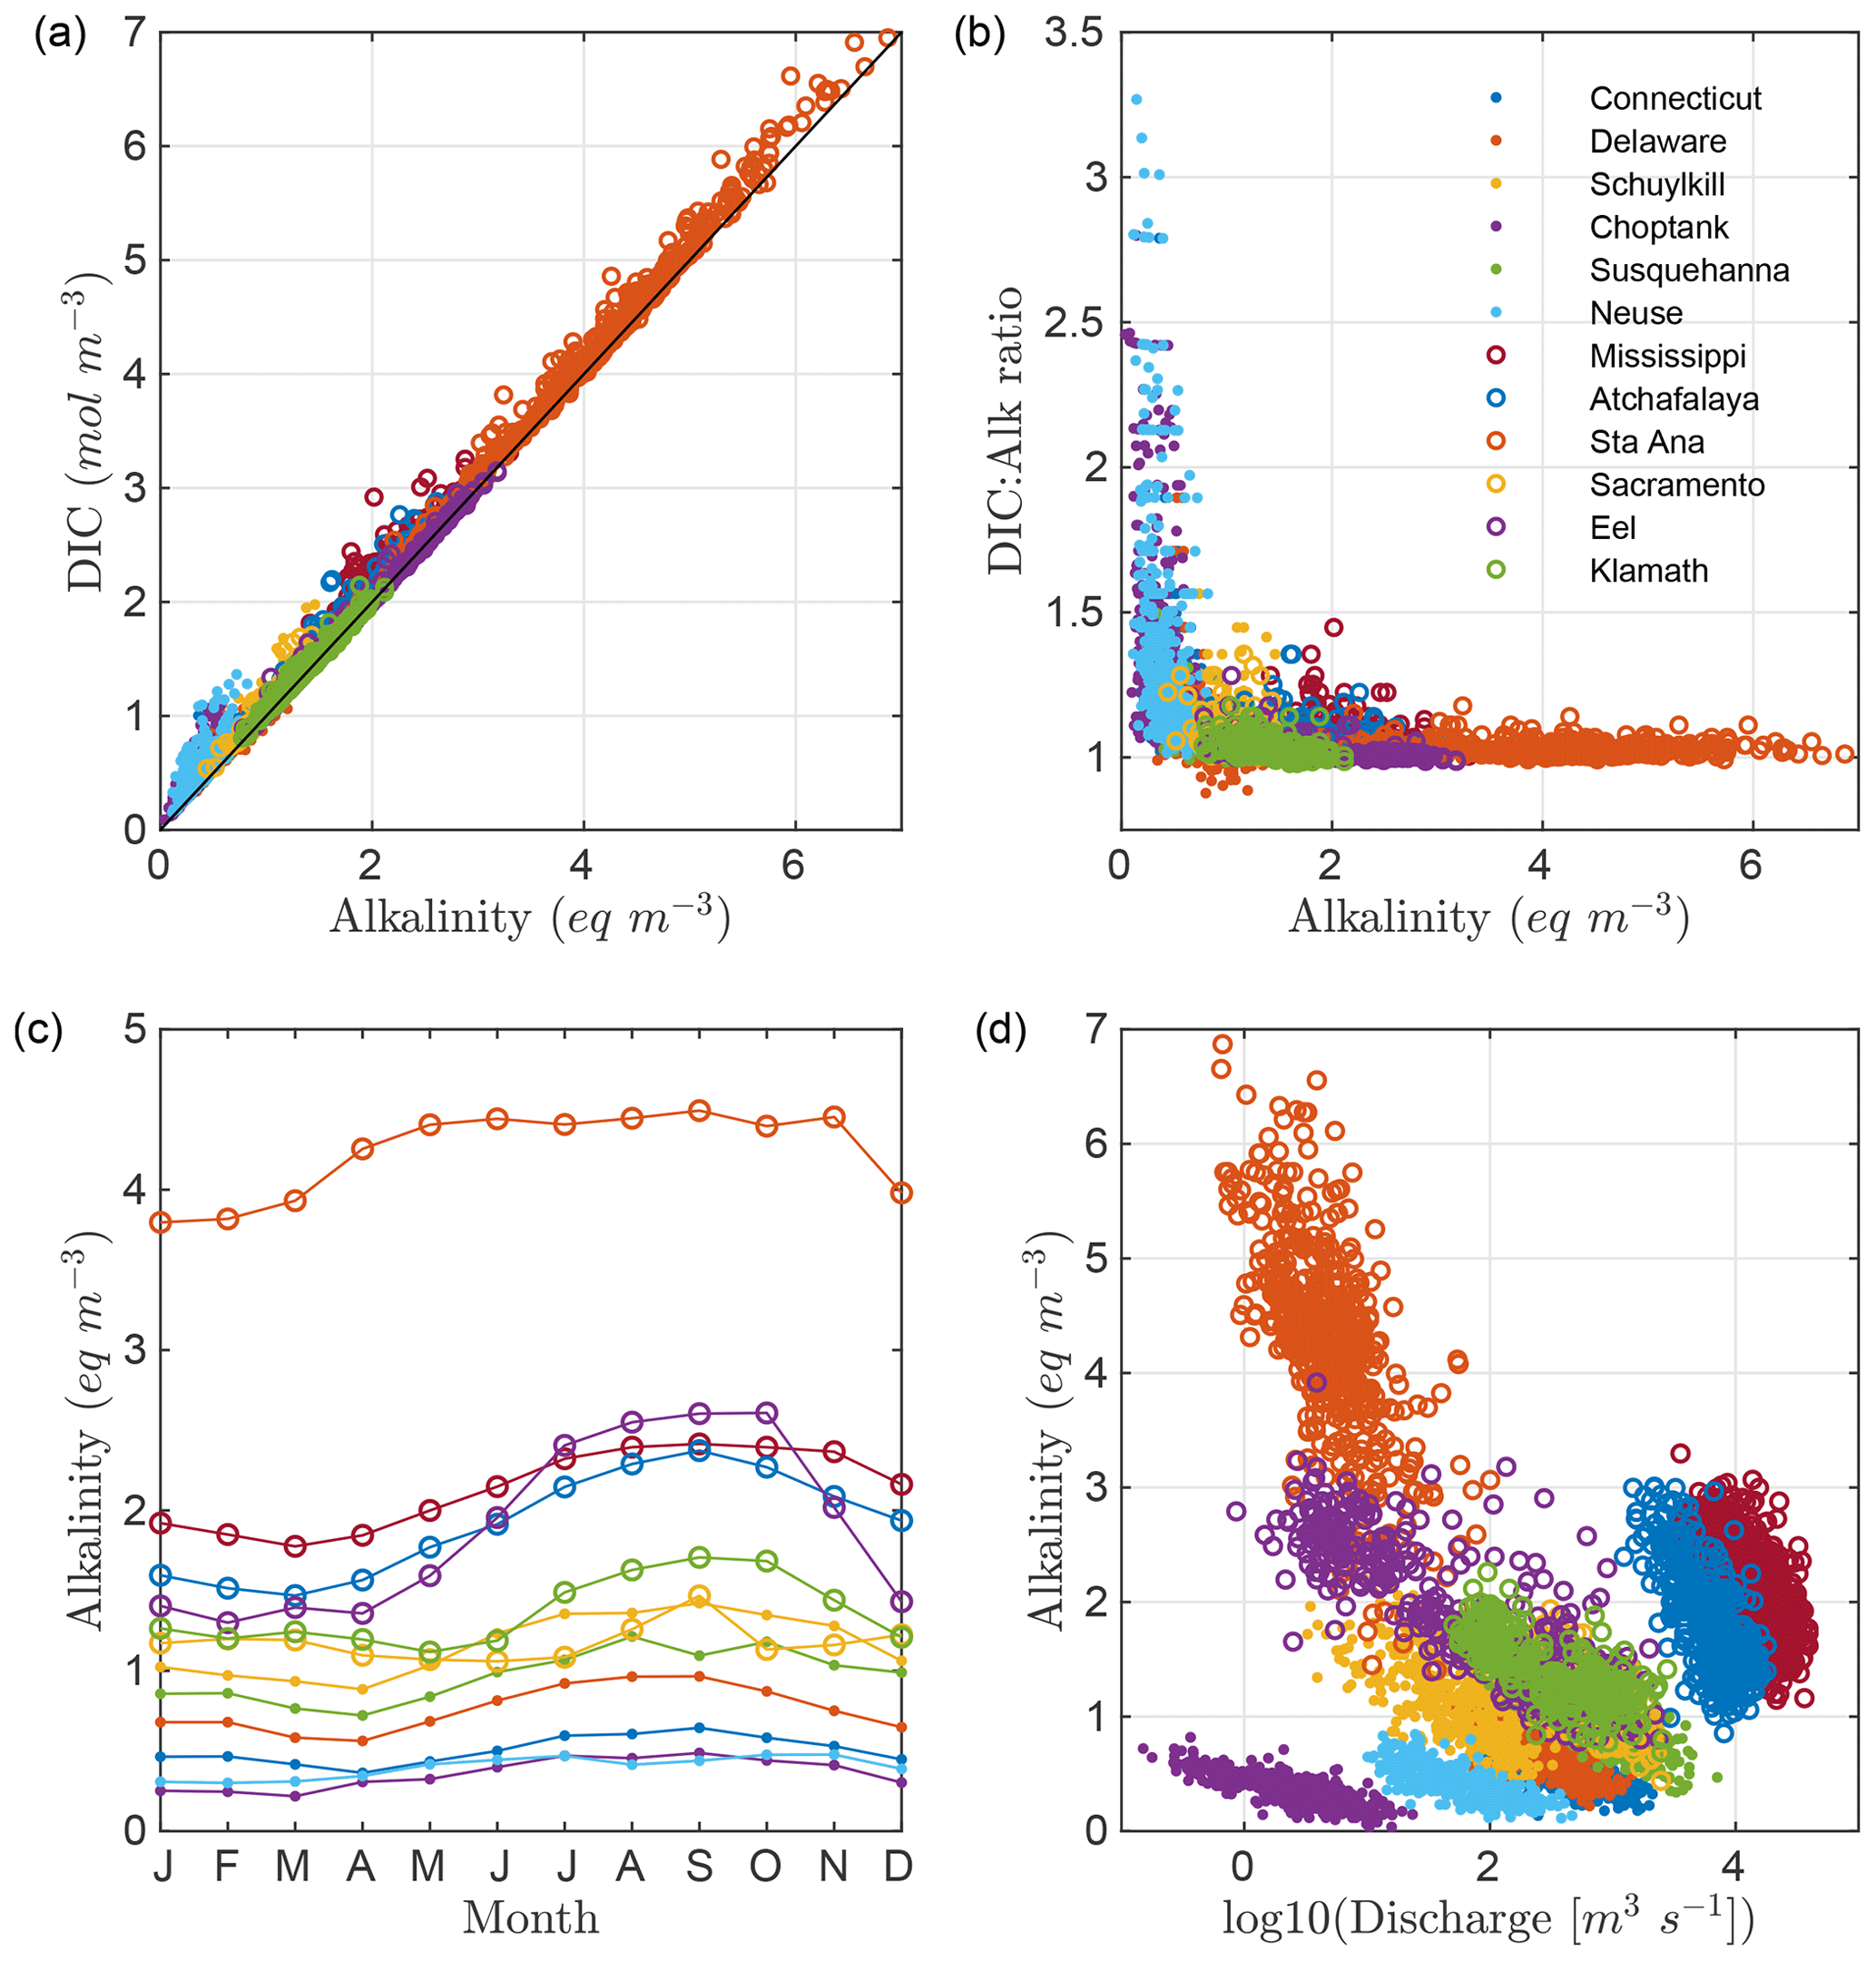
Figure 7Carbon system patterns for 12 selected rivers: (a) DIC vs. alkalinity and (b) DIC:Alk ratio vs. alkalinity; (c) monthly climatological patterns of alkalinity; and (d) alkalinity vs. logarithm of discharge. All patterns were derived for the 12 rivers with the largest number of records in the database: Connecticut (ID = 11), Delaware (23), Schuylkill (24), Choptank (25), Susquehanna (26), Neuse (35), Mississippi (86), Atchafalaya (88), Santa Ana (107), Sacramento (113), Eel (117), and Klamath (119) rivers.
To further investigate the river carbonate chemistry variability, we examined monthly records for the stations with the largest data density. Those stations are associated with six rivers in the East Coast (Connecticut, Delaware, Schuylkill, Choptank, Susquehanna, and Neuse), two rivers in the Gulf of Mexico (Mississippi and Atchafalaya), and four rivers in the West Coast (Santa Ana, Sacramento, Eel, and Klamath). A strong positive relationship between the monthly alkalinity and DIC records is evident for all of the 12 stations (Fig. 7a). The coefficients of determination (R2) for the linear regression of DIC against alkalinity average to 0.89, ranging from 0.57 (Neuse) to 0.99 (Eel) (Table S2 in the Supplement). Like the patterns in Figure 6, the monthly records show an inverse relationship between the DIC:Alk ratio and alkalinity (i.e., an increased variability in the DIC: Alk ratio at low-alkalinity values and vice versa at high-alkalinity values) (Fig.7b). The Choptank and Neuse rivers, in the lower end of the alkalinity concentration, show the largest dispersion in the DIC:Alk ratio, with values ranging from ∼ 1 to higher than 2.5. In contrast, the high-alkalinity Santa Ana River displays a much smaller variability, with the maximum DIC:Alk ratio around 1.1. Seasonal patterns for alkalinity (and DIC) tend to show enhanced values during summer and fall, and minimum values during winter and spring (Fig. 7c), concurrent with low and high discharge periods, respectively. This pattern is consistent with multiple studies conducted in specific river basins, suggesting dilution of carbonate chemistry variables during high discharge conditions (e.g., Cai, 2003; Guo et al., 2008; Joesoef et al., 2017). Indeed, a linear relationship between the logarithm of discharge (logDisc) and alkalinity is evident for each of the 12 stations (Fig. 7d). The adjusted linear regression models for these rivers are all significant, with linear regression coefficients ranging from 0.33 (Sacramento) to 0.69 (Eel) (Table S2).
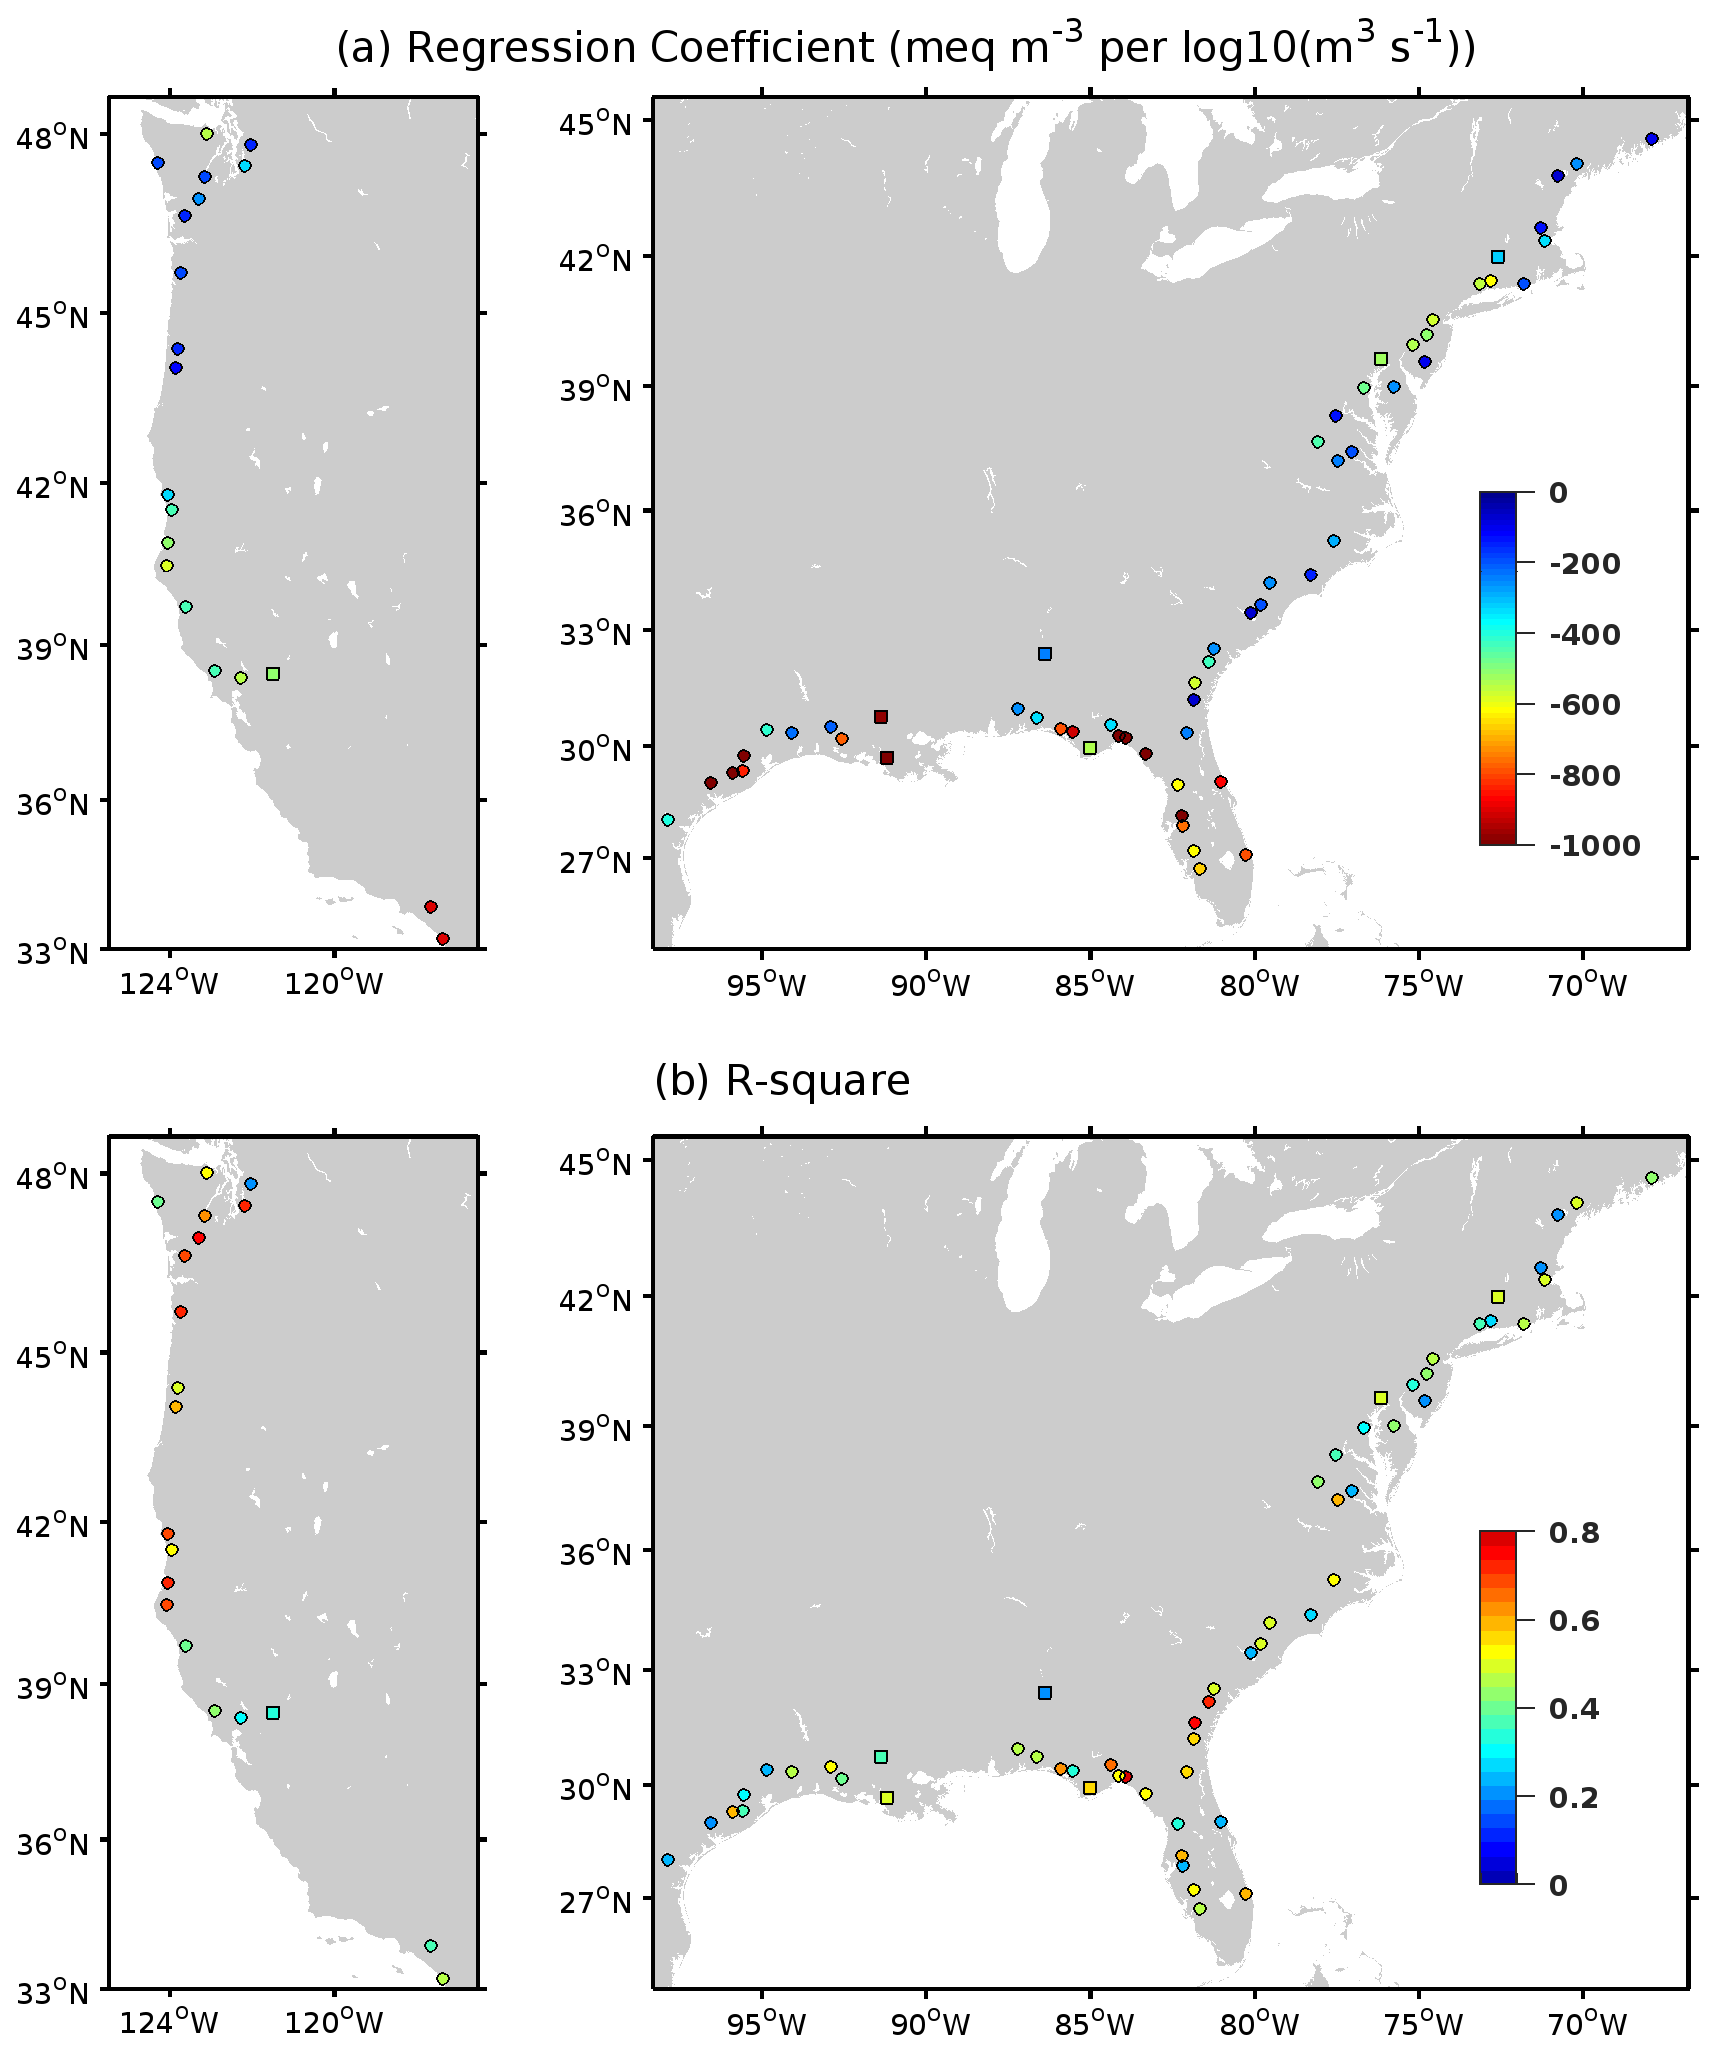
Figure 8(a) Regression coefficient and (b) coefficient of determination (R2) for the adjusted linear regressions between alkalinity and the logarithm of discharge (colored dots and squares). Patterns are shown only for the stations that have a significant regression coefficient, an R2 greater than 0.2, and more than 30 observations (78 out of 140 stations). Squares (dots) represent river stations with a mean discharge greater (smaller) than 500 m3 s−1.
The inverse relationship between logDisc and alkalinity in Fig. 7d can be extended to other rivers in the database. Figure 8 shows the regression coefficient (slope) and R2 for the stations where the regression was significant, explained at least 20 % of the alkalinity variance, and included at least 30 observations (78 out of 140 rivers). The sensitivity of river alkalinity to changes in discharge, reflected in the magnitude of the regression coefficient, is greater in the high-alkalinity rivers flowing to the Gulf of Mexico, Southern California, and eastern Florida coasts and smaller in the low-alkalinity rivers flowing to the Pacific Northwest coast and East Coast (Fig. 8a). This determines a significant negative correlation between the regression coefficient and the site-averaged alkalinity (). The R2 coefficient pattern shows an important spatial variability (Fig. 8b), which is not linked to river alkalinity or discharge. The largest R2 values (>0.5) characterize rivers flowing to the Pacific Northwest coast, Florida Panhandle, and South Atlantic Bight. Similar patterns were found for the relationship between logDisc and DIC (not shown).
The river chemistry data product is available in netCDF format at NOAA/NCEI with a DOI of https://doi.org/10.25921/9jfw-ph50 and NCEI accession number 0260455 (Gomez et al., 2022). For each of the selected river stations, we provide monthly time series and climatologies for each variable. Excel spreadsheets reporting the USGS parameters used to generate the dataset, the station and river mouth locations (latitude/longitude), the number of records in the series, and the first and last year in the series are also provided in the dataset.
Retrieving data from the USGS Water Quality Database has complexities, such as identifying nearshore sites for coastal studies (USGS contains more than 2400 sites across the United States, many in inland waters that are not directly relevant to coastal ocean analyses) or integrating water quality parameters to characterize biogeochemical properties (water properties are usually described by more than one USGS parameter). Thus, a user not familiar with the USGS database may require considerable time and effort to identify river sites and parameters. We facilitate this task, providing an integrated river chemistry and discharge dataset for 140 USGS nearshore sites, which contains relevant variables to characterize biogeochemical and water fluxes (land-to-ocean) along the US West Coast, US East Coast, and Gulf of Mexico. RC4USCoast includes data for alkalinity, pH, nutrients, and novel estimates of river DIC. River mouth location (latitude, longitude) is reported for each USGS site, which expedites the data integration in coastal biogeochemical studies. The main goal is to fill a gap for river carbonate chemistry products, as necessary inputs for regional model simulations that include ocean biogeochemistry. We also note the utility of this product for skill assessment of hydrologic and riverine chemistry models estimating discharge and nutrient loading patterns resulting from climate and land use activities (e.g., Lee et al., 2019). Patterns in RC4USCoast show distinct regional features for alkalinity and DIC. The average and standard deviation of the DIC:Alk ratio increased in low-alkalinity rivers, and both alkalinity and DIC concentration were inversely related to river discharge. Our results revealed a significant spatiotemporal variability in carbonate chemistry, which can play a significant role on coastal biogeochemical dynamics.
The supplement related to this article is available online at: https://doi.org/10.5194/essd-15-2223-2023-supplement.
FAG retrieved the USGS dataset and generated the monthly series and climatological data for the selected sites and variables. ACR produced the files in netCDF format. All authors contributed to the writing of the paper.
The contact author has declared that none of the authors has any competing interests.
Publisher’s note: Copernicus Publications remains neutral with regard to jurisdictional claims in published maps and institutional affiliations.
This article was supported by NOAA's Ocean Acidification Program, Climate Program Office, and Atlantic Oceanographic and Meteorological Laboratory.
The research was conducted under NOAA's awards to the Northern Gulf Institute (grant no. NA21OAR4320190).
This paper was edited by Chaoqun Lu and reviewed by two anonymous referees.
Alexander, R. B., Slack, J. R., Ludtke, A. S., Fitzgerald, K. K., and Schertz, T. L.: Data from selected US Geological Survey national stream water quality monitoring networks, Water Resour. Res., 34, 2401–2405, https://doi.org/10.1029/98WR01530, 1998.
Cai, W.-J.: Riverine inorganic carbon flux and rate of biological uptake in the Mississippi River plume, Geophys. Res. Lett., 30, 1032, https://doi.org/10.1029/2002GL016312, 2003.
Cai, W. J., Hu, X., Huang, W. J., Murrell, M. C., Lehrter, J. C., Lohrenz, S. E., Chou, W. C., Zhai, W., Hollibaugh, J. T., Wang, Y., Zhao, P., Guo X., Gundersen, K., Dai, M., and Gong G. C.: Acidification of subsurface coastal waters enhanced by eutrophication, Nat. Geosci., 4, 766–770, https://doi.org/10.1038/ngeo1297, 2011.
Fennel, K., Hetland, R., Feng, Y., and DiMarco, S.: A coupled physical-biological model of the Northern Gulf of Mexico shelf: model description, validation and analysis of phytoplankton variability, Biogeosciences, 8, 1881–1899, https://doi.org/10.5194/bg-8-1881-2011, 2011.
Fennel, K., Hu, J., Laurent, A., Marta-Almeida, M., and Hetland, R.: Sensitivity of hypoxia predictions for the northern Gulf of Mexico to sediment oxygen consumption and model nesting, J. Geophys. Res.-Ocean, 118, 990–1002, https://doi.org/10.1002/jgrc.20077, 2013.
Gomez, F. A., Wanninkhof, R., Barbero, L., and Lee, S.-K.: Increasing river alkalinity slows ocean acidification in the northern Gulf of Mexico, Geophys. Res. Lett., 48, e2021GL096521, https://doi.org/10.1029/2021GL096521, 2021.
Gomez, F. A., Lee, S.-K., Stock, C. A., Ross, A. C., Resplandy, L., Siedlecki, S. A., Tagklis, F., and Salisbury, J. E.: RC4USCoast: A river chemistry dataset for regional ocean model application in the U.S. East, Gulf of Mexico, and West Coasts from 1950-01-01 to 2022-12-31 (NCEI Accession 0260455), NOAA National Centers for Environmental Information [data set], https://doi.org/10.25921/9jfw-ph50, 2022.
Guo, X., Cai, W. J., Zhai, W., Dai, M., Wang, Y., and Chen, B: Seasonal variations in the inorganic carbon system in the Pearl River (Zhujiang) estuary, Cont. Shelf Res., 28, 1424–1434, https://doi.org/10.1016/j.csr.2007.07.011, 2008.
Hood, R. R., Shenk, G. W., Dixon, R. L., Smith, S. M., Ball, W. P., Bash, J. O., Batiuk, R., Boomer, K., Brady, D. C., Cerco, C., Claggett, P., Mutsert, K., Easton, Z. M., Elmore, A. J., Friedrichs, M. A. M., Harris, L. A., Ihde, T. F., Lacher, L., Li, L., Linker, L. C., Miller, A., Moriarty, J., Noe, G. B., Onyullo, G. E., Rose, K., Skalak, K., Tian, R., Veith, T. L., Wainger, L., Weller, D., and Zhang, Y. J.: The Chesapeake Bay program modeling system: Overview and recommendations for future development, Ecol. Model., 456, 109635, https://doi.org/10.1016/j.ecolmodel.2021.109635, 2021.
Hunt, C. W., Salisbury, J. E., and Vandemark, D.: Contribution of non-carbonate anions to total alkalinity and overestimation of pCO2 in New England and New Brunswick rivers, Biogeosciences, 8, 3069–3076, https://doi.org/10.5194/bg-8-3069-2011, 2011.
Joesoef, A., Kirchman, D. L., Sommerfield, C. K., and Cai, W.-J.: Seasonal variability of the inorganic carbon system in a large coastal plain estuary, Biogeosciences, 14, 4949–4963, https://doi.org/10.5194/bg-14-4949-2017, 2017.
Kearney, K. A., Bograd, S. J., Drenkard, E., Gomez, F. A., Haltuch, M., Hermann, A. J., Jacox, M. G., Kaplan, I. C., Koenigstein, S., Luo, J. Y., and Masi, M.: Using global-scale earth system models for regional fisheries applications, Front. Mar. Sci, 8, 622206, https://doi.org/10.3389/fmars.2021.622206, 2021.
Mayorga, E., Seitzinger, S. P., Harrison, J. A., Dumont, E., Beusen, A. H., Bouwman, A. F., Fekete, B. M., Kroeze, C., and Van Drecht, G.: Global nutrient export from WaterSheds 2 (NEWS 2): model development and implementation, Environ. Modell. Softw., 25, 837–853, https://doi.org/10.1016/j.envsoft.2010.01.007, 2010.
Lacroix, F., Ilyina, T., Mathis, M., Laruelle, G. G., and Regnier, P.: Historical increases in land-derived nutrient inputs may alleviate effects of a changing physical climate on the oceanic carbon cycle, Glob. Change Biol., 27, 5491–5513, https://doi.org/10.1111/gcb.15822, 2021.
Laurent, A., Fennel, K., Cai, W. J., Huang, W. J., Barbero, L., and Wanninkhof, R.: Eutrophication- induced acidification of coastal waters in the northern Gulf of Mexico: Insights into origin and processes from a coupled physical-biogeochemical model, Geophys. Res. Lett., 44, 946–956, https://doi.org/10.1002/2016GL071881, 2017.
Lee, M., Shevliakova, E., Stock, C. A., Malyshev, S., and Milly, P. C.: Prominence of the tropics in the recent rise of global nitrogen pollution, Nat. Commun., 10, 1437,, https://doi.org/10.1038/s41467-019-09468-4, 2019.
Li, M., Peng, C., Wang, M., Xue, W., Zhang, K., Wang, K., Shi, G., and Zhu, Q.: The carbon flux of global rivers: a re-evaluation of amount and spatial patterns, Ecol. Indic., 80, 40–51, https://doi.org/10.1016/j.ecolind.2017.04.049, 2017.
Li, M., Peng, C., Zhou, X., Yang, Y., Guo, Y., Shi, G., and Zhu, Q.: Modeling global riverine DOC flux dynamics from 1951 to 2015, J. Adv. Model. Earth Sy., 11, 514–530, https://doi.org/10.1029/2018MS001363, 2019.
Liu, X., Stock, C. A., Dunne, J. P., Lee, M., Shevliakova, E., Malyshev, S., and Milly, P. C.: Simulated Global Coastal Ecosystem Responses to a Half-Century Increase in River Nitrogen Loads, Geophys. Res. Lett., 48, e2021GL094367, https://doi.org/10.1029/2021GL094367, 2021.
Moore-Maley, B. L., Ianson, D., and Allen, S. E.: The sensitivity of estuarine aragonite saturation state and pH to the carbonate chemistry of a freshet-dominated river, Biogeosciences, 15, 3743–3760, https://doi.org/10.5194/bg-15-3743-2018, 2018.
Rabouille, C., Conley, D. J., Dai, M. H., Cai, W. J., Chen, C. T. A.: Lansard, B., Green, R., Yin, K., Harrison, P. J., Dagg, M., and McKee, B.: Comparison of hypoxia among four river-dominated ocean margins: The Changjiang (Yangtze), Mississippi, Pearl, and Rhône rivers, Cont. Shelf Res., 28, 1527–1537, https://doi.org/10.1016/j.csr.2008.01.020, 2008.
Regnier, P., Resplandy, L., Najjar, R. G., and Ciais, P.: The land-to-ocean loops of the global carbon cycle, Nature, 603, 401–410, https://doi.org/10.1038/s41586-021-04339-9, 2022.
Siedlecki, S. A., Pilcher, D. J., Hermann, A. J., Coyle, K., and Mathis, J.: The importance of freshwater to spatial variability of aragonite saturation state in the Gulf of Alaska, J. Geophys. Res.- Oceans, 122, 8482–8502, https://doi.org/10.1002/2017JC012791, 2017.
Siedlecki, S. A., Salisbury, J., Gledhill, D. K., Bastidas, C., Meseck, S., McGarry, K., Hunt, C. W., Alexander, M., Lavoie, D., Wang, Z. A., and Scott, J.: Projecting ocean acidification impacts for the Gulf of Maine to 2050: New tools and expectations, Elem. Sci. Anth., 9, 00062, https://doi.org/10.1525/elementa.2020.00062, 2021.
Stets, E. G. and Striegl, R. G.: Carbon export by rivers draining the conterminous United States, Inl. Waters, 2, 177–184, https://doi.org/10.5268/IW-2.4.510, 2012.
van Heuven, S. M. A. C., Pierrot, D., Rae, J. W. B., Lewis E., and Wallace D. W. R.: MATLAB program developed for CO2 system calculations, ORNL/CDIAC-105b Carbon Dioxide Information Analysis Center, Oak Ridge National Laboratory, US Department of Energy, Oak Ridge, TN, US [code], 2011.
Xie, Y., Lin, L., Xiao, W., Yu, X., Lan, W., and Huang, B.: Striking seasonal pattern of primary production in the river-dominated ocean margin of the northern South China Sea (NSCS-RiOMar) revealed by new field and remotely sensed data, Prog. Oceanogr., 189, 102470, https://doi.org/10.1016/j.pocean.2020.102470, 2020.