the Creative Commons Attribution 4.0 License.
the Creative Commons Attribution 4.0 License.
 | 15 May 2023
Evaluating the transport of surface seawater from 1956 to 2021 using 137Cs deposited in the global ocean as a chemical tracer
Yayoi Inomata
Michio Aoyama
We analyzed the spatiotemporal variations in the 137Cs activity concentrations in global ocean surface seawater from 1956 to 2021 using the HAMGlobal2021 (Historical Artificial radioactivity database in Marine environment, Global integrated version 2021) and other published data. The global ocean was divided into 37 boxes. When observing the 0.5-year median value of 137Cs in each box in the Pacific Ocean, we noticed that the values gradually increased or had almost constant levels in the 1950s and 1960s, and then decreased exponentially in 1970–2010, immediately before the Fukushima Daiichi Nuclear Power Plant Station (F1NPS) accident. In the northern North Atlantic Ocean and its marginal sea, the 0.5-year median values of 137Cs showed large variations in the directly discharged 137Cs from the reprocessing plants. The 137Cs inventory in the surface mixed layer in 1970, when 137Cs was released into the surface seawater, was estimated to be 184±26 PBq. In 1975 and 1980, the 137Cs inventory increased to 201±27 and 214±11 PBq, respectively, due to direct discharge from the Sellafield and La Hague nuclear fuel reprocessing plants. In 2011, the 137Cs inventory in the global ocean mixed layer increased to 50.7±7.3 PBq compared to that before the F1NPS accident, in which the contribution from the accident was estimated to be approximately 15.5±3.9 PBq. Mass balance analysis indicates that 137Cs deposited by the global fallout in the western North Pacific Ocean moved to the eastern North Pacific Ocean. Subsequently, 137Cs was transported southwards, followed by westward transport in the subtropical and equatorial Pacific Ocean, and then inflowed into the Indian Ocean via the Indonesian Archipelago. The longer apparent half-residence times in the Indonesian Archipelago (36.7 years from 1973 to 1997) and central Atlantic Ocean (38.0 years from 1992 to 2016) also support the interpretation of the global-scale transport of 137Cs from the western North Pacific Ocean to the Indian (20–30 years) and Atlantic oceans (30–40 years). In the northern North Atlantic Ocean and its marginal sea, 137Cs discharged from nuclear reprocessing plants is transported to the North Sea, Barents Sea and coast of Norway, and Arctic Ocean on a decadal scale. The dataset is available at https://doi.org/10.34355/CRiED.U.Tsukuba.00085 (Aoyama, 2021), https://doi.org/10.34355/Ki-net.KANAZAWA-U.00149 (Inomata and Aoyama, 2022a), https://doi.org/10.34355/Ki-net.KANAZAWA-U.00150 (Inomata and Aoyama, 2022b), and https://doi.org/10.34355/Ki-net.KANAZAWA-U.00151 (Inomata and Aoyama, 2022c).
- Article
(32115 KB) - Full-text XML
- BibTeX
- EndNote


137Cs is regarded as one of the most abundant artificial radionuclides in the ocean because of its long half-life (30.17 years) and large fission yield that originates from large-scale atmospheric weapons tests. Atmospheric nuclear weapons tests occurred from 1945 to 1980. During 1945 to 1963, large-scale atmospheric nuclear weapons tests were conducted by the United States. In 1963, the Partial Nuclear Test Ban Treaty was signed, and these tests in the atmosphere by the United States, former Soviet Union, and Great Britain were conducted underground. However, France continued with atmospheric tests until 1974 and China until 1980. In addition, 137Cs has been released into the Pacific Ocean by local fallout from ground tests on Bikini Atoll in the Marshall Islands between 1946 and 1958 as a result of tests conducted by the United States (e.g., UNSCEAR, 2000; Aoyama et al., 2006; Aoyama, 2010; Inomata, 2010). Because large amount of 137Cs released into the atmosphere, leading to fallout onto the ocean surface, the ocean is recognized as the largest receptor of 137Cs on Earth. Furthermore, other sources, such as the accidental release from nuclear facilities (the Three Mile Island nuclear power plant in 1979), sea dumping of nuclear wastes from nuclear facilities carried out in 1986 in the north–central East China Sea/Sea of Japan by the former Soviet Union and Russian Federation, lost nuclear weapons, and the use of radioisotopes in human activities, such as industry, medicine, and science, are recognized. These contributions in the environment are minor compared to those from the dominant sources listed above (UNSCEAR, 2000; IAEA, 2005).
The 137Cs released by the large-scale nuclear weapons tests was largely deposited in the western part of the North Pacific Ocean at approximately 30–45∘ N latitude and in the western part of the North Atlantic Ocean at approximately 30–50∘ N latitude from the late 1950s to the early 1960s (UNSCEAR, 2000; Aoyama et al., 2006). By using a dataset of 137Cs measurements in rainwater, seawater, and soil, 137Cs deposition estimated by global fallout in the Northern Hemisphere with a 10∘ × 10∘ grid was 765±79 PBq (Aoyama et al., 2006). The deposition of 137Cs in the Southern Hemisphere was significantly lower than that in the Northern Hemisphere. The maximum deposition of 137Cs in the Southern Hemisphere occurred approximately 1 year after that in the Northern Hemisphere, owing to the stratosphere air mass exchange between the northern and southern stratosphere (Hirose and Aoyama, 2003a, b).
The dissolved 137Cs discharged from nuclear reprocessing plants, namely the Sellafield plant (Irish Sea, United Kingdom) and the La Hague facility (English Channel coast, France), are also large sources. Since 1952, the discharge of several radionuclides from the Sellafield plant has occurred in the Irish Sea. The released 137Cs amount reached a maximum in the mid to late 1970s (Gray et al., 1995; Guegueniat et al., 1997; UNSCEAR, 2000). The discharged 137Cs from the Sellafield plant from 1951 to 2020 was estimated to be 41.4 PBq (OSPAR, 2021). The maximum discharged 137Cs from the La Hague plant occurred in 1971, and the amount of discharged 137Cs decreased over time. The total amount of 137Cs released from the La Hague plant was estimated to be 1.04 PBq (OSPAR, 2021). These discharged 137Cs components were then transported to the northern North Atlantic Ocean, its marginal seas, and the Arctic Ocean (Smith et al., 1998; Maderich et al., 2021).
The Chernobyl accident on 26 April 1986 also released 137Cs into the environment (e.g., Molero et al., 1999; Steinhauser et al., 2014; Miyao et al., 1998), which was estimated to be 85±26 PBq (Nuclear Energy Agency, 2002). Although most of the 137Cs derived from the Chernobyl accident was deposited on land, a significant amount of 137Cs was released into the ocean, which was estimated to be 15–20 PBq (Aarkrog, 2003). In particular, the Chernobyl fallout increased the 137Cs activity concentrations in the Baltic Sea (Zaborska et al., 2014), resulting in it being the most radioactive, contaminated area, with 4.5 PBq of the total inventory (CEC, 1990). The Black Sea also received the Chernobyl 137Cs fallout in 1986 (Bezhenar et al., 2019; Egorov et al., 1999), and the inventory was estimated to be 2–3 PBq (Egorov et al., 1999). The 137Cs released into the Black Sea flowed into the Mediterranean Sea (Bezhenar et al., 2019). In the Mediterranean Sea, the total deposition of 137Cs from the Chernobyl accident was estimated to be 2.5 PBq in 1986 (Delfanti and Papucci, 2010). Furthermore, the fallout of 137Cs from the Chernobyl accident also occurred as a single, small pulse in the western North Pacific Ocean and Sea of Japan (Miyao et al., 1998; Inomata et al., 2009), and the Chernobyl release contributed only a few percent compared to the previous 137Cs water column inventory in these regions (Aoyama et al., 1986).
The Fukushima Daiichi Nuclear Power Plant Station (F1NPS) accident is also recognized as being a large source of 137Cs. On 11 March 2011, large amounts of 137Cs were released into the western North Pacific Ocean by atmospheric deposition and the direct discharge of liquid-contaminated stagnant water from the F1NPS because of the extraordinary earthquake and the subsequent giant tsunami (IAEA, 2015; UNSCEAR, 2013). The released 137Cs amount by the F1NPS accident and the subsequent distributions were investigated by numerous researchers and summarized in Buesseler et al. (2017). In this study, we used our estimation because these studies were considering the mass balances among atmosphere, land, and ocean. The atmospheric deposited amount of 137Cs into the ocean from the atmosphere was estimated to be 11.7–14.8 PBq (Aoyama et al., 2016c). Directly discharged liquid 137Cs from the F1NPS was estimated to be 3.6±0.7 PBq by using the observation data around the F1NPS and model simulation (Tsumune et al., 2012, 2013). The 137Cs inventory into the North Pacific Ocean in the surface mixed layer was estimated to be 15.2–18.3 PBq (Aoyama et al., 2016c), which are values that are consistent with the values estimated by optical statistical analysis (Inomata et al., 2016) and model simulation (Tsubono et al., 2016). It is noted that the region that contains F1NPS deposition in the western North Pacific Ocean is almost the same region as that with the global fallout of 137Cs in the 1950s and 1960s.
Other sources, such as nuclear waste dumping, discharges from nuclear power plant operation, the release of radionuclides from satellite failures, local underwater nuclear tests, nuclear weapons accidents, and the use in industry and medicine, are considered minor contributors to 137Cs concentrations in the global ocean (Livingston and Povinec, 2000; IAEA, 2005).
137Cs exists mainly in the dissolved form, which allows it to move with seawater. After its release into the ocean, 137Cs undergoes radioactive decay, with a half-life of 30.17 years, during transport into the ocean by undergoing oceanic physical processes, such as advection, diffusion, and downward transport. Therefore, 137Cs has been used as a marine tracer for decades to study physical processes, such as the long-range transport of water masses (e.g., IAEA, 2005; Hirose and Aoyama, 2003a, b; Inomata et al., 2009, 2012; Nakano et al., 2010; Povinec et al., 2003; Tsumune et al., 2003, 2011). Furthermore, 137Cs is used to assess the radioactive doses (or radiological effects) on the human body due to the uptake of marine foods containing anthropogenic radionuclides (e.g., IAEA, 2005; UNSCEAR, 2013).
The spatiotemporal variations in 137Cs activity concentrations in the surface seawater in the global ocean from 1956 to 2021 were investigated in this study. This study is an extension of our previous research, in which we analyzed the measured data up to 2005 (Inomata et al., 2009). The data used in this study were adopted from HAMGlobal2021 (Historical Artificial radioactivity database in the Marine environment, Global integrated version 2021; Aoyama, 2021), which contains data from the F1NPS accident. The HAMGlobal2021 database contains information on several radionuclides (134Cs, 137Cs, 90Sr, 3H, 239,240Pu, 241Am, and 14C) in the global ocean. The data were measured from 1956 to 2021. The dataset of the International Atomic Energy Agency Marine Radioactivity Information System (IAEA MARIS) was also included in HAMGlobal2021. In addition to this, the data measured in the North Atlantic Ocean and its marginal seas by IRSN (Institut de Radioprotection et de Sûreté Nucléaire; Baily du Bois et al., 2020) were also contained in this study.
In this paper, we present the following new insights.
-
The distribution of 137Cs in the mixed layer in the global ocean includes the following:
-
spatiotemporal variations in 137Cs activity concentrations in the surface seawater in the global ocean from 1956 to 2021,
-
spatiotemporal variations in the 137Cs inventory in the surface mixed layer in the global ocean based on the reconstructed 2 min longitude/latitude 137Cs deposition data and surface mixed-layer depths in each box, and
-
an estimate of the apparent half-residence time (Tap) in each box in the global ocean.
-
-
The behavior of 137Cs in the surface mixed layer in the global ocean includes the following:
-
a comparison between the amount of 137Cs deposited from the atmosphere due to global fallout and that directly released from nuclear reprocessing plants,
-
the behavior of 137Cs released from nuclear reprocessing plants in the Atlantic to the Arctic, and
-
an estimate of the amount of 137Cs released from the F1NPS in 2011 by using the inventory in each box.
-
-
The mass balance includes the following:
-
an estimate of the 137Cs amount in net outflow to the downstream box and downward transport below the surface mixed layer, and
-
finally, a summary of the 137Cs transport time in the global ocean.
-
2.1 Data availability – HAMGlobal2021 database
The 137Cs concentration data were obtained from HAMGlobal2021; this database includes data measured from 1956 to 2021. These data are available at https://doi.org/10.34355/CRiED.U.Tsukuba.00085 (Aoyama, 2021). The data were measured by many organizations and institutes, including the Baltic Marine Environment Protection (MORS, Germany), the Bundesamt für Seeschifffahrt und Hydrographie (BSH, Germany), the Korean Institute of Nuclear Safety (KINS, South Korea), the Marine Ecology Research Institute (MERI, Japan), the Ministry of Agriculture, Fisheries and Food (MAFF, United Kingdom), the Japan Coast Guard (JCG, Maritime Safety Agency until 2000, Japan), the Norwegian Radiation Protection Authority (NRPA, Norway), the Risø DTU National Laboratory (RISO, Denmark), and the RPA V. G. Khlopin Radium Institute (VGKRI, Russia). Data were also obtained from various research projects, such as the Arctic Monitoring Assessment Program (AMAP), the Geochemical Ocean Sections Study (GEOSECS), the South Atlantic Ventilation Experiment (SAVE), the Transit Tracers in the Ocean (TTO) program, the World Ocean Circulation Experiment (WOCE), and the Worldwide Marine Radioactivity Studies (WOMARS). Furthermore, we included the data reported in various research papers (Aarkrog, 1994; Aoyama and Hirose, 1995, 2004; Aoyama et al., 2001a, b, 2008, 2011, 2013, 2016a, b, c, 2018; Aoyama, 2018; Ballestra et al., 1984; Bourlat et al., 1996; Bowen et al., 1980; Broecker et al., 1966; Broecker and Simpson, 1968; Buesseler, 2012; Buesseler et al., 2017; Cochran et al., 1987; Dahlgaard et al., 1995; Delfanti et al., 2000; Folsom and Mohanrao, 1960; Folsom et al., 1960, 1968, 1970, 1975; Folsom, 1979; Fowler et al., 1991; Gulin and Stokozov, 2005; Hirose et al., 1987, 1991, 1999; Hirose and Aoyama, 2003a, b; Ikeuchi et al., 1999; Ito et al., 2003, 2005; Kaeriyama et al., 2013, 2014, 2015; Kamenik et al., 2013; Katsuragi, unpublished data; Kautsky, 1987; Kim et al., 2012; Kumamoto et al., 2014, 2015, 2016, 2017, 2018, 2019; Livingston et al., 1985; Livingston and Povinec, 2000; Matishov et al., 2002; Miroshnichenko and Paraskiv, 2020; Miyake et al., 1960, 1961, 1988; Miyake, 1962, 1963; Miyake and Sugimura, 1968, 1978; Miyao et al., 1998; Nagaya et al., 1964a, b, 1965, Nagaya and Nakamura, 1970, 1976, 1981, 1984, 1987, 1993; Nakanishi et al., 1990, 1995; Nies, 1989; Noshkin et al., 1976, 1978, 1979, 1981; Noshkin, 1999; Pillay et al., 1964; Povinec et al., 2003, 2011; Sanchez-Cabeza et al., 2011; Shirasawa and Schuert, 1968; Smith et al., 1998, 2017; Wong et al., 1992; Yamada et al., 2006; Yamada and Wang, 2007). In HAMGlobal2021, the dataset produced by the IAEA Marine Radioactivity Information System (MARIS) was combined. Furthermore, we used the 137Cs data reported in the IRSN (Institut de Radioprotection et de Sûreté Nucléaire) database (Baily du Bois et al., 2020). Finally, all of these data were compiled into a single, comprehensive database for this study.
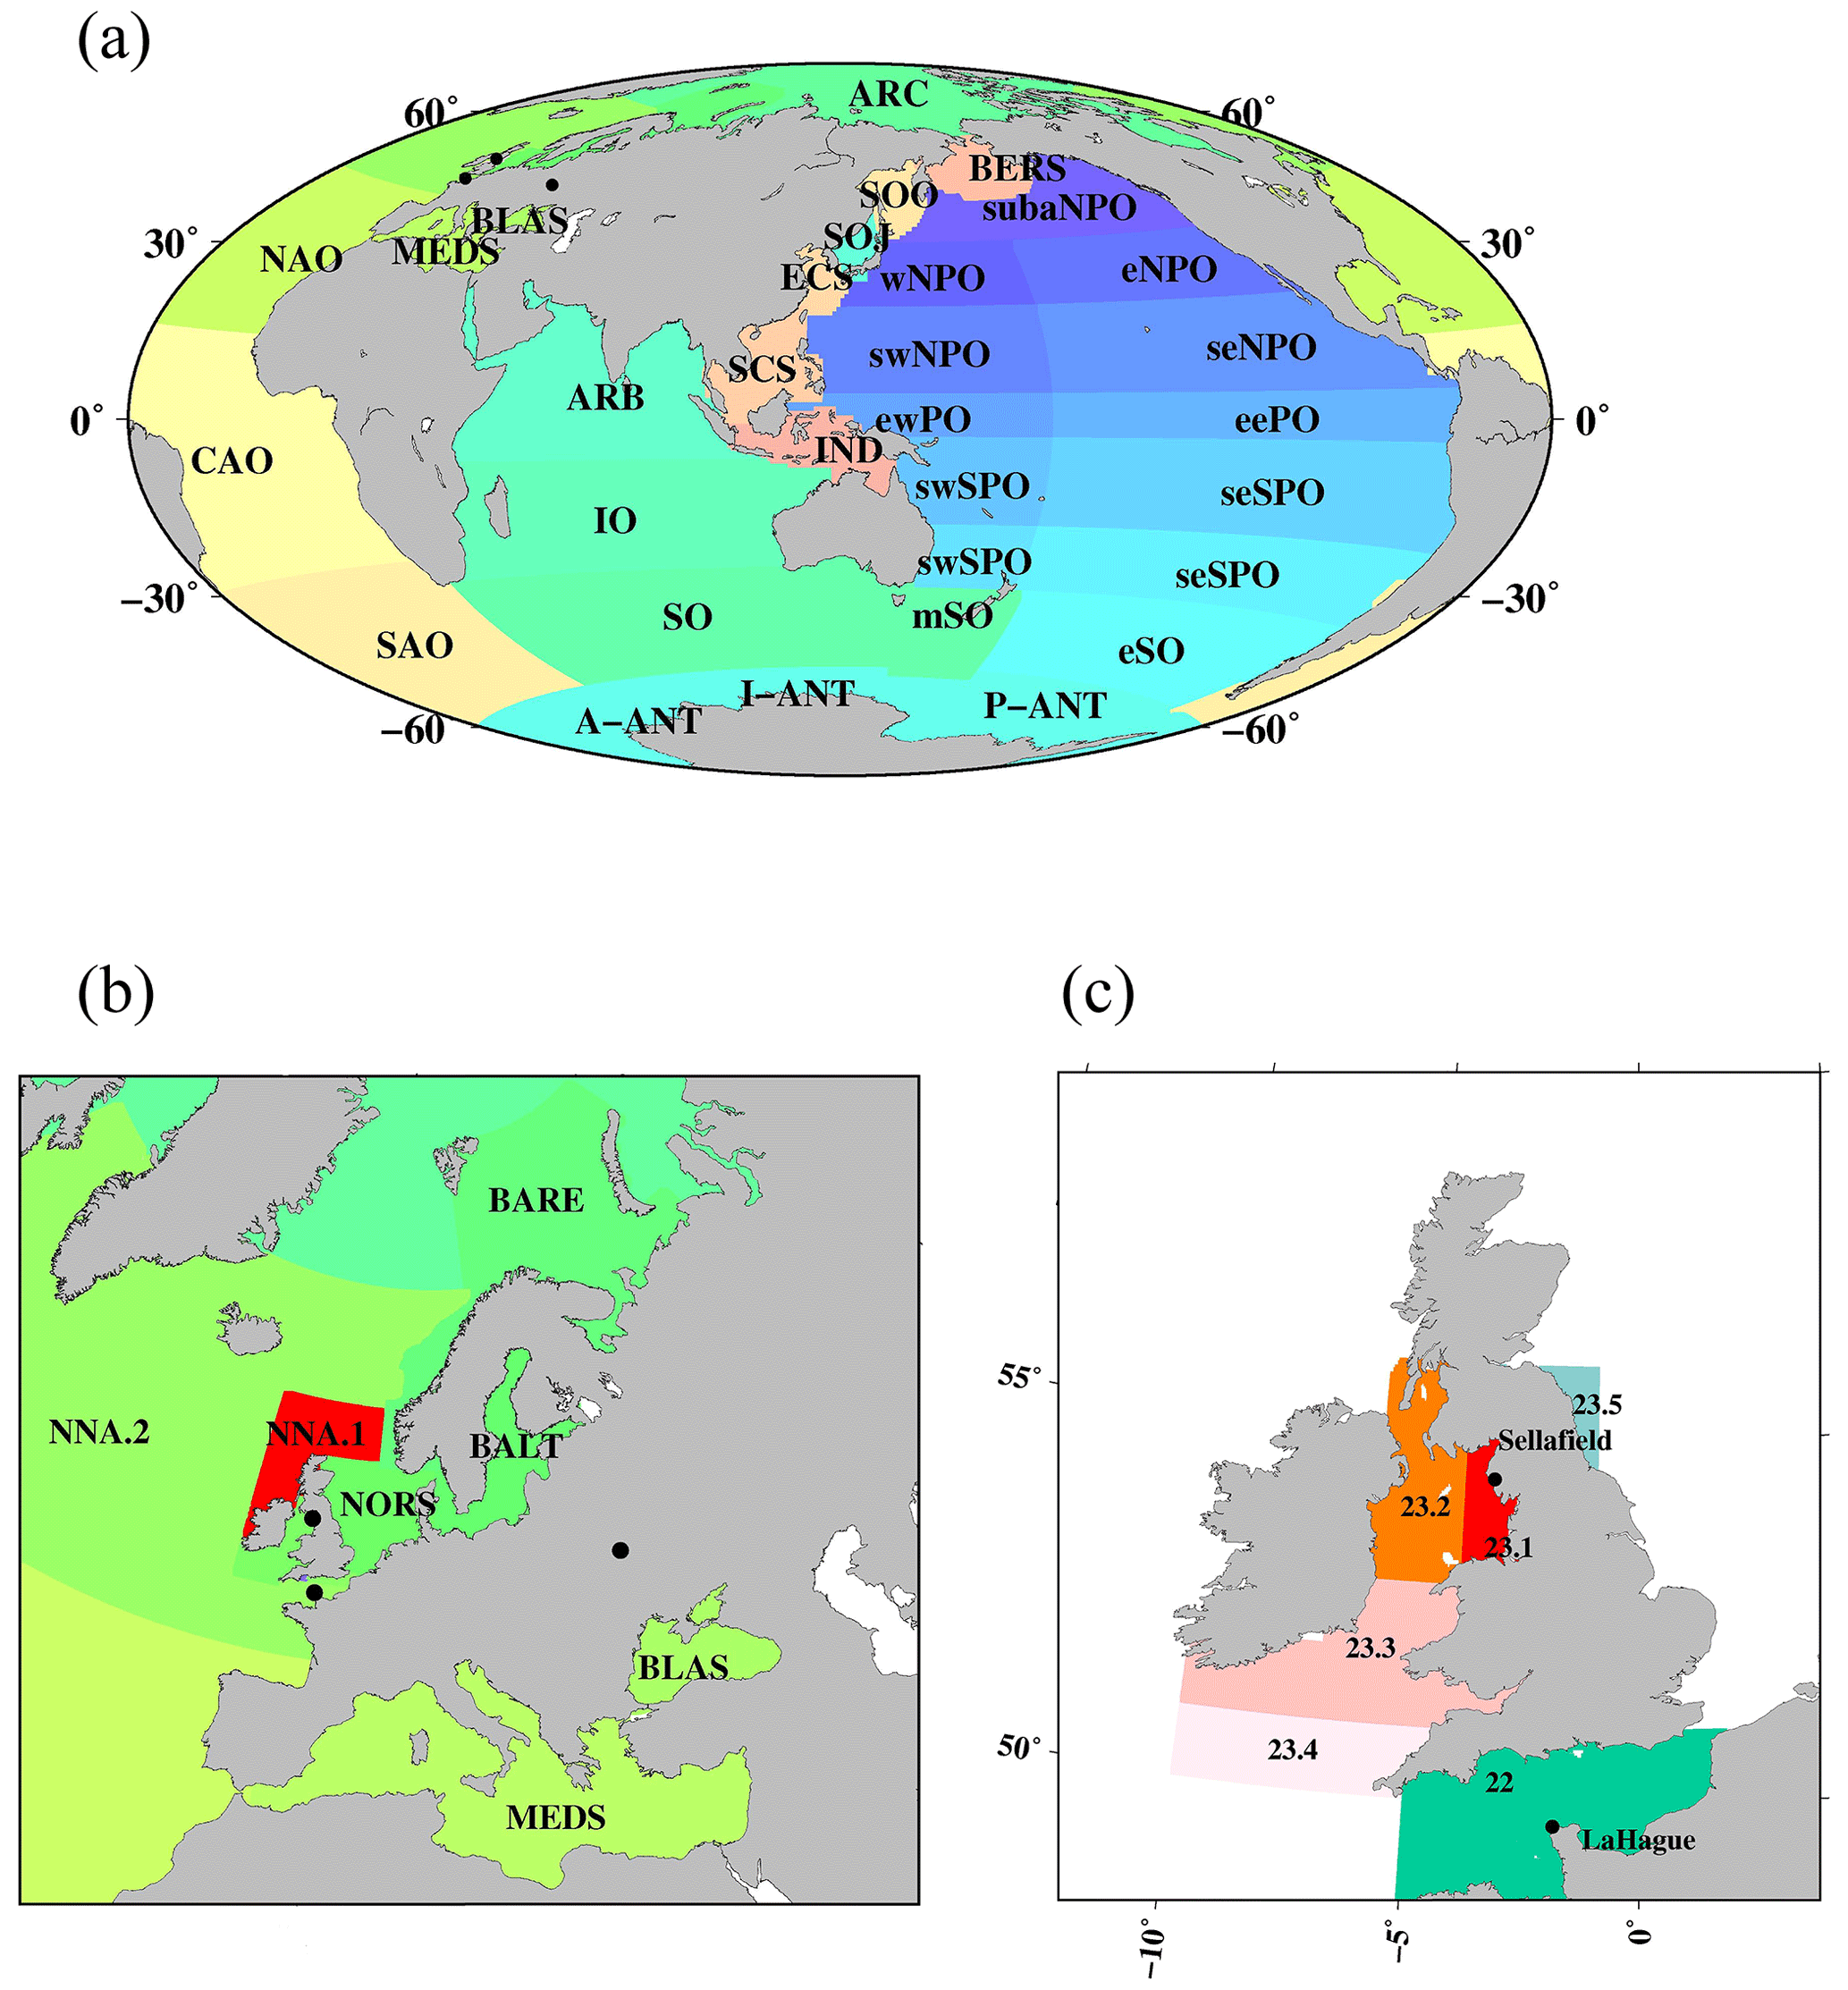
Figure 1Boxes dividing the global ocean. (a) Global ocean, (b) North Atlantic Ocean and its marginal sea, and (c) the Irish Sea (box 23) and English Channel (box 22).
This new database contains a total of 56 447 data points corresponding to 137Cs measured in surface waters (0–20 m) in the global ocean between 1956 and 2021. The 137Cs concentration data points used in this study were significantly larger than those employed in our previous research, which included 22 368 data points obtained until 2005 (Inomata et al., 2009). Measured 137Cs data, however, were very limited, and it is impossible to cover the distribution of 137Cs in the global ocean. In this study, the global ocean was divided into 37 boxes to investigate the temporal variations in 137Cs activity concentrations in surface seawaters by using almost all available data (Inomata and Aoyama, 2022a; Fig. 1). These boxes were divided by showing the latitudinal and longitudinal distributions based on the known ocean currents (IAEA, 2005; Open University, 2004), the latitudinal distributions of global fallout, location of the reprocessing plants, and F1NPS, under the assumption that 137Cs activity concentrations in the box are almost same (Hirose and Aoyama, 2003a; Inomata et al., 2009; IAEA, 2005). Marginal seas are based on the definition by IHO (1953). The subarctic North Pacific Ocean (box 1; 40∘ N) is the highest atmospheric deposition of 137Cs that occurred in the 1960s in the Pacific Ocean, western North Pacific Ocean, and eastern North Pacific Ocean (boxes 2 and 3), which are located at 25–40∘ N and are upstream and downstream of the Kuroshio Extension. These three regions are influenced by the 137Cs contamination derived from the F1NPS accident. The subtropical western and eastern North Pacific Ocean (boxes 4 and 5) are downstream and upstream of the North Equatorial Current associated with the subtropical gyre. The subtropical western and eastern North Pacific Ocean includes the California gyre (5–25∘ N). These boxes include the contamination of local fallout, such as the Bikini Atoll. The western and eastern equatorial Pacific Ocean (boxes 6 and 7) are downstream and upstream of the South Equatorial Current. And an upwelling of seawater occurs in the eastern Southern Pacific Ocean. The western and eastern subtropical North Pacific Ocean (boxes 8 and 9) currents are downstream and upstream of the weak South Equatorial Current. The eastern subtropical South Pacific Ocean includes the French nuclear weapons test sites. The western Southern Pacific Ocean (25–40∘ S) is the Tasman Sea (box 10). The eastern South Pacific Ocean (25–40∘ S) is the midlatitude region of the South Pacific Ocean and includes the South Pacific current (box 11). The eastern Southern Ocean (40–60∘ S) is affected by the Antarctic Circumpolar Current (box 12). The Antarctic Ocean (below 60∘ S) is divided into three, namely the Antarctic sector for the Pacific (box 13), Indian (box 36), and Atlantic (box 37) oceans, and locates the polar front and continental water boundary. In the middle Southern Ocean (box 19), the Leeuwin Current, which flows southward along the continental shelf off the western Australia coast (22 to 35∘ S) in the Southern Ocean (box 17), transports the current to the east. The Southern Ocean is characterized as a subtropical gyre and is connected with the Antarctic Circumpolar Current from the Atlantic Ocean side in the upstream and the Pacific Ocean side in the downstream. The Antarctic Circumpolar Current is a structure banded with several currents and forms a narrow jet with a sharp front. The Indian Ocean (box 16) is connected to the Indonesian Archipelago (box 35) by the Indonesian Throughflow from the Pacific Ocean. The Arabian Sea (box 15; 10∘ S–30∘ N) is affected by the equatorial current system, and the circulation in the northern Indian Ocean is associated with the monsoon system. The marginal seas of the North Pacific Ocean are classified as the South China Sea (box 33), East China Sea (box 32), Sea of Japan (box 14), and Sea of Okhotsk (box 31). The East China Sea has an influence on the bifurcation of the Kuroshio Current and is downstream of the western North Pacific Ocean and connected to the Sea of Japan via the Tsushima Warm Current. The northward-transported seawater in the Sea of Japan is connected to the Sea of Okhotsk. The Bering Sea (box 34) is downstream of the subarctic North Pacific Ocean and upstream of the Arctic Ocean. The Atlantic Ocean was divided into three, namely the South Atlantic Ocean (box 28; 60–30∘ S), central Atlantic Ocean (box 29; 30∘ S–15∘ N), and North Atlantic Ocean (box 30; 15–45∘ N). The South Atlantic Ocean is connected with the Southern Ocean via the Agulhas Current. The Irish Sea (box 23) and English Channel (box 24) are considered to be the 137Cs direct discharge region. The North Sea (box 22), Barents Sea and coast of Norway (box 20), Baltic Sea (box 21), and Arctic Ocean (box 18) are downstream of the northern North Atlantic Ocean and affected the inflow of the 137Cs derived from the Irish Sea and English Channel. The northern North Atlantic Ocean (box 25) received 137Cs global fallout from the large-scale weapons tests in the 1950s and 1960s. The Baltic Sea (box 21), the Mediterranean Sea (box 27), and the Black Sea (box 26) received the fallout of 137Cs from the Chernobyl accident.
The 37 boxes set in this study are almost identical to those in our previous study (Inomata et al., 2009). However, the box areas have been slightly modified by taking into account the ocean currents. The region in the South China Sea, which was in box 33 in Inomata et al. (2009), is divided into two boxes, namely the South China Sea (box 33) and Indonesian Archipelago (box 35), because the seawater in the Pacific Ocean is transported into the Indian Ocean via the Indonesian Archipelago. The region in Antarctica, which was in box 13 in Inomata et al. (2009), is divided into three boxes, including the Pacific sector of the Antarctic Ocean (box 13), the Atlantic sector of the Antarctic Ocean (box 36), and the Indian sector of the Antarctic Ocean (box 37). The region in the Southern Ocean (box 17) is divided into two boxes, with the Southern Ocean (box 17) and the middle Southern Ocean (box 19). The boxes corresponding to the source region, such as the Irish Sea (box 23; boxes 23.1–23.5) for the Sellafield plant and the northern North Atlantic Ocean (box 25; boxes 25.1 and 25.2) and western North Pacific Ocean (box 2; boxes 2.0–2.6) for the F1NPS accident, were divided into several subregions because significantly large values around the discharged region cause larger values in the estimate of the 137Cs inventory.
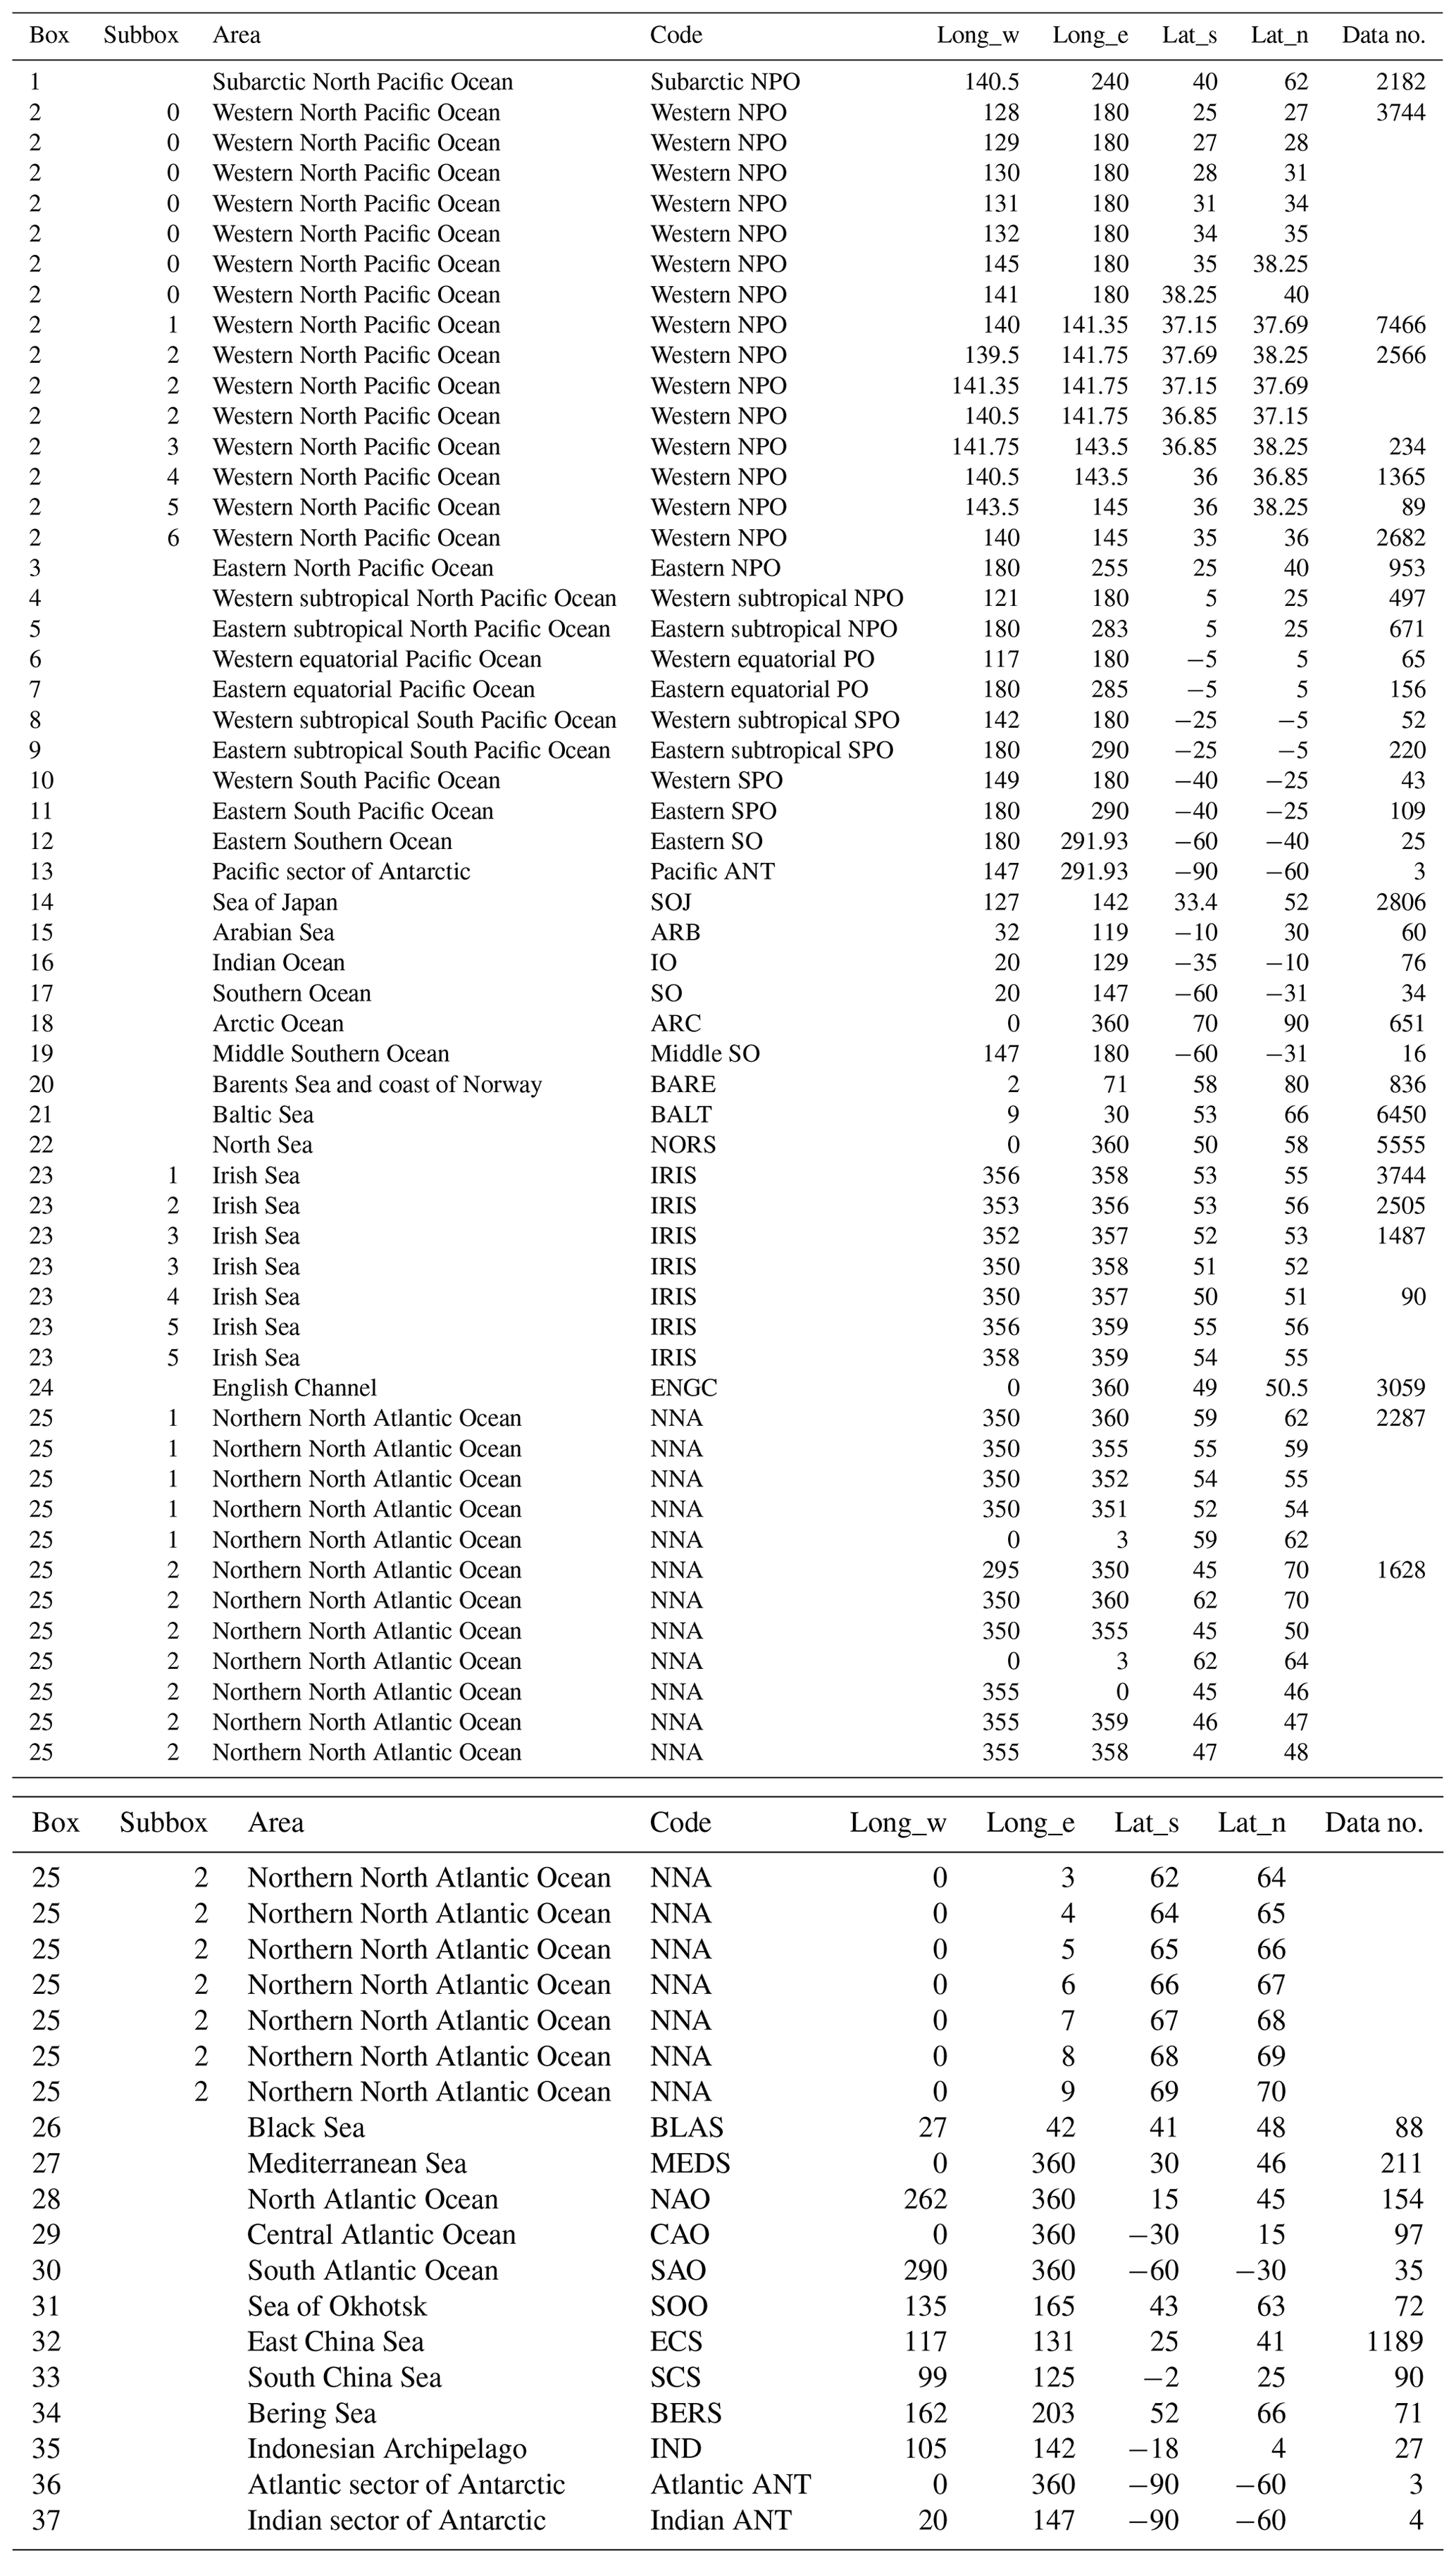
The box numbers, their corresponding longitudes and latitudes, the box name abbreviations, and the data number are listed in Table 1. The sampling points in each box are displayed in the dataset (https://doi.org/10.34355/Ki-net.KANAZAWA-U.00149; Inomata and Aoyama, 2022a). Temporal variations in 137Cs activity concentrations and 0.5-year median values in each box are displayed in the figures in the dataset (https://doi.org/10.34355/Ki-net.KANAZAWA-U.00150) in Inomata and Aoyama (2022b).
2.2 The 0.5-year median values of 137Cs the surface 137Cs activity concentrations in each box
The 0.5-year median values of the surface 137Cs activity concentrations in each box were calculated and are shown in the dataset (Inomata and Aoyama, 2022c, https://doi.org/10.34355/Ki-net.KANAZAWA-U.00151). These 0.5-year median values of the surface 137Cs activity concentrations are useful for verifying the general ocean circulation models (Tsumune et al., 2011; Tsubono et al., 2016) and assessing the radiation doses delivered to humans through the ingestion of marine food (Aarkrog et al., 1997; IAEA, 2005; UNSCEAR, 2013). The 0.5-year median values of the surface 137Cs concentrations in each box were produced by the grid value producing the command of the block median programs (Wessel et al., 2013). The block median reads the arbitrary data (x, y, and z) and calculates the median value in a grid defined in the setting of the range. In the case of t year, the data within t year ±0.5 years were used to calculate the median values. We produced the dataset (box number, year, and 137Cs activity concentrations) for each box. These gridded data were recalculated to continuous curvature splines with adjustable tension, and these values are regarded as the 0.5-year median value. In the case of box 2, significantly higher concentrations were observed only near the F1NPS (box 2.1–2.6) because of the direct release of 137Cs. We used only the 137Cs activity data in box 2.0 for the analysis of the 0.5-year median values because the significantly higher values are localized and do not reflect concentrations throughout box 2.
2.3 Estimates of apparent half-residence times in global surface seawater
The 137Cs activity concentrations are mainly dominated by fallout into the surface seawater, radioactive decay with a 30.17-year half-life, horizontal transport, and downward transport below the mixed layer. Based on the long-term measurement of the 90Sr deposition by the global monitoring network, the cumulative 90Sr deposition reached a maximum in the late 1960s to the early 1970s (UNSCEAR, 2000). This suggests that the atmospheric deposition of 137Cs had a minor contribution to the surface seawater 137Cs activity concentrations after 1970 (UNSCEAR, 2000; Hirose and Aoyama, 2003a; Aoyama et al., 2006). The decrease in 137Cs activity concentrations in the surface seawater in each box is approximated by the corresponding fitting of the exponentially decreasing curves. This decreasing rate of 137Cs activity concentrations is controlled by radionuclide decay and physical ocean circulation because the contribution from large-scale deposition by atmospheric nuclear tests was negligible after 1970 (UNSCEAR, 2000). The regression line of the 0.5-year median value of 137Cs for each box was determined, and the apparent half-residence time (Tap) due to the radioactive decay and ocean physical processes was estimated.
The Tap of 137Cs was calculated using the following equations:
where λCs,apparent, λCs,ocean, and λCs,decay are the decay constants for apparent decay, physical oceanographic decay, and radioactive decay, respectively. λCs,apparent is estimated by using the regression line of the 0.5-year median value of 137Cs, as shown in Eq. (1). Tpo is the apparent half-residence time causing the oceanic physical processes, and λCs,ocean was estimated as λCs,apparent and λCs,decay in Eq. (2). Considering that the half-life of 137Cs () is 30.17 years, the Tap should be shorter than the half-life if no source of 137Cs exists in the region of interest. A shorter Tap means that 137Cs is removed quickly in the area and/or the 137Cs inflow amount is small in the area compared with the 137Cs outflow amount. In other words, a Tap shorter than the radioactive decay time indicates that the variations in the 137Cs activity concentrations are strongly controlled by physical ocean processes. In contrast, a longer Tap and a negative Tpo value mean that 137Cs is preserved in the region for a longer time and/or there is an influx of a water mass with higher 137Cs in the region compared to the 137Cs outflow from the region.
However, the exponentially decreasing trend from 1970 to 2010, before the F1NPS accident, did not estimate values for all boxes. Tap values from 1970 to 2010 were estimated for the western North Pacific Ocean, Sea of Japan, and East China Sea. For other boxes, Tap, therefore, was estimated for several periods, taking into account the source contribution as follows, where Tap1 is before 1970 (periods with nuclear weapons tests at a global scale), Tap2 is the period from 1970 to 1986–1990 (until the Chernobyl accident), Tap3 is from 1990 to 2010 (after the Chernobyl accident), and Tap4 is after 2011 (after the F1NPS accident). There were some regions in which there were no Tap estimates, such as the northern North Atlantic and surrounding waters, because the decreasing trend of 137Cs could not be approximated by Eq. (1).
2.4 F1NPS contribution to the 0.5-year 137Cs median values in the North Pacific Ocean
After several years following the F1NPS accident, 137Cs activity concentrations in the surface seawater gradually increased in the Sea of Japan, East China Sea, subarctic North Pacific Ocean, and Bering Sea (Aoyama et al., 2016a, 2017; Inomata et al., 2018; Smith et al., 2017; Kumamoto et al., 2019). To estimate the contribution of the F1NPS accident, 137Cs derived from the F1NPS accident ([F1NPS-137Cs]) in 2011 was estimated using the following equation.
The “[Global-137Cs]each box” in 2011 was estimated by extrapolating the exponential regression line from 1990 to 2010 under the assumption that the apparent half-residence time of the 137Cs activity concentrations were of the same value.
2.5 Reconstruction with the 2 min latitude/longitude 137Cs deposition amount in the global ocean
To estimate the 137Cs inventory in each box in the global ocean, we reconstructed the 137Cs global fallout distribution with a 2 min latitude/longitude grid based on the 10∘ latitude/longitude grid data of the 137Cs deposition, which was constructed using 137Cs data measured in rainwater, seawater, and soil by Aoyama et al. (2006). The topography–bathymetry information was based on the 2 min Gridded Global Relief Data (ETOPO2; Earth Topography; NOAA National Geophysical Data Center, 2006), taking into account the ellipticity of the Earth (Oki and Kanae, 1997; Suga et al., 2013).
2.6 Estimate of the 137Cs inventory in the surface mixed layer in the global ocean
We estimated the 137Cs inventory in the surface mixed layer in each box and compared it with the 137Cs fallout amount until 1970 because a major input of 137Cs into the surface seawater occurred in the early 1960s and reached a maximum in 1970 (IAEA, 2005; Aoyama et al., 2006). The 137Cs deposition in the surface seawater after 1970 was negligible compared to the activity concentrations in the surface seawater. Therefore, the behavior of 137Cs in the surface seawater after 1970 is mainly controlled by radioactive decay and ocean physical transport processes. In this study, the 137Cs inventory was estimated under the assumption that 137Cs was mixed and homogeneously distributed within each box, with a 0.5-year timescale in the surface mixed layer. However, the Irish Sea (box 23) was subdivided into five regions (boxes 23.1–23.5) because significantly higher values were observed around the directly discharged area from the Sellafield plant. It is noted that there were no available data in box 23.5. In the northern North Atlantic Ocean, higher 137Cs activity concentrations were observed in the region close to the Irish Sea or the North Sea. In this case, the northern North Atlantic Ocean was also divided into two boxes (box 25.1 and box 25.2). Box 2 is also divided into seven subboxes because significantly higher concentrations were observed near the F1NPS.
The 137Cs surface mixed layer inventory (unit is PBq) was estimated using the following equation, assuming that 137Cs activity concentrations are almost constant in the surface mixed layer.
The sea area in each box was calculated using the basin mask assigned to each 2 min latitude/longitude square, which was created based on ETOPO2 (NOAA National Geophysical Data Center, 2006). The average mixed-layer depth in each box was calculated using the 2∘ latitude/longitude gridded Mixed Layer Depth Climatology data compiled by the French Research Institute for the Exploitation of the Sea (IFREMER; Montégut, 2004; Mignot et al., 2007). These data were regridded as the 2 min latitude/longitude data to set the same scale as that in the sea area dataset. In this dataset, the mixed-layer depth was defined as the depth at which the surface temperature decreases by 0.2 ∘C and the density decreases by 0.03 kg m−3. The mixed-layer depths were estimated by 780 000 profiles recorded in the World Ocean Database 09 (WOD09) National Oceanographic Data Center (NODC), using the conductivity, temperature, and depth (CTD) profile (1961–2008), the World Ocean Circulation Experiment (WOCE) version 3.0 Profiling Floats Data (PFL) CTD (1990–2002), and ARGO program (1995–2008). The mixed-layer depth was the monthly time interval with a seasonal variation that is deeper in winter and shallower in summer. It is recognized that seawater subducted from the ocean surface in the mode water formation region associated with winter convective mixing because of the lower buoyancy from the ocean surface (Hanawa and Talley, 2001). The flow through the winter mixed layer ventilates the seawater into the ocean interior. The maximum monthly mixed-layer depth in each box, mainly in the winter months, was used to calculate the 137Cs inventory in the mixed layer. The mixed-layer depths used to estimate the inventory ranged from 33 to 182 m. In the western North Pacific Ocean (box 2), significantly higher 137Cs values around the F1NPS cause the higher 0.5-year median value after 2011. Then, we used our previous estimated inventory by performing a statistical optical interpretation analysis in the subarctic North Pacific Ocean and western and eastern North Pacific Ocean (Inomata et al., 2016).
The 137Cs density in the surface seawater (unit kBqm−2) was also estimated by using the following equation.
2.7 Mass balance – net in-/outflow of 137Cs in each box
In the marine environment, 137Cs activity concentrations after 1970 were dominantly controlled by radioactive decay and physical ocean processes, except for the release by accidents and reprocessing plants. As for the physical oceanographic processes, 137Cs in the surface seawater in each box receives inflow from the upstream box, outflow to the downstream box, and downward transport below the surface mixed layer. In fact, estimates of the 137Cs transport amount in these processes were very difficult to make in this study. Therefore, outflowed 137Cs by these processes were represented as net in-/outflowed 137Cs in each box. The mass balance of 137Cs in the surface mixed layer was considered to be as shown in the following equations.
where Δt is 5 years, and ti is (.
[137Cs inventory] is the value of the initial year, and [137Cs inventory] is the 137Cs inventory after the Δt year in each box. In this study, this mass balance was estimated to be every 5 years from 1970 to 2015. In the case of 1970, the 137Cs deposition amount until 1970 was used as the value of the initial year in each box. In the northern North Atlantic Ocean and Arctic Ocean, an extremely large inflow was estimated in 2000 due to the extremely large values included in the dataset. These data in 2000 and 2005 were removed from the figures. These results are described in Sect. 4.4.
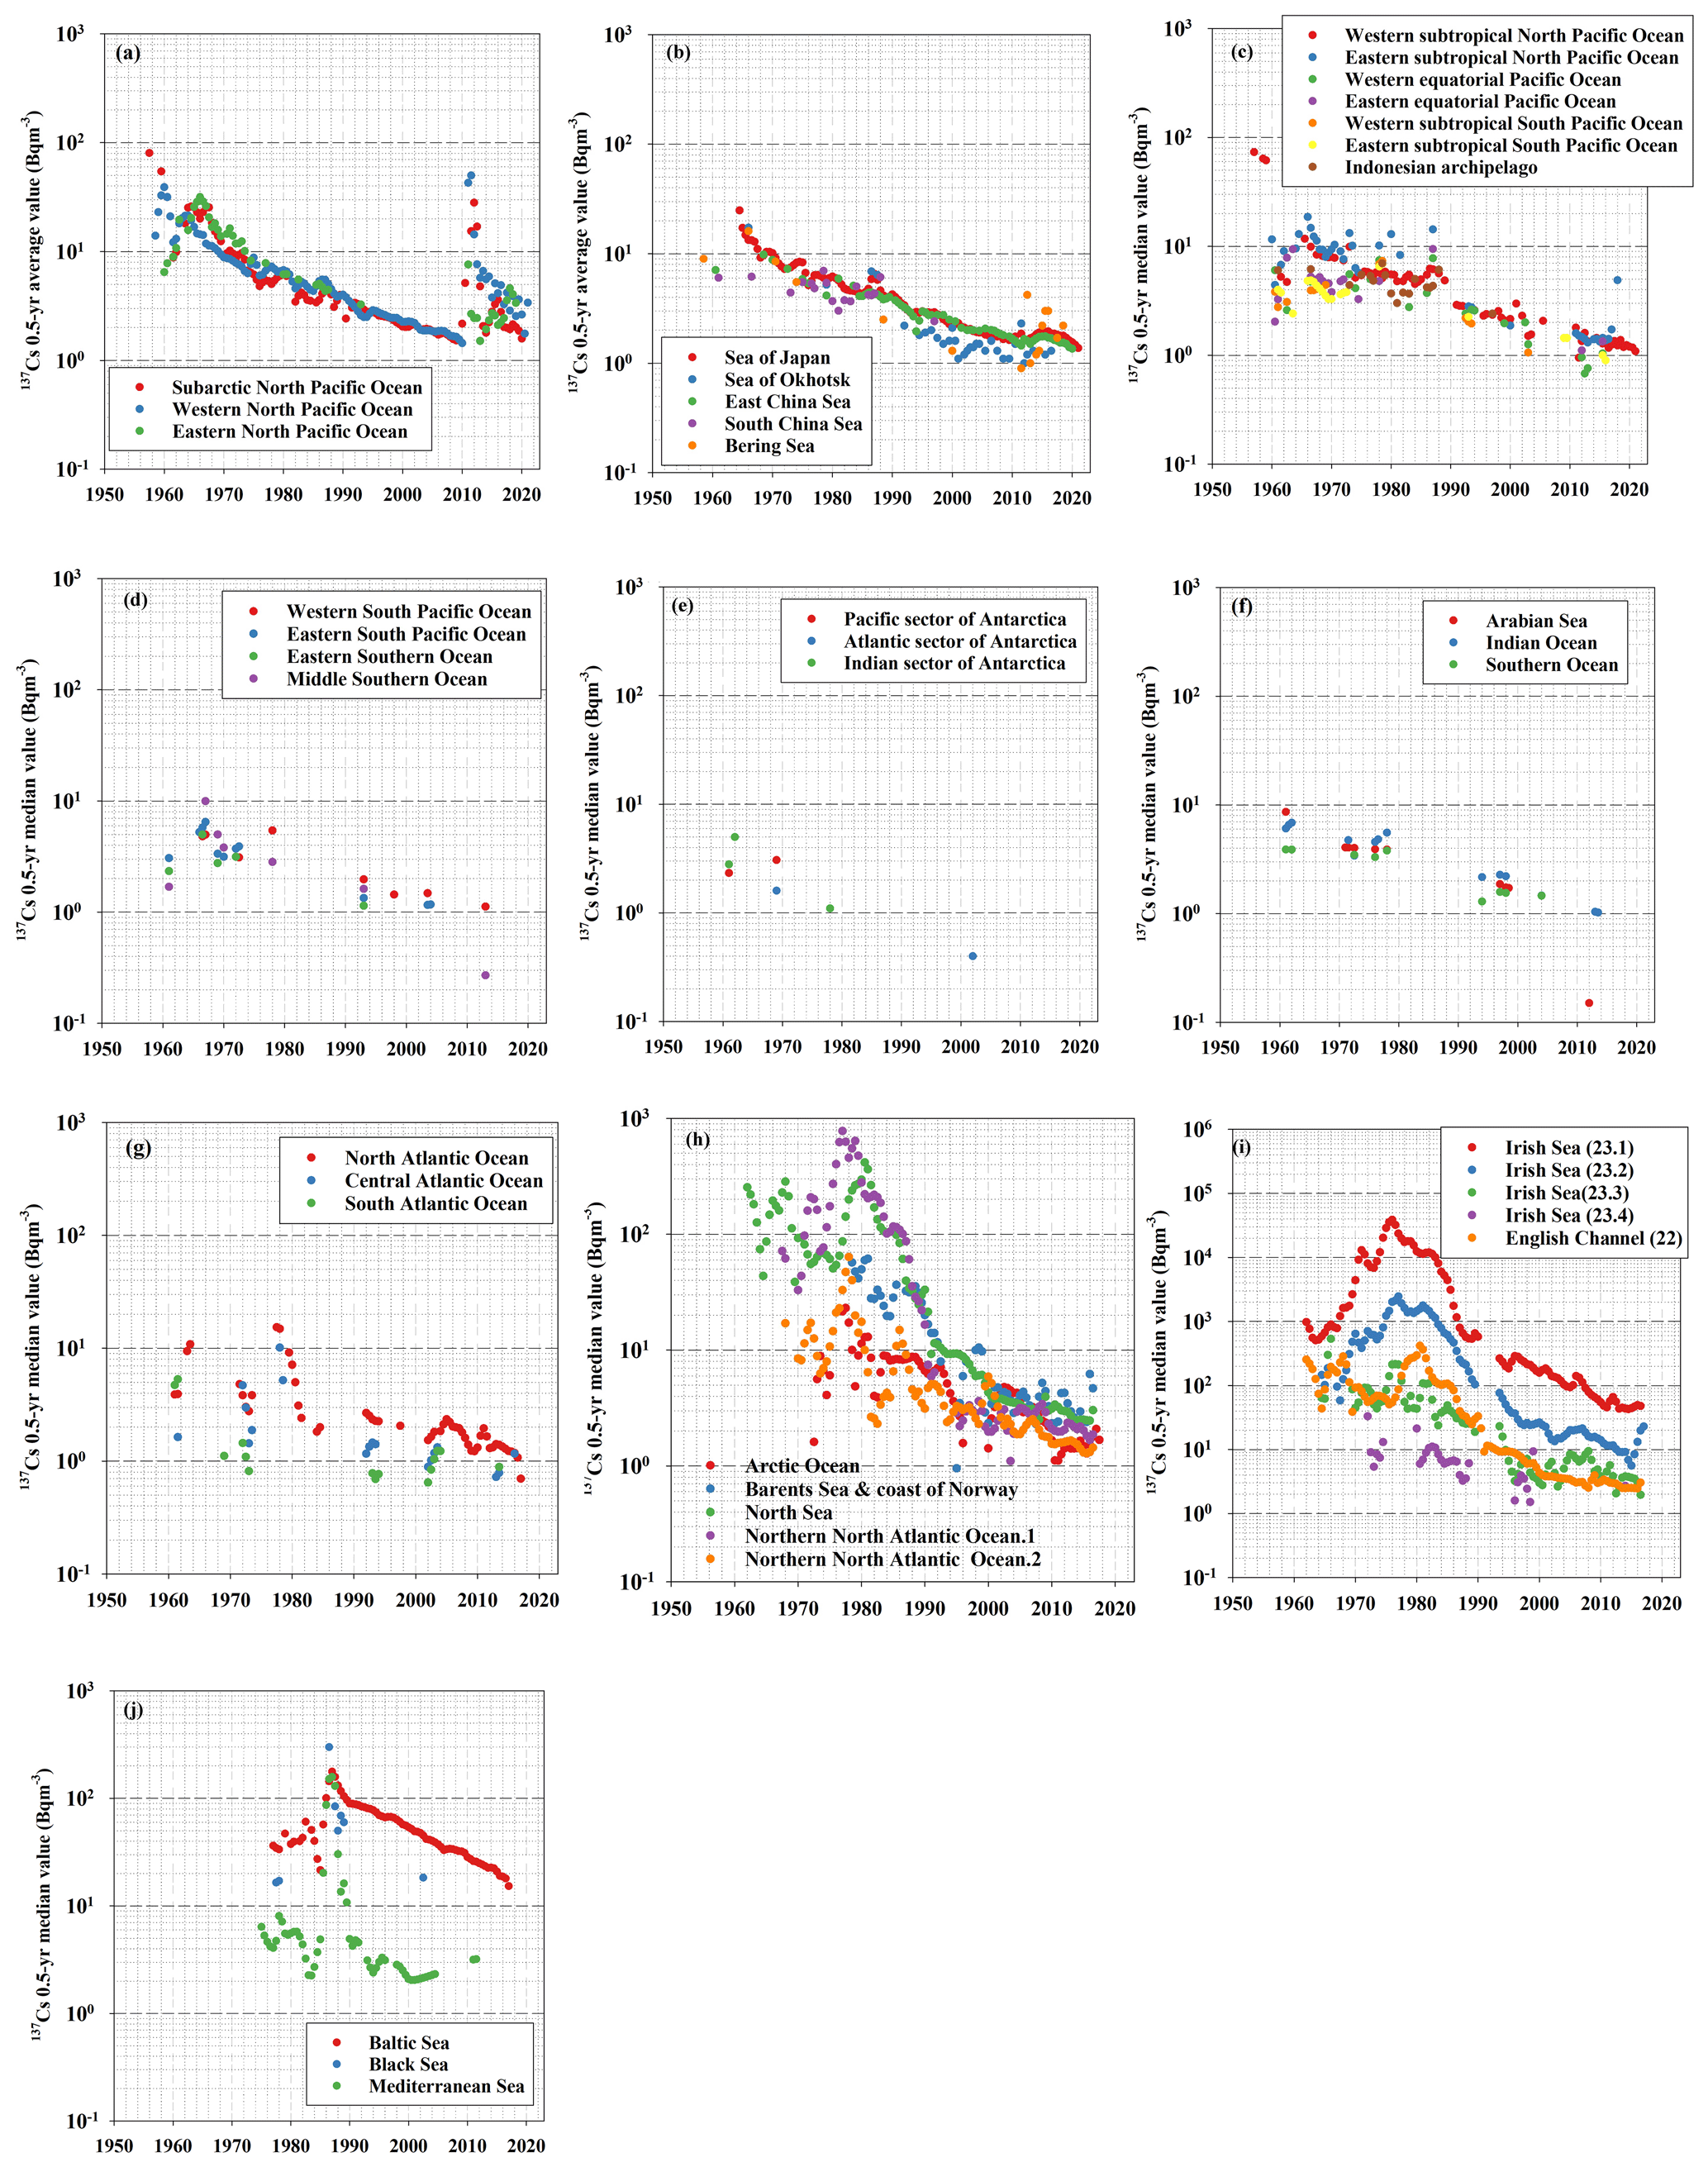
Figure 2The 0.5-year median 137Cs values of each box for (a) boxes 1–3 (subarctic North Pacific Ocean, western North Pacific Ocean, and eastern North Pacific Ocean), (b) boxes 14 and 31–34 (Sea of Japan, Sea of Okhotsk, East China Sea, South China Sea, and Bering Sea), (c) boxes 4–9 (western subtropical North Pacific Ocean, eastern subtropical North Pacific Ocean, western equatorial Pacific Ocean, eastern equatorial Pacific Ocean, eastern subtropical South Pacific Ocean, and western subtropical South Pacific Ocean), (d) boxes 10–12 and 19 (western subtropical South Pacific Ocean, eastern subtropical South Pacific Ocean, eastern Southern Ocean, and middle Southern Ocean), (e) boxes 13, 36, and 37 (Pacific sector of the Antarctic Ocean, Atlantic sector of the Antarctic Ocean, and Indian sector of the Antarctic Ocean), (f) boxes 15–17 (Arabian Sea, Indian Ocean, and Southern Ocean), (g) boxes 28–30 (North Atlantic Ocean, central Atlantic Ocean, and South Atlantic Ocean), (h) boxes 18, 20, 22, and 25 (Arctic Ocean, Barents Sea and coast of Norway, North Sea, and northern North Atlantic Ocean), (i) boxes 23 and 24 (Irish Sea and English Channel), and (j) boxes 21, 26, and 27 (Baltic Sea, Black Sea, and Mediterranean Sea).
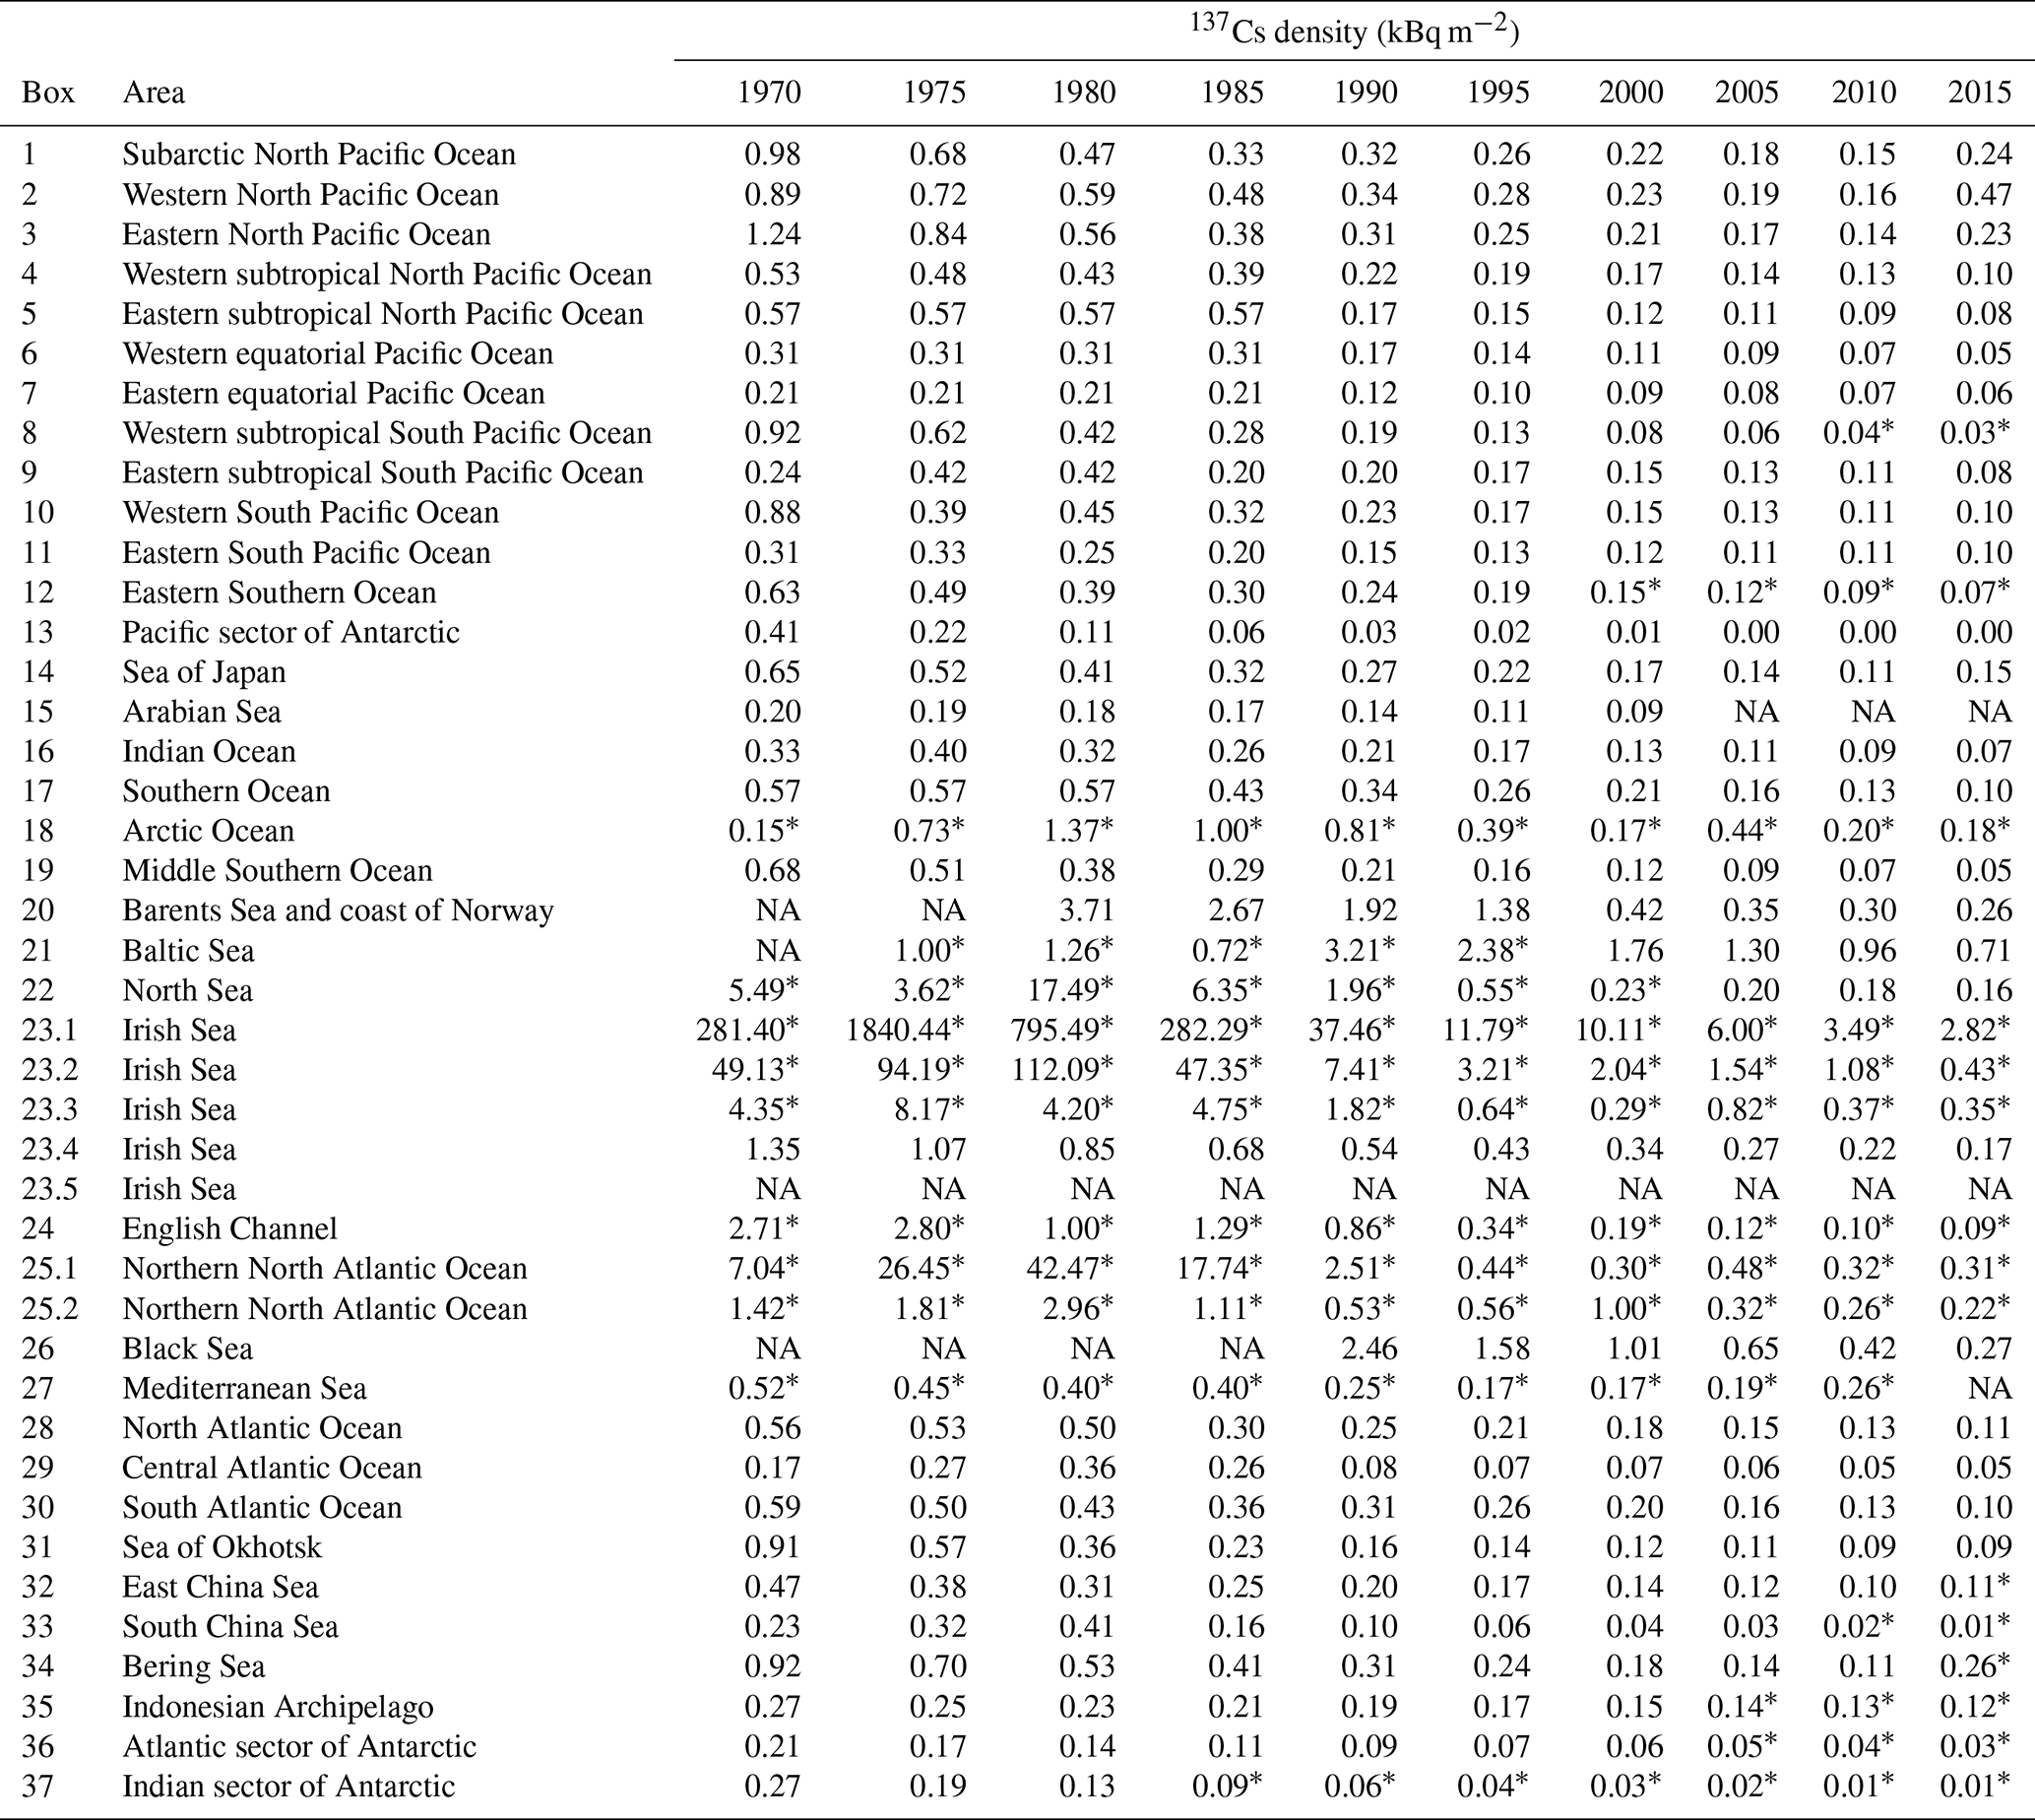
Table 2The 0.5-year 137Cs median value in each box.
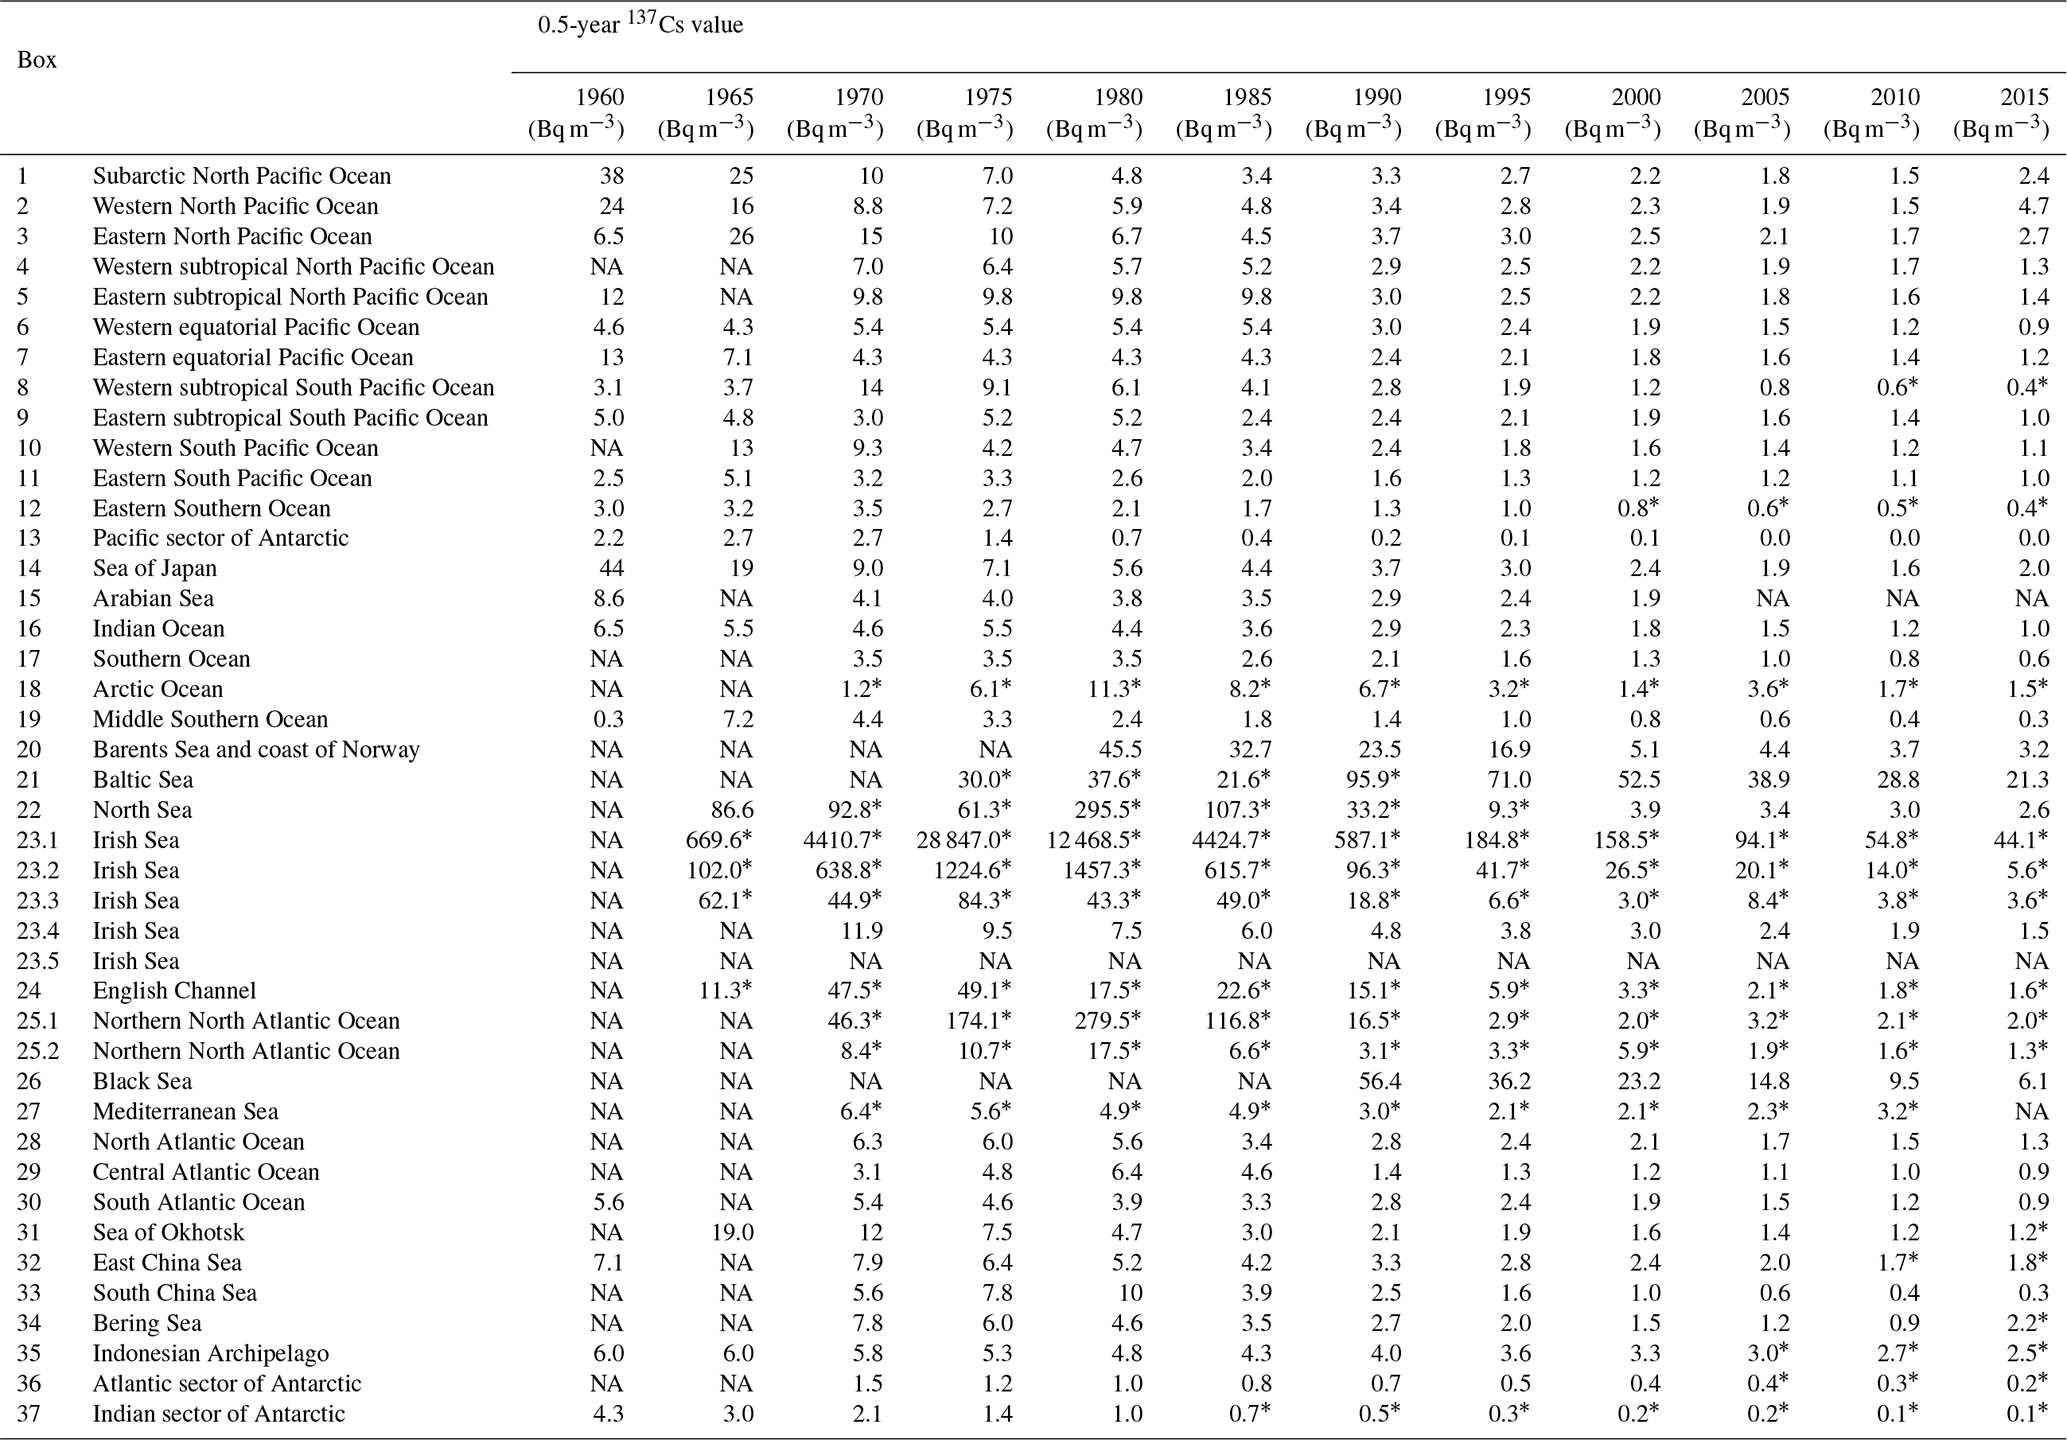
∗ Estimated value based on the extrapolation of the trend line or 0.5-year median value. NA: not available.
Figure 2 shows the temporal variations in the 0.5-year median value of 137Cs in each box. Table 2 lists the 0.5-year median values of the surface 137Cs in the global ocean from 1960 to 2020 every 5 years. The 0.5-year median values of 137Cs in each box are also listed in Inomata and Aoyama (2022c). In this section, temporal variations in the 0.5-year average 137Cs values in each box are described.
3.1 North Pacific Ocean (boxes 1–3)
Figure 2a shows the temporal variations in the 0.5-year median 137Cs values in the subarctic North Pacific Ocean (box 1), western North Pacific Ocean (box 2), and eastern North Pacific Ocean (box 3). The 137Cs in this region largely originated from atmospheric deposition due to large-scale weapons tests (e.g., Aoyama et al., 2006; Inomata et al., 2012), the Chernobyl accident in 1986 (Miyao et al., 1998), and the F1NPS accident after 2011 (e.g., Aoyama et al., 2016a, c; Inomata et al., 2016). The temporal variations in the 0.5-year median values of 137Cs were the highest in the mid- and late 1950s. In the 1960s, the 0.5-year median values of 137Cs increased gradually and reached a maximum in 1968. Then, the values decreased exponentially.
The 0.5-year median values of 137Cs after approximately 1970 became even smaller than those in the 1960s because the supply due to 137Cs deposition was negligible. This implies that the variations in the 137Cs activity concentrations after 1970 strongly depended on the physical processes in the ocean. Until the early 1960s, the 0.5-year median values of 137Cs in the subarctic North Pacific Ocean and western North Pacific Ocean were higher than those in the eastern North Pacific Ocean. However, the 0.5-year median values of 137Cs in the eastern North Pacific Ocean increased in the 1960s and were slightly higher than those in the western North Pacific Ocean in the 1970s. A small peak that occurred in 1986 was caused by the deposition of 137Cs from the Chernobyl accident. The supply of 137Cs due to Chernobyl fallout in the western and eastern North Pacific Ocean was larger than that in the subarctic North Pacific Ocean. After 2011, the 0.5-year average 137Cs values increased in this region. However, the maximum values in the eastern North Pacific Ocean were several years later than those observed in the subarctic and western North Pacific Ocean due to the basin-scale transport of 137Cs in the North Pacific Ocean.
3.2 Marginal seas of the western North Pacific Ocean (boxes 14 and 31–34)
The temporal variations in the 0.5-year 137Cs values in the marginal seas of the North Pacific Ocean (the Sea of Japan (box 14), Sea of Okhotsk (box 31), East China Sea (box 32), South China Sea (box 33), and Bering Sea (box 34)) are displayed in Fig. 2b. The 0.5-year 137Cs values in the marginal seas of the North Pacific Ocean also decreased exponentially. In 1986, a small peak due to 137Cs fallout from the Chernobyl accident was observed in the Sea of Japan and Sea of Okhotsk. In the 1980s, the 0.5-year median value of 137Cs was also high in the South China Sea. After the 1990s, the 0.5-year median value of 137Cs in the Sea of Okhotsk was smaller than those in the other boxes (the Sea of Japan, East China Sea, and South China Sea) in this region. An increase in the 0.5-year average 137Cs values in 2011 occurred in the Sea of Japan, Sea of Okhotsk, and Bering Sea because of 137Cs deposition originating from the F1NPS. In the Sea of Japan and East China Sea, the 0.5-year median values of 137Cs gradually increased after the F1NPS accident. In addition, an increase in the 0.5-year median values of 137Cs derived from the F1NPS occurred gradually in the Sea of Okhotsk and the Bering Sea.
3.3 Subtropical and equatorial Pacific Ocean and Indonesian Archipelago (boxes 4–9 and 35)
The 0.5-year median values of 137Cs in the western subtropical North Pacific Ocean (box 4) in the late 1950s were significantly high (62–73 Bq m−3) due to local fallout (Fig. 2c). In the 1970s and 1980s, the 0.5-year median values of 137Cs almost constantly varied in the eastern subtropical North Pacific Ocean (box 9) and were higher than those in other regions. The values in the western subtropical North Pacific Ocean and western equatorial Pacific Ocean were almost constant in the 1970s and 1980s. In the eastern equatorial Pacific Ocean (box 7) and eastern subtropical South Pacific Ocean (box 9), the values increased gradually. After the mid-1980s or in the 1990s, the 0.5-year median 137Cs values showed an exponential decrease until 2011. The 0.5-year median values of 137Cs in the Indonesian Archipelago (box 35) showed almost the same range as those in the western subtropical and equatorial Pacific Ocean.
3.4 South Pacific Ocean (boxes 10–12 and 19)
In the South Pacific Ocean (the western South Pacific Ocean (box 10), eastern South Pacific Ocean (box 11), eastern Southern Ocean (box 12), and middle Southern Ocean (box 19); as shown in Fig. 2d), the 0.5-year median 137Cs activity concentrations in 1961 ranged from 1.4 to 2.5 Bq m−3, whereas in 1967, the 0.5-year median of 137Cs increased to 4.5–9.9 Bq m−3. Afterwards, the 0.5-year median value of 137Cs decreased exponentially, although the available data were limited. Moreover, substantially lower 0.5-year median 137Cs values of less than 1 Bq m−3 were observed in the middle Southern Ocean in 2013.
3.5 Antarctic Ocean (boxes 13, 36, and 37)
The 0.5-year median 137Cs activity concentrations in the Antarctic Ocean were the lowest in the global ocean, although the measurement data were very limited (Fig. 2e). The 0.5-year median 137Cs activity concentrations from the 1960s to the 2010s decreased from 3.3 to 0.01 Bq m−3 in the Pacific sector of the Antarctic Ocean (box 13) and from 1.6 to 0.4 Bq m−3 in the Atlantic sector of the Antarctic Ocean (box 36). In the Indian sector of the Antarctic Ocean, the 0.5-year median 137Cs activity concentrations decreased from 5.0 to 1.1 Bq m−3 during the period from 1961.5 to 1978 (box 37). The decreasing rate in the Antarctic region was larger than those in the other regions. These lowest 0.5-year median 137Cs values and larger decreasing rates were due to the long distance from the dominant 137Cs fallout area. The transport of 137Cs from the Southern Ocean would be prevented by the Antarctic Circumpolar Current. The upwelling of seawater from the deeper layers in the Antarctic Ocean may also have caused the dilution of the 137Cs activity concentrations, resulting in the lowest 137Cs values (Kumamoto et al., 2016).
3.6 Indian Ocean (boxes 15, 16, and 17)
In the 1960s, the 0.5-year median 137Cs activity concentration was higher in the Arabian Sea (box 15; 8.9 Bq m−3) than in the Indian Ocean (box 16; 5.6–6.6 Bq m−3) and the Southern Ocean (box 17; 2.7–4.0 Bq m−3; Fig. 2f). The median 137Cs activity concentrations in the 1960s showed a latitudinal gradient, with higher values in the northern areas and lower values in the southern areas. The 0.5-year median 137Cs activity concentrations in the Arabian Sea and Southern Ocean were almost constant in the 1970s, whereas those in the Indian Ocean increased slightly (3.4–5.6 Bq m−3) in the 1970s. These values in the three boxes decreased to approximately 1.3–2.3 Bq m−3 in the late 1990s and the early 2000s, although there were no available data in the 1980s. The 0.5-year median 137Cs activity concentrations in the Indian Ocean were higher than those in the Arabian Sea and the Southern Ocean. Note that the lowest values (0.15 Bq m−3) were observed in 2012 in the Arabian Sea.
3.7 Atlantic Ocean (boxes 28–30)
The Atlantic Ocean (the North Atlantic Ocean in box 28, the central Atlantic Ocean in box 29, and the South Atlantic Ocean in box 30) had a north–south gradient of the 0.5-year median 137Cs values, with higher values in the North Atlantic Ocean and lower values in the South Atlantic Ocean (Fig. 2g). In the North Atlantic Ocean, relatively high values were observed in the 1970s but then rapidly decreased after 1980. After 2000, an exponentially decreasing trend was not observed in the North Atlantic Ocean. The values increased slightly and reached the maximum value (2.4 Bq m−3) in 2005, after which they gradually decreased. In the central Atlantic Ocean, the temporal variations in the 0.5-year median values of 137Cs exponentially decreased, although the data were very limited. In the South Atlantic Ocean, the 0.5-year median values also decreased exponentially after 1970. Notably, the 0.5-year median values in 2003 in the central and South Atlantic oceans increased slightly compared to those in 2002.
3.8 Arctic, northern North Atlantic Ocean, and its marginal seas (boxes 18, 20, 22, and 25)
Figure 2h shows the temporal variations in the 0.5-year median values of 137Cs in the Arctic Ocean (box 18), Barents Sea and coast of Norway (box 20), North Sea (box 22), and northern North Atlantic Ocean (boxes 25.1 and 25.2). The dominant sources of 137Cs in this area are the global-scale atmospheric deposition in the 1960s by large-scale nuclear weapons tests and two nuclear fuel reprocessing plants after the 1970s. In these regions, the 0.5-year median values of 137Cs did not decrease exponentially due to the 137Cs being discharged from the nuclear fuel reprocessing plants. In the mid-1970s, the 0.5-year median 137Cs activity concentrations in the North Sea and northern North Atlantic Ocean increased rapidly and reached a the maximum in the years 1977 and 1980.5, respectively. Thereafter, the 0.5-year median 137Cs activity concentrations in these regions rapidly decreased, and the decreasing rate became small after 1990, which was associated with the reduced amount of released 137Cs. In the Arctic Ocean, the 0.5-year median 137Cs activity concentrations increased until the mid-1970s and then decreased. The overall 0.5-year median 137Cs activity concentrations until the 1970s in the Arctic Ocean were lower than those in the surrounding oceans.
3.9 Irish Sea and English Channel (boxes 23 and 24)
The 137Cs activity concentrations in the Irish Sea (box 23) and English Channel (box 24) were primarily affected by the discharge from the nuclear fuel reprocessing plants (Fig. 2i). Because the 0.5-year median value of 137Cs is significantly higher than those in other regions, the scale of the y axis changes from 10−1 to 106 Bq m−3. In the Irish Sea (box 23.1), which is the discharge region, the 0.5-year median 137Cs activity concentrations increased rapidly and reached 38 533 Bq m−3 in 1976 and then decreased rapidly. The 0.5-year median 137Cs activity concentration decreased with increasing distance from the discharge region. In box 23.2, the maximum value (2453 Bq m−3) was observed in 1977. The 137Cs activity concentrations in the Irish Sea (box 23.4) were the lowest in this box. The decreasing gradient of the 0.5-year median 137Cs values reflected the controlled discharge amount.
In the English Channel, the 0.5-year median 137Cs activity concentrations reached a maximum in 1980.5, and these also decreased over time. The 0.5-year median 137Cs activity concentrations in 2017 in the English Channel were 1.9 Bq m−3.
3.10 Baltic Sea (box 21), Black Sea (box 26), and Mediterranean Sea (box 27)
In the Baltic Sea (box 21), the 0.5-year median values of 137Cs increased gradually in the 1970s due to the inflow of the 137Cs released from reprocessing plants (Fig. 2j). In 1986, the 0.5-year median values of 137Cs increased rapidly (177 Bq m−3) due to the deposition of 137Cs derived from the Chernobyl accident. The 0.5-year 137Cs median values in the Baltic Sea decreased over time. The 0.5-year median 137Cs activity concentration in the Baltic Sea in 2017 was estimated to be 15.3 Bq m−3.
The 0.5-year median value of 137Cs in the Black Sea (box 26) in 1977 and 1978.5 was approximately 17 Bq m−3, and in 1986, it increased to 299 Bq m−3, which was at least 18 times higher than that before the Chernobyl accident (Fig. 2j). The 0.5-year median value of 137Cs decreased rapidly to 60 Bq m−3 in 1989. The 0.5-year median 137Cs value in 2002 was almost equal (18.3 Bq m−3) to that before the Chernobyl accident. The rapid decrease in surface 137Cs could be due to the strong intrusion of surface waters to the deep layers, 137Cs inflow into the Mediterranean Sea after passing through the Bosporus Strait, and radioactive decay (Egorov et al., 1999; Delfanti et al., 2014). However, the Black Sea continues to receive 137Cs derived from Chernobyl by river runoff (Gulin et al., 2013).
In the Mediterranean Sea (box 27), the 0.5-year median value of 137Cs varied from 0.8 to 12 Bq m−3 before the Chernobyl accident (Fig. 2j). After the accident, it increased to 142 and 155 Bq m−3 in 1986.5 and 1987.5, respectively. In the following years, the 0.5-year median value of 137Cs decreased rapidly and became almost the same as that before the Chernobyl accident. This rapid decrease could have been due to the stronger intrusion of bottom water from the surface (Delfanti et al., 2000; Delfanti and Papucci, 2010).
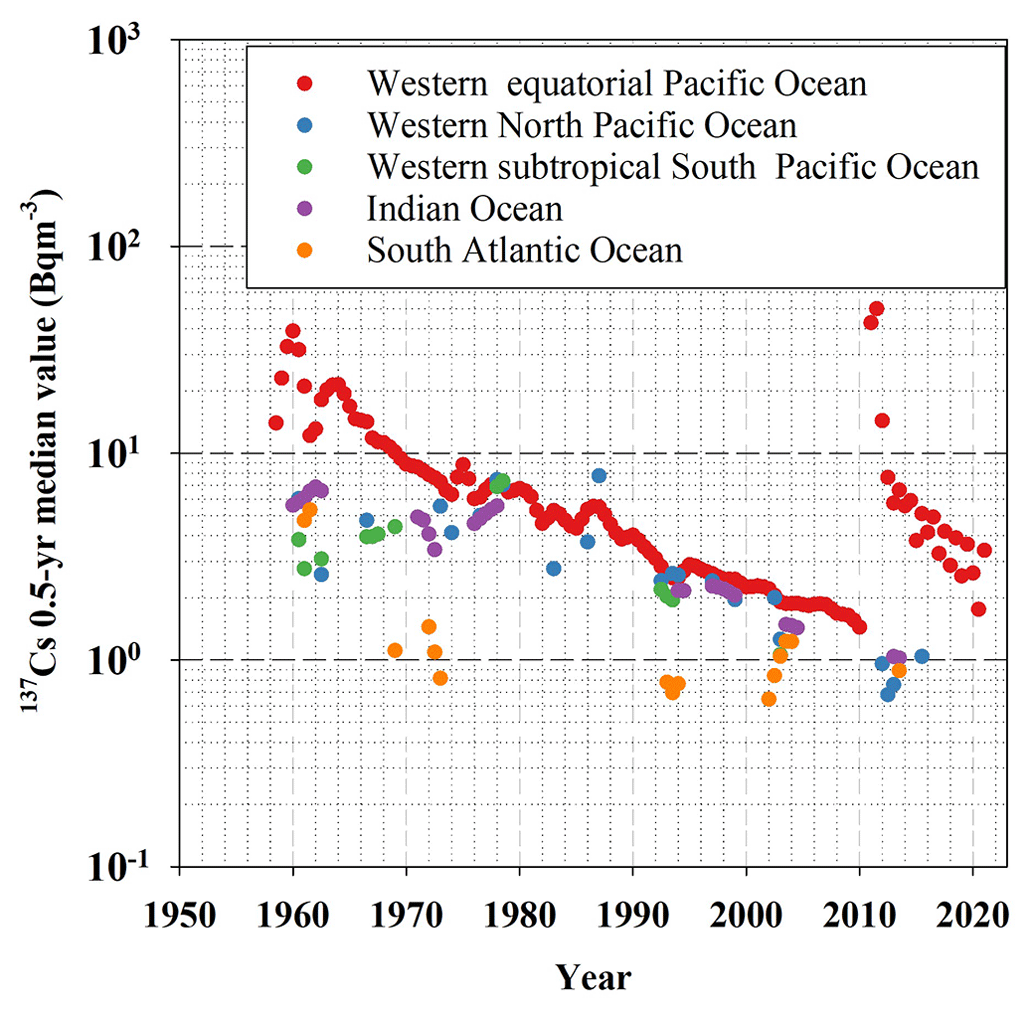
Figure 3Comparison with 0.5-year median 137Cs values in the Pacific Ocean, Indian Ocean, and Atlantic Ocean.
3.11 Comparison with the 0.5-year median 137Cs values in the Pacific Ocean, Indian Ocean, and Atlantic Ocean
Figure 3 shows a comparison of the 0.5-year median 137Cs values in the Pacific Ocean, Indian Ocean, and Atlantic Ocean. A significant feature is that the highest values were observed in the western North Pacific Ocean, and the values decreased exponentially over time until 2011. In contrast, the values in the western equatorial Pacific Ocean, western subtropical South Pacific Ocean, and Indian Ocean increased gradually in the 1970s and 1980s, followed by a decrease after the 1990s. The difference in the 0.5-year median 137Cs values in the Pacific Ocean and Indian Ocean became very small after 1980. Although the data are very limited, the 0.5-year median 137Cs values in the South Atlantic Ocean were lower than those in the Pacific Ocean and the Indian Ocean. In the 2000s, the 0.5-year median 137Cs values in the South Atlantic Ocean was increased and the values were close to those in the Pacific Ocean and Indian Ocean.
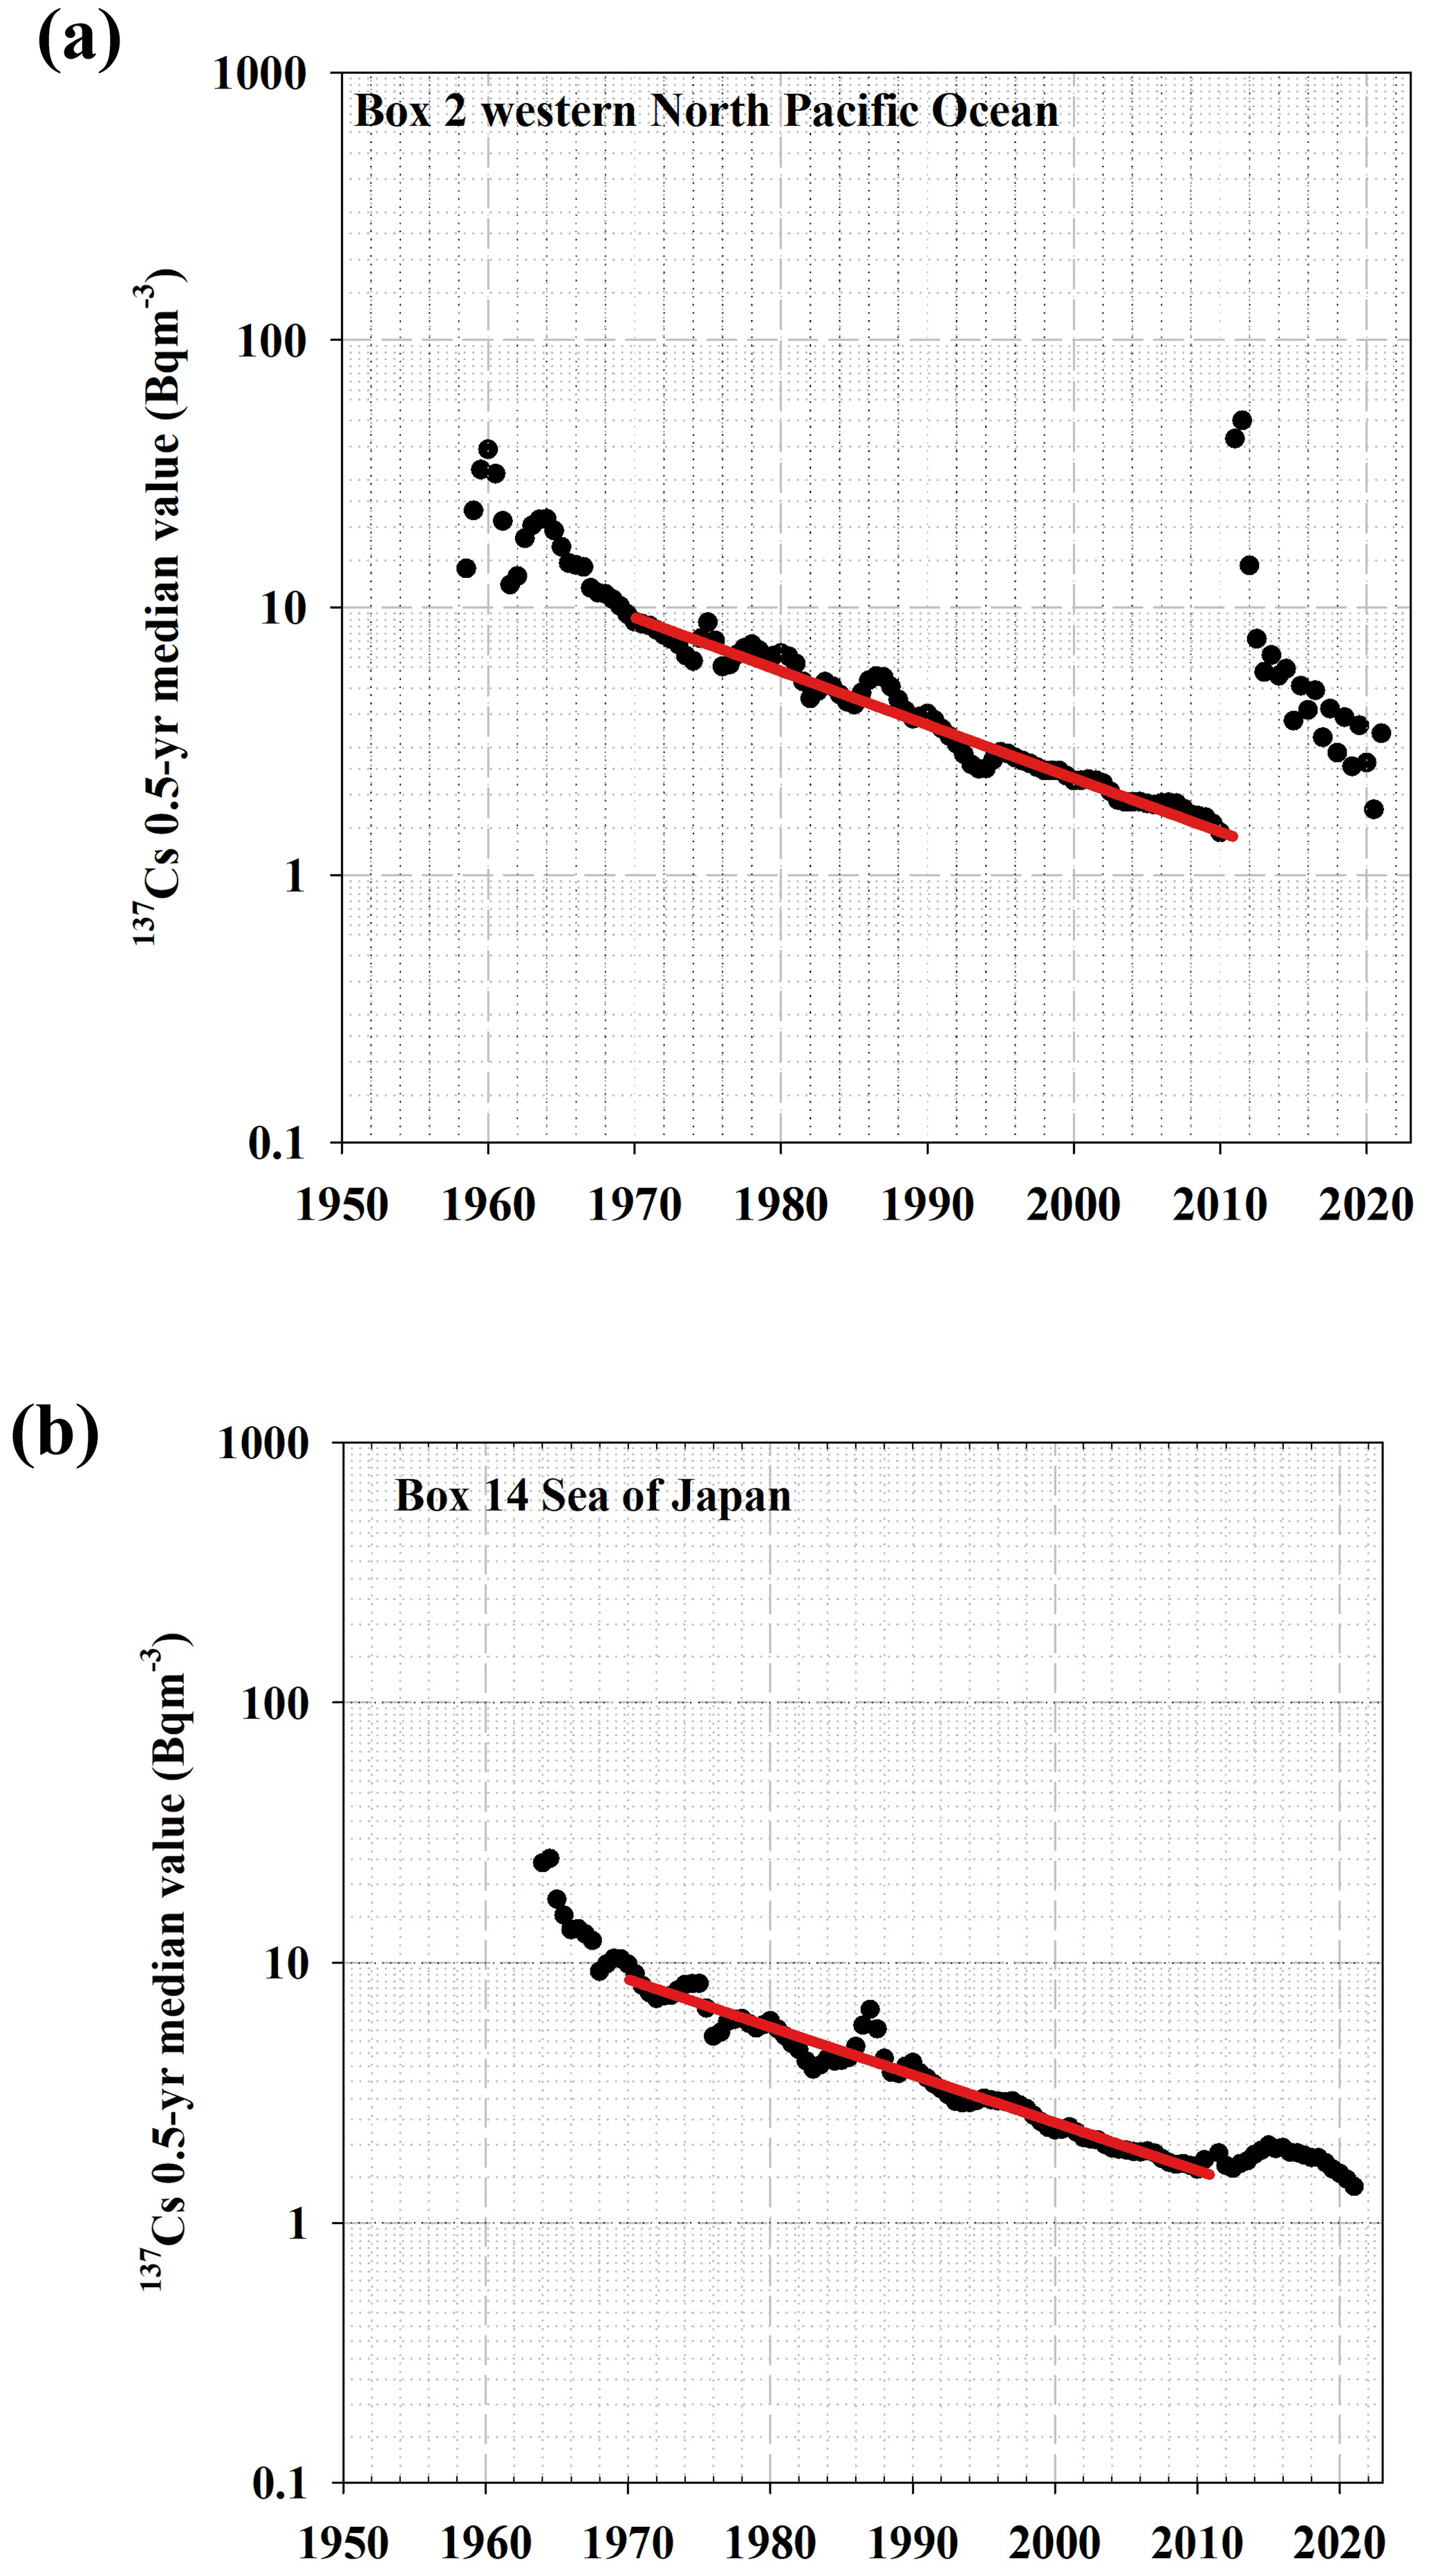
Figure 4Temporal variation in the 0.5-year median 137Cs values. (a) Western North Pacific Ocean. (b) Sea of Japan. The lines represent the exponential decay of the 0.5-year 137Cs median value between 1970 and 2010.
3.12 Tap of the 0.5-year median 137Cs values in the surface mixed layer
Figure 4 shows the temporal variation in the 0.5-year median 137Cs values in the western North Pacific Ocean and the Sea of Japan as being a typical case because of the sequential time series are available in these boxes. The estimated Tap for the western North Pacific Ocean was 15.0 years, whereas the Tap in the Sea of Japan was estimated to be 16.4 years. Although we did not show that in the figures, the Tap in the East China Sea was estimated to be 17.7 years. The longer Tap in the Sea of Japan and East China Sea compared with those in the western North Pacific Ocean suggests that 137Cs was provided into the Sea of Japan and the East China Sea from the western North Pacific Ocean.

The Tap estimated in all boxes until 2010 is listed in Table 3. Tap1, which is the longest at 52.0 years, is estimated in the western equatorial Pacific Ocean, and Tpo in this box is negative. The shorter Tap1, which is approximately 4 years, is in the Sea of Japan. In the case of Tap2, the longer Tap values are in the Indonesian Archipelago (36.7 years), with negative Tpo (−169.2 years), and western subtropical North Pacific Ocean (34.1 years), with negative Tpo (−260.7 years). In Tap3, longer Tap occurs over 38.0 years for the central Atlantic Ocean, 15.4 years for the South Atlantic Ocean, 25.2 years for western subtropical North Pacific Ocean, and 15.6 years for western equatorial Pacific Ocean. In the many boxes with the longer Tap, the Tpo is estimated to be negative, as shown in Table 3. The negative Tpo suggests that the physical oceanographic processes were controlled by the variation in 137Cs activity concentrations.
3.13 Horizontal distribution of 137Cs in the surface mixing layer in the global ocean
3.13.1 Horizontal distribution of 137Cs deposition as of 1 January 1970
The atmospheric deposition of 137Cs due to the nuclear weapons tests in the global Earth as of 1 January 1970 is estimated to be 874±90 PBq, with a 2 min latitude/longitude grid resolution. The global fallout of 137Cs in the Northern Hemisphere is 773±80 PBq. At this time, the deposition in the global ocean is estimated to be 577±60 PBq, which is an initial value in this study. These results are in good agreement with the estimation of the 10∘ latitude/longitude grid by Aoyama et al. (2006), in which the atmospheric deposition of 137Cs derived from nuclear weapons tests in the Northern Hemisphere was 765 and 866 PBq in the global Earth on the 1 January 1970.

Figure 5Horizontal distributions of 137Cs deposition density (kBq m−2) as of the 1 January 1970. (a) Global ocean. (b) Northern North Pacific Ocean and its marginal seas. Black circles are locations of the F1NPS, Sellafield, La Hague, and Chernobyl power plants.
Table 4137Cs deposition density and inventory as on 1 January 1970.

Figure 5 shows the horizontal distributions of the 137Cs deposition density in each box in the global ocean. These values are also listed in Table 4. The 137Cs deposition density is high in the midlatitude region in the North Pacific Ocean (the Sea of Japan, subarctic North Pacific Ocean, Sea of Okhotsk, western North Pacific Ocean, and eastern North Pacific Ocean) and the northern North Atlantic Ocean. In the North Pacific Ocean, these regions correspond to the area in which the Kuroshio Current and Kuroshio Extension are transported. In the northern North Atlantic Ocean, the higher 137Cs deposition area influences the Gulf Stream flow. The dominant features of these regions in the North Pacific Ocean and northern North Atlantic Ocean have received larger precipitation amounts, and stratosphere–troposphere air mass exchange has occurred (Aoyama et al., 2006). The larger air mass exchange between the stratosphere and troposphere means that the 137Cs injected into the stratosphere by the large-scale weapons tests is transported into the troposphere and deposited on the surface by precipitation. South of 5∘ N, the 137Cs deposition density is lower than that in the northern region, and there is no significant difference between the open oceans (Pacific, Atlantic, and Indian oceans). The distribution of the 137Cs deposition a 2 min latitude/longitude grid resolution is also well reproduced in the 10∘ latitude/longitude grid deposition.
However, these estimations were almost 1.4 times larger than those in the estimation by using a model simulation (UNSCEAR, 1993), with an estimated value of 545 PBq (Aoyama, 2019). The large difference occurred in the meridional distribution in the midlatitude. This corresponds to having a larger 137Cs fallout region that includes the Kuroshio Current and its extension areas (latitude 20–40∘ N) in the Pacific Ocean and the Gulf Stream transport area (latitude 30–50∘ N) in the Atlantic Ocean. It was also reported that the 137Cs water column inventory in the North Pacific Ocean was 2–3 times larger than those in the cumulative 137Cs fallout amount in the same latitude in the modeling results in UNSCEAR (1993; Aoyama, 2019). Because the reconstructed 137Cs deposition in Aoyama et al. (2006) was based on the historically observed data, uncertainty in the model would cause the underestimation of 137Cs deposition amount.
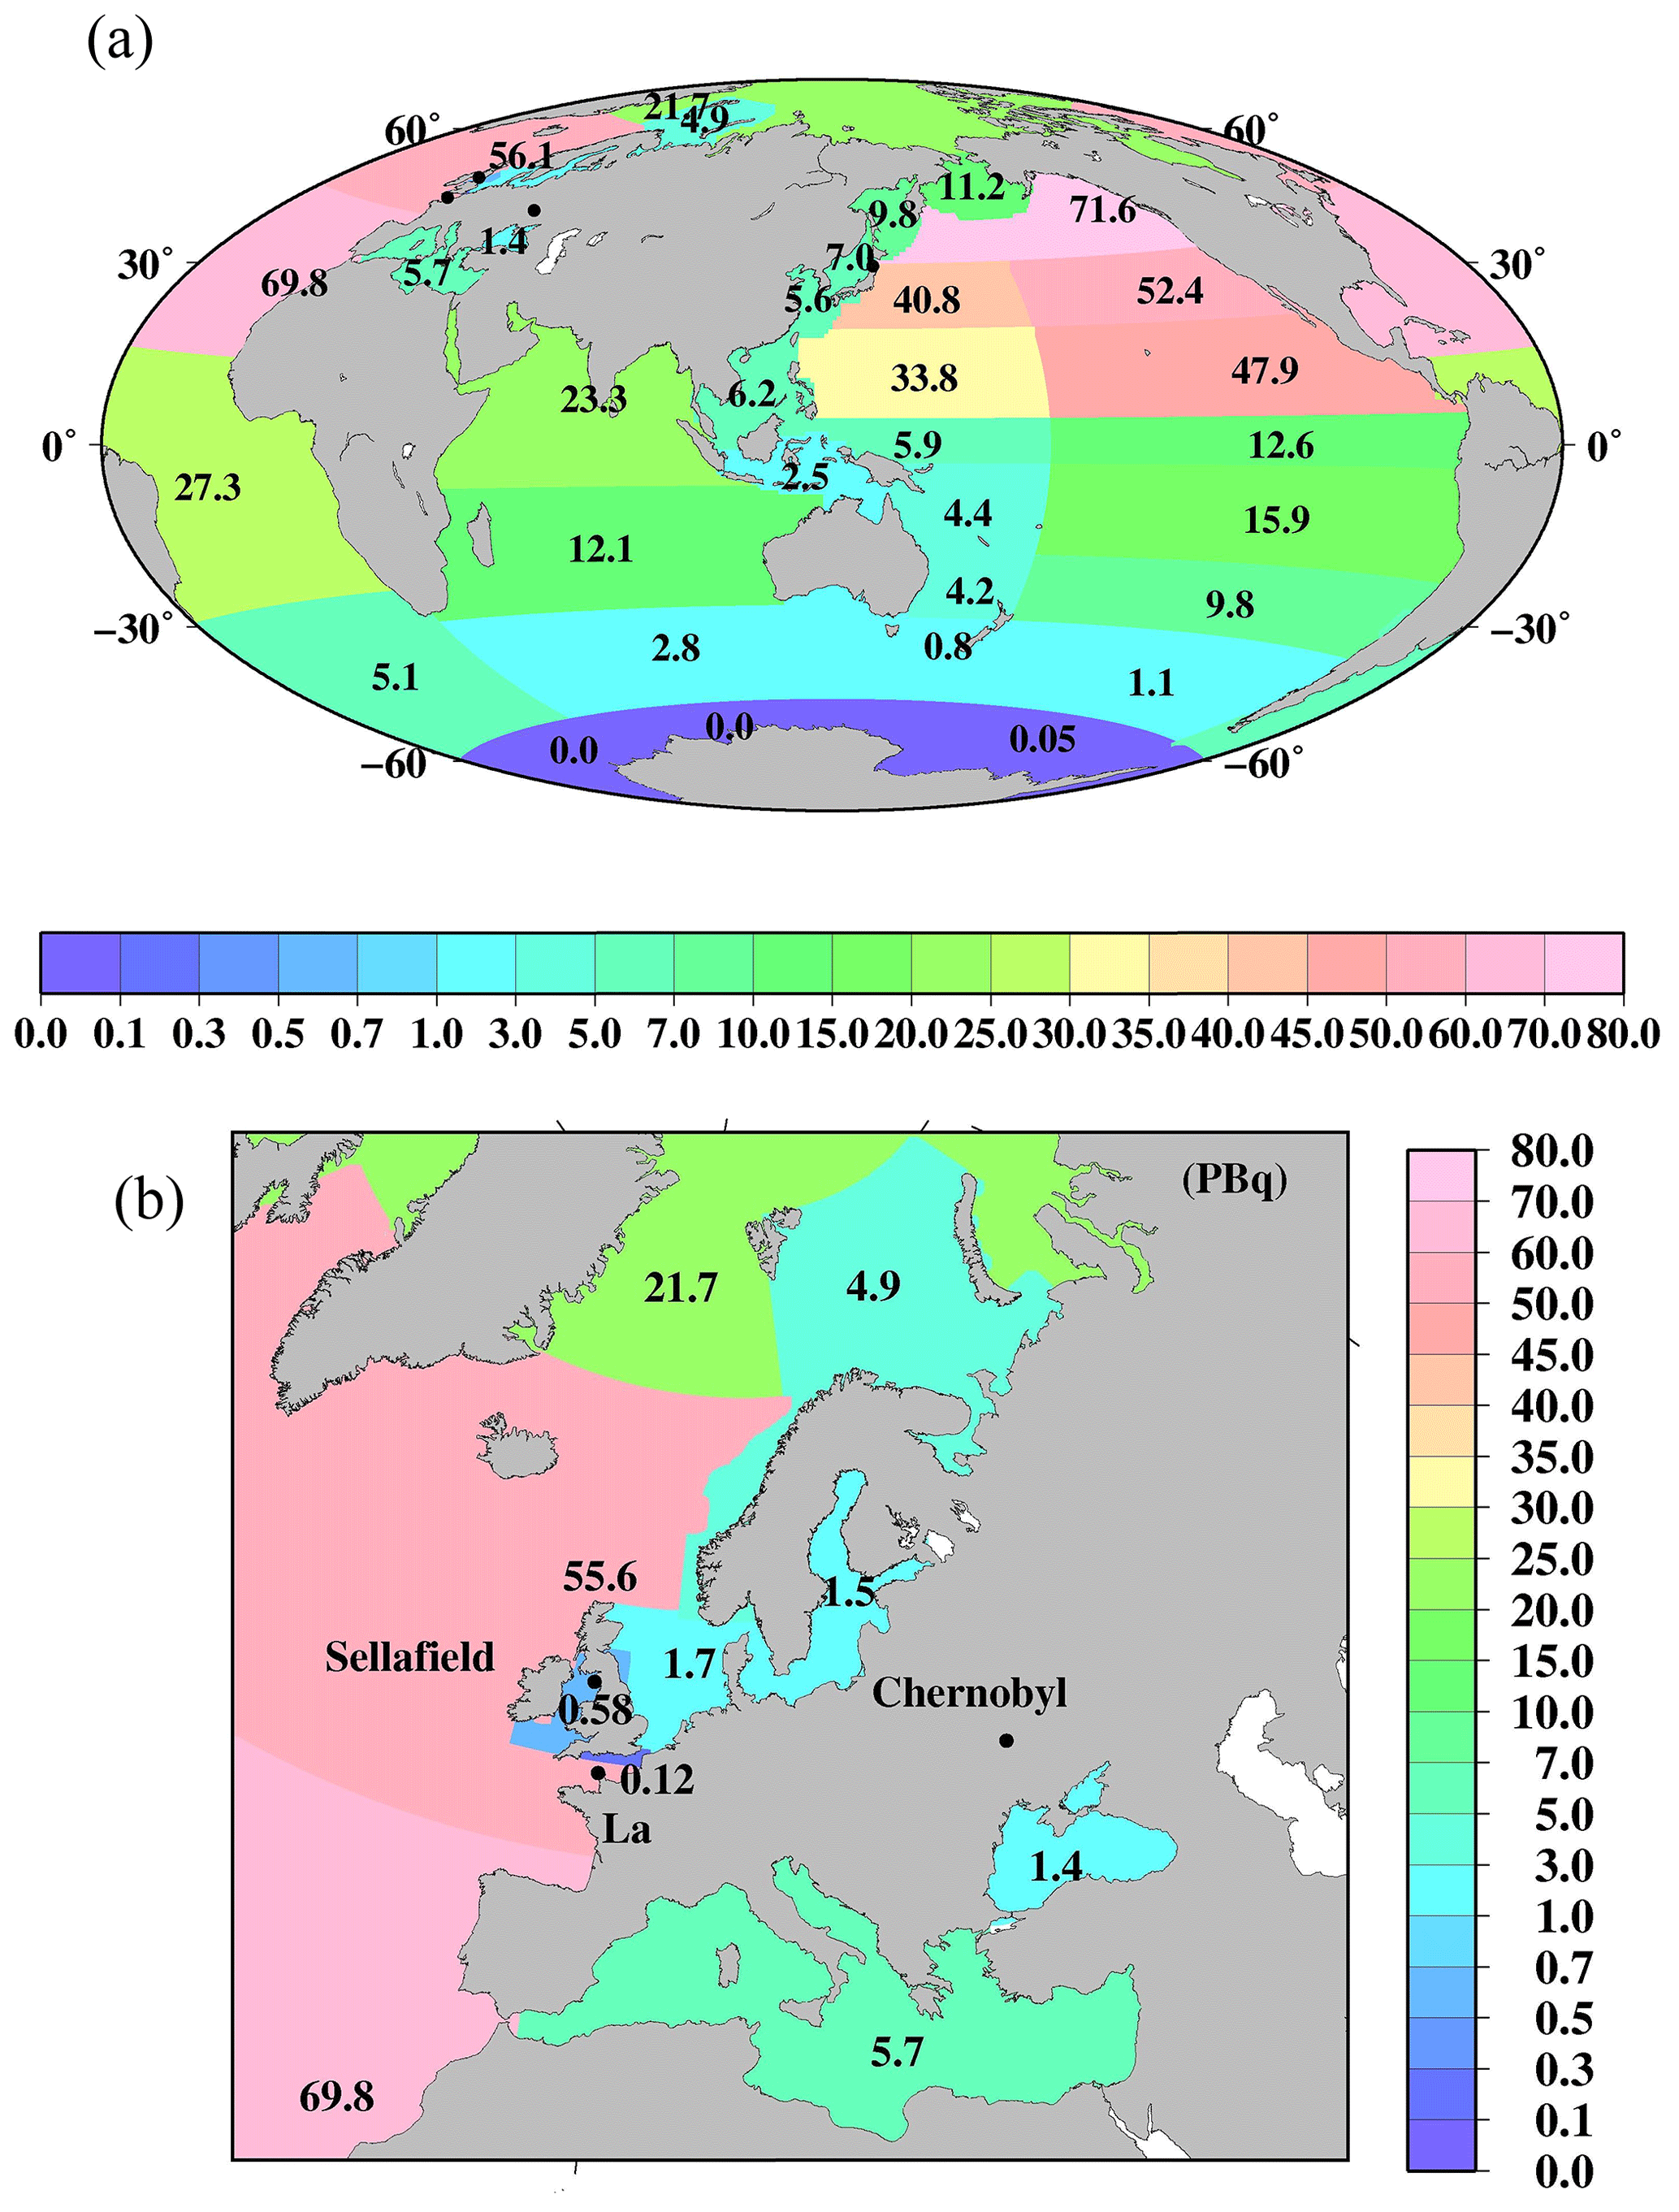
Figure 6Horizontal distributions of the 137Cs deposition amount (PBq) in each box as of 1 January 1970. (a) Global ocean. (b) Northern North Pacific Ocean and its marginal seas. Black circles are locations of the F1NPS, Sellafield, La Hague, and Chernobyl power plants.
Figure 6 shows the horizontal distribution of the 137Cs deposition amount as of 1 January 1970 in the surface mixed layer in the global ocean. These data are also listed in Table 4. In the Pacific Ocean, a higher 137Cs deposition amount occurs in the subarctic North Pacific Ocean (71.6 PBq), western North Pacific Ocean (40.8 PBq), eastern North Pacific Ocean (52.4 PBq), and eastern subtropical North Pacific Ocean (47.9 PBq). In the Atlantic Ocean, a higher 137Cs deposition amount is found in the northern North Atlantic Ocean (sum of boxes 25.1 and 25.2; 56.1 PBq) and the North Atlantic Ocean (69.8 PBq). The 137Cs deposition amount in the Atlantic Ocean shows a significant latitudinal gradient, which is 27.3 PBq for the central Atlantic Ocean and 5.1 PBq for the South Atlantic Ocean. In the Indian Ocean, the 137Cs deposition amount also has a north–south gradient. The 137Cs deposition amount is the lowest in the Pacific sector (0.05 PBq), Atlantic sector (0.0 PBq), and Indian sector (0.0 PBq) of the Antarctic Ocean.
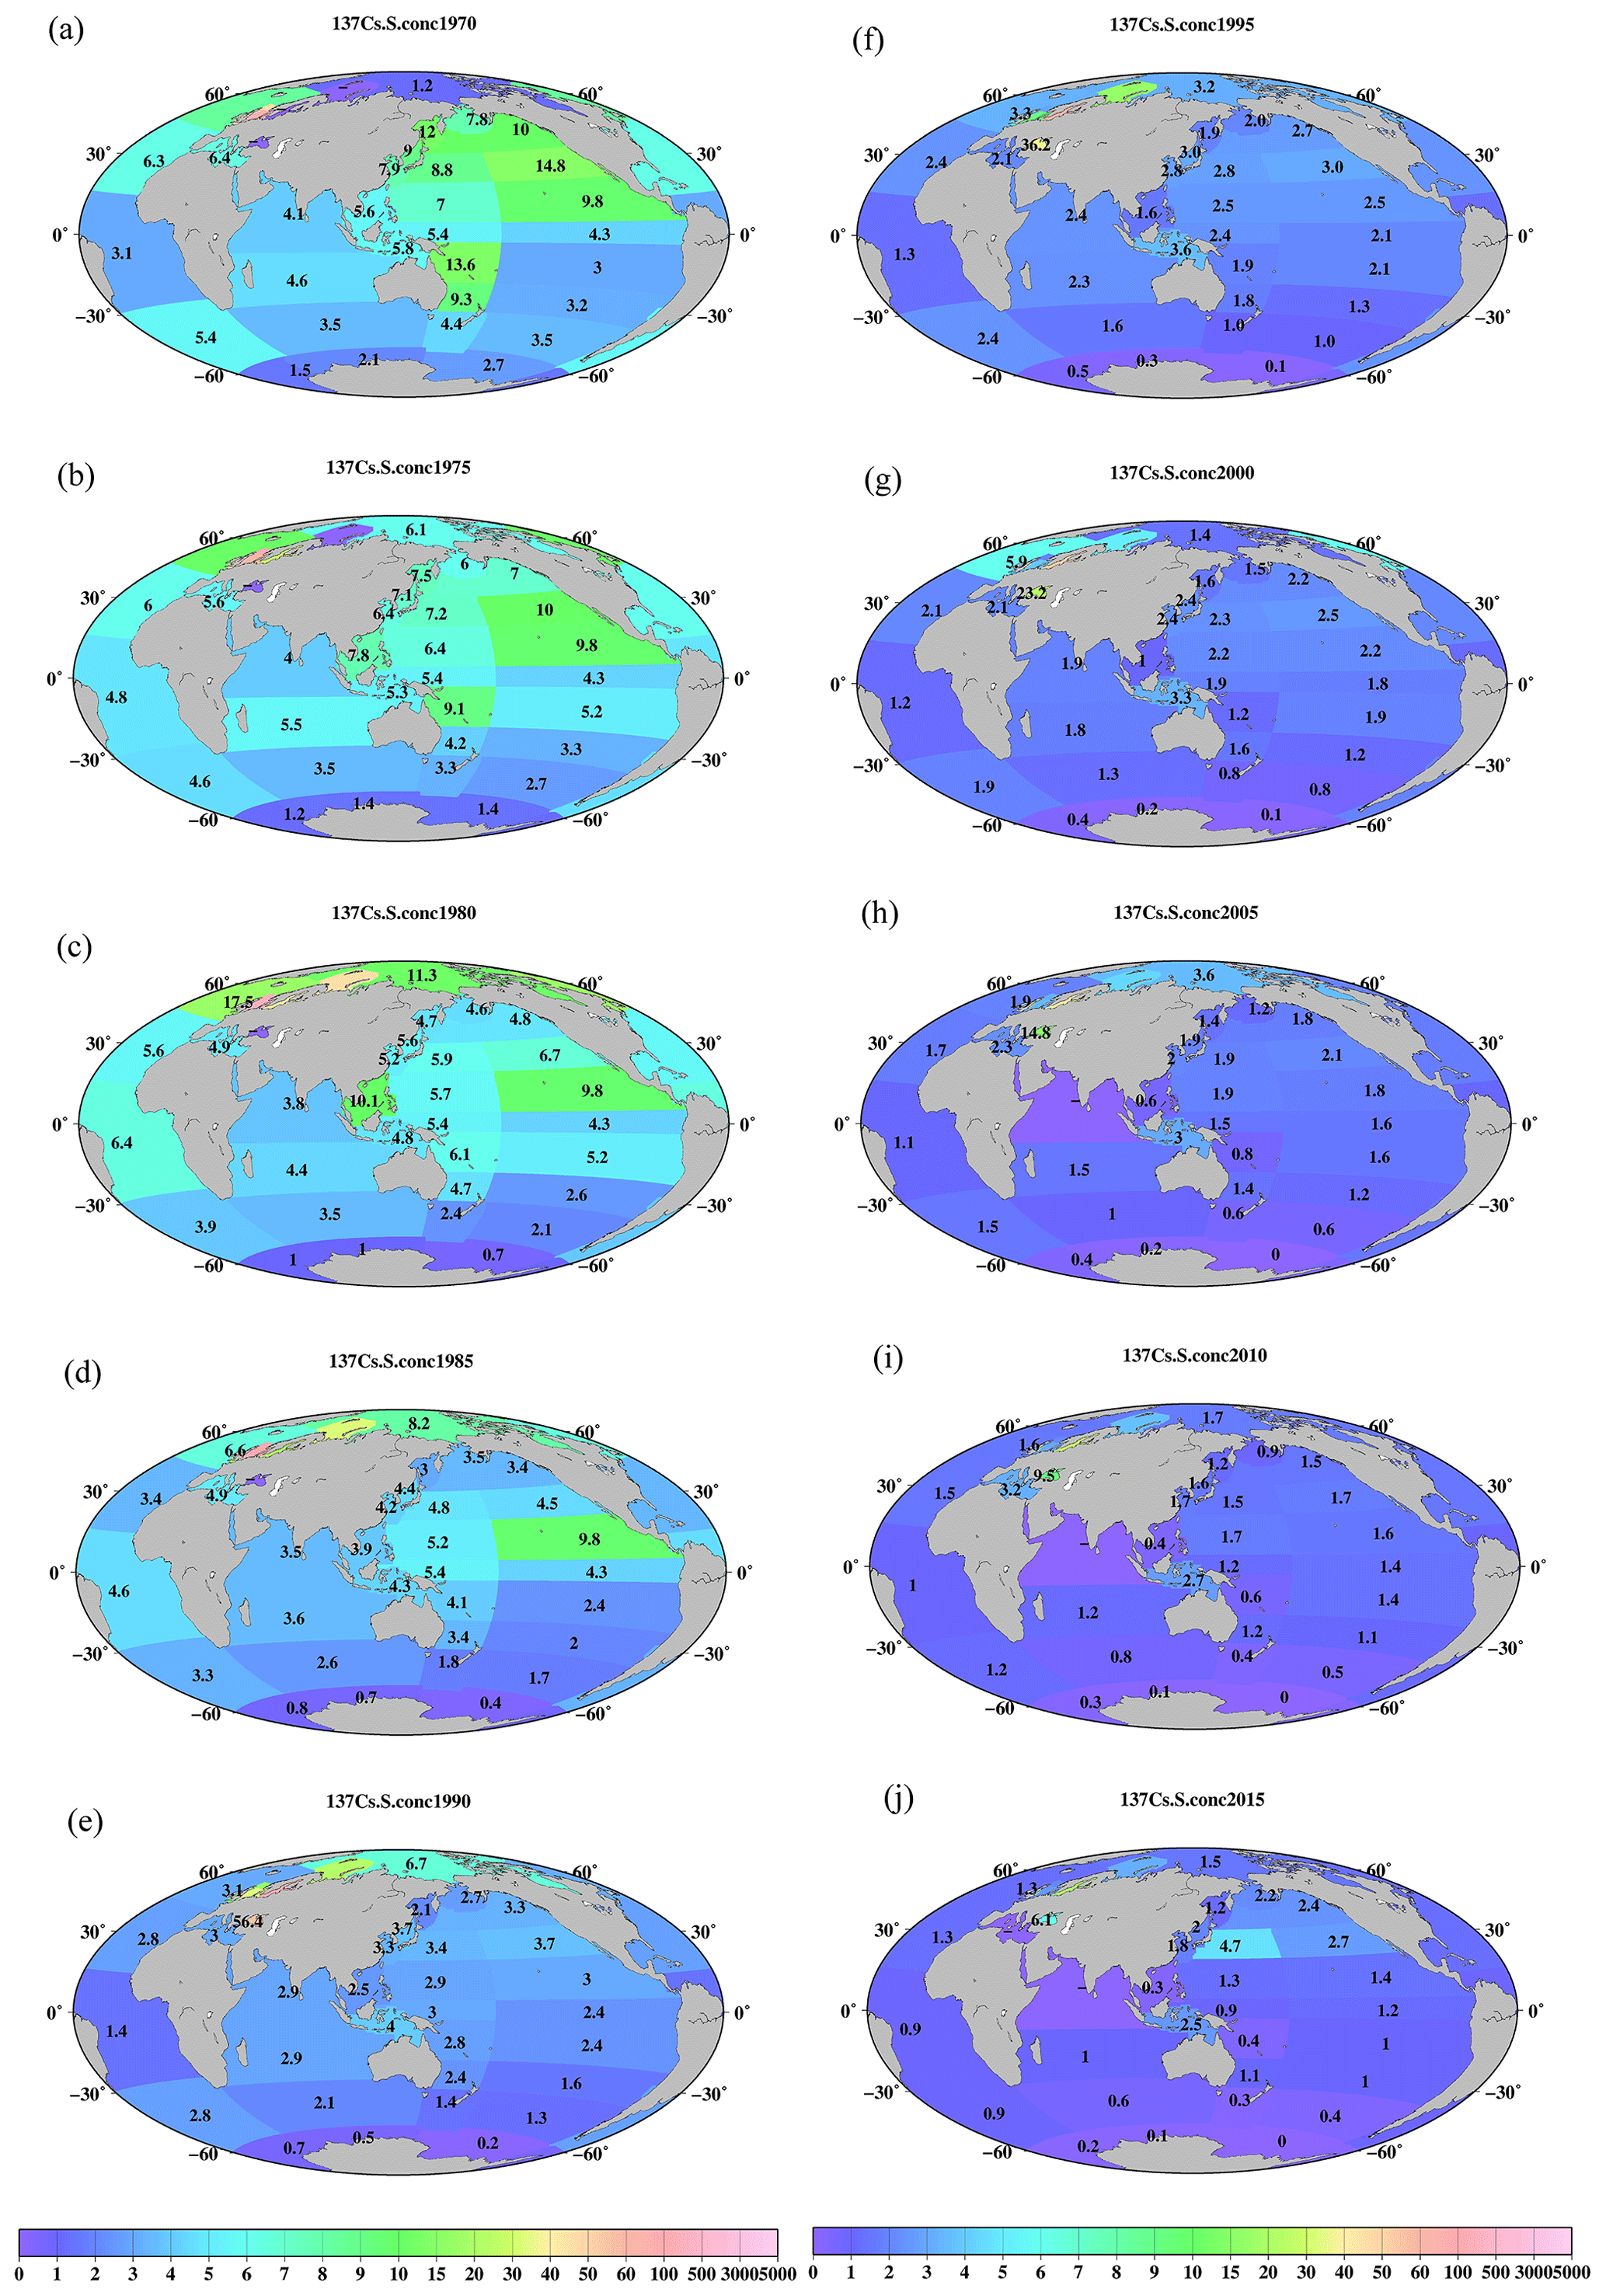
Figure 7Horizontal distributions of the 0.5-year median 137Cs value in the surface mixed layer in the global ocean (unit is Bq m−3). (a) 1970, (b) 1975, (c) 1980, (d) 1985, (e) 1990, (f) 1995, (g) 2000, (h) 2005, (i) 2010, and (j) 2015.
3.13.2 Horizontal distribution of 0.5-year median 137Cs values in the global ocean
Figure 7 shows the spatial variations in the 0.5-year median 137Cs values in the global ocean every 5 years. In 1970, the 0.5-year median 137Cs values were higher in the North Pacific Ocean and lower in the South Pacific Ocean. In particular, the highest value (14.8 Bq m−3) was observed in the eastern North Pacific Ocean. In the South Pacific Ocean, relatively high values occurred in the western and western subtropical South Pacific Ocean (9.3 and 13.6 Bq m−3) compared to those in the eastern region (3–4.3 Bq m−3). The 0.5-year median 137Cs values in the Indonesian Archipelago (5.8 Bq m−3) and the South China Sea (5.6 Bq m−3) were almost the same or slightly higher than those in the western equatorial Pacific Ocean (5.4 Bq m−3). In 1975, the 0.5-year median 137Cs values in the South China Sea were higher than those in the Indonesian Archipelago (Fig. 7b). In 1980 and 1985 (Fig. 7c and d), in the Pacific Ocean, higher values were found in the eastern subtropical Pacific Ocean (9.8 Bq m−3). In the North Pacific Ocean, the 0.5-year median 137Cs values were higher in the eastern region, whereas higher values in the South Pacific Ocean were found in the western region. In 1990, the 0.5-year median 137Cs values decreased, although the concentration distribution was similar to that of the 1980s (Fig. 7e). In particular, after 1990, the Indonesian Archipelago became the hotspot region, with relatively high 0.5-year median 137Cs activity values in the Pacific Ocean and Indian Ocean. Higher values in this region were still observed in 2015 (Fig. 7j). The latitudinal gradient, which was higher in the North Pacific Ocean and lower in the South Pacific Ocean, became small, which lasted until 2010. In 2015, an increase in the 0.5-year median 137Cs values was found in the western and subarctic North Pacific Ocean due to the release of 137Cs from the F1NPS accident (Fig. 7j). The lowest value occurred in the Antarctic Ocean in the global ocean after 1970 (Fig. 7).
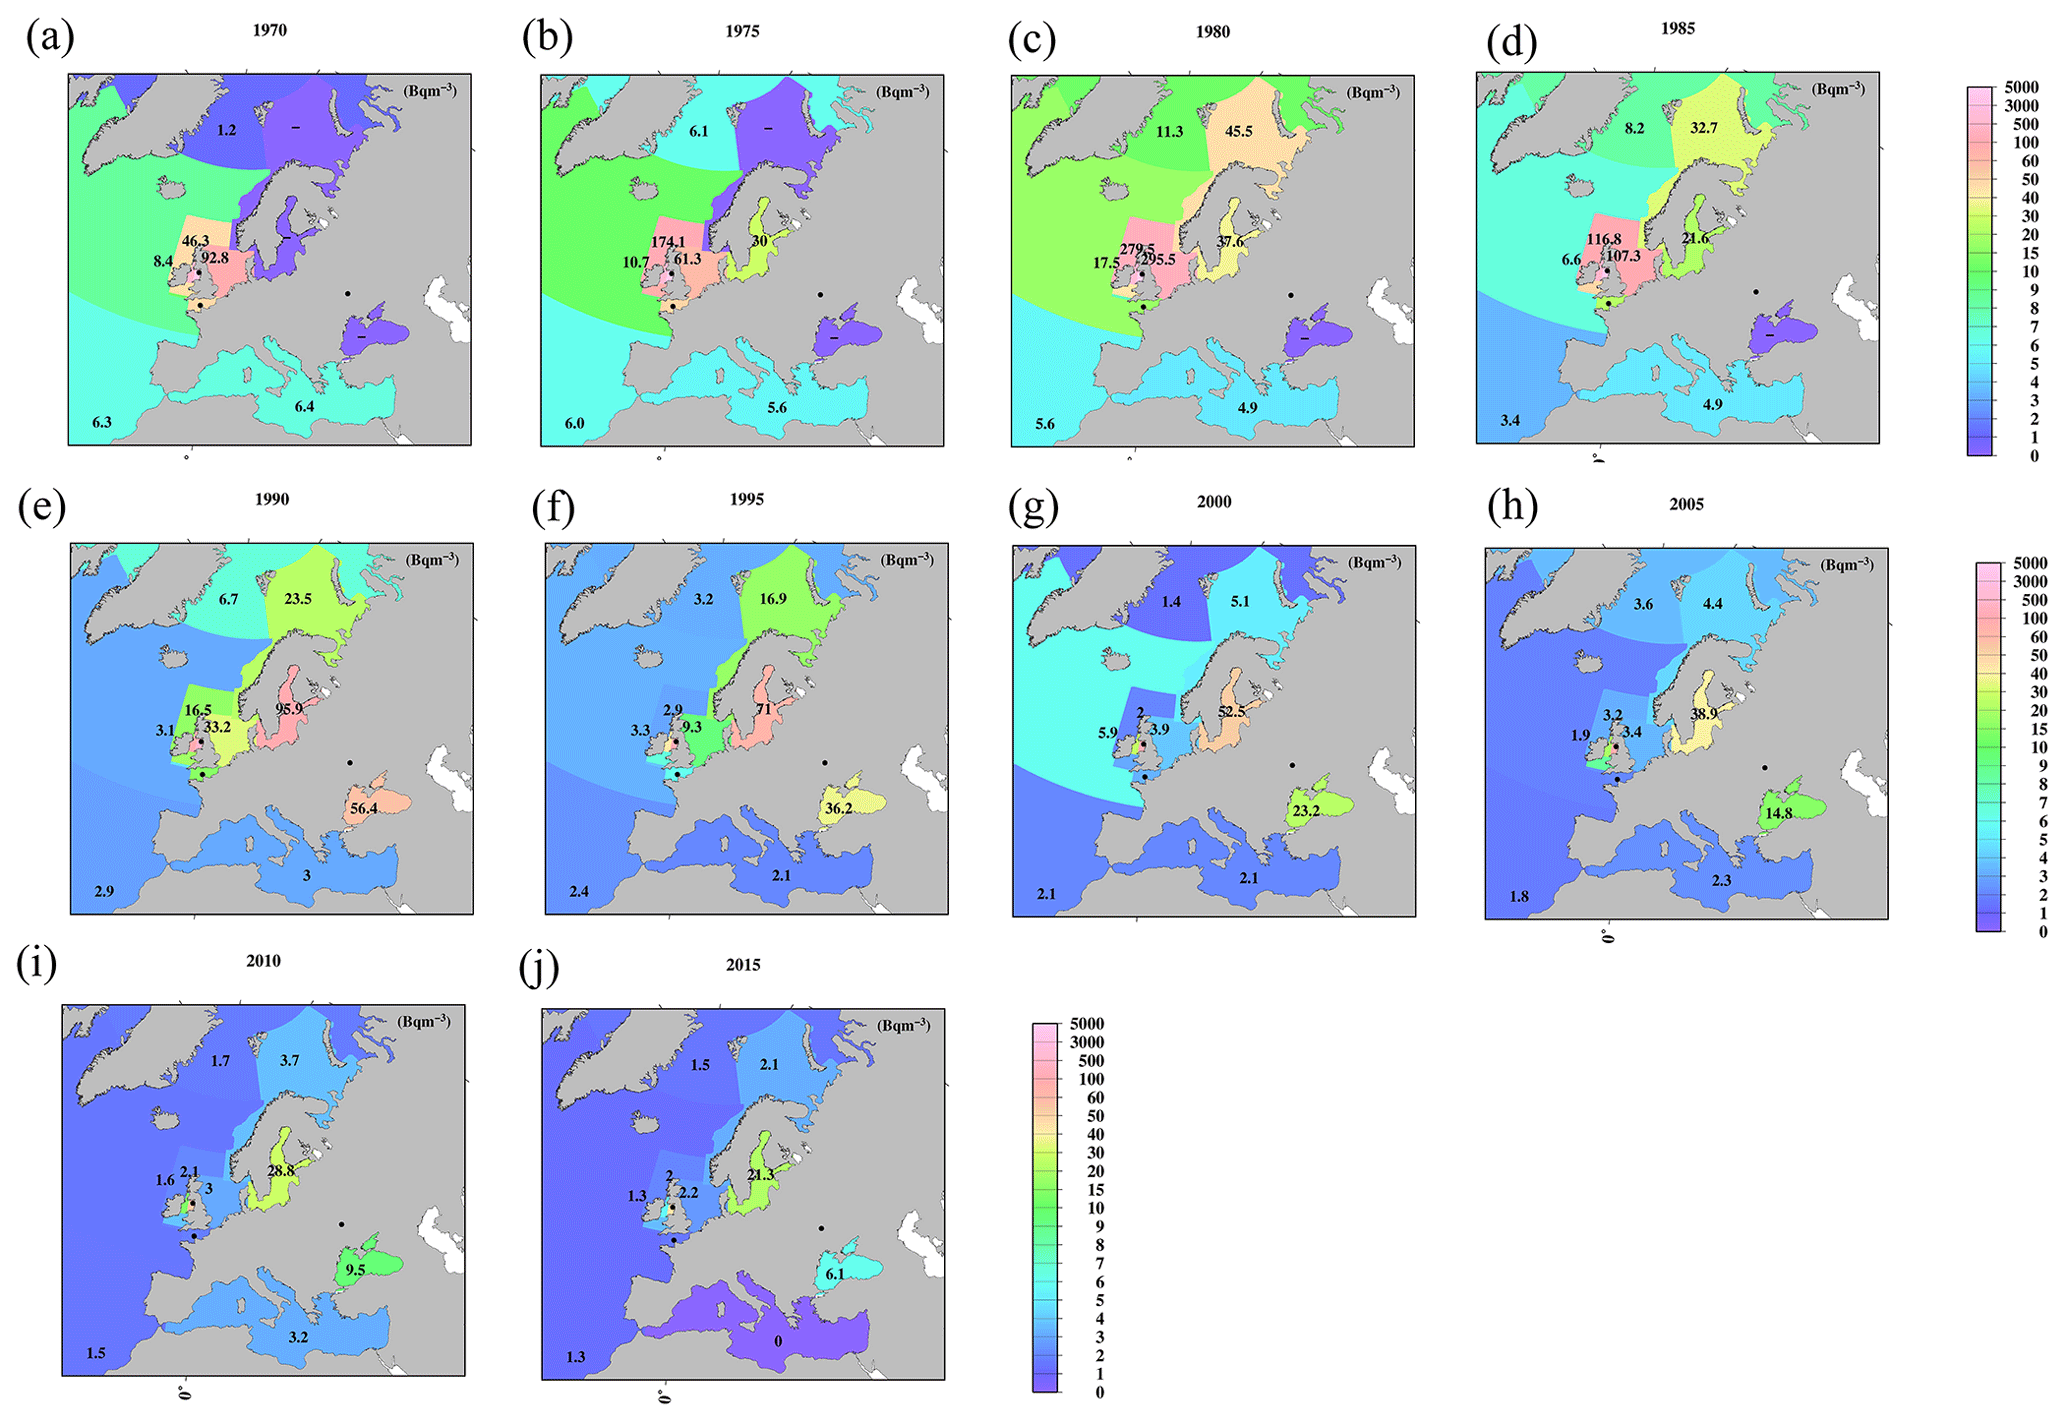
Figure 8Horizontal distributions of the 0.5-year median 137Cs value in the surface mixed layer in the northern North Atlantic Ocean and its marginal seas (unit is Bq m−3). (a) 1970, (b) 1975, (c) 1980, (d) 1985, (e) 1990, (f) 1995, (g) 2000, (h) 2005, (i) 2010, and (j) 2015.
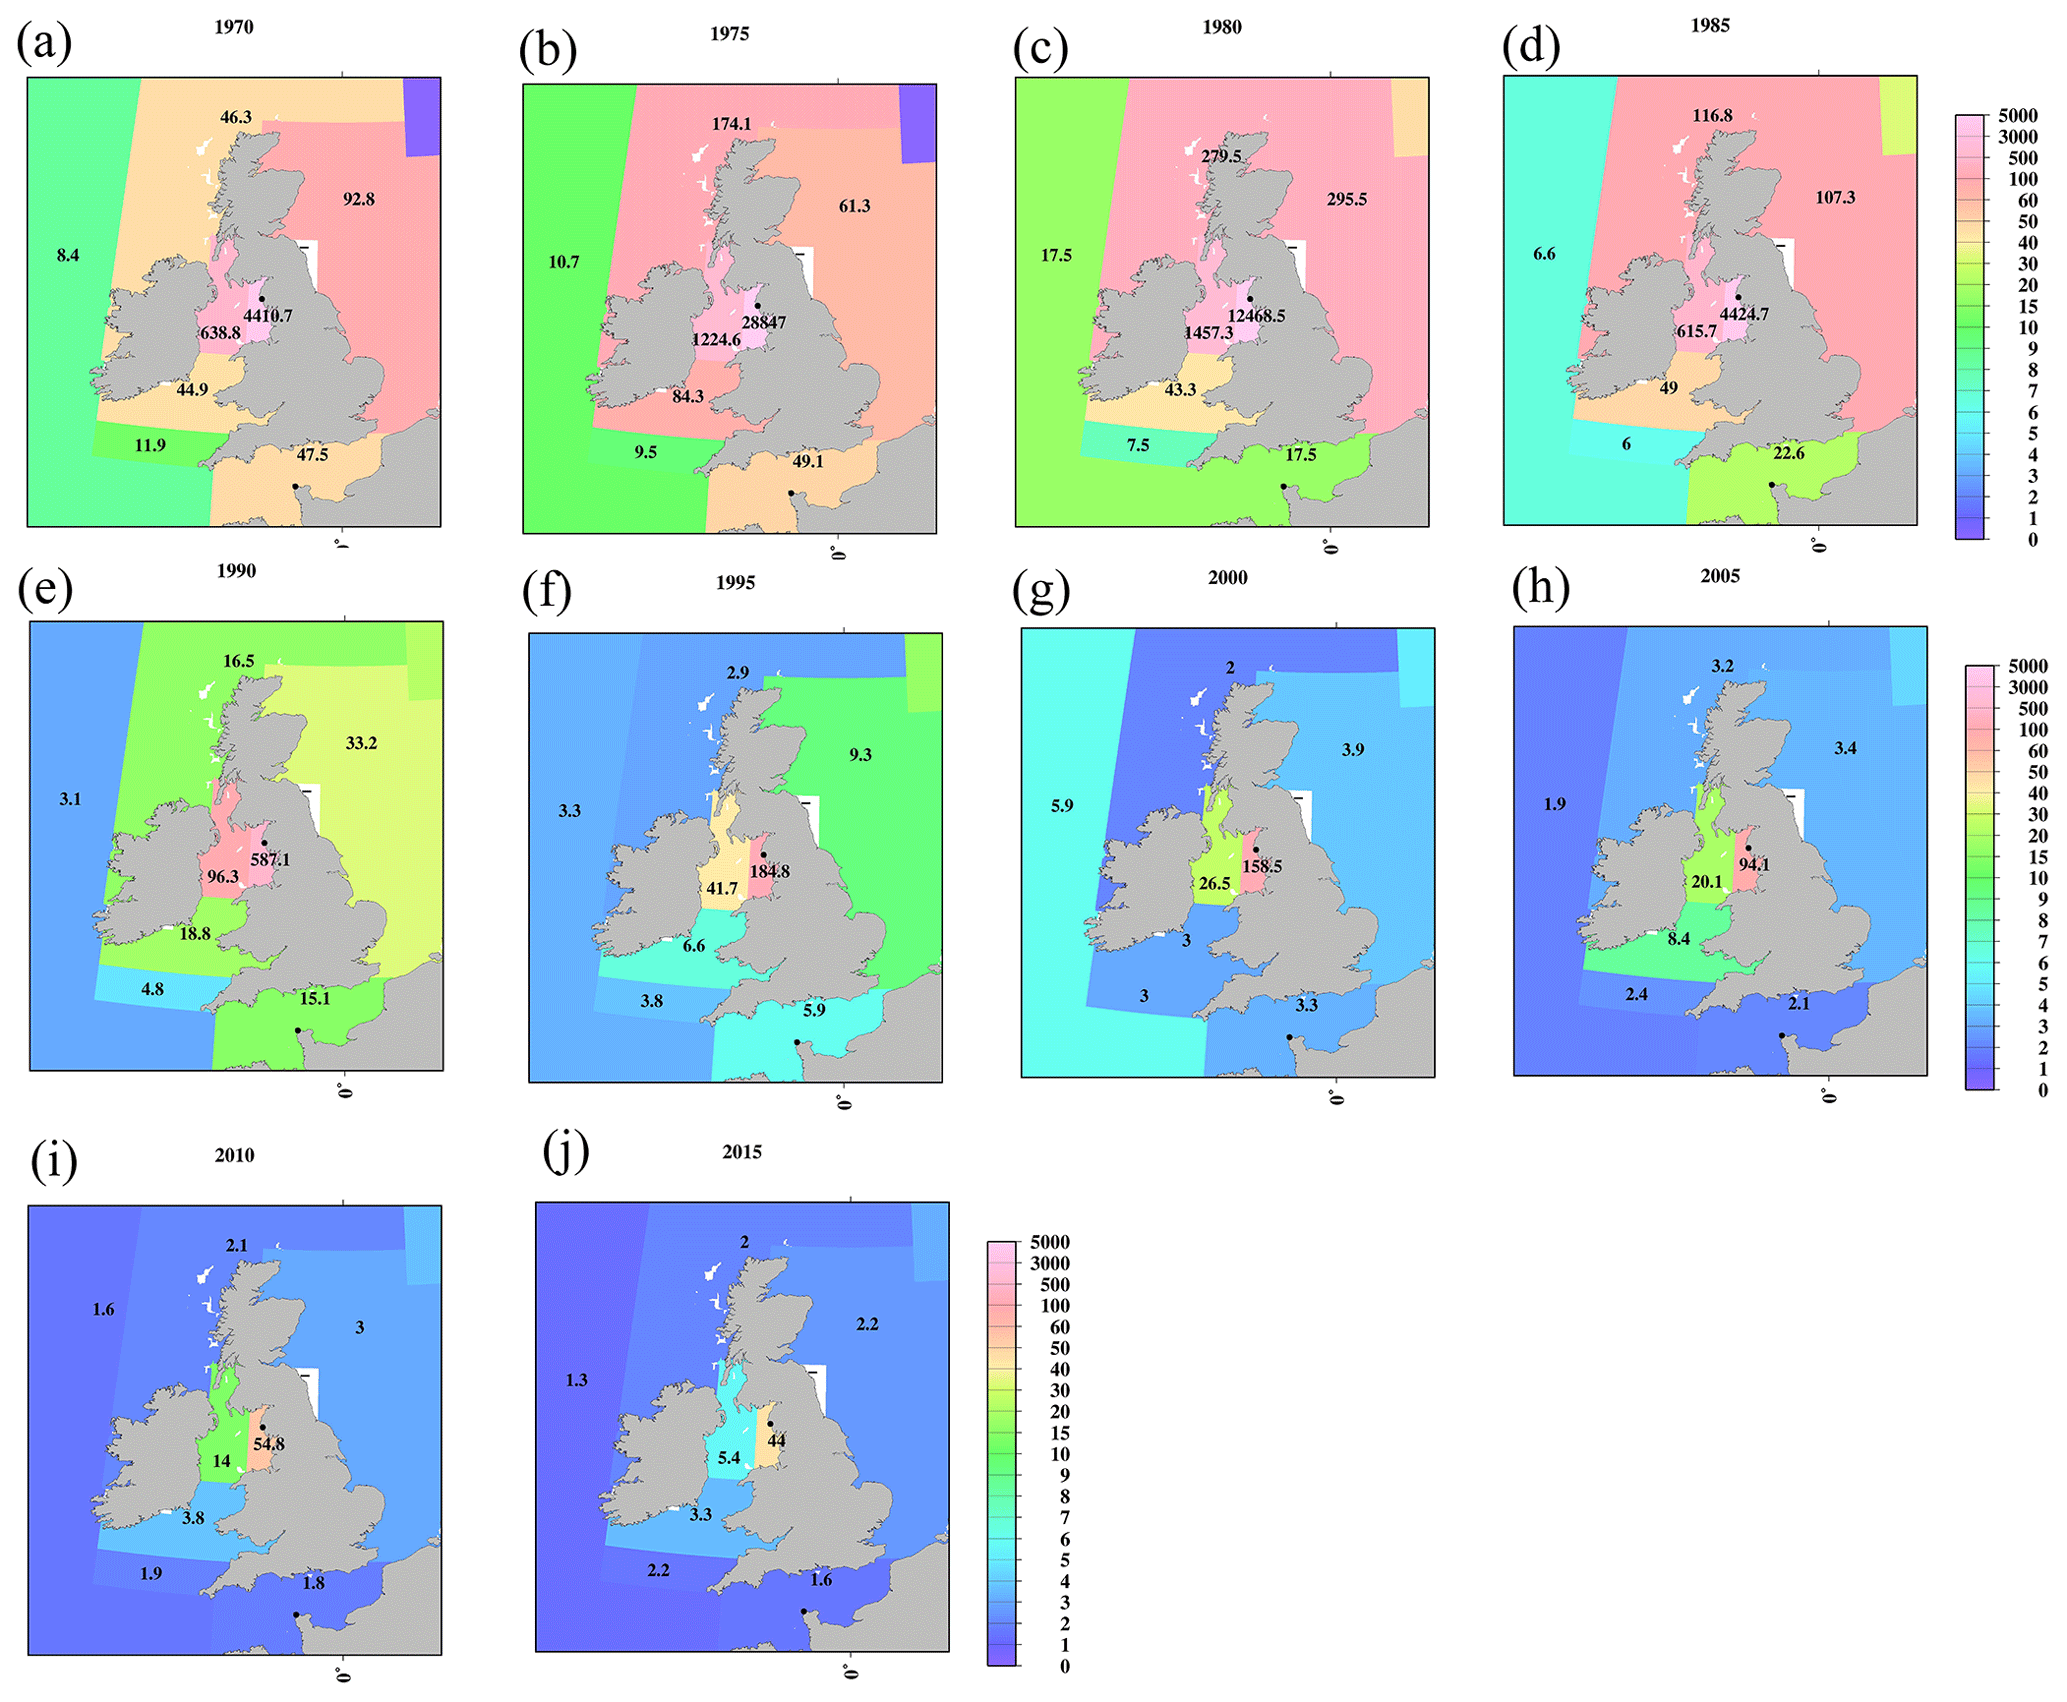
Figure 9Horizontal distributions of the 0.5-year median 137Cs value in the surface mixed layer in the Irish Sea (unit is Bq m−3). (a) 1970, (b) 1975, (c) 1980, (d) 1985, (e) 1990, (f) 1995, (g) 2000, (h) 2005, (i) 2010, and (j) 2015. The symbol “–” means that there are no available data.
In the Atlantic Ocean, a latitudinal gradient that was higher in the northern North Atlantic Ocean and North Atlantic Ocean (north of 30∘ N) than in the Central and South Atlantic Ocean occurs. In 2015, the values in the South Atlantic Ocean (0.7 Bq m−3) were almost equal to those in the Southern Ocean (0.6 Bq m−3; Fig. 7j). In the Atlantic Ocean, because of the discharged 137Cs in the surface seawater from the nuclear reprocessing plants, i.e., the Sellafield plant, significantly higher 0.5-year 137Cs median values occurred in the Irish Sea, particularly at 137Cs discharge points (box 23.1), as shown in Figs. 8 and 9. The discharged 137Cs was transported to the northern North Pacific Ocean (box 25.1) and North Sea from the Irish Sea (box 23.2). The 0.5-year median 137Cs values after 1985 (Fig. 8d) decreased gradually in accordance with the discharged amount of 137Cs (Fig. 9c). The increase in the 0.5-year median 137Cs values in the Baltic Sea (96 Bq m−3) and Black Sea (56 Bq m−3) in 1990 was caused by the deposition of 137Cs from the Chernobyl accident (Fig. 8e and f). Contamination due to the Chernobyl accident continued in the Baltic Sea and Black Sea until 2015 (Fig. 8j).
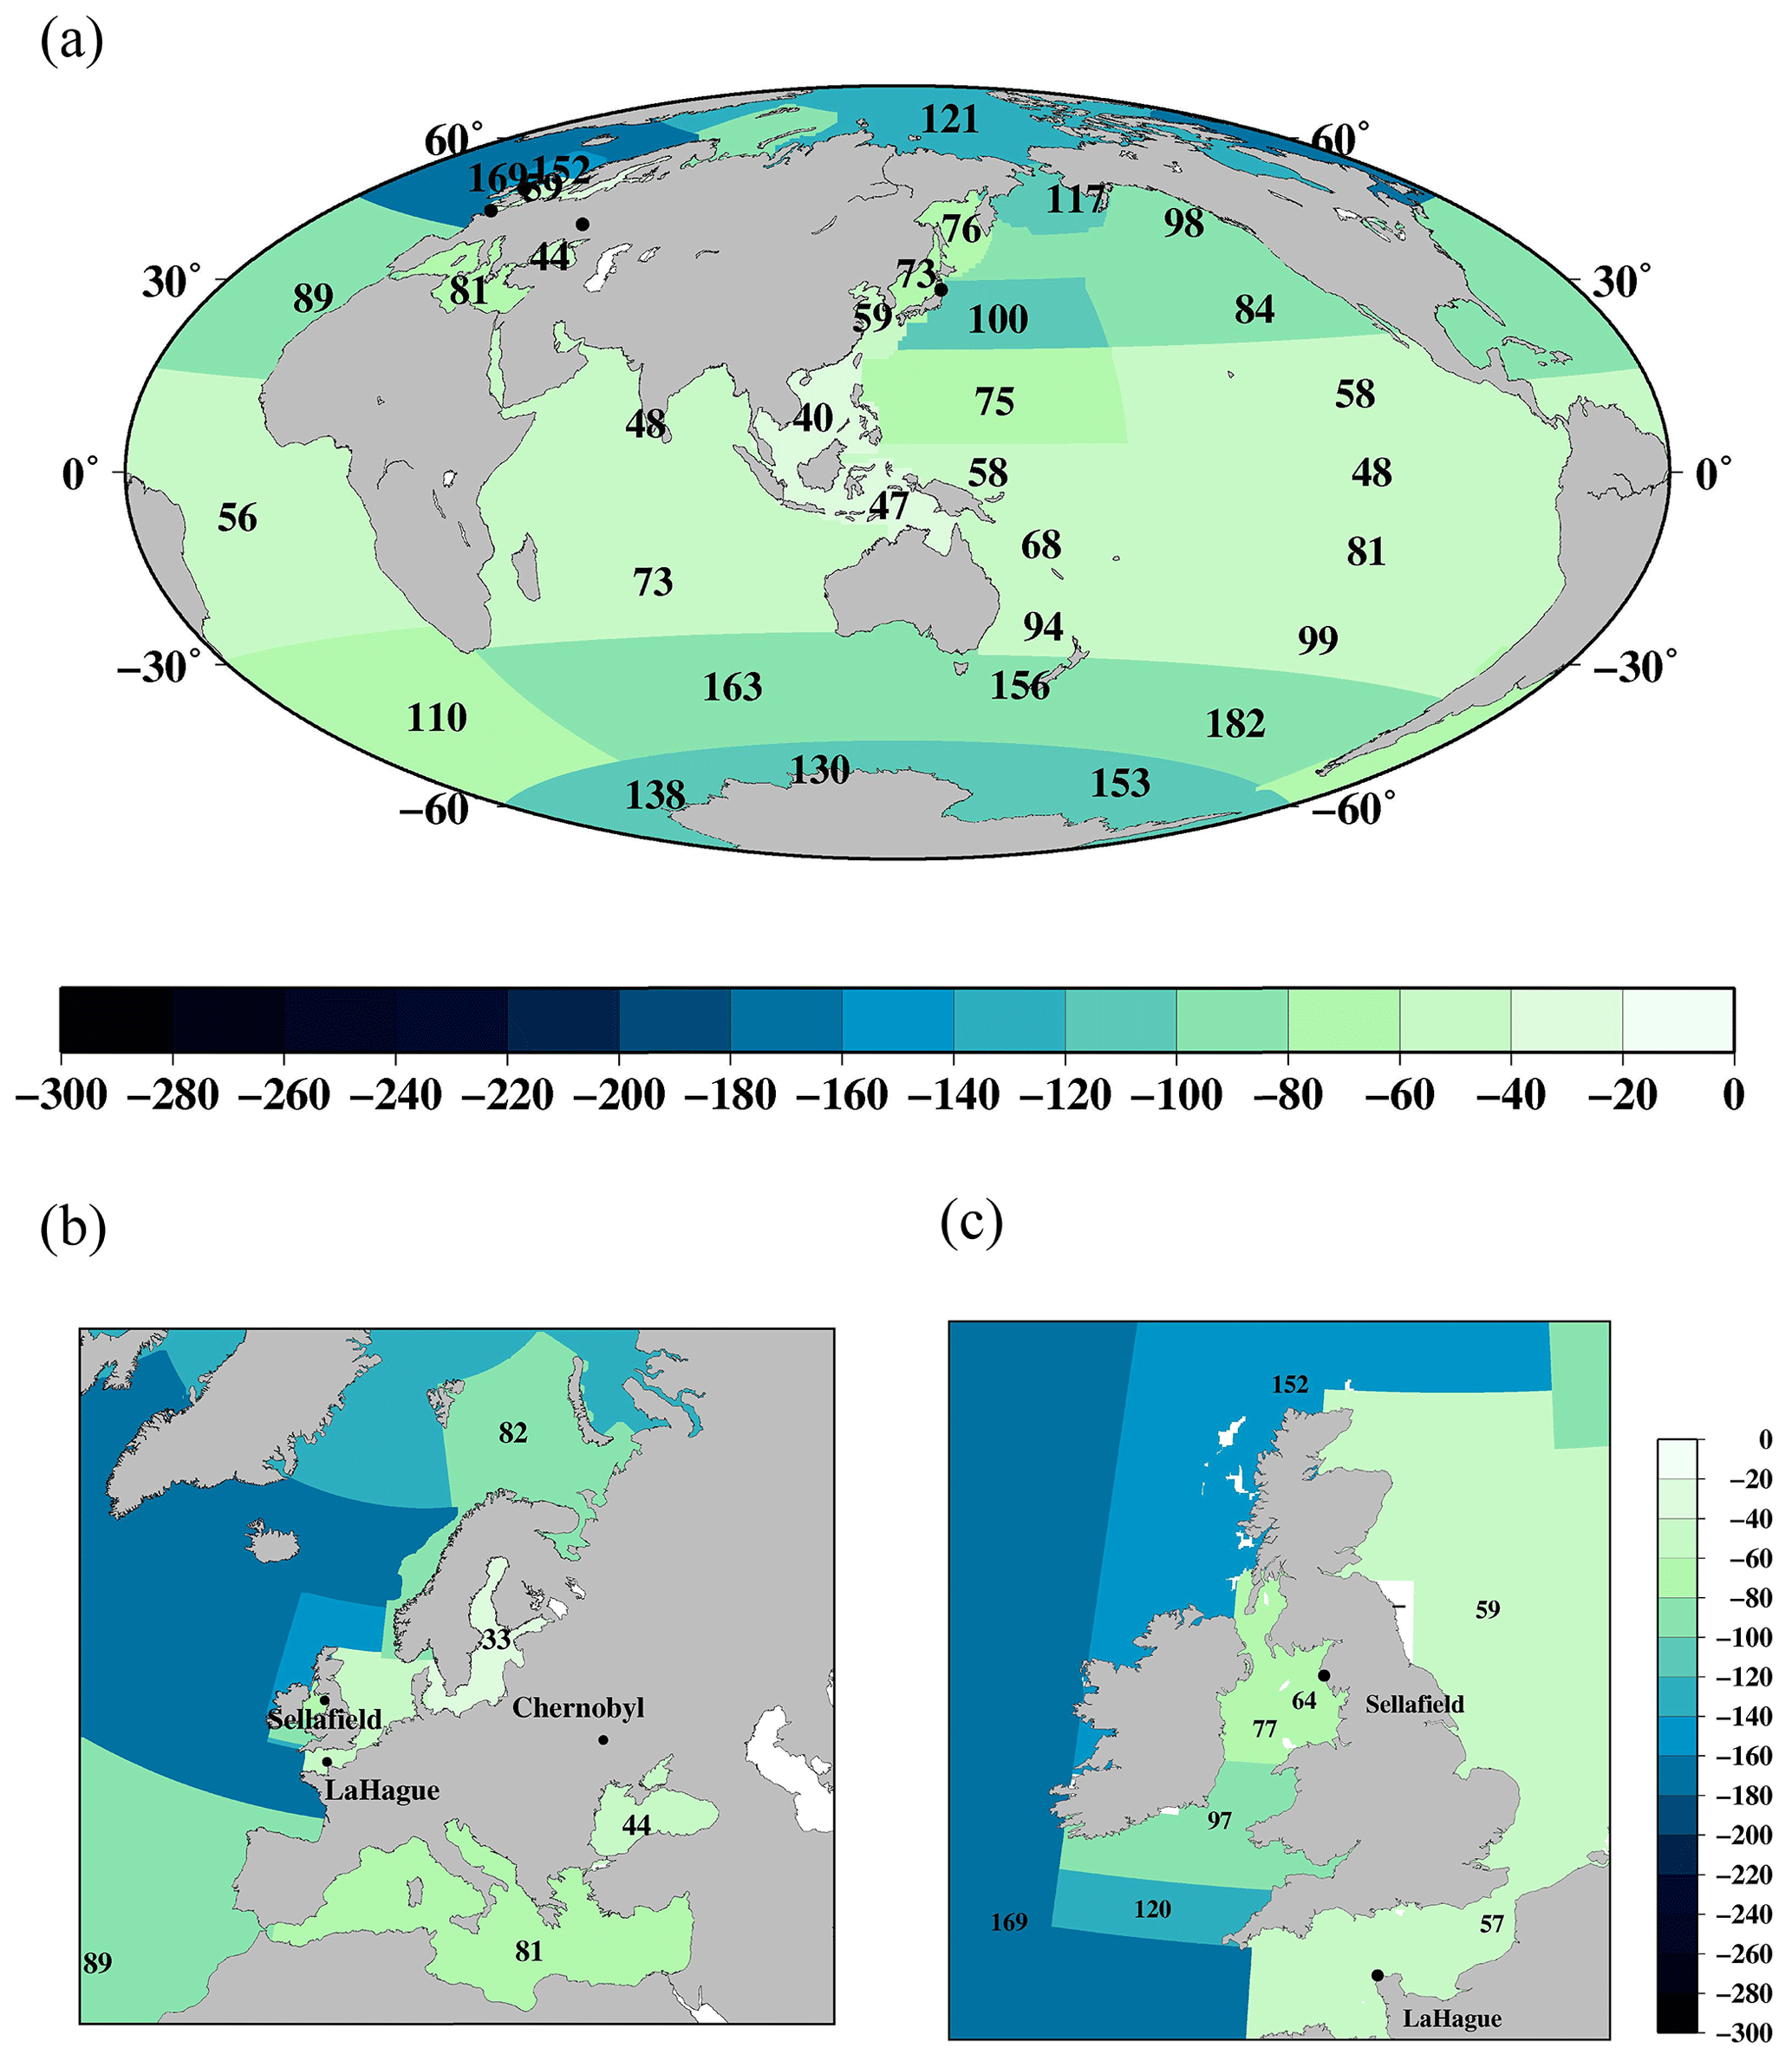
Figure 10Mixed-layer depth in each box in the global ocean. (a) Global ocean, (b) North Atlantic Ocean and its marginal sea, and (c) Irish Sea (unit is m). The symbol “–” means that there are no mixed-layer depth data.
3.14 137Cs inventory in the surface mixing layer in the global ocean after 1970
The horizontal distribution of the surface mixed-layer depth in the global ocean is shown in Fig. 10. The mixed-layer depth in the open ocean shows a clear latitudinal distribution that is deeper (∼182 m) in the higher latitudes and shallower in the lower latitudes, particularly in the equatorial Pacific Ocean (48 m for the eastern equatorial Pacific Ocean and 58 m for the western equatorial Pacific Ocean). In the coastal sea, the mixed-layer depths are shallower (33–76 m) than those in the open ocean. The mixed-layer depth in each box is also listed in Table 5.
Table 5137Cs inventory in each box in the global ocean.

* 137Cs inventory was estimated by using the 137Cs median value. NA means that there are no available data. MLD denotes the mixed-layer depth.
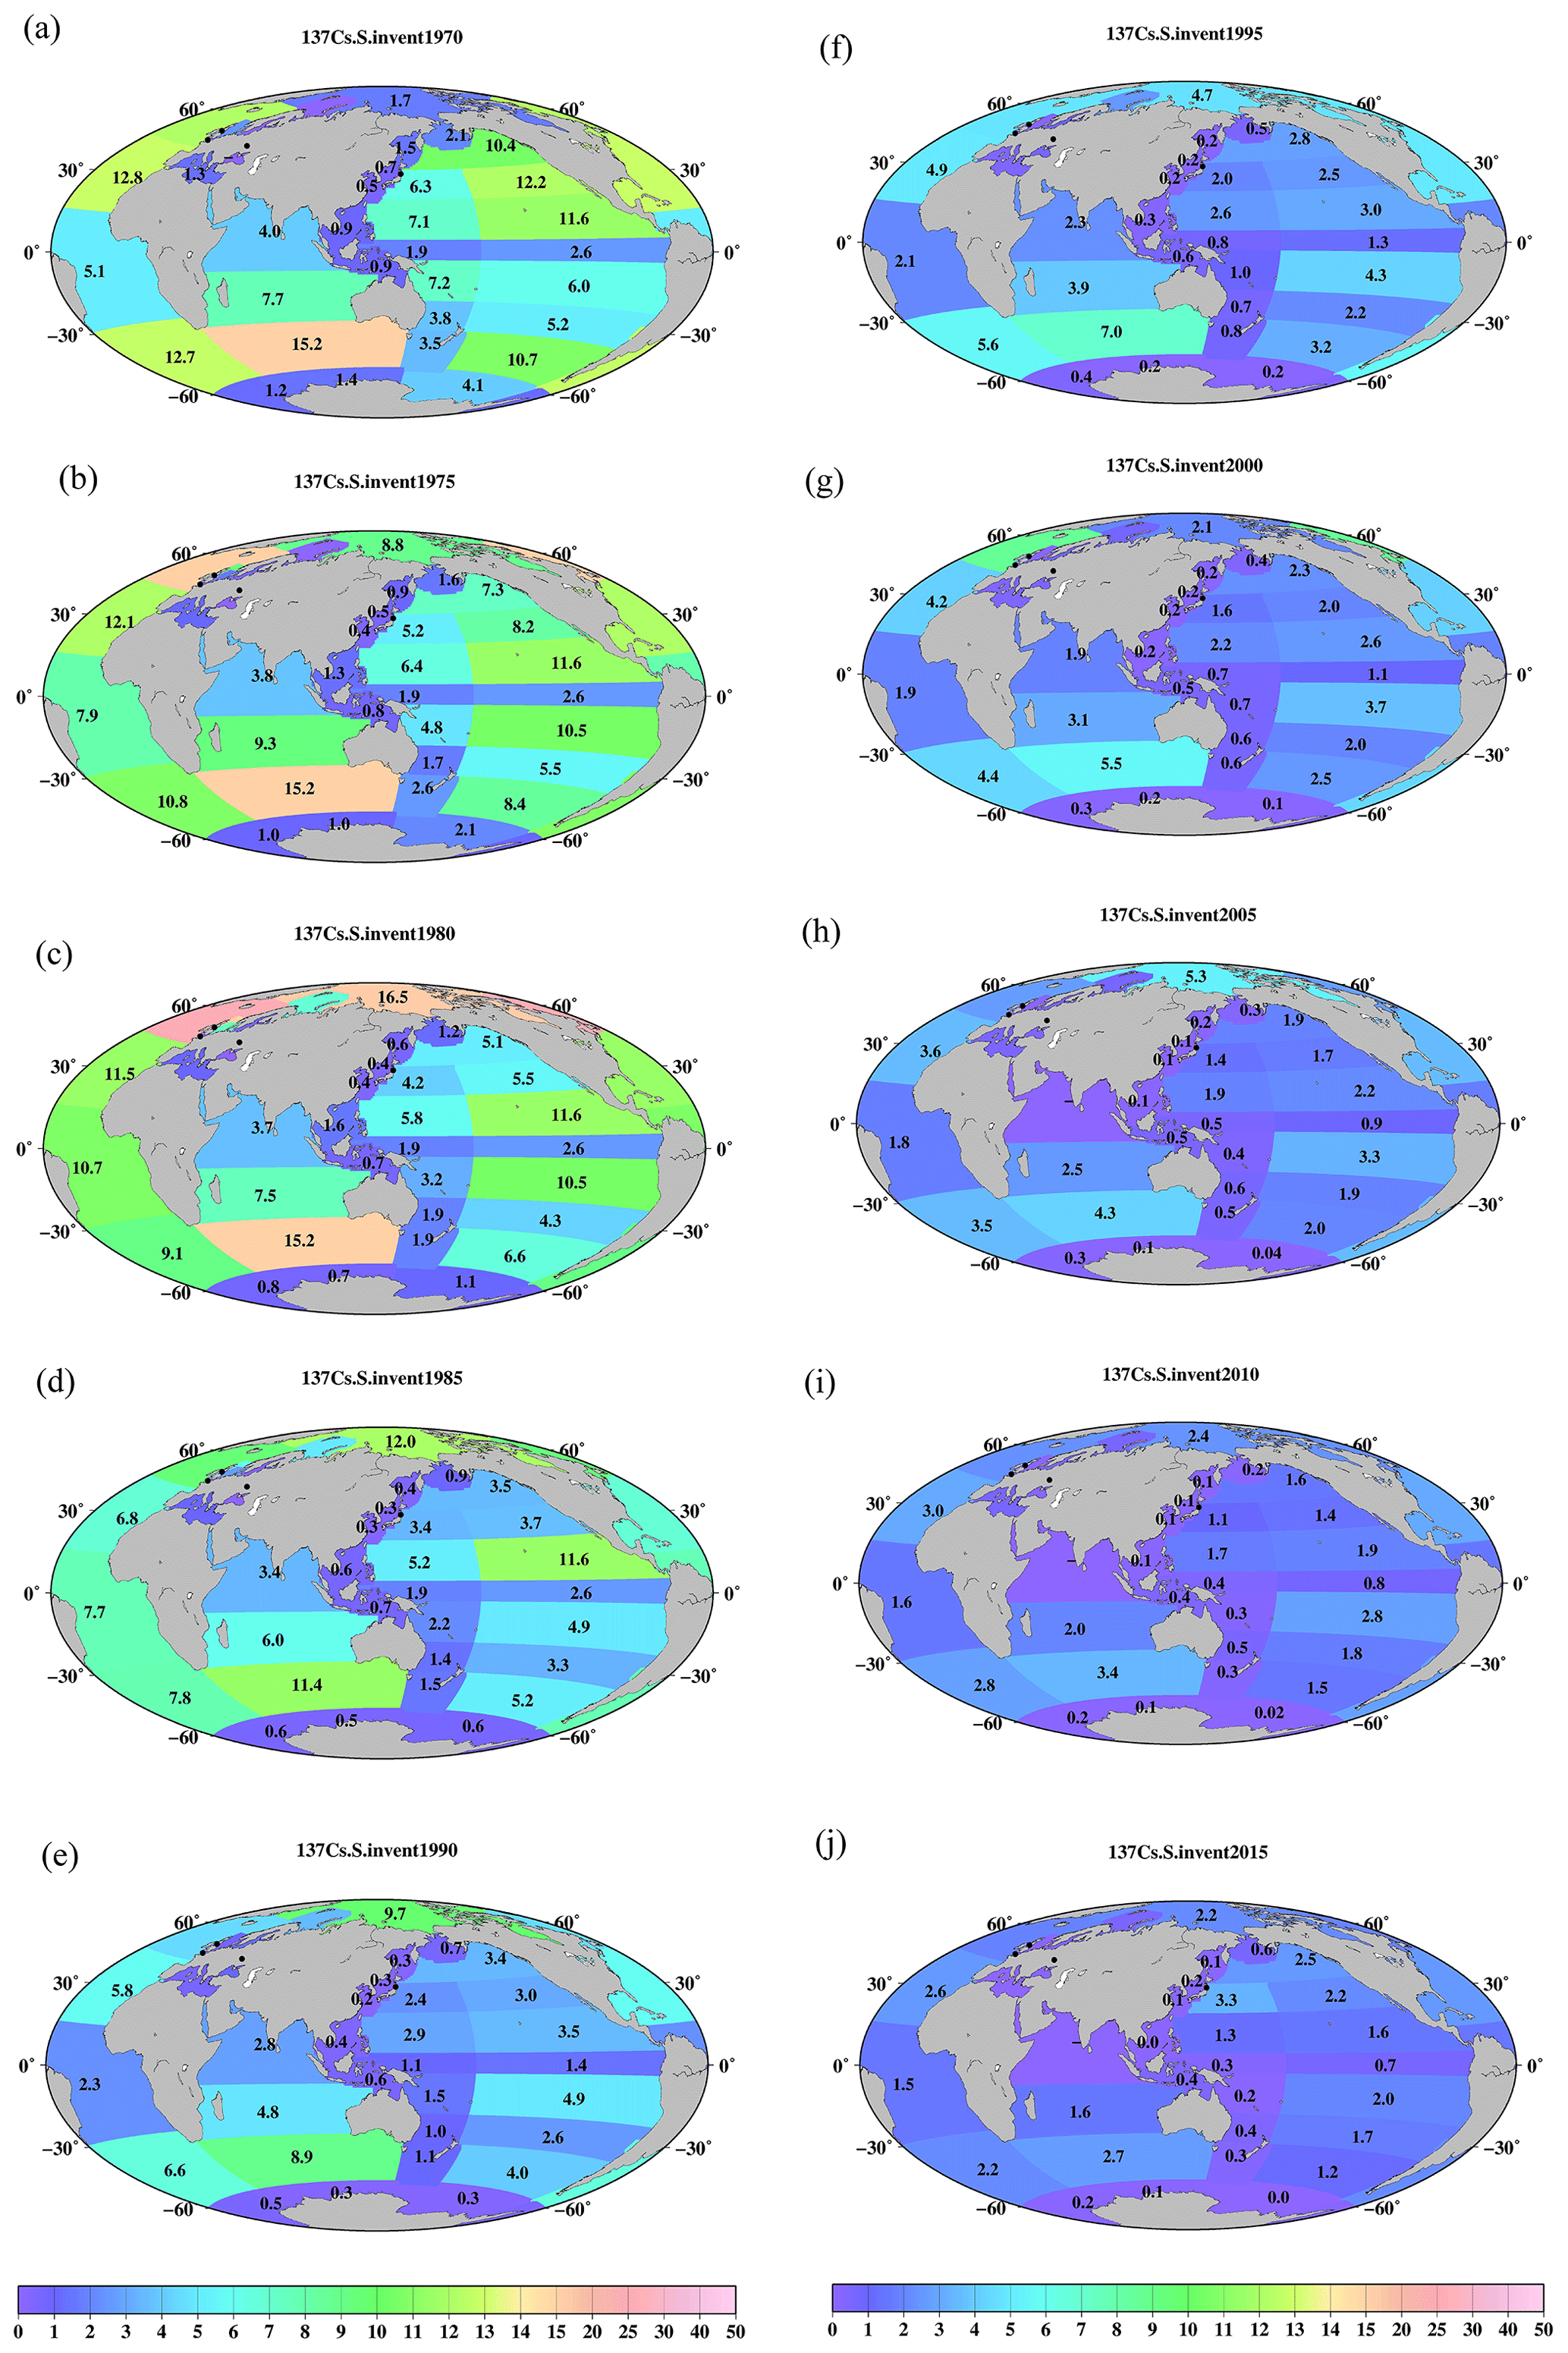
Figure 11Horizontal distributions of the 137Cs inventory in the surface mixed layer in the global ocean (unit is PBq). (a) 1970, (b) 1975, (c) 1980, (d) 1985, (e) 1990, (f) 1995, (g) 2000, (h) 2005, (i) 2010, and (j) 2015. The symbol “–” means that there are no available data.
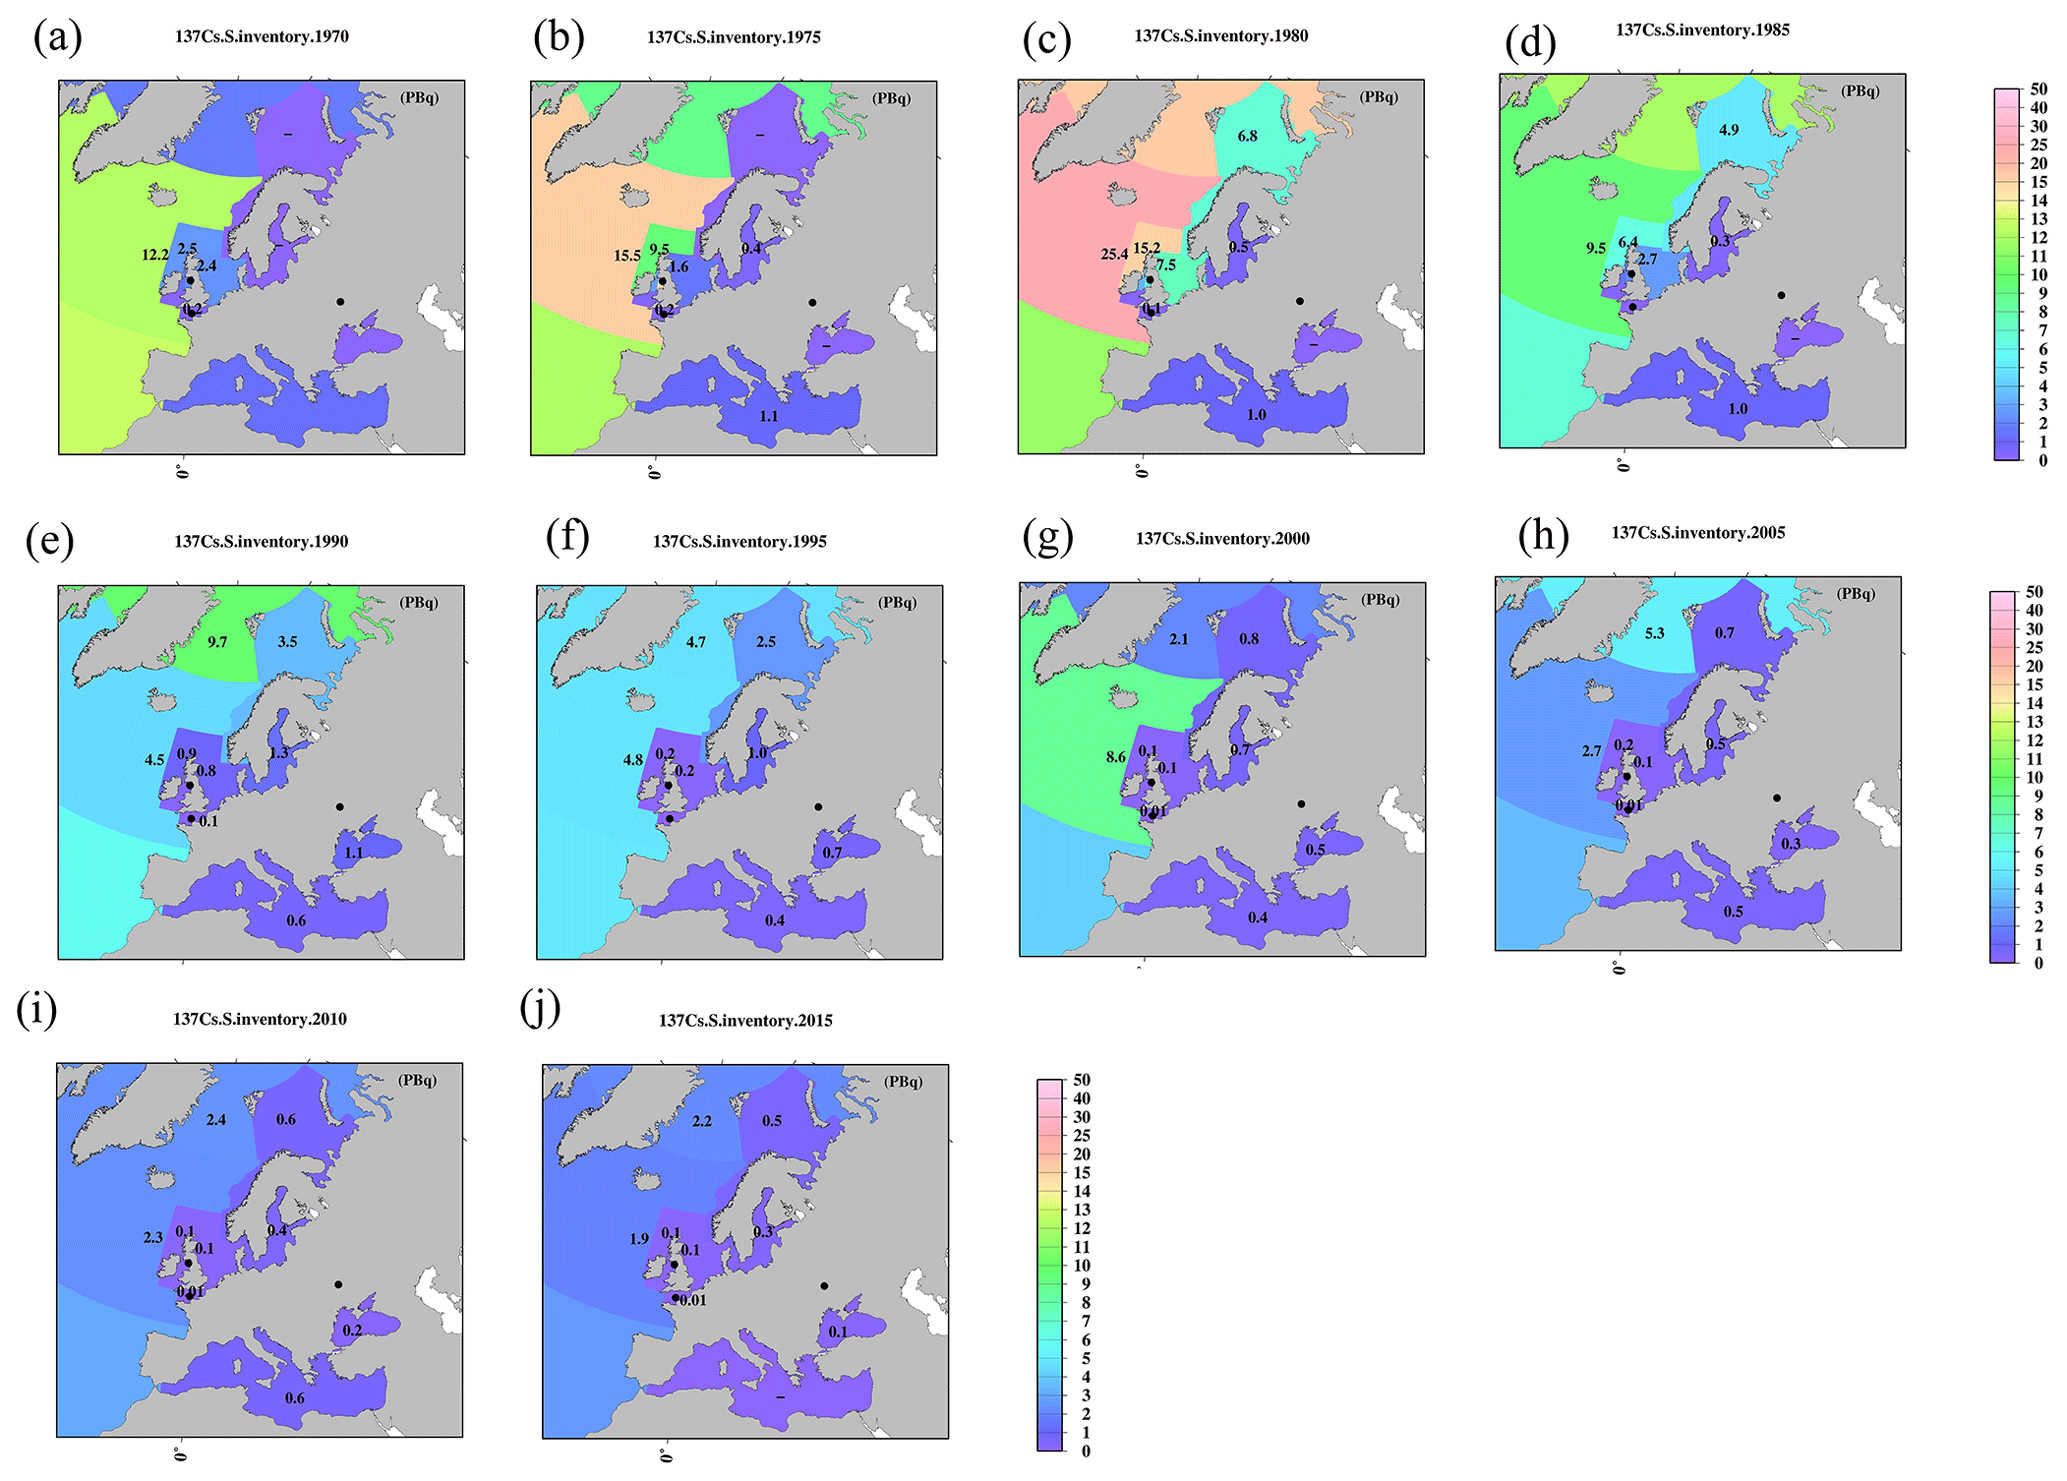
Figure 12Horizontal distributions of 137Cs inventory in the surface mixed layer in the northern North Pacific Ocean and its marginal seas (unit is PBq). (a) 1970, (b) 1975, (c) 1980, (d) 1985, (e) 1990, (f) 1995, (g) 2000, (h) 2005, (i) 2010, and (j) 2015. The symbol “–” means that there are no available data.
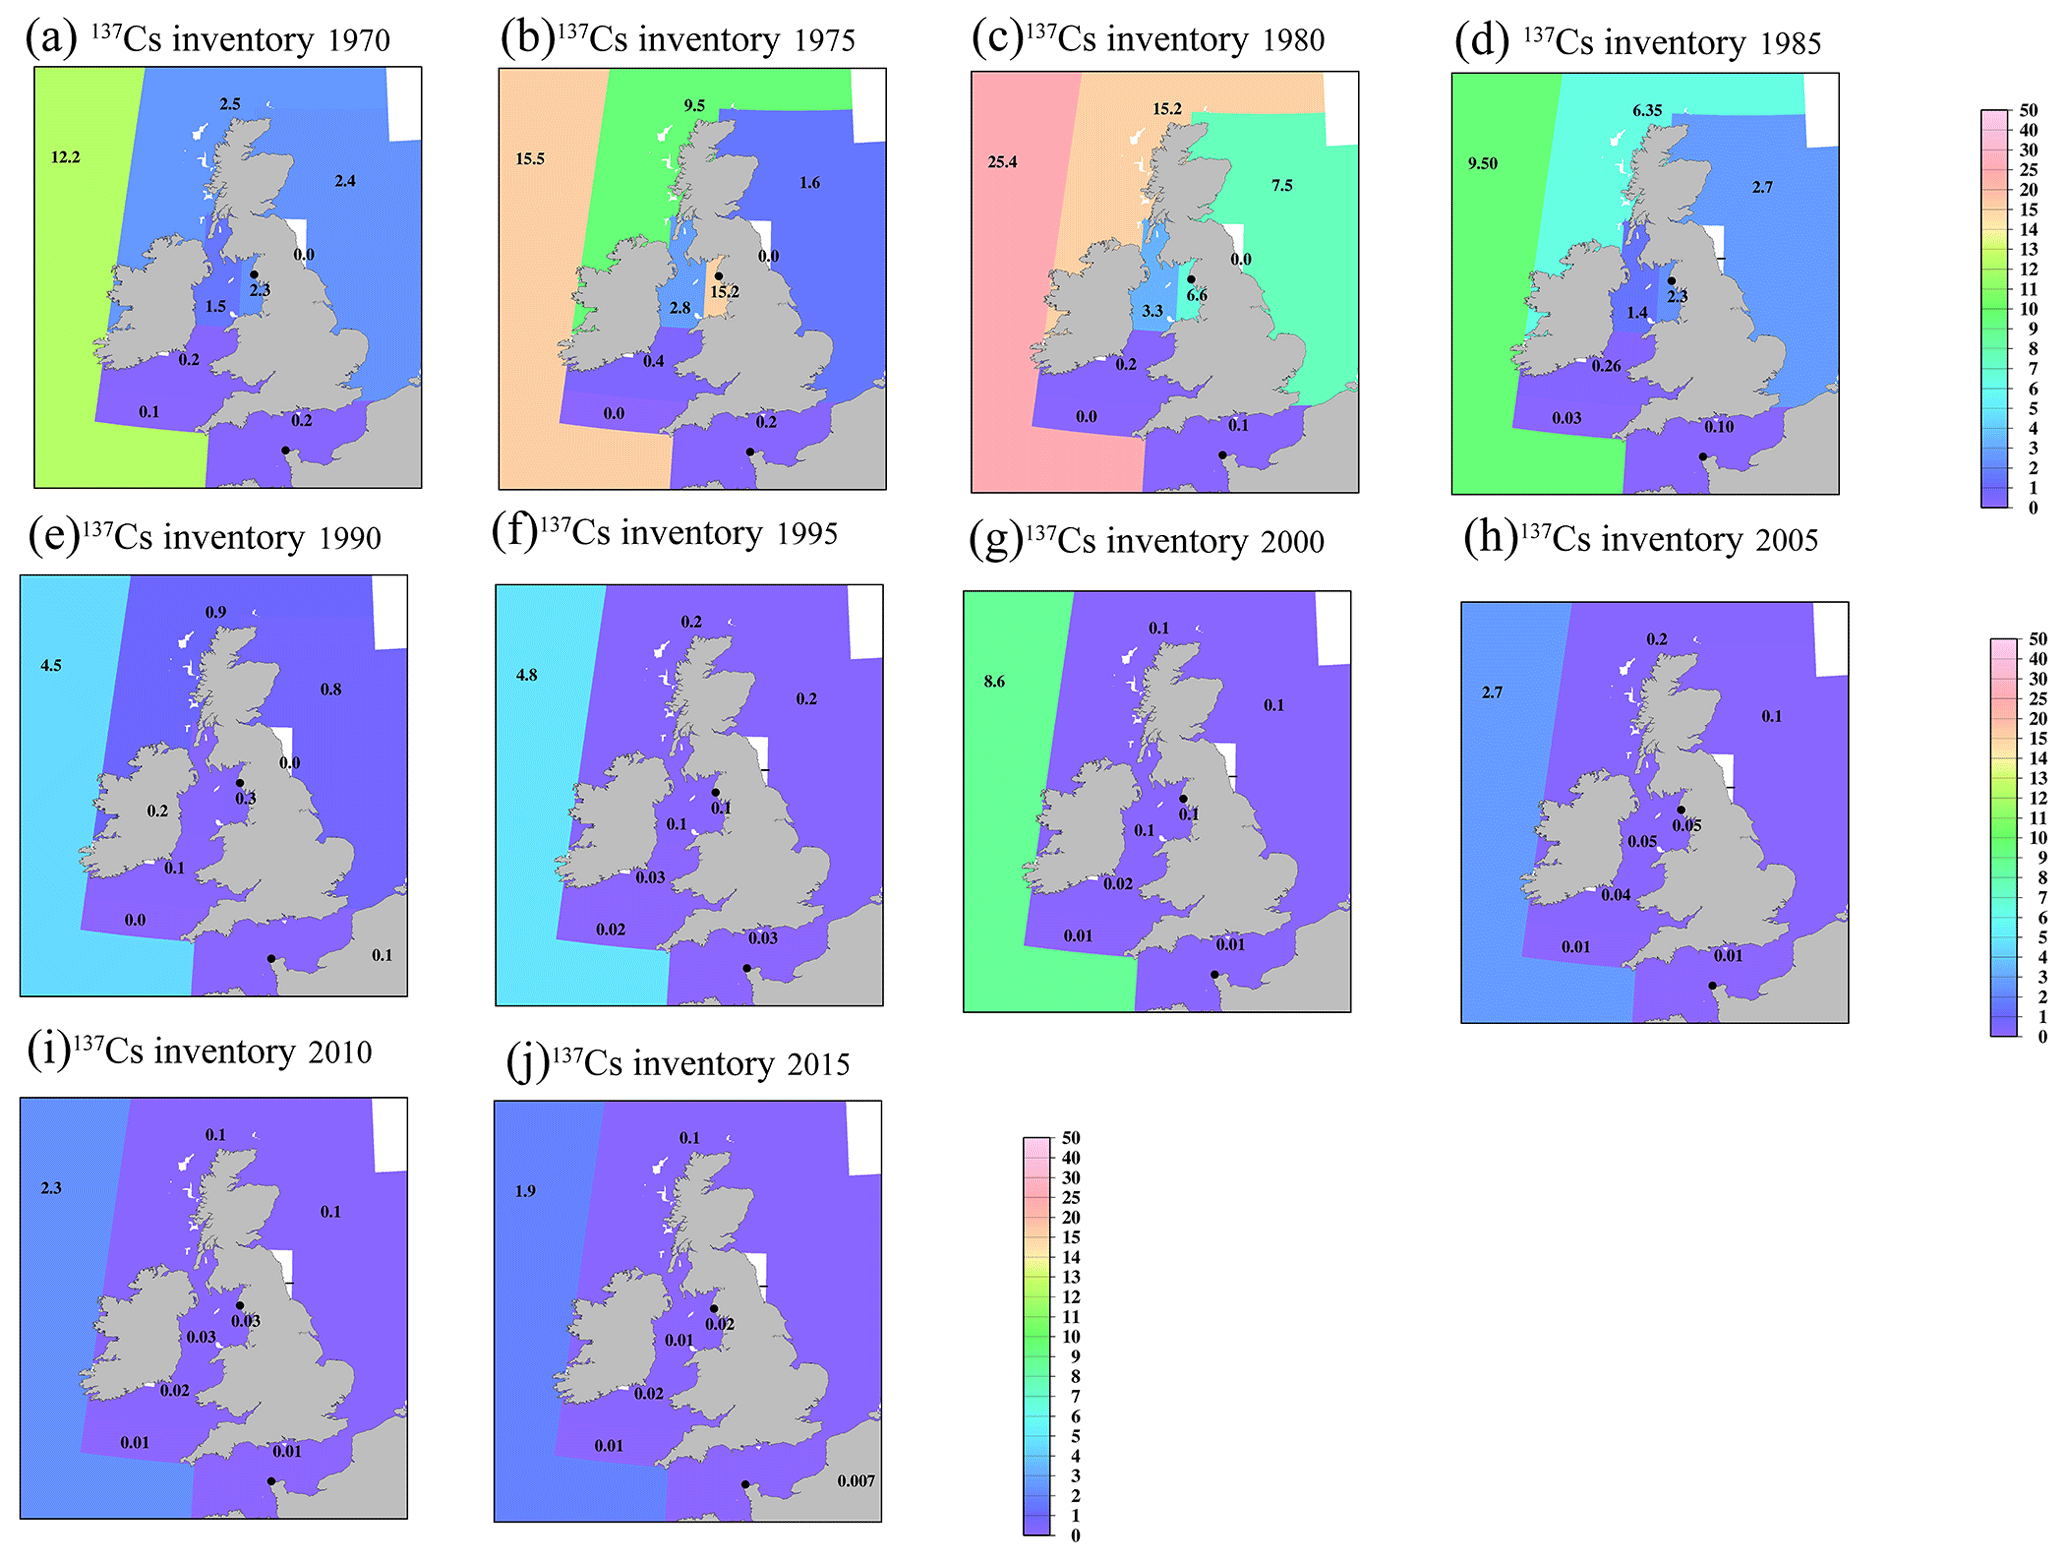
Figure 13Horizontal distributions of the 137Cs inventory in the surface mixed layer in the Irish Sea and English Channel (unit is PBq). (a) 1970, (b) 1975, (c) 1980, (d) 1985, (e) 1990, (f) 1995, (g) 2000, (h) 2005, (i) 2010, and (j) 2015. The symbol “–” means that there are no available data.
By using these mixed-layer depths, the estimated 137Cs inventory in the surface seawater from 1970 to 2015 for every 5 years is shown in Figs. 11–13. The 137Cs inventory in the surface seawater is also listed in Table 5. In the Pacific Ocean, a higher 137Cs inventory exists in the subarctic North Pacific Ocean (10.4 PBq), western and eastern North Pacific Ocean (6.3 and 12.2 PBq), and western and eastern subtropical North Pacific Ocean (7.1 and 11.6 PBq) in 1970 (Fig. 11a). In particular, the 137Cs inventory in the eastern North Pacific Ocean/subtropical eastern North Pacific Ocean is larger than that in the western regions. In the South Pacific Ocean, a higher 137Cs inventory is observed in the western subtropical South Pacific Ocean (7.2 PBq) and eastern Southern Ocean (10.7 PBq) in 1970. After 1975, the 137Cs inventory in the eastern part is larger than that in the western part in the South Pacific Ocean. The 137Cs inventory in the surface seawater in the Southern Hemisphere is the highest in the Pacific Ocean, followed by the Indian Ocean, and it is the lowest in the Atlantic Ocean. In the Indian Ocean, the 137Cs inventory has a latitudinal gradient, which is higher in the Southern Ocean (15.2 PBq) and lower in the Arabian Sea in the year 1970. These latitudinal gradients of the 137Cs inventory in the surface mixed layer continued until 2015.
In the northern North Atlantic Ocean, its marginal seas, and the Arctic Ocean (Figs. 12, 13), the 137Cs inventory is strongly influenced by the discharged 137Cs from fuel reprocessing plants in the Irish Sea and English Channel after 1970, in addition to the global fallout from large-scale weapons tests in the 1960s and 1960s (northern North Atlantic Ocean.2 and Arctic Ocean). In the Irish Sea, the maximum 137Cs inventory occurred in the Irish Sea.1 (15.2 PBq) in 1975. The 137Cs discharged into the Irish Sea.1 was transported into the Irish Sea.2 (3.3 PBq in 1980), followed by transport to the northern North Atlantic Ocean.1 (15.2 PBq in 1980), North Sea (7.5 PBq in 1980), and Barents Sea and coast of Norway (6.8 PBq in 1980). This pattern is also consistent with general pattern of seawater transport in this region (Prandle, 1984; Prandle and Beechey, 1991; Baily du Bois et al., 2020). The 137Cs discharged from La Hague was also transported into the North Sea.
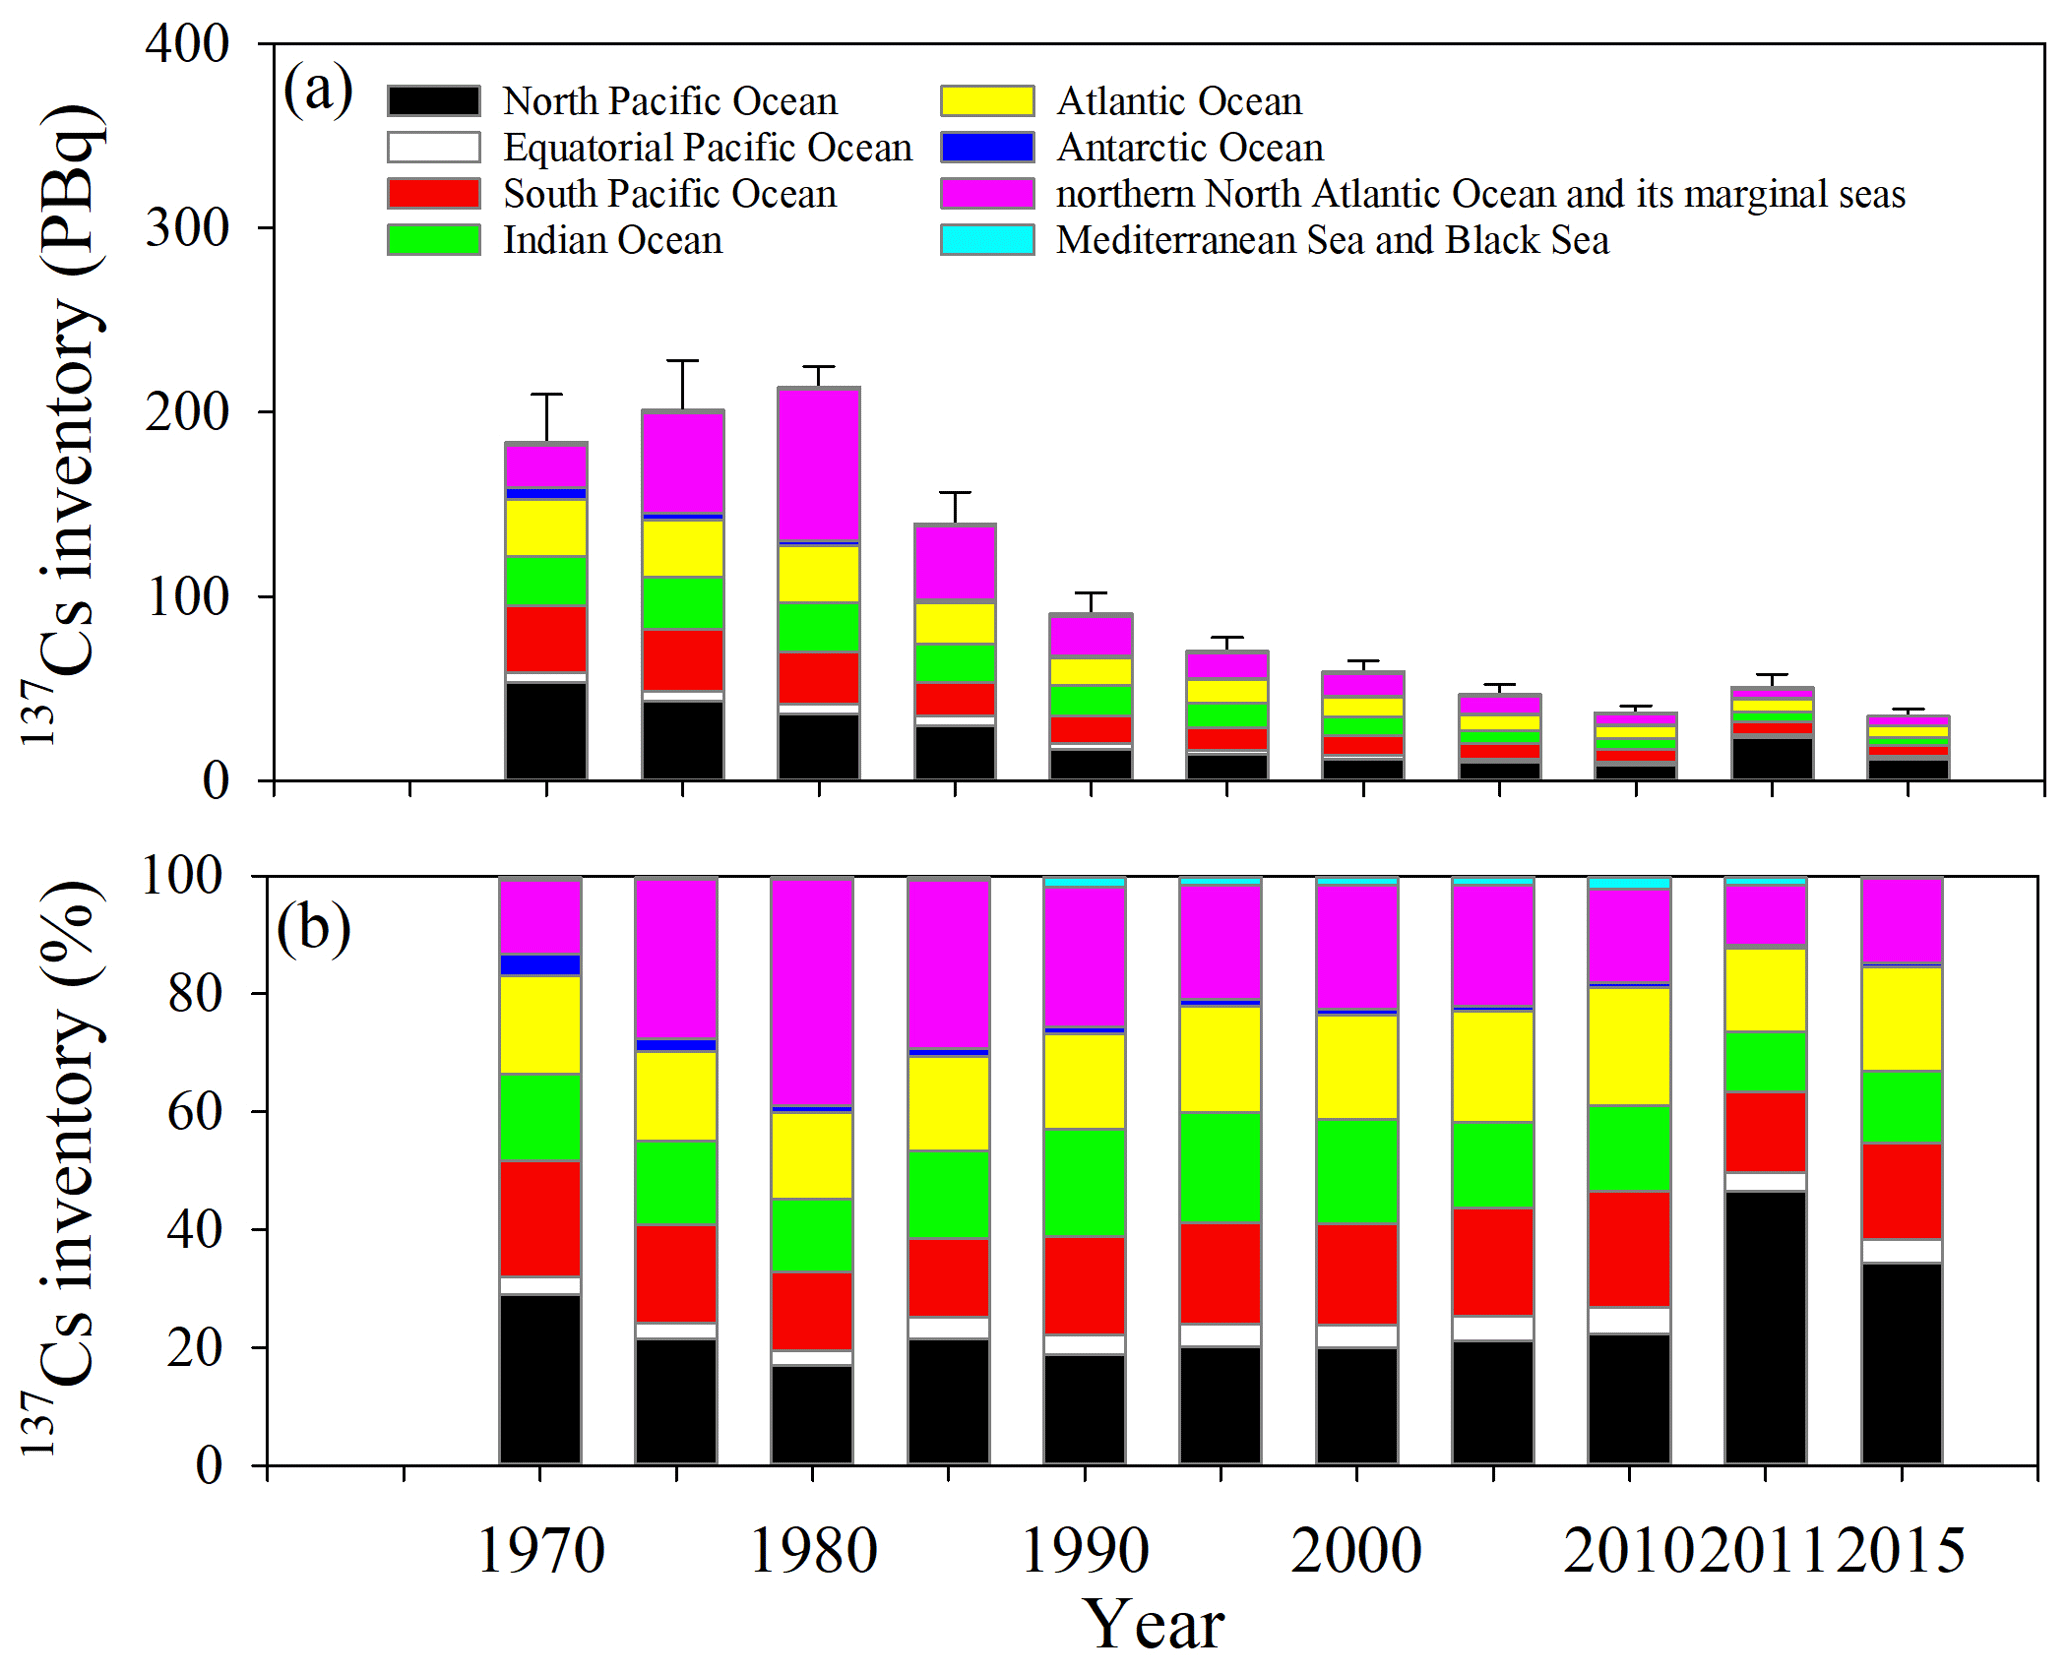
Figure 14Temporal variations in the 137Cs inventory for every 5 years in the global ocean surface seawater.
Figure 14 shows the time variation in 137Cs inventories in the surface mixed layer during 1970–2015. The 137Cs inventory in the surface mixed layer in the global ocean in 1970 was estimated to be 184±26 PBq. This result indicates that 32 % of the deposited 137Cs remained in the surface mixed layer; in other words, 68 % of the deposited 137Cs was transported below the surface mixed layer on a decadal scale in 1970. In 1970, the 137Cs inventory was the largest in the North Pacific Ocean, followed by the North Atlantic Ocean and the marginal sea, Atlantic Ocean, and South Pacific Ocean. The 137Cs inventories increase until 1980, and the inventory is estimated to be 201±27 PBq in 1975 and 214±11 PBq in 1980 due to the discharge of 137Cs from the Sellafield and La Hague reprocessing plants. According to the estimation by OSPAR (2021), approximately 41.4 PBq (32 PBq until 1980; Aarkrog, 2003) and 1.04 PBq (0.70 PBq until 1980; Aarkrog, 2003) of 137Cs were discharged from the Sellafield and La Hague plants from 1970 to 1998, respectively. The contribution from the nuclear fuel reprocessing plants and large-scale nuclear weapons tests (39 %) observed in the Arctic Ocean and the northern North Atlantic Ocean and its marginal sea (the Arctic Ocean, Barents Sea and coast of Norway, Baltic Sea, North Sea, northern North Atlantic Ocean, Irish Sea, and the English Channel) resulted in a large 137Cs inventory in 1980. After 1980, the 137Cs inventory decreased gradually and was estimated to be 37.2±3.6 PBq in 2010, immediately before the F1NPS accident. Although the 137Cs inventory decreased over time after 1980 until 2010, immediately before the F1NPS accident, the relative contributions of the 137Cs inventory in the South Pacific Ocean, Indian Ocean, and Atlantic Ocean gradually increased and were estimated to be 20 %, 15 %, and 20 % in 2010, respectively. After the F1NPS accident, the 137Cs inventory increased and was estimated to be 50.7±7.3 PBq.
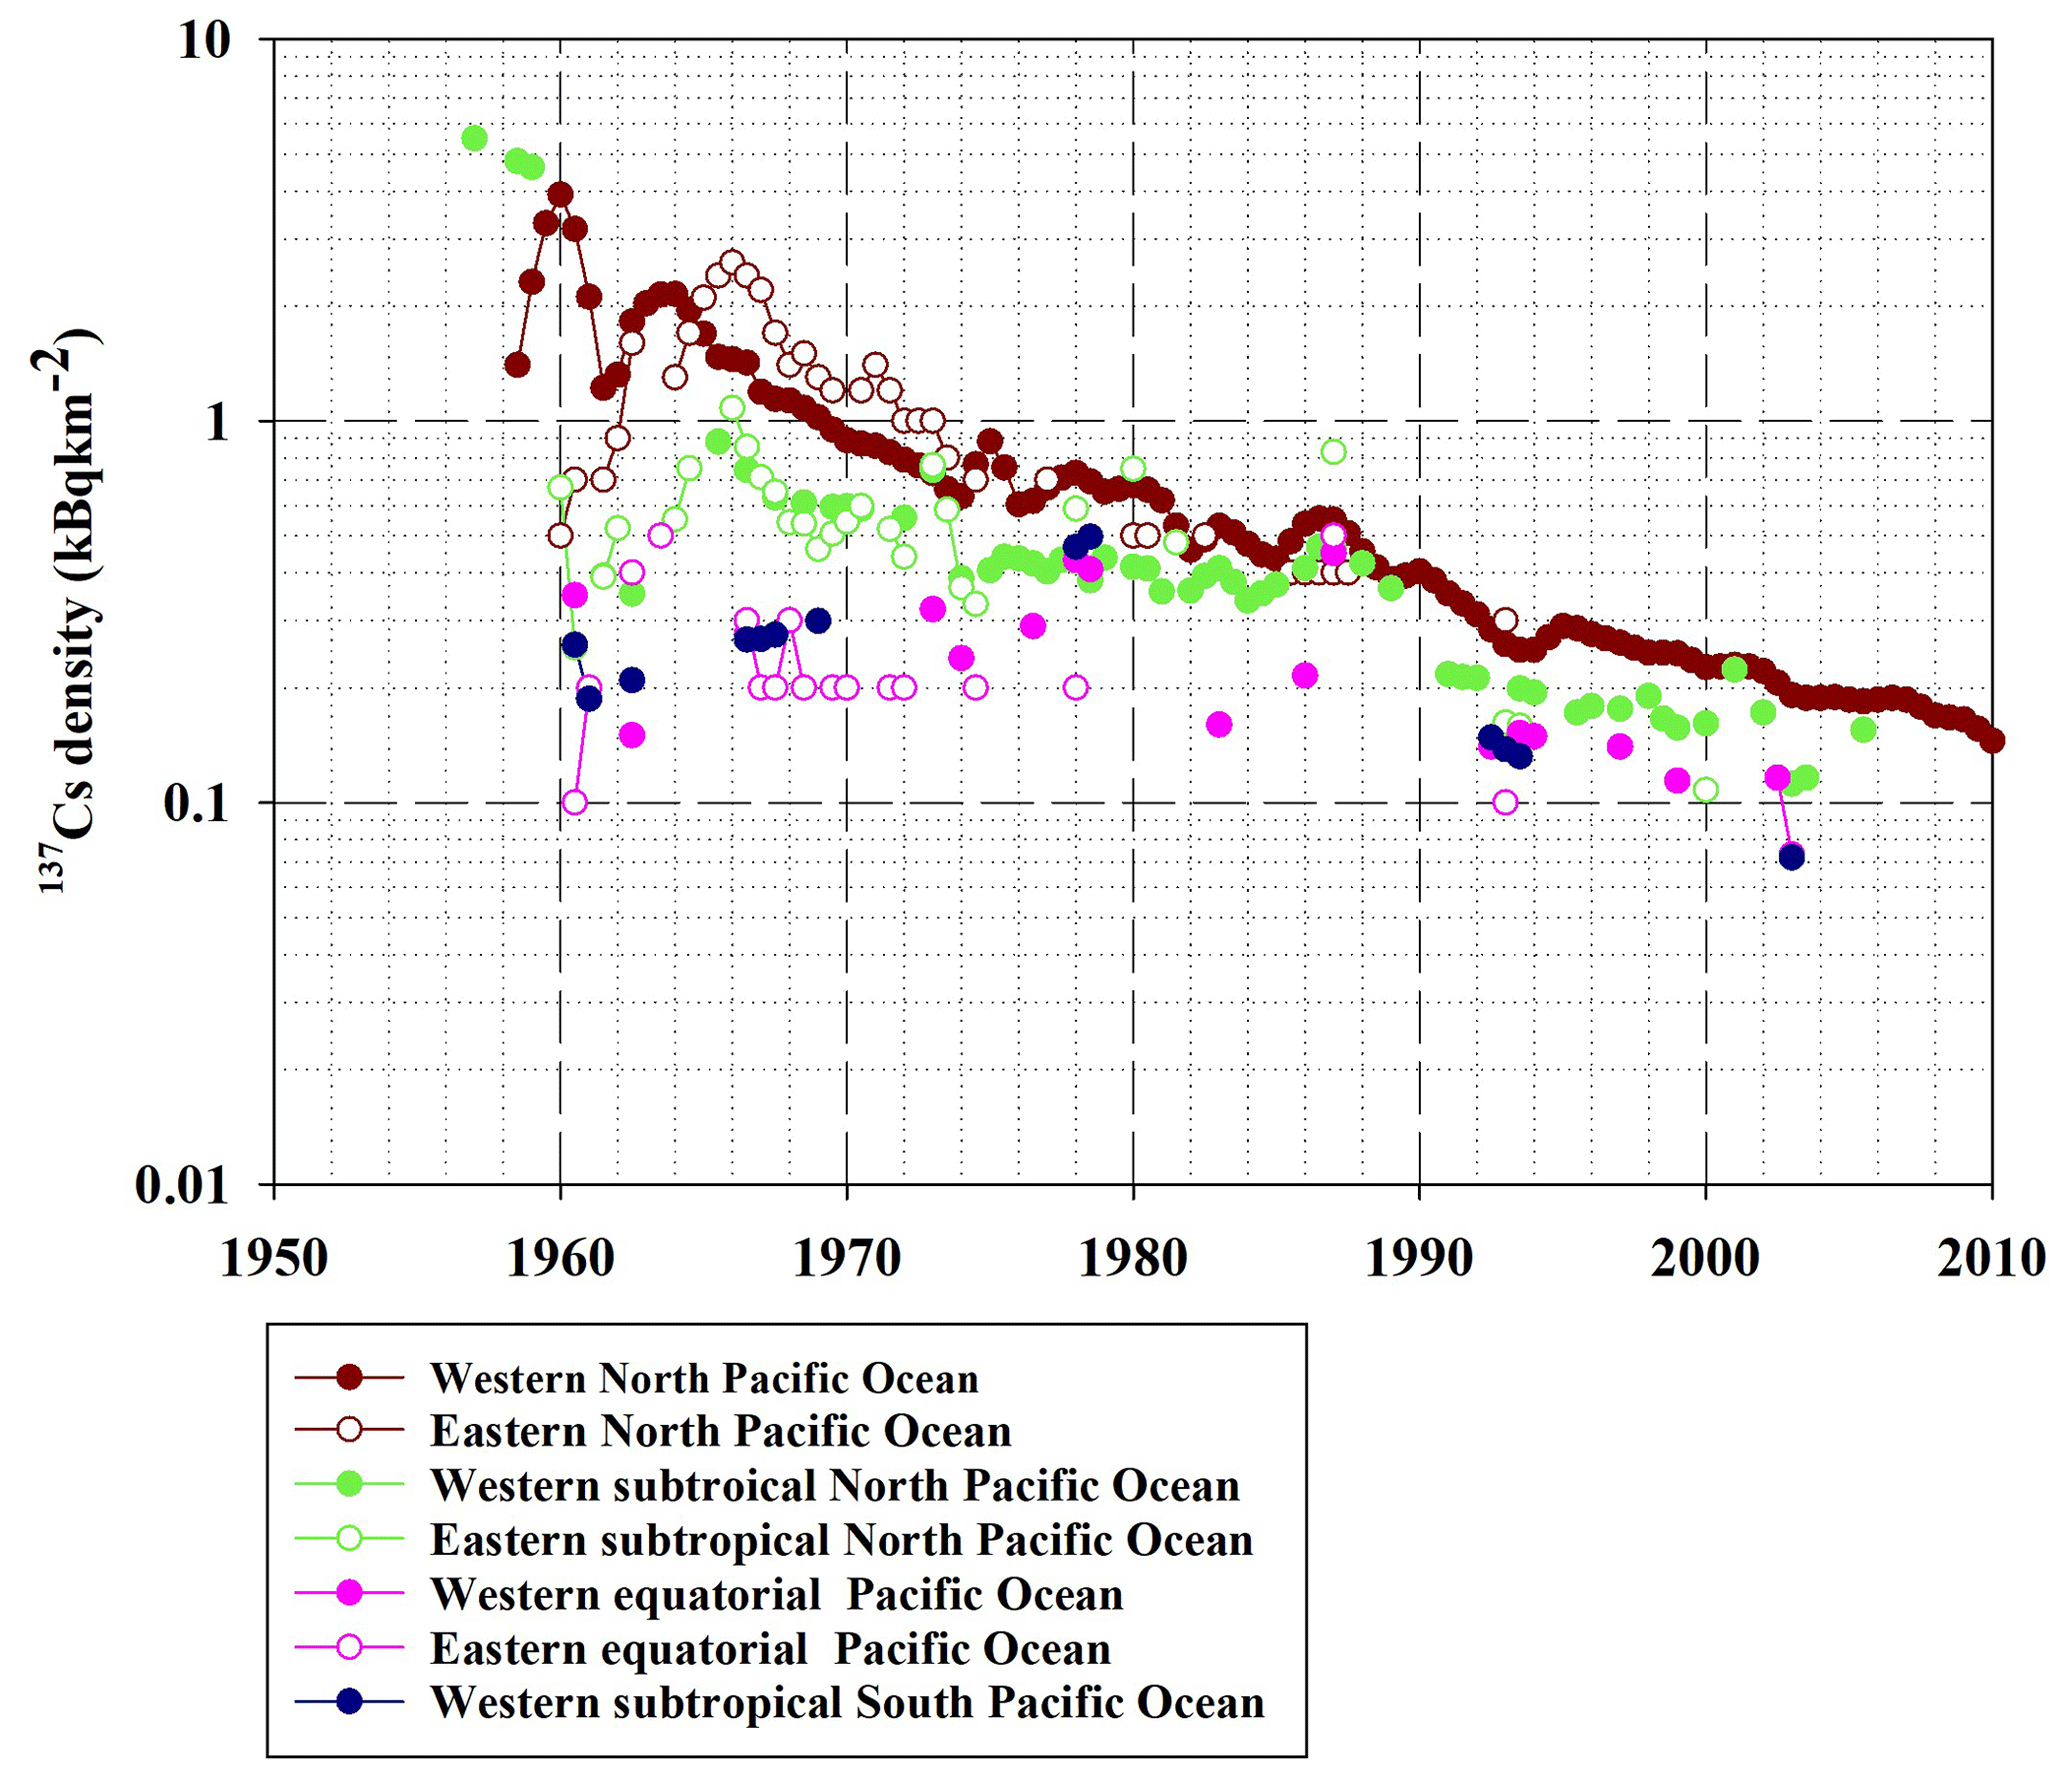
Figure 15137Cs density in the surface mixed layer in the North Pacific Ocean, equatorial Pacific Ocean, and South Pacific Ocean.
4.1 Basin-scale transport of 137Cs in surface seawater in the North Pacific Ocean, its marginal seas, and the equatorial Pacific Ocean
Figure 15 shows the spatiotemporal variations in the 137Cs density in the surface mixed layer in the North Pacific Ocean, subtropical North Pacific Ocean, equatorial Pacific Ocean, and western subtropical South Pacific Ocean. In the western North Pacific Ocean, except for the highest 137Cs density in 1960, the 137Cs density increased until 1964, and then it decreases exponentially. However, in the eastern North Pacific Ocean, the 137Cs density increased until 1966 and then decreased exponentially. The 2-year time lag after reaching the maximum value was caused by horizontal transport from the western North Pacific Ocean that accumulated in the eastern North Pacific Ocean (Inomata et al., 2012). In the subtropical western and eastern North Pacific Ocean and eastern equatorial Pacific Ocean, the 137Cs density was almost constant in the 1970s and 1980s. After the 1990s, the 137Cs density decreased gradually. In the western equatorial Pacific Ocean and western subtropical South Pacific Ocean, the 137Cs density increased gradually until the 1980s and then decreased after the 1990s. As shown in Table 3, Tap2 in the eastern North Pacific Ocean, which is estimated to be 8.8 years, is shorter than that in the western North Pacific Ocean (16.9 years). This suggests that the outflowed 137Cs amount in the eastern North Pacific Ocean was larger than the inflowed 137Cs amount from the western North Pacific Ocean. The Tap2 value in the western subtropical North Pacific Ocean is estimated to be 34.1 years, and Tpo is estimated to be −260.7 years. This mean that the 137Cs accumulated in this region. It was also reported that seawater with higher 137Cs activity concentrations moved southwards, with the subsidence associated with the North Pacific subtropical gyre, followed by a westward transport and subduction in the central and eastern subtropical North Pacific Ocean (Inomata et al., 2012). The increased 137Cs density in the western equatorial Pacific Ocean and the western subtropical South Pacific Ocean, as shown in Fig. 15, would result in a supply of seawater with higher 137Cs activity concentrations.
4.2 Transport of 137Cs from the Pacific Ocean to the Indian Ocean via the Indonesian Sea throughflow
As described in the previous sections, seawater with a relatively large 137Cs density (137Cs activity concentrations) is transported westwards in the equatorial Pacific Ocean and the western subtropical South Pacific Ocean. It is known that the warm seawater in the equatorial Pacific Ocean is transported into the Indian Ocean by the wind-forcing circulation through the Indonesian Archipelago, namely the Indonesian Throughflow (Gordon, 2005; Feng et al., 2018). According to reports, the median volume of seawater in the Indonesian Throughflow was estimated to be 15 Sv (1 Sv = 106 m3 s−1; e.g., Gordon et al., 2010; Feng et al., 2018). The Indonesian Throughflow consists of seawater derived from the North Pacific Ocean, South Pacific Ocean, and Antarctic Ocean. Approximately 9 Sv of seawater is transported to the Indian Ocean (Gordon, 2005). The transport of seawater from the Pacific Ocean into the Indian Ocean is revealed by the higher tritium concentrations in the seawater transported from the North Pacific Ocean through the Makassar Strait with the Mindanao Current, whereas seawater with lower tritium concentrations is transported into the Indian Ocean from the South Pacific Ocean via the Halmahera Sea (Fin et al., 1994). This suggests that most of the 137Cs in the surface seawater inflows into the Indian Ocean from the North Pacific Ocean. Furthermore, the South Indian Ocean is connected to the Atlantic Ocean around the Cape of Good Hope via the Agulhas Current (Sanchez-Cabeza et al., 2011), with an median seawater mass transport of 8.7 Sv, according to Stramma and England (1999). Although we used the median box value in this discussion, the signatures of 137Cs inflow from the North Pacific Ocean to the Indian Ocean via the Indonesian Archipelago were recognized by measurements. Evidently, higher concentrations were found at approximately 100∘ E in the subsurface layer, whereas lower concentrations were observed at approximately 70∘ E in the surface seawater (Povinec et al., 2011). In addition, 137Cs in the Indian Ocean is transported westwards at approximately 10–15∘ S latitude (Sanchez-Cabeza et al., 2011; Povinec et al., 2011).
In this section, we discuss the 137Cs inflow from the Pacific Ocean to the Indian Ocean, followed by the Atlantic Ocean. In the Indonesian Archipelago, the 0.5-year median value of 137Cs in 2010 was 2.7 Bq m−3 (Table 2; Fig. 7). This value is higher than those in the surrounding sea area, such as in the East China Sea (1.7 Bq m−3), western North Pacific Ocean (1.5 Bq m−3), western subtropical North Pacific Ocean (1.7 Bqm−3), and western equatorial Pacific Ocean (1.2 Bq m−3). The 0.5-year median value in the Indonesian Archipelago in 2010 decreased to approximately 53 % compared to that in 1970. These decreasing rates are smaller than those in the surrounding sea area (78 %–93 %).

Figure 16137Cs density in the Indonesian Archipelago and surrounding sea in the surface mixed layer.
Table 6137Cs density in each box in the global ocean.
NA means that there are no available data. ∗ Estimated value based on the extrapolation of the trend line.
Figure 16 shows the spatiotemporal variations in the 137Cs density in the regions related to the Indonesian Throughflow (the South China Sea, Indonesian Archipelago, western subtropical South Pacific Ocean, Arabian Sea, and Indian Ocean). The 137Cs density in each box in the global surface seawater is also listed in Table 6. The 137Cs density in the western subtropical South Pacific Ocean was almost the same as in the Indonesian Archipelago. This result suggests that the 137Cs derived from large-scale weapons tests in the western North Pacific Ocean flowed into the Indian Ocean by basin-scale transport. The 137Cs densities in the Indian Ocean (the Arabian Sea, Indian Ocean, and Southern Ocean) were almost similar to or higher than those in the Indonesian Archipelago. Furthermore, the 137Cs density in these regions decreased after the 1990s. The Tap in the Indonesian Archipelago was estimated to be 36.7 years, and Tpo was estimated to be −169.2 years. It is likely that the main plume of the 137Cs derived from the large-scale weapons tests is transported into the Indian Ocean, with a timescale of 20–30 years.
Furthermore, several studies have found that 137Cs was transported into the South Atlantic Ocean via the Agulhas Current and then transported northwards with the Benguela Current (Sanchez-Cabeza et al., 2011; Stramma and England, 1999). The transit times from the Pacific Ocean to the Atlantic Ocean via the Indian Ocean were estimated over 4 decades via model simulations (Tsumune et al., 2011). In this study, a slight increase in the 137Cs median values in the central Atlantic Ocean and South Atlantic Ocean was detected in 2003, as shown in Fig. 2g. Furthermore, Tap3 values in the South and central Atlantic Ocean (38 and 15.4 years) are longer than those in the surrounding boxes. The difference in the 137Cs concentrations in the central and South Atlantic Ocean, compared with the Pacific Ocean and Indian Ocean, become small after the 1990s, as shown in Fig. 3. These results support the interpretation that the 137Cs deposited into the western North Pacific Ocean is transported into the equatorial Pacific Ocean, Indian Ocean, and Atlantic Ocean on an approximately 3–4 decadal scale.

Figure 17Temporal variations in the 0.5-year median values of surface 137Cs in the northern/equatorial Pacific Ocean and its marginal seas after 2011. (a) Western and eastern North Pacific Ocean. (b) Sea of Japan and East China Sea.
4.3 Recirculation of F1NPS 137Cs associated with basin-scale transport in the North Pacific Ocean and its marginal sea
In this section, we focus on the temporal variations in the 137Cs activity concentrations in the North Pacific Ocean and its marginal seas after 2011 to investigate the transport of 137Cs from the F1NPS accident. Figure 17a shows the 0.5-year 137Cs median values in the western and eastern North Pacific Ocean after 2011. These boxes were selected as typical cases because the main plume of F1NPS-137Cs is transported in these region and exists in many measurements. As described above, the 0.5-year median values of 137Cs decreased exponentially before the F1NPS accident. However, significantly high 0.5-year median 137Cs values were measured in the western North Pacific Ocean (8–59 Bq m−3), which is the major atmospheric fallout region (30–50∘ N, western North Pacific Ocean), and the eastern North Pacific Ocean (2.4–7.6 Bq m−3) in 2011/2012. Increases in 137Cs in the subarctic North Pacific Ocean (15–28 Bq m−3) and Bering Sea (4.2 Bq m−3) were also observed in 2011/2012, although the data are not shown due to the limited sample measurements. Slightly higher values were also observed in the Sea of Okhotsk (2.3 Bq m−3; not shown in this figure) and the Sea of Japan (1.6–1.9 Bq m−3). These were caused by the atmospheric deposition of 137Cs derived from the F1NPS accident.
After 2013, in the western North Pacific Ocean, the 0.5-year median 137Cs values decreased exponentially with seasonal variation, which was higher in summer and lower in winter. In the eastern North Pacific Ocean, the 0.5-year median 137Cs values increased after 2014 and reached a maximum in 2018. It is clear that the 0.5-year median 137Cs values in the eastern North Pacific Ocean were higher than those in the western region in 2018/2019. With the optimal interpretation analysis in Inomata et al. (2016), the main plume of F1NPS-137Cs exists in the center of the North Pacific Ocean (longitude range of 165∘ E–170∘ W and latitude range of 30–50∘ N), which corresponds to the subarctic, western, and eastern North Pacific Ocean boxes in this study in 2012. The zonal transport median speed of F1NPS-137Cs was estimated to be approximately 8 cm s−1 from March 2011 to March 2012 (Aoyama et al., 2013). The arrival of the F1NPS-derived radio caesium was detected in June 2013 in the Canadian continental shelf, and these detections continued until February 2014 (Smith et al., 2017). The 137Cs activity concentrations reached 2 Bq m−3, which is 2 times larger than those in the nuclear-weapons-derived 137Cs.
A slight increase in the 0.5-year median value of 137Cs also occurred in the East China Sea and Sea of Japan after 2013 and reached maximum values in 2015/2016 (Fig. 17b). The 137Cs activity concentrations in the East China Sea and Sea of Japan increased, following the processes elucidated in our previous studies (Inomata et al., 2018). The increase in 137Cs activity concentrations was first observed in the subsurface layer in 2012/2013 around southern Japan in the western North Pacific Ocean. Based on the potential temperature density (σθ), the 137Cs peak existed in the subtropical mode water. In the East China Sea, the increase in the 137Cs activity concentrations also started in subsurface seawater (140 m) in 2013, and 137Cs activity in the surface mixed layer (0–50 m) in the East China Sea reached a maximum in 2014/2015 (Inomata et al., 2018). Increased 137Cs in the East China Sea is caused by the following processes. The 137Cs entrained into the subtropical-mode water is transported westwards in the subsurface seawater and has upwells along the continental shelf in the East China Sea and the Kuroshio Counter Current around the meandering Kuroshio (Ito et al., 1994). Furthermore, the 134Cs/137Cs ratios in subtropical mode water were almost the same as those in seawater in the East China Sea and Sea of Japan (Aoyama et al., 2017; Inomata et al., 2018). Then, the F1NPS-derived 137Cs flowed into the Sea of Japan via the Tsushima Strait by the Tsushima Warm Current and reached a maximum in 2015/2016. The propagation of F1NPS-derived 137Cs from the East China Sea to the Sea of Japan occurred over 1–2 years.
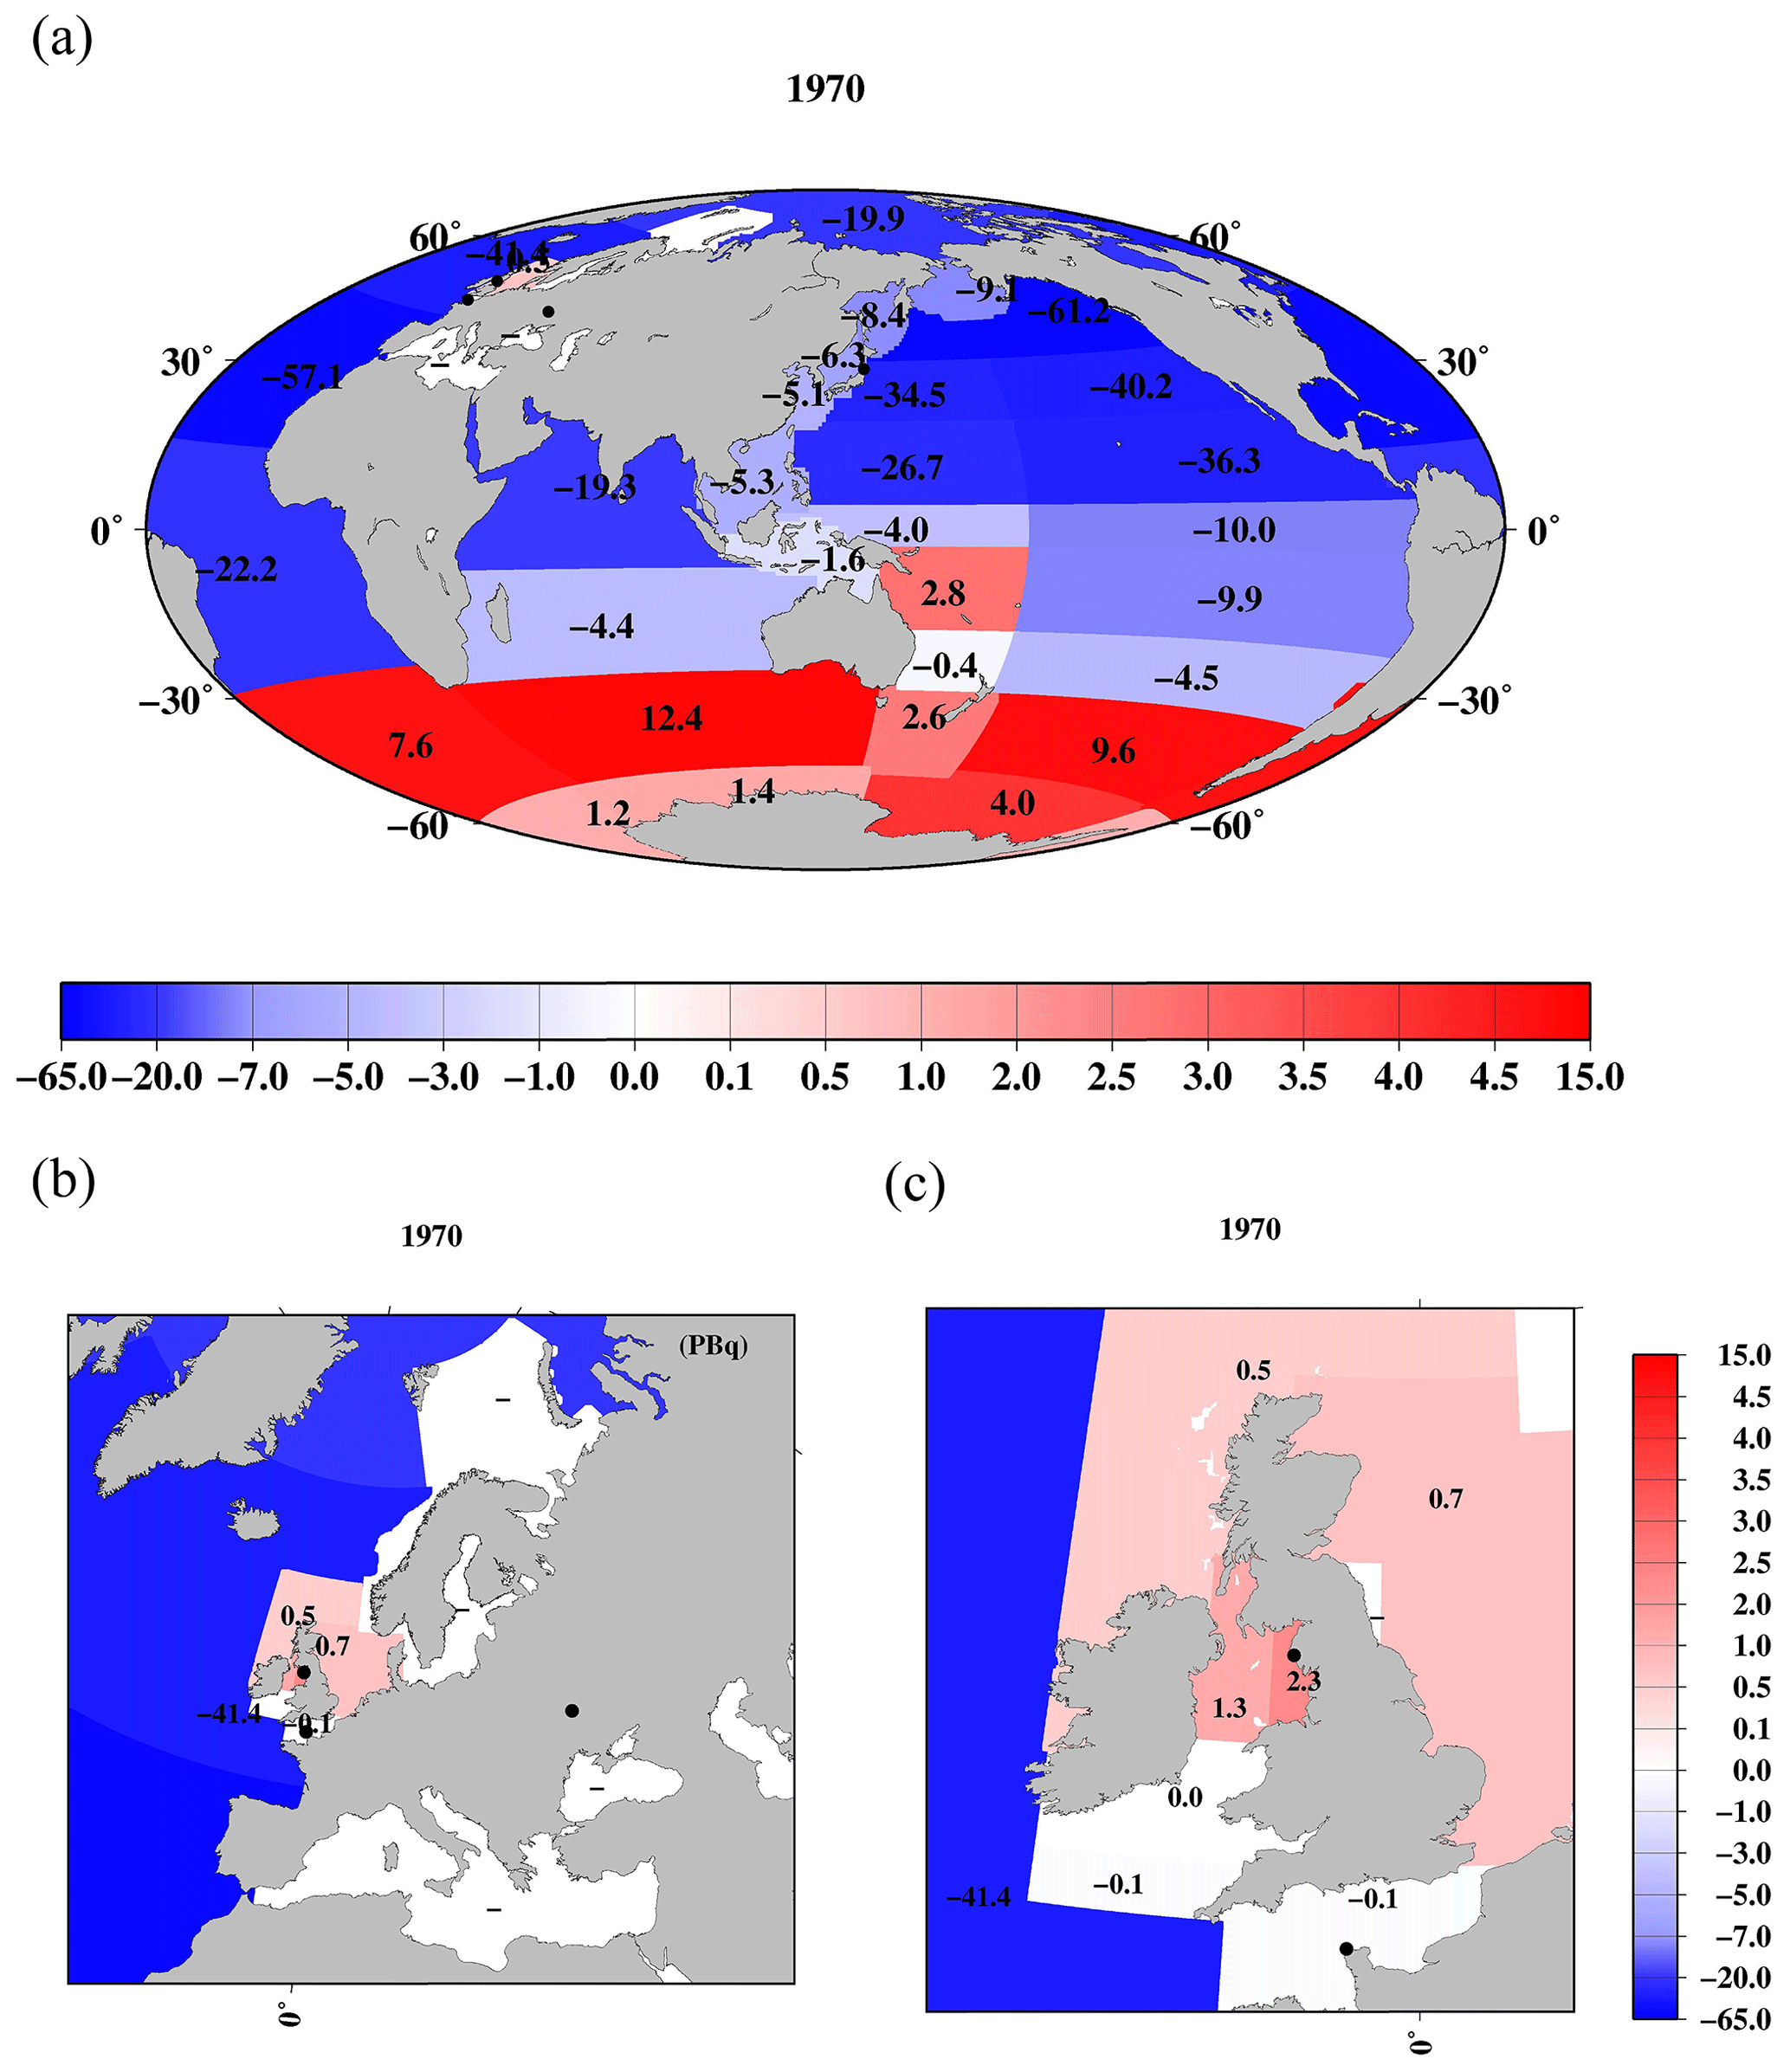
Figure 18The horizontal distribution of the 137Cs net in- or outflow amount in each box against the deposition amount in 1970, based on the 0.5-year 137Cs activity concentration data. The amount of 137Cs net outflow includes the downward transport portion below the surface mixed layer and the horizontal transport in the surface mixed layer to the downstream boxes. A positive value (red) indicates the net inflow amount, and negative values (blue) indicate the net outflow amount. (a) Global ocean, (b) northern North Pacific Ocean and its marginal seas, and (c) Irish Sea and English Channel (unit is PBq).
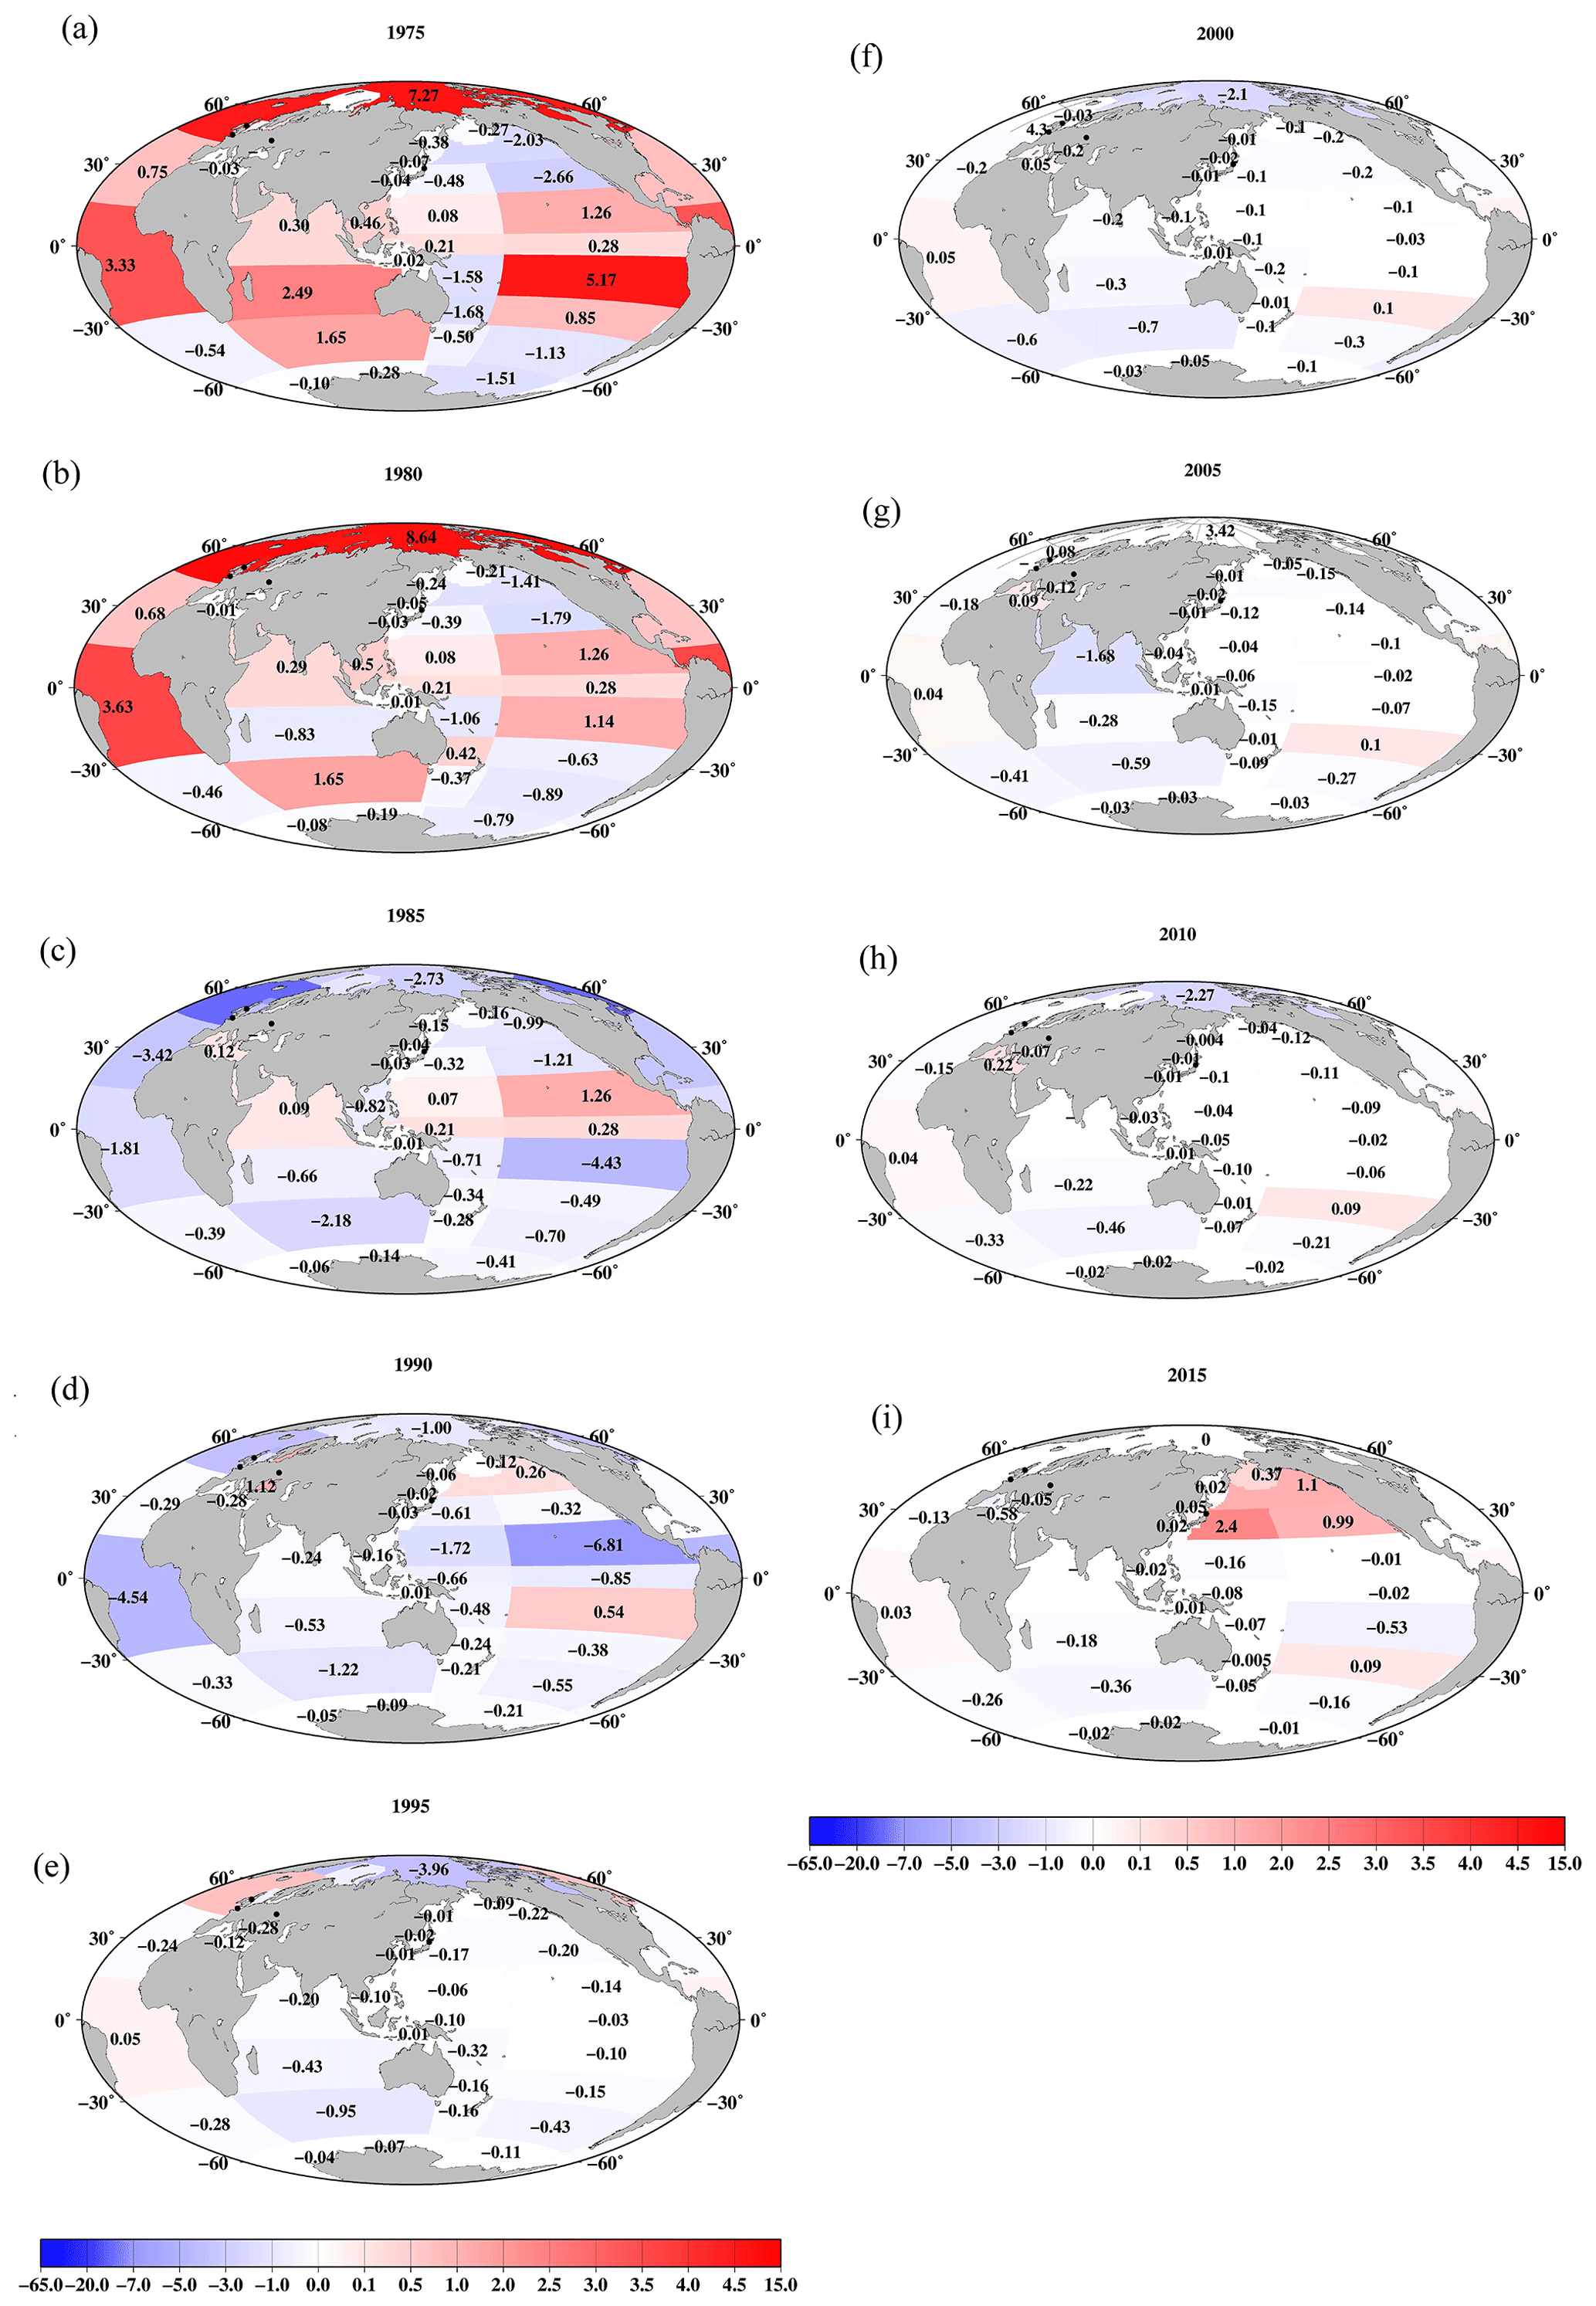
Figure 19Mass balance of 137Cs in the surface seawater in each box in the global ocean. A positive value (red) indicates net inflowed 137Cs from the upstream boxes, and a negative value (blue) indicates the net outflow 137Cs to the downstream boxes or below the surface mixed layer compared to the previous 5 years (unit is PBq). (a) 1975, (b) 1980, (c) 1985, (d) 1990, (e) 1995, (f) 2000, (g) 2005, (h) 2010, and (i) 2015.
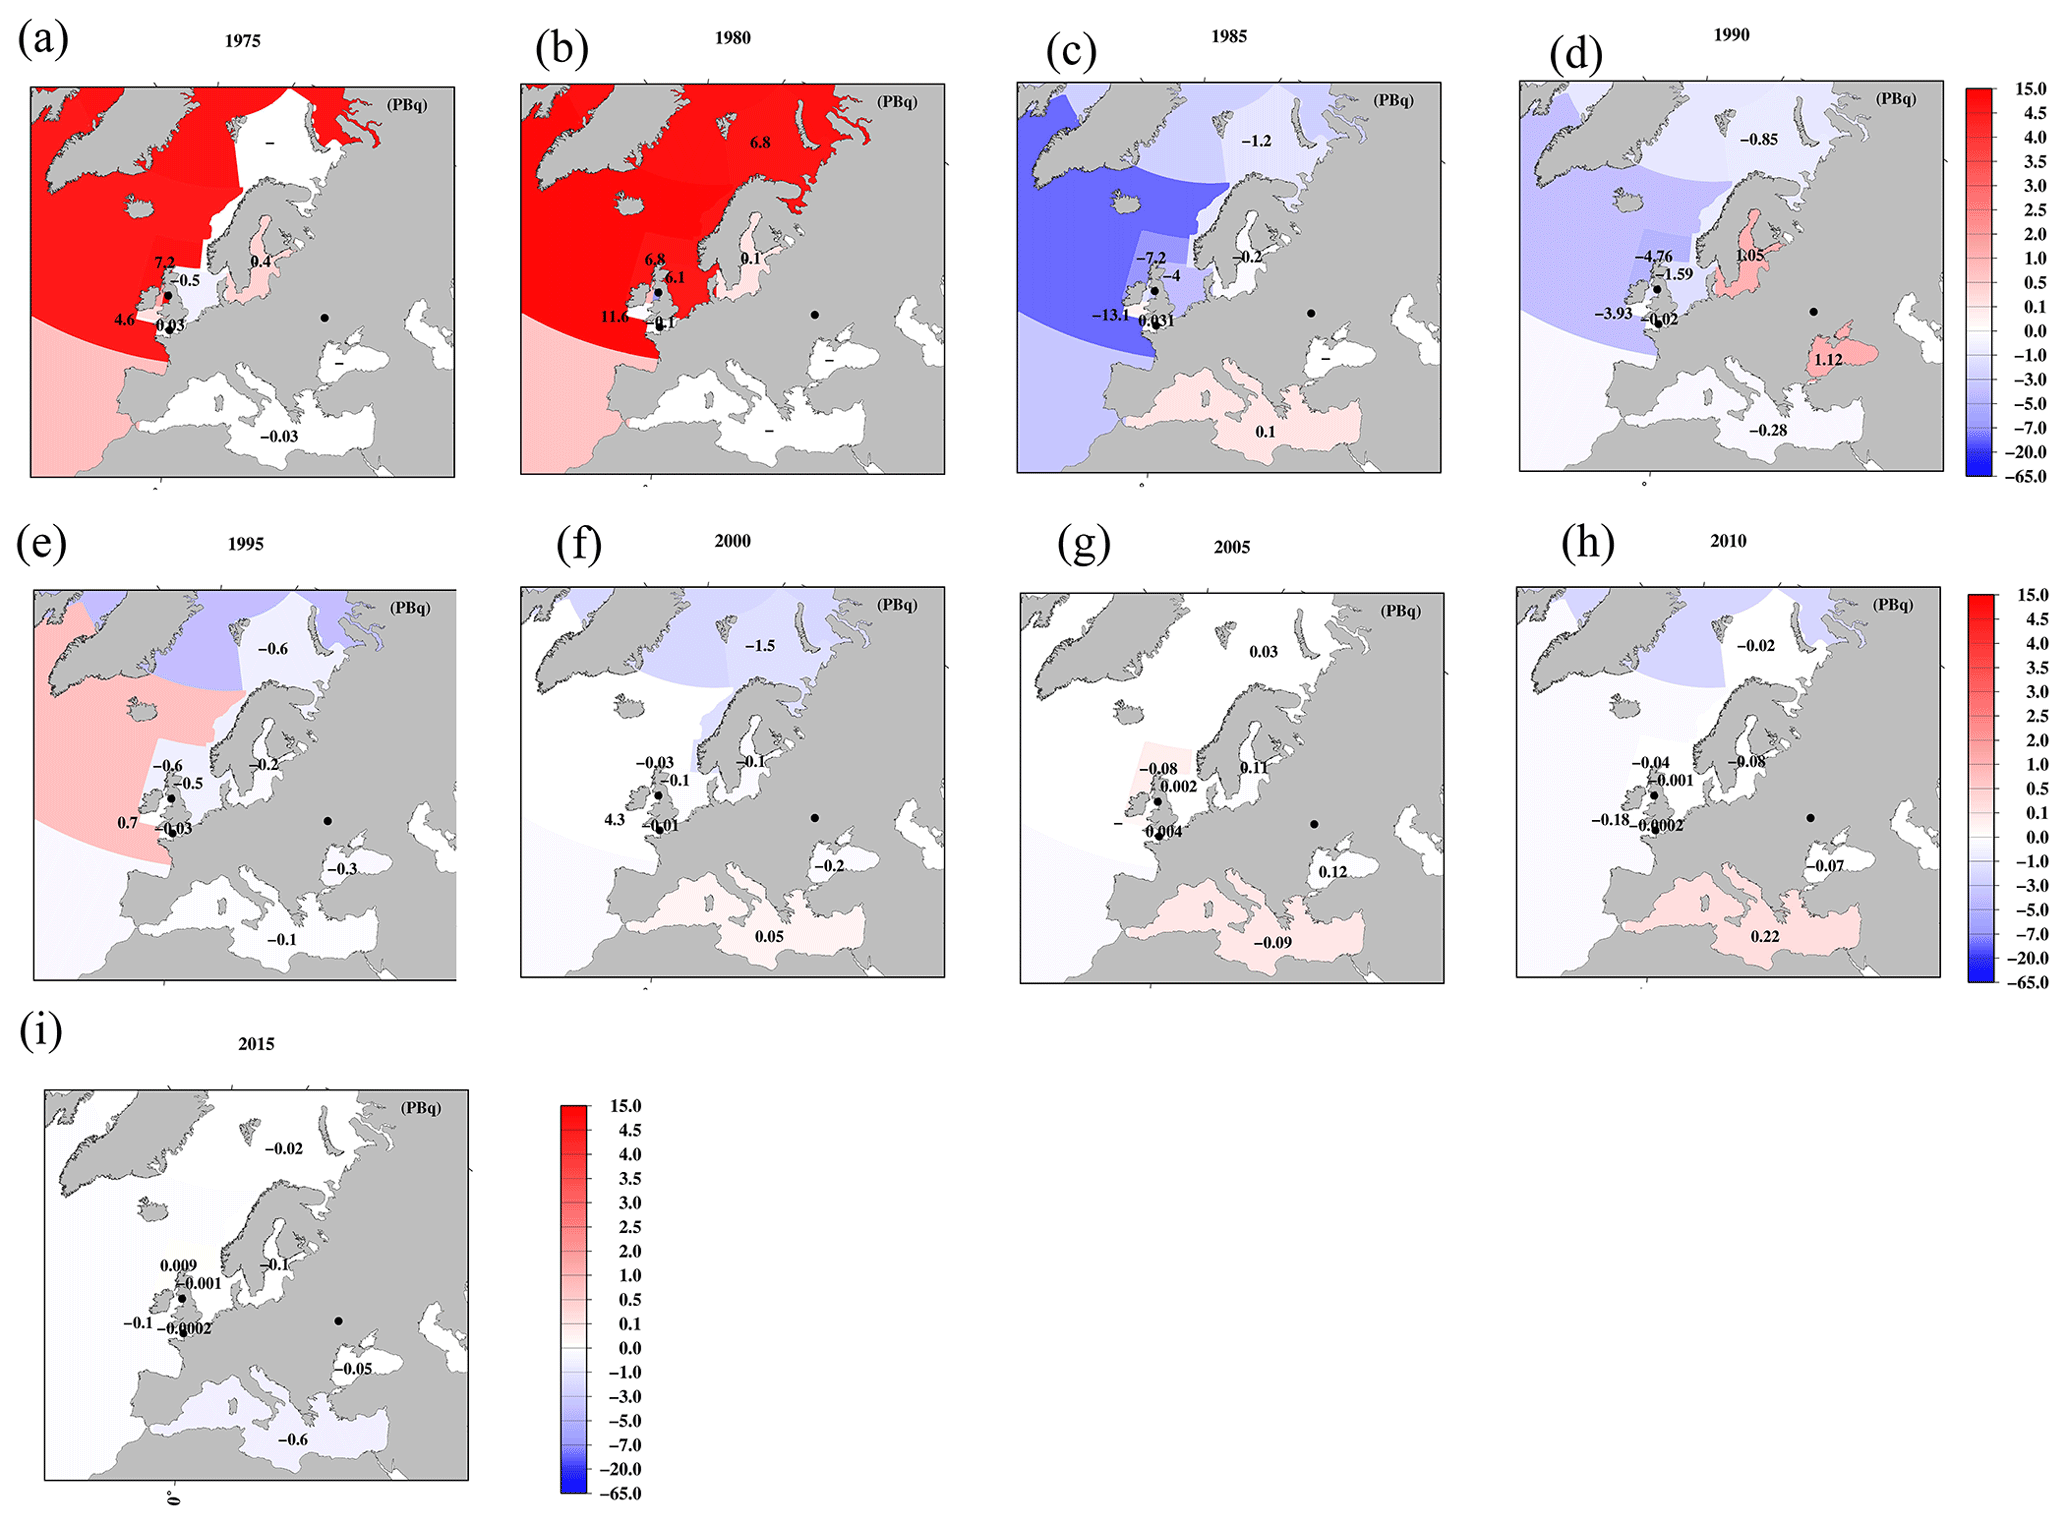
Figure 20Mass balance of 137Cs in the surface seawater in each box in the northern North Atlantic Ocean and its marginal seas. A positive value (red) indicates the net inflowed 137Cs from the upstream boxes, and a negative value (blue) indicates net outflowed 137Cs to the downstream boxes or below the surface mixed layer compared to the previous 5 years (unit is PBq). (a) 1975, (b) 1980, (c) 1985, (d) 1990, (e) 1995, (f) 2000, (g) 2005, (h) 2010, and (i) 2015.

Figure 21Mass balance of 137Cs in the surface seawater in each box in the Irish Sea and English Channel. A positive value (red) indicates the net inflowed 137Cs amount from the upstream boxes, and a negative value (blue) indicates the net outflowed 137Cs amount to the downstream boxes or below the surface mixed layer compared to the previous 5 years (unit is PBq). (a) 1975, (b) 1980, (c) 1985, (d) 1990, (e) 1995, (f) 2000, (g) 2005, (h) 2010, and (i) 2015.
4.4 Estimation of the net in- or outflow amount of 137Cs
The 137Cs deposited into the ocean surface is transported via advection and diffusion in the surface seawater, in addition to being transported to deep water below the surface mixed-layer depth, where it undergoes radioactive decay ( years). On 1 January 1970, 137Cs existing in the surface seawater in the global ocean was estimated to be 187±26 PBq. This value corresponds to 32 % of the deposited 137Cs until 1970, although the 137Cs released from reprocessing plants is included. The remaining approximately 68 % of deposited 137Cs, which is estimated to be 577±60 PBq, would be transported downwards below the surface mixed layer in the global ocean on a decadal timescale. According to the estimation by using a model simulation (Kamidaira et al., 2018), the amount of F1NPS-137Cs transported below the surface mixed layer within 4 months is almost half.
By using the mass balance equations described in Sect. 2.7, the net in- or outflowed 137Cs amounts in each box are shown in Figs. 18–21. Figure 18 shows the horizontal distributions of the net in-/outflowed 137Cs amount in the surface mixed layer in 1970 against the 137Cs deposition amount until 1 January 1970 (Fig. 5). Positive values (red) indicate that the net inflowed 137Cs amount is larger, whereas negative values (blue) indicate that the net outflowed 137Cs amount is larger in each box. The decrease in 137Cs occurred in the North Pacific Ocean. The largest decrease, which was estimated to be 61.2 PBq, occurred in the subarctic North Pacific Ocean. On the other hand, an increase in the 137Cs amount occurred in the western subtropical South Pacific Ocean (2.8 PBq), eastern South Pacific Ocean (9.6 PBq), middle Southern Ocean (2.6 PBq), Southern Ocean (12.4 PBq), and Antarctic Ocean (1.2–4.0 PBq). This suggests that some of the 137Cs deposited into the Pacific Ocean was transported to the South Pacific Ocean (south of 40∘ N), followed by movement to the Indian Ocean within 10–20 years. The outflow of 137Cs in the northern North Atlantic Ocean and North Atlantic Ocean was also large (41.4 and 57.1 PBq, respectively). The increase in 137Cs in the Irish Sea (Irish Sea.1; 2.3 PBq), North Sea (0.7 PBq), and northern North Atlantic Ocean (0.5 PBq) was due to the discharged 137Cs from the Sellafield and La Hague plants (Fig. 18).
The temporal variation in the net in-/outflowed pattern of the 137Cs amount is shown in Figs. 19–21. Figure 19 shows the net in-/outflowed 137Cs amount in each area in the global ocean from 1975 to 2015 at 5-year intervals. The net in- or outflowed 137Cs amount corresponds to the sum of the 137Cs amount for the previous 5 years. In 1975, 1980, and 1985, the values in the subarctic, western, and eastern North Pacific Ocean were negative (−0.5–2.7, −0.4–1.8, and −0.03–1.2 PBq, respectively), suggesting that the net outflowed 137Cs amount is larger than the net inflowed 137Cs amount. On the other hand, the net in-/outflowed 137Cs in the subtropical North Pacific Ocean and equatorial Pacific Ocean showed positive values (0.1–1.3, 0.08–1.3, and 0.07–1.3 PBq, respectively). The net inflowed 137Cs also occurred in the eastern subtropical South Pacific Ocean (5.2 and 1.1 PBq) and Southern Ocean (1.7 and 1.7 PBq) in 1975 and 1980 and the eastern South Pacific Ocean (0.8 PBq) in 1980. The distribution of negative and positive values reflect the 137Cs transport pattern, where the 137Cs deposited in the surface mixed layer in the western North Pacific Ocean was transported eastwards and accumulated into the eastern subtropical Pacific Ocean. Then, these were transported southwards, with the subsidence associated with California Current and westwards in the equatorial Pacific Ocean. The 137Cs moved southwards due to subduction in the eastern subtropical North Pacific Ocean and upwelled in the western/eastern equatorial Pacific Ocean. The negative values (−0.9 to −1.7 PBq for 1975; −0.4 to −1.1 PBq for 1980) in the western subtropical South Pacific Ocean, western South Pacific Ocean, and eastern Southern Ocean and positive values (0.3–2.5 PBq for 1975; 0.3–1.7 PBq for 1980) in the Arabian Sea, Indian Ocean, and Southern Ocean would result in the transport of 137Cs from the Pacific Ocean into the Indian Ocean through the Indonesian Archipelago in 1975 and 1980. After 1990, the positive 137Cs values in the eastern/western subtropical North Pacific Ocean and equatorial Pacific Ocean became negative (Fig. 19d). This suggests that the main 137Cs plume derived from the large-scale nuclear weapons tests would pass through until 1990. It is also noted that a small amount of 137Cs inflowed into the South Atlantic Ocean in 1975 (0.1 PBq) and 1980 (0.01 PBq; Fig. 19a and b). A small 137Cs increase also occurred in the central Atlantic Ocean after 1995 (Fig. 19c). In 2015, increased 137Cs in the subarctic, western, and eastern North Pacific Ocean (0.02–1.2 PBq) would be caused by the 137Cs released from the F1NPS (Fig. 19i).
In the northern North Atlantic Ocean and its marginal seas (Fig. 20), the increase in the 137Cs amount due to the discharged 137Cs from the reprocessing plants was significant in the northern North Atlantic Ocean, North Sea, and Barents Sea and coast of Norway and transported to the Arctic Ocean (Fig. 20a–d). The contribution of the discharged 137Cs from reprocessing plants decreased after 1985. The contribution from the Chernobyl accident was still found in the Baltic Sea, Black Sea, and Mediterranean Sea in 1990 (Fig. 20d).
In the Irish Sea and English Channel, the contributions of 137Cs released from reprocessing plants were large in 1975, and it appears that this 137Cs was transported to the northern North Atlantic Ocean and North Sea until 1980. In 1980, the 137Cs amount around the source region, the Irish Sea.1, showed negative values. After 1985, the contribution from the reprocessing plants was negatively associated with the decreased discharged 137Cs amount (Fig. 21).
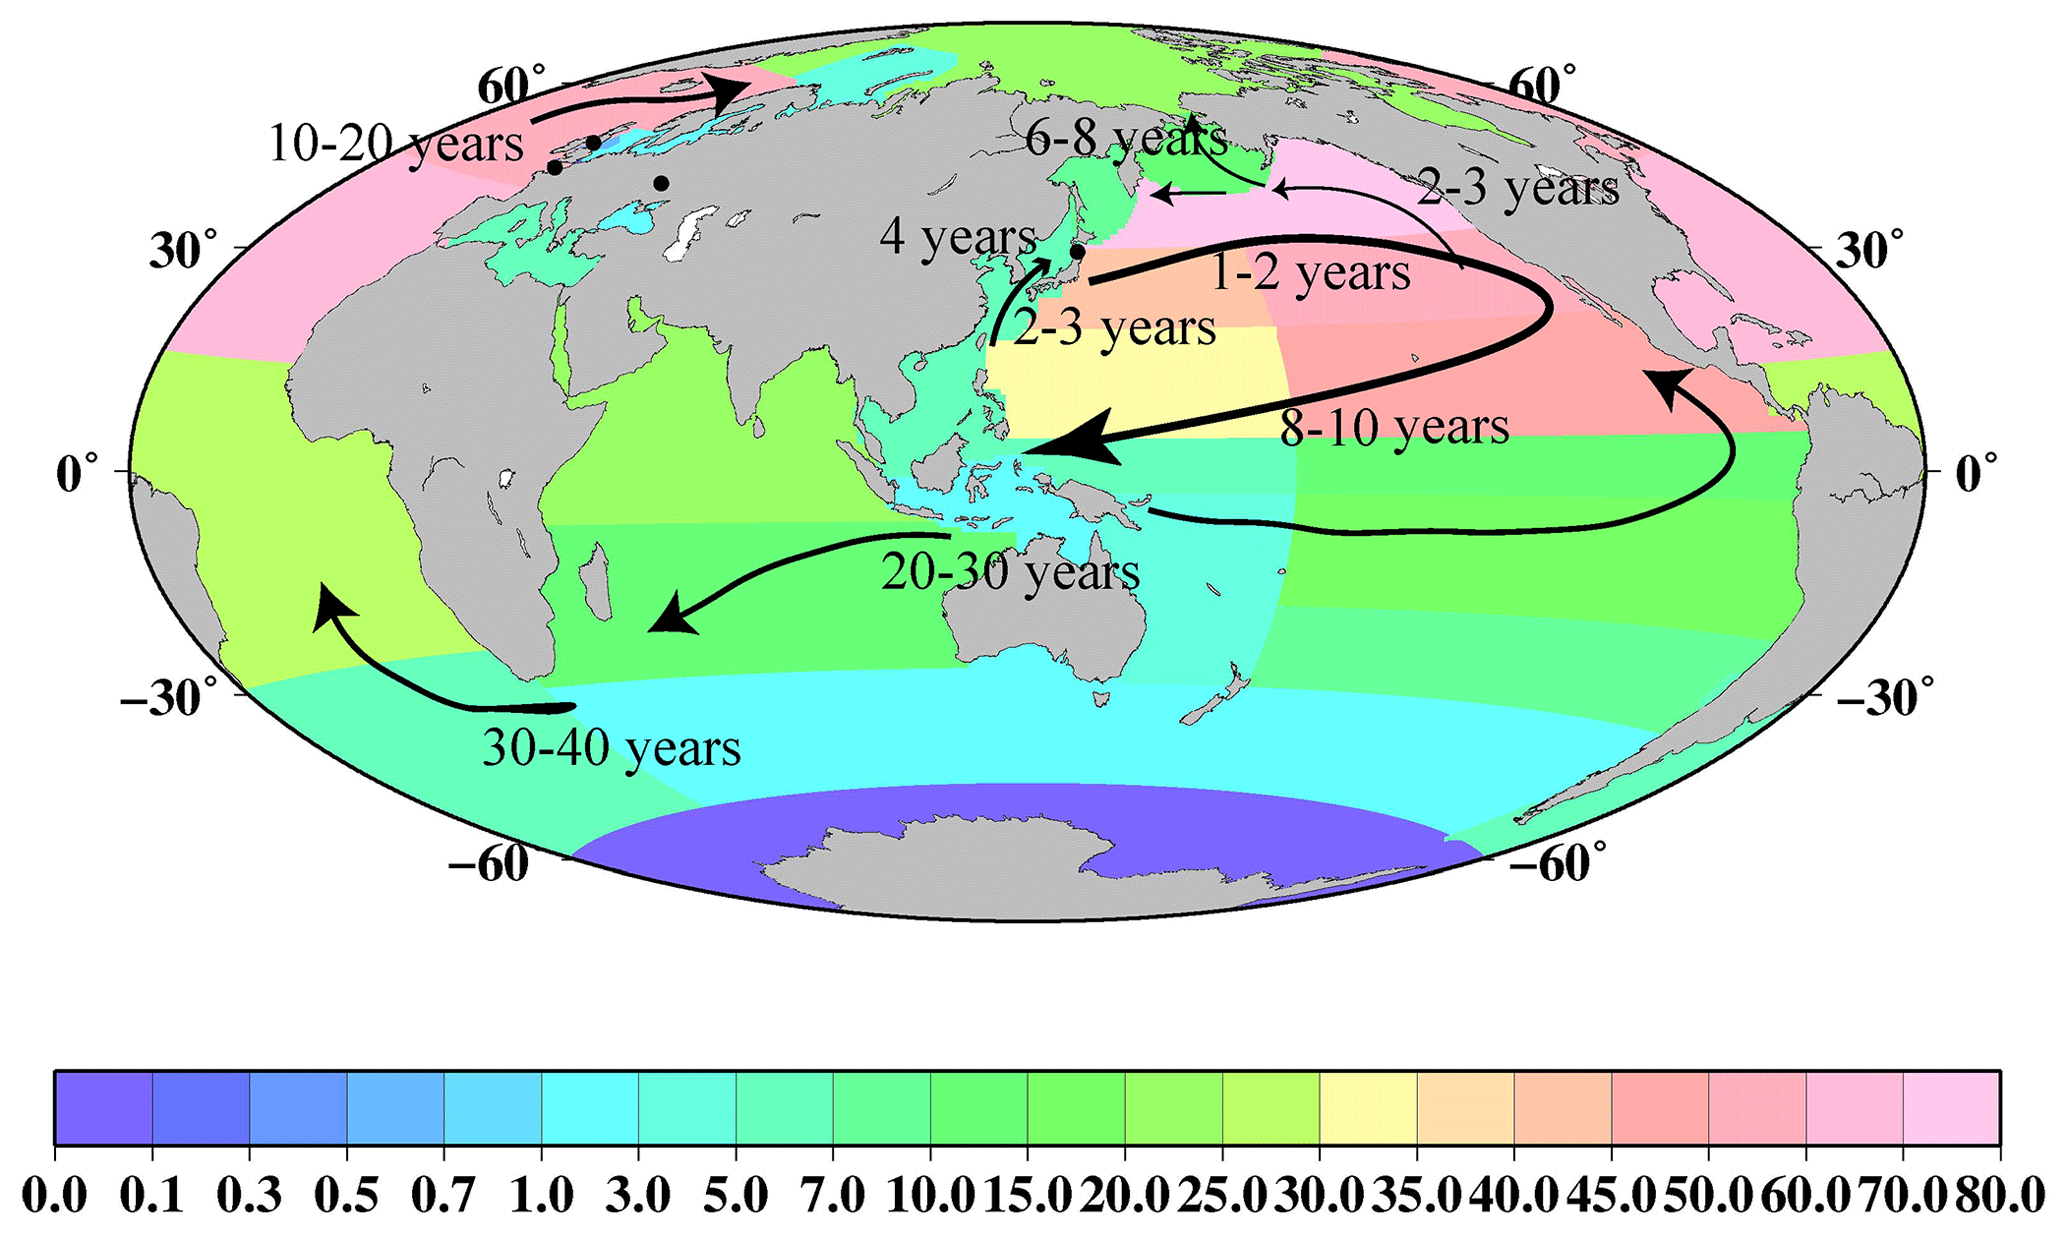
Figure 22Distribution of 137Cs deposition on 1 January 1970 and 137Cs transport route in the surface seawater of the global ocean deduced. The circles are locations of the nuclear reprocessing plants, Chernobyl, and F1NPS.
4.5 Timescale of 137Cs basin- or global-scale transport in the global ocean
The timescales of basin- or global-scale transport of 137Cs are summarized in Fig. 22, based on the spatiotemporal variation in the 137Cs inventory, density, and mass balance analysis. The color means that the 137Cs deposition amount is present in each area until 1 January 1970. The 137Cs deposited by the large-scale nuclear weapons tests and the F1NPS accident in the western North Pacific Ocean was transported eastwards within 1–2 years by the Kuroshio Current and its extension areas. After reaching the western coast of the North American continent with the Kuroshio Current and its extension, the F1NPS-derived 137Cs were bifurcated to toward the north and south, flowing along the current in the North Pacific Ocean. The 137Cs derived from the F1NPS accident in northern transported seawater was along with the Alaska Current (3–4 years). An increase in 137Cs activity concentrations was observed in the Bering Sea and Sea of Okhotsk for 6 years. The 137Cs might be entered in the Arctic Ocean (Kumamoto et al., 2019). On the other hand, the 137Cs derived from the large-scale nuclear weapons test arrived near the coast of California. This 137Cs was transported southwards, with subsidence in the equatorial Pacific Ocean, and transported westwards, in the equatorial Pacific Ocean, for 8–10 years, following the 137Cs that entered the Indian Ocean from the Pacific Ocean over the 2–3 decadal timescale. Furthermore, 137Cs was transported into the South and central Atlantic Ocean over a period of a 3–4 decadal timescale. The 137Cs deposited into the western North Pacific Ocean by the F1NPS accident was entrained in the subtropical mode water, transported in the subsurface layer, and attained to the East China Sea and Sea of Japan with a 2–3-year timescale. The 137Cs transported to the northern part of the Sea of Japan took about 4 years. In the northern North Atlantic Ocean and its marginal seas, a significant amount of 137Cs was discharged from reprocessing plants and transported to the North Sea, Barents Sea and coast of Norway, and the Arctic Ocean over approximately a 1–2 decadal timescale.
The data described in this work can be accessed from the repositories at https://doi.org/10.34355/CRiED.U.Tsukuba.00085 (Aoyama, 2021), https://doi.org/10.34355/Ki-net.KANAZAWA-U.00149 (Inomata and Aoyama, 2022a), https://doi.org/10.34355/Ki-net.KANAZAWA-U.00150 (Inomata and Aoyama, 2022b), and https://doi.org/10.34355/Ki-net.KANAZAWA-U.00151 (Inomata and Aoyama, 2022c).
In this study, we analyzed the 137Cs activity concentrations in the surface seawater in the global ocean by using almost all of the available historical data in the global ocean. The surface seawater was divided into 37 boxes, and the temporal variations in the 0.5-year median 137Cs values in each box were investigated to determine the 137Cs distribution and transport in the global surface seawater.
The 137Cs deposition as of 1 January 1970, with 2×2 min resolution, is estimated to be 874±90 PBq. In 1970, due to the minor contribution of atmospheric deposition, the 137Cs inventory in the surface mixed layer in the global ocean was estimated to be 184±26 PBq. This suggests that 68 % of the 137Cs deposited into the surface seawater in the global ocean (577±60 PBq) had already been transported below the surface mixed layer on a decadal timescale. The 137Cs inventory increased slightly and reached a maximum (214±11 PBq) in 1980. The increased 137Cs inventory was due to the discharged 137Cs from the reprocessing plants of Sellafield and La Hague. Then, the 137Cs inventory decreased, and the value in 2010, immediately before the F1NPS accident, was estimated to be 37.2±3.6 PBq. The relative contributions in the South Pacific Ocean, Indian Ocean, and Atlantic Ocean to the 137Cs inventory in the surface mixed layer in the global ocean increased gradually. In 2011, the 137Cs inventory increased to 50.7±7.3 PBq, and the F1NPS-derived 137Cs accounted for 15.5±3.9 PBq.
The 137Cs derived from the large-scale weapons tests and F1NPS accident was released into the almost same region in the western North Pacific Ocean. The 137Cs transported eastward along the Kuroshio Current and its extension and the coast of North America, with a 1–2-year timescale, and then transported from the south and north. In the southward-transported part, seawater with higher 137Cs activity concentration was transported southward, associated with the Pacific subtropical gyre and subducted in the subtropical North Pacific Ocean and equatorial Pacific Ocean. The seawater with high 137Cs activity concentrations entered the Indian Ocean over 2–3 decades. Then, 137Cs was transported into the South and central Atlantic Ocean over a period of 3–4 decades. On the other hand, northward-transported seawater moved along the North American continent with a 1–2-year timescale and was transported westward for 6–8 years. Part of the seawater would be transported into the Arctic Ocean. The seawater entrained into the subtropical-mode water in the North Pacific Ocean was transported westward in the subsurface layer and entered into the East China Sea and the Sea of Japan within 2–3 years. Finally, because 137Cs is water soluble, its transport and distribution strongly depend on seawater circulation. The transport of 137Cs-labeled seawater can be examined to interpret the circulation of substances in seawater, in addition to the climate change associated with gaseous exchange between the atmosphere and the ocean surface.
YI (the corresponding author) conducted the data analysis and prepared the paper. MA developed the database of radioactivity. Both authors discussed the results of the data analysis.
The contact author has declared that neither of the authors has any competing interests.
Publisher's note: Copernicus Publications remains neutral with regard to jurisdictional claims in published maps and institutional affiliations.
The authors thank Pascal Bailly du Bois, who provided the 137Cs data measured in the northern North Atlantic Ocean and its marginal seas.
This research has been financially supported by the Grant-in-Aid for Scientific Research on Innovative Areas “Interdisciplinary study on environmental transfer of radionuclides from the Fukushima Dai-ichi NPP Accident” project (project no. 25110511) of the Japanese Ministry of Education, Culture, Sports, Science, and Technology (MEXT). This research has also been supported by the cooperation program of the Environmental Radioactivity Research Network Center (grant nos. F-19-02, F-20-08, F-21-18, and F-22-04) and the Institute of Nature and Environmental Technology, Kanazawa University (grant nos. 18009, 19022, and 20043).
This paper was edited by Dagmar Hainbucher and reviewed by Fabio Conte and one anonymous referee.
Aarkrog, A.: Radioactivity in polar-regions – Main sources, J. Environ. Radioact., 25, 21–35, 1994.
Aarkrog, A.: Input of anthropogenic radionuclides into the World Ocean, Deep-Sea Res. Pt. II, 50, 2597–2606, 2003.
Aarkrog, A., Baxter, M. S., Berttencourt, A. O., Bojanowski, R., Bologa, A., Charmasson, S., Cunha, I., Delfanti, R., Duran, E., Holm, E., Jeffree, R., Livingston, H. D., Mahapanyawong, S., Nies, H., Osvath, I., Pingyu, L., Povinec, P. P., Sanchez, A., and Swift, D.: Comparison of doses from 137Cs and 210Po in marine food: A major international study, J. Environ. Radioact., 34, 69–90, 1997.
Aoyama, M.: Oceans and seas, in: Encyclopedia of Inorganic Chemistry, edited by: Atwood, D., Wiley, 339–346, 2010.
Aoyama, M.: Long-range transport of radiocaesium derived from global fallout and the Fukushima accident in the Pacific Ocean since 1953 through 2017 – Part I: Source term and surface transport, J. Radioanal. Nucl. Chem., 318, 1519–1542, 2018.
Aoyama, M.: Artificial Radionuclides, Encyclopedia of Ocean Science, 3rd edn., Elsevier, Co. Ltd., 136–152, https://doi.org/10.1016/B978-0-12-409548-9.10896-6, 2019.
Aoyama, M.: HAMGlobal2021: Historical Artificial radioactivity database in Marine environment, Global version 2021, Center for Research in Isotopes and Environmental Dynamics, University of Tsukuba [data set], https://doi.org/10.34355/CRiED.U.Tsukuba.00085, 2021.
Aoyama, M. and Hirose, K.: The temporal and spatial variation of 137Cs concentration in the Western North Pacific and its marginal seas during the period from 1979 to 1988, J. Environ. Radioact., 29, 57–74, 1995.
Aoyama, M. and Hirose, K.: Artificial radionuclides database in the Pacific Ocean: HAM database, Sci. World J., 4, 200–215, 2004.
Aoyama, M., Hirose, K., Suzuki, Y., Inoue, H., and Sugimura, Y.: High level radioactive nuclides in Japan in May, Nature, 321, 819–820, 1986.
Aoyama, M., Hirose, K., Miyao, T., Igarashi, Y., and Povonec, P. P.: 137Cs activity in surface water in the western North Pacific, J. Radioanal. Nucl. Chem., 248, 789–793, 2001a.
Aoyama, M., Hirose, K., Miyao, T., Igarashi, Y., and Povonec, P. P.: Temporal-variation of 137Cs inventory in the western North Pacific, J. Radioanal. Nucl. Chem., 248, 785–787, 2001b.
Aoyama, M., Hirose, K., and Igarashi, Y.: Re-construction and updating our understanding on the global weapons tests 137Cs fallout, J. Environ. Monit., 8, 431–438, 2006.
Aoyama, M., Hirose, K., Nemoto, K., Takatsuki, Y., and Tsumune, D: Water masses labeled with global fallout 137Cs formed by subduction in the North Pacific, Geophys. Res. Lett., 35, L01604, https://doi.org/10.1029/2007GL031964, 2008.
Aoyama, M., Fukasawa, M., Hirose, K., Hamajima, Y., Kawano, T., Povinec, P. P., and Sanchez-Cabeza, J. A.: Cross equator transport of 137Cs from North Pacific Ocean to South Pacific Ocean (BEAGLE2003 cruises), Prog. Oceanogr., 89, 7–16, 2011.
Aoyama, M., Uematsu, M., Tsumune, D., and Hamajima, Y.: Surface pathway of radioactive plume of TEPCO Fukushima NPP1 released 134Cs and 137Cs, Biogeosciences, 10, 3067–3078, https://doi.org/10.5194/bg-10-3067-2013, 2013.
Aoyama, M., Hamajima, Y., Hult, M., Uematsu, M., Oka, E., Tsumune, D., and Kumamoto, Y.: 134Cs and 137Cs in the North Pacific Ocean derived from the March 2011 TEPCO Fukushima Dai-ichi Nuclear Power Plant accident, Japan. Part one: Surface pathway and vertical distributions, J. Oceanogr., 72, 53–65, 2016a.
Aoyama, M., Hult, M., Hamajima, Y., Lutter, G., Marissens, G., and Stroh, H.: Tracing radioactivity from Fukushima in the Northern Pacific Ocean, Appl. Radiat. Isot., 109, 435–440, 2016b.
Aoyama, M., Kajino, M., Tanaka, T. Y., Sekiyama, T. T., Tsumune, D., Tsubono, T., Hamajima, Y., Inomata, Y., and Gamo, T.: 134Cs and 137Cs in the North Pacific Ocean derived from the March 2011 TEPCO Fukushima Dai-ichi Nuclear Power Plant accident, Japan. Part two: Estimation of 134Cs and 137Cs inventories in the North Pacific Ocean, J. Oceanogr., 72, 67–76, 2016c.
Aoyama, M., Hamajima, Y., Inomata, Y., and Oka, E.: REcirculation of FNPP1-derived radiocaesium observed in winter 2015/2016 in coastal regions of Japan, Appl. Rad. Isotop., 126, 83–87, 2017.
Aoyama, M., Hamajima, Y., Inomata, Y., Kumamoto, Y., Oka, E., Tsubono, T., and Tsumune, D.: Radiocaesium derived from the TEPCO Fukushima accident in the North Pacific Ocean: Surface transport processes until 2017, J. Environ. Radioact., 189, 93–102, 2018.
Baily du Bois, P., Duman, F., Voiseux, C., Morillon, M., Oms, P.-E., and Soiler, L.: Dissolved Radiotracers and Numerical Modeling in North European continental dispersion studies (1982–2016): Datsebases, methods and applications, Water, 12, 1667, https://doi.org/10.3390/w12061667, 2020.
Ballestra, S., Bojanowski, R., Fukai, R., and Vas, D.: Behaviour of selected radionuclides in the northwestern Mediterranean basin influenced by river discharge, Proc. Int. Symposium on the Behaviour of Long lived Radionuclides in the Marine Environment), Symposium on the Behaviour of Long Lived Radionuclides in the Marine Environment, edited by: Cigna, A. and Myttenaere, C., Commission of the European Communities, la Spezia, 215–232, 1984.
Bezhenar, R., Maderich, V., Schirone, A., Conte, F., and Martazinova, V.: Transport and fate of 137Cs in the Mediterranean and Black Seas system during 1945–2020 period: A modelling study, J. Environ. Radioact., 208–209, 106023, https://doi.org/10.1016/j.jenvrad.2019.106023, 2019.
Bourlat, Y., Millies-Lacroix, J.-C., Petit, G. L., and Bourguignon, J.: 90Sr, 137Cs and 239+240Pu in world ocean water samples collected from 1992 to 1994, edited by: Guegueniat, P., Germain, P., and Metivier, H., Radionuclides in the oceans. Input and inventories, Les editions de Physique, Les Ulis, 75–93, 1996.
Bowen, V. T., Noshkin, V. E., Livingston, H. D., and Volchok, H. L.: Fallout radionuclides in the Pacific Ocean: Vertical and horizontal distributions, largely from GEOSECS stations, Earth Planet. Sc. Lett., 49, 411–434, 1980.
Broecker, W. S. and Simpson, H. J.: A summary of Lamont Sr90 and Cs137 measurements on ocean water samples, HASL-197, I-9–I-104, 1968.
Broecker, W. S., Bonebakker, E. R., and Rocco, G. G.: The vertical distribution of cesium137 and strontium90 in the oceans, 2, J. Geophys. Res., 71, 1999–2003, 1966.
Buesseler, K.: Fishing for answers off Fukushima, Science, 338, 480–482, 2012.
Buesseler, K., Dai, M., Aoyama, M., Benitez-Nelson, C., Charmasson, S., Higley, K., Maderich, V., Masqué, P., Oughton, D., and Smith, J. N.: Fukushima Daiichi–derived radionuclides in the ocean: Transport, fate, and impacts, Ann. Rev. Mar. Sci., 9, 173–203, 2017.
CEC: The radiological exposure of the population of the European Community from radioactivity in North European waters, Project Marina, Report EUR 12483 EN, Commission of the European Communities, Brussels, 1990.
Cochran, J. K., Livingston, H. D., Hirschberg, D. J., and Surprenant, L. D.: Natural and anthropogenic radionuclide distributions in the northwest Atlantic Ocean, Earth Planet. Sc. Lett., 84, 135–152, 1987.
Dahlgaard, H., Chen, Q., Herrmann, J., Nies, H., Ibbett, R. D., and Kershaw, P. J.: On the background level of 99Tc∼, 90Sr and 137Cs in the North Atlantic, J. Mar. Syst., 6, 571–578, 1995.
Delfanti, R. and Papucci, C.: Mediterranean Sea, in: Encyclopedia of Inorganic Chemistry, edited by: Atwood, D., Wiley, 401–414, 2010.
Delfanti, R., Papucci, C., Salvi, S., and Lorenzelli, R.: IAEA CRP “Worldwide Marine Radioactivity”, Research Contract – Agreement No. ITA-26803, ENEA, Italy, 2000.
Delfanti, R., Özsoy, E., Kaberi, H., Schirone, A., Salvi, S., Conte, F., Tsabaris, C., and Papucci, C.: Evolution and fluxes of 137Cs in the Black Sea/Turkish Straits System/North Aegean Sea, J. Mar. Syst., 135, 117–123, 2014.
Egorov, V. N., Povinec, P. P., Polikarpov, G. G., Stokozov, N. A., Gulin, S. B., Kulebakina, L. G., and Osvath, I.: 90Sr and 137Cs in the Black Sea after the Chernobyl NPP accident: Inventories, balance and tracer applications, J. Environ. Radioact., 43, 137–155, 1999.
Feng, M., Zhang, N., Liu, Q., and Wijffels, S.: The Indonesian throughflow, its variability and centennial change, Geosci. Lett., 5, 3, https://doi.org/10.1186/s40562-018-0102-2, 2018.
Fin, R. A., Lukas, R., Bingham, F. M., Warner, M. J., and Gammon, R. H.: The western equatorial Pacific: A water mass crossroads, J. Res. Lett., 99, 25063–25080, 1994.
Folsom, T. R.: Summary of Cs-137 Concentrations Measured at Scripps Institution in N. Pacific Surface Waters, EML-356, 1979.
Folsom, T. R. and Mohanrao, G. J.: Measurement of fallout cesium in the Pacific Ocean and in terrestrial effluents likely to alter coastal waters, J. Radiat. Res., 1–2, 150–154, 1960.
Folsom, T. R., Mohanrao, G. J., and Winchell, P.: Fallout caesium in surface sea water off the California coast (1959–60) by gamma-ray, Nature, 187, 480–482, 1960.
Folsom, T. R., Mohanrao, G. J., Pillai, K. C., and Sreekumaran, C.: Distributions of Cs137 in the Pacific, HASL-197, I-95–I-203, 1968.
Folsom, T. R., Sreekumaran, C., Hansen, N., Moore, J. M., and Grismore, R.: Some Concentrations of Cs137 at Moderate Depths in the Pacific 1965–1968, HASL-217, 1970.
Folsom, T. R., Hansen, N., Tatumi, T., and Hodge, V. F.: Recent improvements in methods for concentrating and analyzing radiocesium in sea water, J. Radiat. Res., 16, 19–27, 1975.
Fowler, S. W., Small, L. F., Rosa, J. L., Lopez, J. J., and Teyssie, J. L.: Interannual variation in transuranic flux at the vertex time-series station in the northeast Pacific and its relationship to biological activity, in: Radionuclides in the Study of Marine Processes, edited by: Kershaw, P. J. and Woodhead, D. S., Kluwer, Dordrecht, 286–298, 1991.
Gordon, A.: Oceanography of the Indonesian Seas and their throughflow, Oceanography, 18, 14–27, 2005.
Gordon, A. L., Sprintall, J., Aken, H. M., Susanto, D., Wijffels, S., Molcard, R., Ffield, A. A., Pranowo, W., and Wirasantosa, S: The Indonesian throughflow during 2004–2006 as observed by the INSTANT program, Dynam. Atmos. Oceans, 50, 115–128, 2010.
Gray, J., Jones, S. R., and Smith, A. D.: Discharges to the environment from the Sellafield site, 1951e1992, J. Radiolo. Protect., 15, 99–131, 1995.
Guegueniat, P., Kershaw, P., Hermann, J., and du Bois, P. B.: New estimation of La Hague contribution to the artificial radioactivity of Norwegian waters (1992–1995) and Barents Sea (1992–1997), Sci. Total Environ., 202, 249–266, 1997.
Gulin, S. B. and Stokozov, N. A.: 137Cs concentrations in Atlantic and western Antarctic surface waters: results of the 7th Ukrainian Antarctic Expedition, 2002, J. Environ. Radioact., 83, 1–7, 2005.
Gulin, S. B., Mirzoyeva, N. Yu., Egorov, V. N., Polikarpov, G. G., Sidorov, I. G., and Proskurnin, V. Y.: Secondary radioactive contamination of the Black Sea after Chernobyl accident: recent levels, pathways and trends, J. Environ. Radioact., 124, 50–56, 2013.
Hanawa, K. and Talley, L. D.: Mode Waters, in: Ocean Circulation and Climate, edited by: Siedler, G., Church, J., and Gould, J., Academic Press, 373–386, 2001.
Hirose, K. and Aoyama, M.: Present background levels of surface 137Cs and 239,240Pu concentrations in the Pacific, J. Environ. Radioact., 69, 53–60, 2003a.
Hirose, K. and Aoyama, M.: Analysis of 137Cs and 239,240Pu concentrations in surface waters of the Pacific Ocean, Deep-Sea Res. Pt. II, 50, 2675–2700, 2003b.
Hirose, K., Aoyama, M., Katsuragi, Y., and Sugimura, Y.: Annual deposition of Sr-90, Cs-137 and Pu-239, 240 from the 1961–1980 Nuclear Explosions: A simple model, J. Meteoro. Soc. Jan. Ser. II., 65, 259–277, 1987.
Hirose, K., Sugimura, Y., and Aoyama, M.: Plutonium and 137Cs in the western North Pacific Estimation of residence time of plutonium in surface waters, Int. J. Rad. Appl. Instr. Part A, 43, 349–359, 1991.
Hirose, K., Amano, H., Baxter, M. S., Chaykovskaya, E., Chumiche, V. B., Hong, G. H., Isogai, K., Kim, C. K., Miyao, T., Morimoto, T., Nikitin, K., Oda, K., Pettersson, H. B. L., Povinec, P. P., Seto, Y., Tkalin, A., Togawa, O., and Veletova, M. K.: Anthropogenic radionuclides in seawater in the East Sea/Japan Sea Results of the first-stage Japanese-Korean-Russian expedition, J. Environ. Radioact., 43, 1–1, 1999.
IAEA: Worldwide marine radioactivity studies (WOMARS), Radionuclide levels in oceans and seas, Final report of a coordinate research project, IAEA-TECDOC-1429, 2005.
IAEA: The Fukushima Daiichi Accident, http://Pub1710-TV1-Web.pdf (last access: 25 April 2023), 2015.
IHO: Limits of Oceans and Seas, Special Edition No. 23, 3rd edn., International Hydrographic Organization, 1953.
Ikeuchi, Y., Amano, H., and Aoyama, M.: Anthropogenic radionuclides in seawater of the Far Eastern Seas, Sci. Total Environ., 237/238, 203–212, 1999.
Inomata, Y.: Global trends in cesium distribution, in: Encyclopedia of Inorganic Chemistry, edited by: Atwood, D., Wiley, 453–466, 2010.
Inomata, Y. and Aoyama, M.: 137Cs measurement points in the surface seawater in the global ocean based in the HAMGlobal2021, CRiED (Center for Research in Isotopes and Environmental Dynamics), University of Tsukuba [data set], https://doi.org/10.34355/Ki-net.KANAZAWA-U.00149, 2022a.
Inomata, Y. and Aoyama, M.: Temporal variations of 137Cs activity concentrations and these 0.5-yr median values in the surface seawater in the global ocean, CRiED (Center for Research in Isotopes and Environmental Dynamics), University of Tsukuba [data set], https://doi.org/10.34355/Ki-net.KANAZAWA-U.00150, 2022b.
Inomata, Y. and Aoyama, M.: Dataset of 0.5-yr median values of 137Cs activity concentrations in the surface seawater in the global ocean during the period from 1957 to 2021., CRiED (Center for Research in Isotopes and Environmental Dynamics), University of Tsukuba [data set], https://doi.org/10.34355/Ki-net.KANAZAWA-U.00151, 2022c.
Inomata, Y., Aoyama, M., and Hirose, K.: Analysis of 50-y record of surface 137Cs concentrations in the global ocean using the HAM-global database, J. Environ. Monit., 11, 116–125, 2009.
Inomata, Y., Aoyama, M., Tsumune, D., Motoi, T., and Nakano, H.: Optimum interpolation analysis of basin-scale 137Cs transport in surface seawater in the North Pacific Ocean, J. Environ. Monit., 14, 3146–3155, 2012.
Inomata, Y., Aoyama, M., Tsubono, T., Tsumune, D., and Hirose, K.: Spatial and temporal distributions of 134Cs and 137Cs derived from the TEPCO Fukushima Daiichi Nuclear Power Plant accident in the North Pacific Ocean by using optimal interpolation analysis, Environ. Sci. Process. Impacts, 18, 126–136, 2016.
Inomata, Y., Aoyama, M., Hamajima, Y., and Yamada, M.: Transport of FNPP1-derived radiocaesium from subtropical mode water in the western North Pacific Ocean to the Sea of Japan, Ocean Sci., 14, 813–826, https://doi.org/10.5194/os-14-813-2018, 2018.
Ito, T., Kaneko, A., Tsubota, H., and Gohda, H.: The characteristic distribution of silica over the East China Sea shelf slope, J. Oceanograph., 50, 465–477, 1994.
Ito, T., Aramaki, T., Kitamura, T., Otosaka, S., Suzuki, T., Togawa, O., Kobayashi, T., Senjyu, T., Chaykovskaya, E. L., Karasev, E. V., Lishavskaya, T. S., Novichkov, V. P., Tlalin, A. V., Shcherbinin, A. F., and Volkov, Y. N.: Anthropogenic radionuclides in the Japan Sea: their distributions and transport processes, J. Environ. Radioact., 68, 249–267, 2003.
Ito, T., Aramaki, T., Otosaka, S., Kobayashi, T., Senjyu, T., Chaykovskaya, E. L., Karasev, E. V., Lishavskaya, T. S., Novichkov, V. P., Tkalin, A. V., Shcherbinin, A. F., and Volkov, Y. N.: Anthropogenic radionuclides in seawater of the Japan Sea, J. Nuclear Sci. Technol., 42, 90–100, 2005.
Kaeriyama, H., Ambe, D., Shimizu, Y., Fujimoto, K., Ono, T., Yonezaki, S., Kato, Y., Matsunaga, H., Minami, H., Nakatsuka, S., and Watanabe, T.: Direct observation of 134Cs and 137Cs in surface seawater in the western and central North Pacific after the Fukushima Dai-ichi nuclear power plant accident, Biogeosciences, 10, 4287–4295, https://doi.org/10.5194/bg-10-4287-2013, 2013.
Kaeriyama, H., Shimizu, Y., Ambe, D., Masujima, M., Shigenobu, Y., Fujimoto, K., Ono, T., Nishiuchi, K., Taneda, T., Kurogi, H., Setou, T., Sugisaki, H., Ichikawa, T., Hidaka, K., Hiroe, Y., Kusaka, A., Kodama, T., Kuriyama, M., Morita, H., Nakata, K., Morinaga, K., Morita, T., and Watanabe, T.: Southwest intrusion of 134Cs and 137Cs derived from the Fukushima Dai-ichi nuclear power plant accident in the Western North Pacific, Environ. Sci. Technol., 48, 3120–3127, 2014.
Kaeriyama, H., Fujimoto, K., Ambe, D., Shigenobu, Y., Ono, T., Tadokoro, K., Okazaki, Y., Kakehi, S., Ito, S., Narimatsu, Y., Nakata, K., Morita, T., and Watanabe, T.: Fukushima-derived radionuclides 134Cs and 137Cs in zooplankton and seawater samples collected off the Joban-Sanriku coast, in Sendai Bay, and in the Oyashio region, Fish. Sci., 81, 139–153, 2015.
Kameník, J., Dulaiova, H., Buesseler, K. O., Pike, S. M., and Št'astná, K.: Cesium-134 and 137 activities in the central North Pacific Ocean after the Fukushima Dai-ichi Nuclear Power Plant accident, Biogeosciences, 10, 6045–6052, https://doi.org/10.5194/bg-10-6045-2013, 2013.
Kamidaira, Y., Uchiyama, Y., Kawamura, H., Kobayashi, T., and Furuno, A.: Submesoscale mixing on initial dilution of radionuclides released from the Fukushima Daiichi Nuclear Power Plant, J. Geophys. Res.-Oceans., 123, 2808–2828, https://doi.org/10.1002/2017JC013359, 2018.
Kautsky, H.: Investigations on the distribution of Cs and Sr and the water mass transport times in the Northern North Atlantic and the North Sea, Dt. Hydrogr. Z., 40, 50–67, 1987.
Kim, C. K., Byun, J. I., Chae, J. S., Choi, H. Y., Choi, S. W., and Kim, D. J.: Radiological impact in Korea following the Fukushima nuclear accident, J. Environ. Radioact., 111, 70–82, 2012.
Kumamoto, Y., Aoyama, M., Hamajima, Y., Aono, T., Kouketsu, S., and Murata, A.: Southward spreading of the Fukushima-derived radiocesium across the Kuroshio Extension in the North Pacific, Sci Rep., 4, 4276, https://doi.org/10.1038/srep04276, 2014.
Kumamoto, Y., Aoyama, M., Hamajima, Y., Murata, A., and Kawano, T.: Impact of Fukushima-derived radiocesium in the western North Pacific Ocean about ten months after the Fukushima Dai-ichi nuclear power plant accident, J. Environ. Radioact., 140, 114–122, 2015.
Kumamoto, Y., Aoyama, M., Hamajima, Y., Nishino, S., Murata, A., and Kikuchi, T.: Meridional distribution of Fukushima-derived radiocesium in surface seawater along a trans-Pacific line from the Arctic to Antarctic Oceans in summer 2012, J. Radioanal. Nucl. Chem., 307, 1703–1710, 2016.
Kumamoto, Y., Aoyama, M., Hamajima, Y., Nagai, H., Yamagata, T., Kawai, Y., Yamaguchi, A., Imai, K., and Murata, A.: Fukushima-derived radiocesium in the western North Pacific in 2014, J. Radioanal. Nucl. Chem., 311, 1209–1217, 2017.
Kumamoto, Y., Aoyama, M., Hamajima, Y., Oka, E., and Murata, A.: Time evolution of Fukushima-derived radiocesium in the western subtropical gyre of the North Pacific Ocean by 2017, J. Radioanal. Nucl. Chem., 318, 2181–2187, https://doi.org/10.1007/s10967-018-6133-5, 2018.
Kumamoto, Y., Yamada, M., Aoyama, M., Hamajima, Y., Kaeriyama, H., Nagai, H., Yamagata, T., Murata, A., and Masumoto, Y.: Radiocesium in North Pacific coastal and offshore areas of Japan within several months after the Fukushima accident, J. Environ. Radioact., 198, 79–88, 2019.
Livingston, H. D. and Povinec, P. P.: Anthropogenic marine radioactivity, Ocean Coast. Manag., 43, 689–712, 2000.
Livingston, H. D., Bowe'n, V. T., Casso, S. A., Volchok, H. L., Noshkin, V. E., Wong, K. M., and Beasley, T. M.: Fallout Nuclides in Atlantic and Pacific Water Columns: GEOSECS Data, Technical Report, WHOI-85-19, 1985.
Maderich, V., Kim, K. O., Bezhenar, R., Jung, K. T., Martazinova, V., and Igor, B.: Transport and Fate of 137Cs Released From Multiple Sources in the North Atlantic and Arctic Oceans, Front. Mar. Sci., 8, 806450, https://doi.org/10.3389/fmars.2021.806450, 2021.
Matishov, G. G., Matishov, D. G., and Namjatov, A. A.: Artificial radionuclides in sediments of the Don River Estuary and Azov Sea, J. Environ. Radioact., 59, 309–327, 2002.
Mignot, J., de Boyer Montégut, C., Lazar, A., and Cravatte, S.: Control of salinity on the mixed layer depth in the world ocean: 2. Tropical areas, J. Geophys. Res., 112, https://doi.org/10.1029/2006JC003954, 2007.
Miroshnichenko, O. N. and Paraskiv, A. A.: 137Cs concentration in surface waters of Far Eastern seas: Results of expeditionary research in 2018, Mar. Biolog. J., 5, 55–63, 2020.
Miyake, Y.: Penetration of 90Sr and 137Cs in deep layers of the Pacific and vertical diffusion rate of deep water, J. Radiat. Res., 3–3, 141–147, 1962.
Miyake, Y.: Artificial radioactivity in the Pacific Ocean, in: Radioactive Tracers in Oceanography, I.U.G.G.Monograph, International Union of Geodesy and Geophysics, 21–30, 1963.
Miyake, Y. and Sugimura, Y.: Plutonium content in the western North Pacific waters, Pap. Meteorol. Geophys., 19, 481–485, 1968.
Miyake, Y. and Sugimura, Y.: The Plutonium Content of Pacific Ocean Waters, IAEA-SM-199/22, 91–105, 1978.
Miyake, Y., Saruhashi, K., and Katsuragi, Y.: Strontium 90 in western North Pacific surface waters, Pap. Meteorol. Geophys., XI, 188–191, 1960.
Miyake, Y., Saruhashi, K., Katsuragi, Y., and Kanazawa, T.: Cesium 137 and Strontium 90 in sea water, J. Radiat. Res., 2–1, 25–28, 1961.
Miyake, Y., Saruhashi, K., Sugimura, Y., Kanazawa, T., and Hirose, K.: Contents of 137Cs, plutonium and americium isotopes in the Southern Ocean waters, Pap. Meteorol. Geophys., 39, 95–113, 1988.
Miyao, T., Hirose, K., Aoyama, M., and Igarashi, Y.: Temporal Variation of 137Cs and 239,240Pu in the Sea of Japan, J. Environ. Radioact., 40, 239–250, 1998.
Molero, J., Sanchez-Cabeza, J. A., Merino, J., Mitchell, P. I., and Vidal-Quadrasa, A.: Impact of 134Cs and 137Cs from the Chernobyl reactor accident on the Spanish Mediterranean marine environment, J. Environ. Radioact., 43, 357–370, 1999.
Montégut, C.: Mixed layer depth over the global ocean: An examination of profile data and a profile-based climatology, J. Geophys. Res., 109, C12003, https://doi.org/10.1029/2004JC002378, 2004.
Nagaya, Y. and Nakamura, K.: A study on the vertical transport of 90Sr and 137Cs in the surface waters of the seas around Japan, J. Radiat. Res., 11–1, 32–43, 1970.
Nagaya, Y. and Nakamura, K.: 90Sr and 137Cs contents in the surface waters of the adjacent seas of Japan and the North Pacific during 1969 to 1973, J. Oceanogr. Soc. Jpn., 32, 228–234, 1976.
Nagaya, Y. and Nakamura, K.: Artificial radionuclides in the western Northwest Pacific (I): 90Sr and 137Cs in the deep waters, J. Oceanogr. Soc. Jpn., 37, 135–144, 1981.
Nagaya, Y. and Nakamura, K.: 239,240Pu, 137Cs and 90Sr in the central North Pacific, J. Oceanogr. Soc. Jpn., 40, 410–424, 1984.
Nagaya, Y. and Nakamura, K.: Artificial radionuclides in the western Northwest Pacific (II): 137Cs and 239,240Pu inventories in water and sediment columns observed from 1980 to 1986, J. Oceanogr. Soc. Jpn., 43, 345–355, 1987.
Nagaya, Y. and Nakamura, K. Distributions and mass-balance of 239,240Pu and 137Cs in the northern North Pacific, in: Deep Ocean Circulation, Physical and Chemical Aspects. Elsevier Oceanography Series, edited by: Teramoto, T., Elsevier, Amsterdam, 157–167, 1993.
Nagaya, Y., Shiozaki, M., and Seto, Y.: Radioactive contamination of the Indo-Antarctic Ocean water in each earlier period in 1961 and 1962, J. Radiat. Res., 5–3–4, 206–214, 1964a.
Nagaya, Y., Shiozaki, M., and Seto, Y.: Radiological survey of sea water of adjacent Sea of Japan in 1963, Suiro Yoho, 78, 63–67, 1964b (in Japanese).
Nagaya, Y., Shiozaki, M., and Seto, Y.: Some fallout radionuclides in deep waters around Japan, J. Radiat. Res., 6–1, 23–31, 1965.
Nakanishi, T., Satoh, M., Takai, M., Ishikawa, A., Murata, M., Dairyoh, M., and Higuchi, S.: Successive determinations of 210PB, 210PO, 226RA, 228RA and selected actinides in seawater and sea sediment, J. Radioanal. Nucl. Chem., 138, 321–230, 1990.
Nakanishi, T., Shiba, Y., Muramatsu, M., and Haque, M. A.: Estimation of mineral aerosol fluxes to the Pacific by using environmental plutonium as a tracer, in: Biogeochemial Processes and Ocean Flux in the Western Pacific, edited by: Sakai, H. and Nozaki, Y., Terra Science Publishing Company, Tokyo, 15–30, 1995.
Nakano, H., Motoi, T., Hirose, K., and Aoyama, M.: Analysis of 137Cs concentration in the Pacific using a Lagrangian approach, J. Geophys, Res., 115, C06015, https://doi.org/10.1029/2009JC005640, 2010.
Nies, H.: The distribution of the Chernobyl fallout over the Baltic sea and its change during 1987 and 1988 in seawater, Baltic Sea Environ. Proc., 31, 31–41, 1989.
NOAA National Geophysical Data Center: 2-minute Gridded Global Relief Data (ETOPO2) Global 2, NOAA National Centers for Environmental Information [data set], https://doi.org/10.7289/V5J1012Q, 2006.
Noshkin, V. E.: Concentrations of Radionuclides in Some Seawater and Sediment Samples from the Equatorial Pacific with Emphasis on Samples from the Western Pacific Ocean, Preliminary report prepared for the 1st Coordinated Research Project on Worldwide Marine Radioactivity Studies, IAEA, Monaco, 1999.
Noshkin, V. E., Eagle, R. J., and Wong, K. M.: Plutonium levels in Kwajalein Lagoon, Nature, 262, 745–748, 1976.
Noshkin, V. E., Wong, K. M., Jokela, T. A., Eagle, R. J., and Brunk, J. L.: Radionuclides in the Marine Environment Near the Farallon Island, UCRL-52381, 16, 1978.
Noshkin, V. E., Wong, K. M., and Eagle, R. J.: Plutonium concentrations in fish and seawater from Kwajalein Atoll, Health Phys., 37, 549–556, 1979.
Noshkin, V. E., Brunk, J. L., Jokela, T. A., and Wong, K. M.: 238Pu concentrations in the marine environment at San Clemente Island, Health Phys., 40, 643–659, 1981.
Nucler Energy Agency; Chernobyl: Assessment of radiological and Health Impacts. Chapter II. The release, dispersion, deposition and behaviour of radionuclides. 2002 Update of Chernobyl: Ten Years On, OECD Publishing, Paris, 2002.
Oki, T. and Kanae, S.: Estimation of areas within a cartesian grid box considering the ellipticity of the earth, J. Japan Soc. Hydrol. Water Resour., 10, 371–374, 1997.
Open University: Ocean Circulation, 2nd edn., Elsevier, 2001, reprinted 2004.
OSPAR: Annual report and assessment of discharges of liquid discharges from nuclear installations, OSPAR Secretariat, The Aspect 12 Finsbury Square, London, EC2A, 1AS, United Kingdom,, 2021.
Pillay, K. C., Smith, R. C., and Folsom, T. R.: Plutonium in the marine environment, Nature, 203, 568–571, 1964.
Povinec, P. P., Bailly du Bois, P., Kershaw, P. J., Nies, H., and Scotto, P.: Temporal and spatial trends in the distribution of 137Cs in surface waters of Northern European Seas – a record of 40 years of investigations, Deep-Sea Res. Pt. II, 50, 2785–2801, 2003.
Povinec, P. P., Aoyama, M., Fukasawa, M., Hirose, K., Komura, K., Sanchez-Cabeza, J. A., Gastaud, J., Ješkovský, M., Levy, I., and Sýkora, I.: 137Cs water profiles in the South Indian Ocean–An evidence for accumulation of pollutants in the subtropical gyre, Prog. Oceanogr., 89, 17–30, 2011.
Prandle, D.: A modelling study of the mixing of 137Cs in the seas of the European continental shelf, J. Philos. T. Roy. Soc., A310, 407–430, 1984.
Prandle, D. and Beechey, J.: Marine dispersion of caesium 137 released from Sellafield and Chernobyl, Geophys. Res. Lett., 18, 1723–1726, 1991.
Sanchez-Cabeza, J. A., Levy, I., Gastaud, J., Eriksson, M., Osvath, I., Aoyama, M., Povinec, P. P., and Komura, K.: Transport of North Pacific 137Cs labeled waters to the south-eastern Atlantic Ocean, Prog. Oceanogr., 89, 31–37, 2011.
Shirasawa, T. H. and Schuert, E. A.: Fallout Radioactivity in the North Pacific Ocean: Data Compilation of Sr-90 and Cs-137 Concentrations in Seawater, HASL-197 I-66–I-94, U.S. Atomic Energy Commission, 1968.
Smith, J. N., Ellis, K. M., and Kilius, L. R.: 129I and 137Cs tracer measurements in the Arctic Ocean, Deep-Sea Res., 45, 959–984, 1998.
Smith, J. N., Rossi, V., Buesseler, K. O., Cullen, J. T., Cornett, J., Nelson, R., Macdonald, A. M., Robert, M., and Kellogg, M.: Recent transport jistory of Fukushima Radioactivity in the Northeast Pacific Ocean, Environ. Sci. Technol., 51, 10494–10502, 2017.
Steinhauser, G., Brandl, A., and Johnson, T. E.: Comparison of the Chernobyl and Fukushima nuclear accidents: A review of the environmental impacts, Sci. Total Environ., 470–471, 800–817, 2014.
Stramma, L. and England, M.: On the water masses and mean circulation of the South Atlantic Ocean, J. Geophys. Res., 104, 20863–20883, 1999.
Suga, M., Ando, A., Ubukawa, T., and Ueda, M.: Calculation of “Sea and Land Areas and Their Ratio of Each Latitude Band” by Global Map Version, Kokudochiriin Jihou, 124, 95–98, 2013 (in Japanese).
Tsubono, T., Misumi, K., Tsumune, D., Bryan, F. O., Hirose, K., and Aoyama, M.: Evaluation of radioactive cesium impact from atmospheric deposition and direct release fluxes into the North Pacific from the Fukushima Daiichi nuclear power plant, Deep-Sea Res. Pt. I, 115, 10–21, 2016.
Tsumune, D., Aoyama, M., and Hirose, K.: Numerical simulation of 137Cs and 239,240Pu concentrations by an ocean general circulation model, J. Environ. Radioact., 69, 61–84, 2003.
Tsumune, D., Aoyama, M., Hirose, K., Bryan, F. O., Lindsay, K., and Danabasoglu, G.: Transport of 137Cs to the Southern Hemisphere in an ocean general circulation model, Prog. Oceanogr., 89, 38–48, 2011.
Tsumune, D., Tsubono, T., Aoyama, M., and Hirose, K.: Distribution of oceanic 137Cs from the Fukushima Dai-ichi Nuclear Power Plant simulated numerically by a regional ocean model, J. Environ. Radioact., 111, 100–108, https://doi.org/10.1016/j.jenvrad.2011.10.007, 2012.
Tsumune, D., Tsubono, T., Aoyama, M., Uematsu, M., Misumi, K., Maeda, Y., Yoshida, Y., and Hayami, H.: One-year, regional-scale simulation of 137Cs radioactivity in the ocean following the Fukushima Dai-ichi Nuclear Power Plant accident, Biogeosciences, 10, 5601–5617, https://doi.org/10.5194/bg-10-5601-2013, 2013.
UNSCEAR: Sources and effects of ionizing radiation: UNSCEAR 1993 report to the General Assembly, with scientific annexes/United Nations Scientific Committee on the Effects of Atomic Radiation, United Nations, New York, 1993.
UNSCEAR: Sources, Effects and Risks of Ionizing Radiation, Vol. I. Sources, Report to the general assembly with scientific annexes, United Nations, New York, 2000.
UNSCEAR: Sources, Effects and Risks of Ionizing Radiation, Vol. I. Scientific Annex A, Report to the general assembly with scientific annexes, United Nations, New York, 2013.
Wessel, P., Smith, W. H. F., Scharroo, R., Luis, J., and Wobbe, F.: Generic Mapping Tools: Improved Version Released, EOS Trans. AGU, 94, 409–410, 2013.
Wong, K. M., Jokela, T. A., Eagle, R. J., Brunk, J. L., and Noshkin, V. E.: Radionuclide concentrations, fluxes, and residence times at Santa Monica and San Pedro Basins, Prog. Oceanogr., 30, 353–391, 1992.
Yamada, M. and Wang, Z. L.: 137Cs in the western South Pacific Ocean, Sci. Total Environ., 382, 342–350, 2007.
Yamada, M., Wang, Z. L., and Zheng, J.: The extremely high 137Cs inventory in the Sulu Sea: A possible mechanism, J. Environ. Radioact., 90, 163–171, 2006.
Zaborska, A., Winogradow, A., and Pempkowiak, J.: Caesium-137 distribution, inventories and accumulation history in the Baltic Sea sediments, J Environ. Radioact., 127, 11–25, 2014.