the Creative Commons Attribution 4.0 License.
the Creative Commons Attribution 4.0 License.
 | 15 May 2023
Two years of volatile organic compound online in situ measurements at the Site Instrumental de Recherche par Télédétection Atmosphérique (Paris region, France) using proton-transfer-reaction mass spectrometry
Leïla Simon
Valérie Gros
Jean-Eudes Petit
François Truong
Roland Sarda-Estève
Carmen Kalalian
Alexia Baudic
Caroline Marchand
Olivier Favez
Volatile organic compounds (VOCs) have direct influences on air quality and climate. They indeed play a key role in atmospheric chemistry as precursors of secondary pollutants, such as ozone (O3) and secondary organic aerosols (SOA). In this respect, long-term datasets of in situ atmospheric measurements are crucial for characterizing the variability of atmospheric chemical composition, its sources, and trends. The ongoing establishment of the Aerosols, Cloud, and Trace gases Research InfraStructure (ACTRIS) allows implementation of the collection and provision of such high-quality datasets. In this context, online and continuous measurements of O3, nitrogen oxides (NOx), and aerosols have been carried out since 2012 at the SIRTA (Site Instrumental de Recherche par Télédétection Atmosphérique) observatory, located in the Paris region, France. Within the last decade, VOC measurements were conducted offline at SIRTA, until the implementation of real-time monitoring which started in January 2020 using a proton-transfer-reaction quadrupole mass spectrometer (PTR-Q-MS).
The dataset acquired during the first 2 years of online VOC measurements provides insights into their seasonal and diurnal variabilities. The additional long-term datasets obtained from co-located measurements (NOx, aerosol physical and chemical properties, meteorological parameters) are used to better characterize the atmospheric conditions and to further interpret the obtained results. Results also include insights into VOC main sources and the influence of meteorological conditions and air mass origin on their levels in the Paris region. Due to the COVID-19 pandemic, the year 2020 notably saw a quasi-total lockdown in France in spring and a lighter one in autumn. Therefore, the focus is placed on the impact of these lockdowns on the VOC variability and sources. A change in the behaviour of VOC markers for anthropogenic sources was observed during the first lockdown, reflecting a change in human activities. A comparison with gas chromatography data from the Paris city centre consolidates the regional representativity of the SIRTA station for benzene, while differences are observed for shorter-lived compounds with a notable impact of their local sources. This dataset could be further used as input for atmospheric models and can be found at https://doi.org/10.14768/f8c46735-e6c3-45e2-8f6f-26c6d67c4723 (Simon et al., 2022a).
- Article
(5009 KB) - Full-text XML
-
Supplement
(5016 KB) - BibTeX
- EndNote


Long-term in situ measurements of atmospheric trace components are crucial for understanding their variability, sources, processes, and long-term trends, influencing both air quality and climate (IPCC, 2021). To this end, the European Aerosol, Clouds, and Trace gases Research InfraStructure (ACTRIS, actris.eu) provides high-quality data from in situ and remote-sensing measurements. ACTRIS Topical Centers offer technical and scientific expertise such as guidelines and external quality assurance for the set-up of long-term measurements of short-lived atmospheric constituents. An important database containing a large variety of datasets can be found at the EBAS (ACTRIS database) portal, including many variables at various European sites (https://actris.nilu.no/Data/Policy/, last access: 1 May 2023).
Among the components of interest within ACTRIS, non-methane volatile organic compounds (NMVOCs, hereafter referred to as VOCs) are key pollutants due to their multiple sources and high reactivity in the atmosphere (IPCC, 2021), acting as precursors for secondary organic aerosols (SOA) and ozone (O3) in the troposphere. While atmospheric aerosols have direct and indirect impacts on the Earth's radiative budget, O3 acts as a greenhouse gas in the troposphere (IPCC, 2021). Additionally, both are associated with adverse health effects (Daellenbach et al., 2020; Lefohn et al., 2018). In this respect, it is essential to characterize VOCs, their spatial and temporal variabilities, and their sources in order to best mitigate air pollution and minimize its impacts. While on a global scale VOCs' main sources are biogenic, anthropogenic sources such as traffic, residential wood burning, and solvent use can have major contributions in urban areas, especially in winter (Baudic et al., 2016; Kaltsonoudis et al., 2016; Languille et al., 2020).
The Paris region is the most densely populated area in France, with almost 20 % of France's population in about 2 % of the territory. The region comprises urban areas with city centres and substantial road traffic but also rural environments such as agricultural fields and forests, which represent both anthropogenic and natural sources of pollutants. While high concentrations of particulate matter were shown to be mostly advected to Paris from northern and continental Europe (Beekmann et al., 2015), VOCs are expected to be mainly of local origin due to their shorter lifetime.
Over the last decade, several studies have focused on VOCs in the Paris region (Gros et al., 2011; Gaimoz et al., 2011; Borbon et al., 2013; Ait-Helal et al., 2014; Baudic et al., 2016; Languille et al., 2020), but all were carried out over a relatively short timeframe (<1 year). Measurements in the Paris city centre showed that the main VOC sources were motor-vehicle exhaust, evaporative sources, wood burning, biogenic sources, solvent use, natural gas, and background (Gaimoz et al., 2011; Baudic et al., 2016). An important influence of the air mass origin was pointed out, notably showing that local traffic sources were dominant under oceanic air masses and that under continental air masses, remote industrial pollution was important (Gaimoz et al., 2011). Baudic et al. (2016) and Languille et al. (2020) highlighted the significant contribution of local residential wood burning in the wintertime.
Located about 20 km from the Paris city centre, the SIRTA (Site Instrumental de Recherche par Télédétection Atmosphérique) observatory platform is one of the very few suburban sites of ACTRIS. Aerosols (concentration, chemical composition, granulometry, optical properties) and reactive gases (NOx, O3) have been monitored at SIRTA for about a decade. Complementary measurements of VOCs would allow a better understanding of the sources and formation of secondary pollution in this region.
Historically, in Europe, VOCs have been monitored using mainly canister samples and gas chromatography for non-methane hydrocarbons (NMHCs) and carbonyl DNPH (2,4-Dinitrophenylhydrazine) tubes for oxygenated VOCs (OVOCs) at 17 sites of different types: rural, urban, mountain, coastal, and remote (Solberg et al., 2021). While these techniques are robust, canister samples and DNPH provide data only once to twice a week. They allow the analysis of long-term trends in the VOC levels, but it is not possible to capture emission and transformation processes. Online techniques such as gas chromatography and proton-transfer-reaction mass spectrometry (PTR-MS) enable the temporal variability of NMHCs and/or OVOCs to be captured. PTR-MS instruments were developed in the 1990s by Lindinger et al. (1998), and their short sampling time of a couple of minutes allows one to greatly characterize the pollutants' temporal variability. This technique enables the analysis of both OVOCs and NMHCs, except for alkanes and light alkenes. Long-term measurements using PTR-MS remain however rather scarce within Europe.
For the start of the long-term PTR-MS measurement at SIRTA, a pre-selection of more than 30 compounds was made. These include aromatic hydrocarbons, such as benzene and toluene, which are primary compounds emitted by anthropogenic sources like traffic and wood burning (Kaltsonoudis et al., 2016; Languille et al., 2020). Biogenic VOCs, isoprene, and monoterpenes are also monitored: these correspond to primary compounds as well but are mainly released by vegetation in summer (Jordan et al., 2009; Steinbrecher et al., 2009). Moreover, oxygenated VOCs such as methanol, acetone, acetaldehyde, and acetic acid – corresponding to primary and secondary compounds that can have biogenic and/or anthropogenic origins (Baudic et al., 2016; Bruns et al., 2017) – are also considered to be key variables for ACTRIS.
Here, we present the first long-term PTR-MS measurements at a suburban site in Europe. VOC measurements started in January 2020 at SIRTA, allowing one to document and make available, from the ACTRIS data portal, 2 years of near-real-time VOC in situ measurements. The first part of the present paper provides details on the instrumental set-up, data treatment, and quality-assurance procedures. Then, a descriptive analysis of the data is proposed. Particular interest is given to the influence of meteorology and air mass origin on the VOC loadings and on their seasonal and diurnal variabilities. Focus is placed on the COVID-19-induced lockdown period during spring and autumn 2020. Finally, the data obtained at SIRTA are compared, for a few compounds, with data from a station in the centre of Paris to assess the regional representativity.
2.1 Site presentation
The SIRTA (Site Instrumental de Recherche par Télédétection Atmosphérique) observation platform is located 20 km south-west of Paris (France) and is considered representative of suburban background conditions in the Paris region (Haeffelin et al., 2005; Sciare et al., 2011). It is one of the main ACTRIS national facilities in France. It is composed of a main site (48.718∘ N, 2.208∘ E; 156 m above sea level) for monitoring atmospheric meteorological parameters as well as for aerosol and cloud remote sensing. Dedicated in situ observations of aerosols and reactive gases are conducted at the Laboratoire des Sciences du Climat et de l'Environnement (LSCE, 48.709∘ N, 2.159∘ E; 162 m above sea level), 4 km away from the main SIRTA site.
At the main site, the ambient temperature is measured by a thermometer with a platinum resistance (PT-100), and the relative humidity is measured by an HMP 110 hygrometer, both 2 m high and at a native temporal resolution of 5 s (Haeffelin et al., 2005; Chiriaco et al., 2018). Photosynthetically active radiation (PAR) is measured by a Kipp & Zonen PQS-1 sensor. The mixed-layer height is measured by an automatic lidar and ceilometer and is derived using the CABAM (Characterising the Atmospheric Boundary layer based on ALC Measurements) algorithm (Kotthaus and Grimmond, 2018).
At SIRTA-LSCE, major sub-micron aerosol chemical species, i.e. organic matter (OM), nitrate, sulfate, ammonium, and chloride, have been measured using a Quadrupole Aerosol Chemical Speciation Monitor (Q-ACSM) since 2011 (Petit et al., 2021; Zhang et al., 2019). Complementary information on equivalent-black-carbon (eBC) concentrations and sources is provided by a collocated multi-wavelength Aethalometer (AE33, Magee Scientific; Petit et al., 2015; Zhang et al., 2019). Therefore, eBC could be discriminated between its two main combustion sources, i.e. fossil-fuel (BCff) and wood-burning emissions (BCwb), using the Aethalometer model (Sandradewi et al., 2008; Favez et al., 2010; Sciare et al., 2011; Drinovec et al., 2015). Nitrogen monoxide and dioxide (NO and NO2) have been monitored since 2012 using a chemiluminescence analyser (model T200UP, Teledyne API, USA). More information on these additional gas and particulate measurements is given in Petit et al. (2021).
The Paris region is quite densely populated, and local residential areas are situated mainly north and east of the station. Highways with important traffic (A6, A10) connect Paris to other cities and pass through the east and south of the station, and a national road with important traffic (N118) passes to the east. Forests and agricultural and natural areas are located to the west and south of SIRTA, and marine air masses from the Atlantic Ocean can reach the Paris region (Crippa et al., 2013). The station is therefore under different plumes depending on the wind direction, i.e. under regional background and oceanic air masses if the wind comes from the west/south-west or under Paris and continental plumes if the wind comes from the north/north-east (see Fig. 1). In 2020 and 2021, SIRTA was, respectively, 50 % and 36 % of the time under oceanic (SW) and continental (NE) plumes.
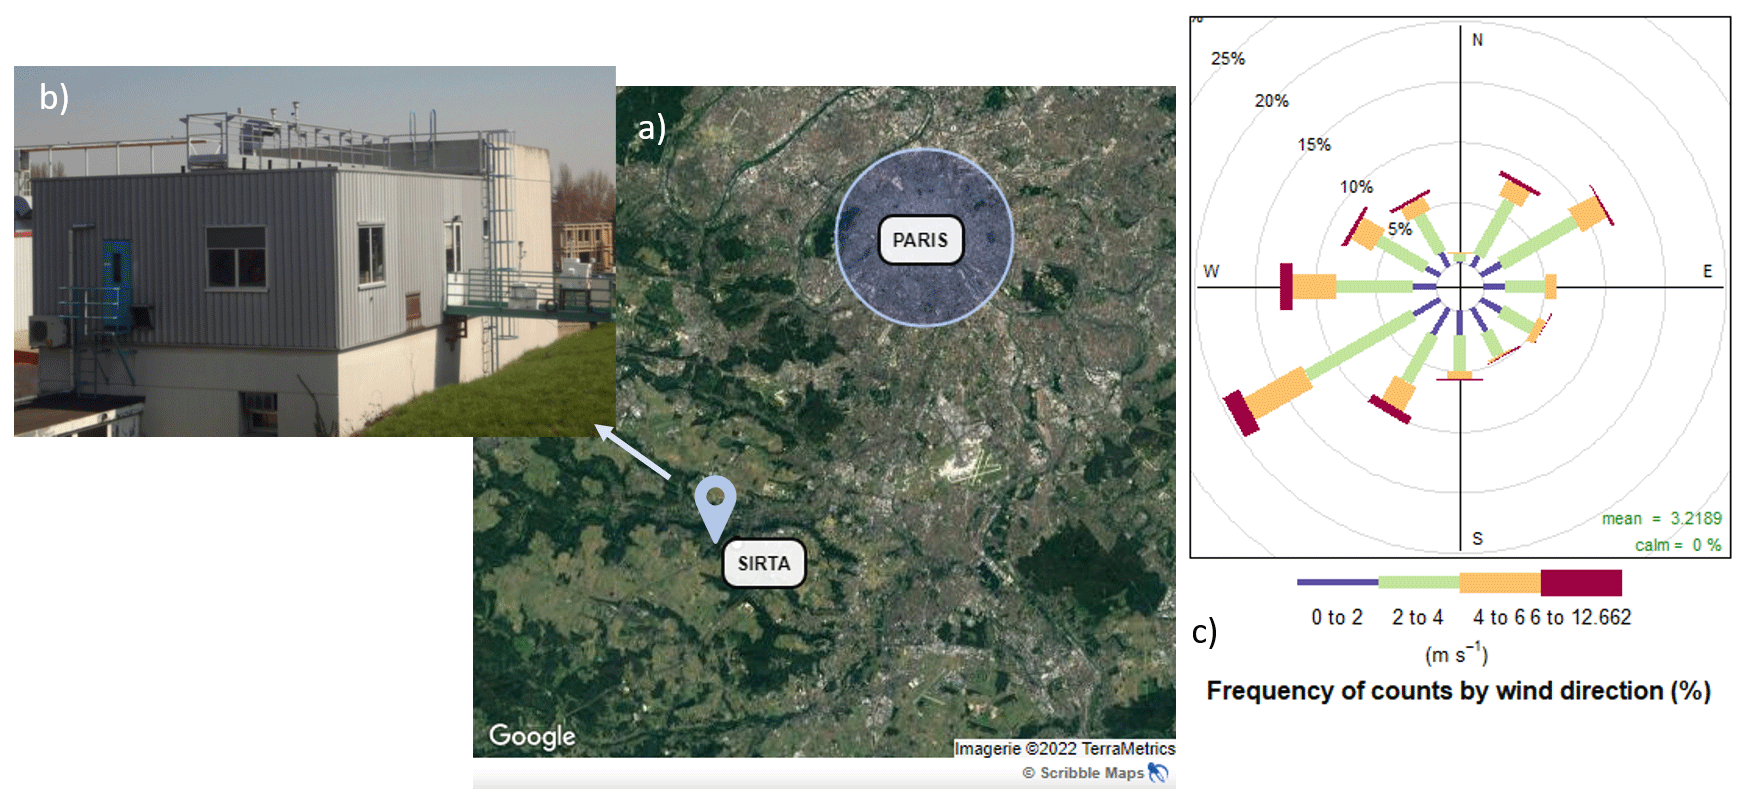
Figure 1(a) Map of the south-western part of the Paris region and the location of the SIRTA station. (b) Picture of the observatory building. (c) Wind rose: wind speed and direction occurrences at SIRTA for the period 2020–2021.
Throughout this paper, results are shown in Coordinated Universal Time (UTC), while local time corresponds to Central European Time CET (UTC + 1) from November to March and to Central European Summer Time CEST (UTC + 2) from April to October.
2.2 General description of a PTR-MS
With the aim of characterizing VOC levels on a real-time and long-term basis, a Proton-Transfer-Reaction Quadrupole Mass Spectrometer (PTR-Q-MS, Ionicon Analytik, 2010) was implemented at SIRTA from 17 January 2020 onwards. The technique was first used by Lindinger et al. (1998), where it is comprehensively described. Briefly, ambient air is pumped in the drift chamber, where gaseous molecules M with a proton affinity greater than that of water react with protonated water molecules (H3O+) produced in the ion source to form ionized MH+. Protonated compounds MH+ are then driven through a quadrupole, where they are separated according to their mass-to-charge ratio (). Finally, they pass through the electron multiplier (SEM) for detection. The obtained raw signal is in counts per second (cps) per . This soft-ionization process induces low fragmentation in the drift tube.
Regular blanks need to be performed in order to account for instrumental background, which can be significant for some . These blanks are usually done by passing clean air through the inlet line and are conducted ideally every few hours and at least once a day. The clean air is either zero air from a bottle or ambient air that passes through a heated catalyser to efficiently remove VOCs and produce VOC-free air. In order to calibrate the instrumental response to ambient VOC mixing ratios, a bottle containing a standard gas mixture can be diluted in clean air to perform several concentration steps. Usually, the standard mixture does not contain all measured compounds; therefore, another method is applied, the so-called “kinetic approach”, where the sensitivity is calculated based on the proton-transfer-reaction rate constant and the collision conditions in the drift tube (Yuan et al., 2017; Pagonis et al., 2019; IONICON, 2018). This approach, detailed in Taipale et al. (2008) and summarized in Text S1 in the Supplement, consists of calculating a transmission curve using the calibrated compounds' measured sensitivity to retrieve the other compounds' transmission and determine their sensitivity.
2.3 Operating conditions of the PTR-Q-MS at SIRTA
2.3.1 Sampling conditions
The PTR-Q-MS is located on the second and last floor of the building, and therefore the sampling line is directly connected to the roof and samples at about 15 m above ground level. The experimental set-up is shown in Fig. S1. The sampling line has a total length of 6 m, with an inner diameter of 9.53 mm and an outer diameter of 12.7 mm ( inch). A pump provides a flow of about 8 L min−1, thus ensuring a residence time for the air in the tube of about 3 s. The sampling line is made of PFA (perfluoroalkoxy). It is isolated and heated with heating wires around the line and with a thermocouple monitoring the temperature at 50 ∘C to avoid condensation. Such a material needs to be passivated at the beginning of the measurement, and therefore the first 3 d of measurements were not taken into account. A multi-way valve (VALCO, Interchim, France) in stainless steel connects ambient-air, blank, and standard measurements to the PTR-MS inlet, therefore allowing one to automatically switch between them.
2.3.2 Instrument parameters
For long-term measurements at SIRTA, the drift pressure (pdrift) was set to 2.2 mbar, drift voltage (Udrift) was set to 600 V, and drift temperature (Tdrift) was set to 60 ∘C, resulting in an ratio (parameter corresponding to the ratio of the electric field to the number density of the gas in the drift tube) of 134 Td. A lower would induce more humidity in the instrument, while a higher would result in more fragmentation of the compounds (Taipale et al., 2008). Higher humidity implies an increased number of water clusters (H2O⋅H3O+) in the drift tube, which can act as primary ions for the VOCs as well (Blake et al., 2009). Other parameters such as water flow, ion source current, voltages at the entrance and exit of the drift chamber, and detector voltage were adjusted when needed in order to maintain the instrument functioning in an optimized way (see Table S1). For example, if the sensitivity decreased and it was not due to the ion source, the detector voltage was increased; also, after maintenance, the drift chamber voltages could be adjusted to keep the amount of 30, 32, and 37 low. A calibration was performed after changes in the parameters.
2.3.3 Measured mass-to-charge ratios
The PTR-Q-MS can work either in scan mode, in which case all values are scanned in a defined range, or the that will be measured are defined ahead. The scan mode is often used to investigate which have a distinct signal in sampled air; however, a complete scan cycle, with a dwell time of 5 s per , would take 11 min. Throughout the measurement period, it was observed that a dwell time of 5 s per mass can result in noisy signals, and so a dwell time of 10 s was preferred, which would result in a resolution time of 22 min. In order not to lose the advantage of a resolution time of <15 min, which can be useful for studying specific events at a high time resolution, the selection method was chosen.
The selection for measured was therefore performed based on previous studies and using the scan mode for a couple of days before starting the long-term measurements. Mass-to-charge ratios were selected based on previous studies: reviews of PTR-MS measurements (de Gouw and Warneke, 2007; Blake et al., 2009; Yuan et al., 2017), a winter campaign at SIRTA that highlighted markers for the traffic and wood-burning source (Languille et al., 2020), and a study on agricultural emissions from a farm in the Paris region (Kammer et al., 2019). The scan mode was run for a couple of days before starting the long-term measurements to confirm the selection. This resulted in 37 mass-to-charge ratios measured, the first six being for instrumental diagnostic purposes: 21, 25, 30, 32, 37, 55, 31, 33, 42, 45, 46, 47, 57, 58, 59, 60, 61, 63, 69, 71, 73, 75, 79, 81, 83, 85, 87, 93, 97, 99, 107, 111, 121, 137, 139, 147, 151. The dwell time of the first six was set to 100 ms, while the dwell time of all the other was 5 s from January to November 2020. On 4 December it was increased to 10 s, resulting in time resolutions, respectively, of 2.6 min from January to November 2020 and 5.2 min from December 2020 on.
2.3.4 Blanks, calibration, and parts-per-billion calculation
A Gas Calibration Unit (GCU, IONICON, Austria), equipped with a catalytic VOC scrubber made of Pt or Pd and heated at 350 ∘C, was used for 1 h blanks every 13 h and for regular calibrations about once a month: a VOC standard mixture was injected through the dilution system inside the GCU to perform steps at different volume-mixing ratios (VMRs, ranging from 1 to 20 ppb). After each calibration, the transmission was calculated for some of the calibrated compounds (methanol, acetonitrile, acetaldehyde, propenal, benzene, toluene, C8 aromatics, C9 aromatics, dichlorobenzene, and trichlorobenzene, when available) using their measured sensitivities (Eq. S1). As an example, two consecutive transmission curves are presented in Fig. S2 for 1 July 2020 and 7 August 2020. The transmission coefficients were interpolated linearly over time. The same standards were used for the transmission as for the calibration, since we used the measured sensitivities to calculate the transmission. The compounds which could fragment were not included in the calculation of the transmission curve (e.g. isoprene, monoterpenes). Different standards were used throughout the study period (see Table S2), allowing one to directly calibrate 9 to 13 species, depending on the standard. The obtained sensitivity coefficients are given in Table S3. Figure 2 presents the temporal evolution of these measured sensitivity coefficients for methanol, acetone, and benzene shape-coded by the standard reference, as well as the maintenance periods. Here, a sensitivity decrease was observed with the use of the PTR-MS (i.e. ion source dirtying, detector aging), while an increase was obtained with the detector (SEM) voltage increase. It can be noted that the standard change resulted in a lower sensitivity shift than the shift due to instrumental evolution and maintenance.
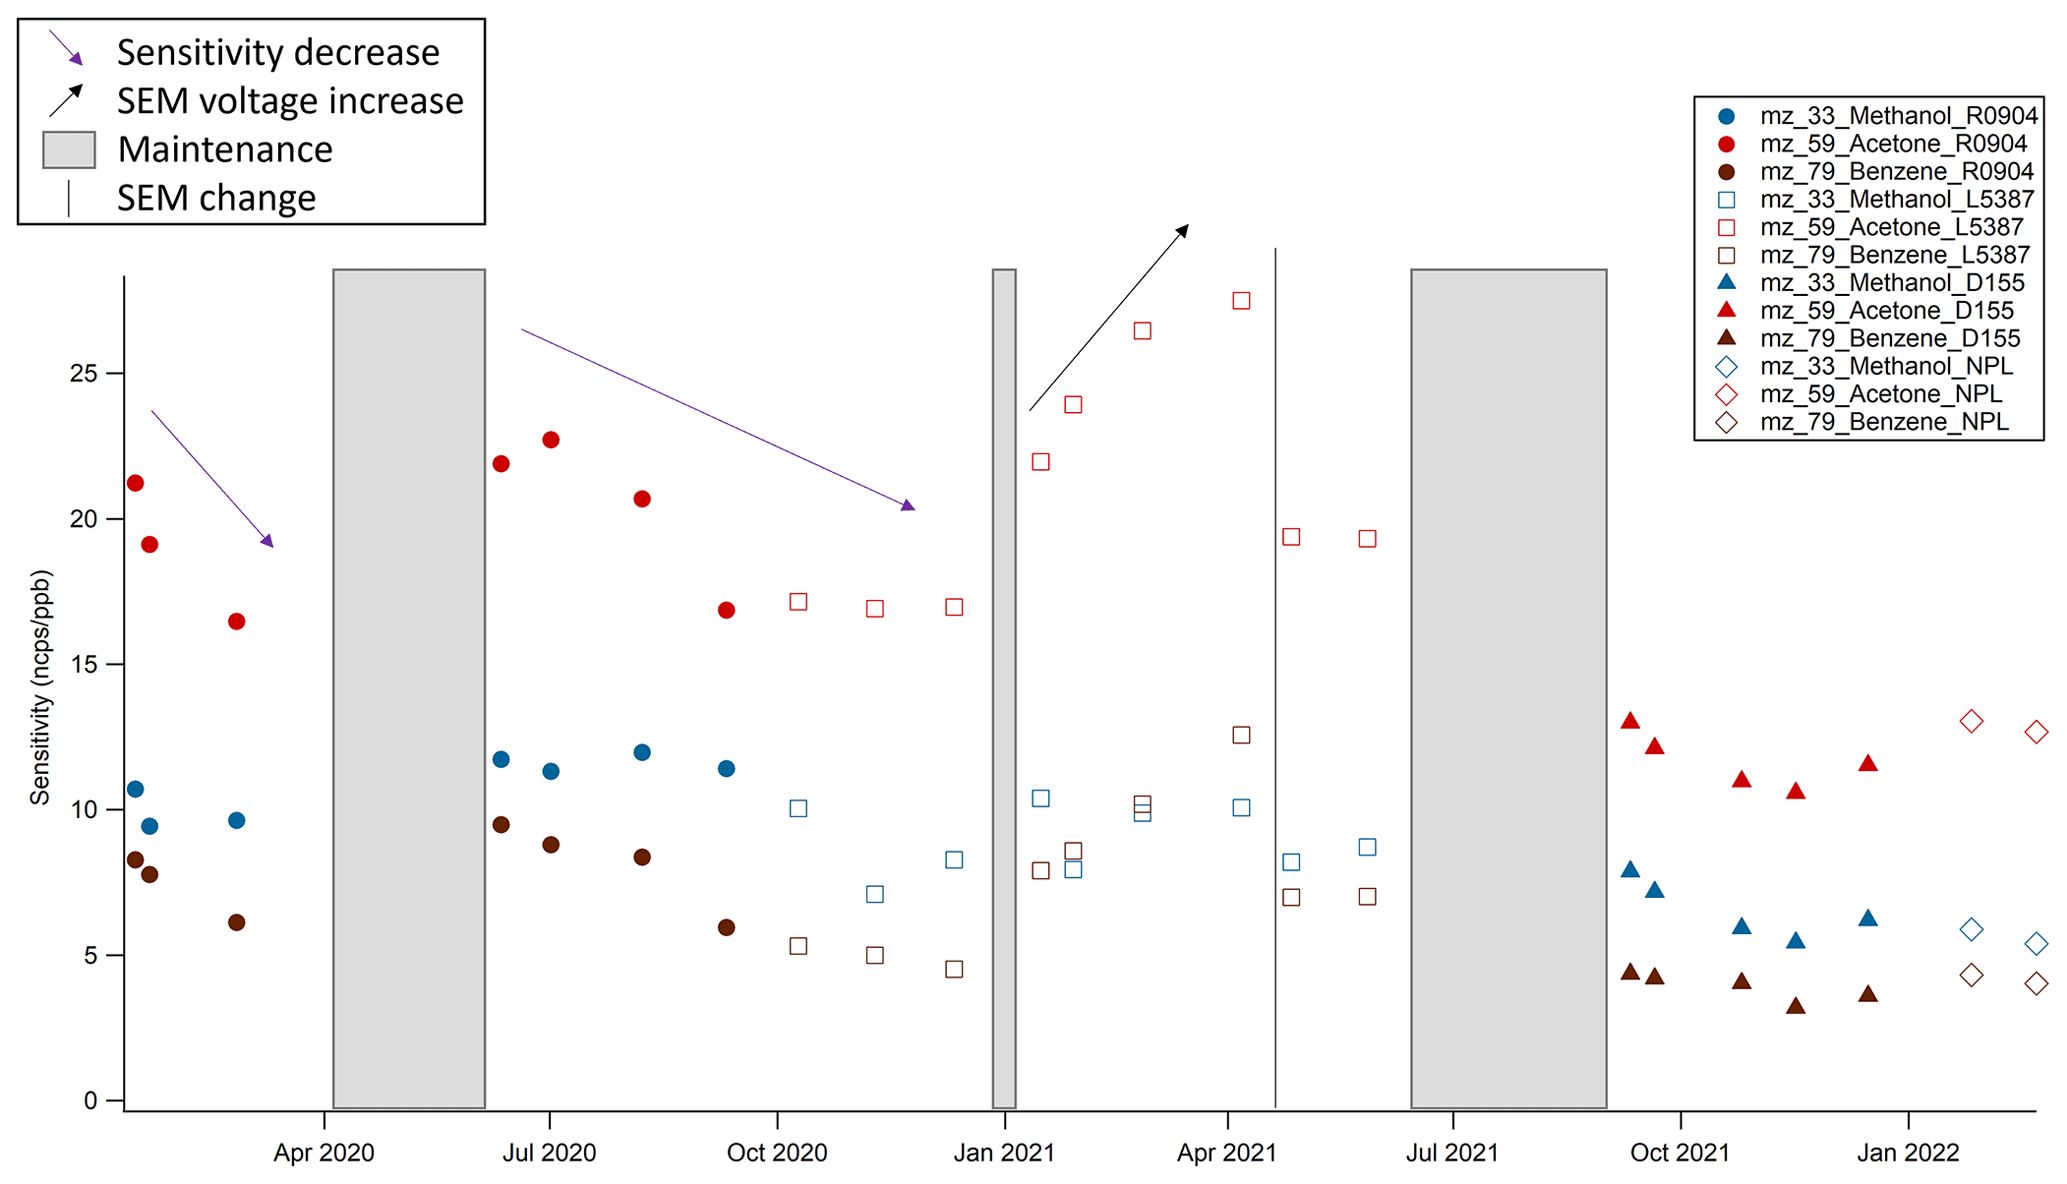
Figure 2Time series of sensitivities for methanol, acetone, and benzene. Standard references are indicated by the shapes of the data points (Table S2).
The ambient counts per second were normalized by primary ions (H3O+, 21) and water clusters (H2O⋅H3O+, 37) following Eq. (1).
At the beginning of the measurement period (2020–2021), a value of 1 was chosen for the Xr factor to take into account the fluctuations of ambient relative humidity (see the discussion about the humidity impact in Sect. 2.4.1).
The obtained blanks (ncps – normalized counts per second) and sensitivities (ncps / ppb) were interpolated and were used to retrieve the ambient VMRs.
2.4 Quality control
2.4.1 Internal quality control and maintenance
The measurements, especially the diagnostic , and the instrument parameters (pressures, voltages, source intensity, water flow; Table S1) were checked at least twice a week in order to diagnose an issue with the PTR-Q-MS. As long as there was no issue in the PTR-MS and for a period with the same set parameters, the drift pressure, the detector pressure, the controlled pressure, the water flow, the drift voltages, and the ion source voltage were stable; their mean coefficients of variation were, respectively, 0.2 %, 1.6 %, 0.3 %, 0.1 %, 0.1 %, and 0.9 %. A decrease in the water-bottle flow indicated that it needed to be filled again, a drastic change in the pressures could indicate a leak in the system, and a sudden change in the voltages implied a potential issue with the pumps. A target bottle, containing ambient air, was measured once per week in order to check that the measurements did not deviate too much from their mean value. The mean and standard deviation values for the target-bottle measurements of ions that have a signal >10 ppt are given in Table S5, and the temporal evolution of acetone and benzene is presented in Fig. S4. These measurements show a mean coefficient of variability of 33 % over the whole 2020–2021 period.
An NPL-certified standard (National Physical Laboratory, 2021), considered a reference standard for ACTRIS, was purchased at a second stage. It was used for comparison, and the difference in sensitivity with the other standard was on average 7 % (ranging from 0 % to 18 %, the maximum range being found for methanol). This standard was also used to infer the repeatability of the measurement at the end of May 2022: it was sampled with the same protocol (same dilution, a blank before and after) over 3 consecutive days, while environmental conditions (i.e. temperature and relative humidity) might vary a little. The obtained coefficients of variation for this test were on average 5 % (ranging from 1 % to 12 %, the maximum value being for trimethylbenzenes). In addition, the influence of humidity on the sensitivity was investigated by performing calibrations using the NPL standard at set relative humidities (RHs) of 30 %, 60 %, and 90 % on 4 August 2022. Results for these tests are presented in Table S4 and Fig. S3: the humidity dependency of the sensitivities for the considered species was on average 3 % (ranging from 1 to 7 %, the maximum value being for acetonitrile). The difference was much lower for the RH range 60 %–90 %, which corresponds to 72 % of the data, than for the range 30 %–60 %. This suggested that a value of Xr of 0 would be more accurate for the calculation of ncps (Sect. 2.3.4) due to the very low humidity dependency determined. We have estimated the impact of this choice by calculating (on several periods from different seasons in 2021 and 2022) the difference in the mixing ratio when considering Xr=0 instead of Xr=1. The mean difference being 2 %, the uncertainty associated with this choice was considered to be included in the 5 % uncertainty taken into account for humidity changes (see the uncertainty calculation in Sect. 2.4.4).
Throughout the 2-year period, the PTR-Q-MS encountered a couple of shutdowns due to common mild dysfunctions, with a usual downtime of around 1 week. Nevertheless, two major breakdowns occurred: one from April to June 2020, when troubleshooting and maintenance were not possible due to the COVID-19 lockdown, and the second one from June to August 2021 because the diagnosis of the issue was difficult.
In addition, each step of the data treatment and the obtained data was carefully verified, and erroneous or outlier data points were deleted.
Considering periods where the PTR-Q-MS was down and the data that had to be invalidated, this resulted in a data coverage of 61 % between the start of the measurements and the end of 2021. The data coverage per season, considering 2 whole years expected, is 74 % in winter, 37.5 % in spring, 42 % in summer, and 85 % in autumn.
2.4.2 PTR-ToF-MS campaigns
Isobaric compounds cannot be separated with a quadrupole mass spectrometer, but they can be with time-of-flight mass spectrometry (ToF-MS). For example, at 69 two important compounds are detected: isoprene (C5H8) and furan (C4H4O). While isoprene is an abundant biogenic compound, furan can be emitted by biomass burning in winter (Bruns et al., 2017; Languille et al., 2020; Coggon et al., 2019).
In order to separate and investigate isobaric compounds throughout the year, a PTR-ToF-MS (Ionicon, 1000) was deployed during several months in 2020. This paper does not intend to intercompare both PTR-MS instruments at SIRTA: the PTR-ToF-MS was only used here to determine the contribution of isobaric compounds to their nominal mass and tentatively attribute compounds to measured mass-to-charge ratios. A first campaign took place from 17 February 2020 to 16 March 2020, a second one from 10 April 2020 to 20 July 2020, and a third one from 6 November 2020 to 16 December 2020. The PTR-ToF-MS was installed in another room from the PTR-Q-MS (about 100 m away) and with a different set-up. A second 16 m PFA sampling line with an inner diameter of 9.63 mm, isolated and heated at 50 ∘C, was used to sample at the same height as the PTR-Q-MS. A pump provided a flow of 22 L min−1, thus resulting in a residence time of about 3 s. Blanks were performed manually using a catalytic converter (Zero air generator, Parker, France) once every other working day during the campaigns, except during the lockdowns (16 March 2020 to 11 May 2020 and 30 October 2020 to 15 December 2020), when they were performed once to twice a week. Figure S5 presents the temporal evolution of the obtained blanks where the different periods (i.e. campaigns, lockdowns) are highlighted. Most of these blanks were rather stable, and they were interpolated for the data treatment. Calibrations were done about once a month using the internal dilution system (flowmeters situated inside the instrument). The calibration standards used were a canister (Fig. S6) until mid-May 2020 and the standard bottle D155286 (Table S2) from mid-May 2020. The temporal evolution of the obtained sensitivities is shown in Fig. S7. The sensitivity decreased gradually with time, as was observed for the PTR-Q-MS.
2.4.3 Tentative attribution of mass-to-charge ratios
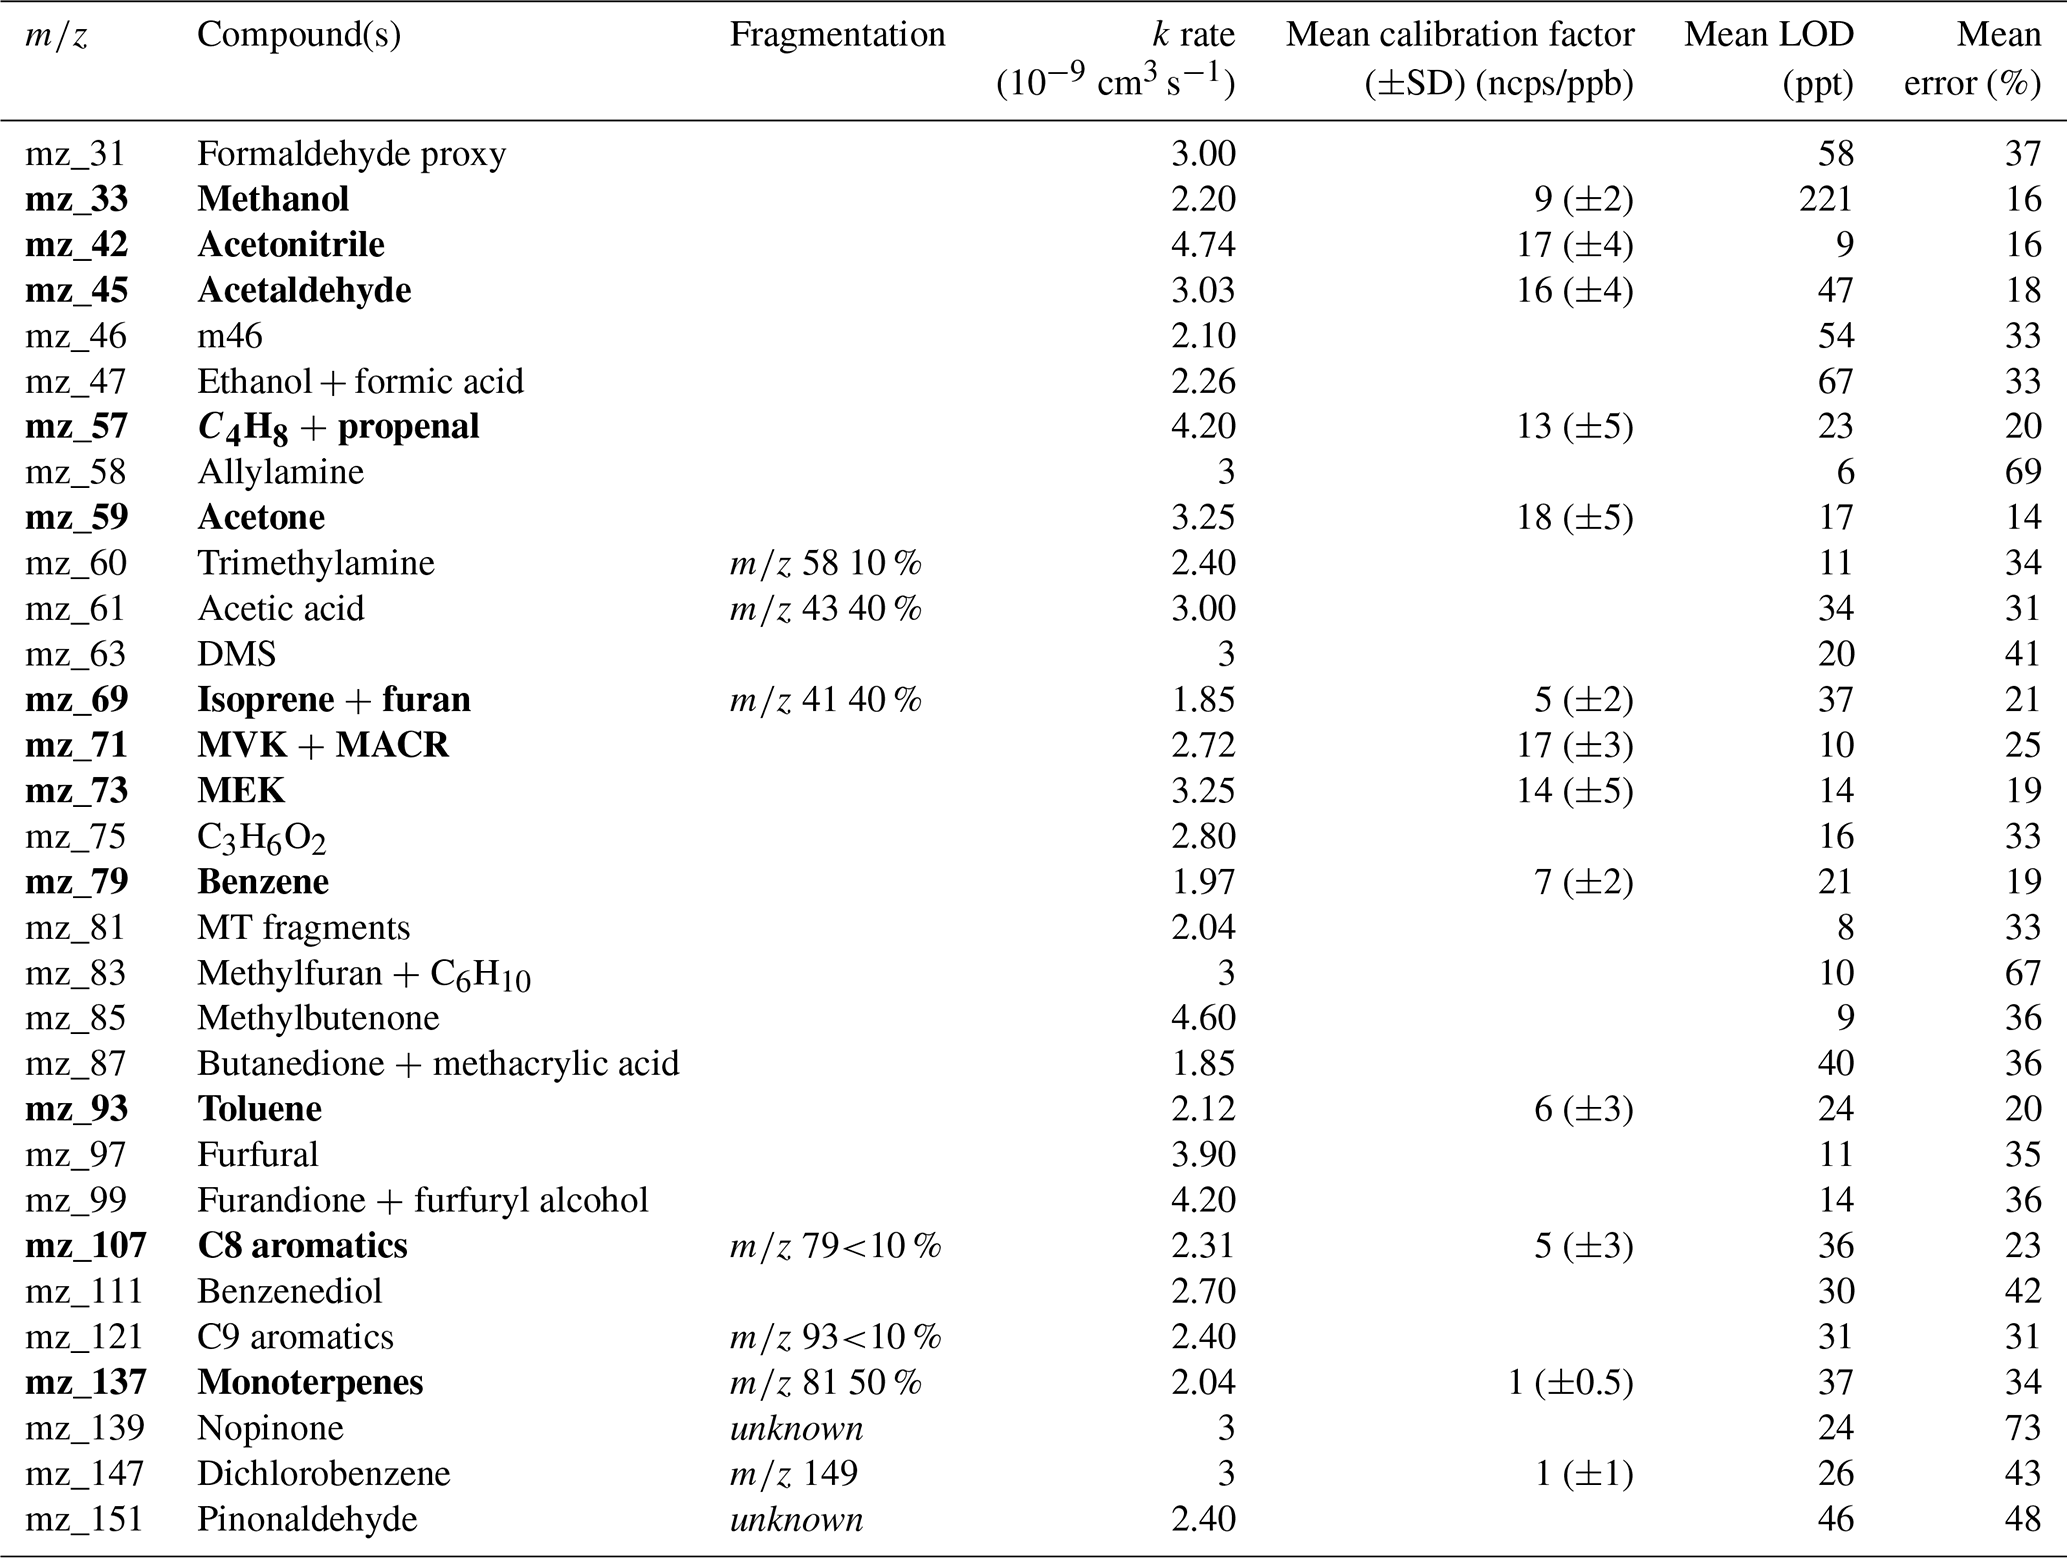
VOCs were tentatively attributed to the measured , based on the literature and on the PTR-ToF-MS measurements. All , the attributed compound(s), possible fragmentation, reaction-rate constants, measured sensitivities, and their calculated detection limit and uncertainties are given in Table 1. A thorough discussion of each is provided in Text S2. Specific nominal masses with different contributions per season are highlighted in Table 2, and 69 is discussed below.
Table 1List of mass-to-charge ratios measured, their corresponding names in this paper, possible fragmentation (Pagonis et al., 2019), reaction-rate constants (Holzinger et al., 2019; Španěl et al., 2002; Zhao and Zhang, 2004; Lindinger et al., 1998), mean and standard deviation of measured sensitivities, mean detection limit (LOD), and mean uncertainty. Compounds in bold are the ones that underwent the quality control of ACTRIS.
69 was assigned to C4H4O, furan and C5H8, and isoprene and fragments of methylbutenol (MBO), but PTR-ToF-MS measurements showed that MBO is negligible (see the discussion of 87 in Text S2). Furan is emitted by biomass-burning activities and has the highest contributions in autumn and winter, while in spring and summer, 69 can be almost exclusively attributed to isoprene due to its important biogenic source, although it can also be emitted by anthropogenic sources (Borbon et al., 2001; Wagner and Kuttler, 2014; Panopoulou, 2020).
2.4.4 Detection limit and uncertainty calculation, ACTRIS quality control
The detection limit (LOD) and the uncertainties for each were calculated using the formulas from the ACTRIS guidelines (in preparation), which are based on de Gouw and Warneke (2007):
with the ion count per second of the blank signal and Sm(RH+) the unnormalized sensitivity (cps / ppb).
with the precision calculated as the relative standard deviation:
with and the ion counts for the ambient and blank signals, respectively.
The accuracy corresponds to the quadratic propagation of the error on the GCU and on the standard. The error on the GCU was evaluated to be equal to 10 % and the errors on the standard for each compound are available on its certificate and range from 5 % to 10 %. Finally, an error of 5 % is added to take into account the uncertainty due to humidity changes.
Table 1 presents the 2-year-averaged value of the point-by-point calculated LOD and error for all compounds: the detection limit ranged from 6 to 221 ppt and the uncertainties ranged from 14 % to 73 %.
An internal quality check was performed on all (see Sect. 2.4.1 above), while an external quality control was also performed by ACTRIS on 12 masses corresponding to the following compounds: benzene, propenal + C4H8, isoprene + furan, C8 aromatics, monoterpenes, toluene, acetonitrile, acetaldehyde, acetone, MEK (methyl ethyl ketone), methanol, and methyl vinyl ketone and MVK + MACR (methyl vinyl ketone + methacrolein). The external quality check was performed by the Central Facility unit of ACTRIS responsible for VOC measurements (CiGas). It consisted in examining carefully the dataset and performing different figures (e.g. scatter plots) to point out and discuss questionable data (outliers, potential contamination). These data could then be flagged accordingly (valid but lower than the detection limit, valid but corresponding to a local event, or missing because invalidated). In addition, for long-lived compounds, a comparison with baseline values from other European stations was performed to check the consistency of the datasets. Once the submitted data and corresponding flags were compliant and validated by ACTRIS, they were made available on EBAS, which is the ACTRIS open-source database. The 2020–2021 dataset presented here can therefore be found on the corresponding website at https://ebas-data.nilu.no (last access: 1 May 2023).
3.1 Descriptive analysis
Levels and statistical variabilities of the measured VOCs are shown in Fig. 3 for the 2-year period. The compounds were grouped, depending on their nature, into seven families: methanol + acetone, oxygenated, aromatics, non-aromatic hydrocarbons, nitrogen-containing, sulfur-containing, and halogenated. Methanol and acetone were separated from the other oxygenated VOCs due to their volume-mixing ratio being higher than other individual oxygenated compounds and for the sake of clarity in the next graphs. Note that S-containing and halogenated groups contain only dimethylsulfide and dichlorobenzene, respectively. Due to their low levels and noisy signals, they are not presented in the figures for the rest of the paper. The statistics (mean, median, and 5th, 25th, 75th, and 95th percentiles) for all are given in Table S6.
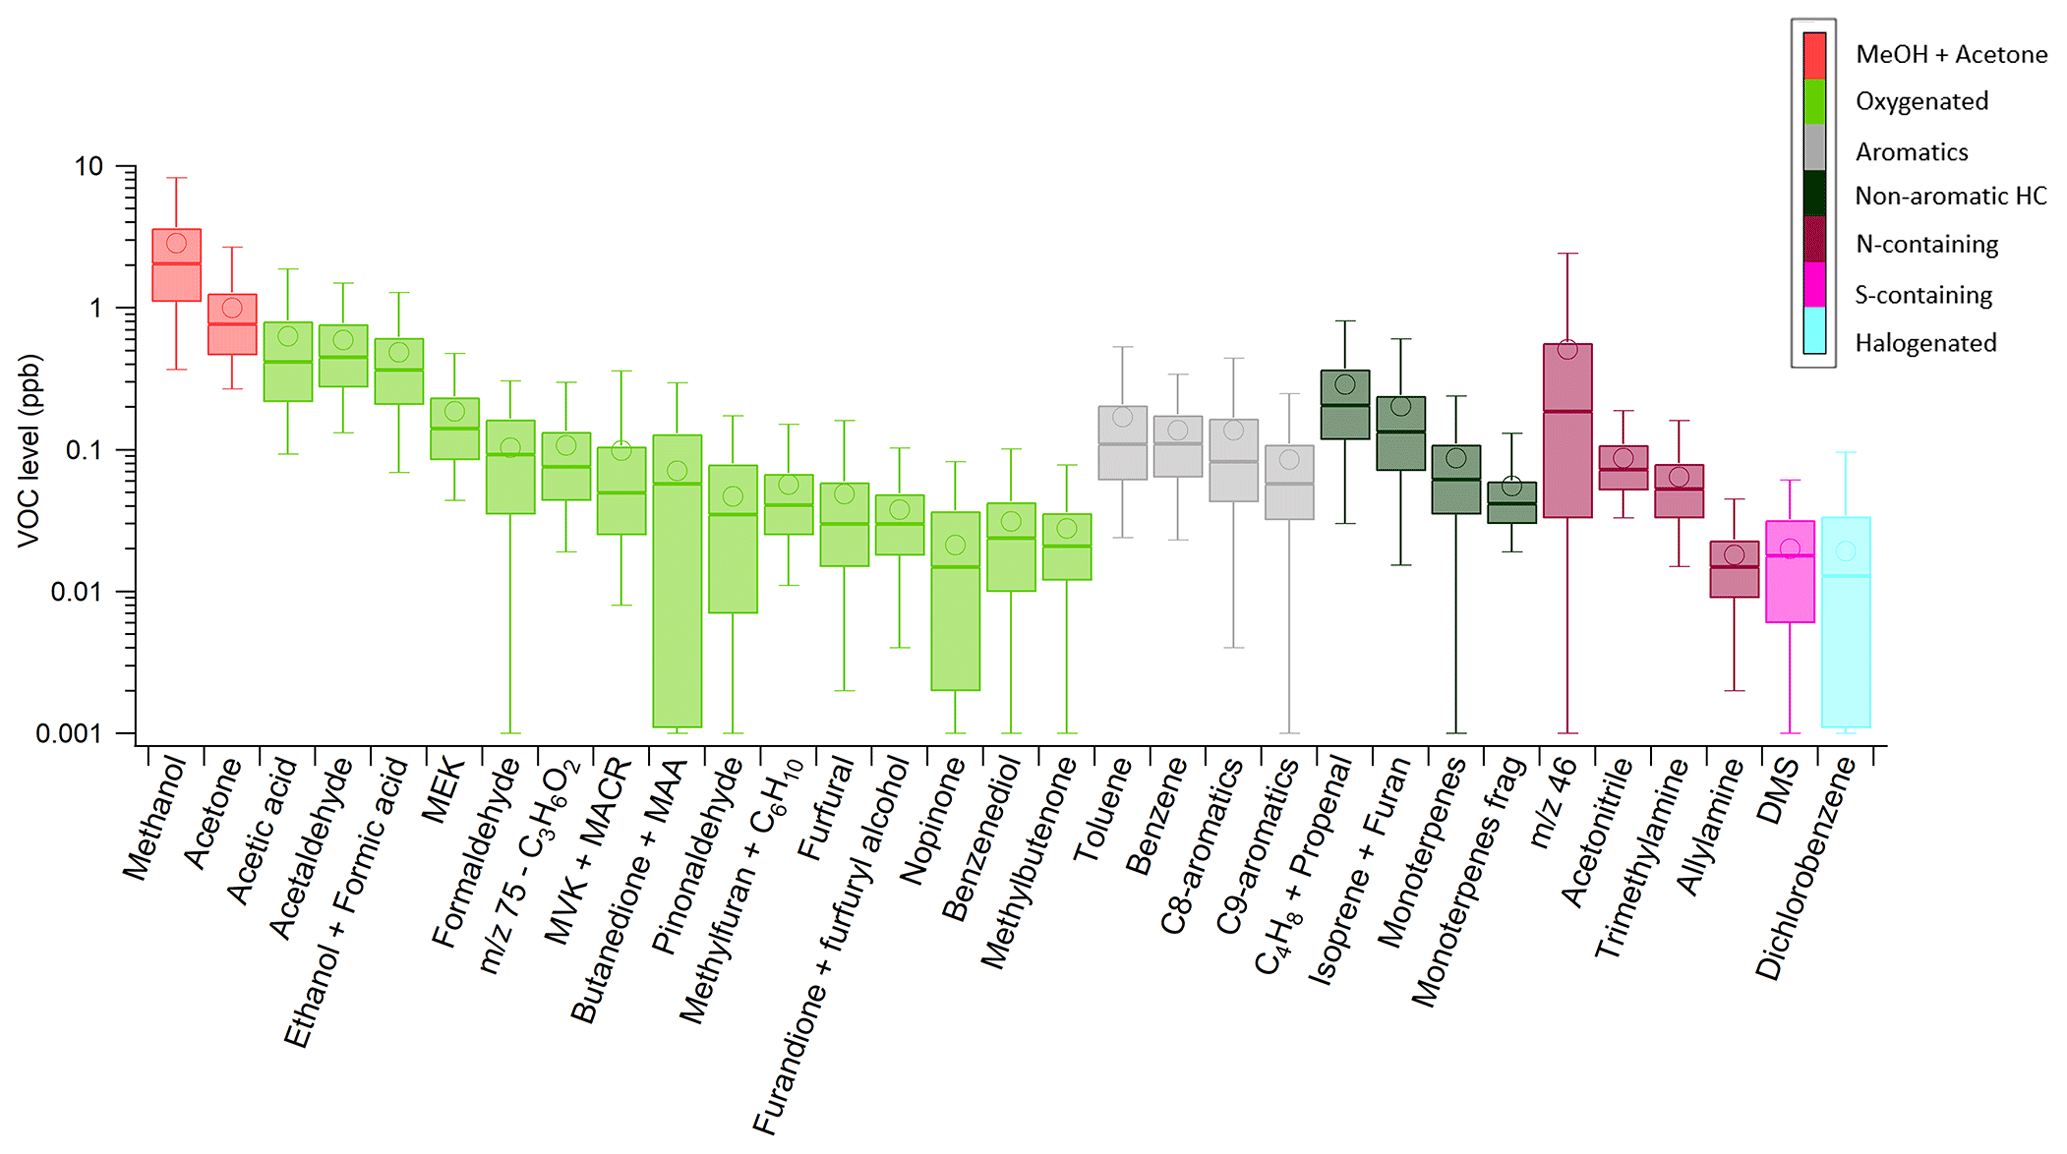
Figure 3Statistical distribution of VOC measurements during the 2-year period. Boxes represent the 25th and 75th percentiles, and the line is the median. Whiskers represent the 5th and 95th percentiles, and the circles represent the mean value.
Methanol and acetone showed the highest levels with mean values above 1 ppb, as previously observed in the Paris region (Gros et al., 2011; Baudic et al., 2016; Languille et al., 2020). The group of oxygenated compounds presents a large variability of concentrations: acetic acid, acetaldehyde, and ethanol + formic acid have a mean concentration of around 0.5 ppb, while nopinone, benzenediol, and methylbutenone have a mean concentration of around 0.03 ppb. The levels of the different aromatic compounds and groups are very similar.
3.2 Overview of VOC variability and influence of air mass origin
The time series over 2020 and 2021 of the VMR of VOCs per family are shown in Fig. 4. Methanol and acetone show a high variability, with cumulated levels of up to 30 ppb in the summertime, while they are on average lower than 5 ppb in winter. Conversely, the other oxygenated compounds have similar levels throughout the year, as they come from both biogenic and wood-burning sources. Aromatic compounds dramatically increase during pollution episodes, empirically defined here as a period of at least 3 successive days with a daily maximum value of aromatics >1 ppb and at least one daily mean value >1 ppb. These events especially occur in autumn/winter (11 events in autumn/winter vs. 4 in spring/summer), due to lower temperatures, more active sources, and a lower boundary layer (Baudic et al., 2016; Languille et al., 2020), inducing less dispersion of the pollutants. Nitrogen-containing compounds increase in spring, most probably due to agricultural sources being important in this season, as is also seen for ammonium nitrate (Petit et al., 2015; Beekmann et al., 2015), but they also increase during some of the pollution events (i.e. at the end of January 2020), which could indicate other anthropogenic sources.

Figure 4Time series of cumulated concentrations of VOCs within the different families. The black dotted line marks the separation between 2020 and 2021 and the grey dotted lines mark every 3 months.
The influence of air mass origin was investigated to better understand the levels and variability of the VOCs. This was done using a cluster analysis from ZeFir (Petit et al., 2017) based on the HYSPLIT 120 h back trajectories reaching SIRTA calculated every 3 h from January 2020 to December 2021. Only latitude and longitude have been taken into account for the clustering, as commonly performed in other studies (e.g. Petit et al., 2021). This analysis is not meant to provide thorough information on the geographical origins of the measured VOCs but more on the impact of air mass origin on the levels and composition of VOCs.
In total, seven clusters were obtained (see Fig. 5a below), corresponding to continental air masses, an anticyclonic cluster, three oceanic air masses of which two were grouped into oceanic 1 and oceanic 2, and two air masses from the north (North 1 and North 2). Continental and North 1 are expected to be polluted air masses due to their probability of passing over Paris and other dense urban areas in the Benelux, thus accumulating pollution along the way. The local anticyclonic cluster is also expected to be polluted due to local sources and more stable meteorological conditions. On the other hand, both oceanic clusters and North 2 are expected to be clean due to fewer anthropogenic sources. The oceanic air masses were dominant (44 % in total), followed by North air masses (22 % in total), the anticyclonic cluster (21 %), and the continental cluster (13 %). Continental air masses and air masses from the north are more dominant in spring (around 40 %), while the oceanic 1 cluster is more occurrent in winter (45 %, Table S7).

Figure 5(a) Map of obtained air mass clusters for the period 2020–2021 (ZeFir) and (b) VOC level and composition per cluster.
The contribution to each cluster of the level of the VOC families is shown in Fig. 5b. The mean VMR of each for each cluster is given in Table S8. As expected, the most polluted clusters were continental, anticyclonic, and North 1 (Fig. 5b). While oceanic air masses are the most frequent, they contribute the least to the VOC levels. There does not seem to be a real difference in the composition of the different clusters; however, small changes can be seen. For instance, nitrogen-containing compounds are dominated by continental air masses (see Fig. 6), which could indicate agricultural sources located in that direction. Another possibility is the formation of alkyl nitrates (including peroxyacetyl nitrate – PAN) by atmospheric aging of hydrocarbons in the presence of NO, measured as a NO fragment at 46 (Kastler and Ballschmiter, 1998; Müller et al., 2012). It should be noted that this fragment comprises 31 % of the N-containing class, and although we cannot rule out an instrumental bias, the R2 correlation of 46 and NO3 being equal to 0.83 suggest that this is an atmospheric signal. Aromatic VOCs contribute more to the North air masses. Non-aromatic hydrocarbons contribute more to the anticyclonic and oceanic 1 air masses, indicating local or regional sources and/or a short lifetime.
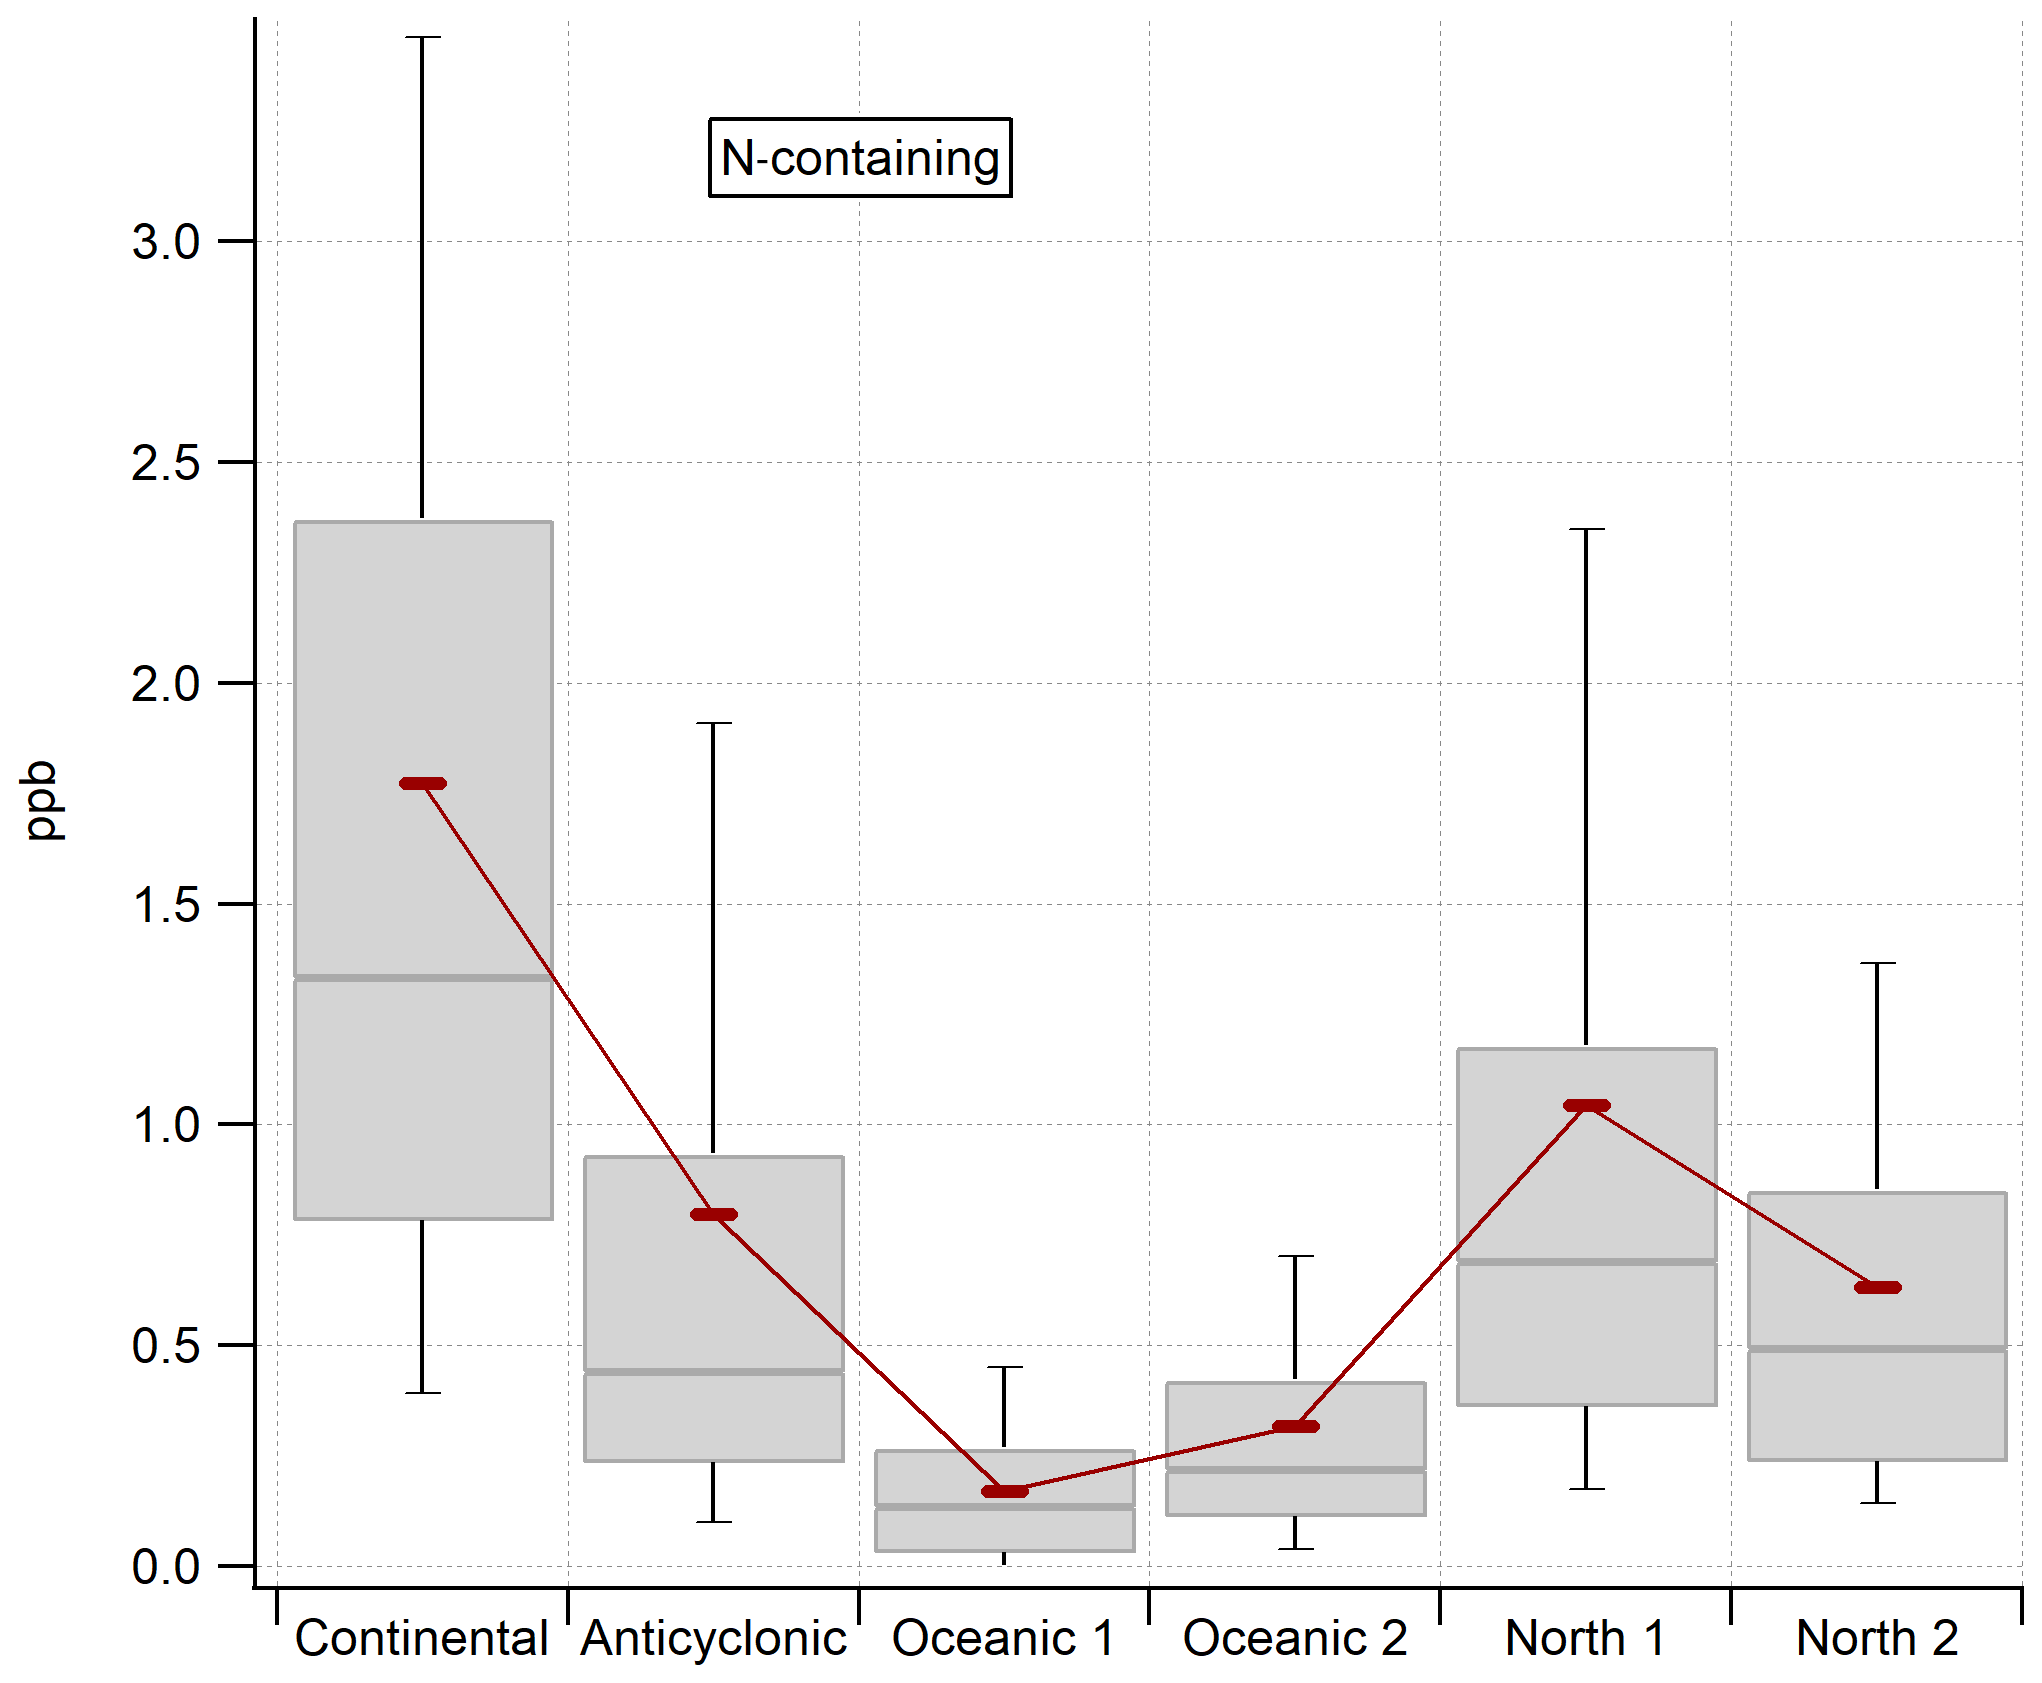
Figure 6Statistical distribution of N-containing compounds per air mass cluster. Boxes represent the 25th and 75th percentiles, and the line is the median. Whiskers represent the 5th and 95th percentiles, and the red dash represents the mean value.
3.3 Seasonal and diurnal variability of the VOCs
In this section, the seasonal variability of individual VOCs is explored, these VOCs being from different families, having different sources, and presenting different variabilities. Figure 7 presents the level and statistical variability per months of 2020 and 2021 of methanol, benzene, isoprene + furan, MVK + MACR, toluene, and monoterpenes as well as temperature, relative humidity, and the mixed-layer height (MLH).
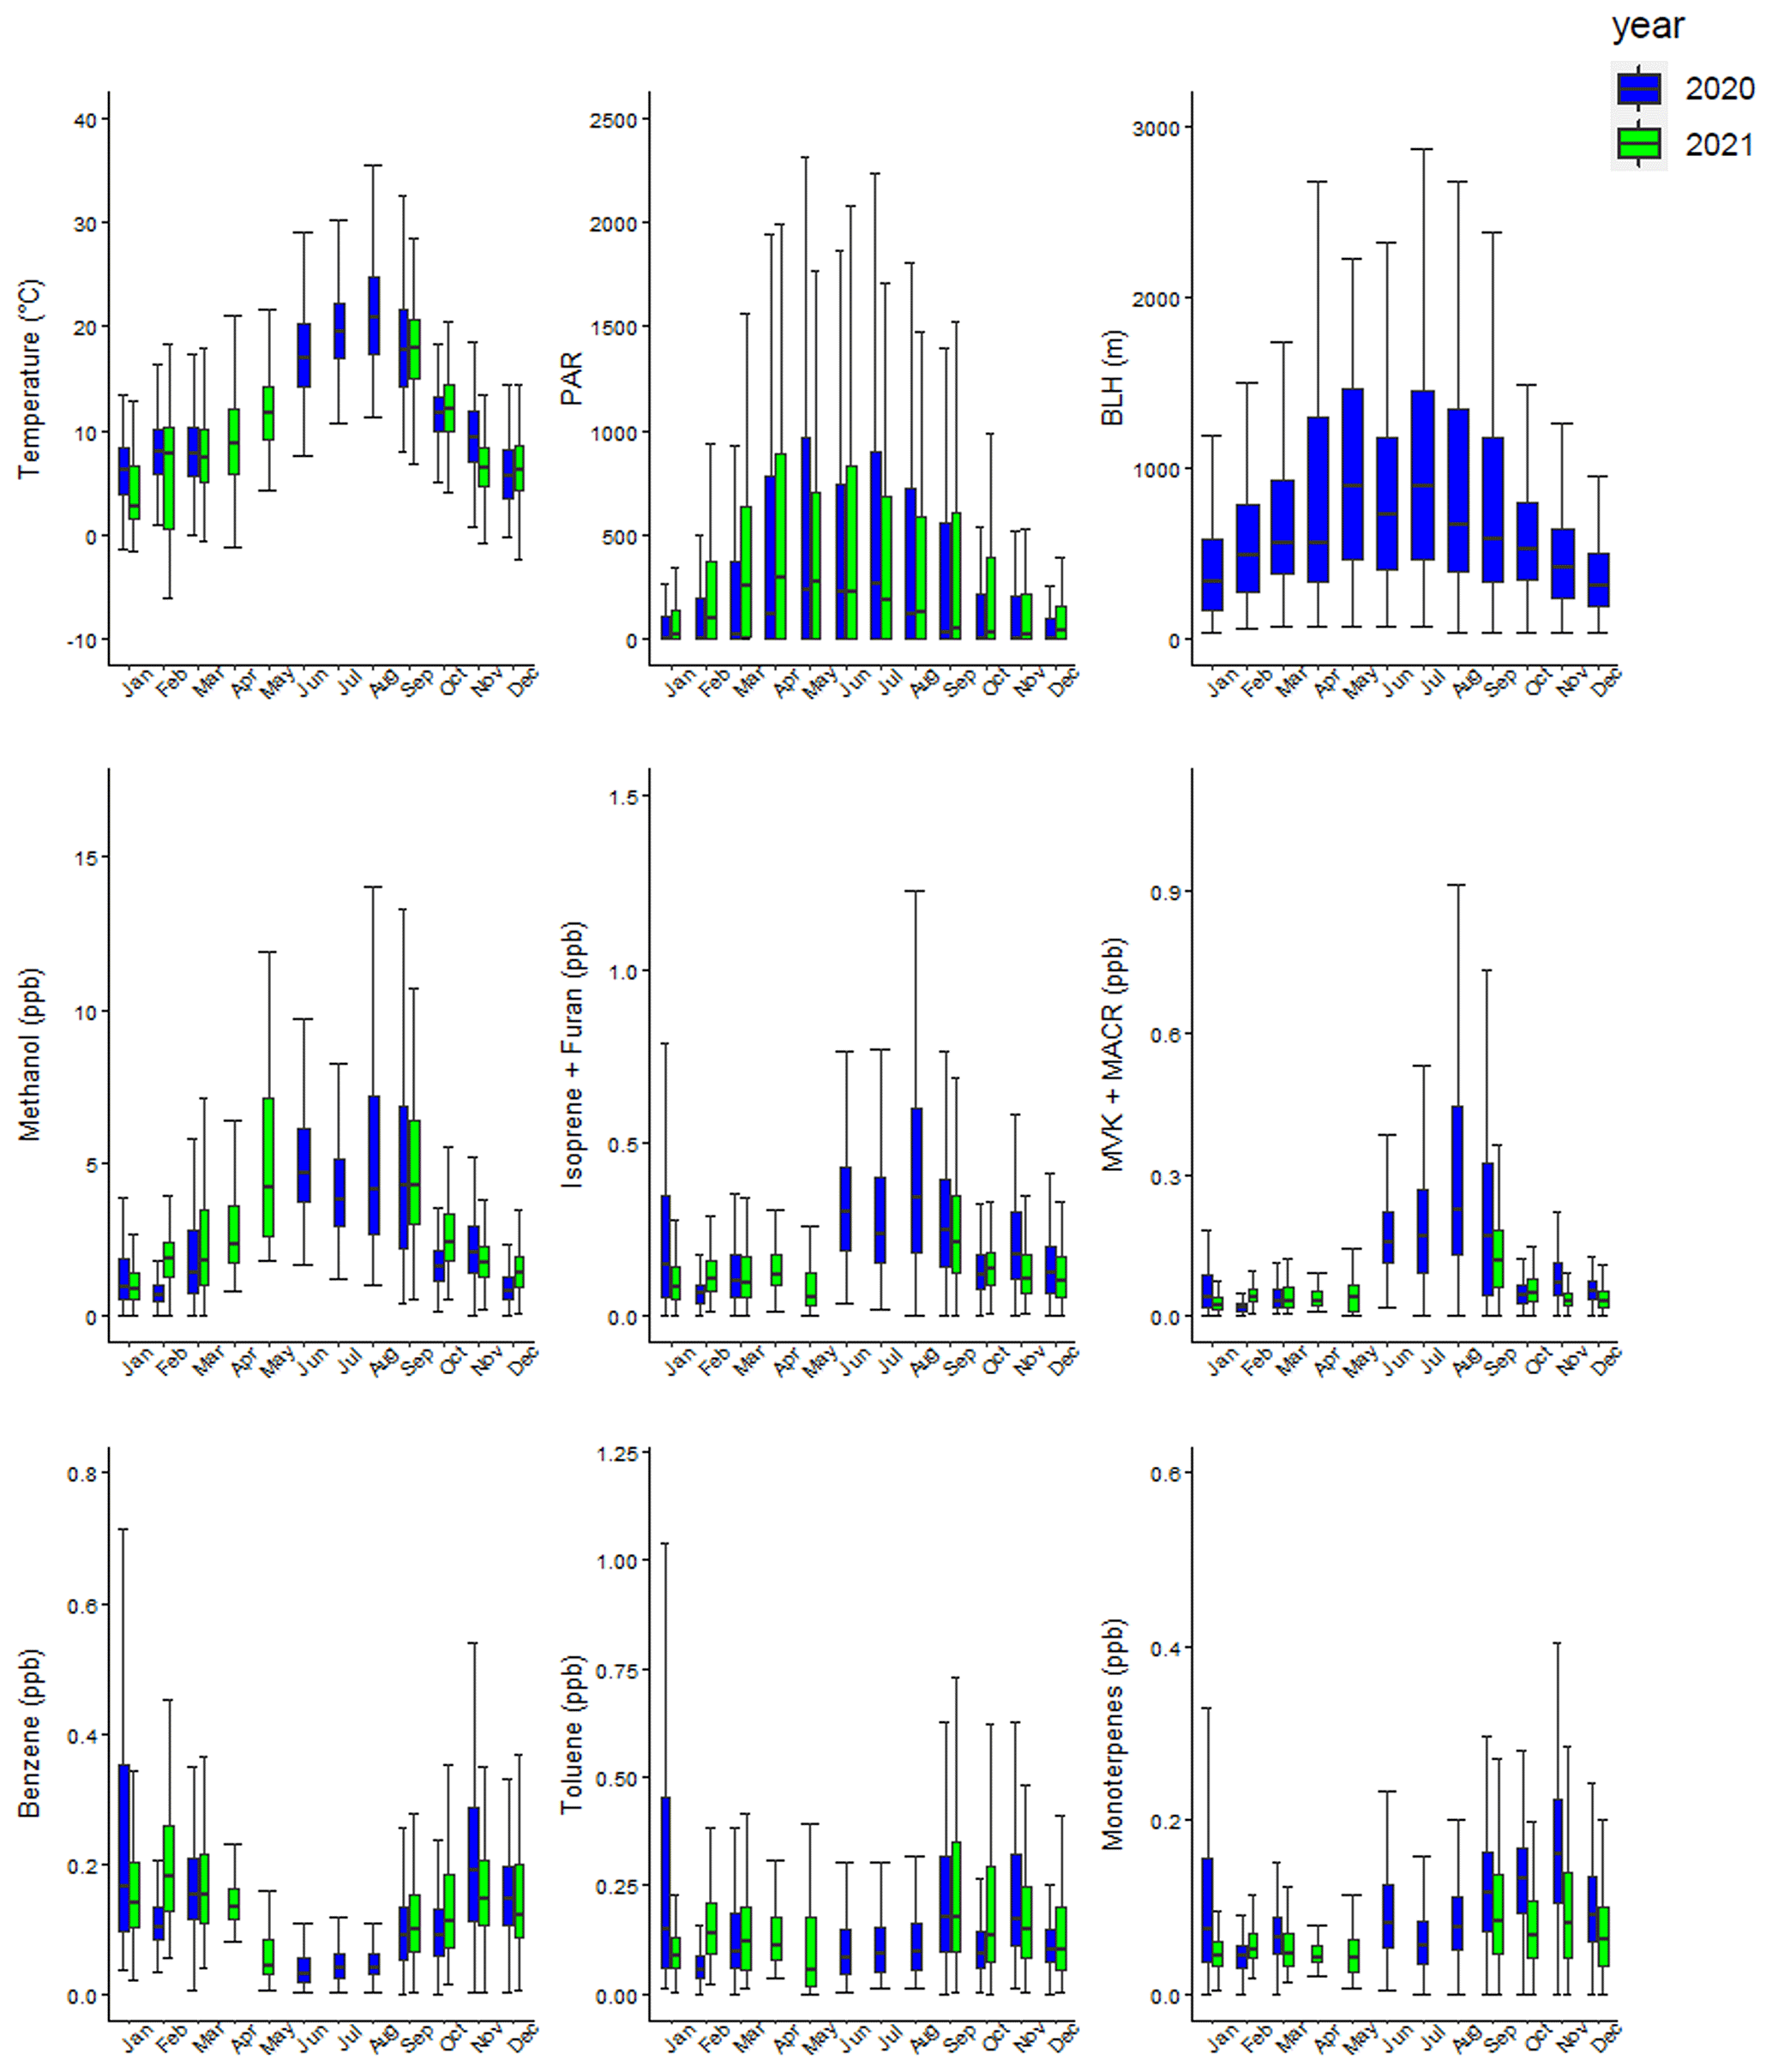
Figure 7Monthly distribution of VOC, temperature, photosynthetically active radiation (PAR, µmol s−1 m−2), and boundary-layer height for 2020 (blue) and 2021 (green). Boxes represent the 25th and 75th percentiles, and the line is the median. Whiskers represent the 5th and 95th percentiles.
In this region of the world, the ambient temperature increases from spring (March–April–May: MAM) to summer (June–July–August: JJA) and then decreases in autumn (September–October–November: SON) until winter (December–January–February: DJF). The temperature in April and May 2020 was higher than in 2021 and similar to temperatures observed in June; spring 2020 was abnormally warm: the mean temperatures recorded in Paris showed increases of 4.2 ∘C in April 2020 and 1.6 ∘C in May compared to the 1981–2010 norm (https://www.infoclimat.fr/, last access: 11 April 2022). For the other months, the temperature was relatively similar between 2020 and 2021. The mixed-layer height (MLH) increases from April to September and decreases during autumn and winter.
Methanol has a similar seasonal variability to the temperature, with higher levels in summertime due to the temperature-driven biogenic emissions and production of methanol by photo-oxidation of other species, a process more important in summer due to increased sunlight. Moreover, high levels of methanol in May 2021 despite the temperature being lower than in the summer months indicate that temperature is not the only parameter driving the emission and formation of methanol.
The sum of isoprene and furan also shows great variability, with increased levels during summer (June to September) due to isoprene being widely emitted by biogenic sources when the temperature and solar radiation are highest. In the wintertime, non-negligible levels of 69 are explained by furan emitted from wood burning. MVK + MACR have very low levels during winter but increase a lot in the summer months due to their production through the rapid photo-oxidation of biogenic isoprene.
Benzene increases from September to April due to more active sources in winter like residential wood burning (Languille et al., 2020) and less dispersion when the boundary layer is low, which is supported by wood-burning tracers such as furfural and benzenediol showing the same tendency (see Fig. S8). Toluene does not display a seasonal pattern as strong as benzene, although it also has higher levels in autumn and winter. Its main source, traffic, is important all year long, and the more stagnant conditions in autumn and winter induce pollutant accumulation.
Finally, monoterpenes, which are considered to be important biogenic compounds, are expected to have higher levels in summer (Jordan et al., 2009; Steinbrecher et al., 2009; Chen et al., 2020). Here, high levels of monoterpenes in summer are indeed observed, but they increase in autumn and winter. This suggests that monoterpenes could have anthropogenic sources in our study, especially in autumn and winter. Their relatively low levels in summer could also indicate their important reactivity with OH and O3, leading to possible formation of secondary organic aerosols (Yu et al., 1999; Larsen et al., 2000; Orlando et al., 2000; Mahilang et al., 2021). Moreover, a difference between 2020 and 2021 is observed for the months of September to December, which is barely seen for other VOCs. The seasonal cycle of monoterpenes resembles that of toluene and C8 aromatics (see Fig. S8), with high levels from September to June, but it also shows discrepancies resulting in unclear behaviour of monoterpenes. This is an interesting result to take into account for modelling.
The investigation of the diurnal profiles of some specific compounds might also give indications of their sources and of processes governing their levels in the atmosphere.
Figure 8a represents the diurnal profile of aromatic compounds (toluene, C8 and C9 aromatics) and markers for the traffic source, which peaks during the morning (05:00–08:00 UTC) and evening (15:00–20:00 UTC) rush hours. Their level stays high during the night due to the lower boundary layer. During the day, aromatic compounds decrease due to their dilution enhanced by the boundary-layer dynamics and due to their fast reaction with OH and O3. The gaseous traffic markers correlate with each other in the wintertime, with a R2 of 0.6–0.8, and they correlate with the fossil-fuel fraction of black carbon (BCff), with a R2>0.7 (see Table S9).
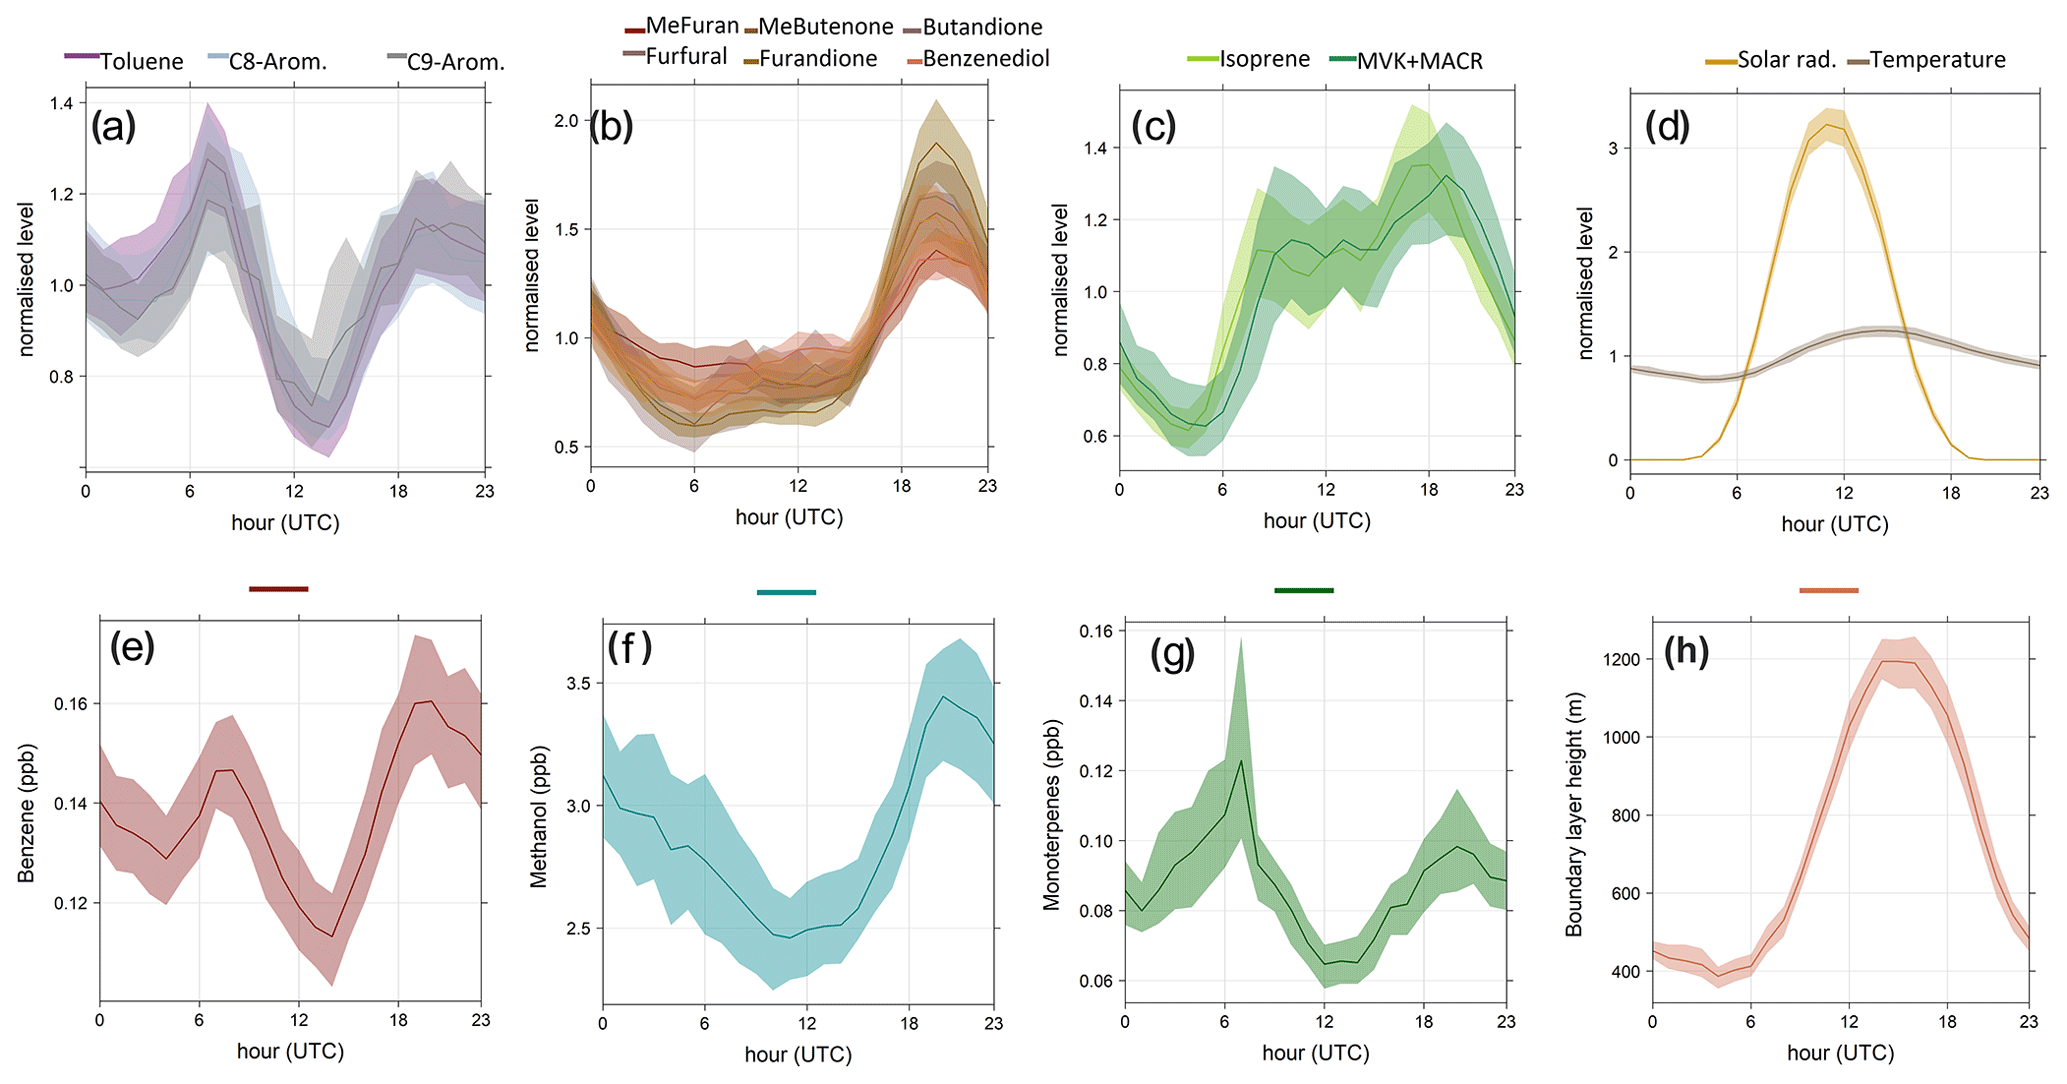
Figure 8Diurnal profiles for the whole studied period at SIRTA: (a) VOCs associated with a traffic pattern (toluene, C8 aromatics, C9 aromatics), (b) VOCs associated with a wood-burning pattern (methylfuran, methylbutenone, butandione, furfural, furandione, benzenediol), (c) isoprene and its oxidation products (methyl vinyl ketone + methacroleine), (d) solar radiation and temperature, (e) benzene, (f) methanol, (g) monoterpenes, and (h) boundary-layer height (data only available in 2020). The line represents the mean and the shaded area corresponds to the 95 % confidence interval. Diurnal cycles a, b, c, and d were normalized by the mean.
Figure 8b presents several compounds – methylfuran, methylbutenone, butanedione, furfural, furandione, benzenediol – markers for the wood-burning source (Languille et al., 2020). Their diurnal cycle shows a peak in the evening (15:00–20:00 UTC) due to people coming home from work and using residential wood burning for heating. Unlike the traffic markers, the wood-burning-related VOCs decrease during the night, which could be explained by their reaction with NO3, an important nighttime oxidant, that leads to partitioning into the particle phase (Joo et al., 2019; Mayorga et al., 2021). Other compounds such as methanol, acetaldehyde, acetic acid, and furan were also highlighted as wood-burning markers by Languille et al. (2020), but although this may be their main source in winter, their overall diurnal cycle displays a different pattern due to additional sources like vegetation or solvent use throughout the year. The compounds highlighted here as wood-burning markers all correlate with the wood-burning fraction of black carbon (BCwb) during winter, with a R2 of about 0.7, except for butanedione (see Table S9).
In Fig. 8c, the sum of isoprene and furan shows a more biogenic diurnal cycle because isoprene is dominant (77 %, Table 2), with an increasing level in the morning due to enhanced emission with higher temperature and solar radiation. Once the plateau is reached around 08:00 UTC, the balance between fresh emissions of isoprene and its removal by OH results in levels staying the same. A peak in the late afternoon (15:00–18:00 UTC) is observed, which could be explained by a shift in this balance due to a lower OH concentration (Jordan et al., 2009). After 18:00 UTC, isoprene emissions drop rapidly due to lower temperature and solar radiation, so its level decreases. The diurnal profile of the sum of MVK and MACR (isoprene oxidation products) is very similar to the one of isoprene, although a shift of 1–1.5 h between both is observed (Verreyken et al., 2021), corresponding to the lifetime of isoprene in the presence of OH (Seinfeld and Pandis, 2006).
Table 2Specific with different attributed compound contributions per season.
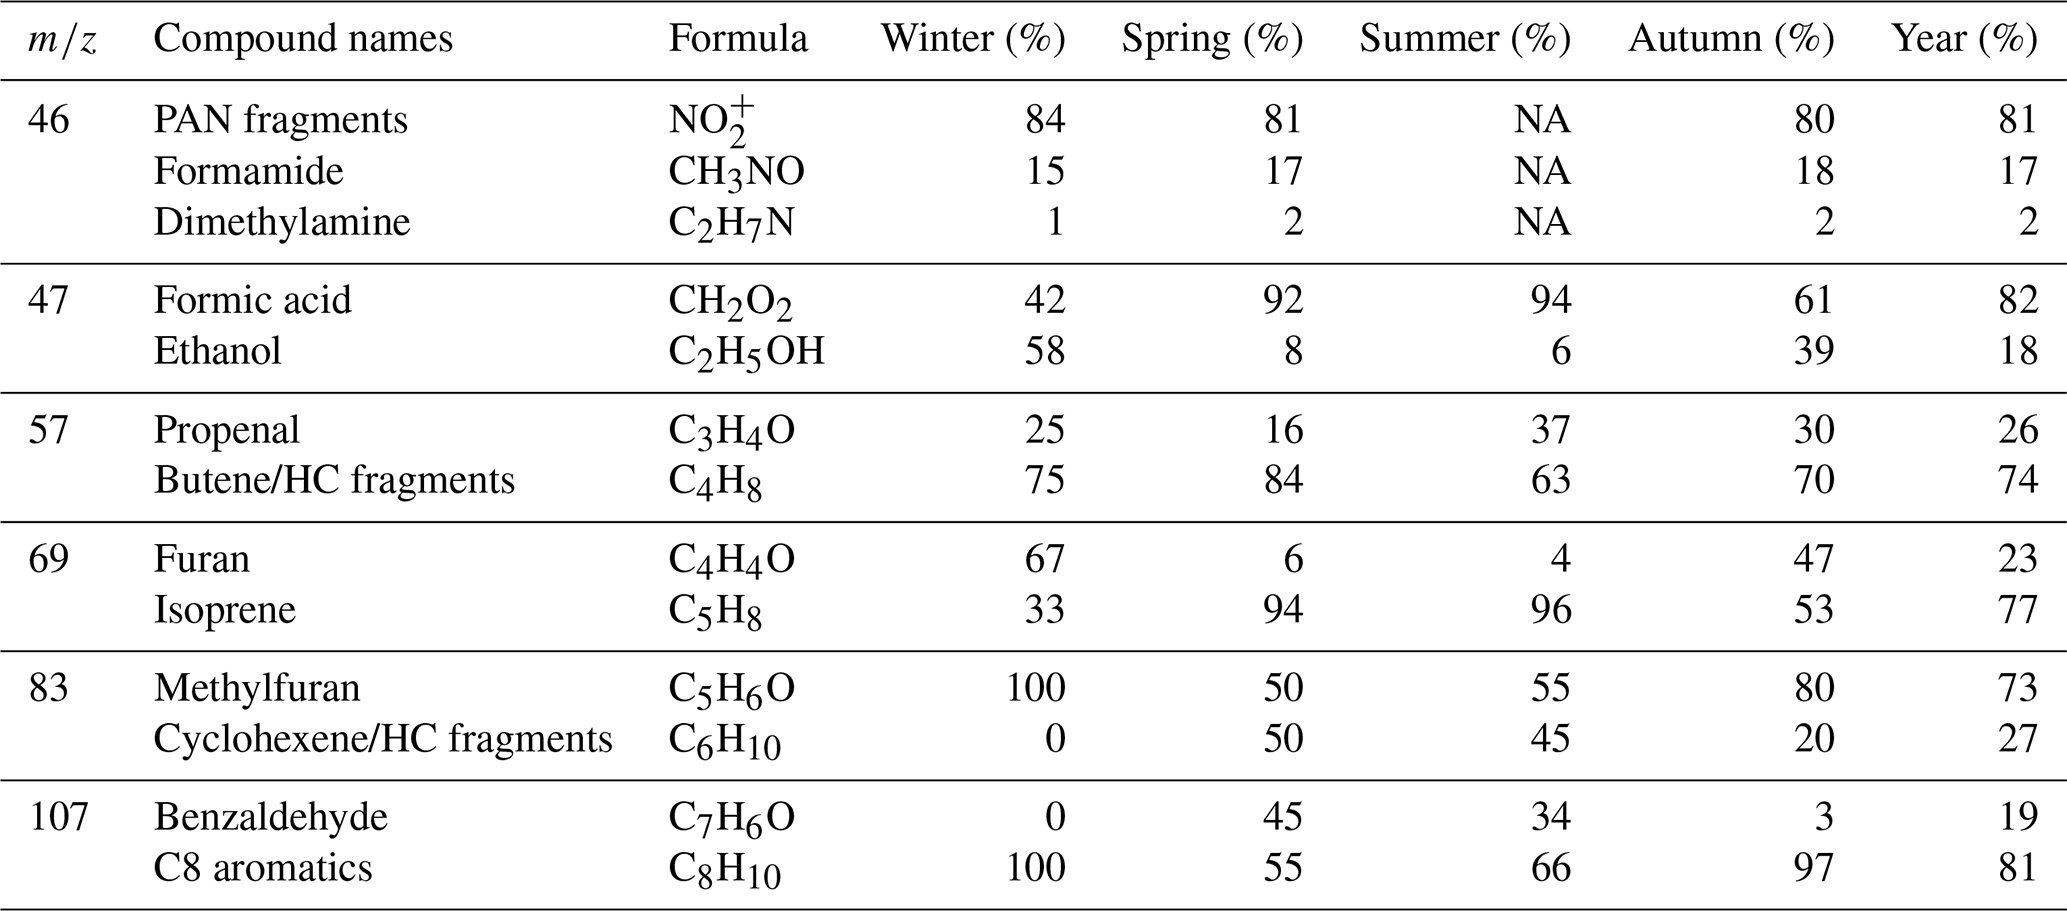
Figure 8e, f, and g show the diurnal cycle of different compounds that have mixed sources. Benzene is emitted by both traffic and wood burning (Languille et al., 2020), its diurnal profile shows the typical double peak of traffic-like profiles, but its evening peak is higher, suggesting the influence of the wood-burning source. Methanol is always present in important amounts, and therefore its diurnal cycle is not marked by a particular source. However, a higher level during the night with respect to the day could indicate an impact of the boundary layer, less oxidation during the night than during daytime, and/or the influence of the wood-burning source.
Monoterpenes are commonly considered to be mainly emitted by vegetation (Guenther et al., 1995), especially in summer. Figure 8g shows that their diurnal cycle is not similar to that of other biogenic compounds at SIRTA. This could be explained by their different emission processes (Steinbrecher et al., 2009; Chen et al., 2020) or by a significant influence of anthropogenic sources, as already suggested in Fig. 7. In this study, monoterpenes have a traffic-like diurnal pattern with morning and evening rush-hour peaks, which could be explained by a traffic source but more probably by mixed biogenic and anthropogenic sources. Previous studies in urban areas highlighted anthropogenic sources for monoterpenes such as wood burning, domestic solvent use, and traffic (Hellén et al., 2012; McDonald et al., 2018; Panopoulou, 2020; Borbon et al., 2023). Panopoulou et al. (2020) notably estimated for Athens anthropogenic fractions of alpha-pinene of 97 % and 70 % during winter and summer, respectively. In this study, we show that, for the Paris region, the anthropogenic sources of terpenes are also significant. The decrease in monoterpenes during the day and at night can be partly due to their reaction with atmospheric oxidants (OH, O3, and NO3) that may lead to important formation of secondary organic aerosols (Mahilang et al., 2021).
These 2 years of VOC measurements gave information on the seasonal and diurnal variabilities of the different measured compounds and the influence of meteorology and air mass origin on their levels. The measurement period comprises two COVID-19-induced lockdowns in spring and autumn–winter 2020, during which the decrease in human activity and change in human behaviour might have impacted the levels and variability of VOCs. In the next section, these periods will be investigated.
3.4 COVID-19 lockdowns
To reduce the spread of the coronavirus, a strong lockdown was established in France from 17 March to 10 May 2020 inclusive, during which all “non-essential” activities and industries were shut down with a stay-at-home obligation. A second lockdown was established in France from 30 October to 15 December, where going to work was possible but restricted and a curfew was set up in the evening and on the weekends.
The spring lockdown period corresponded to the occurrence of unusually high temperatures and sunny days compared to normal conditions over Europe (Barré et al., 2021). Therefore, to quantify a change in pollutant levels due to the lockdown, the meteorology should be considered (Gkatzelis et al., 2021). At the SIRTA site, such a study was done on PM1, BC, NOx, and O3 thanks to the long dataset available (Petit et al., 2021). This cannot be done for VOCs due to the shortness of the reference and lockdown periods covered by our PTR-MS measurements. Instead, meteorological conditions and air mass origins during this event were studied together with the diurnal cycles of some key VOCs before and during the lockdown.
Figure 9 shows the temperature, wind speed and direction, VOC concentrations, and PM1 composition and concentrations during the month of March 2020. The wind origin and speed occurrences were plotted as wind roses for the first and last 2 weeks of March (before and during the lockdown).
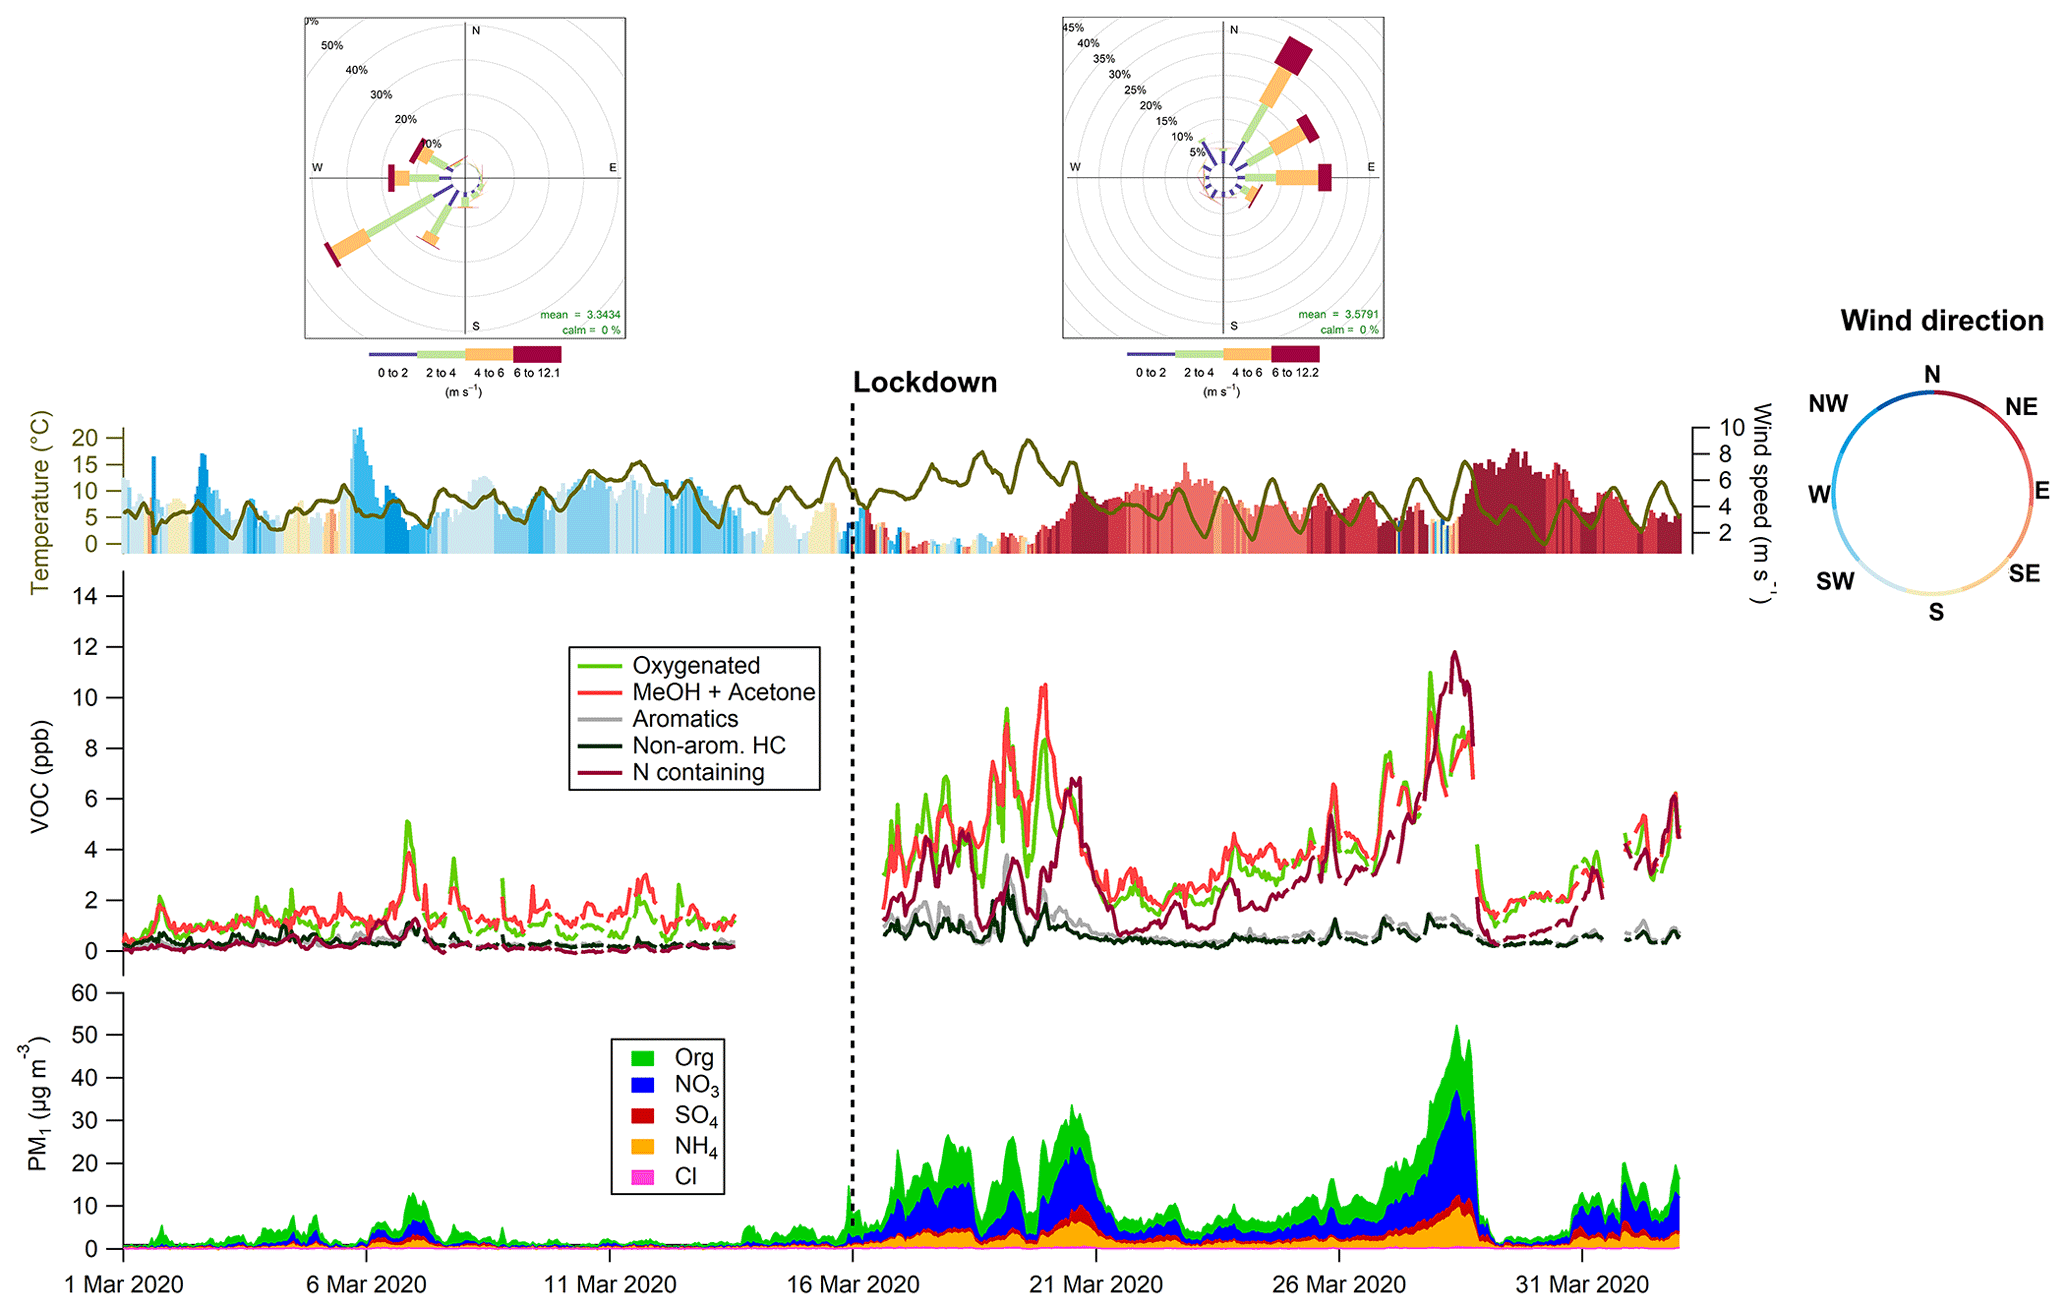
Figure 9Time series of VOCs, non-refractory sub-micron particulate matter (NR-PM1), temperature, wind speed, and direction during the month of March 2020. The black dotted line marks the start of the COVID-19-induced lockdown in France. The frequency of counts by wind direction is represented as wind roses before (1–13 March) and during (16–31 March) the lockdown in the top left-hand-side and right-hand-side panels, respectively.
The levels of all groups of VOCs and particulate components increased suddenly at the start of the lockdown compared to the period before. There was a drastic change in the wind direction: in the first 2 weeks of March, wind was coming from the south-west, bringing clean oceanic air masses, while during the last 2 weeks of March, wind was coming from the north-east, bringing polluted continental and Parisian air masses. This, together with meteorological conditions favouring the accumulation of pollutants (relatively steady winds with a wind speed on average of 3.8 m s−1, dry conditions with a mean relative humidity of 55 %), may explain the increased pollutant levels. Oxygenated VOCs, nitrogen-containing VOCs, and methanol + acetone increased significantly at the start of the lockdown, especially N-containing compounds on 28 March. On this day, an important increase in particulate nitrate (NO) is observed, which was allocated to advected continental pollution (Petit et al., 2021).
Given the difference in the meteorological conditions before and during the lockdown, a quantitative study of the impact of the lockdown on the VOCs cannot be done; however, the diurnal cycles of markers for specific sources in winter were investigated before and during the lockdown. In addition, the diurnal cycles for the second lockdown were also studied.
Figure 10 shows the diurnal profiles of markers for the traffic and wood-burning sources for a non-lockdown period with typical background conditions (1–13 March 2020) and for periods during the spring (17–31 March 2020) and autumn (30 October–15 December 2020) lockdowns. These profiles are normalized by the mean value, because the periods are not under the same air masses and are not intended to be compared on a quantitative basis. The diurnal cycles of toluene, NO2, and the fossil-fuel fraction of black carbon (BCff) before the lockdown show typical traffic profiles with morning and evening rush-hour peaks. During the spring lockdown, the diurnal cycles of these compounds changed, especially for BCff, which does not present a double-peak profile any more. This could be due to an important decrease in the traffic source during the lockdown as a consequence of the strong restrictions on the population (Lamprecht et al., 2021). However, during the second lockdown, the diurnal profiles are more similar to the non-lockdown period than the first lockdown period. This could be explained by the weaker restrictions for the autumn lockdown, resulting in more people going to work.
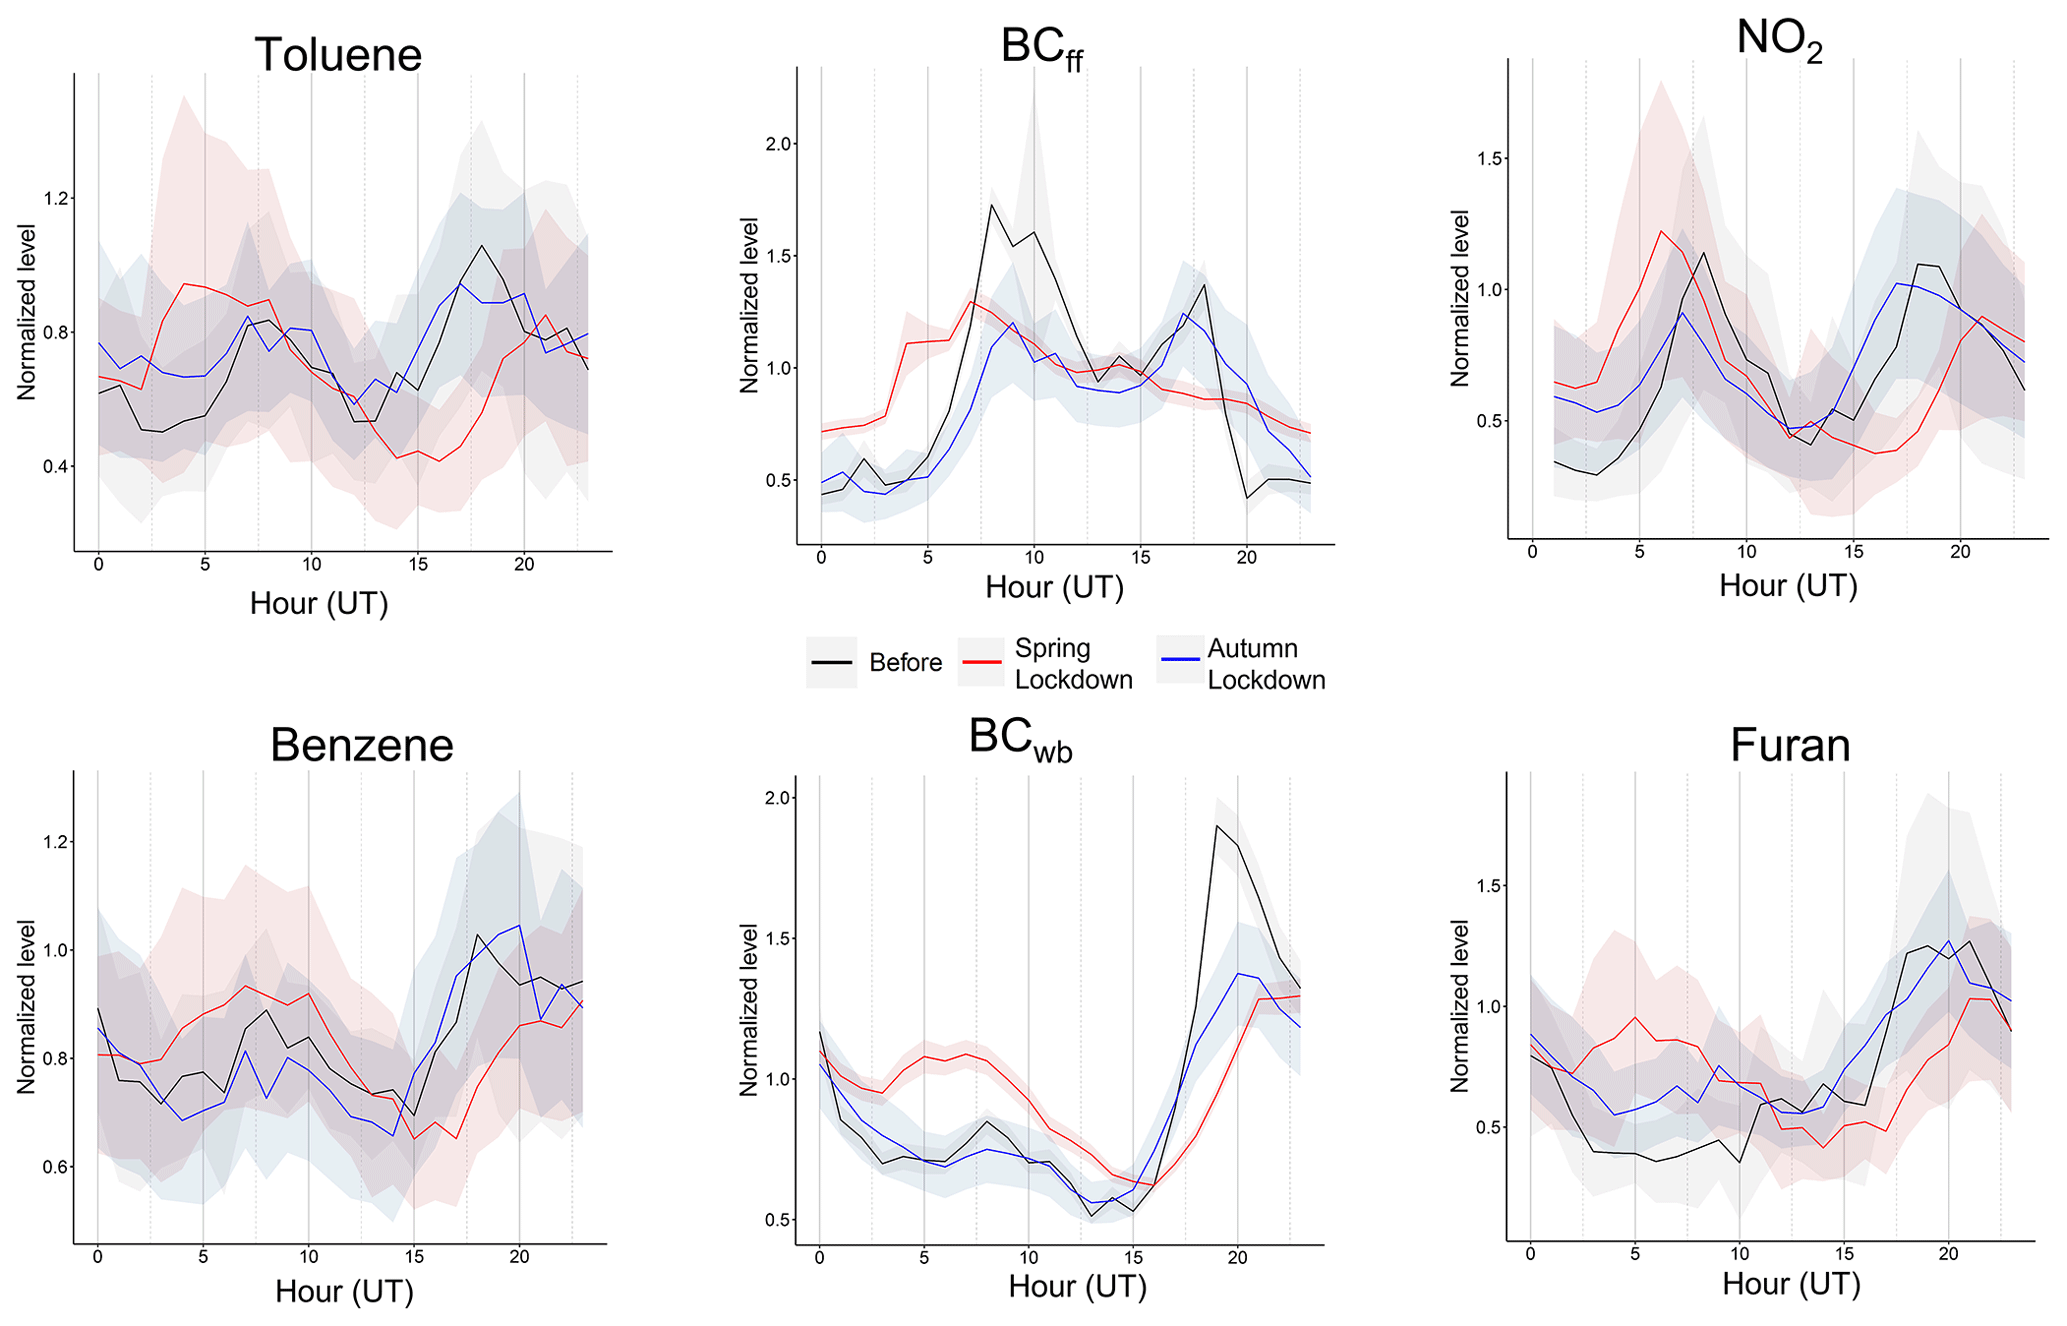
Figure 10Diurnal-cycle markers for the traffic source (toluene, BCff, NO2) and for the wood-burning source (benzene, BCwb, furan) before (in black, 1–13 March) and during (in red, 16–31 March) the spring lockdown and during the autumn lockdown (in blue, 30 October–15 December). The line represents the mean and the shaded area corresponds to the 95 % confidence interval. All diurnal cycles were normalized by the mean.
Figure 10 shows that, during the non-lockdown period, the diurnal profiles of benzene, furan, and the wood-burning fraction of black carbon (BCwb) are typical for the wood-burning source (see Fig. 8), and the additional small peak in the morning observed on the profile of benzene indicates that part of the emissions are from the traffic source. During the spring lockdown, an additional peak appears in the morning for furan and BCwb, and the morning peak of benzene is more pronounced. This could be due to people's presence at home during the day and their use of the fireplace in the morning, because it was still cold at the end of March (mean temperature of 8.1 ∘C). During the second lockdown, as observed for the traffic markers, the diurnal cycles of the wood-burning markers resemble more those of the non-lockdown period than those of the first lockdown, due to less strict regulations.
The investigation of the diurnal cycle's change during the spring lockdown reflected the influence of the change in human activities on the pollutants in the atmosphere. The additional peak in the morning of the wood-burning markers could have an impact on secondary pollution formation, the study of which is beyond the scope of this paper.
3.5 Comparison with the Paris centre
The data obtained at the suburban SIRTA station were compared with data from the regional network for air quality monitoring of the Greater Paris area (Airparif) recorded in the centre of Paris for 2020 and 2021. VOC measurements operated by Airparif were performed at the Paris 1er Les Halles station. Located at around 22 km to the north-east of SIRTA (Fig. S9), this station is considered an urban background site and representative of the average public exposure to pollution levels in the Parisian conurbation. At this station, an automated gas chromatograph equipped with a thermodesorption and flame-ionization detector (TD-GC-FID) is used to continuously measure C2–C9 non-methane hydrocarbons in ambient air (Baudic et al., 2016).
At the SIRTA station, 61 % of PTR-MS data are available over the 2020–2021 period, while at Les Halles station, 84 % of the data are available for this period, except for benzene, for which there are no data from April 2020 to January 2021. Both stations provide, with their own monitoring techniques, measurements of isoprene, benzene, and toluene; for the Paris dataset, ethylbenzene and xylenes were summed to compare with C8-aromatic VOCs from SIRTA, and trimethylbenzenes were summed as C9 aromatics. The PTR-MS at SIRTA measures 69, which contains 77 % of isoprene on average over the whole year (Table 2) and 96 % of isoprene in summer (as a reminder, the remaining fraction of has been attributed to furan). Table 3 presents the average volume-mixing ratios (VMRs) and the standard deviations for these compounds at both sites for 2020–2021 as well as for summer 2020 for isoprene.
Table 3Mean (±standard deviation) parts-per-billion values for isoprene, benzene, toluene, C8 and C9 aromatics for SIRTA and Paris sites (2020–2021) and for isoprene in summer 2020.
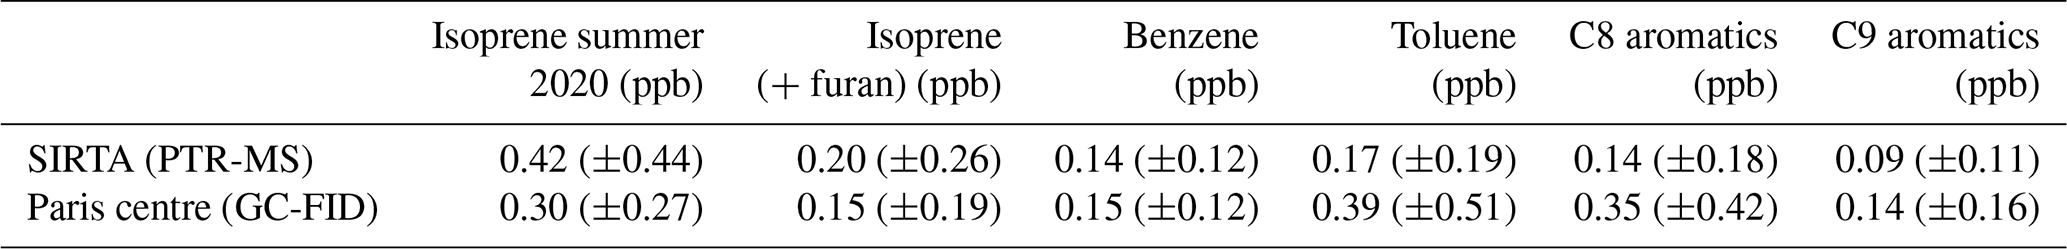
The average level of isoprene is slightly higher at SIRTA than in the Paris centre for the whole period and in summer, suggesting more biogenic sources at the suburban site than the urban one. Benzene levels are similar at both sites, which could be due to its main source, wood burning, being relatively homogeneous in the Paris region (Bressi et al., 2013; Languille et al., 2020) and due to its longer lifetime than the other compounds (9 d for benzene vs. 2 d for toluene; Atkinson, 2000). Levels of toluene and C8 aromatics are more than twice as high in the Paris city centre as at SIRTA due to the important traffic source in the centre of Paris. C9 aromatics are also higher in the Paris city centre than at SIRTA for this reason.
Figure 11 presents the monthly distribution of isoprene (+ furan), benzene, and toluene for 2020 and 2021 for both stations. Throughout the year, isoprene + furan at SIRTA is higher than isoprene in Paris. In winter, this small difference can be explained by furan emitted by the wood-burning source, but in summer 69 is almost only isoprene (Table 2), confirming that there are more biogenic sources around SIRTA than in Paris. Benzene shows similar levels at both stations from January to April and then decreases at SIRTA in spring due to the decrease in the wood-burning source, while it remains relatively high in Paris due to the more important traffic source. In autumn and winter, the levels at both sites are again similar except for December, where they are significantly higher in the Paris centre. We note that, for this specific month, only 15 % of the data over both years are available in the Paris centre (vs. 87 % for SIRTA), and these data correspond to the highest obtained values and therefore are not completely representative of the whole of December. Toluene is significantly higher in the Paris centre than SIRTA all year long due to more traffic in the centre of Paris, and it increases in winter and autumn with the emissions and more stagnant atmospheric conditions (lower boundary layer, Fig. 7).
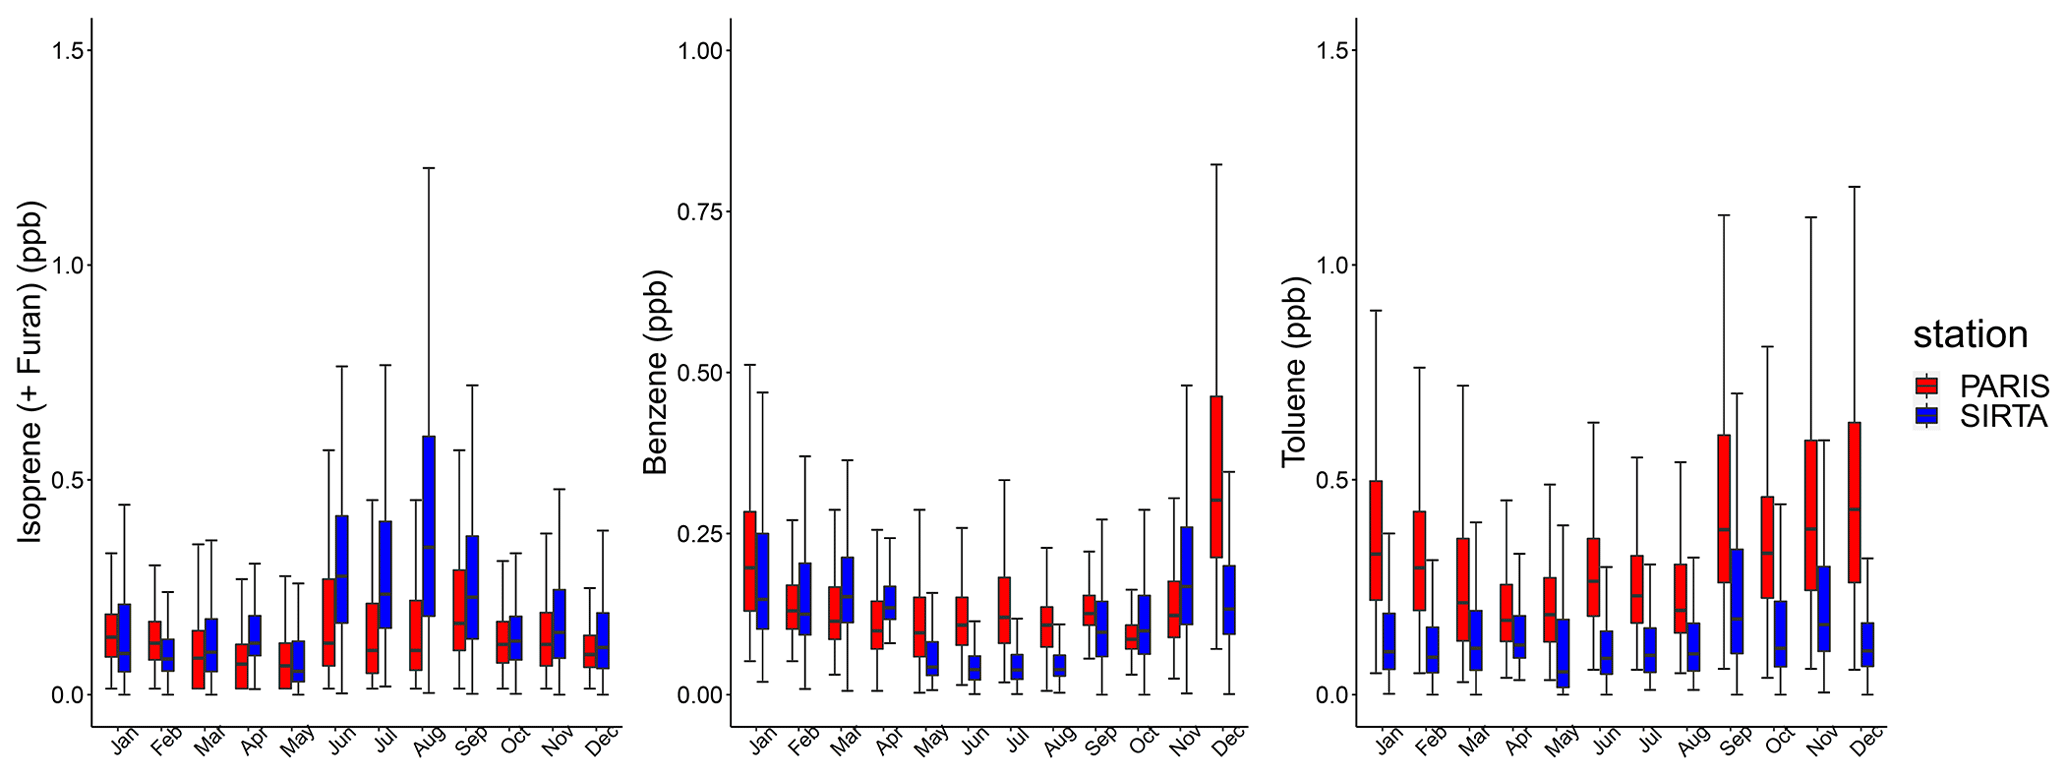
Figure 11Monthly distributions of isoprene (+ furan), benzene, and toluene at both the SIRTA and Paris centre sites (2020 and 2021).
For a more in-depth comparison, the dataset was separated according to the air mass clusters determined in Sect. 3.2 and presented in Fig. 5. For simplicity, oceanic 1 and oceanic 2 clusters were grouped as oceanic, and North 1 and North 2 were grouped as North. The statistical distributions of the data for isoprene, benzene, and toluene from both stations for the anticyclonic, continental, oceanic, and North air mass clusters are given in Fig. S10. For benzene, the highest VMRs are obtained for continental air masses for SIRTA and for both the continental and anticyclonic air masses for the Paris centre; for toluene, the same is observed for SIRTA, but for the Paris centre the highest levels are obtained for the anticyclonic cluster. This indicates more transported/regional origins for these compounds at SIRTA and more local sources in the centre of Paris.
Figure 12 presents the diel cycles per air mass cluster for isoprene, benzene, and toluene for the SIRTA and Paris sites.
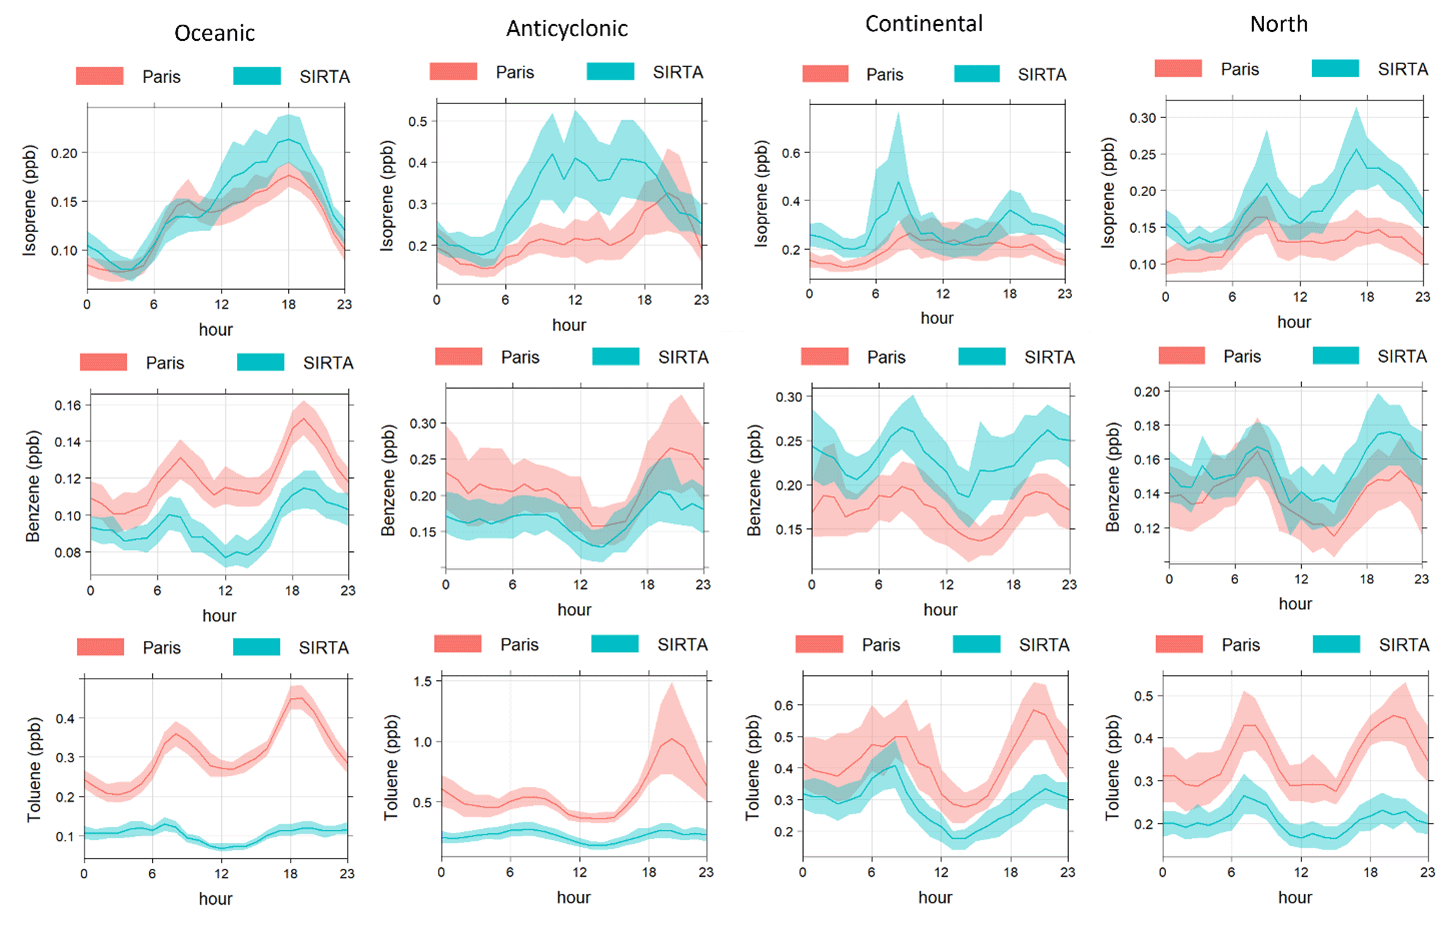
Figure 12Diel cycles of isoprene, benzene, and toluene at SIRTA and in the centre of Paris depending on the oceanic, northern, anticyclonic, and continental air masses. The line represents the mean value, while the shaded area delimits the 95 % confidence interval in the mean. Hours are in universal time.
Under the oceanic air masses, the diel cycle of isoprene is similar between both stations and is specific to the biogenic source with an important increase during the day (Fig. 8). This indicates that this compound is not (or is very little) influenced by anthropogenic sources for these air masses. The diel cycle for anticyclonic air masses is quite different between both stations, with an increase in isoprene during the day for SIRTA indicating an influence of local biogenic sources, while in the centre of Paris, the “biogenic” increase is smaller, but a peak in the evening is observed, pointing to a potential influence of anthropogenic (road traffic, wood burning) sources. The traffic source for isoprene was previously observed in Paris (Borbon et al., 2013; Baudic et al., 2016), while a wood-burning source for this compound would probably also be visible in the SIRTA plot, but no increase is observed at the same time.
Under the continental and North air masses, the diel cycle for isoprene at SIRTA presents morning and evening peaks that could be associated with traffic rush hour from roads nearby (Fig. S9). The North air masses also transport pollution from Paris to SIRTA. The diel profile of the continental cluster for Paris rather points to a local biogenic origin. Finally, for air masses from the north, the diel profile for Paris shows an increase in the morning that is probably associated with the traffic source.
For benzene, the diel profiles are rather similar in terms of shape and level in relation to its spatial homogeneity at the regional scale, as discussed above. In particular, under anticyclonic conditions, this cycle shows an increase in the evening without a clear increase in the morning, pointing to wood burning for residential heating as its major source. However, the shape of the profiles obtained for the other air mass clusters, with an additional morning peak, also points to a traffic source. In addition, the levels are a little higher under oceanic conditions for Paris with respect to SIRTA and a little higher under continental conditions for SIRTA compared to Paris. This could indicate that part of benzene (i.e. from traffic) is local in the Paris centre, while it is transported for the SIRTA site. As expected, we note that when SIRTA is upwind from Paris (i.e. under oceanic and anticyclonic clusters), its levels of benzene are lower than in Paris. On the other hand, when SIRTA is downwind from Paris (i.e. under continental and North air masses), the levels of benzene are higher than in Paris.
For toluene, when Paris is swept by oceanic air masses, the diel cycle in the city centre shows morning and evening increases during the rush-hour peaks due to local road traffic (Gros et al., 2011; Gaimoz et al., 2011; Baudic et al., 2016), which is also observed in the profiles for C8 and C9 aromatics (Fig. S11). However, at SIRTA the air mass remains clean due to little or no source in that direction (Fig. S9), and the diel cycle is clearly lower than that of Paris (mean level <0.2 ppb) and seems to represent only the atmospheric dynamics. For the anticyclonic, continental, and North clusters, the levels of toluene remain higher in the Paris city centre than at SIRTA because of the proximity and density of the emission sources. The shape of these diel profiles points to a traffic source at both stations.
For the anticyclonic air mass cluster in the Paris centre, the evening peak is (much) more important than the morning one. This particularly high peak observed under these conditions could be explained by important local traffic and/or wood-burning sources and intensified with boundary-layer height decrease, temperature inversion, and lower wind speed that are typical for this regime. This is confirmed by the diel cycles of C8 and C9 aromatics presented in Fig. S11 that have a similar shape for these air masses. Moreover, benzene and isoprene also show an increase in the evening for the anticyclonic cluster, although this is not as important as for the other compounds.
For C8-aromatic compounds, the diel cycles are very similar to those of toluene (Fig. S11), so similar conclusions can be drawn. Finally, levels of C9 aromatics are similar at both stations for the continental and North clusters.
The dataset containing the VMRs (ppb) for all measured mass-to-charge ratios are available in the IPSL Data Catalog under https://doi.org/10.14768/f8c46735-e6c3-45e2-8f6f-26c6d67c4723 (Simon et al., 2022a). For compounds that were quality-assured by ACTRIS, flags are also given in this dataset: please refer to Sect. 2.4.1 and to the associated read-me file. For the figures in the present paper, the data flagged as “local contamination/local event” were not considered.
The dataset for the compounds that were quality-assured by ACTRIS is also available in the EBAS database (https://ebas-data.nilu.no/DataSets.aspx?stations=FR0020R&InstrumentTypes=PTR-MS&fromDate=1970-01-01&toDate=2023-12-31, Simon et al., 2022b) containing the VMRs (ppt), the uncertainties (precision and accuracy, ppt), and the flags, giving indications on the state of the data. The flag references are the same for both datasets.
In this paper, we provide the first long-term VOC dataset obtained using PTR-MS measurements at a suburban site in Europe. This 2-year dataset contains 31 mass-to-charge ratios () corresponding to 30 or more compounds of interest for atmospheric chemistry research, identified thanks to additional PTR-ToF-MS measurements. Because long-term PTR-MS measurements are still scarce worldwide, we adapted existing recommendations in order to meet the inherent requirements of pluri-annual observations. Data have been carefully inspected following quality-control and quality-assurance procedures, resulting in a robust dataset. Since long-term PTR-MS measurements are likely to be implemented at a growing number of stations (especially within ACTRIS), harmonized protocols and guidelines are much needed in order to ensure the comparability of the data.
The analysis of the dataset conducted here enabled one to highlight the specificities of VOCs in a suburban environment. Local sources such as traffic, wood burning, and biogenic sources are marked on the compounds' diurnal cycle. The VOC levels are driven here by their sources, meteorological conditions, and air mass origin. This was investigated through the seasonal and diurnal variabilities. Our findings notably confirm the increase in aromatics and oxygenated compounds in wintertime due to additional wood-burning sources and boundary-layer dynamics. On the other hand, oxygenated and biogenic VOCs were higher in summer due to increased temperature and solar radiation. Furthermore, a novel finding of the present study concerns the monoterpenes: their main source in a suburban area is supposedly biogenic, and in this study their seasonal and diurnal variabilities brought out potential anthropogenic sources.
Investigation of the VOCs' geographic origins indicated that the more polluted air masses were the continental and North 1 (that both go through industrial areas and big cities, including Paris) and anticyclonic, highlighting the importance of local sources for short-life components like the VOCs. An interesting result here was the nitrogen-containing compounds, mainly 46, brought to the station mostly by continental air masses, suggesting long-range transport. On an inter-annual basis, the increase or decrease in the VOC levels could be due to variability in the occurrence of oceanic vs. continental air masses and not just the long-term tendency. For trend analysis of VOCs at the SIRTA station, it is thus necessary to consider the air masses and to do this trend analysis per cluster.
The investigation of the COVID-19-induced lockdown in spring emphasized the importance of meteorological conditions for the VOC levels. Diurnal cycles of compound markers for anthropogenic sources before and during the lockdown showed a change in the compounds' behaviour, reflecting the change in human activities in this particular period. Finally, a comparison with gas chromatography data acquired in the centre of Paris shows relatively homogeneous levels in the region for benzene, while toluene is higher in the city centre due to the important local traffic source, and isoprene is higher at SIRTA due to the surrounding biogenic sources.
This dataset will be used in a source-apportionment study, in relation to organic aerosols, to better understand sources and processes driving organic pollution. This dataset is available for modelling studies and can be used for emission inventories.
The supplement related to this article is available online at: https://doi.org/10.5194/essd-15-1947-2023-supplement.
LS: conceptualization, data curation, formal analysis, investigation, visualization, writing – original draft preparation, writing – review and editing. VG: conceptualization, funding acquisition, project administration, resources, supervision, validation, writing – review and editing. JEP: conceptualization, funding acquisition, project administration, resources, supervision, validation, writing – review and editing. FT: resources, methodology, software. RSE: resources. CK: resources, writing – review and editing. AB: resources, writing – review and editing. CM: conceptualization, funding acquisition, project administration, supervision, writing – review and editing. OF: conceptualization, funding acquisition, project administration, resources, supervision, validation, writing – review and editing.
The contact author has declared that none of the authors has any competing interests.
Publisher’s note: Copernicus Publications remains neutral with regard to jurisdictional claims in published maps and institutional affiliations.
The authors would like to thank Sébastien Dusanter and Marina Jamar (IMT Nord Europe, France) for their help with the data-quality evaluation, Stefan Reimann and Matthias Hill (EMPA, Switzerland) for ACTRIS quality control, and Nicolas Pascal (Lille University, France), Christophe Boitel (LMD, France), and Sophie Bouffies-Cloché (IPSL, France) for their help with the data submission to the ACTRIS Data Centre and IPSL databases. The ACTRIS Data Centre and ACTRIS CiGas are thanked for their services and support in the quality assurance, quality control, and data curation.
The authors also warmly thank Nicolas Bonnaire (LSCE, France) for providing NOx and O3 data, Dominique Baisnee (LSCE, France) for the help in maintaining measurements during the lockdowns, Melania Van Hove and Simone Kotthaus from SIRTA-IPSL for providing the PAR and MHL data, and Julie Gauduin and Esthel Le Bronnec (Airparif, France) for the production and validation of VOC data at the Airparif station.
Leïla Simon would like to thank the DIM Qi2, Paris Ile-de-France region, and Ineris for her PhD fellowship.
This work has benefited from the support of the research infrastructure ACTRIS-FR registered on the Roadmap of the French Ministry of Research. This research has been supported by the H2020 ACTRIS-2 project (grant no. 654109) and the following related projects. The authors were also supported financially by CEA and CNRS.
This paper was edited by Tobias Gerken and reviewed by two anonymous referees.
Ait-Helal, W., Borbon, A., Sauvage, S., de Gouw, J. A., Colomb, A., Gros, V., Freutel, F., Crippa, M., Afif, C., Baltensperger, U., Beekmann, M., Doussin, J.-F., Durand-Jolibois, R., Fronval, I., Grand, N., Leonardis, T., Lopez, M., Michoud, V., Miet, K., Perrier, S., Prévôt, A. S. H., Schneider, J., Siour, G., Zapf, P., and Locoge, N.: Volatile and intermediate volatility organic compounds in suburban Paris: variability, origin and importance for SOA formation, Atmos. Chem. Phys., 14, 10439–10464, https://doi.org/10.5194/acp-14-10439-2014, 2014.
Atkinson, R.: Atmospheric chemistry of VOCs and NOV, Atmos. Environ., 34, 2063–2101, https://doi.org/10.1016/S1352-2310(99)00460-4, 2000.
Barré, J., Petetin, H., Colette, A., Guevara, M., Peuch, V.-H., Rouil, L., Engelen, R., Inness, A., Flemming, J., Pérez García-Pando, C., Bowdalo, D., Meleux, F., Geels, C., Christensen, J. H., Gauss, M., Benedictow, A., Tsyro, S., Friese, E., Struzewska, J., Kaminski, J. W., Douros, J., Timmermans, R., Robertson, L., Adani, M., Jorba, O., Joly, M., and Kouznetsov, R.: Estimating lockdown-induced European NO2 changes using satellite and surface observations and air quality models, Atmos. Chem. Phys., 21, 7373–7394, https://doi.org/10.5194/acp-21-7373-2021, 2021.
Baudic, A., Gros, V., Sauvage, S., Locoge, N., Sanchez, O., Sarda-Estève, R., Kalogridis, C., Petit, J.-E., Bonnaire, N., Baisnée, D., Favez, O., Albinet, A., Sciare, J., and Bonsang, B.: Seasonal variability and source apportionment of volatile organic compounds (VOCs) in the Paris megacity (France), Atmos. Chem. Phys., 16, 11961–11989, https://doi.org/10.5194/acp-16-11961-2016, 2016.
Beekmann, M., Prévôt, A. S. H., Drewnick, F., Sciare, J., Pandis, S. N., Denier van der Gon, H. A. C., Crippa, M., Freutel, F., Poulain, L., Ghersi, V., Rodriguez, E., Beirle, S., Zotter, P., von der Weiden-Reinmüller, S.-L., Bressi, M., Fountoukis, C., Petetin, H., Szidat, S., Schneider, J., Rosso, A., El Haddad, I., Megaritis, A., Zhang, Q. J., Michoud, V., Slowik, J. G., Moukhtar, S., Kolmonen, P., Stohl, A., Eckhardt, S., Borbon, A., Gros, V., Marchand, N., Jaffrezo, J. L., Schwarzenboeck, A., Colomb, A., Wiedensohler, A., Borrmann, S., Lawrence, M., Baklanov, A., and Baltensperger, U.: In situ, satellite measurement and model evidence on the dominant regional contribution to fine particulate matter levels in the Paris megacity, Atmos. Chem. Phys., 15, 9577–9591, https://doi.org/10.5194/acp-15-9577-2015, 2015.
Blake, R. S., Monks, P. S., and Ellis, A. M.: Proton-Transfer Reaction Mass Spectrometry, Chem. Rev., 109, 861–896, https://doi.org/10.1021/cr800364q, 2009.
Borbon, A., Fontaine, H., Veillerot, M., Locoge, N., Galloo, J. C., and Guillermo, R.: An investigation into the traffic-related fraction of isoprene at an urban location, Atmos. Environ., 35, 3749–3760, https://doi.org/10.1016/S1352-2310(01)00170-4, 2001.
Borbon, A., Gilman, J. B., Kuster, W. C., Grand, N., Chevaillier, S., Colomb, A., Dolgorouky, C., Gros, V., Lopez, M., Sarda-Esteve, R., Holloway, J., Stutz, J., Petetin, H., McKeen, S., Beekmann, M., Warneke, C., Parrish, D. D., and de Gouw, J. A.: Emission ratios of anthropogenic volatile organic compounds in northern mid-latitude megacities: Observations versus emission inventories in Los Angeles and Paris: VOC EMISSION RATIOS IN MODERN MEGACITIES, J. Geophys. Res.-Atmos., 118, 2041–2057, https://doi.org/10.1002/jgrd.50059, 2013.
Borbon, A., Dominutti, P., Panopoulou, A., Gros, V., Sauvage, S., Farhat, M., Afif, C., Elguindi, N., Fornaro, A., Granier, C., Hopkins, J.R., Liakakou, E., Thiago Nogueira, T., Corrêa dos Santos, T., Salameh, T., Armangaud,, A., Piga, D., and Perrussel, O.: Ubiquity of anthropogenic terpenoids in cities worldwide: Emission ratios, emission quantification and implications for urban atmospheric chemistry, J. Geophys. Res.-Atmos., 128, e2022JD037566, https://doi.org/10.1029/2022JD037566, 2023.
Bressi, M., Sciare, J., Ghersi, V., Bonnaire, N., Nicolas, J. B., Petit, J.-E., Moukhtar, S., Rosso, A., Mihalopoulos, N., and Féron, A.: A one-year comprehensive chemical characterisation of fine aerosol (PM2.5) at urban, suburban and rural background sites in the region of Paris (France), Atmos. Chem. Phys., 13, 7825–7844, https://doi.org/10.5194/acp-13-7825-2013, 2013.
Bruns, E. A., Slowik, J. G., El Haddad, I., Kilic, D., Klein, F., Dommen, J., Temime-Roussel, B., Marchand, N., Baltensperger, U., and Prévôt, A. S. H.: Characterization of gas-phase organics using proton transfer reaction time-of-flight mass spectrometry: fresh and aged residential wood combustion emissions, Atmos. Chem. Phys., 17, 705–720, https://doi.org/10.5194/acp-17-705-2017, 2017.
Chen, Y., Takeuchi, M., Nah, T., Xu, L., Canagaratna, M. R., Stark, H., Baumann, K., Canonaco, F., Prévôt, A. S. H., Huey, L. G., Weber, R. J., and Ng, N. L.: Chemical characterization of secondary organic aerosol at a rural site in the southeastern US: insights from simultaneous high-resolution time-of-flight aerosol mass spectrometer (HR-ToF-AMS) and FIGAERO chemical ionization mass spectrometer (CIMS) measurements, Atmos. Chem. Phys., 20, 8421–8440, https://doi.org/10.5194/acp-20-8421-2020, 2020.
Chiriaco, M., Dupont, J.-C., Bastin, S., Badosa, J., Lopez, J., Haeffelin, M., Chepfer, H., and Guzman, R.: ReOBS: a new approach to synthesize long-term multi-variable dataset and application to the SIRTA supersite, Earth Syst. Sci. Data, 10, 919–940, https://doi.org/10.5194/essd-10-919-2018, 2018.
Coggon, M. M., Lim, C. Y., Koss, A. R., Sekimoto, K., Yuan, B., Gilman, J. B., Hagan, D. H., Selimovic, V., Zarzana, K. J., Brown, S. S., Roberts, J. M., Müller, M., Yokelson, R., Wisthaler, A., Krechmer, J. E., Jimenez, J. L., Cappa, C., Kroll, J. H., de Gouw, J., and Warneke, C.: OH chemistry of non-methane organic gases (NMOGs) emitted from laboratory and ambient biomass burning smoke: evaluating the influence of furans and oxygenated aromatics on ozone and secondary NMOG formation, Atmos. Chem. Phys., 19, 14875–14899, https://doi.org/10.5194/acp-19-14875-2019, 2019.
Crippa, M., El Haddad, I., Slowik, J. G., DeCarlo, P. F., Mohr, C., Heringa, M. F., Chirico, R., Marchand, N., Sciare, J., Baltensperger, U., and Prévôt, A. S. H.: Identification of marine and continental aerosol sources in Paris using high resolution aerosol mass spectrometry: AEROSOL SOURCES IN PARIS USING HR-TOF-MS, J. Geophys. Res.-Atmos., 118, 1950–1963, https://doi.org/10.1002/jgrd.50151, 2013.
Daellenbach, K. R., Uzu, G., Jiang, J., Cassagnes, L.-E., Leni, Z., Vlachou, A., Stefenelli, G., Canonaco, F., Weber, S., Segers, A., Kuenen, J. J. P., Schaap, M., Favez, O., Albinet, A., Aksoyoglu, S., Dommen, J., Baltensperger, U., Geiser, M., El Haddad, I., Jaffrezo, J.-L., and Prévôt, A. S. H.: Sources of particulate-matter air pollution and its oxidative potential in Europe, Nature, 587, 414–419, https://doi.org/10.1038/s41586-020-2902-8, 2020.
de Gouw, J. and Warneke, C.: Measurements of volatile organic compounds in the earth's atmosphere using proton-transfer-reaction mass spectrometry, Mass Spectrom. Rev., 26, 223–257, https://doi.org/10.1002/mas.20119, 2007.
Drinovec, L., Močnik, G., Zotter, P., Prévôt, A. S. H., Ruckstuhl, C., Coz, E., Rupakheti, M., Sciare, J., Müller, T., Wiedensohler, A., and Hansen, A. D. A.: The “dual-spot” Aethalometer: an improved measurement of aerosol black carbon with real-time loading compensation, Atmos. Meas. Tech., 8, 1965–1979, https://doi.org/10.5194/amt-8-1965-2015, 2015.
Favez, O., El Haddad, I., Piot, C., Boréave, A., Abidi, E., Marchand, N., Jaffrezo, J.-L., Besombes, J.-L., Personnaz, M.-B., Sciare, J., Wortham, H., George, C., and D'Anna, B.: Inter-comparison of source apportionment models for the estimation of wood burning aerosols during wintertime in an Alpine city (Grenoble, France), Atmos. Chem. Phys., 10, 5295–5314, https://doi.org/10.5194/acp-10-5295-2010, 2010.
Gaimoz, C., Sauvage, S., Gros, V., Herrmann, F., Williams, J., Locoge, N., Perrussel, O., Bonsang, B., d'Argouges, O., Sarda-Estève, R., and Sciare, J.: Volatile organic compounds sources in Paris in spring 2007. Part II: source apportionment using positive matrix factorisation, Environ. Chem., 8, 91, https://doi.org/10.1071/EN10067, 2011.
Gkatzelis, G. I., Coggon, M. M., McDonald, B. C., Peischl, J., Gilman, J. B., Aikin, K. C., Robinson, M. A., Canonaco, F., Prevot, A. S. H., Trainer, M., and Warneke, C.: Observations Confirm that Volatile Chemical Products Are a Major Source of Petrochemical Emissions in U.S. Cities, Environ. Sci. Technol., 55, 4332–4343, https://doi.org/10.1021/acs.est.0c05471, 2021.
Gros, V., Gaimoz, C., Herrmann, F., Custer, T., Williams, J., Bonsang, B., Sauvage, S., Locoge, N., d'Argouges, O., Sarda-Estève, R., and Sciare, J.: Volatile organic compounds sources in Paris in spring 2007. Part I: qualitative analysis, Environ. Chem., 8, 74–90, 2011.
Guenther, A., Hewitt, C. N., Erickson, D., Fall, R., Geron, C., Graedel, T., Harley, P., Klinger, L., Lerdau, M., Mckay, W. A., Pierce, T., Scholes, B., Steinbrecher, R., Tallamraju, R., Taylor, J., and Zimmerman, P.: A global model of natural volatile organic compound emissions, J. Geophys. Res., 100, 8873, https://doi.org/10.1029/94JD02950, 1995.
Haeffelin, M., Barthès, L., Bock, O., Boitel, C., Bony, S., Bouniol, D., Chepfer, H., Chiriaco, M., Cuesta, J., Delanoë, J., Drobinski, P., Dufresne, J.-L., Flamant, C., Grall, M., Hodzic, A., Hourdin, F., Lapouge, F., Lemaître, Y., Mathieu, A., Morille, Y., Naud, C., Noël, V., O'Hirok, W., Pelon, J., Pietras, C., Protat, A., Romand, B., Scialom, G., and Vautard, R.: SIRTA, a ground-based atmospheric observatory for cloud and aerosol research, Ann. Geophys., 23, 253–275, https://doi.org/10.5194/angeo-23-253-2005, 2005.
Hellén, H., Tykkä, T., and Hakola, H.: Importance of monoterpenes and isoprene in urban air in northern Europe, Atmos. Environ., 59, 59–66, https://doi.org/10.1016/j.atmosenv.2012.04.049, 2012.
Holzinger, R., Acton, W. J. F., Bloss, W. J., Breitenlechner, M., Crilley, L. R., Dusanter, S., Gonin, M., Gros, V., Keutsch, F. N., Kiendler-Scharr, A., Kramer, L. J., Krechmer, J. E., Languille, B., Locoge, N., Lopez-Hilfiker, F., Materić, D., Moreno, S., Nemitz, E., Quéléver, L. L. J., Sarda Esteve, R., Sauvage, S., Schallhart, S., Sommariva, R., Tillmann, R., Wedel, S., Worton, D. R., Xu, K., and Zaytsev, A.: Validity and limitations of simple reaction kinetics to calculate concentrations of organic compounds from ion counts in PTR-MS, Atmos. Meas. Tech., 12, 6193–6208, https://doi.org/10.5194/amt-12-6193-2019, 2019.
IONICON: Fundamentals of PTR-MS manual, Manual Package PTR-TOF 1000-4000-6000 series, 2018.
IPCC [Szopa, S., Naik, V., Adhikary, B., Artaxo, P., Berntsen, T., Collins, W. D., Fuzzi, S., Gallardo, L., Kiendler-Scharr, A., Klimont, Z., Liao, H., Unger, N., and Zanis, P.]: Short-Lived Climate Forcers, in: Climate Change 2021: The Physical Science Basis. Contribution of Working Group I to the Sixth Assessment Report of the Intergovernmental Panel on Climate Change, edited by: Masson-Delmotte, V., Zhai, P., Pirani, A., Connors, S. L., Péan, C., Berger, S., Caud, N., Chen, Y., Goldfarb, L., Gomis, M. I., Huang, M., Leitzell, K., Lonnoy, E., Matthews, J. B. R., Maycock, T. K., Waterfield, T., Yelekçi, O., Yu, R., and Zhou, B., Cambridge University Press, Cambridge, United Kingdom and New York, NY, USA, 817–922, https://www.ipcc.ch/report/ar6/wg1/downloads/report/IPCC_AR6_WGI_Chapter06.pdf (last access: 11 May 2023), 2021.
Joo, T., Rivera-Rios, J. C., Takeuchi, M., Alvarado, M. J., and Ng, N. L.: Secondary Organic Aerosol Formation from Reaction of 3-Methylfuran with Nitrate Radicals, ACS Earth Space Chem., 3, 922–934, https://doi.org/10.1021/acsearthspacechem.9b00068, 2019.
Jordan, C., Fitz, E., Hagan, T., Sive, B., Frinak, E., Haase, K., Cottrell, L., Buckley, S., and Talbot, R.: Long-term study of VOCs measured with PTR-MS at a rural site in New Hampshire with urban influences, Atmos. Chem. Phys., 9, 4677–4697, https://doi.org/10.5194/acp-9-4677-2009, 2009.
Kaltsonoudis, C., Kostenidou, E., Florou, K., Psichoudaki, M., and Pandis, S. N.: Temporal variability and sources of VOCs in urban areas of the eastern Mediterranean, Atmos. Chem. Phys., 16, 14825–14842, https://doi.org/10.5194/acp-16-14825-2016, 2016.
Kammer, J., Décuq, C., Baisnée, D., Ciuraru, R., Lafouge, F., Buysse, P., Bsaibes, S., Henderson, B., Cristescu, S. M., Benabdallah, R., Chandra, V., Durand, B., Fanucci, O., Petit, J.-E., Truong, F., Bonnaire, N., Sarda-Estève, R., Gros, V., and Loubet, B.: Characterization of particulate and gaseous pollutants from a French dairy and sheep farm, Sci. Total Environ., 712, 135598, https://doi.org/10.1016/j.scitotenv.2019.135598, 2019.
Kastler, J. and Ballschmiter, K.: Bifunctional alkyl nitrates – trace constituents of the atmosphere, Fresenius' Journal of Analytical Chemistry, 360, 812–816, https://doi.org/10.1007/s002160050815, 1998.
Kotthaus, S. and Grimmond, C. S. B.: Atmospheric boundary-layer characteristics from ceilometer measurements. Part 1: A new method to track mixed layer height and classify clouds, Q. J. Roy. Meteorol. Soc., 144, 1525–1538, https://doi.org/10.1002/qj.3299, 2018.
Lamprecht, C., Graus, M., Striednig, M., Stichaner, M., and Karl, T.: Decoupling of urban CO2 and air pollutant emission reductions during the European SARS-CoV-2 lockdown, Atmos. Chem. Phys., 21, 3091–3102, https://doi.org/10.5194/acp-21-3091-2021, 2021.
Languille, B., Gros, V., Petit, J.-E., Honoré, C., Baudic, A., Perrussel, O., Foret, G., Michoud, V., Truong, F., Bonnaire, N., Sarda-Estève, R., Delmotte, M., Feron, A., Maisonneuve, F., Gaimoz, C., Formenti, P., Kotthaus, S., Haeffelin, M., and Favez, O.: Wood burning: A major source of Volatile Organic Compounds during wintertime in the Paris region, Sci. Total Environ., 711, 135055, https://doi.org/10.1016/j.scitotenv.2019.135055, 2020.
Larsen, B. R., Bella, D. D., Glasius, M., Winterhalter, R., Jensen, N. R., and Hjorth, J.: Gas-Phase OH Oxidation of Monoterpenes: Gaseous and Particulate Products, J. Atmos. Chem., 38, 231–276, https://doi.org/10.1023/A:1006487530903, 2000.
Lefohn, A. S., Malley, C. S., Smith, L., Wells, B., Hazucha, M., Simon, H., Naik, V., Mills, G., Schultz, M. G., Paoletti, E., De Marco, A., Xu, X., Zhang, L., Wang, T., Neufeld, H. S., Musselman, R. C., Tarasick, D., Brauer, M., Feng, Z., Tang, H., Kobayashi, K., Sicard, P., Solberg, S., and Gerosa, G.: Tropospheric ozone assessment report: Global ozone metrics for climate change, human health, and crop/ecosystem research, Elementa: Science of the Anthropocene, 6, 27, https://doi.org/10.1525/elementa.279, 2018.
Lindinger, W., Jordan, A., and Hansel, A: Proton-transfer-reaction mass spectrometry (PTR–MS): on-line monitoring of volatile organic compounds at pptv levels, Chem. Soc. Rev., 27, 347, https://doi.org/10.1039/a827347z, 1998.
Mahilang, M., Deb, M. K., and Pervez, S.: Biogenic secondary organic aerosols: A review on formation mechanism, analytical challenges and environmental impacts, Chemosphere, 262, 127771, https://doi.org/10.1016/j.chemosphere.2020.127771, 2021.
Mayorga, R. J., Zhao, Z., and Zhang, H.: Formation of secondary organic aerosol from nitrate radical oxidation of phenolic VOCs: Implications for nitration mechanisms and brown carbon formation, Atmos. Environ., 244, 117910, https://doi.org/10.1016/j.atmosenv.2020.117910, 2021.
McDonald, B. C., de Gouw, J. A., Gilman, J. B., Jathar, S. H., Akherati, A., Cappa, C. D., Jimenez, J. L., Lee-Taylor, J., Hayes, P. L., McKeen, S. A., Cui, Y. Y., Kim, S.-W., Gentner, D. R., Isaacman-VanWertz, G., Goldstein, A. H., Harley, R. A., Frost, G. J., Roberts, J. M., Ryerson, T. B., and Trainer, M.: Volatile chemical products emerging as largest petrochemical source of urban organic emissions, Science, 359, 760–764, https://doi.org/10.1126/science.aaq0524, 2018.
Müller, M., Graus, M., Wisthaler, A., Hansel, A., Metzger, A., Dommen, J., and Baltensperger, U.: Analysis of high mass resolution PTR-TOF mass spectra from 1,3,5-trimethylbenzene (TMB) environmental chamber experiments, Atmos. Chem. Phys., 12, 829–843, https://doi.org/10.5194/acp-12-829-2012, 2012.
National Physical Laboratory, UK: https://www.npl.co.uk/ (last access: 30 April 2023), 2021.
Orlando, J. J., Nozière, B., Tyndall, G. S., Orzechowska, G. E., Paulson, S. E., and Rudich, Y.: Product studies of the OH- and ozone-initiated oxidation of some monoterpenes, J. Geophys. Res., 105, 11561–11572, https://doi.org/10.1029/2000JD900005, 2000
Pagonis, D., Sekimoto, K., and de Gouw, J.: A Library of Proton-Transfer Reactions of H3O+ Ions Used for Trace Gas Detection, J. Am. Soc. Mass Spectrom., 30, 1330–1335, https://doi.org/10.1007/s13361-019-02209-3, 2019.
Panopoulou, A.: Yearlong measurements of monoterpenes and isoprene in a Mediterranean city (Athens): Natural vs anthropogenic origin, Atmos. Environ., 243, 117803, https://doi.org/10.1016/j.atmosenv.2020.117803, 2020.
Panopoulou, A., Liakakou, E., Sauvage, S., Gros, V., Locoge, N., Stavroulas, I., Bonsang, B., Gerasopoulos, E., and Mihalopoulos, N.: Yearlong measurements of monoterpenes and isoprene in a Mediterranean city (Athens): Natural vs anthropogenic origin, Atmos. Environ., 243, 117803, https://doi.org/10.1016/j.atmosenv.2020.117803, 2020.
Petit, J.-E., Favez, O., Sciare, J., Crenn, V., Sarda-Estève, R., Bonnaire, N., Močnik, G., Dupont, J.-C., Haeffelin, M., and Leoz-Garziandia, E.: Two years of near real-time chemical composition of submicron aerosols in the region of Paris using an Aerosol Chemical Speciation Monitor (ACSM) and a multi-wavelength Aethalometer, Atmos. Chem. Phys., 15, 2985–3005, https://doi.org/10.5194/acp-15-2985-2015, 2015.
Petit, J.-E., Favez, O., Albinet, A., and Canonaco, F.: A user-friendly tool for comprehensive evaluation of the geographical origins of atmospheric pollution: Wind and trajectory analyses, Environ. Model. Softw., 88, 183–187, https://doi.org/10.1016/j.envsoft.2016.11.022, 2017.
Petit, J.-E., Dupont, J.-C., Favez, O., Gros, V., Zhang, Y., Sciare, J., Simon, L., Truong, F., Bonnaire, N., Amodeo, T., Vautard, R., and Haeffelin, M.: Response of atmospheric composition to COVID-19 lockdown measures during spring in the Paris region (France), Atmos. Chem. Phys., 21, 17167–17183, https://doi.org/10.5194/acp-21-17167-2021, 2021.
Sandradewi, J., Prévôt, A. S. H., Szidat, S., Perron, N., Alfarra, M. R., Lanz, V. A., Weingartner, E., and Baltensperger, U.: Using Aerosol Light Absorption Measurements for the Quantitative Determination of Wood Burning and Traffic Emission Contributions to Particulate Matter, Environ. Sci. Technol., 42, 3316–3323, https://doi.org/10.1021/es702253m, 2008.
Sciare, J., d'Argouges, O., Sarda-Estève, R., Gaimoz, C., Dolgorouky, C., Bonnaire, N., Favez, O., Bonsang, B., and Gros, V.: Large contribution of water-insoluble secondary organic aerosols in the region of Paris (France) during wintertime: WINTERTIME WATER-INSOLUBLE SOA, J. Geophys. Res., 116, D22203, https://doi.org/10.1029/2011JD015756, 2011.
Seinfeld, J. H. and Pandis, S. N.: Atmospheric chemistry and physics: from air pollution to climate change, 2nd ed., J. Wiley, Hoboken, NJ, 1203 pp., 2006.
Simon, L., Gros, V., Truong, F., Sarda-Esteve, R., and Kalalian, C.: PTR-MS measurements in 2020–2021, IPSL Data Catalog [data set], https://doi.org/10.14768/f8c46735-e6c3-45e2-8f6f-26c6d67c4723, 2022a.
Simon, L., Gros V., Truong F., Sarda-Esteve R., and Kalalian, C.: ACTRIS PTR-MS measurements in 2020–2021, ACTRIS Database Ebas [data set], https://ebas-data.nilu.no/DataSets.aspx?stations=FR0020R&InstrumentTypes=PTR-MS&fromDate=1970-01-01&toDate=2023-12-31 (last access: 3 May 2023), 2022b.
Solberg, S., Claude, A., Reimann, S., and Sauvage, S.: VOC measurements 2019, EMEP/CCC-reports, https://projects.nilu.no/ccc/reports/EMEP_CCC-Report_4_2021_VOC_measurements_2019.pdf (last access: 30 April 2023), 2021.
Španěl, P., Wang, T., and Smith, D.: A selected ion flow tube, SIFT, study of the reactions of H3O+, NO+ and O2+ ions with a series of diols, Int. J. Mass Spectrom., 218, 227–236, https://doi.org/10.1016/S1387-3806(02)00724-8, 2002.
Steinbrecher, R., Smiatek, G., Köble, R., Seufert, G., Theloke, J., Hauff, K., Ciccioli, P., Vautard, R., and Curci, G.: Intra- and inter-annual variability of VOC emissions from natural and semi-natural vegetation in Europe and neighbouring countries, Atmos. Environ., 43, 1380–1391, https://doi.org/10.1016/j.atmosenv.2008.09.072, 2009.
Taipale, R., Ruuskanen, T. M., Rinne, J., Kajos, M. K., Hakola, H., Pohja, T., and Kulmala, M.: Technical Note: Quantitative long-term measurements of VOC concentrations by PTR-MS – measurement, calibration, and volume mixing ratio calculation methods, Atmos. Chem. Phys., 8, 6681–6698, https://doi.org/10.5194/acp-8-6681-2008, 2008.
Verreyken, B., Amelynck, C., Schoon, N., Müller, J.-F., Brioude, J., Kumps, N., Hermans, C., Metzger, J.-M., Colomb, A., and Stavrakou, T.: Measurement report: Source apportionment of volatile organic compounds at the remote high-altitude Maïdo observatory, Atmos. Chem. Phys., 21, 12965–12988, https://doi.org/10.5194/acp-21-12965-2021, 2021.
Wagner, P. and Kuttler, W.: Biogenic and anthropogenic isoprene in the near-surface urban atmosphere – A case study in Essen, Germany, Sci. Total Environ., 475, 104–115, https://doi.org/10.1016/j.scitotenv.2013.12.026, 2014.
Yu, J., Iii, D. R. C., Griffin, R. J., Flagan, R. C., and Seinfeld, J. H.: Gas-Phase Ozone Oxidation of Monoterpenes: Gaseous and Particulate Products, J. Atmos. Chem., 34, 207–258, https://doi.org/10.1023/A:1006254930583, 1999.
Yuan, B., Koss, A. R., Warneke, C., Coggon, M., and Sekimoto, K.: Proton-Transfer-Reaction Mass Spectrometry: Applications in Atmospheric Sciences, Chem. Rev., 117, 13187–13229, https://doi.org/10.1021/acs.chemrev.7b00325, 2017.
Zhang, Y., Favez, O., Petit, J.-E., Canonaco, F., Truong, F., Bonnaire, N., Crenn, V., Amodeo, T., Prévôt, A. S. H., Sciare, J., Gros, V., and Albinet, A.: Six-year source apportionment of submicron organic aerosols from near-continuous highly time-resolved measurements at SIRTA (Paris area, France), Atmos. Chem. Phys., 19, 14755–14776, https://doi.org/10.5194/acp-19-14755-2019, 2019.
Zhao, J. and Zhang, R.: Proton transfer reaction rate constants between hydronium ion (H3O+) and volatile organic compounds, Atmos. Environ., 38, 2177–2185, https://doi.org/10.1016/j.atmosenv.2004.01.019, 2004.