the Creative Commons Attribution 4.0 License.
the Creative Commons Attribution 4.0 License.
 | 09 May 2023
An adapted hourly Himawari-8 fire product for China: principle, methodology and verification
Jie Chen
Qiancheng Lv
Shuang Wu
Yelu Zeng
Manchun Li
Ziyue Chen
Enze Zhou
Wei Zheng
Cheng Liu
Xiao Chen
Jing Yang
Bingbo Gao
Wildfires exert strong influences on the environment, ecology, economy and public security. However, the existing hourly Himawari-8 fire product produced by the Japan Meteorological Agency (JMA) presents large uncertainties and is not suitable for reliable real-time fire monitoring in China. To fill this gap, the National Satellite Meteorological Center (NSMC) proposed an adaptive hourly Himawari-8 fire product for China based on the original Himawari-8 source by employing a dynamical threshold for fire extraction and a database of ground thermal sources. According to the visually extracted reference and consistency check, we found that the NSMC-Himawari-8 fire product effectively removed a majority of false fire alarms included in the original Himawari-8 fire product. Based on a rare field-collected ground reference dataset, we evaluated the reliability of original Himawari-8 and NSMC-Himawari-8 fire products across China. The overall accuracy of the raw Himawari-8 fire product was 54 % and 59 % (not considering the omission errors), respectively. As a comparison, by identifying more real fire pixels and avoiding a majority of false fire alarms, the overall accuracy of the NSMC-Himawari-8 fire product was 80 % and 84 % (not considering the omission errors), respectively, making it an ideal source for improved real-time fire monitoring across China. This research also provides a useful reference for employing a local dataset of underlying surfaces and thermal sources to enhance the accuracy of global fire products in specific regions. The NSMC-Himawari-8 fire product can be downloaded at http://figshare.com (last access: 17 April 2023) with the following DOI: https://doi.org/10.6084/m9.figshare.21550248 (Chen et al., 2022a).
- Article
(13252 KB) - Full-text XML
- BibTeX
- EndNote


With a vast coverage, wildfires across China have a strong negative impact on crops (Song et al., 2022), forests (Ying et al., 2018; Niu et al., 2012; Zackrisson, 1977), grasslands (Balch et al., 2013), biodiversity (Driscoll et al., 2010; Andersen et al., 2005), wildlife (Tiedemann et al., 2000), local and regional climate (T. Liu et al., 2018; Marlier et al., 2015), and public health (Huff et al., 2015; Johnston et al., 2012). Recently, the increasing occurrence of annual forest fires in China has caused a high mortality rate. (Wu et al., 2014; Liu et al., 2012). The cross-country grassland fires, especially grasslands at the China–Mongolia boundary, are exerting an increasing serious threat to the sustainable development of grasslands (Na et al., 2018), as well as the wealth (Abram et al., 2021; Cascio, 2018; Reid et al., 2016) and lives (Liu et al., 2015) of local residents. In addition to natural fires, anthropogenic fires, mostly the fires caused by crop-residue burning, which has been considered one significant driver of airborne pollution (Li et al., 2016; Huang et al., 2012; Angassa and Oba, 2008) and strictly controlled across China, are given growing emphasis in recent years.
Given the significant role of wildfires in the national ecology, environment and economy, as well as people's daily lives, both the central and local governments are making substantial efforts to prevent and control natural and human-induced fires (Panjaitan et al., 2019). Amongst a series of measures, timely and precise monitoring is key for the effective identification and suppression of wildfires (Earl and Simmonds, 2018; Andela et al., 2017; Wang et al., 2018). In the past, regular forest, farmland and grassland inspection was the major approach for preventing wildfires (Röder et al., 2008). However, this approach is highly resource-consuming and of extremely low efficiency (Giglio et al., 2006). Furthermore, for those distant regions with terrible natural conditions and scarce residents, it is difficult for people to conduct manual inspection. In that case, the wildfires that occur in those areas can hardly be detected within a short period. To address this issue, some alternative solutions have been employed. For instance, a large number of on-site monitoring sensors can be installed randomly in forests or grasslands to capture in real time the smoke and heat and thus quickly detect active fires (Li et al., 2019). However, extensive resources are required for installing and maintaining these sensors. Meanwhile, there is still a majority of areas that cannot be covered by these sensors; thus, the general efficiency and accuracy of fire monitoring remains low (Ichoku et al., 2012; Freeborn et al., 2011).
Thanks to its easy access, low cost, continuous time series, and most importantly large-scale and spatially continuous coverage, remote sensing has been increasingly employed for fire monitoring (Xu et al., 2017; Schmit et al., 2017). Since the 1970s, the National Oceanic and Atmospheric Administration (NOAA) series satellites (https://www.noaa.gov, last access: 17 April 2023) and NOAA fire products, with a spatial resolution of 1.1 km and a daily temporal resolution, have been employed for global fire monitoring (Fuller and Fulk, 2000). Afterward, many regional or global fire products have been proposed in recent years. Attributed to its free access, long time series, and reliable accuracy (Giglio et al., 2018), Moderate Resolution Imaging Spectroradiometer (MODIS) fire product, with a spatial resolution of 1 km and a temporal resolution of 12 h, has become one of the most widely employed fire products since 2000 (Justice et al., 2002). The Visible Infrared Imaging Radiometer Suite (VIIRS) fire product, with a temporal resolution of 12 h and an improved spatial resolution of 375 m, has been available since 2011 (Schroeder et al., 2014). Despite a higher spatial resolution, the accuracy of the VIIRS fire products is generally lower than that of the MODIS fire products (Sharma et al., 2017). In recent years, China has launched a series of Fengyun satellites, based on which a diversity of meteorological and fire products can be produced. We recently publicly released a Fengyun-3D global fire product (http://satellite.nsmc.org.cn/portalsite/default.aspx, last access: 17 April 2023; Chen et al., 2022b), with a daily resolution and 1 km spatial resolution. The Fengyun-3D fire product has a good global consistency with MODIS fire product and presented a significantly improved accuracy in China (Chen et al., 2022c), making it an ideal continuity of the MODIS fire products and a better choice for relevant study in China.
Despite the rapid development of daily-level and moderate-resolution global fire products, they are not suitable for quick identification of wildfires or for understanding their environmental and ecological consequences (Yang et al., 2019). To fill this gap, specific satellites have been launched recently to produce fire products with extremely high temporal resolution. GEOS-16 Advanced Baseline Imager (ABI) products, with a temporal resolution of 5 min and a spatial resolution of 2 km, have been available for regional fire monitoring in the western hemisphere (Hall et al., 2019). Himawari-8 products from the Japan Meteorological Agency (JMA), with a spatial resolution of 2 km and temporal resolution of 10 min, have been employed to monitor meteorology and wildfires in Asia and Australia since 2015 (Xu and Zhong, 2017). Given its moderate spatial resolution, extremely high temporal resolution and its fixed observation region, Himawari-8 is quite suitable for real-time monitoring of wildfires in China. Furthermore, compared with MODIS or Fengyun-3D fire products, which fail to capture the occurrence in the night, Himawari-8 is advantageous for continuously monitoring wildfires after sunset, which is highly suitable for replacing manual inspection to monitor wildfires at night. However, the existing Himawari-8 fire product presented a poor consistency with MODIS data (Jang et al., 2019), and the accuracy of the Himawari-8 fire products in China remained unknown without a reliable accuracy report. Himawari-8 fire products, despite their good potential, have been limitedly employed (Na et al., 2018).
To provide a more reliable fire product for active fire monitoring in China, based on the raw Himawari-8 data, we proposed a new hourly fire product for China (National Satellite Meteorological Center Himawari-8 fire product for China, NSMC-Himawari-8 fire product for China) by employing adapted fire-detection algorithms and local parameters concerning underlying surface and meteorological conditions, which were not available and implemented by the Japan Meteorological Agency (JMA). This paper introduces the characteristics and fire-detection algorithms of the new fire product (downloadable at http://figshare.com). Meanwhile, based on the ground-truth data, which are rarely collected and employed for verifying fire detection in China, we compared the accuracy of the JMA-Himawari-8 and NSMC-Himawari-8 fire products. Thanks to its good spatiotemporal resolution and significantly improved accuracy, the NSMC-Himawari-8 fire product has the potential to largely prompt the fire prevention and control and boost relevant ecological and environmental research in China.
2.1 Instrument
The Himawari-8 geostationary meteorological satellite was launched by JMA at the Tanegashima Space Center in October 2014, and it officially began operation in July 2015 (Bessho et al., 2016). The satellite was designed to continuously support monitoring of storm clouds, typhoon movements, volcanoes with continuous eruptions and other disaster prevention areas for more than 15 years. The sub-satellite point is located over the Equator at 140.7∘ E, with an operating altitude of approximately 35 800 km. As a new generation of geostationary meteorological satellite, Himawari-8 with an improved Advanced Himawari-8 Imager (AHI) has a great improvement in observation frequency and spatial resolution compared with the previous satellites. AHI includes a total of 16 bands from visible light to far infrared (as shown in Table 1), which can access the 500 m high spatial resolution in the red band and support the observation time interval of 10 min. Himawari-8/AHI with six observation spots can monitor four regions in total, including the full disc (60∘ N–60∘ S, 80∘ E–160∘ W), Japan (scope of two Japanese regions), the tropical cyclone sensitive area (target area) and the corner of Australia (landmark area).

2.2 Product overview
Thanks to Himawari-8/AHI's multi-band setting and the substantial improvement of high-frequency characteristics of observation, JMA has generated a wildfire dataset at a spatial resolution of nominal 0.02∘ (2 km × 2 km at nadir) and hourly temporal resolution (Wickramasinghe et al., 2016). This product has been widely used in wildfire monitoring and analysis in Asia and Australia (Xu and Zhong, 2017), with surprising results. This product provides the location and the fire radioactive power (FRP) of hot spots retrieved from the IR imagers carried on Himawari-8, using the retrieval algorithm developed by the Japan Space Agency Earth Observation Research Center (JAXA/EORC). Based on the notable difference in the brightness temperature between fire spots and background, this JMA fire-detection algorithm can reliably monitor hot spots for the full disc (60∘ N–60∘ S, 80∘ E–160∘ W). And the reliability level of fire detection is given according to detection situations such as sun glint, solar angle, spatial variability of the brightness temperature and so on. The JMA-Himawari-8 fire product has extremely high temporal resolution and good accuracy in Japan (Wickramasinghe et al., 2016). However, given the large variations in underlying surfaces and potential limitations of the fire-detection algorithm, the reliability of JMA-Himawari-8 fire product across the entire monitoring region remains unclear (Liu et al., 2018). Specifically for China, in these years, increasing emphasis has been placed on the timely and reliable monitoring of wildfires, especially crop-residue burning, and the use of satellite data sources has been widely employed. However, the consistency between multiple mainstream fire products in China was relatively low (Liu et al., 2018), which caused large uncertainty and difficulty in providing reliable reference data for fire monitoring. With the highest temporal resolution, Himawari-8-based fire products have great potential to support real-time fire identification in China. Nevertheless, in practical implementation, the JMA-Himawari-8 fire product seems to have a poor consistency with the commonly employed MODIS fire product in China. Meanwhile, due to the lack of ground-truth reference data, the accuracy of the JMA-Himawari-8 fire product has yet to be verified, and the wide implementation of the JMA-Himawari-8 fire product in China's fire monitoring has been limited.
To fully explore the advantage of Himawari-8/AHI for fire detection and overcome the potential limitation of the JMA-Himawari-8 fire product, we presented a new hourly fire product from 2019 to 2021, i.e. NSMC-Himawari-8 fire product for China, with an hourly temporal resolution and a spatial resolution of 2 km. By specifically considering the underlying surface information in China and adjusting fire-detection algorithms, the NSMC-Himawari-8 fire product aims to present an improved reliance for timely fire identification in China, which can provide fire location, burning area, FRP, district name and distribution of underlying surfaces. As briefly demonstrated in Fig. 1, there is a large difference between the two products, characterised by many more fire pixels identified by the JMA-Himawari-8 fire product.
The NSMC-Himawari-8 fire product has been produced to have a better accuracy than the JMA-Himawari-8 fire product through the following strategies. Firstly, by considering the underlying surface information, conventional thermal anomalies caused by industrial production and photovoltaic power plants, which may be easily recognised as fires, can be effectively avoided. Secondly, we dynamically adjusted the function of the fire-pixel identification threshold. As a comparison, commonly employed fire-extraction algorithms used a fixed threshold when calculating the brightness temperature difference between the target pixel and the surrounding pixels, which may cause increased uncertainty for non-uniform underlying surface, where the difference in brightness temperature between the target pixel and surrounding pixels varied notably (Chen et al., 2022b). Thirdly, we adopted a more efficient approach to calculate the background brightness temperature. For traditional algorithms, due to the coarse resolution of the underlying surface, the influence of vegetation type, vegetation coverage and cloud coverage cannot be fully considered. By including more reliable information on the underlying surface in China, our algorithm can better calculate the background brightness temperature of the target area.
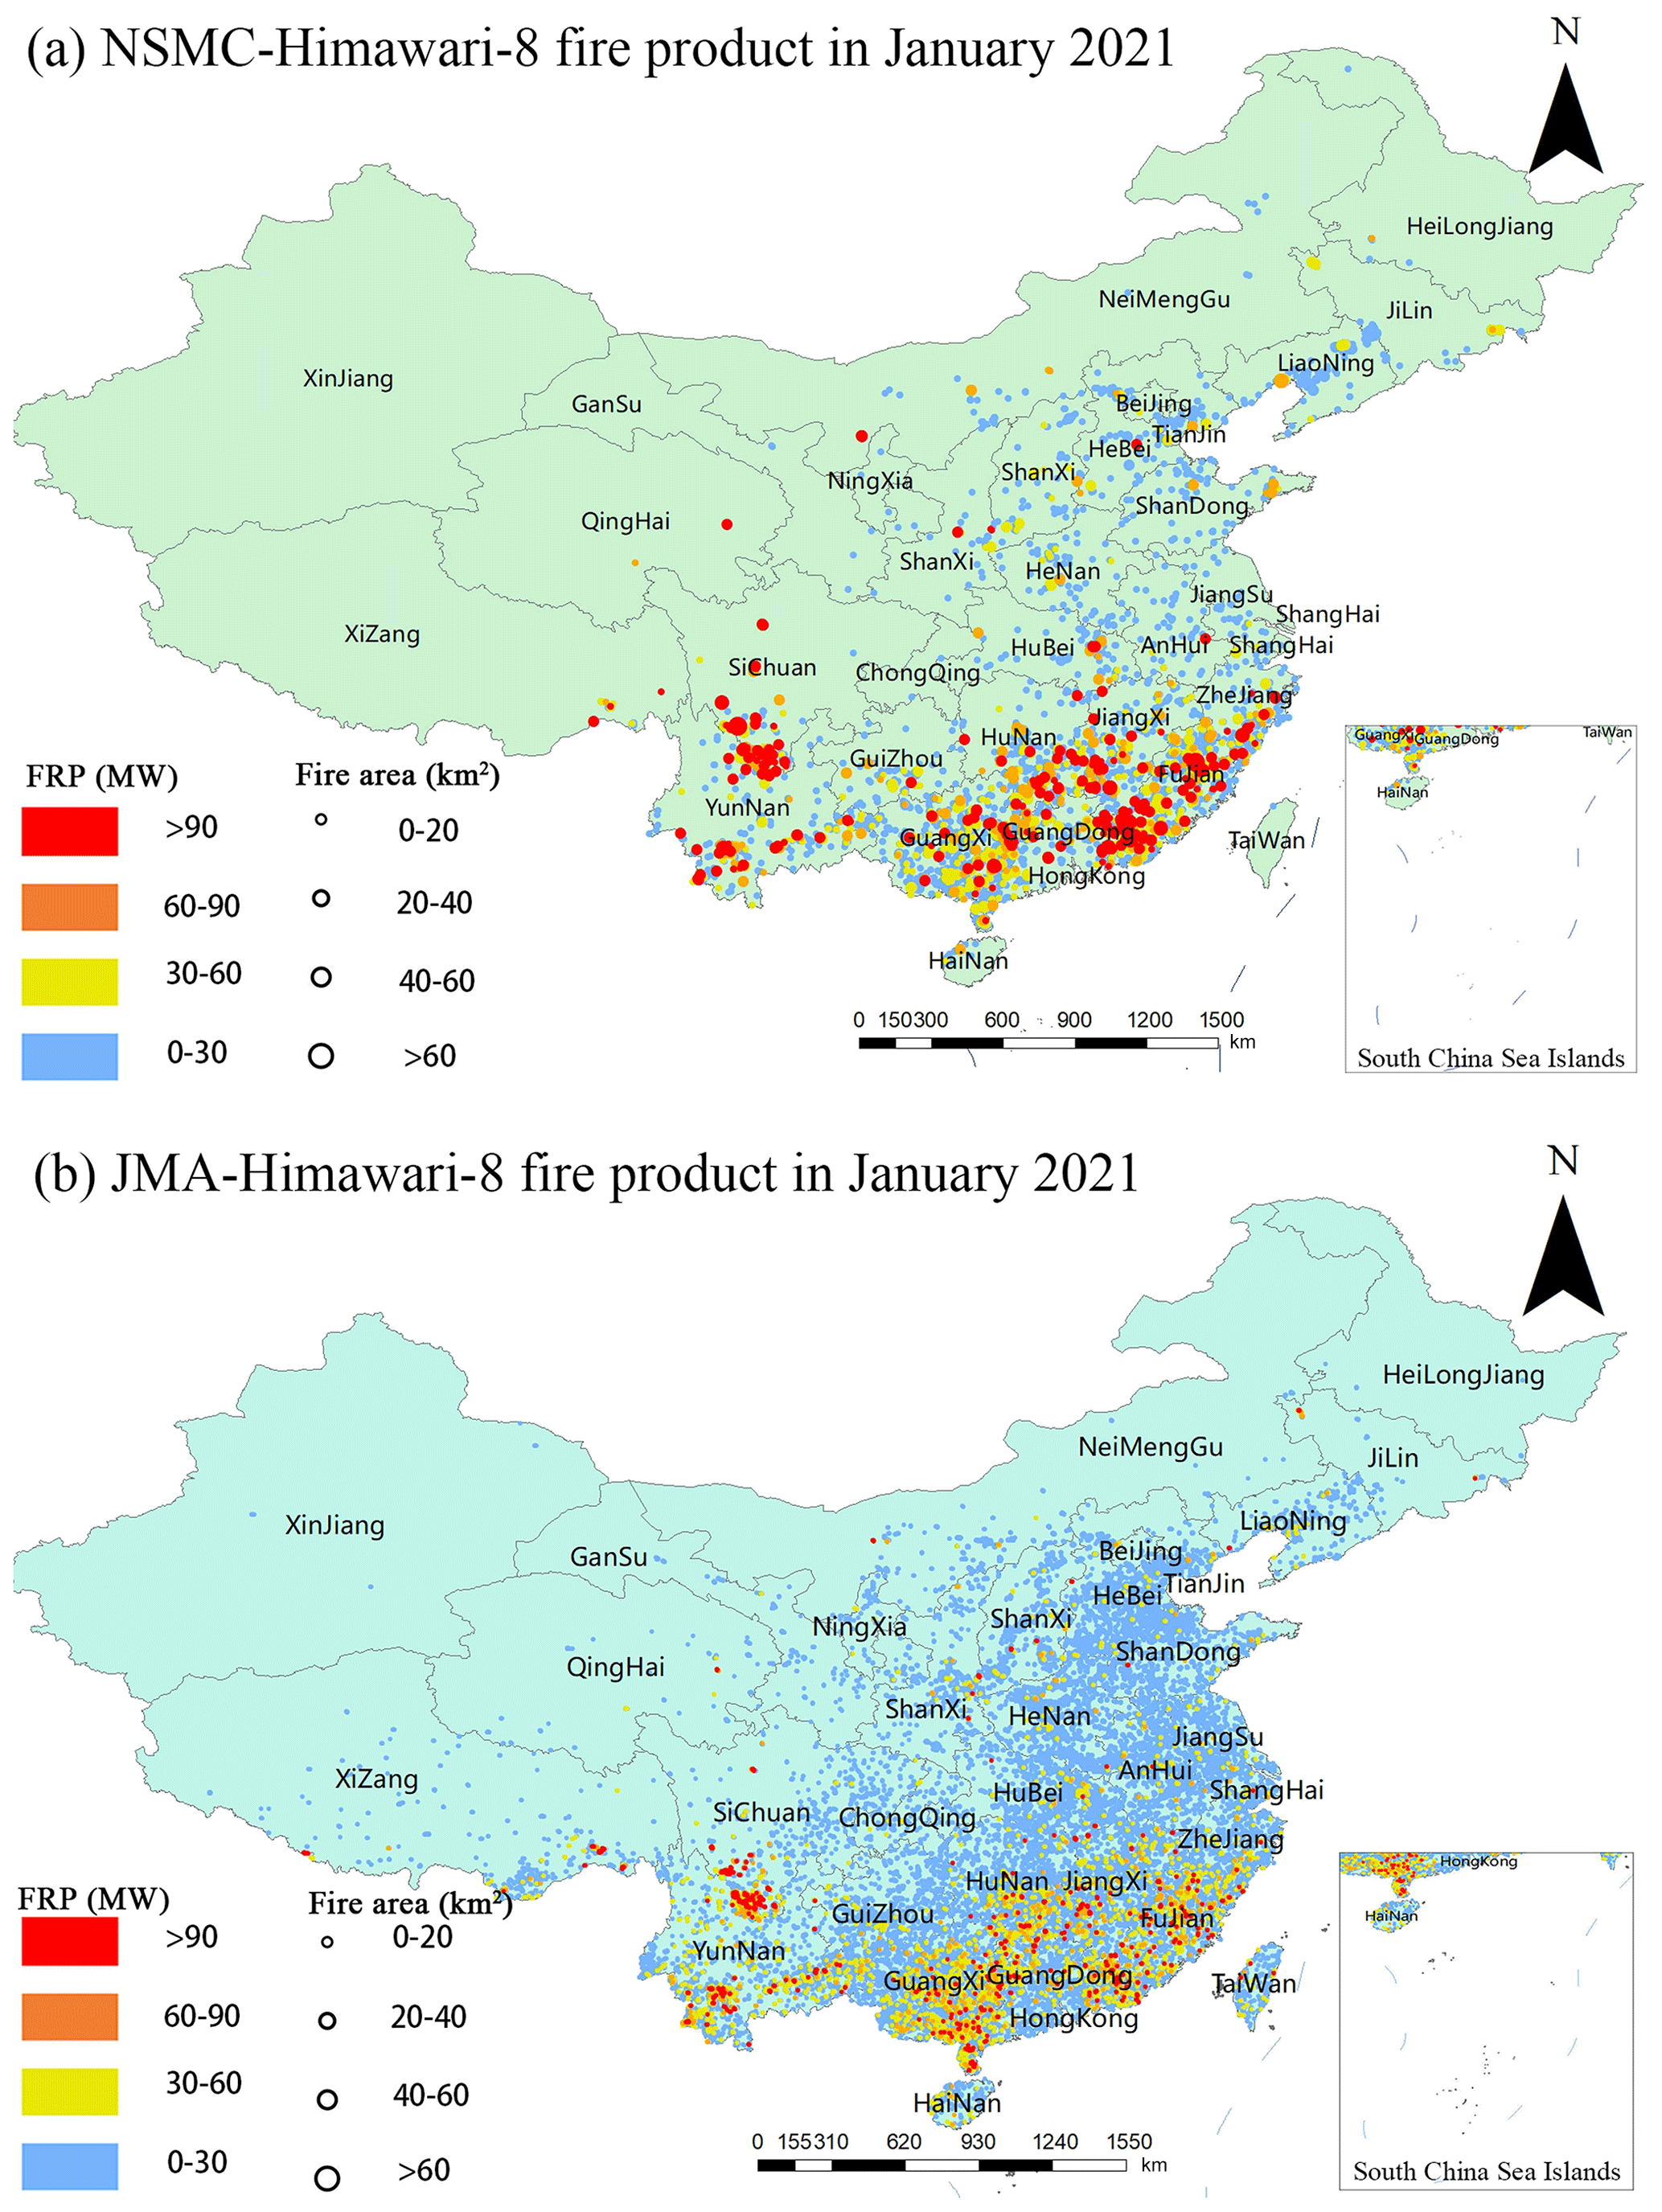
Figure 1A brief illustration of the JMA-Himawari-8 and NSMC-Himawari-8 fire products in January 2021.
This section mainly introduces our automatic fire-identification algorithm for producing the NSMC-Himawari-8 fire product, based on original data obtained from Himawari-8/AHI.
3.1 Principle of fire-pixel identification
The basic principle of fire detection based on remote sensing mainly depends on two conditions: the increase in fire temperature leads to the enhancement of thermal radiation and the difference in the growth range of radiation energy between different thermal infrared bands (Csiszar et al., 2006). Different objects in nature have a diversity of spectral characteristics due to their diverse physical and chemical properties (Herold and Roberts, 2005). When biomass is burned, the main radiation sources are flame, carbides with higher temperature, water vapour, smoke and so forth (Zhang and Kondragunta, 2008). According to the Stephen–Boltzmann formula (Quinn and Martin, 1985), notable variations of surface radiation are sensitive to the temperature, which means the heat sources can be detected based on radiance change.
where J is radiant emittance, and ε is the radiant coefficient. If it is an ideal blackbody, ε=1. Symbol σ is the Stefan–Boltzmann constant, where W m−2 K−4, and T is absolute temperature.
Wien's displacement formula shows that the brightness temperature is inversely proportional to the wavelength of the radiation centre. With an increase in brightness temperature, the radiation wavelength becomes shorter (Kuenzer and Dech, 2013).
where λmax is the peak wavelength of radiation (unit: m); b is the proportional constant, i.e. Wien displacement constant, with a value of 0.002897 m K; and T is the absolute temperature. Blackbody temperature T is inversely proportional to peak radiation wavelength λmax, as a higher temperature can lead to a smaller peak radiation wavelength.
The peak wavelength of surface radiation within normal temperature is close to that at Band 13 and Band 14. When biomass is burned, the temperature can reach 750 K, and the radiation peak wavelength is close to Band 7 (Yang et al., 2017). Taking the radiation when the surface features are not burning as the background radiation, the difference between the combustion radiation and the background radiation is notable in fire pixels, based on which the fire information can be extracted and analysed. Band 7 of Himawari-8/AHI is mid-infrared, with a wavelength of 3.88 µm; Band 13 is far-infrared, with a wavelength of 10.41 µm; and Band 14 is the infrared split-window band, with a wavelength of 11.23 µm. For this research, we considered Band 7, Band 13 and Band 14 for fire-pixel extraction.
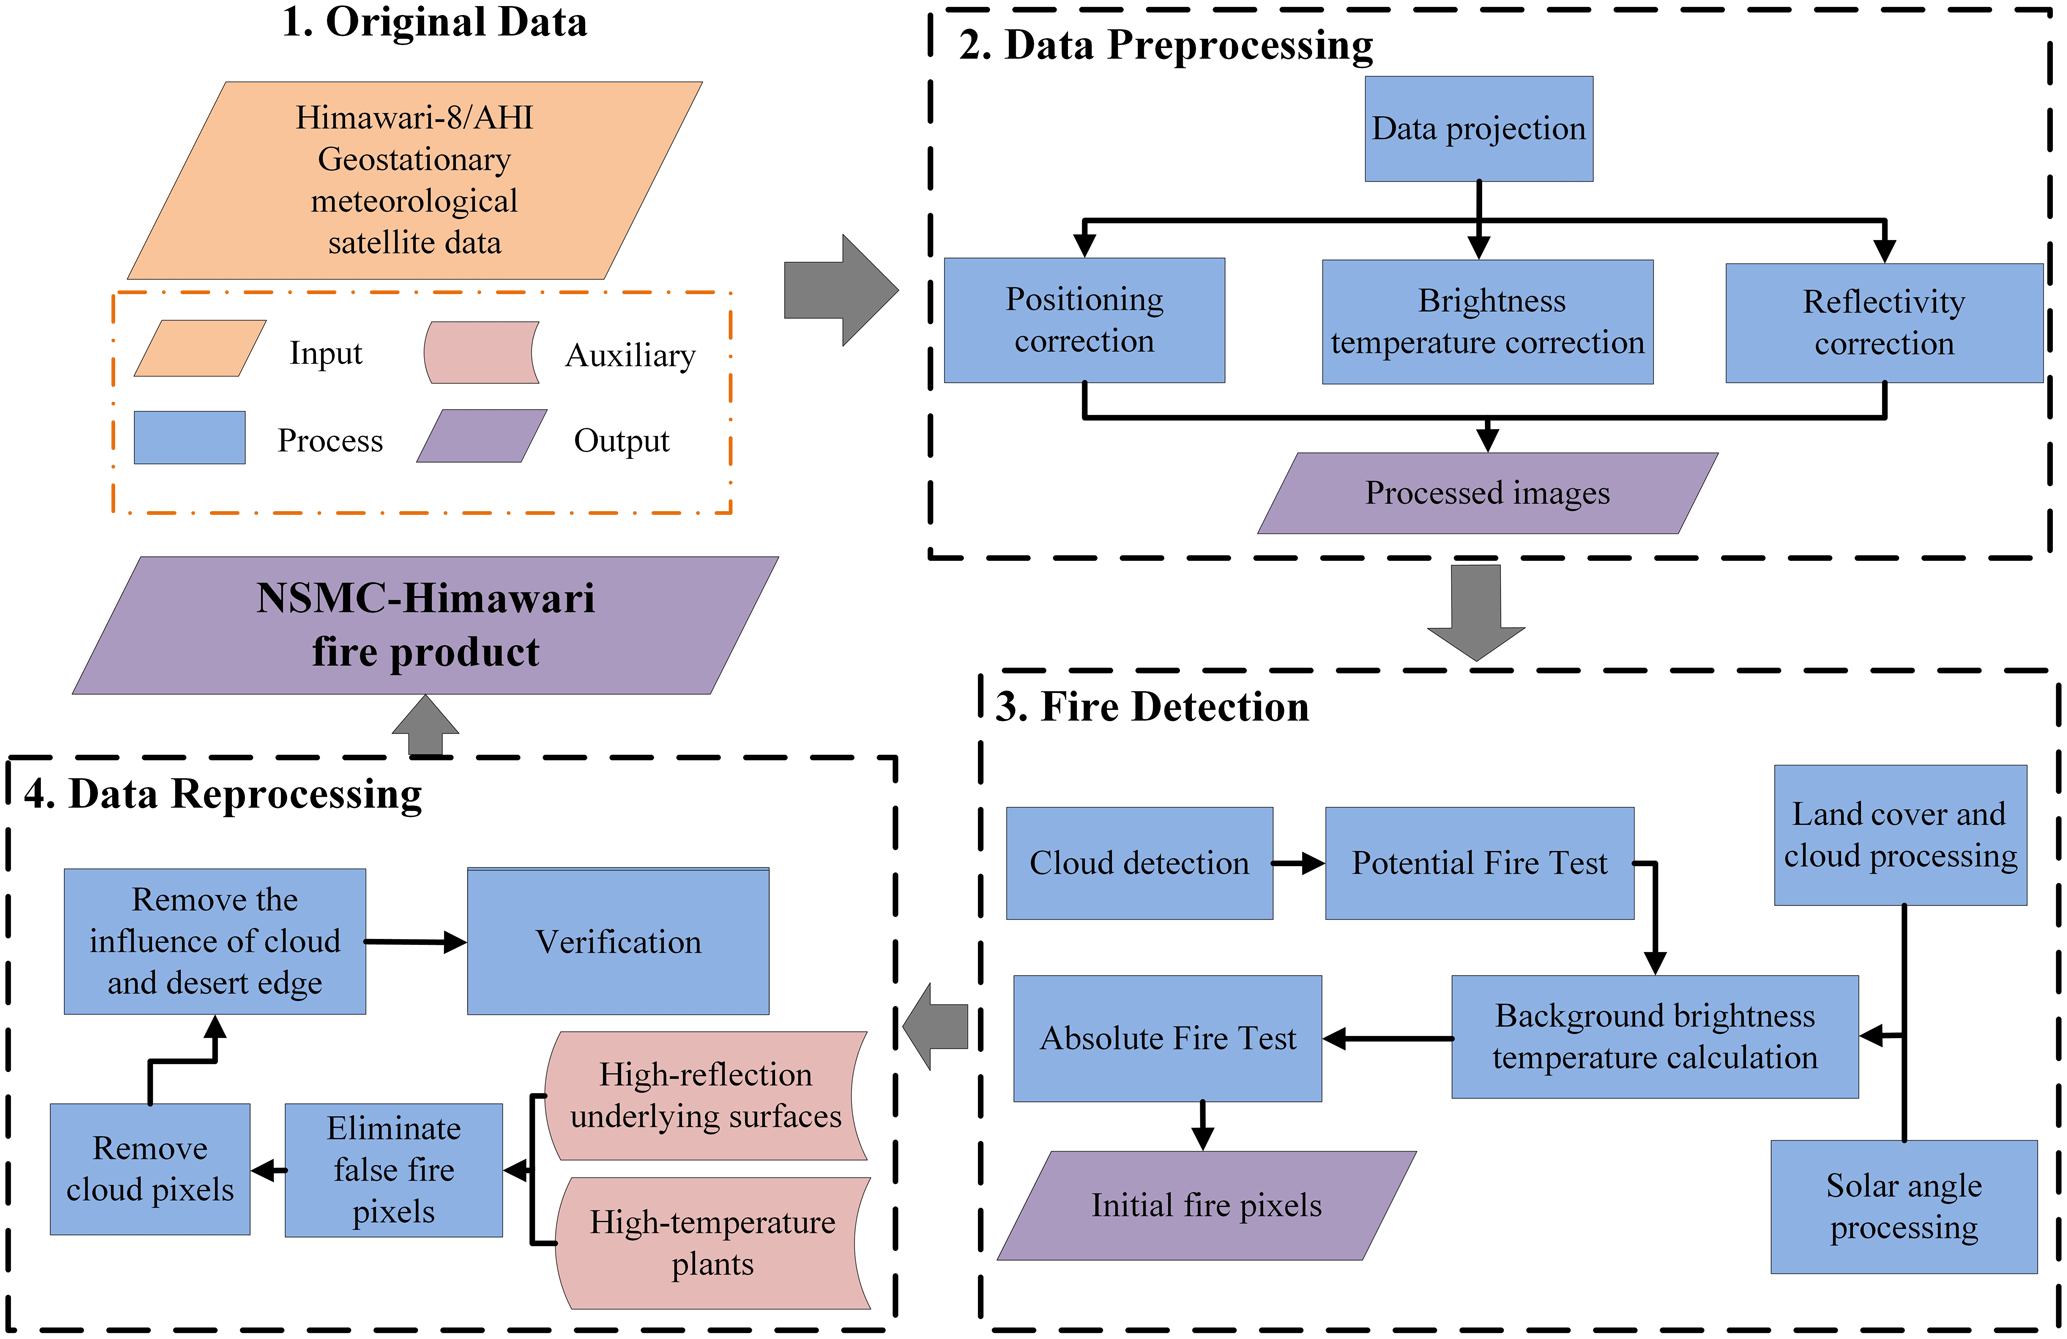
According to the observation characteristics of geostationary satellites and the unique types of regional underlying surface in China, the fire-identification algorithm for producing the NSMC-Himawari-8 fire product has been further improved and enhanced, from our FY-3D global fire-identification algorithm (Chen et al., 2022a). The major improvement of this fire-extraction algorithm, compared with previous algorithms, lies in the dynamic adjustment of fire-identification thresholds and the reprocessing of the heat source. The general steps for generating the NSMC-Himawari-8 fire product are briefly explained in Fig. 2, and the significant procedures are introduced as follows.
3.2 The fire-identification algorithm of the NSMC-Himawari-8 fire product
3.2.1 Detection of cloud pixels
The cloud coverage has a major impact on the confidence level of fire products (Schroeder et al., 2008). On the one hand, the existence of cloud can easily block the ground fire information, causing omission and commission errors. On the other hand, the specular reflection of cloud may lead to the misjudgement of fire pixels (Arino et al., 2012). Therefore, cloud detection is an important step for effective identification of fire pixels. Wildfires in China are mainly concentrated in the northeast, north, south and southwest, with differences across months (Cui et al., 2019).
According to the distinct geographical and climatic characteristics, the fire prevention period, which is decided by the State Forestry Administration in China, is mainly divided into autumn–winter and winter–spring. However, from June to September, the number of fire spots decreases significantly, owing to ample rainfall, higher humidity of combustible substance and wider cloud coverage.
To better present the influence of cloud, we displayed the FY-4A cloud coverage data in 2020, including 75 000 cloud images with a hit rate of approximately 92 %, which is as accurate as Himawari-8 and matches MODIS by up to 67 % (Wang et al., 2019), to briefly demonstrate the spatial distribution of cloud coverage (as shown in Fig. 3). From May, the cloud coverage of the entire country gradually increased, and the cloud coverage in other areas except the Sichuan Basin decreased from November to next February. Generally, under the same ground and observation conditions, the higher the cloud coverage, the lower the number of fire pixels identified by satellite.
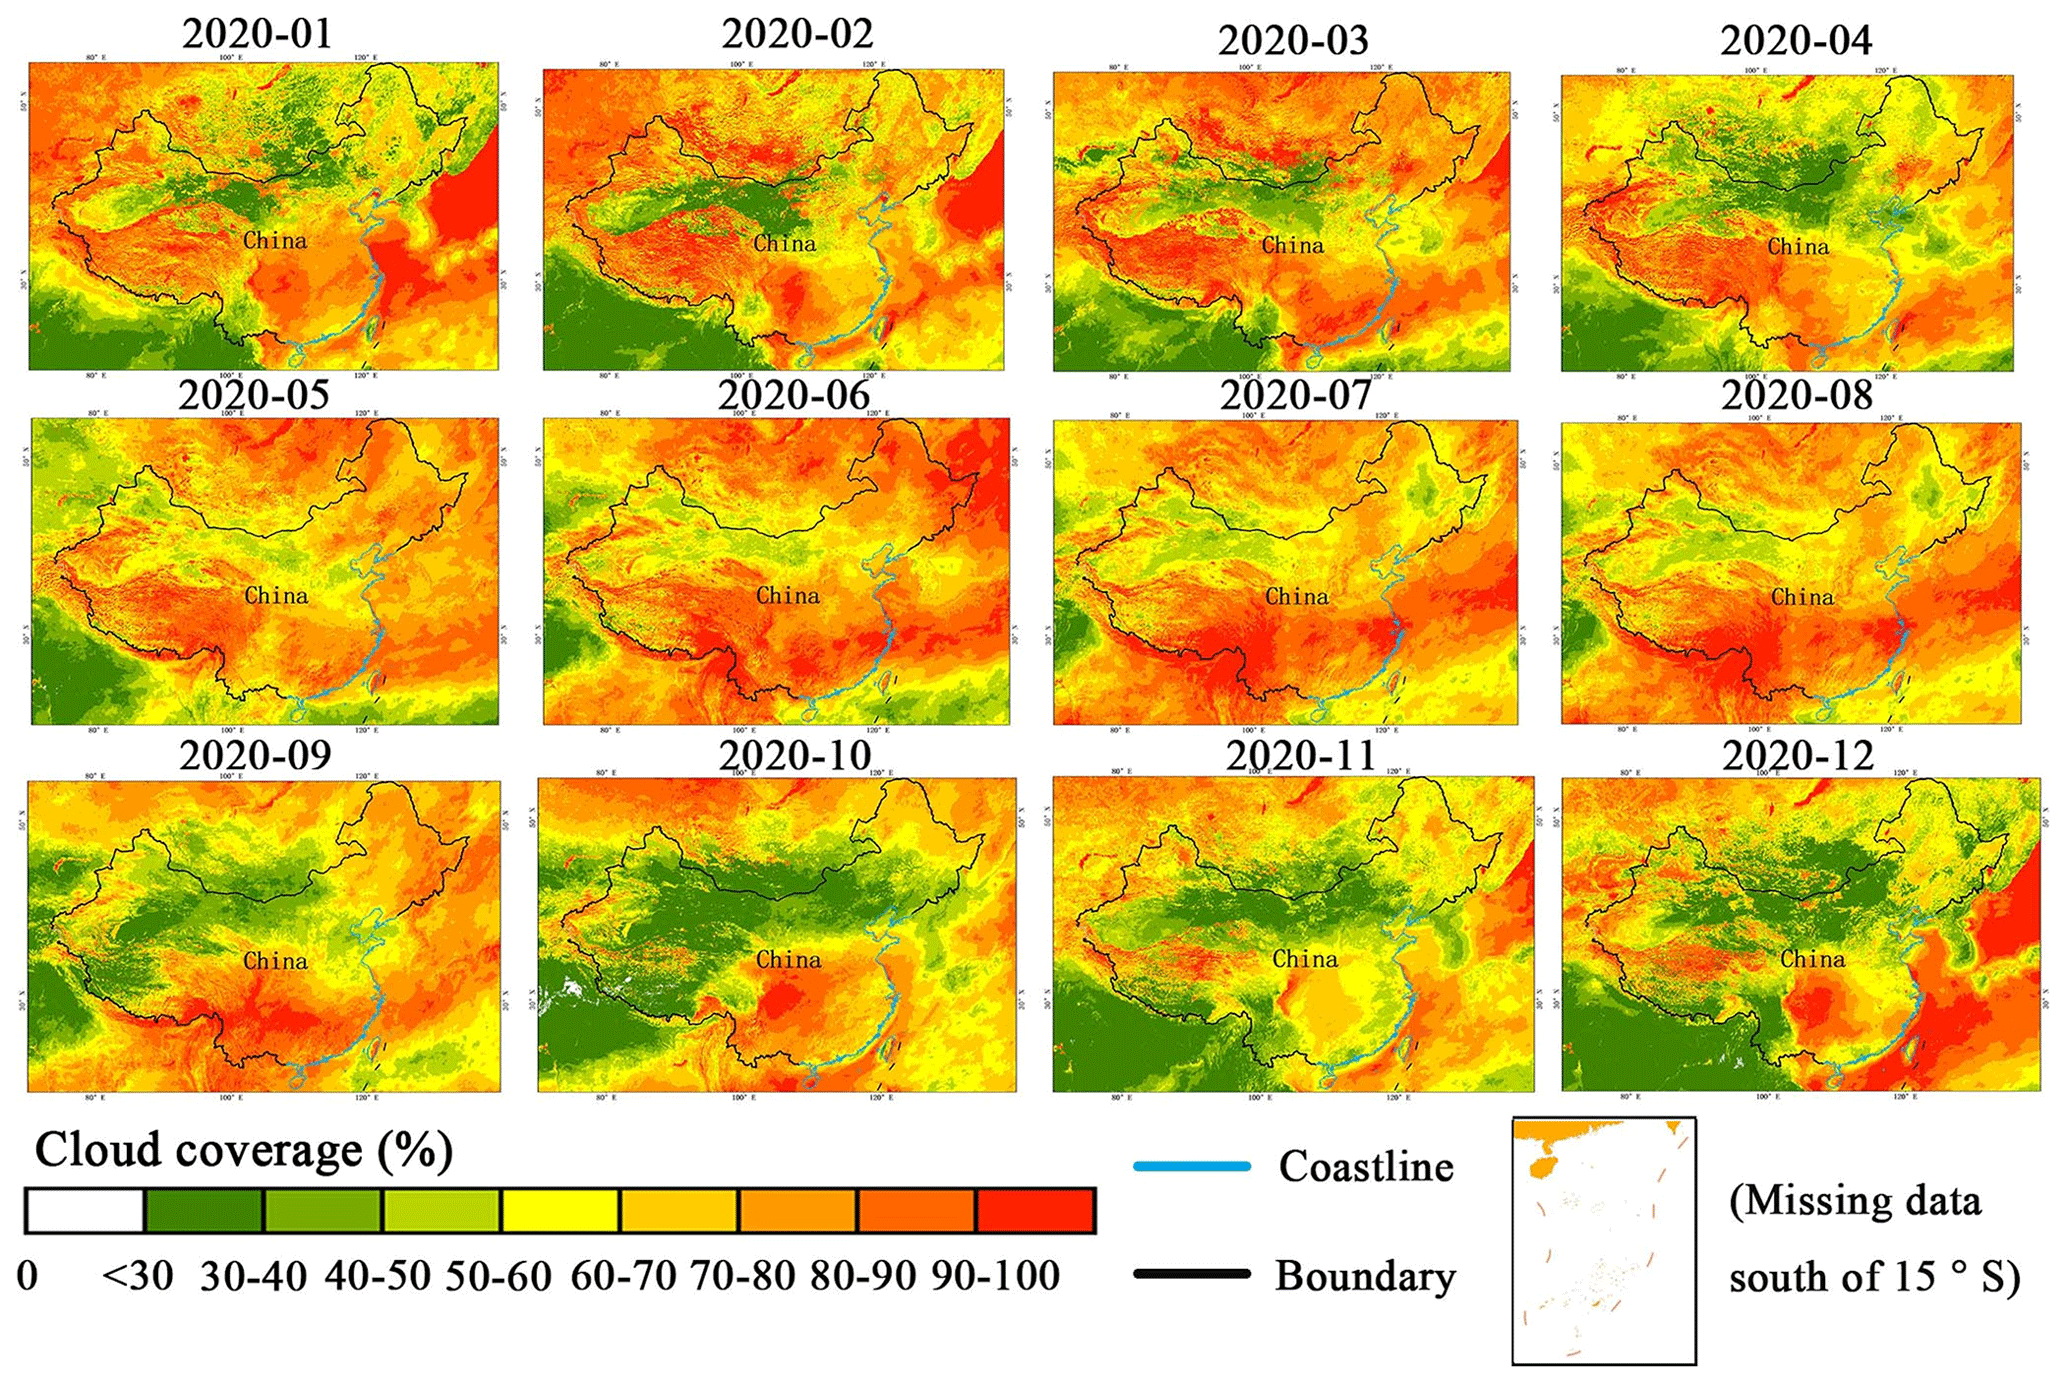
Figure 3The spatial distribution of cloud coverage across China in 2020 (based on the Fengyun-4a satellite data).
The principle of cloud identification for this research is similar to that of our previous FY-3D fire products (Chen et al., 2022a). According to the difference in brightness temperature and reflectivity between cloud and ground pixels, high-reflection characteristics of cloud pixels in visible-light bands and temperature characteristics in thermal infrared bands were employed for cloud removal. The observed pixels were then divided into cloud pixels and clear-sky pixels in different spectral segments. According to the distribution characteristics of clouds in China; the reflectance difference among cloud, water, and land pixels; and our previous product experience of the National Satellite Meteorological Center of China (Chen et al., 2022a, b), we conducted multiple experiments and optimise the threshold value of the cloud-identification algorithm, and we redifferentiate the criteria. We classified cloud pixels according to the rules shown in Table 2. When the pixel meets any of the following conditions, it was identified as a cloud pixel.
Table 2List of cloud pixel determinations.

T7 is the brightness temperature at 3.9 µm band; T13 is the brightness temperature at the 10.4 µm band; T14 is the brightness temperature at the 11.2 µm band; Rvis is the reflectivity at the visible-light band; θsz is solar zenith angle. Note that these five rules are set to exclude a diversity of cloud biases and a pixel that meets any rule in Table 2.
3.2.2 Calculation of background temperature
As a generally accepted principle for fire detection, if there is a true fire spot in the observation pixel, the brightness temperature of the pixel at Band 7 and Band 14 is usually notably higher than the background brightness temperature. And the temperature difference at Band 7 is also higher than that at Band 14. In this case, the brightness temperature of background pixels is an important physical index for automatic fire identification in our research. As the background temperature cannot be obtained from the fire pixels, it should be calculated according to the average of their surrounding pixels. However, if the average brightness temperature of surrounding pixels selected is excessively high, there may be extensive omission errors in fire detection. Conversely, if the average of surrounding pixels selected is lower than normal background brightness temperature, a great number of commission errors may be generated. Therefore, appropriate selection of surrounding pixels is essential for calculating brightness temperature of background pixels. When calculating the background brightness temperature, pixels that may contain fire pixels, water pixels, cloudy pixels or other pixels influenced by solar flare, with excessively low and high brightness temperature, should be regarded as invalid pixels and removed before background temperature calculation.
According to repeated experiments, based on the windowing method, we selected the top 20 % of high-temperature pixels in the initial window area (7×7) as the suspected high-temperature pixels, and we further identified and eliminated them gradually. The suspicious high-temperature pixels can successively be determined if their brightness temperature at Band 7 meets the following equation:
where T7 is the brightness temperature of the suspicious high-temperature pixel at Band 7. T13 is the brightness temperature of suspicious high-temperature pixel at Band 13. Rvis is the reflectivity value of suspicious high-temperature pixel in the visible-light band.
After we removed the above disturbing pixels in the window area, we calculated the background temperature based on the remaining effective background pixels around the candidate fire pixel. Specifically, the background brightness temperature, the averaged brightness temperature of the effective background pixels at Band 7 in the window area, could be calculated through the following method.
where T7_bg is the averaged brightness temperature of effective background pixels at Band 7 in the window area, which represents the background brightness temperature. T7i is brightness temperature of effective background pixels at Band 7, and n is the number of effective background pixels.
Under clear-sky conditions, the satellite could better monitor the fire information on the underlying surface, and the window size was set to 7×7 pixels as initial window area. If the number of available monitored pixels in the window was less than 20 % of the total pixels in the neighbourhood due to cloud cover and other factors, then the 7×7 window was extended to 9×9, 11×11 or 19×19. If it remained not applicable, these candidate fire pixels were directly marked as non-fire pixels.
3.2.3 The identification of fire pixels
The geostationary meteorological satellite can access 24 h observation. Since the monitored fire characteristics are changeable, it is necessary to dynamically adjust the identification threshold considering the influence of various factors. The main factors include the solar altitude angle, cloud surface and the zone that is bare of vegetation, which have a great impact on the discrimination accuracy. For instance, the solar altitude angle affects the brightness temperature of the detection area. The solar altitude angle of each detection area increases from 0∘ to the maximum angle with time and then decrease to 0∘. The solar radiation intensity received by the surface increases with increasing solar altitude angle, and the increment of brightness temperature is different in different regions. If we employ a fixed identification threshold in all different regions in China, it inevitably causes a large number of omission and commission errors. At the same time, the capability of non-vegetation areas to absorb solar radiation is stronger than that of vegetation, and the difference in brightness temperature between such non-vegetation pixels and surrounding pixels is significant. Therefore, to increase the accuracy of fire detection, it is essential to dynamically adjust background coefficients according to solar altitude angle, cloud coverage and non-vegetation pixels. Based on the review of historical fire records, we set the identification thresholds and correction coefficients, which varied across monitoring time and observation areas. According to the following condition check (absolute and relative conditions), fire pixels could be effectively extracted. When the following conditions are met, a pixel can be identified as a fire pixel:
where T7 is the brightness temperature of the candidate pixel at Band 7. Rvis is the reflectivity of the identified pixel at the visible-light band. θsz is solar zenith angle. T7_bg is the background brightness temperature. T7_13 is the difference in brightness temperature between Band 7 and Band 13. T7_13_bg is the difference in background brightness temperature between Band 7 and Band 13. This condition is set to identify the difference under a variety of underlying surfaces in the window. δT7_bg is the standard deviation of the brightness temperature of background pixels. δT7_13_bg is the difference in the standard deviation of background brightness temperature between Band 7 and Band 13.
The specific calculation method of the standard deviation is as follows:
where n is the number of effective background pixels in the window. T7i is brightness temperature of effective background pixels at Band 7. And T7_13i is the difference in brightness temperature of effective background pixels between Band 7 and Band 13. When the land cover types in the window are generally consistent, δT7_13_bg is relatively small. For the candidate fire pixels, when δT7_13_bg is smaller than 2 K, the value is set to 2 K. When δT7_13_bg is large than 4 K, the value is replaced by 4 K.
In the identification algorithm, a(PvPcθsz) is a coefficient function, which is related to the non-vegetation pixel ratio, cloud pixel ratio and solar zenith angle. The coefficient varies with different monitoring areas, detection times and angles. Therefore, the identification threshold can be dynamically adjusted according to different situations. The calculation method is as follows:
where Pv is the proportion of non-vegetation pixels in the window. θsz is the solar altitude angle of the identified pixel. a(PvPcθsz) increases with θsz and Pv to reduce the false errors generated by the solar reflection signal. Pc is the proportion of cloud pixels in window area, and the use of Pc can reduce the false identification of fire pixels at the edge of clouds. The identification threshold increases with Pc.
3.3 Reprocessing of the fire production
The thermal anomalies signal at Band 7 (3.9 µm) also includes non-fire heat source information, e.g. the thermal signals caused by cloud edge, high-reflection underlying surface, bare ground, artificial buildings, factories and other non-fire heat sources. Therefore, the preliminarily extracted heat sources should be reprocessed to eliminate false fire pixels.
3.3.1 The removal of cloud pixels
If extracted high-temperature pixels meet the following conditions, they are considered to be affected by cloud and should not be regarded as fire pixels.
and
where Rc_th is the discrimination threshold of cloud influence at visible light, and the initial value is set to 0.15. Tc_th is the discrimination threshold for cloud interference at Band 13, and the initial value is set to 5 K. Rvis is the reflectivity of the high-temperature pixel at the visible-light band. is the averaged reflectivity of effective background pixels in the window at the visible-light band. T13 is the brightness temperature of the high-temperature pixel at Band 13. And T13_bg is the averaged brightness temperature of effective background pixels in the window at Band 13.
3.3.2 The removal of the influence of cloud and desert edge
When the pixel is at the edge of the cloud, the brightness temperature of the mixed pixel with a few clouds is lower, as the cloud temperature is lower than the surface temperature. When calculating the brightness temperature and standard deviation of background pixels, the mixed pixels are still employed as effective pixels, thus reducing the background brightness temperature and affecting standard deviation. Although cloud pixels have been removed through previous steps, the impact of mixed pixels remains. Based on years of operation and maintenance experience of the National Satellite Meteorological Center, we have made the following amendments. If the high-temperature pixel meets the following conditions, it is considered to be influenced by cloud and desert edge and not regarded as a fire pixel.
and
C is the recognition threshold of cloud edge and desert edge, and the initial value is set to 8. T7_13 is the difference in the brightness temperature between Band 7 and Band 13. T7_13_bg is the difference in background brightness temperature between Band 7 and Band 13. δT7_13_bg is the difference in standard deviation of background brightness temperature between Band 7 and Band 13.
3.3.3 The removal of high-reflection underlying surfaces and high-temperature plants
High-temperature factories and high-reflection underlying surfaces are the main ground interference factors affecting the accuracy of satellite-based fire detection. Due to the large amount of thermal radiation generated in the production process, high-temperature factories present similar characteristics to real fire spots at the mid-infrared band. For satellite-based fire detection, although these interference sources, which may easily be recognised as false fires, are well known, currently employed fire products rarely exclude these basic thermal anomalies, causing a large uncertain to the product accuracy.
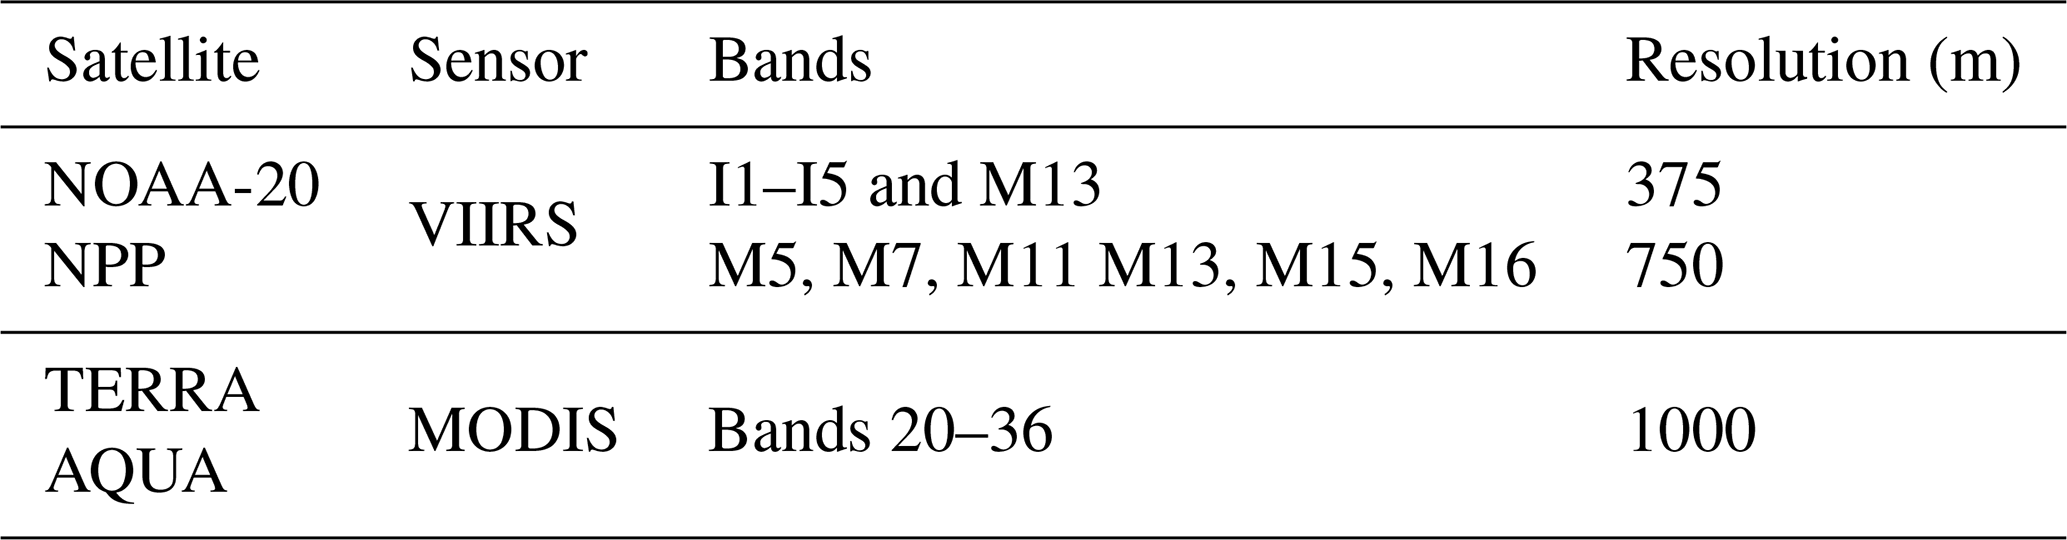
To effectively remove potential false fires and improve the reliability of the Himawari-8 fire products in China, National Satellite Meteorological Center and State Grid Corporation of China cooperated to generate a database concerning major high-temperature plants and high-reflection underlying surfaces in China through AI-assisted visual interpretation based on the comprehensive integration of multiple remote sensing sources, including NOAA-20/VIIRS (https://ncc.nesdis.noaa.gov/NOAA-20/NOAA20VIIRS.php, last access: 5 May 2023; NOAA, 2023), NPP/VIIRS (https://ncc.nesdis.noaa.gov/VIIRS/, last access: 5 May 2023), and TERRA/MODIS and AQUA/MODIS (https://ladsweb.modaps.eosdis.nasa.gov/, last access: 5 May 2023). The specific parameters of these sources are shown in Table 3.
Table 3Main parameters of employed data sources for AI-assisted extraction of heating sources.
The specific procedure for extracting these surface thermal sources is briefly introduced as follows: for interference sources that can generate a strong quantity of heat, such as steel plants, thermal plants and chemical plants, we mainly conducted extraction through visual interpretation. The thermal anomalies detected based on NOAA-20, NPP and other remote sensing sources were matched to Google Maps and further confirmed with high-resolution images. In this case, we identified more than 7000 thermal interferences and added them to the database.
Since the observation angle of the geostationary meteorological satellite is fixed, the impact of ground mirror reflection on the observation instrument is a common cause for falsely detected fires. Specifically, large photovoltaic panels in photovoltaic power plants, which are wildly distributed, are the major sources influencing the extraction of actual fires. Firstly, we manually extracted a large number of photovoltaic panel images from the Google satellite images, and we employed them as a sample to conduct sample training through deep learning, based on which an extraction model was established. Secondly, we employed an image segmentation–classification model (Yuan et al., 2014) to conduct a large-scale extraction of photovoltaic panels in China, and we established a primary sample library of photovoltaic panels. Thirdly, extensive manual editing was conducted to maximally reduce the classification errors. Successively, part of the manual identification results were added to the training samples to further improve the model accuracy. Based on this strategy, we classified more than 9900 photovoltaic panel pixels. The minimum area of extracted photovoltaic panels was dozens of square metres, and the maximum was dozens of square kilometres (as shown is Fig. 4).
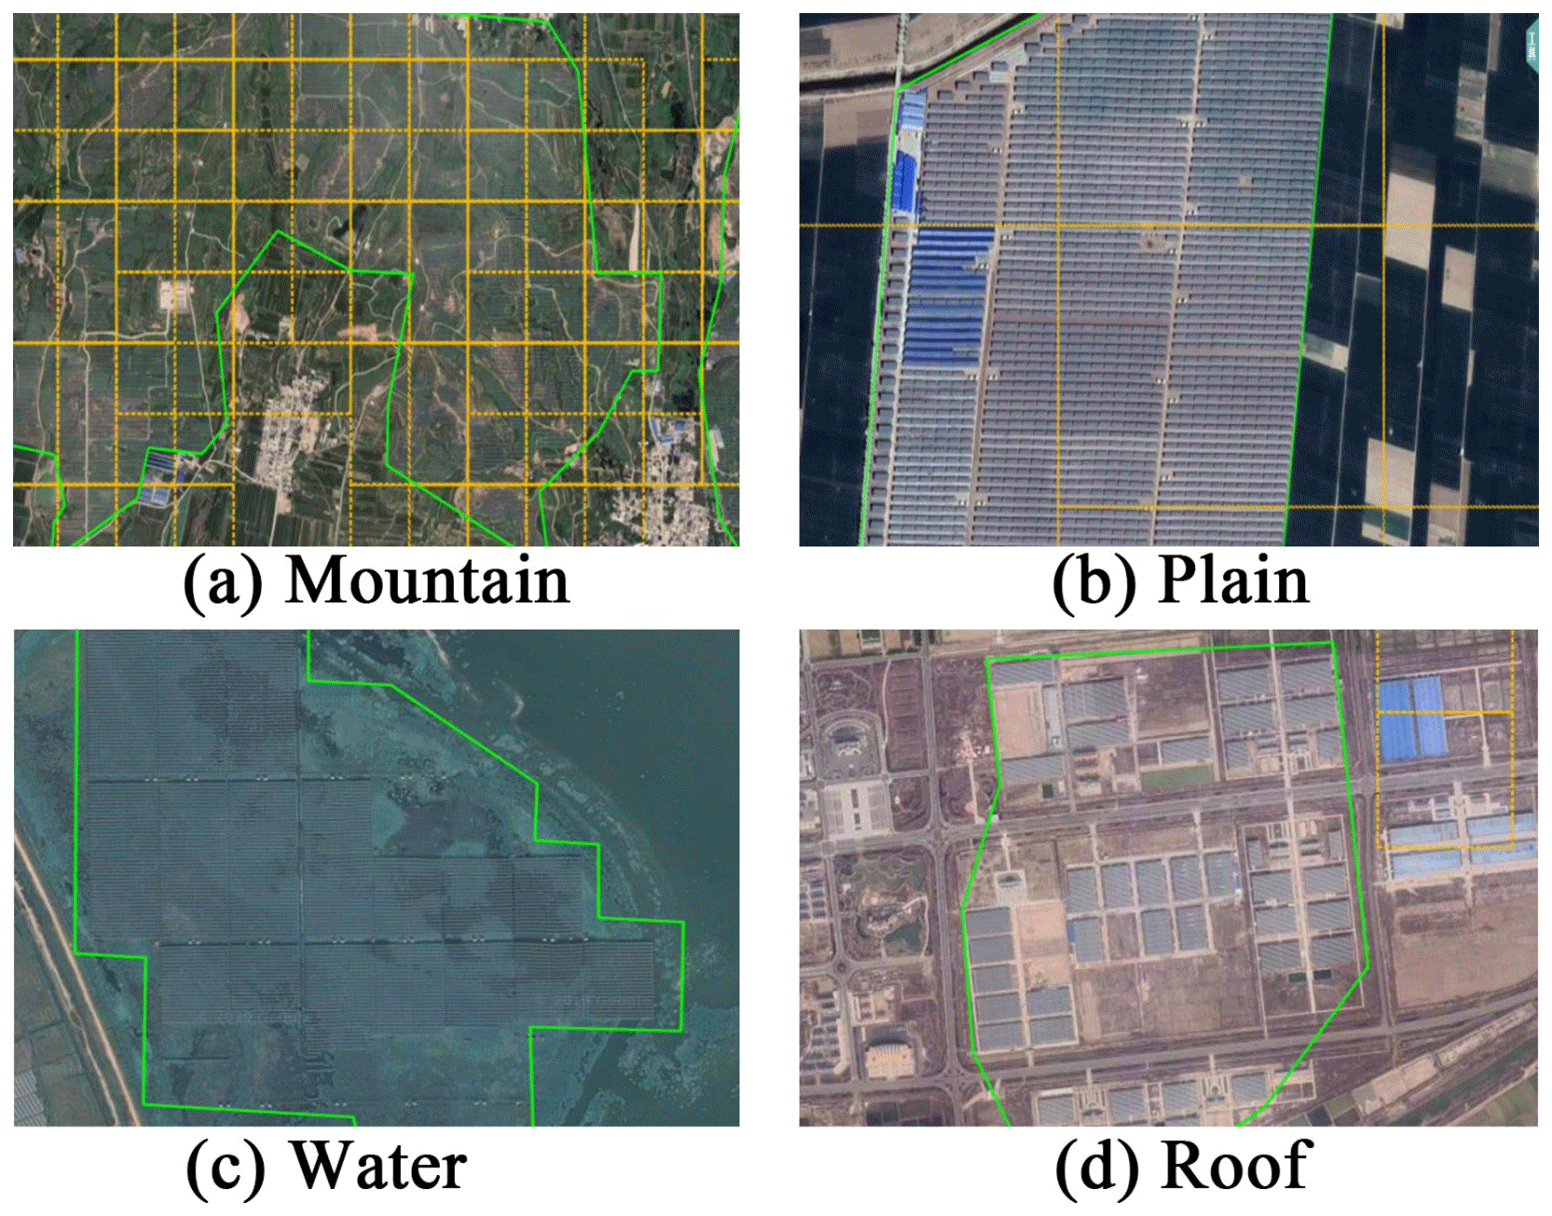
Figure 4Samples of extracted photovoltaic panels (aerial images from © Google Maps).
Based on an accuracy assessment, the primary accuracy of AI recognition is about 87 %. With the following manual editing, the overall accuracy of the extracted thermal sources and photovoltaic panels exceeded 95 %. This dataset of high-temperature plants and high-reflection underlying surfaces (as shown in Fig. 5) has been updated annually by the China Meteorological Administration and State Grid Corporation of China. By comparing preselected fire pixels and this dataset, we removed a majority of false fire pixels and largely enhanced the accuracy of the NSMC-Himawari-8 fire product.
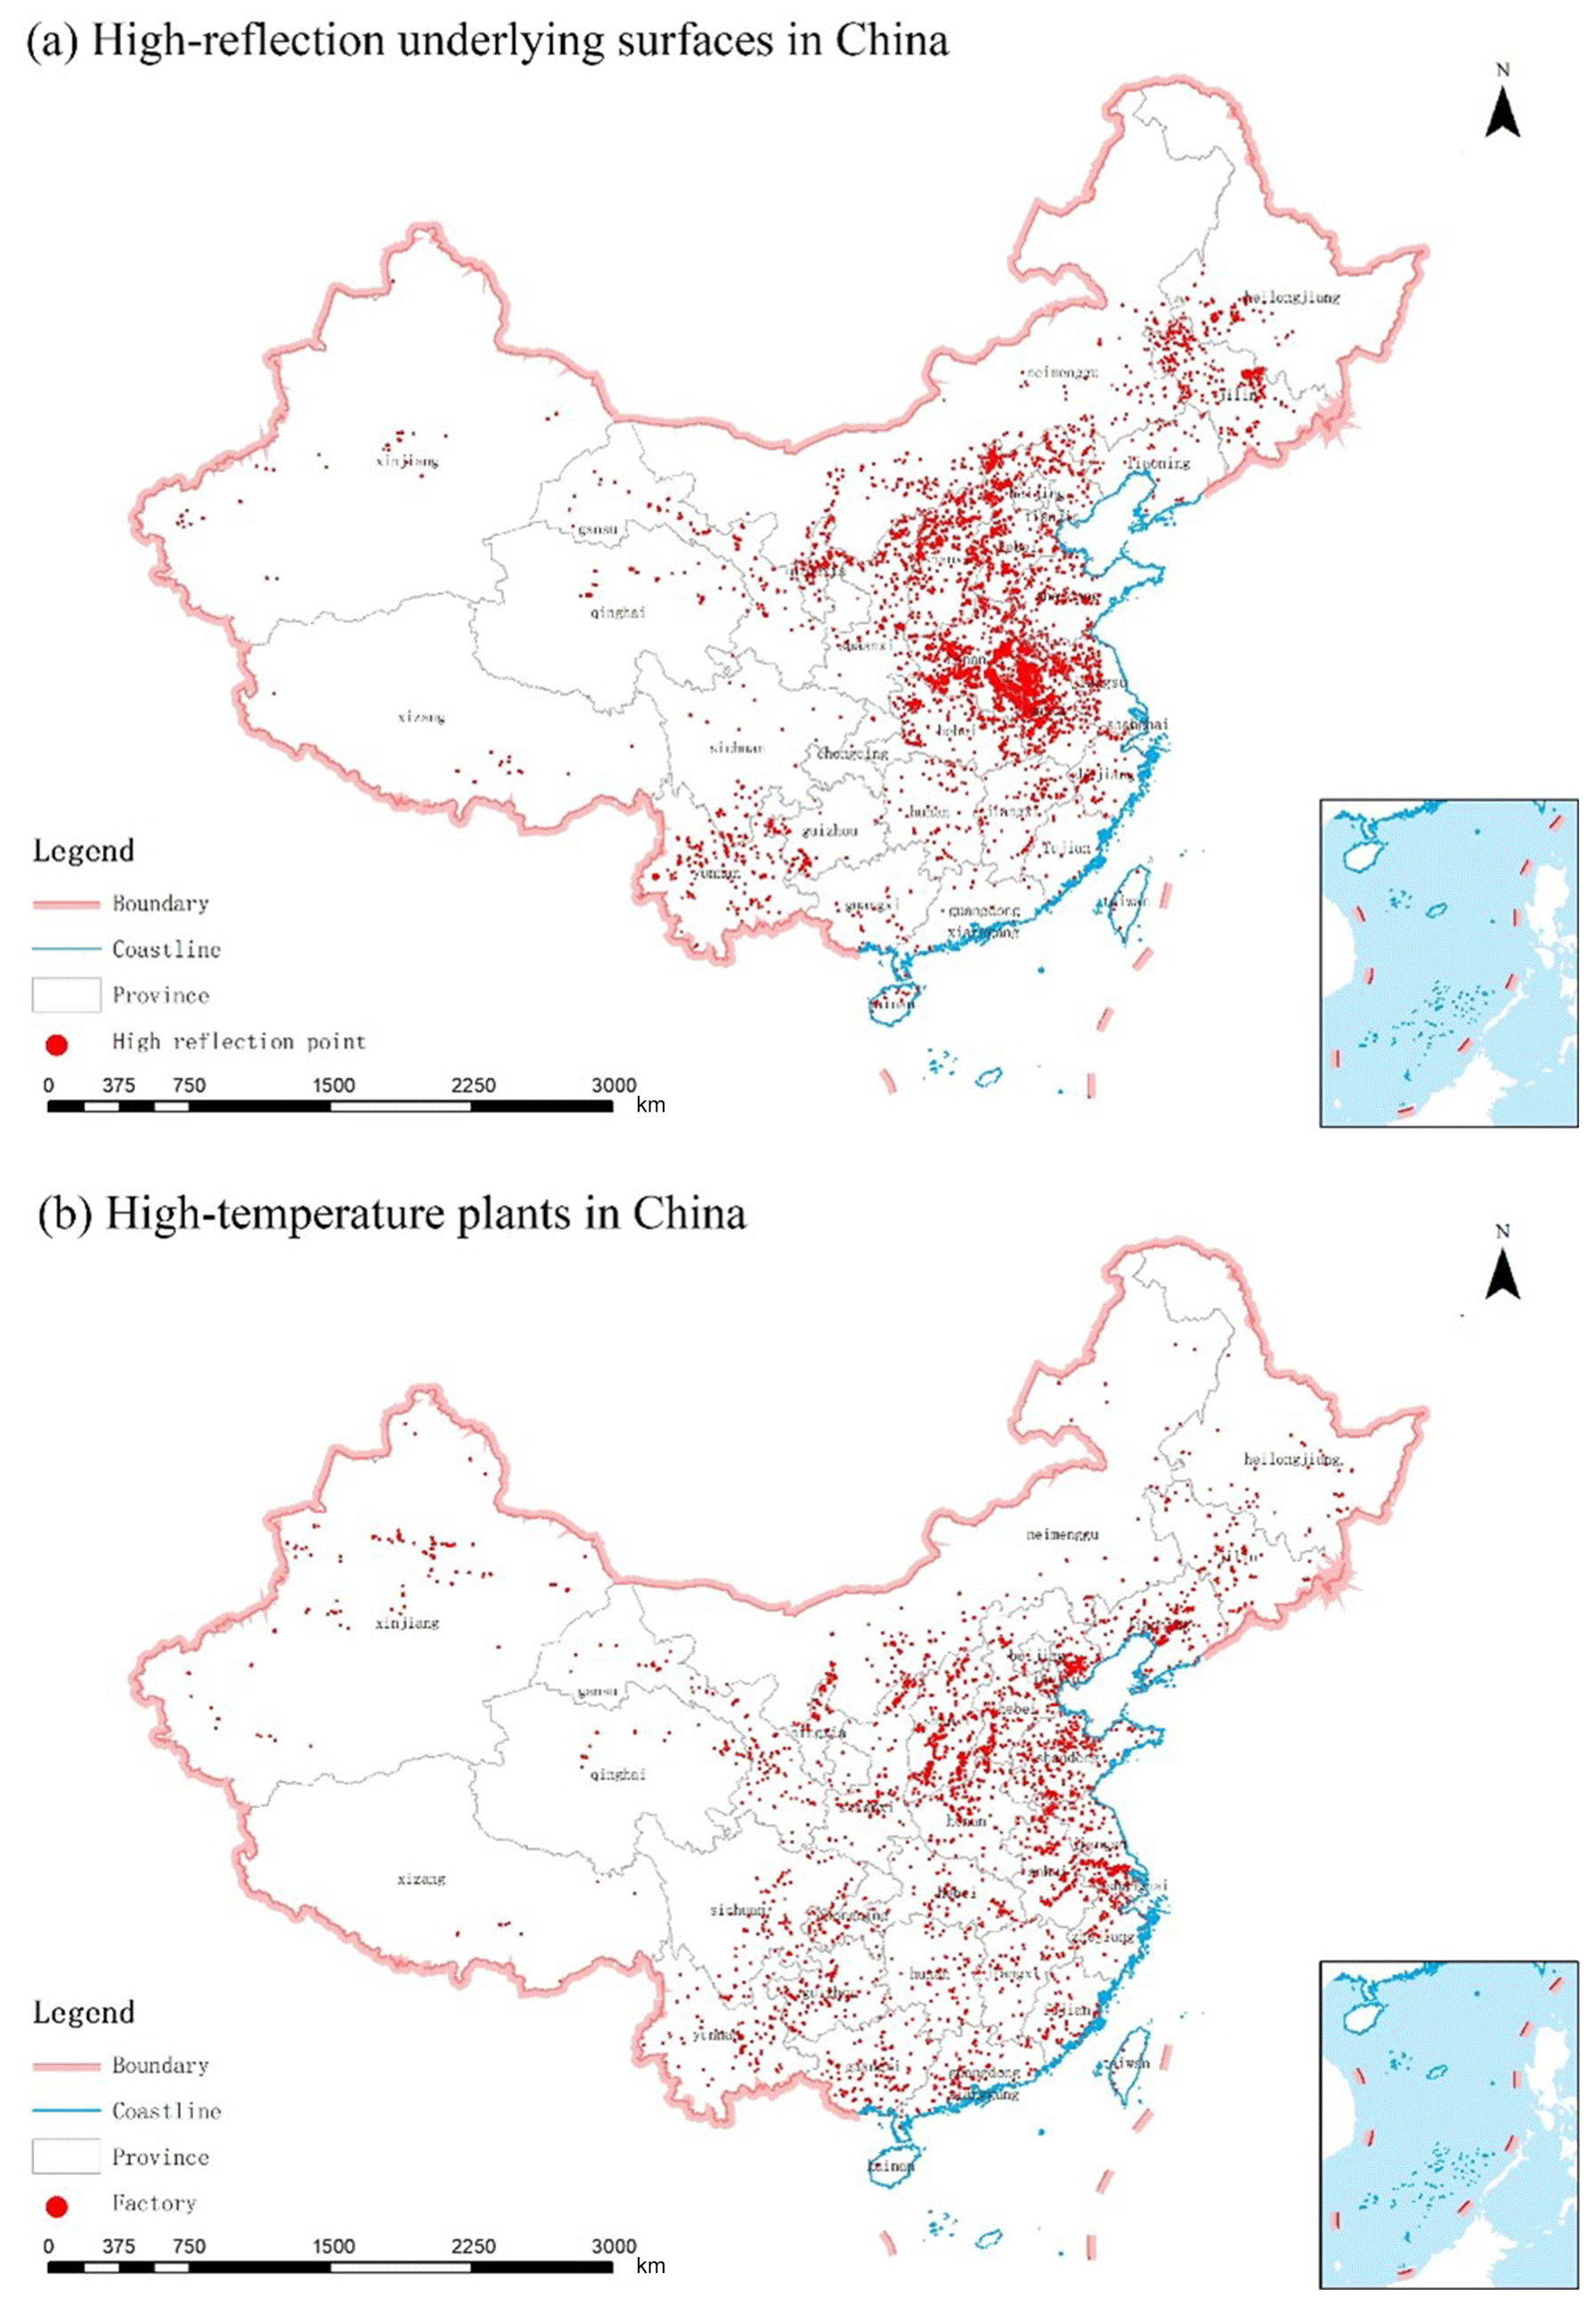
Figure 5The high-temperature plants and high-reflection underlying surfaces identified in China for 2021.
3.4 Verification
Our NSMC-Himawari-8 fire product was evaluated using the JMA-Himawari-8 fire products and on-site collected reference data of true fires. Specifically, the evaluation was conducted in the following steps. Firstly, through excessive manual verification, we compared the number of ground interference sources (high-temperature plants and high-reflection underlying surfaces), which are the main source of falsely detected fire pixels, included in the JMA-Himawari-8 and NSMC-Himawari-8 fire products. Secondly, we examined the consistency of the NSMC-Himawari-8 and JMA-Himawari-8 fire products in China from the perspective of the total number of fire pixels, different underlying surfaces and different brightness temperatures. Finally, we employed a rare dataset of on-site collected burning records, which was jointly established by the State Grid Corporation of China and China Meteorological Administration throughout 2021 in five provinces (Guangdong, Guangxi, Yunnan, Guizhou and Hainan) in China, as reference data to evaluate the overall accuracy of the NSMC-Himawari-8 fire products in China.
4.1 Accuracy assessment of the JMA-Himawari-8 and NSMC-Himawari-8 fire products in terms of falsely identified interference sources
Based on the original hourly Himawari-8 data from 2019 to 2021, we produced the NSMC-Himawari-8 fire product through the above-introduced fire-extraction approach. Through an excessive manual pixel-by-pixel check, we compared the number of interference sources misidentified in the JMA-Himawari-8 and NSMC-Himawari-8 fire products.
As shown in Fig. 6a, the number of misidentified fire pixels in the JMA-Himawari-8 product, mostly caused by ground thermal sources, is much larger than the NSMC-Himawari-8 product in all months. The monthly misidentified fire pixels for the JMA-Himawari-8 fire product was on average 13 000, ranging from 5000 to 20 000 in different months, making the number of hourly misidentified fire pixels close to 18. As a comparison, the monthly misidentified fire pixels for the NSMC-Himawari-8 fire product was on average less than 1500, ranging from 200 to 4500 in different months, making the number of hourly misidentified fire pixels close to 2.
To further present the influence of interference sources in the two products, we also calculated the ratio of monthly true fire pixels to misidentified pixels. As shown in Fig. 6b, except from June to September, the true-to-misidentified ratio for the NSMC-Himawari-8 fire product is notably higher than that of JMA. The largest ratio value, 58, appeared in April; that is, there was only one interference source in every 59 identified pixels. From May to September, due to the relatively small number of real fire pixels, the true-to-misidentified ratio for both products was smaller than 10, with a minimum value close to 1:1 in August, suggesting the influence of interference sources was extremely strong in less-fire seasons.
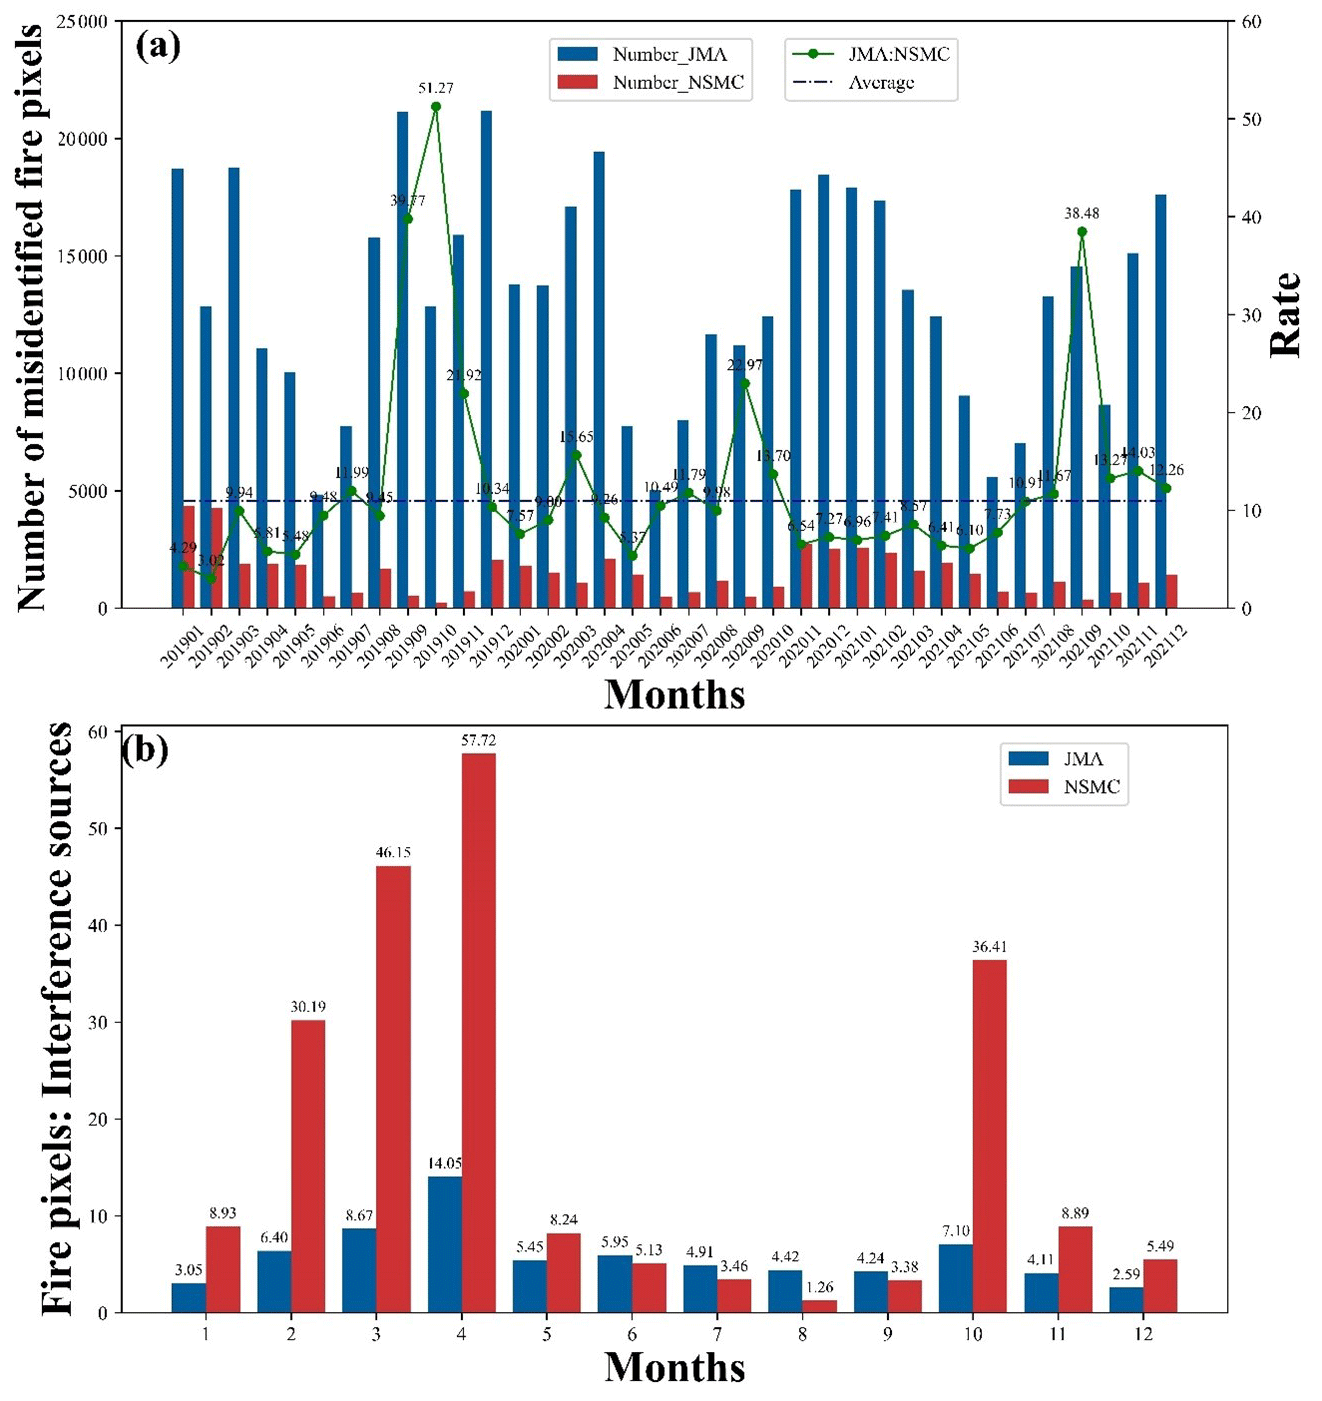
Figure 6The influence of interference sources in the JMA-Himawari-8 and NSMC-Himawari-8 fire products across months. (a) The total number of misidentified fire pixels. (b) The average ratio of true to misclassified fire pixels.
4.2 Consistency between the JMA-Himawari-8 and NSMC-Himawari-8 fire products
In addition to accuracy assessment in terms of misidentified fire pixels, we also examined the consistency between the JMA-Himawari-8 and NSMC-Himawari-8 fire products in terms of the number of fire pixels, underlying surfaces and brightness temperature.
4.2.1 Consistency in terms of the total number of fire pixels
From January 2019 to December 2021, there were in total 1 136 119 fire pixels identified in the NSMC-Himawari-8 fire product, while there were 3 232 940 fire pixels identified in the JMA-Himawari-8 fire product. The total number of identified fire pixels from the JMA-Himawari-8 fire product was around 3 times that of the NSMC-Himawari-8 fire product. As introduced above, the large difference was mostly attributed to the fact that NSMC-Himawari-8 fire product avoided a majority of ground interference thermal sources.
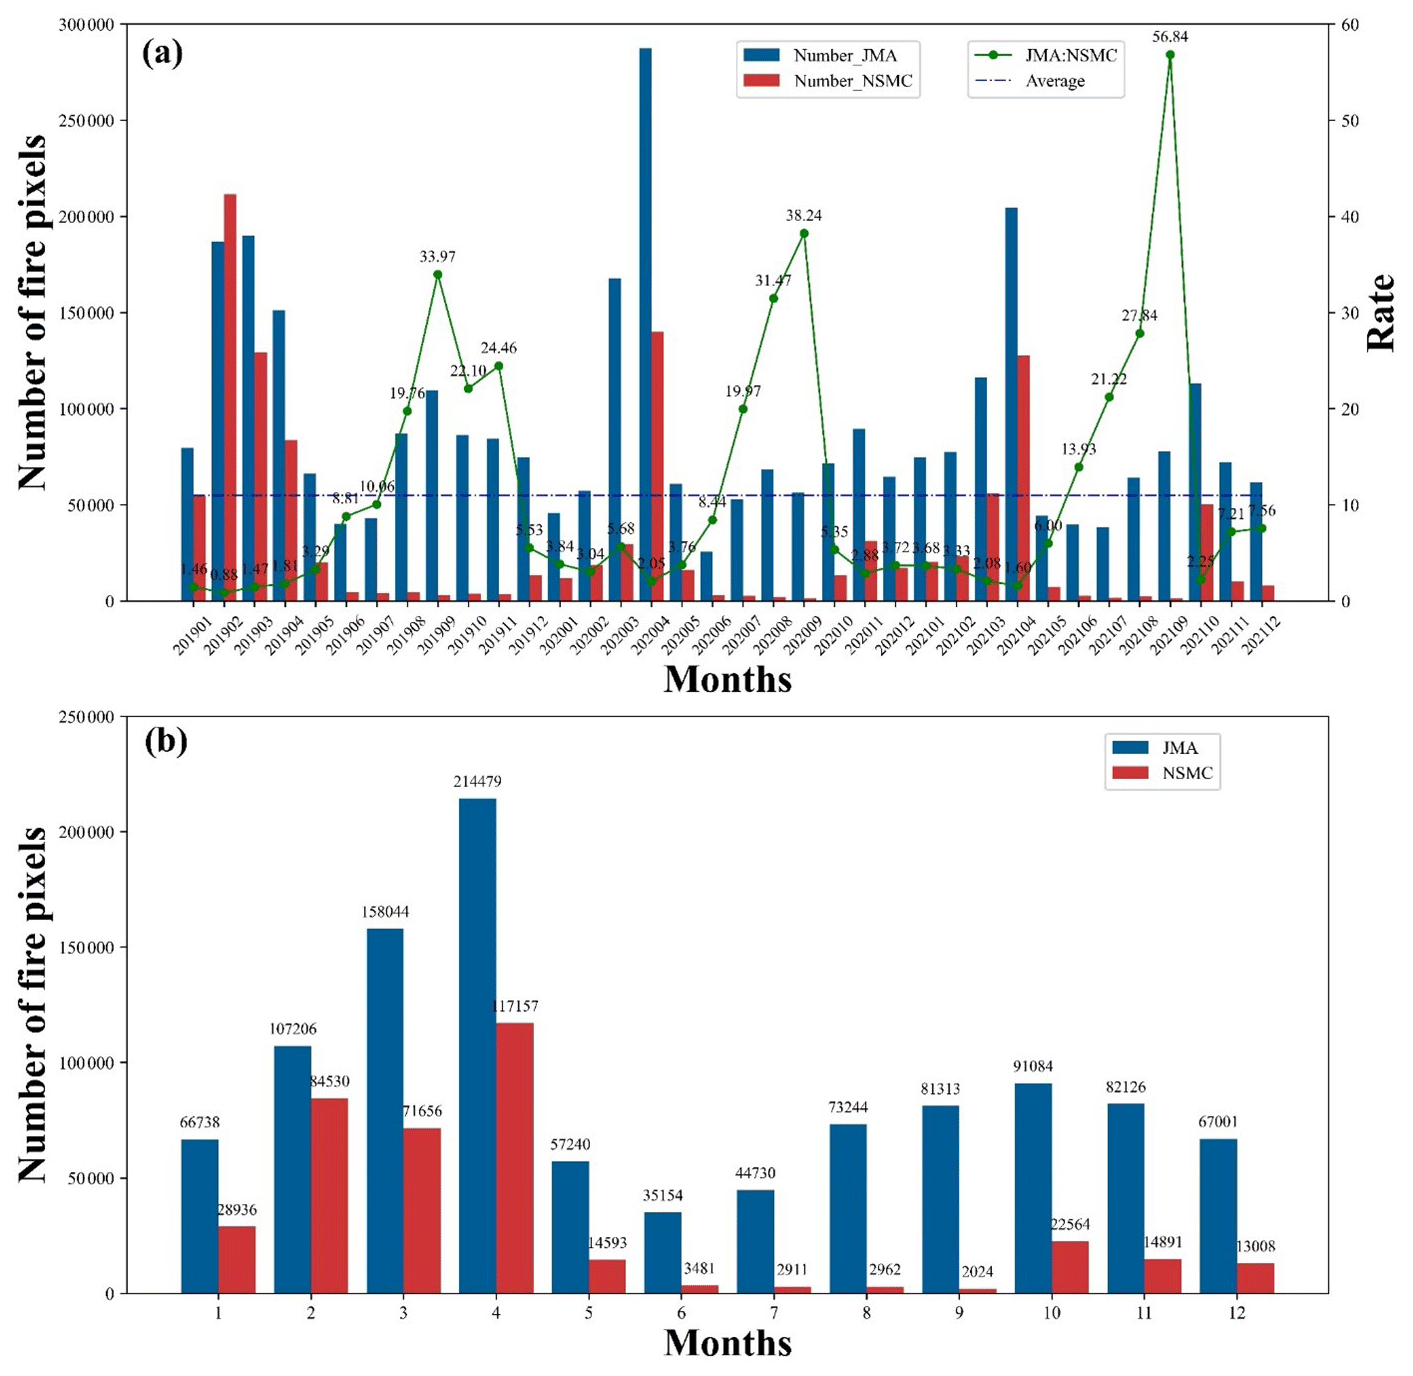
Figure 7The total number of identified fire pixels in the two fire products. (a) Time series; (b) monthly average.
At the monthly basis (Fig. 7), for the NSMC-Himawari-8 fire product, identified fire pixels were mostly concentrated from January to April, while the number of fire pixels was small from June to September every year. As a comparison, for the JMA-Himawari-8 fire product, in addition to the period from January to April there was another peak fire season from June to September. The number of identified fire pixels in the JMA-Himawari-8 product was on average 10 times that of the NSMC-Himawari-8 fire product from June to September, which is actually a season with a relatively small number of forest fires and crop-residue burning. This strong inconsistency further proved the importance of removal of the potentially interfering fire pixels and the reliability of the NSMC-Himawari-8 fire product, especially in the less-fire seasons.
We further examined the overall consistency between the JMA-Himawari-8 and NSMC-Himawari-8 fire products from two different perspectives. From the JMA perspective, we mainly checked the average possibility of one identified fire pixel in the JMA-Himawari-8 fire product also included in the NSMC-Himawari-8 fire product. From the NSMC perspective, we mainly checked the average possibility of one identified fire pixel also included in the JMA-Himawari-8 fire product.
As shown in Fig. 8, the consistency was relatively low from the period from June to September and much higher from the period from January to April. The consistency from the NSMC perspective, ranging from 42 % to 87 % across months, was much higher than the consistency from the JMA perspective, ranging from 1 % to 62 %. This is mostly attributed to the large number of false fire pixels included in the JMA perspective that have been removed in the NSMC-Himawari-8 fire product; thus, the possibility of finding a counterpart was largely reduced. Meanwhile, JMA-Himawari-8 fire product retained a majority of effective true fire pixels in the original Himawari-8 files and thus the possibility of finding a counterpart in JMA-Himawari-8 fire product was relatively large. The consistency check further proved that NSMC-Himawari-8 fire product effectively maintained useful information from the original Himawari-8 sources and presented a largely enhanced reliability.
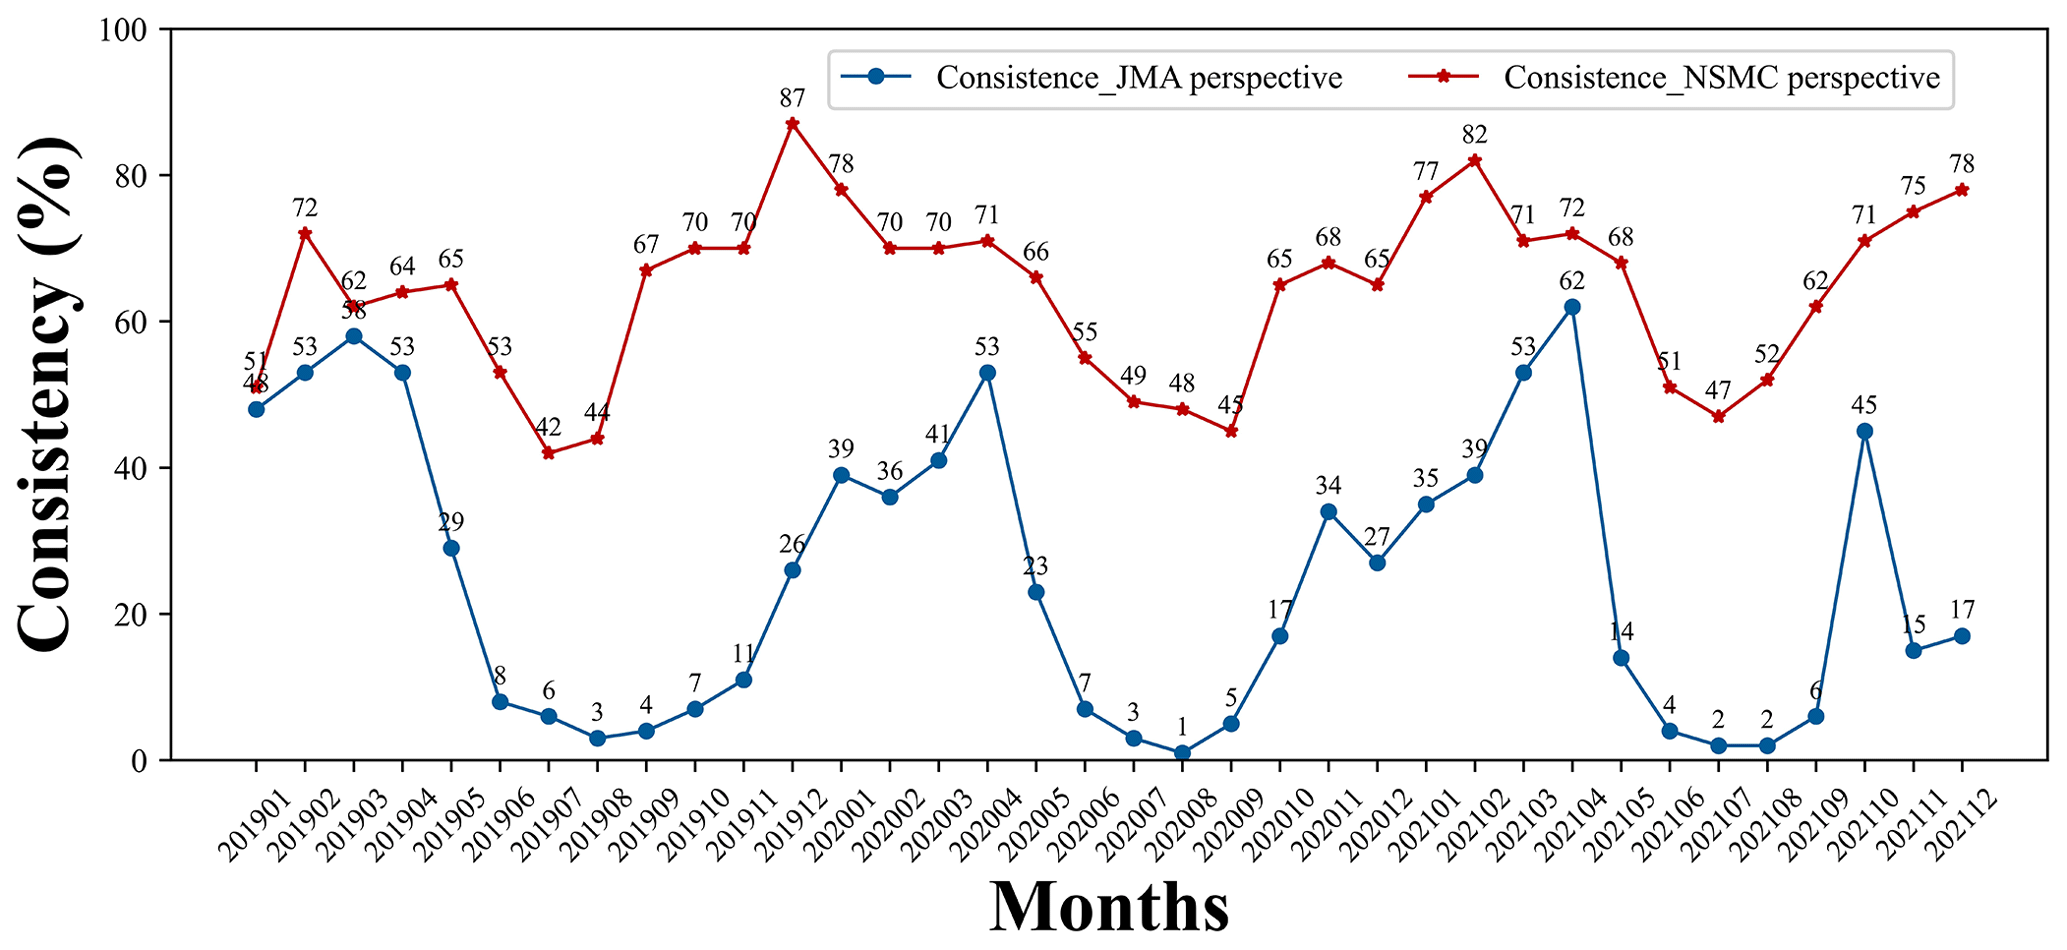
Figure 8The general consistency between the JMA-Himawari-8 and NSMC-Himawari-8 fire products across months.
4.2.2 Consistency on different underlying surfaces
China has a vast territory and a diversity of underlying surfaces, leading to large variations of fire types and difficulty of fire detection across regions. Specifically, compared with southern forest wildfires that could generally burn very large areas and last several months, fires in the northeast of China are mostly small-sized fires that burn in relatively low intensity in agriculture and forestry lands. According to Climate Change Initiative (CCI) Land Cover V2 (http://maps.elie.ucl.ac.be/CCI/viewer/download.php, last access: 5 May 2023; ESA, 2023), with a spatial resolution of 300 m in 2015, we divided the underlying surfaces into built-up areas, farmland (straw), grass (grassland) and forest, respectively.
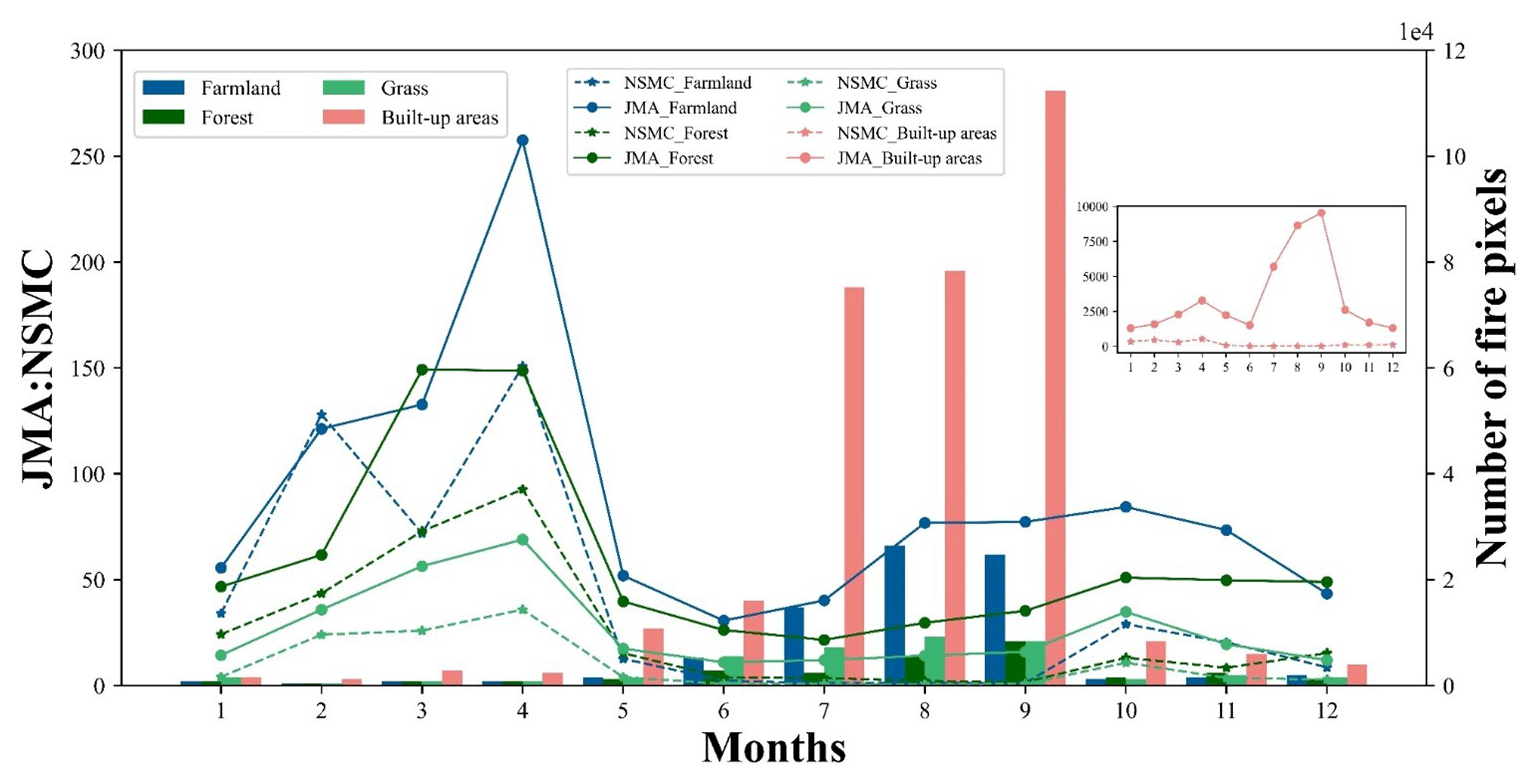
Figure 9The number of fire pixels and ratio between the JMA and NSMC fire products under different underlying surfaces across months.
Figure 9 shows the monthly average of fire pixels identified on different underlying surfaces from 2019 to 2021. The total number of fire pixels in farmland was the largest for both fire products, followed by forest, and the general trend of the two fire products was similar in number. Generally, as Table 4 shows, the consistency between the two products from the NSMC perspective was relatively high for all underlying surfaces, with an average consistency larger than 70 %. As a comparison, from the JMA perspective, the consistency between the two products was relatively low for all underlying surface types. Figure 9 also suggested that the number of fire pixels identified on building areas in the JMA-Himawari-8 fire product during June to September was more than 100 times that identified in the NSMC-Himawari-8 fire product. Given that there is actually a very limited number of fires occurred on buildings during this period, it is highly possible that the excessive number of fire pixels detected on building areas in the JMA-Himawari-8 fire product resulted from false alarms caused by ground thermal sources. Meanwhile, the maximally reduced fire pixels identified on building pixels additionally proved the advantage of employing our ground thermal source database to remove false alarms.
Table 4The consistency between the JMA and NSMC-Himawari-8 fire products under different underlying surfaces.

4.2.3 Consistency under different brightness temperatures
The key to extract fire pixels is to precisely obtain their brightness temperature and set fire-extraction thresholds accordingly. Consequently, the brightness temperature of identified fire pixels has a notable influence on the consistency between the JMA-Himawari-8 and NSMC-Himawari-8 fire products.
As shown in Fig. 10, the higher the brightness temperature, the higher consistency. When the brightness temperature is less than 270 K, the consistency between the two fire products was less than 20 %, and the consistency increased rapidly with the rise of the brightness temperature. When the brightness temperature exceeded 330 K, the consistency between two products exceeded 70 %. It is noted here that the brightness temperature for a fire pixel was not solely decided by the temperature of fires. Since an occurring fire sometimes simply occupied a very small percentage of a 2 km × 2 km cell, then the brightness temperature for this pixel was mostly decided by the background brightness temperature. When the brightness temperature was extremely high (e.g. over 330 K) and exceeded normal background temperature, this pixel was most likely a true fire spot, which thus was included by both the JMA-Himawari-8 and NSMC-Himawari-8 fire products. When the brightness temperature of one pixel was relatively low (e.g. around 270 K) yet much higher than its surrounding pixels, it may also be considered a fire pixel. This phenomenon is common for fire detection in northern China in winter. However, the existence of ground thermal sources can lead to the misidentification of fire pixels. Since we employed the dataset of ground interference sources, a large number of misidentified fire pixels under the low-temperature scenario, which are included in the JMA-Himawari-8 fire product, have been removed from the NSMC-Himawari-8 fire product, leading to a very small consistency when the brightness temperature of the target pixels was low. This output further revealed the strong influence of ground thermal sources on the reliance of extracted fire pixels.
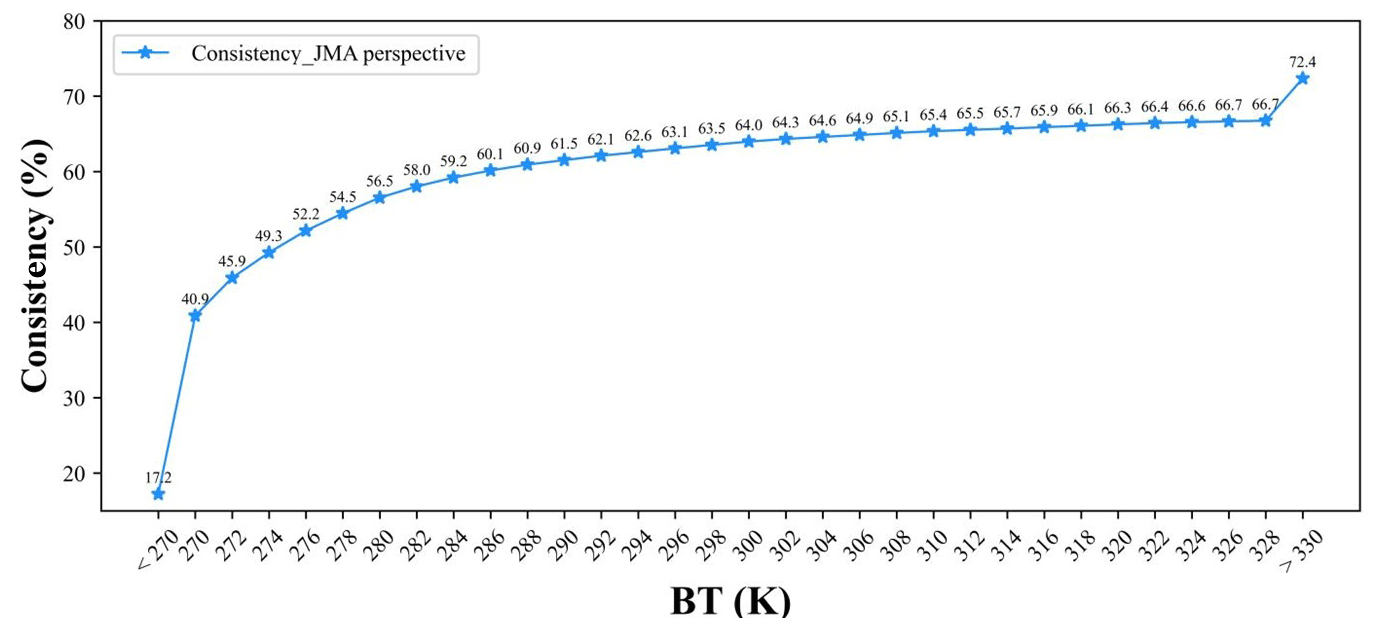
Figure 10The variation of consistency between the JMA-Himawari-8 and NSMC-Himawari-8 fire products under different brightness temperatures.
4.3 Accuracy assessment based on ground-truth data
Since the occurrence of wildfires is highly unpredictable and since the duration of fires may be short, real-time capture and continuous monitoring remains highly difficult. Therefore, the major challenge for verifying fire products lies in the lack of ground-truth reference data, and the reliability of the JMA-Himawari-8 fire product in China remains unknown.
To obtain reliable and large-scale reference data for fire detection, the State Grid Corporation of China and China Meteorological Administration jointly conducted annual fire-detection experiments since 2017 in five provinces in China: Guangdong, Guangxi, Yunnan, Guizhou and Hainan. Extensive drones have been employed to check the occurrence of fires and report the location and occurrence time of actual fires. For this research, we employed field-collected fire reference data in the five provinces throughout 2021 for accuracy assessment. By comparing the actual information of fires and the corresponding information in the two products, we could obtain the omission and commission errors and overall accuracy of the JMA-Himawari-8 and NSMC-Himawari-8 fire products.
As shown in Table 5 and Fig. 11, there were a proportion of omission errors in both fire products. This type of error was mostly caused by the limitation of sensors that some small fires within the 2 km × 2 km grid cannot be identified. Thanks to the dynamic fire-extraction thresholds adapted to China's local parameters, the number of fire pixels correctly recognised by the NSMC-Himawari-8 fire product (2174) was notably larger than that of the JMA-Himawari-8 fire product (1648). Meanwhile, the number of commission errors, which stands for those non-fire pixels misidentified as fire pixels, included in the JMA-Himawari-8 fire product (1160) was much larger than that in the NSMC-Himawari-8 fire product (413).
Table 5Accuracy assessment of the JMA-Himawari-8 and NSMC-Himawari-8 fire products based on field ground truth.

This is mostly attributed to our reprocessing of the preliminarily extracted fire pixels according to our database of ground thermal sources, which removed a majority of false fire pixels. Disturbed by a large proportion of misidentified fire pixels, the overall accuracy of the JMA-Himawari-8 fire product across China was simply 54 %. Even if we ignore those omission errors caused by sensor limitations, the overall accuracy was below 60 %. Therefore, the existing JMA-Himawari-8 fire product cannot provide reliable hourly monitoring of wildfires across China.
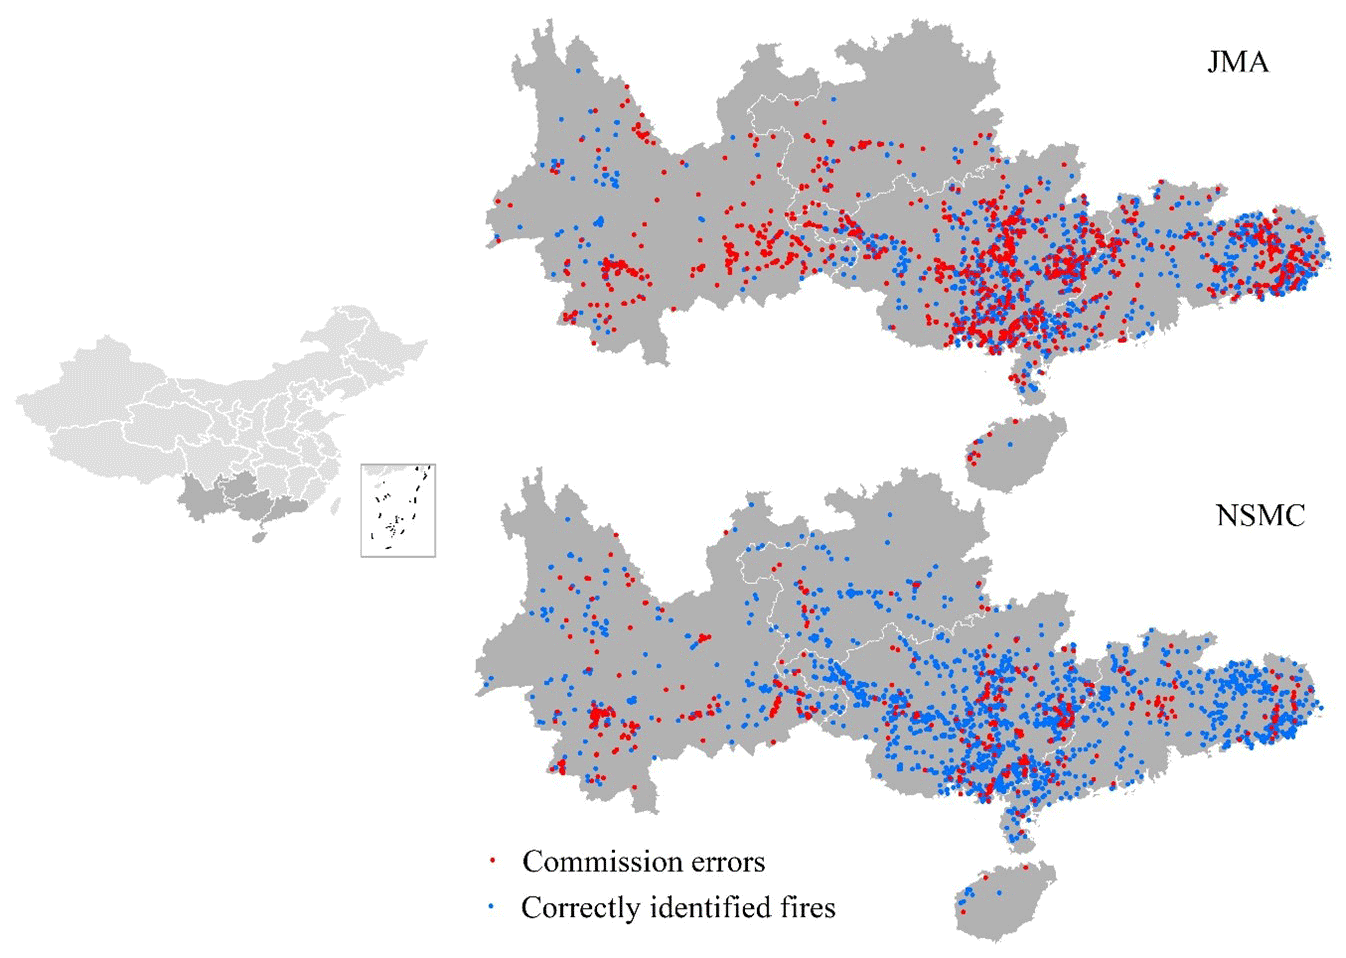
Figure 11Accuracy assessment of the NSMC-Himawari-8 and JMA-Himawari-8 fire products in China based on the ground-truth data.
As a comparison, with a notably improved number of correctly identified fire pixels and a significantly reduced number of misidentified fire pixels, the overall accuracy of the NSMC-Himawari-8 fire product reached 80 %. If the omission errors were not considered, the overall accuracy of the NSMC-Himawari-8 fire product could further reach 84 %. The largely improved accuracy makes our fire product an ideal source for real-time fire monitoring in China.
We compared the accuracy of the JMA-Himawari-8 and NSMC-Himawari-8 fire products in China. Based on the field-collected evidence, the NSMC-Himawari-8 fire product achieved a notably improved accuracy. This was mainly attributed to the additional consideration of underlying surface conditions, which effectively removed a large proportion of false fires. This result was consistent with the overall accuracy of our previous fire products. By comprehensively considering the underlying surfaces in China, the FY-3D global fire product achieved a high consistency with the mainstream and most commonly employed MODIS fire product at the global scale and significantly improved accuracy in China (Chen et al., 2022b). These results suggested that the accuracy of fire products was largely biased by the heating sources, which cannot be easily avoided through previously set fire-detection thresholds, and additional data sources should be employed for removing this type of major noise. Despite a notably improved accuracy, limitations remain. Firstly, regardless of the setting of major fire-detection parameters, the moderate spatial resolution of the NSMC-Himawari-8 fire products (2 km) restricted its capability for identifying the occurrence of those small fires. To address this issue, the comprehensive consideration of the NSMC-Himawari-8 fire products and other high-resolution fire products (e.g. VIIRS fire products) may be a potential solution. Nevertheless, the reliability of these complementary fire products in China requires further verification and improvement. Secondly, during the early morning and evening, due to the relatively low solar altitude, the identification of cloud removal was slightly influenced during this period. Thirdly, due to the vast coverage, the conditions of underlying surface varies significantly in China. Therefore, the setting of fire-identification thresholds may achieve different effects across regions. For those regions with complicated underlying surfaces, the reliability of the NSMC-Himawari-8 fire products may be lower than the overall accuracy.
In recent years, there is a growing need for timely monitoring of the occurrence of wildfires in China, especially for identifying grassland fires and forest fires, which cause a severe threat to public health and environment, and detecting human-induced crop-residue burning, which has become one major source of airborne pollutants. However, existing mainstream fire products cannot fully support these needs. The MODIS and FY-3D daily global fire products can solely visit the target area once per day. Meanwhile, JMA-Himawari-8 hourly fire products have the potential to provide quick identification of wildfires. However, even without quantitative accuracy assessment, previous implementation conducted by major institutions (e.g. State Grid Corporation of China and China Meteorological Administration) reported that the JMA-Himawari-8 products presented large uncertainties across China. Therefore, the JMA-Himawari-8 product was limitedly employed for either scientific or practical implementations, despite its high temporal resolution. Based on a rare reference dataset, this research, for the first time, verified the reliability of the JMA-Himawari-8 product and quantitatively proved that the JMA-Himawari-8 product presented a large uncertainty across China and was not suitable for real-time fire monitoring. In this case, the NSMC-Himawari-8 fire products, with an hourly temporal resolution and an overall accuracy around 80 %, can be an ideal source for monitoring real-time wildfires in China. Furthermore, in recent years, with the increasing strict regulation on crop-residue burning, many farmers choose to secretly burn crop residues in the nighttime, which causes a major challenge for timely monitoring and management. With the NSMC-Himawari-8 fire products, which provides reliable 24 h hourly data sources, automatic monitoring, especially nighttime monitoring, of crop-residue burning in China can be effectively implemented.
In previous implementations, scholars are more likely to employ official fire products released by those institutions that are operating the corresponding satellites and rarely consider to originally propose a fire product based on the raw satellite data. This research is a rare attempt to produce an improved fire product based on the existing raw satellite source by additionally considering localised complementary sources. The result suggested that our NSMC-Himawari-8 fire product achieved a much higher accuracy than the official JMA-Himawari-8 fire product, which is not suitable for practical or research use in China. By analogy, the use of complementary sources (e.g. the location of thermal sources) could further improve the local suitability of other global fire products (e.g. the MODIS fire product).
Further improvement of real-time fire detection in China can be explored in the following perspectives. As introduced above, one major disadvantage of the Himawari-8-based fire products is the relative coarse spatial resolution provided by the Himawari-8 satellite. As an important part of the Fengyun series of meteorological satellites, China plans to launch the new-generation FY-4C stationary satellite with a temporal resolution of 5 min and an improved spatial resolution of 1 km in 2024, which presents a good potential for largely enhancing the sensitivity of fire identification in China. Meanwhile, time series analysis, instead of the analysis on individual image, should be additionally considered in the algorithm of fire detection, leading to more effective removal of false fire information. With enhanced resolution and reduced uncertainty, real-time fires can be better monitored in China.
The NSMC-Himawari-8 fire product for China is available at http://figshare.com with the following DOI: https://doi.org/10.6084/m9.figshare.21550248 (Chen et al., 2022a).
Given the uncertainty of the JMA-Himawari-8 fire product in China, we proposed an adaptive hourly NSMC-Himawari-8 fire product based on the original Himawari-8 source by employing a dynamical threshold for fire extraction and a database of ground thermal sources. Based on the visually extracted references and consistency check, we found that the NSMC-Himawari-8 fire product effectively removed a majority of false fire alarms included in the JMA-Himawari-8 fire product. Based on a rare field-collected ground reference dataset, we evaluated the reliability of the JMA-Himawari-8 and NSMC-Himawari-8 fire products across China. The overall accuracy of the JMA-Himawari-8 fire product was 54 % and 59 % (not considering the omission error), respectively. As a comparison, by identifying more real fire pixels and avoiding a majority of false fire alarms, the overall accuracy of the NSMC-Himawari-8 fire product was 80 % and 84 % (not considering the omission errors), respectively. The NSMC-Himawari-8 fire product can be a promising source for improved real-time fire monitoring across China. This research also provides a useful reference for employing a local dataset of underlying surfaces and thermal sources to enhance the accuracy of global fire products in specific regions.
JC, WZ, SW and CL produced the NSMC-Himawari-8 fire product. QL and ZC initiated the manuscript. JC, QL, ZC, WZ, YZ, CL and EZ conducted data analysis. QL, XC, JY and JC produced figures. QL and ZC wrote the draft. BG produced the official website. ML, ZC and BG reviewed and revised the manuscript.
The contact author has declared that none of the authors has any competing interests.
Publisher's note: Copernicus Publications remains neutral with regard to jurisdictional claims in published maps and institutional affiliations.
Thanks go to the two anonymous reviewers for the valuable comments. This research is supported by the National Key Research and Development Program of China (grant no. 2021YFC3000300) and the National Natural Science Foundation of China (grant no. 42171399).
This research is supported by the National Key Research and Development Program of China (grant no. 2021YFC3000300) and the National Natural Science Foundation of China (grant no. 42171399).
This paper was edited by Jia Yang and reviewed by two anonymous referees.
Abram, N. J., Henley, B. J., Sen Gupta, A., Lippmann, T. J., Clarke, H., Dowdy, A. J., Sharples, J. J., Nolan, R. H., Zhang, T., and Wooster, M. J.: Connections of climate change and variability to large and extreme forest fires in southeast Australia, Commun. Earth Environ., 2, 1–17, https://doi.org/10.1038/s43247-020-00065-8, 2021.
Andela, N., Morton, D. C., Giglio, L., Chen, Y., van der Werf, G. R., Kasibhatla, P. S., DeFries, R. S., Collatz, G. J., Hantson, S., Kloster, S., Bachelet, D., Forrest, M., Lasslop, G., Li, F., Mangeon, S., Melton, J. R., Yue, C., and Randerson, J. T.: A human-driven decline in global burned area, Science, 356, 1356–1362, https://doi.org/10.1126/science.aal4108, 2017.
Andersen, A. N., Cook, G. D., Corbett, L. K., Douglas, M. M., Eager, R. W., Russell-Smith, J., Setterfield, S. A., Williams, R. J., and Woinarski, J. C.: Fire frequency and biodiversity conservation in Australian tropical savannas: implications from the Kapalga fire experiment, Austral Ecol., 30, 155–167, https://doi.org/10.1111/j.1442-9993.2005.01441.x, 2005.
Angassa, A. and Oba, G.: Herder perceptions on impacts of range enclosures, crop farming, fire ban and bush encroachment on the rangelands of Borana, Southern Ethiopia, Human Ecol., 36, 201–215, https://doi.org/10.1007/s10745-007-9156-z, 2008.
Arino, O., Casadio, S., and Serpe, D.: Global night-time fire season timing and fire count trends using the ATSR instrument series, Remote Sens., 116, 226–238, https://doi.org/10.1016/j.rse.2011.05.025, 2012.
Balch, J. K., Bradley, B. A., D'Antonio, C. M., and Gómez-Dans, J.: Introduced annual grass increases regional fire activity across the arid western USA (1980–2009), Glob. Chang. Biol., 19, 173–183, https://doi.org/10.1111/gcb.12046, 2013.
Bessho, K., Date, K., Hayashi, M., Ikeda, A., Imai, T., Inoue, H., Kumagai, Y., Miyakawa, T., Murata, H., and Ohno, T.: An introduction to Himawari-8/9 – Japan's new-generation geostationary meteorological satellites, J. Meteorol. Soc. Japan, Ser. II, 94, 151–183, https://doi.org/10.2151/jmsj.2016-009, 2016.
Cascio, W. E.: Wildland fire smoke and human health, Sci. Total Environ., 624, 586–595, https://doi.org/10.1016/j.scitotenv.2017.12.086, 2018.
Chen, J., Lv, Q., Wu, S., Zeng, Y., Li, M., Chen, Z., Zhou, E., Zheng, W., Chen, X., Yang, J., and Gao, B.: NSMC-Himawari-8 fire product for China, figshare [data set], https://doi.org/10.6084/m9.figshare.21550248, 2022a.
Chen, J., Yao, Q., Chen, Z., Li, M., Hao, Z., Liu, C., Zheng, W., Xu, M., Chen, X., Yang, J., Lv, Q., and Gao, B.: The Fengyun-3D (FY-3D) global active fire product: principle, methodology and validation, Earth Syst. Sci. Data, 14, 3489–3508, https://doi.org/10.5194/essd-14-3489-2022, 2022b.
Chen, J., Zheng, W., Wu, S., Liu, C., and Yan, H.: Fire Monitoring Algorithm and Its Application on the Geo-Kompsat-2A Geostationary Meteorological Satellite, Remote Sens., 14, 2655, https://doi.org/10.3390/rs14112655, 2022c.
Csiszar, I. A., Morisette, J. T., and Giglio, L.: Validation of active fire detection from moderate-resolution satellite sensors: the MODIS example in northern Eurasia, IEEE T. Geosci. Remote, 44, 1757–1764, https://doi.org/10.1109/TGRS.2006.875941, 2006.
Cui, X., Alam, M. A., Perry, G. L., Paterson, A. M., Wyse, S. V., and Curran, T. J.: Green firebreaks as a management tool for wildfires: Lessons from China, J. Environ. Manage., 233, 329–336, https://doi.org/10.1016/j.jenvman.2018.12.043, 2019.
Driscoll, D. A., Lindenmayer, D. B., Bennett, A. F., Bode, M., Bradstock, R. A., Cary, G. J., Clarke, M. F., Dexter, N., Fensham, R., and Friend, G.: Fire management for biodiversity conservation: key research questions and our capacity to answer them, Biol. Conserv., 143, 1928–1939, https://doi.org/10.1016/j.biocon.2010.05.026, 2010.
Earl, N. and Simmonds, I.: Spatial and temporal variability and trends in 2001–2016 global fire activity, J. Geophys. Res.-Atmos., 123, 2524–2536, https://doi.org/10.1002/2017JD027749, 2018.
ESA: A Global Plant Functional Types (PFT) dataset (v2.0.8) 2019–2020, ESA [data set], http://maps.elie.ucl.ac.be/CCI/viewer/download.php, last access: 5 May 2023.
Freeborn, P. H., Wooster, M. J., and Roberts, G.: Addressing the spatiotemporal sampling design of MODIS to provide estimates of the fire radiative energy emitted from Africa, Remote Sens. Environ., 115, 475–489, https://doi.org/10.1016/j.rse.2010.09.017, 2011.
Fuller, D. O. and Fulk, M.: Comparison of noaa-avhrr and DMSP-OLS for operational fire monitoring in kalimantan, Indonesia. Int. J. Remote Sens., 21, 181–187, https://doi.org/10.1080/014311600211073, 2000.
Giglio, L., Csiszar, I., Justice, C. O.: Global distribution and seasonality of active fires as observed with the Terra and Aqua Moderate Resolution Imaging Spectroradiometer (MODIS) sensors, J. Geophys. Res.-Biogeo., 111, G02016, https://doi.org/10.1029/2005JG000142, 2006.
Giglio, L., Boschetti, L., Roy, D. P., Humber, M. L., and Justice, C. O.: The Collection 6 MODIS burned area mapping algorithm and product, Remote Sens. Environ., 217, 72–85, https://doi.org/10.1016/j.rse.2018.08.005, 2018.
Hall, J. V., Zhang, R., Schroeder, W., Huang, C., and Giglio, L.: Validation of GOES-16 ABI and MSG SEVIRI active fire products. Int. J. Appl. Earth Obs. Geoinf., 83, 101928, https://doi.org/10.1016/j.jag.2019.101928, 2019.
Herold, M. and Roberts, D.: Spectral characteristics of asphalt road aging and deterioration: implications for remote-sensing applications, Appl. Optics, 44, 4327–4334, https://doi.org/10.1364/AO.44.004327, 2005.
Huang, X., Li, M., Li, J., and Song, Y.: A high-resolution emission inventory of crop burning in fields in China based on MODIS Thermal Anomalies/Fire products, Atmos. Environ., 50, 9–15, https://doi.org/10.1016/j.atmosenv.2012.01.017, 2012.
Huff, A. K., Kondragunta, S., Zhang, H., and Hoff, R. M.: Monitoring the impacts of wildfires on forest ecosystems and public health in the exo-urban environment using high-resolution satellite aerosol products from the visible infrared imaging radiometer suite (VIIRS), Environ. Health Insights., 9s2, EHI.S19590, https://doi.org/10.4137/ehi.s19590, 2015.
Ichoku, C., Kahn, R., and Chin, M.: Satellite contributions to the quantitative characterization of biomass burning for climate modeling, Atmos. Res., 111, 1–28, https://doi.org/10.1016/j.atmosres.2012.03.007, 2012.
Jang, E., Kang, Y., Im, J., Lee, D. W., Yoon, J., and Kim, S. K.: Detection and monitoring of forest fires using Himawari-8 geostationary satellite data in South Korea, Remote Sens., 11, 271, https://doi.org/10.3390/rs11030271, 2019.
Johnston, F. H., Henderson, S. B., Chen, Y., Randerson, J. T., Marlier, M., DeFries, R. S., Kinney, P., Bowman, D. M., and Brauer, M.: Estimated global mortality attributable to smoke from landscape fires, Environ. Health Perspect., 120, 695–701, https://doi.org/10.1289/ehp.1104422, 2012.
Justice, C., Giglio, L., Korontzi, S., Owens, J., Morisette, J., Roy, D., Descloitres, J., Alleaume, S., Petitcolin, F., and Kaufman, Y.: The MODIS fire products, Remote Sens. Environ., 83, 244–262, https://doi.org/10.1016/S0034-4257(02)00076-7, 2002.
Kuenzer, C. and Dech, S.: Theoretical background of thermal infrared remote sensing, in: Thermal infrared remote sensing, Springer, Dordrecht, 1–26, https://doi.org/10.1007/978-94-007-6639-6_1, 2013.
Li, F., Zhang, X., Roy, D. P., and Kondragunta, S.: Estimation of biomass-burning emissions by fusing the fire radiative power retrievals from polar-orbiting and geostationary satellites across the conterminous United States, Atmos. Environ., 211, 274–287, https://doi.org/10.1016/j.atmosenv.2019.05.017, 2019.
Li, J., Bo, Y., and Xie, S.: Estimating emissions from crop residue open burning in China based on statistics and MODIS fire products, J. Environ. Sci.-China, 44, 158–170, https://doi.org/10.1016/j.jes.2015.08.024, 2016.
Liu, J. C., Pereira, G., Uhl, S. A., Bravo, M. A., and Bell, M. L.: A systematic review of the physical health impacts from non-occupational exposure to wildfire smoke, Environ. Res., 136, 120–132, https://doi.org/10.1016/j.envres.2014.10.015, 2015.
Liu, T., Marlier, M. E., DeFries, R. S., Westervelt, D. M., Xia, K. R., Fiore, A. M., Mickley, L. J., Cusworth, D. H., and Milly, G.: Seasonal impact of regional outdoor biomass burning on air pollution in three Indian cities: Delhi, Bengaluru, and Pune, Atmos. Environ., 172, 83–92, https://doi.org/10.1016/j.atmosenv.2017.10.024, 2018.
Liu, X., He, B., Quan, X., Yebra, M., Qiu, S., Yin, C., Liao, Z., and Zhang, H.: Near real-time extracting wildfire spread rate from Himawari-8 satellite data, Remote Sens., 10, 1654, https://doi.org/10.3390/rs10101654, 2018.
Liu, Z., Yang, J., Chang, Y., Weisberg, P. J., and He, H. S.: Spatial patterns and drivers of fire occurrence and its future trend under climate change in a boreal forest of Northeast China, Glob. Chang. Biol., 18, 2041–2056, https://doi.org/10.1111/j.1365-2486.2012.02649.x, 2012.
Marlier, M. E., DeFries, R. S., Kim, P. S., Koplitz, S. N., Jacob, D. J., Mickley, L. J., and Myers, S. S.: Fire emissions and regional air quality impacts from fires in oil palm, timber, and logging concessions in Indonesia, Environ. Res. Lett., 10, 085005, https://doi.org/10.1088/1748-9326/10/8/085005, 2015.
Na, L., Zhang, J., Bao, Y., Bao, Y., Na, R., Tong, S., and Si, A.: Himawari-8 satellite based dynamic monitoring of grassland fire in China-Mongolia border regions, Sensors, 18, 276, https://doi.org/10.3390/s18010276, 2018.
Niu, R. and Zhai, P.: Study on forest fire danger over Northern China during the recent 50 years, Clim. Change, 111, 723–736, https://doi.org/10.1007/s10584-011-0198-2, 2012.
NOAA: NOAA-20 Visible Infrared Imaging Radiometer Suite (VIIRS) 2019–2021, NOAA [data set], https://ncc.nesdis.noaa.gov/NOAA-20/NOAA20VIIRS.php, last access: 5 May 2023.
Panjaitan, R. B., Sumartono, S., Sarwono, S., and Saleh, C.: The role of central government and local government and the moderating effect of good governance on forest fire policy in Indonesia, Benchmarking: An International Journal, 26, 147–159, https://doi.org/10.1108/BIJ-12-2017-0336, 2019.
Quinn, T. J. and Martin, J. E.: A radiometric determination of the Stefan-Boltzmann constant and thermodynamic temperatures between −40 ∘C and +100 ∘C, Philos. T. Roy. Soc. Lond. A, 316, 85–189, https://doi.org/10.1098/rsta.1985.0058, 1985.
Reid, C. E., Brauer, M., Johnston, F. H., Jerrett, M., Balmes, J. R., and Elliott, C. T.: Critical review of health impacts of wildfire smoke exposure, Environ. Health Perspect., 124, 1334–1343, https://doi.org/10.1289/ehp.1409277, 2016.
Röder, A., Hill, J., Duguy, B., Alloza, J. A., and Vallejo, R.: Using long time series of Landsat data to monitor fire events and post-fire dynamics and identify driving factors. A case study in the Ayora region (eastern Spain), Remote Sens. Environ., 112, 259–273, https://doi.org/10.1016/j.rse.2007.05.001, 2008.
Schmit, T. J., Griffith, P., Gunshor, M. M., Daniels, J. M., Goodman, S. J., and Lebair, W. J.: A closer look at the ABI on the GOES-R series, B. Am. Meteorol. Soc., 98, 681–698, https://doi.org/10.1175/bams-d-15-00230.1, 2017.
Schroeder, W., Csiszar, I., and Morisette, J.: Quantifying the impact of cloud obscuration on remote sensing of active fires in the Brazilian Amazon, Remote Sens. Environ., 112, 456–470, https://doi.org/10.1016/j.rse.2007.05.004, 2008.
Schroeder, W., Oliva, P., Giglio, L., and Csiszar, I. A.: The New VIIRS 375 m active fire detection data product: Algorithm description and initial assessment, Remote Sens. Environ., 143, 85–96, https://doi.org/10.1016/j.rse.2013.12.008, 2014.
Sharma, A., Wang, J., and Lennartson, E. M.: Intercomparison of MODIS and VIIRS fire products in Khanty-Mansiysk Russia: Implications for characterizing gas flaring from space, Atmosphere, 8, 95, https://doi.org/10.3390/atmos8060095, 2017.
Song, R., Wang, T., Han, J., Xu, B., Ma, D., Zhang, M., Li, S., Zhuang, B., Li, M., and Xie, M.: Spatial and temporal variation of air pollutant emissions from forest fires in China, Atmos. Environ., 281, 119156, https://doi.org/10.1016/j.atmosenv.2022.119156, 2022.
Tiedemann, A. R., Klemmedson, J. O., and Bull, E. L.: Solution of forest health problems with prescribed fire: are forest productivity and wildlife at risk, For. Ecol. Manag., 127, 1–18, https://doi.org/10.1016/S0378-1127(99)00114-0, 2000.
Wang, J., Bhattacharjee, P. S., Tallapragada, V., Lu, C.-H., Kondragunta, S., da Silva, A., Zhang, X., Chen, S.-P., Wei, S.-W., Darmenov, A. S., McQueen, J., Lee, P., Koner, P., and Harris, A.: The implementation of NEMS GFS Aerosol Component (NGAC) Version 2.0 for global multispecies forecasting at NOAA/NCEP – Part 1: Model descriptions, Geosci. Model Dev., 11, 2315–2332, https://doi.org/10.5194/gmd-11-2315-2018, 2018.
Wang, X., Min, M., Wang, F., Guo, J., Li, B., and Tang, S.: Intercomparisons of cloud mask products among Fengyun-4A, Himawari-8, and MODIS, IEEE T. Geosci. Remote, 57, 8827–8839, https://doi.org/10.1109/TGRS.2019.2923247, 2019.
Wickramasinghe, C. H., Jones, S., Reinke, K., and Wallace, L.: Development of a multi-spatial resolution approach to the surveillance of active fire lines using Himawari-8, Remote Sens., 8, 932, https://doi.org/10.3390/rs8110932, 2016.
Wu, Z., He, H. S., Yang, J., Liu, Z., and Liang, Y.: Relative effects of climatic and local factors on fire occurrence in boreal forest landscapes of northeastern China, Sci. Total Environ., 493, 472–480, https://doi.org/10.1016/j.scitotenv.2014.06.011, 2014.
Xu, G. and Zhong, X.: Real-time wildfire detection and tracking in Australia using geostationary satellite: Himawari-8, Remote Sens. Lett., 8, 1052–1061, https://doi.org/10.1080/2150704X.2017.1350303, 2017.
Xu, W., Wooster, M. J., Kaneko, T., He, J., Zhang, T., and Fisher, D.: Major advances in geostationary fire radiative power (FRP) retrieval over Asia and Australia stemming from use of Himarawi-8 AHI, Remote Sens. Environ., 193, 138–149, https://doi.org/10.1016/j.rse.2017.02.024, 2017.
Yang, Z., Zhang, P., Gu, S., Hu, X., Tang, S., Yang, L., Xu, N., Zhen, Z., Wang, L., and Wu, Q.: Capability of Fengyun-3D satellite in earth system observation, J. Meteorol. Res., 33, 1113–1130, https://doi.org/10.1007/s13351-019-9063-4, 2019.
Yang, Z.-Y., Ishii, S., Yokoyama, T., Dao, T.D., Sun, M.-G., Pankin, P.S., Timofeev, I.V., Nagao, T., and Chen, K.-P.: Narrowband wavelength selective thermal emitters by confined tamm plasmon polaritons, Acs Photonics, 4, 2212–2219, https://doi.org/10.1021/acsphotonics.7b00408, 2017.
Ying, L., Han, J., Du, Y., and Shen, Z.: Forest fire characteristics in China: Spatial patterns and determinants with thresholds, For. Ecol. Manag., 424, 345–354, https://doi.org/10.1016/j.foreco.2018.05.020, 2018.
Yuan, J., Wang, D., and Li, R.: Remote sensing image segmentation by combining spectral and texture features, IEEE T. Geosci. Remote, 52, 16–24, https://doi.org/10.1109/TGRS.2012.2234755, 2014.
Zackrisson, O.: Influence of forest fires on the North Swedish boreal forest, Oikos, 29, 22–32, https://doi.org/10.2307/3543289, 2013, 1977.
Zhang, X. and Kondragunta, S.: Temporal and spatial variability in biomass burned areas across the USA derived from the GOES fire product, Remote Sens. Environ., 112, 2886–2897, https://doi.org/10.1016/j.rse.2008.02.006, 2008.