the Creative Commons Attribution 4.0 License.
the Creative Commons Attribution 4.0 License.
 | 18 Apr 2023
The sea level time series of Trieste, Molo Sartorio, Italy (1869–2021)
Fabio Raicich
The sea level observations carried out at Trieste, Molo Sartorio, from 1869 to 2021 have been revised and updated. Information on the tide gauges and on the geodetic benchmarks on Molo Sartorio during that period have been collected. Basic quality checks have been applied. The hourly data for the 1917–1938 period, digitized from the original charts, have allowed us to build a time series of hourly sea level heights from 1905 to 2021. Gaps of up to 24 h have been filled by interpolation. The errors affecting the monthly and annual mean sea levels have been estimated. The availability of monthly and annual means prior to 1904 allowed us to build a mean sea level time series spanning 153 years, characterized by linear trends of an observed sea level of 1.36 ± 0.17 mm yr−1 and of an inverse-barometer-corrected sea level of 1.45 ± 0.13 mm yr−1. A significant acceleration of 0.008 ± 0.004 mm yr−2 was estimated from the inverse-barometer-corrected sea level time series. This data set represents the most up-to-date data set of sea level observations and ancillary information relative to the tide-gauge station of Trieste, Molo Sartorio.
The data are available through SEANOE (https://doi.org/10.17882/62758, Raicich, 2022).
- Article
(7198 KB) - Full-text XML
- BibTeX
- EndNote


Long time series of environmental observations are fundamental in climate studies. Among them, it is widely recognized that historical sea level records play a key role in the assessment of long-term sea level rise rate and acceleration. Some records date back to the 18th century (e.g. Woodworth, 1999; Wöppelmann et al., 2006; Raicich, 2015), and automatic recordings started in the first decades of the 19th century (Matthäus, 1972). Nevertheless, the number of homogeneous sea level records longer than a century is quite limited, and, moreover, they are unevenly distributed geographically. Therefore, there is an increasing demand for the rescue of historical sea level observations.
The relevance of sea level data archaeology, i.e. the discovery, recovery, quality control, and publication of historical data for different purposes, is recognized by the Global Sea Level Observing System (GLOSS) (Bradshaw et al., 2015; UNESCO/IOC, 2020a). Recent efforts include, among others, the recovery of long time series in Australia (Hunter et al., 2003), Croatia (Međugorac et al., 2022), France and its overseas territories (Wöppelmann et al., 2006, 2008, 2014; Testut et al., 2010; Gouriou et al., 2013), Germany (Dangendorf et al., 2013), Italy (Battistin and Canestrelli, 2006; Bruni et al., 2019), New Zealand (Hannah, 2004), Portugal (Araújo et al., 2013), Spain (Marcos et al., 2011, 2013, 2021), the United Kingdom and its overseas territories (Woodworth, 1999; Woodworth et al., 2010), and the United States (Talke et al., 2014, 2018, 2020; Ray and Talke, 2019).
In Trieste a tide gauge was installed in 1859 on Molo (Pier) Sartorio and, thanks to the efforts made by many people belonging to different organizations, sea level data spanning over 150 years are available today, making them one of the few ultra-centennial time series in the Mediterranean Sea (Zerbini et al., 2017). The geographical position of the present tide-gauge station is 45.6472∘ N, 13.7596∘ E (Becker et al., 2002), and it is shown in Fig. 1c. In the past, monthly and annual means were summarized, for example, by Polli (1938, 1970), AOP (1939), Ferraro (1972), and Raicich (2007). Those data are regularly updated in the database of the Permanent Service for Mean Sea Level (PSMSL; https://psmsl.org/data/obtaining/stations/154.php, last access: 13 December 2022). The hourly data for 1905–1911 were reported in Mazelle (1909, 1910, 1911, 1912, 1913, 1914, 1917).
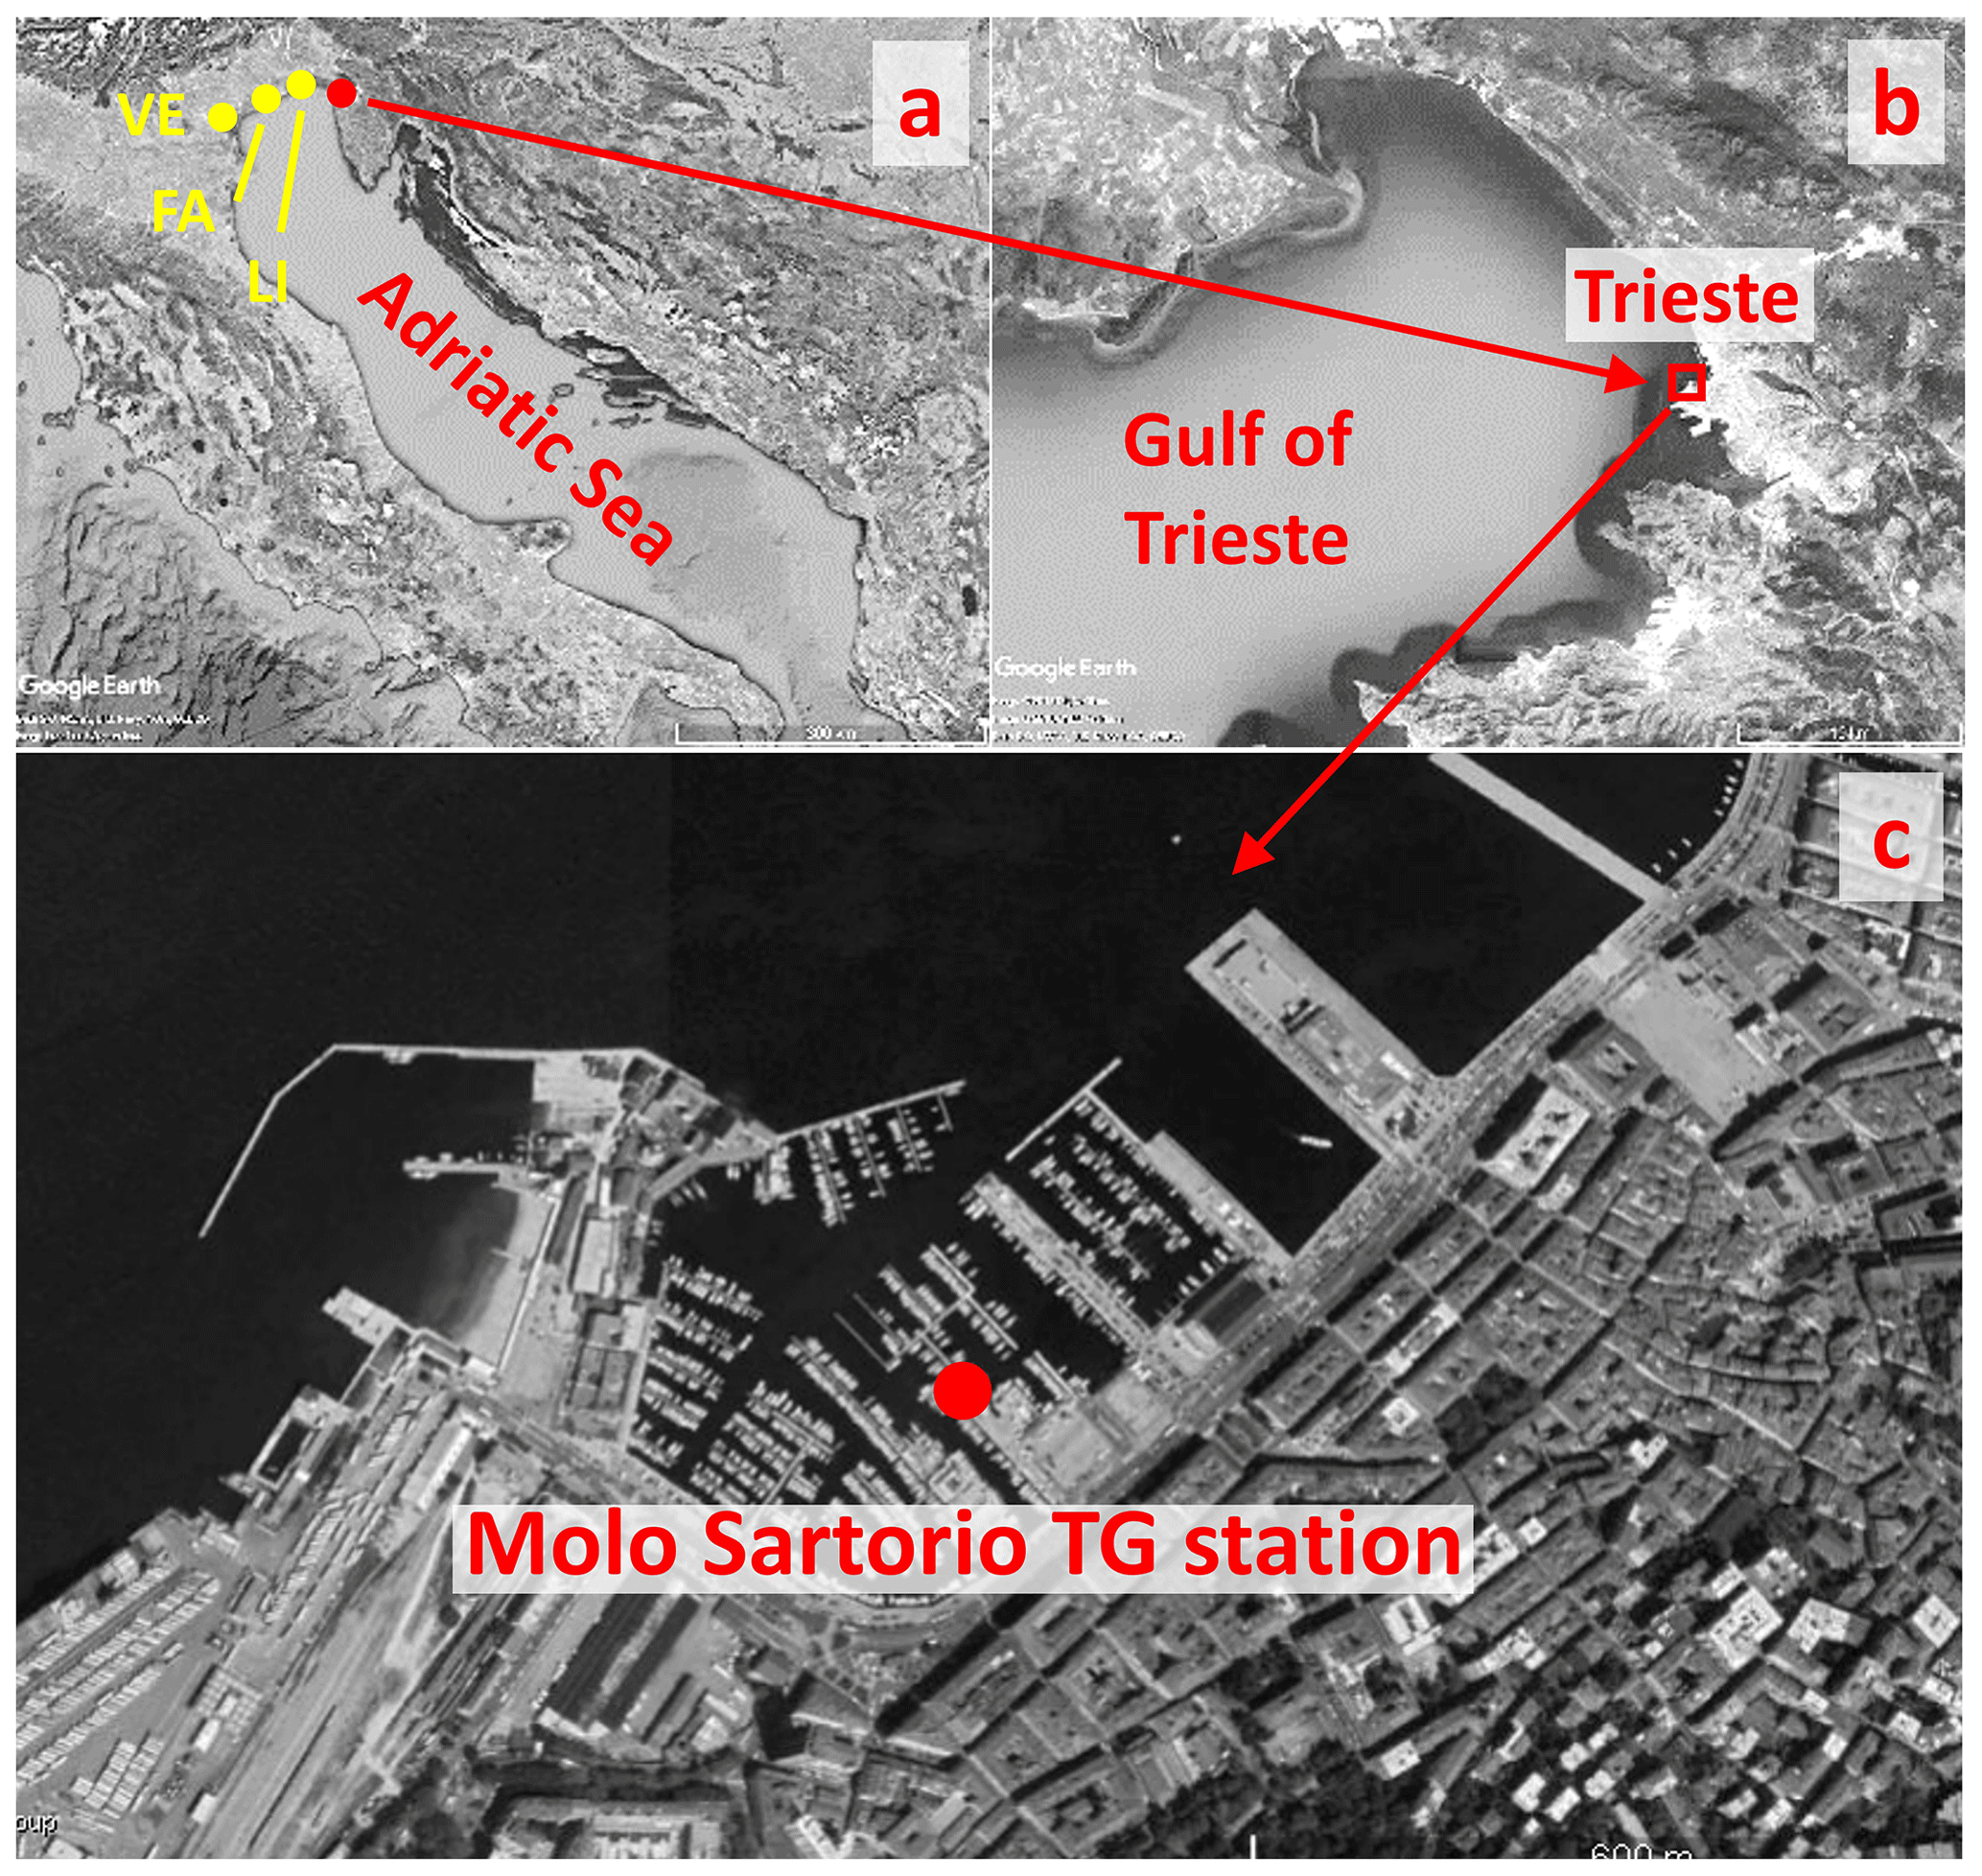
Figure 1(a) The Adriatic region. (b) The Gulf of Trieste. (c) Aerial image of Trieste harbour with the location of the tide-gauge (TG) station. The yellow dots in panel (a) indicate the stations of Venice Punta Salute (VE), Falconera (FA), and Porto Lignano (LI). (Images extracted from © Google Earth, © 2020 Landsat/Copernicus, © 2020 CNES/Airbus, © 2020 Digital Globe, and © 2020 TerraMetric.)
This work aimed at recovering and making available the sea level data obtained at Trieste, Molo Sartorio, the information on the instruments used for the observations, and the levelling data of the benchmarks inside and outside the tide-gauge hut. The existing data and metadata have been thoroughly revised and previously unpublished data have been added to the existing time series.
Section 2 describes the historical evolution of the station and the elements relevant to sea level observation. The observations are discussed in Sect. 3. In Sect. 4 the long-term time series obtained from the revised data set is described, and some basic properties are discussed. Data availability is summarized in Sect. 5. Concluding remarks are presented in Sect. 6.
2.1 Installations and instruments
The earliest known measurements of sea level height in Trieste were made by the physician Leonardo Vordoni from 1782 to 1794, who was interested in studying the connection of tides and the course of diseases. Although the data set is remarkably long for the period, it mainly has a historical value due to its low quality, as discussed in Raicich (2020). On 23 July 1840, Vincenzo Gallo, the director of the local meteorological observatory, began measuring the sea level height in order to compute the establishment of the port and to make tidal predictions (Gallo, 1840); observations for 21–22 March 1844 only could be recovered (Gallo, 1844).
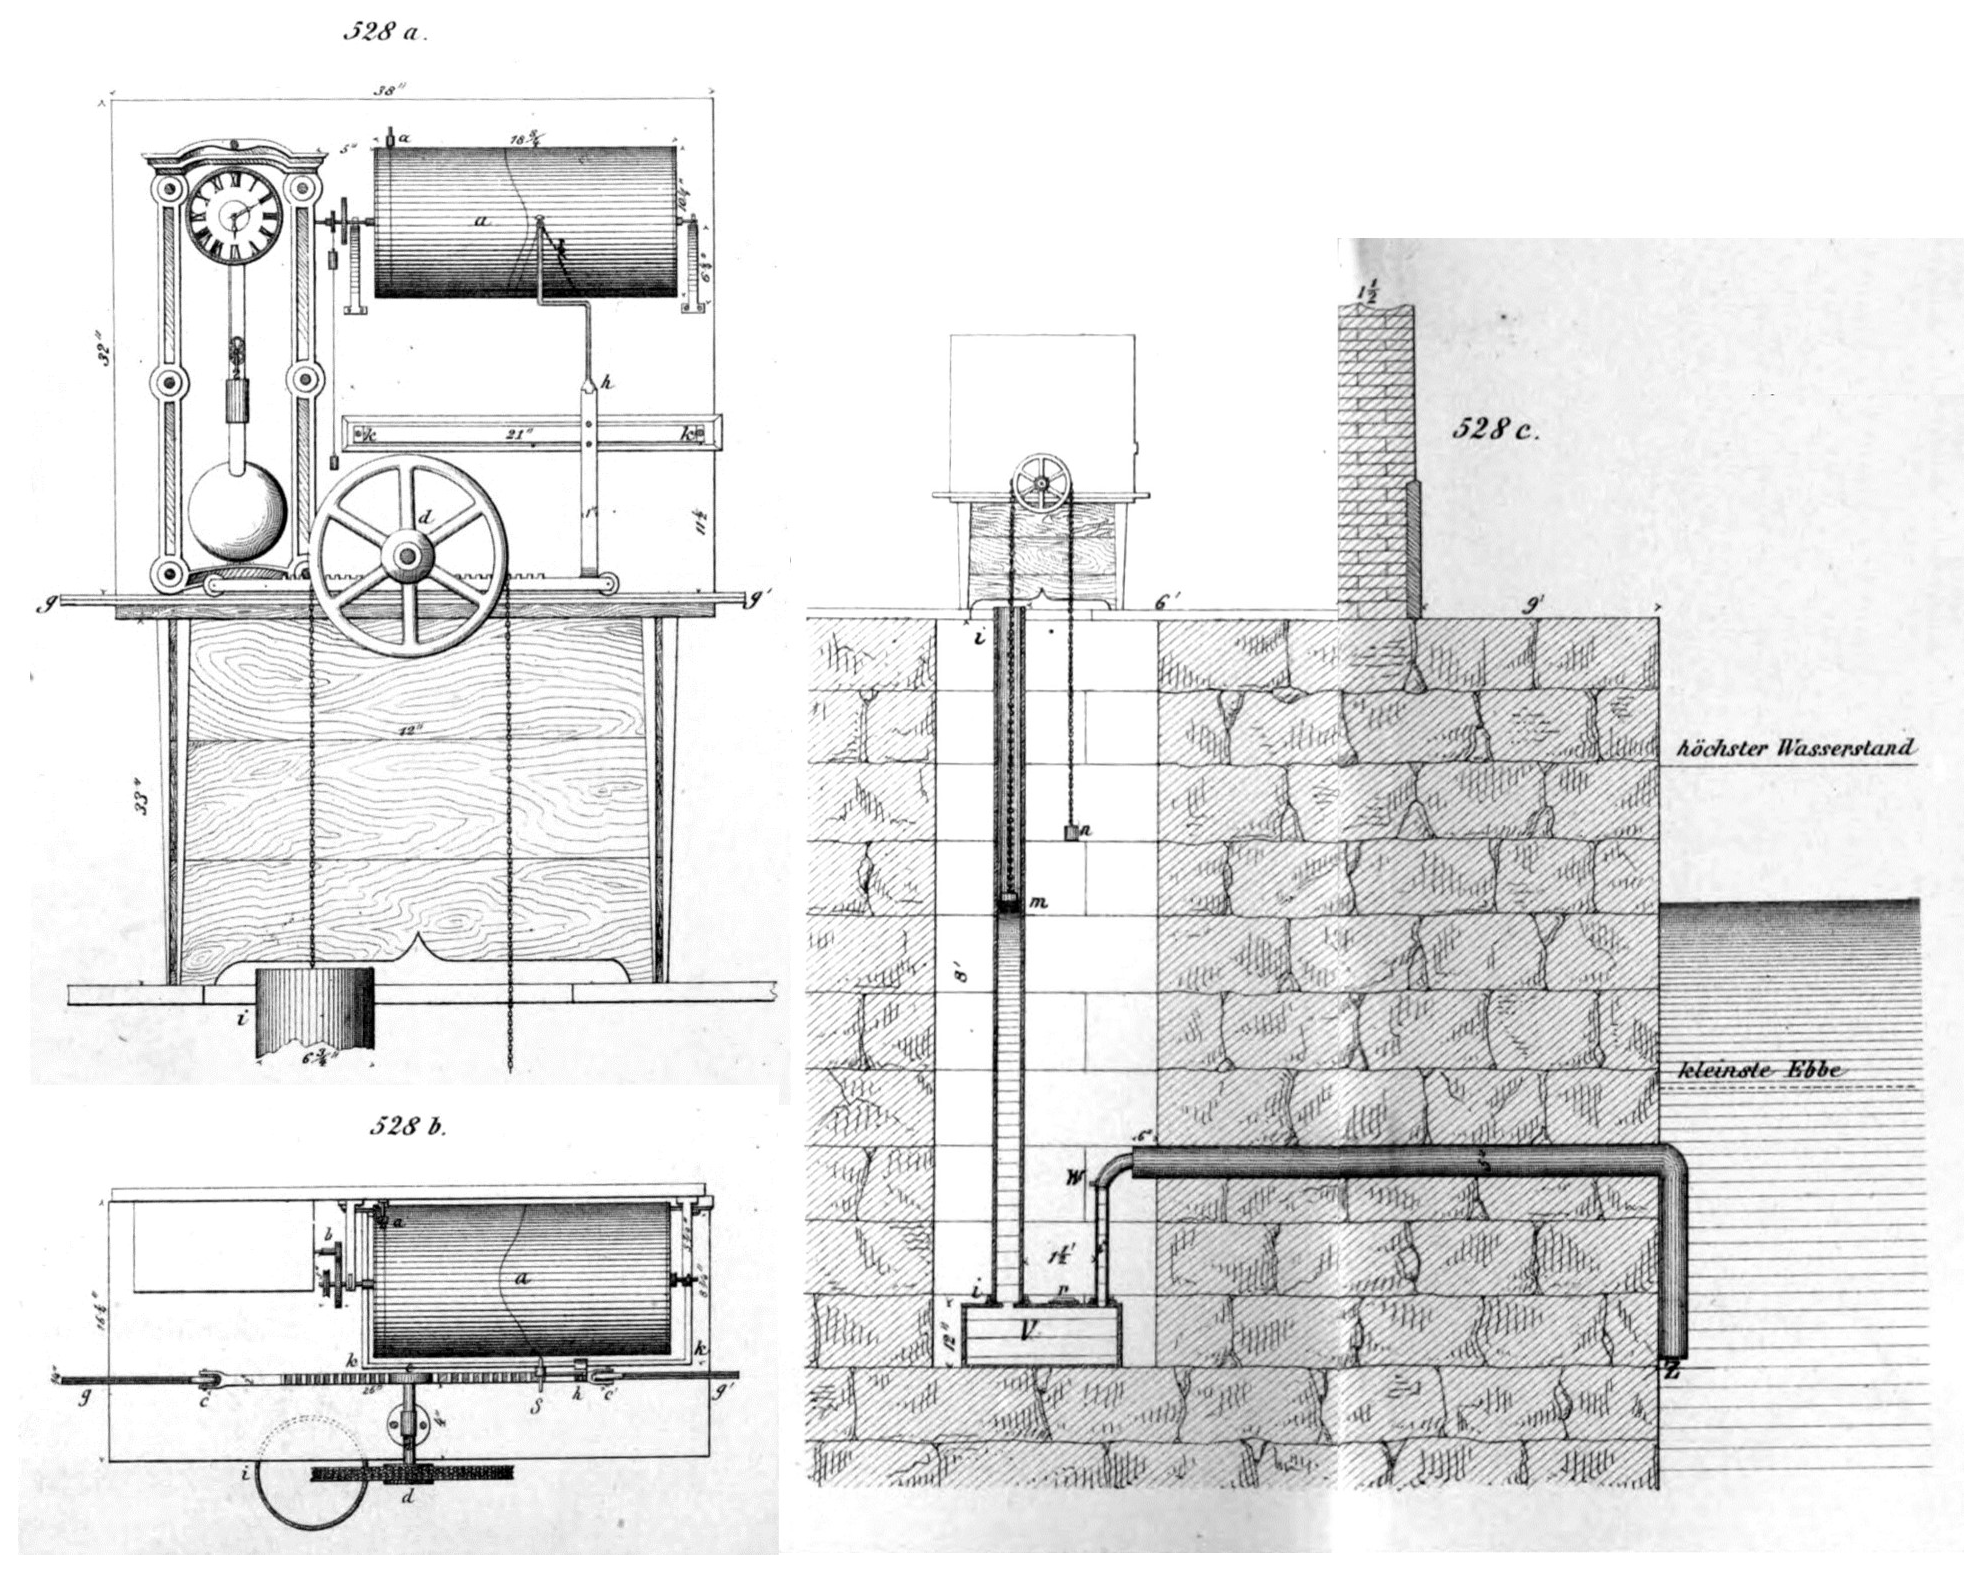
Figure 2The tide gauge installed in 1859. View of the instrument from the front (528a) and from above (528b); vertical section of the north-western end of the building hosting the tide gauge and the stilling well (528c). Mean high and low waters are indicated by “höchster Wasserstand” and “kleinste Ebbe”, respectively. The figures are adapted from von Chiolich-Löwensberg (1865, 1866).
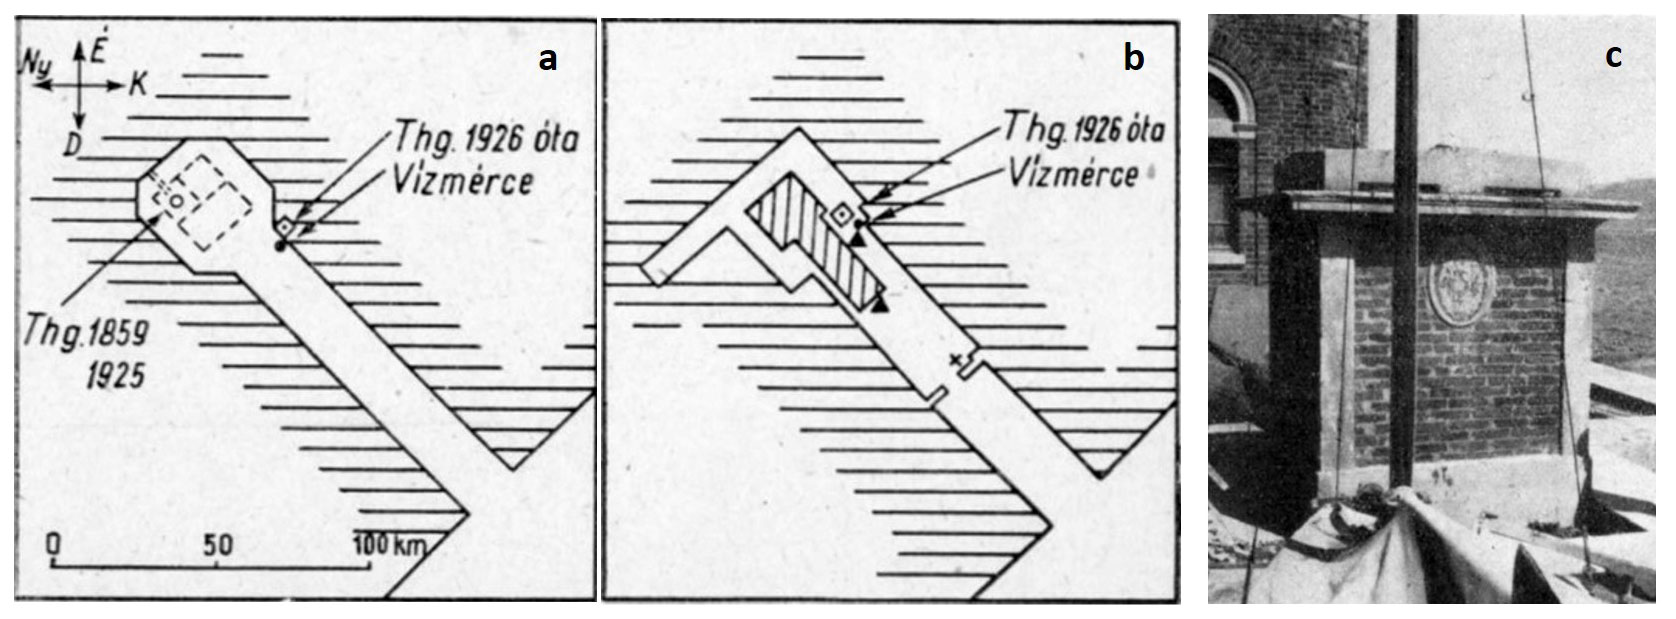
Figure 3(a) Map of Molo Sartorio before and (b) after the construction works of 1925–1926. (c) Image of the new tide-gauge hut probably in the early 1930s. “Thg. 1859 1925” (“Tide gauge 1859 1925”) indicates the position of the old tide gauge (a) and “Thg. 1926 óta” (“Tide gauge from 1926”) that of the new tide-gauge hut (a, b). “Vízmérce” indicates the hydrometer (a, b). North is upwards. Adapted from Bendefy (1958), who credited the photograph to Silvio Polli (Geophysical Institute of Trieste). (Note: the scale unit in panel (a) should be “m”.)
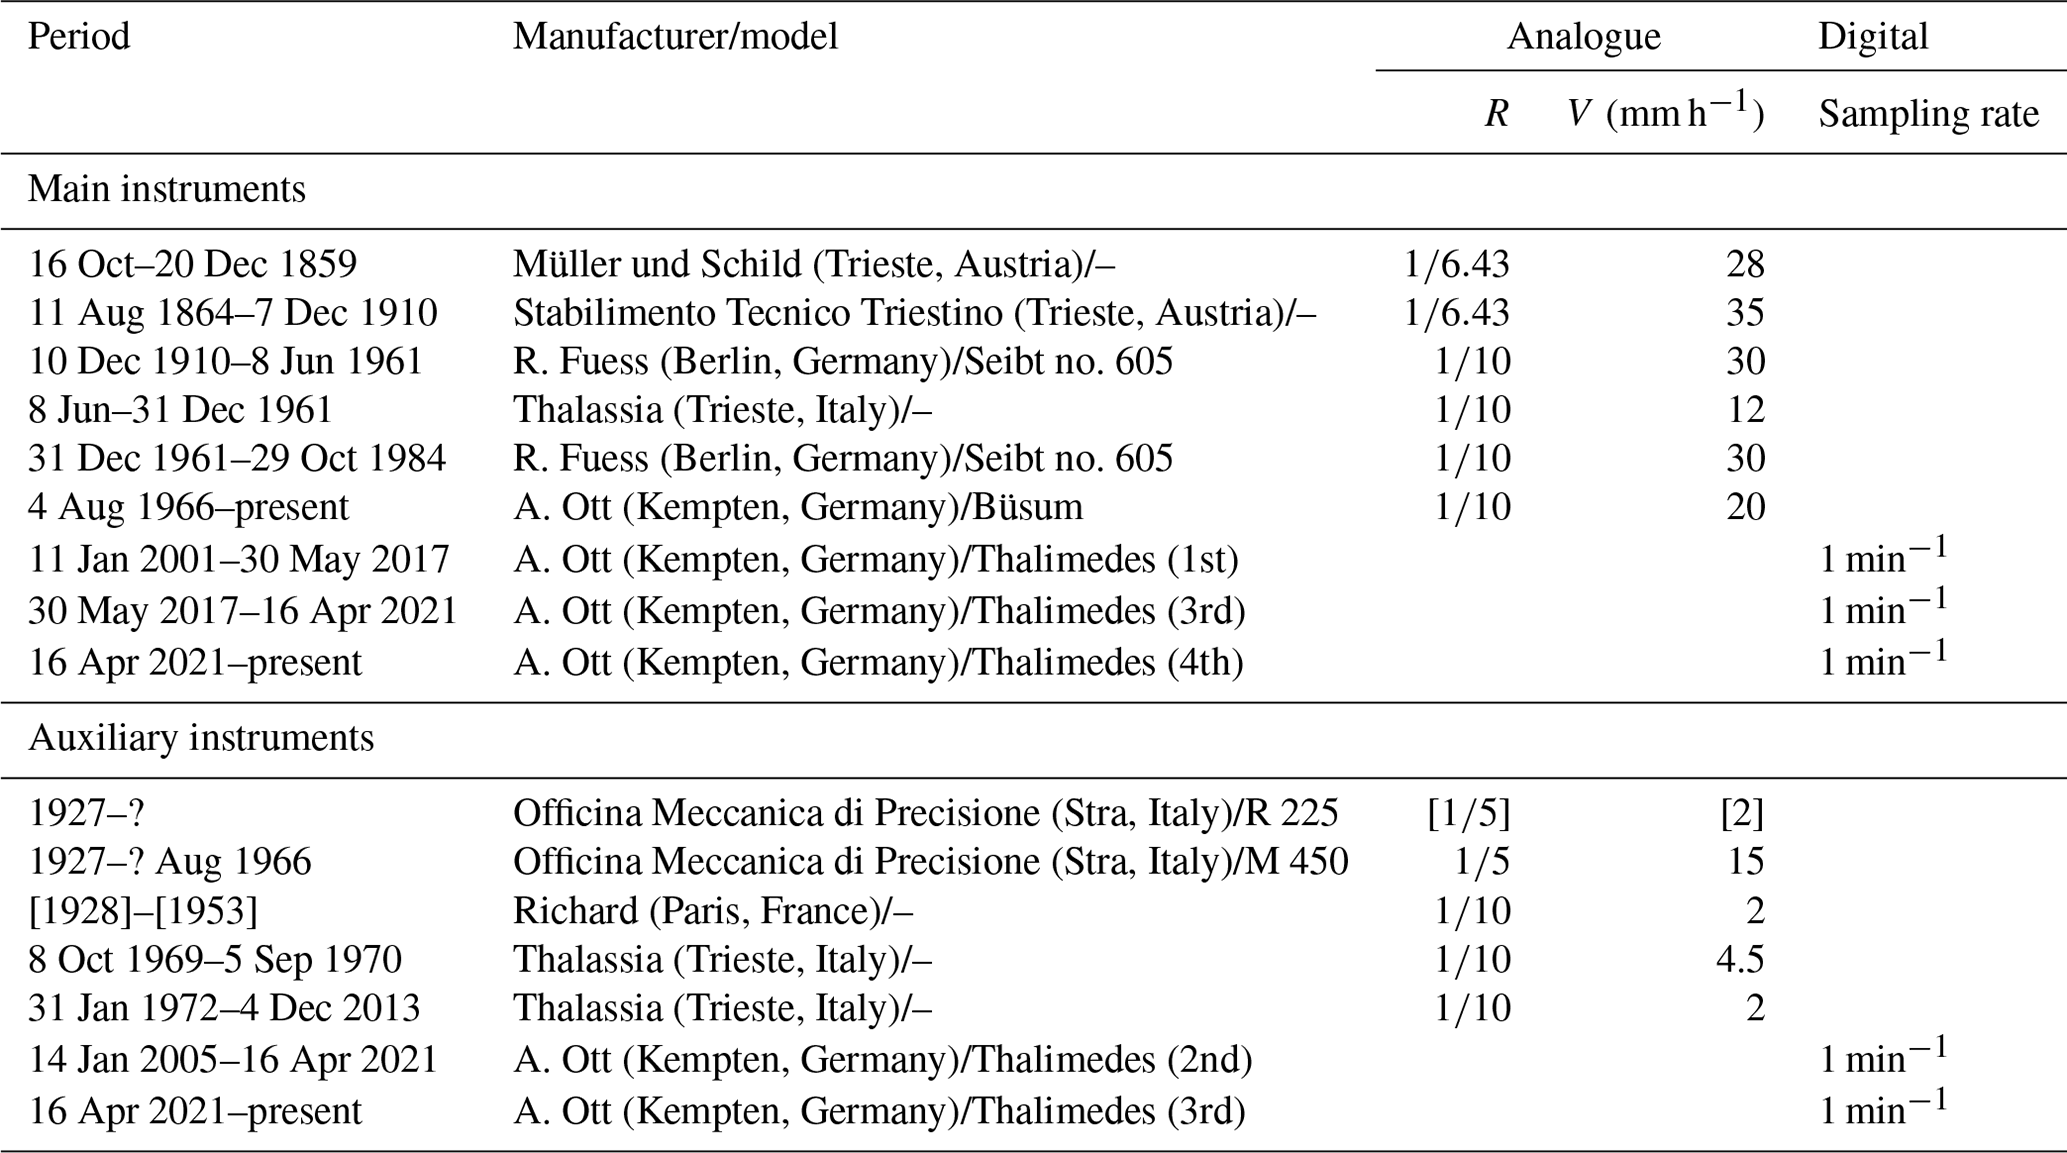
Table 1Instruments used in the tide-gauge station and sources of their technical characteristics. R is the reduction ratio; V is the paper speed. A dash (–) indicates that the model is unknown. The information in square brackets is uncertain.
The systematic observation of sea level started on 16 October 1859, when the first self-recording float tide gauge became operational (Table 1). It was provided with a stilling well opened in the floor of a room in the north-western corner of the Finance Guard building, at the end of Molo Sartorio (Schaub, 1860). Figure 2 displays the tide gauge, seen from the front and from above, and a vertical section of the stilling well, which was connected to the open sea by a siphon (von Chiolich-Löwensberg, 1865, 1866). Around 1860 a vertical tube with a hydrometric scale was fixed to the north-eastern side of the pier to carry out direct sea level measurements for calibration (MGI, 1897).
That setting remained unchanged until 29 November 1924, when the observations were interrupted because the building that hosted the tide gauge was completely restructured. Unfortunately, no temporary tide gauge was put in operation in the meantime, and the observations were resumed on 30 June 1926 in a new tide-gauge hut, built on the same pier approximately 30 m to the east of the previous installation (Fig. 3). The station was provided with a stilling well which communicated with the sea through a 40 cm-long pipe. Since then, the hydrometric tube could be accessed through the floor of the new tide-gauge hut. It still exists, although is it impossible to say whether it is the original one; however, it is no longer used as the calibration measurements are made in the stilling well.
In 1961 the hut was enlarged and a new stilling well was built (Picotti, 1960); this is the present installation. Figure 4 shows the tide-gauge hut in 2001 and four tide gauges, three of which were operational at that time.
Table 1 summarizes the instruments used since 1869 and their main technical characteristics; all the tide gauges are float instruments. The instruments with chart speeds greater than 10 mm h−1 have a 24 h rotation drum, the others a 7 d drum. Unfortunately, little original documentation exists, and the literature is often confusing; therefore, the table was compiled solving contradictions as far as possible. The date of the instrument change between 1859 and 1864 is unknown.
During its long history, the tide gauge has been managed by several organizations, namely the Central Maritime Government (Central Seebehörde/Governo Centrale Marittimo) from 1859 to 1919, the Royal Geophysical Institute (Regio Istituto Geofisico) from 1919 to 1941, the National Research Council of Italy (Consiglio Nazionale delle Ricerche) from 1941 to 1945, the Ministry of Agriculture and Forestry (Ministero dell'Agricoltura e Foreste) from 1945 to 1985, and, again, the National Research Council of Italy from 1985 onwards. These changes are reflected in the complex situations of tide-gauge zeros and benchmarks that are described below.
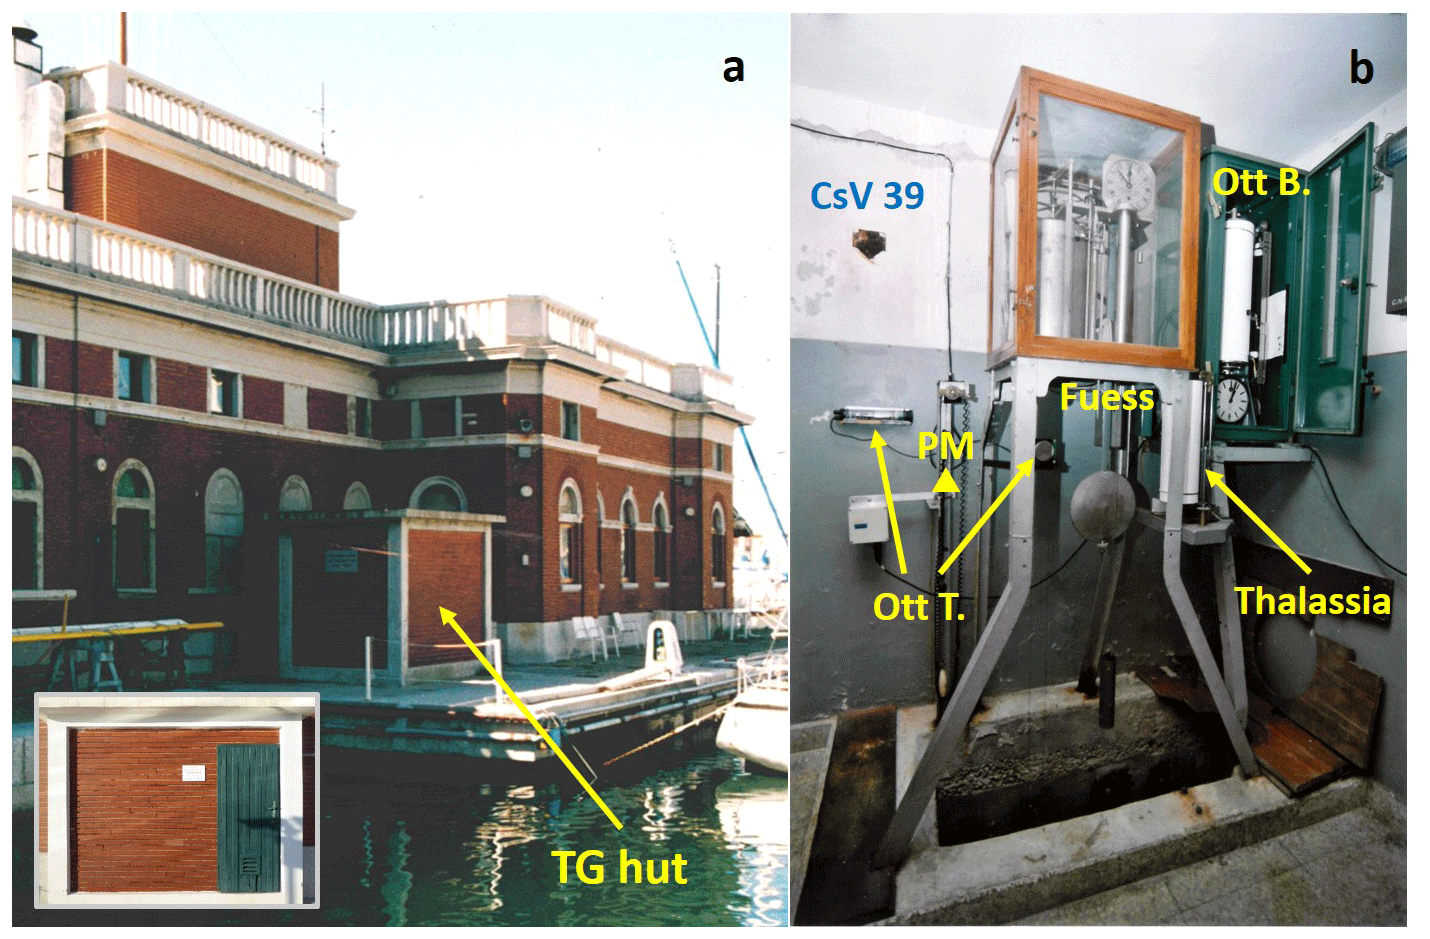
Figure 4(a) The tide-gauge hut in 2001; since 2004, only the wall indicated by the arrow has been visible (see the inset), because the hut is enclosed in the main building, which was enlarged. (b) The inside of the tide-gauge hut in 2001. Four instruments are shown: Ott Thalimedes (1st) (Ott T.), Ott Büsum (Ott B.), Thalassia, and Fuess. PM is the tide-gauge contact point (TG CP), and CsV 39 is a vertical benchmark no longer present. (Photographs by CNR-ISMAR, Trieste.)
2.2 The tide-gauge zeros
Until 7 December 1910 at 17:00, the tide-gauge zero corresponded to the top edge of the hydrometric scale, which was also known as “the pier edge”, “the zero line of the hydrometer”, or simply “Molo Sartorio”. It coincided with benchmark (Höhenmarke, HM) HM 39 of the Austrian Military-Geographic Institute (k. u. k. Militär-geographisch Institut, MGI). The positive versus of the hydrometric scale was downwards (e.g. von Sterneck, 1905). This zero was named the “zero point of Molo Sartorio” for the first time by Anonymous (ca. 1910), and it has generally been known as “Zero Molo Sartorio” (ZMS) starting from Polli (1938).
From 7 December 1910 at 18:00 to 10 December 1910 at 08:00, a temporary zero was defined at 1.64 m below ZMS; the positive versus remained downwards (Osservatorio Marittimo, 1910). On 10 December 1910 at 19:00 a new zero was adopted at 2.16 m below ZMS, corresponding to the lowest height recorded since an unknown date to 1910, namely on 15 January 1907 at 16:00; it was known as “Zero Hopfner” (ZH) (Hopfner, 1913). Since then the positive versus has been upwards.
The zero was changed again probably in August 1919. It was set to 1.50 m below the mean sea level of 1911, also known as the “Hopfner mean sea level”, namely 1.123 m above ZH. The zero introduced in 1919 was named “Zero Istituto Talassografico” (ZIT) for the first time by Ferraro (1972) and is the present zero. It corresponds to 2.537 m below the ZMS.
Figure 5 summarizes the scheme of the tide-gauge zeros and the relationships with the tide-gauge contact point (CP) and benchmark (BM).

Figure 5The relationships between the tide-gauge zeros and their connections to the TG CP and benchmark (TG BM).
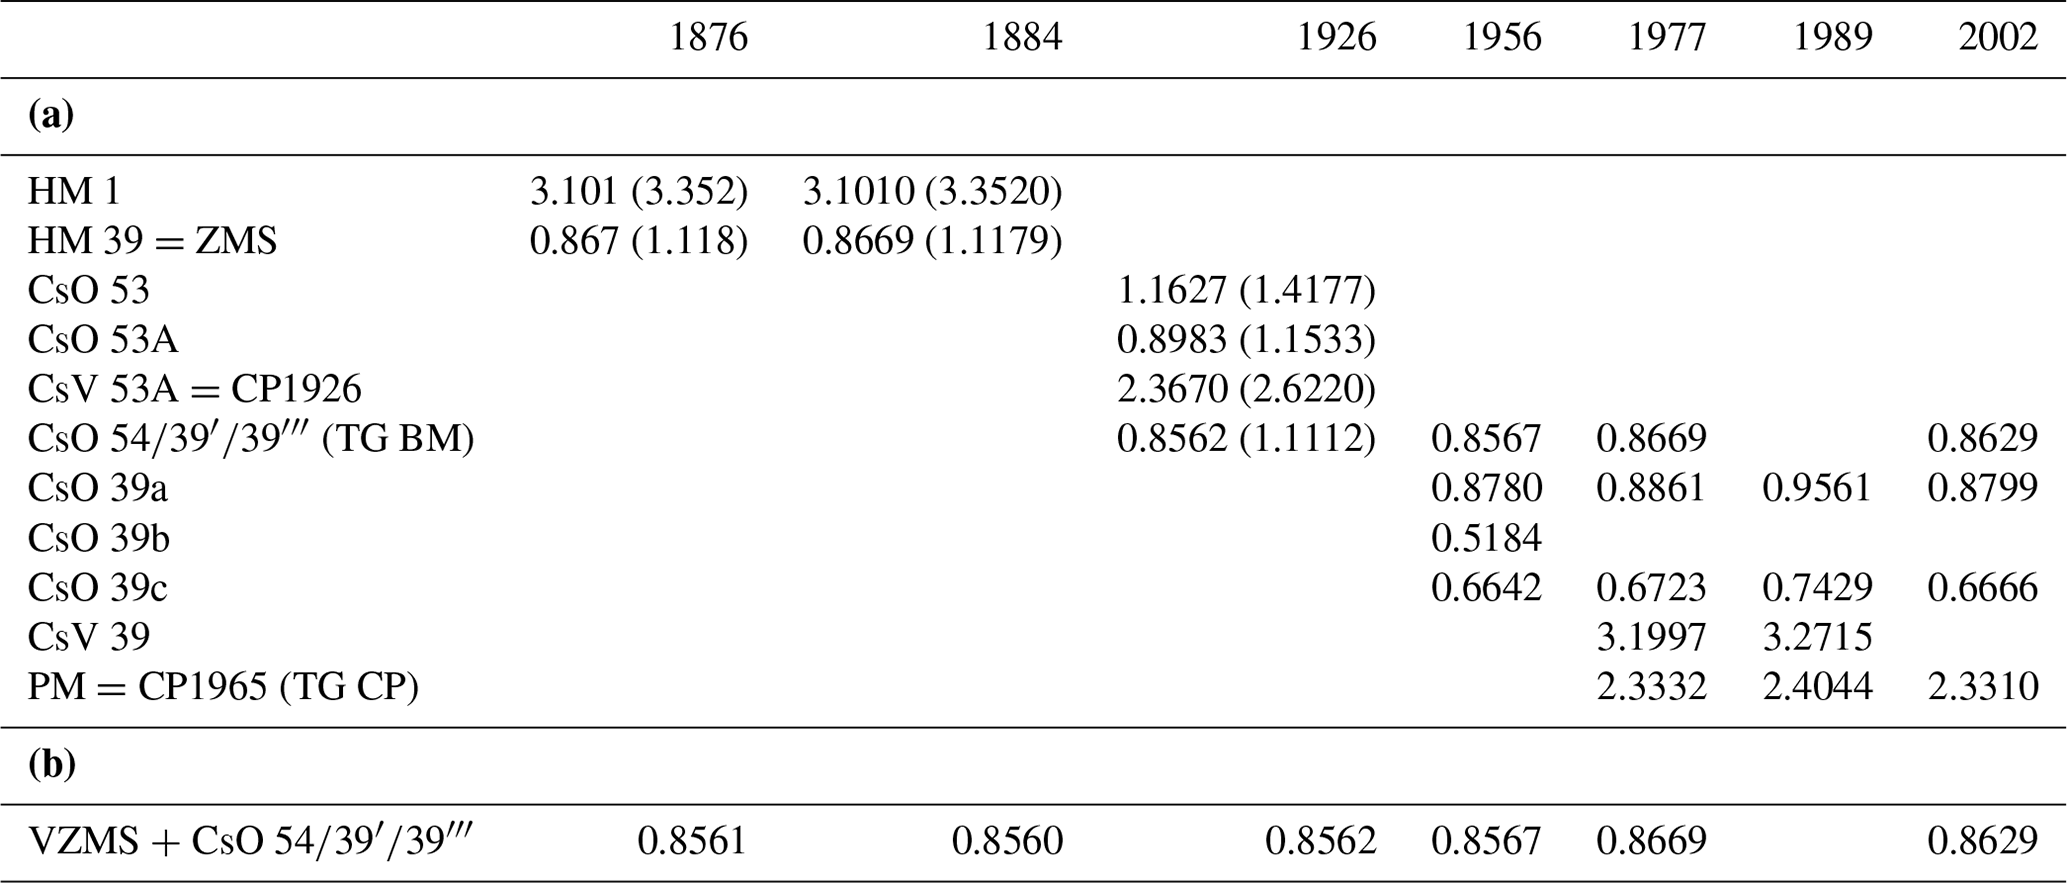
Table 2(a) Heights (m) of the benchmarks near the tide gauge at Molo Sartorio relative to IZ1942. The measurements in the original reference system, namely AZ1869 for 1876 and 1884 and IZ1894 for 1926, are reported in parentheses. (b) Composite time series of heights (m) of VZMS = ZMS − 0.0109 m and CsO 54/39′/39′′′ relative to IZ1942. TG BM is the tide-gauge benchmark, and TG CP is the tide-gauge contact point. See the text for other details on denominations and normalizations.
2.3 The benchmarks
2.3.1 The Austrian period
The two earliest surveys were performed by the MGI in 1876 and 1884 (MGI, 1885, 1896). Both involved the vertical benchmark in the tide-gauge room, identified as HM 1. The “absolute” height of HM 1, namely 3.352 m, was defined by adding 1.118 m, which was the mean sea level (MSL) relative to the tide-gauge zero, and 2.234 m, which was the height difference between HM 1 and HM 39 obtained in the levelling survey of 1876. The horizontal distance between HM 1 and HM 39 was 52 m along the levelling line (MGI, 1885, 1892). The MSL was probably relative to 1869. During a survey in 1884, HM 1 − HM 39 = 2.2341 m (MGI, 1896). The height of HM 1 was taken as the base of the levelling networks of the Austrian–Hungarian Empire and of several countries that became independent after its dissolution.
Note that MGI (1897), belonging to the same collection as MGI (1896), reports HM 1 − HM 39 = 2.224 m, because the adopted MSL was 1.128 m, measured in 1875. A levelling in 1904 gave HM 1 − HM 39 = 2.2347 m (von Sterneck, 1905), coherent with the value of 1876; von Sterneck himself stated explicitly that 2.224 m was wrong.
2.3.2 The Italian period
The first survey was performed in 1926, when the Italian Military Geographic Institute of Florence (Istituto Geografico Militare Italiano, IGMI) levelled the new benchmarks installed after the new (present) tide-gauge hut was built. On Molo Sartorio the levelling involved the vertical benchmark (caposaldo verticale, CsV) CsV 53A, the horizontal benchmarks (caposaldo orizzontale, CsO) CsO 53, CsO 53A, and CsO 54 and the tide-gauge CP (CP1926). The heights were referred to the zero of the IGMI defined on the basis of the MSL of 1884–1903 at Genoa (IZ1894). CsO 53 was connected with CsO 52, located 879 m away. Subsequently, the survey involved CsO/CsV 53A, 42 m away from CsO 53, and CsO 54, 26 m away from CsO 53A (IGMI, 1926). The ZMS was the only surviving Austrian benchmark, and its height was connected to the others in 1927 (Spinello, 1927).
The IGMI carried out another survey in 1956 involving CsO 39 and CsO 39′; the latter was the former CsO 54, which had been renamed. A new zero of the IGMI levelling network was adopted, based on the Genoa MSL of 1937–1946 (IZ1942) (Salvioni, 1957).
After the works on the tide-gauge hut in 1961, a new tide-gauge CP was installed in 1965 (CP1965), known as “Piastrina Mareografica” (PM), which is currently used for the direct calibration measurements.
Other levelling surveys were carried out by IGMI in 1977, involving CsO 39a, CsO 39c, CsV 39, CP1965 (IGMI, 1977), and CsO 39′ (Lama and Corsini, 2000), and in 1989, involving CsO 39a, CsO 39c, CsV 39, and CP1965 (Lama and Corsini, 2000). Both CsO 39 and CP1965 are 6 m away from CsO 39′ (formerly 54). CsV 39 is just above CP1965. The most recent survey dates back to 2002. It was required because new benchmarks were installed before the existing benchmarks became unusable due to the restoration works of the building near the tide-gauge hut. The levelling involved CsO 39a, CsO 39c, CsO 39′′′, which is the new name of CsO 39′, and CP1965 (IGMI, 2009).
2.3.3 Merging the benchmark heights
Overall, three national reference frameworks have been used to refer to the benchmark heights during the period of sea level observations, namely Austrian Zero AZ1869 and the two Italian zeros IZ1894 and IZ1942. In order to obtain a homogeneous time series of height data, the relationships between those zeros should be known. Unfortunately, it was not possible to find unambiguous information about them in the literature or in public archives. Therefore, they were estimated as explained in Appendix A.
Table 2a summarizes the original and normalized heights of the benchmarks on Molo Sartorio obtained during the national levelling surveys. The normalization was made using Eqs. (A16) and (A17). Moreover, a composite time series of benchmark heights relative to IZ1942 (Table 2b) was obtained by merging those of CsO for 1926–2002 with those for 1876–1884 relative to the virtual benchmark VZMS (Virtual Zero Molo Sartorio), defined as
Equation (1) is based on the height difference between ZMS and CsO 54 measured by the Hydrographic Office of the Water Magistrate of Venice (Ufficio Idrografico del Magistrato alle Acque, UIMA) in 1926 (Spinello, 1927) as well as the composite time series. Figure 6 displays the heights of the benchmarks involved in the composite time series in the respective reference systems.

Figure 6Heights of the benchmarks used to build the composite time series; the year of the survey is in brackets. The zeros of the levelling networks are shown: Austrian Zero of 1869 (AZ1869), Italian Zero of 1894 (IZ1894), and Italian Zero of 1942 (IZ1942). The differences between the zeros have been estimated as discussed in Appendix A.
The heights of 1977 are slightly higher than in 1956 and 2002, probably as an effect of the ground deformation induced by the earthquake of May 1976 in the Friuli region (Talamo et al., 1978), with the epicentre at about 90 km from Trieste and Mw=6.4 (Finetti et al., 1979). The heights of 1989 are anomalous, as they are about 7 cm higher than in both 1977 and 2002 for reasons that could not be discovered; they were not taken into account.
The linear trend of the composite time series of tide-gauge BM heights is 0.07 ± 0.06 mm yr−1, significant at p=0.02 and corresponding to a total height variation of +9 ± 7 mm from 1876 to 2002. If the height of 1977 is not included in the analysis, the trend becomes 0.05 ± 0.04 mm yr−1, significant at p=0.01 and corresponding to a total height variation of +6 ± 5 mm in 126 years. In this work the errors correspond to 5 % significance. The result is consistent with the known relative stability of Trieste compared to the other coastal areas of the northern Adriatic (Carbognin and Taroni, 1996; Carbognin et al., 2004).
The data from 1859 to 1904 could only be found in the literature, except for a few original charts covering about 10 d of August 1864 (CNA, 1864). The monthly and annual MSLs for 1875–1904 are also summarized and discussed in Raicich (2007).
From 1905 onwards the data could be retrieved from original documents, namely tabulations of hourly heights for 1905–1911 and 1913–1914 and charts from 1917 onwards. Polli (1938) stated that manuscript hourly heights from 1912 to March 1915 did exist and reported the monthly and annual means of 1912; the monthly and annual means of 1915 appeared for the first time in Polli (1970). Moreover, according to the Osservatorio Marittimo (1916, 1917), the observations were regularly carried out in 1916 too, but they are missing.
Polli (1947) provided annual means for 1890–1904, but the data source was not quoted, and it is unclear whether they came from observations or were estimated. Moreover, the values of 1901–1904 are different from those in von Sterneck (1905), who explicitly reported that he obtained the data from the Maritime Observatory (Osservatorio Marittimo). Therefore, we considered Polli's data suspect and discarded them.
3.1 The data since 1905
The complete time series of hourly data from 1905 to 2021 obtained in this work is included in the data set for 1869–2021 available in Raicich (2022). The data for 1905–1914 have been digitized from the original tabulations. Due to the absence of original charts for a direct check, only evident mistakes could be corrected. The hourly heights from 1917 to 1938 have been digitized from the original charts; previously, only high waters (HWs) and low waters (LWs) were available. The hourly data from 1939 onwards, which were already available, have also been thoroughly revised.
In principle, the hourly heights are “instantaneous”; that is, the curves were not filtered before digitization. However, in the case of oscillations of periods shorter than approximately 10–15 min, the persons in charge of data digitization used to smooth the curve graphically and digitize the smoothed values.
Gaps no longer than 24 h were filled by interpolation according to UNESCO/IOC (1994, 2020b), which uses linear interpolation of the residual sea level, obtained after subtraction of the astronomical tide from the observations. In the case of failure of the main tide gauge, the sea level heights were generally taken from the charts of auxiliary instruments characterized by a 7 d rotation drum, such as the R 225 and the Richard (Table 1). This allowed one to digitize the HWs and LWs but made it difficult to extract the hourly values, which, in fact, were not usually reported. In such cases, we obtained the hourly values by means of cubic spline interpolation of the HW and LW data. In order to treat the HWs and LWs as true local extremes, two auxiliary data were introduced, 1 min before and 1 min after each extreme, respectively; they are 1 mm lower/higher than the corresponding HW/LW. This procedure ensures that the estimated values do not overshoot/undershoot the observed local extremes. We stress that interpolation aims at obtaining reasonable hourly values for the estimate of daily MSL and the subsequent calculation of monthly and annual means, not at estimating the missing data.
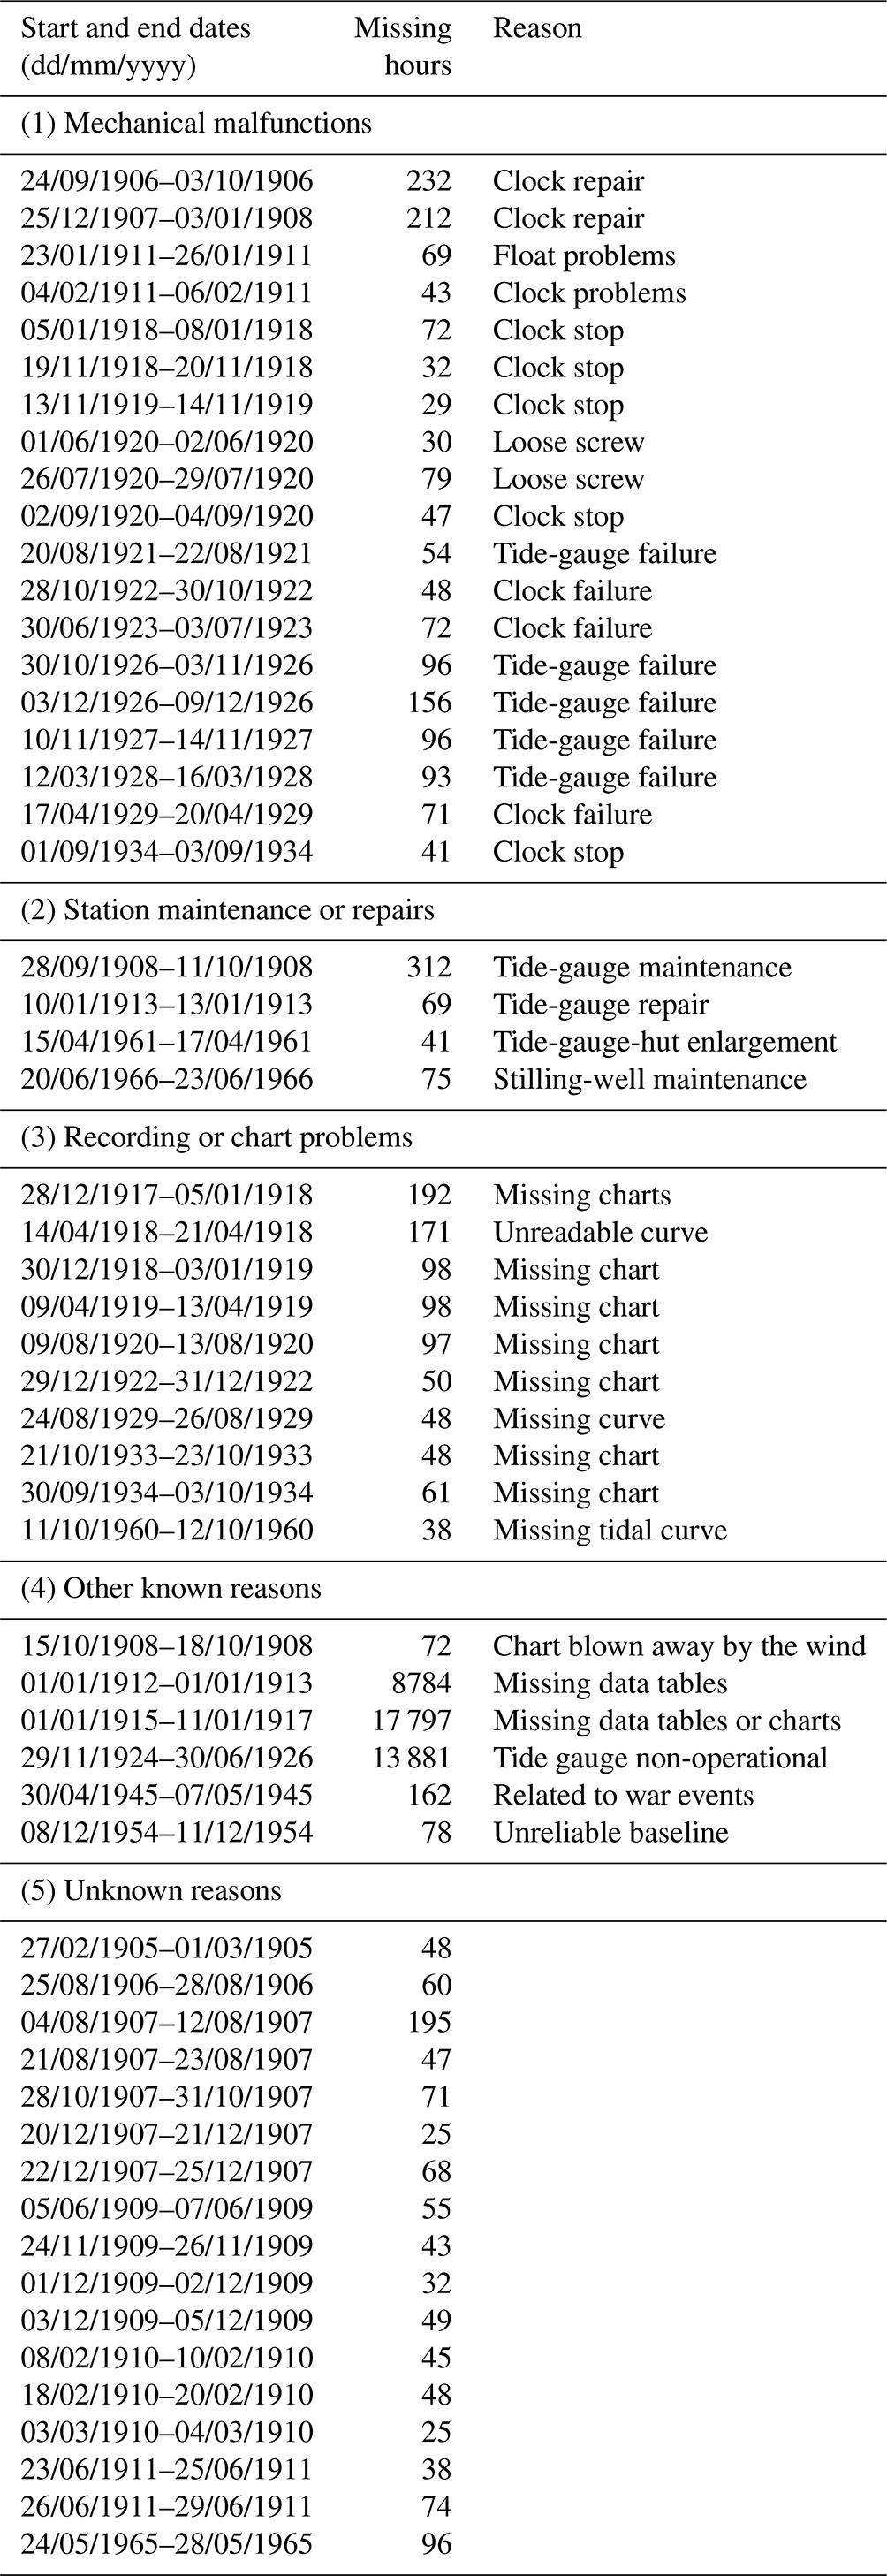
The only major gaps are in 1912 and 1915–1916, due to missing observations as explained above, and from 29 November 1924 to 30 June 1926, when the tide gauge was dismantled and reinstalled in the new hut. The other gaps that occurred for different reasons and that could not be filled are summarized in Appendix B.
From 1905 to 2021, except for the December 1924–June 1926 period in which the tide gauge was not operational, 1 011 736 hourly values are potentially available. The number of those estimated by interpolation is 3531, corresponding to 0.3 %, while 30883, i.e. 3.1 %, are missing. At least one auxiliary tide gauge became available in 1927 (Table 1), and this has allowed one to reduce the missing hourly data to 0.1 % since then.
From the hourly data, daily MSLs were estimated by means of a Doodson X0 filter. Monthly MSLs were computed when at least 50 % of the daily values were available. As a result, the monthly MSL could not be determined for the following months: January–December 1912, January 1915–December 1916, and December 1924–June 1926. Annual (calendar) MSLs were computed with at least 11 monthly means: therefore, they could not be determined for 1912, 1915–1916, 1925, and 1926. For 1912 and 1915, we adopted the monthly and annual MSLs available from the literature (Polli, 1938, 1970).
3.2 The assessment of errors
It is not easy to associate errors with the hourly heights digitized from charts: therefore, we only aim at estimating representative values.
Because the sea level height is defined on the basis of the vertical distance between the tidal curve and a baseline drawn on the chart, we must take into account the accuracies of the positions of those lines. The baseline of the Fuess–Seibt tide gauge charts was identified by a horizontal line drawn a posteriori 8 mm above the bottom edge of the chart. The Ott-Büsum tide gauge provided both the tidal curve and the baseline. At least before June 1961 the curve of Fuess–Seibt was originally marked by a metal tip on special coated paper. The curve was very thin and often faint: therefore, the persons in charge of data digitization used to trace it with a coloured pencil or ink; that practice might have introduced errors, but it made it possible to distinguish each day in case of overlapping curves, as the paper was generally changed every 2 or 3 d. In any case, the line thickness of each line is about 0.5 mm. As the reduction ratio is , it is realistic to associate a 1 cm accuracy with the individual digitized heights. We also recall that, because the charts before 1917 are not available, we could not verify the accuracy of the 1905–1914 data.
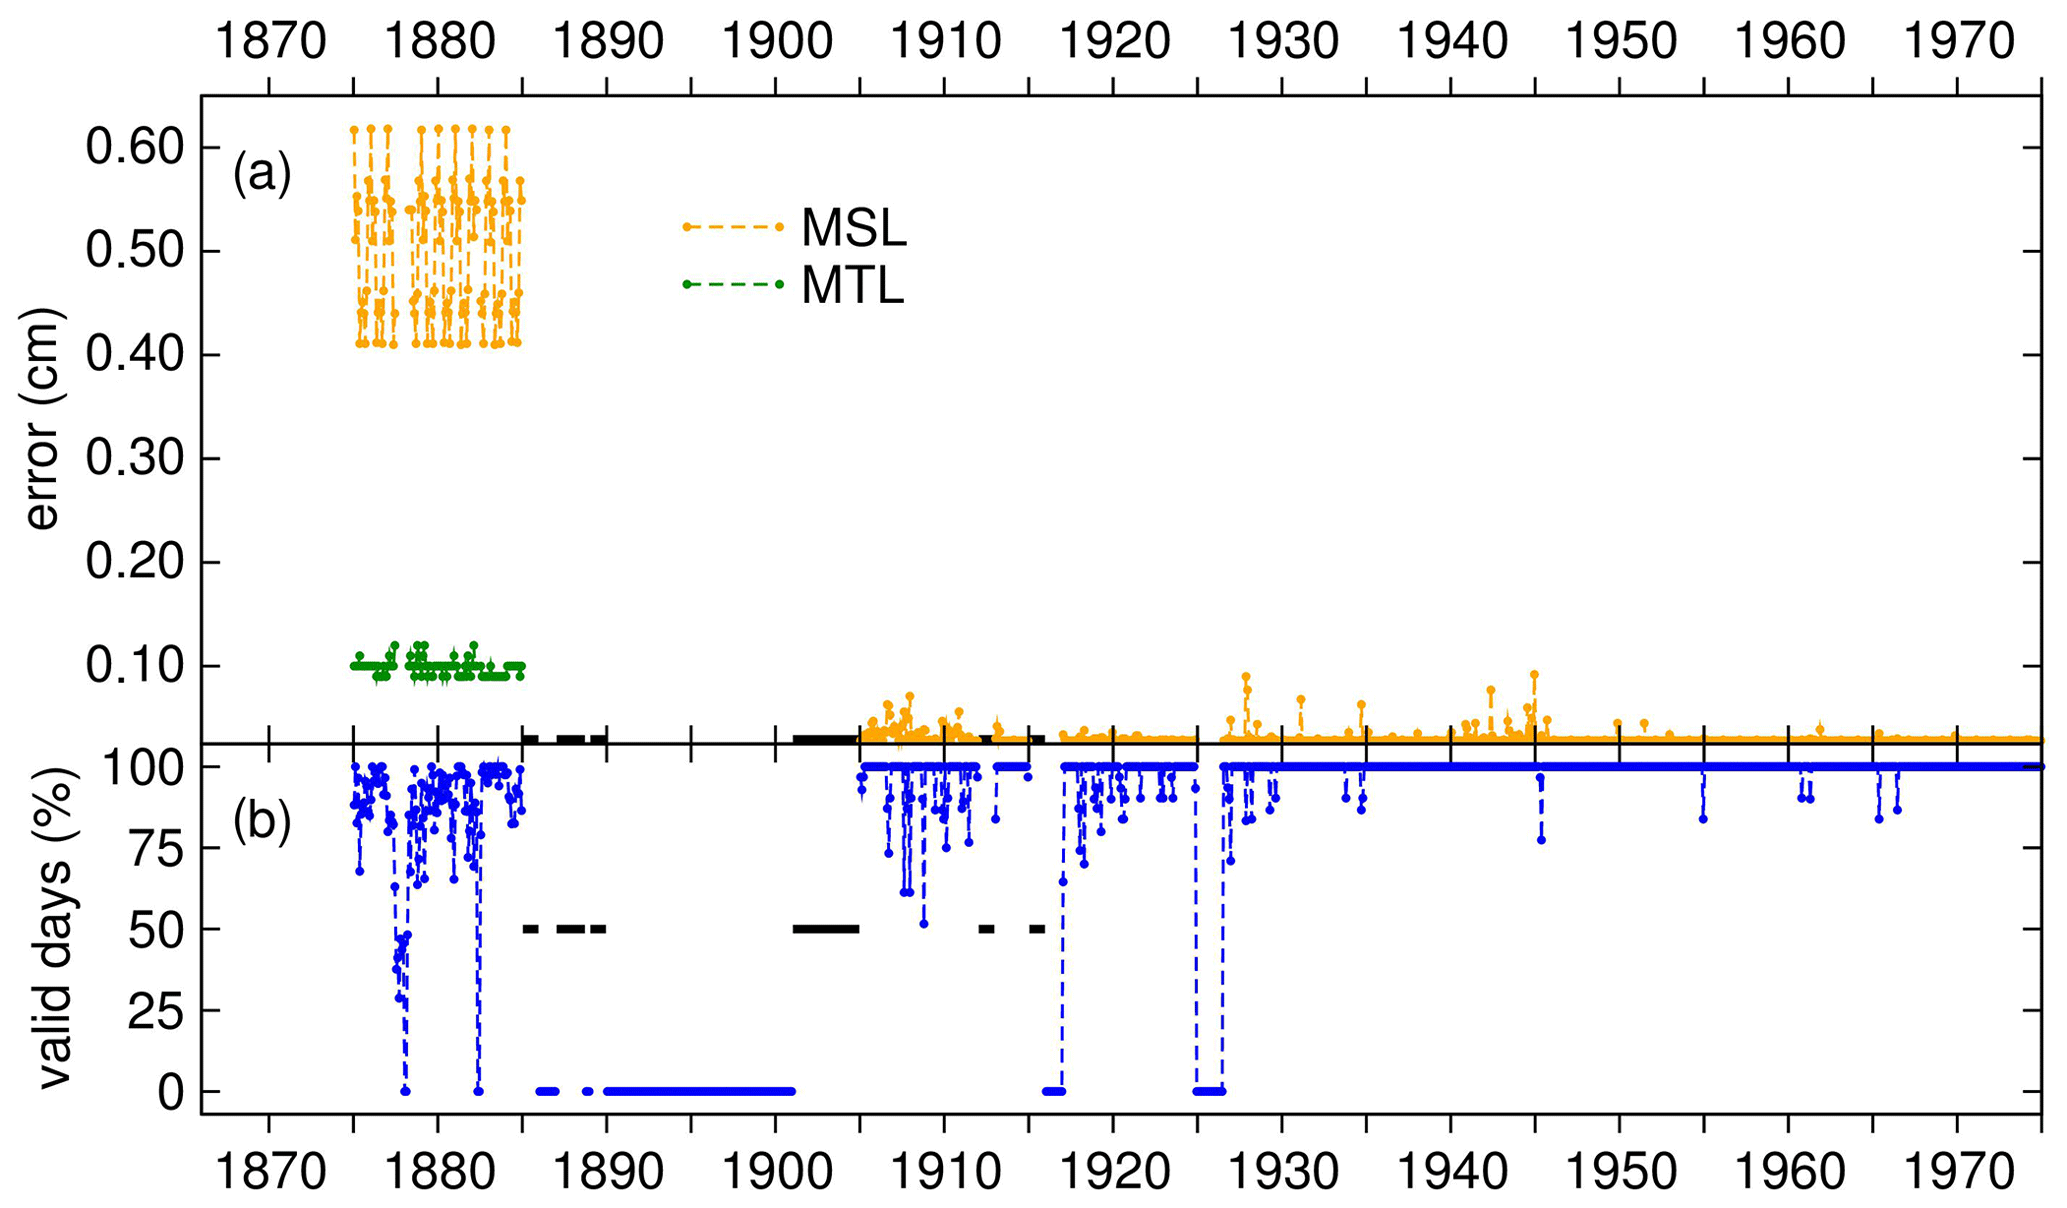
Figure 7(a) Monthly errors (cm) for 1875–1975; both the errors in MTL and MSL are shown for 1875–1889. (b) Monthly percentages of valid days for 1875–1975. After 1975 the error is always 0.03 cm, and there are no missing days. The black segments indicate that the errors and percentages of valid days are unknown. The labels on the abscissa axis refer to the beginning of the year.
The uncertainty associated with the interpolation of gaps using cubic splines was assessed empirically as follows. As HW and LW data are available for 1917–2021, we estimated a time series of hourly heights for that period using cubic splines (as in Sect. 3.1). The root-mean-square difference between estimated and observed hourly values is about 5 cm, which was assumed to be the representative uncertainty in the individual hourly height estimated with splines. The uncertainty related to the interpolation based on de-tided residuals is more difficult to assess, because the procedure is intrinsically more complex, as it involves the estimate of the astronomical tide, the subtraction from the observations, and the interpolation on a specific time interval. Because we only aim at representative errors, in this case we also assumed a 5 cm uncertainty in the individual estimated hourly height. The errors on the daily, monthly, and annual MSLs were estimated on the basis of the actual number of interpolated hourly data involved.
As a result, the daily MSL is affected by an error between 0.15 cm (no interpolated hourly data) and 0.77 cm (24 interpolated hourly data). Figure 7 displays the monthly errors and percentages of valid days until 1975; afterwards, there are no missing data. With regard to the 1905–2021 period, the MSL of a month with no missing days is affected by an error of 0.03 cm; the largest monthly error is 0.09 cm, due to missing days and/or daily means estimated from interpolated hourly values (Fig. 7a). The errors in annual MSLs are always 0.01 cm (to centimetre precision). It is reasonable to also adopt these errors for the monthly and annual MSLs of 1901–1904, 1912, and 1915, for which the numbers of valid days are unknown.
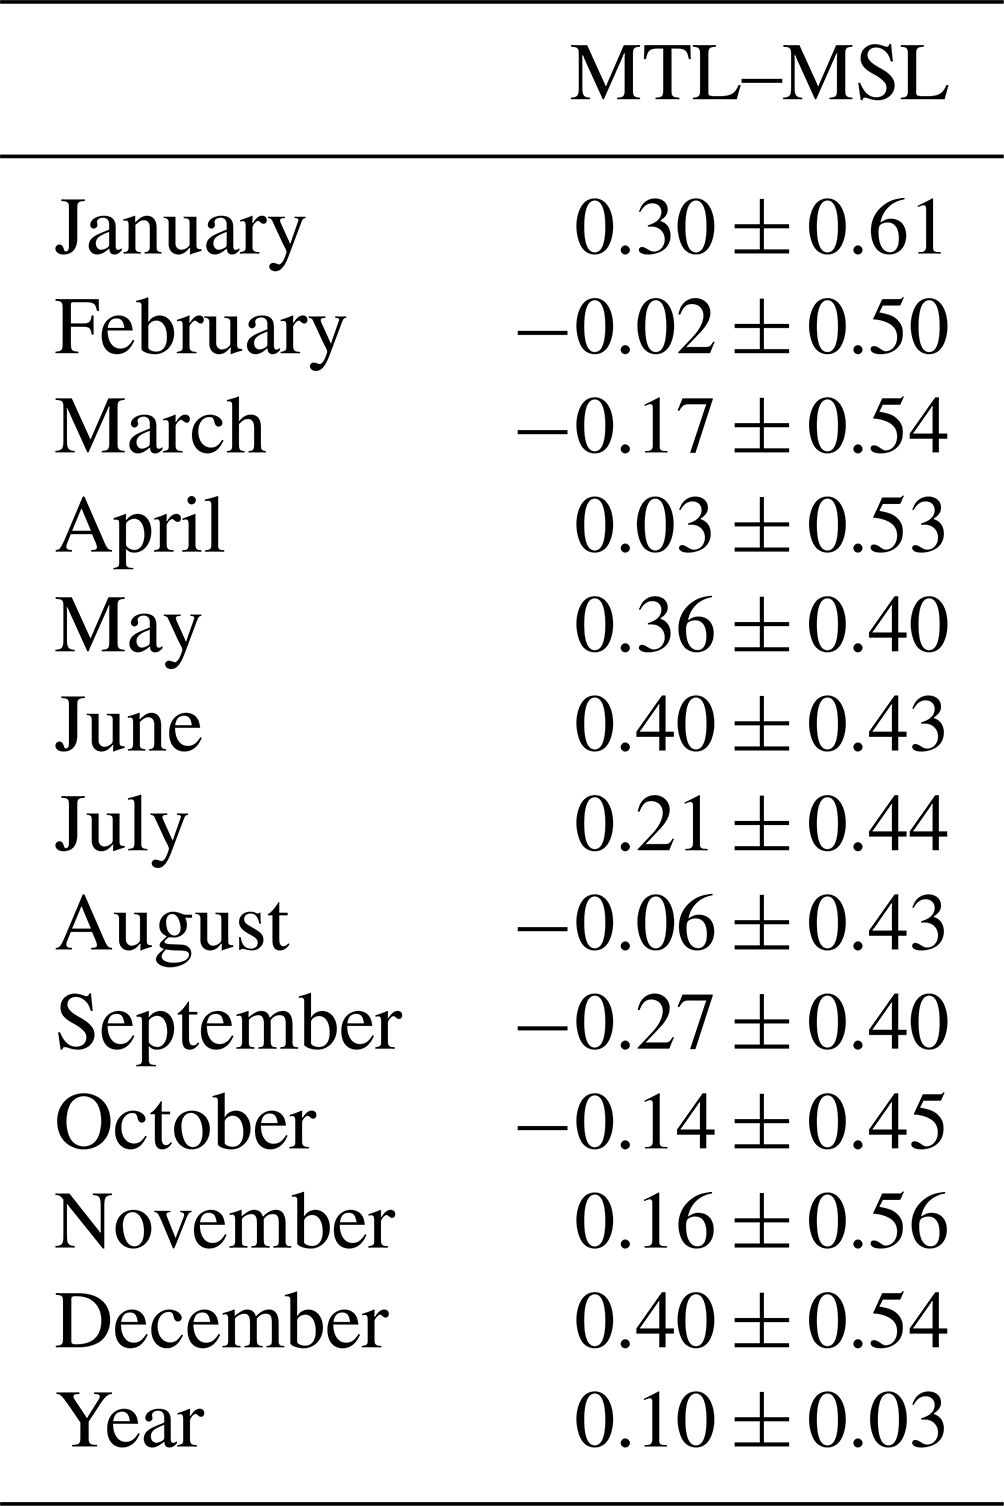
The original monthly means of the 1875–1889 period are mean tide levels (MTLs). MSLs were estimated using average monthly corrections obtained by comparing the MTLs and MSLs of 1917–2021 (Table 3), thanks to the availability of HWs and LWs during that period. The typical error in monthly MTLs is around 0.10 cm (between 0.09 and 0.11 cm), depending on data availability (Fig. 7b). The errors in the estimated monthly MSLs range approximately between 0.4 and 0.6 cm and are mostly determined by the error in the corrections (Fig. 7a). The errors in the annual MSLs for 1875–1884 are 0.14 cm, including the corrections from MTL to MSL (Table 3); this value is also representative of the error for 1885–1889.
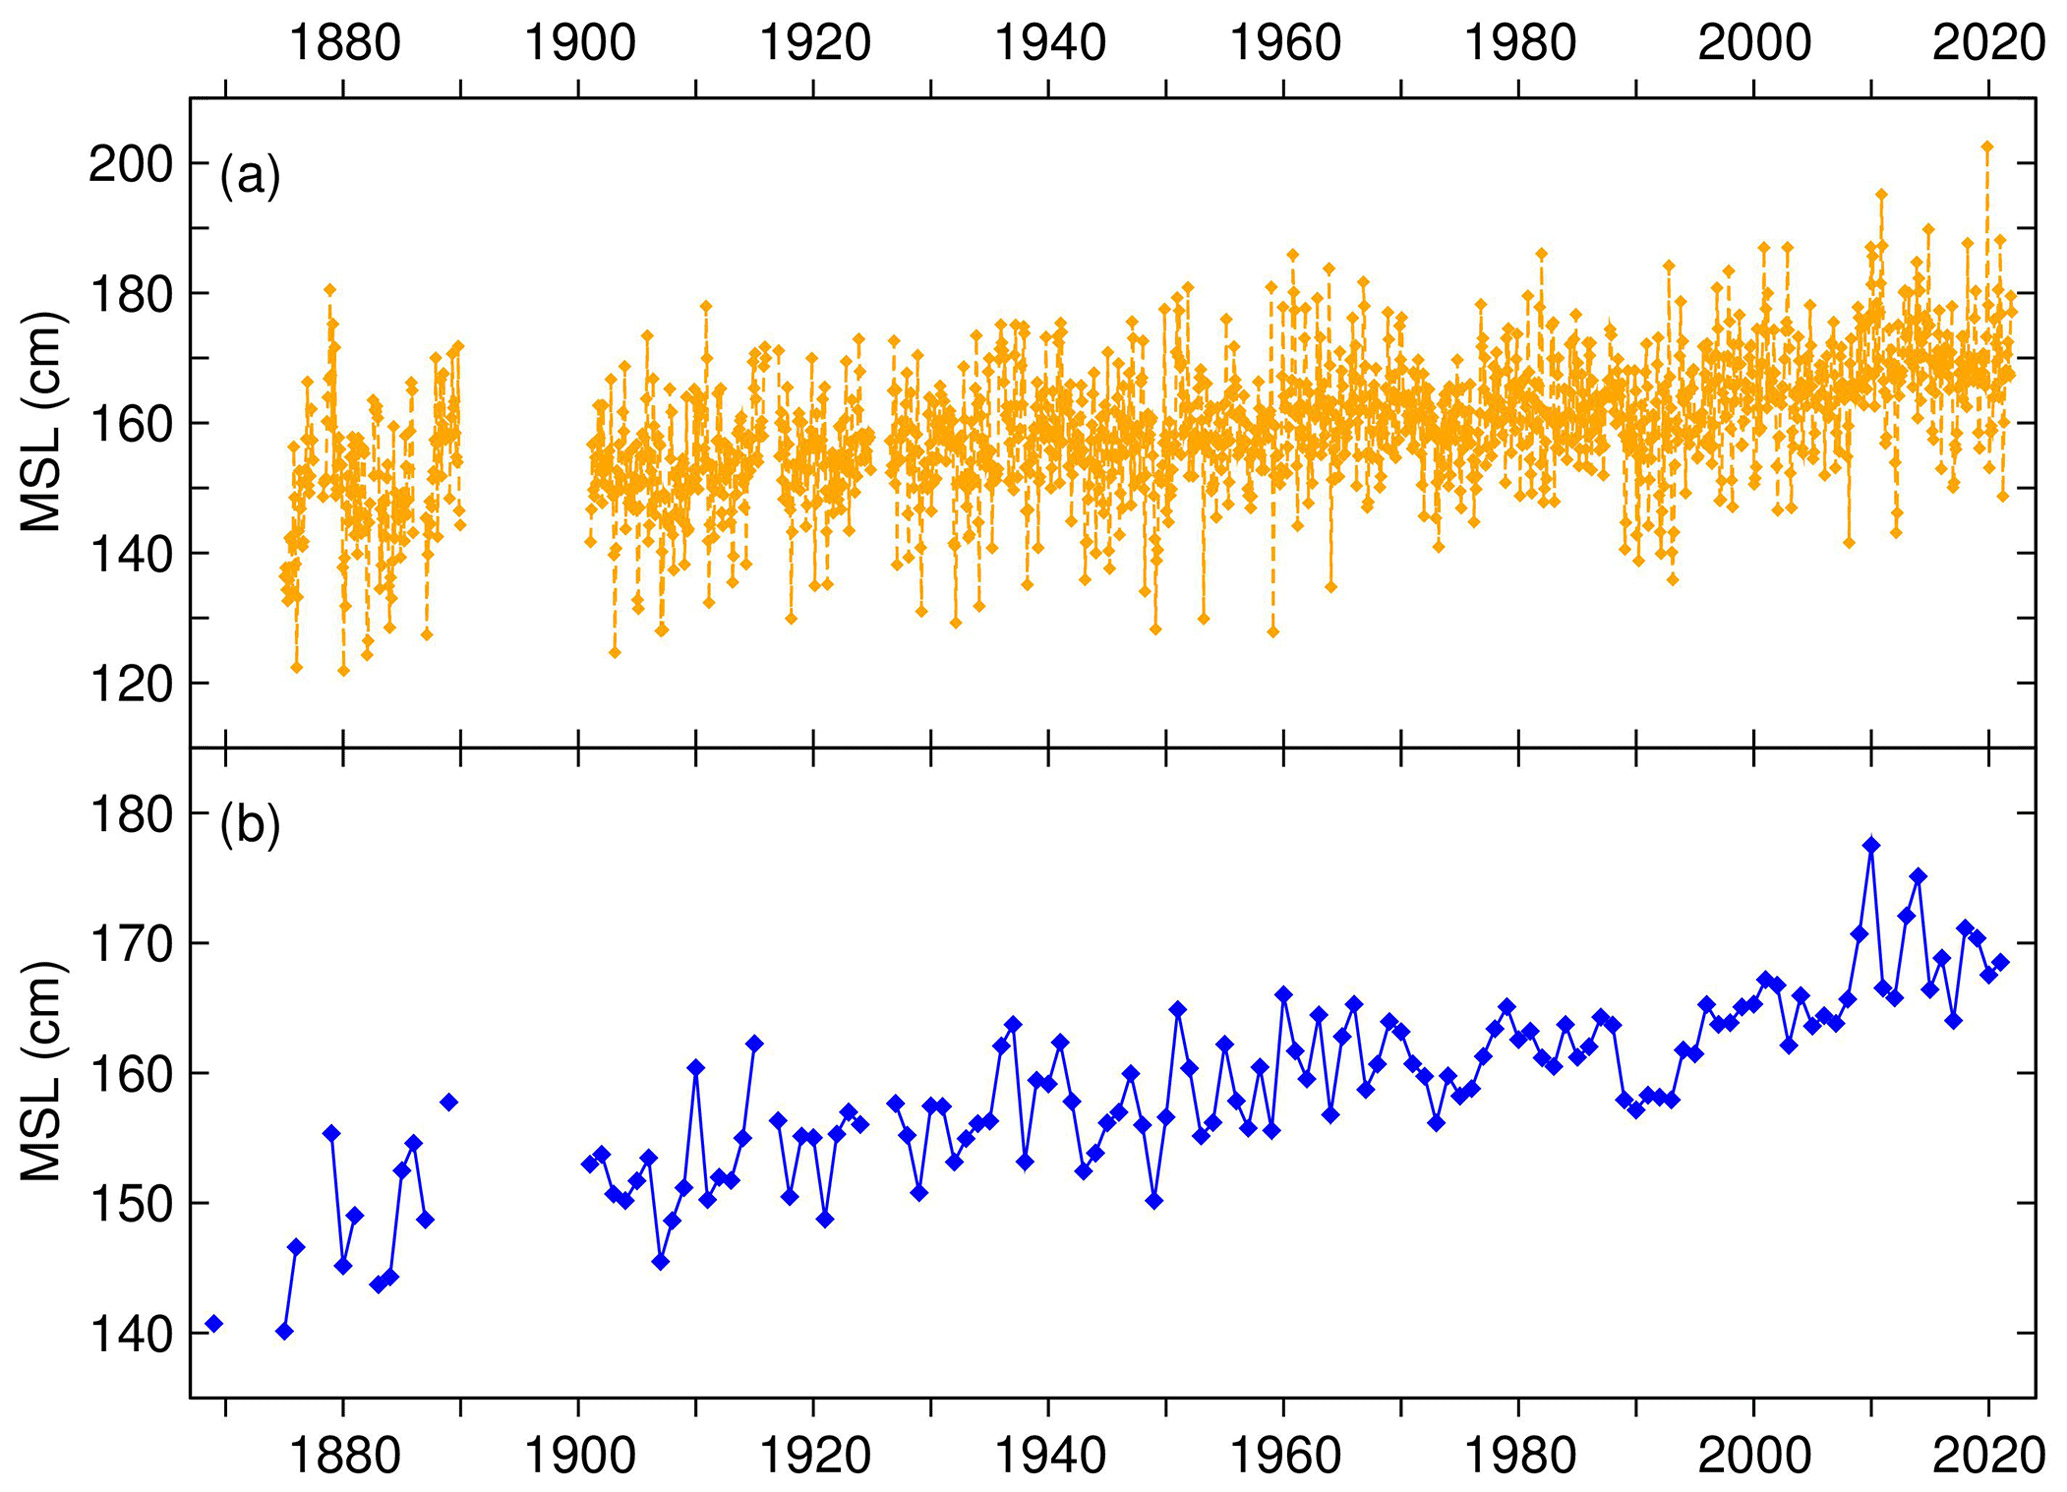
Figure 8(a) Monthly MSL and (b) annual MSL. The data are expressed in centimetres relative to the TG Zero (ZIT; see Fig. 5). The labels on the abscissa axis in panel (a) refer to the beginning of the year.
Figure 8 displays the time series of monthly MSL (a) and annual MSL (b) relative to ZIT.
The time series reflects the behaviour of sea level variability common to the Mediterranean Sea stations, coherent with the global sea level rise, except for a period of stability approximately between the 1960s and the early 1990s (Tsimplis and Baker, 2000; Marcos and Tsimplis, 2008; Gomis et al., 2012; Zerbini et al., 2017).
The digitization of the 1917–1938 hourly data and the revision of the whole time series mostly led to minor differences from the previously known monthly means, but there are some exceptions. Appendix C summarizes the main differences between the values obtained in this work and those in the PSMSL database used for reference. There is an issue with the annual mean of 1869. The MSL reported in Lorenz et al. (1873) corresponds to 1.407 m above ZIT, and this has been verified to be correct using the data therein. On the other hand, the MSL of 1869, used to define the zero of the Austrian levelling network, is 1.118 m below ZMS (MGI, 1885, 1892; see Sect. 2.3.1), i.e. 1.419 m above ZIT. The reason for the difference is unknown, but it could be in the conversion from the Viennese foot (the original unit) to the SI units and subsequent rounding or truncations.
In practice, the MSL in Lorenz et al. (1873) is homogenous with the rest of the sea level data that are referred to as ZIT, while the MSL in MGI (1885, 1892) represents the height of ZMS in the Austrian levelling reference system and is involved in the time series of the benchmark heights shown in Fig. 5. A problem might arise only if the two reference systems interacted with each other, which is not the case in this work.
The linear trend computed with all the annual MSLs from 1869 to 2021 (Fig. 8b) is 1.36 ± 0.17 mm yr−1. Taking into account only the period covered by hourly data (1905–2021), the trend is the same, namely 1.36 ± 0.19 mm yr−1. Note that in the fit the annual MSLs have been weighted with the inverse of the respective errors (see Sect. 3.2).
Among the factors that affect the sea level variability, there is the inverted barometer (IB), which consists of an inverse relationship between variations of atmospheric pressure and sea level. In equilibrium conditions, 1 hPa of atmospheric pressure increase approximately corresponds to 1 cm of sea level decrease, and vice versa. According to Raicich and Colucci (2021a), the atmospheric pressure at Trieste exhibits a significant linear trend during the last 150 years, namely 0.5 ± 0.2 hPa per century. The standard IB correction (−1 cm hPa−1) was applied to the MSL time series using the pressure data in Raicich and Colucci (2021b). As a result, for the IB-corrected MSL, we obtain linear trends of 1.45 ± 0.13 mm yr−1 for 1869–2021 and 1.46 ± 0.15 mm yr−1 for 1905–2021.
Table 3Average monthly and annual differences (cm) between MTL and MSL from 1917–2021 data.
The linear trends estimated here are slightly lower than the global value of 1.73 ± 0.44 mm yr−1 in Fox-Kemper et al. (2021) for 1901–2018 but are within the interval defined by the uncertainties.
The linear trends for 1993–2021, i.e. the period covered by satellite altimetry, are 3.03 ± 0.14 mm yr−1 (observed sea level) and 3.02 ± 0.11 mm yr−1 (IB-corrected sea level), which turn out to be slightly lower than the global value of 3.4 ± 0.4 mm yr−1 (https://sealevel.nasa.gov; Beckley et al., 2017, 2021) but consistent within the uncertainties.
The sea level acceleration was estimated as twice the coefficient of the quadratic term of the second-order polynomial fit. If the observed sea level is taken into account, for 1869–2021 the acceleration is 0.006 ± 0.005 mm yr−2 (p=0.23 significance), and for 1905–2021 it is 0.008 ± 0.006 mm yr−2 (p=0.22). From the IB-corrected sea level, the acceleration is 0.008 ± 0.004 mm yr−2 (p=0.05 significance) for 1869–2021 and 0.009 ± 0.005 mm yr−2 (p=0.06) for 1905–2021. These values are included in the range of (−0.002, +0.019) mm yr−2 relative to 1902–2010 adopted in Fox-Kemper et al. (2021).
To assess how the steady sea level period affects the trend and acceleration estimates, we analysed an IB-corrected time series from which the annual means from 1967 to 1995 were removed. As a result, the linear trends are 1.55 ± 0.14 mm yr−1 for 1869–2021 and 1.56 ± 0.16 mm yr−1 for 1905–2021, while the accelerations are 0.004 ± 0.005 mm yr−2 for 1869–2021 and 0.004 ± 0.0006 mm yr−2 for 1905–2021, respectively. In both cases accelerations are statistically not significant at p=0.05.
The hourly sea level data and the derived monthly and annual mean sea levels used in this work are available from SEANOE (https://doi.org/10.17882/62758, Raicich, 2022).
We have revised and updated the information about the sea level observations carried out at Trieste, Molo Sartorio, from 1869 to 2021, using the material in the archive of CNR, Institute of Marine Sciences (ISMAR), Trieste, and published and unpublished documents from other sources.
We could identify the tide gauges used for the observations, and we could recover the heights of the geodetic benchmarks on Molo Sartorio since the late 19th century.
The digitization of hourly data from 1905 to 1938 from the original tabulations or charts allowed one to extend the available time series from 1905 to 2021. The quality control provided information on data gaps, most of which were filled by interpolation in order to obtain reasonable daily sea level means and, consequently, compute reliable monthly and annual MSLs. The monthly and annual MSLs obtained from hourly data are affected by errors of 0.01 and 0.03 cm, respectively.
Monthly and annual MTL from 1869 to 1889 and MSLs for 1901–1904 were also available from the literature, although with gaps. Thanks to average monthly corrections (Table 3) the MTLs were normalized to MSLs, which allowed one to build monthly and annual MSL time series spanning 153 years. The linear trend of the 1869–2021 observed sea level is 1.36 ± 0.17 mm yr−1, that of the IB-corrected sea level is 1.45 ± 0.13 mm yr−1. The acceleration estimated from observed sea level is 0.006 ± 0.005 mm yr−2, and from IB-corrected data is 0.008 ± 0.004 mm yr−2. Both the linear trends and the acceleration are consistent with long-term global estimates Fox-Kemper et al. (2021).
The outcome of this sea level data archaeology work represents the most up-to-date data set of sea level observations and ancillary information relative to the tide-gauge station of Trieste, Molo Sartorio.
Let us recall the definitions: AZ1869 is the Austrian Zero based on the Trieste MSL of 1869, IZ1894 is the Italian Zero based on the Genoa MSL of 1884–1903, and IZ1942 is the Italian Zero based on the Genoa MSL of 1937–1946. The available relationships are the following.
Equations (A1.1) and (A4.2) were taken from Morelli (1950) and Equation (A1.2) from MGI (1892, 1896), Eq. (A2) from Hopfner (1913), Eq. (A3) from IGMI (1926), Eq. (A4.1) from Spinello (1927), Eq. (A5) from UIMA (1941), Eq. (A6) from Dorigo (1961), Eq. (A7) from IGMI (1967), and Eq. (A8) from Cavazzoni (1977).
ZMS is “Zero Molo Sartorio” and HMSL is “Hopfner MSL” (Sect. 2.2). CsO 54 and CsO 39′ represent the same benchmark, which was renamed (Sect. 2.3.2). CM1825 is the “Comune Marino” (CM) of 1825 in Venice; it is identified by the upper edge of the algae belt that forms on quays and approximately corresponds to the wetting caused by the combination of high tides and waves (Camuffo et al., 2017). The CM represented the local levelling reference plane until the late 19th century. ZMPS is “Zero Mareografico Punta Salute”, i.e. the MSL at Venice of 1884–1909, central year 1897, used as the tide-gauge datum since 1923.
A major ambiguity concerns Eqs. (A1.1) and (A1.2). The values represent the annual MSL measured downwards relative to ZMS, which was used to define the Austrian Zero. Unfortunately, the origin of the MSL values of 1.110 and 1.118 below ZMS is partly unclear. Equation (A1.1) was adopted by Morelli (1950), who quoted Lorenz et al. (1873) as the data source. Using Eqs. (A3) and (A4.1) too, Morelli estimated
Actually, the data in Lorenz et al. (1873) lead to a MSL of 1.130 m below ZMS. The difference could be explained by the conversion from the Viennese foot (the original unit) to the SI units and subsequent rounding or truncations. On the other hand, MGI (1885, 1892) reports values of 1.12 and 1.118 m, respectively, and MGI (1896) reports 1.1179 m as a result of subtracting 2.2341 m from 3.3520 m (Sect. 2.3.1). Here, Eq. (A1.2) was preferred because the MGI publications were considered official.
A lesser ambiguity concerns Eqs. (A4.1) and (A4.2). Equation (A4.1) was adopted here because the measurement was carried out shortly after the IGMI levelling of 1926 and because in 1949 it was rather difficult to access ZMS (Morelli, 1950).
The difference between AZ1869 and IZ1894 was computed from Eqs. (A1.2), (A3), and (A4.1):
Recalling that CsO 54 was renamed CsO 39′, the difference between IZ1942 and IZ1894 was computed from Eqs. (A3) and (A7):
As a consequence, from Eqs. (A10) and (A11),
Another approach is possible. By adding together Eqs. (A1.2), (A2), (A5), (A6), and (A8),
and, using Eq. (A10),
There is a 0.0006 m difference between Eqs. (A13) and (A12) and between Eqs. (A14) and (A11), but a 0.1 mm precision is unrealistic because only Eqs. (A3), (A4.1), and (A7) are results of levelling, while a MSL is involved in the other equations. Therefore, we adopted
where the value in Eq. (A16) is the average of those in Eqs. (A12) and (A13), and the value in Eq. (A17) is the average of those in Eqs. (A11) and (A14).
As explained in Sect. 3.1, the hourly data gaps up to 24 h were filled by interpolation to obtain reasonable daily mean sea levels. The gaps that could not be filled are summarized in Table B1, alongside the reasons that caused the observations to be missed. They were grouped into four categories: (1) mechanical malfunctions; (2) station maintenance or repairs; (3) recording or chart problems; (4) other known reasons; (5) unknown reasons.
Here we discuss how the updated monthly and annual time series differ from those available from the PSMSL database (https://www.psmsl.org/data/obtaining/stations/154.php, last access: 13 December 2022). The RLR datum of PSMSL is 9.4 m below the tide-gauge CP, corresponding to 5.407 m below ZIT.
The difference between the monthly MSLs of this work and those of the PSMSL database are shown in Fig. C1, where departures greater than 1 cm are also highlighted.
A difference common to all the monthly MSLs is related to the method of calculation. Here, first, daily MSLs have been estimated by applying a Doodson X0 filter to the hourly values, and then monthly values have been computed by averaging the daily MSLs. In the past the daily MSL was generally computed by averaging the hourly sea levels (the heights at 00:00 and 24:00 were given a weight of 0.5 and those from 01:00 to 23:00 a weight of 1).
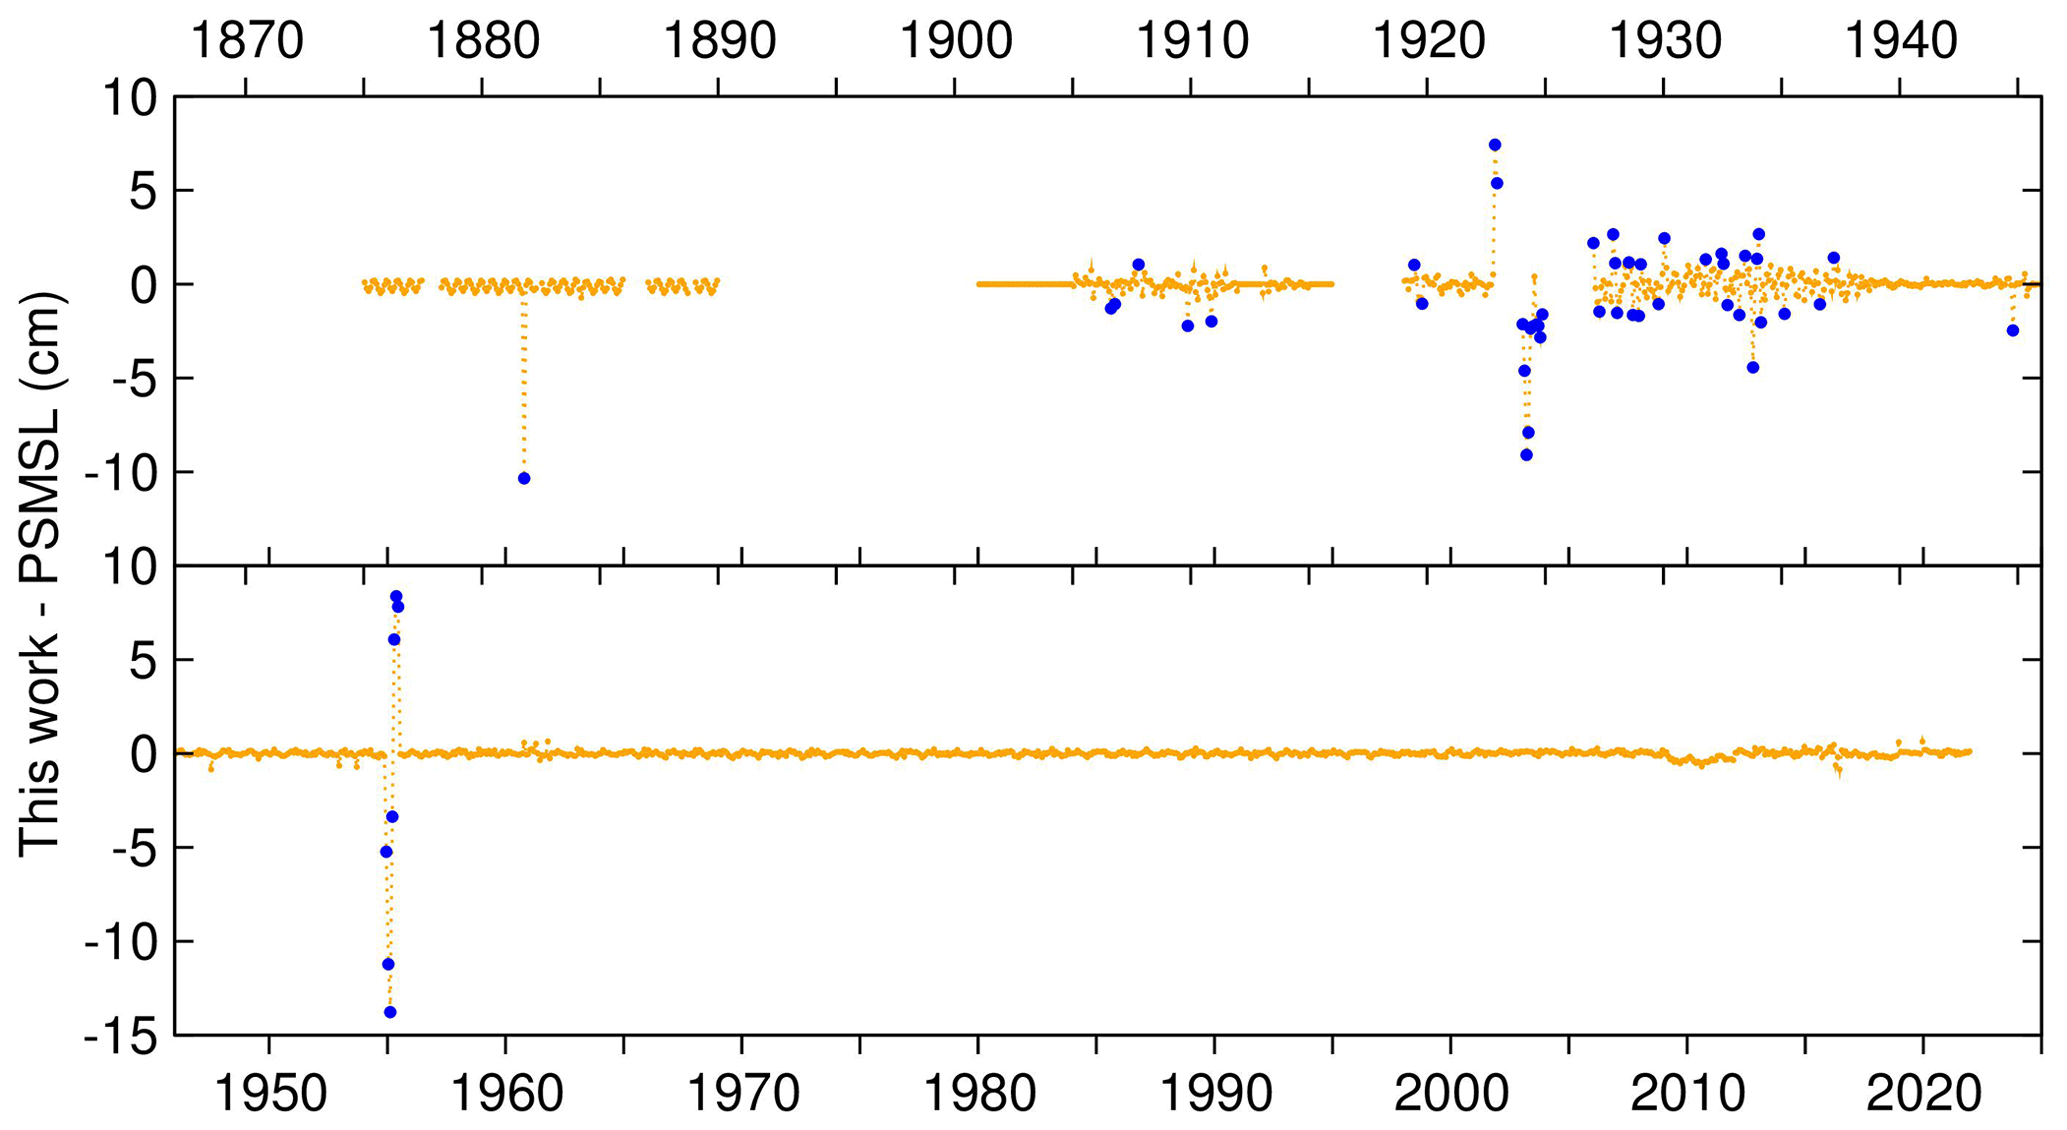
Figure C1Differences between the monthly MSLs obtained in this work and those in the PSMSL database (cm). The blue dots highlight differences greater than 1 cm in absolute value. The labels on the abscissa axes refer to the beginning of the year.
The main differences are the following.
-
The annual MSL for 1869 is reported for the first time.
-
The monthly MSLs for 1875–1889 are estimated using average monthly corrections (Table 3). By contrast, the data of PSMSL were estimated by subtracting 2 mm from the MTLs, regardless of the month. The original MTLs are confirmed here, with marginal differences due to rounding, except those of October 1881, which was found to be wrong in the original source (Governo Marittimo, 1877–1890), and March 1884, which was previously reported erroneously (Raicich, 2007).
-
The MSLs for 1905–1911 and 1913–1914 were revised. Besides the method of computing the MSL, differences come from the interpolation of gaps.
-
Monthly and annual MSLs are now available for 1917–1938, while, previously, they were only available for 1920–1922. The PSMSL database does not include the data for 1917, 1918, and 1923 and July–December 1926; instead, it includes December 1924, which does not exist.
-
The monthly MSLs of November–December 1922 and January–November 1924 were substantially corrected after revising the relationship between the zero level of the charts and the tide-gauge zero.
-
The same revision was done for December 1954–June 1955, which, according to the PSMSL, was anomalous compared to nearby stations. The corrected data were checked to be consistent with those of Venice Punta Salute (data from Battistin and Canestrelli, 2006), Falconera (UIMA, 1924–1925), and Porto Lignano (UIMA, 1956) (Fig. 1).
The author has declared that there are no competing interests.
Publisher's note: Copernicus Publications remains neutral with regard to jurisdictional claims in published maps and institutional affiliations.
The author thanks the Italian Military Geographic Institute of Florence for giving access to historical levelling data of benchmarks on Molo Sartorio.
The author is grateful for the work done by the previous staff of the Maritime Observatory, the Geophysical Institute, the Thalassographic Institute, and the Institute of Marine Sciences, who managed and maintained the tide gauge, carried out the observations, and processed and preserved the data used to build the sea level data set. The author would like to thank Massimo Iorio and Emilio Caterini, of the current staff of the Institute of Marine Sciences of CNR, and Renato R. Colucci, previously at the Institute of Marine Sciences and now at the Institute of Polar Sciences of CNR.
This paper was edited by Alessio Rovere and reviewed by Marta Marcos and one anonymous referee.
Anonymous: Tide gauge, schemes of zeros and benchmarks, CNR-ISMAR archive, Trieste, Italy, unpublished, ca 1910.
AOP: Publication Scientifique No. 5. Monthly and Annual Mean Heights of Sea-Level Up to and including the year 1936, Association d'Océanographie Physique, Union Géodésique et Géophysique Internationale, The University, Liverpool, UK, https://iapso-ocean.org/images/stories/pdf/IAPSO_publications/Publications_Scientifiques/Pub_Sci_No_5.pdf (last access: 13 December 2022), 1939.
Araújo, I. B., Bos, M. S., Bastos, L. C., and Cardoso, M. M.: Analysing the 100 year sea level record of Leixões, Portugal, J. Hydrol. 481, 76–84, https://doi.org/10.1016/j.jhydrol.2012.12.019, 2013.
Battistin, D., and Canestrelli, P.: La Serie Storica delle Maree a Venezia, Istituzione Centro Previsioni e Segnalazioni Maree, Venice, https://www.comune.venezia.it/sites/default/files/publicCPSM2/pubblicazioni/La_serie_storica_delle_maree_a_Venezia_1872-2004_web_ridotto.pdf (last access: 13 December 2022), 2006.
Becker, M., Zerbini, S., Baker, T., Bürki, B., Galanis, J, Garate, J., Georgiev, I., Kahle, H.-G., Kotzev, V., Lobazov, V., Marson, I., Negusini, M., Richter, B., Veis, G., and Yuzefovich, P.,: Assessment of height variations by GPS at Mediterranean and Black Sea coast tide gauges from the SELF projects, Global Planet. Change, 34, 5–35, https://doi.org/10.1016/S0921-8181(02)00103-0, 2002.
Beckley, B. D., Callahan, P. S., Hancock, D. W., Mitchum, G. T., and Ray, R. D.: On the “cal-mode” correction to TOPEX satellite altimetry and its effect on the global mean sea level time series, J. Geophys. Res.-Oceans, 122, 8371–8384, https://doi.org/10.1002/2017JC013090, 2017.
Beckley, B. D., Yang, X., Zelensky, N. P., Holmes, S. A., Lemoine, F. G., Ray, R. D., Mitchum, G. T., Desai, S., and Brown, S. T.: Global Mean Sea Level Trend from Integrated Multi-Mission Ocean Altimeters TOPEX/Poseidon, Jason-1, OSTM/Jason-2, and Jason-3 Version 5.0, Ver. 5. PO.DAAC, CA, USA, https://doi.org/10.5067/GMSLM-TJ150, 2021.
Bendefy, L.: Szintezési munkálatok Magyarországon 1820–1920, Akadémiai Kiadó, Budapest, Hungary, https://library.hungaricana.hu/en/view/VizugyiKonyvek_018/?pg=0&layout=s (last access: 13 December 2022), 1958.
Bradshaw, E., Rickards, L., and Aarup, T.: Sea level data archaeology and the Global Seal Level Observing System (GLOSS), GeoResJ, 6, 9–16, https://doi.org/10.1016/j.grj.2015.02.005, 2015.
Bruni, S., Zerbini, S., Raicich, F., and Errico, M.: Rescue of the 1873–1922 High and Low Waters of the Porto Corsini/Marina di Ravenna (northern Adriatic, Italy) tide gauge, J. Geodesy, 1227–1244, https://doi.org/10.1007/s00190-019-01238-w, 2019.
Camuffo, D., Bertolin, C., and Schenal, P.: A novel proxy and the sea level rise in Venice, Italy, from 1350 to 2014, Climatic Change, 143, 73–86, https://doi.org/10.1007/s10584-017-1991-3, 2017.
Carbognin, L. and Taroni, G.: Eustatismo a Venezia e Trieste nell'ultimo secolo, Atti Istituto Veneto di Scienze, Lettere ed Arti, Classe di Scienze Fis., Mat. e Nat., CLIV, 281–298, http://atena.beic.it/view/action/nmets.do?DOCCHOICE=9320662.xml&dvs=1681294733079~460&locale=it_IT&search_terms=DTL8&show_metadata=true&adjacency=&VIEWER_URL=/view/action/nmets.do?&DELIVERY_RULE_ID=7&divType=&usePid1=true&usePid2=true (last access: 19 December 2022), 1996.
Carbognin, L., Teatini, P., and Tosi, L.: Eustacy and land subsidence in the Venice Lagoon at the beginning of the new millennium, J. Marine Syst., 51, 345–353, https://doi.org/10.1016/j.jmarsys.2004.05.021, 2004.
Cavazzoni, S.: Variazioni batimetriche e idrografiche nella Laguna di Venezia intercorse tra il 1933 e il 1977, Ist. Veneto Sc., Lett. Arti, Commissione di studio dei provvedimenti per la conservazione e difesa della Laguna e della città di Venezia, Rapporti e studi, vol. VII, 1–18, http://atena.beic.it/view/action/nmets.do?DOCCHOICE=2247140.xml&dvs=1681293326495~709&locale=it_IT&search_terms=DTL9&show_metadata=true&adjacency=&VIEWER_URL=/view/action/nmets.do?&DELIVERY_RULE_ID=7&divType=&usePid1=true&usePid2=true (last access: 19 December 2022), 1977.
CNA: Commercial and Nautical Academy, Tide-gauge charts, CNR-ISMAR archive, Trieste, Italy, 1864.
Dangendorf, S., Mudersbach, C., Wahl, T., and Jensen, J.: Characteristics of intra-, inter-annual and decadal sea-level variability and the role of meteorological forcing: the long record of Cuxhaven, Ocean Dynam., 63, 209–224, https://doi.org/10.1007/s10236-013-0598-0, 2013.
Dorigo, L.: Le osservazioni mareografiche in Laguna di Venezia, Ist. Veneto Sc., Lett. Arti, Commissione di studio dei provvedimenti per la conservazione e difesa della Laguna e della città di Venezia, Rapporti preliminari, vol. I, 11–38, http://atena.beic.it/view/action/nmets.do?DOCCHOICE=2232962.xml&dvs=1681293527875~350&locale=it_IT&search_terms=DTL12&show_metadata=true&adjacency=&VIEWER_URL=/view/action/nmets.do?&DELIVERY_RULE_ID=7&divType=&usePid1=true&usePid2=true (last access: 19 December 2022), 1961.
Ferraro, S.: Dati del mareografo di Trieste, Istituto Sperimentale Talassografico “Francesco Vercelli”, Publication no. 477, Trieste, Italy, 1972.
Finetti, I., Russi, M., and Slejko, D.: The Friuli earthquake (1976–1977), Tectonophysics, 53, 261–272, https://doi.org/10.1016/0040-1951(79)90070-2, 1979.
Fox-Kemper, B., Hewitt, H. T., Xiao, C., Aðalgeirsdóttir, G., Drijfhout, S. S., Edwards, T. L., Golledge, N. R., Hemer, M., Kopp, R. E., Krinner, G., Mix, A., Notz, D., Nowicki, S., Nurhati, I. S., Ruiz, L., Sallée, J.-B., Slangen, A. B. A., and Yu, Y.: Ocean, Cryosphere and Sea Level Change, in: Climate Change 2021: The Physical Science Basis. Contribution of Working Group I to the Sixth Assessment Report of the Intergovernmental Panel on Climate Change, edited by: Masson-Delmotte, V., Zhai, P., Pirani, A., Connors, S. L., Péan, C., Berger, S., Caud, N., Chen, Y., Goldfarb, L., Gomis, M. I., Huang, M., Leitzell, K., Lonnoy, E., Matthews, J. B. R., Maycock, T. K., Waterfield, T., Yelekçi, O., Yu, R., and Zhou, B., Cambridge University Press, Cambridge, UK and New York, NY, USA, 1211–1362, https://doi.org/10.1017/9781009157896.001, 2021.
Gallo, V.: L'Osservatore Triestino, 6 August, No. 496, 1840.
Gallo, V.: Trieste. Osservazioni meteorologiche fatte nell'I.R. Accademia di Nautica dal prof. Sig. V. Gallo, in: Stündliche Beobachtungen zur Zeit des Frühlings-Aequinoctiums 1844, Annalen für Meteorologie, Erdmagnetismus und verwandte Gegenstände, Jahrgang 1844, v. XI, 48–49, G. Franz, Munich, Germany, https://download.digitale-sammlungen.de/BOOKS/download.pl?id=bsb10133287 (last access: 13 December 2022), 1844.
Gomis, D., Tsimplis, M., Marcos, M., Fenoglio-Marc, L., Pérez, B., Raicich, F., Vilibić, I., Wöppelmann, G., Monserrat, S.,: Mediterranean sea level variability and trends, in: Mediterranean Climate: FromPast to Future, edited by: Lionello, P., Elsevier, Dordrecht, The Netherlands, 251–293, https://doi.org/10.1016/B978-0-12-416042-2.00004-5, 2012.
Gouriou, T., Martín Míguez, B., and Wöppelmann, G.: Reconstruction of a two-century long sea level record for the Pertuis d'Antioche (France), Cont. Shelf Res., 61–62, 31–40, https://doi.org/10.1016/j.csr.2013.04.028, 2013.
Governo Marittimo (I.R.): Annuario Marittimo 1875–1889, Stabilimento Letterario Artistico J. Ohswaldt, then Tip. Lloyd Austro-Ungarico, then Tip. Lloyd Austriaco, Trieste, Austria, 1877–1890.
Hannah, J.: An updated analysis of long-term sea level change in New Zealand, Geophys. Res. Lett., 31, L03307, https://doi.org/10.1029/2003GL019166, 2004.
Hopfner, F.: Die Gezeiten im Hafen von Triest, Sitzungsberichte der k.u.k. Akademie der Wissenschaften, mathematisch-naturwissenschaftliche Klasse, vol. CXXII, fasc. IX, 1745–1799, 1913.
Hunter, J., Coleman, R., and Pugh, D.: The sea level at Port Arthur, Tasmania, from 1841 to the present, Geophys. Res. Lett., 30, 1401, https://doi.org/10.1029/2002GL016813, 2003.
IGMI: Linea di livellazione Cervignano-Monfalcone-Trieste e deviazioni (Ms.), Italian Military Geographic Institute, geodetic archive, cat. 1.21.1.32, Florence, Italy, 1926.
IGMI: Data sheet of CsO Cj/39′, 1967 Edn., Italian Military Geographic Institute, Florence, Italy, 1967.
IGMI: Data sheet of CsO Cj/39, 1977 Edn., Italian Military Geographic Institute, Florence, Italy, 1977.
IGMI: Data sheet of benchmark “00CJ#_###_039P Trieste – Molo Sartorio – Cabina Mareografica”, Italian Military Geographic Institute, Florence, Italy, 2009.
Lama, R. and Corsini, S.: La rete mareografica italiana, Istituto Poligrafico e Zecca dello Stato, Rome, Italy, 2000.
Lorenz, J. R., Prey, A., and Stahlberger, E.: Ebbe und Fluth (Gezeiten), Dritter Bericht an der ständigen Commission für die Adria, 85–124, https://digital.onb.ac.at/OnbViewer/viewer.faces?doc=ABO_%2BZ226843100 (last access: 13 December 2022), 1873.
Marcos, M. and Tsimplis, M. N.: Coastal sea level trends in southern Europe, Geophys. J. Int., 175, 70–82, https://doi.org/10.1111/j.1365-246X.2008.03892.x, 2008.
Marcos, M., Puyol, B., Wöppelmann, G., Herrero, C., and García-Fernández, M. J.: The long sea level record at Cádiz (southern Spain) from 1880 to 2009, J. Geophys. Res., 116, C12003, https://doi.org/10.1029/2011JC007558, 2011.
Marcos, M., Puyol, B., Calafat, F. M., and Wöppelmann, G.: Sea level changes at Tenerife Island (NE Tropical Atlantic) since 1927, J. Geophys. Res.-Oceans, 118, 4899–4910, https://doi.org/10.1002/jgrc.20377, 2013.
Marcos, M., Puyol, B., Amores, A., Pérez Gómez, B., Fraile, M.Á., and Talke, S. A.: Historical tide gauge sea-level observations in Alicante and Santander (Spain) since the 19th century, Geosci. Data J., 8, 144–153, https://doi.org/10.1002/gdj3.112, 2021.
Matthäus, W.: On the history of recording tide gauges, P. R. Soc. Edinb. B, 73, 26–34, https://doi.org/10.1017/S0080455X00002083, 1972.
Mazelle, E.: Rapporto annuale dell'Osservatorio Marittimo 1905, Tip. Lloyd Austriaco, Trieste, Austria, 1909.
Mazelle, E.: Rapporto annuale dell'Osservatorio Marittimo 1906, Tip. Lloyd Austriaco, Trieste, Austria, 1910.
Mazelle, E.: Rapporto annuale dell'Osservatorio Marittimo 1907, Tip. Lloyd Austriaco, Trieste, Austria, 1911.
Mazelle, E.: Rapporto annuale dell'Osservatorio Marittimo 1908, Tip. Lloyd Austriaco, Trieste, Austria, 1912.
Mazelle, E.: Rapporto annuale dell'Osservatorio Marittimo 1909, Tip. Lloyd Austriaco, Trieste, Austria, 1913.
Mazelle, E.: Rapporto annuale dell'Osservatorio Marittimo 1910, Tip. Lloyd Austriaco, Trieste, Austria, 1914.
Mazelle, E.: Rapporto annuale dell'Osservatorio Marittimo 1911, Tip. Lloyd Austriaco, Trieste, Austria, 1917.
Međugorac, I., Pasarić, M., and Orlić, M.: Long-term measurements at Bakar tide-gauge station (east Adriatic), Geofizika, 39, 1–16, https://doi.org/10.15233/gfz.2022.39.8, 2022.
MGI: Die in das Präcisions-Nivellement in der österreichisch-ungarischen Monarchie einbezogen See- und Flusspegel, Mittheilungen des k.u.k. Militär-Geographischen Institutes, V, 52–58, https://anno.onb.ac.at/cgi-content/anno-plus?aid=mgi&datum=1885&size=45 (last access: 13 December 2022), 1885.
MGI: Provisorisch ausgeglichene Daten des Präcisions-Nivellement im westlichen Theile der österr.-ungar. Monarchie, Mittheilungen des k.u.k. Militär-Geographischen Institutes, XI, 58–120, https://anno.onb.ac.at/cgi-content/anno-plus?aid=mgi&datum=1892&size=45 (last access: 13 December 2022), 1892.
MGI: Das Präcisions-Nivellement in der österreichisch-ungarischen Monarchie, II, Westlicher Theil, Astronomisch-geodätischen Arbeiten des k. und k. Militär-geographischen Institutes, VIII Band, kaiserlich-königlichen Hof- und Staatsdruckerei, Vienna, https://goobi.tib.eu/viewer/!toc/883927195/1/-/ (last access: 13 December 2022), 1896.
MGI: Das Präcisions-Nivellement in der österreichisch-ungarischen Monarchie, I, Theoretische Grundlagen und Ausführungs-Bestimmungen, Astronomisch-geodätischen Arbeiten des k. und k. Militär-geographischen Institutes, VII Band, kaiserlich-königlichen Hof- und Staatsdruckerei, Vienna, https://goobi.tib.eu/viewer/!toc/883926881/1/-/ (last access: 13 December 2022), 1897.
Morelli, C.: Livellazione di precisione nella zona portuale di Trieste e collegamento altimetrico fra la rete italiana e quella austriaca, Tecnica Italiana, 5, 27–42, 1950.
Osservatorio Marittimo (I.R.): Table of hourly sea level heights of December 1910, (Ms.), CNR-ISMAR archive, Trieste, Italy, 1910.
Osservatorio Marittimo (I.R.): Letter dd 8 June 1916, (Ms.), State Archive of Trieste, 7821/1916 prot. 600 ex 1916, 1916.
Osservatorio Marittimo (I.R.): Letter dd 9 January 1917, (Ms.), State Archive of Trieste, 666/1917 prot. 36 ex 1917, 1917.
Picotti, M.: Letter dd 12 March 1960 to the Technical Office of Trieste Municipality, Municipality of Trieste, general archive, Prot. n. 283 10/184-60, 1960.
Polli, S.: Livelli medi, capisaldi di livellazione e ampiezza della marea nel porto di Trieste, CNR, Comitato Talassografico Italiano, Memoria CCLIII, Off. Grafiche C. Ferrari, Venice, Italy, 1938.
Polli, S.: Analisi periodale delle serie dei livelli marini di Trieste e Venezia, Geofisica Pura e Applicata, 10, 29–40, https://doi.org/10.1007/BF01996365, 1947.
Polli, S.: Livelli medi del mare di Trieste, Istituto Sperimentale Talassografico “Francesco Vercelli”, Publication no. 459, Trieste, Italy, 1970.
Raicich, F.: A study of early Trieste sea level data (1875–1914), J. Coast. Res., 23, 1067–1073, https://doi.org/10.2112/04-0325.1, 2007.
Raicich, F.: Long-term variability of storm surge frequency in the Venice Lagoon: an update thanks to 18th century sea level observations, Nat. Hazards Earth Syst. Sci., 15, 527–535, https://doi.org/10.5194/nhess-15-527-2015, 2015.
Raicich, F.: A 1782–1794 sea level record at Trieste (northern Adriatic), Hist. Geo Space. Sci., 11, 1–14, https://doi.org/10.5194/hgss-11-1-2020, 2020.
Raicich, F.: Sea-level observations at Trieste, Molo Sartorio, Italy, SEANOE [data set], https://doi.org/10.17882/62758, 2022.
Raicich, F. and Colucci, R. R.: A mean-sea-level pressure time series for Trieste, Italy (1841–2018), Earth Syst. Sci. Data, 13, 3363–3377, https://doi.org/10.5194/essd-13-3363-2021, 2021a.
Raicich, F. and Colucci, R. R.: Mean-sea-level atmospheric pressure from 1841 to 2018 at Trieste, Italy, PANGAEA [data set], https://doi.org/10.5194/PANGAEA.926896, 2021b.
Ray, R. and Talke, S. A.: Nineteenth-Century Tides in the Gulf of Maine and implications for secular trends, J. Geophys. Res., 124, 7046–7067, https://doi.org/10.1029/2019JC015277, 2019.
Salvioni, G.: Letter dd 12 March 1957 to S. Polli, Italian Military Geographic Institute, geodetic archive, cat. 1.21.1.32, Florence, Italy, 1957.
Schaub, F.: Ueber Ebbe und Fluth in der Rhede von Triest, Franz Foetterle, Ed., Mittheilungen der kaiserlich-königlichen Geographischen Gesellschaft, anno IV, 78–82, https://anno.onb.ac.at/cgi-content/anno-plus?aid=geo&datum=1860&size=45 (last access: 13 December 2022), 1860.
Spinello, V.: Specchio delle quote dei principali c.s. (capisaldi) della livellazione eseguita a Trieste nell'ottobre 1926 dal Molo Sartorio all'idrometro di Ponte Rosso e conseguente collegamento alla rete di livellazione italiana avvenuto nel Febbraio 1927, (Ms), Italian Military Geographic Institute, geodetic archive, cat. 1.21.1.32, Florence, Italy, 1927.
Talamo, R., Pampaloni, M., and Grassi, S.: Risultati delle misure di livellazione di alta eseguite dall'Istituto Geografico Militare nelle zone del Friuli interessate dalle recenti attività sismiche, Bollettino di Geodesia e Geofisica, a. XXXVII, n. 1, 61–75, 1978.
Talke, S. A., Orton, P., and Jay, D. A.: Increasing storm tides in New York Harbor, 1844–2013, Geophys. Res. Lett., 41, 3149–3155, https://doi.org/10.1002/2014GL059574, 2014.
Talke, S. A., Kemp, A. C., and Woodruff, J.: Relative sea level, tides, and extreme water levels in Boston harbour from 1825 to 2018, J. Geophys. Res.-Oceans, 123, 3895–3914, https://doi.org/10.1029/2017JC013645, 2018.
Talke, S. A., Mahedy, A., Jay, D. A., Lau, P., Hilley, C., and Hudson, A.: Sea level, tidal and river flow trends in the Lower Columbia River Estuary, 1853–present, J. Geophys. Res.-Oceans, 125, e2019JC015656, https://doi.org/10.1029/2019JC015656, 2020.
Testut, L., Martín Míguez, B., Wöppelmann, G., Tiphaneau, P., Pouvreau, N., and Karpytchev, M.: Sea level at Saint Paul Island, southern Indian Ocean, from 1874 to the present, J. Geophys. Res., 115, C12028, https://doi.org/10.1029/2010JC006404, 2010.
Tsimplis, M. N. and Baker, T. F.: Sea level drop in the Mediterranean Sea: an indicator of deep water salinity and temperature changes?, Geophys. Res. Lett., 27, 1731–1734, https://doi.org/10.1029/1999GL007004, 2000.
UIMA: Mareografia. In: Bollettino Idrografico, parte prima, 1924, Ufficio Idrografico del R. Magistrato alle Acque di Venezia, Officine Grafiche Carlo Ferrari, Venice, Italy, https://content.meteotrentino.it/dati-meteo/registri-cartacei/VENEZIA_1924_PARTE1.pdf (last access: 13 December 2022), 1924–1925.
UIMA: Annali Idrologici 1936, Elaborazioni e studi, Mareografia, Ufficio Idrografico del Magistrato alla Acque di Venezia, Istituto Poligrafico dello Stato, Rome, Italy, https://content.meteotrentino.it/dati-meteo/registri-cartacei/VENEZIA_1936_PARTE2.pdf (last access: 13 December 2022), 1941.
UIMA: Mareografia, in: Bollettino Mensile, parte prima, December 1954. Ufficio Idrografico del Magistrato alle Acque di Venezia, Istituto Poligrafico dello Stato, Rome, Italy, https://content.meteotrentino.it/dati-meteo/registri-cartacei/VENEZIA_1954_PARTE1.pdf (last access: 13 December 2022), 1956.
UNESCO/IOC: Manual on sea level measurement and interpretation, Vol. II – Emerging technologies, UNESCO, IOC Manuals and Guides No. 14, Vol. 2, Paris, France, https://repository.oceanbestpractices.org/handle/11329/211 (last access: 13 December 2022), 1994.
UNESCO/IOC: Workshop on Sea Level Data Archaeology, Paris, France, 10–12 March 2020, UNESCO, IOC Workshop Reports, 287, (IOC/2020/WR/287), https://unesdoc.unesco.org/ark:/48223/pf0000373327 (last access: 13 December 2022), 2020a.
UNESCO/IOC: Quality Control of in situ Sea Level Observations: A Review and Progress towards Automated Quality Control, Vol. 1, UNESCO, IOC Manuals and Guides No. 83, Paris, France, https://repository.oceanbestpractices.org/handle/11329/1348 (last access: 13 December 2022), 2020b.
von Chiolich-Löwensberg, H.: Anleitung zum Wasserbau: nach den vorzüglichsten und neuesten Quellen bearbeitet, Abteilung 3, Hoffmann, Stuttgart, Germany, https://opacplus.bsb-muenchen.de/Vta2/bsb10479869/bsb:11573328 (last access: 13 December 2022), 1865.
von Chiolich-Löwensberg, H.: Anleitung zum Wasserbau: nach den vorzüglichsten und neuesten Quellen bearbeitet, Abteilung 3, Tafeln, Hoffmann, Stuttgart, Germany, https://opacplus.bsb-muenchen.de/Vta2/bsb10479872/bsb:11573342 (last access: 13 December 2022), 1866.
von Sterneck, R.: Kontrolle des Nivellements durch die Fluthmesserangaben und die Schwankungen des Meeresspiegels der Adria, Mittheilungen der k.u.k. Militär-Geographischen Institutes, XXIV, 75–111, https://anno.onb.ac.at/cgi-content/anno-plus?aid=mgi&datum=1905&size=45 (last access: 13 December 2022), 1905.
Woodworth, P. L.: High waters at Liverpool since 1768: The UK's longest sea level record, Geophys. Res. Lett., 26, 1589–1592, https://doi.org/10.1029/1999GL900323, 1999.
Woodworth, P. L., Pugh, D. T., and Bingley, R. M.: Long term and recent changes in sea level in the Falkland Islands, J. Geophys. Res., 115, C09025, https://doi.org/10.1029/2010JC006113, 2010.
Wöppelmann, G., Pouvreau, N., and Simon, B.: Brest sea level record: A time series construction back to the early eighteenth century, Ocean Dynam., 56, 487–497, https://doi.org/10.1007/s10236-005-0044-z, 2006.
Wöppelmann, G., Pouvreau, N., Coulomb, A., Simon, B., and Woodworth, P. L.: Tide gauge datum continuity at Brest since 1711: France's longest sea level record, Geophys. Res. Lett., 35, L22605, https://doi.org/10.1029/2008GL035783, 2008.
Wöppelmann, G., Marcos, M., Coulomb, A., Martín Míguez, B., Bonnetain, P., Boucher, C., Gravelle, M., Simon, B., and Tiphaneau, P.: Rescue of the historical sea level record of Marseille (France) from 1885 to 1988 and its extension back to 1849–1851, J. Geodesy, 88, 869–885, https://doi.org/10.1007/s00190-014-0728-6, 2014.
Zerbini, S., Raicich, F., Prati, C. M., Bruni, S., Del Conte, S., Errico, M., and Santi, E.: Sea-level change in the Northern Mediterranean Sea from long-period tide gauge time series, Earth-Sci. Rev., 167, 72–87, https://doi.org/10.1016/j.earscirev.2017.02.009, 2017.
- Abstract
- Introduction
- Historical background and local setting
- The observations
- The long-term mean sea level time series
- Data availability
- Summary and conclusions
- Appendix A: The relationships between the Austrian and Italian levelling zeros
- Appendix B: The gaps in the hourly time series from 1905 to 2021
- Appendix C: Differences from the monthly means of this work and those in the PSMSL database
- Competing interests
- Disclaimer
- Acknowledgements
- Review statement
- References