the Creative Commons Attribution 4.0 License.
the Creative Commons Attribution 4.0 License.
 | 17 Apr 2023
Heat stored in the Earth system 1960–2020: where does the energy go?
Karina von Schuckmann
Audrey Minière
Flora Gues
Francisco José Cuesta-Valero
Gottfried Kirchengast
Susheel Adusumilli
Fiammetta Straneo
Michaël Ablain
Richard P. Allan
Paul M. Barker
Hugo Beltrami
Alejandro Blazquez
Tim Boyer
Lijing Cheng
John Church
Damien Desbruyeres
Han Dolman
Catia M. Domingues
Almudena García-García
Donata Giglio
John E. Gilson
Maximilian Gorfer
Leopold Haimberger
Maria Z. Hakuba
Stefan Hendricks
Shigeki Hosoda
Gregory C. Johnson
Rachel Killick
Brian King
Nicolas Kolodziejczyk
Anton Korosov
Gerhard Krinner
Mikael Kuusela
Felix W. Landerer
Moritz Langer
Thomas Lavergne
Isobel Lawrence
Yuehua Li
John Lyman
Florence Marti
Ben Marzeion
Michael Mayer
Andrew H. MacDougall
Trevor McDougall
Didier Paolo Monselesan
Jan Nitzbon
Inès Otosaka
Jian Peng
Sarah Purkey
Dean Roemmich
Kanako Sato
Katsunari Sato
Abhishek Savita
Axel Schweiger
Andrew Shepherd
Sonia I. Seneviratne
Leon Simons
Donald A. Slater
Thomas Slater
Andrea K. Steiner
Toshio Suga
Tanguy Szekely
Wim Thiery
Mary-Louise Timmermans
Inne Vanderkelen
Susan E. Wjiffels
Tonghua Wu
Michael Zemp
The Earth climate system is out of energy balance, and heat has accumulated continuously over the past decades, warming the ocean, the land, the cryosphere, and the atmosphere. According to the Sixth Assessment Report by Working Group I of the Intergovernmental Panel on Climate Change, this planetary warming over multiple decades is human-driven and results in unprecedented and committed changes to the Earth system, with adverse impacts for ecosystems and human systems. The Earth heat inventory provides a measure of the Earth energy imbalance (EEI) and allows for quantifying how much heat has accumulated in the Earth system, as well as where the heat is stored. Here we show that the Earth system has continued to accumulate heat, with 381±61 ZJ accumulated from 1971 to 2020. This is equivalent to a heating rate (i.e., the EEI) of 0.48±0.1 W m−2. The majority, about 89 %, of this heat is stored in the ocean, followed by about 6 % on land, 1 % in the atmosphere, and about 4 % available for melting the cryosphere. Over the most recent period (2006–2020), the EEI amounts to 0.76±0.2 W m−2. The Earth energy imbalance is the most fundamental global climate indicator that the scientific community and the public can use as the measure of how well the world is doing in the task of bringing anthropogenic climate change under control. Moreover, this indicator is highly complementary to other established ones like global mean surface temperature as it represents a robust measure of the rate of climate change and its future commitment. We call for an implementation of the Earth energy imbalance into the Paris Agreement's Global Stocktake based on best available science. The Earth heat inventory in this study, updated from von Schuckmann et al. (2020), is underpinned by worldwide multidisciplinary collaboration and demonstrates the critical importance of concerted international efforts for climate change monitoring and community-based recommendations and we also call for urgently needed actions for enabling continuity, archiving, rescuing, and calibrating efforts to assure improved and long-term monitoring capacity of the global climate observing system. The data for the Earth heat inventory are publicly available, and more details are provided in Table 4.
- Article
(3040 KB) - Full-text XML
- Version 2020
- BibTeX
- EndNote


The Earth energy imbalance (EEI) is the most fundamental indicator for climate change, as it tells us if, how much, how fast, and where the Earth's climate is warming, as well as how this warming evolves in the future (Hansen et al., 2011, 2005; von Schuckmann et al., 2016). The EEI is given by the difference between incoming solar radiation and outgoing radiation, which determines the net radiative flux at the top of the atmosphere (TOA). Today, the Earth climate system is out of energy balance; consequently, heat has accumulated continuously over the past decades, warming the ocean, the land, the cryosphere, and the atmosphere, determining the Earth heat inventory (Fig. 1, von Schuckmann et al., 2020). This planetary warming is human-driven and results in unprecedented and committed changes to the Earth system (Fig. 1) (IPCC, 2021), with adverse impacts for ecosystems and human systems (IPCC, 2022a). As long as this imbalance persists (or even increases) planet Earth will keep gaining energy, increasing planetary warming (Hansen et al., 2005, 2017). Today, the EEI can be best estimated from the quantification of the Earth heat inventory, complemented by direct measurements from space (von Schuckmann et al., 2016; Loeb et al., 2021). In addition, the Earth heat inventory as derived from multiple sources of measurements and models also allows researchers to unravel where the energy – mostly in the form of heat – is stored in the Earth system across all components (von Schuckmann et al., 2020). Results of the first internationally driven initiative on the Earth heat inventory (von Schuckmann et al., 2020) not only show how much and where heat has accumulated in the Earth system but also show for the first time that the Earth energy imbalance has increased over the recent decade. This increase is expected to have fundamental implications for the Earth's climate, and several potential drivers have been discussed recently (Loeb et al., 2021; Hakuba et al., 2021; Kramer et al., 2021).
The Earth system responds to an imposed radiative forcing through a number of feedback mechanisms, which operate on various timescales. Earth's radiative response is complex, comprising a variety of climate feedback mechanisms (e.g., water vapor feedback, cloud feedback, ice–albedo feedback) (Forster et al., 2021). Conceptually, the relationships between EEI, radiative forcing, and surface temperature change can be expressed as the following (Gregory and Andrews, 2016):
where ΔNTOA is the Earth's net energy imbalance at TOA (in Wm−2), ΔFERF is the effective radiative forcing (Wm−2), ΔTS is the global surface temperature anomaly (K) relative to the equilibrium state, and αFP is the net total feedback parameter (Wm−2 K−1), which represents the combined effect of the various climate feedback mechanisms. Essentially, αFP in Eq. (1) can be viewed as a measure of how efficient the system is at restoring radiative equilibrium for a unit surface temperature rise. Thus, ΔNTOA represents the difference between the applied radiative forcing and Earth's radiative response through climate feedback associated with surface temperature increase (e.g., Hansen et al., 2011). Observation-based estimates of ΔNTOA are therefore crucial to our understanding of past climate change and for refining projections of future climate change (Gregory and Andrews, 2016; Kuhlbrodt and Gregory, 2012). The long atmospheric lifetime of carbon dioxide means that ΔNTOA, ΔFERF, and ΔTS will remain positive for centuries, even with substantial reductions in greenhouse gas emissions, and lead to substantial sea-level rise, ocean warming, and ice shelf loss (Cheng et al., 2019; Forster et al., 2021; Hansen et al., 2017; IPCC, 2021a; Nauels et al., 2017). In other words, warming will continue even if atmospheric greenhouse gas (GHG) amounts are stabilized at today's level, and the EEI defines additional global warming that will occur without further change in forcing (Hansen et al., 2017). The EEI is, in principle, less subject to decadal variations associated with internal climate variability than global surface temperature and therefore represents a robust measure of the rate of climate change and its future commitment (Cheng et al., 2017b; Forster et al., 2021; Loeb et al., 2018; Palmer and McNeall, 2014; von Schuckmann et al., 2016).
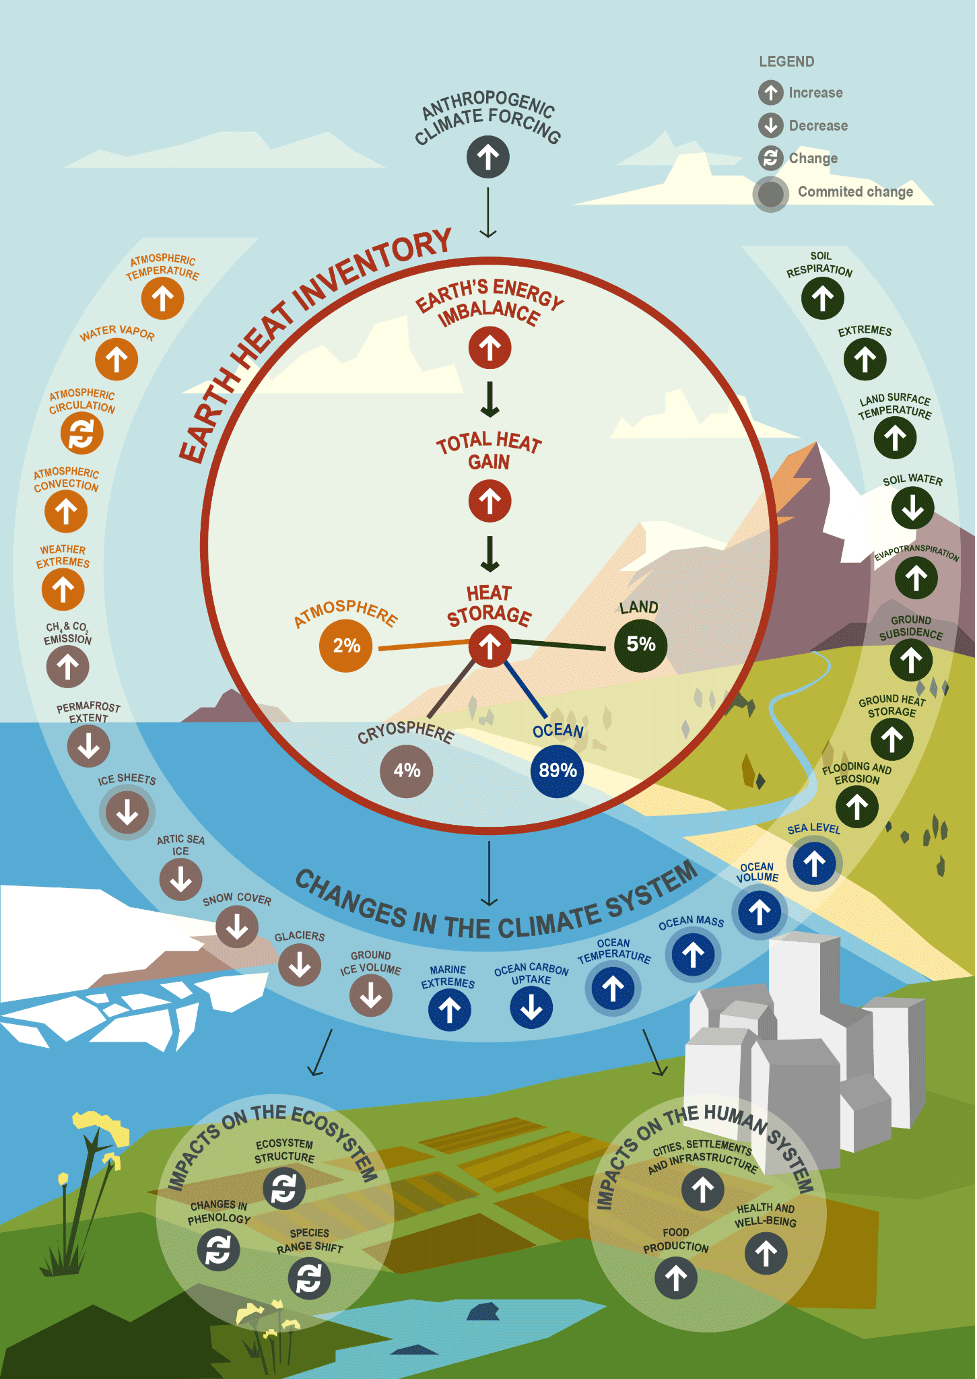
Figure 1Schematic overview on the central role of the Earth heat inventory and its linkage to anthropogenic emissions, the Earth energy imbalance, change in the Earth system, and implications for ecosystems and human systems. The Earth heat inventory plays a central role for climate change monitoring as it provides information on the absolute value of the Earth energy imbalance, the total Earth system heat gain, and how much and where heat is stored in the different Earth system components. Examples of associated global-scale changes in the Earth system as assessed in Gulev et al. (2021) are drawn, together with major implications for the ecosystem and human systems (IPCC, 2022b). Upward arrows indicate increasing change, downward arrows indicate decreasing change, and turning arrows indicate change in both directions. The percentages for heat stored in the Earth system components are provided over the period 2006–2020 (see Sect. 6).
The heat gain in the Earth system from a positive EEI results in directly and indirectly triggered changes in the climate system, with a variety of implications for the environment and human systems (Fig. 1). One of the most direct implications from a positive EEI is the rise of global mean surface temperature. The accumulation and storage of surplus anthropogenic heat leads to ocean warming and thermal expansion of the water column, which together with terrestrial ice melt leads to sea-level rise (WCRP Global Sea Level Budget Group, 2018). Moreover, there are various facets of impacts from ocean warming such as on climate extremes, which are provided in more detail in a recent review (Cheng et al., 2022a). The heat accumulation in the Earth system also leads to warming of the atmosphere, particularly to a temperature increase in the troposphere, leading to water vapor increase and changes in atmospheric circulation (Gulev et al., 2021).
On land, the heat accumulation leads to an increase in ground heat storage, which in turn triggers an increase in ground surface temperatures that may increase soil respiration and may lead to a decrease in soil water, depending on the climatic and meteorological conditions and factors such as land cover and soil characteristics (Cuesta-Valero et al., 2022; Gulev et al., 2021). Moreover, inland water heat storage increases, leading to increases in lake water temperatures that may result in algal blooms and lake stratification, and typically leads to a decrease in lake ice cover. Heat gain in the Earth system also induces an increase in permafrost heat content, which in turn leads to disruptive changes in ground morphology, CH4 and CO2 emissions, and a decrease in permafrost extent and ground ice volume. More details are synthesized in Cuesta-Valero et al. (2023a). In the cryosphere, associated changes include a loss of glaciers, ice sheets, and Arctic sea ice (IPCC, 2019, 2021a). These human-induced changes have already impacted ecosystems and have adverse impacts on human systems (Fig. 1). Particularly, they have emerged for ecosystem structure and species ranges and phenology (timing of life cycles), and they include adverse impacts such as for water security and food production; health and wellbeing; and cities, settlements, and infrastructure (IPCC, 2022b; see their Fig. SPM.2).
Regularly assessing, quantifying, and evaluating the Earth heat inventory creates a unique opportunity to support the call to action and solution pathways as assessed during the sixth assessment cycle of the Intergovernmental Panel on Climate Change (IPCC). Moreover, the Earth heat inventory allows for a regular stocktaking of the implementation of the Paris Agreement1 while monitoring progress towards achieving the purpose of the agreement and its long-term goals based on best available science. These assessment outcomes further emphasize the need to extend the Global Climate Observing System (GCOS) beyond the strict scientific observation of the climate state to also support policy and planning (GCOS, 2021). Science-driven studies driven by an Earth system view and backed by concerted multidisciplinary and international collaborations play a critical role to support these objectives (Crisp et al., 2022; Dorigo et al., 2021; von Schuckmann et al., 2020). With this second study, we aim to contribute to a more frequent and regular science-driven update of the state of the Earth heat inventory as an important indicator of climate change.
Based on the quantification of the Earth heat inventory published in 2020 (von Schuckmann et al., 2020), we present the updated results of the Earth heat inventory over the period 1960–2020, along with the long-term Earth system's heat gain over this period, and the partitions of where the heat goes for the ocean, atmosphere, land, and cryosphere. Section 2 provides the updates for ocean heat content, which is based on improved evaluations (e.g., trend evaluation method) and the addition of further international data products of subsurface temperature. Updated estimates and refinements for atmospheric heat content are discussed in Sect. 3. For the land component in Sect. 4, an improved uncertainty framework is proposed for the ground heat storage estimate, and new evaluations for inland freshwater heat storage and thawing of permafrost have been included (Cuesta-Valero et al., 2022). An update of the heat available to melt the cryosphere is described in Sect. 5 based on re-enforced international collaboration. In Sect. 6, the updated Earth heat inventory is established and discussed based on the results of Sects. 2–5. In the final section, challenges and recommendations for future improved estimates are discussed for each Earth system component, with associated recommendations for future evolution of the observing system.
Global ocean heat content (OHC) can be estimated directly from subsurface temperature measurements, which is one of the variables of the in situ component of the Global Ocean Observing System (GOOS2) and which has continued to evolve during the past decades (Abraham et al., 2013; Gould et al., 2013; Moltmann et al., 2019). The evolution of the ocean observing system for subsurface temperature measurements is provided, for example, in Cheng et al. (2022a), leveraging the transition from historical measures to modern autonomous techniques, which achieved near-global coverage in the year 2006 (the so-called golden Argo era). Different research groups have developed gridded products of subsurface temperature fields and ocean heat content using different processing methodologies (Abraham et al., 2022; Boyer et al., 2016; Cheng et al., 2022b; Gulev et al., 2021; Li et al., 2022; Savita et al., 2022). Additionally, specific Argo-based products are listed on the Argo web page (http://www.argo.ucsd.edu/, last access: 12 July 2022). Near-global OHC can also be indirectly estimated from spatial geodetic measurements by combining sea surface height from altimetry and ocean mass from gravimetry to solve the sea-level budget equation (Meyssignac et al., 2019; Dieng et al., 2017; Llovel et al., 2014). Spatial geodetic OHC is available since 2002 and provides full-depth OHC variations (Marti et al., 2022; Hakuba et al., 2021). Ocean reanalysis systems have also been used to deliver estimates of near-global OHC (Trenberth et al., 2016; von Schuckmann et al., 2018), and their international assessments show increased agreement with increasing in situ data availability for the assimilation, particularly when the Argo project had achieved nearly global-scale data sampling (Fig. 2) (Palmer et al., 2017; Storto et al., 2018, 2019; Meyssignac et al., 2019).
This initiative relies on the availability of regular updates to data products, their temporal extensions, and direct interactions with the different research groups. A complete view of all subsurface ocean temperature products can only be achieved through a concerted international effort and over time, particularly accounting for the continued development of new or improved OHC products. In this study, we do not achieve a holistic view of all available products but present a starting point for future international regular assessments of global OHC. A first established international ensemble mean and standard deviation of near-global OHC up to 2018 was established in von Schuckmann et al. (2020), which has now been updated up to 2020 and further extended with the addition of five new products (Fig. 3). The ensemble spread gives an indication of the agreement among products and can be used as a proxy for uncertainty. Compared to the results in von Schuckmann et al. (2020), the spread has increased, which can be referred back to the additional use of data products, the impact of year-to-year variations, and the refined use of the ensemble spread approach (see below).
Although there has been a tremendous improvement in in situ subsurface temperature measurements over time, estimates of global OHC remain an area of active research to minimize the major effects from different data processing techniques of the irregular (in space and time) in situ database and associated sampling characteristics, followed by the choice of the climatology used in the mapping process and data bias corrections, which today induce discrepancies between the different estimates (Boyer et al., 2016; Cheng et al., 2014; Gouretski and Cheng, 2020; Cheng et al., 2018; Good, 2017; Savita et al., 2022; Allison et al., 2019). Concerns about common errors in the products remain. Accurate understanding of the uncertainties of the product is an essential element in their use. So far, a basic assumption is that the error distribution for the observations is Gaussian with a mean of zero, which has been approximated by an ensemble of various products. However, a more complete understanding of any apparent trends requires the determination of systematic errors (e.g., systematic calibration errors) (or the impacts of changing observation densities through a synthetic profile approach; Allison et al., 2019) and of instrument technologies (Wong et al., 2020). These elements can result in biases across the ensemble, or produce artificial changes in the energetics of the system (Wunsch, 2020). For example, Li et al. (2022) estimated that assuming linear vertical interpolation with sparse historical vertical profiles results is an underestimation of global ocean heat content (and ocean thermal expansion) trends since the 1950s on the order of 14 % compared with a more sophisticated vertical interpolation scheme (Barker and McDougall, 2020; Li et al., 2022), with the greatest systematic underestimates at latitudes 15–20∘ N, and Li et al. (2022) also found that interannual differences between various eXpendable BathyThermograph (XBT) corrections were similar to the differences when only higher-quality hydrographic data were included, implying the need for improved time-dependent XBT corrections. The uncertainty can also be estimated in other ways, including some purely statistical methods (Levitus et al., 2012; MacIntosh et al., 2017; Cheng et al., 2019) or methods explicitly accounting for the error sources (Gaillard et al., 2016; Lyman and Johnson, 2014; von Schuckmann and Le Traon, 2011). Each method has its caveats; for example, the error covariances are mostly unknown and must be estimated a priori. For this study, adopting a straightforward method with a “data democracy” strategy (i.e., all OHC estimates have been given equal weight) has been chosen as a starting point, which is different from the ensemble approach adopted in the Sixth Assessment Report (AR6) (Forster et al., 2021).
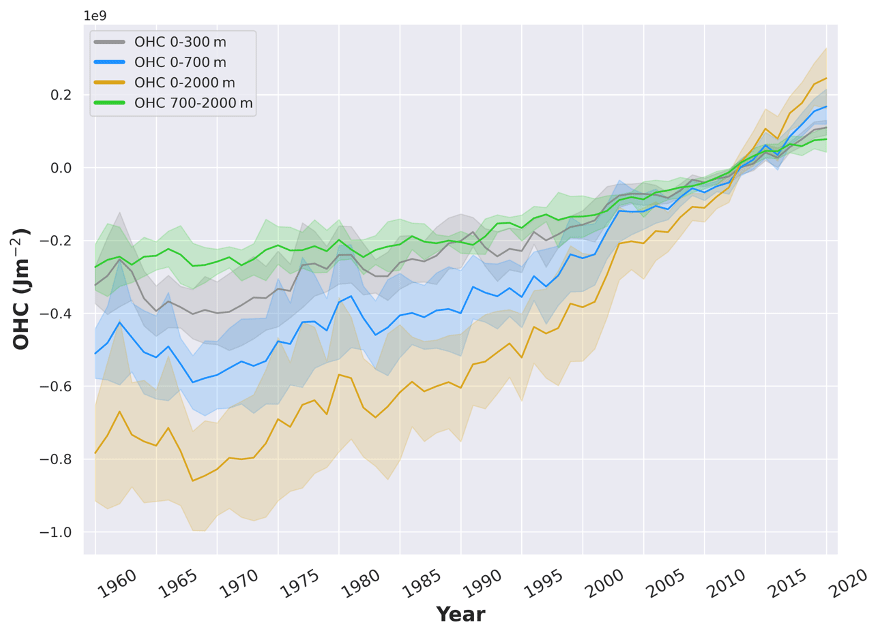
Figure 2Ensemble mean time series and ensemble standard deviation (95 %, shaded) of global ocean heat content (OHC) anomalies relative to the 2005–2020 climatology for the 0–300 m (gray), 0–700 m (blue), 0–2000 m (yellow), and 700–2000 m depth layer (green). The ensemble mean is an outcome of an international assessment initiative, and all products used are referenced in the legend of Fig. 3. The trends derived from the time series are given in Table 1. Note that values are given for the ocean surface area between 60∘ S and 60∘ N and are limited to the 300 m bathymetry of each product.
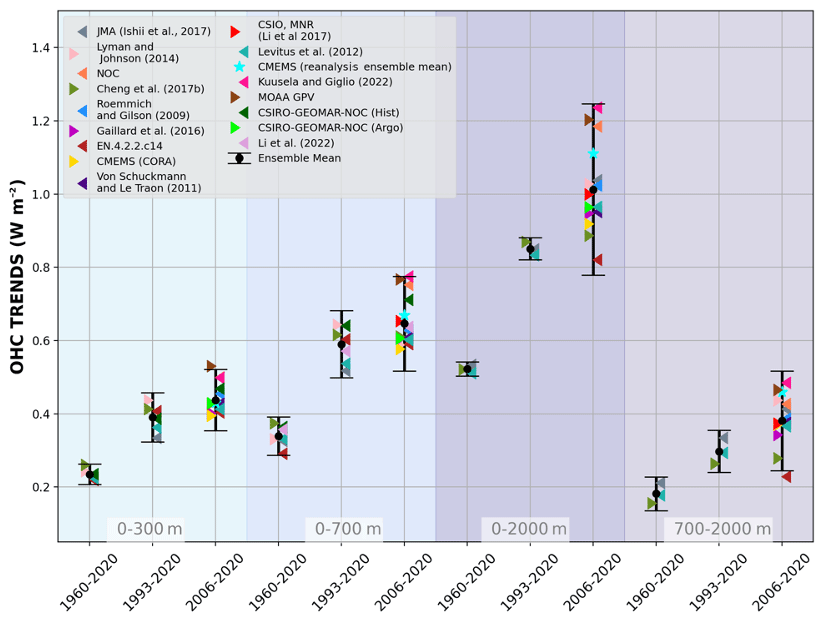
Figure 3Trends of global ocean heat content (OHC) as derived from different products (colors) and using LOWESS (see text for more details). References are given in the figure legend, except for CMEMS (CORA, Copernicus Marine Ocean Monitoring Indicator, 2023), EN.4.2.2.c14 (Good et al., 2013) with Cheng et al. (2014), XBT (Gouretski and Cheng, 2020), and Mechanical Bathythermograph (MBT) bias corrections, as well as for the method by Palmer et al. (2007). CSIRO-GEOMAR-NOC (Argo) (Domingues et al., 2008; Wijffels et al., 2016; Roemmich et al., 2015), CSIRO-GEOMAR-NOC (hist) (Church et al., 2011; Domingues et al., 2008), NOC (National Oceanographic Centre) (Desbruyères et al., 2017), and the Argo dataset MOAA GPV (Hosoda et al., 2008) are also included. Results from the Copernicus Marine Service Global Reanalysis Ensemble Product have been added as well (Copernicus Marine Ocean Monitoring Indicator: global ocean heat content) for comparison but are not considered for the ensemble mean in Fig. 1. The ensemble mean and standard deviation (95 % confidence interval) are indicated in black. The shaded areas show trends from different depth layer integrations, i.e., 0–300 m (light turquoise), 0–700 m (light blue), 0–2000 m (purple), and 700–2000 m (light purple). For each integration depth layer, trends are evaluated over the three study periods, i.e., historical (1960–2020), altimeter era (1993–2020), and golden Argo era (2006–2020). See text for more details on the international assessment criteria. Note that values are given for the ocean surface area (see text for more details). References as indicated in the legend include the following: Cheng et al. (2017a); Gaillard et al. (2016); Good et al. (2013); Ishii et al. (2017); Kuusela and Giglio (2022); Levitus et al. (2012); Li et al. (2017, 2022); Lyman and Johnson (2014); Roemmich and Gilson (2009); and von Schuckmann and Le Traon (2011).
The continuity of this activity will help to further expand international collaboration and to unravel uncertainties due to the community's collective efforts on data quality as well as on detecting and reducing processing uncertainties. It also provides up-to-date scientific knowledge of ocean warming. Products used for this assessment are referenced in the caption of Fig. 3. Estimates of OHC have been provided by the different research groups under homogeneous criteria: all estimates use a coherent ocean volume limited by the 300 m isobath (700 m for Li et al., 2022) of each product and are limited to 60∘ S–60∘ N, since most observational products exclude high-latitude ocean areas because of the low observational coverage, and only annual averages have been used. The ocean areas within 60∘ S–60∘ N include 91 % of the global ocean surface area, and limiting to the 300 m isobath neglects the contributions from coastal and shallow waters, so the resultant OHC trends will be underestimated if these ocean regions are warming. For example, neglecting shallow waters is estimated to account for more than 10 % for 0–2000 m OHC trends (Savita et al., 2022; von Schuckmann et al., 2014) and about 4 % for the Arctic area (J. Mayer et al., 2021). The assessment is based on three distinct periods to account for the evolution of the observing system, i.e., 1960–2020 (i.e., “historical”), 1993–2020 (i.e., “altimeter era”), and 2006–2020 (i.e., “golden Argo era”). All time series go up to 2020 – which was one of the principal limitations for the inclusion of some products. Our final estimates of OHC for the 0–300, 0–700, 700–2000, and 0–2000 m depth layers are the ensemble average of all products, with the uncertainty range defined by the standard deviation (2σ, 95 % confidence interval) of the corresponding ensemble used (Fig. 2).
For the trend evaluation, we have followed the most recent study by Cheng et al. (2022b) and used a locally weighted scatterplot smoothing (LOWESS) approach to reduce the effect of high-frequency variability (e.g., year-to-year variability), data noise, or changes in the observing system as it relies on a weighted regression (Cleveland, 1979) within a prescribed span width of 25 years for the historical and altimeter era and 15 years for the recent period (2006–2020). The change in OHC(t) over a specific period, ΔOHC, is then calculated by subtracting the first value from the last value of the fitted time series, OHCLOWESS(t), to obtain the trend while dividing by the considered period. To obtain an uncertainty range on the trend estimate and to take into account the sensitivity of the calculation to interannual variability, we implement a Monte Carlo simulation to generate 1000 surrogate series OHCrandom(t), under the assumption of a given mean (our “true” time series OHC(t)) (Cheng et al., 2022b). Each surrogate OHCrandom(t) consists of the fitted true time series OHC(t) plus a randomly generated residual which follows a normal (Gaussian) distribution and which is included in an envelope equal to 2 times the uncertainty associated with the time series. Then, a LOWESS fitted line is estimated for each of the 1000 surrogates. The 95 % confidence interval for the trend is then calculated based on ±2 times the standard deviation (±2σ) of all 1000 trends of the surrogates. However, the use of either trend estimates following a linear, LOWESS approach, or the approach discussed in Palmer et al. (2021) leads to consistent results within uncertainties (not shown).
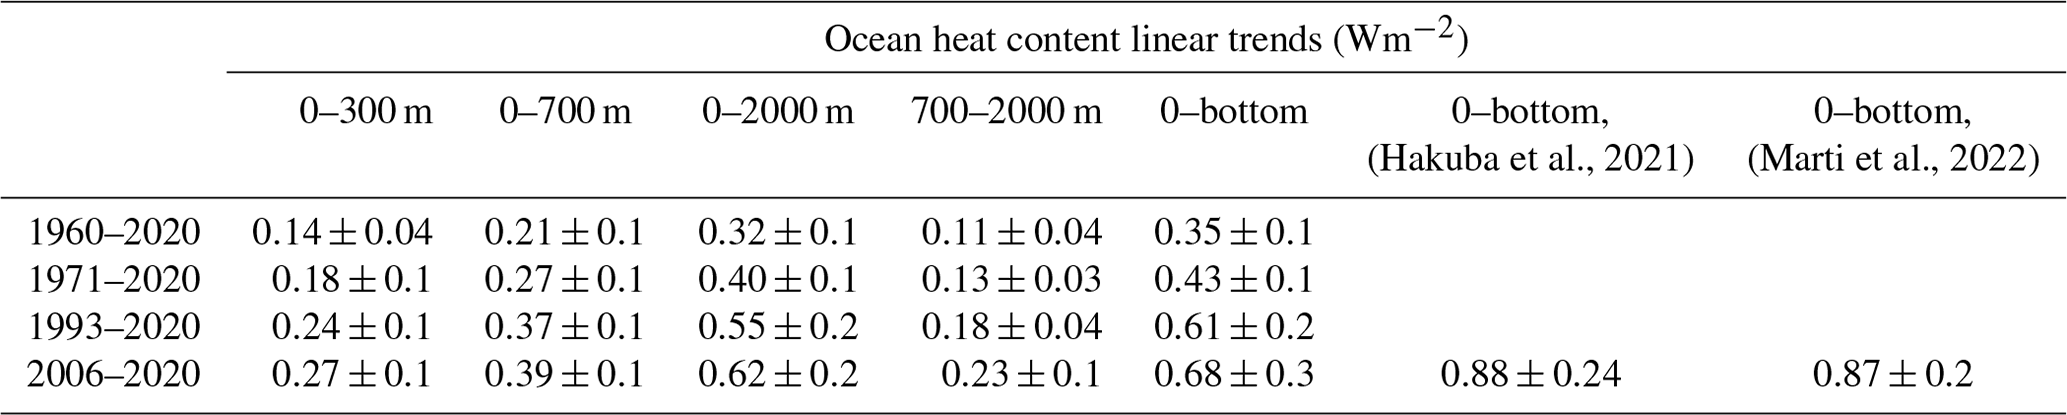
In agreement with Cheng et al. (2019) and Gulev et al. (2021), our results confirm a continuous increase in ocean warming over the entire study period (Fig. 2). Moreover, rates of global ocean warming have increased over the three different study periods, i.e., historical up to the recent decadal change. The trend values are all given in Table 1. The major fraction of heat is stored in the upper ocean (0–300 and 0–700 m depth). However, heat storage at intermediate depth (700–2000 m) increases at a nearly comparable rate as reported for the 0–300 m depth layer (Table 1, Fig. 3). There is a general agreement among the 16 international OHC estimates (Fig. 3). However, for some periods and depth layers the standard deviation (95 % confidence level) reaches maxima at about 0.3 W m−2. All products agree on the fact that global ocean warming rates have increased in the past decades and doubled since the beginning of the altimeter era (1993–2020 compared with 1960–2020) (Fig. 3). Moreover, there is a clear indication that heat sequestration took place in the 700–2000 m depth layer over the past six decades linked to an increase in OHC trends over time (Fig. 3). Ocean warming rates for the 0–2000 m depth layer reached record rates of 1.03 (0.62) ±0.2 W m−2 over the period 2006–2020 for the ocean (global) area, consistent with what has been reported in Johnson et al. (2022).
Table 1OHC trends using LOWESS (locally weighted scatterplot smoothing; see text for more details) as derived from the ensemble mean (Fig. 2) for different time intervals, as well as different integration depths. The regression was done for each time period (1960–2020, 1971–2020, 1993–2020, 2006–2020). A time window of 25 years was used for the periods that allowed it (1960–2020, 1971–2020, 1993–2020). For the period 2006–2020, a time window of 15 years was used. Note that values are given in watts per square meter (Wm−2) relative to the global surface (a factor of 0.61 for the ocean surface is used considering the area 60∘ S–60∘ N, >300 m bathymetry). See also text and Figs. 2–3 for more details. Additionally, values for satellite-derived estimates of OHC have been added for the most recent period, which are updated after Hakuba et al. (2021) and Marti et al. (2022).
For the deep OHC changes below 2000 m, we adapted an updated estimate from Purkey and Johnson (2010) (PG10 hereinafter) from 1992 to 2020, which is a constant linear trend estimate (0.97±0.48 ZJ yr−1, 0.06±0.03 W m−2) derived from a global integration of OHC below 2000 m using basin-scale deep-ocean temperature trends from repeated hydrographic sections. Some recent studies strengthened the results in PG10 (Desbruyères et al., 2016; Zanna et al., 2019). Desbruyères et al. (2016) examined the decadal change of the deep and abyssal OHC trends below 2000 m in the 1990s and 2000s, suggesting that there has not been a significant change in the rate of decadal global deep/abyssal warming from the 1990s to the 2000s, and the overall deep-ocean warming rate is consistent with PG10. Using a Green's function method and Estimating the Circulation and Climate of the Ocean (ECCO) reanalysis data, Zanna et al. (2019) reported a deep-ocean warming rate of ∼0.06 W m−2 during the 2000s, consistent with PG10 used in this study. Zanna et al. (2019) show a fairly weak global trend during the 1990s, which is different from observation-based estimates. This mismatch might come from how surface–deep connections are represented in ECCO reanalysis data and the use of time-mean Green's functions in Zanna et al. (2019), as well as from the sparse coverage of the observational network for relatively short time spans. Furthermore, combining hydrographic and deep-Argo floats, a recent study (Johnson et al., 2019) reported an accelerated warming in the South Pacific Ocean in recent years, but a global estimate of the OHC rate of change over time is not available yet, and the rates of warming may vary by ocean basin. Comparison of the results in Table 1 with OHC estimates derived from the space geodetic approach (Hakuba et al., 2021; Marti et al., 2022) shows overall agreement within uncertainties.
Before 1992, we assume zero OHC trend below 2000 m due to insufficient global observations below 2000 m, following the methodology in some studies (Cheng et al., 2017a, 2022b), IPCC AR5 (Rhein et al., 2013), and IPCC AR6 (Forster et al., 2021; Gulev et al., 2021). The deep warming is likely driven by decadal variability in deep water formation rates, which could have been in a non-steady-state mode prior to 1990, introducing additional uncertainty to the pre-1990 OHC estimates. Using surface temperature observations and assuming the heat is advected by mean circulation, Zanna et al. (2019) show a near-zero (small cooling trend) OHC trend below 2000 m from the 1960s to 1980s, suggesting the trend before 1992 might be small. The derived time series of PG10 after 1991 and zero-trend before 1992 is used for the Earth energy inventory in Sect. 5. A centralized (around the year 2006) uncertainty approach has been applied for the deep (>2000 m depth) OHC estimate, following the method by Cheng et al. (2017a), which allows us to extract an uncertainty range over the period 1993–2018 within the given (lower (0.96–0.48 ZJ yr−1), upper (0.96+0.48 ZJ yr−1)) range of the deep OHC trend estimate. We then extend the obtained uncertainty estimate back from 1992 to 1960, with zero OHC anomaly.
The heat content of the atmosphere is small compared to those of the other Earth subsystems. Yet it is by no means negligible, since, in relative terms, the atmospheric heat gain is rapid over the recent decades and has a high impact on human life (Fig. 1) (IPCC, 2021a). Atmospheric observations show a warming of the troposphere and a cooling and contraction of the stratosphere since at least 1979 (Pisoft et al., 2021; Steiner et al., 2020a). In the tropics, the upper troposphere has warmed faster than the near-surface atmosphere since at least 2001, as seen with the new observation technique of GPS radio occultation (Gulev et al., 2021; Ladstädter et al., 2023; Steiner et al., 2020a, b), while observations based on microwave soundings have likely underestimated tropospheric temperature trends in the past (Santer et al., 2021; Zou et al., 2021).
Recently, a continuous rise in the height of the tropopause has been observed for 1980 to 2020 over the Northern Hemisphere (Meng et al., 2022). The increase is equally due to tropospheric warming and stratospheric cooling in the period 1980 to 2000, while the rise after 2000 resulted primarily from enhanced tropospheric heat gain. Moreover, indications exist of a widening of the tropical belt (Grise et al., 2019; Fu et al., 2019; Staten et al., 2020) as well as of changes in the seasonal cycle (Santer et al., 2022). However, changes in atmospheric circulation and related conditions for extreme weather are still subject to uncertainty (Cohen et al., 2020), while the occurrence of heat-related extreme weather events has clearly increased over recent decades (Cohen et al., 2020; IPCC, 2021b), with high risks for societies, economies, and the environment (Fischer et al., 2021).
A regular assessment of atmospheric heat content changes is hence critical for a complete overview of energy and mass exchanges with other climate components and for a complete energy budgeting of Earth's climate system.
3.1 Atmospheric heat content
In a globally averaged and vertically integrated sense, heat accumulation in the atmosphere arises from a small imbalance between net energy fluxes at the top of the atmosphere (TOA) and the surface (denoted s). The total energy budget of the vertically integrated and globally averaged atmosphere (indicated by the global averaging operator 〈.〉) reads as follows (Mayer et al., 2017):
where the vertically integrated atmospheric energy content EA per unit surface area (J m−2) reads as
In Eq. (2), NTOA is the net radiation at top of the atmosphere, Fs is the net surface energy flux defined as the sum of net surface radiation and latent and sensible heat fluxes, Fsnow denotes the latent heat flux associated with snowfall, and FPE additionally accounts for sensible heat of precipitation. See Mayer et al. (2017) or von Schuckmann et al. (2020) for a discussion of the last two terms, which are small on a global scale and hence often neglected.
Equation (3), formulated in mean-sea-level altitude (z) coordinates and used here for integrating over observational data, provides a decomposition of EA into sensible heat energy (sum of the first two terms, internal heat energy, and gravity potential energy), latent heat energy (third term), and kinetic energy (fourth term), where ρ is the air density, cv the specific heat for moist air at constant volume, T the air temperature, g the acceleration of gravity, Le the temperature-dependent effective latent heat of condensation Lv or sublimation Ls (the latter relevant below 0 ∘C), q the specific humidity of moist air, and V the wind speed. We neglect atmospheric liquid water droplets and ice particles as separate species, as their amounts and especially their trends are small.
In computing EA for the purpose of this update to the von Schuckmann et al. (2020) heat storage assessment, we continued to use the formulations described therein, including that we refer to (geographically aggregated) EA as atmospheric heat content (AHC) in this context. This acknowledges the dominance of the heat-related terms in Eq. (3). Briefly, in deriving the AHC from observational datasets, we accounted for the intrinsic temperature dependence of the latent heat of water vapor in formulating Le (for details, see Gorfer, 2022), while the reanalysis derivations approximated Le by constant values of Lv, as this simplification is typically also made in the assimilating models (e.g., ECMWF-IFS, 2015). As another small difference, the observational estimations neglected the kinetic energy term in Eq. (3), while the reanalysis estimations accounted for it. However, the resulting differences in AHC anomalies from any of these differences are negligibly small, especially when considering trends over time.
3.2 Datasets and heat content estimation
Turning to the actual datasets used, the AHC and its changes and trends over time can be quantified using various data sources. Reassessing possible data sources, we extended the high-quality datasets that we used in the initial von Schuckmann et al. (2020) assessment. In particular, we updated the time period from 2018 to 2020 and improved the backward extension from 1980 to 1960. Specifically, the adopted datasets and the related AHC data record preparations can be summarized as follows.
Atmospheric reanalyses combine observational information from various sources (radiosondes, satellites, weather stations, etc.) and a dynamical model in a statistically optimal way. These data have reached a high level of maturity, thanks to continuous improvement work since the early 1990s (Hersbach et al., 2018). Especially reanalyzed thermodynamic state variables, like temperature and water vapor that are most relevant for AHC computation, are of high quality and suitable for climate studies, although temporal discontinuities introduced from changing observing systems continue to deserve due attention (Berrisford et al., 2011; Chiodo and Haimberger, 2010; Hersbach et al., 2020; M. Mayer et al., 2021).
We use the latest generation of reanalyses, including ECMWF's fifth-generation reanalysis ERA5 (Bell et al., 2021; Hersbach et al., 2020), Japan Meteorological Agency (JMA)'s reanalysis JRA55 (Kobayashi et al., 2015), and NASA's Modern-Era Retrospective analysis for Research and Applications version 2 (MERRA2) (Gelaro et al., 2017). ERA5 and JRA55 are both available over the full joint time frame of this heat storage assessment from 1960 to 2020, while MERRA2 complements these from 1980 to 2020. The additional JRA55C reanalysis variant of JRA55, included for initial intercomparison in von Schuckmann et al. (2020), is no longer used since it is available to 2012 only, and due to its similarity to JRA55 it is not adding appreciable complementary value.
In addition to these three reanalyses, the datasets from two climate-quality observation techniques are used for complementary observational AHC estimates. These include the Wegener Center (WEGC) multi-satellite radio occultation (RO) data record (WEGC OPSv5.6; Angerer et al., 2017; Steiner et al., 2020b), over 2002–2020, and a radiosonde (RS) data record derived from the high-quality Vaisala sondes RS80/RS92/VS41 (WEGC Vaisala; Ladstädter et al., 2015), covering 1996–2020. These RO and RS datasets provide atmospheric profiles of temperature, specific humidity, and density that are vertically completed by colocated ERA5 profiles in domains not fully covered by the data (e.g., in the lower troposphere for RO or at polar latitudes for RS). Similar to dropping the JRA55C reanalysis variant for no longer adding appreciable further value, the simplified AHC proxy data based on microwave sounding unit (MSU) observational data, intercompared in von Schuckmann et al. (2020), are no longer used.
From the observational data, the AHC is estimated by first evaluating Eq. (3) (using all terms for total and the third term only for latent AHC) at each available profile location and subsequently deriving it as volumetric heat content, for up to the global scale, from vertical integration, temporal averaging, and geographic aggregation according to the approach summarized in von Schuckmann et al. (2020) and described in detail by Gorfer (2022). For the reanalyses, the estimation is based on the full gridded fields. Applying the approach for cross-check with reanalysis profiles subsampled at observation locations only, confirms its validity as it accurately leads to the same AHC results as from the full gridded fields.
Overall, the ensemble spread of all the atmospheric datasets used is deemed a reasonable proxy for the uncertainty in the ensemble-mean annual AHC anomaly data, in particular since 1980 during the “satellite observation era” (e.g., Hersbach et al., 2020; Steiner et al., 2020a). However, the uncertainties of the trend estimates, i.e., of the AHC increase rates (“AHC gain”) obtained from linear fitting to the anomaly data over periods of interest (see Sect. 3.3), are weakly depending on these data uncertainties anyway, since the trend uncertainties are dominated by the interannual natural variability in the data, which is significantly larger than the data uncertainties expressed by the ensemble spread (see Fig. 4).
3.3 Atmospheric heat content change since 1960 and its amplification
Figure 4 shows the resulting global AHC change inventory over 1960 to 2020 (61-year record), in terms of total AHC anomalies for each data type (Fig. 4a) and for the ensemble mean with trends for selected periods and uncertainty estimates (Fig. 4c). The selected trend periods align with those for ocean data and with availability of atmospheric datasets (see Sect. 3.2 above) and represent a reference trend 1961–2000 plus recent trends of the last about 30, 20, and 15 years. Latent AHC anomalies, a key component of the AHC (Matthews et al., 2022), are also shown (Fig. 4b and d). Compared to von Schuckmann et al. (2020), the AHC data have the El Niño–Southern Oscillation (ENSO) signal removed (with ENSO regressed out via the Niño 3.4 Index; and cross-check with non-ENSO-corrected data is showing that trend differences are reasonably small). However, variability due to volcanic eruptions is still included and may somewhat influence the trends over 1993–2020, which start in the cold anomaly after the Pinatubo eruption (Santer et al., 2001).
The latent AHC (Fig. 4b and d), which accounts for about one-quarter of the total AHC, exhibits a qualitatively similar temporal evolution as total AHC, but with larger relative uncertainty compared to the total AHC. The RO and RS datasets in Fig. 4b show some differences, particularly the low latent AHC values in the 1990s and early 2000s from the RS WEGC Vaisala dataset likely stem from known dry biases of the RS80/RS90/RS92 humidity sensors (Wang et al., 2002; Verver et al., 2006; Vömel et al., 2007). Estimated trends based on these RS data are thus likely too high, although the overall increase in latent AHC is also substantial in the other datasets.

Figure 4Annual-mean global AHC anomalies from 1960 to 2020 of total AHC (a, c) and latent-only AHC (b, d), respectively, of three different reanalyses and two different observational datasets shown together with their mean (a, b) and the mean AHC anomaly shown together with four representative AHC trends and ensemble spread measures of its underlying datasets (c, d). The in-panel legends identify the individual datasets (a, b) and the selected trend periods together with the associated trend values (plus 90 % confidence range) and ensemble spread measures (c, d), with the latter including the time-average standard deviation and minimum/maximum deviations of the individual datasets from the mean.
The results clearly show that the AHC trends have increased from the earlier decades, represented by the 1961–2000 trend of near 1.7 TW. We find the mean trend to be about 2.5 times higher over 1993–2020 (about 5.3 TW) and about 4 times higher in the most recent two decades (about 6–7 TW), a period that is already covered by the RO and RS records. Latent AHC trends in the most recent periods are about 3 times larger than the 1961–2000 reference period. Since 1971, the heat gain in the atmosphere amounts to 5±1 ZJ (see also Fig. 8).
The remarkable amplification of total AHC and latent AHC trends is highlighted in Fig. 5 and summarized in Table 2 for the representative recent periods vs. the 1961–2000 reference period. The 1961–2000 and 1993–2020 periods were covered by reanalysis only, while the WEGC Vaisala RS dataset additionally covers the 2001–2020 and 2006–2020 periods, and the RO dataset covers the most recent period (see dataset descriptions in Sect. 3.2). The larger diversity of recent datasets induces more spread; for example, the RS dataset shows an amplification factor of near 4.5 in the global total AHC gain for 2001–2020, while the amplification factors from the reanalyses range from 2.6 to 3.8. Amplifications are generally largest in the Southern Hemisphere extratropics, where the 1961–2000 reference gain is smallest, and weakest in the tropics. In the most recent period (2006–2020), the amplification factors are strongest, with the RS and RO datasets on the high end of the spread (near a factor of 5 in global total AHC) and somewhat smaller but still high from the reanalyses (around a factor of 4).
For the latent AHC amplification factors, we see moderate values in the 1993–2020 period in the global mean and tropics. In the tropics, the lower uncertainty bound for amplification is slightly below 1 during all three recent trend periods. The spread of the amplification factors increases for the most recent periods, which is, on the one hand, due to the shorter duration. The range increase is also related to the inclusion of the RS and RO datasets after 2000, which contribute the largest and smallest latent AHC gain amplification factors. For 2006–2020, the global mean amplification factor from RO is about 2, whereas from the RS dataset it is near 5. Regarding latitudinal bands, the amplification factors are again strongest in the extratropics, where the 1961–2000 reference gains are also smallest, exhibiting a large spread, especially in the southern extratropics. The relatively large amplification factors of the RS WEGC Vaisala dataset are likely exaggerated due to the well-documented dry bias of the early RS humidity sensors as noted above (Wang et al., 2002; Vömel et al., 2007; Verver et al., 2006).
Despite the uncertainties and spread described, the overall message from Fig. 5 and Table 2 is very clear and substantially reinforcing the evidence from the initial von Schuckmann et al. (2020) assessment: the trends in the AHC, including in its latent heat component, show that atmospheric heat gain has strongly increased over the recent decades.
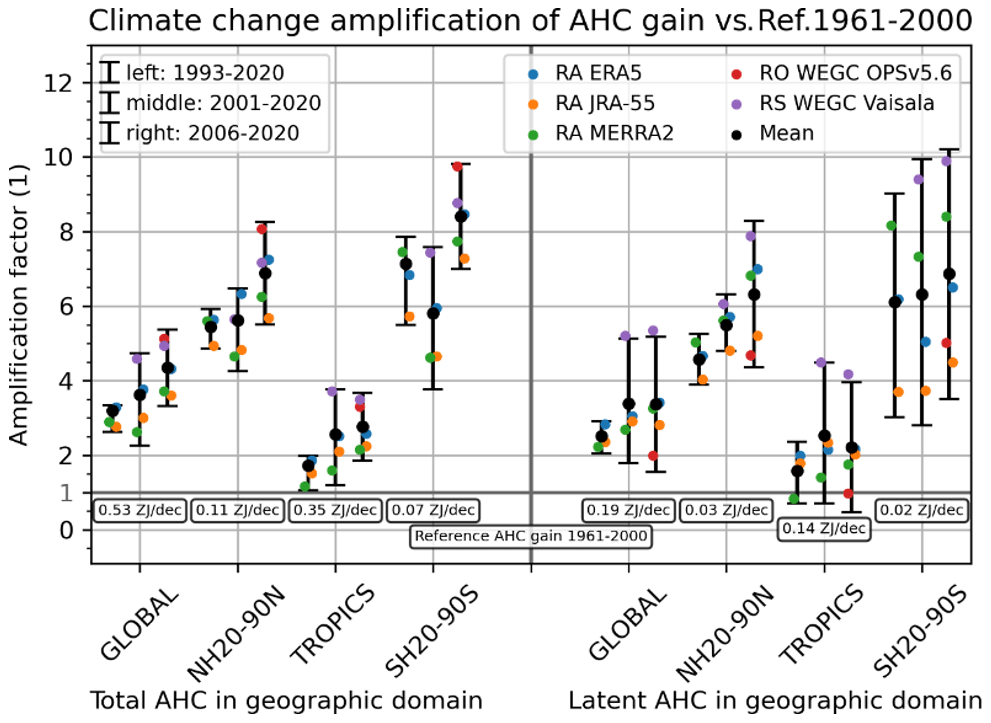
Figure 5Amplification of long-term trends in AHC anomalies (“AHC gain”) for total AHC (left) and latent-only AHC (right) in four geographic domains (global, Northern Hemisphere extratropics, tropics, Southern Hemisphere extratropics) for three recent time periods (legend upper left) expressed as a ratio of the trend of each period relative to the trend in the previous-century reference period (1961–2000) (noted below the reference line where the amplification factor equals 1). The amplification factor for each recent-trend case (for the four domains of both total and latent AHC) is depicted for the mean anomaly serving as best estimate (larger black circles) and the related recent trends in the individual-dataset anomalies (colored circles as per upper-right legend). The related 90 % uncertainty range (black error bar) is estimated from the spread (standard deviation) of the individual-dataset amplification factors. The trend in the mean anomaly over 1961–2000 is used as the reference AHC gain.
Table 2Long-term trend values in mean AHC anomalies (AHC gains; in units of zettajoule per decade (ZJ per decade) and terrawatt (TW), the latter listed in parentheses) and amplification factors vs. the 1961–2000 reference gain (lines marked “Ref.”), for total AHC (left block) and latent-only AHC (right block) for the three recent time periods in four geographic domains as illustrated in Fig. 5. The AHC gain and amplification values are listed together with their 90 % confidence ranges.

In previous studies, the land term of the Earth heat inventory was considered as the heat used to warm the continental subsurface (Hansen et al., 2011; Rhein et al., 2013; von Schuckmann et al., 2020). Temperature changes within the continental subsurface are typically retrieved by analyzing the global network of temperature–depth profiles, measured mostly in the Northern Hemisphere, southern Africa, and Australia. Each temperature profile records changes in subsurface temperatures caused by the heat propagated through the ground due to alterations in the surface energy balance (Cuesta-Valero et al., 2021b). Such perturbations in the subsurface temperature profiles can be analyzed to recover the changes in past surface conditions that generated the measured profile, allowing a reconstruction of the evolution of ground surface temperatures and ground heat fluxes at decadal to centennial timescales (Beltrami et al., 2002; Beltrami and Mareschal, 1992; Demezhko and Gornostaeva, 2015; Hartmann and Rath, 2005; Hopcroft et al., 2007; Jaume-Santero et al., 2016; Lane, 1923; Pickler et al., 2016; Shen et al., 1992). Although previous estimates only considered changes in ground temperatures for representing the heat storage by exposed land, ground heat storage has been found to be the second largest term of the Earth heat inventory, accounting for 4 % to 6 % of the total heat in the Earth system (von Schuckmann et al., 2020, Sect. 6).
The ground heat is, nevertheless, not the only energy component of the continental landmasses. Other processes with large thermodynamic coefficients, such as permafrost thawing and the warming of inland water bodies, occur across large areas, leading to the exchange of large amounts of heat with its surroundings over time. To account for those heat exchanges, a recent study (Cuesta-Valero et al., 2023a) has estimated the heat uptake by permafrost thawing and the warming of inland water bodies, as well as ground heat storage from subsurface temperature profiles, resulting in a comprehensive estimate of continental heat storage. Therefore, our estimate is different to terrestrial or land estimates, as we take into account the subsurface and water bodies of the continental landmasses and thus not the land surface. The authors used the same global network of subsurface temperature profiles as in von Schuckmann et al. (2020) to estimate ground heat storage but applied an improved inversion technique to analyze the profiles. This new technique is based on combining bootstrap sampling with a widely used singular value decomposition (SVD) algorithm (e.g., Beltrami and Mareschal, 1992) to retrieve past changes in surface temperatures and ground heat fluxes, which also resulted in smaller uncertainty estimates for global results (Cuesta-Valero et al., 2022). Heat uptake from permafrost thawing was estimated using a large ensemble of simulations performed with the CryoGridLite permafrost model (Nitzbon et al., 2022). Ground stratigraphies required for this purpose, including ground ice distributions, were generated using various global ground datasets. For soil properties, we used the datasets described in Masson et al. (2003) and Faroux et al. (2013); for soil organic carbon, we used the dataset described in Hugelius et al. (2013), and for excess ground ice content, we used Brown et al. (1997). Latent heat storage due to melting of ground ice is evaluated to a depth of 550 m over the Arctic region. Uncertainty ranges are evaluated using 100-parameter ensemble simulations with strongly varied soil properties and soil ice distributions. The climate forcing at the surface is based on a paleoclimate simulation performed by the Commonwealth Scientific and Industrial Research Organization (CSIRO), providing the initialization of the permafrost model, and data from the ERA-Interim reanalysis since 1979 onwards. Heat storage by inland water bodies was estimated by integrating water temperature anomalies in natural lakes and reservoirs from a set of Earth system model (ESM) simulations participating in the Inter-Sectoral Impact Model Intercomparison Project phase 2b (ISIMP2b) (Frieler et al., 2017; Grant et al., 2021; Golub et al., 2022). Heat storage is then computed using simulations with four global lake models following the methodology presented in Vanderkelen et al. (2020) but replacing the cylindrical lake assumption in that study for a more detailed lake morphometry, which leads to a more realistic representation of lake volume.
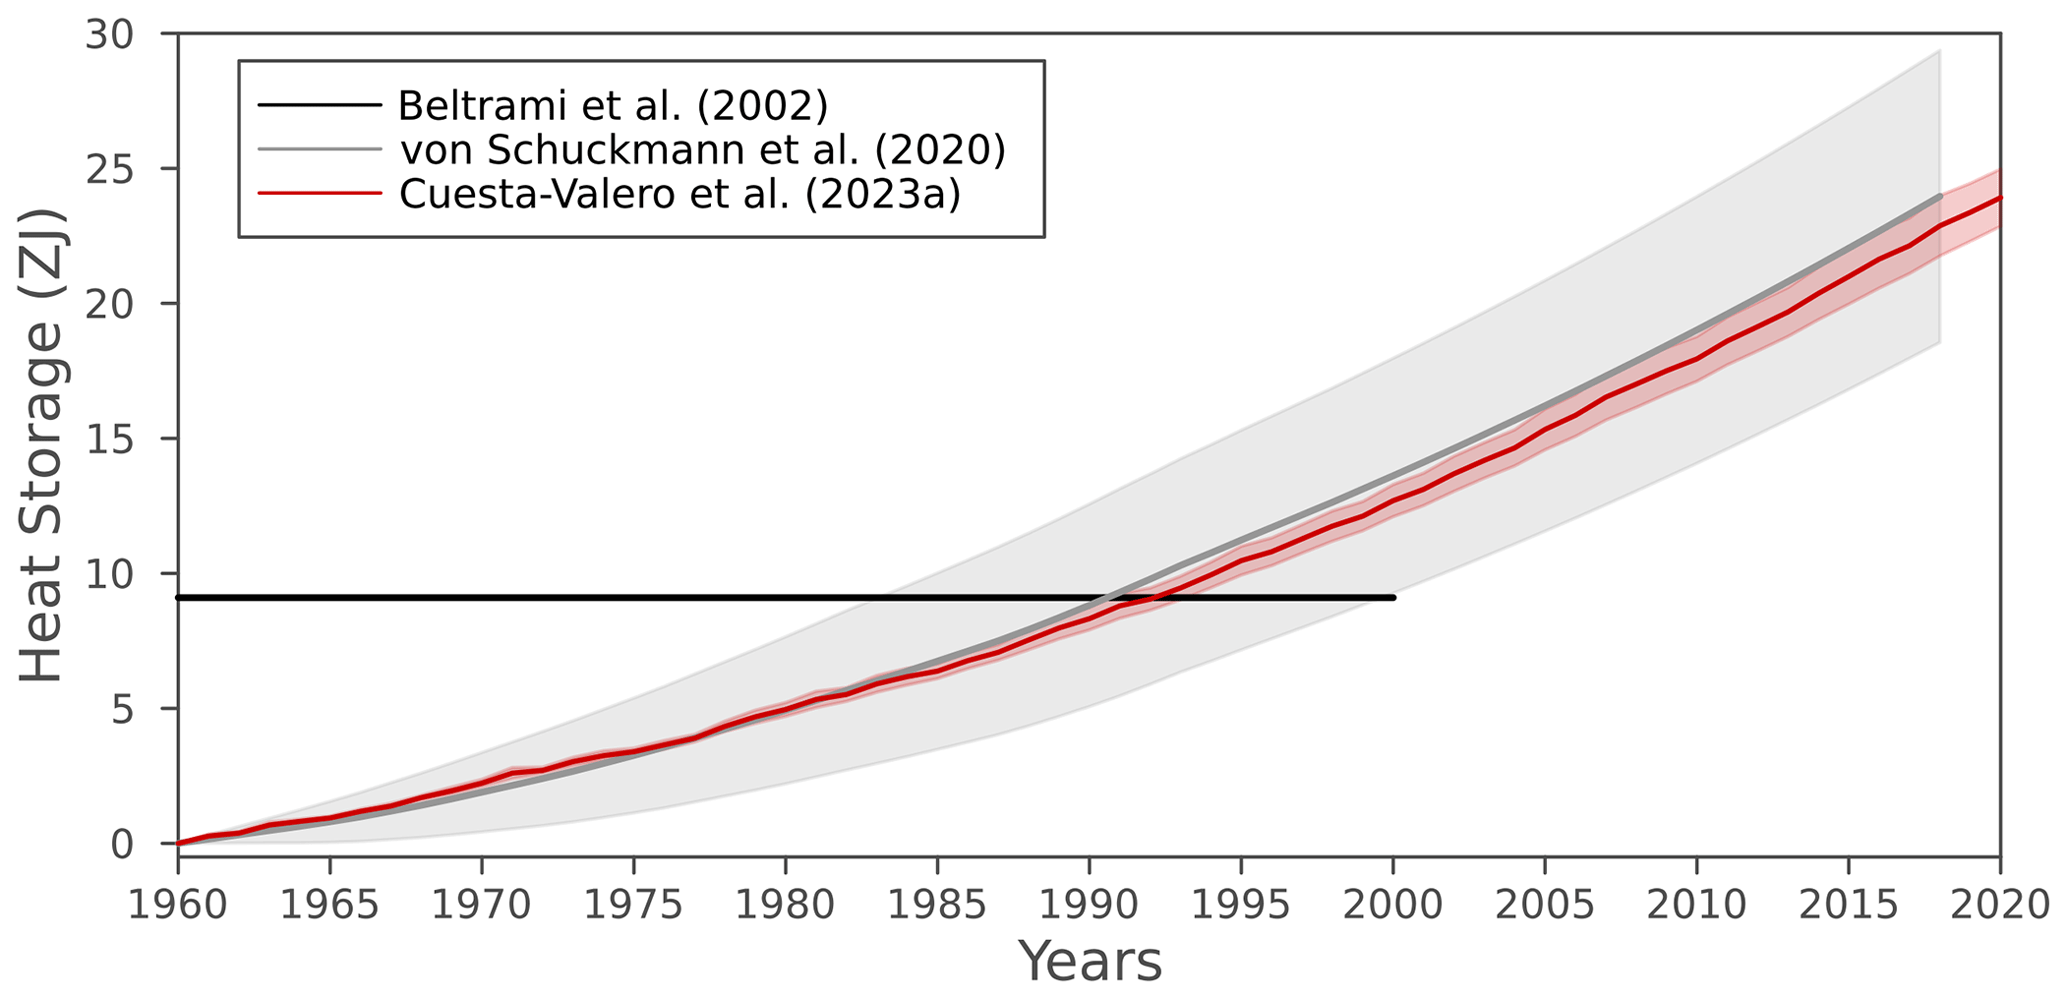
Figure 6Continental heat storage from Beltrami et al. (2002) (black), von Schuckmann et al. (2020) (gray), and Cuesta-Valero et al. (2023a) (red). Gray and red shadows show the uncertainty range of the heat storage from von Schuckmann et al. (2020) and Cuesta-Valero et al. (2023a), respectively.
Figure 6 shows the three main estimates of heat gain by the continental landmasses since 1960. The first global estimate of continental heat storage was provided by Beltrami et al. (2002), consisting of changes in ground heat content for the period 1500–2000 as time steps of 50 years (black line in Fig. 6). These estimates were retrieved by inverting 616 subsurface temperature profiles constituting the global network of subsurface temperature profiles in 2002, yielding a heat gain of 9.1 ZJ during the second half of the 20th century. A comprehensive update was included in von Schuckmann et al. (2020) using the results of Cuesta-Valero et al. (2021b) (gray line in Fig. 6), with the main difference consisting of the use of a larger dataset with 1079 subsurface temperature profiles. Since many of these new profiles were measured at a later year than those in Beltrami et al. (2002), the inversions from this new dataset were able to include the recent warming of the continental subsurface, yielding higher ground heat content than those from Beltrami et al. (2002). Concretely, the estimates in von Schuckmann et al. (2020) showed a heat gain of 24±5 ZJ from 1960 to 2018.
Recently, a new estimate of continental heat gain including the heat used in permafrost thawing and in warming inland water bodies was presented in Cuesta-Valero et al. (2023a) (red line in Fig. 6), achieving heat gains of 24±2 ZJ since 1960 and 21±2 ZJ since 1971 (see also Fig. 8). Despite considering the heat stored in permafrost thawing, the warming of inland water bodies, and the warming of the ground, the retrieved continental heat storage is similar to the values from ground warming in von Schuckmann et al. (2020). There is a difference of ∼3 ZJ between the average ground heat storage in Cuesta-Valero et al. (2022) (21.6±0.2 ZJ) and in von Schuckmann et al. (2020) (24±5 ZJ), which is similar to the heat storage in inland water bodies and the heat storage due to permafrost thawing together (see below). That is, the decrease in ground heat storage in the new estimates is compensated by the heat storage in inland water bodies and permafrost degradation. Another important result is the narrower confidence interval in estimates from Cuesta-Valero et al. (2023a), which is directly related to the new bootstrap technique used to invert the subsurface temperature profiles (Cuesta-Valero et al., 2022). This new bootstrap technique offers a more adequate statistical framework than the technique used in von Schuckmann et al. (2020) as demonstrated in Cuesta-Valero et al. (2022); thus, we are confident in the robustness of the lower uncertainty estimate for ground heat storage presented here. Heat storage within inland water bodies has reached 0.2±0.4 ZJ since 1960, with permafrost thawing accounting for 2±2 ZJ. Therefore, ground heat storage is the main contributor to continental heat storage (90 %), with inland water bodies accounting for 0.7 % of the total heat and permafrost thawing accounting for 9 %. Despite the smaller proportion of heat stored in inland water bodies and permafrost thawing, several important processes affecting both society and ecosystems depend on the warming of lakes and reservoirs, as well as on the thawing of ground ice (Gädeke et al., 2021). Therefore, it is important to continue quantifying and monitoring the evolution of heat storage in all three components of the continental landmasses.
Changes in Earth's cryosphere affect almost all other elements of the environment including the global sea level, ocean currents, marine ecosystems, atmospheric circulation, weather patterns, freshwater resources, and the planetary albedo (Abram et al., 2019). The cryosphere includes frozen components of the Earth system that are at or below the land and ocean surface: snow, glaciers, ice sheets, ice shelves, icebergs, sea ice, inland water body ice (e.g., lake, river), permafrost, and seasonally frozen ground (IPCC, 2019). In this study, we estimate the heat uptake by the melting of ice sheets (including both floating and grounded ice), glaciers, and sea ice at the global scale (Fig. 7). Notwithstanding the important role that snow cover plays in the Earth's energy surface budget as a result of changes in the albedo (de Vrese et al., 2021; Qu and Hall, 2007; Weihs et al., 2021), its influence on the temperature of underlying permafrost (Jan and Painter, 2020; Park et al., 2015), or on sea ice in the Arctic (Perovich et al., 2017; Webster et al., 2021) and Antarctica (Eicken et al., 1995; Nicolaus et al., 2021; Shen et al., 2022), estimates of changes in global snow cover are still highly uncertain and not included in this inventory. However, they should be considered in future estimates. Similarly, changes in lake ice cover (Grant et al., 2021) are not taken into account here and warrant more attention in the future. Permafrost is accounted for in the land component (see Sect. 4).
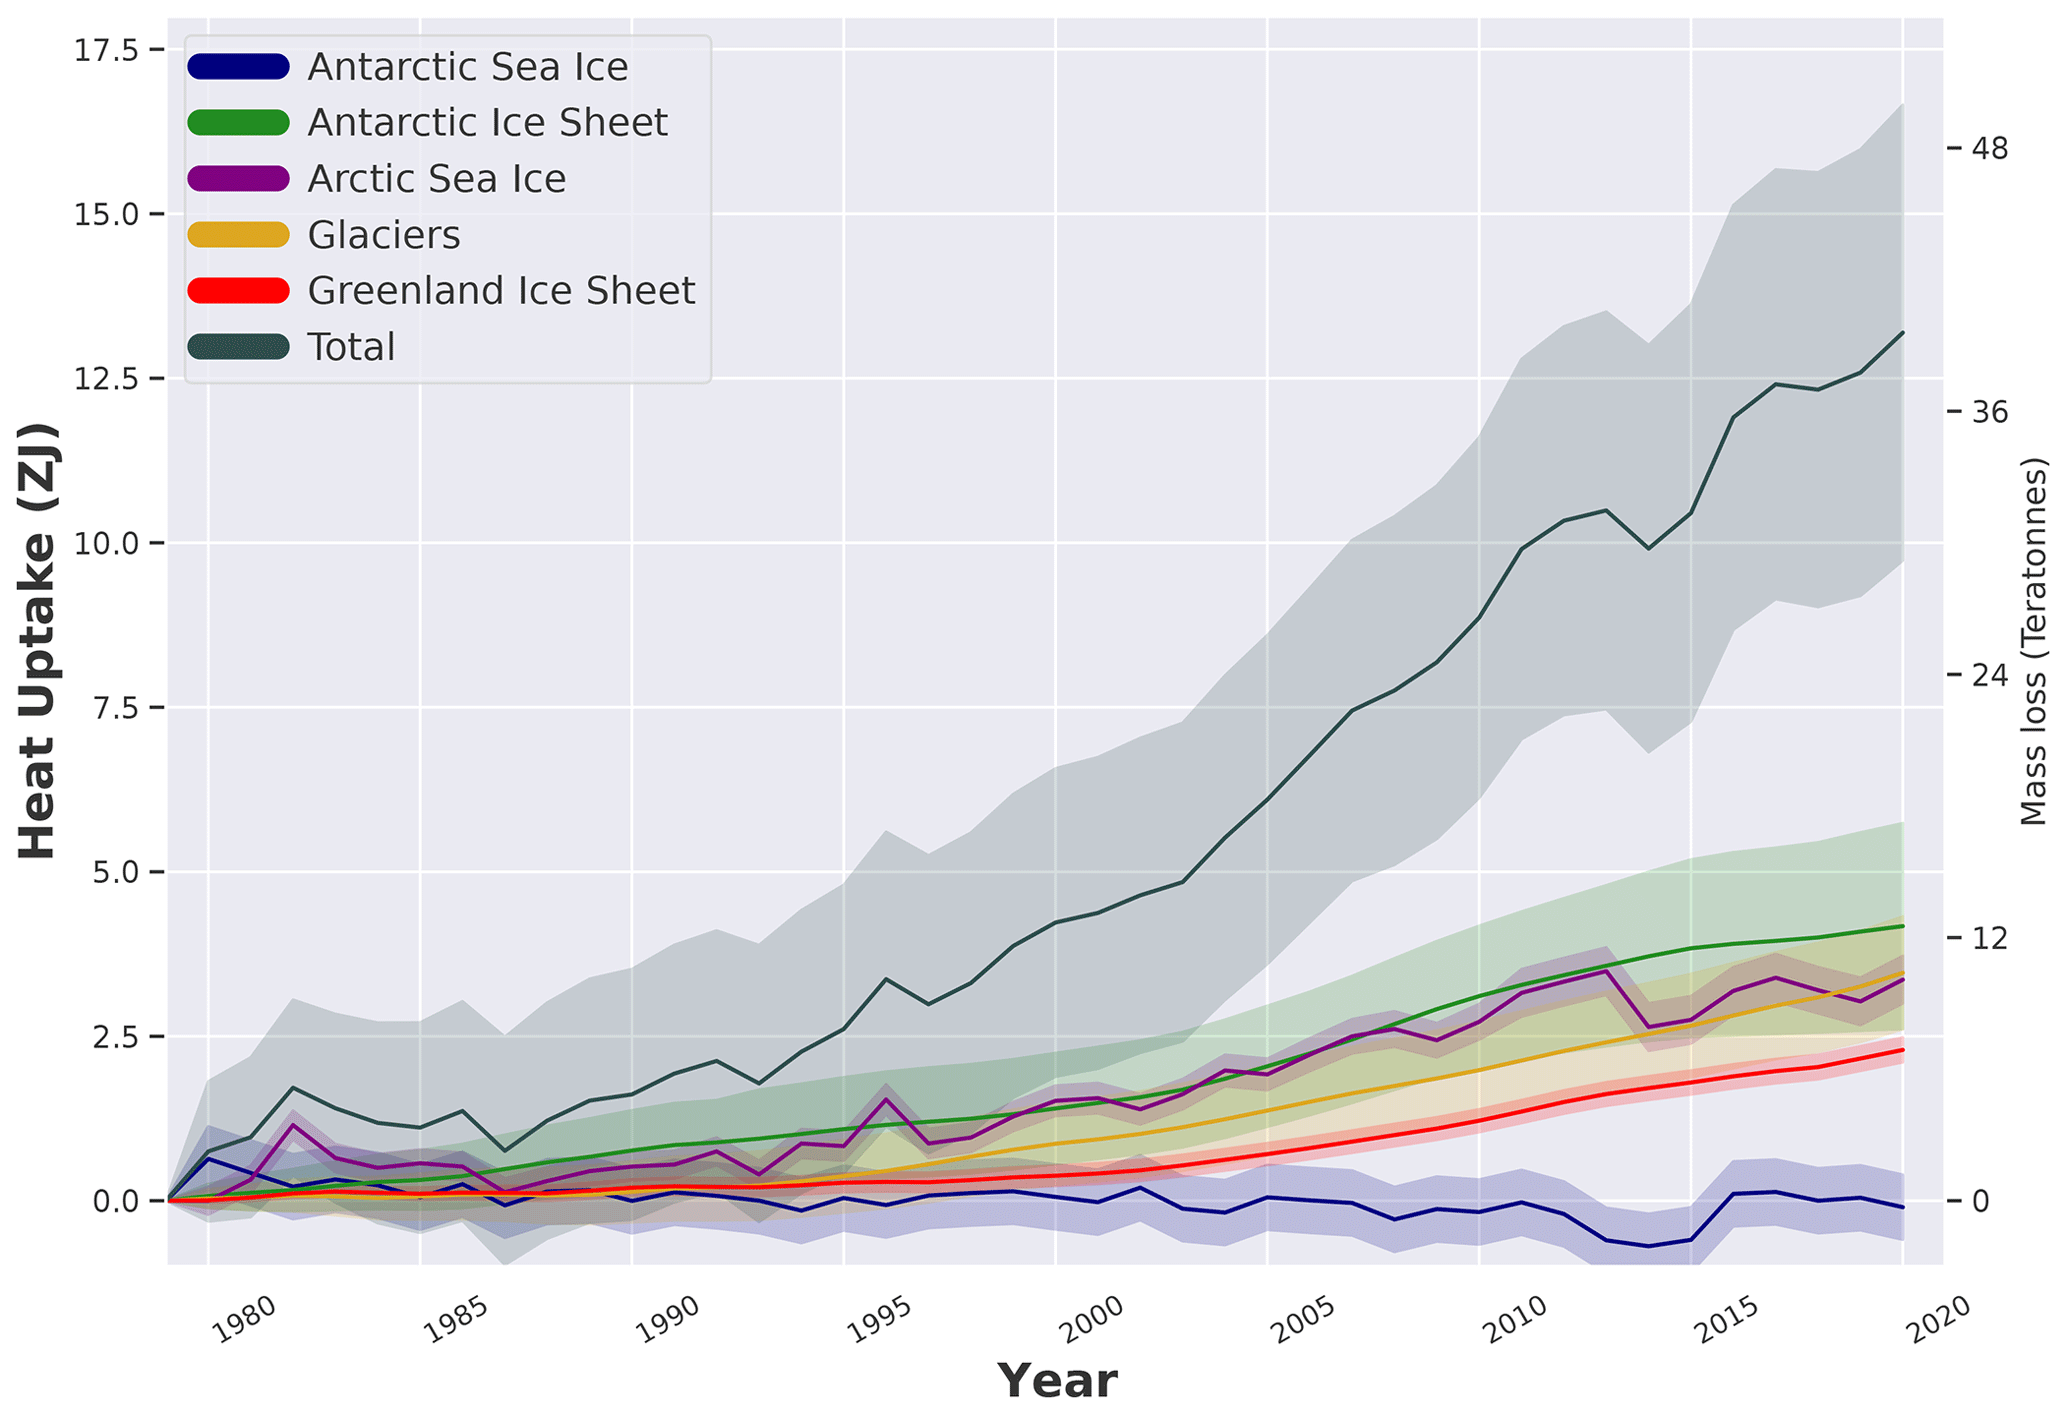
Figure 7Heat uptake (in ZJ) and mass loss (in trillions of tonnes) for the Antarctic Ice Sheet (grounded and floating ice, green), glaciers (orange), Arctic sea ice (purple), Greenland Ice Sheet (grounded and floating ice, red), and Antarctic sea ice (blue), together with the sum of the energy uptake within each one of its components (total, black). Uncertainties are 95 % confidence intervals provided as shaded areas. See the text for more details.
We equate the energy uptake by the cryosphere (glaciers, grounded and floating ice of the Antarctic and Greenland ice sheets, and sea ice) with the energy needed to drive the estimated mass loss. In doing so, we assume that the energy change associated with the temperature change of the remaining ice is negligible. As a result, the energy uptake by the cryosphere is directly proportional to the mass of melted ice:
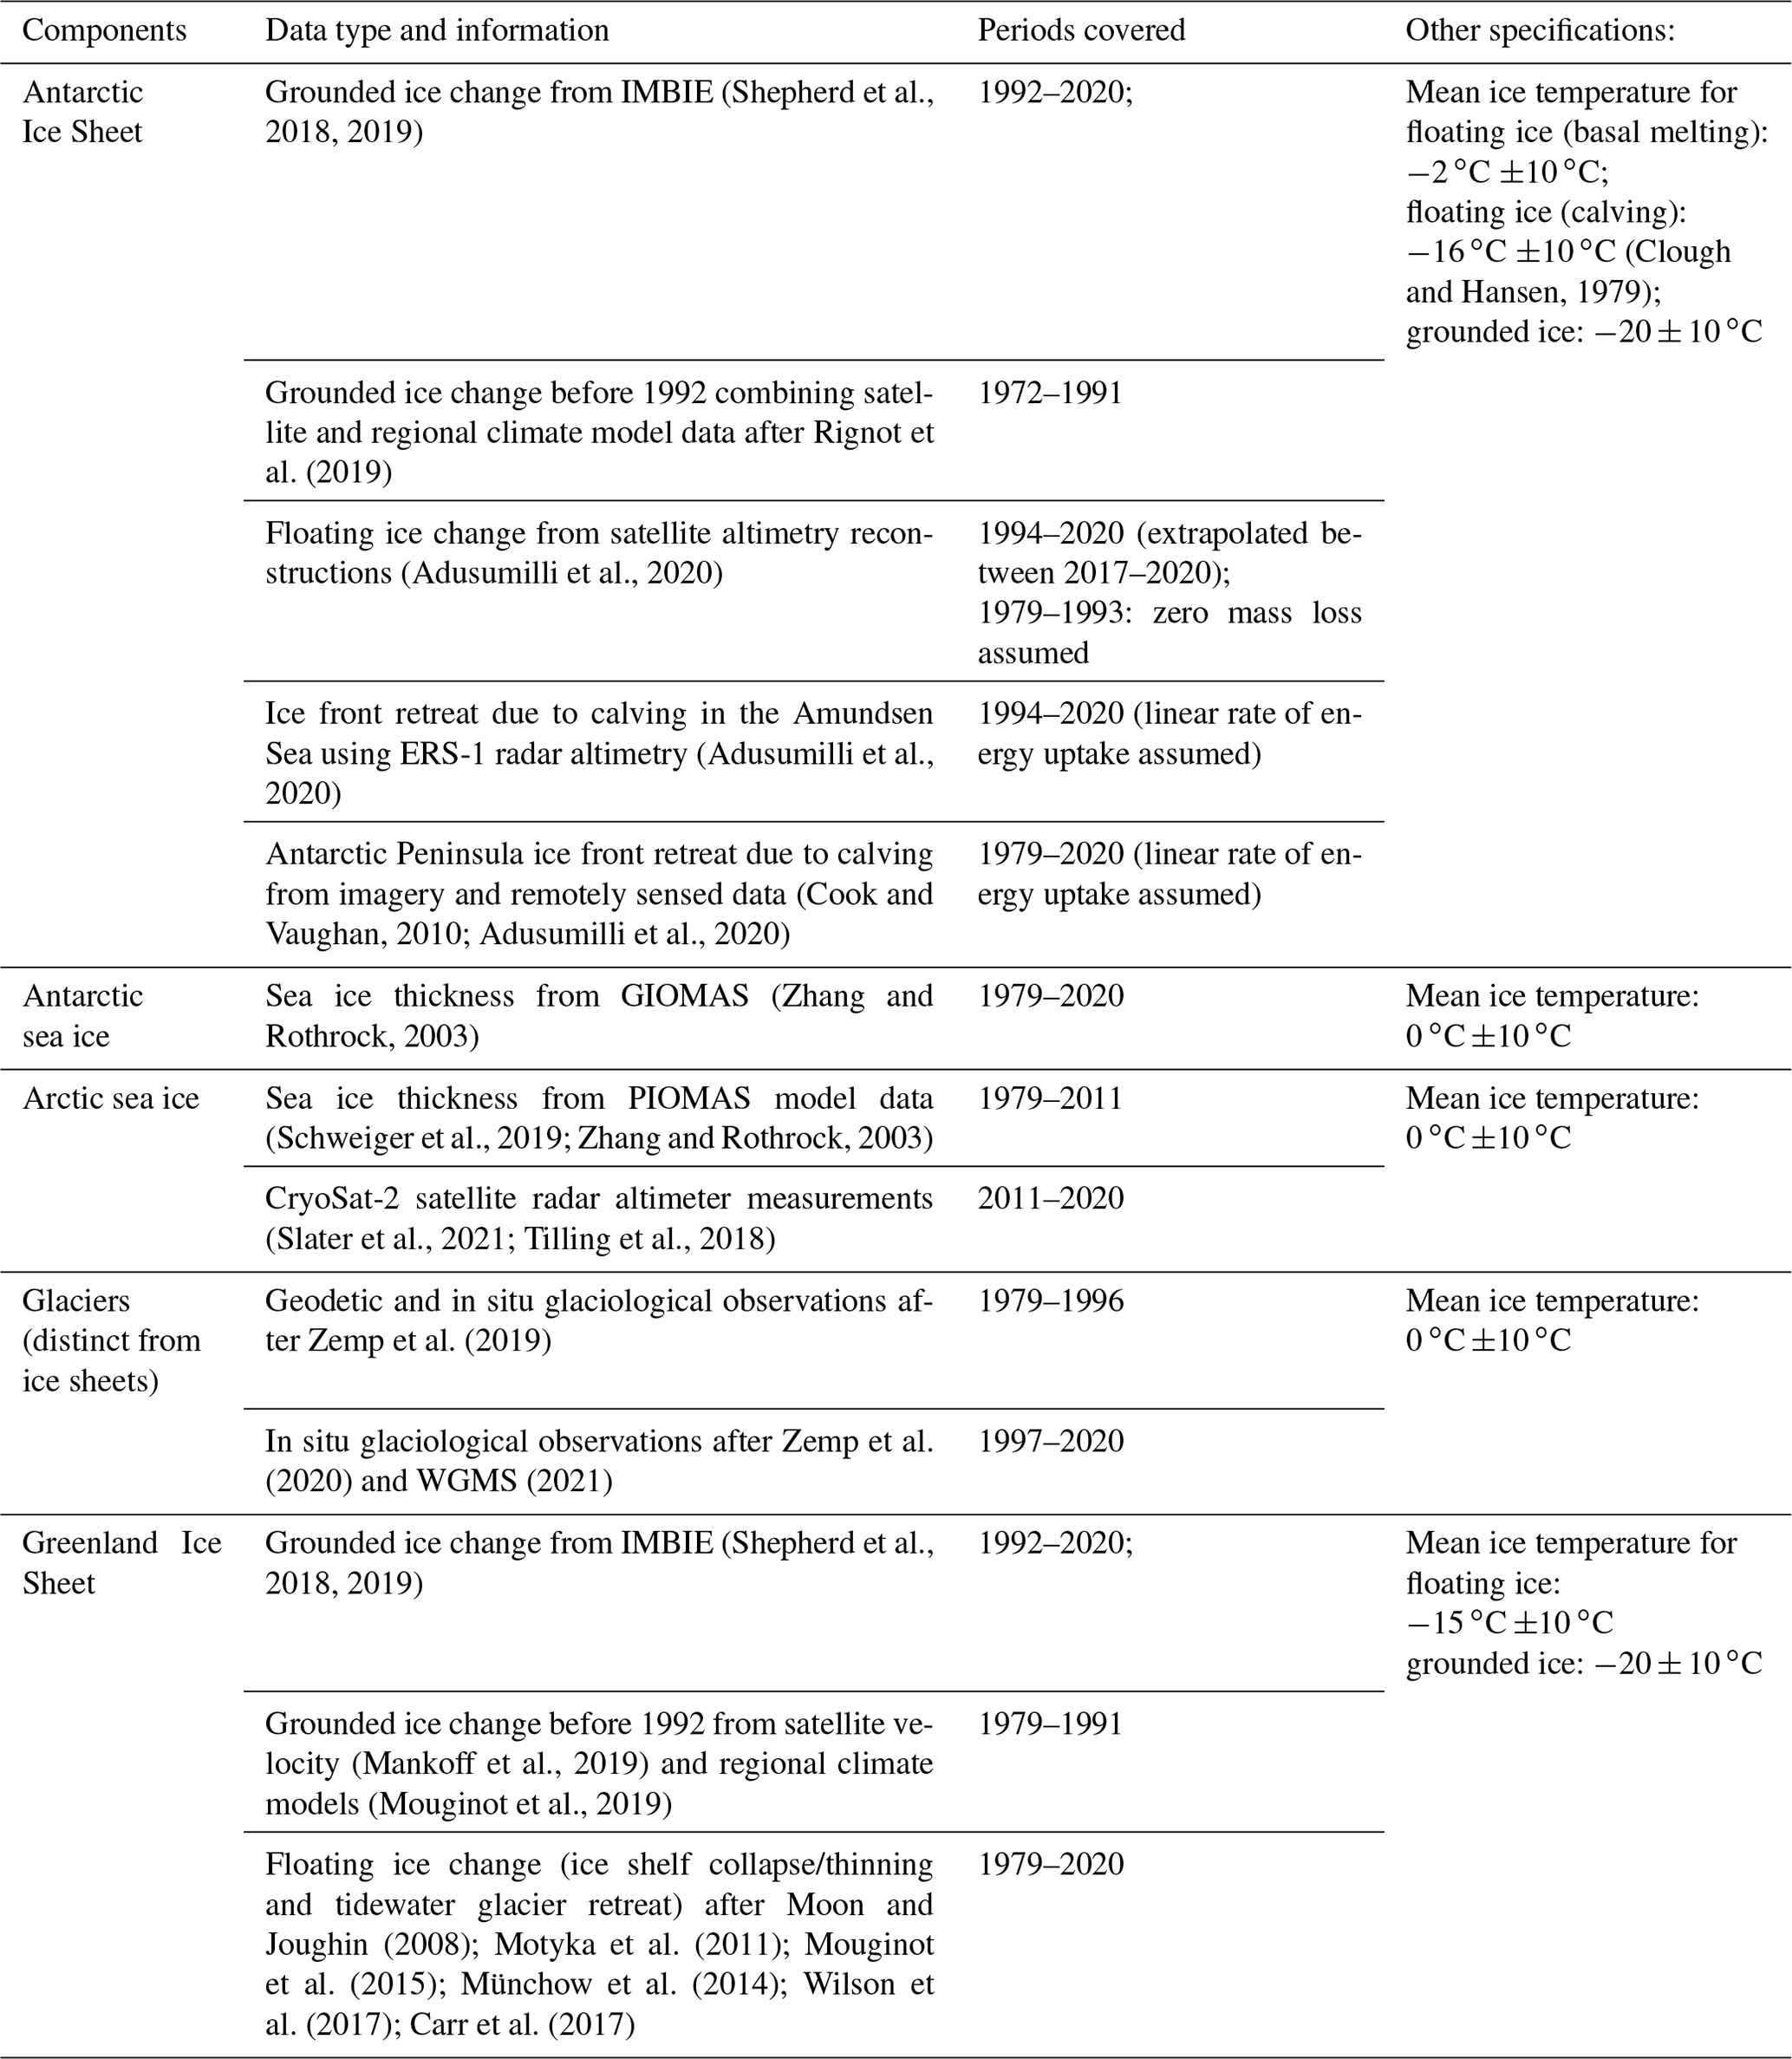
where, for any given component, ΔM is the mass of ice loss, L is the latent heat of fusion, c is the specific heat capacity of the ice, and ΔT is the rise in temperature needed to bring the ice to the melting point. For consistency with previous estimates (Ciais et al., 2014; Slater et al., 2021; von Schuckmann et al., 2020), we use a constant latent heat of fusion of 3.34×10⁵ J kg−1, a specific heat capacity of 2.01×10³ J kg−1 ∘C−1, and a density of ice of 917 kg m−3. Estimating the energy used to warm the ice to its melting point requires knowledge of the mean ice temperature for each component. Here we assume a temperature of −15 ∘C for floating ice in Greenland, −2 ∘C for the floating ice in Antarctica, ∘C for grounded ice in Antarctica and Greenland, and 0 ∘C for sea ice and glaciers. Although this assumption is poorly constrained, the energy required to melt ice is primarily associated with its phase transition, and the fractional energy required for warming is a small percentage (<1 % ∘C−1) of the total energy uptake (Slater et al., 2021). Nevertheless, we include an additional uncertainty of ±10 ∘C on the assumed initial ice temperature within our estimate of the energy uptake. An overview of all datasets used and their availabilities are provided in Table 3 and are further described in the following.
Table 3Overview on data used and their availability for the estimate of heat available to melt the cryosphere over the period 1979–2020. Backward extension to 1971 for the heat inventory is based on the assumption of negligible contribution. General specifications include constant values for latent heat of fusion of 3.34×10⁵ J kg−1, specific heat capacity of 2.01×10³ J kg−1 ∘C−1, density of ice of 917 kg m−3 for first-year ice and 882 kg m−3 for multiyear ice; see also Ciais et al. (2014), Slater et al. (2021), and von Schuckmann et al. (2020). Other component specifications are provided in the table.
Grounded ice losses from the Greenland and Antarctic ice sheets from 1992 to 2020 are estimated from a combination of 50 satellite-based estimates of ice sheet mass balance produced from observations of changes in ice sheet volume, flow, and gravitational attraction, compiled by the Ice Sheet Mass Balance Inter-comparison Exercise (IMBIE3) (Shepherd et al., 2018, 2019). To extend those time series further back in time, we use ice sheet mass balance estimates produced using the input–output method, which combines estimates of solid ice discharge with surface mass balance estimates. Satellite estimates of ice velocity are available from the Landsat historical archive from 1972, allowing for the calculation of ice discharge before the 1990s, while surface mass balance is estimated from regional climate models. We extend the IMBIE mass balance time series backwards to 1979 for Greenland using Mouginot et al. (2019) and Mankoff et al. (2019) and for Antarctica from 1972 to 1991 using Rignot et al. (2019).
Changes in Antarctic floating ice shelves due to thinning between 1994 and 2017 are derived from satellite altimetry reconstructions (Adusumilli et al., 2020). There were no estimates of ice shelf thinning between 1979 and 1993; therefore, we assume zero mass loss from ice shelf thinning during that period. Changes in Antarctic ice shelves due to increased calving in the Antarctic Peninsula and the Amundsen Sea sector are derived from ERS-1 radar altimetry (Adusumilli et al., 2020) for 1994–2017. For the 1979–1994 period, we only have data for changes in the extent of the Antarctic Peninsula ice shelves from Cook and Vaughan (2010). These are converted to changes in mass using an ice shelf thickness of 140±110 m ice equivalent, which represents the range of ice thickness values for the portions of Antarctic Peninsula ice shelves that have collapsed since 1994 (Adusumilli et al., 2020). Once icebergs break off from large Antarctic floating ice shelves, the timescales of dissolution of the icebergs are largely unknown; therefore, we assumed a linear rate of energy uptake between 1979–2020. For icebergs, we use an initial temperature of −16 ∘C, which was the mean ice temperature in the Ross Ice Shelf J-9 ice core (Clough and Hansen, 1979). There are no large-scale observations or manifestations of significant firn layer temperature change for the Antarctic Ice Shelf; for example, there is no significant trend in the observationally constrained model outputs of surface melt described in Smith et al. (2020). Therefore, the change in temperature of any ice that does not melt is assumed to be negligible.
Changes in the floating portions of the Greenland Ice Sheet include ice shelf collapse, ice shelf thinning, and tidewater glacier retreat. As in von Schuckmann et al. (2020), we assume no ice shelf mass loss before 1997 and estimate a loss of 13 Gt yr−1 after 1997 based on studies of the Zacharie Isstrom, C. H. Ostenfeld, Petermann, Jakobshavn, 79N, and Ryder glaciers (Mouginot et al., 2015; Moon and Joughin, 2008; Münchow et al., 2014; Motyka et al., 2011; Wilson et al., 2017). We assign a generous uncertainty of 50 % to this value. For tidewater glacier retreat, we note a mean retreat rate of 37.6 m yr−1 during 1992–2000 and 141.7 m yr−1 during 2000–2010 (Carr et al., 2017). We assume that the former estimate is also valid for 1979–1991 and that the latter estimate is valid for 2011–2020. Assuming a mean glacier width of 4 km and thickness of 400 m, we estimate mass loss from glacier retreat to be 9.3 Gt yr−1 during 1979–2000 and 35.1 Gt yr−1 during 2000–2020. Based on firn modeling, we assessed that warming of Greenland's firn has not yet contributed significantly to its energy uptake (Ligtenberg et al., 2018).
The contributions from both the Antarctic and Greenland ice sheets to the EEI are obtained by summing the mass loss from the individual components (ice shelf mass, grounded ice mass, and ice shelf extent) for each ice sheet separately, and, given that the datasets used for each component are independent, the uncertainties were summed in quadrature. This is then converted to an energy uptake according to the equation above.
Glaciers are another part of the land-based ice, and we here include glaciers found in the periphery of Greenland and Antarctica (but distinct from the ice sheets) in our estimate. We build our estimate on the international efforts to compile and reconcile measurements of glacier mass balance, under the lead of the World Glacier Monitoring Service (WGMS4). Up to 2016, the results are based on Zemp et al. (2019), who combined geodetic mass balance observations from digital elevation model (DEM) differencing on long temporal and large spatial scales with in situ glaciological observations, which are spatially less representative but provide information of higher temporal resolution. Through this combination, they achieve coverage that is globally complete yet retains the interannual variability well. For 2017 to 2021, the numbers are based on the ad hoc method by Zemp et al. (2020), which corrects for the spatial bias of the limited number of recent in situ glaciological observations that are available with short delay (WGMS, 2021), to derive globally representative estimates. Error bars include uncertainties related to the in situ and spaceborne observations, extrapolation to unmeasured glaciers, density conversion, and to glacier area and its changes. For the conversion from mass loss to energy uptake, only the latent heat uptake is considered, which is based on the assumption of ice at the melting point, due to a lack of glacier temperature data at the global scale. Moreover, since the absolute mass change estimates are based on geodetic mass balances, mass loss of ice below floatation is neglected. While this is a reasonable approximation concerning the glacier contribution to sea-level rise, it implies a systematic underestimation of the glacier heat uptake. While to our knowledge there are no quantitative estimates available of glacier mass loss below sea level on the global scale, it is reasonable to assume that this effect is minor, based on the volume–altitude distribution of glacier mass (Farinotti et al., 2019; Millan et al., 2022). Further efforts are underway within the Glacier Mass Balance Intercomparison Exercise (GlaMBIE5), particularly to reconcile global glacier mass changes, including estimates from gravimetry and altimetry, and to further assess related sources of uncertainties (Zemp et al., 2019).
Sea ice, formed from freezing ocean water and further thickened by snow accumulation, is not only another important aspect of the albedo effect (Kashiwase et al., 2017; Zhang et al., 2019) and water formation processes (Moore et al., 2022) but also provides essential services for polar ecosystems and human systems in the Arctic (Abram et al., 2019). Observations of sea ice extent are available over the satellite era, i.e., since the 1970s, but ice thickness data – required to obtain changes in volume – have only recently become available through the launch of CryoSat-2 and ICESat-2. For the Arctic, we use a combination of sea ice thickness estimates from the Pan-Arctic Ice-Ocean Modeling and Assimilation System (PIOMAS) between 1979 and 2011 (Schweiger et al., 2019; Zhang and Rothrock, 2003) and CryoSat-2 satellite radar altimeter measurements between 2011 and 2020 when they are available (Tilling et al., 2018; Slater et al., 2021). PIOMAS assimilates ice concentration and sea surface temperature data and is validated with most available thickness data (from submarines, oceanographic moorings, and remote sensing) and against multidecadal records constructed from satellite (Labe et al., 2018; Laxon et al., 2013; Wang et al., 2016). We note that the PIOMAS domain does not extend sufficiently far south to include all regions covered by sea ice in winter (Perovich et al., 2017). Given that the entirety of the regions that are unaccounted for (e.g., the Sea of Okhotsk and the Gulf of St Lawrence) are only seasonally ice covered since the start of the record, this should not influence the results. We convert monthly estimates of sea ice volume from CryoSat-2 satellite altimetry to mass using densities of 882 and 916.7 kg m−3 in regions of multiyear and first-year ice, respectively (Tilling et al., 2018). During the summer months (May to September), the presence of melt ponds on Arctic sea ice makes it difficult to discriminate between radar returns from leads and sea ice floes, preventing the retrieval of summer sea ice thickness from radar altimetry (Tilling et al., 2018). As a result, we use the winter-mean (October to April) mass trend across the Arctic for both CryoSat-2 and PIOMAS estimates for consistency. According to PIOMAS, winter Arctic sea ice mass estimates are 19 Gt yr−1 (6 %) smaller than the annual mass trend between 1979 and 2011 (−324 Gt yr−1) and so are a conservative estimate of Arctic sea ice mass change (Slater et al., 2021). The uncertainty in monthly Arctic sea ice volume measurements from CryoSat-2 ranges from 14.5 % in October to 13 % in April (Tilling et al., 2018; Slater et al., 2021), and it is estimated as km3 for PIOMAS (Schweiger et al., 2011).
Satellite radar altimeter retrievals of sea ice thickness in the Southern Ocean are complicated by the presence of thick snow layers with unknown radar backscatter properties on Antarctic sea ice floes. As a result, no remote sensing estimates are available for Antarctic sea ice, and we use sea ice volume anomalies from the Global Ice-Ocean Modeling and Assimilation System (GIOMAS; Zhang and Rothrock, 2003), which is the global equivalent to PIOMAS. GIOMAS output has been recently validated against in situ and satellite data by Liao et al. (2022). We compute Antarctic sea ice trends as annual averages between January and December. In the absence of a detailed characterization of uncertainties for these estimates, we use the uncertainty in GIOMAS sea ice thickness of 0.34 m (Liao et al., 2022) to estimate the uncertainty in GIOMAS sea ice volume to be km3, using an annual mean sea ice extent of 11.9×10⁶ km2 (Lavergne et al., 2019). One caveat to this is that the observational estimates have their own significant uncertainties (Kern et al., 2019; Liao et al., 2022). For future updates of the Earth heat inventory, we also aim to include observation-based (remote sensing) estimates in the Southern Ocean (Lavergne et al., 2019).
Our estimate of the total heat gain in the cryosphere amounts to 14±4 ZJ over the period 1971–2020 (see also Fig. 8 and Sect. 6) (assuming negligible contribution before 1979 according to the data availability limitation), which is consistent with the estimate obtained in von Schuckmann et al. (2020) within uncertainties. Approximately half of the cryosphere's energy uptake is associated with the melting of grounded ice, while the remaining half is associated with the melting of floating ice (ice shelves in Antarctica and Greenland, Arctic sea ice). Compared to earlier estimates and in particular the 8.83 ZJ estimate from Ciais et al. (2014), this larger estimate is a result of both the longer period of time considered and the improved estimates of ice loss across all components, especially the ice shelves in Antarctica. Contributions to the total cryosphere heat gain are dominated by the Antarctic Ice Sheet (including the floating and grounded ice, about 33 %) and Arctic sea ice (about 26 %), directly followed by the heat utilized to melt glaciers (about 25 %). The Greenland Ice Sheet amounts to about 17 %, whereas Antarctic sea ice is accounted for with a nonsignificant contribution of about 0.2 %.
Evaluations of the heat storage in the different Earth system components as performed in Sects. 2–5 now allow for the establishment of the Earth heat inventory. Estimates for all Earth system components cover a core period of 1971–2020, except for the cryosphere where negligible contribution is assumed before 1979. Our results reconfirm a continuous accumulation of heat in the Earth system since our estimate begins (Fig. 8). The total Earth system heat gain in this study amounts to 380±62 ZJ over the period 1971–2020. For comparison, IPCC AR6 obtained a total heat gain of 434.9 (324.5 to 545.5) ZJ for the period 1971–2018 and is hence consistent with our estimate within uncertainties (Forster et al., 2021). However, it is important to note that our estimate still excludes some aspects of Earth heat accumulation, such as, for example, the shallow areas of the ocean, which are challenging to be quantified with respect to gaps in the observing system.

Figure 8Total Earth system heat gain in ZJ (1 ZJ =1021 J) relative to 1960 and from 1960 to 2020. The upper ocean (0–300 m, light blue line, and 0–700 m, light blue shading) accounts for the largest amount of heat gain, together with the intermediate ocean (700–2000 m, blue shading) and the deep ocean below 2000 m depth (dark blue shading). The second largest contributor is the storage of heat on land (orange shading), followed by the gain of heat to melt grounded and floating ice in the cryosphere (gray shading) and heating of the atmosphere (magenta shading). Uncertainty in the ocean estimate also dominates the total uncertainty (dot-dashed lines derived from the standard deviations (2σ) for the ocean, cryosphere, land, and atmosphere). See Sects. 2–5 for more details of the different estimates. The dataset for the Earth heat inventory is published at the German Climate Computation Centre (DKRZ; https://www.dkrz.de/, last access: 29 March 2023) (see Sect. 7). Consistent with von Schuckmann et al. (2020), we obtain a total heat gain of 381±61 ZJ over the period 1971–2020, which is equivalent to a heating rate (i.e., the EEI) of 0.48±0.1 W m−2 applied continuously over the surface area of the Earth (5.10×10¹⁴ m2). The corresponding EEI over the period 2006–2020 amounts to 0.76±0.2 W m−2. The LOWESS method and associated uncertainty evaluations have been used as described in Sect. 2.
The estimate of heat storage in all Earth system components not only allows for obtaining a measure of how much and where heat is available for inducing changes in the Earth system (Fig. 1) but also to improve the accuracy of the Earth system's total heat gain. In 1971–2020 and for the total heat gain, the ocean accounts for the largest contributor with an about 89 % fraction of the global inventory. The second largest component in the Earth heat inventory relies on heat stored in land with an about 6 % contribution. The cryosphere component accounts for about 4 % and the atmosphere for about 1 %. For the most recent era of best available GCOS data for the Earth heat inventory since the year 2006, the fractions amount to about 89 % for the ocean, about 5 % for land, about 4 % for the cryosphere, and about 2 % for the atmosphere.
The change of the Earth heat inventory over time allows for an estimate of the absolute value of the Earth energy imbalance. Our results of the total heat gain in the Earth system over the period 1971–2020 is equivalent to a heating rate of 0.48±0.1 W m−2 and is applied continuously over the surface area of the Earth (5.10×10¹⁴ m2). For comparison, the heat gain obtained in IPCC AR5 amounts to 274±78 ZJ and 0.4 W m−2 over the period 1971–2010 (Rhein et al., 2013). In IPCC AR6, the total heat rate has been assessed by 0.57 (0.43 to 0.72) W m−2 for the period 1971–2018 and 0.79 (0.52 to 1.06) W m−2 for the period 2006–2018 (Forster et al., 2021). Consistently, we further infer a total heating rate of 0.76±0.2 W m−2 for the most recent era (2006–2020).
Thus, the rate of heat accumulation across the Earth system has increased during the most recent era as compared to the long-term estimate – an outcome which reconfirms the earlier finding in von Schuckmann et al. (2020) and which had then been concurrently and independently confirmed in Foster et al. (2021), Hakuba et al. (2021), Loeb et al. (2021), Liu et al. (2020), Raghuraman et al. (2021), and Kramer et al. (2021). The drivers of a larger EEI in the 2000s than in the long-term period since 1971 are still unclear, and several mechanisms are discussed in literature. For example, Loeb et al. (2021) argue for a decreased reflection of energy back into space by clouds (including aerosol cloud interactions) and sea ice and increases in well-mixed greenhouse gases (GHG) and water vapor to account for this increase in EEI. Kramer et al. (2021) refer to a combination of rising concentrations of well-mixed GHG and recent reductions in aerosol emissions to be accounting for the increase, and Liu et al. (2020) address changes in surface heat flux together with planetary heat redistribution and changes in ocean heat storage. Future studies are needed to further explain the drivers of this change, together with its implications for changes in the Earth system.
Besides heat, which is the focus of this study, Earth also stores energy chemically through photosynthesis in living and dead biomass with plant growth. Recent studies (Friedlingstein et al., 2022; Denning, 2022; Crisp et al., 2022) on the Global Carbon Budget and carbon cycle show that approximately 25 % of the added anthropogenic CO2 is removed from the atmosphere by increased plant growth, which is a result of fertilization by rising atmospheric CO2 and nitrogen inputs and of higher temperatures and longer growing seasons in northern temperate and boreal areas (Friedlingstein et al., 2022). This significant increase in carbon uptake by the biosphere indicates that more energy is stored inside biomass, together with the stored carbon. The quantification of the additional amount of energy stored inside the biosphere is outside the scope of this study.
The time series of the Earth heat inventory are published at DKRZ (https://www.dkrz.de/, last access: 24 January 2023) under https://www.wdc-climate.de/ui/entry?acronym=GCOS_EHI_1960-2020. More details are given below.
-
von Schuckmann et al. (2023): data for ocean heat content (Sect. 2) and the total heat inventory as presented in Sect. 6 are integrated.
-
Kirchengast et al. (2022): data for the atmospheric heat content are distributed (Sect. 3).
-
Cuesta-Valero et al. (2023b): data for the ground heat storage, together with the total continental heat gain, are provided (Sect. 4).
-
Vanderkelen and Thiery (2022): data for inland freshwater heat storage are included (Sect. 4).
-
Nitzbon et al. (2022b): data for permafrost are delivered (Sect. 4).
-
Adusumilli et al. (2022): data for the cryosphere heat inventory are provided.
The Digital Object Identifiers (DOIs) for data access are provided in Table 4.
Table 4Overview of Digital Object Identifiers (DOIs) for data access for the components of the Earth heat inventory and associated references. The results are presented in Fig. 8.
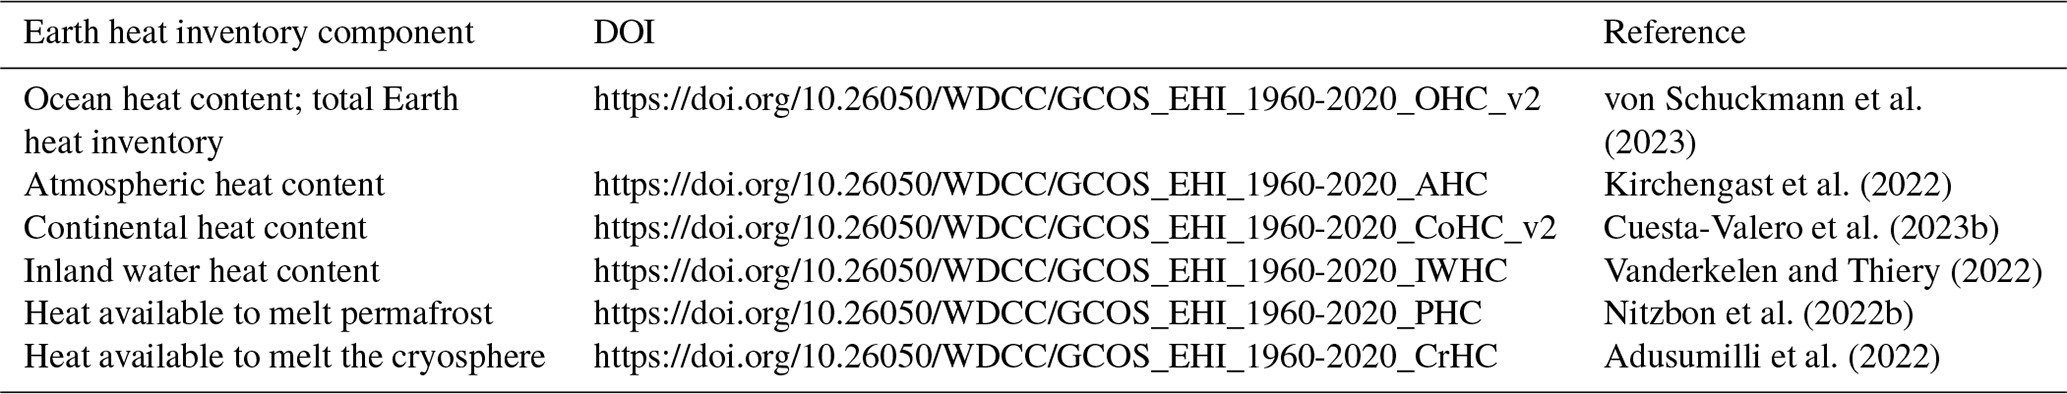
The Earth heat inventory is a global climate indicator integrating fundamental aspects of the Earth system under global warming. Particularly, the Earth heat inventory provides the best available current estimate of the absolute value of the Earth energy imbalance (Cheng et al., 2017a, 2019; Hakuba et al., 2021; Hansen et al., 2011; Loeb et al., 2012, 2022; Trenberth et al., 2016; von Schuckmann et al., 2020). Moreover, its evaluation enables an integrated view of the effective radiative climate forcing, Earth's surface temperature response, and the climate sensitivity (Forster et al., 2021; Hansen et al., 2011, 2005; Palmer and McNeall, 2014; Smith et al., 2015). Additionally, its quantification informs about the status of global warming in the Earth system as it integrates the heat “in the pipeline” that will ultimately warm the deep ocean and melt ice sheets in the long term (Hansen et al., 2011, 2005; IPCC, 2021b). The Earth heat inventory also reveals how much and where surplus anthropogenic heat is available for melting the cryosphere and warming the ocean, land, and atmosphere, which in turn allows for an evaluation of associated changes in the climate system, and it is essential to improve seasonal-to-decadal climate predictions and projections on century timescales to enable improved planning for and adaptation to climate change (Hansen et al., 2011; von Schuckmann et al., 2016, 2020). Regular international assessment on the Earth heat inventory enables concerted international and multidisciplinary collaboration and advancements in climate science, including contributing to the development of recommendations for the status and evolution of the global climate observing system (GCOS, 2021; von Schuckmann et al., 2020).
This study builds on the first internationally and multidisciplinary Earth heat inventory in 2020 (von Schuckmann et al., 2020) and provides an update on total Earth system heat accumulation, heat storage in all Earth system components (ocean, land, cryosphere, atmosphere), and the Earth energy imbalance up to the year 2020. Moreover, this study improved earlier estimates and further extended and fostered international collaboration, allowing researchers to move towards a more complete view of where and how much heat is stored in the Earth system through the addition of new estimates such as for permafrost thawing, inland freshwater (Sect. 4), and Antarctic sea ice (Sect. 5). Results obtained reveal a total Earth system heat gain of 381±61 ZJ over the period 1971–2020, with an associated total heating rate of 0.48±0.1 W m−2. About 89 % of this heat is stored in the ocean, about 6 % on land, about 4 % in the cryosphere, and about 1 % in the atmosphere (Figs. 8, 9). The analysis additionally reconfirms an increased heating rate which amounts to 0.76±0.2 W m−2 for the most recent era (2006–2020). The drivers for this change still need to be elucidated, and they most likely reflect the interplay between natural variability and anthropogenic change (Loeb et al., 2021; Kramer et al., 2021; Liu et al., 2020); their implications for changes in the Earth system are reflected in the many record levels of change in the 2000s reported elsewhere (e.g., Cheng et al., 2022b; Forster et al., 2021; Gulev et al., 2021).
The Paris Agreement builds upon the United Nations Framework Convention on Climate Change, and for the first time all nations agreed to undertake ambitious efforts to combat climate change, with the central aim to keep global temperature rise this century well below 2 ∘C above pre industrial levels and to limit the temperature increase even further to 1.5 ∘C. Article 14 of the Paris Agreement requires the Conference of the Parties serving as the meeting of the Parties to the Paris Agreement (CMA) to periodically take stock of the implementation of the Paris Agreement and to assess collective progress towards achieving the purpose of the agreement and its long-term goals through the so-called Global Stocktake of the Paris Agreement (GST)6 based on best available science. The Earth heat inventory provides information on how much and where heat is accumulated and stored in the Earth system. Moreover, it provides a measure of how much the Earth is out of energy balance, and when combined with directly measured net flux at the top of the atmosphere, it also enables us to understand the change of the EEI over time. This in turn allows for assessing the portion of the anthropogenic forcing that the Earth's climate system has not yet responded to (Hansen et al., 2005) and defines additional global warming that will occur without further change in human-induced forcing (Hansen et al., 2017). The Earth heat inventory is thus one of the key critical global climate change indicators defining the prospects for continued global warming and climate change (Hansen et al., 2011; von Schuckmann et al., 2016, 2020). Hence, we call for an implementation of the Earth heat inventory into the Global Stocktake.
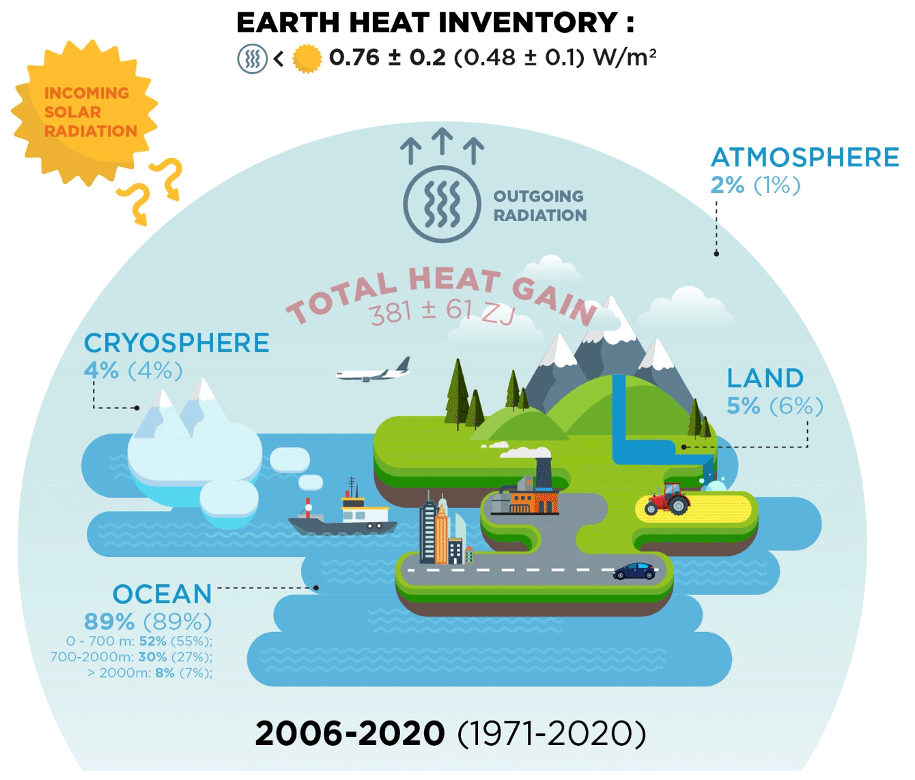
Figure 9Schematic presentation on the Earth heat inventory for the current anthropogenically driven positive Earth energy imbalance (EEI) at the top of the atmosphere (TOA). The relative partition (in %) of the Earth heat inventory presented in Fig. 8 for the different components is given for the ocean (upper: 0–700 m, intermediate: 700–2000 m, deep: >2000 m), land, cryosphere (grounded and floating ice), atmosphere, and EEI for the periods 2006–2020 and 1971–2020 (for the latter period, values are provided in parentheses). The total heat gain (in red) over the period 1971–2020 is obtained from the Earth heat inventory as presented in Fig. 8.
The quantifications presented in this study are the result of multidisciplinary global-scale collaboration and demonstrate the critical importance of concerted international efforts for climate change monitoring and community-based recommendations for the global climate observing system. For the ocean observing system, the core Argo sampling needs to be sustained – which includes the maintenance of shipboard collection of reference data for validation – and complemented by remote sensing data. Extensions such as into the deep-ocean layer need to be further fostered, and technical developments for the measurements under ice and in shallower areas need to be sustained and extended. Moreover, continued efforts are needed to further advance bias-correction methodologies, uncertainty evaluations, data recovery, and processing of the historical dataset. Spatial geodetic observations and the closure of the sea-level budget serve as a valuable constraint for the full-column OHC. Although the independent estimates agree within uncertainty, the geodetic approach suggest slightly larger OHC linear trends, especially since 2016. Though efforts are underway to investigate the emerging discrepancy (e.g., Barnoud et al., 2021), the causes are not yet fully understood and require further investigation.
For the ground heat storage, the estimate had been hampered by a lack of subsurface temperature profiles in the Southern Hemisphere, as well as by the fact that most of the profiles were measured before the 2000s. Subsurface temperature data are direct and independent (not proxy) measurements of temperature, yielding information on the temporal variation of the ground surface temperature and ground heat flux at the land surface. A larger spatial-scale dataset of the thermal state of the subsurface from the last millennium to the present will aid in the continued monitoring of continental heat storage, provide initial conditions for land surface model (LSM) components of Earth system models (ESMs) (Cuesta-Valero et al., 2019), and serve as a dataset for validation of climate models' simulations (Cuesta-Valero et al., 2021a, 2016). Progress in understanding climate variability through the last millennium must lean on additional data acquisition as the only way to reduce uncertainty in the paleoclimatic record and on changes to the current state of the continental energy reservoir. Remote sensing data are expected to be very valuable to retrieve recent, past, and future changes in ground heat flux at short timescales with near-global coverage. However, collecting subsurface temperature data is urgent as we must make a record of the present thermal state of the subsurface before the subsurface climate baseline is affected by the downward-propagating thermal signal from current climate heating. Furthermore, an international organization should take responsibility to gather and curate all measured subsurface temperature profiles currently available and those that will be measured in the future, as the current practices, in which individual researchers are responsible for measuring, storing, and distributing the data, have led to fragmented datasets, restrictions in the use of data, and loss of the original datasets. Support from GCOS for international data acquisition and curating efforts would be extremely important in this context.
For the permafrost estimates, the primary sources of uncertainty arise from lacking information about the amount and distribution of ground ice in permafrost regions, as well as measurements of liquid water content (Nitzbon et al., 2022a). Permafrost heat storage is defined as the required heat to change the mass of ground ice at a certain location; thus, monitoring changes in ground ice and water contents would be required to improve estimates of this component of the continental heat storage. Nevertheless, the current monitoring system for permafrost soils is focused on soil temperature, and the distribution of stations is still relatively scarce in comparison with the vast areas that need to be surveyed (Biskaborn et al., 2015). Due to the current limitations in the observational data, a permafrost model was used to estimate the heat uptake by thawing of ground ice. This approach retrieves latent heat fluxes in extensive areas and at depths relevant to analyze the long-term change in ground ice mass, but this is done at the cost of ignoring other relevant processes, such as ground subsidence, to balance model performance with computational resources. Including permafrost heat storage in the Tibetan Plateau is a priority for the next iteration of this work, as well as to explore new methods to evaluate model simulations using the available observations in permafrost areas.
For inland water heat storage, a better representation of lake and reservoir volume would be possible by better accounting for lake bathymetry using the GLOBathy (Khazaei et al., 2022) dataset and results from the upcoming Surface Water and Ocean Topography (SWOT) mission. These improvements in the representation of lake volume and an updated lake mask will be available in the upcoming ISIMIP3 simulation round, next to improved meteorological forcing data (Golub et al., 2022). In contrast to Vanderkelen et al. (2020), the heat storage in rivers is not included in this analysis due to the high uncertainties in simulated river water volume. To reduce the uncertainty in river heat storage, the estimation of river water storage should be improved, together with an explicit representation of water temperature in the global hydrological models (Wanders et al., 2019). These improvements will be incorporated into ISIMIP3 and will lead to better estimates of inland water heat storage, thus enhancing future estimates of continental heat storage. In the long run, these model-based estimates could be supplemented or replaced by observation-based estimates, which would however require a large, global-scale effort to monitor lake and river temperatures at high spatial resolution and over long time periods. Estimates for inland water heat storage and permafrost heat storage in this analysis depend heavily on model simulations, which is a particular challenge for analyzing and adding uncertainty ranges, as the sources of uncertainty in model simulations differ from those in observational records (Cuesta-Valero et al., 2023a). Future estimates should hence focus on a hybrid approach considering in situ measurements, reanalyses, remote sensing data, and model simulations, consistent with the methods employed for deriving cryosphere and atmosphere heat storage for the Earth heat inventory.
For the cryosphere, sustained remote sensing for all of the cryosphere components is critical for quantifying future changes over these vast and inaccessible regions; in situ observations are also needed for process understanding and in order to properly calibrate and validate them. For sea ice, observations of the albedo, area, and ice thickness are all essential – the continuation of satellite altimeter missions with high inclination, polar-focused orbits is critical for our ability to monitor sea ice thickness in particular. Observations of snow thickness with multifrequency altimeters and microwave radiometers are essential for further constraining sea ice thickness estimates. For ice sheets and glaciers, reliable gravimetric, geodetic, and ice velocity measurements; knowledge of ice thickness and extent; snow/firn thickness and density; and the continuation of the now three-decade long satellite altimeter records are essential for understanding changes in the mass balance of grounded and floating ice. The recent failure of Sentinel-1b, which in tandem with Sentinel-1a could be used to systematically measure ice speed changes every 6 d, means that images are now being acquired every 12 d and thus an earlier launch of Sentinel-1c should be encouraged to regain the ability to monitor ice speed changes over short timescales. The estimate of glacier heat uptake is particularly affected by lacking knowledge of ice melt below sea level and, to a lesser degree, lacking knowledge of firn and ice temperatures. This lack of observations is likely related to most studies on glaciers focusing on their contribution to sea-level rise or seasonal water availability, where melt below sea level and warming of ice do not matter much. However, it becomes obvious here that this gap introduces a systematic bias in the estimate of cryospheric energy uptake, which is presumably small compared to the other components but unconstrained. Although the Antarctic sea ice change and the warming of Greenland and Antarctic firn are poorly constrained or have not significantly contributed to this assessment, they may become increasingly important over the coming decades. Similarly, there exists the possibility for rapid change associated with positive ice dynamical feedback at the marine margins of the Antarctic Ice Sheet. Sustained monitoring of each of these components will, therefore, serve the dual purpose of furthering the understanding of the dynamics and quantifying the contribution to Earth's energy budget. In addition to data collection, open access to the data and data synthesis products, as well as coordinated international efforts, are key to the continued monitoring of the ice loss from the cryosphere and its related energy uptake.
For the atmosphere, there is a need to sustain and enhance a coherent operational long-term monitoring system for the provision of climate data records of essential climate variables. Observations from radiosonde stations within the GCOS Reference Upper-Air Network (GRUAN) and from satellite-based Global Navigation Satellite System (GNSS) radio occultation deliver thermodynamic profiling observations of benchmark quality and stability from surface to stratopause. For climate monitoring, it is of critical importance to ensure continuity of such observations with global coverage over all local times. This continuity of radio occultation observations in the future is not sufficiently guaranteed as we are facing an imminent observational gap in the middle to high latitudes for most local times (IROWG, 2021), which is a major concern. Thus, there is an urgent need for satellite missions in high-inclination orbits to provide full global and local-time coverage in order to ensure global climate monitoring. Operational radio occultation missions need to be maintained as support for a global climate observing system, and long-term availability and archiving of measurement data, metadata, and processing information need to be ensured.
In summary, we also call for urgently needed actions for enabling continuity, archiving, rescuing and calibrating efforts to assure improved and long-term monitoring capacity of the global climate observing system for the Earth heat inventory and to complement with measurements from space for assessing the changes in EEI (e.g., Loeb et al., 2021; von Schuckmann et al., 2016). Particularly, the summarized recommendations include the following:
-
We need to sustain, reinforce, and even to establish data repositories for historical climate data (archiving).
-
We need to reinforce efforts for recovery projects for historical data and associated metadata information (rescuing).
-
We need to sustain and reinforce the global climate observing system for assuring the monitoring of the Earth heat inventory targets, such as for the polar, deep, and shallow ocean, as well as of top-of-the-atmosphere radiation fluxes (continuity).
-
We need to foster calibration measurements (in situ) for assuring the quality and reliability of large-scale measurement techniques (e.g., remote sensing) and autonomous components (e.g., Argo) (calibrating).
A continuous effort to regularly update the Earth heat inventory is important as this global climate indicator crosses multidisciplinary boundaries and calls for the inclusion of new science knowledge from the different disciplines involved, including the evolution of climate observing systems and associated data products, uncertainty evaluations, and processing tools. The outcomes have further demonstrated how we are able to evolve our estimates for the Earth heat inventory while bringing together different expertise and major climate science advancements through a concerted international effort. All of these component estimates are at the leading edge of climate science. Their union has provided a new and unique insight into the inventory of heat in the Earth system, its evolution over time, and the absolute values. The data product of this effort is made available and thus can be used for climate model validation purposes. The results also demonstrate that further efforts are needed for uncertainty evaluations, such as, for example, the use of synthetic profile analyses. Indeed, improving the climate observing system will allow for reduced uncertainties for estimating the Earth heat inventory. However, further evaluations are needed to unravel uncertainties in the different components of the Earth heat inventory, which rely for example on nonhomogeneous data sampling and large data gaps, the use of different measurement types and statistical approaches, instrumental bias corrections, and their joint analysis of mode-based quantifications.
This study has demonstrated the unique value of such a concerted international effort, and we thus call for a regular evaluation of the Earth heat inventory. This updated attempt presented here has focused on the global area average only, and evolving into regional heat storage and redistribution, the inclusion of various timescales (e.g., seasonal, year to year), and other climate study tools (e.g., indirect methods, ocean reanalyses) would be an important asset of this much-needed regular international framework for the Earth heat inventory. This would also respond directly to the request of GCOS to establish the observational requirements needed to further monitor the Earth's cycles and the global energy budget (GCOS, 2021). The outcome of this study will therefore directly feed into GCOS assessments of the status of the global climate observing system, and the identified observation requirements will guide the development of the next generation of in situ and satellite global climate observations as specified by GCOS by all national meteorological services and space agencies and other oceanic and terrestrial networks.
KvS, AM, FCV, GK, AS, SA, FS have worked on the conceptualization and the writing of the original draft preparation; FG, AM, AS, FCV, KvS, FS, GK, TB, LC, DG, MG, SH, RK, BK, NK, JN, ML, JL, BM, SP, KS, AS, TS, IV, MZ have supported the work with formal analysis and software developments; FG, GK, KvS have worked on the visualization, and all authors have worked on the writing, particularly for review and editing.
The contact author has declared that none of the authors has any competing interests.
Publisher’s note: Copernicus Publications remains neutral with regard to jurisdictional claims in published maps and institutional affiliations.
Ocean: the OHC estimate from the product ISAS (Gaillard et al., 2016) was provided by “Service National d'Observation Argo France” (INSU/CNRS) at Observatoire des Sciences de l'Univers (OSU) IUEM (https://www.argo-france.fr/, last access: 29 March 2023). Atmosphere: we acknowledge the WEGC EOPAC (Earth Observation Processing and Analysis Center for Atmosphere and Climate) team for providing the OPSv5.6 RO data (available online at https://doi.org/10.25364/WEGC/OPS5.6:2021.1, EOPAC Team, 2021) as well as quality-processed Vaisala RS data, UCAR/CDAAC (Boulder, CO, USA) for access to RO phase and orbit data, ECMWF (Reading, UK) for access to operational analysis and forecast data, ERA5 reanalysis data and RS data from the ERA-Interim archive, JMA (Tokyo, Japan) for provision of the JRA55 and JRA55C reanalysis data, and NASA GMAO (Global Modeling and Assimilation Office) (Greenbelt, MD, USA) for access to the MERRA-2 reanalysis data.
Maximilian Gorfer was supported by WEGC atmospheric remote sensing and climate system research group young scientist funds. Michael Mayer was supported by the Austrian Science Fund (project P33177).
Donata Giglio and Mikael Kuusela were supported by NOAA (awards NA21OAR4310261 and NA21OAR4310258).
Lijing Cheng was financial supported by the Strategic Priority Research Program of the Chinese Academy of Sciences (XDB42040402) and the National Natural Science Foundation of China (grant numbers 42122046, 42076202).
John Church and Yuehua Li were supported by the Centre for Southern Hemisphere Oceans Research (CSHOR), jointly funded by the Qingdao National Laboratory for Marine Science and Technology (QNLM, China) and the Commonwealth Scientific and Industrial Research Organisation (CSIRO, Australia), and the Australian Research Council's Discovery Project funding scheme (project DP190101173) and the Australian Research Council Special Research Initiative, Australian Centre for Excellence in Antarctic Science (Project Number SR200100008). TMcD and PMB gratefully acknowledge Australian Research Council support through grant FL150100090. This paper contributes to the tasks of the Joint SCOR/IAPSO/IAPWS Committee on the Thermophysical Properties of Seawater.
Hugo Beltrami was supported by grants from the National Sciences and Engineering Research Council of Canada Discovery Grant (NSERC DG 140576948) and the Canada Research Chairs Program (CRC 230687). Hugo Beltrami holds a Canada Research Chair in Climate Dynamics.
Francisco José Cuesta-Valero is an Alexander von Humboldt Research Fellow at the Helmholtz Centre for Environmental Research (UFZ).
Richard P. Allan is funded by the National Centre for Earth Observation (Research Councils UK) (grant NE/RO16518/1).
Felix W. Landerer and Maria Z. Hakuba were supported by the Jet Propulsion Laboratory, California Institute of Technology, under a contract with the National Aeronautics and Space Administration (80NM0018D0004).
Rachel Killick was supported by the Met Office Hadley Centre Climate Programme funded by BEIS.
Axel Schweiger was supported by NSF Grant NSF-OPP-1744587 and NASA Grant 80NSSC20K1253.
This paper was edited by David Carlson and reviewed by two anonymous referees.
Abraham, J., Cheng, L., Mann, M. E., Trenberth, K., and von Schuckmann, K.: The ocean response to climate change guides both adaptation and mitigation efforts, Atmos. Ocean. Sci. Lett., 15, 100221, https://doi.org/10.1016/j.aosl.2022.100221, 2022.
Abraham, J. P., Baringer, M., Bindoff, N. L., Boyer, T., Cheng, L. J., Church, J. A., Conroy, J. L., Domingues, C. M., Fasullo, J. T., Gilson, J., Goni, G., Good, S. A., Gorman, J. M., Gouretski, V., Ishii, M., Johnson, G. C., Kizu, S., Lyman, J. M., Macdonald, A. M., Minkowycz, W. J., Moffitt, S. E., Palmer, M. D., Piola, A. R., Reseghetti, F., Schuckmann, K., Trenberth, K. E., Velicogna, I., and Willis, J. K.: A review of global ocean temperature observations: Implications for ocean heat content estimates and climate change, Rev. Geophys., 51, 450–483, https://doi.org/10.1002/rog.20022, 2013.
Abram, N., Gattuso, J.-P., Prakash, A., Cheng, L., Chidichimo, M. P., Crate, S., Enomoto, H., Garschagen, M., Gruber, N., Harper, S., Holland, E., Kudela, R. M., Rice, J., Steffen, K., and von Schuckmann, K.: Framing and Context of the Report. In: IPCC Special Report on the Ocean and Cryosphere in a Changing Climate, edited by: Pörtner, H.-O., Roberts, D. C., Masson-Delmotte, V., Zhai, P., Tignor, M., Poloczanska, E., Mintenbeck, K., Alegría A., Nicolai, M., Okem, A., Petzold, J., Rama, B., and Weyer, N. M., Cambridge University Press, Cambridge, UK and New York, NY, USA, 73–129, https://doi.org/10.1017/9781009157964.003, 2019.
Adusumilli, S., Fricker, H. A., Medley, B., Padman, L., and Siegfried, M. R.: Interannual variations in meltwater input to the Southern Ocean from Antarctic ice shelves, Nat. Geosci., 13, 616–620, https://doi.org/10.1038/s41561-020-0616-z, 2020.
Adusumilli, S., Straneo, F., Hendricks, S., Korosov, A., Lavergne, T., Lawrence, I., Marzeion, B., Otosaka, I., Schweiger, A., Shepherd, A., Slater, D. A., Slater, T., Timmermanns, M.-L., and Zemp, M.: GCOS EHI 1960–2020 Cryosphere Heat Content, World Data Center for Climate (WDCC) at DKRZ [data set], https://doi.org/10.26050/WDCC/GCOS_EHI_1960-2020_CrHC, 2022.
Allison, L. C., Roberts, C. D., Palmer, M. D., Hermanson, L., Killick, R. E., Rayner, N. A., Smith, D. M., and Andrews, M. B.: Towards quantifying uncertainty in ocean heat content changes using synthetic profiles, Environ. Res. Lett., 14, 084037, https://doi.org/10.1088/1748-9326/ab2b0b, 2019.
Angerer, B., Ladstädter, F., Scherllin-Pirscher, B., Schwärz, M., Steiner, A. K., Foelsche, U., and Kirchengast, G.: Quality aspects of the Wegener Center multi-satellite GPS radio occultation record OPSv5.6, Atmos. Meas. Tech., 10, 4845–4863, https://doi.org/10.5194/amt-10-4845-2017, 2017.
Barker, P. M. and McDougall, T. J.: Two Interpolation Methods Using Multiply-Rotated Piecewise Cubic Hermite Interpolating Polynomials, J. Atmos. Ocean. Tech., 37, 605–619, https://doi.org/10.1175/JTECH-D-19-0211.1, 2020.
Barnoud, A., Pfeffer, J., Guérou, A., Frery, M.-L., Siméon, M., Cazenave, A., Chen, J., Llovel, W., Thierry, V., Legeais, J.-F., and Ablain, M.: Contributions of Altimetry and Argo to Non-Closure of the Global Mean Sea Level Budget Since 2016, Geophys. Res. Lett., 48, e2021GL092824, https://doi.org/10.1029/2021GL092824, 2021.
Bell, B., Hersbach, H., Simmons, A., Berrisford, P., Dahlgren, P., Horányi, A., Muñoz-Sabater, J., Nicolas, J., Radu, R., Schepers, D., Soci, C., Villaume, S., Bidlot, J.-R., Haimberger, L., Woollen, J., Buontempo, C., and Thépaut, J.-N.: The ERA5 global reanalysis: Preliminary extension to 1950, Q. J. Roy. Meteor. Soc., 147, 4186–4227, https://doi.org/10.1002/qj.4174, 2021.
Beltrami, H. and Mareschal, J.-C.: Ground temperature histories for central and eastern Canada from geothermal measurements: Little Ice Age signature, Geophys. Res. Lett., 19, 689–692, https://doi.org/10.1029/92GL00671, 1992.
Beltrami, H., Smerdon, J. E., Pollack, H. N., and Huang, S.: Continental heat gain in the global climate system, Geophys. Res. Lett., 29, 8-1–8-3, https://doi.org/10.1029/2001GL014310, 2002.
Berrisford, P., Kållberg, P., Kobayashi, S., Dee, D., Uppala, S., Simmons, A. J., Poli, P., and Sato, H.: Atmospheric conservation properties in ERA-Interim, Q. J. Roy. Meteor. Soc., 137, 1381–1399, https://doi.org/10.1002/qj.864, 2011.
Biskaborn, B. K., Lanckman, J.-P., Lantuit, H., Elger, K., Streletskiy, D. A., Cable, W. L., and Romanovsky, V. E.: The new database of the Global Terrestrial Network for Permafrost (GTN-P), Earth Syst. Sci. Data, 7, 245–259, https://doi.org/10.5194/essd-7-245-2015, 2015.
Boyer, T., Domingues, C. M., Good, S. A., Johnson, G. C., Lyman, J. M., Ishii, M., Gouretski, V., Willis, J. K., Antonov, J., Wijffels, S., Church, J. A., Cowley, R., and Bindoff, N. L.: Sensitivity of Global Upper-Ocean Heat Content Estimates to Mapping Methods, XBT Bias Corrections, and Baseline Climatologies, J. Climate, 29, 4817–4842, https://doi.org/10.1175/JCLI-D-15-0801.1, 2016.
Brown, J., Ferrians Jr., O. J., Heginbottom, J. A., and Melnikov, E. S.: Circum-Arctic map of permafrost and ground-ice conditions, Circum-Pacific Map, https://doi.org/10.3133/cp45, 1997.
Carr, J. R., Stokes, C. R., and Vieli, A.: Threefold increase in marine-terminating outlet glacier retreat rates across the Atlantic Arctic: 1992–2010, Ann. Glaciol., 58, 72–91, https://doi.org/10.1017/aog.2017.3, 2017.
Cheng, L., Zhu, J., Cowley, R., Boyer, T., and Wijffels, S.: Time, Probe Type, and Temperature Variable Bias Corrections to Historical Expendable Bathythermograph Observations, J. Atmos. Ocean. Tech., 31, 1793–1825, https://doi.org/10.1175/JTECH-D-13-00197.1, 2014.
Cheng, L., Abraham, J., Goni, G., Boyer, T., Wijffels, S., Cowley, R., Gouretski, V., Reseghetti, F., Kizu, S., Dong, S., Bringas, F., Goes, M., Houpert, L., Sprintall, J., and Zhu, J.: XBT Science: Assessment of Instrumental Biases and Errors, B. Am. Meteorol. Soc., 97, 924–933, https://doi.org/10.1175/BAMS-D-15-00031.1, 2015.
Cheng, L., Trenberth, K. E., Fasullo, J., Boyer, T., Abraham, J., and Zhu, J.: Improved estimates of ocean heat content from 1960 to 2015, Sci. Adv., 3, e1601545, https://doi.org/10.1126/sciadv.1601545, 2017a.
Cheng, L., Trenberth, K., Fasullo, J., Abraham, J., Boyer, T., von Schuckmann, K., and Zhu, J.: Taking the Pulse of the Planet, Eos Washington DC, https://doi.org/10.1029/2017EO081839, 2017b.
Cheng, L., Luo, H., Boyer, T., Cowley, R., Abraham, J., Gouretski, V., Reseghetti, F., and Zhu, J.: How Well Can We Correct Systematic Errors in Historical XBT Data?, J. Atmos. Ocean. Tech., 35, 1103–1125, https://doi.org/10.1175/JTECH-D-17-0122.1, 2018.
Cheng, L., Abraham, J., Hausfather, Z., and Trenberth, K. E.: How fast are the oceans warming?, Science, 363, 128–129, https://doi.org/10.1126/science.aav7619, 2019.
Cheng, L., Foster, G., Hausfather, Z., Trenberth, K. E., and Abraham, J.: Improved Quantification of the Rate of Ocean Warming, J. Climate, 35, 4827–4840, https://doi.org/10.1175/JCLI-D-21-0895.1, 2022a.
Cheng, L., Schuckmann, K. von, Abraham, J., Trenberth, K., Mann, M., Zanna, L., England, M. H., Zika, J. D., Fasullo, J., Yu1, Y., Pan, Y., Zhu, J., Newsom, E., Bronselaer, B., and Lin, X.: Past and future ocean warming, Nat. Rev. Earth Env., 3, 776–794, https://doi.org/10.1038/s43017-022-00345-1, 2022b.
Chiodo, G. and Haimberger, L.: Interannual changes in mass consistent energy budgets from ERA-Interim and satellite data, J. Geophys. Res.-Atmos., 115, D02112, https://doi.org/10.1029/2009JD012049, 2010.
Church, J. A., White, N. J., Konikow, L. F., Domingues, C. M., Cogley, J. G., Rignot, E., Gregory, J. M., van den Broeke, M. R., Monaghan, A. J., and Velicogna, I.: Revisiting the Earth's sea-level and energy budgets from 1961 to 2008, Geophys. Res. Lett., 38, L18601, https://doi.org/10.1029/2011GL048794, 2011.
Ciais, P., Sabine, C., Bala, G., Bopp, L., Brovkin, V., Canadell, J., Chhabra, A., DeFries, R., Galloway, J., Heimann, M., Jones, C., Le Quéré, C., Myneni, R. B., Piao, S., and Thornton, P.: Carbon and Other Biogeochemical Cycles, in: Climate Change 2013 – The Physical Science Basis: Working Group I Contribution to the Fifth Assessment Report of the Intergovernmental Panel on Climate Change, Cambridge University Press, Cambridge University Press, Cambridge United Kingdom and New York, USA, 465–570, https://doi.org/10.1017/CBO9781107415324.015, 2014.
Cleveland, W. S.: Robust Locally Weighted Regression and Smoothing Scatterplots, J. Am. Stat. Assoc., 74, 829–836, 1979.
Clough, W. J. and Hansen, L. B.: The Ross Ice Shelf Project, Science, 203, 433–434, https://doi.org/10.1126/science.203.4379.433, 1979.
Copernicus Marine Ocean Monitoring Indicator: Global ocean heat content: https://marine.copernicus.eu/access-data/ocean-monitoring-indicators/global-ocean-heat-content-0-2000\,m-time-series-and-trend, last access: 29 March 2023.
Cohen, J., Zhang, X., Francis, J., Jung, T., Kwok, R., Overland, J., Ballinger, T., Bhatt, U. S., Chen, H. W., Coumou, D., Feldstein, S., Handorf, D., Henderson, G., Ionita, M., Kretschmer, M., Laliberte, F., Lee, S., Linderholm, H. W., Maslowski, W., Peings, Y., Pfeiffer, K., and Yoon, J.: Divergent consensuses on Arctic amplification influence on midlatitude severe winter weather, Nat. Clim. Change, 10, 20–29, https://doi.org/10.1038/s41558-019-0662-y, 2020.
Cook, A. J. and Vaughan, D. G.: Overview of areal changes of the ice shelves on the Antarctic Peninsula over the past 50 years, The Cryosphere, 4, 77–98, https://doi.org/10.5194/tc-4-77-2010, 2010.
Crisp, D., Dolman, H., Tanhua, T., McKinley, G. A., Hauck, J., Bastos, A., Sitch, S., Eggleston, S., and Aich, V.: How Well Do We Understand the Land-Ocean-Atmosphere Carbon Cycle?, Rev. Geophys., 60, e2021RG000736, https://doi.org/10.1029/2021RG000736, 2022.
Cuesta-Valero, F. J., García-García, A., Beltrami, H., and Smerdon, J. E.: First assessment of continental energy storage in CMIP5 simulations, Geophys. Res. Lett., 43, 5326–5335, https://doi.org/10.1002/2016GL068496, 2016.
Cuesta-Valero, F. J., García-García, A., Beltrami, H., Zorita, E., and Jaume-Santero, F.: Long-term Surface Temperature (LoST) database as a complement for GCM preindustrial simulations, Clim. Past, 15, 1099–1111, https://doi.org/10.5194/cp-15-1099-2019, 2019.
Cuesta-Valero, F. J., García-García, A., Beltrami, H., and Finnis, J.: First assessment of the earth heat inventory within CMIP5 historical simulations, Earth Syst. Dynam., 12, 581–600, https://doi.org/10.5194/esd-12-581-2021, 2021a.
Cuesta-Valero, F. J., García-García, A., Beltrami, H., González-Rouco, J. F., and García-Bustamante, E.: Long-term global ground heat flux and continental heat storage from geothermal data, Clim. Past, 17, 451–468, https://doi.org/10.5194/cp-17-451-2021, 2021b.
Cuesta-Valero, F. J., Beltrami, H., Gruber, S., García-García, A., and González-Rouco, J. F.: A new bootstrap technique to quantify uncertainty in estimates of ground surface temperature and ground heat flux histories from geothermal data, Geosci. Model Dev., 15, 7913–7932, https://doi.org/10.5194/gmd-15-7913-2022, 2022.
Cuesta-Valero, F. J., Beltrami, H., García-García, A., Krinner, G., Langer, M., MacDougall, A. H., Nitzbon, J., Peng, J., von Schuckmann, K., Seneviratne, S. I., Thiery, W., Vanderkelen, I., and Wu, T.: Continental heat storage: Contributions from ground, inland waters, and permafrost thawing, Earth Syst. Dynam. Discuss. [preprint], https://doi.org/10.5194/esd-2022-32, accepted, 2023a.
Cuesta-Valero, F. J., Beltrami, H., García-García, A., Krinner, G., Langer, M., MacDougall, A., Nitzbon, J., Peng, J., von Schuckmann, K., Seneviratne, S. I., Thiery, W., Vanderkelen, I., and Wu, T.: GCOS EHI 1960–2020 Continental Heat Content (Version 2), World Data Center for Climate [data set], https://doi.org/10.26050/WDCC/GCOS_EHI_1960-2020_CoHC_v2, 2023b.
Demezhko, D. Y. and Gornostaeva, A. A.: Late Pleistocene–Holocene ground surface heat flux changes reconstructed from borehole temperature data (the Urals, Russia), Clim. Past, 11, 647–652, https://doi.org/10.5194/cp-11-647-2015, 2015.
Denning, A. S.: Where Has All the Carbon Gone?, Annu. Rev. Earth Pl. Sc., 50, 55–78, https://doi.org/10.1146/annurev-earth-032320-092010, 2022.
Desbruyères, D., McDonagh, E. L., King, B. A., and Thierry, V.: Global and Full-Depth Ocean Temperature Trends during the Early Twenty-First Century from Argo and Repeat Hydrography, J. Climate, 30, 1985–1997, https://doi.org/10.1175/JCLI-D-16-0396.1, 2017.
Desbruyères, D. G., Purkey, S. G., McDonagh, E. L., Johnson, G. C., and King, B. A.: Deep and abyssal ocean warming from 35 years of repeat hydrography, Geophys. Res. Lett., 43, 310–356, https://doi.org/10.1002/2016GL070413, 2016.
de Vrese, P., Stacke, T., Caves Rugenstein, J., Goodman, J., and Brovkin, V.: Snowfall-albedo feedbacks could have led to deglaciation of snowball Earth starting from mid-latitudes, Commun. Earth Environ., 2, 91, https://doi.org/10.1038/s43247-021-00160-4, 2021.
Dieng, H. B., Cazenave, A., Meyssignac, B., and Ablain, M.: New estimate of the current rate of sea level rise from a sea level budget approach, Geophys. Res. Lett., 44, 3744–3751, https://doi.org/10.1002/2017GL073308, 2017.
Domingues, C. M., Church, J. A., White, N. J., Gleckler, P. J., Wijffels, S. E., Barker, P. M., and Dunn, J. R.: Improved estimates of upper-ocean warming and multi-decadal sea-level rise, Nature, 453, 1090–1093, https://doi.org/10.1038/nature07080, 2008.
Dorigo, W., Dietrich, S., Aires, F., Brocca, L., Carter, S., Cretaux, J.-F., Dunkerley, D., Enomoto, H., Forsberg, R., Güntner, A., Hegglin, M. I., Hollmann, R., Hurst, D. F., Johannessen, J. A., Kummerow, C., Lee, T., Luojus, K., Looser, U., Miralles, D. G., Pellet, V., Recknagel, T., Vargas, C. R., Schneider, U., Schoeneich, P., Schröder, M., Tapper, N., Vuglinsky, V., Wagner, W., Yu, L., Zappa, L., Zemp, M., and Aich, V.: Closing the Water Cycle from Observations across Scales: Where Do We Stand?, B. Am. Meteorol. Soc., 102, E1897–E1935, https://doi.org/10.1175/BAMS-D-19-0316.1, 2021.
ECMWF-IFS: ECMWF-IFS: Part IV: Physical processes, IFS documentation–Cy41r1, 210 pp., https://doi.org/10.21957/p50qmwprw, 2015.
Eicken, H., Fischer, H., and Lemke, P.: Effects of the snow cover on Antarctic sea ice and potential modulation of its response to climate change, Ann. Glaciol., 21, 369–376, https://doi.org/10.3189/S0260305500016086, 1995.
EOPAC Team: GNSS Radio Occultation Record OPS 5.6 2001–2020, Wegener Center, University of Graz, Graz, Austria, EOPAC Team [data set], https://doi.org/10.25364/WEGC/OPS5.6:2021.1, 2021.
Farinotti, D., Huss, M., Fürst, J. J., Landmann, J., Machguth, H., Maussion, F., and Pandit, A.: A consensus estimate for the ice thickness distribution of all glaciers on Earth, Nat. Geosci., 12, 168–173, https://doi.org/10.1038/s41561-019-0300-3, 2019.
Faroux, S., Kaptué Tchuenté, A. T., Roujean, J.-L., Masson, V., Martin, E., and Le Moigne, P.: ECOCLIMAP-II/Europe: a twofold database of ecosystems and surface parameters at 1 km resolution based on satellite information for use in land surface, meteorological and climate models, Geosci. Model Dev., 6, 563–582, https://doi.org/10.5194/gmd-6-563-2013, 2013.
Fischer, E. M., Sippel, S., and Knutti, R.: Increasing probability of record-shattering climate extremes, Nat. Clim. Change, 11, 689–695, https://doi.org/10.1038/s41558-021-01092-9, 2021.
Forster, P., Storelvmo, T., Armour, K., Collins, W., Dufresne, J.-L., Frame, D., Lunt, D. J., Mauritsen, T., Palmer, M. D., Watanabe, M., Wild, M., and Zhang, H.: The Earth's Energy Budget, Climate Feedbacks, and Climate Sensitivity, in: Climate Change 2021: The Physical Science Basis. Contribution of Working Group I to the Sixth Assessment Report of the Intergovernmental Panel on Climate Change, edited by: Masson-Delmotte, V., Zhai, P., Pirani, A., Connors, S. L., Péan, C., Berger, S., Caud, N., Chen, Y., Goldfarb, L., Gomis, M. I., Huang, M., Leitzell, K., Lonnoy, E., Matthews, J. B. R., Maycock, T. K., Waterfield, T., Yelekçi, O., Yu, R., and Zhou, B., Cambridge University Press, Cambridge, United Kingdom and New York, NY, USA, Cambridge, United Kingdom and New York, NY, USA, 923–1054, https://doi.org/10.1017/9781009157896.009, 2021.
Friedlingstein, P., Jones, M. W., O'Sullivan, M., Andrew, R. M., Bakker, D. C. E., Hauck, J., Le Quéré, C., Peters, G. P., Peters, W., Pongratz, J., Sitch, S., Canadell, J. G., Ciais, P., Jackson, R. B., Alin, S. R., Anthoni, P., Bates, N. R., Becker, M., Bellouin, N., Bopp, L., Chau, T. T. T., Chevallier, F., Chini, L. P., Cronin, M., Currie, K. I., Decharme, B., Djeutchouang, L. M., Dou, X., Evans, W., Feely, R. A., Feng, L., Gasser, T., Gilfillan, D., Gkritzalis, T., Grassi, G., Gregor, L., Gruber, N., Gürses, Ö., Harris, I., Houghton, R. A., Hurtt, G. C., Iida, Y., Ilyina, T., Luijkx, I. T., Jain, A., Jones, S. D., Kato, E., Kennedy, D., Klein Goldewijk, K., Knauer, J., Korsbakken, J. I., Körtzinger, A., Landschützer, P., Lauvset, S. K., Lefèvre, N., Lienert, S., Liu, J., Marland, G., McGuire, P. C., Melton, J. R., Munro, D. R., Nabel, J. E. M. S., Nakaoka, S.-I., Niwa, Y., Ono, T., Pierrot, D., Poulter, B., Rehder, G., Resplandy, L., Robertson, E., Rödenbeck, C., Rosan, T. M., Schwinger, J., Schwingshackl, C., Séférian, R., Sutton, A. J., Sweeney, C., Tanhua, T., Tans, P. P., Tian, H., Tilbrook, B., Tubiello, F., van der Werf, G. R., Vuichard, N., Wada, C., Wanninkhof, R., Watson, A. J., Willis, D., Wiltshire, A. J., Yuan, W., Yue, C., Yue, X., Zaehle, S., and Zeng, J.: Global Carbon Budget 2021, Earth Syst. Sci. Data, 14, 1917–2005, https://doi.org/10.5194/essd-14-1917-2022, 2022.
Frieler, K., Lange, S., Piontek, F., Reyer, C. P. O., Schewe, J., Warszawski, L., Zhao, F., Chini, L., Denvil, S., Emanuel, K., Geiger, T., Halladay, K., Hurtt, G., Mengel, M., Murakami, D., Ostberg, S., Popp, A., Riva, R., Stevanovic, M., Suzuki, T., Volkholz, J., Burke, E., Ciais, P., Ebi, K., Eddy, T. D., Elliott, J., Galbraith, E., Gosling, S. N., Hattermann, F., Hickler, T., Hinkel, J., Hof, C., Huber, V., Jägermeyr, J., Krysanova, V., Marcé, R., Müller Schmied, H., Mouratiadou, I., Pierson, D., Tittensor, D. P., Vautard, R., van Vliet, M., Biber, M. F., Betts, R. A., Bodirsky, B. L., Deryng, D., Frolking, S., Jones, C. D., Lotze, H. K., Lotze-Campen, H., Sahajpal, R., Thonicke, K., Tian, H., and Yamagata, Y.: Assessing the impacts of 1.5 °C global warming – simulation protocol of the Inter-Sectoral Impact Model Intercomparison Project (ISIMIP2b), Geosci. Model Dev., 10, 4321–4345, https://doi.org/10.5194/gmd-10-4321-2017, 2017.
Fu, Q., Solomon, S., Pahlavan, H. A., and Lin, P.: Observed changes in Brewer–Dobson circulation for 1980–2018, Environ. Res. Lett., 14, 114026, https://doi.org/10.1088/1748-9326/ab4de7, 2019.
Gädeke, A., Langer, M., Boike, J., Burke, E. J., Chang, J., Head, M., Reyer, C. P. O., Schaphoff, S., Thiery, W., and Thonicke, K.: Climate change reduces winter overland travel across the Pan-Arctic even under low-end global warming scenarios, Environ. Res. Lett., 16, 24049, https://doi.org/10.1088/1748-9326/abdcf2, 2021.
Gaillard, F., Reynaud, T., Thierry, V., Kolodziejczyk, N., and von Schuckmann, K.: In Situ–Based Reanalysis of the Global Ocean Temperature and Salinity with ISAS: Variability of the Heat Content and Steric Height, J. Climate, 29, 1305–1323, https://doi.org/10.1175/JCLI-D-15-0028.1, 2016.
GCOS: The Status of the Global Climate Observing System 2021: Executive Summary (GCOS-239), Geneva, Switzerland, https://ane4bf-datap1.s3.eu-west-1.amazonaws.com/wmod8_gcos/s3fs-public/2021-misc-i-gcos-status-report-211187_en_0.pdf?3xI1k6_u9wMSAsmJ5Hzy9nL5kzdLbPMD= (last access: 29 March 2023), 2021.
Gelaro, R., McCarty, W., Suárez, M. J., Todling, R., Molod, A., Takacs, L., Randles, C. A., Darmenov, A., Bosilovich, M. G., Reichle, R., Wargan, K., Coy, L., Cullather, R., Draper, C., Akella, S., Buchard, V., Conaty, A., da Silva, A. M., Gu, W., Kim, G.-K., Koster, R., Lucchesi, R., Merkova, D., Nielsen, J. E., Partyka, G., Pawson, S., Putman, W., Rienecker, M., Schubert, S. D., Sienkiewicz, M., and Zhao, B.: The Modern-Era Retrospective Analysis for Research and Applications, Version 2 (MERRA-2), J. Climate, 30, 5419–5454, https://doi.org/10.1175/JCLI-D-16-0758.1, 2017.
Golub, M., Thiery, W., Marcé, R., Pierson, D., Vanderkelen, I., Mercado-Bettin, D., Woolway, R. I., Grant, L., Jennings, E., Kraemer, B. M., Schewe, J., Zhao, F., Frieler, K., Mengel, M., Bogomolov, V. Y., Bouffard, D., Côté, M., Couture, R.-M., Debolskiy, A. V., Droppers, B., Gal, G., Guo, M., Janssen, A. B. G., Kirillin, G., Ladwig, R., Magee, M., Moore, T., Perroud, M., Piccolroaz, S., Raaman Vinnaa, L., Schmid, M., Shatwell, T., Stepanenko, V. M., Tan, Z., Woodward, B., Yao, H., Adrian, R., Allan, M., Anneville, O., Arvola, L., Atkins, K., Boegman, L., Carey, C., Christianson, K., de Eyto, E., DeGasperi, C., Grechushnikova, M., Hejzlar, J., Joehnk, K., Jones, I. D., Laas, A., Mackay, E. B., Mammarella, I., Markensten, H., McBride, C., Özkundakci, D., Potes, M., Rinke, K., Robertson, D., Rusak, J. A., Salgado, R., van der Linden, L., Verburg, P., Wain, D., Ward, N. K., Wollrab, S., and Zdorovennova, G.: A framework for ensemble modelling of climate change impacts on lakes worldwide: the ISIMIP Lake Sector, Geosci. Model Dev., 15, 4597–4623, https://doi.org/10.5194/gmd-15-4597-2022, 2022.
Good, S. A.: The impact of observational sampling on time series of global 0–700 m ocean average temperature: a case study, Int. J. Climatol., 37, 2260–2268, https://doi.org/10.1002/joc.4654, 2017.
Good, S. A., Martin, M. J., and Rayner, N. A.: EN4: Quality controlled ocean temperature and salinity profiles and monthly objective analyses with uncertainty estimates, J. Geophys. Res.-Oceans, 118, 6704–6716, https://doi.org/10.1002/2013JC009067, 2013.
Gorfer, M.: Monitoring of climate change and variability in atmospheric heat content based on climate records and reanalyses, Sci. Rep. 94-2022, University of Graz, Austria, https://wegccloud.uni-graz.at/s/ypz6cqk48xrJnSF (last access: 29 March 2023), 2022.
Gould, J., Sloyan, B., and Visbeck, M.: Chapter 3 – In Situ Ocean Observations: A Brief History, Present Status, and Future Directions, in: Ocean Circulation and Climate, vol. 103, edited by: Siedler, G., Griffies, S. M., Gould, J., and Church, J. A., Academic Press, 59–81, doi.org/10.1016/B978-0-12-391851-2.00003-9, 2013.
Gouretski, V. and Cheng, L.: Correction for Systematic Errors in the Global Dataset of Temperature Profiles from Mechanical Bathythermographs, J. Atmos. Ocean. Tech., 37, 841–855, https://doi.org/10.1175/JTECH-D-19-0205.1, 2020.
Grant, L., Vanderkelen, I., Gudmundsson, L., Tan, Z., Perroud, M., Stepanenko, V. M., Debolskiy, A. V, Droppers, B., Janssen, A. B. G., Woolway, R. I., Choulga, M., Balsamo, G., Kirillin, G., Schewe, J., Zhao, F., del Valle, I. V., Golub, M., Pierson, D., Marcé, R., Seneviratne, S. I., and Thiery, W.: Attribution of global lake systems change to anthropogenic forcing, Nat. Geosci., 14, 849–854, https://doi.org/10.1038/s41561-021-00833-x, 2021.
Gregory, J. M. and Andrews, T.: Variation in climate sensitivity and feedback parameters during the historical period, Geophys. Res. Lett., 43, 3911–3920, https://doi.org/10.1002/2016GL068406, 2016.
Grise, K. M., Davis, S. M., Simpson, I. R., Waugh, D. W., Fu, Q., Allen, R. J., Rosenlof, K. H., Ummenhofer, C. C., Karnauskas, K. B., Maycock, A. C., Quan, X. W., Birner, T., and Staten, P. W.: Recent tropical expansion: Natural variability or forced response?, J. Climate, 32, 1551–1571, https://doi.org/10.1175/JCLI-D-18-0444.1, 2019.
Gulev, S. K., Thorne, P. W., Ahn, J., Dentener, F. J., Domingues, C. M., Gerland, S., Gong, D., Kaufman, D. S., Nnamchi, H. C., Quaas, J., Rivera, J. A., Sathyendranath, S., Smith, S. L., Trewin, B., Schuckmann, K. von, and Vose, R. S.: Changing State of the Climate System Supplementary Material, in: Climate Change 2021: The Physical Science Basis. Contribution of Working Group I to the Sixth Assessment Report of the Intergovernmental Panel on Climate Change, edited by: Masson-Delmotte, V., Zhai, P., Pirani, A., Connors, S. L., Péan, C., Berger, S., Caud, N., Chen, Y., Goldfarb, L., Gomis, M. I., Huang, M., Leitzell, K., Lonnoy, E., Matthews, J. B. R., Maycock, T. K., Waterfield, T., Yelekçi, O., Yu, R., and Zhou, B., Cambridge University Press, Cambridge, United Kingdom and New York, NY, USA, 287–422, https://doi.org/10.1017/9781009157896.004, 2021.
Hakuba, M. Z., Frederikse, T., and Landerer, F. W.: Earth's Energy Imbalance From the Ocean Perspective (2005–2019), Geophys. Res. Lett., 48, e2021GL093624, doi.org/10.1029/2021GL093624, 2021.
Hansen, J., Nazarenko, L., Ruedy, R., Sato, M., Willis, J., Del Genio, A., Koch, D., Lacis, A., Lo, K., Menon, S., Novakov, T., Perlwitz, J., Russell, G., Gavin A., S., and Tausnev, N.: Earth's Energy Imbalance: Confirmation and Implications, Science, 308, 1431–1435, https://doi.org/10.1126/science.1110252, 2005.
Hansen, J., Sato, M., Kharecha, P., and von Schuckmann, K.: Earth's energy imbalance and implications, Atmos. Chem. Phys., 11, 13421–13449, https://doi.org/10.5194/acp-11-13421-2011, 2011.
Hansen, J., Sato, M., Kharecha, P., von Schuckmann, K., Beerling, D. J., Cao, J., Marcott, S., Masson-Delmotte, V., Prather, M. J., Rohling, E. J., Shakun, J., Smith, P., Lacis, A., Russell, G., and Ruedy, R.: Young people's burden: requirement of negative CO2 emissions, Earth Syst. Dynam., 8, 577–616, https://doi.org/10.5194/esd-8-577-2017, 2017.
Hartmann, A. and Rath, V.: Uncertainties and shortcomings of ground surface temperature histories derived from inversion of temperature logs, J. Geophys. Eng., 2, 299–311, https://doi.org/10.1088/1742-2132/2/4/S02, 2005.
Hersbach, H., de Rosnay, P., Bell, B., Schepers, D., Simmons, A., Soci, C., Abdalla, S., Alonso-Balmaseda, M., Balsamo, G., Bechtold, P., Berrisford, P., Bidlot, J.-R., de Boisséson, E., Bonavita, M., Browne, P., Buizza, R., Dahlgren, P., Dee, D., Dragani, R., Diamantakis, M., Flemming, J., Forbes, R., Geer, A. J., Haiden, T., Hólm, E., Haimberger, L., Hogan, R., Horányi, A., Janiskova, M., Laloyaux, P., Lopez, P., Munoz-Sabater, J., Peubey, C., Radu, R., Richardson, D., Thépaut, J.-N., Vitart, F., Yang, X., Zsótér, E., and Zuo, H.: Operational global reanalysis: progress, future directions and synergies with NWP, ECMWF, ERA Report Series, https://doi.org/10.21957/tkic6g3wm, 2018.
Hersbach, H., Bell, B., Berrisford, P., Hirahara, S., Horányi, A., Muñoz-Sabater, J., Nicolas, J., Peubey, C., Radu, R., Schepers, D., Simmons, A., Soci, C., Abdalla, S., Abellan, X., Balsamo, G., Bechtold, P., Biavati, G., Bidlot, J., Bonavita, M., De Chiara, G., Dahlgren, P., Dee, D., Diamantakis, M., Dragani, R., Flemming, J., Forbes, R., Fuentes, M., Geer, A., Haimberger, L., Healy, S., Hogan, R. J., Hólm, E., Janisková, M., Keeley, S., Laloyaux, P., Lopez, P., Lupu, C., Radnoti, G., de Rosnay, P., Rozum, I., Vamborg, F., Villaume, S., and Thépaut, J. N.: The ERA5 global reanalysis, Q. J. Roy. Meteor. Soc., 146, 1999–2049, https://doi.org/10.1002/qj.3803, 2020.
Hopcroft, P. O., Gallagher, K., and Pain, C. C.: Inference of past climate from borehole temperature data using Bayesian Reversible Jump Markov chain Monte Carlo, Geophys. J. Int., 171, 1430–1439, https://doi.org/10.1111/j.1365-246X.2007.03596.x, 2007.
Hosoda, S., Ohira, T., and Nakamura, T.: A monthly mean dataset of global oceanic temperature and salinity derived from Argo float observations, JAMSTEC Report of Research and Development, 8, 47–59, https://doi.org/10.5918/jamstecr.8.47, 2008.
Hugelius, G., Bockheim, J. G., Camill, P., Elberling, B., Grosse, G., Harden, J. W., Johnson, K., Jorgenson, T., Koven, C. D., Kuhry, P., Michaelson, G., Mishra, U., Palmtag, J., Ping, C.-L., O'Donnell, J., Schirrmeister, L., Schuur, E. A. G., Sheng, Y., Smith, L. C., Strauss, J., and Yu, Z.: A new data set for estimating organic carbon storage to 3 m depth in soils of the northern circumpolar permafrost region, Earth Syst. Sci. Data, 5, 393–402, https://doi.org/10.5194/essd-5-393-2013, 2013.
IPCC: IPCC Special Report on the Ocean and Cryosphere in a Changing Climate, edited by: Pörtner, H.-O., Roberts, D. C., Masson-Delmotte, V., Zhai, P., Tignor, M., Poloczanska, E., Mintenbeck, K., Alegría, A., Nicolai, M., Okem, A., Petzold, J., Rama, B., and Weyer, N. M., Cambridge University Press, Cambridge, United Kingdom and New York, NY, USA, https://doi.org/10.1017/9781009157964, 2019.
IPCC: Climate Change 2021: The Physical Science Basis. Contribution of Working Group I to the Sixth Assessment Report of the Intergovernmental Panel on Climate Change, edited by: Masson-Delmotte, V., Zhai, P., Pirani, A., Connors, S. L., Péan, C., Berger, S., Caud, N., Chen, Y., Goldfarb, L., Gomis, M. I., Huang, M., Leitzell, K., Lonnoy, E., Matthews, J. B. R., Maycock, T. K., Waterfield, T., Yelekçi, O., Yu, R., and Zhou, B., Cambridge University Press, Cambridge, United Kingdom and New York, NY, USA, https://doi.org/10.1017/9781009157896, 2021a.
IPCC: Summary for Policymakers, in: Climate Change 2021: The Physical Science Basis. Contribution of Working Group I to the Sixth Assessment Report of the Intergovernmental Panel on Climate Change, edited by: Masson-Delmotte, V., Zhai, P., Pirani, A., Connors, S. L., Péan, C., Berger, S., Caud, N., Chen, Y., Goldfarb, L., Gomis, M. I., M.Huang, Leitzell, K., Lonnoy, E., Matthews, J. B. R., Maycock, T. K., Waterfield, T., Yelekçi, O., Yu, R., and Zhou, B., Cambridge University Press, Cambridge, United Kingdom and New York, NY, USA, https://doi.org/10.1017/9781009157896.001, 2021b.
IPCC: Climate Change 2022: Impacts, Adaptation, and Vulnerability. Contribution of Working Group II to the Sixth Assessment Report of the Intergovernmental Panel on Climate Change, edited by: Pörtner, H.-O., Roberts, D. C., Tignor, M., Poloczanska, E. S., Mintenbeck, K., Alegría, A., Craig, M., Langsdorf, S., Löschke, S., Möller, V., Okem, A., and Rama, B., Cambridge University Press, Cambridge, UK and New York, NY, USA, 3056 pp., https://doi.org/10.1017/9781009325844, 2022a.
IPCC: Summary for Policymakers, edited by: Pörtner, H.-O., Roberts, D. C., Poloczanska, E. S., Mintenbeck, K., Tignor, M., Alegría, A., Craig, M., Langsdorf, S., Löschke, S., Möller, V., and Okem, A., in: Climate Change 2022: Impacts, Adaptation, and Vulnerability. Contribution of Working Group II to the Sixth Assessment Report of the Intergovernmental Panel on Climate Change, edited by: Pörtner, H.-O., Roberts, D. C., Tignor, M., Poloczanska, E. S., Mintenbeck, K., Alegría, A., Craig, M., Langsdorf, S., Löschke, S., Möller, V., Okem, A., and Rama, B., Cambridge University Press, Cambridge, UK and New York, NY, USA, 3–33, https://doi.org/10.1017/9781009325844.001, 2022b.
IROWG: Report of IROWG activities: Outcome and recommendations from the IROWG-8 Workshop, CGMS-49 IROWG-WP-01 V3, 28 April 2021, International Radio Occultation Working Group, https://www.cgms-info.org/Agendas/WP/CGMS-49-IROWG-WP-01 (last access: 29 March 2023), 2021.
Ishii, M., Fukuda, Y., Hirahara, S., Yasui, S., Suzuki, T., and Sato, K.: Accuracy of Global Upper Ocean Heat Content Estimation Expected from Present Observational Data Sets, SOLA, 13, 163–167, https://doi.org/10.2151/sola.2017-030, 2017.
Jan, A. and Painter, S. L.: Permafrost thermal conditions are sensitive to shifts in snow timing, Environ. Res. Lett., 15, 084026, https://doi.org/10.1088/1748-9326/ab8ec4, 2020.
Jaume-Santero, F., Pickler, C., Beltrami, H., and Mareschal, J.-C.: North American regional climate reconstruction from ground surface temperature histories, Clim. Past, 12, 2181–2194, https://doi.org/10.5194/cp-12-2181-2016, 2016.
Johnson, G. C., Purkey, S. G., Zilberman, N. V, and Roemmich, D.: Deep Argo Quantifies Bottom Water Warming Rates in the Southwest Pacific Basin, Geophys. Res. Lett., 46, 2662–2669, https://doi.org/10.1029/2018GL081685, 2019.
Johnson, G. C., Lumpkin, R., Boyer, T., Bringas, F., Cetinić, I., Chambers, D. P., Cheng, L., Dong, S., Feely, R. A., Fox-Kemper, B., Frajka-Williams, E., Franz, B. A., Fu, Y., Gao, M., Garg, J., Gilson, J., Goni, G., Hamlington, B. D., Hewitt, H. T., Hobbs, W. R., Hu, Z.-Z., Huang, B., Jevrejeva, S., Johns, W. E., Katsunari, S., Kennedy, J. J., Kersalé, M., Killick, R. E., Leuliette, E., Locarnini, R., Lozier, M. S., Lyman, J. M., Merrifield, M. A., Mishonov, A., Mitchum, G. T., Moat, B. I., Nerem, R. S., Notz, D., Perez, R. C., Purkey, S. G., Rayner, D., Reagan, J., Schmid, C., Siegel, D. A., Smeed, D. A., Stackhouse, P. W., Sweet, W., Thompson, P. R., Volkov, D. L., Wanninkhof, R., Weller, R. A., Wen, C., Westberry, T. K., Widlansky, M. J., Willis, J. K., Yu, L., and Zhang, H.-M.: Global Oceans, B. Am. Meteorol. Soc., 103, S143–S192, https://doi.org/10.1175/BAMS-D-22-0072.1, 2022.
Kashiwase, H., Ohshima, K. I., Nihashi, S., and Eicken, H.: Evidence for ice-ocean albedo feedback in the Arctic Ocean shifting to a seasonal ice zone, Sci. Rep., 7, 8170, https://doi.org/10.1038/s41598-017-08467-z, 2017.
Kern, S., Lavergne, T., Notz, D., Pedersen, L. T., Tonboe, R. T., Saldo, R., and Sørensen, A. M.: Satellite passive microwave sea-ice concentration data set intercomparison: closed ice and ship-based observations, The Cryosphere, 13, 3261–3307, https://doi.org/10.5194/tc-13-3261-2019, 2019.
Khazaei, B., Read, L. K., Casali, M., Sampson, K. M., and Yates, D. N.: GLOBathy, the global lakes bathymetry dataset, Sci. Data, 9, 36, https://doi.org/10.1038/s41597-022-01132-9, 2022.
Kirchengast, G., Gorfer, M., Mayer, M., Steiner, A. K., and Haimberger, L.: GCOS EHI 1960–2020 Atmospheric Heat Content, World Data Center for Climate (WDCC) at DKRZ [data set], https://doi.org/10.26050/WDCC/GCOS_EHI_1960-2020_AHC, 2022.
Kobayashi, S., Ota, Y., Harada, Y., Ebita, A., Moriya, M., Onoda, H., Onogi, K., Kamahori, H., Kobayashi, C., Endo, H., MiyaokaI, K., and Takahashi, K.: The JRA-55 Reanalysis: General Specifications and Basic Characteristics, J. Meteorol. Soc. Jpn., 93, 5–48, https://doi.org/10.2151/jmsj.2015-001, 2015.
Kramer, R. J., He, H., Soden, B. J., Oreopoulos, L., Myhre, G., Forster, P. M., and Smith, C. J.: Observational Evidence of Increasing Global Radiative Forcing, Geophys. Res. Lett., 48, e2020GL091585, https://doi.org/10.1029/2020GL091585, 2021.
Kuhlbrodt, T. and Gregory, J. M.: Ocean heat uptake and its consequences for the magnitude of sea level rise and climate change, Geophys. Res. Lett., 39, L18608, https://doi.org/10.1029/2012GL052952, 2012.
Kuusela, M. and Giglio, D.: Global Ocean Heat Content Anomalies based on Argo data, Zenodo, https://doi.org/10.5281/zenodo.6131625, 2022.
Labe, Z., Magnusdottir, G., and Stern, H.: Variability of Arctic Sea Ice Thickness Using PIOMAS and the CESM Large Ensemble, J. Climate, 31, 3233–3247, https://doi.org/10.1175/JCLI-D-17-0436.1, 2018.
Ladstädter, F., Steiner, A. K., Schwärz, M., and Kirchengast, G.: Climate intercomparison of GPS radio occultation, RS90/92 radiosondes and GRUAN from 2002 to 2013, Atmos. Meas. Tech., 8, 1819–1834, https://doi.org/10.5194/amt-8-1819-2015, 2015.
Ladstädter, F., Steiner, A. K., and Gleisner, H.: Resolving the 21st century temperature trends of the upper troposphere–lower stratosphere with satellite observations, Sci. Rep., 13, 1306, https://doi.org/10.1038/s41598-023-28222-x, 2023.
Lane, A. C.: Geotherms of Lake Superior Copper Country, GSA Bull., 34, 703–720, https://doi.org/10.1130/GSAB-34-703, 1923.
Lavergne, T., Sørensen, A. M., Kern, S., Tonboe, R., Notz, D., Aaboe, S., Bell, L., Dybkjær, G., Eastwood, S., Gabarro, C., Heygster, G., Killie, M. A., Brandt Kreiner, M., Lavelle, J., Saldo, R., Sandven, S., and Pedersen, L. T.: Version 2 of the EUMETSAT OSI SAF and ESA CCI sea-ice concentration climate data records, The Cryosphere, 13, 49–78, https://doi.org/10.5194/tc-13-49-2019, 2019.
Laxon, S. W., Giles, K. A., Ridout, A. L., Wingham, D. J., Willatt, R., Cullen, R., Kwok, R., Schweiger, A., Zhang, J., Haas, C., Hendricks, S., Krishfield, R., Kurtz, N., Farrell, S., and Davidson, M.: CryoSat-2 estimates of Arctic sea ice thickness and volume, Geophys. Res. Lett., 40, 732–737, https://doi.org/10.1002/grl.50193, 2013.
Levitus, S., Antonov, J. I., Boyer, T. P., Baranova, O. K., Garcia, H. E., Locarnini, R. A., Mishonov, A. V, Reagan, J. R., Seidov, D., Yarosh, E. S., and Zweng, M. M.: World ocean heat content and thermosteric sea level change (0–2000 m), 1955–2010, Geophys. Res. Lett., 39, L10603, https://doi.org/10.1029/2012GL051106, 2012.
Li, H., Xu, F., Zhou, W., Wang, D., Wright, J. S., Liu, Z., and Lin, Y.: Development of a global gridded Argo data set with Barnes successive corrections, J. Geophys. Res.-Oceans, 122, 866–889, https://doi.org/10.1002/2016JC012285, 2017.
Li, Y., Church, J. A., McDougall, T. J., and Barker, P. M.: Sensitivity of Observationally Based Estimates of Ocean Heat Content and Thermal Expansion to Vertical Interpolation Schemes, Geophys. Res. Lett., 49, e2022G, https://doi.org/10.1029/2022GL101079, 2022.
Liao, S., Luo, H., Wang, J., Shi, Q., Zhang, J., and Yang, Q.: An evaluation of Antarctic sea-ice thickness from the Global Ice-Ocean Modeling and Assimilation System based on in situ and satellite observations, The Cryosphere, 16, 1807–1819, https://doi.org/10.5194/tc-16-1807-2022, 2022.
Ligtenberg, S. R. M., Kuipers Munneke, P., Noël, B. P. Y., and van den Broeke, M. R.: Brief communication: Improved simulation of the present-day Greenland firn layer (1960–2016), The Cryosphere, 12, 1643–1649, https://doi.org/10.5194/tc-12-1643-2018, 2018.
Liu, C., Allan, R. P., Mayer, M., Hyder, P., Desbruyères, D., Cheng, L., Xu, J., Xu, F., and Zhang, Y.: Variability in the global energy budget and transports 1985–2017, Clim. Dynam., 55, 3381–3396, https://doi.org/10.1007/s00382-020-05451-8, 2020.
Llovel, W., Willis, J. K., Landerer, F. W., and Fukumori, I.: Deep-ocean contribution to sea level and energy budget not detectable over the past decade, Nat. Clim. Change, 4, 1031–1035, https://doi.org/10.1038/nclimate2387, 2014.
Loeb, N. G., Lyman, J. M., Johnson, G. C., Allan, R. P., Doelling, D. R., Wong, T., Soden, B. J., and Stephens, G. L.: Observed changes in top-of-the-atmosphere radiation and upper-ocean heating consistent within uncertainty, Nat. Geosci., 5, 110–113, https://doi.org/10.1038/ngeo1375, 2012.
Loeb, N. G., Thorsen, T. J., Norris, J. R., Wang, H., and Su, W.: Changes in Earth's energy budget during and after the “Pause” in global warming: An observational perspective, Climate, 6, 62, https://doi.org/10.3390/cli6030062, 2018.
Loeb, N. G., Johnson, G. C., Thorsen, T. J., Lyman, J. M., Rose, F. G., and Kato, S.: Satellite and Ocean Data Reveal Marked Increase in Earth's Heating Rate, Geophys. Res. Lett., 48, e2021GL093047, https://doi.org/10.1029/2021GL093047, 2021.
Loeb, N. G., Mayer, M., Kato, S., Fasullo, J. T., Zuo, H., Senan, R., Lyman, J. M., Johnson, G. C., and Balmaseda, M.: Evaluating Twenty-Year Trends in Earth's Energy Flows From Observations and Reanalyses, J. Geophys. Res.-Atmos., 127, e2022JD036686, https://doi.org/10.1029/2022JD036686, 2022.
Lyman, J. M. and Johnson, G. C.: Estimating Global Ocean Heat Content Changes in the Upper 1800 m since 1950 and the Influence of Climatology Choice, J. Climate, 27, 1945–1957, https://doi.org/10.1175/JCLI-D-12-00752.1, 2014.
MacIntosh, C. R., Merchant, C. J., and von Schuckmann, K.: Uncertainties in Steric Sea Level Change Estimation During the Satellite Altimeter Era: Concepts and Practices, Surv. Geophys., 38, 59–87, https://doi.org/10.1007/s10712-016-9387-x, 2017.
Mankoff, K. D., Colgan, W., Solgaard, A., Karlsson, N. B., Ahlstrøm, A. P., van As, D., Box, J. E., Khan, S. A., Kjeldsen, K. K., Mouginot, J., and Fausto, R. S.: Greenland Ice Sheet solid ice discharge from 1986 through 2017, Earth Syst. Sci. Data, 11, 769–786, https://doi.org/10.5194/essd-11-769-2019, 2019.
Marti, F., Blazquez, A., Meyssignac, B., Ablain, M., Barnoud, A., Fraudeau, R., Jugier, R., Chenal, J., Larnicol, G., Pfeffer, J., Restano, M., and Benveniste, J.: Monitoring the ocean heat content change and the Earth energy imbalance from space altimetry and space gravimetry, Earth Syst. Sci. Data, 14, 229–249, https://doi.org/10.5194/essd-14-229-2022, 2022.
Masson, V., Champeaux, J.-L., Chauvin, F., Meriguet, C., and Lacaze, R.: A Global Database of Land Surface Parameters at 1-km Resolution in Meteorological and Climate Models, J. Climate, 16, 1261–1282, https://doi.org/10.1175/1520-0442(2003)16<1261:AGDOLS>2.0.CO;2, 2003.
Matthews, T., Byrne, M., Horton, R., Murphy, C., Pielke Sr, R., Raymond, C., Thorne, P., and Wilby, R. L.: Latent heat must be visible in climate communications, WIREs Clim. Change, 13, e779, https://doi.org/10.1002/wcc.779, 2022.
Mayer, J., Mayer, M., and Haimberger, L.: Consistency and Homogeneity of Atmospheric Energy, Moisture, and Mass Budgets in ERA5, J. Climate, 34, 3955–3974, https://doi.org/10.1175/JCLI-D-20-0676.1, 2021.
Mayer, M., Haimberger, L., Edwards, J. M., and Hyder, P.: Toward Consistent Diagnostics of the Coupled Atmosphere and Ocean Energy Budgets, J. Climate, 30, 9225–9246, https://doi.org/10.1175/JCLI-D-17-0137.1, 2017.
Mayer, M., Lien, V. S., Mork, K. A., von Schuckmann, K., Monier, M., and Greiner, E.: Ocean heat content in the High North, in Copernicus Marine Service Ocean State Report, Issue 5, J. Oper. Oceanogr., 14, 17–23, https://doi.org/10.1080/1755876X.2021.1946240, 2021.
Meng, L., Liu, J., Tarasick, D. W., Randel, W. J., Steiner, A. K., Wilhelmsen, H., Wang, L., and Haimberger, L.: Continuous rise of the tropopause in the Northern Hemisphere over 1980–2020, Sci. Adv., 7, eabi8065, https://doi.org/10.1126/sciadv.abi8065, 2022.
Meyssignac, B., Boyer, T., Zhao, Z., Hakuba, M. Z., Landerer, F. W., Stammer, D., Köhl, A., Kato, S., L'Ecuyer, T., Ablain, M., Abraham, J. P., Blazquez, A., Cazenave, A., Church, J. A., Cowley, R., Cheng, L., Domingues, C. M., Giglio, D., Gouretski, V., Ishii, M., Johnson, G. C., Killick, R. E., Legler, D., Llovel, W., Lyman, J., Palmer, M. D., Piotrowicz, S., Purkey, S. G., Roemmich, D., Roca, R., Savita, A., Schuckmann, K. von, Speich, S., Stephens, G., Wang, G., Wijffels, S. E., and Zilberman, N.: Measuring Global Ocean Heat Content to Estimate the Earth Energy Imbalance, Front. Mar. Sci., 6, 432, https://doi.org/10.3389/fmars.2019.00432, 2019.
Millan, R., Mouginot, J., Rabatel, A., and Morlighem, M.: Ice velocity and thickness of the world's glaciers, Nat. Geosci., 15, 124–129, https://doi.org/10.1038/s41561-021-00885-z, 2022.
Moltmann, T., Turton, J., Zhang, H.-M., Nolan, G., Gouldman, C., Griesbauer, L., Willis, Z., Piniella, Á. M., Barrell, S., Andersson, E., Gallage, C., Charpentier, E., Belbeoch, M., Poli, P., Rea, A., Burger, E. F., Legler, D. M., Lumpkin, R., Meinig, C., O'Brien, K., Saha, K., Sutton, A., Zhang, D., and Zhang, Y.: A Global Ocean Observing System (GOOS), Delivered Through Enhanced Collaboration Across Regions, Communities, and New Technologies, Front. Mar. Sci., 6, https://doi.org/10.3389/fmars.2019.00291, 2019.
Moon, T. and Joughin, I.: Changes in ice front position on Greenland's outlet glaciers from 1992 to 2007, J. Geophys. Res.-Earth, 113, F02022, https://doi.org/10.1029/2007JF000927, 2008.
Moore, G. W. K., Våge, K., Renfrew, I. A., and Pickart, R. S.: Sea-ice retreat suggests re-organization of water mass transformation in the Nordic and Barents Seas, Nat. Commun., 13, 67, https://doi.org/10.1038/s41467-021-27641-6, 2022.
Motyka, R. J., Truffer, M., Fahnestock, M., Mortensen, J., Rysgaard, S., and Howat, I.: Submarine melting of the 1985 Jakobshavn Isbræ floating tongue and the triggering of the current retreat, J. Geophys. Res.-Earth, 116, F01007, https://doi.org/10.1029/2009JF001632, 2011.
Mouginot, J., Rignot, E., Scheuchl, B., Fenty, I., Khazendar, A., Morlighem, M., Buzzi, A., and Paden, J.: Fast retreat of Zachariæ Isstrø m, northeast Greenland, Science, 350, 1357–1361, https://doi.org/10.1126/science.aac7111, 2015.
Mouginot, J., Rignot, E., Bjørk, A., van den Broeke, M., Millan, R., Morlighem, M., Noël, B., Scheuchl, B., and Wood, M.: Forty-six years of Greenland Ice Sheet mass balance from 1972 to 2018, P. Natl. Acad. Sci. USA, 116, 9239–9244, https://doi.org/10.1073/pnas.1904242116, 2019.
Münchow, A., Padman, L., and Fricker, H. A.: Interannual changes of the floating ice shelf of Petermann Gletscher, North Greenland, from 2000 to 2012, J. Glaciol., 60, 489–499, https://doi.org/10.3189/2014JoG13J135, 2014.
Nauels, A., Meinshausen, M., Mengel, M., Lorbacher, K., and Wigley, T. M. L.: Synthesizing long-term sea level rise projections – the MAGICC sea level model v2.0, Geosci. Model Dev., 10, 2495–2524, https://doi.org/10.5194/gmd-10-2495-2017, 2017.
Nicolaus, M., Hoppmann, M., Arndt, S., Hendricks, S., Katlein, C., Nicolaus, A., Rossmann, L., Schiller, M., and Schwegmann, S.: Snow Depth and Air Temperature Seasonality on Sea Ice Derived From Snow Buoy Measurements, Front. Mar. Sci., 8, https://doi.org/10.3389/fmars.2021.655446, 2021.
Nitzbon, J., Krinner, G., Schneider von Deimling, T., Werner, M., and Langer, M.: Quantifying the Permafrost Heat Sink in Earth's Climate System, ESS Open Archive [preprint], https://doi.org/10.1002/essoar.10511600.1, 2022a.
Nitzbon, J., Krinner, G., and Langer, M.: GCOS EHI 1960–2020 Permafrost Heat Content. World Data Center for Climate (WDCC) at DKRZ [data set], https://doi.org/10.26050/WDCC/GCOS_EHI_1960-2020_PHC, 2022b.
Palmer, M. D. and McNeall, D. J.: Internal variability of Earth's energy budget simulated by CMIP5 climate models, Environ. Res. Lett., 9, 034016, https://doi.org/10.1088/1748-9326/9/3/034016, 2014.
Palmer, M. D., Haines, K., Tett, S. F. B., and Ansell, T. J.: Isolating the signal of ocean global warming, Geophys. Res. Lett., 34, L23610, https://doi.org/10.1029/2007GL031712, 2007.
Palmer, M. D., Roberts, C. D., Balmaseda, M., Chang, Y.-S., Chepurin, G., Ferry, N., Fujii, Y., Good, S. A., Guinehut, S., Haines, K., Hernandez, F., Köhl, A., Lee, T., Martin, M. J., Masina, S., Masuda, S., Peterson, K. A., Storto, A., Toyoda, T., Valdivieso, M., Vernieres, G., Wang, O., and Xue, Y.: Ocean heat content variability and change in an ensemble of ocean reanalyses, Clim. Dynam., 49, 909–930, https://doi.org/10.1007/s00382-015-2801-0, 2017.
Palmer, M. D., Domingues, C. M., Slangen, A. B. A., and Boeira Dias, F.: An ensemble approach to quantify global mean sea-level rise over the 20th century from tide gauge reconstructions, Environ. Res. Lett., 16, 044043, https://doi.org/10.1088/1748-9326/abdaec, 2021.
Park, H., Fedorov, A. N., Zheleznyak, M. N., Konstantinov, P. Y., and Walsh, J. E.: Effect of snow cover on pan-Arctic permafrost thermal regimes, Clim. Dynam., 44, 2873–2895, https://doi.org/10.1007/s00382-014-2356-5, 2015.
Perovich, D., Polashenski, C., Arntsen, A., and Stwertka, C.: Anatomy of a late spring snowfall on sea ice, Geophys. Res. Lett., 44, 2802–2809, https://doi.org/10.1002/2016GL071470, 2017.
Pickler, C., Beltrami, H., and Mareschal, J.-C.: Laurentide Ice Sheet basal temperatures during the last glacial cycle as inferred from borehole data, Clim. Past, 12, 115–127, https://doi.org/10.5194/cp-12-115-2016, 2016.
Pisoft, P., Sacha, P., Polvani, L. M., Añel, J. A., de la Torre, L., Eichinger, R., Foelsche, U., Huszar, P., Jacobi, C., Karlicky, J., Kuchar, A., Miksovsky, J., Zak, M., and Rieder, H. E.: Stratospheric contraction caused by increasing greenhouse gases, Environ. Res. Lett., 16, 64038, https://doi.org/10.1088/1748-9326/abfe2b, 2021.
Purkey, S. G. and Johnson, G. C.: Warming of Global Abyssal and Deep Southern Ocean Waters between the 1990s and 2000s: Contributions to Global Heat and Sea Level Rise Budgets, J. Climate, 23, 6336–6351, https://doi.org/10.1175/2010JCLI3682.1, 2010.
Qu, X. and Hall, A.: What Controls the Strength of Snow-Albedo Feedback?, J. Climate, 20, 3971–3981, https://doi.org/10.1175/JCLI4186.1, 2007.
Raghuraman, S. P., Paynter, D., and Ramaswamy, V.: Anthropogenic forcing and response yield observed positive trend in Earth's energy imbalance, Nat. Commun., 12, 4577, https://doi.org/10.1038/s41467-021-24544-4, 2021.
Rhein, M., RintoulS., Aoki, S., Campos, E., Chambers, D., Feely, R., Gulev, S., Johnson, G., Josey, S., Kostianoy, A., Mauritzen, C., Roemmich, D., Talley, L., and Wang, F.: Chapter 3: Observations: Ocean, in: Climate Change 2013: The Physical Science Basis. Contribution of Working Group I to the Fifth Assessment Report of the Intergovernmental Panel on Climate Change., edited by: Stocker, T., Qin, D., Plattner, G.-K., Tignor, M., Allen, S., Boschung, J., Nauels, A., Xia, Y., Bex, V., and Midgley, P., Cambridge University Press, Cambridge University Press, Cambridge United Kingdom and New York, USA, 2013.
Rignot, E., Mouginot, J., Scheuchl, B., van den Broeke, M., van Wessem, M. J., and Morlighem, M.: Four decades of Antarctic Ice Sheet mass balance from 1979–2017, P. Natl. Acad. Sci., 116, 1095, https://doi.org/10.1073/pnas.1812883116, 2019.
Roemmich, D. and Gilson, J.: The 2004–2008 mean and annual cycle of temperature, salinity, and steric height in the global ocean from the Argo Program, Prog. Oceanogr., 82, 81–100, https://doi.org/10.1016/j.pocean.2009.03.004, 2009.
Roemmich, D., Church, J., Gilson, J., Monselesan, D., Sutton, P., and Wijffels, S.: Unabated planetary warming and its ocean structure since 2006, Nat. Clim. Change, 5, 240–245, https://doi.org/10.1038/nclimate2513, 2015.
Santer, B. D., Wigley, T. M. L., Doutriaux, C., Boyle, J. S., Hansen, J. E., Jones, P. D., Meehl, G. A., Roeckner, E., Sengupta, S., and Taylor, K. E.: Accounting for the effects of volcanoes and ENSO in comparisons of modeled and observed temperature trends, J. Geophys. Res.-Atmos., 106, 28033–28059, https://doi.org/10.1029/2000JD000189, 2001.
Santer, B. D., Po-Chedley, S., Mears, C., Fyfe, J. C., Gillett, N., Fu, Q., Painter, J. F., Solomon, S., Steiner, A. K., Wentz, F. J., Zelinka, M. D., and Zou, C.-Z.: Using Climate Model Simulations to Constrain Observations, J. Climate, 34, 6281–6301, https://doi.org/10.1175/JCLI-D-20-0768.1, 2021.
Santer, B. D., Po-Chedley, S., Feldl, N., Fyfe, J. C., Fu, Q., Solomon, S., England, M., Rodgers, K. B., Stuecker, M. F., Mears, C., Zou, C.-Z., Bonfils, C. J. W., Pallotta, G., Zelinka, M. D., Rosenbloom, N., and Edwards, J.: Robust anthropogenic signal identified in the seasonal cycle of tropospheric temperature, J. Climate, 35, 6075–6100, https://doi.org/10.1175/JCLI-D-21-0766.1, 2022.
Savita, A., Domingues, C. M., Boyer, T., Gouretski, V., Ishii, M., Johnson, G. C., Lyman, J. M., Willis, J. K., Marsland, S. J., Hobbs, W., Church, J. A., Monselesan, D. P., Dobrohotoff, P., Cowley, R., and Wijffels, S. E.: Quantifying Spread in Spatiotemporal Changes of Upper-Ocean Heat Content Estimates: An Internationally Coordinated Comparison, J. Climate, 35, 851–875, https://doi.org/10.1175/JCLI-D-20-0603.1, 2022.
Schweiger, A., Lindsay, R., Zhang, J., Steele, M., Stern, H., and Kwok, R.: Uncertainty in modeled Arctic sea ice volume, J. Geophys. Res.-Oceans, 116, C00D06, https://doi.org/10.1029/2011JC007084, 2011.
Schweiger, A. J., Wood, K. R., and Zhang, J.: Arctic Sea Ice Volume Variability over 1901–2010: A Model-Based Reconstruction, J. Climate, 32, 4731–4752, https://doi.org/10.1175/JCLI-D-19-0008.1, 2019.
Shen, P. Y., Wang, K., Beltrami, H., and Mareschal, J.-C.: A comparative study of inverse methods for estimating climatic history from borehole temperature data, Palaeogeogr. Palaeoecl., 98, 113–127, https://doi.org/10.1016/0031-0182(92)90192-8, 1992.
Shen, X., Ke, C.-Q., and Li, H.: Snow depth product over Antarctic sea ice from 2002 to 2020 using multisource passive microwave radiometers, Earth Syst. Sci. Data, 14, 619–636, https://doi.org/10.5194/essd-14-619-2022, 2022.
Shepherd, A., Fricker, H. A., and Farrell, S. L.: Trends and connections across the Antarctic cryosphere, Nature, 558, 223–232, https://doi.org/10.1038/s41586-018-0171-6, 2018.
Shepherd, A., Ivins, E., Rignot, E., Smith, B., van den Broeke, M., Velicogna, I., Whitehouse, P., Briggs, K., Joughin, I., Krinner, G., Nowicki, S., Payne, T., Scambos, T., Schlegel, N., Geruo, A., Agosta, C., Ahlstrøm, A., Babonis, G., Barletta, V. R., Bjørk, A. A., Blazquez, A., Bonin, J., Colgan, W., Csatho, B., Cullather, R., Engdahl, M. E., Felikson, D., Fettweis, X., Forsberg, R., Hogg, A. E., Gallee, H., Gardner, A., Gilbert, L., Gourmelen, N., Groh, A., Gunter, B., Hanna, E., Harig, C., Helm, V., Horvath, A., Horwath, M., Khan, S., Kjeldsen, K. K., Konrad, H., Langen, P. L., Lecavalier, B., Loomis, B., Luthcke, S., McMillan, M., Melini, D., Mernild, S., Mohajerani, Y., Moore, P., Mottram, R., Mouginot, J., Moyano, G., Muir, A., Nagler, T., Nield, G., Nilsson, J., Noël, B., Otosaka, I., Pattle, M. E., Peltier, W. R., Pie, N., Rietbroek, R., Rott, H., Sørensen, L. S., Sasgen, I., Save, H., Scheuchl, B., Schrama, E., Schröder, L., Seo, K.-W., Simonsen, S. B., Slater, T., Spada, G., Sutterley, T., Talpe, M., Tarasov, L., Jan van de Berg, W., van der Wal, W., van Wessem, M., Vishwakarma, B. D., Wiese, D., Wilton, D., Wagner, T., Wouters, B., Wuite, J., and Team, T. I.: Mass balance of the Greenland Ice Sheet from 1992 to 2018, Nature, 579, 233–239, https://doi.org/10.1038/s41586-019-1855-2, 2019.
Slater, T., Lawrence, I. R., Otosaka, I. N., Shepherd, A., Gourmelen, N., Jakob, L., Tepes, P., Gilbert, L., and Nienow, P.: Review article: Earth's ice imbalance, The Cryosphere, 15, 233–246, https://doi.org/10.5194/tc-15-233-2021, 2021.
Smith, B., Fricker, A. H., Gardner, S. A., Medley, B., Nilsson, J., Paolo, S. F., Holschuh, N., Adusumilli, S., Brunt, K., Csatho, B., Harbeck, K., Markus, T., Neumann, T., Siegfried, M., and Zwally, J. H.: Pervasive ice sheet mass loss reflects competing ocean and atmosphere processes, Science, 368, 1239–1242, https://doi.org/10.1126/science.aaz5845, 2020.
Smith, D. M., Allan, R. P., Coward, A. C., Eade, R., Hyder, P., Liu, C., Loeb, N. G., Palmer, M. D., Roberts, C. D., and Scaife, A. A.: Earth's energy imbalance since 1960 in observations and CMIP5 models, Geophys. Res. Lett., 42, 1205–1213, https://doi.org/10.1002/2014GL062669, 2015.
Staten, P. W., Grise, K. M., Davis, S. M., Karnauskas, K. B., Waugh, D. W., Maycock, A. C., Fu, Q., Cook, K., Adam, O., Simpson, I. R., Allen, R. J., Rosenlof, K., Chen, G., Ummenhofer, C. C., Quan, X.-W., Kossin, J. P., Davis, N. A., and Son, S.-W.: Tropical Widening: From Global Variations to Regional Impacts, B. Am. Meteorol. Soc., 101, E897–E904, https://doi.org/10.1175/bams-d-19-0047.1, 2020.
Steiner, A. K., Ladstädter, F., Randel, W. J., Maycock, A. C., Fu, Q., Claud, C., Gleisner, H., Haimberger, L., Ho, S.-P., Keckhut, P., Leblanc, T., Mears, C., Polvani, L. M., Santer, B. D., Schmidt, T., Sofieva, V., Wing, R., and Zou, C.-Z.: Observed Temperature Changes in the Troposphere and Stratosphere from 1979 to 2018, J. Climate, 33, 8165–8194, https://doi.org/10.1175/JCLI-D-19-0998.1, 2020a.
Steiner, A. K., Ladstädter, F., Ao, C. O., Gleisner, H., Ho, S.-P., Hunt, D., Schmidt, T., Foelsche, U., Kirchengast, G., Kuo, Y.-H., Lauritsen, K. B., Mannucci, A. J., Nielsen, J. K., Schreiner, W., Schwärz, M., Sokolovskiy, S., Syndergaard, S., and Wickert, J.: Consistency and structural uncertainty of multi-mission GPS radio occultation records, Atmos. Meas. Tech., 13, 2547–2575, https://doi.org/10.5194/amt-13-2547-2020, 2020b.
Storto, A., Masina, S., Simoncelli, S., Iovino, D., Cipollone, A., Drevillon, M., Drillet, Y., Schuckman, K., Parent, L., Garric, G., Greiner, E., Desportes, C., Zuo, H., Balmaseda, M., and Peterson, K.: The added value of the multi-system spread information for ocean heat content and steric sea level investigations in the CMEMS GREP ensemble reanalysis product, Clim. Dynam., 53, 287–312, https://doi.org/10.1007/s00382-018-4585-5, 2018.
Storto, A., Alvera-Azcárate, A., Balmaseda, M. A., Barth, A., Chevallier, M., Counillon, F., Domingues, C. M., Drevillon, M., Drillet, Y., Forget, G., Garric, G., Haines, K., Hernandez, F., Iovino, D., Jackson, L. C., Lellouche, J.-M., Masina, S., Mayer, M., Oke, P. R., Penny, S. G., Peterson, K. A., Yang, C., and Zuo, H.: Ocean Reanalyses: Recent Advances and Unsolved Challenges, Front. Mar. Sci., 6, https://doi.org/10.3389/fmars.2019.00418, 2019.
Tilling, R. L., Ridout, A., and Shepherd, A.: Estimating Arctic sea ice thickness and volume using CryoSat-2 radar altimeter data, Adv. Space Res., 62, 1203–1225, https://doi.org/10.1016/j.asr.2017.10.051, 2018.
Trenberth, K. E., Fasullo, J. T., von Schuckmann, K., and Cheng, L.: Insights into Earth's Energy Imbalance from Multiple Sources, J. Climate, 29, 7495–7505, https://doi.org/10.1175/JCLI-D-16-0339.1, 2016.
Vanderkelen, I., van Lipzig, N. P. M., Lawrence, D. M., Droppers, B., Golub, M., Gosling, S. N., Janssen, A. B. G., Marcé, R., Schmied, H. M., Perroud, M., Pierson, D., Pokhrel, Y., Satoh, Y., Schewe, J., Seneviratne, S. I., Stepanenko, V. M., Tan, Z., Woolway, R. I., and Thiery, W.: Global Heat Uptake by Inland Waters, Geophys. Res. Lett., 47, e2020GL087867, https://doi.org/10.1029/2020GL087867, 2020.
Vanderkelen, I. and Thiery, W.: GCOS EHI 1960–2020 Inland Water Heat Content, World Data Center for Climate (WDCC) at DKRZ [data set], https://doi.org/10.26050/WDCC/GCOS_EHI_1960-2020_IWHC, 2022.
Verver, G., Fujiwara, M., Dolmans, P., Becker, C., Fortuin, P., and Miloshevich, L.: Performance of the Vaisala RS80A/H and RS90 Humicap Sensors and the Meteolabor “Snow White” Chilled-Mirror Hygrometer in Paramaribo, Suriname, J. Atmos. Ocean. Tech., 23, 1506–1518, https://doi.org/10.1175/JTECH1941.1, 2006.
von Schuckmann, K. and Le Traon, P.-Y.: How well can we derive Global Ocean Indicators from Argo data?, Ocean Sci., 7, 783–791, https://doi.org/10.5194/os-7-783-2011, 2011.
von Schuckmann, K., Sallée, J.-B., Chambers, D., Le Traon, P.-Y., Cabanes, C., Gaillard, F., Speich, S., and Hamon, M.: Consistency of the current global ocean observing systems from an Argo perspective, Ocean Sci., 10, 547–557, https://doi.org/10.5194/os-10-547-2014, 2014.
von Schuckmann, K., Palmer, M. D., Trenberth, K. E., Cazenave, A., Chambers, D., Champollion, N., Hansen, J., Josey, S. A., Loeb, N., Mathieu, P.-P., Meyssignac, B., and Wild, M.: An imperative to monitor Earth's energy imbalance, Nat. Clim. Change, 6, 138–144, https://doi.org/10.1038/nclimate2876, 2016.
von Schuckmann, K., Le Traon, P.-Y., Smith, N., et al.: Copernicus Marine Service Ocean State Report, J. Oper. Oceanogr., 11, S1–S142, https://doi.org/10.1080/1755876X.2018.1489208, 2018.
von Schuckmann, K., Cheng, L., Palmer, M. D., Hansen, J., Tassone, C., Aich, V., Adusumilli, S., Beltrami, H., Boyer, T., Cuesta-Valero, F. J., Desbruyères, D., Domingues, C., García-García, A., Gentine, P., Gilson, J., Gorfer, M., Haimberger, L., Ishii, M., Johnson, G. C., Killick, R., King, B. A., Kirchengast, G., Kolodziejczyk, N., Lyman, J., Marzeion, B., Mayer, M., Monier, M., Monselesan, D. P., Purkey, S., Roemmich, D., Schweiger, A., Seneviratne, S. I., Shepherd, A., Slater, D. A., Steiner, A. K., Straneo, F., Timmermans, M.-L., and Wijffels, S. E.: Heat stored in the Earth system: where does the energy go?, Earth Syst. Sci. Data, 12, 2013–2041, https://doi.org/10.5194/essd-12-2013-2020, 2020.
von Schuckmann, K., Minière, A., Gues, F., Cuesta-Valero, F. J., Kirchengast, G., Adusumilli, S., Straneo, F., Allan, R., Barker, P. M. ., Beltrami, H., Boyer, T., Cheng, L., Church, J., Desbruyeres, D., Dolman, H., Domingues, C. M. ., García-García, A., Gilson, J., Gorfer, M., Haimberger, L., Hendricks, S., Hosoda, S., Johnson, G. C. ., Killick, R., King, B. A. ., Kolodziejczyk, N., Korosov, A., Krinner, G., Kuusela, M., Langer, M., Lavergne, T., Lawrence, I., Li, Y., Lyman, J., Marzeion, B., Mayer, M., MacDougall, A., McDougall, T., Monselesan, D. P., Nitzbon, J., Otosaka, I., Peng, J., Purkey, S., Roemmich, D., Sato, K., Sato, K., Savita, A., Schweiger, A., Shepherd, A., Seneviratne, S. I. ., Slater, D. A. ., Slater, T., Simons, L., Steiner, A. K. ., Szekely, T., Suga, T., Thiery, W., Timmermanns, M.-L., Vanderkelen, I., Wijffels, S. E. ., Wu, T., and Zemp, M.: GCOS EHI 1960–2020 Earth Heat Inventory Ocean Heat Content (Version 2), World Data Center for Climate [data set], https://doi.org/10.26050/WDCC/GCOS_EHI_1960-2020_OHC_v2, 2023.
Vömel, H., Selkirk, H., Miloshevich, L., Valverde-Canossa, J., Valdés, J., Kyrö, E., Kivi, R., Stolz, W., Peng, G., and Diaz, J. A.: Radiation Dry Bias of the Vaisala RS92 Humidity Sensor, J. Atmos. Ocean. Tech., 24, 953–963, https://doi.org/10.1175/JTECH2019.1, 2007.
Wanders, N., Thober, S., Kumar, R., Pan, M., Sheffield, J., Samaniego, L., and Wood, E. F.: Development and Evaluation of a Pan-European Multimodel Seasonal Hydrological Forecasting System, J. Hydrometeorol., 20, 99–115, https://doi.org/10.1175/JHM-D-18-0040.1, 2019.
Wang, J., Cole, H. L., Carlson, D. J., Miller, E. R., Beierle, K., Paukkunen, A., and Laine, T. K.: Corrections of Humidity Measurement Errors from the Vaisala RS80 Radiosonde–Application to TOGA COARE Data, J. Atmos. Ocean. Tech., 19, 981–1002, https://doi.org/10.1175/1520-0426(2002)019<0981:COHMEF>2.0.CO;2, 2002.
Wang, X., Key, J., Kwok, R., and Zhang, J.: Comparison of Arctic Sea Ice Thickness from Satellites, Aircraft, and PIOMAS Data, Remote Sens., 8, 713, https://doi.org/10.3390/rs8090713, 2016.
WCRP Global Sea Level Budget Group: Global sea-level budget 1993–present, Earth Syst. Sci. Data, 10, 1551–1590, https://doi.org/10.5194/essd-10-1551-2018, 2018.
Webster, M. A., DuVivier, A. K., Holland, M. M., and Bailey, D. A.: Snow on Arctic Sea Ice in a Warming Climate as Simulated in CESM, J. Geophys. Res.-Oceans, 126, e2020JC016308, https://doi.org/10.1029/2020JC016308, 2021.
Weihs, P., Laimighofer, J., Formayer, H., and Olefs, M.: Influence of snow making on albedo and local radiative forcing in an alpine area, Atmos. Res., 255, 105448, https://doi.org/10.1016/j.atmosres.2020.105448, 2021.
WGMS: Fluctuations of Glaciers Database, World Glacier Monitoring Service, Zurich, Switzerland, https://doi.org/10.5904/wgms-fog-2021-05, 2021.
Wijffels, S., Roemmich, D., Monselesan, D., Church, J., and Gilson, J.: Ocean temperatures chronicle the ongoing warming of Earth, Nat. Clim. Change, 6, 116–118, https://doi.org/10.1038/nclimate2924, 2016.
Wilson, N., Straneo, F., and Heimbach, P.: Satellite-derived submarine melt rates and mass balance (2011–2015) for Greenland's largest remaining ice tongues, The Cryosphere, 11, 2773–2782, https://doi.org/10.5194/tc-11-2773-2017, 2017.
Wong, A. P. S., Wijffels, S. E., Riser, S. C., et al.: Argo Data 1999–2019: Two Million Temperature-Salinity Profiles and Subsurface Velocity Observations From a Global Array of Profiling Floats, https://www.frontiersin.org/articles/10.3389/fmars.2020.00700 (last access: 29 March 2023), 2020.
Wunsch, C.: Is the Ocean Speeding Up? Ocean Surface Energy Trends, J. Phys. Oceanogr., 50, 3205–3217, https://doi.org/10.1175/JPO-D-20-0082.1, 2020.
Zanna, L., Khatiwala, S., Gregory, J. M., Ison, J., and Heimbach, P.: Global reconstruction of historical ocean heat storage and transport, P. Natl. Acad. Sci. USA, 116, 1126, https://doi.org/10.1073/pnas.1808838115, 2019.
Zemp, M., Huss, M., Thibert, E., Eckert, N., McNabb, R., Huber, J., Barandun, M., Machguth, H., Nussbaumer, S. U., Gärtner-Roer, I., Thomson, L., Paul, F., Maussion, F., Kutuzov, S., and Cogley, J. G.: Global and regional glacier mass changes from 1961 to 2016, Zenodo, https://doi.org/10.5281/zenodo.3557199, 2019.
Zemp, M., Huss, M., Eckert, N., Thibert, E., Paul, F., Nussbaumer, S. U., and Gärtner-Roer, I.: Brief communication: Ad hoc estimation of glacier contributions to sea-level rise from the latest glaciological observations, The Cryosphere, 14, 1043–1050, https://doi.org/10.5194/tc-14-1043-2020, 2020.
Zhang, J. and Rothrock, D. A.: Modeling Global Sea Ice with a Thickness and Enthalpy Distribution Model in Generalized Curvilinear Coordinates, Mon. Weather Rev., 131, 845–861, https://doi.org/10.1175/1520-0493(2003)131<0845:MGSIWA>2.0.CO;2, 2003.
Zhang, R., Wang, H., Fu, Q., Rasch, J. P., and Wang, X.: Unraveling driving forces explaining significant reduction in satellite-inferred Arctic surface albedo since the 1980s, P. Natl. Acad. Sci. USA, 116, 23947–23953, https://doi.org/10.1073/pnas.1915258116, 2019.
Zou, C.-Z., Xu, H., Hao, X., and Fu, Q.: Post-Millennium Atmospheric Temperature Trends Observed From Satellites in Stable Orbits, Geophys. Res. Lett., 48, e2021GL093291, https://doi.org/10.1029/2021GL093291, 2021.
https://unfccc.int/sites/default/files/english_paris_agreement.pdf (last access: 29 March 2023)
https://www.goosocean.org/ (last access: 29 March 2023)
http://imbie.org/imbie-3/ (last access: 29 March 2023)
https://wgms.ch (last access: 29 March 2023)
https://glambie.org (last access: 29 March 2023)
https://unfccc.int/topics/global-stocktake#:~:text=The global stocktake of the,term goals (Article 14) (last access: 29 March 2023)
- Abstract
- Introduction
- Heat stored in the ocean
- Heat available to warm the atmosphere
- Heat available to warm land
- Heat utilized to melt ice
- The Earth heat inventory: where does the energy go?
- Data availability
- Conclusions
- Author contributions
- Competing interests
- Disclaimer
- Acknowledgements
- Financial support
- Review statement
- References