the Creative Commons Attribution 4.0 License.
the Creative Commons Attribution 4.0 License.
 | 23 Mar 2023
Lake surface temperature retrieved from Landsat satellite series (1984 to 2021) for the North Slave Region
Homa Kheyrollah Pour
K. Andrea Scott
Lake surface temperature (LST) is an important attribute that highlights regional weather and climate variability and trends. The spatial resolution and thermal sensors on Landsat platforms provide the capability of monitoring the temporal and spatial distribution of lake surface temperature on small- to medium-sized lakes. In this study, a retrieval algorithm was applied to the thermal bands of Landsat archives to generate a LST dataset (North Slave LST dataset) for 535 lakes in the North Slave Region (NSR) of the Northwest Territories (NWT), Canada, for the period of 1984 to 2021. North Slave LST was retrieved from Landsat 5 Thematic Mapper (TM), Landsat 7 Enhanced Thematic Mapper Plus (ETM+), and Landsat 8 Operational Land Imager (OLI) and the Thermal Infrared Sensor (TIRS); however, most of the dataset was created from the thermal bands of Landsat 5 (43 %) due to its longevity (1984–2013). Cloud masks were applied to Landsat images to eliminate cloud cover. In addition, a 100 m inward buffer was applied to lakes to prevent pixel mixing with shorelines. To evaluate the algorithm applied, retrieved LST was compared with in situ data and Moderate Resolution Imaging Spectroradiometer (MODIS) LST observations. A good agreement was observed between in situ observations and North Slave LST, with a mean bias of 0.12 ∘C and a root mean squared deviation (RMSD) of 1.7 ∘C. The North Slave LST dataset contains more available data for warmer months (May to September; 57.3 %) compared to colder months (October to April). The average number of images per year for each lake across the NSR ranged from 20 to 45. The North Slave LST dataset, available at https://doi.org/10.5683/SP3/J4GMC2 (Attiah et al., 2022), will provide communities, scientists, and stakeholders with spatial and temporal changing temperature trends on lakes for the past 38 years.
- Article
(6658 KB) - Full-text XML
- BibTeX
- EndNote


Lake surface temperature (LST) is a significant indicator of climate change and is crucial to lake ecosystems (Livingstone et al., 2005; Zhang et al., 2019). Several ecological, biological, and hydrogeochemical processes are influenced by temperature in lakes (Schneider and Hook, 2010). Lake warming can result in a decrease in ice cover, changes in over-lake wind speeds, and changes in water column stratification (Austin and Colman, 2007; Desai et al., 2009; Kraemer et al., 2015; Magnuson et al., 2000). The land–water–atmosphere system's energy and material exchange processes can also be reflected in lake surface temperature (Huang et al., 2017; Yang et al., 2020) and is hence recognised as an essential climate variable. As a significant variable in regional studies, the impact and relationship of LST to weather, climate, and lake processes have been explored by other studies, including influences on the weather (Eerola et al., 2014; Kheyrollah Pour et al., 2017, 2014a, b), climate (Moigne et al., 2016; Wang et al., 2022), precipitation (Zhang et al., 2016), lake effect snow (Shi and Xie, 2019), and lake overturning (Fichot et al., 2019). Observations of lakes worldwide have reported increased lake temperatures associated with global warming, resulting in changes to the underlying lake system (O'Reilly et al., 2015; Woolway et al., 2019). Long-term records of lake surface temperature are therefore necessary to understand the thermal mechanism underlying lake processes, including lake ice formation and decay, lake productivity, aquatic ecosystems, and other limnological processes (Chen et al., 2019; Collingsworth et al., 2017; Woolway et al., 2020).
Even though in situ records on lake surface temperature are a good source of temperature data for lake studies, their sparse distribution, especially in the north, presents a challenge, making satellite-derived data an essential resource in regional and global studies. Satellite sensors like MODIS (Moderate Resolution Imaging Spectroradiometer) and AVHRR (Advanced Very High-Resolution Radiometer) have been heavily relied upon to estimate and analyse LST in several studies (e.g. Kheyrollah Pour et al., 2014b; Wloczyk et al., 2006; Sima et al., 2013; Wan et al., 2002; Zhao et al., 2020; Reinart and Reinhold, 2008); however, their application to small and medium lakes is limited due to their relatively moderate spatial resolution (∼ 250 m–1 km). In addition, satellite-retrieved LST datasets for global studies like the Global Lake Temperature Collaboration (GLTC) have a low sampling of high-latitude lakes, restricting their use for climate studies in these northern regions. Satellites like Landsat, however, provide an opportunity for regional studies of lake processes, including the spatial extraction of LST on Arctic and Subarctic lakes. The strength of Landsat includes its high spatial resolution (30–120 m), high radiometric resolution (8–12 bit), and the presence of thermal infrared bands for the retrieval of LST. In addition, the longevity of data archives makes it one of the vastest and most extended observations of Earth's surface water from space (Pekel et al., 2016). Currently, a regional spatial lake surface temperature dataset for small- and medium-sized lakes on a large scale does not exist in the Northwest Territories (NWT) in Canada, specifically for North Slave Region (NSR) lakes. This study aims to bridge this gap by utilising Landsat's capabilities.
In this study, we generated LST data (North Slave LST) for over 535 predominantly small to medium lakes using data obtained from Landsat archives (Landsat 5 TM, Landsat 7 ETM+, and Landsat 8 OLI/TIRS). An adapted temperature retrieval algorithm (Jimenez-Munoz et al., 2009, 2014) is applied to the thermal bands of Landsat to estimate LST. The dataset produced has a spatial resolution of 30 m and varying temporal resolution due to differences in satellite overpass and cloud interference. The generated North Slave LST dataset was evaluated with in situ datasets and compared with the widely used LST satellite data (MODIS). The temporal and spatial distribution of the dataset is presented to report on data availability patterns. Additionally, the North Slave LST dataset is used to briefly highlight the spatial inter-lake and intra-lake distribution of LST on NSR lakes.
This study aims to (i) capitalise on the thermal bands of Landsat to create an up-to-date lake surface temperature dataset for the NSR to record distribution from 1984 to 2021, (ii) highlight the temporal and spatial heterogeneity of LST between and within lakes on a 30 m grid, and (iii) distribute and publish LST data for stakeholders, research communities, to enable further research, the public, and the Government of the Northwest Territories to facilitate decision-making processes.
2.1 Selected lakes in North Slave Region, NWT
The North Slave LST data are generated for 535 lakes between latitude 61 and 67∘ N and longitude −120 and −102∘ W of the Northwest Territories (NWT) located in northern Canada, covering an area of about 316 000 km2 (Fig. 1a). The region lies in the Slave Province of the Canadian Shield and is interspersed with numerous lakes (>10 000) of various sizes. The average elevation in the NSR is 301 m, with the lake elevation ranging from 138 to 624 m (Messager et al., 2016). This dataset contains LST on lakes with surface areas ranging from 0.05 to 1680 km2, mean depths ranging from 1 to 63 m, and volumes ranging from 0.24 to 27 321 km3. Appendix A contains a table listing all the study lakes and their geophysical properties. Air temperature in the NSR ranges from to +30 ∘C. Most study lakes are between 1 and 5 km2 (Fig. 1b), and the dominant mean depth range is from 5 to 10 m (Fig. 1c).
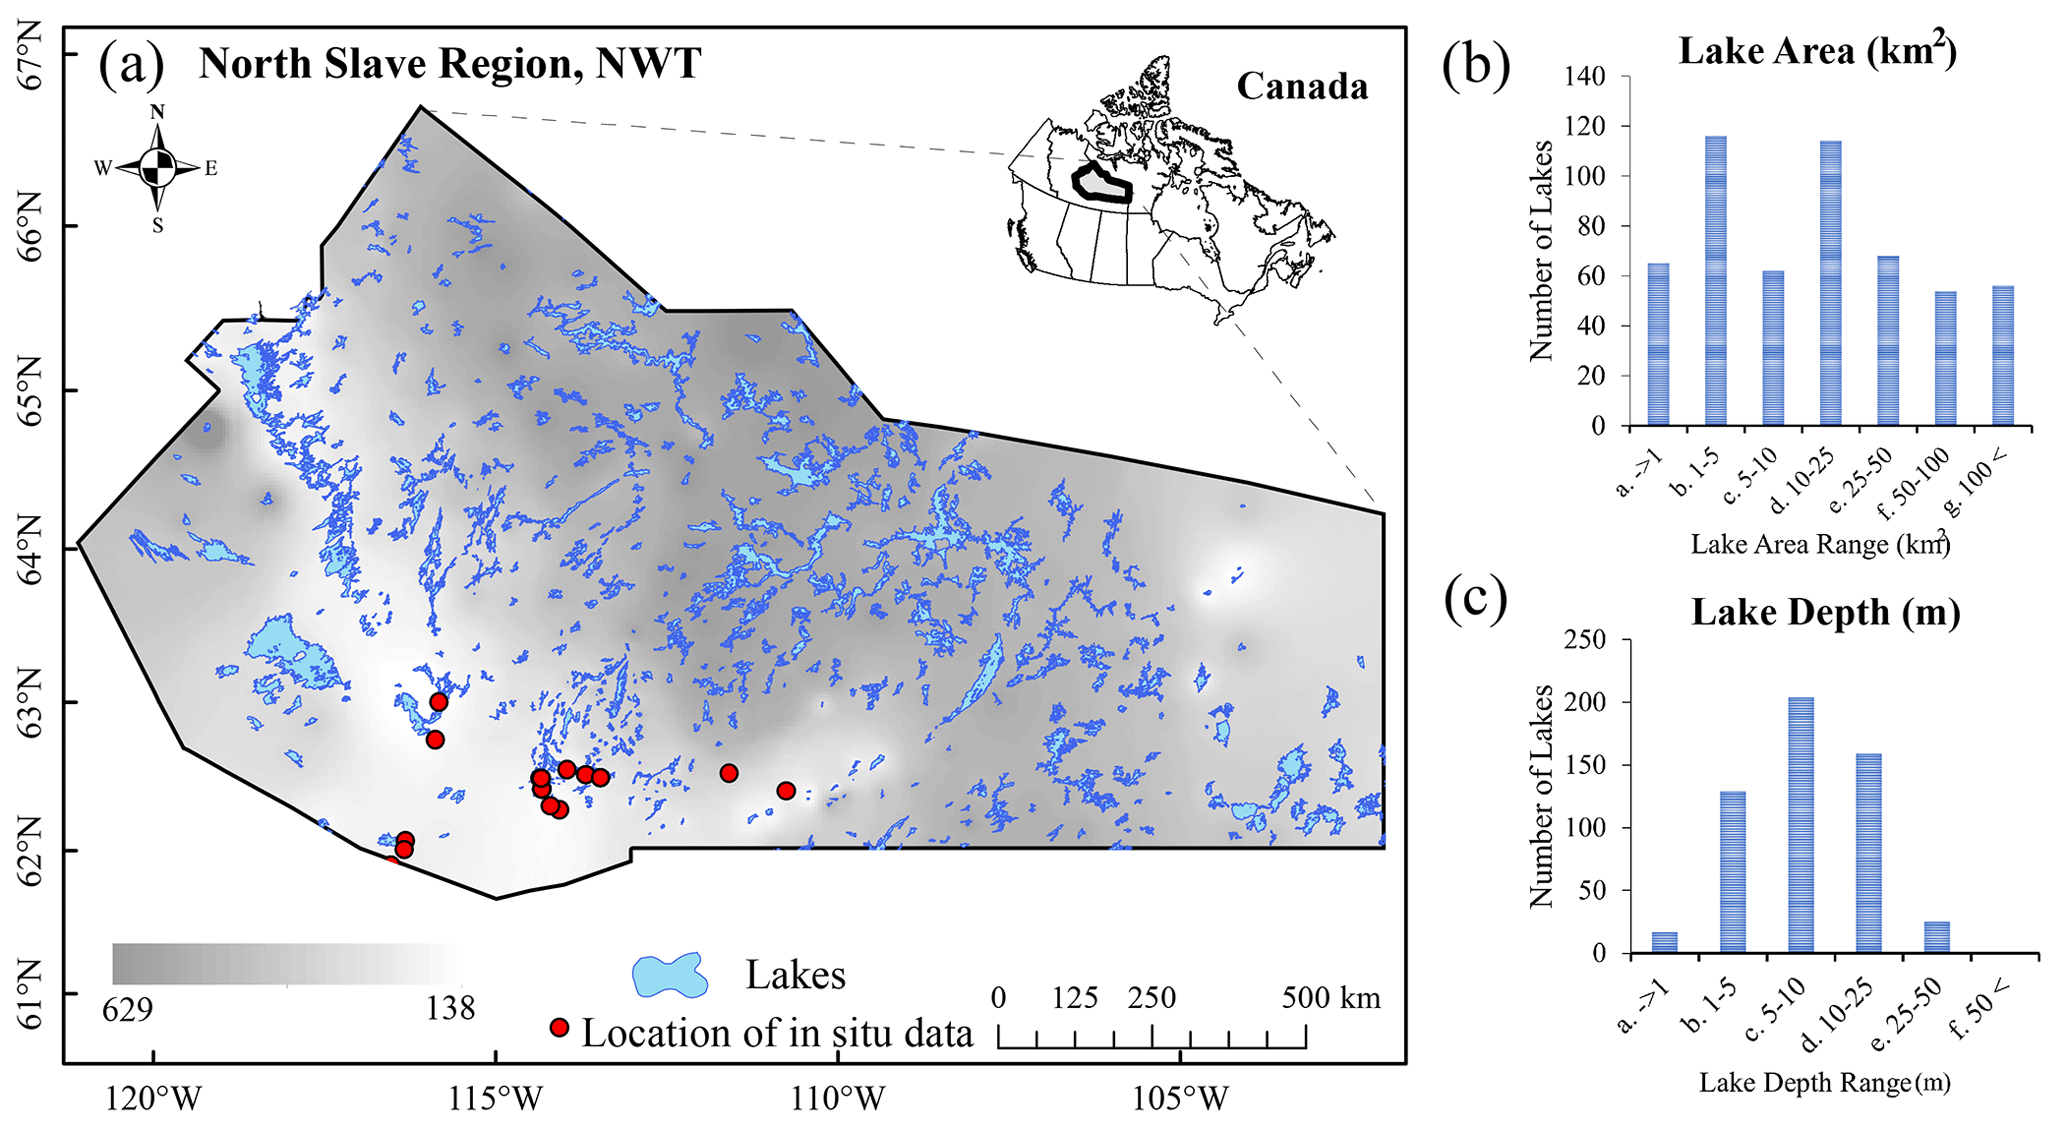
Figure 1(a) Geographic distribution of study lakes in the North Slave Region, Northwest Territories, Canada. The lake area and depth distribution are shown in panels (b) and (c), respectively.
2.2 Spatial data for LST retrieval
2.2.1 Landsat archives
Landsat archives consist of optical data from a series of Earth-observing satellite missions. For this study, Landsat tiles covering the NSR were obtained from the United States Geological Survey (USGS). Surface temperatures on lakes were estimated from the thermal infrared (TIR) bands of Landsat 5 TM (Thematic Mapper; 1984–2013), Landsat 7 ETM+ (Enhanced Thematic Mapper Plus; 1999–present), and Landsat 8 OLI/TIRS (Operational Land Imager and the Thermal Infrared Sensor; 2013–present) instruments. Landsat instruments orbit at an altitude of 705 km, are sun-synchronous, and have a 16 d repeat cycle. The thermal band (band 6) of Landsat 5 and Landsat 7 record emitted radiation between the wavelengths of 10.40 and 12.50 µm, while that of Landsat 8 (band 10) records between 10.6 and 11.19 µm. The spatial resolution of the thermal bands for Landsat 5 TM (120 m), Landsat 7 ETM+ (60 m), and Landsat 8 OLI/TIRS (100 m) are resampled with the cubic convolution method and distributed at a spatial resolution of 30 m to match optical bands (USGS, 2022). In addition, other bands, including the quality band (BQA), near-infrared band, red band, and metadata, are also used in the retrieval of LST. About 34 Landsat tile scenes cover the NSR, with each tile containing 5000 × 5000 30 m pixels and overpass times ranging from 18:00 to 20:00 UTC.
2.2.2 ERA5 reanalysis data
Total column water vapour obtained from ERA5 reanalysis data (Copernicus Climate Change Service – C3S) from 1984 to 2021 was used as input in the algorithm to correct for atmospheric effects on Landsat images. Values were derived from the hourly data, with a ∼ 30 km spatial resolution obtained from the European Centre for Medium-Range Weather Forecasts (ECMWF; Hersbach et al., 2020). ERA5 reanalysis data are a dataset generated from a combination of in situ observations and modelling to provide estimates of land, atmospheric, and ocean changes on a global scale. Average ERA5 hourly total column water vapour on single levels was used as an input in the LST retrieval algorithm.
2.2.3 Lake outline and properties data
Each lake's name, location, depth, size, elevation, and outline were retrieved from a combination of the HydroLAKES database, CanVec Series, and the Water File – Lakes and Rivers database. The HydroLAKES database is a digital map repository developed in the Global HydroLAB (http://wp.geog.mcgill.ca/hydrolab/, last access: 20 May 2022) from a collection of several databases (e.g. global and regional databases like CanVec Series and Shuttle Radar Topography Mission, SRTM, Water Body Data; Slater et al., 2006). This database provides information on world lakes and their significant properties through high-resolution maps. Over 1 427 688 individual lake vector polygons greater than 10 ha are included in the repository (Messager et al., 2016). The mode of pixel-level lake elevation data obtained from the EarthEnv-DEM90 (digital elevation model) and the USGS-provided GTOPO30 DEM was used to calculate the HydroLAKES elevation data. A geostatistical model developed from surrounding land surface topography was derived to generate average lake depths and volumes (Messager et al., 2016). As part of the Government of Canada initiative (https://open.canada.ca, last access: 28 March 2022), the CanVec Series provides a geometric description and fundamental characteristics of hydrographic phenomena in the form of geospatial vector data. The Water File – Lakes and Rivers (polygons) data (https://www12.statcan.gc.ca, last access: 30 March 2022) maps lakes and rivers under the 2006 census, as created by Statistics Canada under the Government of Canada on 29 August 2013. These data were the primary source of lake names attributed to lake outlines in our dataset.
2.2.4 Evaluation dataset
Landsat-derived LST was generated during both open-water and ice-covered seasons. Retrieved data were evaluated against in situ measurements collected over selected locations within the study area (Fig. 1). In situ measurements from Mackenzie DataStream were used for evaluating LST derived from Landsat. DataStream is an open-access freshwater data platform that provides water-monitoring data collected by governments and communities across Canada. The database for the NWT region was the product of the NWT-wide community-based water quality monitoring (CBM) programme, which is collected during open-water seasons. The CBM programme was implemented in 2012 as part of a partnership between the Department of Environment and Natural Resources (ENR), the Government of the Northwest Territories (GNWT), communities, and regional organisations in NWT to monitor water quality and changes. The surface temperatures on lakes were measured with YSI sondes and EXO2 sondes and interpreted by ENR. Collated surface temperature data used for evaluation from this source were from the years 2014 to 2019. Another primary source was lake temperature data collected by Environment and Climate Change Canada (ECCC) from 1999 to 2003. Temperature loggers were used to measure hourly temperature on lakes during open water periods; however, only temperature collected at the skin surface (depth = 0 m) was used for LST evaluation in this study.
The MODIS (MYD11_L2) surface temperature dataset from 2003 to 2021 was used to evaluate the Landsat-derived LST data generated during both open-water and ice-covered seasons. The dataset was obtained from NASA's Earth Observing System Data and Information System (EOSDIS), mounted on the Terra and Aqua satellites; MODIS records within the spectral ranges of 0.405–14.385 µm across 36 bands. The Aqua product contains nighttime and daytime LST measurements on a spatial resolution of ∼ 1 km derived from the thermal infrared bands. For this study, the daytime LST measurement covering lakes in the NSR was compared against the Landsat-derived LST.
3.1 Algorithm for lake surface temperature
The thermal bands of Landsat were used in the retrieval algorithm to generate North Slave LST (band 6 for Landsat 5TM/Landsat 7ETM+ and band 10 for Landsat OLI/TIRS). Atmospheric and emissivity correction of thermal bands were conducted to account for the effect of absorption and emission of surface radiation. A single channel (SC) method was adapted and applied in this study to retrieve LST (Jimenez-Munoz et al., 2009, 2014; Jiménez-Muñoz and Sobrino, 2003). This method is based on approximating the radiative transfer equation without the dependence on in situ radio-sounding data. Only a single band is required in the SC method, making it feasible for use on single thermal band satellites like Landsat 5 TM, which was utilised in this study. The SC method uses atmospheric water vapour (Sect. 2.2.2) as a variable in the correction for atmospheric effect.
LST retrieval using the SC method requires atmospheric water vapour, emissivity, brightness-temperature- and wavelength-emitted radiance values, and thermal constants. The LST estimation is based on the following (Jiménez-Munoz and Sobrino, 2003):
where
and
At-sensor radiance and brightness temperature are denoted by Lsensor,λ (W m−2 sr−1 µm−1) and Tsensor (K), respectively. c1 (1.19104 108 W µm4 m−2 sr−1) and c2 (14387.7 µm K) are Planck's constants. The emitted radiance wavelength (λ) is 11.457 µm in Landsat 5 TM, 11.269 µm in Landsat 7 ETM+, and 10.904 µm in Landsat 8 OLI TIRS. ψ1, ψ2 and ψ3 are atmospheric functions obtained as a function of water vapour (w) and are specific to the three individual Landsat sensors.
At-sensor spectral radiance was calculated from raw digital numbers (DNs) of thermal bands based on metadata information and constants. Equations used are specific to the type of sensor, as listed below.
At-sensor radiance values for Landsat 5 TM were derived using Eq. (4) as follows (Chander and Markham, 2003):
where 0.0551584 Wm2 sr1 µm1/DN and 1.2378 Wm2 sr1 µm1/DN are constants for Grescale and Brescale, respectively.
Landsat 7 ETM+'s at-sensor radiance values were derived using Eq. (5) as follows (Ihlen and Zanter, 2019):
where the maximum and minimum spectral radiance is represented by Lλmax and Lλmin, respectively, and the maximum and minimum quantised calibrate pixel is represented by Qcalmax and Qcalmin, respectively, as obtained from the metafile. Qcal denotes DN values of pixels in band 6.
Landsat 8 OLI TIRS's at-sensor radiance values were derived using Eq. (6) as follows (U.S. Geological Survey, 2016):
where the DN values of pixels in band 10 are denoted by Qcal. ML=0.000342 and AL=0.1 are fixed rescaling factors in the metadata provided by the USGS.
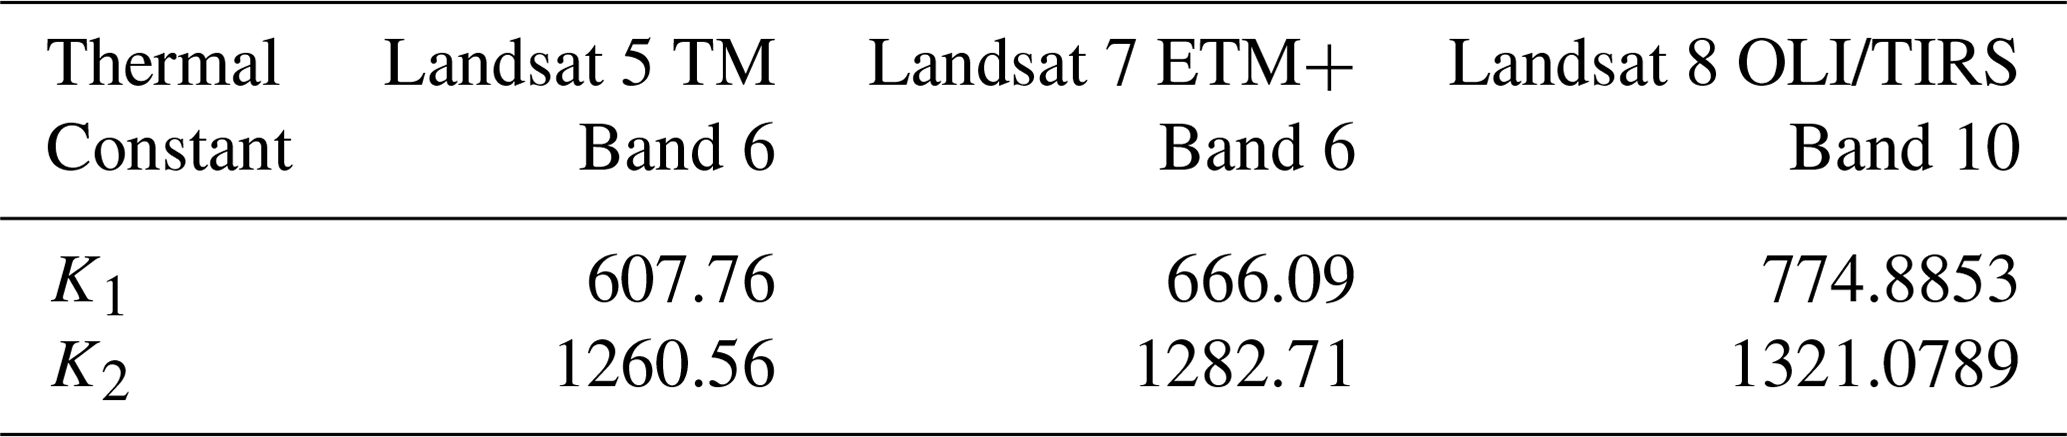
Brightness temperature Tsensor is estimated using calculated at-sensor radiance values and thermal constants derived from the metadata based on Eq. (7) below:
where thermal constants K1 (W m−2 sr−1 µm−1) and K2 (K) vary based on the type of Landsat sensor (Table 1).
Table 1Thermal constants applied to Landsat thermal bands for brightness temperature estimation.
The atmospheric functions (AFs) used for atmospheric correction were based on coefficients acquired using Global Atmospheric Profiles derived from Reanalysis Information (GAPRI) and Thermodynamic Initial Guess Retrieval (TIGR) databases (Jimenez-Munoz et al., 2009, 2014).
Atmospheric function equations ψ1, ψ2 and ψ3, particularised for Landsat 8 OLI/TIRS, are as follows:
Landsat 7 ETM+'s AFs are as follows:
Landsat 5 TM's AFs are as follows:
The normalised difference vegetation index (NDVI; Eq. 11) values calculated were used to assign lake surface emissivity. Near-infrared (NIR) and red bands of Landsat were used to calculate NDVI values (Eq. 11).
The lake surface was assigned an emissivity of 0.985 if the NDVI values were lower than 0.05; otherwise, a value of 0.97 was assigned (Prats et al., 2018).
3.2 Retrieval of lake surface temperature
3.2.1 LST retrieval
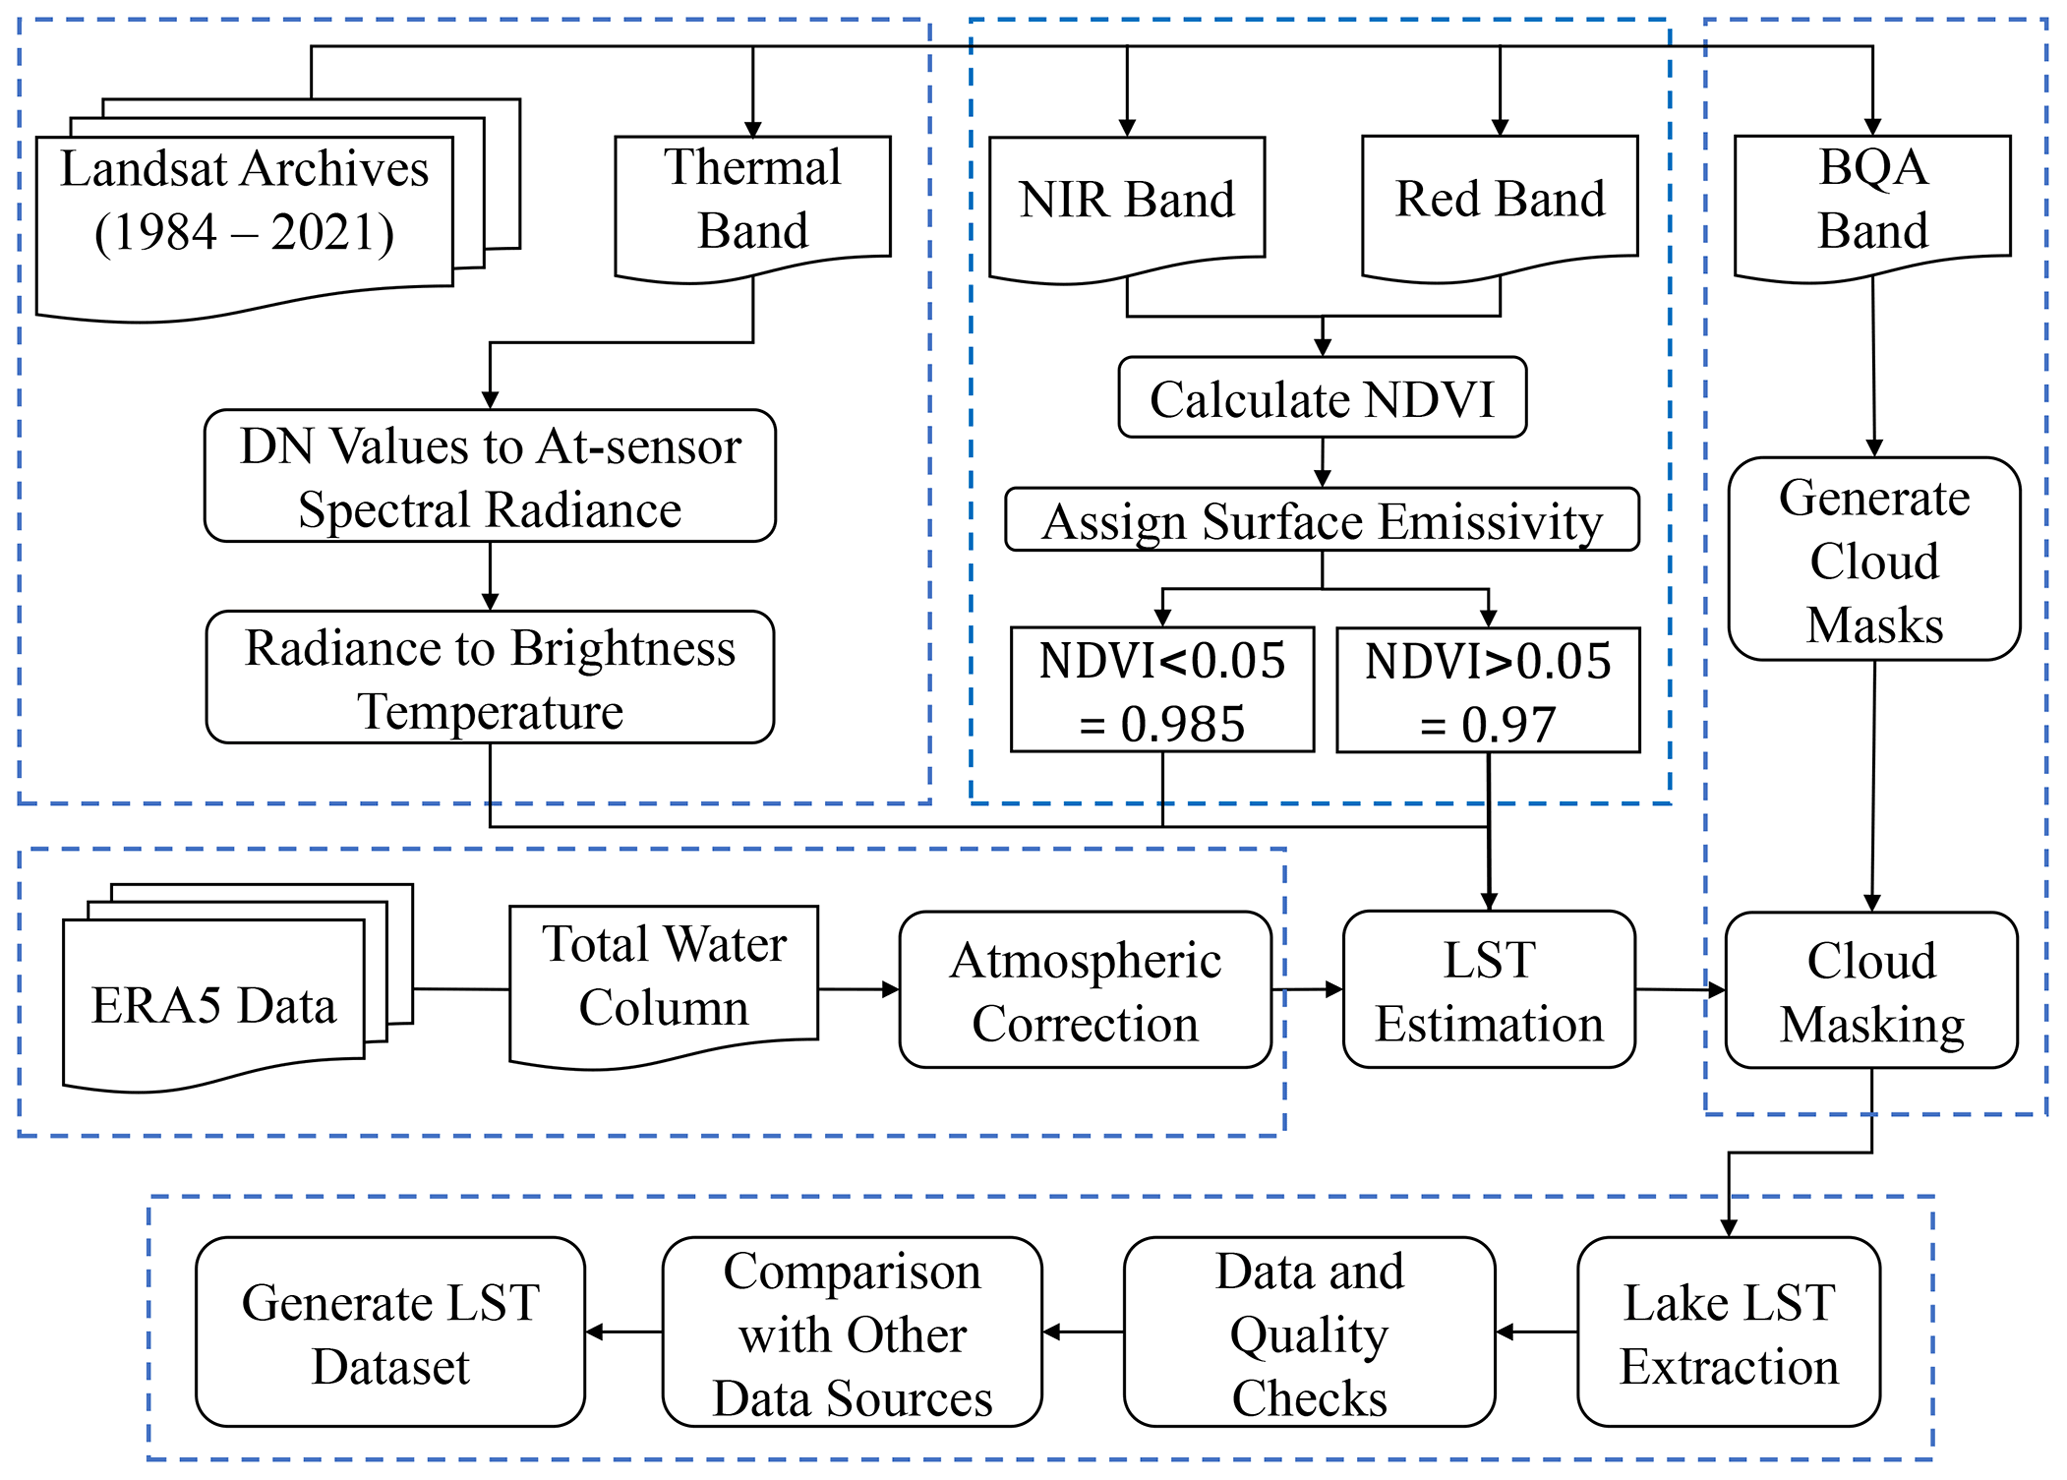
LST retrieval algorithms were applied to the thermal bands in conjunction with other processed output (bands and metadata) from Landsat data to generate the North Slave LST dataset. A quality assurance (QA) band, outlining the surface, atmosphere, and sensor conditions included in the Landsat data, was used to mask clouds and other obstructions. The QA band assesses cloud influence at different confidence levels (high, with 67 %–100 %, medium, with 34 %–66 %, and low, with 0 %–33 %), making it possible for cloud removal. This study categorised high and medium confidence values as cloud pixels, while low confidence values were considered to be cloud-free. LST retrieval algorithms and equations (Eqs. 1–11) were applied to the thermal bands of all tiles from 1984 to 2021. Cloud masks were generated and applied to retrieved LST to eliminate cloud-distorted pixels. LST pixels were extracted using the vector files of lake outlines from the HydroLAKES dataset. A 100 m negative buffer was applied to remove the effect of lake pixel mixing with land surface pixels. Possible erroneous pixels were flagged using z scores which calculate how far a value is from the mean. This was used to access spatial differences and outliers in pixels. Pixels of lakes with z-score values above 3.5 and below −3.5 were flagged. In addition, LST output with equal pixels across the entire lake or group of pixels having the same value to four decimal places were flagged. Further visual quality checks and analysis were applied to flagged LST to clean the generated data and remove the erroneous cloud cover that the masks could not capture. The overall framework for the retrieval and generation of the LST dataset for selected lakes in the NSR is highlighted in Fig. 2.
3.2.2 Data quality assessment information
It is essential to highlight the limitations of data estimates from satellite-based records (Merchant et al., 2017). This provides an awareness of the degree to which a sensor is stable, in addition to the observations obtained from them. Additionally, these reports are necessary to inform the confidence of the data extracted and the structures of their errors through time and space. One significant distortion of the Landsat archives is the failure of the scan line corrector (SLC) of Landsat 7 ETM+ on 31 May 2003. As a result, the measurement from scans could not be corrected, causing all images sensed after that date to lose about 22 % of the data extracted. This limitation, named Landsat 7 ETM+ SLC-off issue, is more prominent at the edges of images than in the centre. Nevertheless, Landsat 7 ETM+ data were still used in the study because the radiometric and geometric corrections are unaffected by this scan line issue.
3.2.3 Evaluation methods
Indicators used to evaluate the performance of North Slave LST against in situ and MODIS LST were the root mean squared deviation (RMSD), mean bias deviation (MBD), and R squared (R2). The MBD assesses systematic differences and evaluates the underprediction and overprediction between two datasets (Eq. 12). A MBD value of 0 indicates an utterly random error.
where Oi and Pi are the observed and generated values, respectively, while N is the number of points used for evaluation. The index values ranged between 0 and 1, indicating the worst and best possible performance.
The root mean squared deviation (RMSD) measures the total difference between the two datasets without distinguishing between the over- or underprediction of models and/or algorithms (Eq. 13). No deviation in the values results in a RMSD value of 0.
4.1 Quality of North Slave LST
The primary sources of limitation for the North Slave LST data include (i) potential mixed pixels that might not be captured by the algorithm, (ii) the presence of “no data” pixels on lakes, and (iii) inconsistency in the temporal resolution of dataset per lake. The lake boundaries' extraction of LST was based on outlines from external boundary files (Sect. 2.2.4). As such, errors that may exist, including overestimating lake area and the inability to accurately demarcate lake islands, would affect the LST values retrieved. A 100 m inward buffer was applied to address this; however, valuable lake shore LST information is lost, especially in small lakes. The number of pixels and the percentage of the lake it represents is reported in Appendix A. Depending on the lake shape, area, and existence of islands, the pixels represented 16.7 % to 97.34 % of the lake area. The spatial variation in LST is reduced for lakes with a smaller number of pixels.
In addition to the overall representativeness of pixels on lakes, LST pixels retrieved for a given day may vary due to cloud cover and the Landsat 7 ETM+ SLC-off issue (Sect. 3.2.2), resulting in missing LST pixels for a given lake. The dataset represents these missing LST pixels with no data pixels (which do not contain LST values). Figure 3 highlights the fraction of LST pixels to no data pixels distributed over years and months. The percentage of no data pixels ranged from 30.6 % (1996) to 45.4 % (1993) across the years, with relatively lower no data pixels percentages recorded from 2014 to 2021 (less than 37.2 %; Fig. 3a). Generally, earlier years recorded higher no data pixels percentages compared to later years. For example, the monthly distribution (Fig. 3b) showed the least percentage of no data pixels for February (26.8 %) and the highest for October (51.2 %).
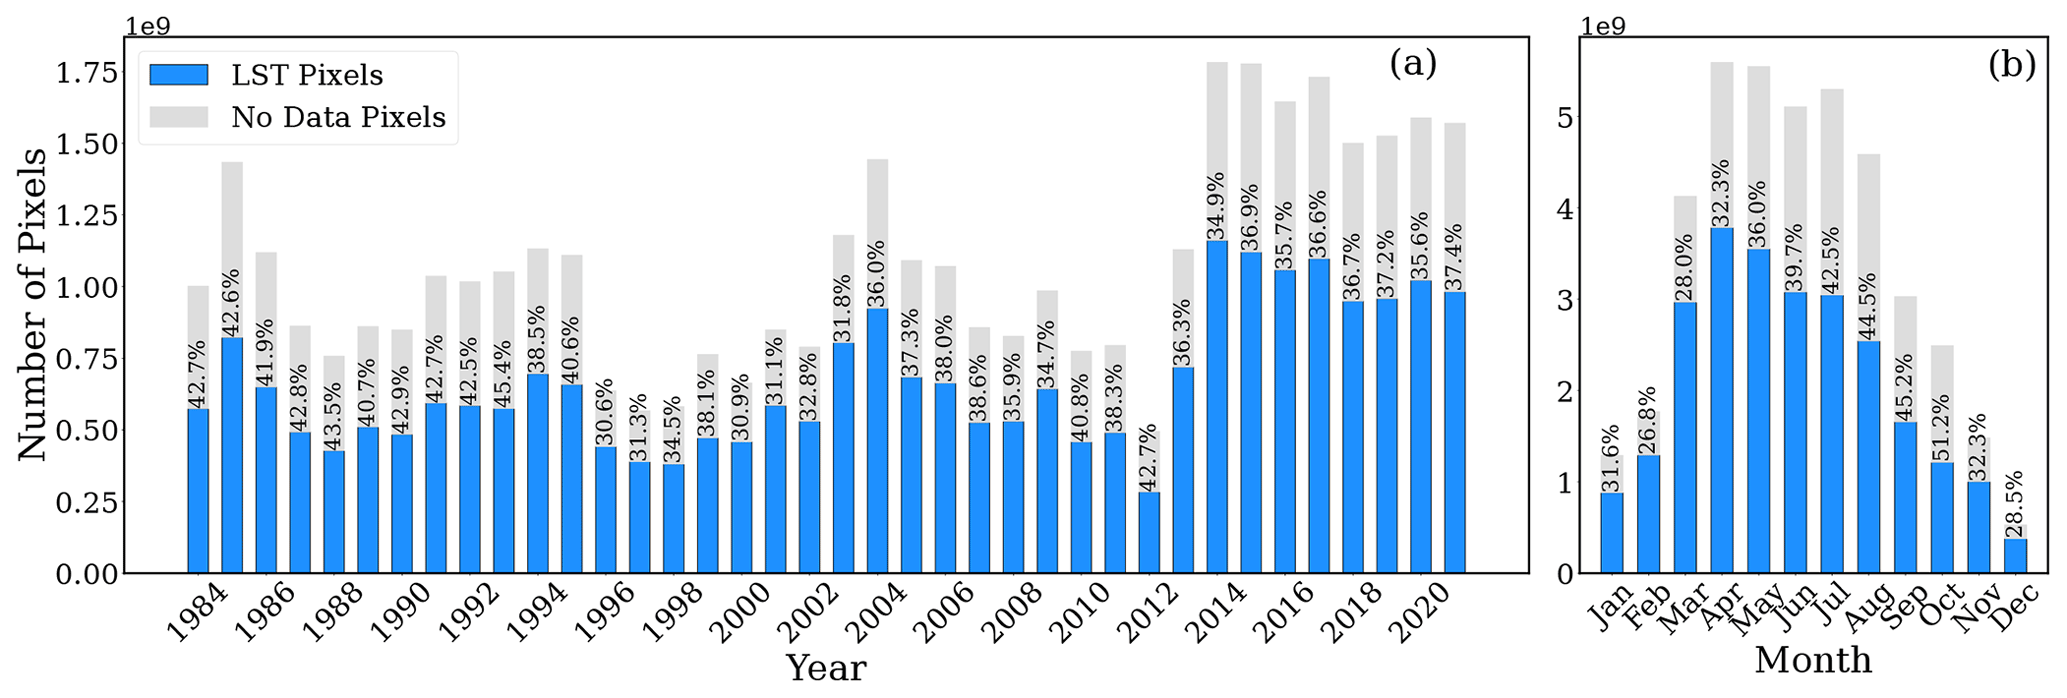
Figure 3(a) Yearly and (b) monthly distribution of LST pixels vs. no data pixels, highlighting the percentage of no data pixels for a given period.
Due to the presence of no data pixels, it is necessary to inform the reader on the percentage coverage of LST pixels. LST pixel coverage for each image is calculated as the LST pixels retrieved divided by the total number of pixels for a given lake multiplied by 100 %. The LST pixel coverage is reported for each lake on a given day as part of the naming and metadata of our dataset. Figure 4 shows the yearly distribution of LST pixel coverage for the entire dataset. Lakes with less than 10 % of LST pixels on a given day were eliminated from the dataset. The percentage of lakes with LST pixel coverage greater than 90 % was 47.2 % (Fig. 4a). A greater percentage of lakes (77.4 %) in the dataset had more than 50 % LST pixel coverage. The percentage of lakes with LST pixel coverage greater than 90 % is plotted in Fig. 4b on an annual scale. Results show a general reduction in percentage with time, where earlier years had higher percentages of LST pixel coverage (>90 %) than recent years. This downward trend can be attributed to the Landsat 7 ETM+ SLC-off issue, which increases the presence of no data pixels.
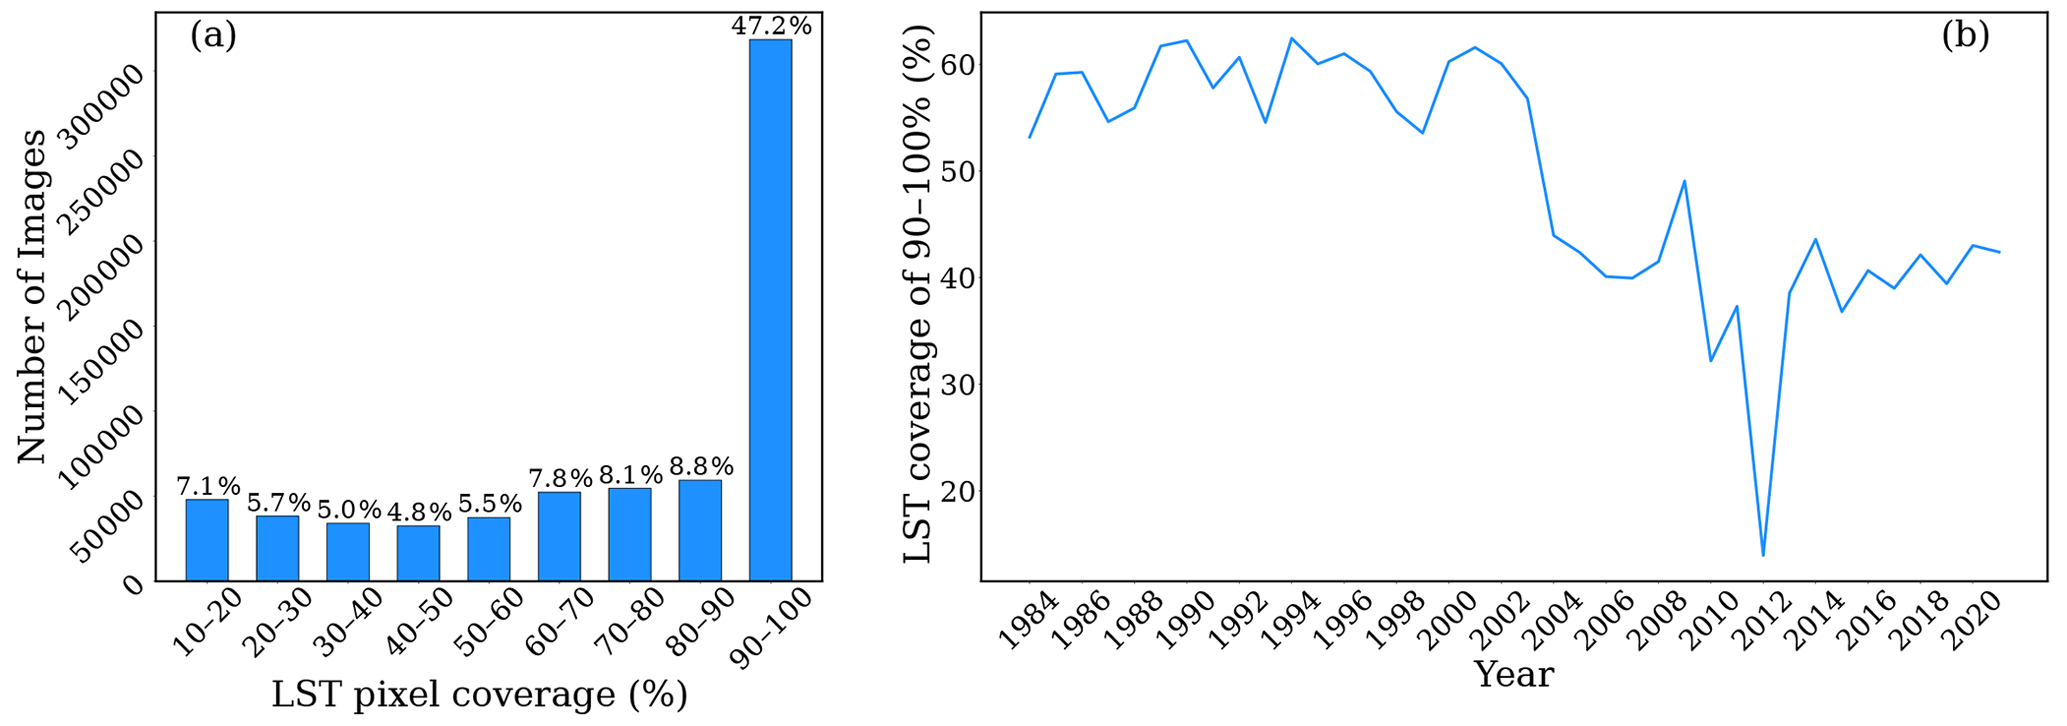
Figure 4(a) Distribution of LST pixel coverage (%) and (b) yearly percentage of the dataset, with LST coverage ranging from 90 %–100 %.
Even though the typical overpass for Landsat is 16 d, the temporal resolution of the North Slave LST dataset varied due to the overlap of satellite sensors for specific years and the inability to retrieve LST due to the cloud cover. The distribution and frequency of the data were based on the operational times of the three Landsat satellites used in this study. Most of the dataset was derived from Landsat 5 (43 %). Landsat 7 and Landsat 8 contributed 34 % and 22 % of the dataset, respectively. LST images from 1999 were derived from two sets of Landsat data (Landsat 5 and Landsat 7 from 1999 to 2011; Landsat 7 and Landsat 8 from 2013 to 2021). Years with overlapping sensors may have shorter temporal resolution than years with only one sensor retrieval. As a result, there is an inconsistency with the temporal resolution of the LST product.
4.2 North Slave LST evaluation
4.2.1 Evaluation of North Slave LST data
The accuracy of generated North Slave LST was examined by evaluating the Landsat-derived LST to corresponding in situ data (Fig. 5). Dates from measured in situ surface water temperature data (DataStream and ECCC) and derived North Slave LST data were matched. In addition, the widely used daily MODIS LST was compared with the generated dataset. Ground-based observations were compared against equivalent pixels within which measurements were taken, and the North Slave LST data were plotted against corresponding in situ surface temperature measurements (Fig. 5). A good correlation was observed between North Slave LST data and in situ surface water temperature, with an R2 value of 0.89 for the regression line. The North Slave LST was slightly higher than in situ records, with a MBD of 0.12 ∘C and RMSD of 1.71 ∘C.
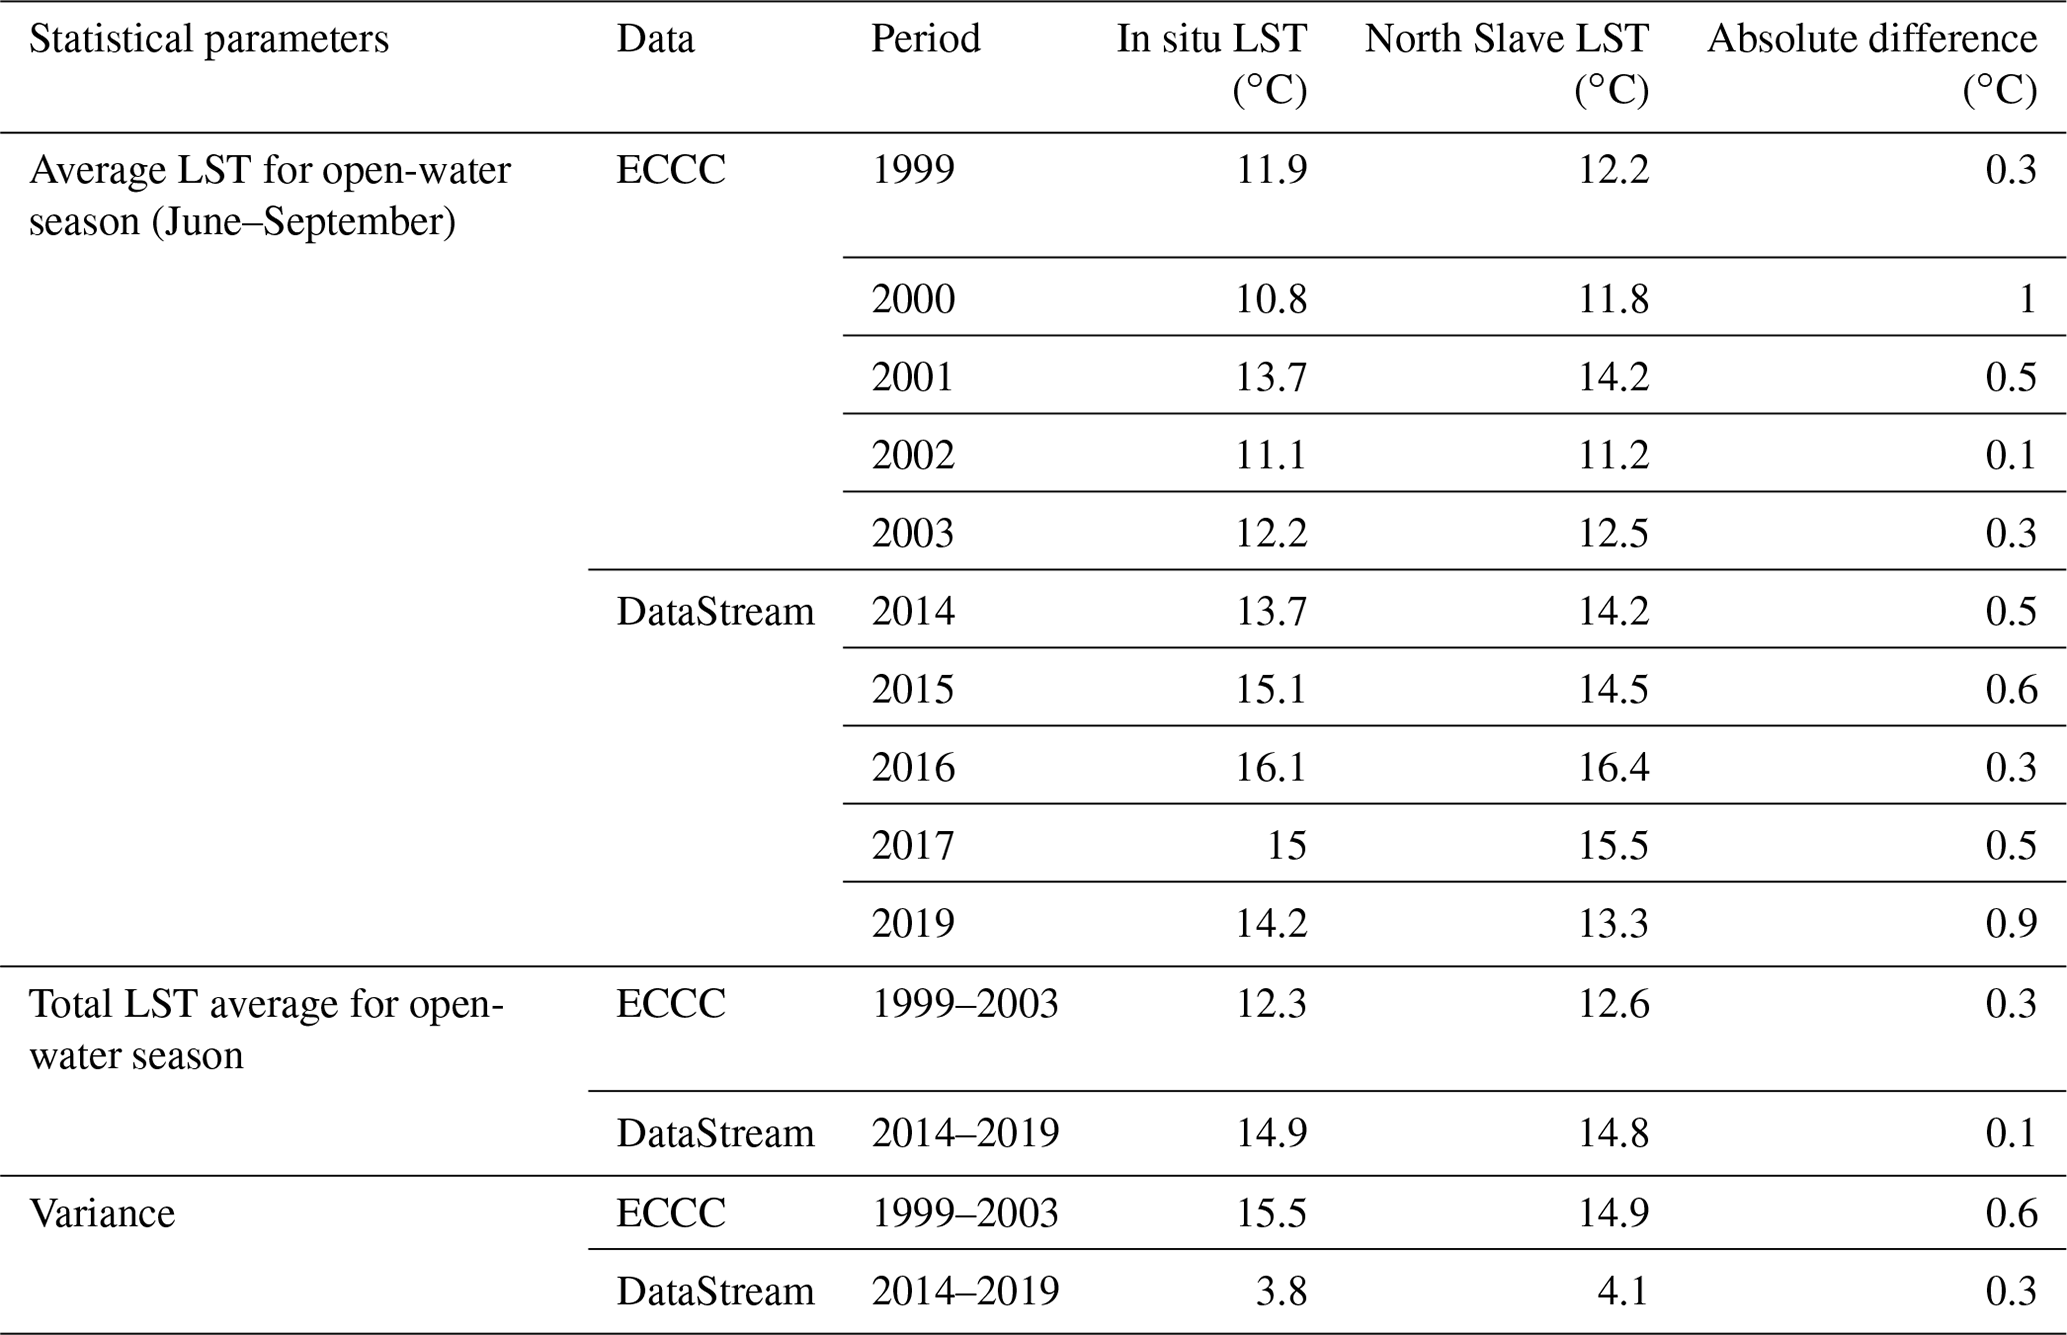
Statistical parameters, including average yearly LST for the open-water season, total average LST, and variance, were calculated for available ECCC and DataStream in situ data and compared against North Slave LST, which is highlighted in Table 2. Absolute differences calculated for the parameters ranged from 0.1 to 1 ∘C. The highest absolute difference for the average LST of open water between the two datasets was 1 ∘C calculated for the year 2000 of the ECCC data. The variance was 0.6 and 0.3 ∘C for the ECCC and DataStream data, respectively. Differences between the total LST average were the lowest, with 0.3 ∘C from 1999 to 2003 and 0.1 ∘C from 2014 to 2019.

Figure 5Comparison of North Slave LST with DataStream and ECCC in situ measurements of water surface temperature during open-water seasons.
Table 2Comparison of yearly average LST, average LST, and variance between North Slave LST and in situ LST.
Deviations between North Slave LST and measured surface water temperature could be due to differences between image acquisition times and the time of in situ measurements. The Landsat capture times of the NSR were between 18:00 and 20:00 UTC, corresponding to 12:00 and 14:00 LT (local time). However, the time of in situ observations was variable and did not necessarily correspond to the time of satellite image acquisition. Further variations in North Slave LST can also be attributed to the differences in sample collection and spatial resolution. North Slave LST is essentially the mean of ∼ 60–120 m2 area instead of a single in situ location. Possible errors reported by other studies for the differences in measured and Landsat values include georeferencing and radiometric and memory effects (Chander and Markham, 2003; Markham et al., 2014; Sentlinger et al., 2008; USGS, 2022; Young et al., 2017).
4.2.2 Yearly and monthly comparison of North Slave LST to MODIS LST
MODIS LST was first compared against available water surface temperature measurements from DataStream (Fig. 6a) and North Slave LST for days when records were available for all three data sources. The aim was to compare the deviation of North Slave LST and water surface temperature to that of MODIS LST and water surface temperature. A relatively low coefficient of determination was observed for MODIS LST (R2=0.5) compared to the North Slave LST (R2=0.94) when evaluated against measured water surface temperature. RMSD values were also higher for MODIS LST (4.63 ∘C) than North Slave LST (1.55 ∘C), with a MBD of 2.35 and −0.12 ∘C for MODIS LST and North Slave LST, respectively.
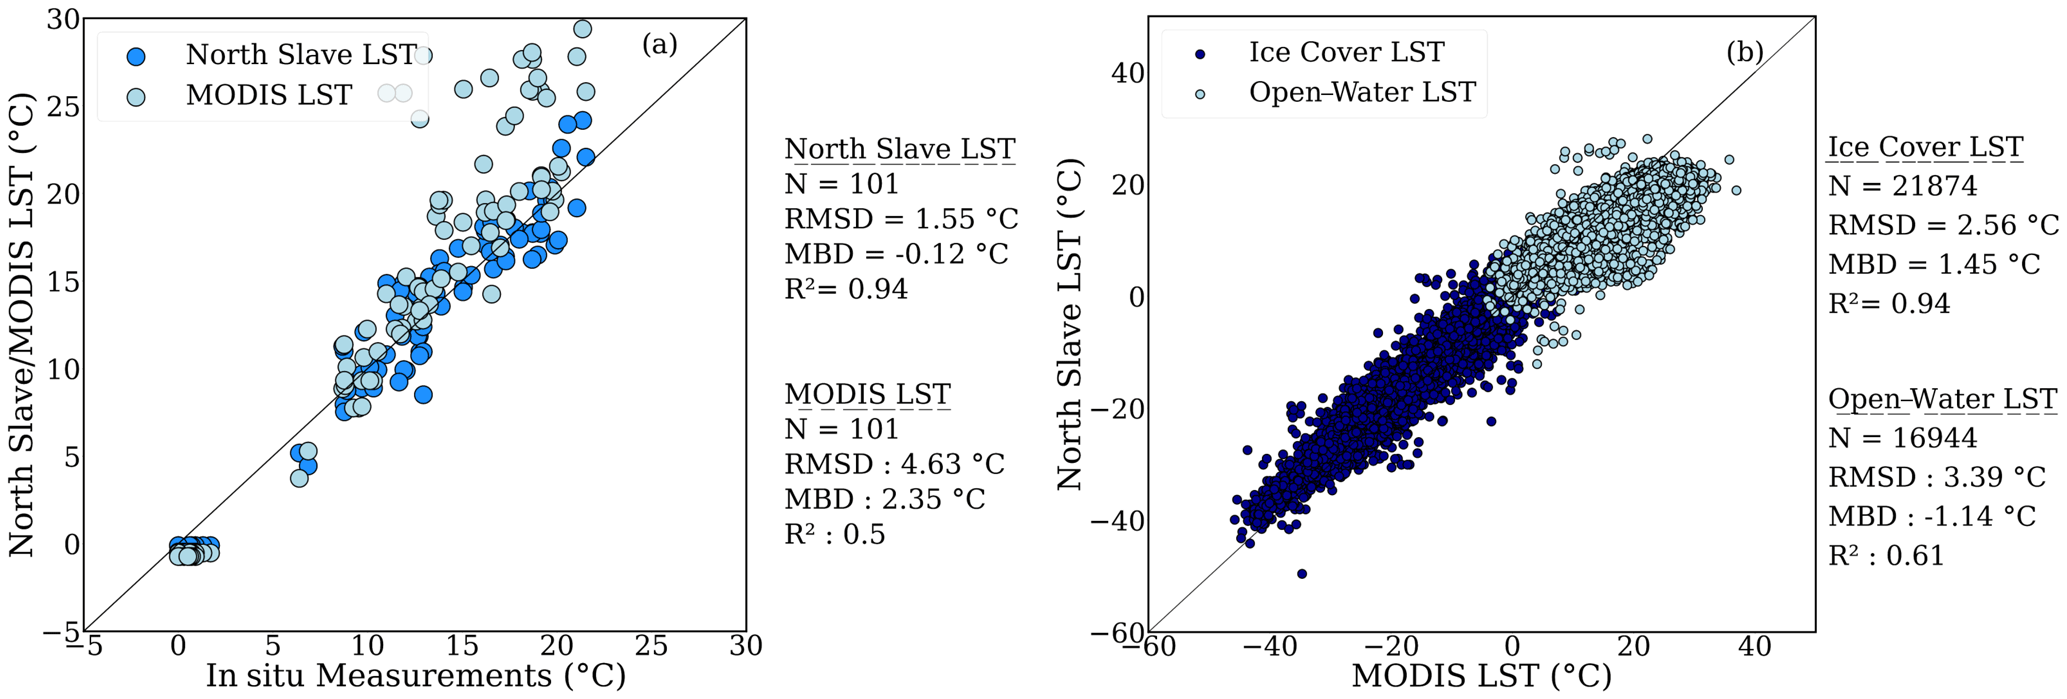
Figure 6Comparison of North Slave LST and MODIS LST to (a) DataStream and ECCC in situ water surface temperature measurements during open-water seasons (b) MODIS LST during open-water and ice-covered seasons.
North Slave LST was further compared against MODIS LST from 2003 to 2021 (ice-covered and open-water areas separately) for larger study lakes (30 km2) to avoid pixel mixing with land (Fig. 6b). Results showed a RMSD of 2.56 ∘C and MBD of 1.45 ∘C for ice-covered LST, suggesting an overestimation of North Slave LST during this period. On the other hand, an underestimation against MODIS LST was observed (MBD = −1.14 ∘C) for open-water LST with a relatively higher RMSD of 3.39 ∘C. This underestimation was expected as MODIS LST overestimates when compared against in situ data (Fig. 6a). Even though a prior comparison of MODIS LST to surface water temperature demonstrated a lower coefficient of determination, North Slave LST was still further compared against MODIS LST in this study. However, the decision to use MODIS for comparative analysis was due to the unavailability of continuous historical measurements of lake surface temperature. Additionally, MODIS LST provided an added outlook on the capability of North Slave LST to highlight historical trends despite the low temporal resolution by demonstrating a good correlation between the LST values (R=0.93).
Figure 7a and b demonstrate the yearly and monthly RMSD values derived from the comparison between North Slave LST and MODIS LST. Yearly RMSD shows a generally decreasing RMSD from earlier to later years, which may be attributed to Landsat's sensor change in recent years. LST values derived from 2013 onwards were extracted from Landsat 8 OLI/TIRS, which is known to have improved signal-to-noise ratio and calibration, higher 12 bit radiometric resolution, and narrower spectral bands compared to previous sensors (Irons et al., 2012; Roy et al., 2014). Most importantly, Landsat 8 OLI/TIRS has a radiometric uncertainty of 3 %, compared to Landsat 7 ETM+ (5 %), and a reduced band saturation (Markham et al., 2014). Monthly RMSD comparing MODIS LST to North Slave LST showed that RMSDs were lowest in spring and highest in winter. LST in spring months (March–May) had the least deviation (RMSD = 1.9–2.9 ∘C) when compared against MODIS data.
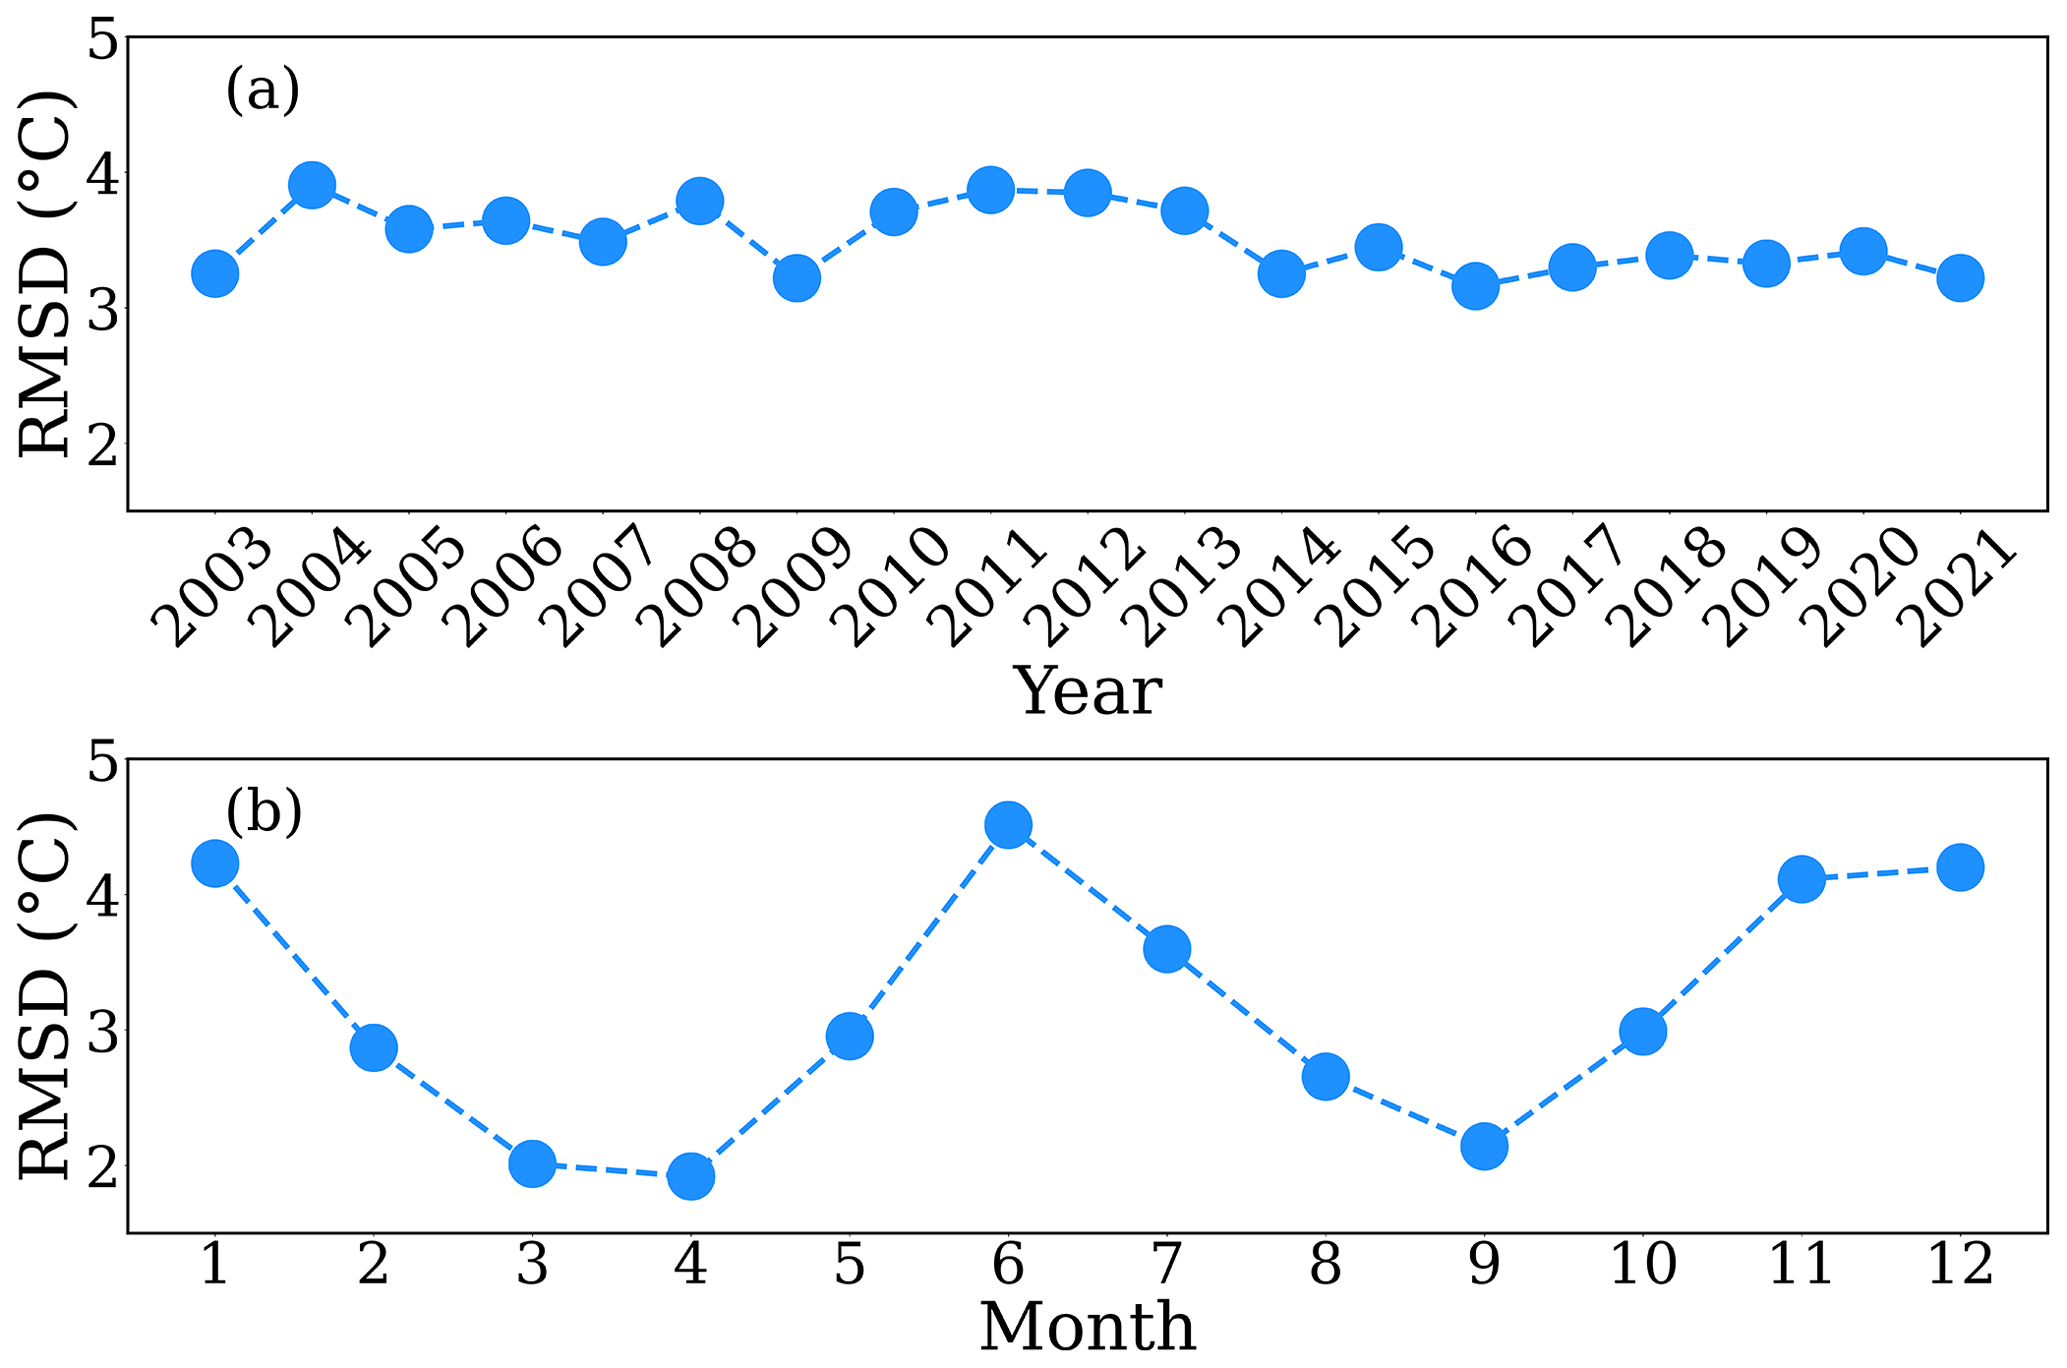
Figure 7Yearly and monthly RMSD values from evaluating North Slave LST with MODIS LST from 2003 to 2021.
4.3 North Slave LST dataset distribution
4.3.1 Temporal distribution of North Slave LST dataset
LST was derived from the thermal radiation of the lakes' uppermost layer; hence; the skin temperature is given. A total of 673 223 gridded data files and 536 tabular data were included in the generated North Slave LST dataset (https://doi.org/10.5683/SP3/J4GMC2) for the 535 lakes studied across the NSR (Attiah et al., 2022). The yearly and monthly distribution of the dataset within and between lakes varied temporally and is highlighted in Fig. 8. Overall, the yearly distribution of the North Slave LST dataset was greater in recent years, with the period between 2014 and 2021 having the majority of the data and yearly percentages ranging from 4.15 % to 5 % of the total dataset. The larger number of data files in recent years was due to LST retrieval from a combination of Landsat 7 and Landsat 8 compared to the single-sensor retrieval (Landsat 5) for earlier years. As a result, the highest yearly percentage of the North Slave LST dataset was for 2014 (5 %), and the lowest yearly percentage was for 1988 (1.2 %). Unavailable data for the various years were predominantly due to insufficient usable Landsat data for winter months.

Figure 8Yearly and monthly distribution of the North Slave LST dataset from 1984 to 2021. Percentages (%) represent the total percentage of the entire data for each month or year.
The monthly distribution of the North Slave LST dataset showed the month of May with the highest percentage (13.9 %) and December (1.3 %) with the lowest. Generally, colder months (October–April) had fewer data (42.7 %) compared to relatively warmer months (May–September; 57.3 %). Data are unevenly distributed across months and years due to differences in overpass times and influences like cloud cover and other atmospheric impacts on data retrieval.
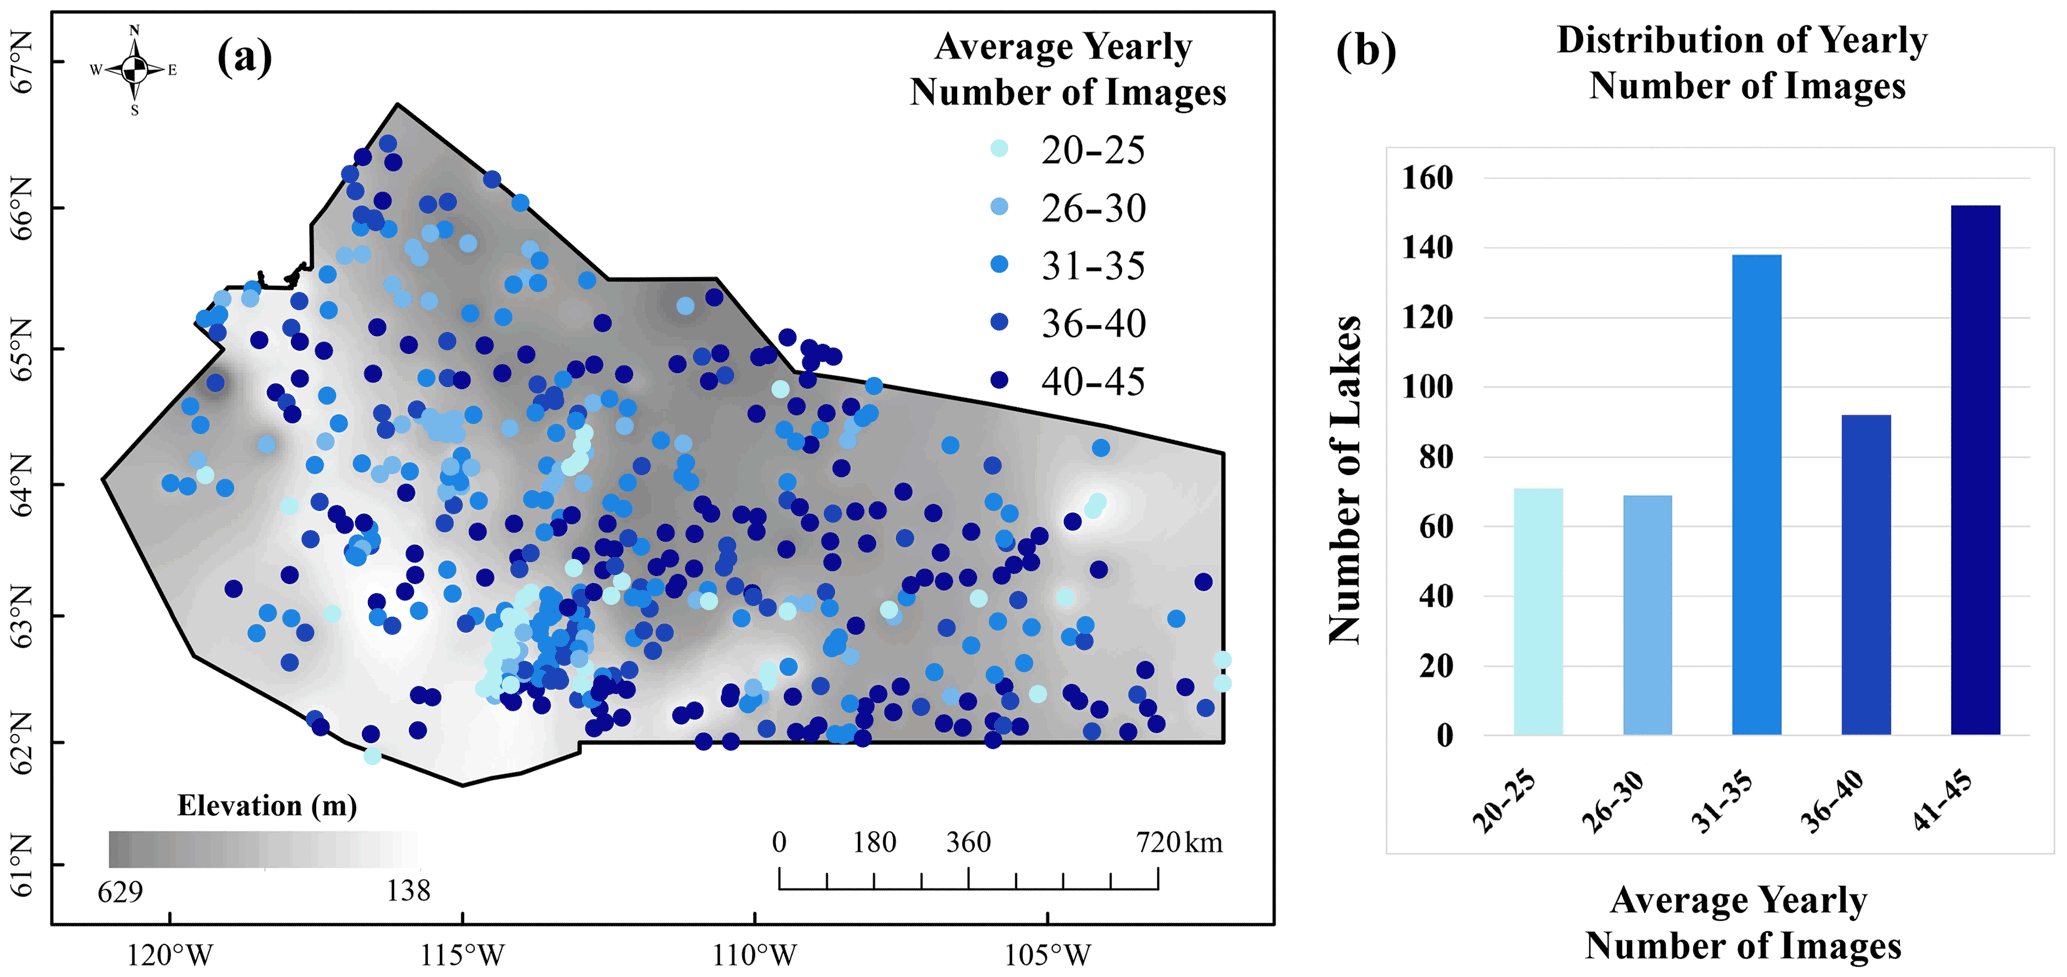
4.3.2 Spatial dataset distribution of LST dataset between lakes
While study lakes are widely distributed across the NSR, a large number (144 out of 535) were within 150 km distance of Yellowknife. The average yearly number of images for each lake in the study region is demonstrated in Fig. 9. The average yearly minimum number of images was 20, reaching a maximum of 45. Lakes with a relatively smaller number of images were mainly distributed around Yellowknife. Smaller-sized lakes generally had fewer images than relatively larger ones, and this can be primarily attributed to clouds covering the entirety of small lakes. Most lakes (152 out of 535) had between 40 and 45 images, and 71 % of the total lakes in the dataset had more than 30 images per year. Lakes with fewer pixels are more likely to be entirely cloud covered and lose relatively more surface area due to the lake buffer.
4.4 North Slave LST dataset
4.4.1 NetCDF spatial coverage of LST
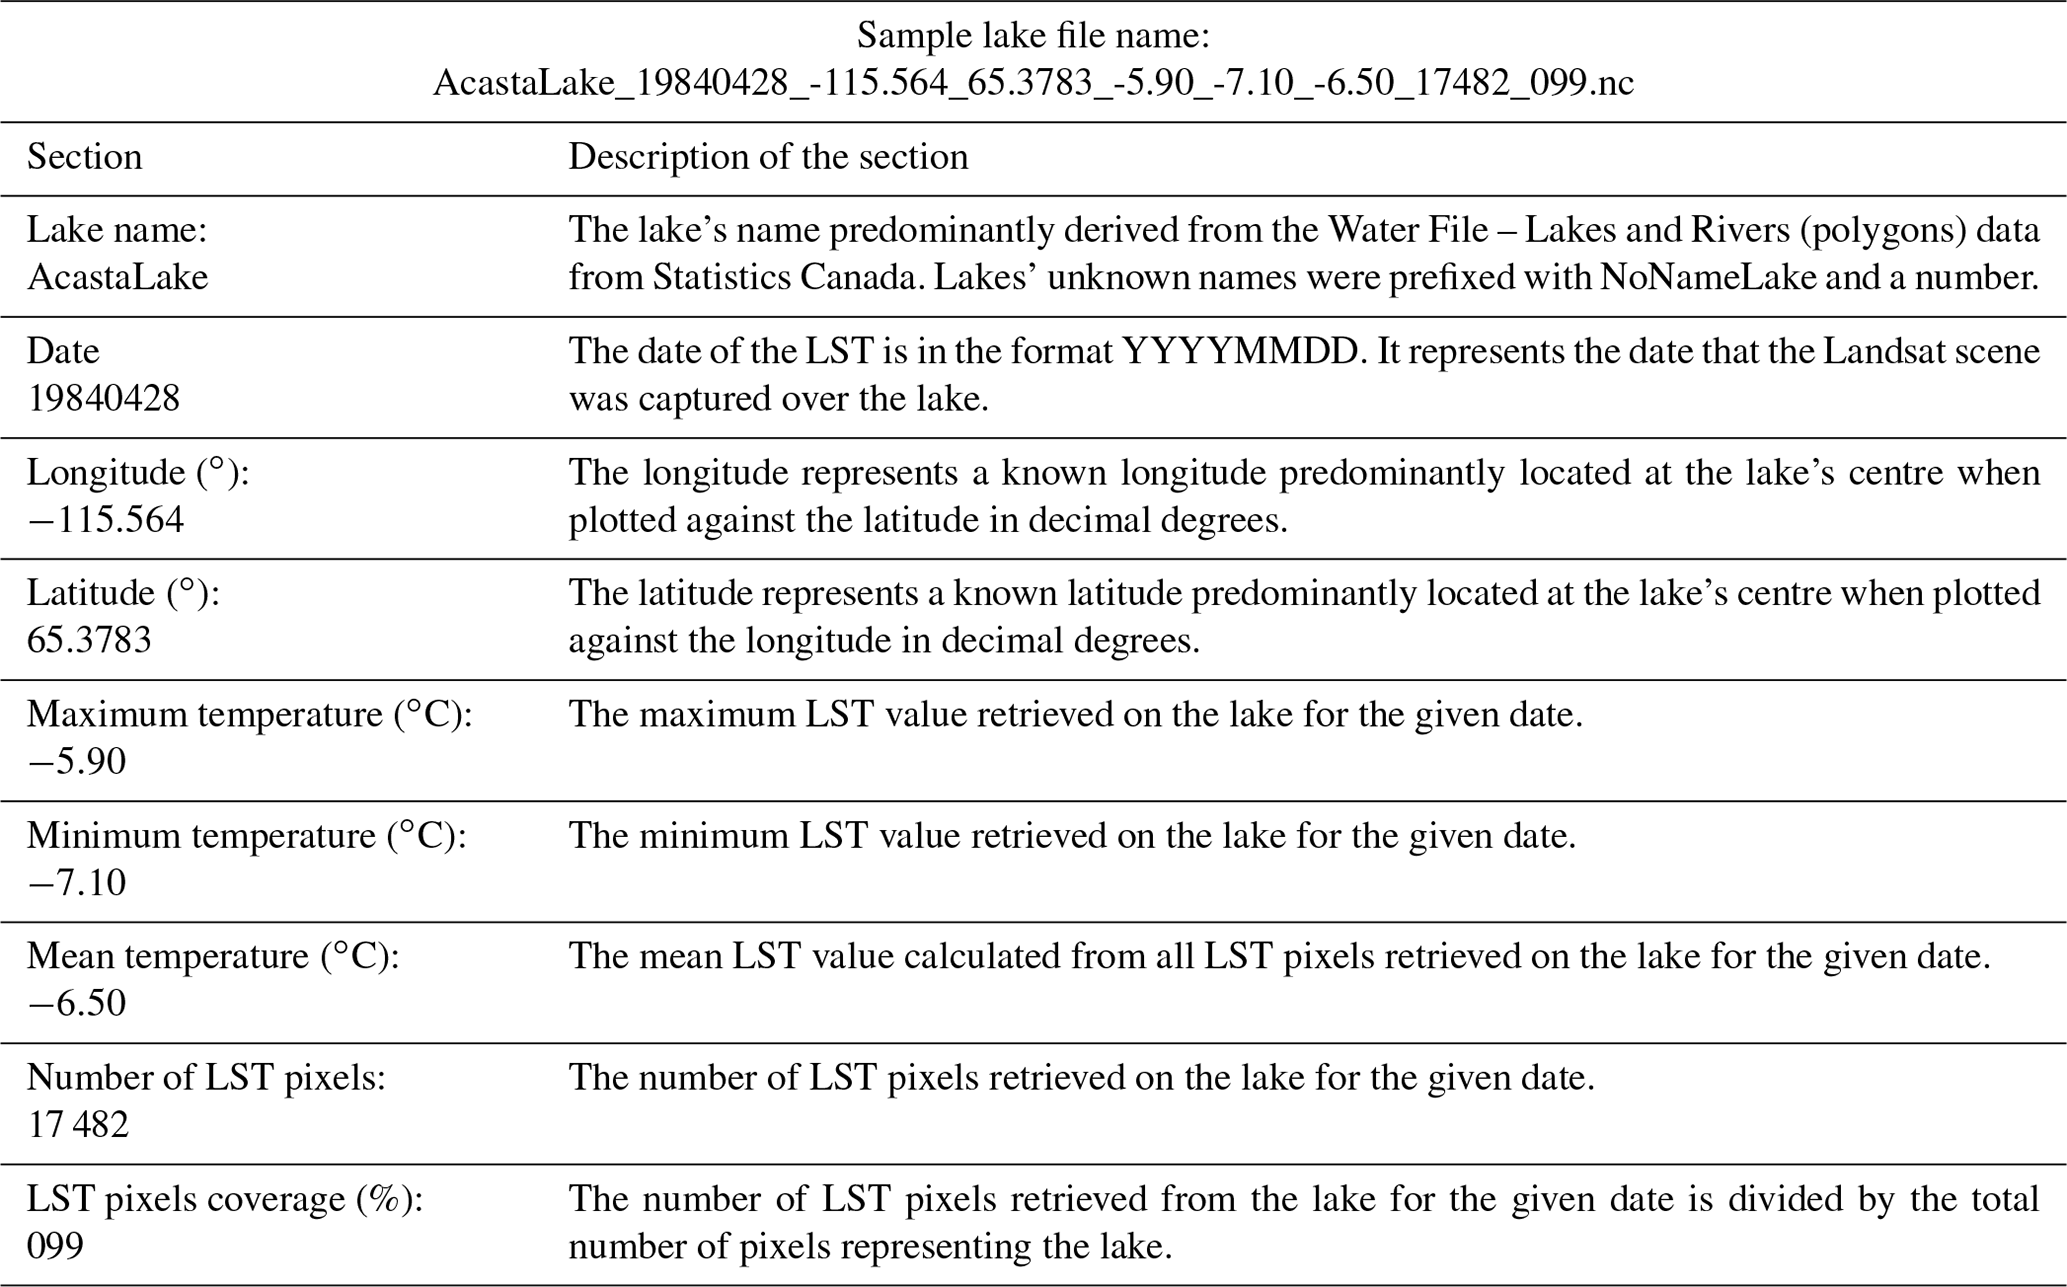
The North Slave LST dataset includes LST for 500 lakes with known names and 35 without names. NetCDF (Network Common Data Form) and tabular data are the data types in this dataset. NetCDF is a file format for storing multidimensional data and, hence, capturing the spatial coverage and dimension of LST for study lakes in this dataset. To facilitate easy data queries, each NetCDF filename includes the name of the lake, date, longitude, latitude, minimum LST, maximum LST, mean LST, number of pixels, and the percentage area of the LST pixels coverage of the lake for a given day. The naming convention for lakes and their explanation is summarised in Table 3. The dataset was grouped based on the first alphabet of the lake name, then the name of the lake, and finally into yearly sub-groups.
The NetCDF files in our dataset have a two-dimensional variable, lst, which shows the spatial distribution of lake surface temperature. In addition, the one-dimensional x and y axes show the lake's extent and the number of pixels. The spatial reference for the data is the World Geodetic System 1984, EPSG:4326, with a 30 m resolution.
Table 3Sections of North Slave LST dataset's NetCDF filename and description.
4.4.2 Tabular data of LST
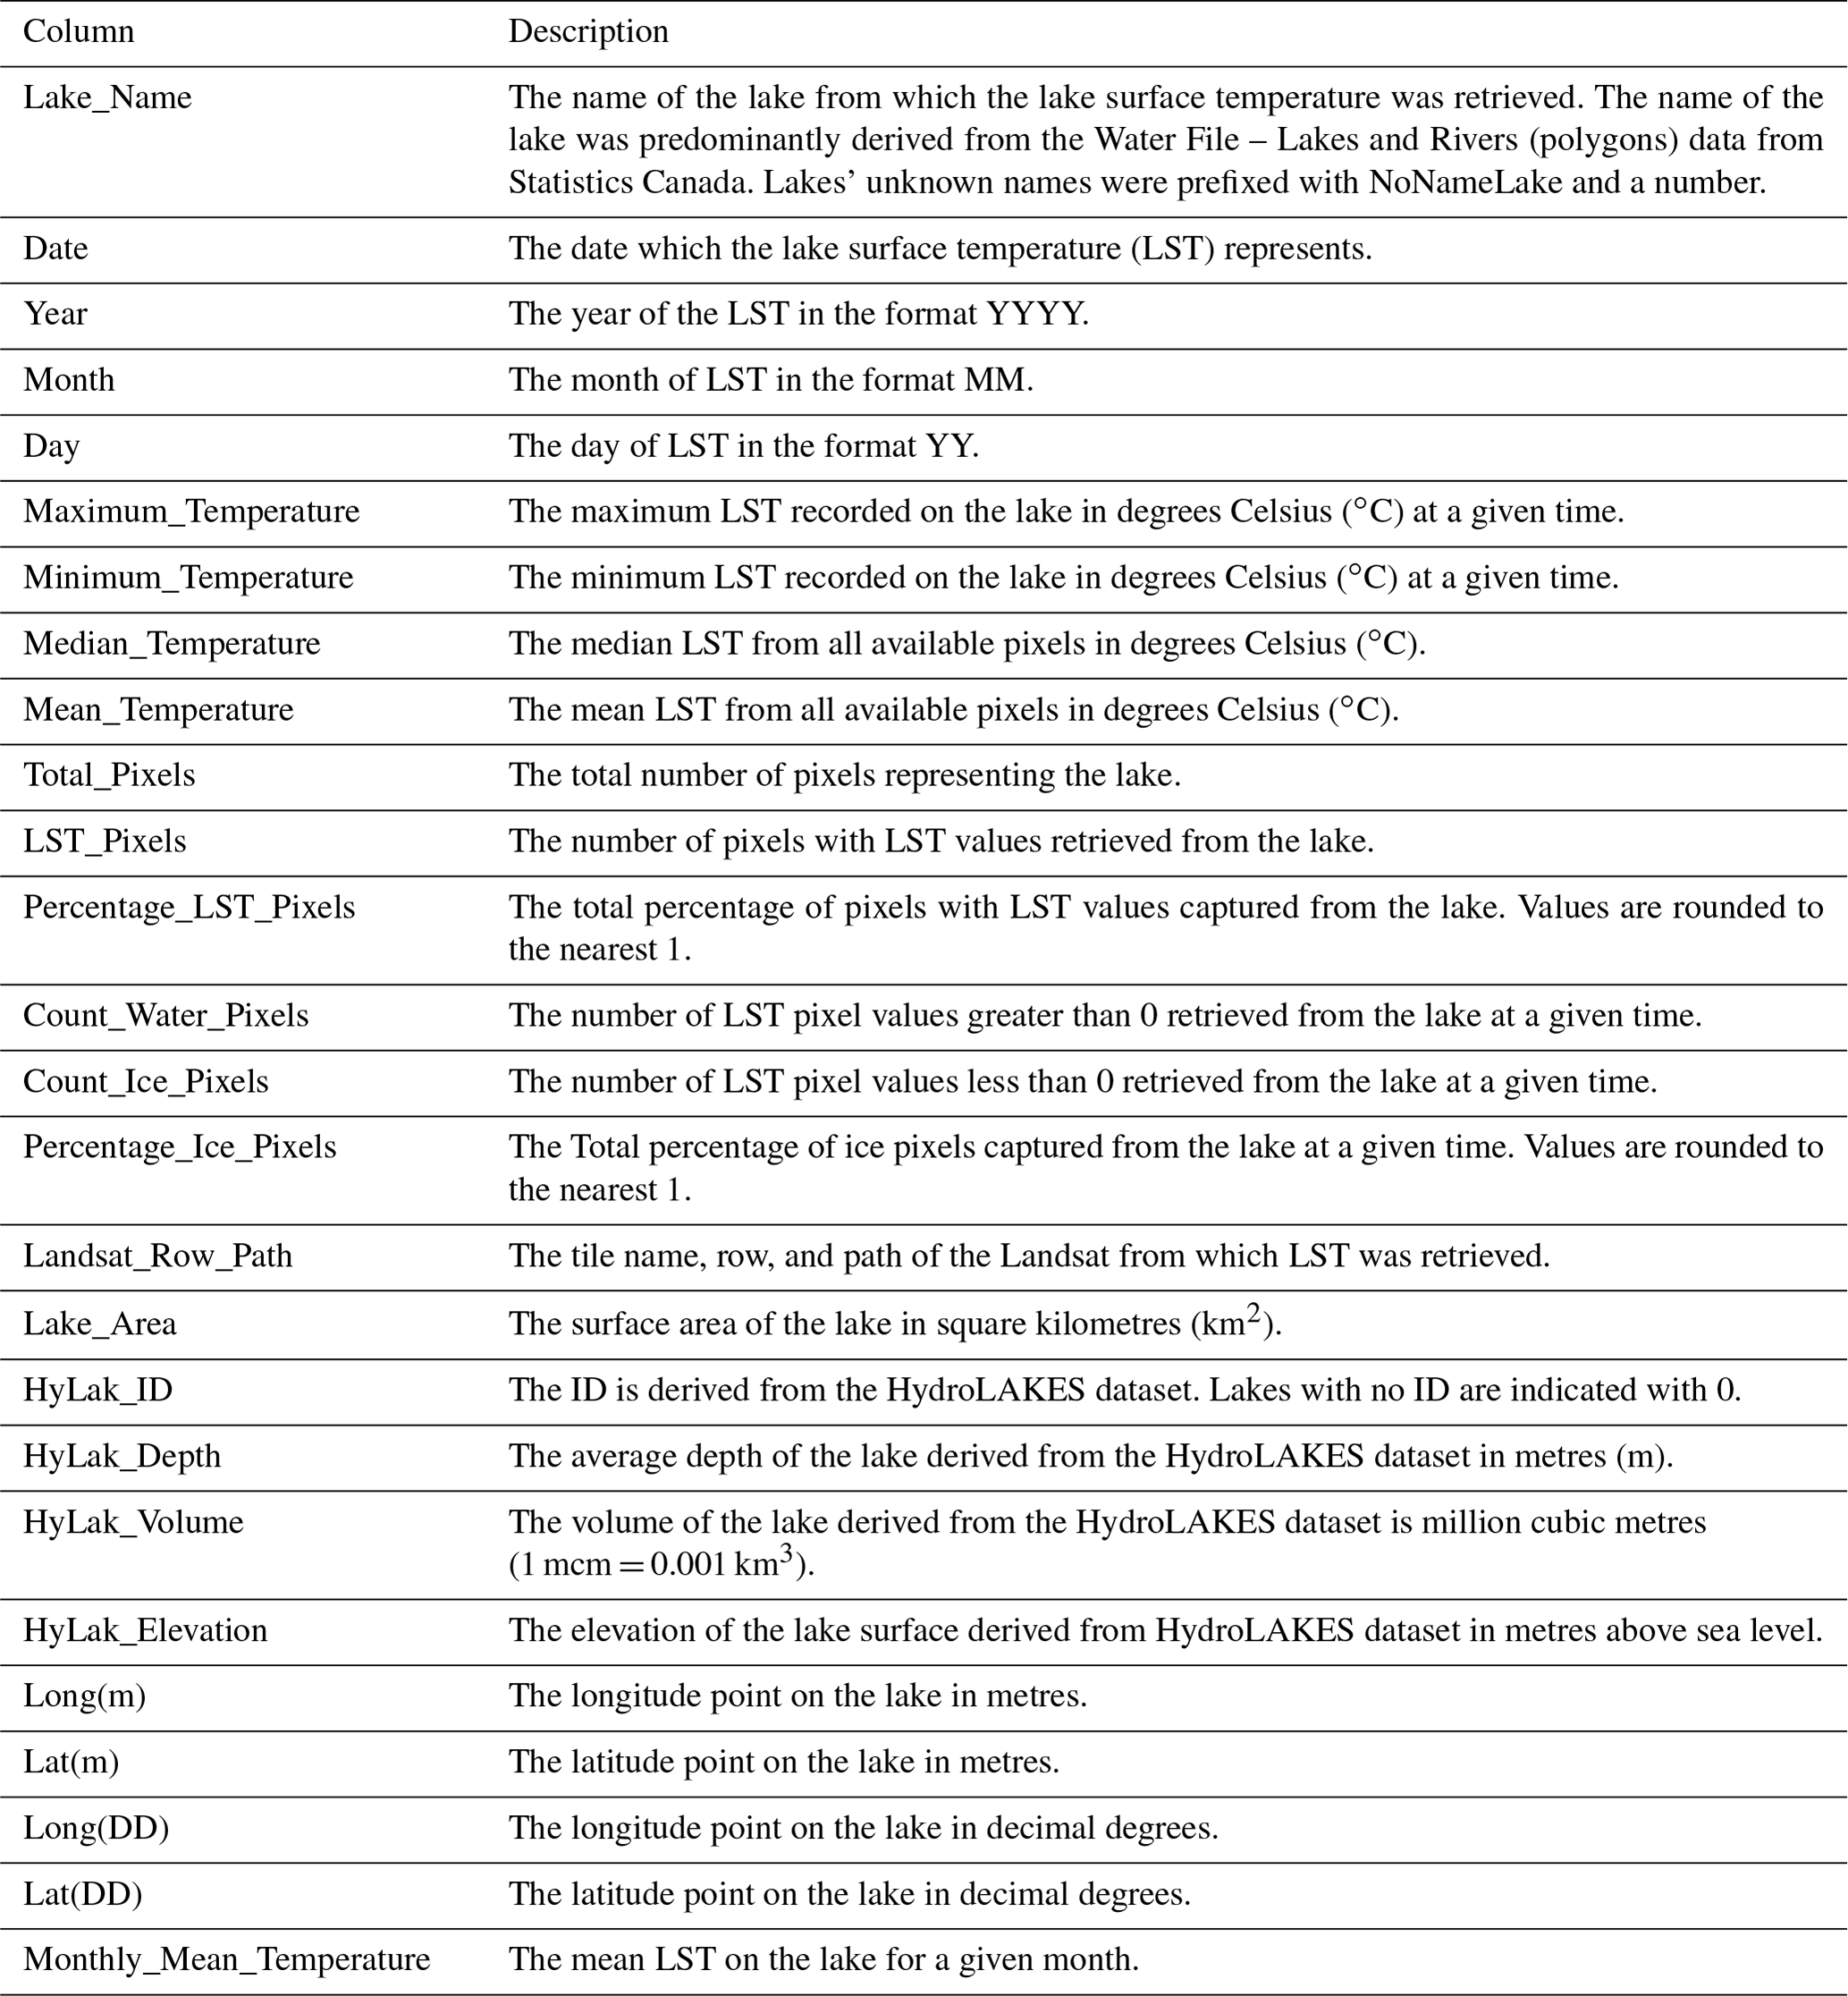
The second type of data included in the North Slave LST dataset is the tabular data containing LST statistics on individual study lakes for a given day. Derived attributes include the minimum, maximum, median, mean, number of ice cover pixels, number of open-water pixels, percentage of lake captured, and other lake properties. Table 4 highlights the column and field names from the tabular data and what they represent. These tabular data are generated for each lake and are included in the dataset. Each filename consists of the lake name followed by longitude and latitude, for easy query, based on location (e.g. AcastaLake_-115.564_65.3783). Additionally, monthly means were calculated for each lake and combined into one file in the dataset.
Table 4Column names of the tabular dataset and the description.
4.5 Spatial patterns of North Slave LST
4.5.1 Seasonal lake spatial distribution of North Slave LST
The seasonal spatial distribution of mean LST from 1984 to 2021 is shown in Fig. 10 to highlight the spatial variation in LST for different seasons. The distribution of average LST was computed for winter (December–January), spring (March–May), summer (June–August), and autumn (September–November) for all study lakes. LST on lakes in the NSR is generally negative in winter (−26 to −18 ∘C) and spring (−17 to −3 ∘C). This is because lakes are ice covered during these two seasons, constituting negative LST values. Autumn was characterised by both positive and negative LST values (−8 to 3 ∘C). Lakes start to freeze in autumn, and the freezing rate is influenced by several factors, resulting in differences in the open-water duration, which affect the average temperature. The average LST for summer ranged from 6 to 22 ∘C. Winter had the lowest LST ranges with a variability of 8 ∘C, while LST variability for summer was twice (16 ∘C) that of winter. This is expected, as temperatures on lakes during this season are influenced by several factors, including lake size, elevation, depth, latitude, longitude, and volume (O'Reilly et al., 2015; Xie et al., 2022), in addition to air temperature. Seasonal LST spatial distribution provides insight into the climate patterns of the NSR region.
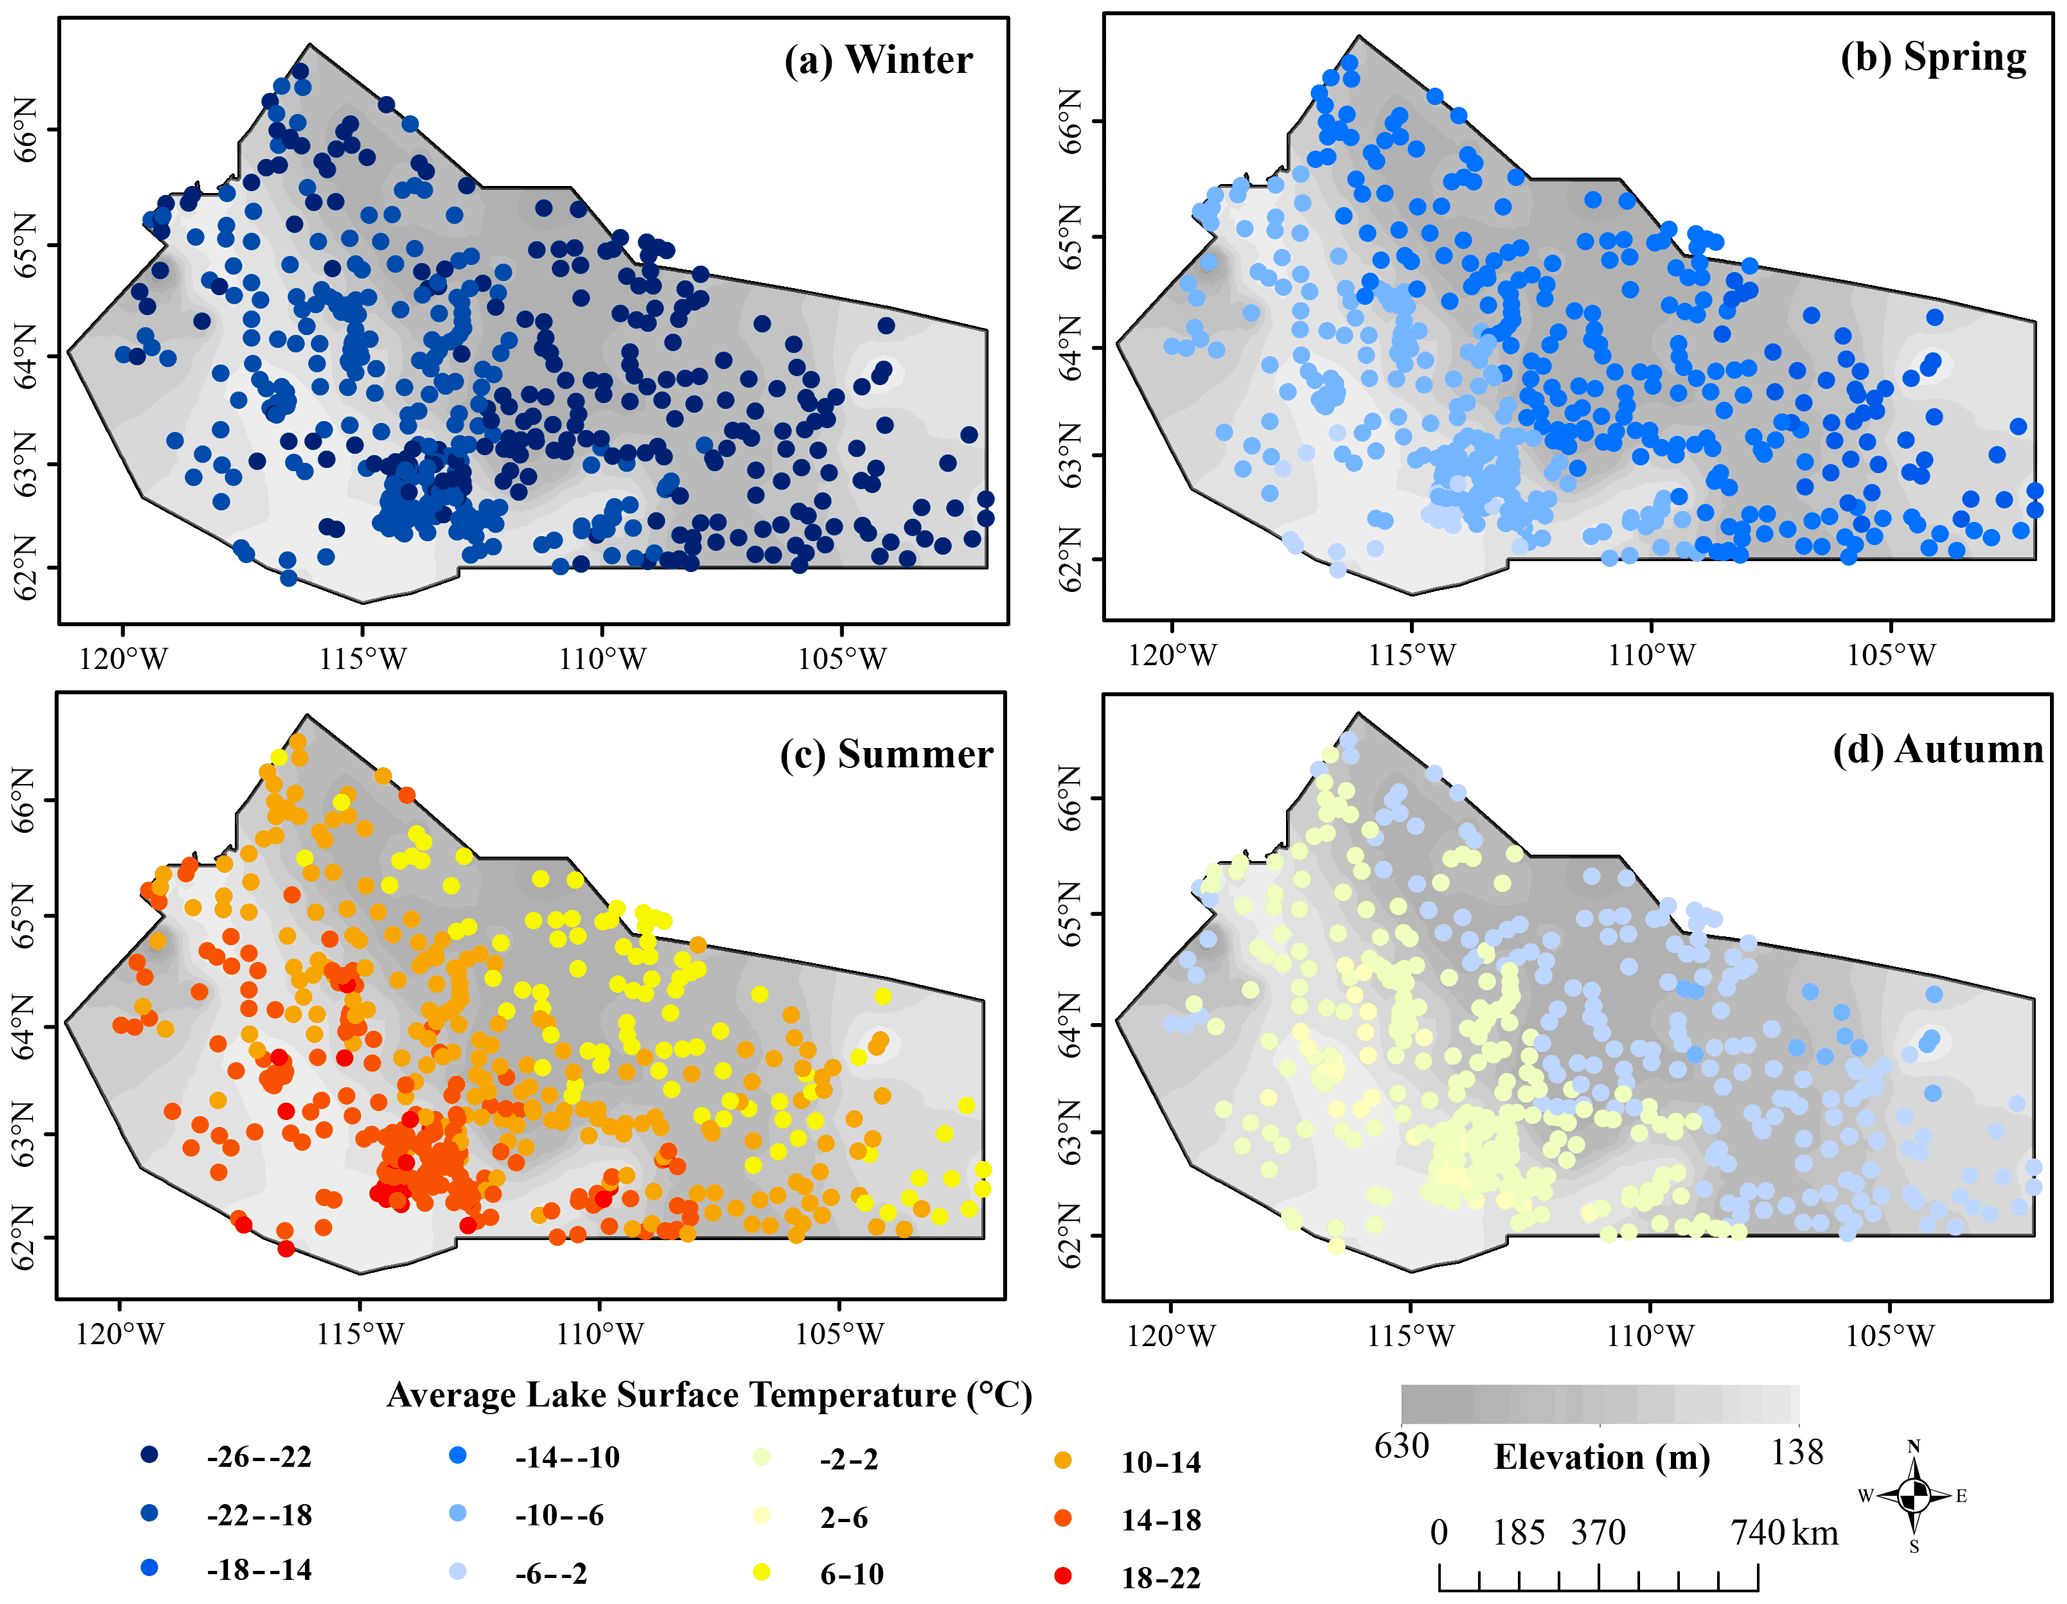
Figure 10Spatial distribution of average LST of all years across the NSR for (a) winter, (b) spring, (c) summer, and (d) autumn.
4.5.2 Spatial distribution of North Slave LST for 2021
The spatial distribution of the mean annual LST across the NSR for 2021 is shown in Fig. 11a, which highlights the remarkable spatial differences between lakes at higher versus lower elevations, with lower-elevation lakes generally demonstrating higher LST. Based on the mean annual LST values in 2021, the LST category was divided into five different ranges, as shown in the map (−12 to −9 ∘C, −9 to −6 ∘C, −6 to −3 ∘C, −3 to 0 ∘C, and 0 to 3 ∘C). Figure 11b shows most lakes (28 %), with a mean of −3 to 0 ∘C. The lake distribution of mean LST was 8 %, 22 %, 27 %, 28 %, and 15 % from colder to warmer LST categories, respectively. The percentage of the total area covered by lakes in relation to mean LST was 34 %, 27 %, 18 %, 19 %, and 2 %, respectively (Fig. 11b). Although the number of lakes with LST ranging from −12 to −9 ∘C was the least (8 % of lakes), the percentage of the total area covered by lakes with this LST range was the largest (34 % of lakes). The total area covered for all lakes with mean LST from 0 to 3 ∘C was only 2 %. This suggests that several of the lakes with warmer temperatures were smaller sized. Generally, relatively warmer lakes were also distributed around Yellowknife and the southwestern part of the region.

Figure 11(a) Spatial distribution of mean LST for the year 2021 across the NSR showing (b) the percentage number of lakes and (c) the percentage area of lakes within specific LST ranges.
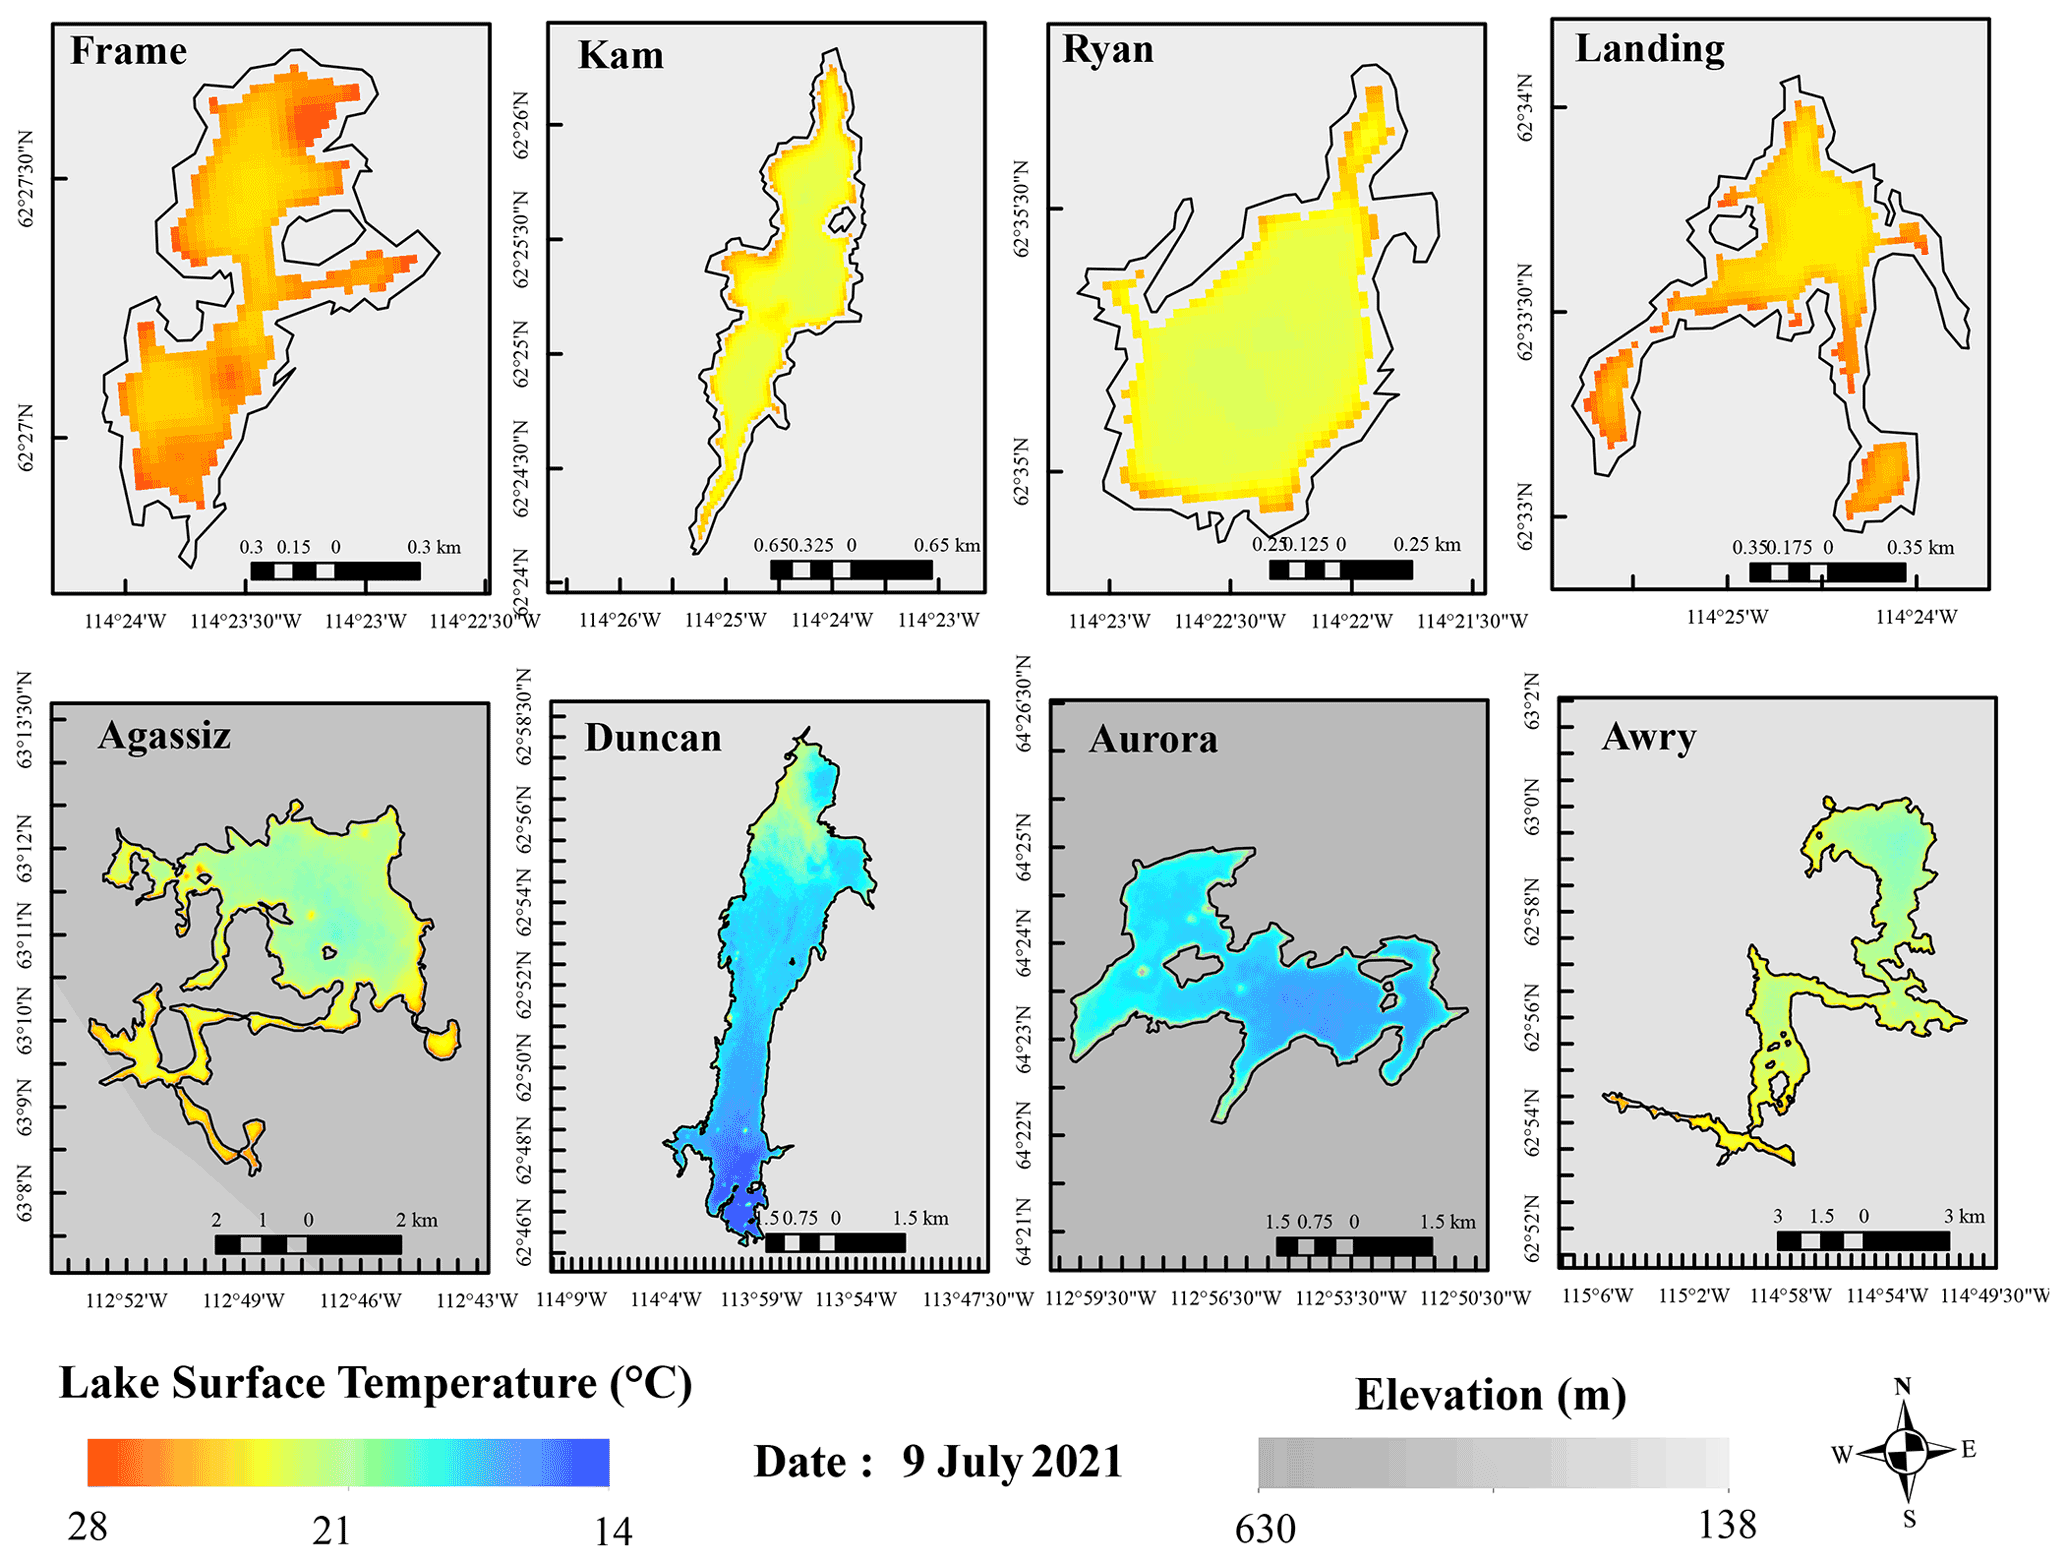
Figure 12Intra-lake spatial distribution of LST on selected lakes in the NSR highlighting the North Slave LST's ability to capture small-scale details of the LST.
4.5.3 Intra-lake spatial distribution of generated LST
Lakes in several studies are treated as homogenous entities; however, there is spatial variability in the surface temperature of a given lake based on several factors, including the difference in morphometry or the biological, physical, and anthropogenic activities occurring on the lake at a given time (Crosman and Horel, 2009; Huang et al., 2017; Yang et al., 2020). The North Slave LST dataset generated in this study can highlight the spatial variability within a given lake. As expected, the high spatial resolution and multidate LST generated show lakes' surface temperature heterogeneity. The phenomenon is demonstrated with LST distribution on 9 July 2021 for a few selected lakes within our study given as examples (Fig. 12).
Lakes may demonstrate significant surface temperature variations for various reasons, including wind redistribution, depth, and biological and anthropogenic activities. Warmer LSTs are generally at the shallower coastal regions of lakes; however, internal LST variations differ. An example is Duncan Lake (Fig. 12), which demonstrated warmer temperatures in the northern part of the lake than in the south. Maximum and minimum LST on lakes also differ, with some lakes having wider variations (e.g. Duncan Lake; 23–14 ∘C) and others having less variation (e.g. Frame Lake; 28–24 ∘C). Lakes' physical differences, location, and elevation may contribute to the different ranges of surface temperature distribution on individual lakes.
The long-term (1984–2021) continuous high-resolution (30 m spatial resolution) regional (North Slave Region, NWT) gridded LST dataset is available at https://doi.org/10.5683/SP3/J4GMC2 (Attiah et al., 2022). The Landsat imagery used to generate this dataset can be downloaded from the USGS platform. Physical properties and names of lakes were derived from HydroLAKES (https://www.hydrosheds.org/products/hydrolakes, HydroSheds, 2022; Messager et al., 2016), Water File – Lakes and Rivers (polygons) data (https://www12.statcan.gc.ca/census-recensement/2011/geo/bound-limit/files-fichiers/ghy_000c06a_e.zip, Statistics Canada, 2022) and CanVec Series (https://open.canada.ca/data/en/dataset/9d96e8c9-22fe-4ad2-b5e8-94a6991b744b, Natural Resources Canada, 2019). Evaluation data were derived from Mackenzie DataStream (https://mackenziedatastream.ca/, last access: 25 May 2022, https://doi.org/10.25976/gm49-2a19, Environment and Climate Change Canada, Université de Montréal, 2020). ERA5 reanalysis data were obtained from Copernicus Climate Change Service (https://doi.org/10.24381/cds.adbb2d47; Hersbach et al., 2019).
A new gridded dataset (North Slave LST) containing lake surface temperature across the NSR, generated by applying a retrieval algorithm to the thermal bands of Landsat archives, was presented in this study. LST data are available for 38 years (from 1984 to 2021) on a 30 m spatial resolution and varying temporal resolution. North Slave LST dataset has proven that it is suitable for capturing small-scale details of LST on small lakes and is comparable with LST products like MODIS (1 km resolution) and other water surface temperature measurements.
The North Slave LST dataset includes 673 223 NetCDF gridded data files for all lakes, with a greater percentage (57.3 %) highlighting LST in warmer months. Tabular LST data have also been generated to report the aggregated values of LST on lakes. A high percentage (43 %) of the dataset was derived from Landsat 5. Lakes had a 100 m buffer applied, resulting in a pixel representation ranging from 16.7 % to 97.34 % of the lake area. Most of the dataset (77.4 %) had LST pixel coverage greater than 50 %, of which 42.2 % had pixel coverage greater than 90 %. Each lake's average yearly number of LST images was between 20 and 45.
The algorithm, when successfully applied, retrieves LST from Landsat images across the NSR, with a RMSD of 1.7 ∘C and MBD of 0.12 ∘C. The dataset produced provides continuous data and highlights spatial and temporal LST of lakes in the NSR. Based on generated North Slave LST, warmer lakes are predominantly located around Yellowknife and on the southwestern part of the NSR. Seasonal average LST is highlighted using the North Slave LST dataset, with summer having the highest variation in LST (16 ∘C) between lakes across the NSR. Intra-lake variability is also demonstrated in this dataset. The North Slave LST dataset will be continually updated with improved retrieval algorithms and up-to-date data as they become available.

GA was responsible for developing the methodology, conducting the analysis, writing, and visualizing the original draft. HKP and KAS supervised, provided resources, and reviewed and edited the paper.
The contact author has declared that none of the authors has any competing interests.
Publisher's note: Copernicus Publications remains neutral with regard to jurisdictional claims in published maps and institutional affiliations.
The authors acknowledge that this research was conducted within the Chief Drygeese Territories on the traditional land of the Yellowknives Dene First Nation. The authors are grateful to the Indigenous Peoples for allowing them the opportunity to learn and conduct fieldwork on their lands. This research has been supported by funding from the Natural Sciences and Engineering Research Council (NSERC) Canada Research Chair (CRC), the NSERC Discovery Grant (RGPIN-2020-05573), the Global Water Futures (GWF) Remotely Sensed Monitoring of Northern Lake Ice project (grant no. 353374), and the Government of Northwest Territories, Environment and Natural Resources, the Cumulative Impact Monitoring Programme (project no. CIMP-212). This research was enabled in part by support provided by Compute Ontario (https://www.computeontario.ca/, last access: 17 March 2023) and the Digital Research Alliance of Canada (https://alliancecan.ca/en, last access: 17 March 2023).
This research has been supported by the Global Water Futures (grant no. 353374).
This paper was edited by Achim A. Beylich and reviewed by Artyom Gusarov and one anonymous referee.
Attiah, G., Kheyrollah Pour, H., and Scott, K. A.: North Slave Lake Surface Temperature Retrieved from Landsat Archives from 1984 to 2021, Borealis [data set], https://doi.org/10.5683/SP3/J4GMC2, 2022.
Austin, J. A. and Colman, S. M.: Lake Superior summer water temperatures are increasing more rapidly than regional temperatures: A positive ice-albedo feedback, Geophys. Res. Lett., 34, L06604, https://doi.org/10.1029/2006GL029021, 2007.
Chander, G. and Markham, B.: Revised Landsat-5 TM Radiometrie Calibration Procedures and Postcalibration Dynamic Ranges, IEEE T. Geosci. Remote, 41, 2674–2677, https://doi.org/10.1109/TGRS.2003.818464, 2003.
Chen, Y., Zhao, C., and Ming, Y.: Potential impacts of Arctic warming on Northern Hemisphere mid-latitude aerosol optical depth, Clim. Dynam., 53, 1637–1651, https://doi.org/10.1007/s00382-019-04706-3, 2019.
Collingsworth, P. D., Bunnell, D. B., Murray, M. W., Kao, Y. C., Feiner, Z. S., Claramunt, R. M., Lofgren, B. M., Höök, T. O., and Ludsin, S. A.: Climate change as a long-term stressor for the fisheries of the Laurentian Great Lakes of North America, Rev. Fish Biol. Fish., 27, 363–391, https://doi.org/10.1007/s11160-017-9480-3, 2017.
Crosman, E. T. and Horel, J. D.: Remote Sensing of Environment MODIS-derived surface temperature of the Great Salt Lake, Remote Sens. Environ., 113, 73–81, https://doi.org/10.1016/j.rse.2008.08.013, 2009.
Desai, A. R., Austin, J. A., Bennington, V., and McKinley, G. A.: Stronger winds over a large lake in response to weakening air-to-lake temperature gradient, Nat. Geosci., 2, 855–858, https://doi.org/10.1038/ngeo693, 2009.
Eerola, K., Rontu, L., Kourzeneva, E., Pour, H. K., and Duguay, C.: Impact of partly ice-free Lake Ladoga on temperature and cloudiness in an anticyclonic winter situation – a case study using a limited area model, Tellus A, 66, 23929, https://doi.org/10.3402/tellusa.v66.23929, 2014.
Environment and Climate Change Canada, Université de Montréal: CIMP 161_Legacy arsenic pollution in Yellowknife Bay sediments, 1.0.0, DataStream [data set], https://doi.org/10.25976/gm49-2a19, 2020.
Fichot, C. G., Matsumoto, K., Holt, B., Gierach, M. M., and Tokos, K. S.: Assessing change in the overturning behavior of the Laurentian Great Lakes using remotely sensed lake surface water temperatures, Remote Sens. Environ., 235, 111427, https://doi.org/10.1016/j.rse.2019.111427, 2019.
Hersbach, H., Bell, B., Berrisford, P., Biavati, G., Horányi, A., Muñoz Sabater, J., Nicolas, J., Peubey, C., Radu, R., Rozum, I., Schepers, D., Simmons, A., Soci, C., Dee, D., and Thépaut, J.-N.: ERA5 hourly data on single levels from 1959 to present, Copernicus Climate Change Service (C3S) Climate Data Store (CDS) [data set], https://doi.org/10.24381/cds.adbb2d47, 2018.
Hersbach, H., Bell, B., Berrisford, P., Hirahara, S., Horányi, A., Muñoz-Sabater, J., Nicolas, J., Peubey, C., Radu, R., Schepers, D., Simmons, A., Soci, C., Abdalla, S., Abellan, X., Balsamo, G., Bechtold, P., Biavati, G., Bidlot, J., Bonavita, M., De Chiara, G., Dahlgren, P., Dee, D., Diamantakis, M., Dragani, R., Flemming, J., Forbes, R., Fuentes, M., Geer, A., Haimberger, L., Healy, S., Hogan, R. J., Hólm, E., Janisková, M., Keeley, S., Laloyaux, P., Lopez, P., Lupu, C., Radnoti, G., De Rosnay, P., Rozum, I., Vamborg, F., Villaume, S., and Thépaut, J.-N.: The ERA5 global reanalysis, Q. J. Roy. Meteorol. Soc., 146, 1999–2049, https://doi.org/10.1002/qj.3803, 2020.
Huang, Y., Liu, H., Hinkel, K., Yu, B., Beck, R., and Wu, J.: Analysis of Thermal Structure of Arctic Lakes at Local and Regional Scales Using in Situ and Multidate Landsat-8 Data, Water Resour. Res., 53, 9642–9658, https://doi.org/10.1002/2017WR021335, 2017.
HydroSheds: HydroLAKES, Hydrosheds [data set], https://www.hydrosheds.org/products/hydrolakes, last access: 20 May 2022.
Ihlen, V. and Zanter, K.: Landsat 7 (L7) Data Users Handbook, USGS Landsat User Serv., 7, 151, https://d9-wret.s3.us-west-2.amazonaws.com/assets/palladium/production/s3fs-public/atoms/files/LSDS-1927_L7_Data_Users_Handbook-v2.pdf (last access: 6 March 2023), 2019.
Irons, J. R., Dwyer, J. L., and Barsi, J. A.: The next Landsat satellite: The Landsat Data Continuity Mission, Remote Sens. Environ., 122, 11–21, https://doi.org/10.1016/j.rse.2011.08.026, 2012.
Jiménez-Muñoz, J. C. and Sobrino, J. A.: A generalized single-channel method for retrieving land surface temperature from remote sensing data, J. Geophys. Res, 108, 4688, https://doi.org/10.1029/2003JD003480, 2003.
Jimenez-Munoz, J. C., Cristobal, J., Sobrino, J. A., Sòria, G., Ninyerola, M., and Pons, X.: Revision of the single-channel algorithm for land surface temperature retrieval from landsat thermal-infrared data, IEEE T. Geosci. Remote, 47, 339–349, https://doi.org/10.1109/TGRS.2008.2007125, 2009.
Jimenez-Munoz, J. C., Sobrino, J. A., Skokovic, D., Mattar, C., and Cristobal, J.: Land surface temperature retrieval methods from landsat-8 thermal infrared sensor data, IEEE Geosci. Remote Sens. Lett., 11, 1840–1843, https://doi.org/10.1109/LGRS.2014.2312032, 2014.
Kheyrollah Pour, H., Duguay, C. R., Solberg, R., and Rudjord, Ø.: Impact of satellite-based lake surface observations on the initial state of HIRLAM. Part I: Evaluation of remotelysensed lake surface water temperature observations, Tellus A, 66, 21534, https://doi.org/10.3402/tellusa.v66.21534, 2014a.
Kheyrollah Pour, H., Rontu, L., Duguay, C., Eerola, K., and Kourzeneva, E.: Impact of satellite-based lake surface observations on the initial state of HIRLAM. Part II: Analysis of lake surface temperature and ice cover, Tellus A, 66, 21395, https://doi.org/10.3402/tellusa.v66.21395, 2014b.
Kheyrollah Pour, H., Duguay, C. R., Scott, K. A., and Kang, K. K.: Improvement of Lake Ice Thickness Retrieval from MODIS Satellite Data Using a Thermodynamic Model, IEEE T. Geosci. Remote, 55, 5956–5965, https://doi.org/10.1109/TGRS.2017.2718533, 2017.
Kraemer, B. M., Anneville, O., Chandra, S., Dix, M., Kuusisto, E., Livingstone, D. M., Rimmer, A., Schladow, S. G., Silow, E., Sitoki, L. M., Tamatamah, R., Vadeboncoeur, Y., and McIntyre, P. B.: Morphometry and average temperature affect lake stratification responses to climate change, Geophys. Res. Lett., 42, 4981–4988, https://doi.org/10.1002/2015GL064097, 2015.
Livingstone, D. M., Lotter, F., and Kettle, H.: Altitude-dependent differences in the primary physical response of mountain lakes to climatic forcing, Limnol. Oceanogr., 50, 1313–1325, 2005.
Magnuson, J. J., Robertson, D. M., Benson, B. J., Wynne, R. H., Livingstone, D. M., Arai, T., Assel, R. A., Barry, R. G., Card, V., Kuusisto, E., Granin, N. G., Prowse, T. D., Stewart, K. M., and Vuglinski, V. S.: Historical trends in lake and river ice cover in the Northern Hemisphere, Science, 289, 1743–1746, https://doi.org/10.1126/science.289.5485.1743, 2000.
Markham, B., Barsi, J., Kvaran, G., Ong, L., Kaita, E., Biggar, S., Czapla-Myers, J., Mishra, N., and Helder, D.: Landsat-8 operational land imager radiometric calibration and stability, Remote Sensing, 6, 12275–12308, https://doi.org/10.3390/rs61212275, 2014.
Merchant, C. J., Paul, F., Popp, T., Ablain, M., Bontemps, S., Defourny, P., Hollmann, R., Lavergne, T., Laeng, A., de Leeuw, G., Mittaz, J., Poulsen, C., Povey, A. C., Reuter, M., Sathyendranath, S., Sandven, S., Sofieva, V. F., and Wagner, W.: Uncertainty information in climate data records from Earth observation, Earth Syst. Sci. Data, 9, 511–527, https://doi.org/10.5194/essd-9-511-2017, 2017.
Messager, M. L., Lehner, B., Grill, G., Nedeva, I., and Schmitt, O.: Estimating the volume and age of water stored in global lakes using a geo-statistical approach, Nat. Commun., 7, 13603, https://doi.org/10.1038/ncomms13603, 2016.
Le Moigne, P., Colin, J., and Decharme, B.: Impact of lake surface temperatures simulated by the FLake scheme in the CNRM-CM5 climate model, Tellus A, 68, 31274, https://doi.org/10.3402/tellusa.v68.31274, 2016.
Natural Resources Canada: Lakes, Rivers and Glaciers in Canada – CanVec Series – Hydrographic Features, Government of Canada [data set], https://open.canada.ca/data/en/dataset/9d96e8c9-22fe-4ad2-b5e8-94a6991b744b (last access: 28 March 2022), 2019.
O'Reilly, C. M., Rowley, R. J., Schneider, P., Lenters, J. D., Mcintyre, P. B., and Kraemer, B. M.: Rapid and highly variable warming of lake surface waters around the globe, Geophys. Res. Lett., 42, 10773–10781, https://doi.org/10.1002/2015GL066235, 2015.
Pekel, J. F., Cottam, A., Gorelick, N., and Belward, A. S.: High-resolution mapping of global surface water and its long-term changes, Nature, 540, 418–422, https://doi.org/10.1038/nature20584, 2016.
Prats, J., Reynaud, N., Rebière, D., Peroux, T., Tormos, T., and Danis, P.-A.: LakeSST: Lake Skin Surface Temperature in French inland water bodies for 1999–2016 from Landsat archives, Earth Syst. Sci. Data, 10, 727–743, https://doi.org/10.5194/essd-10-727-2018, 2018.
Reinart, A. and Reinhold, M.: Mapping surface temperature in large lakes with MODIS data, Remote Sens. Environ., 112, 603–611, https://doi.org/10.1016/j.rse.2007.05.015, 2008.
Roy, D. P., Wulder, M. A., Loveland, T. R., C. E., W., Allen, R. G., Anderson, M. C., Helder, D., Irons, J. R., Johnson, D. M., Kennedy, R., Scambos, T. A., Schaaf, C. B., Schott, J. R., Sheng, Y., Vermote, E. F., Belward, A. S., Bindschadler, R., Cohen, W. B., Gao, F., Hipple, J. D., Hostert, P., Huntington, J., Justice, C. O., Kilic, A., Kovalskyy, V., Lee, Z. P., Lymburner, L., Masek, J. G., McCorkel, J., Shuai, Y., Trezza, R., Vogelmann, J., Wynne, R. H., and Zhu, Z.: Landsat-8: Science and product vision for terrestrial global change research, Remote Sens. Environ., 145, 154–172, https://doi.org/10.1016/j.rse.2014.02.001, 2014.
Schneider, P. and Hook, S. J.: Space observations of inland water bodies show rapid surface warming since 1985, Geophys. Res. Lett., 37, L22405, https://doi.org/10.1029/2010GL045059, 2010.
Sentlinger, G. I., Hook, S. J., and Laval, B.: Sub-pixel water temperature estimation from thermal-infrared imagery using vectorized lake features, Remote Sens. Environ., 112, 1678–1688, https://doi.org/10.1016/j.rse.2007.08.019, 2008.
Shi, Q. and Xie, P.: Impact of lake surface temperature variations on lake effect snow over the great lakes region, J. Geophys. Res.-Atmos., 124, 12553–12567, https://doi.org/10.1029/2019JD031261, 2019.
Sima, S., Ahmadalipour, A., and Tajrishy, M.: Mapping surface temperature in a hyper-saline lake and investigating the effect of temperature distribution on the lake evaporation, Remote Sens. Environ., 136, 374–385, https://doi.org/10.1016/j.rse.2013.05.014, 2013.
Slater, J. A., Garvey, G., Johnston, C., Haase, J., Heady, B., Kroenung, G., and Little, J.: The SRTM data “finishing” process and products, Photogramm. Eng. Remote Sensing, 72, 237–247, https://doi.org/10.14358/PERS.72.3.237, 2006.
Statistics Canada: 2016 Census-Boundary files, Statistics Canada [data set], https://www12.statcan.gc.ca/census-recensement/2011/geo/bound-limit/files-fichiers/ghy_000c06a_e.zip, last access: 30 March 2022.
U.S. Geological Survey: Landsat 8 Data Users Handbook, Nasa, 8, 97, 2016.
USGS: landsat-level-1-processing-details, https://www.usgs.gov/landsat-missions/landsat-level-1-processing-details, last access: 11 March 2022.
Wan, Z., Zhang, Y., Zhang, Q., and Li, Z. L.: Validation of the land-surface temperature products retrieved from terra moderate resolution imaging spectroradiometer data, Remote Sens. Environ., 83, 163–180, https://doi.org/10.1016/S0034-4257(02)00093-7, 2002.
Wang, J., Xue, P., Pringle, W., Yang, Z., and Qian, Y.: Impacts of lake surface temperature on the summer climate over the Great Lakes Region, J. Geophys. Res.-Atmos., 127, e2021JD036231, https://doi.org/10.1029/2021JD036231, 2022.
Wloczyk, C., Richter, R., Borg, E., and Neubert, W.: Sea and lake surface temperature retrieval from Landsat thermal data in Northern Germany, Journal of Remote Sensing, 27, 2489–2502, https://doi.org/10.1080/01431160500300206, 2006.
Woolway, R. I., Merchant, C. J., Van Den Hoek, J., Azorin-Molina, C., Nõges, P., Laas, A., Mackay, E. B., and Jones, I. D.: Northern Hemisphere Atmospheric Stilling Accelerates Lake Thermal Responses to a Warming World, Geophys. Res. Lett., 46, 11983–11992, https://doi.org/10.1029/2019GL082752, 2019.
Woolway, R. I., Kraemer, B. M., Lenters, J. D., Merchant, C. J., O'Reilly, C. M., and Sharma, S.: Global lake responses to climate change, Nat. Rev. Earth Environ., 1, 388–403, https://doi.org/10.1038/s43017-020-0067-5, 2020.
Xie, C., Zhang, X., Zhuang, L., Zhu, R., and Guo, J.: Analysis of surface temperature variation of lakes in China using MODIS land surface temperature data, Scientific Reports, 12, 2415, https://doi.org/10.1038/s41598-022-06363-9, 2022.
Yang, K., Yu, Z., and Luo, Y.: Analysis on driving factors of lake surface water temperature for major lakes in Yunnan-Guizhou Plateau, Water Res., 184, 116018, https://doi.org/10.1016/j.watres.2020.116018, 2020.
Young, N. E., Anderson, R. S., Chignell, S. M., Vorster, A. G., Lawrence, R., and Evangelista, P. H.: A survival guide to Landsat preprocessing, Ecology, 98, 920–932, https://doi.org/10.1002/ecy.1730, 2017.
Zhang, G., Yao, T., Chen, W., Zheng, G., Shum, C. K., Yang, K., Piao, S., Sheng, Y., Yi, S., Li, J., O'Reilly, C. M., Qi, S., Shen, S. S. P., Zhang, H., and Jia, Y.: Regional differences of lake evolution across China during 1960s–2015 and its natural and anthropogenic causes, Remote Sens. Environ., 221, 386–404, https://doi.org/10.1016/j.rse.2018.11.038, 2019.
Zhang, X., Duan, K. Q., Shi, P. H., and Yang, J. H.: Effect of lake surface temperature on the summer precipitation over the Tibetan Plateau, J. Mt. Sci., 13, 802–810, https://doi.org/10.1007/s11629-015-3743-z, 2016.
Zhao, G., Gao, H., and Cai, X.: Estimating lake temperature profile and evaporation losses by leveraging MODIS LST data, Remote Sens. Environ., 251, 112104, https://doi.org/10.1016/j.rse.2020.112104, 2020.