the Creative Commons Attribution 4.0 License.
the Creative Commons Attribution 4.0 License.
 | 07 Mar 2023
An evaluation of long-term physical and hydrochemical measurements at the Sylt Roads Marine Observatory (1973–2019), Wadden Sea, North Sea
Johannes J. Rick
Mirco Scharfe
Tatyana Romanova
Justus E. E. van Beusekom
Ragnhild Asmus
Harald Asmus
Finn Mielck
Anja Kamp
Rainer Sieger
Karen H. Wiltshire
The Sylt Roads pelagic time series covers physical and hydrochemical parameters at five neighboring stations in the Sylt–Rømø bight, Wadden Sea, North Sea. Since the beginning of the time series in 1973, sea surface temperature (SST), salinity, ammonium, nitrite, nitrate, and soluble reactive phosphorus (SRP) have been measured twice a week. The other parameters were introduced later (dissolved silicate (Si) since 1974, pH since 1979, dissolved organic nitrogen (DON) since 1996, dissolved organic phosphorus (DOP) since 2001, chlorophyll a since 1979, and suspended particulate matter (SPM) since 1975), and in the case of dissolved oxygen, were already discontinued (1979–1983). In the years 1977, 1978, and 1983, no sampling took place. Since the start of the continuous sampling in 1984, the sea surface temperature in the bight has risen by +1.11 ∘C, with the highest increases during the autumn months, while the pH and salinity decreased by 0.23 and 0.33 units, respectively. Summer and autumn salinities are generally significantly elevated compared to spring and winter conditions. Dissolved nutrients (ammonium, nitrite, nitrate, and SRP) have displayed periods of intense eutrophication (1973–1998) and de-eutrophication since 1999. Silicate has shown significantly higher winter levels since 1999. Interestingly, phytoplankton parameters did not mirror these large changes in nutrient concentrations, as a seasonal comparison of the two eutrophication periods showed no significant differences with regard to chlorophyll a. This phenomenon might be triggered by an important switch in nutrient limitation during the time series. With regard to nutrients, the phytoplankton was probably primarily limited by silicate until 1998, while, since 1999, the SRP limitation has become increasingly important. All data are available in Rick et al. (2017b–e, 2020a–o) from https://doi.org/10.1594/PANGAEA.150032, https://doi.org/10.1594/PANGAEA.873549, https://doi.org/10.1594/PANGAEA.873545,
https://doi.org/10.1594/PANGAEA.873547, https://doi.org/10.1594/PANGAEA.918018,
https://doi.org/10.1594/PANGAEA.918032, https://doi.org/10.1594/PANGAEA.918027,
https://doi.org/10.1594/PANGAEA.918023, https://doi.org/10.1594/PANGAEA.918033,
https://doi.org/10.1594/PANGAEA.918028, https://doi.org/10.1594/PANGAEA.918024,
https://doi.org/10.1594/PANGAEA.918034, https://doi.org/10.1594/PANGAEA.918029,
https://doi.org/10.1594/PANGAEA.918025, https://doi.org/10.1594/PANGAEA.918035,
https://doi.org/10.1594/PANGAEA.918030, https://doi.org/10.1594/PANGAEA.918026,
https://doi.org/10.1594/PANGAEA.918036, and https://doi.org/10.1594/PANGAEA.918031.
- Article
(2736 KB) - Full-text XML
- BibTeX
- EndNote


The Sylt–Rømø bight (SRB) has been a marine protected area (MPA) in the Wadden Sea UNESCO World Heritage area since 2009. It is a large tidal lagoon (ca. 400 km2) in the northern part of the Wadden Sea (SE North Sea). In the previous century, two causeways connecting the islands of Rømø and Sylt with the mainland were built. Since then, a narrow inlet between Sylt and Rømø has been the only connection with the open German Bight through which almost 50 % of the bights' water is exchanged during each tidal cycle. Local riverine discharge is estimated to be 0.1 % of the total water input. Tides are semidiurnal, with a range of about 2 m. At mean low tide, 33 % of the bight is exposed, 10 % of the remainder comprises deep channels with a maximum depth of 40 m, and 57 % is a shallow subtidal area with depths less than 5 m (Gätje and Reise, 1998; Fig. 1).
In 1973, the Sylt Roads Long Term Ecological Research time series (Sylt Roads LTER) was initiated in this hydrographically and ecologically interesting area. This consists of twice-weekly sampling of oceanographic, hydrochemical, and biological (phytoplankton, zooplankton, and fish) parameters. Meanwhile, most of these Sylt Roads data (>1000 data sets) have been published online in the open-access data bank PANGAEA (https://www.pangaea.de, last access: 1 March 2023). In this work, we summarize, for the first time, the information on the physical and hydrochemical parameters of this time series and provide a brief overview of the development over the last 45 years.
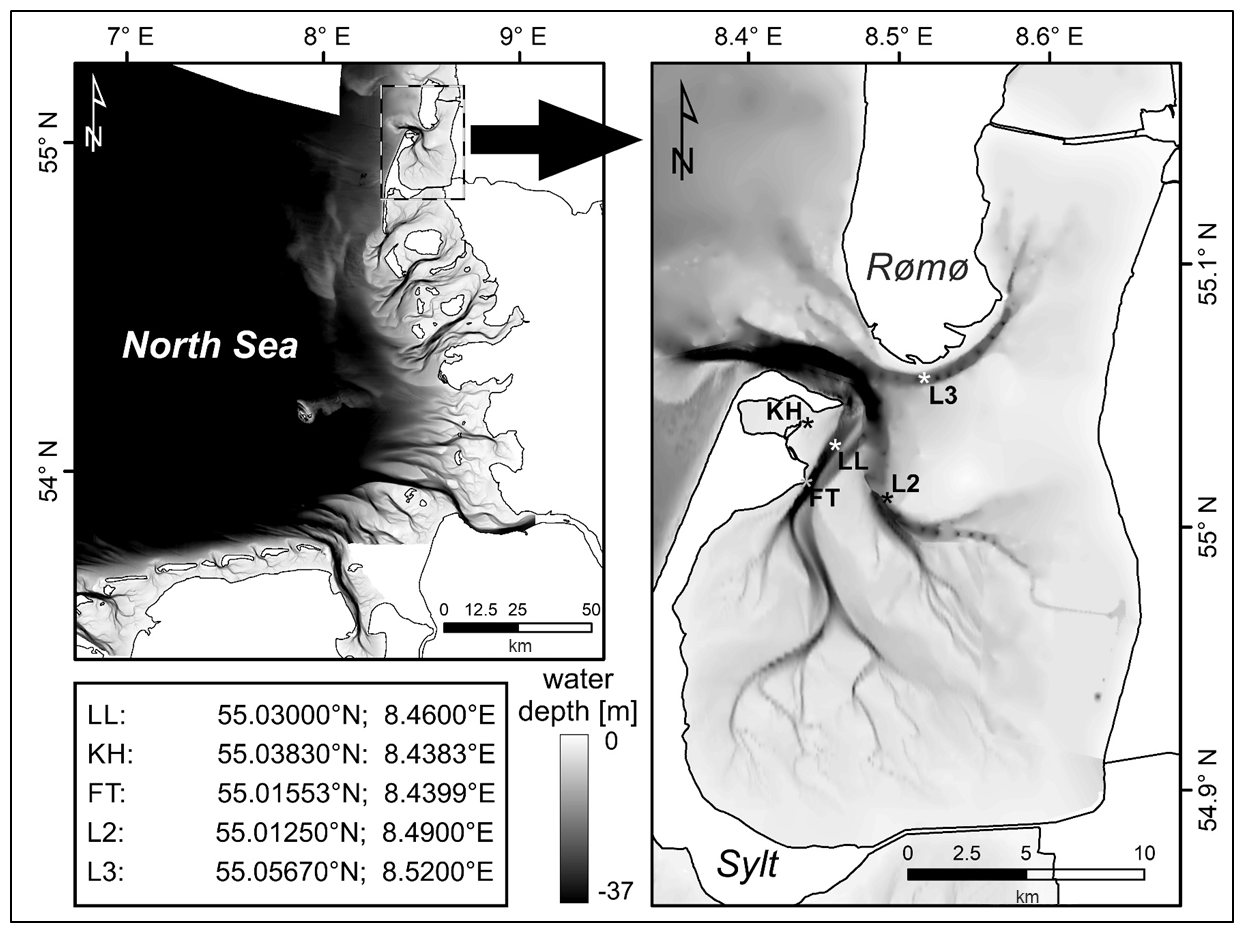
Figure 1Map of the German Bight, with the sampling area (Sylt–Rømø bight) enlarged with the main sampling stations of the Sylt Roads LTER time series and their geographical position. LL is Lister Ley or Lister Reede, KH is the entrance of Königshafen, FT is the LL ferry terminal, and L2 and L3 are the Lister 2 and 3 stations sampled in the early part (until 1991) of the time series only.
The data coverage is from 55.01250–55.05670∘ N to 8.43830–8.52000∘ E. The location names and positions, in addition to the start and end dates and times, are as follows:
-
LL is List_Reede (Lister_Ley), Sylt–Rømø bight, Wadden Sea, and the North Sea (55.03000∘ N, 8.46000∘ E).
-
L2 is List_2, Sylt–Rømø bight, German Bight, Wadden Sea, and the North Sea (55.01250∘ N, 8.49000∘ E).
-
L3 is List_3, Sylt–Rømø bight, German Bight, Wadden Sea, and the North Sea (55.05670∘ N, 8.52000∘ E).
-
KH is List_Entrance_Königshafen, Sylt–Rømø bight, German Bight, Wadden Sea, and the North Sea (55.03830∘ N, 8.43830∘ E).
-
FT is List_Ferry_Terminal, Sylt–Rømø bight, German Bight, Wadden Sea and the North Sea (55.01553∘ N, 8.43990∘ E).
-
Date (yyyy-mm-dd) and time of start is 1973-06-28 at 00:00:00 UTC.
-
Date (yyyy-mm-dd) and time of end is 2019-12-31 at 00:00:00 UTC.
Table 1Compilation of the physical and hydrochemical parameters at the Sylt Roads observatory (short name, units, and information on sample preparation).
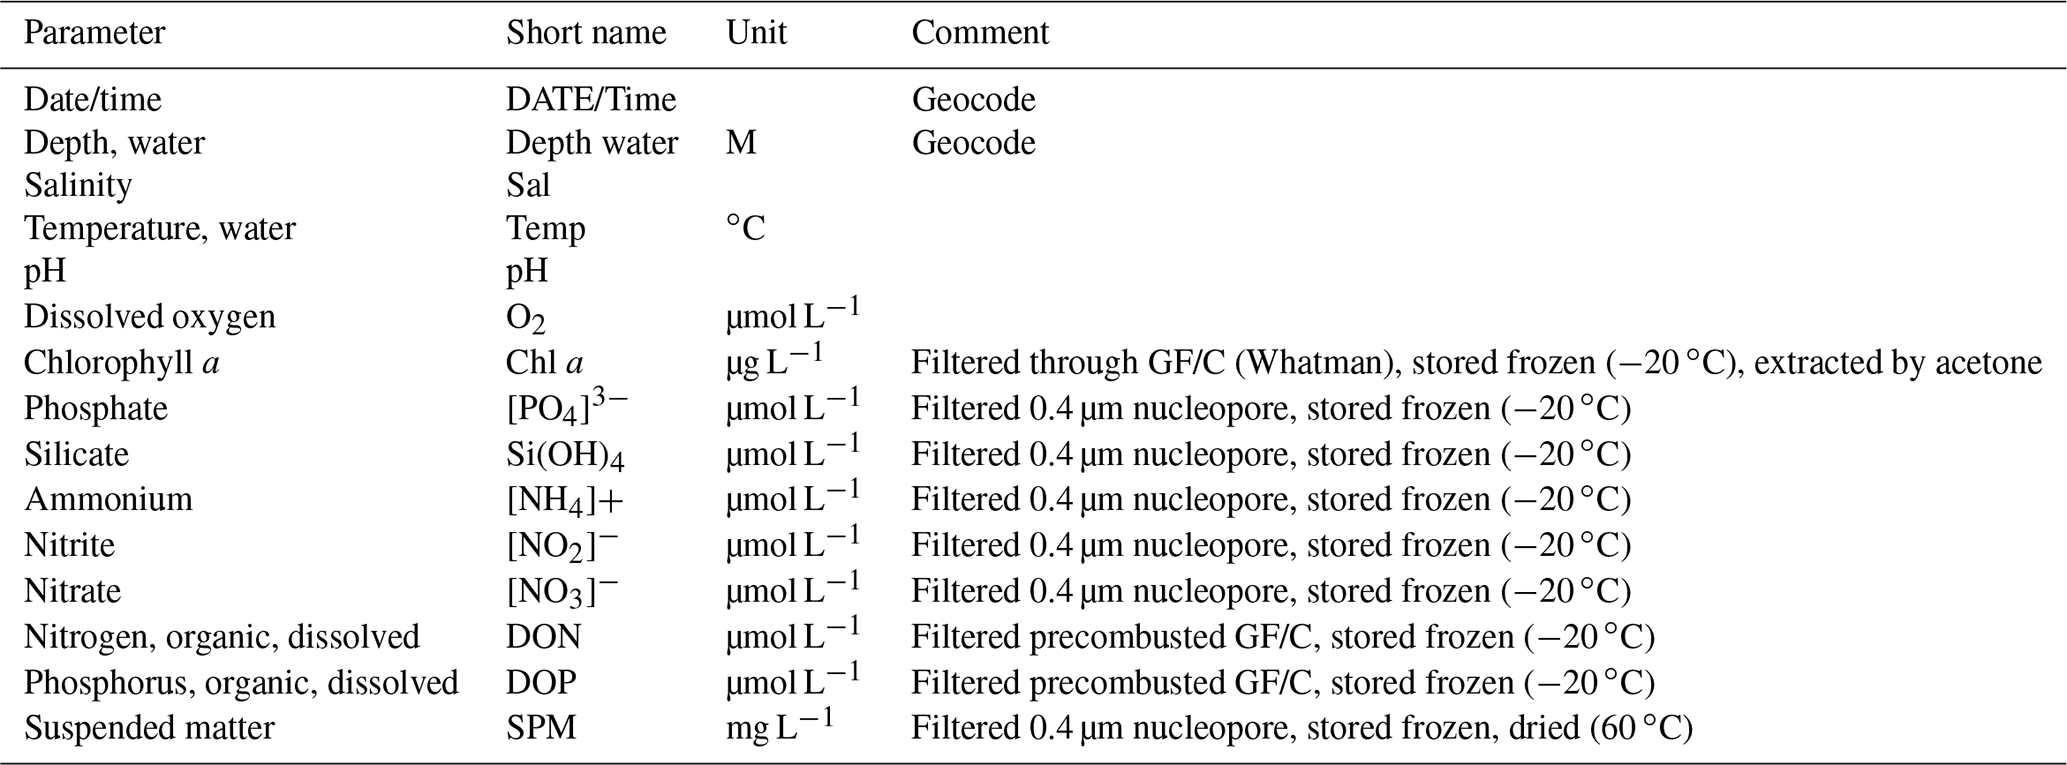
Sea surface temperature (SST), salinity, ammonium (NH), nitrite (NO), nitrate (NO), soluble reactive phosphorus (SRP), and reactive silicate (Si) measurements were started in 1973 and interrupted temporarily in the years 1977, 1978, and 1983. Temperatures of the sea surface (SST) were gathered using reversing thermometers (Thomas and Dorey, 1967). For the period 1973–1982, the inductive salinometer method was used for salinity measurements (Brown and Hamon, 1961). Since 1983, we have measured the salinity using a Guildline Autosal 8400B salinometer (Kawano, 2010). pH measurements were initiated in 1979. Until 1984, diverse pH meters were applied, and since 1985, a WTW pH 3000 m has been in use. Dissolved oxygen was measured only during the period from 1979–1983 using the Winkler method (e.g., Culberson et al., 1991). Table 2 gives an overview of the methods applied within the time series for several chemical analyses on nutrient components and chlorophyll a. For both DON and dissolved organic phosphorus (DOP) filtration we used precombusted GF/C filters (Whatman microfiber glass filters), and the filtrates were frozen at −20 ∘C, while for chlorophyll a analysis, untreated GF/C filters were employed instead. For gravimetric suspended matter (SPM) analyses, we have used precombusted GF/C filters from 1975 to 1998; since 1999, 0.4–0.45 µm nucleopore filters have been employed.
Table 2Compilation of methods applied in the Sylt Roads time series.
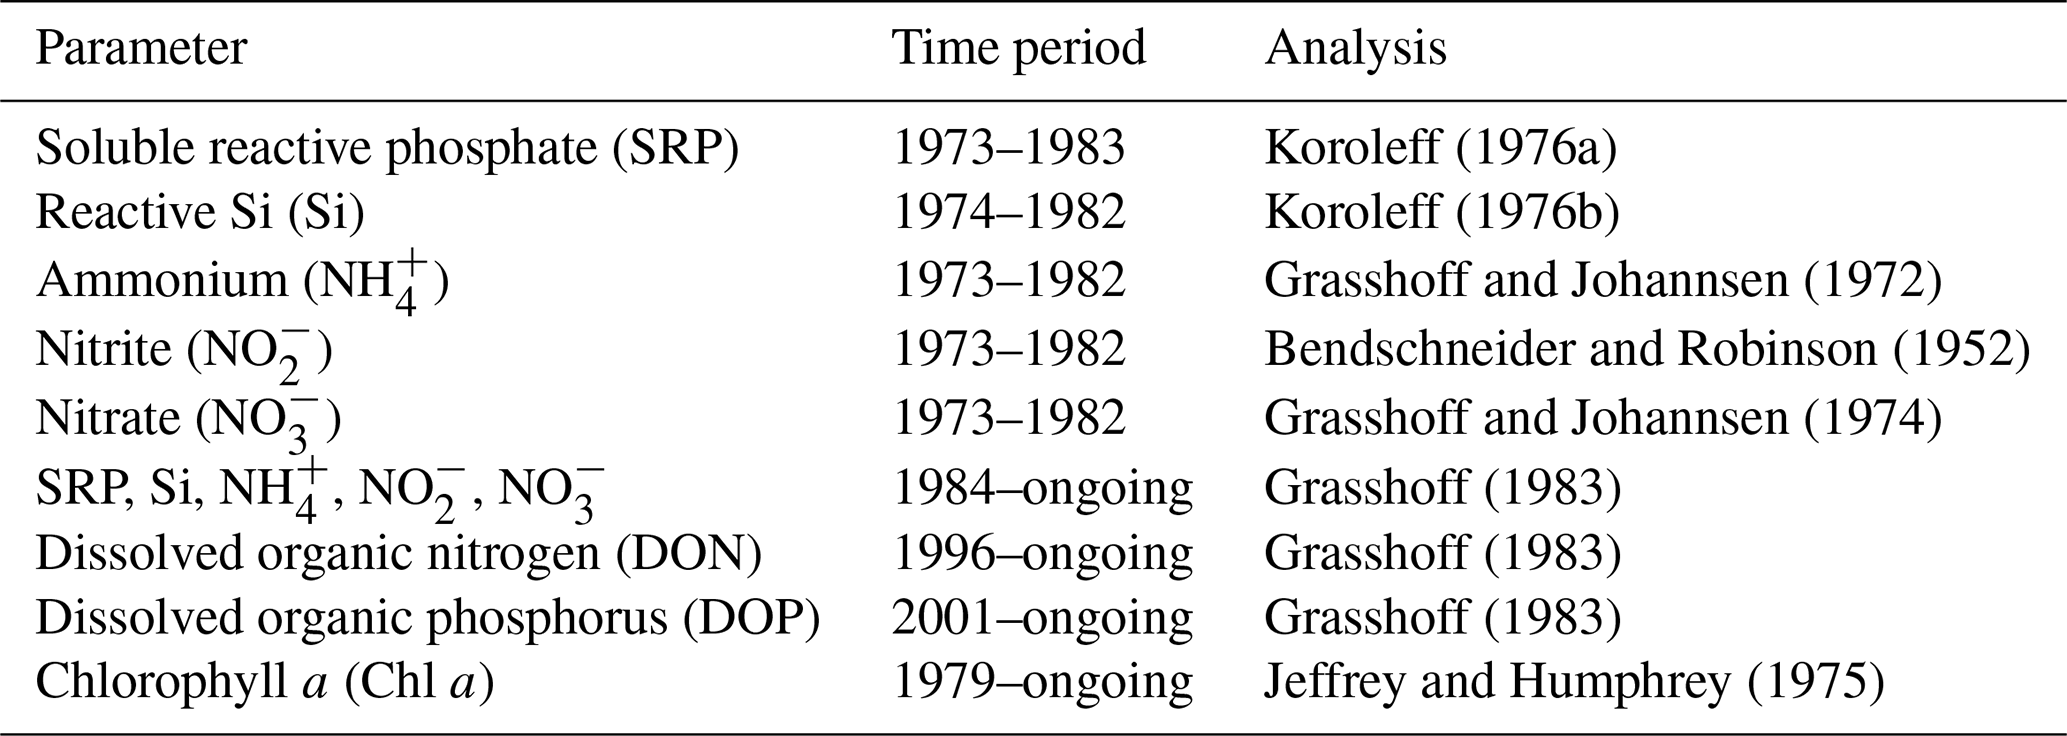
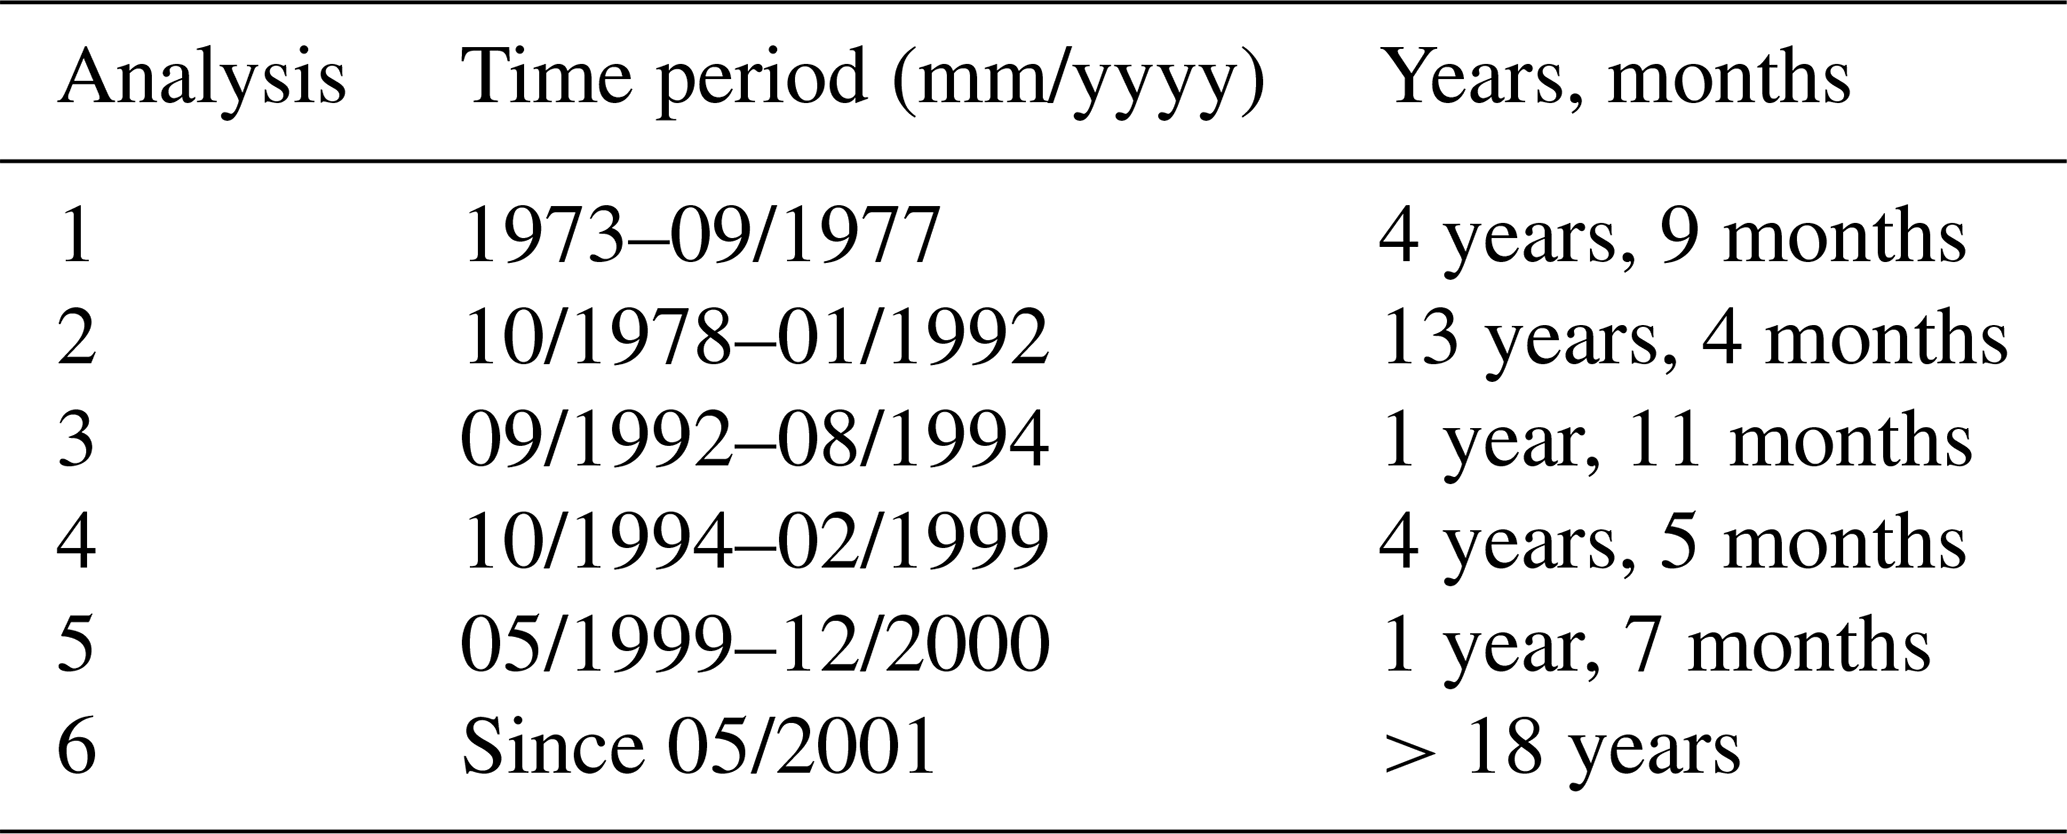
Since the start of the Sylt Roads time series, six analysts have been engaged in the hydrochemical analyses (Table 3).
Table 3Analyses within the Sylt Roads hydrochemistry time series.
Sampling was mostly conducted from small research vessels (RV Mya until 2012 and RV Mya II since 2013), or sometimes, in severe weather conditions, it was land based at the List ferry terminal. Figure 1 provides an overview of the geographical position of the main sampling locations in the Sylt–Rømø bight (SRB).
Statistical analyses were performed using the Analyse-it tool for Microsoft Excel 6.15 (build 8265.19231). For the correlation and principal component analyses (PCAs), seasonal averages (3-month means; winter is December–February) were calculated for each parameter. Prior to PCAs, these data were standardized so that each variable had a variance of 1.
4.1 General description of the basic data
Ship-based sampling was carried out with the research vessels Mya (until 2013) and Mya II (2014–ongoing). The Lister Ley station (LL) and the Königshafen station (KH) were visited most frequently, while stations List 2 and 3 (L2 and L3) were sampled only during the early periods (1973–1976 and 1987–1991) of the time series. Since 1999, the List ferry terminal station (FT) has been used as a backup when ship-based sampling was not possible due to adverse weather conditions. Until 20 December 2019, 43 712 data (SST, salinity, pH, nutrients, chlorophyll, and SPM) were collected during 5133 RV Mya and Mya II samplings and 150 land-based campaigns at the List ferry terminal. Figure 2 provides an overview of the seasonal sampling efforts summarized for all stations. Generally, the number of samples per season varied during the first part of the time series; since 1999, the seasonal sampling has been more homogenous. The inserted box plots compare the earlier with the more recent parts of the time series. For winter and summer sampling, significant differences in sampling effort are obvious (Fig. 2; Table A1).
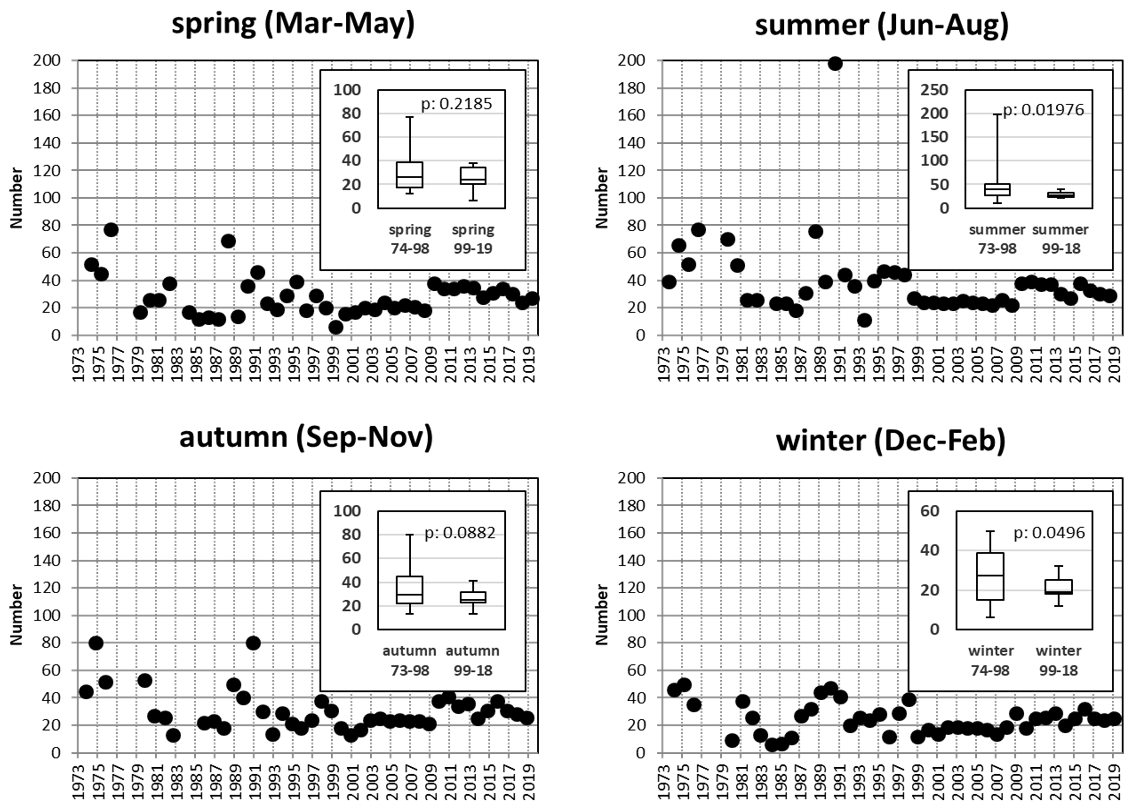
Figure 2Seasonal sampling efforts summarized for all Sylt Roads stations in the SRB (1973–2019). The inserts compare the seasonal efforts from the early days (1973/1974–1998) with the most recent part (1999–2019) of the time series.
Most of the measured parameters are shown as original data in Fig. 3a–j. Due to the physical proximity of stations and the extremely well-mixed waters in the SRB, data from all sampling stations (Fig. 1) were included in the graphs. Most of the parameters, even salinity (Fig. 3a), show seasonal signals.

Figure 3Data of the five sampling stations at Sylt Roads (Fig. 1) are included in all subgraphs of Fig. 3. (a) Salinity time series at Sylt Roads. (b) Sea surface temperature (SST). (c) Ammonium time series; data from 1973–1978 and 1993–1994 were biased and are not shown in the graph. (d) Nitrite time series. (e) Nitrate time series. (f) Phosphate time series. (g) Silicate time series. (h) Development of chlorophyll a concentration at Sylt Roads. (i) pH development; data from before 1984 and from 1992 were biased and are not included in the graph. (j) Suspended particulate matter (SPM) concentrations at Sylt Roads. No data are shown for the period of biased handling (1993–1998).
For salinity, this is mainly triggered by the enhanced freshwater runoff in late winter and spring. Seasonal patterns are most evident for the SST (Fig. 3b), the associated oxygen content of the waters (data not shown) and for the major inorganic nutrients such as NH, NO, NO, SRP, and reactive silicate (Fig. 3c–g). Not too much should be read into the nutrient data from earlier years, since some (e.g., NH and SRP) show quite high variability or exceptionally low values (Si, NO), especially in the initial period (1973–1975). From 1992 to 1994, all NH numbers were also exceptionally low, which coincided with a specific analyst (Table 3) and are obviously erroneous. All questionable values were eliminated from the graph (Fig. 3c).
Dissolved inorganic nutrients display an opposite behavior compared to the SST, with high values in winter/early spring and minimal numbers during summer. As expected, chlorophyll a, pH (Fig. 3h, i), and dissolved organic nutrients (data not shown) are inversely related to levels of inorganic nutrients due to the nutrient uptake by the phytoplankton.
Table 4Pearson's r values (a) from a correlation analysis of Sylt Roads LTER physical and hydrochemical parameters based on seasonal averages (1984–2019). Values >0.4 and are in bold. (b) Variance and (cumulative) proportion of principal components. Physical and hydrochemical parameters in the Sylt Roads LTER time series, with seasonal averages (1984–2019).
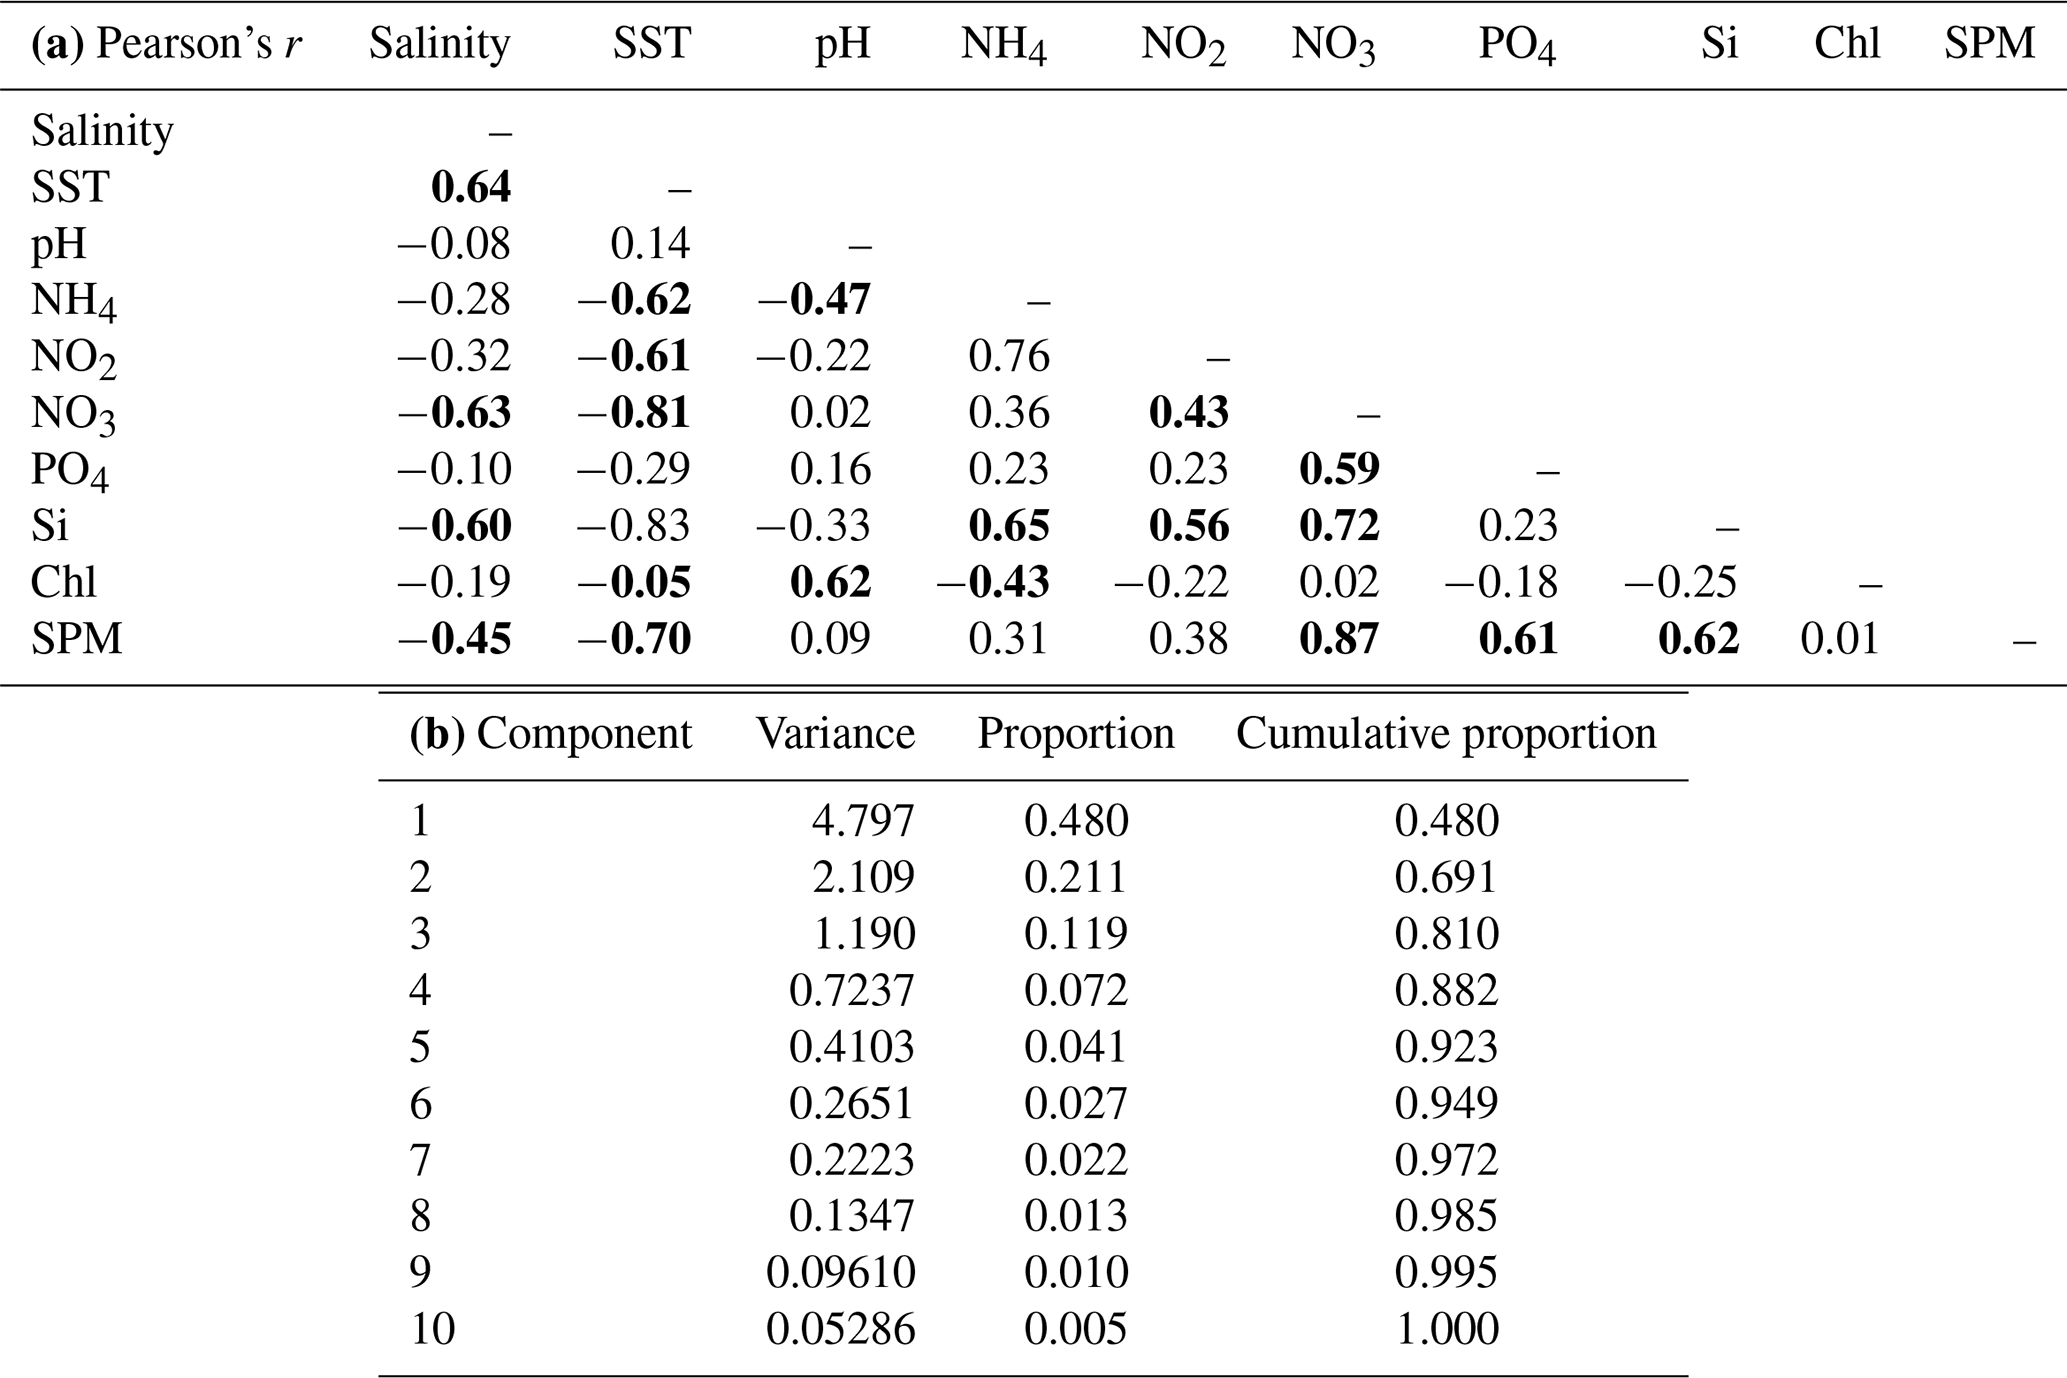
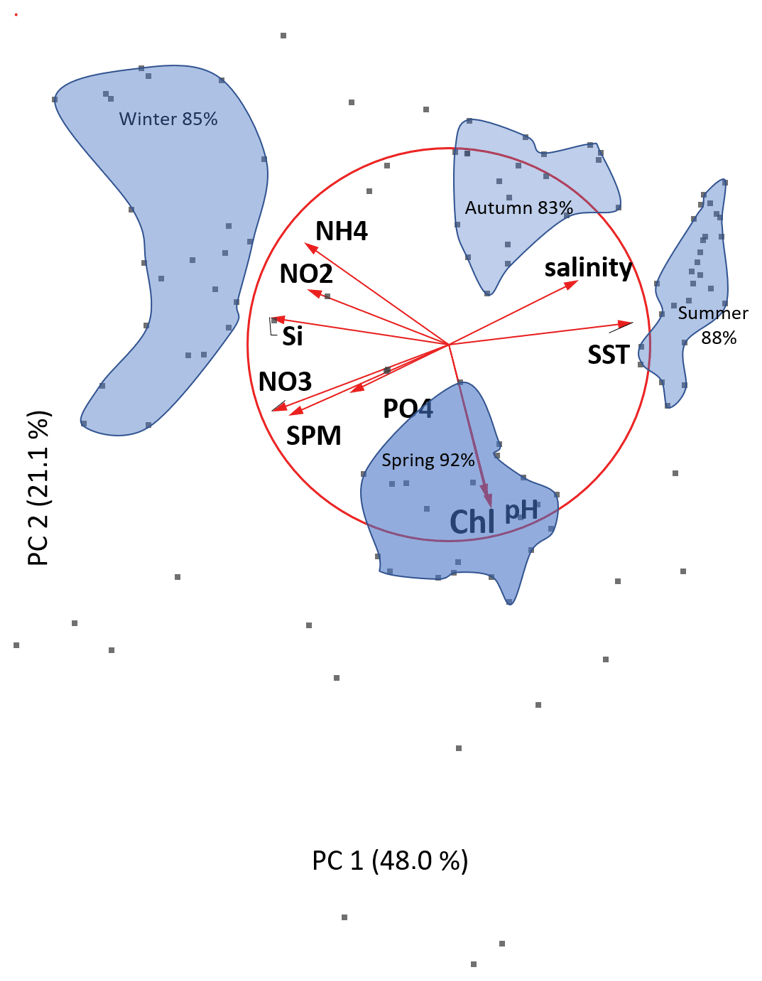
Figure 4PCA correlation monoplot of the first two principal components. Sylt Roads LTER time series with physical and hydrochemical parameters and seasonal averages are shown. Areas covering >83 % of the data points are displayed for each season.
High SPM is mostly found in winter due to the large amounts of sediment mixed into the water column by wind forcing (Fig. 3j; Bayerl et al., 1998). In summer, SPM decreases to minimum values. A deviation from this pattern was seen in the period from 1993–1997, which is likely due to inaccurate sample treatment: following the filtration process, the sea salt retained by the filter material is normally leached out using distilled water. When the salt is not completely removed in this process, the measured SPM load will be biased. This was probably the case for the 1993–1998 SPM measurements, and the respective data should not be used and, consequently, have been omitted from the graph.
The nutrient plots (e.g., Fig. 3e, f) indicate a change in the eutrophication status of the bight. Until 1998, nitrate and SRP concentrations were high; since 1999, they have been decreasing. This is in line with several observations from the southern North Sea area and mainly due to strong reductions in phosphorus and nitrogen loads in the rivers Rhine, Ems, Weser, and Elbe (e.g., Carstensen et al., 2006; van Beusekom et al., 2005, 2017, 2019).
A much higher variability in nutrient values was evident in the high eutrophication period (1973–1998), compared with more recent times (1999–2019) of reduced nutrient loads. This high variability might be partly related to the fact that, until 1998, only unfiltered nutrient samples were analyzed; from 1999 on, the samples were finally filtered (van Beusekom et al., 2009). The early eutrophication period was additionally characterized by intense marine or inshore construction and dredging activities. Sediments originating from the Sylt–Rømø bight were intensively used for dike building (e.g., the polders Margarethenkoog and Rickelsbüller Koog), the Hoyer lock was constructed, the Ruttebüll Lake dredged out, and the river Vidå renatured. All these activities certainly have influenced, e.g., the loads of SRP and contributed potentially to the high variability in nutrient concentrations. An intense blue mussel fishery in the early period of the time series, with its associated dredging impact, and the shutdown of the List sewage plant in 2005 might have played an important role in nutrient variability too.
To evaluate more generalized relationships between all the parameters, we calculated seasonal averages (3 months each; winter is December–February) for the years and have performed (1) a correlation analysis and (2) a principal component analysis (PCA) on these data since the start of the continuous sampling in 1984. For the PCA, the data were standardized so that each variable had a variance of 1 (Table 4a, b).
The correlation table (Table 4a) shows the Pearson's r values for all parameters in the correlation analysis. Salinity is highly correlated with SST and negatively correlated to nutrients illustrating the dominance of nutrient-poor open North Sea waters during warmer seasons. All dissolved nutrients and SPM are negatively correlated to salinity and SST, displaying the importance of the elevated freshwater inflow and the higher storm frequency during cold seasons. The primarily river-born components of nitrate and silicate show the most negative correlation to both salinity and SST. Generally, all nutrients are highly correlated to each other. A strong connection between pH and chlorophyll is obvious, underlining the importance of the biogenic decalcification process in aquatic photosynthesis.

Figure 5Development of SRP over the course of continuous measurements (1984–2019) within the Sylt Roads LTER time series. (a) Seasonal averages (December, January, February – winter; March, April, May – spring; June, July, August – summer; September, October, November – autumn) are displayed with standard error of the mean (SEM) as error bars. (b) Seasonal comparison of SRP concentrations (µmol L−1) for high and low eutrophication periods. Box plots give median values, with quartiles 1 and 3 attached as boxes and min and max values shown as endpoints of the error bars. All data, including possible outliers, are shown in the graph. The p values of the respective t tests are given in the upper right.

Figure 6Seasonal comparison (box plots and t test p values) of dissolved inorganic nitrogen (DIN) concentrations (µmol L−1) for high and low eutrophication periods. Detailed information is available in Fig. 5b.
The PCA variance table (Table 4b) shows the amount of variance in the original data described by each principal component. The first three principal components explain more that 80 % of the variance in the data. All results are consistent with those of the correlation analysis. PC1 is mostly determined by SST, Si, NO3, SPM, NH4, and NO2, PC2 by pH and chlorophyll, while PO4 dominates PC3 (Table A2).
A correlation monoplot of the first two principal components representing 69 % of the variability in the data set is shown in Fig. 4. Most parameters are represented very well, with the exception of PO4 (short arrow), which is the most dominant feature in the third component (see Table A2). The small angle between the salinity and SST vectors shows their close correlation. NO3, SPM, and (PO4) display a complete negative correlation with salinity. All nutrients are strongly negatively correlated with SST, with the highest numbers for Si and NO3. The close similarity of the chlorophyll and pH vectors again shows the strong influence of the photosynthesis on the pH. Both parameters do not have any correlation to either salinity and SST or SPM, PO4, and NO3, while they are slightly negatively correlated to Si, NO2, and NH4.
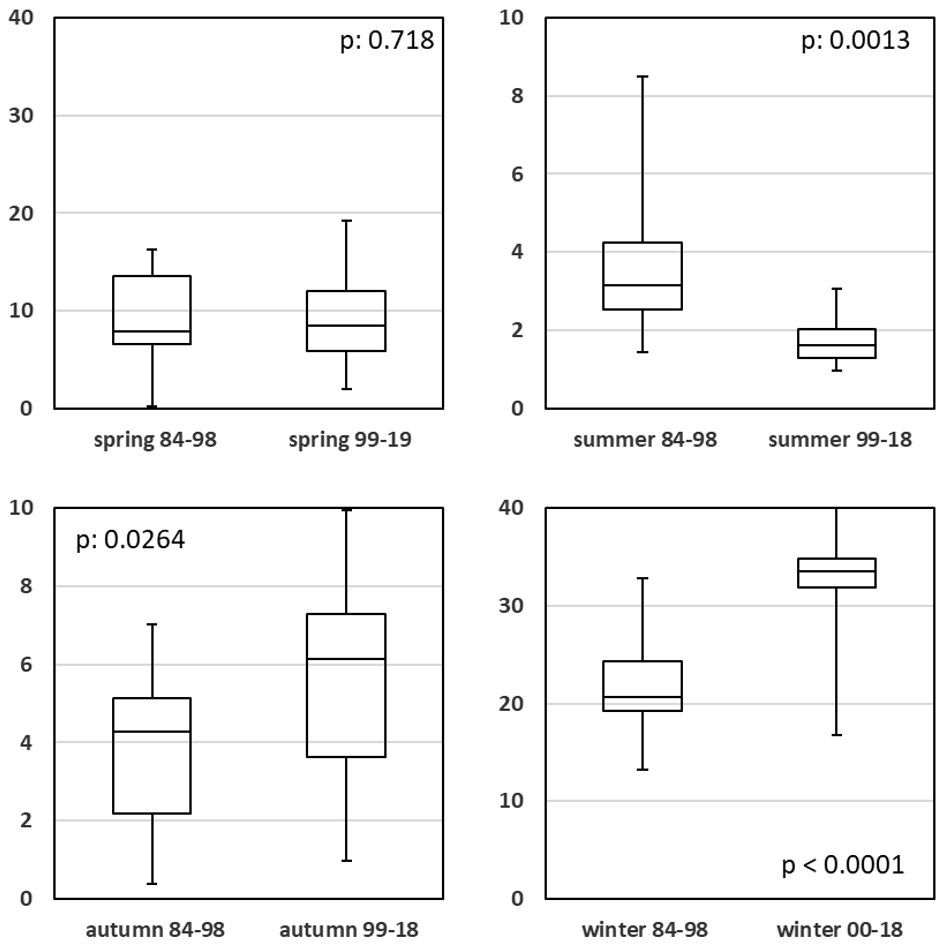
Figure 7Seasonal comparison of reactive silicate concentrations (µmol L−1) for high and low eutrophication periods.
Additionally, point areas representing data for the seasons are shown. The provided percentages describe the amount of the seasonal data within the respective area. Summer seasons are characterized by high temperature and SST combined with low nutrient and SPM values. The opposite is the case for winter seasons. Spring seasons show chlorophyll and pH as major factors, highlighting the importance of the phytoplankton spring bloom in the SRB. Autumn is characterized by medium salinity and SST levels. Additionally, the intermediate nitrogen components NH4 and NO2 are the most important in autumn, which points to an increased relevance of remineralization processes during this season.
4.2 Nutrients, chlorophyll a, nutrient ratios, and SPM
Since most of the parameters show seasonal signals, it was considered to be appropriate to focus on changes for the four main seasons in the course of the time series. Figure 5a and b give an example for the nutrient SRP. For each year in the time series, seasonal averages are presented together with their respective standard errors. As already seen to some extent in Fig. 3f, a first period (1984–1998) of relatively high values shifts towards a second one (1999–2019) with much lower SRP concentrations. A comparison of both periods using a t test (two-sided and different variances assumed) results in significantly lower (p is 0.0003, i.e., ) and much fewer variable SRP values for all seasons in the period of low eutrophication (1999–2019; Fig. 5b; Table A1a). Dissolved inorganic nitrogen (DIN; i.e., the sum of nitrate, nitrite, and ammonium) shows a similar pattern, although the respective t tests yielded significant differences for spring (p is 0.017) and winter (p is 0.001) seasons only (Fig. 6; Table A1b).
Silicate (Si), a nutrient important for diatoms, shows a completely different pattern (Fig. 7; Table A1c). The more recent (1999–2019) low eutrophication winters and autumns (N and P) showed significantly (p is and 0.026) elevated Si values compared with the respective data of high eutrophication (1973–1998). For the spring comparison, Si values remained in the same range. In summer (p=0.001), the low eutrophication set showed a significantly lower value. Generally, the variability in Si was a lot higher in the period from 1973–1998 compared to 1999–2019 (Fig. 7; Table A1c). Interestingly, the silicate anomaly from 1988 (Raabe and Wiltshire, 2009) shows its imprint (highlighted in Fig. 3g) in the Sylt Roads data too.
Despite these large changes in nutrient concentrations, phytoplankton parameters such as chlorophyll a (Figs. 3h, 8; Table A1i) or phytoplankton carbon (Rick et al., 2017a) did not shift accordingly, as one would probably have expected (e.g., Cadee and Hegeman, 2002).
Planktonic algae are not solely influenced by the total concentrations of single nutrients; rather, the ratios of the nutrients have a decisive influence too (Dugdale, 1967). For most algae, the DINSRP ratio (Fig. 9; Table A1j) is of major importance (Redfield, 1934, 1958), and diatoms are additionally affected by the DINSi (Fig. 10; Table A1k) ratio (Brzezinski, 1985). In Figs. 9 and 10, the optimal nutrient ratios, based on molar concentrations, are highlighted as gray bars.
Generally, the DINSRP ratio, in most cases, is significantly elevated in the low eutrophication period when compared with the high eutrophication period (Fig. 9).
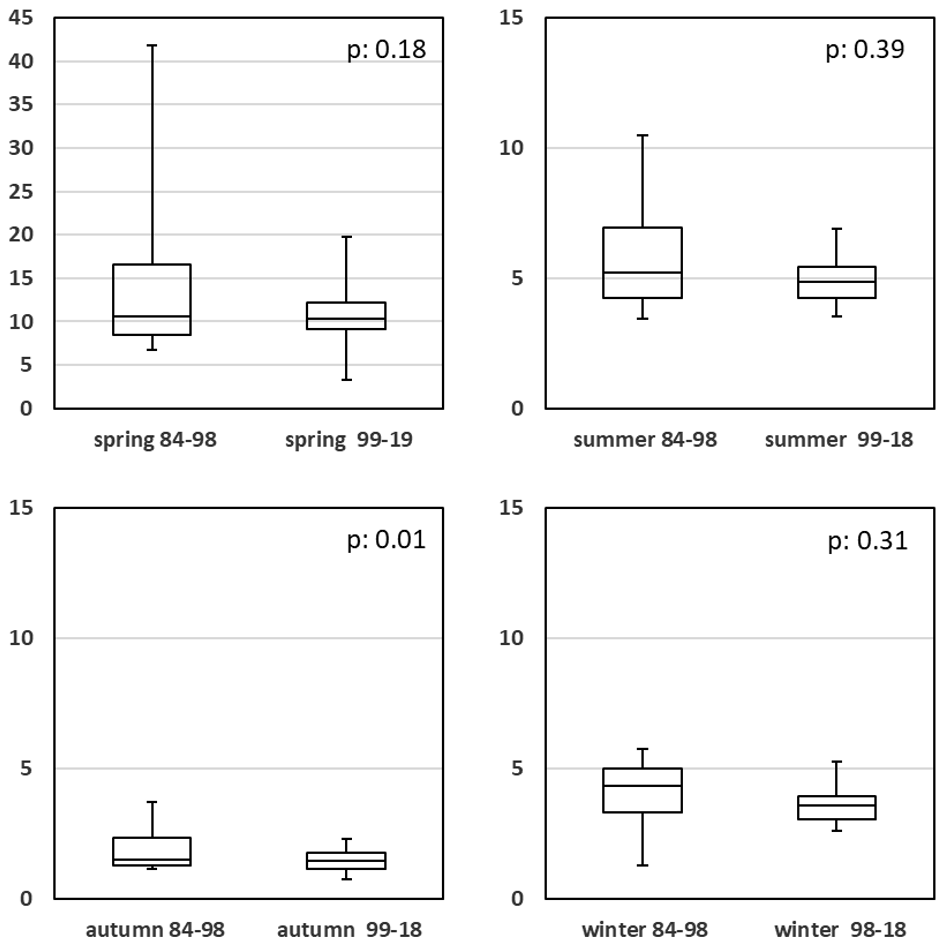
Figure 8Seasonal comparison of chlorophyll a concentration (µg L−1) for high and low eutrophication periods.
For winter and spring, this change moved the ratio towards an increasing phosphorus limitation, while for summer and autumn it diminished the N limitation during the high eutrophication period.
The winter DINSi ratio (Fig. 10; Table A1k) changed significantly (p=0.018), from higher (1984–1998) to more balanced values (1999–2019). For the summer and autumn comparisons, DINSi remained close to a ratio of 1. The comparison for the spring seasons shows no significant change but has been characterized by clearly lowered minimum and maximum DINSRP values in more recent years.
Diatoms are the most prominent phytoplankton group in the bight during all seasons (Rick and Wiltshire, 2016; Rick et al., 2017a, 2018). In addition to diatoms, the prymnesiophyte Phaeocystis globosa Scherffel, 1899 may add substantially to the photosynthetic biomass in late spring and early summer (Rick et al., 2017a). During the period of high phosphorus and nitrogen loads (1984–1998), initial winter silicate (Fig. 9, lower right panel) was probably not available in sufficient amounts, with the result that the diatoms were, at least for the following spring bloom, limited by silicate. Since the decline in SRP and DIN in the second half of the time series (1999–2019), silicate limitation has been replaced by a limitation of phosphorus.
This explains the almost unchanged chlorophyll a pattern, despite the strong nutrient changes (Fig. 8; Table A1i). These results are in accordance with the findings of Loebl et al. (2009), who studied patterns of phytoplankton limitation along the southern North Sea coast for the period 1990 to 2005. The authors concluded that, aside from underwater light, silicate limitation of the phytoplankton was most common, followed by the restraining effects of low phosphorus concentrations.
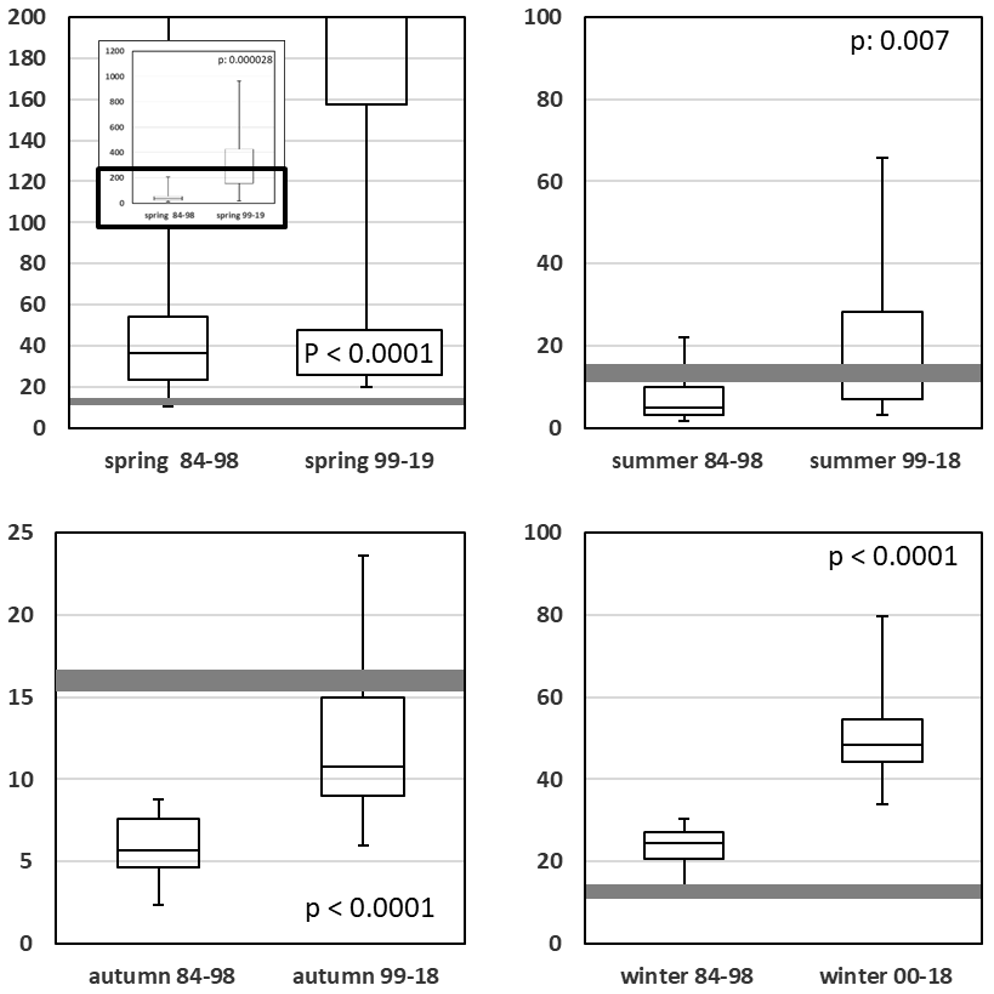
Figure 9Seasonal comparison of DINSRP molar ratios for high and low eutrophication periods. The optimum value around 16 is highlighted as a gray bar. The black box in the spring plot has been magnified.
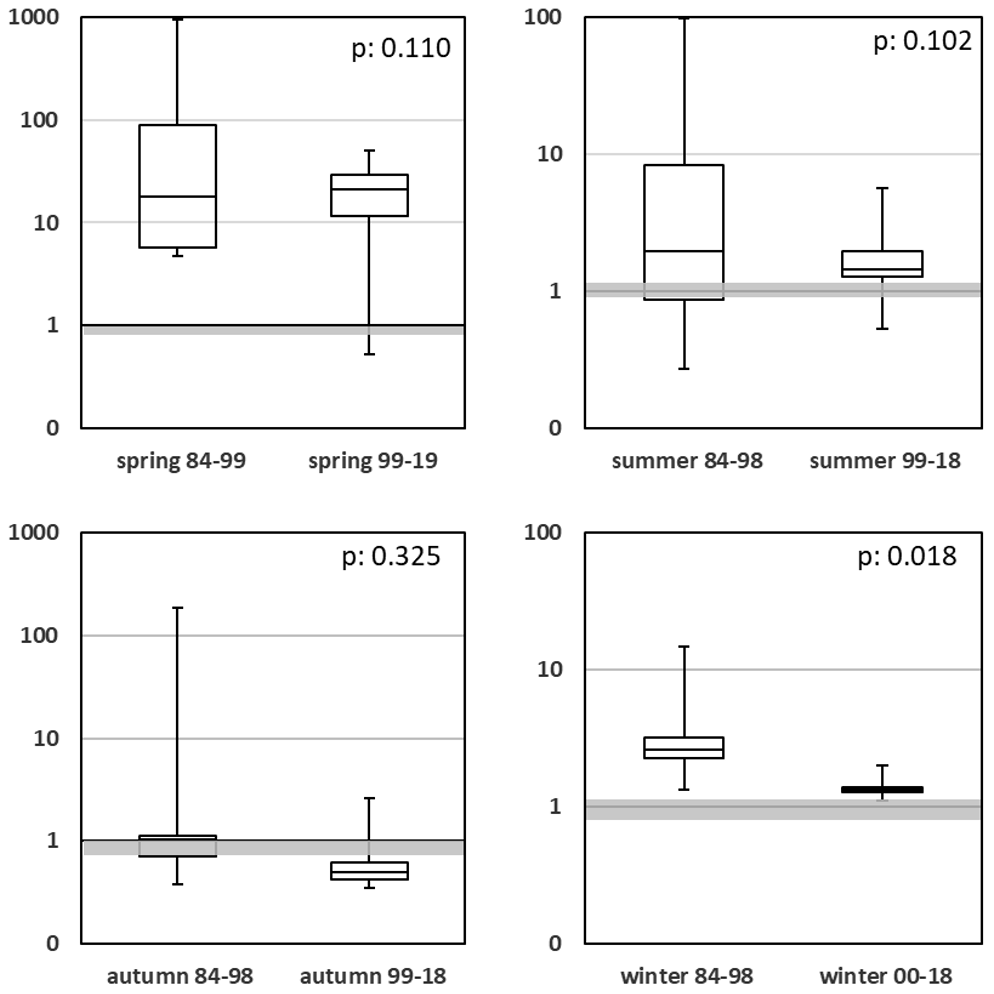
Figure 10Seasonal comparison of DINSi molar ratios for high and low eutrophication periods. The optimum value around 1 is highlighted as a light gray bar. Note the log-scaled y axes.
A comparison of seasonal SPM data for both eutrophication periods is given in Fig. 11 and Table A1h. Despite the omission of the biased values (1993–1997), a t test comparison for all seasons resulted in significantly lower values for the low eutrophication period (1999–2019). This cannot be explained either by lowered plankton biomass (Rick et al., 2017a) or by less sediment input into the water during these years. We assume that a change in the SPM methodology might be the cause. Since 1999, nucleopore filters have been used instead of GF/C filters. Therefore, comparisons of recent and earlier SPM data should be avoided.
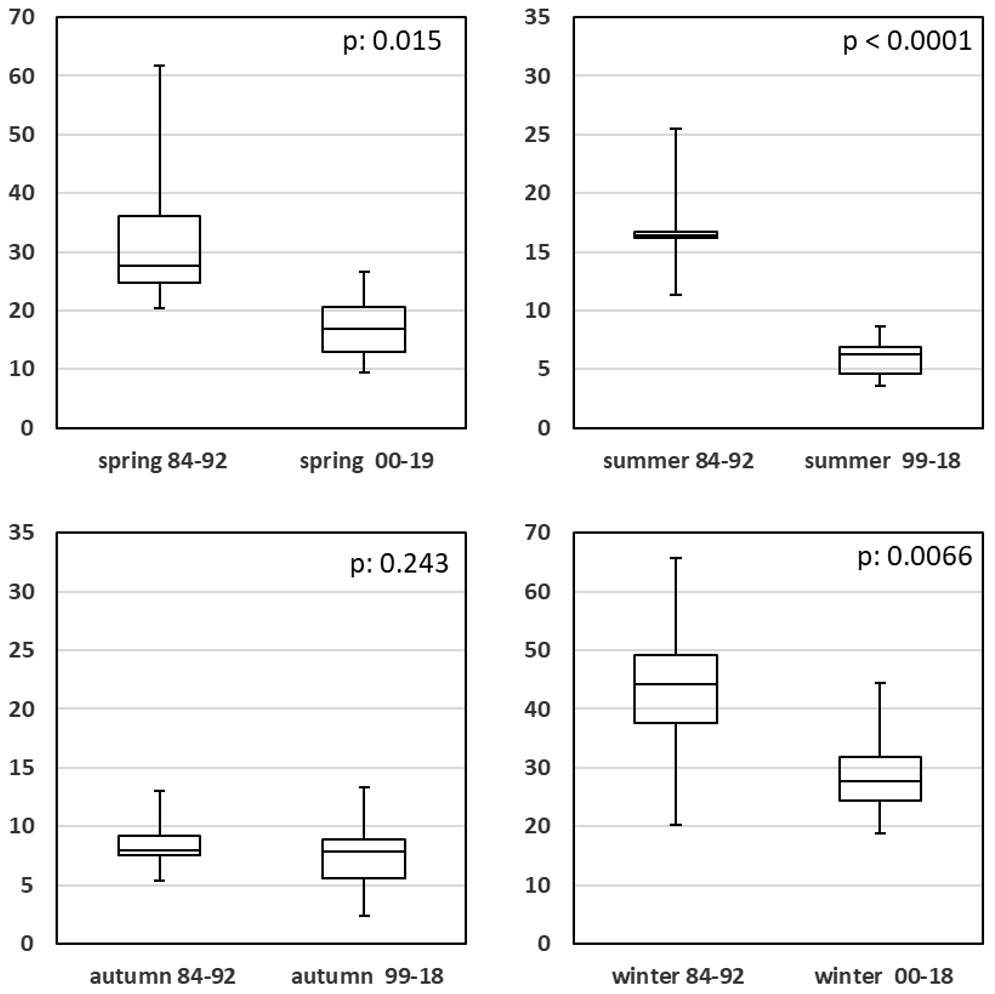
Figure 11Seasonal comparison of SPM values (mg L−1) for high and low eutrophication periods.
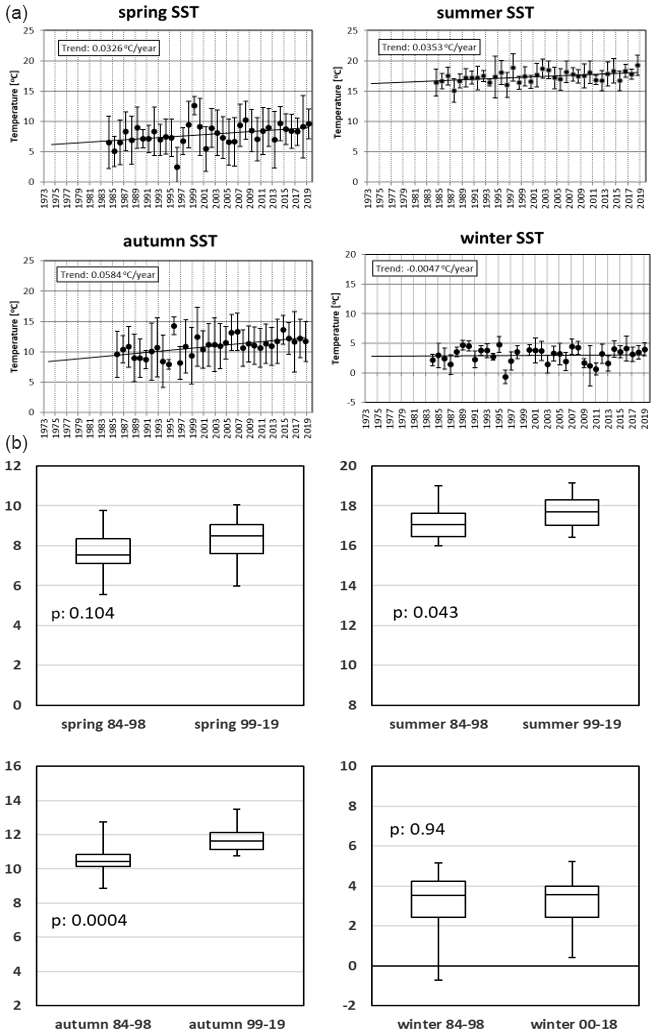
Figure 12Development of SST over the course of the Sylt Roads LTER time series. Seasonal averages are shown, with the standard error of the mean (SEM) given as error bars. Data on linear seasonal trends (1984–2019) are shown in boxes. Panel (b) compares seasonal SST values (∘C) for the early and recent part of the time series.
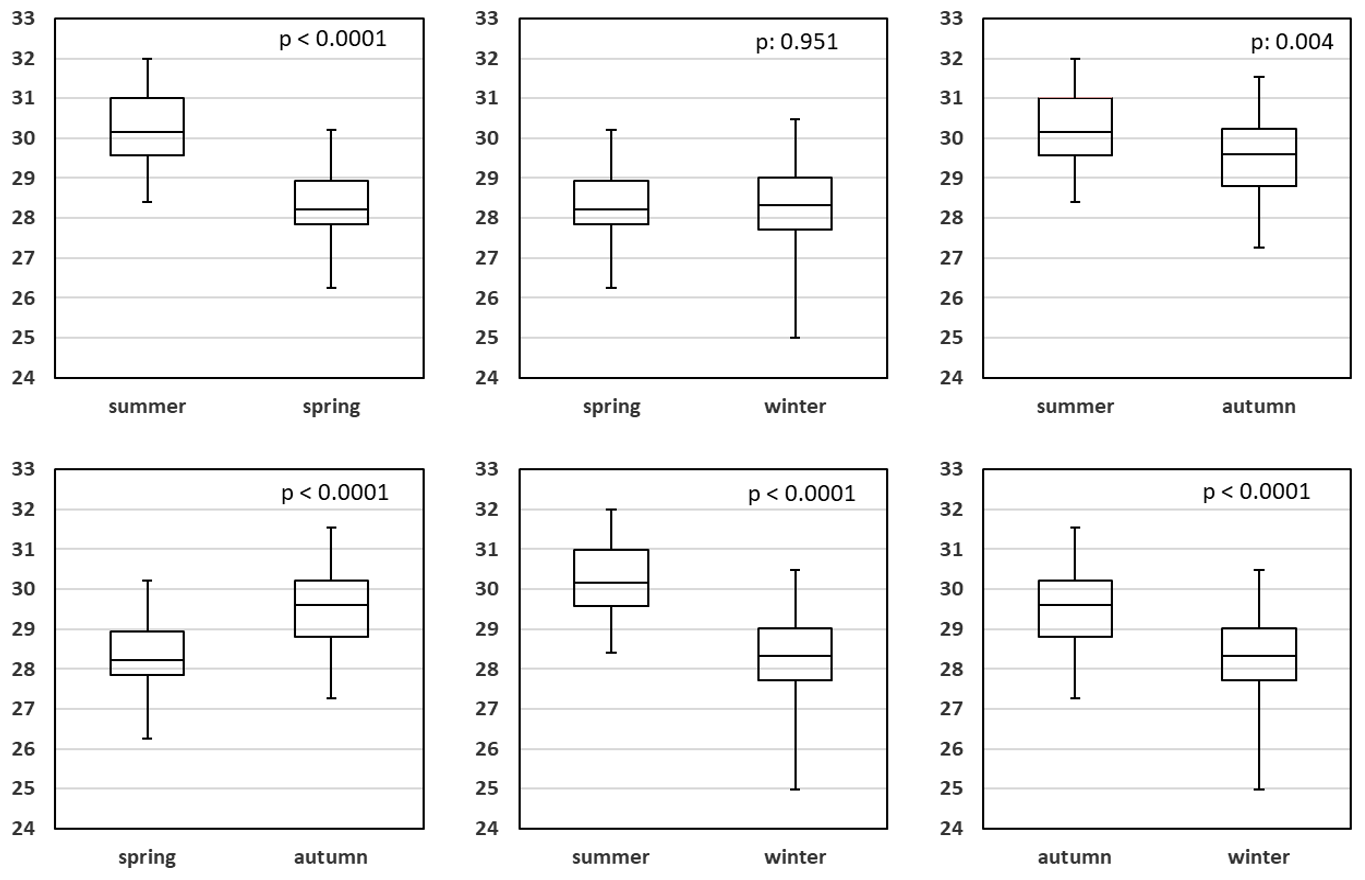
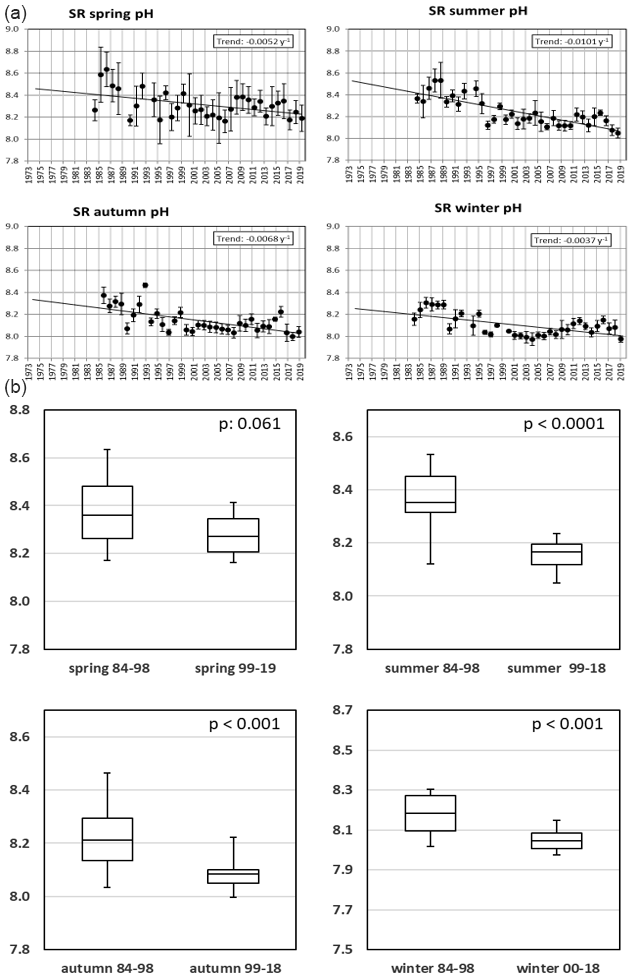
Figure 14(a, b) pH development over the course of the Sylt Roads LTER time series. Seasonal averages are shown, with the standard error of the mean (SEM) given as error bars. Data on linear seasonal trends are shown in the boxes. Panel (b) shows a seasonal comparison of pH values for high and low eutrophication periods.
4.3 Development of sea surface temperature, salinity, and pH
Figure 12a and b describe the temperature development at Sylt Roads. SST has risen since the start of continuous measurements in 1984 until 2019 by 1.11 ∘C, which is close to the temperature development at Heligoland Roads (Wiltshire and Manly, 2004). Summers warmed by 1.24 ∘C, spring seasons by 1.14 ∘C, and autumn seasons by 2.04 ∘C, but winters even cooled slightly by −0.16 ∘C (Fig. 12a). Figure 12b and Table A1d show a t test comparison of identical seasons for the two periods defined in the previous chapter. For all seasons, the period 1999–2019 shows higher average SST values compared with the earlier years of the time series. This finding is significant for summer (p is 0.043) and autumn data (p is 0.0004). Figure 13 and Table A1f give an all-season comparison of salinity values for the entire time series. Generally, the salinities in winter and spring are highly significantly lower compared to summer and autumn. Additionally, the summers show slightly significantly higher salinities compared to autumn data.
This overall picture is explained by the more prominent freshwater impact in winter and spring on the area (Pätsch and Lenhart, 2004; van Beusekom et al., 2017). Comparisons of seasonal salinities for the high and low eutrophication periods yielded no significant differences at all (Table A1e).
On average, the pH has decreased since the start of continuous measurements in 1984 until 2019 by 0.23 units (Fig. 14a, b). This was evident for all seasons, with summer, autumn, and spring showing the most pronounced declines (−0.36, −0.24, and −0.18). A t test comparing pH values from 1984–1998 with values from 1999–2019 yielded significant differences for the winter, summer, and autumn seasons (p<0.001; Fig. 14b; Table A1g). Progressively declining pH levels in coastal regions have been documented elsewhere, e.g., from the USA East Coast (Waldbusser et al., 2011; Wallace et al., 2014).
Table 5Data access table. Descriptions of the data (LR – List Reede or List Roads station; KH – Königshafen station; FT – ferry terminal station) are given, along with the respective DOI and the abbreviation of the data publication used in the text.
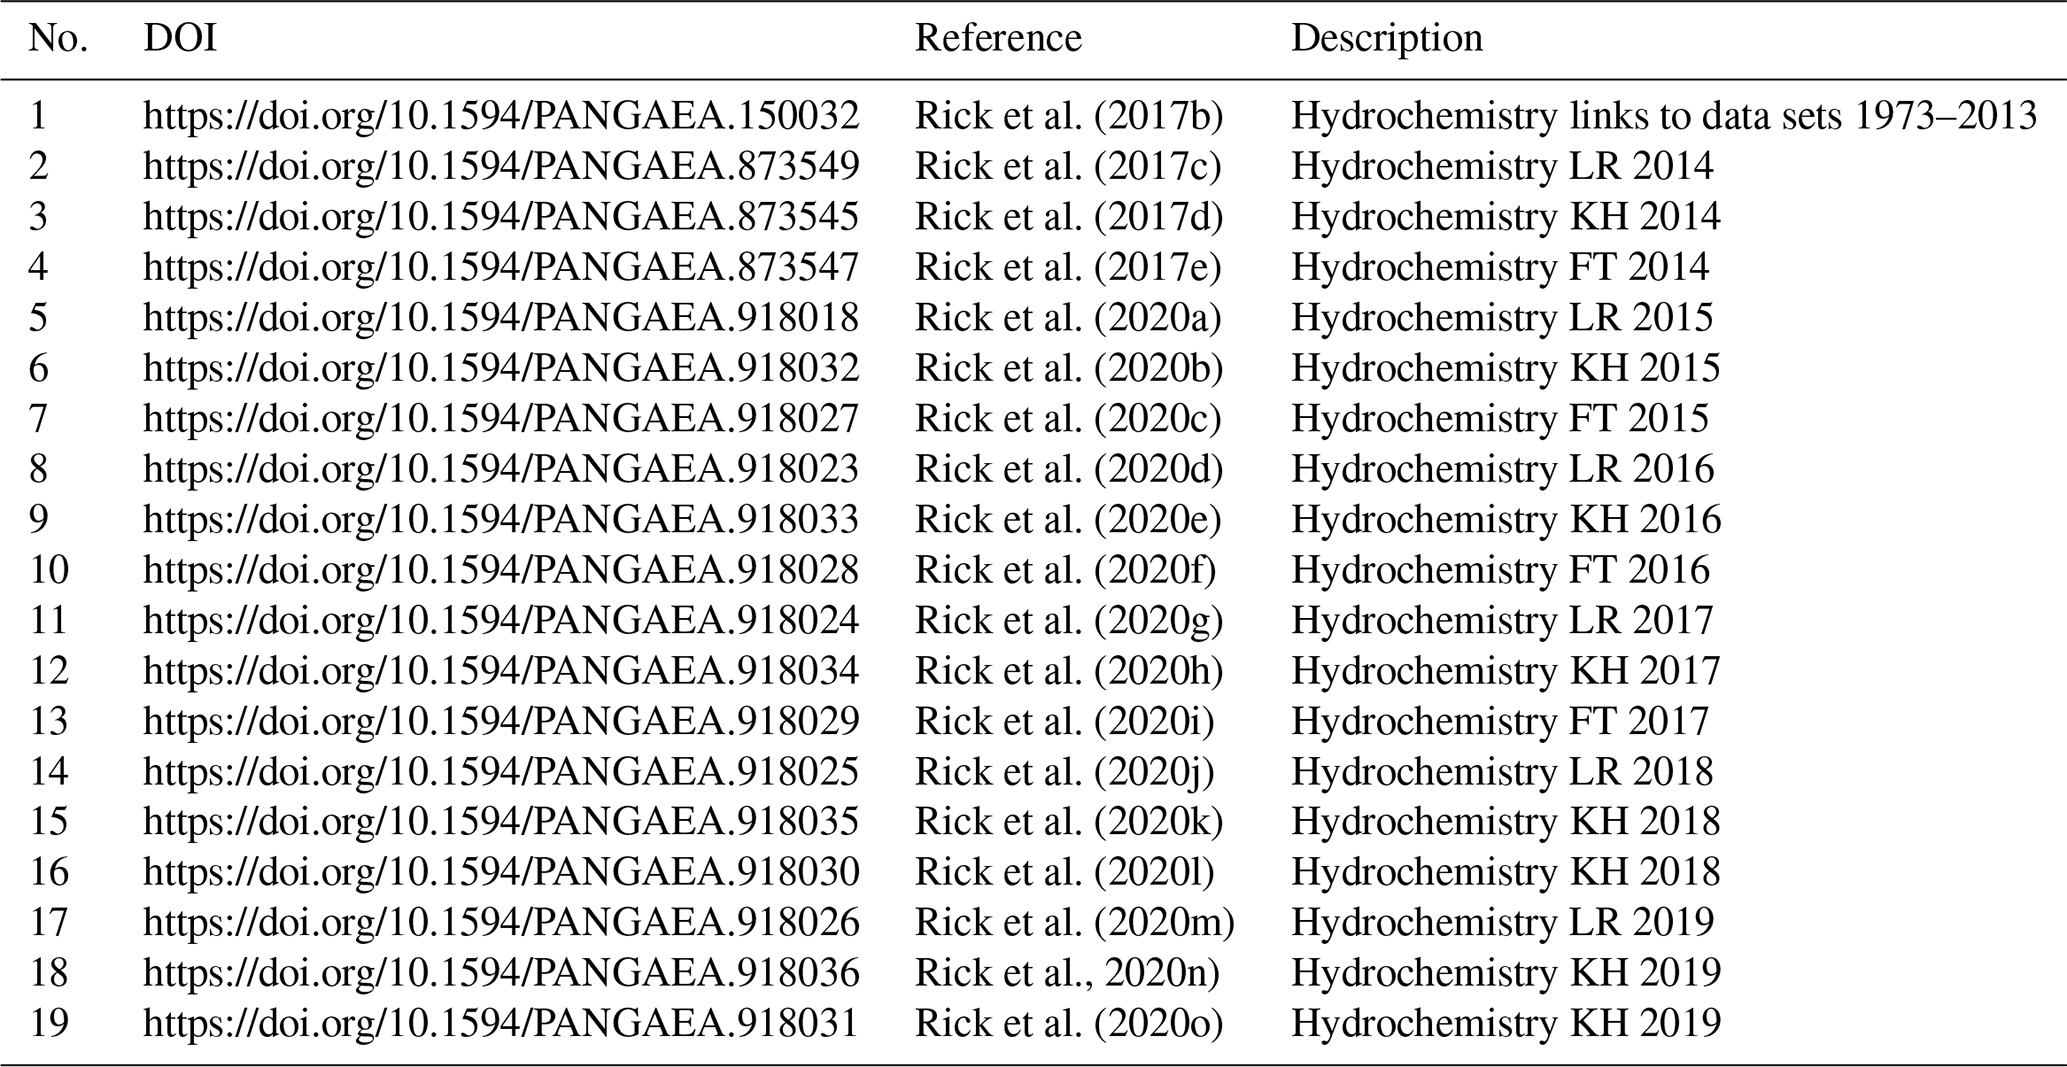
All data sets can be found in Table 5.
Over the years, several data sets closely related to this physical–hydrochemical time series were compiled at the Sylt Marine Observatory.
The Sylt Roads zooplankton time series was initiated by Peter Martens. Quantification of abundant zooplankton (>50 species or groups) occurred weekly from 1979 to 2011. For this time period, all data (32 years) have been stored in the open-access repository PANGAEA (e.g., Martens, 2007, 2012). Due to the retirement of the lead scientist, the series has been on hold since 2012. Zooplankton samples are still taken weekly and stored for further analysis.
The Sylt Roads quantitative microplankton time series was started in June 1992 by Wolfgang Hickel. Mostly on a twice-weekly basis, microplankton abundance and related biomass parameters, such as plankton biovolume and carbon, were recorded. All data until 2013 are compiled in the PANGAEA repository (Rick et al., 2017a).
In 1987, the Sylt Roads semiquantitative microplankton time series was initiated by Gerhard Drebes, Malte Elbrächter, and Hannelore Halliger. Weekly in-depth microscopic and regular electron microscopic analyses of living plankton and fixed samples, respectively, resulted in high-quality data sets (>700 taxa) that have been compiled in PANGAEA until 2020 (Rick et al., 2018; Castillo-Ramírez et al., 2021).
In 1994, the planktonic primary productivity and respiration time series was started by Ragnhild Asmus. Monthly measurements based on the oxygen method (Gaarder and Gran, 1927), using oxygen-sensitive electrodes (WTW OxiCal), were performed in the List–Königshafen area until 2020. All data, including 2014, are archived in PANGAEA (Asmus and Hussel, 2010; Asmus and Asmus, 2016).
The Sylt Roads gelatinous zooplankton time series was also initiated by Ragnhild Asmus. The data have been available on a weekly basis since May 2009 (Asmus et al., 2017a, b).
The Sylt Roads bivalve larvae time series was established in 1996 by Matthias Strasser (Strasser and Günther, 2001). Twice-weekly sampling is ongoing, and the data are currently available via PANGAEA until the year 2014 (e.g., Asmus, 2010, 2016).
The Sylt Roads meroplankton time series was established in 1996 by Ragnhild Asmus. Sampling (twice a week) is ongoing, and the data are available in PANGAEA until the year 2021 (Strasser et al., 2022).
The Sylt Roads fish survey was established in 2007 by Harald Asmus in order to analyze the Wadden Sea fish fauna, with special focus on migration changes, species composition, and feeding habits. Seven stations are sampled monthly inside the bight, while two additional reference stations, one outside the bight and one close to the Danish border, are sampled four times a year. The data from 2007 to 2020 are stored in the PANGAEA repository (Asmus et al., 2020).
Table A1Descriptive statistics related to box plot figures (5, 6–11, 12, 13, and 14), with p values of the associated t tests (two-sided and unequal variances assumed) comparing seasonal data for two time periods within the Sylt Roads LTER characterized by different eutrophication potential (high during 1978–1998; low during 1999–2019; note that the century has been omitted from the range of years given in the table). In case of salinity (part e in the Table), the seasons are compared to each other for the complete series (1973–2019). Q1 is the first quartile, Q3 is the third quartile, SEM is the standard error of the mean, SD is for the standard deviation, H is for highly significantly different, S is for significantly different, M is for marginally significantly different, and N is for not significantly different.
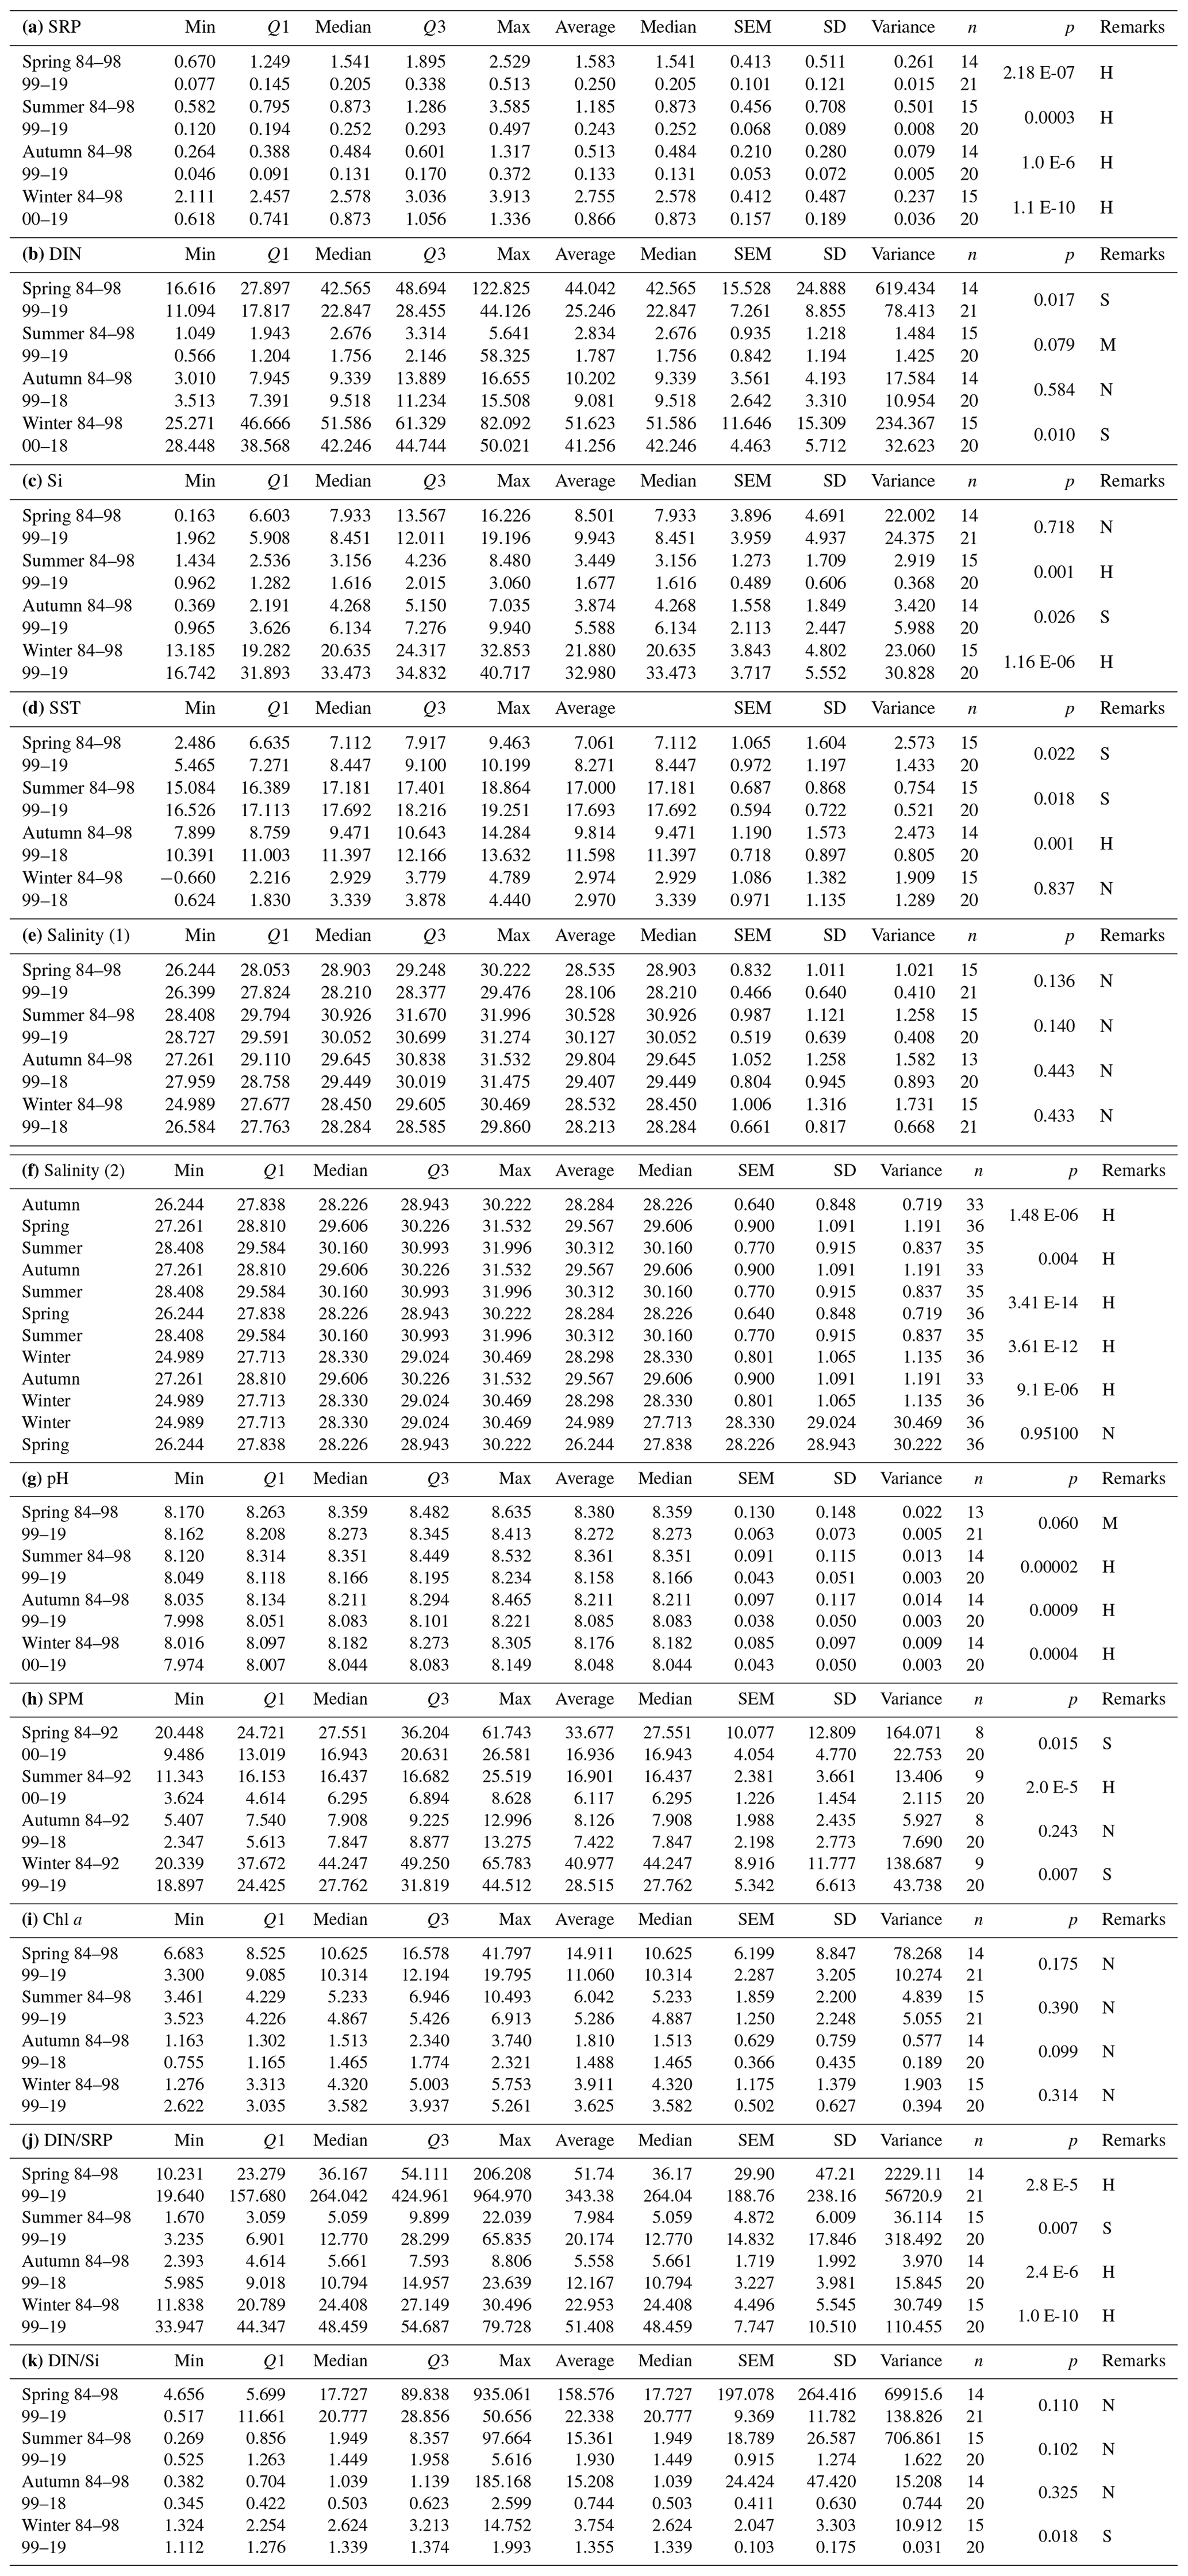
Table A2PCA coefficients of principal components for the tested physical and hydrochemical parameters, Sylt Roads time series, and seasonal averages (1984-2019). Coefficients >0,3 or <-0,3 are shown in bold.

JJR prepared the paper, with the contributions of MS, TR, JEEvB, RA, HA, FM, AK, and KHW. RS compiled the data in PANGAEA. TR has been performing the hydrochemical measurements since 2000.
At least one of the (co-)authors is a member of the editorial board of Earth System Science Data. The peer-review process was guided by an independent editor, and the authors also have no other competing interests to declare.
Publisher's note: Copernicus Publications remains neutral with regard to jurisdictional claims in published maps and institutional affiliations.
We would like to thank all the devoted people who have been supporting the Sylt Roads LTER time series over more than 4 decades. Special thanks go to Ludmila Baumann, Tanja Burgmer, Lydia Canals, Marthe Claußen, Gerhard Drebes, Claus-Dieter Dürselen, Malte Elbrächter, Peter Elvert, Alfonso Lopez Gonzales, Alexandra Halbe, Hannelore Halliger, Wolfgang Hickel, Valentin Hildebrand, Birgit Hussel, Petra Kadel, Alexandra Kraberg, Niels Kruse, Peter Martens, Cornelia Reineke, Karsten Reise, Alfred Resch, Anette Tillmann, and Kay von Böhlen.
This paper was edited by Dirk Fleischer and reviewed by two anonymous referees.
Asmus, H., Hussel, B., Kadel, P., Asmus, R., Rick, J. J., and Wiltshire, K. H.: Fish monitoring in the Sylt Rømø bight (2007 et seq), Alfred- Wegener-Institute – Wadden Sea Station Sylt, PANGAEA [data set], https://doi.pangaea.de/10.1594/PANGAEA.911261, 2020.
Asmus, R.: Bivalvia abundance at List Ferry Terminal, Sylt, Germany, in 1996, Alfred-Wegener-Institute – Wadden Sea Station Sylt, PANGAEA [data set], https://doi.pangaea.de/10.1594/PANGAEA.745178, 2010.
Asmus, R.: Bivalvia abundance at List Ferry Terminal, Sylt, Germany, in 2014, Alfred- Wegener-Institute – Wadden Sea Station Sylt, PANGAEA [data set], https://doi.pangaea.de/10.1594/PANGAEA.859859, 2016.
Asmus, R. and Asmus H.: Phytoplankton primary production at Koenigshafen, List/Sylt, in 2014, Alfred-Wegener-Institute – Wadden Sea Station Sylt, PANGAEA [data set], https://doi.org/10.1594/PANGAEA.860613, 2016.
Asmus, R. and Hussel, B.: Chlorophyll, net oxygen production and respiration rates measured on water bottle samples at List Institute Beach, 1994–2007, Alfred- Wegener-Institute – Wadden Sea Station Sylt, PANGAEA [data set], https://doi.org/10.1594/PANGAEA.753577, 2010.
Asmus, R., Hussel, B., Asmus, H., Rick, J. J., and Wiltshire, K. H.: Gelatinous zooplankton abundance at Sylt Roads – Wadden Sea off List, Sylt, North Sea in 2009, Alfred-Wegener-Institute – Wadden Sea Station Sylt, PANGAEA [data set], https://doi.org/10.1594/PANGAEA.880599, 2017a.
Asmus, R., Hussel, B., Asmus, H., Rick, J. J., and Wiltshire K. H.: Gelatinous zooplankton abundance at Sylt Roads – Wadden Sea off List, Sylt, North Sea in 2016, Alfred-Wegener-Institute – Wadden Sea Station Sylt, PANGAEA [data set], https://doi.org/10.1594/PANGAEA.880606, 2017b.
Bayerl, K., Austen, I., Köster, R., Pejrup, M., and Witte, G.: Sediment dynamics in the List tidal basin, in: Ökosystem Wattenmeer – Austausch-, Transport- und Stoffumwandlungsprozesse, edited by: Gätje, C. and Reise, K., Springer Verlag Berlin Heidelberg, 127–159, https://doi.org/10.1007/978-3-642-58751-1, 1998.
Bendschneider, K. and Robinson, R. J.: A new spectrophotometric method for the determination of nitrite in sea water, J. Mar. Res., 11, 87–96, 1952.
Brown, N. L. and Hamon, B. V.: An inductive salinometer, Deep-Sea Res., 8, 65–75, 1961.
Brzezinski, M. A.: The Si:C:N ratio of marine diatoms: interspecific variability and the effect of some environmental variables, J. Phycol., 21, 347–357, 1985.
Cadee, C. C. and Hegeman, J.: Phytoplankton in the Marsdiep at the end of the 20th century: 30 years monitoring biomass, primary production and Phaeocystis blooms, J. Sea. Res., 48, 97–110, 2002.
Carstensen, J., Conley, D. J., Andersen, J. H., and Aertebjerk, G.: Coastal eutrophication and trend reversal; a Danish case study, Limnol. Oceanogr., 51, 398–408, 2006.
Castillo-Ramírez, A. Claussen, M., Rick, J. J., Elbrächter, M., and Wiltshire, K. H.: Semi-quantitative microplankton analysis (Sylt Roads Time Series) – Wadden Sea off List, Sylt, North Sea in 2020, PANGAEA [data set], https://doi.org/10.1594/PANGAEA.937748, 2021.
Culberson, C. H., Knapp, G., Stalcup, M. C., Williams, R. T., and Zemlyak, F.: A comparison of methods for the determination of dissolved oxygen in seawater, WHPO Publication, 9, https://doi.org/10.1575/1912/243, 1991.
Dugdale, R. C.: Nutrient limitation in the sea: dynamics, identification, and significance, Limnol. Oceanogr., 12, 685–695, 1967.
Gaarder, T. and Gran, H. H.: Investigations of the production of plankton in the Oslo Fjord. Rapports et procès-verbaux des réunions/Conseil international pour l'exploration de la mer, 42, 1–48, 1927.
Gätje, C. and Reise, K.: Ökosystem Wattenmeer: Austausch-, Transport-, und Stoffumwandlungsprozesse, edited by: Gätje, C. and Reise, K., Springer, https://epic.awi.de/899 (last access: 2 March 2023), 1998.
Grasshoff, K.: Determination of nitrate, in: Methods of Seawater Analysis, edited by: Grasshoff, K., Ehrhardt, M., and Kremling, K., Weinheim: Verlag Chemie, 143, 1983.
Grasshoff, K. and Johannsen, H.: A new sensitive and direct method of the automatic determination of ammonia in seawater, J. Cons. Int. Explor. Mer., 34, 516–521, 1972.
Grasshoff, K. and Johannsen, H.: Notes on techniques and methods for sea water analysis, J. Cons. Int. Explor. Mer., 36, 90–92, 1974.
Jeffrey, S. W. and Humphrey, G. F.: New spectrophotometric equations for determining Chlorophylls a, b, c1 and c2 in higher plants, algae and natural phytoplankton, Biochem. Physiol. Pfl., 167, 191–194, 1975.
Kawano, T.: The GO-SHIP Repeat Hydrography Manual: A Collection of Expert Reports and Guidelines. IOCCP Report No. 14, ICPO Publication Series No. 134, Version 1, https://www.go-ship.org/Manual/Kawano_Salinity.pdf (last access: 2 March 2023), 2010.
Koroleff, F.: Determination of nutrients: 1. Phosphorus, in: Methods of seawater analysis, edited by: Grasshoff, K., 117–126, 1976a.
Koroleff, F.: Determination of nutrients: 6. Silicon, in: Methods of seawater analysis, edited by: Grasshoff, K., 149–158, 1976b.
Loebl, M., Colijn, F., van Beusekom, J. E. E., Baretta-Bekker, J. G., Lancelot, C., Philippart, C. J. M., Rousseau, V., and Wiltshire, K. H.: Recent patterns in potential phytoplankton limitation along the Northwest European continental coast, J. Sea Res., 61, 34–43, 2009.
Martens, P.: Abundance of zooplankton at times series station List Reede in 1976, Alfred- Wegener-Institute – Wadden Sea Station Sylt, PANGAEA [data set], https://doi.org/10.1594/PANGAEA.646264, 2007.
Martens, P.: Abundance of zooplankton at times series station List Reede in 2011, Alfred- Wegener-Institute – Wadden Sea Station Sylt, PANGAEA [data set], https://doi.org/10.1594/PANGAEA.774882, 2012.
Pätsch, J. and Lenhart H.-J. (Eds.): Daily Loads of Nutrients, Total Alkalinity, Dissolved Inorganic Carbon and Dissolved Organic Carbon of the European Continental Rivers for the years 1977–2002, Berichte aus dem Zentrum für Meeres- und Klimaforschung. Reihe B: Ozeanographie, 48, 159 pp., 2004.
Raabe, T. and Wiltshire, K. H.: Quality control and analyses of the long-term nutrient data from Helgoland Roads, North Sea, J. Sea Res., 61, 3–16, 2009.
Redfield, A. C.: On the proportions of organic derivations in sea water and their relation to the composition of plankton, in: James Johnstone Memorial Volume, edited by: Daniel, R. J., University Press of Liverpool, 176–192, 1934.
Redfield, A. C.: The biological control of chemical factors in the environment, Sci Prog., 111, 150–170, PMID: 24545739, 1958.
Rick, J. J. and Wiltshire K. H.: Veränderungen des Phytoplanktons in der Nordsee, in: WARNSIGNAL KLIMA: Die Biodiversität Unter Berücksichtigung von Habitatveränderungen, Umweltverschmutzung & Globalisierung Wissenschaftliche Fakten, WARNSIGNALE KLIMA: Die Biodiversität, Hamburg, 8 p., https://www.klima-warnsignale.uni-hamburg.de/wp-content/uploads/pdf/de/biodiversitaet/warnsignal_klima-die_biodiversitaet-kapitel-4_1.pdf (last access: 2 March 2023), 2016.
Rick, J. J., van Beusekom, J., Asmus, R., and Wiltshire, K. H.: Long-term quantitative microplankton analysis at Sylt Roads LTER (1992–2013), Wadden Sea, North Sea, links to datasets, PANGAEA [data set], https://doi.org/10.1594/PANGAEA.150033, 2017a.
Rick, J. J., van Beusekom, J., Romanova, T., and Wiltshire, K. H.: Long-term physical an hydrochemical measurements at Sylt Roads LTER (1973–2013), Wadden Sea, North Sea, links to data sets, PANGAEA [data set], https://doi.org/10.1594/PANGAEA.150032, 2017b.
Rick, J. J., Romanova, T., and Wiltshire, K. H.: Hydrochemistry time series at List Reede, Sylt, Germany, in 2014, Alfred Wegener Institute – Wadden Sea Station Sylt, PANGAEA [data set], https://doi.org/10.1594/PANGAEA.873549, 2017c.
Rick, J. J., Romanova, T., and Wiltshire K. H.: Hydrochemistry time series at List Entrance Koenigshafen, Sylt, Germany, in 2014, Alfred Wegener Institute – Wadden Sea Station Sylt, PANGAEA [data set], https://doi.org/10.1594/PANGAEA.873545, 2017d.
Rick, J. J., Romanova, T., and Wiltshire, K. H.: Hydrochemistry time series at List Ferry Terminal, Sylt, Germany, in 2014, Alfred Wegener Institute – Wadden Sea Station Sylt, PANGAEA [data set], https://doi.org/10.1594/PANGAEA.873547, 2017e.
Rick, J. J., Drebes, G., Elbrächter, M., Halliger, H., van Beusekom, J., and Wiltshire, K. H.: Semi-quantitative microplankton analysis (Sylt Roads Time Series) in the Wadden Sea off List, Sylt, North Sea (1987–2016), Alfred- Wegener-Institute – Wadden Sea Station Sylt, PANGAEA [data set], https://doi.org/10.1594/PANGAEA.886833, 2018.
Rick, J. J., Romanova, T., and Wiltshire, K. H.: Hydrochemistry time series at List Reede, Sylt, Germany, in 2015 (Version 2), Alfred Wegener Institute – Wadden Sea Station Sylt, PANGAEA [data set], https://doi.org/10.1594/PANGAEA.918018, 2020a.
Rick, J. J., Romanova, T., and Wiltshire, K. H.: Hydrochemistry time series at List Entrance Koenigshafen, Sylt, Germany, in 2015 (Version 2), Alfred Wegener Institute – Wadden Sea Station Sylt, PANGAEA [data set], https://doi.org/10.1594/PANGAEA.918032, 2020b.
Rick, J. J., Romanova, T., and Wiltshire, K. H.: Hydrochemistry time series at List Ferry Terminal, Sylt, Germany, in 2015 (Version 2), Alfred Wegener Institute – Wadden Sea Station Sylt, PANGAEA [data set], https://doi.org/10.1594/PANGAEA.918027, 2020c.
Rick, J. J., Romanova, T., and Wiltshire, K. H.: Hydrochemistry time series at List Reede, Sylt, Germany, in 2016 (Version 2), Alfred Wegener Institute – Wadden Sea Station Sylt, PANGAEA [data set], https://doi.org/10.1594/PANGAEA.918023, 2020d.
Rick, J. J., Romanova, T., and Wiltshire K.H.: Hydrochemistry time series at List Entrance Koenigshafen, Sylt, Germany, in 2016 (Version 2), Alfred Wegener Institute – Wadden Sea Station Sylt, PANGAEA [data set], https://doi.org/10.1594/PANGAEA.918033, 2020e.
Rick, J. J., Romanova, T., and Wiltshire, K. H.: Hydrochemistry time series at List Ferry Terminal, Sylt, Germany, in 2016 (Version 2), Alfred Wegener Institute – Wadden Sea Station Sylt, PANGAEA [data set], https://doi.org/10.1594/PANGAEA.918028, 2020f.
Rick, J. J., Romanova, T., and Wiltshire, K. H.: Hydrochemistry time series at List Reede, Sylt, Germany, in 2017, Alfred Wegener Institute – Wadden Sea Station Sylt, PANGAEA [data set], https://doi.org/10.1594/PANGAEA.918024, 2020g.
Rick, J. J., Romanova, T., and Wiltshire, K. H.: Hydrochemistry time series at List Entrance Koenigshafen, Sylt, Germany, in 2017, Alfred Wegener Institute – Wadden Sea Station Sylt, PANGAEA [data set], https://doi.org/10.1594/PANGAEA.918034, 2020h.
Rick, J. J., Romanova, T., and Wiltshire, K. H.: Hydrochemistry time series at List Ferry Terminal, Sylt, Germany, in 2017, Alfred Wegener Institute – Wadden Sea Station Sylt, PANGAEA [data set], https://doi.org/10.1594/PANGAEA.918029, 2020i.
Rick, J. J., Romanova, T., and Wiltshire, K. H.: Hydrochemistry time series at List Reede, Sylt, Germany, in 2018, Alfred Wegener Institute – Wadden Sea Station Sylt, PANGAEA [data set], https://doi.org/10.1594/PANGAEA.918025, 2020j.
Rick, J. J., Romanova, T., and Wiltshire, K. H.: Hydrochemistry time series at List Entrance Koenigshafen, Sylt, Germany, in 2018, Alfred Wegener Institute – Wadden Sea Station Sylt, PANGAEA [data set], https://doi.org/10.1594/PANGAEA.918035, 2020k.
Rick, J. J., Romanova, T., and Wiltshire, K. H.: Hydrochemistry time series at List Ferry Terminal, Sylt, Germany, in 2018. Alfred Wegener Institute – Wadden Sea Station Sylt, PANGAEA [data set], https://doi.org/10.1594/PANGAEA.918030, 2020l.
Rick, J. J., Romanova, T., and Wiltshire, K. H.: Hydrochemistry time series at List Reede, Sylt, Germany, in 2019. Alfred Wegener Institute – Wadden Sea Station Sylt, PANGAEA [data set], https://doi.org/10.1594/PANGAEA.918026, 2020m.
Rick, J. J., Romanova, T., and Wiltshire, K. H.: Hydrochemistry time series at List Entrance Koenigshafen, Sylt, Germany, in 2019, Alfred Wegener Institute – Wadden Sea Station Sylt, PANGAEA, https://doi.org/10.1594/PANGAEA.918036, 2020n.
Rick, J. J., Romanova, T., and Wiltshire, K. H.: Hydrochemistry time series at List Ferry Terminal, Sylt, Germany, in 2019, Alfred Wegener Institute – Wadden Sea Station Sylt, PANGAEA [data set], https://doi.org/10.1594/PANGAEA.918031, 2020o.
Strasser, M. and Günther, C.-P.: Larval supply of predator and prey: temporal mismatch between crabs and bivalves after a severe winter in the Wadden Sea, J. Sea Res., 46, 57–67, 2001.
Strasser, M., Kadel, P., Asmus, R., Rick, J., and Wiltshire, K.: Sylt Roads Meroplankton time series at List, Ferry Terminal station and Station 1, Alfred-Wegener Institut – Wadden Sea Station Sylt, PANGAEA [data set], https://doi.org/10.1594/PANGAEA.946473, 2022.
Thomas, R. W. and Dorey, S. W.: Protected oceanographic reversing thermometer comparison study, Limnol. Oceanogr., 12, 361–362, https://doi.org/10.4319/lo.1967.12.2.0361, 1967.
van Beusekom, J. E. E., Bot, P., Göbel, J. Hanslik, M., Lenhart, H.J., Pätsch, J., Peperzak, L., Petenati, T., and Reise, K.: Eutrophication, in: Wadden Sea Quality Status Report 2004, edited by: Essink, K., Dettmann, C., Farke, H., Laursen, K., Lüerssen, G., Marencic, H., and Wiersinga, W., Wadden Sea Ecosystem No. 19, Trilateral Monitoring and Assessment Group. Common Wadden Sea Secretariat, Wilhemshaven, Germany, 2005.
van Beusekom, J. E. E., Loebl, M., and Martens, P.: Distant riverine nutrient supply and local temperature drive the long-term phytoplankton development in a temperate coastal basin, J. Sea Res., 61, 26–33, 2009.
van Beusekom, J. J. E., Bot, P., Carstensen, J., Grage, A., Lenhart, H.J., Pätsch, J., Petenati, T., and Rick, J.: Eutrophication, in: Wadden Sea Quality Status Report 2017, edited by: Kloepper, S., Baptist, M. J., Bostelmann, A., Busch, J. A., Buschbaum, C., Gutow, L., Janssen, G., Jensen, K., Jørgensen, H. P., de Jong, F., Lüerßen, G., Schwarzer, K., Strempel, R., and Thieltges, D., Common Wadden Sea Secretariat, Wilhelmshaven, Germany, http://qsr.waddensea-worldheritage.org/reports/eutrophication (last access: 2 March 2023), 2017.
van Beusekom, J. E. E., Carstensen, J., Dolch, T., Grage, A., Hofmeister, R., Lenhart, H., Kerimoglu, O., Kolbe, K., Pätsch, J., Rick, J., Rönn, L., and Ruiter, H.: Wadden Sea Eutrophication: Long-Term Trends and Regional Differences, Front. Mar. Sci., 6, 370, https://doi.org/10.3389/fmars.2019.00370, 2019.
Wallace, R. B., Baumann, H., Grear, J. S., Aller, R. C., and Gobler, C. J.: Coastal ocean acidification: The other eutrophication problem, Estuar. Coast. Shelf Scie., 148, 1–13, 2014.
Waldbusser, G. G., Voigt, E. P., Bergschneider, H., Green, M. A., and Newell, R. I. E.: Biocalcification in the eastern oyster (Crassostrea virginica) in relation to longer trends in Chesapeake Bay pH, Estuar. Coast., 34, 221–231, 2011.
Wiltshire, K. H. and Manly B. F. J.: The warming trend at Helgoland Roads, North Sea: phytoplankton response, Helgol., Mar. Res., 58, 269–273, 2004.