the Creative Commons Attribution 4.0 License.
the Creative Commons Attribution 4.0 License.
 | 03 Jan 2023
The World Atlas of Last Interglacial Shorelines (version 1.0)
Deirdre D. Ryan
Matteo Vacchi
Andrea Dutton
Alexander R. Simms
Colin V. Murray-Wallace
This paper presents version 1.0 of the World Atlas of Last Interglacial Shorelines (WALIS), a global database of sea-level proxies and samples dated to marine isotope stage 5 (∼ 80 to 130 ka). The database includes a series of datasets compiled in the framework of a special issue published in this journal (https://essd.copernicus.org/articles/special_issue1055.html, last access: 15 December 2022). This paper collates the individual contributions (archived in a Zenodo community at https://zenodo.org/communities/walis_database/, last access: 15 December 2022) into an open-access, standalone database (Rovere et al., 2022, https://doi.org/10.5281/zenodo.7348242). The release of WALIS 1.0 includes complete documentation and scripts to download, analyze, and visualize the data (https://alerovere.github.io/WALIS/, last access: 15 December 2022). The database contains 4545 sea-level proxies (e.g., marine terraces or fossil beach deposits), 4110 dated samples (e.g., corals dated with U-series), and 280 other time constraints (e.g., biostratigraphic constraints or tephra layers) interconnected with several tables containing accessory data and metadata. By creating a centralized database of sea-level proxy data for the Last Interglacial, the WALIS database will be a valuable resource to the broader paleoclimate community to facilitate data–model integration and intercomparisons, assessments of sea-level reconstructions between different studies and different regions, as well as comparisons between past sea-level history and other paleoclimate proxy data.
- Article
(7429 KB) - Full-text XML
- BibTeX
- EndNote


The survey, interpretation, and dating of sea-level index points is an essential tool to assess long-term relative sea-level (RSL) changes resulting from the interplay between land motion and global mean sea-level changes. Since the end of the 18th century, scientists have systematically observed and measured archeological and geological evidence of RSL changes (Celsius, 1743; Issel, 1883; Forbes, 1829). In the 20th century, the observation of past sea-level changes evolved into a standalone discipline at the crossroads between geomorphology (measurement and interpretation of sea-level proxies, e.g., Shennan, 1982), geochemistry (dating of sea-level proxies, e.g., De Vries and Barendsen, 1954), geophysics (modeling vertical land motions following ice melting, e.g., Peltier, 1974; Farrell and Clark, 1976), and structural geology (understanding the vertical displacement of shoreline features through time, e.g., Chappell et al., 1996).
The growing knowledge on geological sea-level proxies in different regions and the emergence of new and more refined scientific questions on past RSL changes (see overviews by Murray-Wallace and Woodroffe, 2014, and Gehrels and Shennan, 2015) presents a need to standardize how geological sea-level information is both collected and stored. Answers to such need were first introduced in a seminal paper by Shennan (1982) and, only a few years later, were explicit in the volume Sea-level research: A manual for the collection and evaluation of data (Van de Plassche, 1986). After these efforts, approaches to standardize Holocene sea-level proxies were widely accepted by the community working on paleo sea-level changes and have recently been summarized in an update of the 1986 manual (Shennan et al., 2015).
The community working on past RSL changes has often organized itself around projects supported by the IGCP (International Geoscience Programme, formerly International Geological Correlation Programme) or focus groups supported by the International Union for Quaternary Research (INQUA). One such group, the “PALeo constraints on SEA level rise” (PALSEA), founded and currently co-funded by PAGES (Past Global Changes), has contributed to advancing the state of the art on paleo ice sheets and sea levels (Rovere and Dutton, 2021) in the last decade. Results from PALSEA have laid the foundations for improvements in the standardization of paleo sea-level data encouraging the creation of global sea-level databases compiled by experts following standardized approaches (Düsterhus et al., 2016). The first multi-proxy global sea-level database stemming from these efforts compiled published sea-level index points formed after the Last Glacial Maximum (20 ka to present) and presented as part of a special issue in the journal Quaternary Science Reviews (Khan et al., 2019). This standardized compilation of Holocene sea-level proxies includes data reviewed by 30 studies (see Table 1 of Khan et al., 2019). It presents a total of 5290 sea-level indicators distributed across the globe. The structure used by the database was built upon the concepts already explored within a database template that was already widely employed in Holocene sea-level studies (e.g., Engelhart and Horton, 2012), stemming directly from the early efforts of sea-level data standardization by Shennan (1982) and Van de Plassche (1986).
While studies of RSL changes for periods older than the Holocene have a long tradition (De Lamothe, 1911; Issel, 1914; Blanc, 1936), the standardization of reporting for sea-level proxies older than 20 ka into databases has lagged. One significant period of former sea-level changes is the Last Interglacial (MIS 5, ca. 130–80 ka). The warmest peak of this interglacial, MIS 5e (ca. 128–116 ka), is commonly considered a useful (however imperfect) analog for a future warmer climate. During MIS 5e, the Earth was slightly warmer than pre-industrial time (with global mean atmospheric temperatures 1–2 ∘C above pre-industrial, McKay et al., 2011), probably as a consequence of greater insolation at high latitudes. In such a warmer climate, the global mean sea level interpreted from sea-level index points corrected for post-depositional displacement was higher than today. Sea-level estimates for MIS 5e range from 1 to 5 m (Dyer et al., 2021) to 6–9 m higher than today (Dutton and Lambeck, 2012; Dutton et al., 2015). Last Interglacial global mean sea-level estimates have been used as benchmarks for ice models projecting future sea-level changes in the face of global warming (DeConto et al., 2021). Gilford et al. (2020) highlighted that improving field measurements of MIS 5e sea levels might help improve the accuracy of future sea-level projections.
Hundreds of studies since the early 1900s have described the stratigraphy, elevation, and age of Last Interglacial RSL proxies at thousands of locations. The present undertaking within this special issue presents a global database reporting geological sea-level proxies formed during MIS 5. We named the database World Atlas of Last Interglacial Shorelines (WALIS). The name is meant as an homage to the World Atlas of Holocene sea-level changes by Pirazzoli (1991), which was the first attempt at making a global compilation of paleo sea-level data. The database was built by collating the individual contributions in the WALIS special issue (published in this journal) into a unique database (WALIS 1.0, i.e., version 1.0). Here, we describe the database structure and associated tools (e.g., interface for inserting data, analysis, and visualization tools). We also summarize the contents of WALIS 1.0 and the main limitations of the database in its present form.
WALIS is not the first attempt to collect MIS 5 sea-level index points into a coherent database. Databases compiling single studies of MIS 5 sea-level proxies exist for several regions and were built to summarize single studies in regional databases (e.g., Ferranti et al., 2006; Ota and Omura, 1991; Muhs et al., 2003, 2002). These include the work done over several decades in one region, nation, or wide geographic area, often reporting the results of earlier work that are hard to retrieve in digital format. In addition, regional compilations are usually done by geoscientists with direct expertise on at least some of the sites reported, which increases the confidence that the data have been screened and standardized with a certain degree of knowledge of local geological contexts. In the WALIS ESSD special issue, we tried to maintain this advantage by soliciting regional compilations from authors with direct expertise on each area addressed in the database or with expertise with a particular type of indicator (e.g., coral sea-level proxies or speleothems) or dating technique (e.g., U-series).
Within the existing literature, several global databases predate WALIS 1.0. One of the most comprehensive in terms of the sheer number of data points was assembled by Pedoja et al. (2011), later updated by Pedoja et al. (2014). In parallel, the works of Dutton and Lambeck (2012), Medina-Elizalde (2013), and Hibbert et al. (2016) contain global compilations of Quaternary U-series data and associated RSL information. Similarly, scientists working on amino acid racemization dating have worked towards a database of dated samples compiled within a standardized framework (Wehmiller and Pellerito, 2015). Finally, a global compilation of deposits dated with luminescence exists (Lamothe, 2016); however, the published version contains relatively little metadata (e.g., region of occurrence, luminescence method, sedimentary facies, age, and reference).
These databases were used as a starting point for WALIS 1.0. In particular, all the references cited by Pedoja et al. (2014) were initially added to the “References” table and subsequently updated and implemented with new ones by the data compilers working on regional databases within the special issue. Hibbert et al. (2016) were the foundation upon which the U-series coral compilation was done (Chutcharavan and Dutton, 2021a). The global compendium of MIS 5a and MIS 5c data (Thompson and Creveling, 2021b) is based on an expansion of a previous compilation that was included in the form of a table in Creveling et al. (2017). Data from some of the regional databases mentioned above (e.g., Ferranti et al., 2006; Ota and Omura, 1991) have been re-evaluated and inserted into the WALIS structure (Cerrone et al., 2021b; Tam and Yokoyama, 2021), most often cross-checking information with the original studies (when available).
The key difference between previous compilations and WALIS is that the latter is structured as a relational database with links between records in different tables. Previously published databases have, in general, a more straightforward structure than WALIS. For example, the databases of Pedoja et al. (2014) and Ferranti et al. (2006) contain several fields describing sea-level index points, including some columns dedicated to the dating methods used and the associated age(s). However, no detailed information is available on the ages themselves (e.g., the minimum fields considered necessary to describe a U-series age, as discussed in Dutton et al., 2017). In WALIS, such data are presented in a dedicated table and linked to the table containing sea-level information. Conversely, the fields to describe U-series ages are present in the global compilation of coral sea-level index points by Hibbert et al. (2016). Instead, those related to sea-level stratigraphic details are limited. Instead, these fields are in WALIS in the “RSL Stratigraphy” table. As described below, all tables in WALIS are linked with one-to-many or many-to-many relationships.
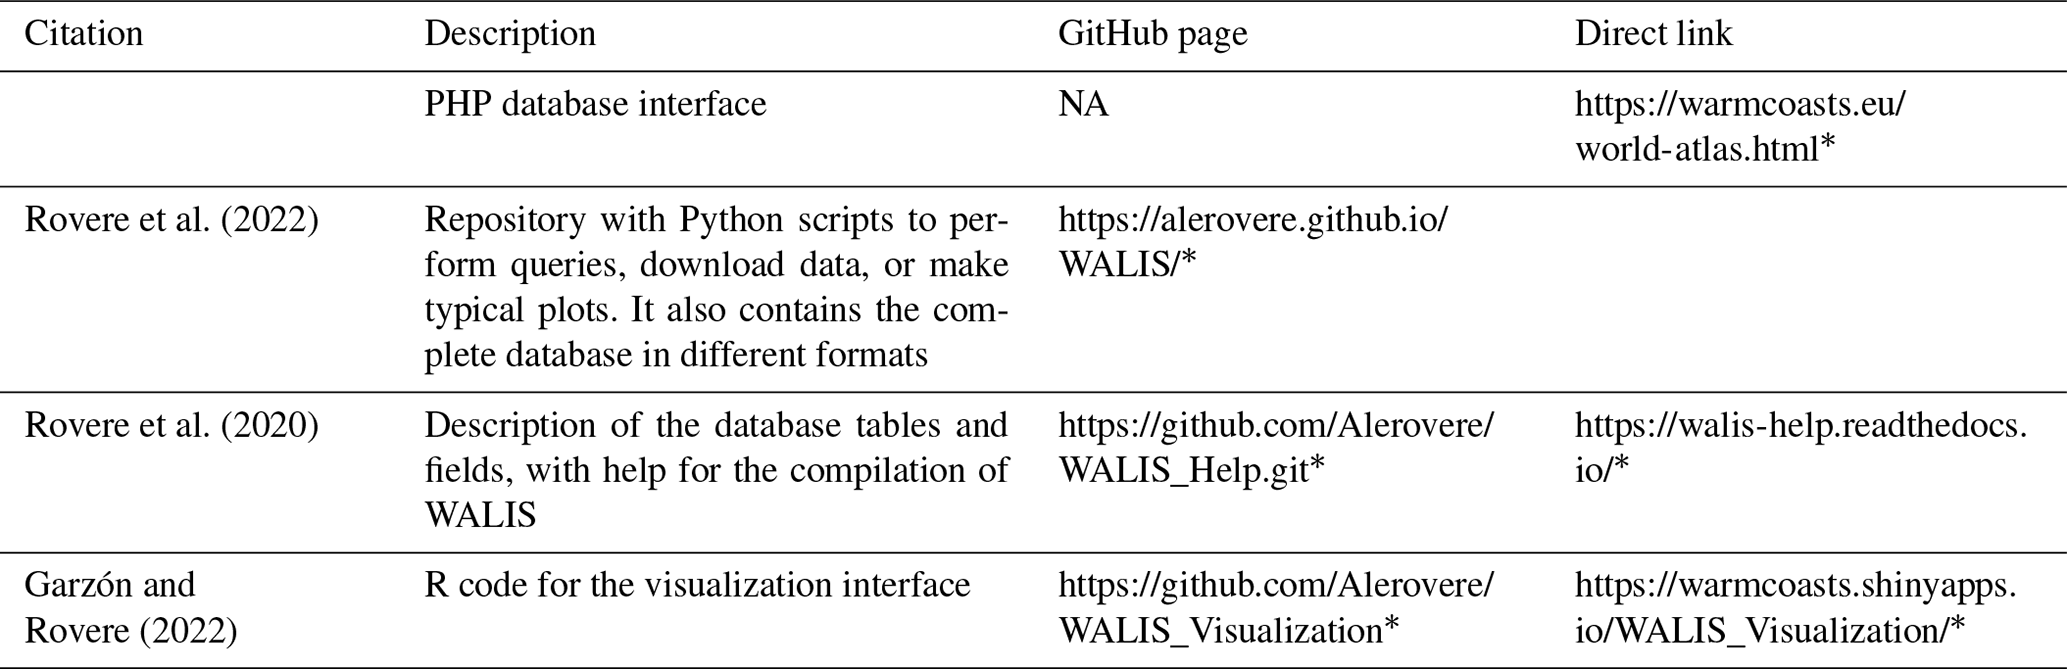
Overall, the WALIS database was built alongside a data platform with the same name. Critical parts of the data platform are two MySQL databases (one private and one public), a PHP (Hypertext Preprocessor) interface, and a series of visualization, data download, and documentation tools (see Fig. 1 for a schematic representation and Table 1 for links to resources). WALIS was structured around the four key types of scientists interacting with a database, described by Düsterhus et al. (2016). Data creators are scientists who produce new data, such as sea-level proxies or radiometric dates, and publish them in research outputs (e.g., peer-reviewed articles or PhD theses). Data compilers review these outputs and include the data in the standardized WALIS format. For WALIS 1.0, data compilers are the authors of review papers included in the ESSD special issue (with a few exceptions discussed in Sect. 4 “Database contents”). In some instances, a data creator may coincide with the data compiler. End users do not contribute data but may query and analyze the database for their research. Database administrators ensure that data entered by data compilers meet the minimum standards and manage the platform's administration, including fixing bugs and updates. For WALIS 1.0, the database administrators are the authors of this paper.
Data compilers can sign up to the interface, which is publicly available and free of charge (Table 1). The data required to sign up are a user-selected username and password (the latter is encrypted in the private database and deleted in the public version), a valid email address, name, surname, institution, and country. The data compiler must accept a privacy policy (that was built with the Privacy Policy Generator of the German Association for Data Protection). Generally, every WALIS table contains a “Public” field of type integer. For every new data point inserted in WALIS, this field is set to “0”, which means that the record is not publicly visible and can only be seen, edited, and deleted by the user who inserted it. Exceptions to this rule are tables containing positioning and elevation measurement methods and bibliographic references (Fig. 2). Data inserted in these tables are immediately public and can be seen by all data compilers (and they can be deleted only by Admin) to ensure that standard metadata (e.g., survey methods) can be used at large and are not duplicated in the database.
All data inserted by a data compiler are embedded within a private MySQL database. This database can be accessed only by the administrators, who periodically revise the non-public records and contact the data compiler to inquire whether it is possible to make them public. Upon agreement, the data compiler is invited to upload their data to the WALIS Community in Zenodo (or any other open-access repository) under a Creative Commons Attribution (CC BY) license. Alternatively, the data compiler is requested to consent to publish the data in WALIS under this license. At this stage, public fields are changed to “1” and can only be edited or deleted by submitting a data modification or deletion request to the database administrators via the database interface so that post-publication changes are tracked in future WALIS versions.
All data where the public field is set to “1” are periodically migrated to the public MySQL database, where a general user is granted “SELECT” rights. End users can download this database or perform SQL queries directly on the public online version (Table 1). For end users familiar with Python, a series of Jupyter notebooks can perform simple database queries (Table 1). These scripts are also available in GitHub, where they can be forked (i.e., copied and modified without affecting the original repository) and commented on by anyone with a GitHub account. For end users who do not wish to use SQL or Python, the database is available for download as a multi-sheet spreadsheet, comma-separated text files, or GeoJson files (Table 1).
A combination of Python and R scripts is then run periodically by the database administrators on the public MySQL database. These scripts summarize the data and compile an R ShinyApp for data visualization and download (Garzón and Rovere, 2022). Database administrators also update the database documentation (Rovere et al., 2020) and a series of video tutorials to guide data compilation. The documentation files are included in a ReadTheDocs website and are available via GitHub. Users may either fork the original documentation (written in markup language) or suggest improvements via the GitHub “issues” function.
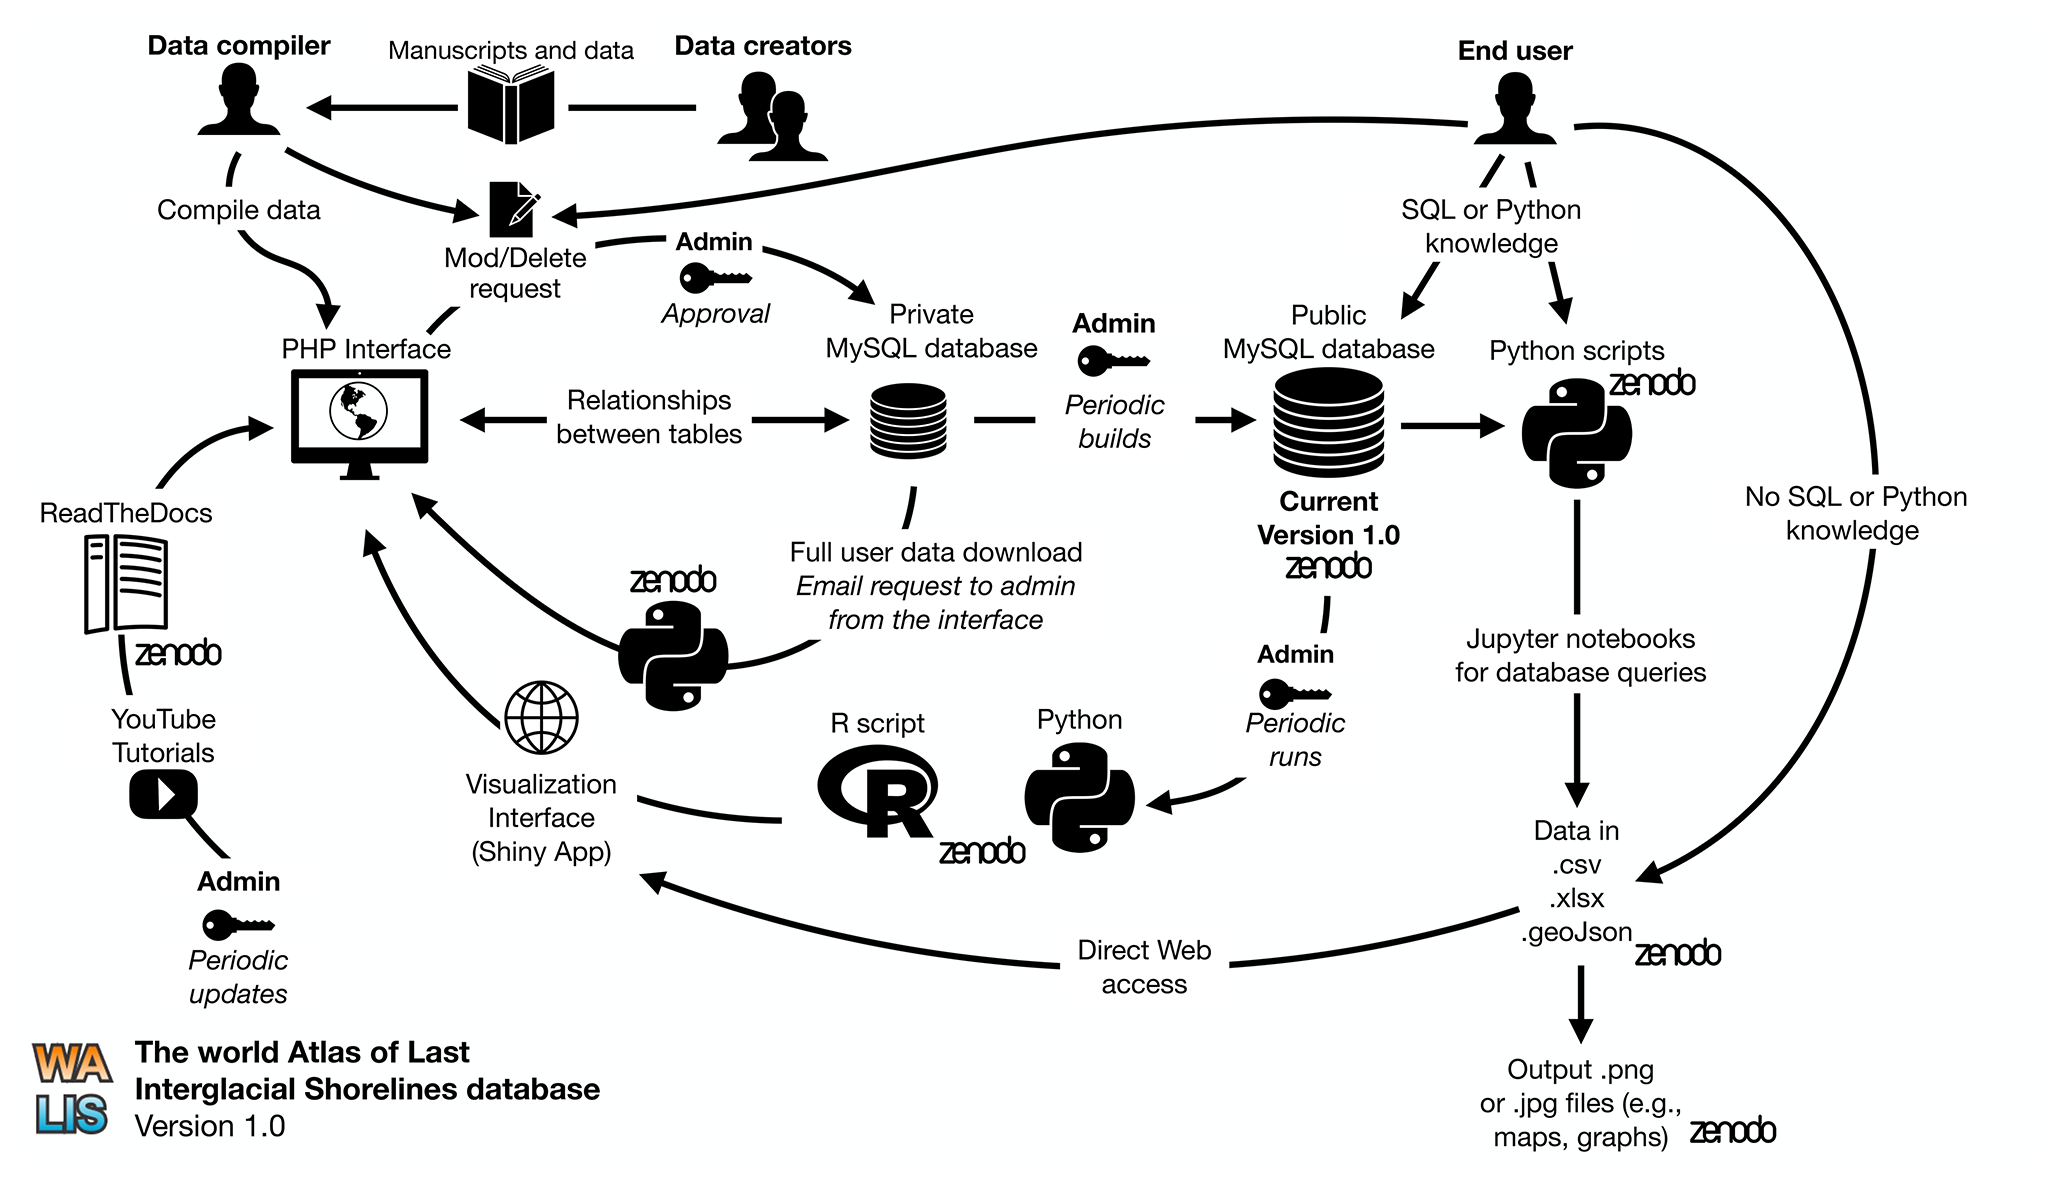
Figure 1Overview of the WALIS platform, which includes the private and public instances of the database, the PHP data interface, and scripts in R and Python to query and visualize the data. The “Zenodo” logo indicates that the scripts/data are available in Zenodo (see Table 1 for links).
3.1 The WALIS database
WALIS is built as a series of tables embedded in a MySQL database. The central concept is that the description of a single sea-level index point must include data and metadata describing its stratigraphy and relationship with the former sea level and must be tied to a series of tables reporting on dated samples and details on how both samples and index points have been measured. The techniques used to measure elevation (including the vertical datum) and geographic positioning must relate to sea-level index points and dated samples. Also, studies reporting details on each site, sample, or technique used must be referenced where necessary (Fig. 2). The WALIS database structure (i.e., the mandatory or optional columns that need to be filled when describing a given entity) was drafted by several scientists (coordinated by the authors of this paper), including experts on different subfields (e.g., geomorphology, stratigraphy, dating techniques, earth modeling). A complete list of tables, fields and associated descriptors is available via the project documentation (Rovere et al., 2020). An overview of the database in terms of the number of fields and records contained in each table is shown in Fig. 2.
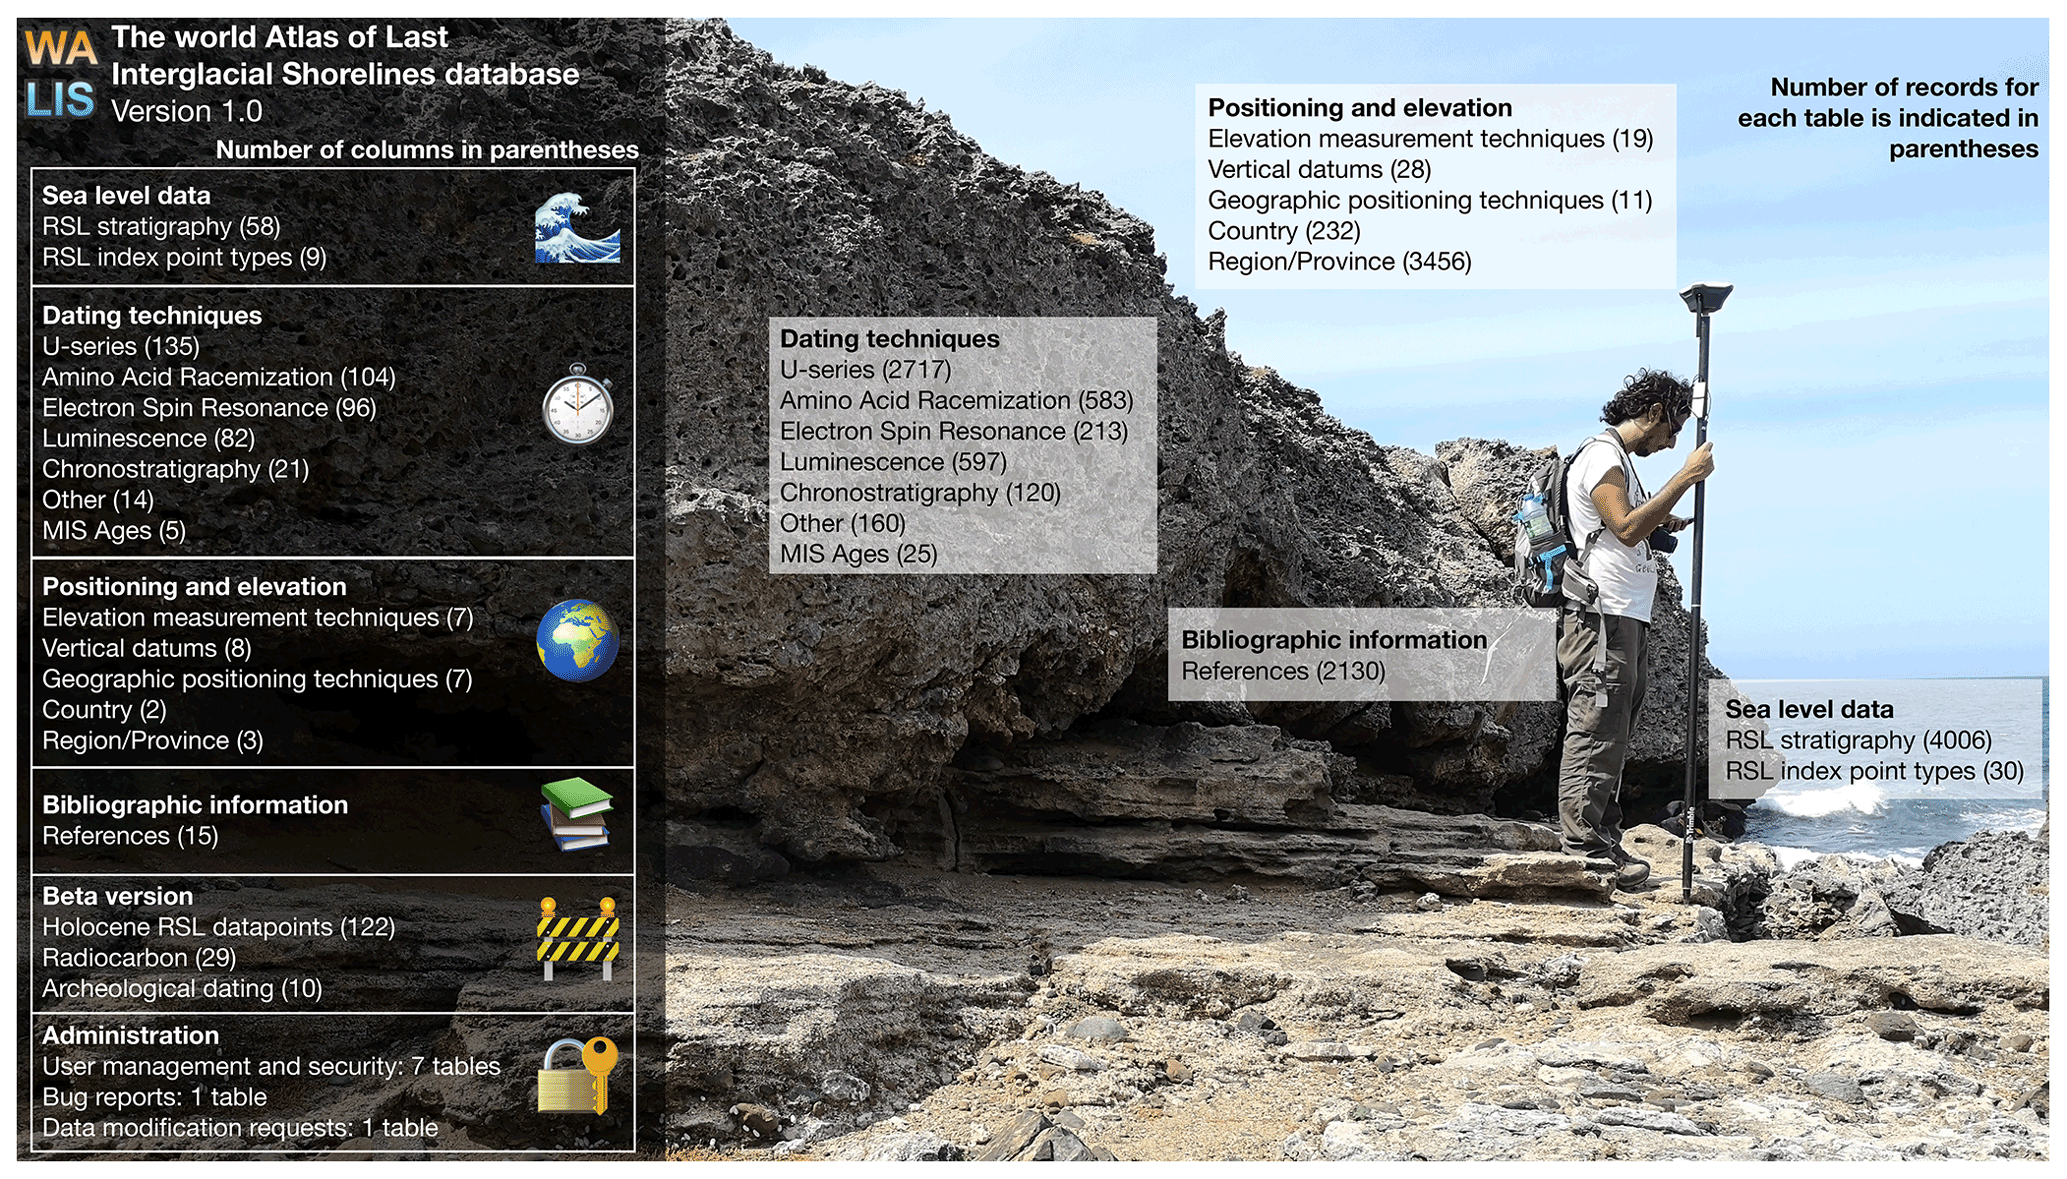
Figure 2Summary of the number of columns in each table and the number of records (rows) per table in WALIS 1.0. Photo by Alessio Rovere (2019). Location: Boca Cortalein, Curaçao. In the picture: geologist Ciro Cerrone measuring the elevation of a Pleistocene beach deposit using real-time kinematic GNSS.
WALIS has a complex structure, with a series of one-to-many and many-to-many links between tables (Fig. 3). One example of a one-to-many relationship is the one between the tables “RSL stratigraphy” (containing the stratigraphic descriptions of sea-level index points) and “Elevation measurement technique” (including details on the techniques used to measure site or sample elevation). Each record in the elevation measurement technique table can be associated with many RSL stratigraphy data points, as the same measuring technique can be applied to many sites. However, each RSL stratigraphy record can be associated with only one elevation measurement technique. The relationship between the RSL stratigraphy and any table containing dated samples (e.g., amino acid racemization, electron spin resonance, and U-series) is an example of a many-to-many relationship. Multiple dated samples can characterize one RSL stratigraphy data point (e.g., replicates of the same dated material or different samples within the same stratigraphic layer).
It is also possible, under certain conditions, that a single dated sample can be used within various RSL stratigraphy records. This can happen when different sites containing sea-level index points correlate with a single stratigraphic unit dated elsewhere with, for example, U-series. In such cases, the WALIS structure allows connecting one or more sea-level index points with one stratigraphic unit but also with one or more radiometric ages that have been used to assign an age to that unit. The distance between the sea-level proxy and the closest dated sample is calculated and stored in a column of the exported spreadsheet. This kind of many-to-many relationship between sea-level proxies and dated samples allows retaining not only the age information for a given sea-level proxy but also information about how that age has been established. This is a crucial difference with previous Last Interglacial sea-level databases (Hibbert et al., 2016; Pedoja et al., 2014; Ferranti et al., 2006). The relationship between samples and sea-level proxies in these databases is always one-to-one.
The links between database tables are shown in Fig. 3. One key aspect of WALIS is that the links are not defined in MySQL but are managed in the PHP interface. Taking the examples of the one-to-many and many-to-many relationships described above, in the RSL stratigraphy, there is an elevation measurement technique type integer field, which is filled via the PHP interface with the corresponding ID in the Elevation measurement techniques table. Similarly, in the RSL stratigraphy table, there is a U-series type varchar field (i.e., an indeterminate string length data type) that, upon selection in the PHP interface, is filled with the corresponding ID(s) in the U-series table as comma-separated values. Unique constraints and orphans are managed via the PHP interface, and all relationships are coded into the Python scripts used to extract the data (Fig. 1). While we recognize that this makes WALIS an “unorthodox” database from the SQL standpoint, we have found that this is the most effective way to manage the inter-table relationships' complexity without affecting the interface's usability.
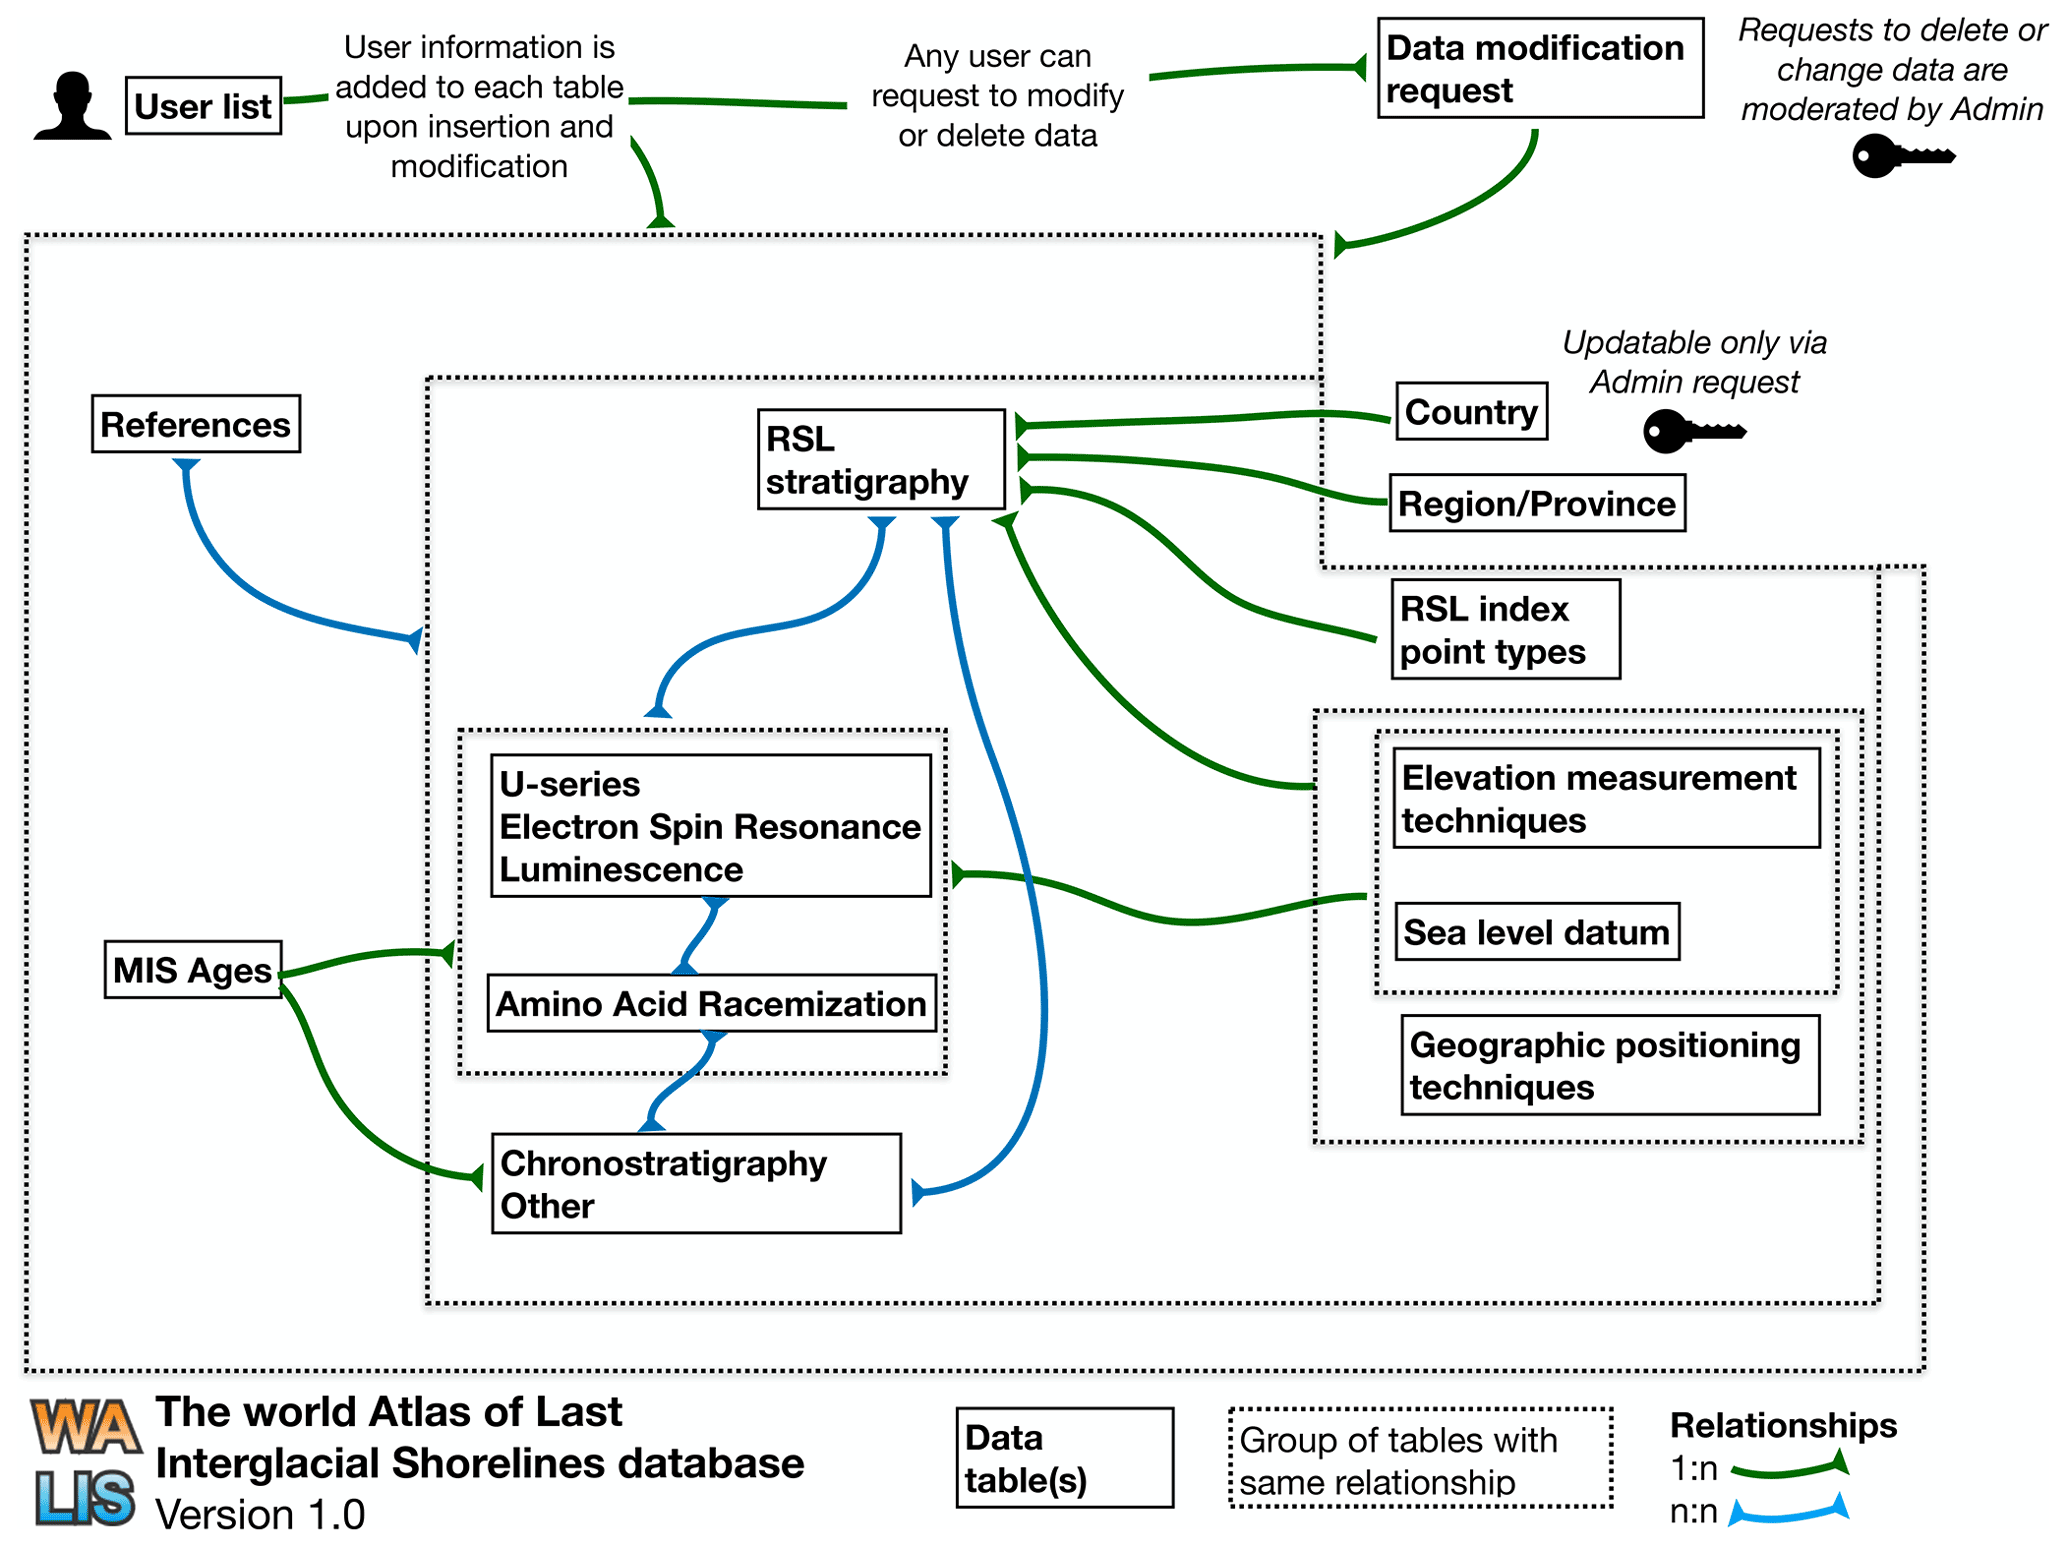
Figure 3Database structure for WALIS. Note that the relationships among tables are managed via the PHP interface and are, therefore, not included in the database. Also not included in this scheme are the tables to report Holocene data, which are still in beta testing.
3.2 The WALIS interface (version 1.8.0)
The interface to the MySQL database was built in PHP 7.3 using Scriptcase, a rapid application development software. The main components of the interface (current version: 1.8.0) are shown in Fig. 4. On the left side, a menu allows navigating the different pages of the application. Windows for data insertion can be browsed in a tab space in the central part of the application. Below the tab space is the main window, where the active tab is shown. The data insertion is done inside the active tabs in the main window, where a data compiler can find the fields to fill and help tips to guide the compilation of the database.
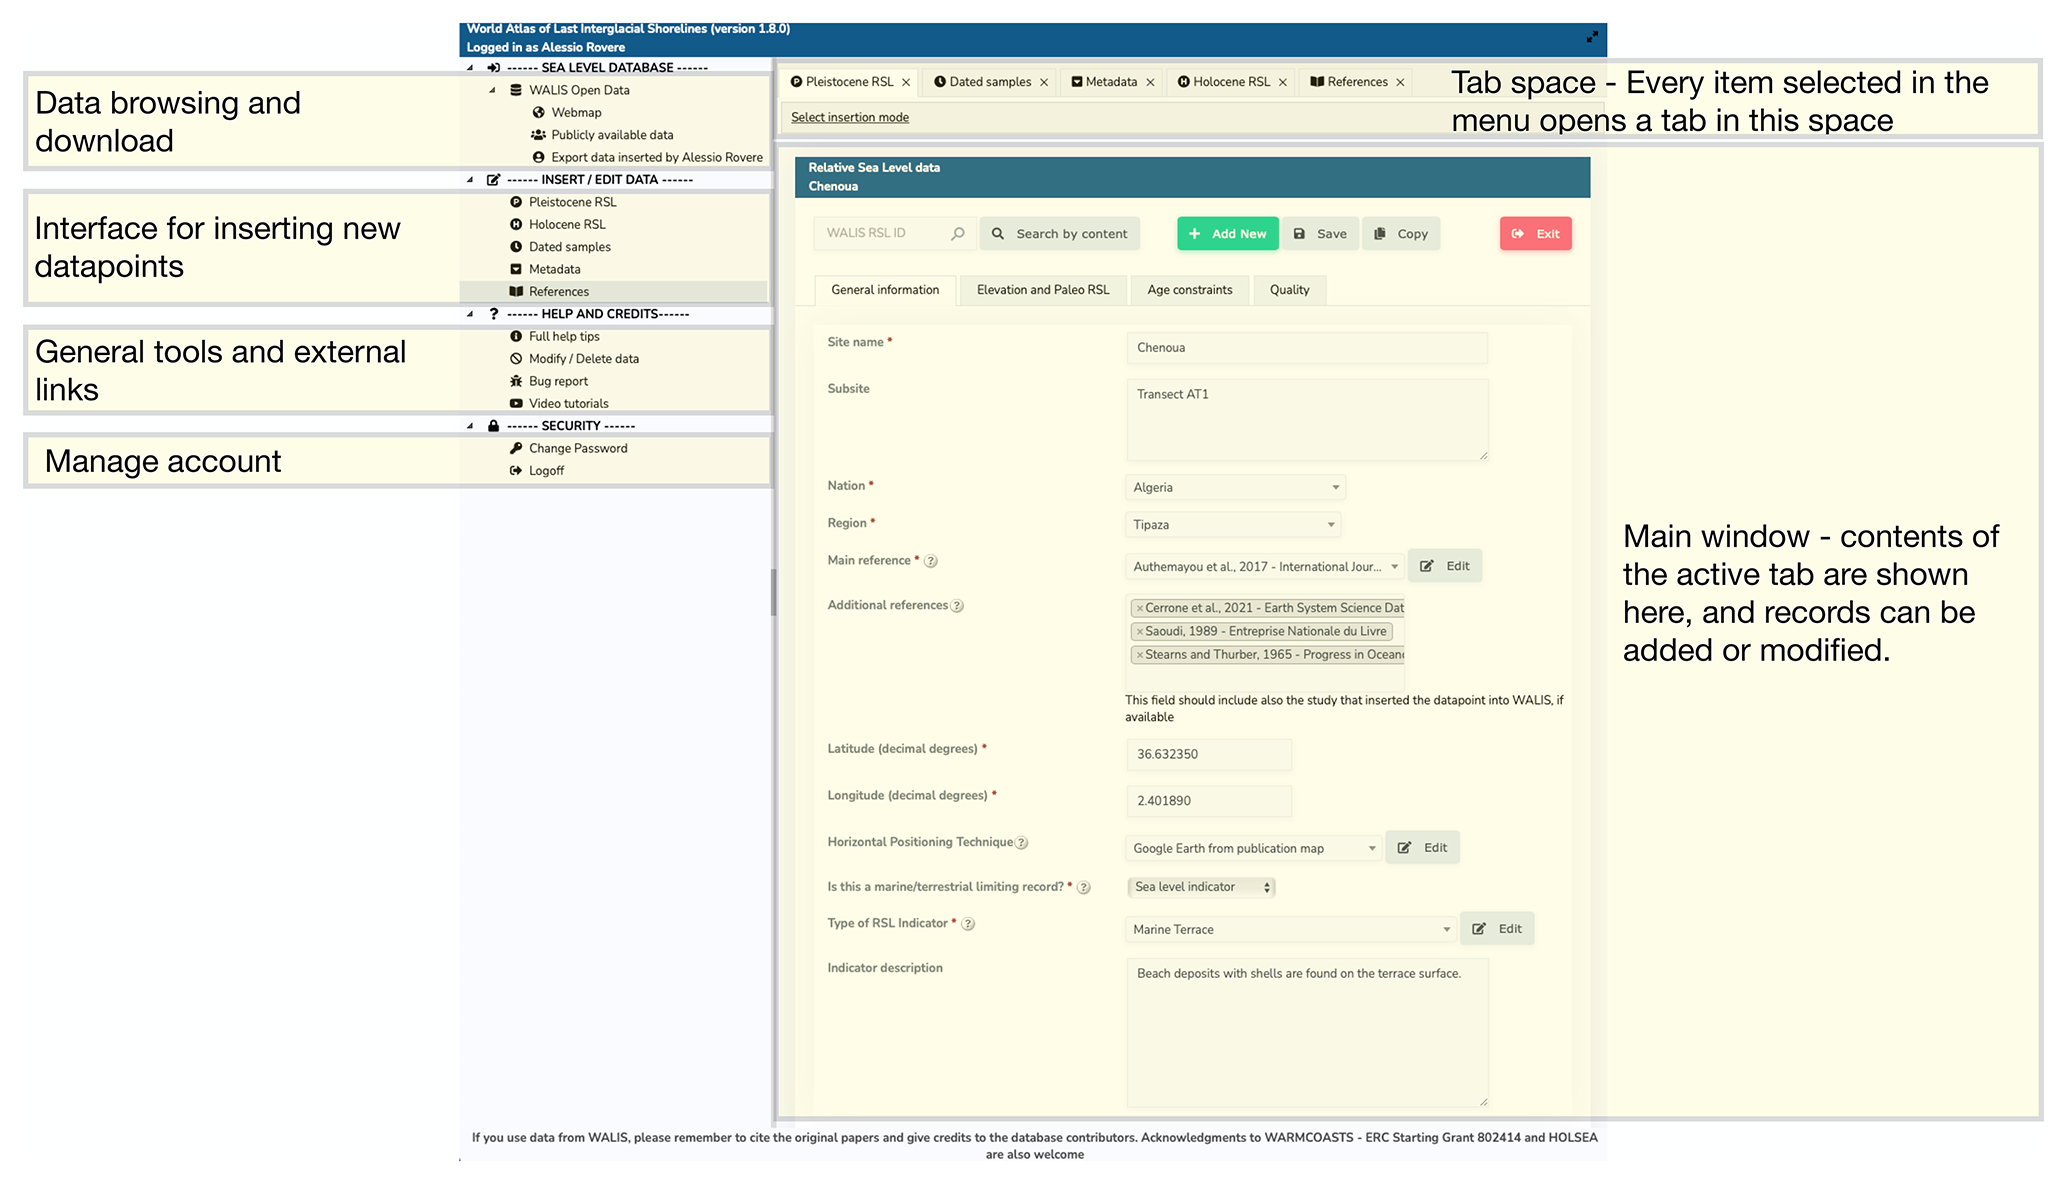
Figure 4Annotated screenshot of the WALIS PHP interface, version 1.8.0.
3.3 Data visualization (version 2.0)
To ensure rapid access to the data in WALIS, we also prepared a map interface that allows end users to browse the contents of the database (Garzón and Rovere, 2022). This visualization interface is built with the R package Shiny and uses a simplified database version exported via a Python script (Table 1). The interface's main page allows an end user to select data from different filters or geographic queries. The chosen data on the first page can be browsed and downloaded in CSV format on the second page of the interface (Fig. 5). On the third page of the visualization interface, it is possible to run a script implementing a Monte Carlo elaboration that allows plotting a probability density distribution of RSL in space and time, as indicated by the selected indicators. It is also possible to download the results of the Monte Carlo elaboration for further analysis or plot outside the interface. Within the visualization interface, it is possible to apply different filters to the selected data.
Figure 5Screenshots of the three pages of the WALIS data visualization, version 2.0. The tool is available at https://warmcoasts.shinyapps.io/WALIS_Visualization/ (last access: 15 December 2022).
3.4 Query and plotting scripts
With the release of WALIS 1.0, we prepared a repository that includes several Python scripts that can be executed via Jupyter notebooks. The scripts allow querying WALIS by selecting data compilers by name or geographic boundaries. Then, they connect records via one-to-one and many-to-many links and associate database column names with formatted labels. After these scripts are run, it is possible to export the queried data in different formats (CSV, XLSX, GeoJson) or make exploratory plots, such as maps or histograms for various fields (Table 1).
3.5 Documentation
The documentation associated with WALIS is maintained in GitHub and served via a ReadTheDocs web page built with Sphinx (Brandl, 2021). The documentation contains details on the main tables of WALIS and a description for each field of the database, with guidelines on which values or details are expected to be included by the data compiler. Via the ReadTheDocs page, the documentation may be searched and exported as a PDF file.
Table 1Main resources associated with WALIS, with repositories on GitHub and the direct link to the application (if available). NA – not available.
* Last access: 15 December 2022.
The data included in WALIS 1.0 were compiled primarily within the ESSD special issue (Table 2). Some of the papers in the special issue have a global scope, such as those collecting data for U-series on corals, speleothems, and MIS 5c/5a (Chutcharavan and Dutton, 2021a; Dumitru et al., 2021; Thompson and Creveling, 2021b, respectively). Most papers are instead focused on specific regions. Two manuscripts for which data are available in WALIS 1.0 are only available as preprints (see Table 2). At the same time, data from one paper published outside the special issue were submitted by the lead author to WALIS (Steidle et al., 2021). In one case (not shown in Table 2), the WALIS U-series structure was used to report on Last Interglacial coral and speleothem ages in the Mediterranean Sea, adding more samples to those currently in WALIS for that region (Pasquetti et al., 2021). These data were not compiled via the interface; therefore, they are not included in WALIS 1.0. They will be included in the subsequent versions of WALIS.
Table 2List of papers describing data compiled in WALIS format and associated datasets.
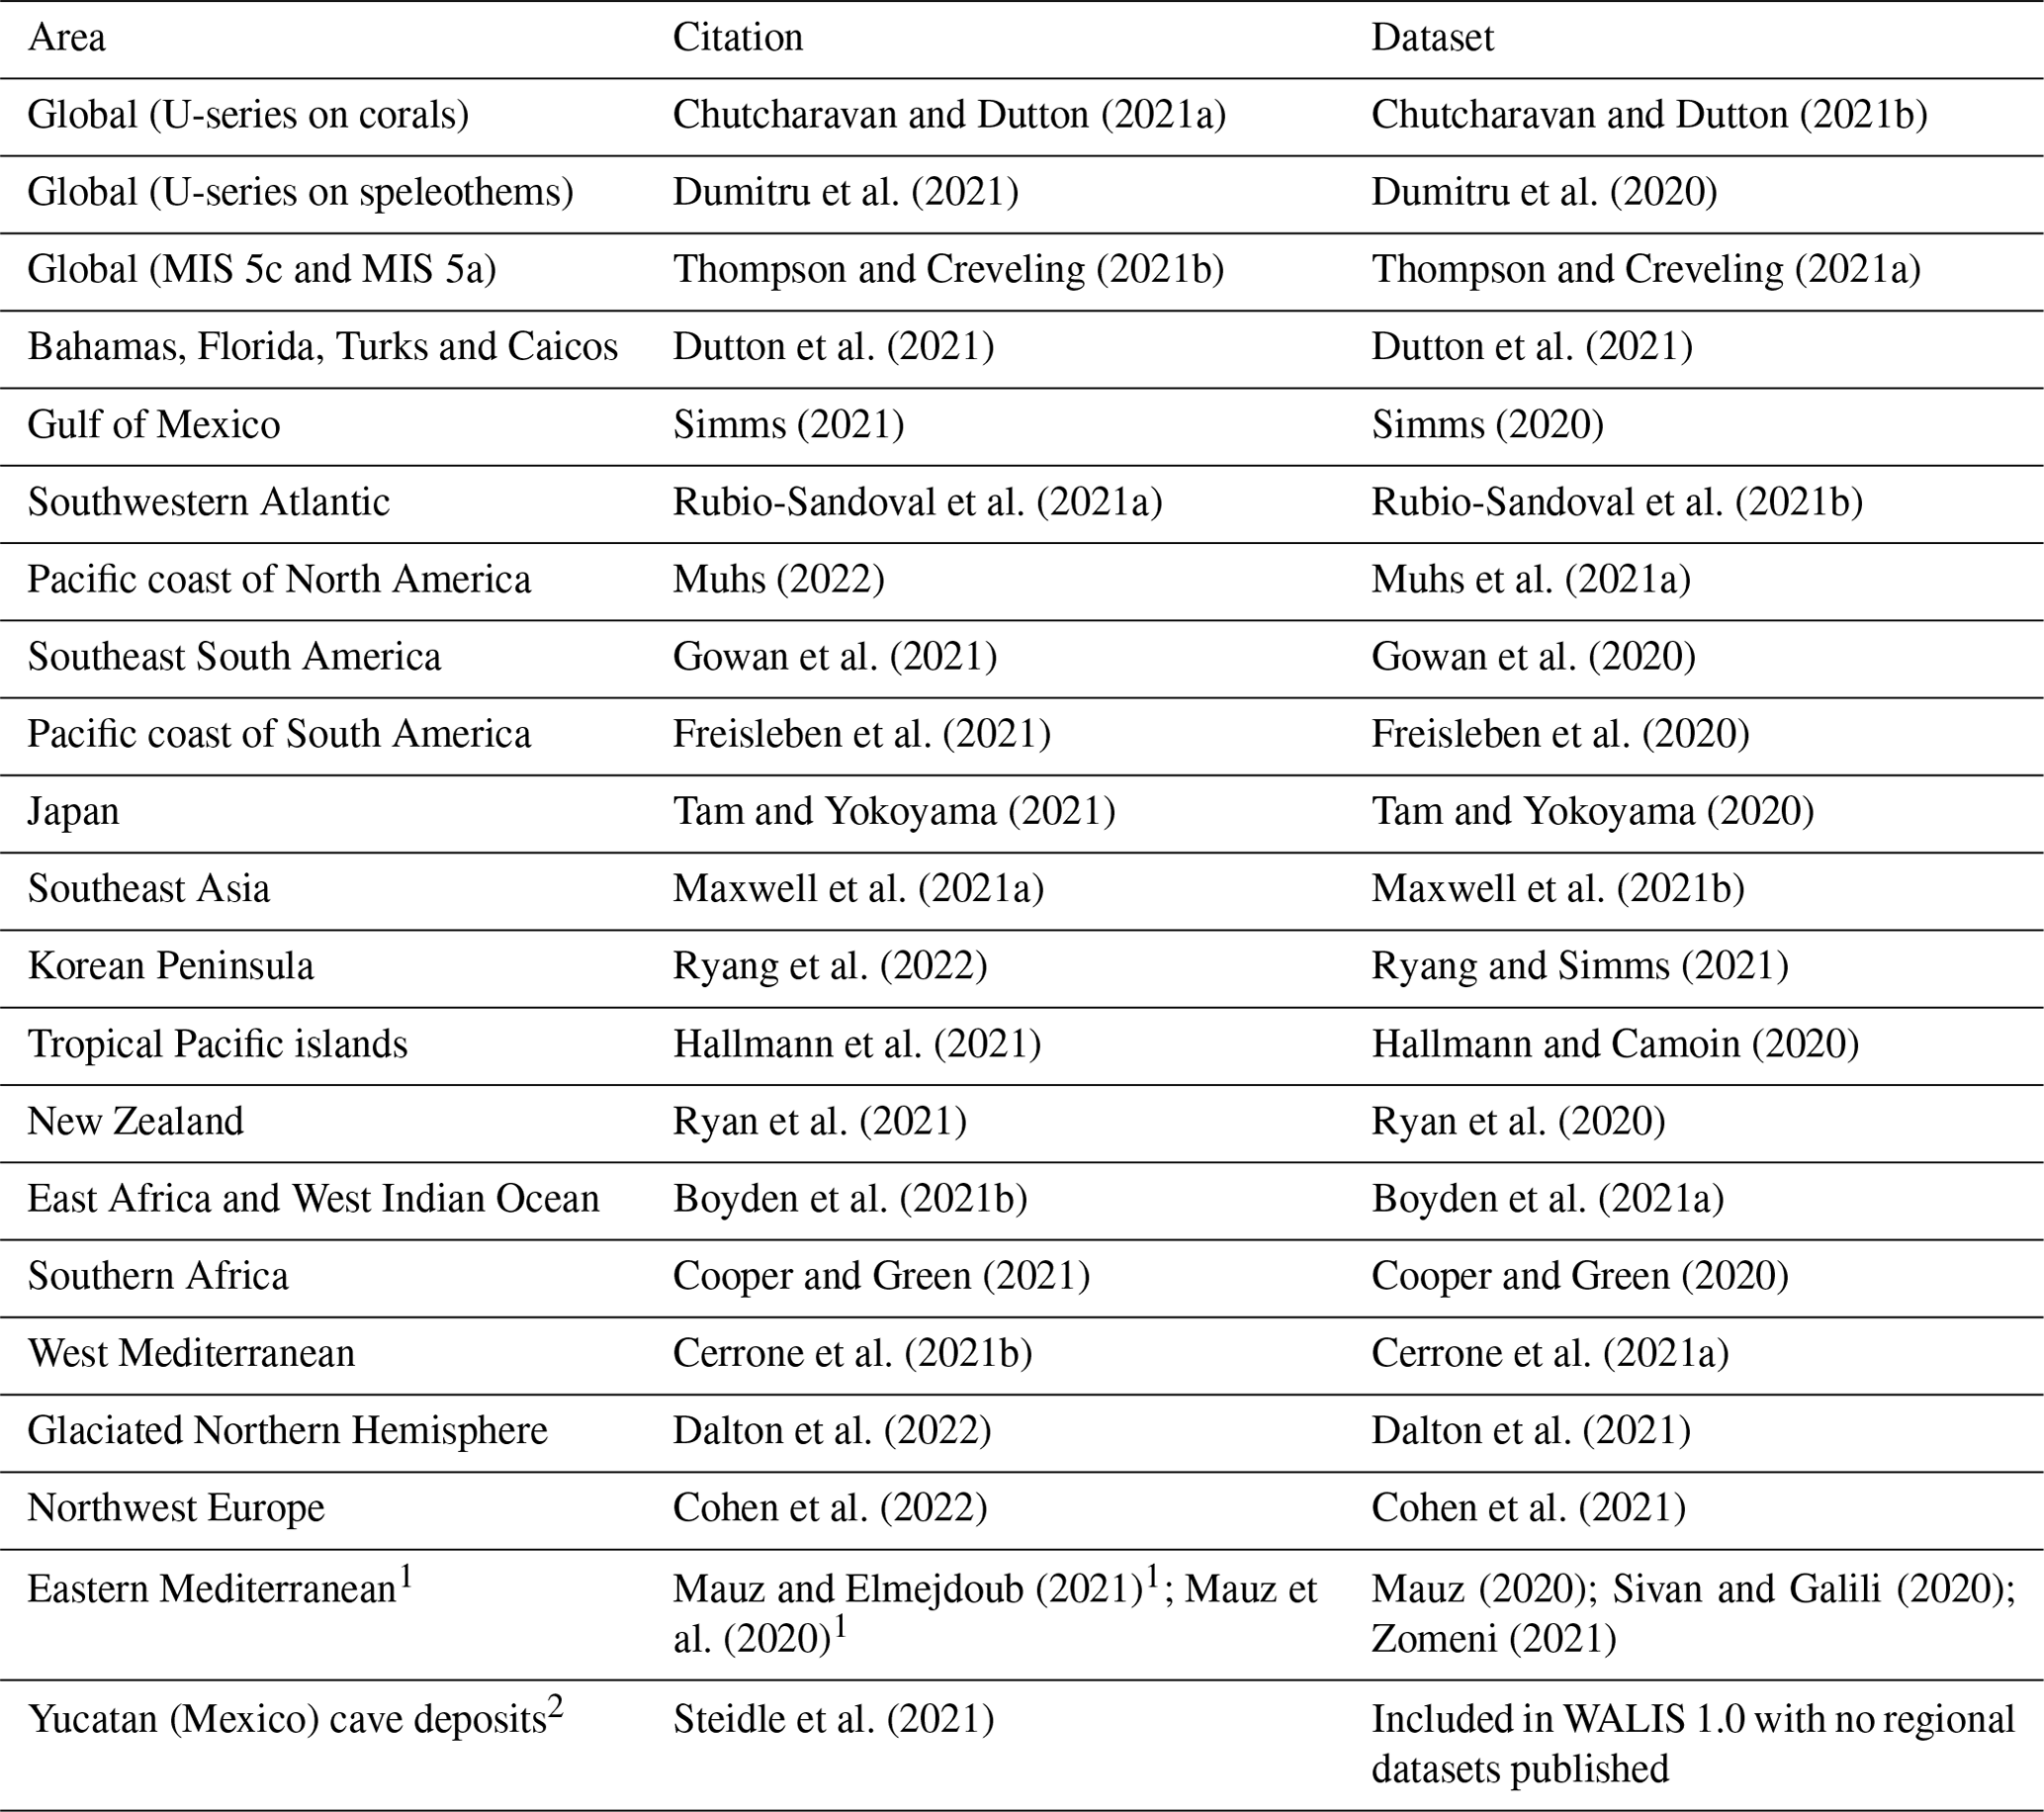
1 Preprints, not peer reviewed. 2 Data from this paper are available within version 1.0 of the global database but are not included in the ESSD special issue and are not uploaded in Zenodo as a regional dataset.
4.1 Sea-level and age data points
WALIS 1.0 includes 4545 sea-level proxies (Fig. 6). The papers listed in Table 2 contain data and metadata standardized from 2130 references, spanning more than one century of published scientific literature. The sea-level proxies in WALIS 1.0 consist of 3311 sea-level index points from coastal sites (containing, for example, fossil beach deposits or marine terraces), for which it is possible to identify a relationship with the paleo sea level via the “indicative meaning” (Shennan et al., 2015). Other points indicate that paleo sea level was above (“marine limiting” points, n=285) or below (“terrestrial limiting” points, n=410) the measured stratigraphy. Examples of marine limiting points are fossil subtidal sands, while terrestrial limiting points are, for example, fossil dunes. The database also contains 463 sea-level index points from fossil corals (most of them compiled by Chutcharavan and Dutton, 2021a), which can be correlated to paleo sea level when there is enough information on paleo water depth given. In WALIS are also included 76 phreatic overgrowths on speleothems, which are a particular morphotype of cave deposits formed in association with paleo sea level (Dumitru et al., 2021).
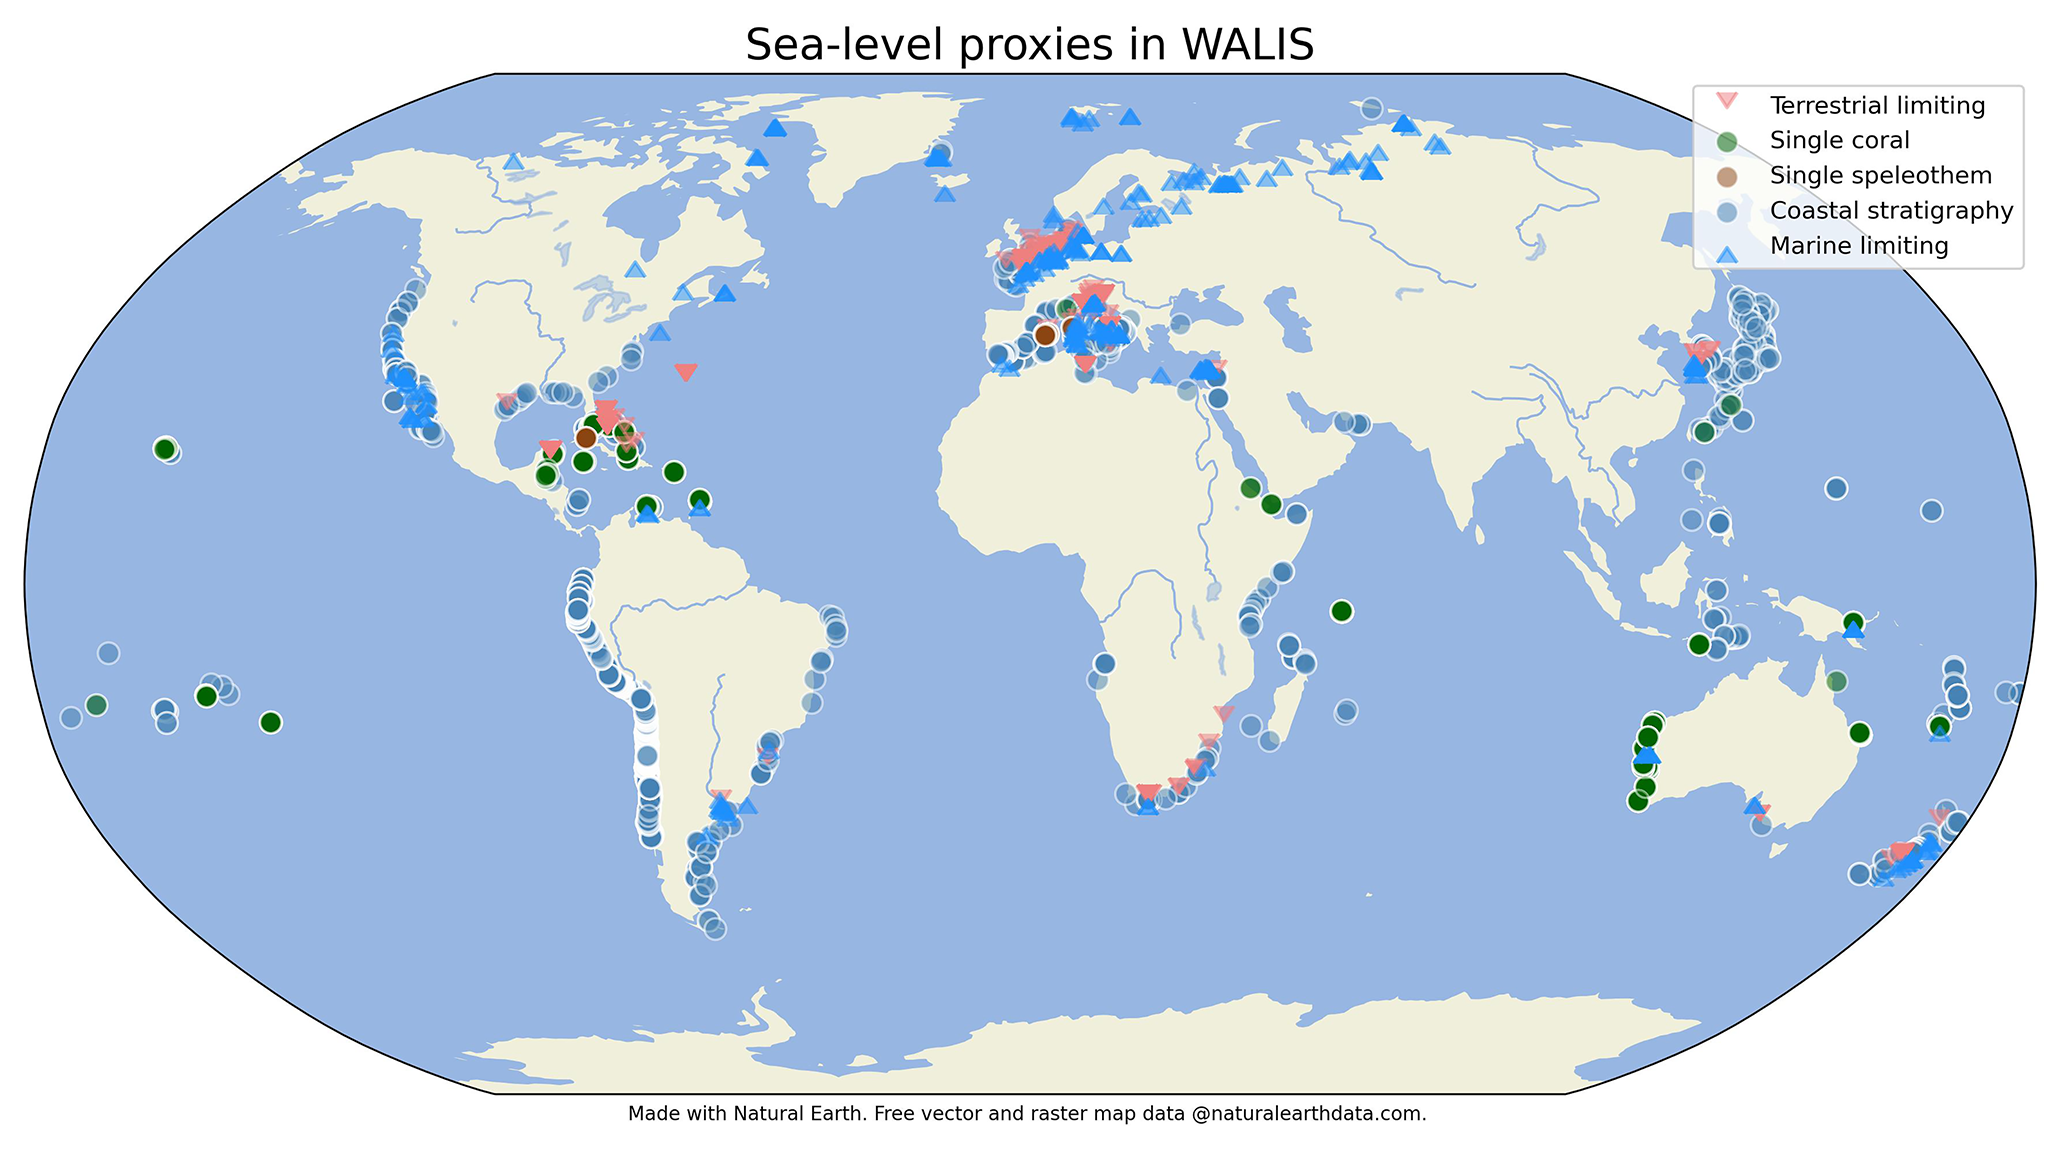
Figure 6Location of sea-level proxies included in WALIS 1.0, divided by category. The code used to create this image is available from Rovere et al. (2022). Map made with Natural Earth, background from https://www.naturalearthdata.com (last access: 15 December 2022).
Each sea-level index point is associated with one or more dated samples or with non-radiometric chronological constraints, such as, for example, biostratigraphic markers. In total, WALIS 1.0 includes 4110 dated samples. These include corals, cave deposits, mollusks, or oolites dated via U-series (n=2717). Upon selecting the material dated by U-series techniques, the interface requests the compiler to fill in different fields specific to the material chosen. WALIS 1.0 also contains a relevant number of samples dated with luminescence (n=597), amino acid racemization (n=583), and electron spin resonance (n=213). Additional chronological constraints include 120 chronostratigraphic or biostratigraphic records (e.g., pollen zones) and 160 age determinations of “other” type. Examples of the latter are tephra layers or finite radiocarbon ages, or ages inferred to be beyond the range of the radiocarbon method. Each sea-level proxy must be correlated with at least one chronological constraint. There is no upper limit on the number of chronological constraints associated with a single sea-level proxy. The choice of how to calculate final-age uncertainties for a sea-level proxy associated with several chronological constraints is left to the end user. However, in the data visualization interface, we propose an approach where each age within the same sea-level proxy is sampled using a Monte Carlo method within a random or uniform distribution (depending on the type of constraint), and a synthetic age is calculated by combining the samples available for the proxy.
In the interface, it is also possible to select minimum or maximum ages, indicating if a sea-level proxy is older or younger than a given sample. This option may be chosen when, for example, only infinite radiocarbon ages are available as an age constraint for a beach deposit, indicating thus that the deposit is older than 50–60 ka, but it is impossible to assign a radiometric age. In summary, in WALIS 1.0, there are nine possible combinations (Fig. 7) to define a sea-level proxy (sea-level index point, marine or terrestrial limiting) and its associated age (older/younger than, or with defined age).
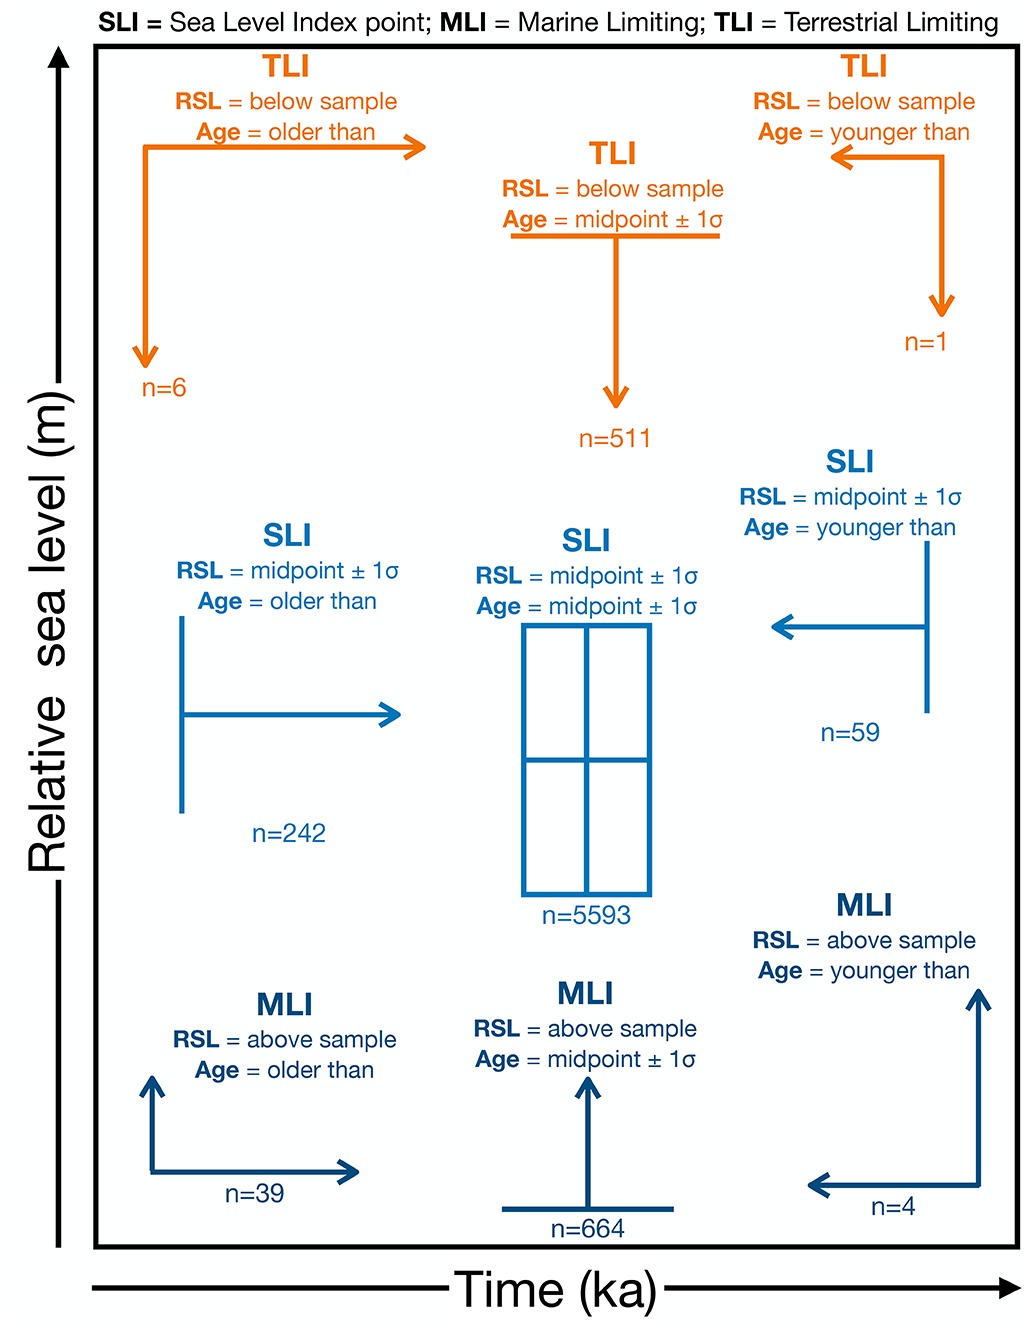
Figure 7Nine possible combinations of sea-level proxies and age determination types in WALIS 1.0. The number on the bottom of each type indicates its frequency within the database.
4.2 Types of sea-level proxies
In WALIS 1.0, paleo sea levels are interpreted from 30 different types of sea-level indicators. In Fig. 8, we group them into four general categories. In the current version, the most represented category is geomorphological sea-level indicators (such as marine terraces, shoreline angles, or tidal notches). The high number of records for this category is driven by the data from Freisleben et al. (2020). They used a tool called TerraceM (Jara-Muñoz et al., 2016) to systematically map the inner margin of marine terraces along the Pacific coasts of South America, reporting 1953 marine terraces, representing more than 80 % of the data points of this kind in WALIS (and 43 % of the data points in WALIS 1.0). Biological indicators (i.e., single corals or coral reef terraces) and limiting points (marine or terrestrial) contain relatively fewer records. The lowest occurrences in the database are indicators of depositional origin. This category includes several proxies, ranging from widely defined fossil beach deposits and beach rocks (Mauz et al., 2015), to beach ridges (Otvos, 2000) or lagoonal deposits.

Figure 8Percentage of occurrence in WALIS of main categories of sea-level proxies. The code used to create this image is available from Rovere et al. (2022).
4.3 Elevation metadata
Data and metadata on elevation measurement and the vertical datum used are essential to describe a sea-level proxy, as they affect the uncertainties associated with paleo RSL. For this reason, WALIS includes two tables containing information on elevation measurement methods and vertical datums used to report the elevation of samples and sea-level proxies in the field. Each sea-level proxy and each sample in WALIS 1.0 must relate to one record in these two tables. Looking at broad categories of elevation measurement techniques (Fig. 9), it is evident that only a fraction of sea-level proxies in WALIS 1.0 have been measured with techniques with sub-meter (or better) vertical accuracy (e.g., differential GNSS or total station). Elevations for almost half of the sea-level proxies in WALIS 1.0 were gathered from digital elevation models or topographic maps. This high percentage is driven by the 1953 marine terraces measured on digital elevation models by Freisleben et al. (2021). Also, elevation measurement methods are often labeled in WALIS as “not reported”, meaning that there was insufficient information in the literature to discern how the elevation of a sea-level proxy was initially measured.
Looking at broad categories of vertical datums to which elevation measurements have been attributed (Fig. 9), a large number of data referred to either orthometric or geodetic datums. The high frequency of the latter is driven by the large number of terraces reported by Freisleben et al. (2021), who referred their measurements to the global EGM08 geoid. If this source is excluded, the vertical datum for most records in WALIS is either not reported or referred generally to “mean sea level” with no further specifications. Only a small fraction of data are referred to a tidal datum, and very few data points were referred to a vertical biological datum (e.g., the height of living coral microatolls).
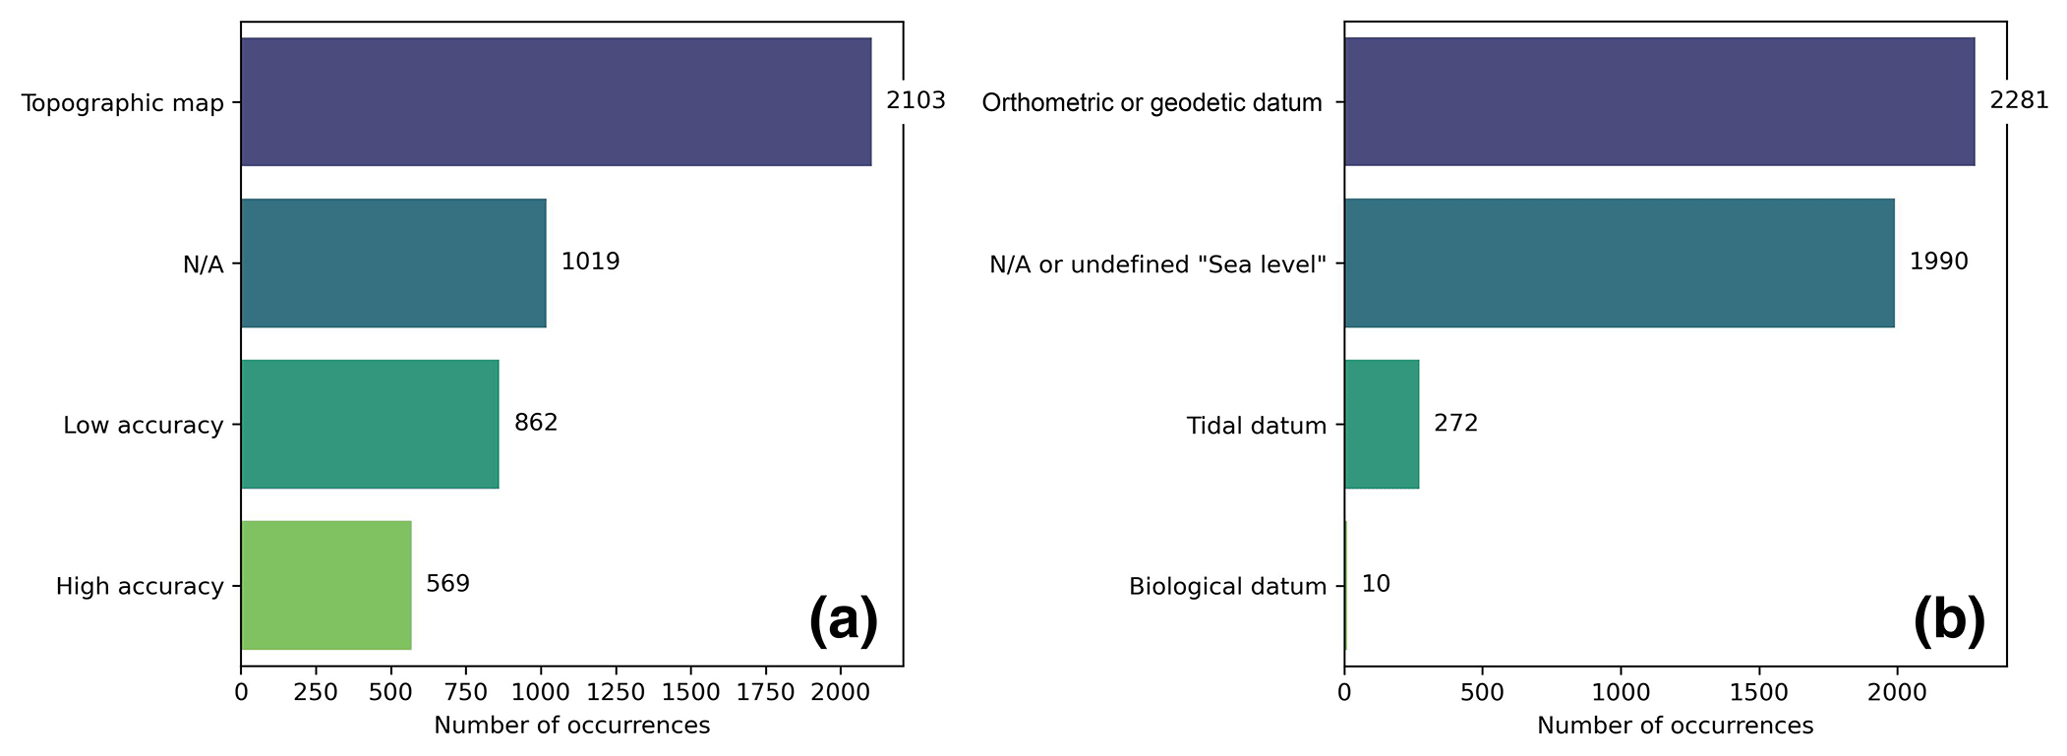
Figure 9Elevation measurement methods (a) and vertical datums (b) associated with sea-level proxies in WALIS. The code used to create this image is available from Rovere et al. (2022).
4.4 Relative sea-level estimates from WALIS data
As shown above, in Fig. 8, sea-level proxies in WALIS 1.0 can be divided into four broad categories. However, there are differences in how relative sea-level (RSL) information is inserted in the WALIS interface for three common types of index points: stratigraphic (including geomorphological proxies), speleothems, or corals (Fig. 10). For any sea-level index point, regardless of the type, the WALIS interface requests as mandatory information the elevation of the proxy and the associated 2σ error, which should also include datum uncertainty.
Regarding RSL index points from stratigraphy, the WALIS interface calculates paleo RSL from the upper and lower limits of occurrence of the proxy in modern analogs, which are requested as mandatory fields. Using the concept of indicative meaning (Shennan, 1982; Shennan et al., 2015) and associated formulas (Rovere et al., 2016), the interface calculates paleo RSL and 2σ uncertainties, which are then saved in the database. In the case of sea-level index points from speleothems, in WALIS 1.0 represented by phreatic overgrowth on speleothems (POS), the compiler is required to insert the values of paleo RSL and associated ±1σ uncertainty. In the case of sea-level index points from single corals, the WALIS interface requests the insertion of upper, lower, and modal depth range of occurrence of living specimens. For corals, the interface does not calculate paleo RSL. However, in the code used to prepare data for the ShinyApp interface (Rovere et al., 2022), we include scripts to compute a gamma distribution from the upper and lower limits of occurrence of corals used as index points (shown in Fig. 10), an approach similar to that proposed by Hibbert et al. (2016).
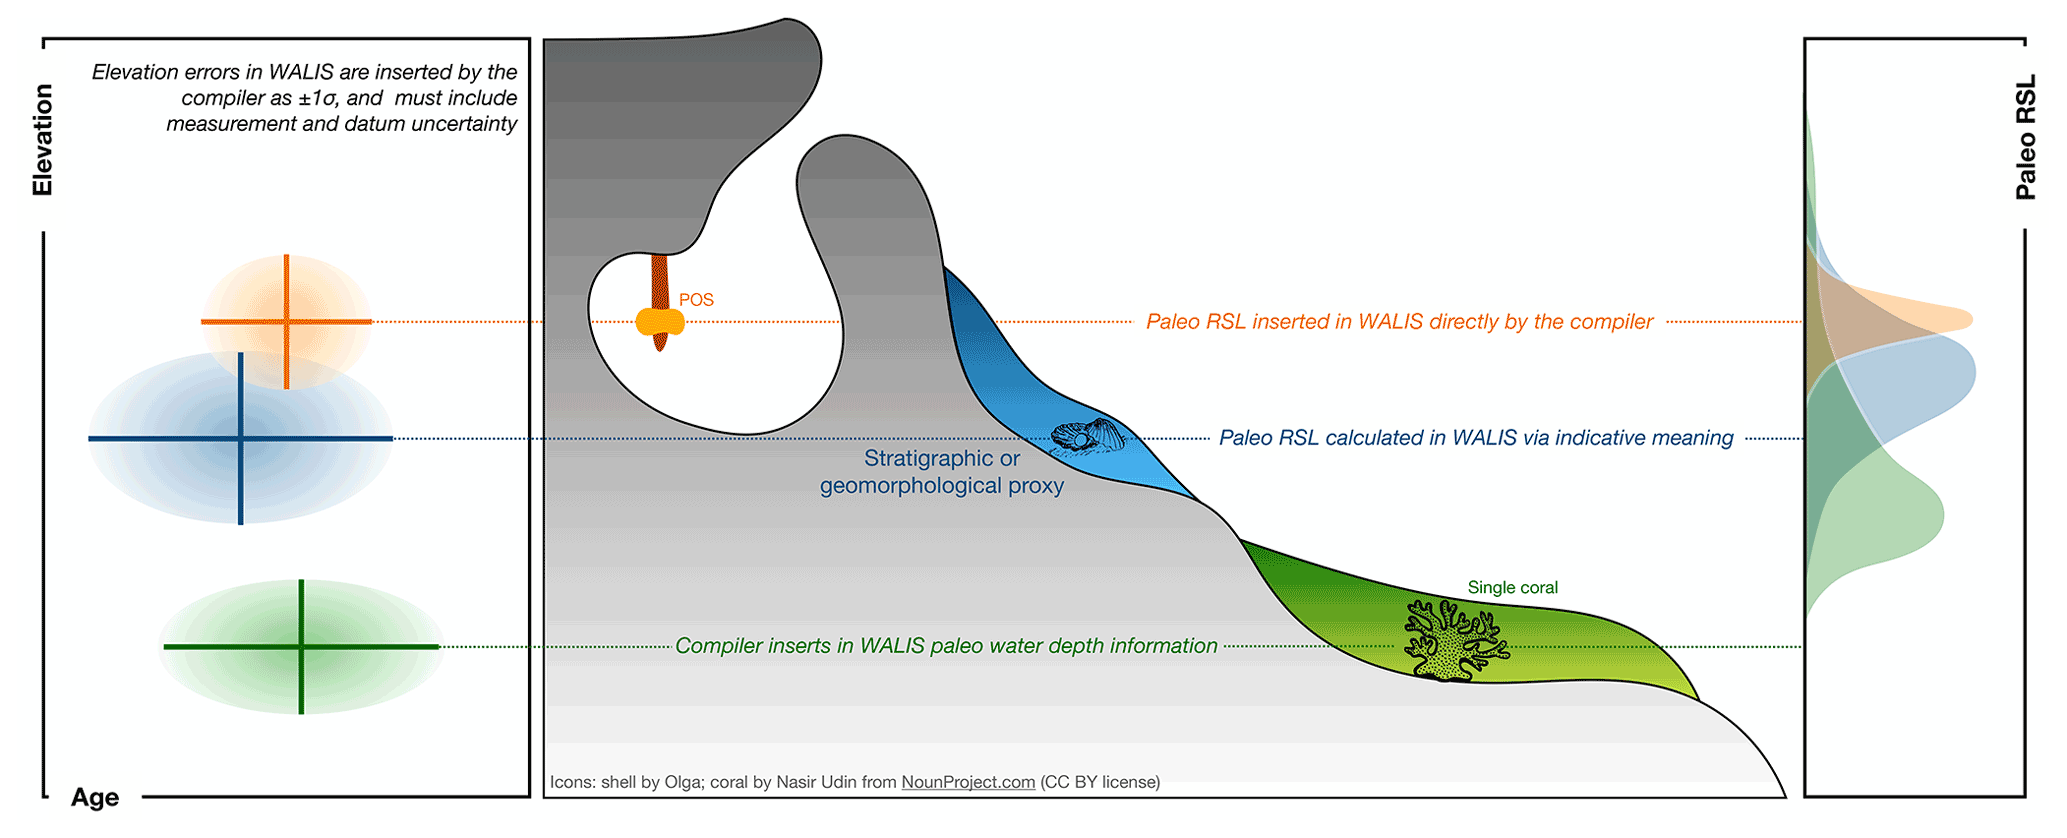
Figure 10Three types of index points in WALIS 1.0 and associated elevation (left) and paleo RSL information (right). The figure represents the ideal case of three index points formed at the same time (overlapping ages within error bars), surveyed at different elevations but resulting in a coherent paleo RSL history (overlapping paleo RSL) once interpretation of proxies is included. POS is phreatic overgrowth on speleothems.
An essential aspect of any database is the assessment of limitations in its structure and in the data it contains. The WALIS structure was agreed upon by a pool of scientists who are experts in different regions and dating techniques. It was also modified as needed during the compilation of version 1.0, following the suggestions of data compilers. Within the interface, there is the possibility to report “bugs” or recommendations to the administrators, helping future developments of the WALIS interface and database structure. The data included in WALIS 1.0 underwent peer review together with the associated papers, and most data contained in WALIS 1.0 have been subject to peer review via their original publication. However, errors or inaccuracies may be present in WALIS 1.0. For this reason, the interface allows data compilers and end users to indicate issues with specific data points. Correcting the problems identified in this way will likely lead to future WALIS versions, allowing the tracking of changes and sharing credit with new contributors.
5.1 Data quality
In several tables within WALIS, there are fields to help end users understand the quality of the data. In this context, quality does not necessarily refer to accuracy or precision but is a subjective measure that can reflect, for example, more information associated with the data point that leads it to be considered more robust. In the RSL from stratigraphy table, data compilers were asked to score, on a scale from 0 to 5, the age and RSL information quality of each data point inserted. A general guide on how to score the records was given by Rovere et al. (2020) and is here reported in Table 3. However, its use was not strictly enforced within the WALIS special issue. Although the guidelines are designed to facilitate objective data analysis, we recognize there is still potential for subjective interpretation.
For studies following this suggested ranking scale, comparing quality scores among areas is possible. Examples are the records of Argentina (Gowan et al., 2020) and Brazil (Rubio-Sandoval et al., 2021a), shown in Fig. 11. Comparing the scores in these two datasets shows that, on average, records in Argentina have slightly higher age quality than those in Brazil. However, the RSL information for some sites in Brazil reaches the “excellent” score, which is not achieved by any record in Argentina. Ideally, those sites might be targeted to gauge whether it may be possible to improve their age control.
Table 3Quality scores as suggested by the WALIS guidelines (verbatim from Rovere et al., 2020, originally published under the CC-BY 2.0 license). Scores vary from 0 (rejected) to 5 (excellent).

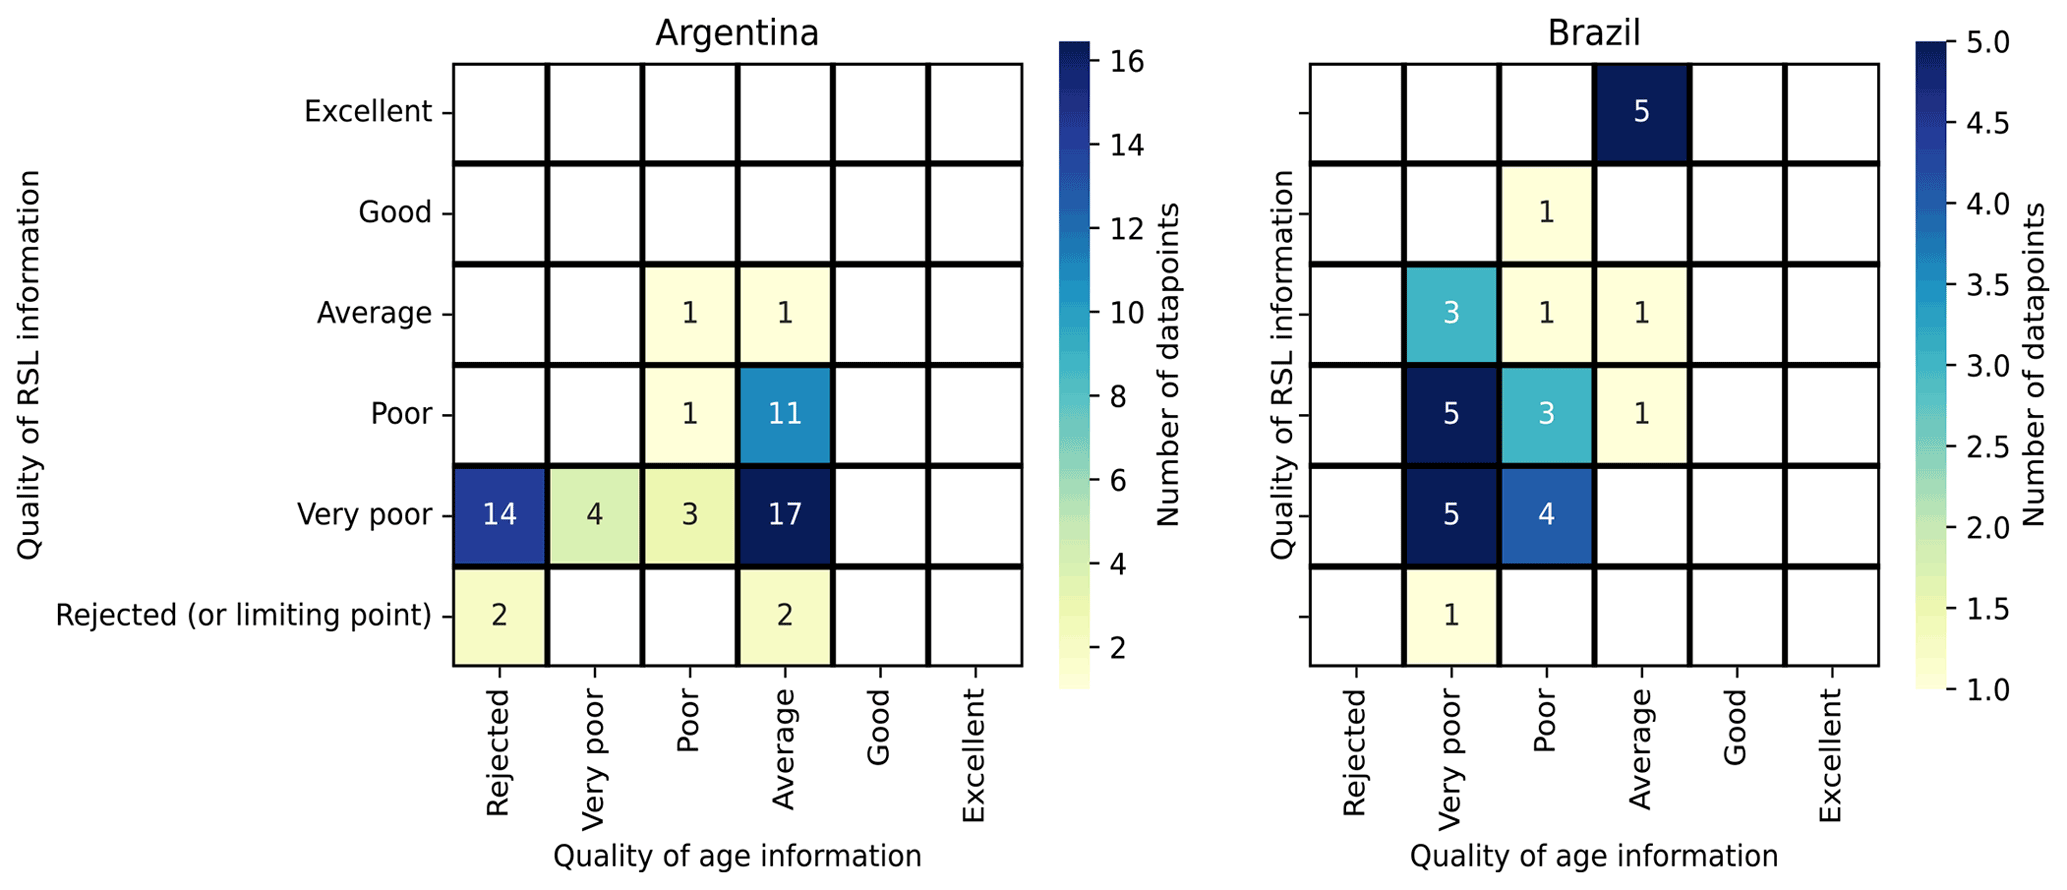
Figure 11Heatmap summarizing the quality of age and RSL information for data in Argentina (Gowan et al., 2020) and Brazil (Rubio-Sandoval et al., 2021a). Labels inside each cell detail the number of sites with the corresponding RSL/age quality scores. The color of each cell is related to the relative frequency of each duplet of scores. The code used to create this image is available from Rovere et al. (2022).
Samples dated with radiometric techniques have a mandatory field where data compilers indicate whether the data point is “accepted” or “rejected”. The rationale of this field is to allow the data compiler to insert samples rejected by original authors and retain unsuccessful dating attempts for future reference. Such fields were expanded in the U-series ages on corals template thanks to the input by Chutcharavan and Dutton (2021a). These authors proposed inserting fields in the database to report different screening protocols applied to existing ages. Investigating whether U-series approach on corals might also be used for other radiometric dating techniques represents potential ground for future WALIS versions.
5.2 Geographic gaps
In compiling data for WALIS 1.0, the aim was to include as many sites as possible globally, including all relevant information related to sea-level proxies and associated dating methods. While we achieved both goals, comparing the data included in WALIS 1.0 with the sites reported in the extensive review by Pedoja et al. (2014), it is possible to highlight areas where Last Interglacial sea-level proxies might be present but are not available in the WALIS standard format. These areas are shown in Fig. 12 and are discussed below, together with relevant or most recent works, which may be used as a starting point for the inclusion of these areas in the subsequent versions of WALIS.

Figure 12Comparison between sea-level proxies in WALIS 1.0 and those in the global review by Pedoja et al. (2014), indicating areas where geographic data gaps are present (see details in the main text). Map made with Natural Earth, background from https://www.naturalearthdata.com (last access: 15 December 2022).
Starting from the northernmost part of the North American continent, the areas not included in WALIS 1.0 include the Last Interglacial shorelines reported in Alaska along the coasts of the Lisburne and Seward peninsulas, the latter including the Nome coastal plain where sea-level records left by several sea-level highstands have been reported (Brigham-Grette and Hopkins, 1995; Goodfriend et al., 1996). On the Russian side of the Bering Strait, in the Chukotka Peninsula, the Last Interglacial sequences are reported by Khim et al. (2001) and Brigham-Grette et al. (2001). South of this area, Quaternary marine and coastal sequences were also reported on the eastern side of the Kamčatka Peninsula (Pedoja et al., 2013).
Another data gap in WALIS 1.0 is evident on the Pacific coasts of North and Central America. Potential sites in this area (including the Mexican states south of Sonora and the Pacific coast of Central America) are discussed in Muhs (2022), who highlights that some studies on these locations are present but do not contain enough details to be inserted in WALIS. We also emphasize that WALIS 1.0 does not include the data reported by a recent paper detailing the marine terraces of Santa Cruz Island, California, which appeared in the literature during the compilation of the atlas (Muhs et al., 2021b).
There are virtually no Last Interglacial shorelines along the South American Pacific coasts extending south of 75∘ S latitude. The absence of such features in this vast area is probably due to the presence of the Patagonian ice sheet during the Last Glacial Maximum, which has likely eroded most, if not all, Last Interglacial coastal sections in this area. Going southwards, surfaces of marine origin, likely of Pleistocene age, are reported on the South Shetland Islands (Navas et al., 2006; López-Martínez et al., 2016) but not included in WALIS 1.0. It is unclear whether the chronological constraints on those landforms are robust enough to be inserted in WALIS.
On the western coasts of the Central Atlantic, another vast area with a substantial lack of records in WALIS 1.0 includes the shores of northern Brazil, French Guiana, Suriname, Guyana, Venezuela, and the Caribbean Sea coasts of Colombia, Panama, Costa Rica, Nicaragua, and Honduras. Rubio-Sandoval et al. (2021a) discuss potential sites in this vast area. However, studies with enough metadata are missing, except offshore Colombia, on the San Andrés and Providencia Islands. Regarding the Caribbean Sea, WALIS 1.0 includes the most relevant data from this region. However, additional sites that may be inserted in WALIS are present in Jamaica (Mitchell et al., 2001, 2006) and Cuba (Muhs et al., 2017; Schielein et al., 2020).
For the US Atlantic coast (excluding the Florida Keys), the only data included in WALIS 1.0 are those related to MIS 5a/5c (Thompson and Creveling, 2021b). Former studies suggested that these stages attained similar elevations to MIS 5e in this area due to glacial isostatic adjustment processes (Wehmiller et al., 2004); therefore, outcrops of this age might have been eroded by later highstands. However, there are reports of MIS 5e successions scattered along the coast (Wehmiller et al., 2010, 2012; O'Neal and McGeary, 2002; Wright et al., 2009), which should be screened for insertion in WALIS. Also, as already mentioned in the previous sections, the Last Interglacial amino acid racemization data obtained from samples of the US Atlantic coast (Wehmiller et al., 2021) should be included in future versions of WALIS. In Bermuda, data from corals (Chutcharavan and Dutton, 2021a) and cave deposits (Dumitru et al., 2021) are included in WALIS 1.0. Still, more sites and dated samples are reported in a recent review by Muhs et al. (2020). Their inclusion in the subsequent versions of WALIS must be considered a priority, given the importance of this area for unraveling land motion changes driven by glacial isostatic adjustment in the North Atlantic.
On the East Atlantic, Pedoja et al. (2014) report that Last Interglacial sea-level proxies were mapped in Ireland by Orme (1966). While it seems unlikely that this study contains enough metadata to be considered for WALIS, some of the Quaternary deposits presented in this early study might have been the subject of successive dating (e.g., Gallagher and Thorp, 1997), thereby meeting the standard for their inclusion in subsequent versions of WALIS. Last Interglacial data missing from WALIS 1.0 may also be present on the Atlantic coasts of the Iberian Peninsula (Alonso and Pagés, 2007; Meireles and Texier, 2000; Benedetti et al., 2009). In the Azores islands, Last Interglacial deposits have also been reported (Ávila et al., 2009, 2015) but are not included in WALIS 1.0. Only U-series ages with no indication of paleo sea level are reported in WALIS 1.0 from the Canary and Cabo Verde archipelagos. However, enough metadata might be present in some papers (Zazo et al., 2010, 2007; Muhs et al., 2014) to upgrade these points to sea-level proxies in the subsequent versions of WALIS.
Within the Mediterranean Sea, data from several studies were inserted in WALIS 1.0. However, some areas lack records, mainly in the eastern part of the basin. For example, there seem to be little to no studies on the coastal Quaternary of Libya, except for one site near Alexandria inserted in WALIS 1.0 (Mauz and Elmejdoub, 2021). While sites in Israel and Cyprus have been inserted in WALIS 1.0 (Sivan and Galili, 2020; Zomeni, 2021), there are no sites in WALIS for Lebanon, Syria, Turkey, and Greece. In these areas, Last Interglacial sea-level proxies are reported in the literature (e.g., Sanlaville, 1974; Dodonov et al., 2008; Tarıet al., 2018; Gaki-Papanastassiou et al., 2009) and should be screened to gauge whether enough metadata are available for their insertion in the following versions of WALIS. Also, Last Interglacial sea-level proxies from the Black Sea are reported by Pedoja et al. (2014) but are not yet present in WALIS 1.0. The published records in these areas need to be evaluated and eventually included in the subsequent versions of WALIS.
There is a substantial lack of data in WALIS 1.0 along the Atlantic coasts of northern and central Africa. However, there are several recent studies detailing Last Interglacial marine and coastal sequences in Morocco (Barton et al., 2009; Plaziat et al., 2008, 2006; Rhodes et al., 2006), Mauritania, and Senegal (Giresse et al., 2000), where data might be gathered for subsequent WALIS versions. There are only a few other reports of Last Interglacial shorelines (e.g., Gregory, 1962) south of Senegal, the first southwards being those in Angola inserted in WALIS 1.0 by Cooper and Green (2021).
Another area where more data could be added to WALIS is the Red Sea. Here, several U-series ages on corals have been reviewed by Chutcharavan and Dutton (2021a), some of which were identified as “sea-level index points from corals”. Further sea-level index points might be retrieved from studies reporting on Last Interglacial shorelines in Saudi Arabia (Dullo, 1990) and the Gulf of Suez (Parker et al., 2012; Bosworth and Taviani, 1996). On the other side of the Arabian Peninsula, in the Gulf of Oman and the Persian Gulf, the only data inserted in WALIS 1.0 are those related to MIS 5a/5c proxies (Thompson and Creveling, 2021b). However, potential MIS 5e sea-level proxies are reported in the literature from Oman (Falkenroth et al., 2020, 2019), United Arab Emirates, Qatar (Williams and Walkden, 2002), and Iran (Oveisi et al., 2007; Pirazzoli et al., 2004). These studies must be screened to gauge whether valid sea-level index points can be inserted in the subsequent versions of WALIS.
There are no data in WALIS 1.0 for India and the Chagos–Laccadive ridge. Key references from which data might be retrieved are Bhatt and Bhonde (2006), Banerjee (2000) (for India), Woodroffe (2005), and Gischler et al. (2008) (for the Chagos–Laccadive Ridge). Unfortunately, we could not find publications reporting data for Last Interglacial successions in Thailand, Malaysia, and the islands of Sumatra and Java. WALIS 1.0 also lacks data from the South China Sea; however, some potentially Last Interglacial sites were reported by Pedoja et al. (2008).
In Australia, the Last Interglacial data included in WALIS 1.0 are mainly derived from corals (Chutcharavan and Dutton, 2021a) along the western coast and the Great Barrier Reef. Thompson and Creveling (2021b) report MIS 5a/5c in South Australia. Further data on MIS 5e shorelines from strand plains in South Australia are available from several studies (Murray-Wallace and Belperio, 1991; Murray-Wallace, 2002; Murray-Wallace et al., 2016; Pan et al., 2018) and should be included in the subsequent versions of WALIS.
5.3 Future developments
While WALIS 1.0 represents a concrete result, we know there are several ways in which the WALIS database and infrastructure could be improved. We discuss the main avenues for improvement below. These emerged during the compilation of WALIS 1.0, and more will likely be identified as the database starts to be used by more end users.
-
As mentioned above, the database structure is now a collection of tables with no links defined in MySQL. Creating such a connection would imply a partial restructuring of the PHP interface. However, this would improve the overall structure of the WALIS database. Another technical improvement would consist in allowing bulk uploads, which at the current stage is not possible.
-
One of the main aims of WALIS is to standardize the reporting of sea-level proxies and dated samples for the Last Interglacial. The focus is on relative sea-level proxies for reconstructing former sea levels from WALIS data. The paleo RSL calculated from these proxies (Fig. 10) represents the sum of global mean sea-level changes (driven by ice melting and thermal expansion) and local effects due to land motions caused by subsidence, tectonic uplift, glacial isostatic adjustment, and other processes. Fields to report on rates of uplift or subsidence are present in WALIS, with the caveat that such estimates must be independent of the Last Interglacial sea-level record. Uplift or subsidence rates are stored in the database but are not used in WALIS to correct the paleo relative sea-level elevations. Future versions of WALIS should improve the fields describing land motion values, which would also entail revising the data already inserted in the database. One future addition to the database structure could be the insertion of fields reporting glacial isostatic adjustment (GIA) predictions and associated metadata (e.g., information on ice and earth models) published alongside the geological records. Another possible addition is the possibility to query (and save in the database) geodatabases of GIA predictions for each site.
-
To calculate paleo RSL from the elevation of stratigraphic sea-level index points, the data compiler must insert the upper and lower limits of occurrence of a given landform or stratigraphy in the modern environment, from which the indicative meaning is calculated. Unfortunately, these values are often not reported in the literature; therefore, in the WALIS interface, we suggest using IMCalc (Lorscheid and Rovere, 2019) to infer them from global wave and tide atlases and typical landform limits. However, as noted by the original authors of IMCalc, this tool only gives a first-order quantification of the indicative meaning, which should be replaced wherever possible by local information. We surmise that this is a challenge for the subsequent versions of WALIS and the scientific community working on Last Interglacial sea-level at large to start reporting, alongside fossil coastal sequences and quantitative information on their modern analogs (for an example, see Vyverberg et al., 2018).
-
In the current interface version, anyone with a valid account can insert data in the WALIS format. This means that it is possible that a data compiler may insert a duplicated record, either to propose an alternative interpretation or because they do not know that another data compiler previously inserted the record. While there is a general cross-check that prevents the insertion of records sharing the same general fields (e.g., site-subsite name combination, laboratory Sample ID), a new record can be inserted by changing these values. However, the suggested avenue for proposing a new interpretation of a data point is to use the “modify/delete” data button in the interface, which allows submitting to the database administrators' observations and notes on an existing record within the database, allowing a discussion to start on a record and track changes to be preserved.
-
As reported in the introduction, WALIS was preceded by efforts to create a global sea-level database of Holocene data (Khan et al., 2019) called HOLSEA. This database is in spreadsheet format, but there are already visualization tools built around it stemming from a MySQL structure (Drechsel et al., 2021). Following the interest of the sea-level community in the WALIS interface, and thanks to a “Data Stewardship Scholarship” awarded by PAGES (the Past Global Changes project) to Alessio Rovere and Nicole Khan, we started implementing the HOLSEA structure into WALIS. This work is still in beta version but, once completed, will allow data compilers to insert Holocene data via the WALIS interface. At the time of writing, it was possible to insert Holocene data, but it had not yet been fully implemented in the workflow shown in Fig. 1. The final goal is to make a unique database including all sea-level proxies, regardless of age.
WALIS 1.0 is released under a Creative Commons Attribution license 4.0 (CC BY 4.0, https://creativecommons.org/licenses/by/4.0/, last access: 15 December 2022). This license allows anyone to share and adapt our work for any use, also commercially, provided that the proper attribution is given. We encourage anyone to cite the review papers in the ESSD special issue alongside the original works in any new paper arising from further research that builds upon the data compiled in WALIS 1.0. Credit to the database administrators, key contributors, data compilers, and funding agencies that made WALIS possible should also be given. The easiest way to adhere to this requirement is to include in any derived work a suggested acknowledgment line embedded in the interface and the WALIS 1.0 distribution, alongside citations of original works.
Data in WALIS 1.0 are correct to the best of our knowledge, but we cannot exclude the presence of errors or defects. We encourage anyone finding issues or errata in WALIS 1.0 to suggest corrections using the online tools described in this paper or writing directly to the database administrators. Another important disclaimer is that WALIS 1.0 indicates sites (retrieved from literature) where samples were collected. There is no implied guarantee that the coordinates are accurate (some may be gathered from old maps or outdated site descriptions), that these sites are accessible, or that new samples can be lawfully collected at the same location. For the sake of preserving geological heritage and ethical field science (Peppoloni et al., 2019), we encourage anyone planning the collection of new samples to cross-check whether the original samples reported in WALIS are still available from the original data creators to avoid collecting new material.
The data presented in this paper are available through Zenodo: https://doi.org/10.5281/zenodo.7348242 (Rovere et al., 2022).
WALIS 1.0 collects data and metadata for thousands of sites globally, carrying information on Last Interglacial sea-level proxies. Each data point in WALIS 1.0 is related to the complete information needed to describe a sea-level index point, its age constraints, and all relevant metadata associated with these properties. We built the structure of WALIS following the guidelines of Düsterhus et al. (2016) to ensure database Accessibility, Transparency, Trust, Availability, Continuity, Completeness, and Communication of content (the so-called ATTAC3 properties). WALIS 1.0 is accessible in several formats, some non-proprietary: SQL, CSV, XLS, and GeoJSON. Data are also accessible (upon free registration) via the interface. Transparency is guaranteed via the interface and the documentation, which give ample details on the database structure and its fields. Also, the data quality is addressed, as described in the sections above. WALIS includes tools to increase trust between data compilers and data creators, namely the requirement, for each record, to insert literature references and the reminder, set on every instance of WALIS, to credit original authors. The data and code used to export data from the database and the database documentation are available on open-access repositories and can be forked on GitHub for subsequent modification. We embedded within the WALIS structure tools to allow the continuity of updating. The open-access repository we selected for the code and data includes versioning, and modifications to the existing records can be proposed and maintained in the track record. To the best of our knowledge, the WALIS structure is complete, as it includes all the relevant uncertainties and metadata useful to contextualize the database information. The content of WALIS is also communicated via an easy-to-use and intuitive visualization interface that can be freely accessed and for which the code is also available open access. We foresee that WALIS will be a valuable resource to the broader paleoclimate community to facilitate data–model integration and intercomparisons, assessments of sea-level reconstructions between different studies and regions, as well as comparisons between past sea-level history and other paleoclimate proxy data.
AR coordinated the creation of the WALIS database structure and wrote the first draft of the paper. DDR provided inputs on the database structure, in particular for the amino acid racemization ages table. MV, ARS and CVMW provided input on the definition of sea-level index points within the database. AD provided input on U-series ages and sea-level index points from single corals. All authors coordinated the data insertion process by data compilers and contributed to the final draft of the manuscript with their expertise on sea-level proxies and dating methods.
At least one of the (co-)authors is a guest member of the editorial board of Earth System Science Data for the special issue “WALIS – the World Atlas of Last Interglacial Shorelines”. The peer-review process was guided by an independent editor, and the authors also have no other competing interests to declare.
Publisher’s note: Copernicus Publications remains neutral with regard to jurisdictional claims in published maps and institutional affiliations.
This article is part of the special issue “WALIS – the World Atlas of Last Interglacial Shorelines”. It is not associated with a conference.
The data used in this study were extracted from WALIS, a sea-level database interface developed by the ERC Starting Grant WARMCOASTS (ERC-StG-802414) in collaboration with PALSEA (PAGES/INQUA) working group. The database structure was designed by Alessio Rovere, Deirdre D. Ryan, Thomas Lorscheid, Andrea Dutton, Peter Chutcharavan, Dominik Brill, Nathan Jankowski, Daniela Mueller, Melanie Bartz, Evan Gowan, and Kim Cohen. The data points used in this study were contributed to WALIS by Roland Freisleben, Deirdre Ryan, Peter Chutcharavan, Evan Gowan, Ann-Kathrin Petersen, Ciro Cerrone, Evan Tam, Jessica Creveling and Schmitty Thompson, Daniel Muhs, Oana Alexandra Dumitru, Alessio Rovere, WALIS Admin, Alexander Simms, Kim Cohen, Patrick Boyden, Kathrine Maxwell, Nadine Hallmann, Víctor Cartelle, Karla Zurisadai Rubio Sandoval, Gilbert Camoin, Andrew Cooper, Matteo Vacchi, Alexandra Villa, Simon Steidle, Alessandro Fontana, Dorit Sivan, Ehud Galili, Zomenia Zomeni, Rob Barnett, Natasha Barlow, Barbara Mauz, and Dominik Brill (in order of numbers of records inserted).
This project has received funding from the European Research Council (ERC) under the European Union's Horizon 2020 research and innovation programme (grant agreement no. 802414 to Alessio Rovere). Andrea Dutton acknowledges support from the National Science Foundation grant nos. 702740 and 2041325. The development of the WALIS visualization interface was sponsored by the PAGES “Data Stewardship Scholarship” given to Sebastian Garzòn. PAGES is supported by the Swiss Academy of Sciences and the Chinese Academy of Sciences.
This paper was edited by David Carlson and reviewed by Amila Sandaruwan Ratnayake and Georgia Grant.
Alonso, A. and Pagés, J.: Estratigrafia de los depositos costeros pleistocenos en el noroeste de Espana, J. Iber. Geol., 33, 207–221, 2007.
Ávila, S. P., Madeira, P., Zazo, C., Kroh, A., Kirby, M., da Silva, C. M., Cachão, M., and de Frias Martins, A. M.: Palaeoecology of the Pleistocene (MIS 5.5) outcrops of Santa Maria Island (Azores) in a complex oceanic tectonic setting, Palaeogeogr. Palaeocl., 274, 18–31, https://doi.org/10.1016/j.palaeo.2008.12.014, 2009.
Ávila, S. P., Melo, C., Silva, L., Ramalho, R. S., Quartau, R., Hipólito, A., Cordeiro, R., Rebelo, A. C., Madeira, P., Rovere, A., Hearty, P. J., Henriques, D., Silva, C. M. da, Martins, A. M. de F., and Zazo, C.: A review of the MIS 5e highstand deposits from Santa Maria Island (Azores, NE Atlantic): palaeobiodiversity, palaeoecology and palaeobiogeography, Quaternary Sci. Rev., 114, 126–148, https://doi.org/10.1016/j.quascirev.2015.02.012, 2015.
Banerjee, P. K.: Holocene and Late Pleistocene relative sea level fluctuations along the east coast of India, Mar. Geol., 167, 243–260, https://doi.org/10.1016/S0025-3227(00)00028-1, 2000.
Barton, R. N. E., Bouzouggar, A., Collcutt, S. N., Schwenninger, J.-L., and Clark-Balzan, L.: OSL dating of the Aterian levels at Dar es-Soltan I (Rabat, Morocco) and implications for the dispersal of modern Homo sapiens, Quaternary Sci. Rev., 28, 1914–1931, https://doi.org/10.1016/j.quascirev.2009.03.010, 2009.
Benedetti, M. M., Haws, J. A., Funk, C. L., Daniels, J. M., Hesp, P. A., Bicho, N. F., Minckley, T. A., Ellwood, B. B., and Forman, S. L.: Late Pleistocene raised beaches of coastal Estremadura, central Portugal, Quaternary Sci. Rev., 28, 3428–3447, https://doi.org/10.1016/j.quascirev.2009.09.029, 2009.
Bhatt, N. and Bhonde, U.: Geomorphic expression of late Quaternary sea level changes along the southern Saurashtra coast, western India, J. Earth Syst. Sci., 115, 395–402, https://doi.org/10.1007/BF02702868, 2006.
Blanc, A. C.: Una spiaggia pleistocenica a “Strombus bubonius” presso Palidoro (Roma), Ist. Ital. di Antropologia, 1936.
Bosworth, W. and Taviani, M.: Late Quaternary reorientation of stress field and extension direction in the southern Gulf of Suez, Egypt: Evidence from uplifted coral terraces, mesoscopic fault arrays, and borehole breakouts, Tectonics, 15, 791–802, https://doi.org/10.1029/95TC03851, 1996.
Boyden, P., Weil Accardo, J., Deschamps, P., Oppo, D., and Rovere, A.: Database of last interglacial sea level proxies in the East Africa and Western Indian Ocean Region, Zenodo [data set], https://doi.org/10.5281/zenodo.4302244, 2021a.
Boyden, P., Weil-Accardo, J., Deschamps, P., Oppo, D., and Rovere, A.: Last interglacial sea-level proxies in East Africa and the Western Indian Ocean, Earth Syst. Sci. Data, 13, 1633–1651, https://doi.org/10.5194/essd-13-1633-2021, 2021b.
Brandl, G.: Sphinx documentation, http://sphinx-doc.org/sphinx.pdf (last access: 15 December 2022), 2021.
Brigham-Grette, J. and Hopkins, D. M.: Emergent Marine Record and Paleoclimate of the Last Interglaciation along the Northwest Alaskan Coast, Quaternary Res., 43, 159–173, https://doi.org/10.1006/qres.1995.1017, 1995.
Brigham-Grette, J., Hopkins, D. M., Ivanov, V. F., Basilyan, A. E., Benson, S. L., Heiser, P. A., and Pushkar, V. S.: Last Interglacial (isotope stage 5) glacial and sea-level history of coastal Chukotka Peninsula and St. Lawrence Island, Western Beringia, Quaternary Sci. Rev., 20, 419–436, https://doi.org/10.1016/S0277-3791(00)00107-4, 2001.
Celsius, A.: Anmärkning om vatnets förminskande sa i Östersiönsom Vesterhafvet, Kongl. Swenska Wetenskaps Academiens Handlingar, 4, 33–50, 1743.
Cerrone, C., Vacchi, M., Fontana, A., and Rovere, A.: Last interglacial sea-level index points in the Western Mediterranean, Zenodo [data set], https://doi.org/10.5281/zenodo.5341661, 2021a.
Cerrone, C., Vacchi, M., Fontana, A., and Rovere, A.: Last Interglacial sea-level proxies in the western Mediterranean, Earth Syst. Sci. Data, 13, 4485–4527, https://doi.org/10.5194/essd-13-4485-2021, 2021b.
Chappell, J., Omura, A., Esat, T., McCulloch, M., Pandolfi, J., Ota, Y., and Pillans, B.: Reconciliaion of late Quaternary sea levels derived from coral terraces at Huon Peninsula with deep sea oxygen isotope records, Earth Planet. Sc. Lett., 141, 227–236, https://doi.org/10.1016/0012-821X(96)00062-3, 1996.
Chutcharavan, P. M. and Dutton, A.: A global compilation of U-series-dated fossil coral sea-level indicators for the Last Interglacial period (Marine Isotope Stage 5e), Earth Syst. Sci. Data, 13, 3155–3178, https://doi.org/10.5194/essd-13-3155-2021, 2021a.
Chutcharavan, P. M. and Dutton, A.: Global database of U-series dated fossil coral sea-level indicators for the Last Interglacial period, Zenodo [data set], https://doi.org/10.5281/zenodo.4792284, 2021b.
Cohen, K. M., Cartelle, V., Barnett, R., Busschers, F. S., and Barlow, N. L. M.: Last Interglacial sea-level data points from Northwest Europe, Earth Syst. Sci. Data, 14, 2895–2937, https://doi.org/10.5194/essd-14-2895-2022, 2022.
Cohen, K. M., Cartelle, V., Barnett, R., Busschers, F. S., and Barlow, N. L. M.: Last Interglacial sea-level data points from Northwest Europe, Zenodo [data set], https://doi.org/10.5281/zenodo.5608459, 2021.
Cooper, A. and Green, A.: Database of Last Interglacial sea levels in Angola, Namibia and South Africa, Zenodo [data set], https://doi.org/10.5281/zenodo.4459297, 2020.
Cooper, J. A. G. and Green, A. N.: A standardized database of Marine Isotope Stage 5e sea-level proxies in southern Africa (Angola, Namibia and South Africa), Earth Syst. Sci. Data, 13, 953–968, https://doi.org/10.5194/essd-13-953-2021, 2021.
Creveling, J. R., Mitrovica, J. X., Clark, P. U., Waelbroeck, C., and Pico, T.: Predicted bounds on peak global mean sea level during marine isotope stages 5a and 5c, Quaternary Sci. Rev., 163, 193–208, https://doi.org/10.1016/j.quascirev.2017.03.003, 2017.
Dalton, A. S., Gowan, E. J., Mangerud, J., Möller, P., Lunkka, J. P., and Astakhov, V.: Last interglacial (MIS 5e) sea level proxies in the glaciated Northern Hemisphere, Zenodo [data set], https://doi.org/10.5281/zenodo.5602213, 2021.
Dalton, A. S., Gowan, E. J., Mangerud, J., Möller, P., Lunkka, J. P., and Astakhov, V.: Last interglacial sea-level proxies in the glaciated Northern Hemisphere, Earth Syst. Sci. Data, 14, 1447–1492, https://doi.org/10.5194/essd-14-1447-2022, 2022.
De Lamothe, R.: Les anciennes lignes de rivage du Sahel d'Alger et d'une partie de la côte Algérienne, Societe geologique de France, 1911.
De Vries, H. and Barendsen, G.: Measurements of age by the carbon-14 technique, Nature, 174, 1138–1141, 1954.
DeConto, R. M., Pollard, D., Alley, R. B., Velicogna, I., Gasson, E., Gomez, N., Sadai, S., Condron, A., Gilford, D. M., Ashe, E. L., Kopp, R. E., Li, D., and Dutton, A.: The Paris Climate Agreement and future sea-level rise from Antarctica, Nature, 593, 83–89, 2021.
Dodonov, A. E., Trifonov, V. G., Ivanova, T. P., Kuznetsov, V. Yu., Maksimov, F. E., Bachmanov, D. M., Sadchikova, T. A., Simakova, A. N., Minini, H., Al-Kafri, A.-M., and Ali, O.: Late Quaternary marine terraces in the Mediterranean coastal area of Syria: Geochronology and neotectonics, Quatern. Int., 190, 158–170, https://doi.org/10.1016/j.quaint.2008.02.008, 2008.
Drechsel, J., Khan, N. S., and Rovere, A.: PALEO-SEAL: A tool for the visualization and sharing of Holocene sea-level data, Quaternary Sci. Rev., 259, 106884, https://doi.org/10.1016/j.quascirev.2021.106884, 2021.
Dullo, W.-C.: Facies, fossil record, and age of pleistocene reefs from the Red Sea (Saudi Arabia), Facies, 22, 1–45, https://doi.org/10.1007/BF02536943, 1990.
Dumitru, O. A., Polyak, V. J., Asmerom, Y., and Onac, B. P.: Last interglacial sea-level history from speleothems: a global standardized database, Earth Syst. Sci. Data, 13, 2077–2094, https://doi.org/10.5194/essd-13-2077-2021, 2021.
Dumitru, O.-A., Polyak, V. J., Asmerom, Y., and Onac, B. P.: Last Interglacial sea-level history from speleothems: a global standardized database, Zenodo [data set], https://doi.org/10.5281/zenodo.4681307, 2020.
Düsterhus, A., Rovere, A., Carlson, A. E., Horton, B. P., Klemann, V., Tarasov, L., Barlow, N. L. M., Bradwell, T., Clark, J., Dutton, A., Gehrels, W. R., Hibbert, F. D., Hijma, M. P., Khan, N., Kopp, R. E., Sivan, D., and Törnqvist, T. E.: Palaeo-sea-level and palaeo-ice-sheet databases: problems, strategies, and perspectives, Clim. Past, 12, 911–921, https://doi.org/10.5194/cp-12-911-2016, 2016.
Dutton, A. and Lambeck, K.: Ice Volume and Sea Level During the Last Interglacial, Science, 337, 216–219, https://doi.org/10.1126/science.1205749, 2012.
Dutton, A., Carlson, A. E., Long, A. J., Milne, G. A., Clark, P. U., DeConto, R., Horton, B. P., Rahmstorf, S., and Raymo, M. E.: Sea-level rise due to polar ice-sheet mass loss during past warm periods, Science, 349, aaa4019, https://doi.org/10.1126/science.aaa4019, 2015.
Dutton, A., Rubin, K., McLean, N., Bowring, J., Bard, E., Edwards, R. L., Henderson, G. M., Reid, M. R., Richards, D. A., Sims, K. W. W., Walker, J. D., and Yokoyama, Y.: Data reporting standards for publication of U-series data for geochronology and timescale assessment in the earth sciences, Quat. Geochronol., 39, 142–149, https://doi.org/10.1016/j.quageo.2017.03.001, 2017.
Dutton, A., Villa, A., and Chutcharavan, P. M.: Database of Last Interglacial sea level indicators from the Bahamas, Turks and Caicos, and the east coast of Florida, USA, Zenodo [data set], https://doi.org/10.5281/zenodo.5596899, 2021.
Dyer, B., Austermann, J., D'Andrea, W. J., Creel, R. C., Sandstrom, M. R., Cashman, M., Rovere, A., and Raymo, M. E.: Sea-level trends across the Bahamas constrain peak last interglacial ice melt, P. Natl. Acad. Sci. USA, 118, e2026839118, https://doi.org/10.1073/pnas.2026839118, 2021.
Engelhart, S. E. and Horton, B. P.: Holocene sea level database for the Atlantic coast of the United States, Quaternary Sci. Rev., 54, 12–25, 2012.
Falkenroth, M., Schneider, B., and Hoffmann, G.: Beachrock as sea-level indicator – A case study at the coastline of Oman (Indian Ocean), Quaternary Sci. Rev., 206, 81–98, https://doi.org/10.1016/j.quascirev.2019.01.003, 2019.
Falkenroth, M., Adolphs, S., Cahnbley, M., Bagci, H., Kázmér, M., Mechernich, S., and Hoffmann, G.: Biological Indicators Reveal Small-Scale Sea-Level Variability During MIS 5e (Sur, Sultanate of Oman), Open Quaternary, 6, 1–20, https://doi.org/10.5334/oq.72, 2020.
Farrell, W. and Clark, J. A.: On postglacial sea level, Geophys. J. Int., 46, 647–667, 1976.
Ferranti, L., Antonioli, F., Mauz, B., Amorosi, A., Dai Pra, G., Mastronuzzi, G., Monaco, C., Orrù, P., Pappalardo, M., Radtke, U., Renda, P., Romano, P., Sansò, P., and Verrubbi, V.: Markers of the last interglacial sea-level high stand along the coast of Italy: Tectonic implications, Quatern. Int., 145–146, 30–54, https://doi.org/10.1016/j.quaint.2005.07.009, 2006.
Forbes, J.: On the Temple of Jupiter Serapis at Pozzuoli and the phenomena which it exhibits, Edinb. J. Sci. New Series, 1, 260–286, 1829.
Freisleben, R., Jara-Muñoz, J., Melnick, D., Martínez, J. M., and Strecker, M.: Marine terraces of the last interglacial period along the Pacific coast of South America (1∘ N–40∘ S), Zenodo [data set], https://doi.org/10.5281/zenodo.4309748, 2020.
Freisleben, R., Jara-Muñoz, J., Melnick, D., Martínez, J. M., and Strecker, M. R.: Marine terraces of the last interglacial period along the Pacific coast of South America (1∘ N–40∘ S), Earth Syst. Sci. Data, 13, 2487–2513, https://doi.org/10.5194/essd-13-2487-2021, 2021.
Gaki-Papanastassiou, K., Karymbalis, E., Papanastassiou, D., and Maroukian, H.: Quaternary marine terraces as indicators of neotectonic activity of the Ierapetra normal fault SE Crete (Greece), Geomorphology, 104, 38–46, https://doi.org/10.1016/j.geomorph.2008.05.037, 2009.
Gallagher, C. and Thorp, M.: The age of the Pleistocene raised beach near Fethard, County Wexford, using infra red stimulated luminescence (IRSL), Irish Geography, 30, 68–89, 1997.
Garzón, S. and Rovere, A.: WALIS visualization interface (Version 2.0), Zenodo [code], https://doi.org/10.5281/zenodo.7252121, 2022.
Gehrels, W. R. and Shennan, I.: Sea level in time and space: revolutions and inconvenient truths, J. Quaternary Sci., 30, 131–143, 2015.
Gilford, D. M., Ashe, E. L., DeConto, R. M., Kopp, R. E., Pollard, D., and Rovere, A.: Could the Last Interglacial Constrain Projections of Future Antarctic Ice Mass Loss and Sea-level Rise?, J. Geophys. Res.-Earth, 125, e2019JF005418, https://doi.org/10.1029/2019JF005418, 2020.
Giresse, P., Barusseau, J.-P., Causse, C., and Diouf, B.: Successions of sea-level changes during the Pleistocene in Mauritania and Senegal distinguished by sedimentary facies study and U/Th dating, Mar. Geol., 170, 123–139, https://doi.org/10.1016/S0025-3227(00)00070-0, 2000.
Gischler, E., Hudson, J. H., and Pisera, A.: Late Quaternary reef growth and sea level in the Maldives (Indian Ocean), Mar. Geol., 250, 104–113, https://doi.org/10.1016/j.margeo.2008.01.004, 2008.
Goodfriend, G. A., Brigham-Grette, J., and Miller, G. H.: Enhanced Age Resolution of the Marine Quaternary Record in the Arctic Using Aspartic Acid Racemization Dating of Bivalve Shells, Quaternary Res., 45.2, 176–187, 1996.
Gowan, E. J., Rovere, A., Ryan, D. D., Richiano, S., Montes, A., Pappalardo, M., and Aguirre, M. L.: Last interglacial (MIS 5e) sea-level proxies in southeastern South America, Zenodo [data set], https://doi.org/10.5281/zenodo.4313799, 2020.
Gowan, E. J., Rovere, A., Ryan, D. D., Richiano, S., Montes, A., Pappalardo, M., and Aguirre, M. L.: Last interglacial (MIS 5e) sea-level proxies in southeastern South America, Earth Syst. Sci. Data, 13, 171–197, https://doi.org/10.5194/essd-13-171-2021, 2021.
Gregory, S.: The Raised Beaches of the Peninsula Area of Sierra Leone, Transactions and Papers (Institute of British Geographers), 15–22, https://doi.org/10.2307/621084, 1962.
Hallmann, N. and Camoin, G.: Database of Last Interglacial (MIS 5e) sea-level proxies on tropical Pacific islands, Zenodo [data set], https://doi.org/10.5281/zenodo.4731480, 2020.
Hallmann, N., Camoin, G., Webster, J. M., and Humblet, M.: A standardized database of Marine Isotopic Stage 5e sea-level proxies on tropical Pacific islands, Earth Syst. Sci. Data, 13, 2651–2699, https://doi.org/10.5194/essd-13-2651-2021, 2021.
Hibbert, F. D., Rohling, E. J., Dutton, A., Williams, F. H., Chutcharavan, P. M., Zhao, C., and Tamisiea, M. E.: Coral indicators of past sea-level change: A global repository of U-series dated benchmarks, Quaternary Sci. Rev., 145, 1–56, https://doi.org/10.1016/j.quascirev.2016.04.019, 2016.
Issel, A.: Le oscillazioni lente del suolo o bradisismi: saggio di geologia storica, R. Istituto de'sordomuti, 1883.
Issel, A.: Lembi fossiliferi quaternarie recenti nella Sardegna meridionale, Accademia Nazionale dei Lincei, Serie, 5, 759–770, 1914.
Jara-Muñoz, J., Melnick, D., and Strecker, M. R.: TerraceM: A MATLAB® tool to analyze marine and lacustrine terraces using high-resolution topography, Geosphere, 12, 176–195, 2016.
Khan, N. S., Horton, B. P., Engelhart, S., Rovere, A., Vacchi, M., Ashe, E. L., Törnqvist, T. E., Dutton, A., Hijma, M. P., and Shennan, I.: Inception of a global atlas of sea levels since the Last Glacial Maximum, Quaternary Sci. Rev., 220, 359–371, 2019.
Khim, B.-K., Krantz, D. E., and Brigham-Grette, J.: Stable isotope profiles of Last Interglacial (Pelukian Transgression) mollusks and paleoclimate implications in the Bering Strait Region, Quaternary Sci. Rev., 20, 463–483, https://doi.org/10.1016/S0277-3791(00)00104-9, 2001.
Lamothe, M.: Luminescence dating of interglacial coastal depositional systems: Recent developments and future avenues of research, Quaternary Sci. Rev., 146, 1–27, https://doi.org/10.1016/j.quascirev.2016.05.005, 2016.
López-Martínez, J., Schmid, T., Serrano, E., Mink, S., Nieto, A., and Guillaso, S.: Geomorphology and landforms distribution in selected ice-free areas in the South Shetland Islands, Antarctic Northern Peninsula region, Cuadernos de Investigación Geográfica, 42, 435–455, https://doi.org/10.18172/cig.2965, 2016.
Lorscheid, T. and Rovere, A.: The indicative meaning calculator – quantification of paleo sea-level relationships by using global wave and tide datasets, Open geospatial data, Softw. Stand., 4, 10, https://doi.org/10.1186/s40965-019-0069-8, 2019.
Mauz, B.: Database of last interglacial sea-level proxies in the eastern Mediterranean, Zenodo [data set], https://doi.org/10.5281/zenodo.4454553, 2020.
Mauz, B. and Elmejdoub, N.: A review of last interglacial sea-level proxies in the eastern Mediterranean coastal region, Physical Sciences and Mathematics, Eartharxiv [preprint], https://doi.org/10.31223/X50G6H, 2021.
Mauz, B., Vacchi, M., Green, A., Hoffmann, G., and Cooper, A.: Beachrock: A tool for reconstructing relative sea level in the far-field, Mar. Geol., 362, 1–16, https://doi.org/10.1016/j.margeo.2015.01.009, 2015.
Mauz, B., Sivan, D., and Galili, E.: MIS 5e sea-level proxies in the eastern Mediterranean coastal region, https://essd.copernicus.org/preprints/essd-2020-357/essd-2020-357.pdf (last access: 15 December 2022), 2020.
Maxwell, K., Westphal, H., and Rovere, A.: A standardized database of Last Interglacial (MIS 5e) sea-level indicators in Southeast Asia, Earth Syst. Sci. Data, 13, 4313–4329, https://doi.org/10.5194/essd-13-4313-2021, 2021a.
Maxwell, K., Westphal, H., and Rovere, A.: Database of Last Interglacial (MIS 5e) Sea-level Indicators in Southeast Asia, Zenodo [data set], https://doi.org/10.5281/zenodo.5040784, 2021b.
McKay, N. P., Overpeck, J. T., and Otto-Bliesner, B. L.: The role of ocean thermal expansion in Last Interglacial sea level rise, Geophys. Res. Lett., 38, L14605, https://doi.org/10.1029/2011GL048280, 2011.
Medina-Elizalde, M.: A global compilation of coral sea-level benchmarks: Implications and new challenges, Earth Planet. Sc. Lett., 362, 310–318, https://doi.org/10.1016/j.epsl.2012.12.001, 2013.
Meireles, J. and Texier, J. P.: Etude morpho-stratigraphique des dépôts littoraux du Minho (NW du Portugal) [Morpho-stratigraphic study of littoral deposits of the Minho region (NW Portugal)], Quaternaire, 11, 21–29, https://doi.org/10.3406/quate.2000.1652, 2000.
Mitchell, S. F., Pickerill, R. K., and Stemann, T. A.: The Port Morant Formation (Upper Pleistocene, Jamaica): high resolution sedimentology and paleoenvironmental analysis of a mixed carbonate clastic lagoonal succession, Sediment. Geol., 144, 291–306, https://doi.org/10.1016/S0037-0738(01)00101-4, 2001.
Mitchell, S. F., James, S. A., and Brown, I. C.: A late Pleistocene progradational clastic shoreface succession in Jamaica: Implications for the preservation potential of the echinoid Leodia, Lethaia, 39, 321–327, https://doi.org/10.1080/00241160600847553, 2006.
Muhs, D., Wehmiller, J., Ryan, D. D., and Rovere, A.: MIS 5e relative sea-level index points along the Pacific coast of North America, Zenodo [data set], https://doi.org/10.5281/zenodo.5903285, 2021a.
Muhs, D. R.: MIS 5e sea-level history along the Pacific coast of North America, Earth Syst. Sci. Data, 14, 1271–1330, https://doi.org/10.5194/essd-14-1271-2022, 2022.
Muhs, D. R., Simmons, K. R., and Steinke, B.: Timing and warmth of the Last Interglacial period: new U-series evidence from Hawaii and Bermuda and a new fossil compilation for North America, Quaternary Sci. Rev., 21, 1355–1383, https://doi.org/10.1016/S0277-3791(01)00114-7, 2002.
Muhs, D. R., Wehmiller, J. F., Simmons, K. R., and York, L. L.: Quaternary sea-level history of the United States, in: Developments in Quaternary Sciences, vol. 1, Elsevier, 147–183, https://doi.org/10.1016/S1571-0866(03)01008-X, 2003.
Muhs, D. R., Meco, J., and Simmons, K. R.: Uranium-series ages of corals, sea level history, and palaeozoogeography, Canary Islands, Spain: An exploratory study for two Quaternary interglacial periods, Palaeogeogr. Palaeocl., 394, 99–118, https://doi.org/10.1016/j.palaeo.2013.11.015, 2014.
Muhs, D. R., Schweig, E. S., Simmons, K. R., and Halley, R. B.: Late Quaternary uplift along the North America-Caribbean plate boundary: Evidence from the sea level record of Guantanamo Bay, Cuba, Quaternary Sci. Rev., 178, 54–76, https://doi.org/10.1016/j.quascirev.2017.10.024, 2017.
Muhs, D. R., Simmons, K. R., Schumann, R. R., Schweig, E. S., and Rowe, M. P.: Testing glacial isostatic adjustment models of last-interglacial sea level history in the Bahamas and Bermuda, Quaternary Sci. Rev., 233, 106212, https://doi.org/10.1016/j.quascirev.2020.106212, 2020.
Muhs, D. R., Schumann, R. R., Groves, L. T., Simmons, K. R., and Florian, C. R.: The marine terraces of Santa Cruz Island, California: Implications for glacial isostatic adjustment models of last-interglacial sea-level history, Geomorphology, 389, 107826, https://doi.org/10.1016/j.geomorph.2021.107826, 2021b.
Murray-Wallace, C. and Belperio, A.: The last interglacial shoreline in Australia – a review, Quaternary Sci. Rev., 10, 441–461, 1991.
Murray-Wallace, C. V.: Pleistocene coastal stratigraphy, sea-level highstands and neotectonism of the southern Australian passive continental margin?a review, J. Quaternary Sci., 17, 469–489, https://doi.org/10.1002/jqs.717, 2002.
Murray-Wallace, C. V. and Woodroffe, C. D.: Quaternary sea-level changes: a global perspective, Cambridge University Press, ISBN 9781108445856, 2014.
Murray-Wallace, C. V., Belperio, A. P., Dosseto, A., Nicholas, W. A., Mitchell, C., Bourman, R. P., Eggins, S. M., and Grün, R.: Last interglacial (MIS 5e) sea-level determined from a tectonically stable, far-field location, Eyre Peninsula, southern Australia, Aust. J. Earth Sci., 63, 611–630, https://doi.org/10.1080/08120099.2016.1229693, 2016.
Navas, A., López-Martínez, J., Casas, J., Machín, J., Durán, J. J., Serrano, E., and Cuchi, J.-A.: Soil Characteristics along a Transect on Raised Marine Surfaces on Byers Peninsula, Livingston Island, South Shetland Islands, in: Antarctica, edited by: Fütterer, D. K., Damaske, D., Kleinschmidt, G., Miller, H., and Tessensohn, F., Springer-Verlag, Berlin/Heidelberg, 467–473, https://doi.org/10.1007/3-540-32934-X_60, 2006.
O'Neal, M. L. and McGeary, S.: Late Quaternary stratigraphy and sea-level history of the northern Delaware Bay margin, southern New Jersey, USA: a ground penetrating radar analysis of composite Quaternary coastal terraces, Quaternary Sci. Rev., 21, 929–946, https://doi.org/10.1016/S0277-3791(01)00051-8, 2002.
Orme, A. R.: Quaternary Changes of Sea-level in Ireland, T. I. Brit. Geogr., 39, 127–140, https://doi.org/10.2307/621680, 1966.
Ota, Y. and Omura, A.: Late Quaternary shorelines in the Japanese islands, The Quaternary Research (Daiyonki-Kenkyu), 30, 175–186, 1991.
Otvos, E. G.: Beach ridges – definitions and significance, Geomorphology, 32, 83–108, https://doi.org/10.1016/S0169-555X(99)00075-6, 2000.
Oveisi, B., Lavé, J., and van der Beek, P.: Rates and Processes of Active Folding Evidenced by Pleistocene Terraces at the Central Zagros Front (Iran), in: Thrust Belts and Foreland Basins, edited by: Lacombe, O., Roure, F., Lavé, J., and Vergés, J., Springer Berlin Heidelberg, Berlin, Heidelberg, 267–287, https://doi.org/10.1007/978-3-540-69426-7_14, 2007.
Pan, T.-Y., Murray-Wallace, C. V., Dosseto, A., and Bourman, R. P.: The last interglacial (MIS 5e) sea level highstand from a tectonically stable far-field setting, Yorke Peninsula, southern Australia, Mar. Geol., 398, 126–136, https://doi.org/10.1016/j.margeo.2018.01.012, 2018.
Parker, J. H., Gischler, E., and Eisenhauer, A.: Biodiversity of foraminifera from Late Pleistocene to Holocene coral reefs, South Sinai, Egypt, Mar. Micropaleontol., 86–87, 59–75, https://doi.org/10.1016/j.marmicro.2012.02.002, 2012.
Pasquetti, F., Bini, M., Giaccio, B., Ratti, A., Vacchi, M., and Zanchetta, G.: Chronology of the Mediterranean sea-level highstand during the Last Interglacial: a critical review of the U/Th-dated deposits, J. Quaternary Sci, 36, 1174–1189, https://doi.org/10.1002/jqs.3359, 2021.
Pedoja, K., Shen, J.-W., Kershaw, S., and Tang, C.: Coastal Quaternary morphologies on the northern coast of the South China Sea, China, and their implications for current tectonic models: A review and preliminary study, Mar. Geol., 255, 103–117, https://doi.org/10.1016/j.margeo.2008.02.002, 2008.
Pedoja, K., Husson, L., Regard, V., Cobbold, P. R., Ostanciaux, E., Johnson, M. E., Kershaw, S., Saillard, M., Martinod, J., Furgerot, L., Weill, P., and Delcaillau, B.: Relative sea-level fall since the last interglacial stage: Are coasts uplifting worldwide?, Earth-Sci. Rev., 108, 1–15, https://doi.org/10.1016/j.earscirev.2011.05.002, 2011.
Pedoja, K., Authemayou, C., Pinegina, T., Bourgeois, J., Nexer, M., Delcaillau, B., and Regard, V.: “Arc-continent collision” of the Aleutian-Komandorsky arc into Kamchatka: Insight into Quaternary tectonic segmentation through Pleistocene marine terraces and morphometric analysis of fluvial drainage, Tectonics, 32, 827–842, https://doi.org/10.1002/tect.20051, 2013.
Pedoja, K., Husson, L., Johnson, M. E., Melnick, D., Witt, C., Pochat, S., Nexer, M., Delcaillau, B., Pinegina, T., Poprawski, Y., Authemayou, C., Elliot, M., Regard, V., and Garestier, F.: Coastal staircase sequences reflecting sea-level oscillations and tectonic uplift during the Quaternary and Neogene, Earth-Sci. Rev., 132, 13–38, https://doi.org/10.1016/j.earscirev.2014.01.007, 2014.
Peltier, W.: The impulse response of a Maxwell Earth, Rev. Geophys., 12, 649–669, 1974.
Peppoloni, S., Bilham, N., and Di Capua, G.: Contemporary Geoethics Within the Geosciences, in: Exploring Geoethics, edited by: Bohle, M., Palgrave Pivot, Cham, https://doi.org/10.1007/978-3-030-12010-8_2, 2019.
Pirazzoli, P. A.: World atlas of Holocene sea-level changes, Elsevier Oceanography Series, 58, Elsevier, Amsterdam/Oxford/New York/Tokyo, ISBN 0-444-89086-6, e-ISBN 978-0-444-89086-3. X, 300 pp., 1991.
Pirazzoli, P. A., Reyss, J.-L., Fontugne, M., Haghipour, A., Hilgers, A., Kasper, H. U., Nazari, H., Preusser, F., and Radtke, U.: Quaternary coral-reef terraces from Kish and Qeshm Islands, Persian Gulf: new radiometric ages and tectonic implications, Quatern. Int., 120, 15–27, https://doi.org/10.1016/j.quaint.2004.01.003, 2004.
Plaziat, J.-C., Aberkan, M., and Reyss, J.-L.: New late Pleistocene seismites in a shoreline series including eolianites, north of Rabat (Morocco), B. Soc. Géol. Fr., 177, 323–332, https://doi.org/10.2113/gssgfbull.177.6.323, 2006.
Plaziat, J.-C., Aberkan, M., Ahmamou, M., and Choukri, A.: The Quaternary Deposits of Morocco, in: Continental Evolution: The Geology of Morocco, vol. 116, edited by: Michard, A., Saddiqi, O., Chalouan, A., and Lamotte, D. F. de, Springer Berlin Heidelberg, Berlin, Heidelberg, 359–376, https://doi.org/10.1007/978-3-540-77076-3_8, 2008.
Rhodes, E. J., Singarayer, J. S., Raynal, J.-P., Westaway, K. E., and Sbihi-Alaoui, F. Z.: New age estimates for the Palaeolithic assemblages and Pleistocene succession of Casablanca, Morocco, Quaternary Sci. Rev., 25, 2569–2585, https://doi.org/10.1016/j.quascirev.2005.09.010, 2006.
Rovere, A. and Dutton, A.: PaLsea: 13 years of ice-sheet and sea-level science, Past Global Changes Magazine, 29, 18–20, https://doi.org/10.22498/pages.29.1.18, 2021.
Rovere, A., Raymo, M. E., Vacchi, M., Lorscheid, T., Stocchi, P., Gómez-Pujol, L., Harris, D. L., Casella, E., O'Leary, M. J., and Hearty, P. J.: The analysis of Last Interglacial (MIS 5e) relative sea-level indicators: Reconstructing sea-level in a warmer world, Earth-Sci. Rev., 159, 404–427, https://doi.org/10.1016/j.earscirev.2016.06.006, 2016.
Rovere, A., Ryan, D., Murray-Wallace, C., Simms, A., Vacchi, M., Dutton, A., Lorscheid, T., Chutcharavan, P., Brill, D., Bartz, M., Jankowski, N., Mueller, D., Cohen, K., and Gowan, E.: Descriptions of database fields for the World Atlas of Last Interglacial Shorelines (WALIS), Zenodo [data set], https://doi.org/10.5281/zenodo.3961544, 2020.
Rovere, A., Ryan, D. D., Vacchi, M., Dutton, A., Simms, A., and Murray-Wallace, C.: WALIS – The World Atlas of Last Interglacial Shorelines (Ver 1.0 final), Zenodo [code and data set], https://doi.org/10.5281/zenodo.7348242, 2022.
Rubio-Sandoval, K., Rovere, A., Cerrone, C., Stocchi, P., Lorscheid, T., Felis, T., Petersen, A.-K., and Ryan, D. D.: A review of last interglacial sea-level proxies in the western Atlantic and southwestern Caribbean, from Brazil to Honduras, Earth Syst. Sci. Data, 13, 4819–4845, https://doi.org/10.5194/essd-13-4819-2021, 2021a.
Rubio-Sandoval, K., Rovere, A., Cerrone, C., Stocchi, P., Lorscheid, T., Felis, T., Petersen, A.-K., and Ryan, D. D.: Last Interglacial sea-level proxies in the Western Atlantic and Southwestern Caribbean, from Brazil to Honduras, Zenodo [data set], https://doi.org/10.5281/zenodo.5516444, 2021b.
Ryan, D. D., Clement, A. J. H., Jankowski, N. R., Stocchi, P., and Rovere, A.: The last interglacial sea-level record of Aotearoa New Zealand – WALIS database of sea-level indicators, Zenodo [data set], https://doi.org/10.5281/zenodo.4590188, 2020.
Ryan, D. D., Clement, A. J. H., Jankowski, N. R., and Stocchi, P.: The last interglacial sea-level record of Aotearoa New Zealand, Earth Syst. Sci. Data, 13, 3399–3437, https://doi.org/10.5194/essd-13-3399-2021, 2021.
Ryang, W. H. and Simms, A. R.: Last Interglacial Sea Levels within the Korean Peninsula, Zenodo [data set], https://doi.org/10.5281/zenodo.4974826, 2021.
Ryang, W. H., Simms, A. R., Yoon, H. H., Chun, S. S., and Kong, G. S.: Last interglacial sea-level proxies in the Korean Peninsula, Earth Syst. Sci. Data, 14, 117–142, https://doi.org/10.5194/essd-14-117-2022, 2022.
Sanlaville, P.: Le rôle de la mer dans les aplanissements côtiers du Liban, in: Revue de géographie de Lyon, 49, 295–310, https://doi.org/10.3406/geoca.1974.1656, 1974.
Schielein, P., Burow, C., Pajon, J., Rojas Consuegra, R., Zhao, J., and Schellmann, G.: ESR and U-Th dating results for Last Interglacial coral reef terraces at the northern coast of Cuba, Quatern. Int., 556, 216–229, https://doi.org/10.1016/j.quaint.2019.11.041, 2020.
Shennan, I.: Interpretation of Flandrian sea-level data from the Fenland, England, P. Geologist. Assoc., 93, 53–63, 1982.
Shennan, I., Long, A. J., and Horton, B. P.: Handbook of sea-level research, edited by: Shennan, I., Long, A. J., and Horton, B. P., John Wiley & Sons, Print ISBN 9781118452585, Online ISBN 9781118452547, https://doi.org/10.1002/9781118452547, 2015.
Simms, A. R.: Last Interglacial Sea Levels within the Gulf of Mexico and northwestern Caribbean Sea, Zenodo [data set], https://doi.org/10.5281/zenodo.4556163, 2020.
Simms, A. R.: Last interglacial sea levels within the Gulf of Mexico and northwestern Caribbean Sea, Earth Syst. Sci. Data, 13, 1419–1439, https://doi.org/10.5194/essd-13-1419-2021, 2021.
Sivan, D. and Galili, E.: The last interglacial sea-level record of the Israeli coastline – WALIS database of sea-level indicators, Zenodo [data set], https://doi.org/10.5281/zenodo.4274178, 2020.
Steidle, S. D., Warken, S. F., Schorndorf, N., Förstel, J., Schröder-Ritzrau, A., Moseley, G. E., Spötl, C., Aviles, J., Stinnesbeck, W., and Frank, N.: Reconstruction of Middle to Late Quaternary sea level using submerged speleothems from the northeastern Yucatán Peninsula, J. Quaternary Sci, 36, 1190–1200, https://doi.org/10.1002/jqs.3365, 2021.
Tam, E. and Yokoyama, Y.: Database of Last Interglacial Sea-level Proxies in and around Japan, Zenodo [data set], https://doi.org/10.5281/zenodo.4294326, 2020.
Tam, E. and Yokoyama, Y.: A review of MIS 5e sea-level proxies around Japan, Earth Syst. Sci. Data, 13, 1477–1497, https://doi.org/10.5194/essd-13-1477-2021, 2021.
Tarı, U., Tüysüz, O., Blackwell, B. A. B., Mahmud, Z., Florentin, J. A., Qi, J., Genç, Ş. C., and Skinner, A. R.: Sealevel change and tectonic uplift from dated marine terraces along the eastern Mediterranean coast, southeastern Turkey, Palaeogeogr. Palaeocl., 511, 80–102, https://doi.org/10.1016/j.palaeo.2018.07.003, 2018.
Thompson, S. and Creveling, J.: WALIS Spreadsheet Thompson Creveling v2.0, Zenodo [data set], https://doi.org/10.5281/zenodo.5021306, 2021a.
Thompson, S. B. and Creveling, J. R.: A global database of marine isotope substage 5a and 5c marine terraces and paleoshoreline indicators, Earth Syst. Sci. Data, 13, 3467–3490, https://doi.org/10.5194/essd-13-3467-2021, 2021b.
Van de Plassche, O.: Sea-level research: A manual for the collection and evaluation of data, Geobooks, UK (Norwich), 1986.
Vyverberg, K., Dechnik, B., Dutton, A., Webster, J. M., Zwartz, D., and Portell, R. W.: Episodic reef growth in the granitic Seychelles during the Last Interglacial: Implications for polar ice sheet dynamics, Mar. Geol., 399, 170–187, https://doi.org/10.1016/j.margeo.2018.02.010, 2018.
Wehmiller, J. F. and Pellerito, V.: An evolving database for Quaternary aminostratigraphy, GeoResJ, 6, 115–123, https://doi.org/10.1016/j.grj.2015.02.009, 2015.
Wehmiller, J. F., Simmons, K. R., Cheng, H., Lawrence Edwards, R., Martin-McNaughton, J., York, L. L., Krantz, D. E., and Shen, C.-C.: Uranium-series coral ages from the US Atlantic Coastal Plain–the “80ka problem” revisited, Quatern. Int., 120, 3–14, https://doi.org/10.1016/j.quaint.2004.01.002, 2004.
Wehmiller, J. F., Thieler, E. R., Miller, D., Pellerito, V., Bakeman Keeney, V., Riggs, S. R., Culver, S., Mallinson, D., Farrell, K. M., and York, L. L.: Aminostratigraphy of surface and subsurface Quaternary sediments, North Carolina coastal plain, USA, Quat. Geochronol., 5, 459–492, https://doi.org/10.1016/j.quageo.2009.10.005, 2010.
Wehmiller, J. F., Harris, W. B., Boutin, B. S., and Farrell, K. M.: Calibration of amino acid racemization (AAR) kinetics in United States mid-Atlantic Coastal Plain Quaternary mollusks using analyses: Evaluation of kinetic models and estimation of regional Late Pleistocene temperature history, Quat. Geochronol., 7, 21–36, https://doi.org/10.1016/j.quageo.2011.09.005, 2012.
Wehmiller, J. F., Brothers, L. L., Ramsey, K. W., Foster, D. S., Mattheus, C. R., Hein, C. J., and Shawler, J. L.: Molluscan aminostratigraphy of the US Mid-Atlantic Quaternary coastal system: Implications for onshore-offshore correlation, paleochannel and barrier island evolution, and local late Quaternary sea-level history, Quat. Geochronol., 66, 101177, https://doi.org/10.1016/j.quageo.2021.101177, 2021.
Williams, A. H. and Walkden, G. M.: Late Quaternary highstand deposits of the southern Arabian Gulf: a record of sea-level and climate change, Geological Society, London, Special Publications, 195, 371–386, https://doi.org/10.1144/GSL.SP.2002.195.01.20, 2002.
Woodroffe, C. D.: Late Quaternary sea-level highstands in the central and eastern Indian Ocean: A review, Global Planet. Change, 49, 121–138, https://doi.org/10.1016/j.gloplacha.2005.06.002, 2005.
Wright, J. D., Sheridan, R. E., Miller, K. G., Uptegrove, J., Cramer, B. S., and Browning, J. V.: Late Pleistocene Sea level on the New Jersey Margin: Implications to eustasy and deep-sea temperature, Global Planet. Change, 66, 93–99, https://doi.org/10.1016/j.gloplacha.2008.03.013, 2009.
Zazo, C., Goy, J. L., Dabrio, C. J., Soler, V., Hillaire-Marcel, Cl., Ghaleb, B., González-Delgado, J. A., Bardají, T., and Cabero, A.: Quaternary marine terraces on Sal Island (Cape Verde archipelago), Quaternary Sci. Rev., 26, 876–893, https://doi.org/10.1016/j.quascirev.2006.12.014, 2007.
Zazo, C., Goy, J. L., Hillaire-Marcel, C., Dabrio, C. J., González-Delgado, J. A., Cabero, A., Bardají, T., Ghaleb, B., and Soler, V.: Sea level changes during the last and present interglacials in Sal Island (Cape Verde archipelago), Global Planet. Change, 72, 302–317, https://doi.org/10.1016/j.gloplacha.2010.01.006, 2010.
Zomeni, Z.: Last interglacial (MIS 5e) sea-level proxies in Cyprus, Eastern Mediterranean, Zenodo [data set], https://doi.org/10.5281/zenodo.4438721, 2021.
- Abstract
- Introduction
- Relationship with previous compilations
- The WALIS data platform
- Database contents
- Principal limitations of WALIS 1.0
- Using WALIS
- Data availability
- Conclusions
- Author contributions
- Competing interests
- Disclaimer
- Special issue statement
- Acknowledgements
- Financial support
- Review statement
- References