the Creative Commons Attribution 4.0 License.
the Creative Commons Attribution 4.0 License.
 | 24 Feb 2022
LGHAP: the Long-term Gap-free High-resolution Air Pollutant concentration dataset, derived via tensor-flow-based multimodal data fusion
Ke Li
Mingliang Ma
Kaitao Li
Zhengqiang Li
Ni-Bin Chang
Zhuo Tan
Di Han
Developing a big data analytics framework for generating the Long-term Gap-free High-resolution Air Pollutant concentration dataset (abbreviated as LGHAP) is of great significance for environmental management and Earth system science analysis. By synergistically integrating multimodal aerosol data acquired from diverse sources via a tensor-flow-based data fusion method, a gap-free aerosol optical depth (AOD) dataset with a daily 1 km resolution covering the period of 2000–2020 in China was generated. Specifically, data gaps in daily AOD imageries from the Moderate Resolution Imaging Spectroradiometer (MODIS) aboard Terra were reconstructed based on a set of AOD data tensors acquired from diverse satellites, numerical analysis, and in situ air quality measurements via integrative efforts of spatial pattern recognition for high-dimensional gridded image analysis and knowledge transfer in statistical data mining. To our knowledge, this is the first long-term gap-free high-resolution AOD dataset in China, from which spatially contiguous PM2.5 and PM10 concentrations were then estimated using an ensemble learning approach. Ground validation results indicate that the LGHAP AOD data are in good agreement with in situ AOD observations from the Aerosol Robotic Network (AERONET), with an R of 0.91 and RMSE equaling 0.21. Meanwhile, PM2.5 and PM10 estimations also agreed well with ground measurements, with R values of 0.95 and 0.94 and RMSEs of 12.03 and 19.56 µg m−3, respectively. The LGHAP provides a suite of long-term gap-free gridded maps with a high resolution to better examine aerosol changes in China over the past 2 decades, from which three major variation periods of haze pollution in China were revealed. Additionally, the proportion of the population exposed to unhealthy PM2.5 increased from 50.60 % in 2000 to 63.81 % in 2014 across China, which was then reduced drastically to 34.03 % in 2020. Overall, the generated LGHAP dataset has great potential to trigger multidisciplinary applications in Earth observations, climate change, public health, ecosystem assessment, and environmental management. The daily resolution AOD, PM2.5, and PM10 datasets are publicly available at https://doi.org/10.5281/zenodo.5652257 (Bai et al., 2021a), https://doi.org/10.5281/zenodo.5652265 (Bai et al., 2021b), and https://doi.org/10.5281/zenodo.5652263 (Bai et al., 2021c), respectively. Monthly and annual datasets can be acquired from https://doi.org/10.5281/zenodo.5655797 (Bai et al., 2021d) and https://doi.org/10.5281/zenodo.5655807 (Bai et al., 2021e), respectively. Python, MATLAB, R, and IDL codes are also provided to help users read and visualize these data.
- Article
(23988 KB) - Full-text XML
-
Supplement
(3152 KB) - BibTeX
- EndNote


Atmospheric aerosols not only impact regional climate by changing the Earth radiation budget but also significantly influence air quality at the ground level (Fuzzi et al., 2015; Gao et al., 2018; Shen et al., 2020; Sun et al., 2015; Yang et al., 2020; Zheng et al., 2020). Monitoring aerosol loading in the atmosphere is thus of great significance for climate change attribution and haze pollution assessment. Aerosol optical depth (AOD), an indicator of aerosol bulks distributed within a column of air from the Earth's surface to the top of the atmosphere, has been monitored for decades to map global aerosol loading in the atmosphere. Compared with sparsely and unevenly distributed ground-based aerosol monitoring stations (e.g., the Aerosol Robotic Network – AERONET), satellite instruments can map AOD with vaster spatial coverage at even sub-hourly sampling frequency (e.g., geostationary satellite). An overview of sensors, algorithms, and AOD datasets that are widely used in the community can be found in the literature such as in Sogacheva et al. (2020) and Wei et al. (2020).
Due to negative impacts of bright surfaces (e.g., snow cover) and clouds, as well as algorithmic restrictions, satellite AOD retrievals often suffer from extensive data gaps, significantly reducing the downstream application potential such as mapping particulate matter (PM) concentrations at the ground surface (e.g., Bai et al., 2019a; J. Wei et al., 2021). Also, excessive data gaps in AOD imageries may result in large uncertainty when assessing aerosol impacts on weather and climate (Guo et al., 2017; Li et al., 2019; Zhao et al., 2020; Zheng et al., 2018). Over the years, versatile gap-filling methods have been developed (e.g., Bai et al., 2016, 2020b; Chang et al., 2015). Nonetheless, filling data gaps in satellite-based AOD retrievals is still challenging due to extraordinary nonrandom missing values and high aerosol dynamics in space and time.
Wei et al. (2020) provided a short review of methods that have been frequently applied to deal with data gaps in AOD products. In general, merging AOD data acquired from diverse instruments and/or platforms is the most popular approach to improve AOD spatial coverage (Sogacheva et al., 2020). Statistical methods such as linear regression (Bai et al., 2019a; Wang et al., 2019; Zhang et al., 2017), inversed variance weighting (Chen et al., 2018; Ma et al., 2016; Sogacheva et al., 2020), and maximum likelihood estimation (Xu et al., 2015) are often applied to account for systematic bias among different datasets. Data fusion methods such as Bayesian maximum entropy can be applied to blend AOD products with different resolutions (Tang et al., 2016; X. Wei et al., 2021). Another way is to reconstruct missing AOD values using either neighboring observations in space and time or external data sources such as AOD simulations from numerical models (Li et al., 2020; Xiao et al., 2017) and even meteorological factors (Bi et al., 2018).
Although there exist a variety of gap-filling methods, spatially gap-free AOD datasets are still rare, particularly high-resolution AOD datasets from satellites, significantly limiting downstream applications such as PMx concentration mapping. In spite of versatile PM2.5 concentration prediction models (e.g., Di et al., 2019; Fang et al., 2016; Hu et al., 2014; Li et al., 2016; Lin et al., 2016; Liu et al., 2009; B. Wang et al., 2021), to date, there are few publicly accessible PMx concentration datasets that can be used to examine haze pollution variations regionally and globally. Several typical datasets, e.g., the one generated by Dalhousie University (van Donkelaar et al., 2010, 2016), CHAP (J. Wei et al., 2021), and TAP (Geng et al., 2021), have been widely applied to advance our understanding of aerosol impacts across China and the globe. However, these datasets more or less still suffer from drawbacks in terms of spatial and/or temporal resolution, spatial coverage, and data accuracy. To meet contemporary needs, Zhang et al. (2021) provided a more comprehensive review of the widely used PMx concentration mapping approaches. With a thorough review of PM2.5 concentration mapping techniques, an optimal full-coverage PM2.5 modeling scheme was proposed, in which diverse aerosol datasets were fused toward a full-coverage AOD map based on a multimodal approach (Bai et al., 2022). In parallel with these efforts, some have attempted to improve AOD data coverage over space with high accuracy by merging AODs observed at adjacent times directly (Li et al., 2022).
With such prior knowledge, the current study developed a big data analytics framework for generating the Long-term Gap-free High-resolution Air Pollutant concentration dataset (abbreviated as LGHAP hereafter), aiming at providing gap-free AOD, PM2.5, and PM10 concentration data with a daily 1 km resolution in China for the period of 2000 to 2020. To achieve such a goal, multimodal aerosol data acquired from diverse sources including satellites, ground stations, and numerical models were synergistically integrated via high-order singular value decomposition (HOSVD) to form a tensor-flow-based data fusion framework in the current study. Full-coverage PM2.5 and PM10 concentration data were then estimated on the basis of the gap-filled AOD dataset. This 21-year-long gap-free high-resolution (daily and 1 km) aerosol dataset was then compared against ground-based AOD and PMx observations to validate the data accuracy of each product, particularly their performance in spatial pattern recognition and temporal trend assessment. These advances enabled a better assessment of long-term variability in haze pollution in China as well as of the corresponding population exposure over the past 2 decades.
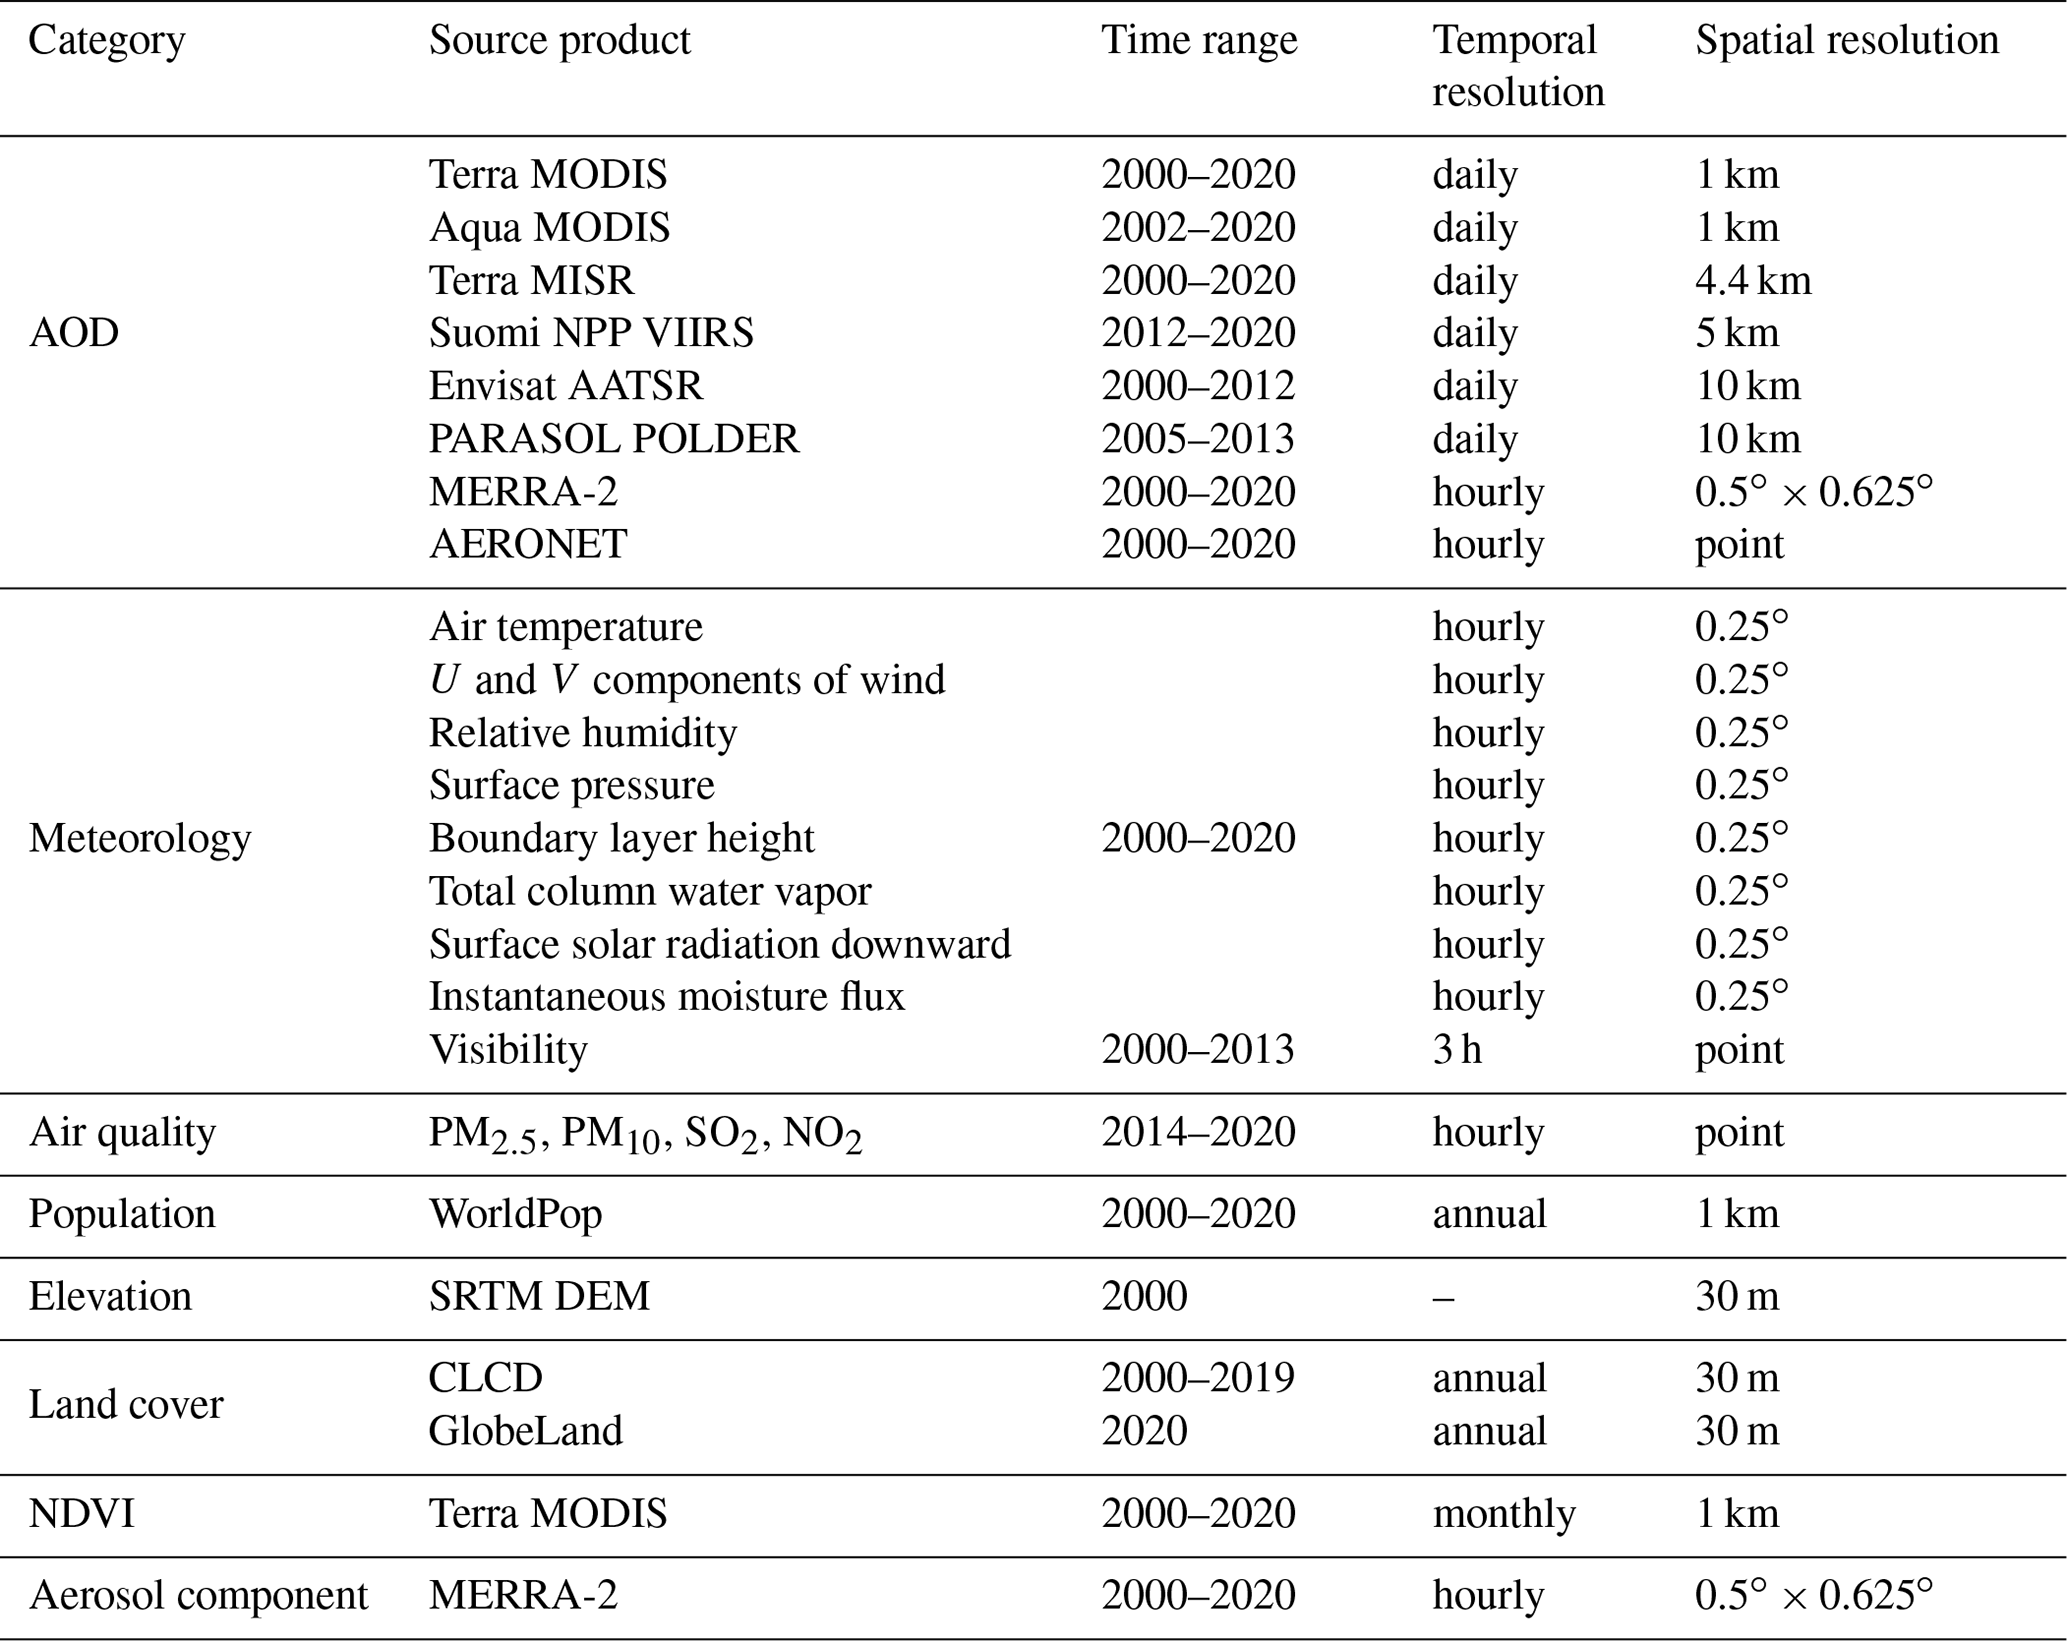
Table 1 provides a brief summary of the multisource datasets used in this study to generate the LGHAP dataset. As shown, 6 satellite-based AOD products, 5 numerical simulations of AOD and aerosol components, 11 meteorological factors, and 6 datasets of ground-based AOD and air pollutant concentration measurements, as well as a set of land cover, topographic, and socioeconomic parameters, were employed. Descriptions of these datasets are given in the following subsections.
Table 1Summary of the data sources used in this study to generate gap-free high-resolution AOD and PMx concentration datasets. NDVI denotes the normalized difference vegetation index.
2.1 Gridded aerosol products
In many previous studies, coarse AOD and/or aerosol component simulations acquired from numerical models have oftentimes been used as the primary data source to help derive full-coverage AOD and/or PM2.5 concentration maps (e.g., Park et al., 2020; Y. Wang et al., 2021). However, due to the lack of a high-accuracy near-real-time emission inventory, simulated AOD and/or aerosol components are often prone to large uncertainty, which could be inevitably introduced into the final PM2.5 estimations if no observational data are applied for possible bias correction. In such a research context, here we used six satellite-based AOD products with a relatively long temporal coverage (>5 years) to help better reconstruct historical AOD variations over space and time, though geostationary satellites can provide AOD observations at even an hourly resolution. The reasons are twofold. On the one hand, the operational AOD product from the recent Chinese FY-4 satellite is still unavailable. On the other hand, the AOD product from Himawari-8 cannot provide observations in the northwest region of China.
The latest AOD product derived from the Moderate Resolution Imaging Spectroradiometer (MODIS) on board Terra using the multiangle implementation of atmospheric correction (MAIAC) algorithm (Lyapustin et al., 2011, 2018), was hereby used as the baseline dataset for the generation of gap-free AOD maps. This AOD product has not only a finer spatial resolution (1 km) but also a comparable and perhaps even better accuracy, when comparing it with those derived from the Dark Target and Deep Blue algorithms (Goldberg et al., 2019; Lyapustin et al., 2018). In addition, AOD products derived from MODIS on board Aqua, the Multi-angle Imaging SpectroRadiometer (MISR) on board Terra, the Visible Infrared Imaging Radiometer Suite (VIIRS) on board Suomi NPP, the Advanced Along-Track Scanning Radiometer (AATSR) on board Envisat, and POLarization and Directionality of the Earth's Reflectances (POLDER) on board PARASOL were also employed. The ultimate goal was to reduce the bias level in the final full-coverage AOD product by providing as many observational AODs as possible. Accuracies of these AOD products have been extensively validated in previous studies, e.g., de Leeuw et al. (2018), Xiao et al. (2016), Wei et al. (2019), and Che et al. (2019), to name a few. A brief description of these satellite-based AOD products can be found in Sect. S1 in the Supplement.
In addition to satellite-based AOD products, numerically simulated aerosol diagnostics from MERRA-2, including AOD and aerosol components such as black carbon, organic carbon, dust, and sulfate, were also applied to help reconstruct missing AOD information and to predict PM2.5 and PM10 concentrations at the ground level. The aerosol components were used here as a proxy for an emission inventory when predicting PMx concentrations. Big data analytics procedures applied to these datasets will be described in Sect. 3.
2.2 In situ AOD and air quality measurements
AOD observations from AERONET were used as the ground truth to evaluate the data accuracy of the generated gap-free AOD product and also as the learning target to infer AOD from air pollutant concentration and atmospheric visibility. Considering few valid data were provided in the Level 2.0 dataset, here we used the Level 1.5 AOD data to guarantee adequate in situ AOD data coverage in space and time. To validate the gridded AOD products in this study, each in situ AOD observation was registered with the gridded mean AOD over a 50 × 50 km window.
Near-surface air pollutant concentrations including PM2.5, PM10, NO2, and SO2 that were sampled at state-controlled monitoring sites were also applied, not only to help establish machine-learned regression models for PMx prediction (PM2.5 and PM10) but also to infer AOD over air quality monitoring sites given their dense distributions across China. The gauged air pollutant concentration data have been released online on an hourly basis by the China National Environmental Monitoring Centre since late 2013. For quality control, outliers were first detected and removed from each pollutant dataset by following the criteria used in our previous study (Bai et al., 2020a). The missing values were then reconstructed using the diurnal-cycle-constrained empirical orthogonal function (DCCEOF) method proposed in Bai et al. (2020b).
The 3 h resolution atmospheric visibility data acquired from 4052 weather stations, at which in situ air quality measurements were not available, were employed to help generate gap-free AOD maps before 2014. Previous studies have attempted to predict PM2.5 concentration from atmospheric visibility data with good accuracies (Liu et al., 2017), indicative of great potential for estimating AOD. Specifically, visibility data were used as an important predictor for site-specific AOD prediction, and the resulting AOD predictions were then used as critical prior information for reconstructing AOD distributions over space, especially over those regions without satellite AOD observations. Given the availability of abundant air quality measurements and the fact that automatic visibility sensors have been widely used across China since 2014, atmospheric visibility data after 2014 were thereby excluded to guarantee data consistency (Li et al., 2018). For quality control, the consistency of visibility data was examined using an outlier detection method; i.e., the annual mean should not exceed 3 times the standard deviation of data over a 5-year time window (Zhang et al., 2020). Those data with apparent jumps and drifts in visibility time series were excluded. Meanwhile, visibility data on rainstorms and foggy days were eliminated as well.
2.3 Auxiliary data
As shown in Table 1, 11 meteorological factors, including air temperature at the near surface, wind speed and direction, relative humidity, surface pressure, boundary layer height, total column water vapor, downward solar radiation, and instantaneous moisture flux, were used to help resolve nonlinear relationships between PMx and AOD, as well as to downscale AOD from MERRA-2. These data were acquired from the fifth-generation ECMWF atmospheric reanalysis (ERA5), and the first three factors were extracted at the levels of not only the ground surface but also 850 and 500 hPa so as to indicate the vertical structure of the atmosphere. Additionally, population data from WorldPop, land cover from CLCD during 2000 to 2019 (Yang and Huang, 2021) and GlobeLand 30 in 2020 (Chen et al., 2014), and elevation data from the Global Digital Elevation Model (GDEM) version 2, as well as the monthly composited 1 km normalized difference vegetation index (NDVI) from MODIS were employed to resolve the socioeconomic and ecological contributions to haze pollution. Properties of these datasets can be found in Table 1, and datasets with a finer resolution were upscaled to 0.01∘ via a cubic interpolation method.

Figure 1Flowchart of the proposed big data analytics framework for generating the long-term gap-free high-resolution air pollutant concentration dataset (LGHAP), taking aerosol optical depth (AOD) and PMx (PM2.5 and PM10) concentration in China as illustration. HOSVD is an abbreviation of high-order singular value decomposition. MET, LULC, DEM, and POP denote variables of the meteorology, land use/land cover, digit elevation model, and population, respectively.
With the aim of the generation of LGHAP aerosol datasets to advance environment management and Earth system science analysis, here we developed a big data analytics framework via a seamless integration of tensor-flow-based multimodal data fusion with ensemble-learning-based PMx concentration estimation. The proposed method transformed a set of data tensors of AOD and other related datasets such as air pollutant concentration and atmospheric visibility, which were acquired from diverse sensors or platforms via integrative efforts of spatial pattern recognition for high-dimensional gridded data analysis to achieve data fusion and multiresolution image analysis, as well as knowledge transfer in statistical data mining. The proposed method consists of three major procedures in general, including multisensory data homogenization, tensor-flow-based AOD reconstruction, and ensemble learning for PMx concentration estimation. The analytical framework of the big data analytics is depicted in Fig. 1 and described in detail in the following subsections.
3.1 Multisensory data homogenization
Since a set of aerosol products with different types, resolutions, and accuracies were applied to support the reconstruction of gap-free AOD imageries, harmonizing cross-platform biases and scale differences between these diverse datasets is crucial to multisensory data integration. In this study, machine-learned regression models were established to harmonize these heterogeneous aerosol datasets. A baseline dataset was first selected to be used as the learning target, and other datasets were calibrated to the level of baseline dataset to make them comparable. Given the finer resolution and higher proportion of data coverage in space and time, the MAIAC AOD product from Terra (AODTerra) was selected as the baseline dataset. Consequently, six machine-learned regression models were established between AODTerra and each gridded AOD product (i.e., five satellite-based AOD products plus MERRA-2 AOD simulations) using the random forest method. Meteorological factors (MET), land cover types (LULC), topography (DEM), and population (POP) were used as covariates to help downscale these multimodal AOD products to have a resolution the same as AODTerra while accounting for cross-mission biases arising from temporal and algorithmic differences.
Considering data gaps are extensive in satellite AOD products, especially over regions with vast cloud cover, providing prior AOD information over such regions is thus of great value in support of the reconstruction of missing AOD values. As indicated in our recent studies, AOD can be accurately predicted from ground-measured air pollutant concentration, showing an accuracy even higher than some satellite AOD retrievals (Li et al., 2022; Bai et al., 2022). To support AOD reconstruction over regions with fewer or even without valid satellite AOD observations, we attempted to infer AOD over air quality monitoring sites from in situ air pollutant concentration measurements via a machine learning approach. Similarly, machine-learned regression models were established using random forest by taking AODTerra as the learning target while ground-measured air pollutant concentrations, meteorological factors, land cover, and terrain information were used conjunctively as predictors.
The transformation of ground-measured air pollutant concentration data to AOD allows for providing external observational AOD data to supplement satellite observations, especially over regions suffering from significant data gaps. Since air pollutant concentration data were not available before 2013, atmospheric visibility data sampled at dense weather stations were used as an alternative for site-based AOD prediction, by applying a similar prediction model to that described above and used for air pollutant concentration. Figure S1 show the ground-based validation results of AOD inferred from atmospheric visibility and air pollutant concentrations, indicative of a generally good accuracy of these inferred AOD values. All efforts led to aggregating a set of multimodal aerosol data with different properties for multisensory data fusion to achieve gap-free AOD mapping as the next step.
3.2 Tensor-flow-based AOD reconstruction
The core of generating full-coverage AOD imageries is to fill in data gaps in AODTerra. Previous studies have demonstrated that merging satellite AOD retrievals at adjacent time steps can help improve the observational AOD coverage at each single snapshot, while the involvement of numerical AOD simulations can help bridge AOD data gaps (Li et al., 2022; Bai et al., 2022). In this study, a tensor completion method was particularly designed and applied to fulfill the gap filling in AODTerra. Specifically, the incomplete AODTerra imageries were deemed the hard data (true AOD state), while other AOD datasets (e.g., the downscaled AOD datasets and site-specific AOD predictions inferred from air pollutant concentration and atmospheric visibility) were used as the soft data (complementary data) to help reconstruct AOD distribution in AODTerra via tensor-flow-based pattern recognition. Detailed procedures for gap filling are outlined as follows.
3.2.1 Initial AOD tensor construction
Due to extensive data gaps in satellite-based AOD retrievals, it is insufficient to reconstruct all missing AOD information in AODTerra for a given date by simply merging the harmonized satellite-based AOD data synchronously. To fulfill AOD gap filling, the tensor completion method was thus applied to synergistically integrate AOD acquired from diverse sources. Consequently, creating the data tensor of AOD is of critical importance. In this study, the data tensor of AOD was constructed by incorporating not only observational AOD from both satellites and those inferred from in situ air quality indicators on the same date but also historical AOD retrievals from MODIS instruments (AODTerra and AODAqua) and part of data from the downscaled MERRA-2 AOD (denoted as AODM2 hereafter). The latter two were applied to provide knowledge of AOD distributions over space to guide the reconstruction of missing values in AODTerra.
For the screening of historical observations resembling AODTerra distribution on the given date to be reconstructed, AODM2 was used in concert with AODTerra and site-based AOD estimations to identify similar imageries. Toward this goal, site-specific AOD estimations and 5 % randomly selected downscaled AODM2 data were merged directly with valid AODTerra to form a new image on each date. Subsequently, correlations and biases were estimated between AODTerra on the given date to be reconstructed and each newly merged historical AODTerra image. To avoid the inclusion of imageries with distinct variation patterns, only those closely resembling AODTerra on the date to be reconstructed were finally retained in terms of their correlations and biases subject to thresholds of R>0.7 and RMSE <0.2. Once sufficient historical imageries were obtained, the data tensor of AOD was constructed by compiling the observed AOD imageries on the given date with historical imageries into a three-dimensional data array (composed of N3 images with a size of N1×N2). Considering satellite AOD retrievals suffer from extensive data gaps, we injected data values of site-specific AOD estimations and 1 % randomly selected downscaled AODM2 data directly onto grids where AODTerra values were missing on each specific date as prior knowledge. This not only accelerates convergence speed during the reconstruction process but also avoids large reconstruction errors over regions with tremendous data gaps in satellite-observed AOD imageries.
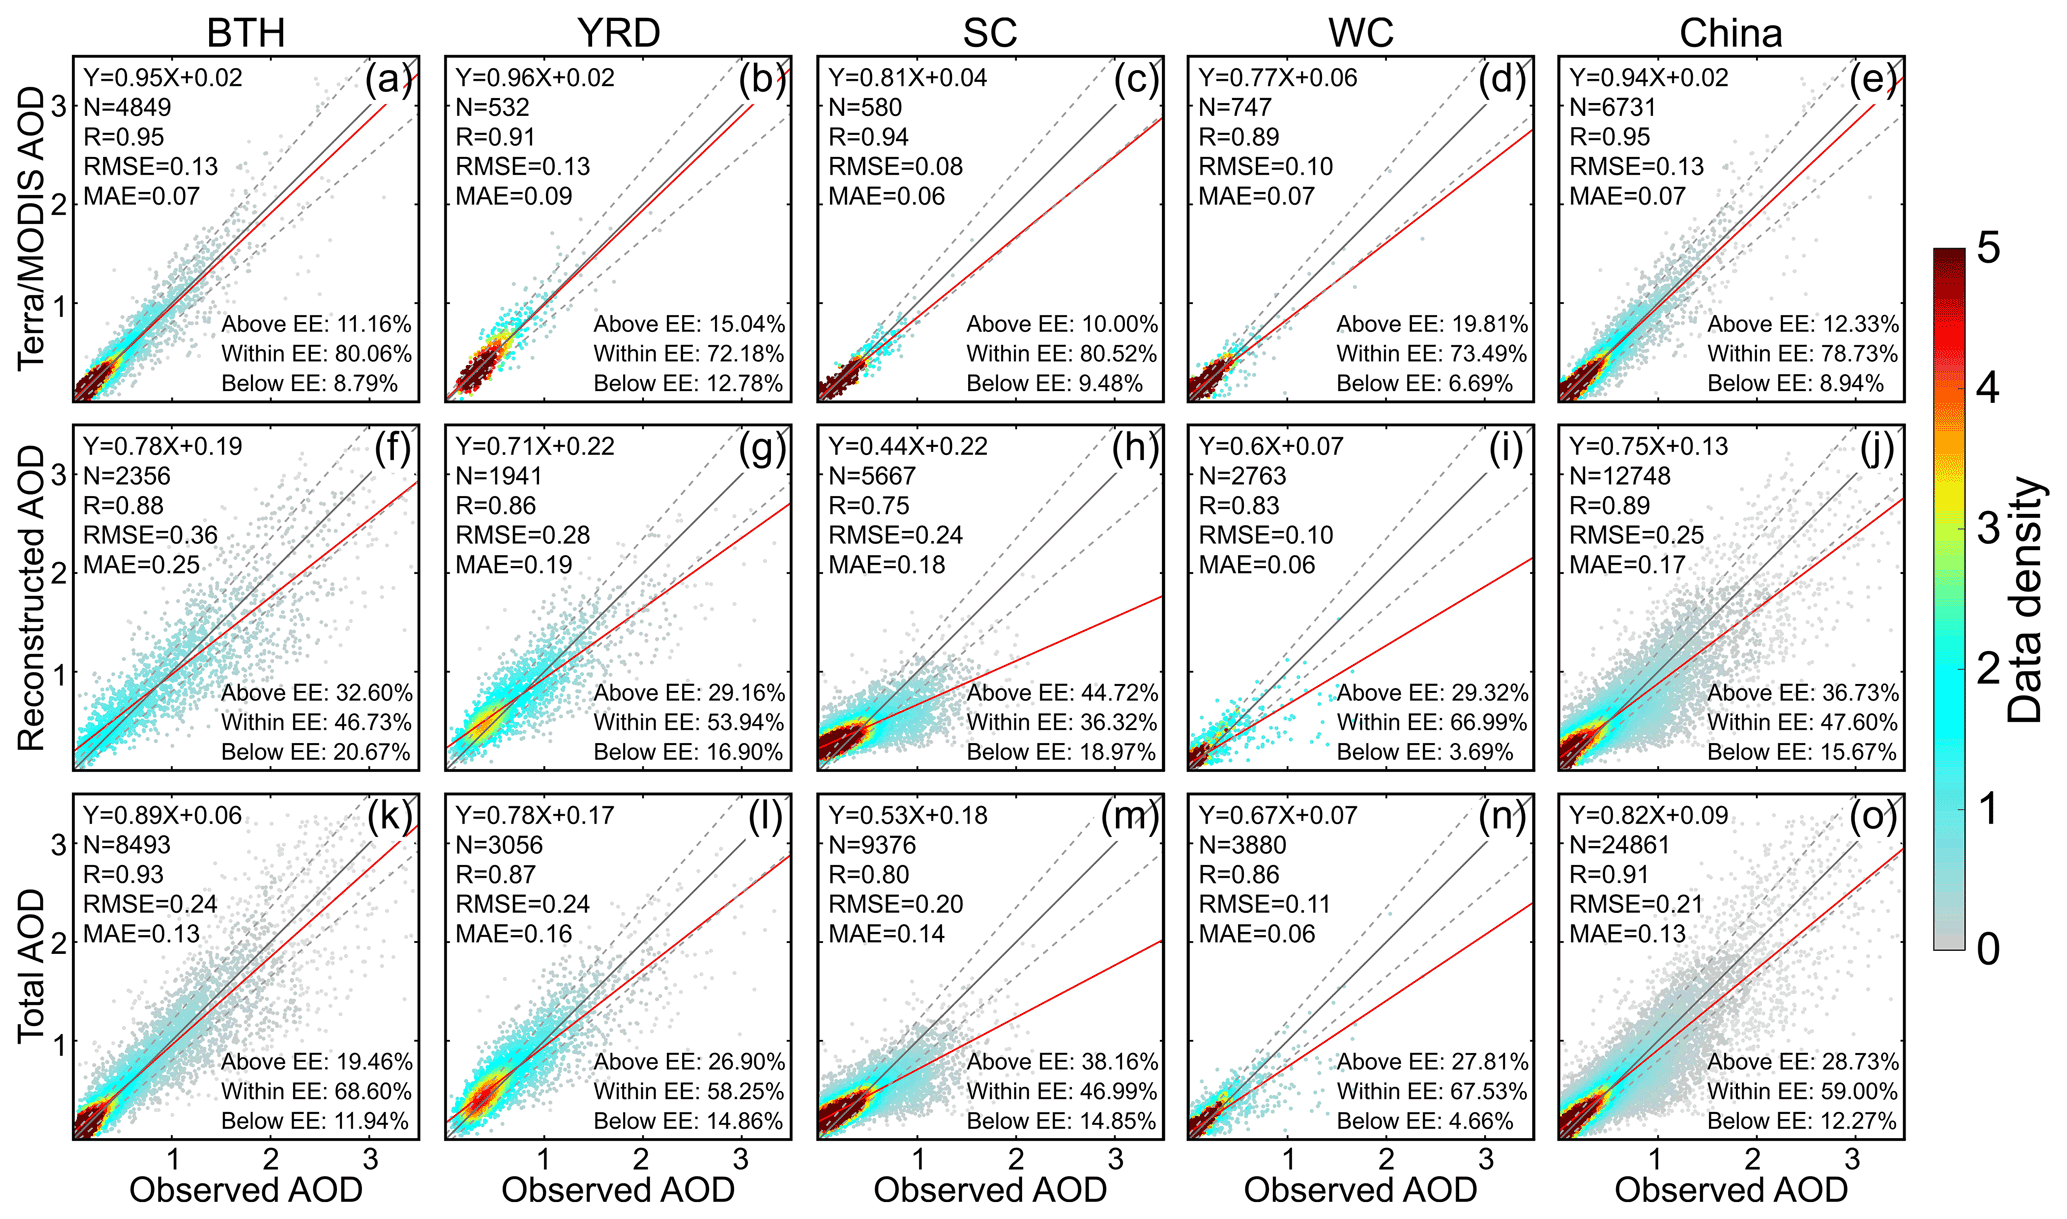
Figure 2Scatterplots between ground-observed and satellite-based AOD data in different regions of China. (a–e) Original Terra MODIS AOD, (f–j) reconstructed AOD, and (k–o) combined AOD between original and reconstructed data. BTH, YRD, SC, and WC refer to the regions of Beijing–Tianjin–Hebei, Yangtze River Delta, South China, and West China, respectively.
3.2.2 Gap filling via tensor completion
Previous studies have well demonstrated the good performance of matrix decomposition methods such as empirical orthogonal functions and singular value decomposition (SVD) for missing value imputation (Bai et al., 2020b; Beckers and Rixen, 2003). However, these methods can only work on a two-dimensional matrix mathematically, namely the matrix domain. To integrate spatial features of AOD revealed by datasets to generate a smooth AOD distribution with complete coverage, in this study, the HOSVD, a specific orthogonal Tucker decomposition, was applied. More detailed descriptions of HOSVD can be found in the literature such as in Sun et al. (2021), Tucker (1966), Kolda and Bader (2009), and Sidiropoulos et al. (2017).
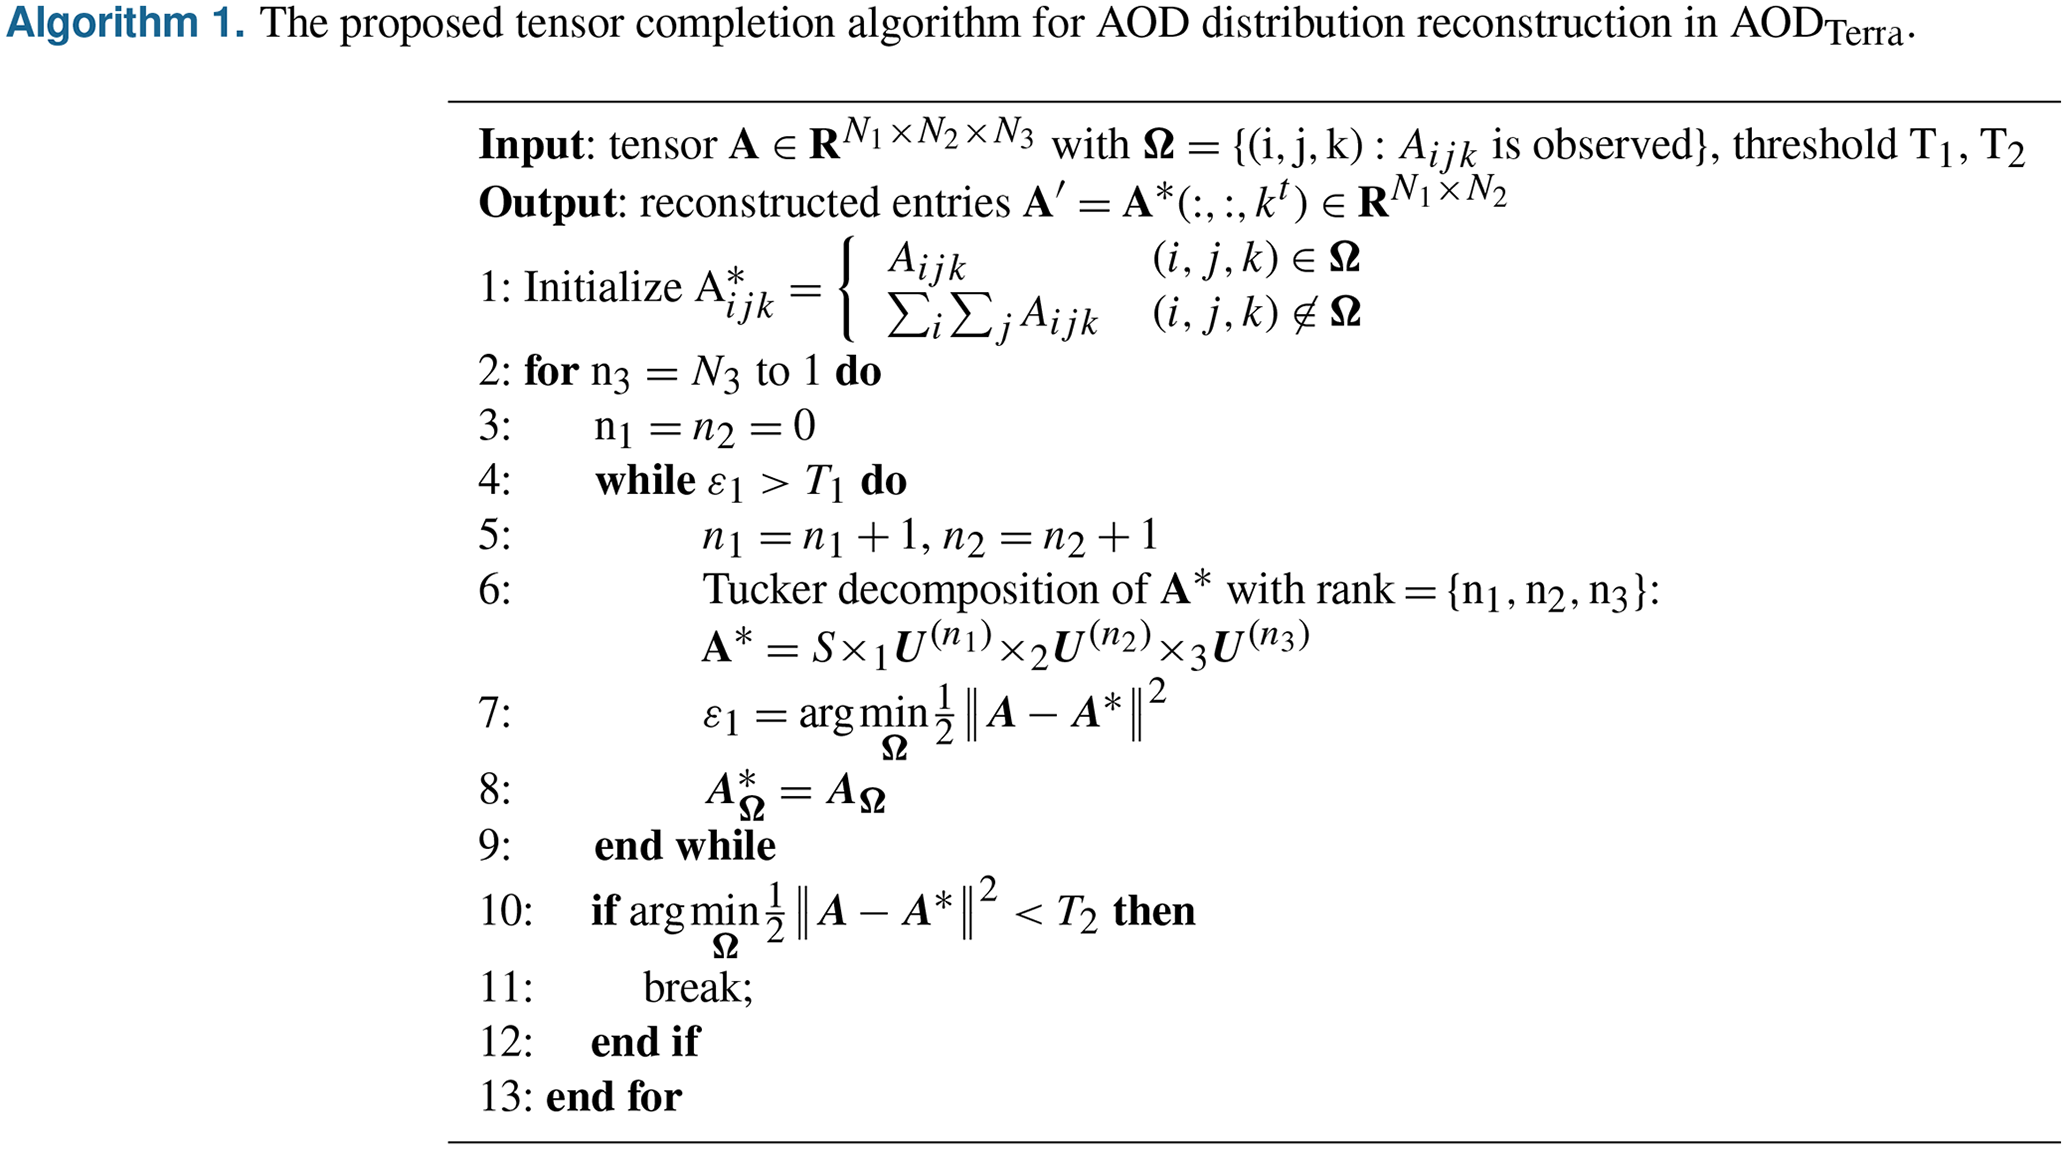
In Algorithm 1, we provided a stepwise description of the algorithm used to fill data gaps in AODTerra by integrating AOD features recognized in different imageries as the data tensor of AOD via HOSVD. To initiate the tensor decomposition, grids with missing values in the original AOD tensor were first filled with the spatial average of valid AOD data in each individual image. Then, the AOD tensor was decomposed along each of the three dimensions, while the dominant features in each dimension determined by the corresponding rank values were applied to reconstruct the data tensor. By gradually increasing the rank values and iteratively updating the initial filled values, the tensor can be reconstructed to better delineate AOD distribution over space after several iterations.
To confirm the convergence, a small portion of observational AOD values were randomly held out in advance, and the reconstructed values over these grids in each iteration were compared with these held-out data till the difference between them was lower than 0.01 (a threshold to determine convergence, a.k.a ε1 in Algorithm 1). Meanwhile, to make the computational burden manageable, the study region (China in this study) was divided into 40 subregions (refer to Fig. S2 for the spatial distribution of these subregions), and the tensor completion was then performed over each individual region. Finally, the reconstructed imageries were mosaicked to attain a national gap-free AOD map on each specific date. During this step, a smooth filter was applied to solve the boundary effect when mosaicking two adjacent maps. Specifically, the data value on each overlapped grid at the boundary (50 km on the edge of a subregion) was averaged via an inverse distance (the distance to the edge) weighting scheme. In the end, the mosaic AODTerra image was retained as the final gap-free AOD product.
3.3 PMx concentration estimation
In this study, the widely used random forest method was applied to establish regression models for PM2.5 and PM10 concentration estimation. Ground-measured PM2.5 (or PM10) concentration data were used as the learning target, and gap-filled AOD, aerosol components (AERcomp), meteorological factors (MET), the digital elevation model (DEM), the NDVI, land cover information (LC), and population were used as regressors. The random forest (RF) regression model can be generally formulated as
where month is a categorical variable that was used to account for monthly varying relationships between AOD and PMx. For validation, PM2.5 and PM10 measurements from 10 % of monitoring sites were randomly held out to evaluate the predictive performance of each regression model. During the training process, 500 regression trees were used in each RF model, and each tree was grown on a bootstrap sample. The learning dataset was randomly divided into two parts during the training process, with 80 % used as the training set and the remaining 20 % for testing. In order to guarantee a larger value of PM10 than PM2.5, PM2.5 estimations from Eq. (1) were used as one predictor in addition to factors used to predict PM2.5 when estimating PM10 concentration. Such a model can also significantly improve the prediction accuracy of PM10 given the prior PM2.5 information.
3.4 Point–surface data fusion
Ground-measured PM2.5 and PM10 concentration data were further fused with their gridded estimations to enhance the data accuracy of PMx data after 2014. Here, the well-known optimal interpolation (OI) method was applied to perform point–surface fusions between two different types of dataset. Please refer to Bai et al. (2022) and Li et al. (2022) for a more detailed description of the OI method used to fuse PMx concentration data. In this study, a modified scheme was developed to select neighboring observations. To avoid an isotropic interpolation effect, here we only used 30 ground observations with land cover, terrain, and atmospheric conditions similar to those at the analyzed grid cell to estimate the innovation that should be assigned to the background value at the given grid. In other words, a similarity measure was first estimated between the analyzed grid cell and neighboring sites in terms of land cover, the DEM, and atmospheric conditions. The 30 observations with similar background fields were then used in the OI procedure to correct possible bias in gridded PMx estimations. Such a treatment can help exclude those observations with different ambient background, e.g., one site not far from the given grid but separated by a high mountain, thereby avoiding the possible propagation of antiphase corrections to data over adjacent grids.
4.1 Data accuracy of gap-free AOD in LGHAP
Table 2 summarizes the data accuracy of the gap-free AOD dataset generated in this study. For comparison, the data accuracy of each original AOD dataset was also assessed. Since in situ AOD measurements were not used as data input when reconstructing missing AOD information, the gap-free AOD can be directly compared with in situ AOD measurements from AERONET. As indicated, all these AOD datasets are in good agreement with in situ AOD measurements. Generally, AODs from MODIS on board Terra and Aqua have an almost identical data accuracy, which is also among the highest when comparing with other datasets (R=0.95, and RMSE = 0.14). AODs from AATSR show a comparable accuracy to that of MODIS but with a relatively low correlation with ground-based AOD measurements. AODs from MISR, POLDER, and VIIRS exhibit a similar bias level, with R varying from 0.80 to 0.92 and RMSE ranging from 0.22 to 0.29. In contrast, AODM2 data have the poorest accuracy among these eight gridded AOD datasets (R=0.77, and RMSE = 0.36), even though AOD data from AERONET and satellite observations like MODIS had been already assimilated. This indicates the presence of large biases in AODM2, and thus these AODM2 data cannot solely be used to delineate AOD distributions over space.
Table 2Data accuracy of original and gap-free AOD datasets used and/or generated in this study. The expected error (EE) was defined as × AODsite. MAE denotes the mean absolute error and was calculated as the absolute value of bias.
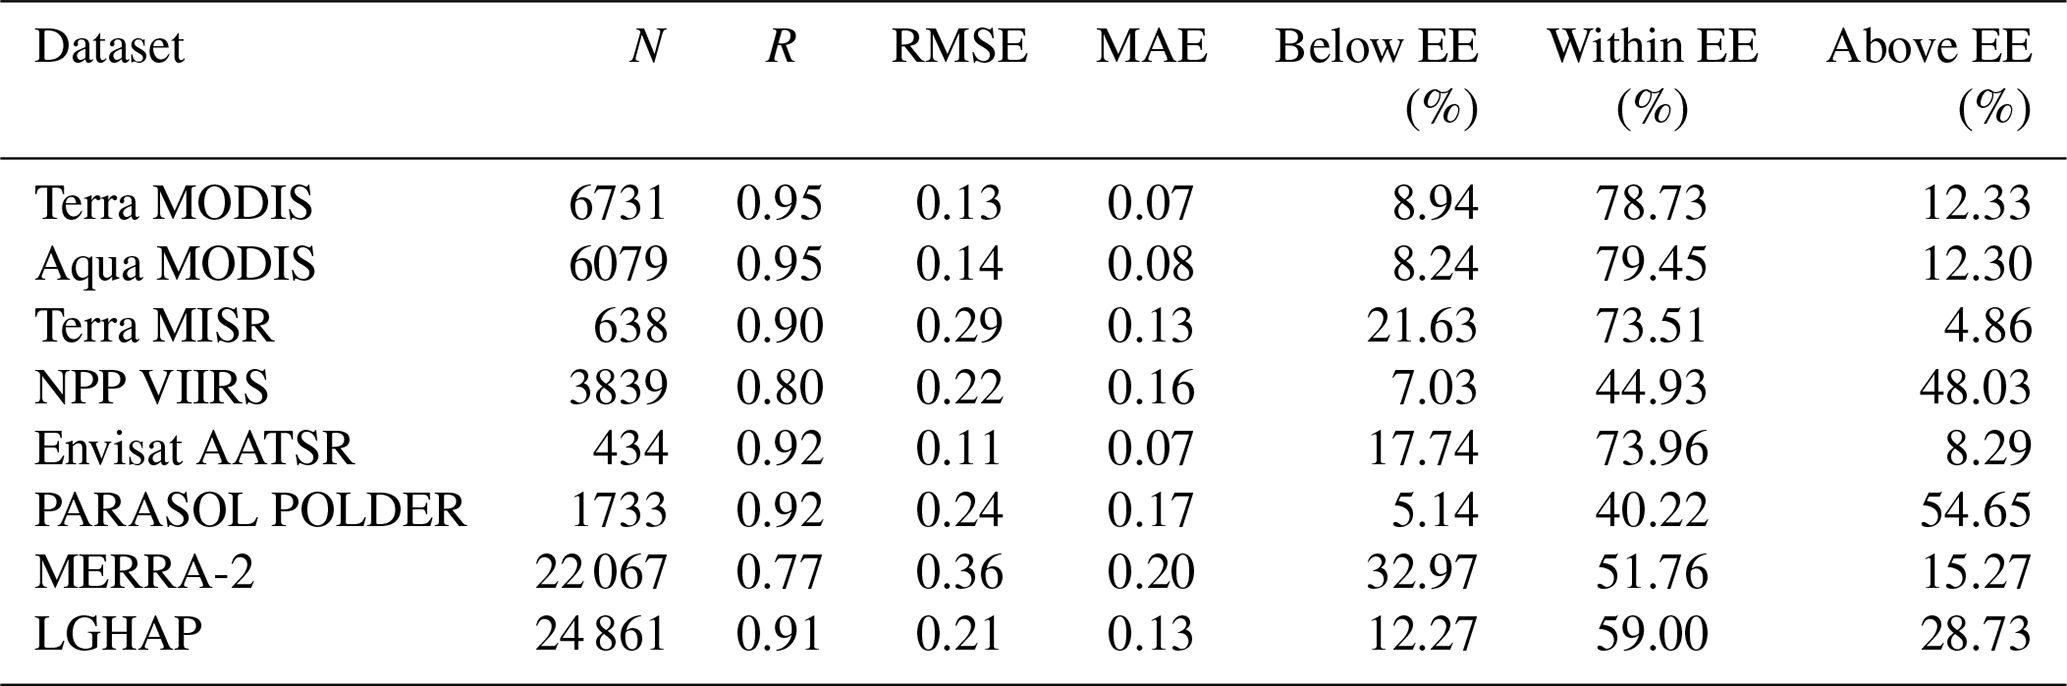
Compared to the first seven gridded AOD datasets, the LGHAP AOD dataset has an accuracy slightly worse than the original MODIS AOD product but comparable to AODs from MISR, POLDER, and MERRA-2, with an R of 0.91 and RMSE equaling 0.21 compared to ground-based AOD observations. Nevertheless, the gap-filled AOD appeared to overestimate ground-based AOD observations, and this could be due to the involvement of AODs from VIIRS and POLDER as these two products significantly overestimated ground AOD observations, which can be indicated by the proportion of data pairs above the expected error (EE). On the other hand, significant underestimations in AODM2 were not introduced into the LGHAP AOD as the below-EE ratio was 32.97 % in the former and was only 12.27 % in the latter. These results indicate that the LGHAP AOD data are more likely to resemble AOD distributions revealed by satellite observations rather than AODM2, endorsing the advantages of involving multisensory satellite AOD observations to support missing AOD reconstruction. Figure 2 further compares the data accuracy of original AODTerra and the reconstructed data over different regions of China. It is indicative that the purely reconstructed data have an accuracy (R=0.88, and RMSE = 0.26) lower than the original AODTerra (R=0.95, and RMSE = 0.13) across China, especially in South China where the reconstructed data significantly underestimated the ground-based AOD observations. Possible reasons for this effect could be attributed to extensive data gaps in satellite AOD retrievals due to frequent and extensive cloud cover there (refer to Fig. S3 for the distribution of the mean data integrity of AODTerra during 2000–2020), and the scarce AOD observations significantly limit the learning capacity in space and temporal domain during the tensor completion process. In other words, limited observations in satellite imageries greatly reduced the learning performance from the sparse tensor. Nevertheless, the purely reconstructed data exhibit a bias level comparable to AOD retrievals from several satellite instruments, e.g., MISR, VIIRS, and POLDER. This demonstrates the good performance of the proposed tensor completion method in reconstructing missing AOD information. By combining the reconstructed data with original AODTerra, we obtained a 21-year-long gap-free high-resolution (daily and 1 km) AOD dataset with satisfying accuracy (R=0.91, and RMSE = 0.21).
In Fig. 3 we present a comparison of AOD time series between the LGHAP dataset and ground observations at three AERONET sites under different air pollution levels. As shown, the AOD time series from LGHAP are temporally continuous, whereas data gaps are common in AERONET observations. Generally, AODs from LGHAP are well reconstructed with respect to the temporal variations in aerosol loading at these three sites, with R ranging from 0.77 to 0.90 and RMSE varying between 0.11 and 0.21. For illustration, Fig. 4 compares the spatial distribution of original and gap-filled AOD on four dates with different AODTerra coverage over space. As shown, the missing AOD values were well reconstructed after gap filling, resembling a smooth and reasonable AOD distribution over space, even over regions with very limited prior AOD observations from Terra MODIS (e.g., Fig. 4d). As indicated in Fig. 4a and c, the high AOD loading was also properly reconstructed even though no prior information was provided by AODTerra. Since AERONET AOD observations were not used as a data input when generating the LGHAP AOD dataset, these independent validation results clearly demonstrated the high accuracy of the LGHAP AOD product as well as a good performance of the proposed AOD gap-filling approach.
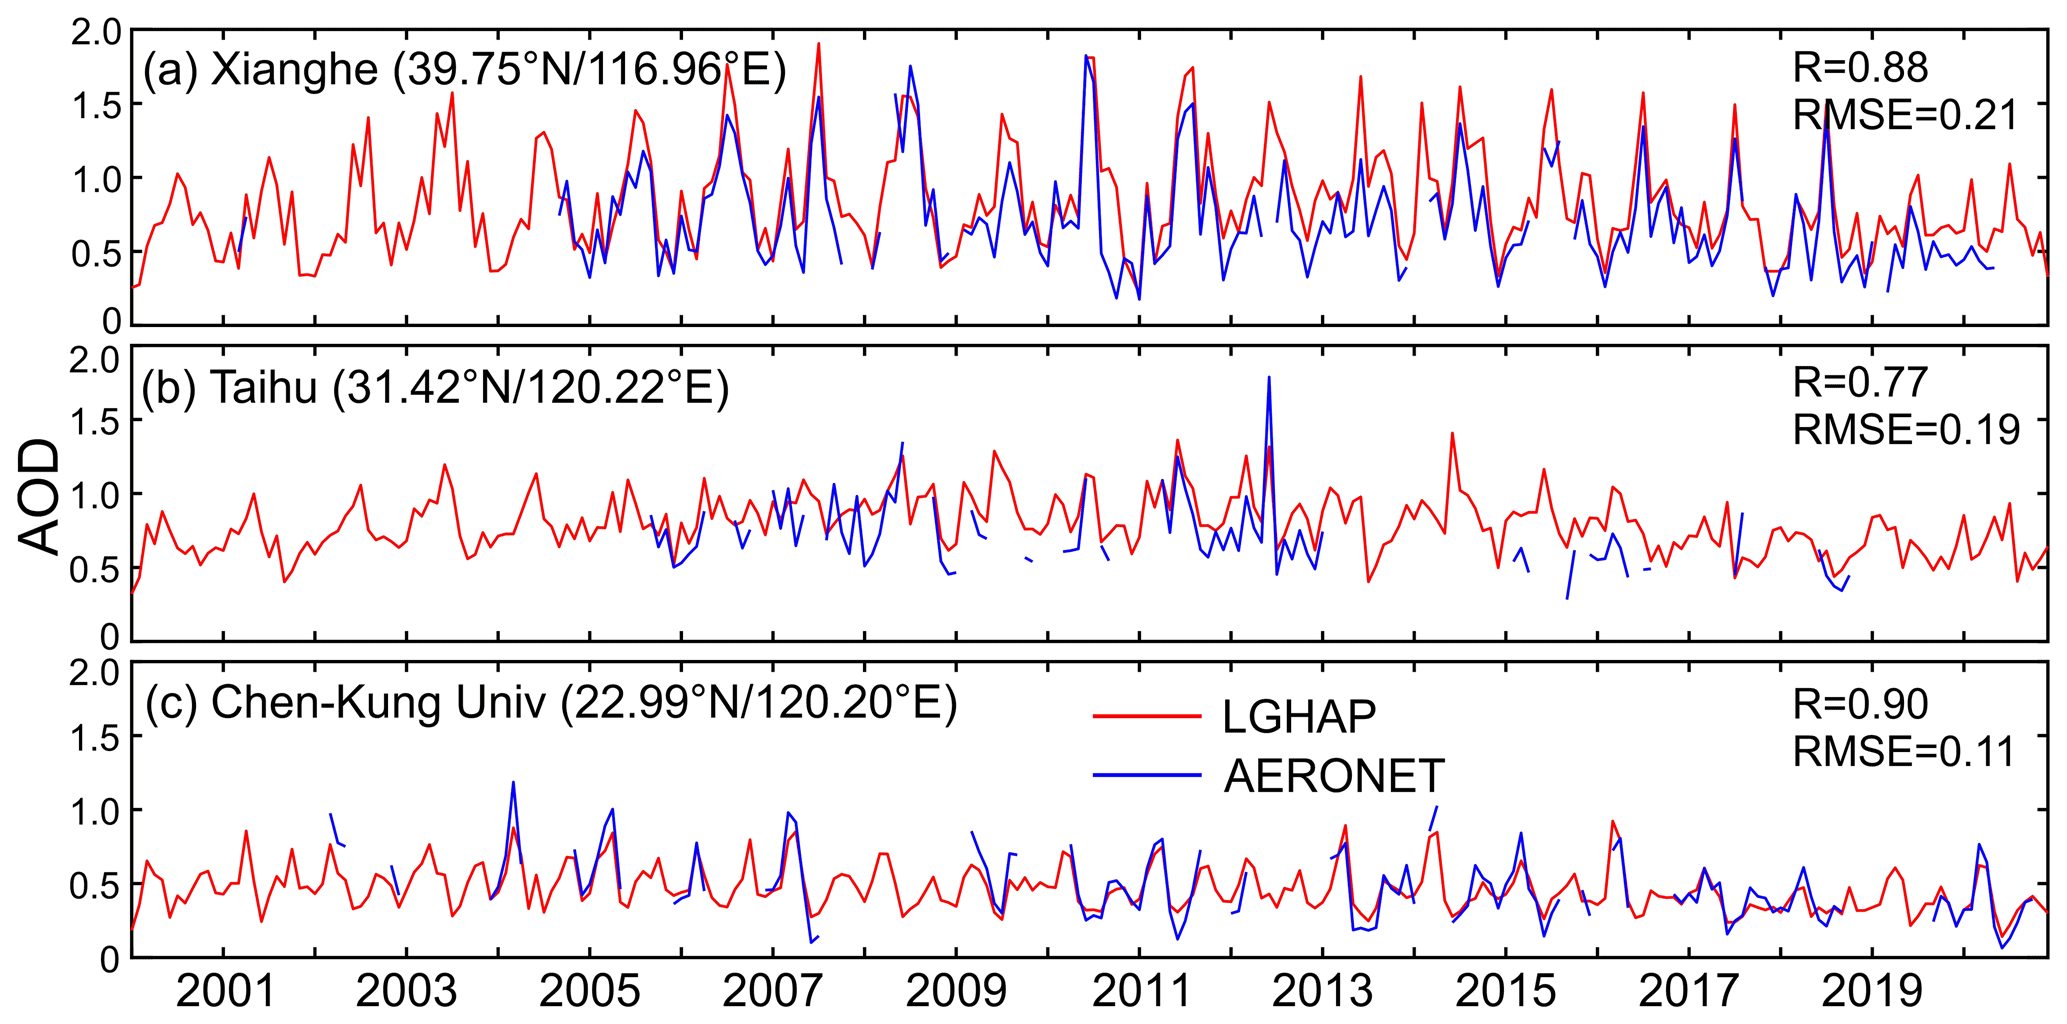
Figure 3Comparison of monthly AOD time series from LGHAP and AERONET at three different stations in China. Latitude and longitude information of each site is given in parentheses.

Figure 4Spatial patterns of the reconstructed AOD under different baseline AOD coverage ratios. In each panel, the upper part presents the original AOD distribution from Terra MODIS and the gap-filled imagery is shown below. The zoomed-in views of the outlined regions are shown on the right. Dates are given in the format year/month/day.
Since the final gap-free AOD product was generated mainly by integrating a set of data tensors of gridded AOD with AOD estimations from in situ air quality measurements, the relative contribution of each product to the final gap-free dataset is worth investigating. In this study, a data-coverage-ratio-weighted nonlinear correlation coefficient was proposed to examine the relative contribution of each gridded product to the LGHAP AOD dataset. The nonlinear correlation coefficient was used to assess the mutual information between two variables (Sun et al., 2021; Wang et al., 2005), while the data coverage ratio was multiplied to indicate the overall contribution of one product to the final fused dataset (refer to Sect. S2 for the definition of this indicator). As shown in Fig. 5, the relative contribution of each gridded product varied with time and the input data sources. In the 2 early years (2000–2001), the AOD distribution in gap-free imageries was determined largely by AODTerra (81 %), whereas this ratio decreased to about 30 % when many other products were involved, especially AOD from Aqua and PARASOL. With the advent of VIIRS and the loss of PARASOL after 2012, the relative contribution changed drastically as AOD from MODIS and VIIRS played the dominant roles in reconstructing AOD distribution. Note the relative contribution of AODM2 remained lower than 10 %, indicative of the greater importance of satellite observations in generating the LGHAP AOD product.
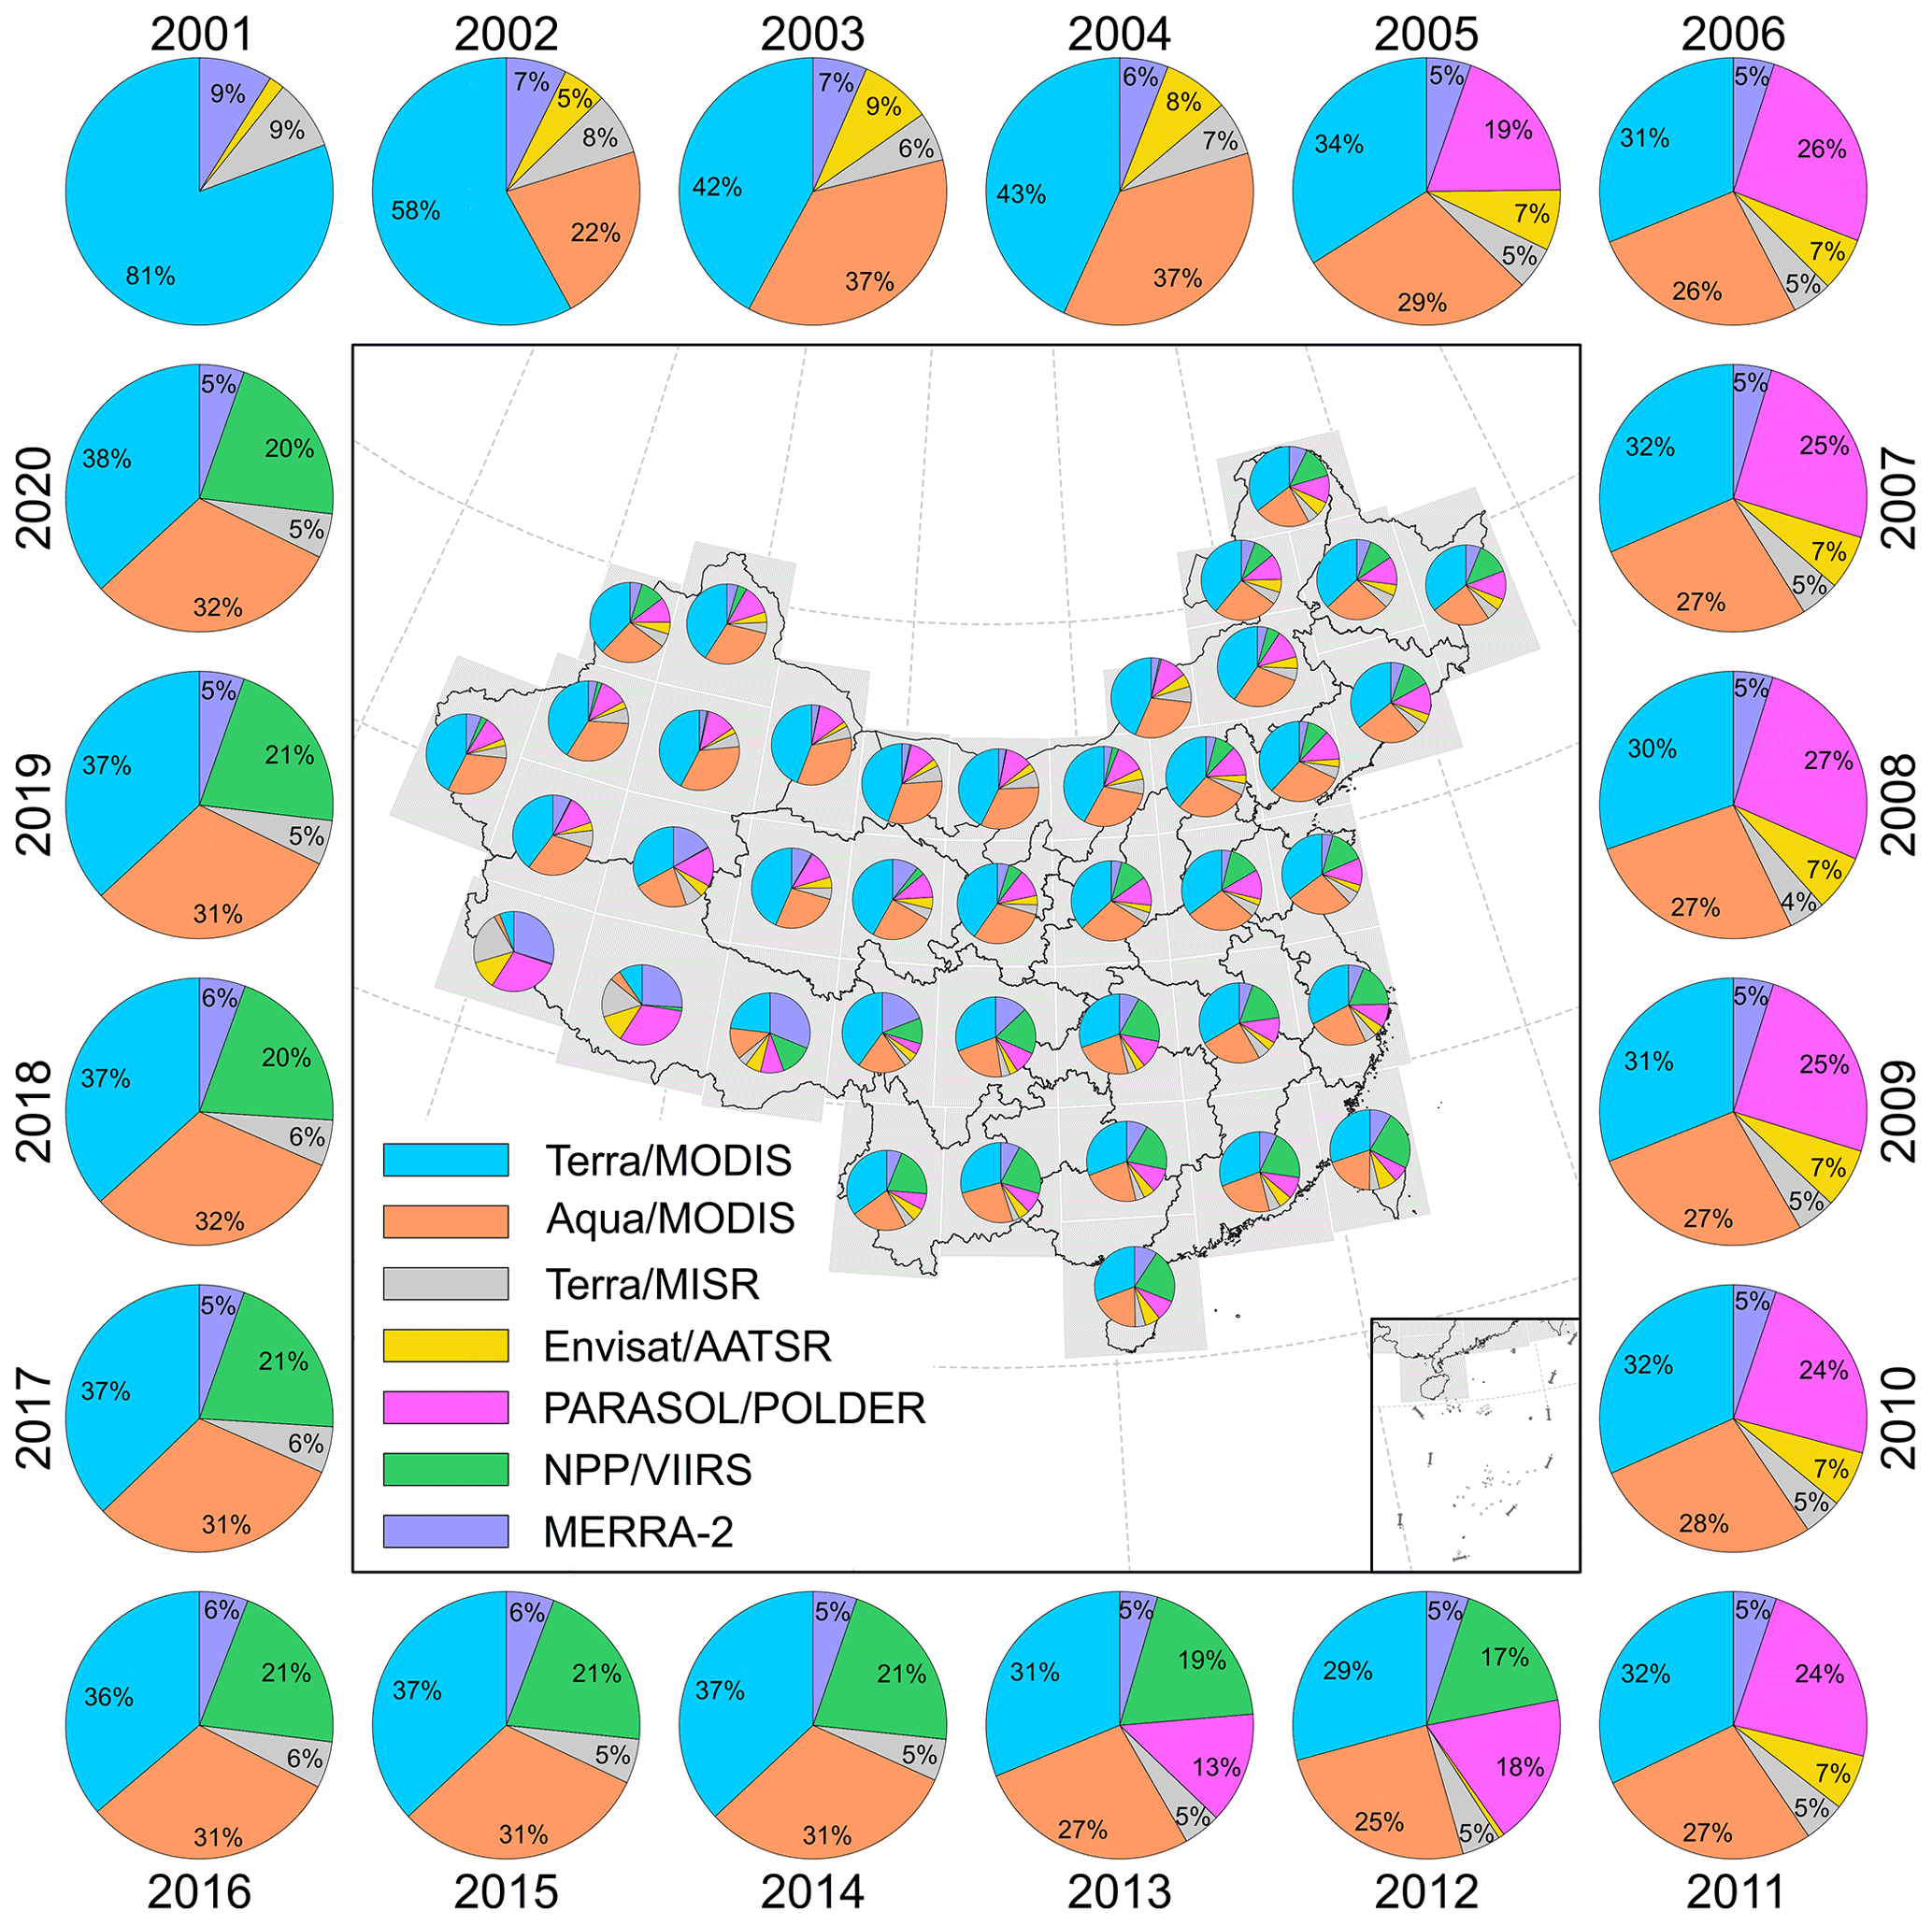
Figure 5Spatiotemporal variations in the relative contribution of each gridded AOD product to the generation of the LGHAP AOD dataset. The relative contribution was estimated as the data-coverage-ratio-weighted nonlinear correlation coefficient (please refer to Sect. S2 in the Supplement for the arithmetic theory to calculate this measure). The annual mean shown outside is the national averaged contribution in each individual year, while the regional mean shown on the map was averaged over the past 21 years in each subregion.
With respect to the temporally averaged contribution in each subregion, it shows that the relative contribution of each product also varied significantly across regions. Generally, AOD from MODIS aboard Terra and Aqua played the most important role (>60 %) in generating the LGHAP AOD product, except over the southwest part of the country (Tibetan Plateau) where AODM2 contributed most. This is largely associated with the fact that data gaps are abnormally high in satellite observations over this region because of the vast and long-lasting snow cover (refer to Fig. S3 for the data integrity distribution). Consequently, AODM2 would play an important role in reconstructing AOD distribution over such regions. Note that the relative contribution of AOD estimations from in situ air quality measurements was not accounted for in the current analysis because of incomparable spatial coverage of in situ data in contrast to gridded AOD products, and this does not imply the contribution of in situ AOD estimations was negligible. Overall, the results shown here clearly highlight the success of big data analytics in generating the LGHAP AOD dataset via integrative efforts from diverse data sources.
4.2 Data accuracy of PM2.5 and PM10 estimations
By taking advantage of the gap-filled AOD, daily 1 km resolution PM2.5 and PM10 concentration data in China were then estimated via an ensemble learning approach. Figure S4 shows the sample-based cross-validation accuracy of two prediction models. It shows that the original daily PM2.5 prediction model had a sample-based cross-validation R2 of 0.79 and RMSE of 20.04 µg m−3. This accuracy is comparable to that of our previous study (Bai et al., 2019a) but slightly worse than those reported in some recent studies (Table 3). In contrast, PM10 had a much higher prediction accuracy, with an R2 of 0.90 and RMSE of 21.06 µg m−3 for the daily product. This good performance should be attributed to the involvement of PM2.5 estimations as a predictor in the PM10 prediction model. Figure 6 shows the site-specific (held-out in advance) validation accuracy of daily, monthly, and annual mean PM2.5 and PM10 concentration in LGHAP. As shown, the site-specific validation results indicated that the final full-coverage (gap-free) daily PM2.5 and PM10 concentration data are in good agreement with ground-based measurements, with an R of 0.95 and RMSE of 12.03 µg m−3 for PM2.5 and an R of 0.94 and RMSE of 19.56 µg m−3 for PM10. Overall, PMx data in LGHAP not only are spatially complete with a finer resolution but also have a comparable accuracy with previous studies.
Table 3Comparison of the data quality of PM2.5 from LGHAP with other related studies.
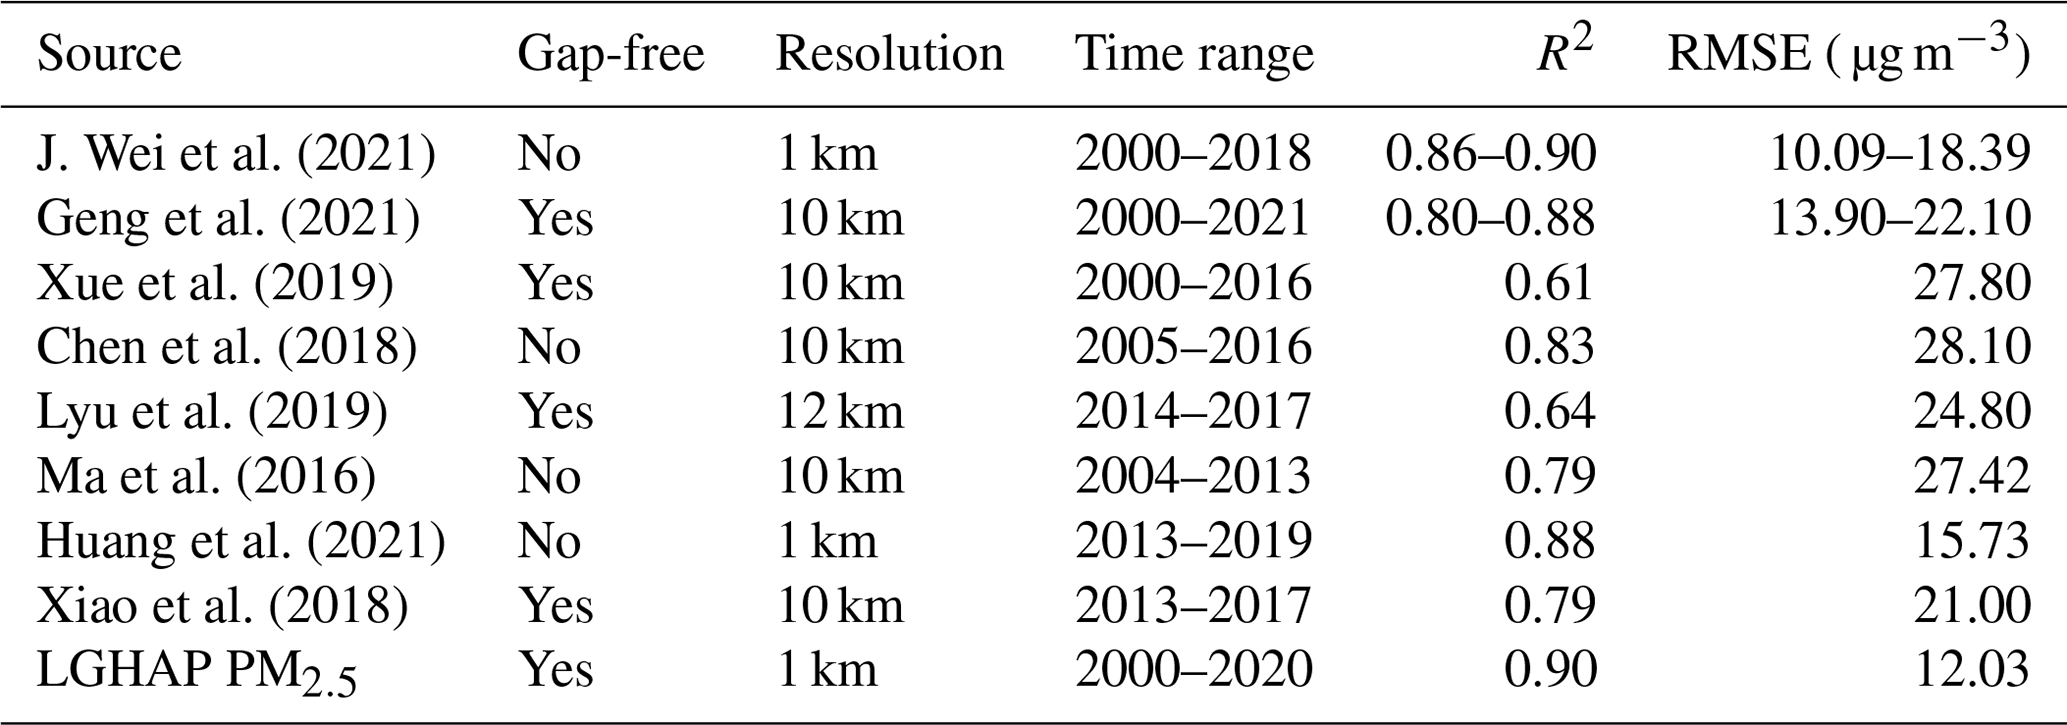
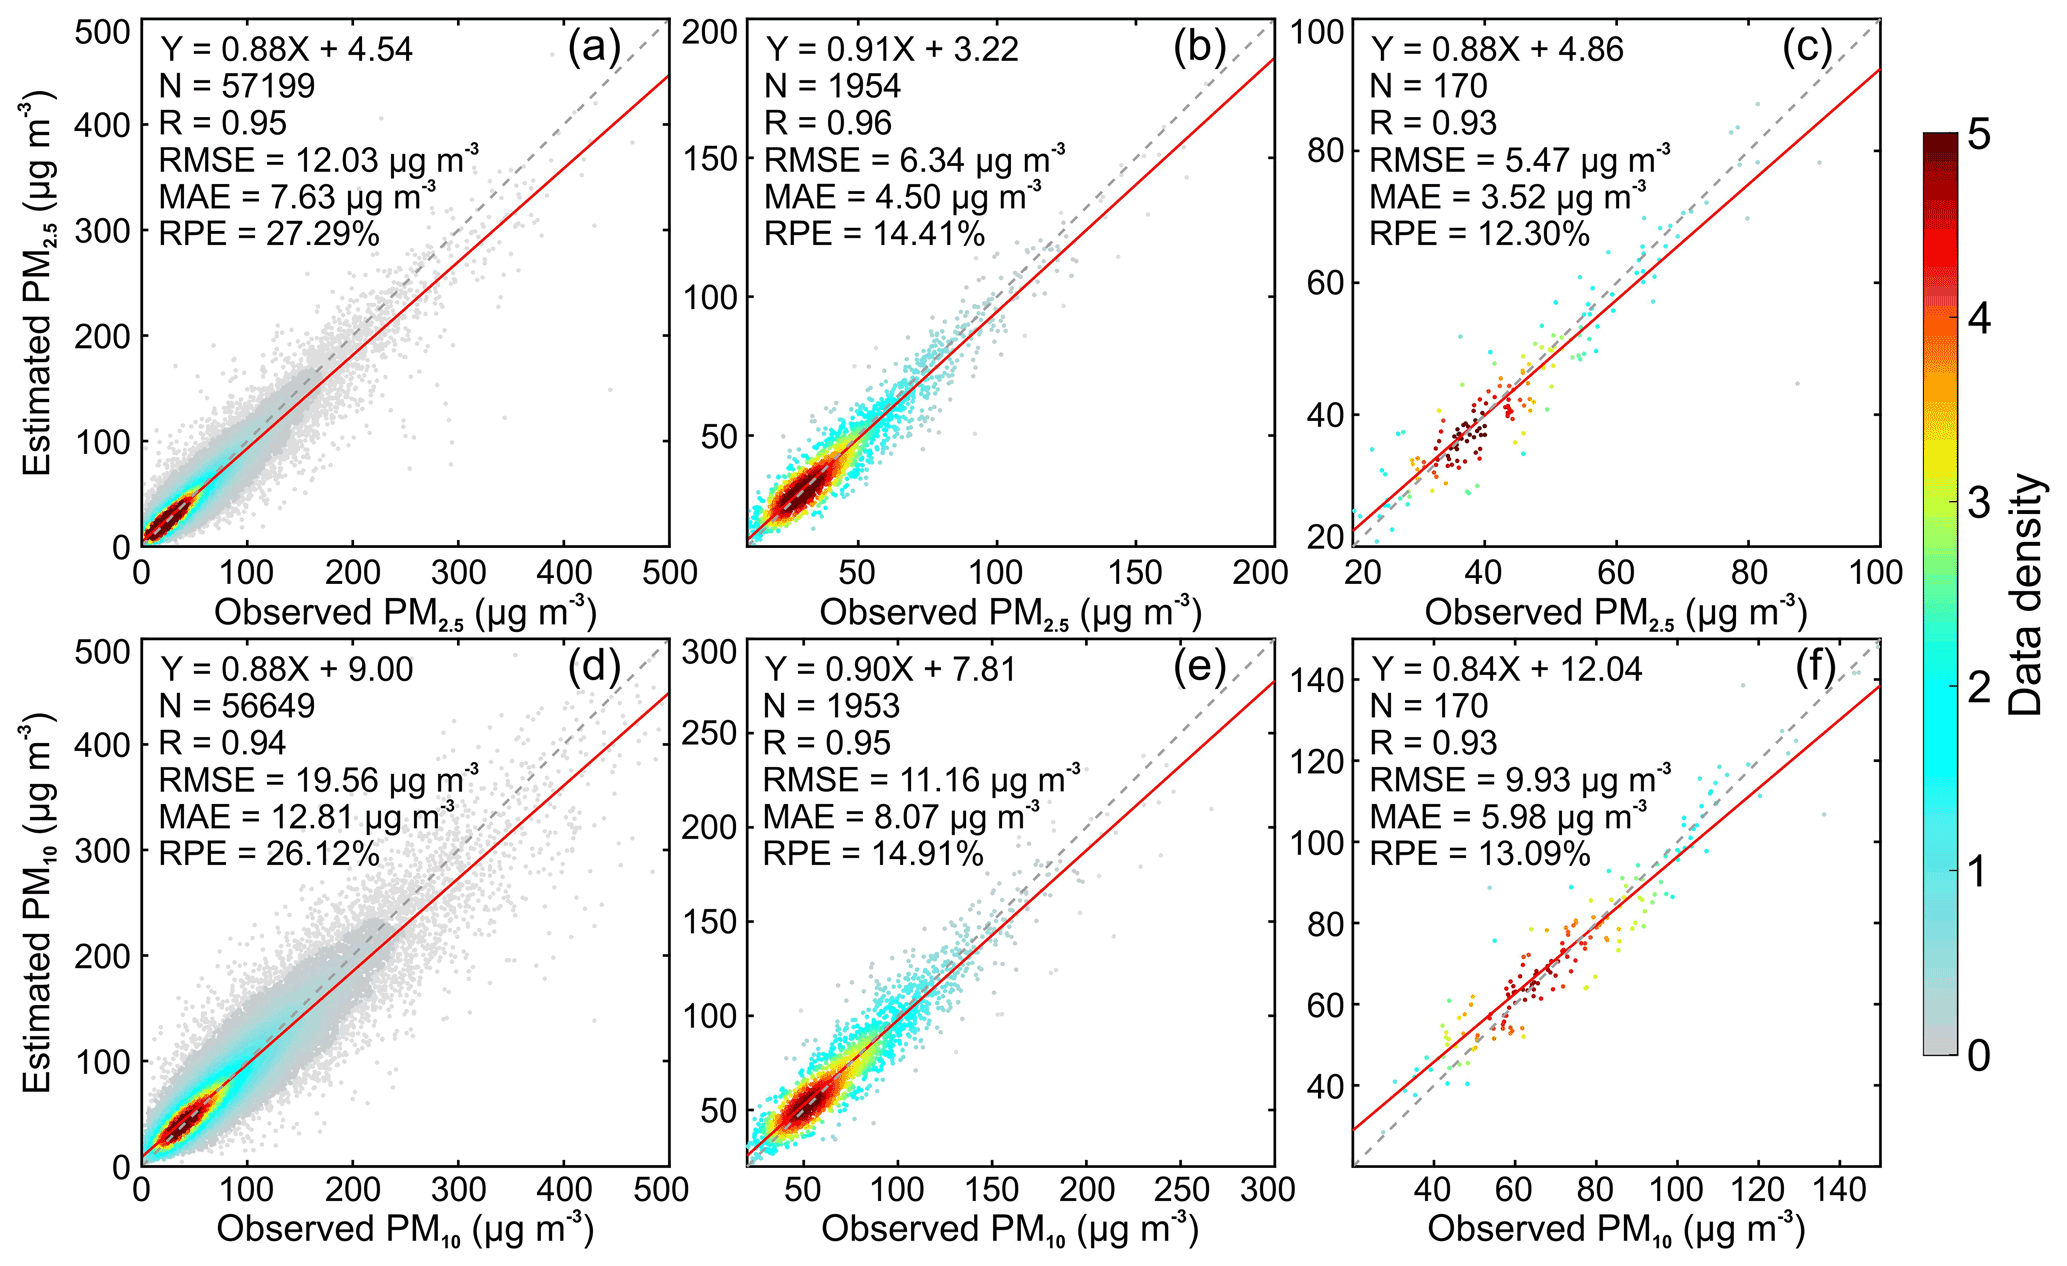
Figure 6Scatterplots between observed and estimated PM2.5 and PM10 concentration. Panels (a)–(c) denote daily, monthly, and annual mean PM2.5 validation results, respectively, while panels (d)–(f) are for PM10 concentration. The ground measurements were acquired from 30 independent air quality monitoring sites that were randomly held out before the model training.
Figure 7 presents a 2-year-long comparison of PM2.5 concentration time series from LGHAP and two other open-access datasets with PM2.5 measurements sampled at four United States embassies in China. Since this ground-based dataset has been seldom noticed and used, it can be applied as an independent dataset to fairly evaluate the accuracy of these three machine-learned PM2.5 estimations. As shown, all these three datasets well reconstructed temporal variations in PM2.5 from 2019 to 2020. Temporally, LGHAP and TAP are continuous, while CHAP suffers from significant data gaps because no gap filling was applied when generating the dataset. Compared with the other two datasets, LGHAP PM2.5 data had a better agreement with ground-based PM2.5 measurements. This high accuracy could be partially due to the fusion of in situ PM2.5 data measured at adjacent sites via the OI method. Figure S5 compares PM2.5 time series from LGHAP with PM2.5 measurements sampled at five United States embassies in China. It is indicative that historical PM2.5 variations over these five cities were well reconstructed in LGHAP, even over years before 2014 during which PM2.5 measurements from state-control monitoring sites were not available. Note PM2.5 estimations appeared to significantly underestimate PM2.5 concentration sampled at the embassy in Beijing before 2013. Considering the reconstructed AOD time series agreed well with AERONET AOD in Beijing (Fig. 3a) and the model performed well in predicting historical PM2.5 in Shanghai during the synchronous time period (Fig. S5b), we are more willing to attribute this issue to significant PM2.5 overestimations by the US Embassy during that period. Overall, these independent validation results collectively indicate a good accuracy of PM2.5 in the LGHAP dataset.
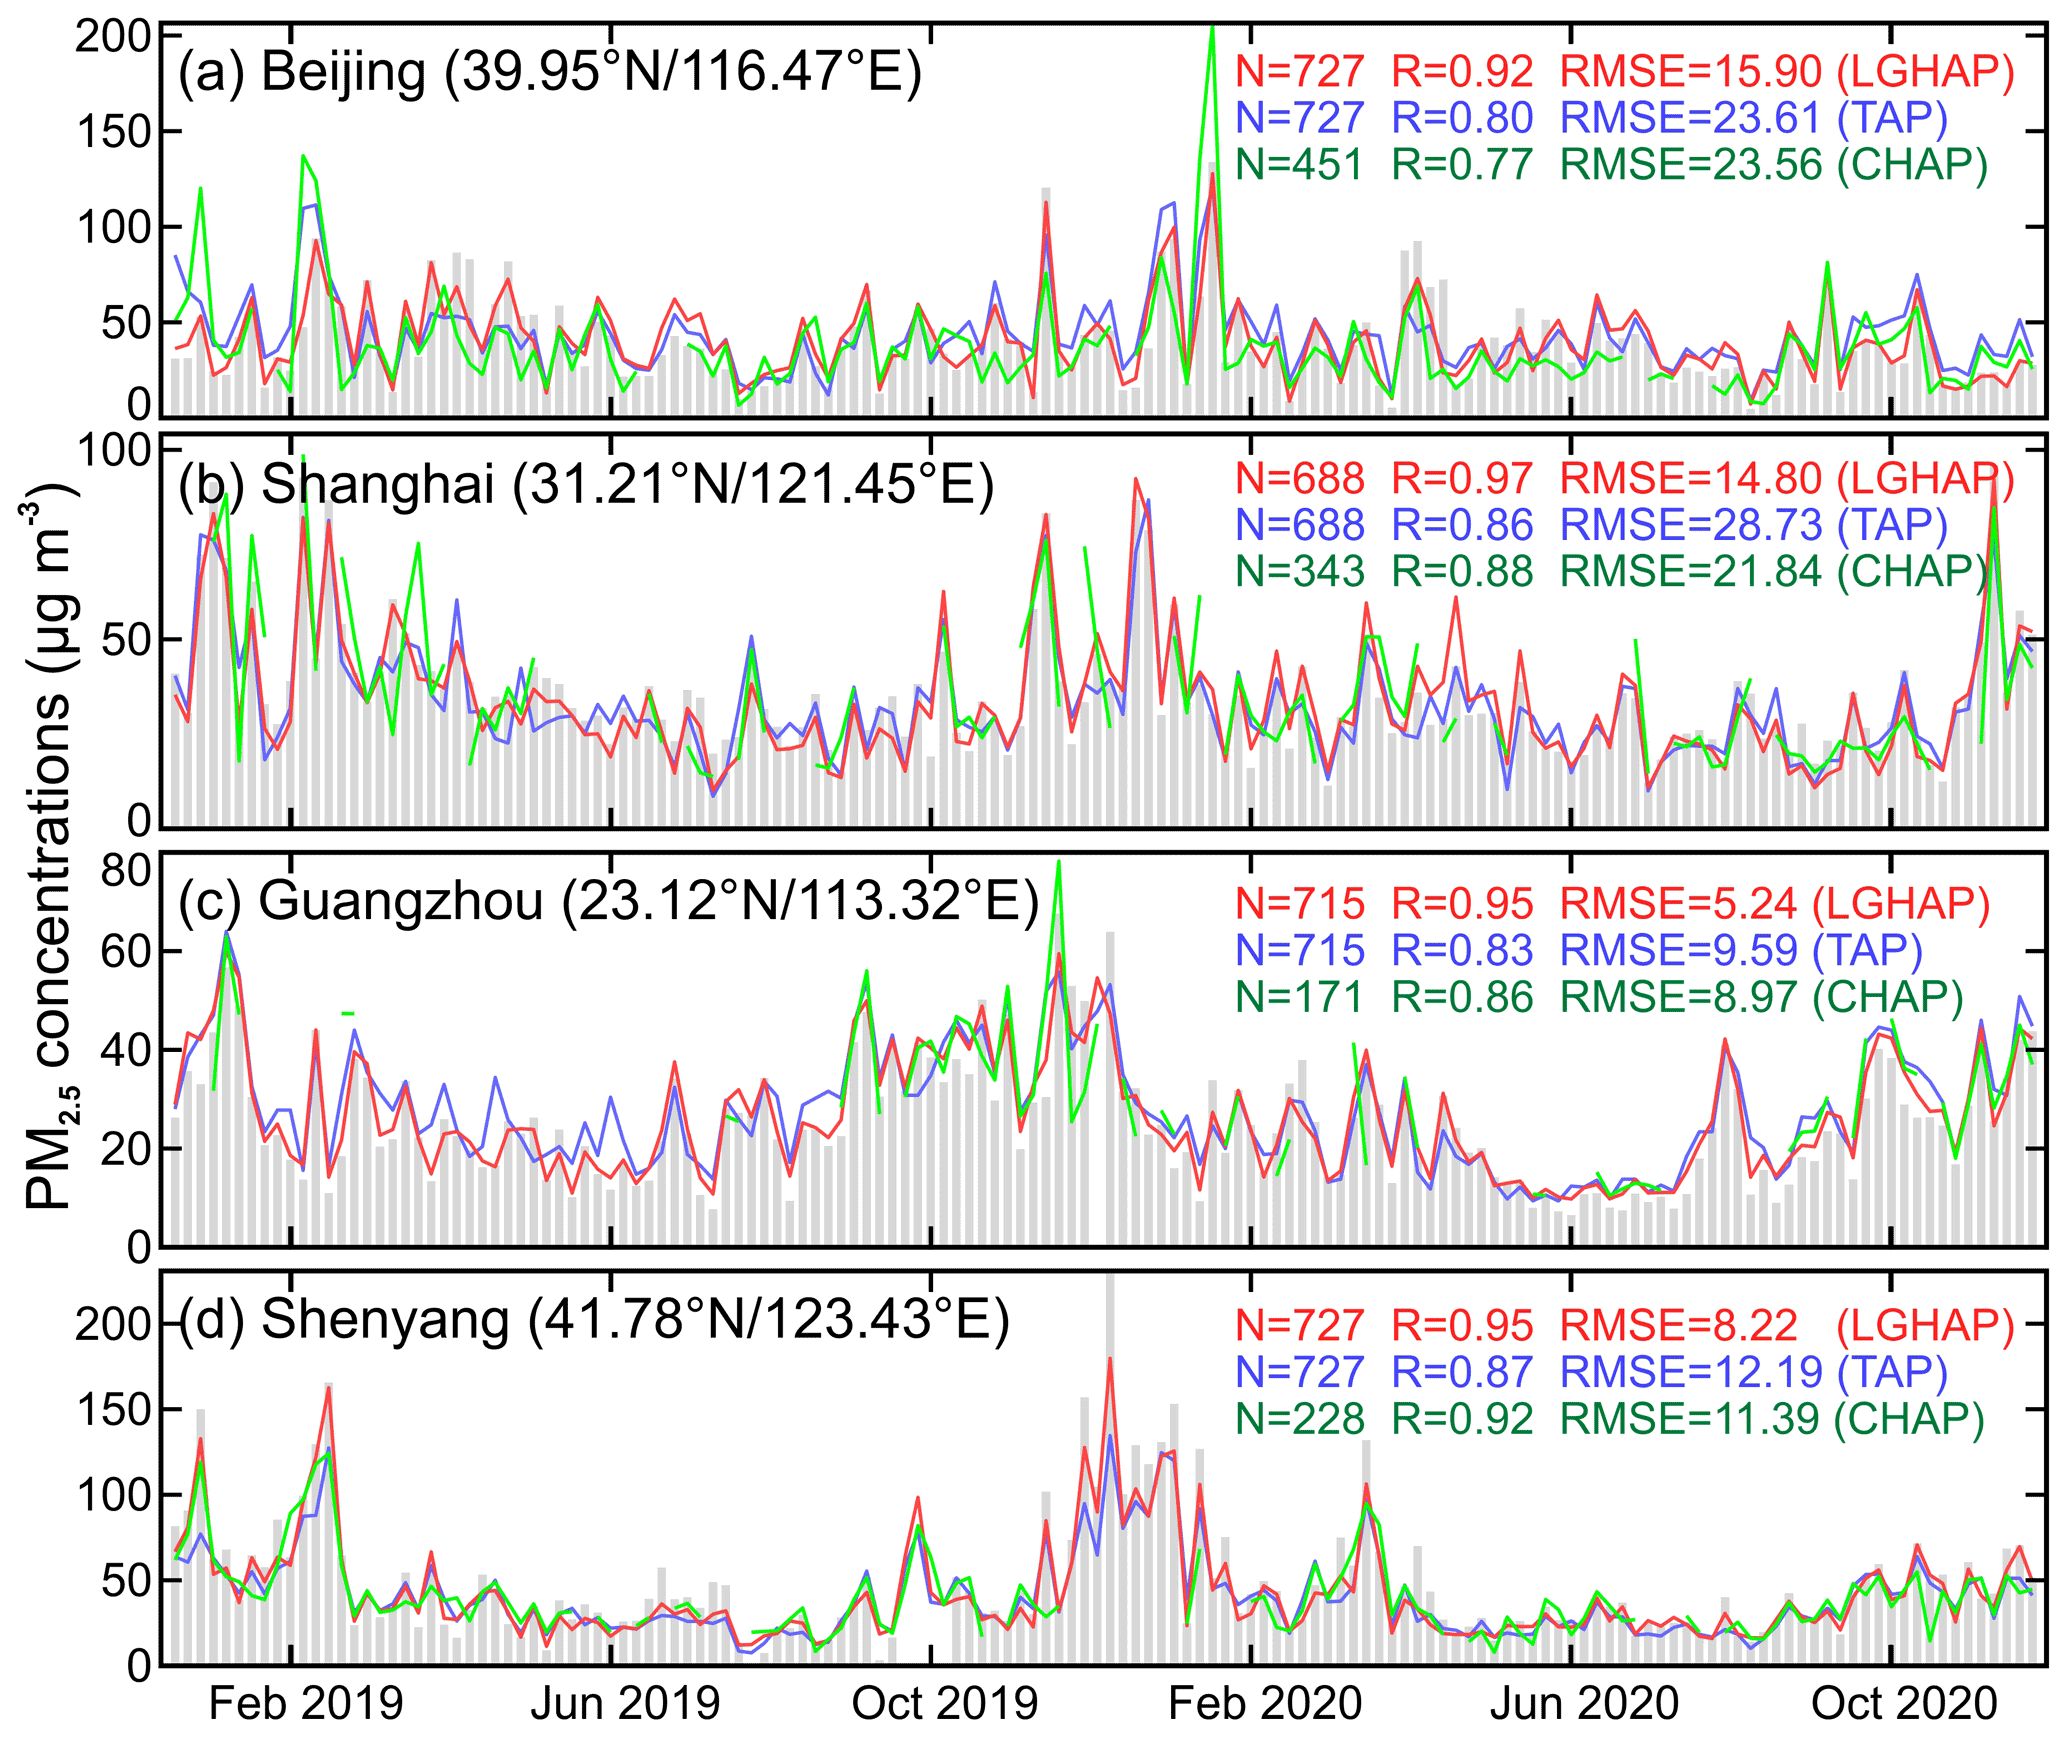
Figure 7Comparison of PM2.5 concentration time series between LGHAP (red line) and two open datasets (blue: TAP; green: CHAP). Here, hourly PM2.5 concentrations measured by four United States embassies in China from 2019 to 2020 (grey bar) were used as an independent PM2.5 dataset to validate these three daily products. CHAP and TAP are two open-access datasets providing PM2.5 concentration that were created by J. Wei et al. (2021) and Geng et al. (2021), respectively.
In Fig. 8 we compared the spatial distribution of PM2.5 that was reconstructed by different datasets. Compared to LGHAP and TAP, PM2.5 data from CHAP are not gap-free since the spatial coverage is determined by the AOD data coverage in the MAIAC product. Compared to TAP, LGHAP PM2.5 data have a finer resolution (1 km versus 10 km), enabling us to examine PM2.5 variations in space with more details. Overall, LGHAP performs better in reconstructing PM2.5 spatial distributions than the other two datasets. Reasons could be attributed to the following two aspects. Firstly, in situ PM2.5 measurements were fused with gridded PM2.5 estimations using the OI method when generating the final PM2.5 product in LGHAP. This can help correct modeling biases in original PM2.5 estimations. Secondly, a set of satellite-based AOD retrievals were incorporated when generating the full-coverage AOD product, which greatly helps reduce large biases in numerical AOD simulations, yielding more accurate PM2.5 estimations in turn. This also highlights the great advantages of using big data analytics methods to advance air pollution assessment.
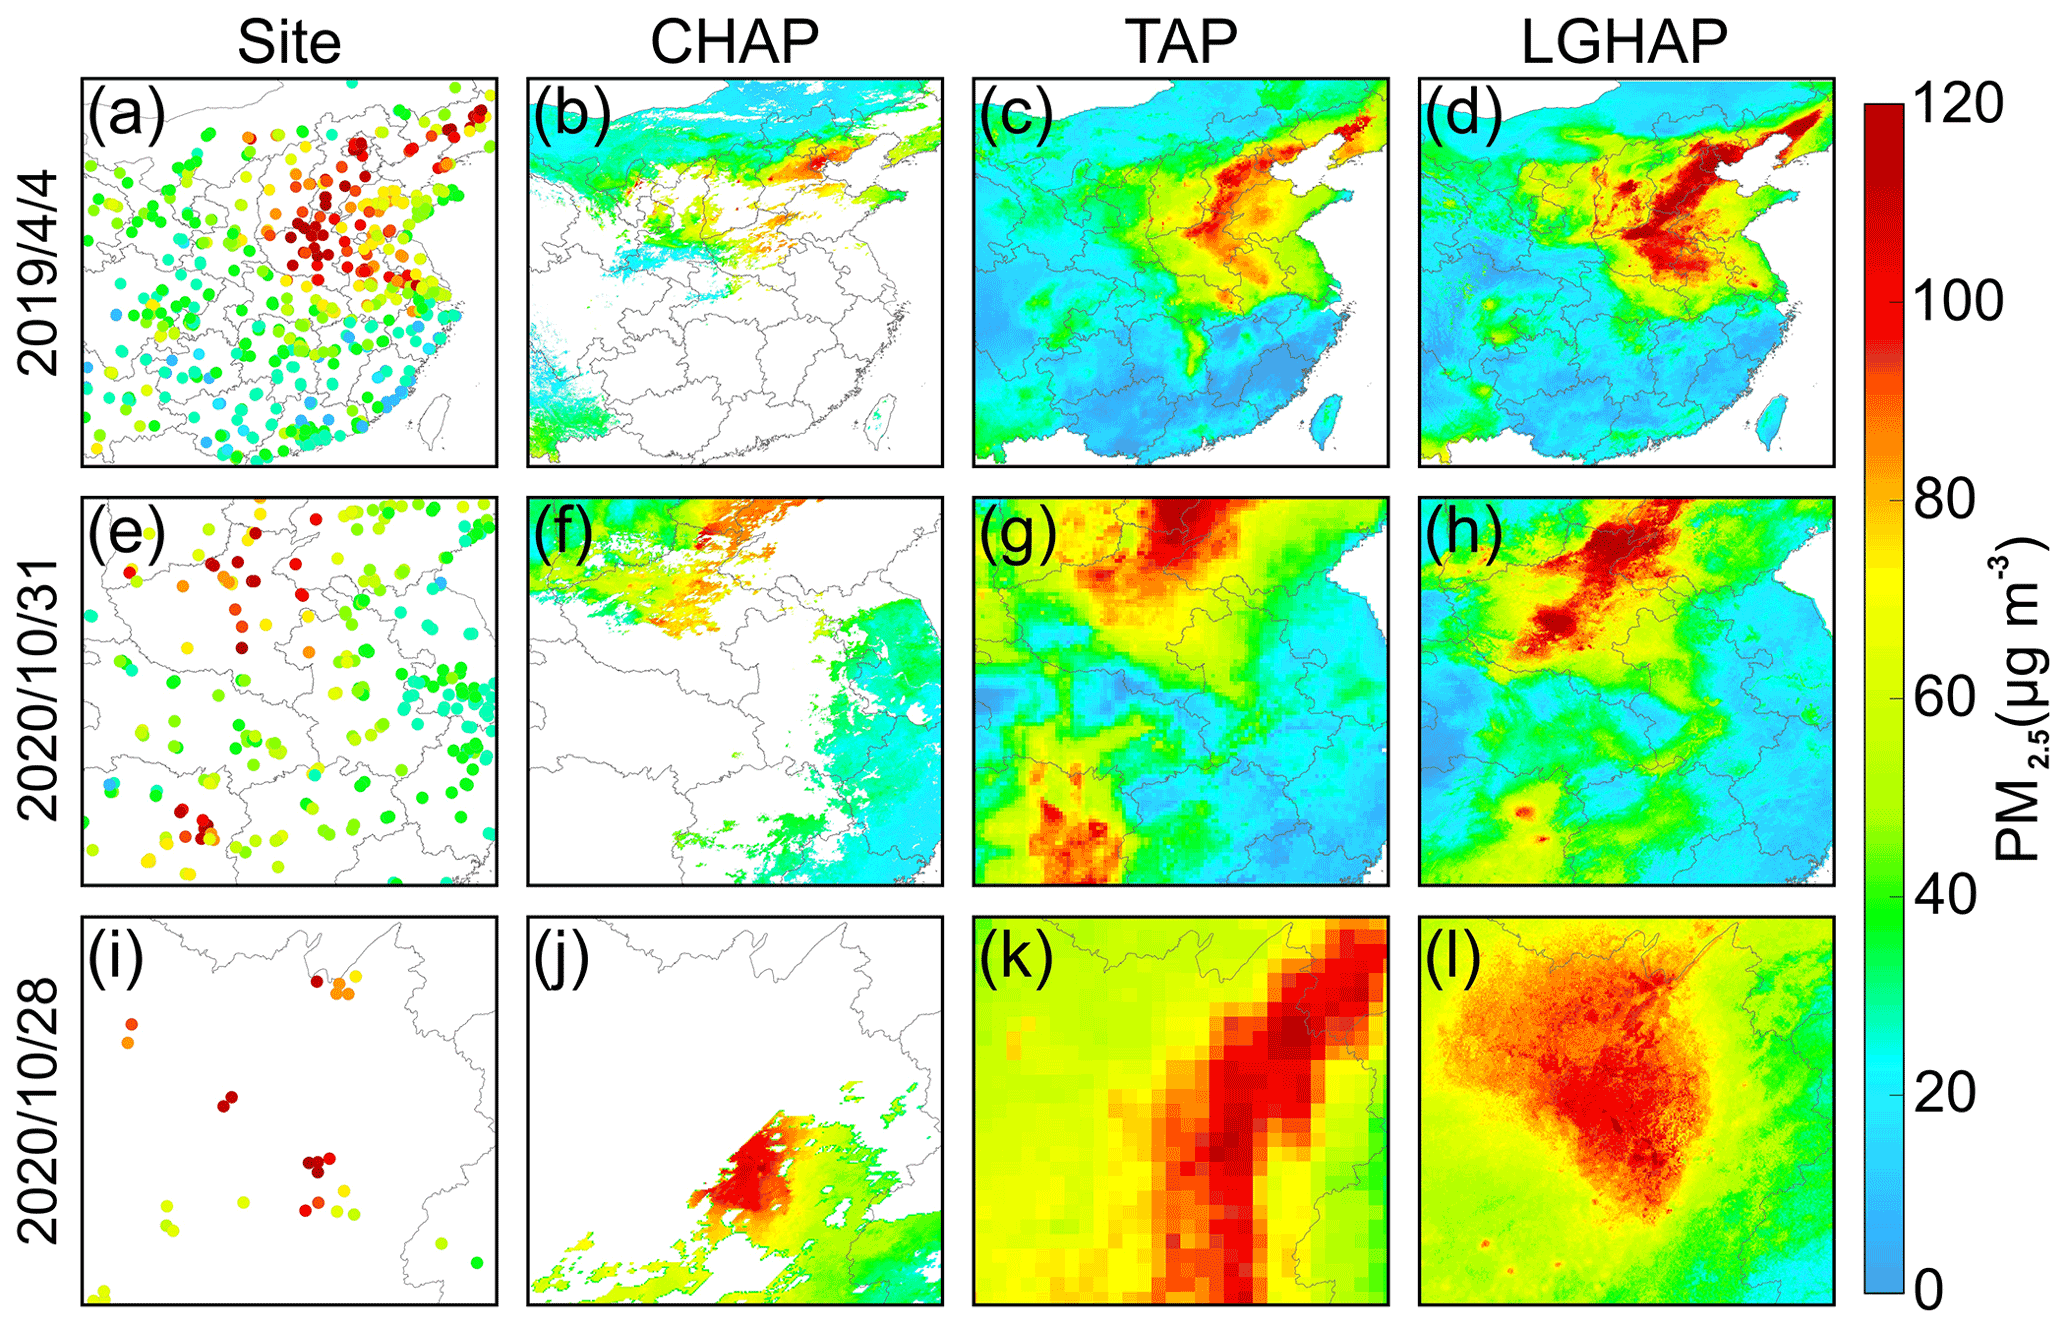
Figure 8Comparison of PM2.5 distribution reconstructed by different PM2.5 concentration datasets. From the left to right, it shows in situ PM2.5 concentration measurements, CHAP, TAP, and LGHAP, respectively. Dates are given in the format year/month/day.
To illustrate the fine resolution of the LGHAP dataset, we compared the annual mean PM10 concentration in 2019 with the proportion of impervious surface that was derived from 30 m resolution land cover data in eastern China. As shown in Fig. 9, the finer resolution of the LGHAP dataset enables us to easily recognize the “hot spot” regions with high PM10 loading. By referring to the impervious surface distribution on the right, we found that these hot spots are mainly over cities and towns, indicative of the presence of pollution islands in urban regions. Owing to the involvement of such high-resolution datasets, the spatial details of PM2.5 and PM10 can be well recognized in LGHAP. The finer-spatial-resolution advantage of the LGHAP dataset can also be demonstrated by comparisons of the spatial distribution of annual mean PM2.5 concentration that was revealed by four different datasets shown in Fig. S6.
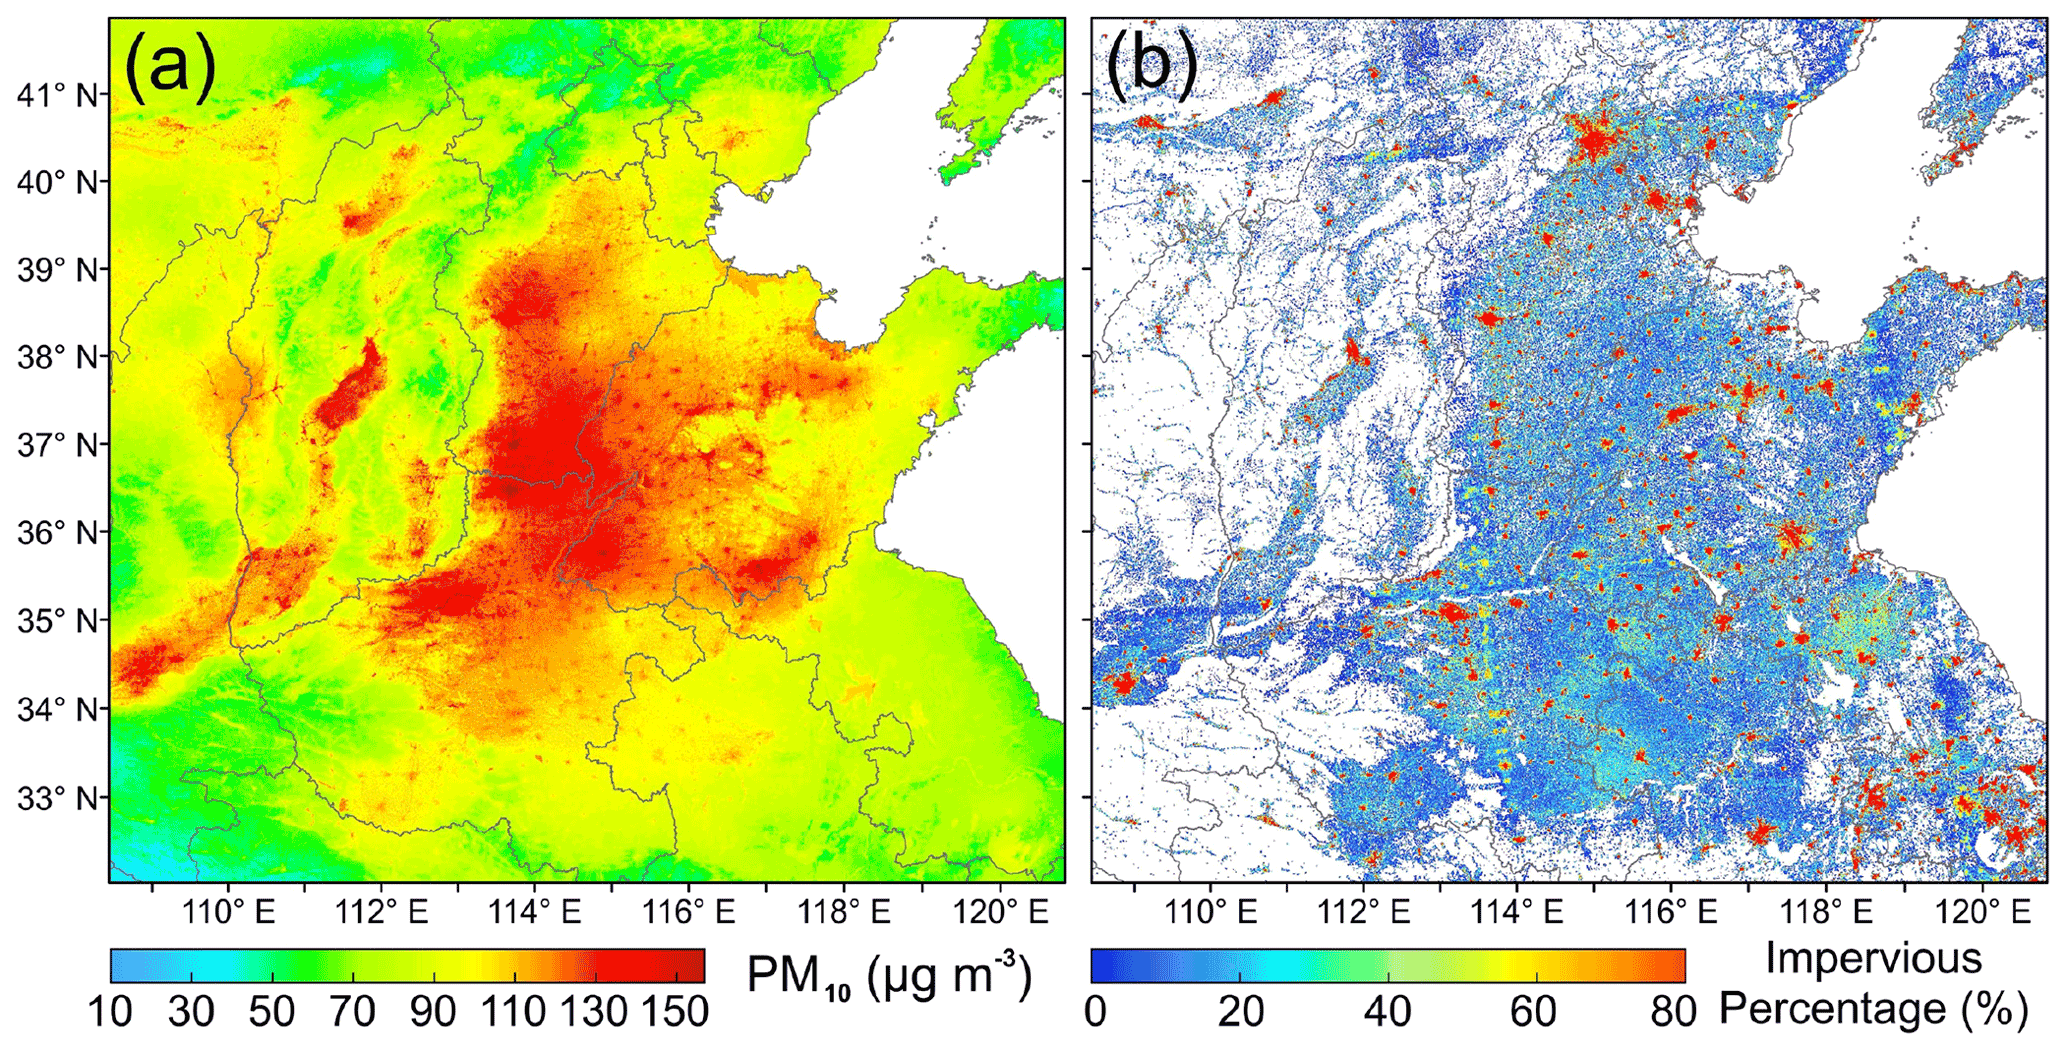
Figure 9Comparison of annual mean PM10 concentration with the proportion of areas coved by impervious surface in eastern China.
4.3 Long-term trends of haze pollution in China from 2000 to 2020
The aerosol pollution trends in China can be better examined by taking advantage of the LGHAP dataset given its long-temporal-coverage, gap-free, and high-resolution superiority. Severe haze pollution such as PM2.5 is oftentimes observed during the winter half year (September–February). In this study, we first calculated mean PM2.5 concentration in China during the winter half year from 2000 to 2020. As shown in Fig. 10, severe haze pollution events were mainly observed in North China during the wintertime, especially over the adjacent region in Hebei–Shandong–Henan provinces. In addition, the Sichuan Basin and Fenwei Plain also suffered from severe haze pollution. Temporally, severe haze pollution events occurred mainly from late 2002 to early 2017 and were significantly reduced after 2017. Similar pattern can also be inferred from PM10 concentration distributions shown in Fig. S7.

Figure 10Spatial distribution of mean PM2.5 concentration from LGHAP during the winter half year (September–February) from 2000 to 2020 in China.
Figure 11 shows the temporal variations in the proportion of land areas covered by PM2.5 concentration exceeding 35 µg m−3 (the national ambient air quality standard for 24 h PM2.5 concentration given in GB 3095-2012). As shown in Fig. 11a, severe PM2.5 pollution occurred mainly during the wintertime in China, as more than one-third of land areas (indicated by the blue lines) were exposed to unhealthy PM2.5 pollutants. Meanwhile, an apparent inflection was observed in 2007, after which the number of episode days decreased drastically for more than one-third of the land area covered by PM2.5 concentration exceeding 35 µg m−3. According to the proportion of land area covered with annual mean PM2.5 concentration greater than 35 µg m−3, the variation in haze pollution in China can be generally divided into three different periods during the past 2 decades (Fig. 11b). As indicated, an increasing trend was observed from 2000 to 2007, during which land areas covered by PM2.5 concentration greater than 35 µg m−3 increased to nearly 40 % at a pace of 1.04 % a−1. The second period was from 2008 to 2013, during which the land area coverage ratio decreased at a rate of −0.21 % a−1. The third period started from 2014, after which the land area covered with PM2.5 concentration more than 35 µg m−3 decreased drastically, at a pace of −2.23 % a−1.
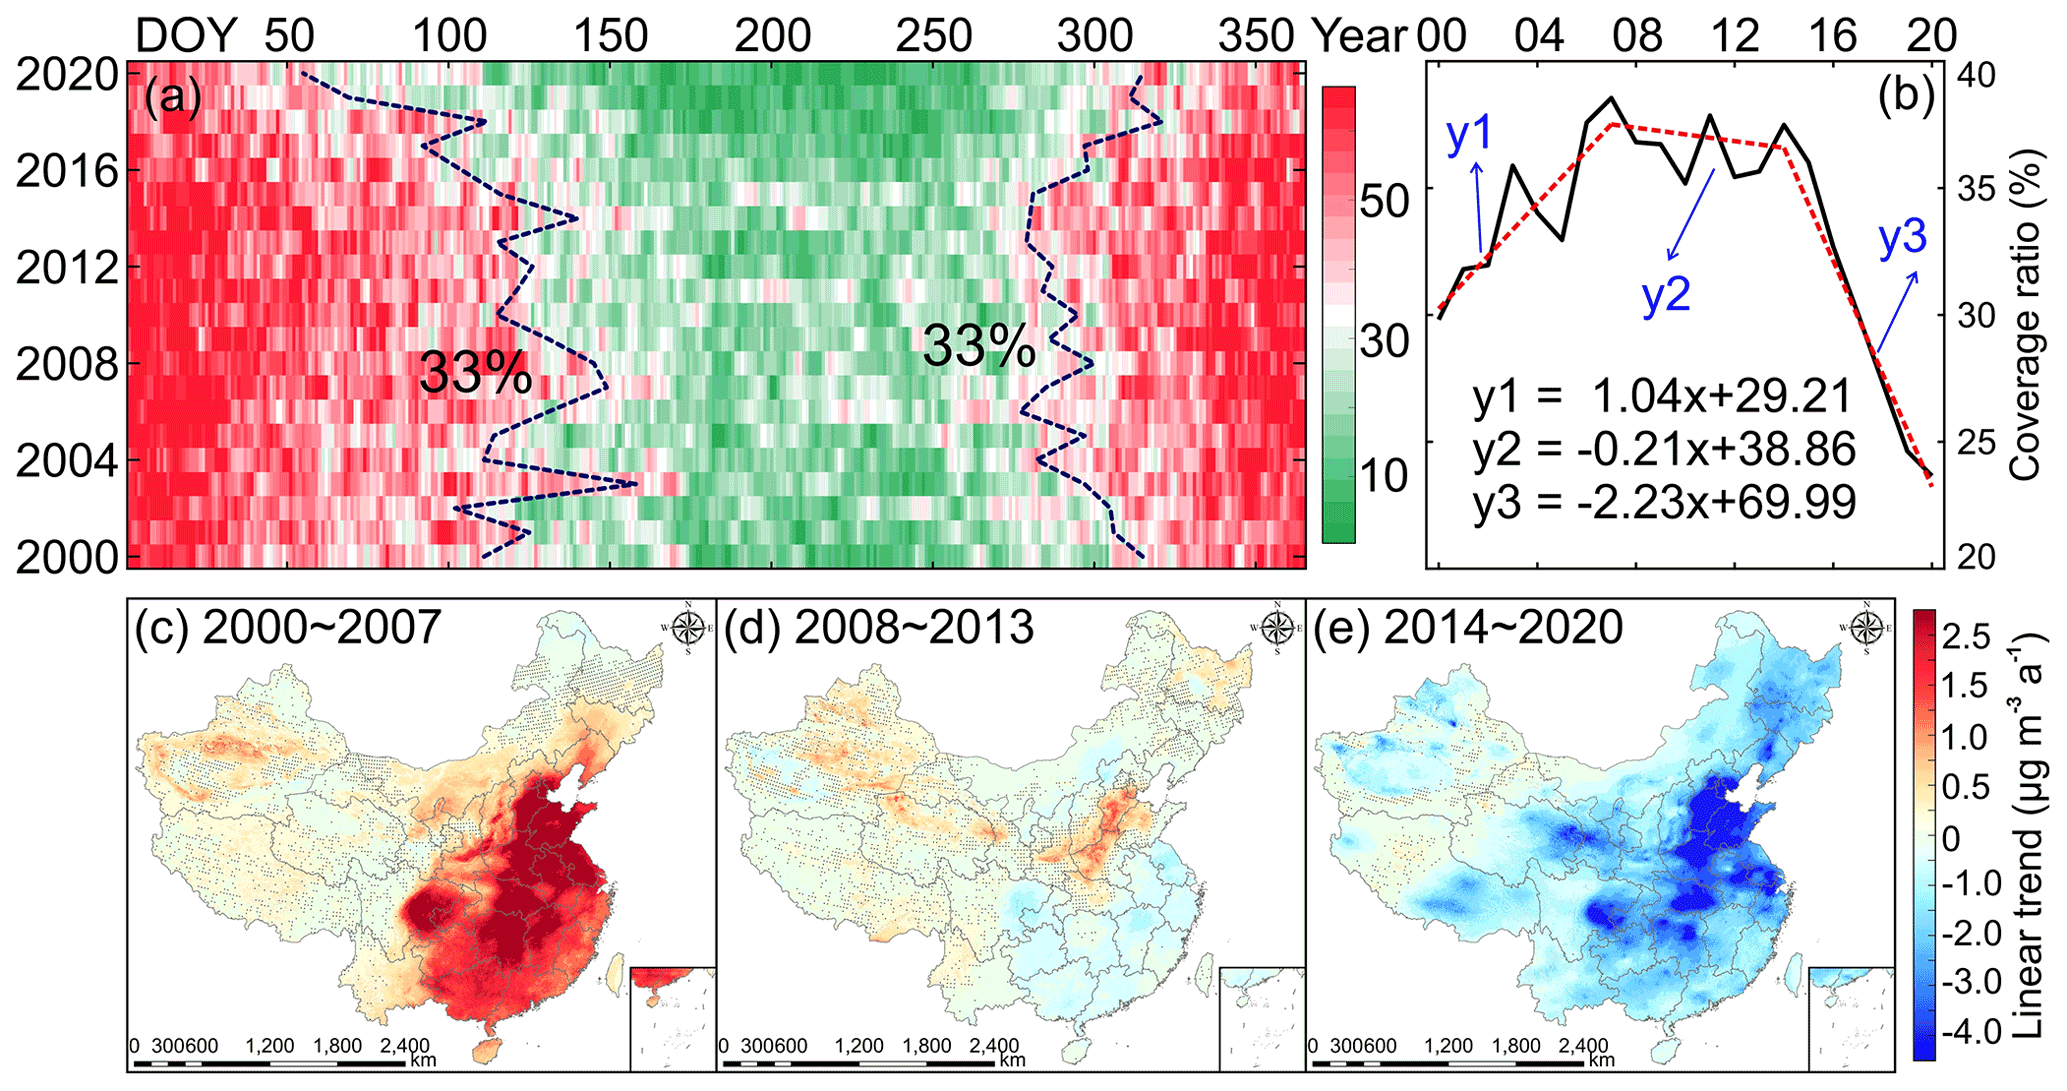
Figure 11Temporal variations in the proportion of land areas covered with PM2.5 concentration exceeding 35 µg m−3 and PM2.5 trends during three different periods. (a) Temporal variations in the land coverage ratio with daily PM2.5 concentration exceeding 35 µg m−3 from 2000 to 2020. (b) Same as (a) but for annual mean PM2.5 concentration. (c–e) PM2.5 trends during the periods of 2000–2007, 2008–2013, and 2014–2020. The dotted regions imply trend estimations are statistically insignificant at the 95 % confidence interval.
Figure 11c–e present the linear trend of PM2.5 concentration during these three specific periods, from which we observed that significant PM2.5 variations occurred mainly over the eastern part of the country where two-thirds of the population resides. A near-ubiquitous PM2.5 increasing trend was observed during 2000–2007, with significant increase (>1.0 µg m−3 a−1) mainly observed in eastern China. During the second period, PM2.5 concentration over most regions showed a small decreasing trend except in the Hebei–Shandong–Henan region where an increasing trend was still observed. An apparent decreasing trend was observed over most parts of the country after 2014, indicative of significant reductions in PM2.5 loading across China. This trend distribution is in line with our previous finding that was derived using the annual mean PM2.5 concentration dataset generated by Dalhousie University (Bai et al., 2019b). However, differences were still observed in terms of the regions where significant decreasing trends were present. The most significant decreasing trends were mainly observed in the Sichuan Basin and Pearl River Delta in the previous study. However, regions with drastic PM2.5 decreases were found mainly in North China where severe haze pollution events were oftentimes reported. Similar variation patterns can also be inferred from PM10 (Fig. S8) and AOD (Fig. S9). Overall, the LGHAP dataset provides us with a gridded perspective to better examine long-term variations in haze pollution in China during the past 2 decades.
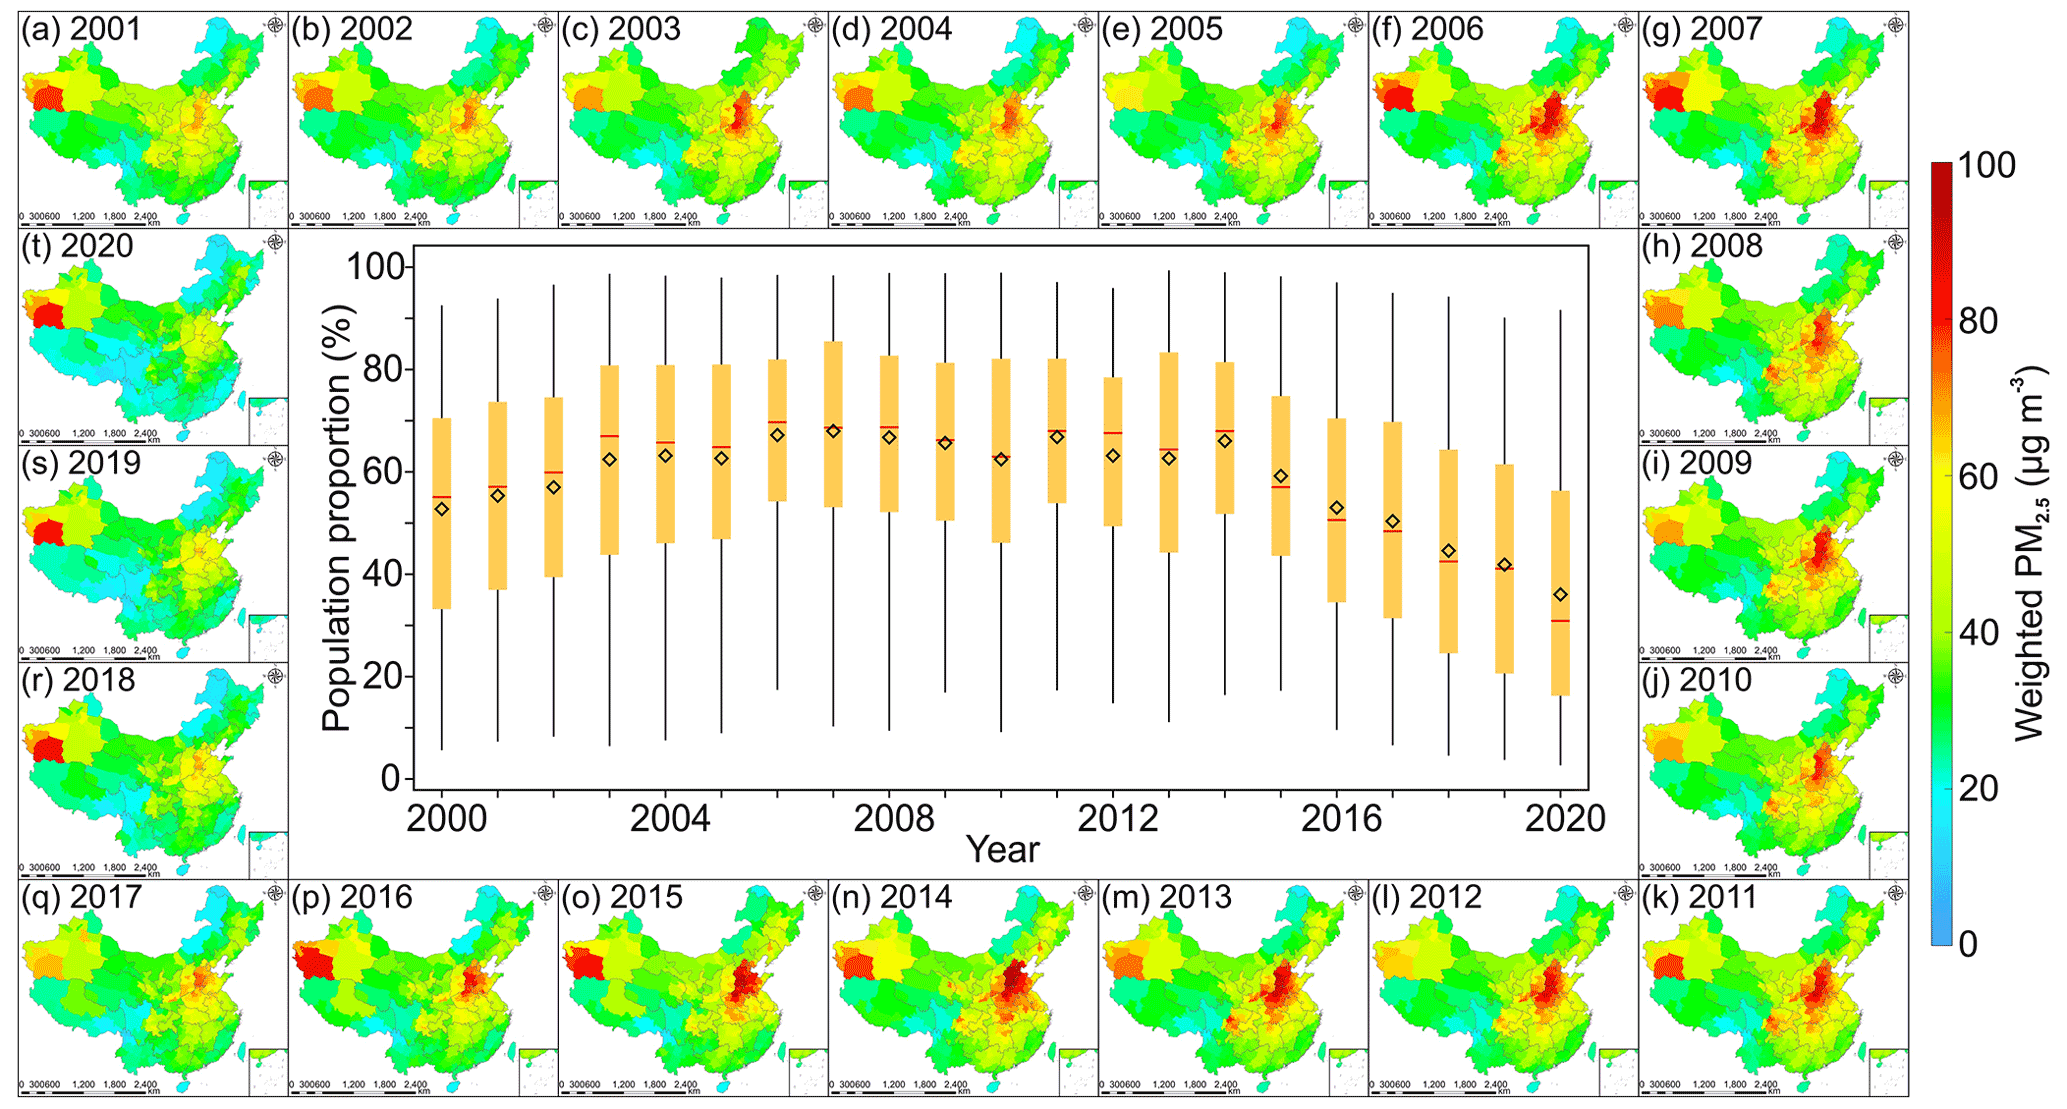
Figure 12Spatial distribution of population-weighted PM2.5 concentration and the proportion of the population exposed to PM2.5 concentration greater than 35 µg m−3. Annual and daily LGHAP PM2.5 concentration data were used for the calculation of weighted PM2.5 and the proportion of population exposure, respectively. The diamond and red line indicate the annual mean and median population proportion, respectively.
4.4 Population exposure to PM2.5 pollution in China
By taking advantage of fine-resolution LGHAP PM2.5 concentration and gridded population data, population exposure to PM2.5 pollution across China over the past 2 decades was estimated. Figure 12 shows the spatial distribution of population-weighted PM2.5 concentration and the proportion of population exposed to PM2.5 concentration greater than 35 µg m−3. As shown, the spatial distribution of population-weighted PM2.5 concentration resembles the spatial pattern of annual mean PM2.5 concentration, with high values observed mainly in eastern and central China as well as northwest China. Nonetheless, PM2.5 sources in these two areas could be different. In northwest China, natural emissions could be the dominant source since a very limited number of people reside there. In contrast, most of the population lives in eastern and central China with a highly developed economy, and anthropogenic emissions thus might play more important roles in PM2.5 formation (Xin et al., 2015; Yang et al., 2011). In regard to the proportion of the population exposed to the ambient environment with PM2.5 concentration greater than 35 µg m−3, we observed that the annual mean population ratio exposure to unhealthy PM2.5 increased gradually from 50.60 % in 2000 to 65.72 % in 2007. During 2007–2014, the ratio varied with small changes (<5 %), whereas a drastic decline was observed after 2014, when the annual mean proportion of population exposed to unhealthy PM2.5 was reduced from 63.81 % in 2014 to 34.03 % in 2020, even though the total population increased from 1.37 billion to 1.41 billion during the synchronous period. Nonetheless, more than one-third of the population was still exposed to unhealthy PM2.5, highlighting the requirement for further emission reduction actions to manage haze pollution in China.
The LGHAP dataset, consisting of gap-free AOD, PM2.5, and PM10 concentration with a daily 1 km resolution from 2000 to 2020, is publicly accessible. All data are provided in the NetCDF format, and data in each individual year are archived in a zip file. For AOD, the dataset has a disk storage size of nearly 27 GB in total, which is available at https://doi.org/10.5281/zenodo.5652257 (Bai et al., 2021a). PM2.5 (38 GB) and PM10 (48 GB) concentration data can be acquired from https://doi.org/10.5281/zenodo.5652265 (Bai et al., 2021b) and https://doi.org/10.5281/zenodo.5652263 (Bai et al., 2021c), respectively. Additionally, monthly and annual mean datasets are also provided, which are publicly available at https://doi.org/10.5281/zenodo.5655797 (Bai et al., 2021d) and https://doi.org/10.5281/zenodo.5655807 (Bai et al., 2021e), respectively. In addition to these datasets, Python, MATLAB, R, and IDL codes that can be used to read and visualize these data are provided as well.
In this study, a big data analytics method was developed for generating the LGHAP dataset to advance research in Earth system science and environment management. With integrative efforts to fuse AOD features extracted from a set of AOD data tensors and knowledge transfer in statistical data mining from diverse air quality indicators, the LGHAP aerosol dataset providing 21-year-long (2000–2020) gap-free AOD, PM2.5, and PM10 concentration data with a daily 1 km resolution in China was generated. Gap-filled AOD imageries were firstly generated by reconstructing AOD distribution in AODTerra via synergistically fusing AOD features recognized from diverse satellites and numerical models as well as in situ data through tensor completion. Compared to ground-based AOD measurements, the gap-filled AOD data exhibit a satisfying prediction accuracy and good performance in delineating AOD variations over space and time. To our knowledge, this is the first attempt to generate a long-term high-resolution AOD dataset with a gap-free nature in China.
PM2.5 and PM10 concentration data were then estimated using an ensemble learning approach by taking advantage of the generated gap-free AOD imageries. Ground validation results also indicate good accuracies of these two gridded products, showing a bias level comparable with many previous studies. Compared with other open-access daily PM2.5 concentration datasets, the LGHAP PM2.5 dataset performs well due to the vantage of having gap-free and fine resolution products. With this gap-free and high-resolution dataset, the long-term variation trend of haze pollution in China over the past 2 decades was examined, and apparent inflections were observed in 2007 and 2014, when PM2.5 concentration was found to turn from an increasing path to decreasing in 2007 with a more drastic decline observed starting from 2014. Moreover, the LGHAP dataset provides us with a gridded perspective to assess 2-decade-long population exposure to PM2.5 pollution in China. In spite of a drastic decline in population exposure, there is still more than one-third of the population exposed to unhealthy PM2.5 pollutants, highlighting the requirement of long-lasting actions to continue PM2.5-related emission reduction.
Overall, these three gridded LGHAP aerosol products provide a long-term perspective on aerosol changes over different regions of China, and users are encouraged to use the LGHAP dataset to assess aerosol impacts on public health, air quality, climate, and ecosystems. The dataset has been publicly released online and is freely accessible via the links provided in Sect. 5. A global-scale dataset is on track and will be released to the public soon.
The supplement related to this article is available online at: https://doi.org/10.5194/essd-14-907-2022-supplement.
The study was completed with cooperation between all authors. KB, KeL, JG, ZL, and NBC conceived of the idea behind generating the LGHAP dataset. KeL, KB, and ZT developed the method, and KB wrote the paper. KeL, KB, KaL, DH, and MM conducted the data analyses. JG and ZL provided atmospheric visibility and in situ AOD data, respectively. All authors discussed the results and proofread the paper.
The contact author has declared that neither they nor their co-authors have any competing interests.
Publisher’s note: Copernicus Publications remains neutral with regard to jurisdictional claims in published maps and institutional affiliations.
The authors are grateful to the editor and the two anonymous referees for their constructive comments and suggestions for improving this paper. Also, the authors would like to thank all the organizations and groups that provided essential datasets that were used in this study. The MAIAC AOD was acquired from https://lpdaac.usgs.gov/products/mcd19a2v006/ (last access: 1 May 2021). The MISR AOD was acquired from https://asdc.larc.nasa.gov/project/MISR (last access: 1 May 2021). The VIIRS AOD was acquired from https://earthdata.nasa.gov/earth-observation-data/near-real-time/download-nrt-data/viirs-nrt (last access: 1 May 2021). The AATSR AOD was acquired from https://climate.esa.int/en/projects/aerosol/data/ (last access: 1 May 2021). The POLDER AOD was acquired from https://www.grasp-open.com/products/polder-data-release/ (last access: 1 May 2021). The aerosol diagnostics including AOD and aerosol components from MERRA-2 were acquired from https://disc.gsfc.nasa.gov/datasets/M2T1NXAER_5.12.4/summary?keywords=MERRA2 (last access: 1 May 2021). AOD from AERONET was acquired from https://aeronet.gsfc.nasa.gov/new_web/aerosols.html (last access: 1 May 2021). Meteorological factors were retrieved from the latest ERA5 reanalysis and can be reached at https://cds.climate.copernicus.eu/cdsapp#!/dataset/reanalysis-era5-single-levels?tab=overview (last access: 1 May 2021). Atmospheric visibility data were acquired from the National Meteorological Information Centre at http://data.cma.cn/en (last access: 1 May 2021). Ground-based air pollutant concentration was acquired from https://air.cnemc.cn:18007/ (last access: 31 December 2020). Gridded population data were acquired from https://www.worldpop.org/ (last access: 1 May 2021), and the DEM was acquired from https://www.resdc.cn/ (last access: 1 May 2021). Monthly NDVI data were acquired from https://lpdaac.usgs.gov/products/mod13a3v061/ (last access: 1 May 2021). Land cover data were acquired from http://www.globallandcover.com/defaults.html?src=/Scripts/map/defaults/browse.html&head=browse&type=data (last access: 1 May 2021) and https://zenodo.org/record/4417810#.YSxD844zYuW (last access: 15 April 2021).
This study was supported by the National Natural Science Foundation of China (grant nos. 42171309 and 41701413) and the Science and Technology Commission of Shanghai Municipality (grant no. 20ZR1415900).
This paper was edited by Qingxiang Li and reviewed by two anonymous referees.
Bai, K., Chang, N.-B., and Chen, C.-F.: Spectral Information Adaptation and Synthesis Scheme for Merging Cross-Mission Ocean Color Reflectance Observations From MODIS and VIIRS, IEEE T. Geosci. Remote, 54, 311–329, https://doi.org/10.1109/TGRS.2015.2456906, 2016.
Bai, K., Li, K., Chang, N.-B., and Gao, W.: Advancing the prediction accuracy of satellite-based PM2.5 concentration mapping: A perspective of data mining through in situ PM2.5 measurements, Environ. Pollut., 254, 113047, https://doi.org/10.1016/j.envpol.2019.113047, 2019a.
Bai, K., Ma, M., Chang, N.-B., and Gao, W.: Spatiotemporal trend analysis for fine particulate matter concentrations in China using high-resolution satellite-derived and ground-measured PM2.5 data, J. Environ. Manage., 233, 530–542, https://doi.org/10.1016/j.jenvman.2018.12.071, 2019b.
Bai, K., Li, K., Wu, C., Chang, N.-B., and Guo, J.: A homogenized daily in situ PM2.5 concentration dataset from the national air quality monitoring network in China, Earth Syst. Sci. Data, 12, 3067–3080, https://doi.org/10.5194/essd-12-3067-2020, 2020a.
Bai, K., Li, K., Guo, J., Yang, Y., and Chang, N.-B.: Filling the gaps of in situ hourly PM2.5 concentration data with the aid of empirical orthogonal function analysis constrained by diurnal cycles, Atmos. Meas. Tech., 13, 1213–1226, https://doi.org/10.5194/amt-13-1213-2020, 2020b.
Bai, K., Li, K. Tan, Z., Han, D., and Guo, J.: Daily 1 km gap-free AOD grids in China, v1 (2000–2020), Zenodo [data set], https://doi.org/10.5281/zenodo.5652257, 2021a.
Bai, K., Li, K. Tan, Z., Han, D., and Guo, J.: Daily 1 km gap-free PM2.5 grids in China, v1 (2000–2020), Zenodo [data set], https://doi.org/10.5281/zenodo.5652265, 2021b.
Bai, K., Li, K. Tan, Z., Han, D., and Guo, J.: Daily 1 km gap-free PM10 grids in China, v1 (2000–2020), Zenodo [data set], https://doi.org/10.5281/zenodo.5652263, 2021c.
Bai, K., Li, K. Tan, Z., Han, D., and Guo, J.: Monthly averaged 1 km gap-free AOD, PM2.5 and PM10 grids in China, v1 (2000–2020), Zenodo [data set], https://doi.org/10.5281/zenodo.5655797, 2021d.
Bai, K., Li, K. Tan, Z., Han, D., and Guo, J.: Annual mean 1 km gap-free AOD, PM2.5 and PM10 grids in China, v1 (2000–2020), Zenodo [data set], https://doi.org/10.5281/zenodo.5655807, 2021e.
Bai, K., Li, K., Guo, J., and Chang, N.-B.: Multiscale and multisource data fusion for full-coverage PM2.5 concentration mapping: Can spatial pattern recognition come with modeling accuracy?, ISPRS J. Photogramm., 184, 31–44, https://doi.org/10.1016/j.isprsjprs.2021.12.002, 2022.
Beckers, J. M. and Rixen, M.: EOF Calculations and Data Filling from Incomplete Oceanographic Datasets, J. Atmos. Ocean. Technol., 20, 1839–1856, https://doi.org/10.1175/1520-0426(2003)020<1839:ECADFF>2.0.CO;2, 2003.
Bi, J., Belle, J. H., Wang, Y., Lyapustin, A. I., Wildani, A., and Liu, Y.: Impacts of snow and cloud covers on satellite-derived PM2.5 levels, Remote Sens. Environ., 221, 665–674, https://doi.org/10.1016/j.rse.2018.12.002, 2018.
Chang, N.-B., Bai, K., and Chen, C.-F.: Smart Information Reconstruction via Time-Space-Spectrum Continuum for Cloud Removal in Satellite Images, IEEE J. Sel. Top. Appl., 8, 1898–1912, https://doi.org/10.1109/JSTARS.2015.2400636, 2015.
Che, H., Yang, L., Liu, C., Xia, X., Wang, Y., Wang, H., Wang, H., Lu, X., and Zhang, X.: Long-term validation of MODIS C6 and C6.1 Dark Target aerosol products over China using CARSNET and AERONET, Chemosphere, 236, 124268, https://doi.org/10.1016/j.chemosphere.2019.06.238, 2019.
Chen, G., Li, S., Knibbs, L. D., Hamm, N. A. S., Cao, W., Li, T., Guo, J., Ren, H., Abramson, M. J., and Guo, Y.: A machine learning method to estimate PM2.5 concentrations across China with remote sensing, meteorological and land use information, Sci. Total Environ., 636, 52–60, https://doi.org/10.1016/j.scitotenv.2018.04.251, 2018.
Chen, J., Ban, Y., and Li, S.: China: Open access to Earth land-cover map, Nature, 514, 434–434, https://doi.org/10.1038/514434c, 2014.
de Leeuw, G., Sogacheva, L., Rodriguez, E., Kourtidis, K., Georgoulias, A. K., Alexandri, G., Amiridis, V., Proestakis, E., Marinou, E., Xue, Y., and van der A, R.: Two decades of satellite observations of AOD over mainland China using ATSR-2, AATSR and MODIS/Terra: data set evaluation and large-scale patterns, Atmos. Chem. Phys., 18, 1573–1592, https://doi.org/10.5194/acp-18-1573-2018, 2018.
Di, Q., Amini, H., Shi, L., Kloog, I., Silvern, R., Kelly, J., Sabath, M. B., Choirat, C., Koutrakis, P., Lyapustin, A., Wang, Y., Mickley, L. J., and Schwartz, J.: An ensemble-based model of PM2.5 concentration across the contiguous United States with high spatiotemporal resolution, Environ. Int., 130, 104909, https://doi.org/10.1016/j.envint.2019.104909, 2019.
Fang, X., Zou, B., Liu, X., Sternberg, T., and Zhai, L.: Satellite-based ground PM2.5 estimation using timely structure adaptive modeling, Remote Sens. Environ., 186, 152–163, https://doi.org/10.1016/j.rse.2016.08.027, 2016.
Fuzzi, S., Baltensperger, U., Carslaw, K., Decesari, S., Denier van der Gon, H., Facchini, M. C., Fowler, D., Koren, I., Langford, B., Lohmann, U., Nemitz, E., Pandis, S., Riipinen, I., Rudich, Y., Schaap, M., Slowik, J. G., Spracklen, D. V., Vignati, E., Wild, M., Williams, M., and Gilardoni, S.: Particulate matter, air quality and climate: lessons learned and future needs, Atmos. Chem. Phys., 15, 8217–8299, https://doi.org/10.5194/acp-15-8217-2015, 2015.
Gao, M., Beig, G., Song, S., Zhang, H., Hu, J., Ying, Q., Liang, F., Liu, Y., Wang, H., Lu, X., Zhu, T., Carmichael, G. R., Nielsen, C. P., and McElroy, M. B.: The impact of power generation emissions on ambient PM2.5 pollution and human health in China and India, Environ. Int., 121, 250–259, https://doi.org/10.1016/j.envint.2018.09.015, 2018.
Geng, G., Xiao, Q., Liu, S., Liu, X., Cheng, J., Zheng, Y., Xue, T., Tong, D., Zheng, B., Peng, Y., Huang, X., He, K., and Zhang, Q.: Tracking Air Pollution in China: Near Real-Time PM2.5 Retrievals from Multisource Data Fusion, Environ. Sci. Technol., 55, 12106–12115, https://doi.org/10.1021/acs.est.1c01863, 2021.
Goldberg, D. L., Gupta, P., Wang, K., Jena, C., Zhang, Y., Lu, Z., and Streets, D. G.: Using gap-filled MAIAC AOD and WRF-Chem to estimate daily PM2.5 concentrations at 1 km resolution in the Eastern United States, Atmos. Environ., 199, 443–452, https://doi.org/10.1016/j.atmosenv.2018.11.049, 2019.
Guo, J., Su, T., Li, Z., Miao, Y., Li, J., Liu, H., Xu, H., Cribb, M., and Zhai, P.: Declining frequency of summertime local-scale precipitation over eastern China from 1970 to 2010 and its potential link to aerosols, Geophys. Res. Lett., 44, 5700–5708, https://doi.org/10.1002/2017GL073533, 2017.
Hu, X., Waller, L. A., Lyapustin, A., Wang, Y., Al-Hamdan, M. Z., Crosson, W. L., Estes, M. G., Estes, S. M., Quattrochi, D. A., Puttaswamy, S. J., and Liu, Y.: Estimating ground-level PM2.5 concentrations in the Southeastern United States using MAIAC AOD retrievals and a two-stage model, Remote Sens. Environ., 140, 220–232, https://doi.org/10.1016/j.rse.2013.08.032, 2014.
Huang, C., Hu, J., Xue, T., Xu, H., and Wang, M.: High-Resolution Spatiotemporal Modeling for Ambient PM2.5 Exposure Assessment in China from 2013 to 2019, Environ. Sci. Technol., 55, 2152–2162, https://doi.org/10.1021/acs.est.0c05815, 2021.
Kolda, T. G. and Bader, B. W.: Tensor Decompositions and Applications, SIAM Rev., 51, 455–500, https://doi.org/10.1137/07070111X, 2009.
Li, J., Li, C., and Zhao, C.: Different trends in extreme and median surface aerosol extinction coefficients over China inferred from quality-controlled visibility data, Atmos. Chem. Phys., 18, 3289–3298, https://doi.org/10.5194/acp-18-3289-2018, 2018.
Li, L., Franklin, M., Girguis, M., Lurmann, F., Wu, J., Pavlovic, N., Breton, C., Gilliland, F., and Habre, R.: Spatiotemporal imputation of MAIAC AOD using deep learning with downscaling, Remote Sens. Environ., 237, 111584, https://doi.org/10.1016/j.rse.2019.111584, 2020.
Li, K., Bai, K., Li, Z., Guo, J., and Chang, N.-B.: Synergistic Data Fusion of Multimodal AOD and Air Quality Data for Near Real-Time Full Coverage Air Pollution Assessment, J. Environ. Manage., 302, 114121, https://doi.org/10.1016/j.jenvman.2021.114121, 2022.
Li, Z., Zhang, Y., Shao, J., Li, B., Hong, J., Liu, D., Li, D., Wei, P., Li, W., Li, L., Zhang, F., Guo, J., Deng, Q., Wang, B., Cui, C., Zhang, W., Wang, Z., Lv, Y., Xu, H., Chen, X., Li, L., and Qie, L.: Remote sensing of atmospheric particulate mass of dry PM2.5 near the ground: Method validation using ground-based measurements, Remote Sens. Environ., 173, 59–68, https://doi.org/10.1016/j.rse.2015.11.019, 2016.
Li, Z., Wang, Y., Guo, J., Zhao, C., Cribb, M. C., Dong, X., Fan, J., Gong, D., Huang, J., Jiang, M., Jiang, Y., Lee, S. S., Li, H., Li, J., Liu, J., Qian, Y., Rosenfeld, D., Shan, S., Sun, Y., Wang, H., Xin, J., Yan, X., Yang, X., Yang, X.-Q., Zhang, F., and Zheng, Y.: East Asian Study of Tropospheric Aerosols and their Impact on Regional Clouds, Precipitation, and Climate (EAST-AIRCPC), J. Geophys. Res.-Atmos., 124, 13026–13054, https://doi.org/10.1029/2019JD030758, 2019.
Lin, C., Li, Y., Lau, A. K. H., Deng, X., Tse, T. K. T., Fung, J. C. H., Li, C., Li, Z., Lu, X., Zhang, X., and Yu, Q.: Estimation of long-term population exposure to PM2.5 for dense urban areas using 1 km MODIS data, Remote Sens. Environ., 179, 13–22, https://doi.org/10.1016/j.rse.2016.03.023, 2016.
Liu, M., Bi, J., and Ma, Z.: Visibility-Based PM2.5 Concentrations in China: 1957–1964 and 1973–2014, Environ. Sci. Technol., 51, 13161–13169, https://doi.org/10.1021/acs.est.7b03468, 2017.
Liu, Y., Paciorek, C. J., and Koutrakis, P.: Estimating Regional Spatial and Temporal Variability of PM2.5 Concentrations Using Satellite Data, Meteorology, and Land Use Information, Environ. Health Persp., 117, 886–892, https://doi.org/10.1289/ehp.0800123, 2009.
Lyapustin, A., Martonchik, J., Wang, Y., Laszlo, I., and Korkin, S.: Multiangle implementation of atmospheric correction (MAIAC): 1. Radiative transfer basis and look-up tables, J. Geophys. Res.-Atmos., 116, D03210, https://doi.org/10.1029/2010JD014985, 2011.
Lyapustin, A., Wang, Y., Korkin, S., and Huang, D.: MODIS Collection 6 MAIAC algorithm, Atmos. Meas. Tech., 11, 5741–5765, https://doi.org/10.5194/amt-11-5741-2018, 2018.
Lyu, B., Hu, Y., Zhang, W., Du, Y., Luo, B., Sun, X., Sun, Z., Deng, Z., Wang, X., Liu, J., Wang, X., and Russell, A. G.: Fusion Method Combining Ground-Level Observations with Chemical Transport Model Predictions Using an Ensemble Deep Learning Framework: Application in China to Estimate Spatiotemporally-Resolved PM2.5 Exposure Fields in 2014–2017, Environ. Sci. Technol., 53, 7306–7315, https://doi.org/10.1021/acs.est.9b01117, 2019.
Ma, Z., Hu, X., Sayer, A. M., Levy, R., Zhang, Q., Xue, Y., Tong, S., Bi, J., Huang, L., and Liu, Y.: Satellite-based spatiotemporal trends in PM2.5 concentrations: China, 2004–2013, Environ. Health Persp., 124, 184–192, https://doi.org/10.1289/ehp.1409481, 2016.
Park, S., Lee, J., Im, J., Song, C. K., Choi, M., Kim, J., Lee, S., Park, R., Kim, S. M., Yoon, J., Lee, D. W., and Quackenbush, L. J.: Estimation of spatially continuous daytime particulate matter concentrations under all sky conditions through the synergistic use of satellite-based AOD and numerical models, Sci. Total Environ., 713, 136516, https://doi.org/10.1016/j.scitotenv.2020.136516, 2020.
Shen, F., Zhang, L., Jiang, L., Tang, M., Gai, X., Chen, M., and Ge, X.: Temporal variations of six ambient criteria air pollutants from 2015 to 2018, their spatial distributions, health risks and relationships with socioeconomic factors during 2018 in China, Environ. Int., 137, 105556, https://doi.org/10.1016/j.envint.2020.105556, 2020.
Sidiropoulos, N. D., De Lathauwer, L., Fu, X., Huang, K., Papalexakis, E. E., and Faloutsos, C.: Tensor Decomposition for Signal Processing and Machine Learning, IEEE T. Signal Proces., 65, 3551–3582, https://doi.org/10.1109/TSP.2017.2690524, 2017.
Sogacheva, L., Popp, T., Sayer, A. M., Dubovik, O., Garay, M. J., Heckel, A., Hsu, N. C., Jethva, H., Kahn, R. A., Kolmonen, P., Kosmale, M., de Leeuw, G., Levy, R. C., Litvinov, P., Lyapustin, A., North, P., Torres, O., and Arola, A.: Merging regional and global aerosol optical depth records from major available satellite products, Atmos. Chem. Phys., 20, 2031–2056, https://doi.org/10.5194/acp-20-2031-2020, 2020.
Sun, J.-L., Jing, X., Chang, W.-J., Chen, Z.-X., and Zeng, H.: Cumulative health risk assessment of halogenated and parent polycyclic aromatic hydrocarbons associated with particulate matters in urban air, Ecotox. Environ. Safe., 113, 31–37, https://doi.org/10.1016/j.ecoenv.2014.11.024, 2015.
Sun, Z., Chang, N. Bin, Chen, C. F., Mostafiz, C., and Gao, W.: Ensemble learning via higher order singular value decomposition for integrating data and classifier fusion in water quality monitoring, IEEE J. Sel. Top. Appl., 14, 3345–3360, https://doi.org/10.1109/JSTARS.2021.3055798, 2021.
Tang, Q., Bo, Y., and Zhu, Y.: Spatiotemporal fusion of multiple-satellite aerosol optical depth (AOD) products using Bayesian maximum entropy method, J. Geophys. Res.-Atmos., 121, 4034–4048, https://doi.org/10.1002/2015JD024571, 2016.
Tucker, L. R.: Some mathematical notes on three-mode factor analysis, Psychometrika, 31, 279–311, https://doi.org/10.1007/BF02289464, 1966.
van Donkelaar, A., Martin, R. V., Brauer, M., Kahn, R., Levy, R., Verduzco, C., and Villeneuve, P. J.: Global Estimates of Ambient Fine Particulate Matter Concentrations from Satellite-Based Aerosol Optical Depth: Development and Application, Environ. Health Perspect., 118, 847–855, https://doi.org/10.1289/ehp.0901623, 2010.
van Donkelaar, A., Martin, R. V., Brauer, M., Hsu, N. C., Kahn, R. A., Levy, R. C., Lyapustin, A., Sayer, A. M., and Winker, D. M.: Global Estimates of Fine Particulate Matter using a Combined Geophysical-Statistical Method with Information from Satellites, Models, and Monitors, Environ. Sci. Technol., 50, 3762–3772, https://doi.org/10.1021/acs.est.5b05833, 2016.
Wang, B., Yuan, Q., Yang, Q., Zhu, L., Li, T., and Zhang, L.: Estimate hourly PM2.5 concentrations from Himawari-8 TOA reflectance directly using geo-intelligent long short-term memory network, Environ. Pollut., 271, 116327, https://doi.org/10.1016/j.envpol.2020.116327, 2021.
Wang, Q., Shen, Y., and Zhang, J. Q.: A nonlinear correlation measure for multivariable data set, Phys. D, 3–4, 287–295, https://doi.org/10.1016/j.physd.2004.11.001, 2005.
Wang, Y., Yuan, Q., Li, T., Shen, H., Zheng, L., and Zhang, L.: Large-scale MODIS AOD products recovery: Spatial-temporal hybrid fusion considering aerosol variation mitigation, ISPRS J. Photogramm., 157, 1–12, https://doi.org/10.1016/j.isprsjprs.2019.08.017, 2019.
Wang, Y., Yuan, Q., Li, T., Tan, S., and Zhang, L.: Full-coverage spatiotemporal mapping of ambient PM2.5 and PM10 over China from Sentinel-5P and assimilated datasets: Considering the precursors and chemical compositions, Sci. Total Environ., 793, 148535, https://doi.org/10.1016/j.scitotenv.2021.148535, 2021.
Wei, J., Li, Z., Peng, Y., and Sun, L.: MODIS Collection 6.1 aerosol optical depth products over land and ocean: validation and comparison, Atmos. Environ., 201, 428–440, https://doi.org/10.1016/j.atmosenv.2018.12.004, 2019.
Wei, J., Li, Z., Lyapustin, A., Sun, L., Peng, Y., Xue, W., Su, T., and Cribb, M.: Reconstructing 1 km-resolution high-quality PM2.5 data records from 2000 to 2018 in China: spatiotemporal variations and policy implications, Remote Sens. Environ., 252, 112136, https://doi.org/10.1016/j.rse.2020.112136, 2021.
Wei, X., Chang, N., Bai, K., and Gao, W.: Satellite remote sensing of aerosol optical depth: advances, challenges, and perspectives, Crit. Rev. Env. Sci. Tec., 50, 1640–1725, https://doi.org/10.1080/10643389.2019.1665944, 2020.
Wei, X., Bai, K., Chang, N., and Gao, W.: Multi-source hierarchical data fusion for high-resolution AOD mapping in a forest fire event, Int. J. Appl. Earth Obs., 102, 102366, https://doi.org/10.1016/j.jag.2021.102366, 2021.
Xiao, Q., Zhang, H., Choi, M., Li, S., Kondragunta, S., Kim, J., Holben, B., Levy, R. C., and Liu, Y.: Evaluation of VIIRS, GOCI, and MODIS Collection 6 AOD retrievals against ground sunphotometer observations over East Asia, Atmos. Chem. Phys., 16, 1255–1269, https://doi.org/10.5194/acp-16-1255-2016, 2016.
Xiao, Q., Wang, Y., Chang, H. H., Meng, X., Geng, G., Lyapustin, A., and Liu, Y.: Full-coverage high-resolution daily PM2.5 estimation using MAIAC AOD in the Yangtze River Delta of China, Remote Sens. Environ., 199, 437–446, https://doi.org/10.1016/j.rse.2017.07.023, 2017.
Xiao, Q., Chang, H. H., Geng, G., and Liu, Y.: An Ensemble Machine-Learning Model to Predict Historical PM2.5 Concentrations in China from Satellite Data, Environ. Sci. Technol., 52, 13260–13269, https://doi.org/10.1021/acs.est.8b02917, 2018.
Xin, J., Wang, Y., Pan, Y., Ji, D., Liu, Z., Wen, T., Wang, Y., Li, X., Sun, Y., Sun, J., Wang, P., Wang, G., Wang, X., Cong, Z., Song, T., Hu, B., Wang, L., Tang, G., Gao, W., Guo, Y., Miao, H., Tian, S., and Wang, L.: The Campaign on Atmospheric Aerosol Research Network of China: CARE-China, B. Am. Meteorol. Soc., 96, 1137–1155, https://doi.org/10.1175/BAMS-D-14-00039.1, 2015.
Xu, H., Guang, J., Xue, Y., de Leeuw, G., Che, Y. H., Guo, J., He, X. W., and Wang, T. K.: A consistent aerosol optical depth (AOD) dataset over mainland China by integration of several AOD products, Atmos. Environ., 114, 48–56, https://doi.org/10.1016/j.atmosenv.2015.05.023, 2015.
Xue, T., Zheng, Y., Tong, D., Zheng, B., Li, X., Zhu, T., and Zhang, Q.: Spatiotemporal continuous estimates of PM2.5 concentrations in China, 2000–2016: A machine learning method with inputs from satellites, chemical transport model, and ground observations, Environ. Int., 123, 345–357, https://doi.org/10.1016/j.envint.2018.11.075, 2019.
Yang, F., Tan, J., Zhao, Q., Du, Z., He, K., Ma, Y., Duan, F., Chen, G., and Zhao, Q.: Characteristics of PM2.5 speciation in representative megacities and across China, Atmos. Chem. Phys., 11, 5207–5219, https://doi.org/10.5194/acp-11-5207-2011, 2011.
Yang, J. and Huang, X.: The 30 m annual land cover dataset and its dynamics in China from 1990 to 2019, Earth Syst. Sci. Data, 13, 3907–3925, https://doi.org/10.5194/essd-13-3907-2021, 2021.
Yang, Y., Zheng, Z., Yim, S. H. L., Roth, M., Ren, G., Gao, Z., Wang, T., Li, Q., Shi, C., Ning, G., and Li, Y. B.: PM2.5 Pollution Modulates Wintertime Urban-Heat-Island Intensity in the Beijing-Tianjin-Hebei Megalopolis, China, Geophys. Res. Lett., 47, e2019GL084288, https://doi.org/10.1029/2019gl084288, 2020.
Zhang, T., Zeng, C., Gong, W., Wang, L., Sun, K., Shen, H., Zhu, Z., and Zhu, Z.: Improving spatial coverage for Aqua MODIS AOD using NDVI-based multi-temporal regression analysis, Remote Sens., 9, 340, https://doi.org/10.3390/rs9040340, 2017.
Zhang, Y., Gao, L., Cao, L., Yan, Z., and Wu, Y.: Decreasing atmospheric visibility associated with weakening winds from 1980 to 2017 over China, Atmos. Environ., 224, 117314, https://doi.org/10.1016/j.atmosenv.2020.117314, 2020.
Zhang, Y., Li, Z., Bai, K., Wei, Y., Xie, Y., Zhang, Yuanxun, Ou, Y., Cohen, J., Zhang, Yuhuan, Peng, Z., Zhang, X., Chen, C., Hong, J., Xu, H., Guang, J., Lv, Y., Li, K., and Li, D.: Satellite remote sensing of atmospheric particulate matter mass concentration: Advances, challenges, and perspectives, Fundam. Res., 1, 240–258, https://doi.org/10.1016/j.fmre.2021.04.007, 2021.
Zhao, C., Yang, Y., Fan, H., Huang, J., Fu, Y., Zhang, X., Kang, S., Cong, Z., Letu, H., and Menenti, M.: Aerosol characteristics and impacts on weather and climate over the Tibetan Plateau, Natl. Sci. Rev., 7, 492–495, https://doi.org/10.1093/nsr/nwz184, 2020.
Zheng, Z., Ren, G., Wang, H., Dou, J., Gao, Z., Duan, C., Li, Y., Ngarukiyimana, J., Zhao, C., Cao, C., Jiang, M., and Yang, Y.: Relationship between Fine Particle Pollution and the Urban Heat Island in Beijing, China: Observational Evidence, Bound.-Lay. Meteorol., 169, 93-113, https://doi.org/10.1007/s10546-018-0362-6, 2018.
Zheng Z., Zhao, C., Lolli, S., Wang, X., Wang, Y., Ma, X., Li, Q., and Yang, Y.: Diurnal Variation of Summer Precipitation Modulated by Air Pollution: Observational Evidences in the Beijing Metropolitan Area, Environ. Res. Lett., 15, 094053, https://doi.org/10.1088/1748-9326/ab99fc, 2020.