the Creative Commons Attribution 4.0 License.
the Creative Commons Attribution 4.0 License.
 | 18 Feb 2022
Reactive nitrogen fluxes over peatland and forest ecosystems using micrometeorological measurement techniques
Christian Brümmer
Jeremy J. Rüffer
Jean-Pierre Delorme
Pascal Wintjen
Frederik Schrader
Burkhard Beudert
Martijn Schaap
Christof Ammann
Interactions of reactive nitrogen (Nr) compounds between the atmosphere and the earth's surface play a key role in atmospheric chemistry and in understanding nutrient cycling of terrestrial ecosystems. While continuous observations of inert greenhouse gases through micrometeorological flux measurements have become a common procedure, information about temporal dynamics and longer-term budgets of Nr compounds is still extremely limited. Within the framework of the research projects NITROSPHERE and FORESTFLUX, field campaigns were carried out to investigate the biosphere–atmosphere exchange of selected Nr compounds over different land surfaces. The aim of the campaigns was to test and establish novel measurement techniques in eddy-covariance setups for continuous determination of surface fluxes of ammonia (NH3) and total reactive nitrogen (ΣNr) using two different analytical devices. While high-frequency measurements of NH3 were conducted with a quantum cascade laser (QCL) absorption spectrometer, a custom-built converter called Total Reactive Atmospheric Nitrogen Converter (TRANC) connected and operated upstream of a chemiluminescence detector (CLD) was used for the measurement of ΣNr. As high-resolution data of Nr surface–atmosphere exchange are still scarce but highly desired for testing and validating local inferential and larger-scale models, we provide access to campaign data including concentrations, fluxes, and ancillary measurements of meteorological parameters. Campaigns (n=4) were carried out in natural (forest) and semi-natural (peatland) ecosystem types. The published datasets stress the importance of recent advancements in laser spectrometry and help improve our understanding of the temporal variability of surface–atmosphere exchange in different ecosystems, thereby providing validation opportunities for inferential models simulating the exchange of reactive nitrogen. The dataset has been placed in the Zenodo repository (https://doi.org/10.5281/zenodo.4513854; Brümmer et al., 2022) and contains individual data files for each campaign.
- Article
(1419 KB) - Full-text XML
-
Supplement
(1837 KB) - BibTeX
- EndNote


The term “reactive nitrogen” (Nr) describes all forms of nitrogen that are biologically, photochemically, and radiatively active. The most important substances are nitric oxide (NO), nitrogen dioxide (NO2), nitrate (NO), nitric acid (HNO3), ammonium (NH), and ammonia (NH3). Historically, their low availability had been the main limiting factor for the productivity of natural ecosystems. However, with the invention of the Haber–Bosch process in 1908, inexpensive industrial mass production of synthetic Nr fertilizers through synthesizing NH3 from di-nitrogen (N2) and hydrogen became viable, thereby inducing a number of positive and unintended negative consequences (Erisman et al., 2008; Sutton et al., 2011). A clear benefit was the stabilization of the food supply for populations in developed countries, whereas substantial Nr losses into the environment caused a number of adverse effects for terrestrial and aquatic ecosystems. These were for example impacts on greenhouse gas exchange such as enhanced nitrous oxide (N2O) and NH3 emissions and inhibition of soil methane (CH4) oxidation. Other effects comprised direct toxicity of plants followed by biodiversity loss, while acidification and eutrophication of soils and inshore waters, respectively, were further observed (Galloway et al., 2003; Flechard et al., 2011).
Biosphere–atmosphere interactions of Nr compounds play a key role in atmospheric chemistry and in nutrient dynamics of terrestrial and aquatic ecosystems (Ollinger et al., 2002; Farmer et al., 2008). While cropland or intensively managed grasslands typically lose massive amounts of Nr via gaseous emissions to the atmosphere or via nitrate leaching into soil and water bodies, (semi-)natural ecosystems such as forests and peatlands receive crucial Nr input deposited from the atmosphere, thereby being a controlling factor for their productivity, species composition, and their biosphere–atmosphere exchange of greenhouse gases (Fleischer et al., 2013; Hurkuck et al., 2014). Depending on regional emission sources and local surface characteristics, the ratio of dry to wet deposition may range from 1:2 to 2:1 (Simpson et al., 2006).
Micrometeorological flux measurements of non-reactive greenhouse gases using the eddy-covariance technique have become a common procedure for continuous observations of the biosphere–atmosphere exchange (Baldocchi, 2014). Hundreds of flux towers are nowadays organized in regional or continental-scale networks such as ICOS (Integrated Carbon Observation System; Franz et al., 2018; Gielen et al., 2017) and follow standardized measurement protocols (Rebmann et al., 2018). Despite recent technological advances, particularly in the area of laser spectroscopy, flux measurements of Nr compounds are still challenging and have largely remained experimental with limited campaign durations mainly due to high costs for devices, maintenance, and operation (Flechard et al., 2011). Other aspects challenging Nr flux field campaigns are gas-phase reactions (Meixner, 1994) and gas–aerosol particle interactions (Wolff et al., 2010) within the chemical mixture of Nr, thereby requiring individual measurements of several parameters simultaneously. A comprehensive overview of commonly used measurement techniques for a variety of Nr compounds is given in the introductory section of Marx et al. (2012). A general issue with flux measurements using the eddy-covariance technique is a potential flux loss occurring in the high-frequency range because of different types of setups and response characteristics of instruments, e.g. closed- vs. open-path instruments. These losses are found to be significantly higher for Nr than for carbon dioxide (CO2) or water vapour flux measurements (cf. Fratini et al., 2012; Ibrom et al., 2007; Mamadou et al., 2016; Moravek et al., 2019; Wintjen et al., 2020) and can be up to 35 % of an individually measured flux rate.
Models simulating plant–soil–atmosphere interactions of Nr species are useful tools to investigate exchange patterns of different ecosystems. Land surface–atmosphere schemes (Massad et al., 2010; Wichink Kruit et al., 2010) can either be applied in local-scale studies (e.g. Schrader et al., 2016) or within the framework of chemical transport models such as DEPAC (DEPosition of Acidifying Compounds) (Erisman et al., 1994) within LOTOS-EUROS (Long Term Ozone Simulation – European Operational Smog) (van Zanten et al., 2010; Manders et al., 2017). Outputs of these models help understand ecosystem functioning and can further be used for gap filling in order to compile total nitrogen budgets, which form the basis of national inventories of air pollutants and their assessment reports. For a more robust model validation and to better facilitate investigations of the high degree of spatial and temporal variability of Nr fluxes, a close coupling of modelling and measurement studies has been recently postulated (Schrader, 2019; Schrader et al., 2020). The latter studies also provide a state-of-the-art overview of current challenges and perspectives in Nr modelling focusing on biosphere–atmosphere exchange of ammonia.
The aim of this paper is the release and description of campaign datasets of Nr fluxes, which have been made publicly available in the Zenodo repository (https://doi.org/10.5281/zenodo.4513854). Four multi-month to multi-year field campaigns covering two different ecosystem types (peatland and forest) have been carried out within the research projects NITROSPHERE (Brümmer et al., 2019) and FORESTFLUX (Brümmer et al., 2020). We used a quantum cascade laser (QCL) absorption spectrometer and a custom-built converter called Total Reactive Atmospheric Nitrogen Converter (TRANC) connected upstream to a chemiluminescence detector (CLD) for measuring ammonia and total reactive nitrogen (hereafter named ΣNr) fluxes, respectively. These datasets demonstrate the suitability of QCL and TRANC in eddy-covariance setups and – as in situ high-resolution data of surface–atmosphere fluxes of Nr compounds are still scarce – highlight potential applications such as model validation, understanding temporal dynamics of Nr exchange, derivation of deposition velocities, and using model output as a gap-filling strategy for eddy-covariance datasets. The reader is referred to Table S1 in the Supplement where an overview of previous eddy-covariance campaigns of different Nr compounds is given. The table highlights the limitations of campaign lengths, a wide range of flux uncertainties, and mainly different aims of previous studies such as testing the suitability of a certain analyser, investigating processes of tropospheric chemistry, or derivation of correction factors. In the here presented study, we follow the nomenclature of Marx et al. (2012), with the definition of ΣNr comprising all nitrogen-containing trace species but excluding N2 and N2O as these are non-reactive in the lower troposphere.
Datasets of reactive nitrogen ecosystem–atmosphere fluxes presented in this paper were acquired during four field campaigns between October 2012 and June 2018. Measurements took place at two different sites representing a natural forest (FOR) and a semi-natural peatland (WET). At each of the sites, both high-frequency QCL and TRANC measurements of NH3 and ΣNr, respectively, were conducted in eddy-covariance setups. These micrometeorological measurements were accompanied by monthly integrated low-cost denuder and filter samplers for a variety of Nr compounds (Sect. 3.3). Further site information, campaign numbers, individual campaign lengths, and site acronyms used in this paper are given in Tables 1 to 3.
Table 1Overview of field campaigns with ΣNr referring to the sum of all reactive nitrogen compounds, with TRANC being the Total Reactive Atmospheric Nitrogen Converter, QCL being a quantum cascade laser spectrometer, and CLD being a chemiluminescence detector.
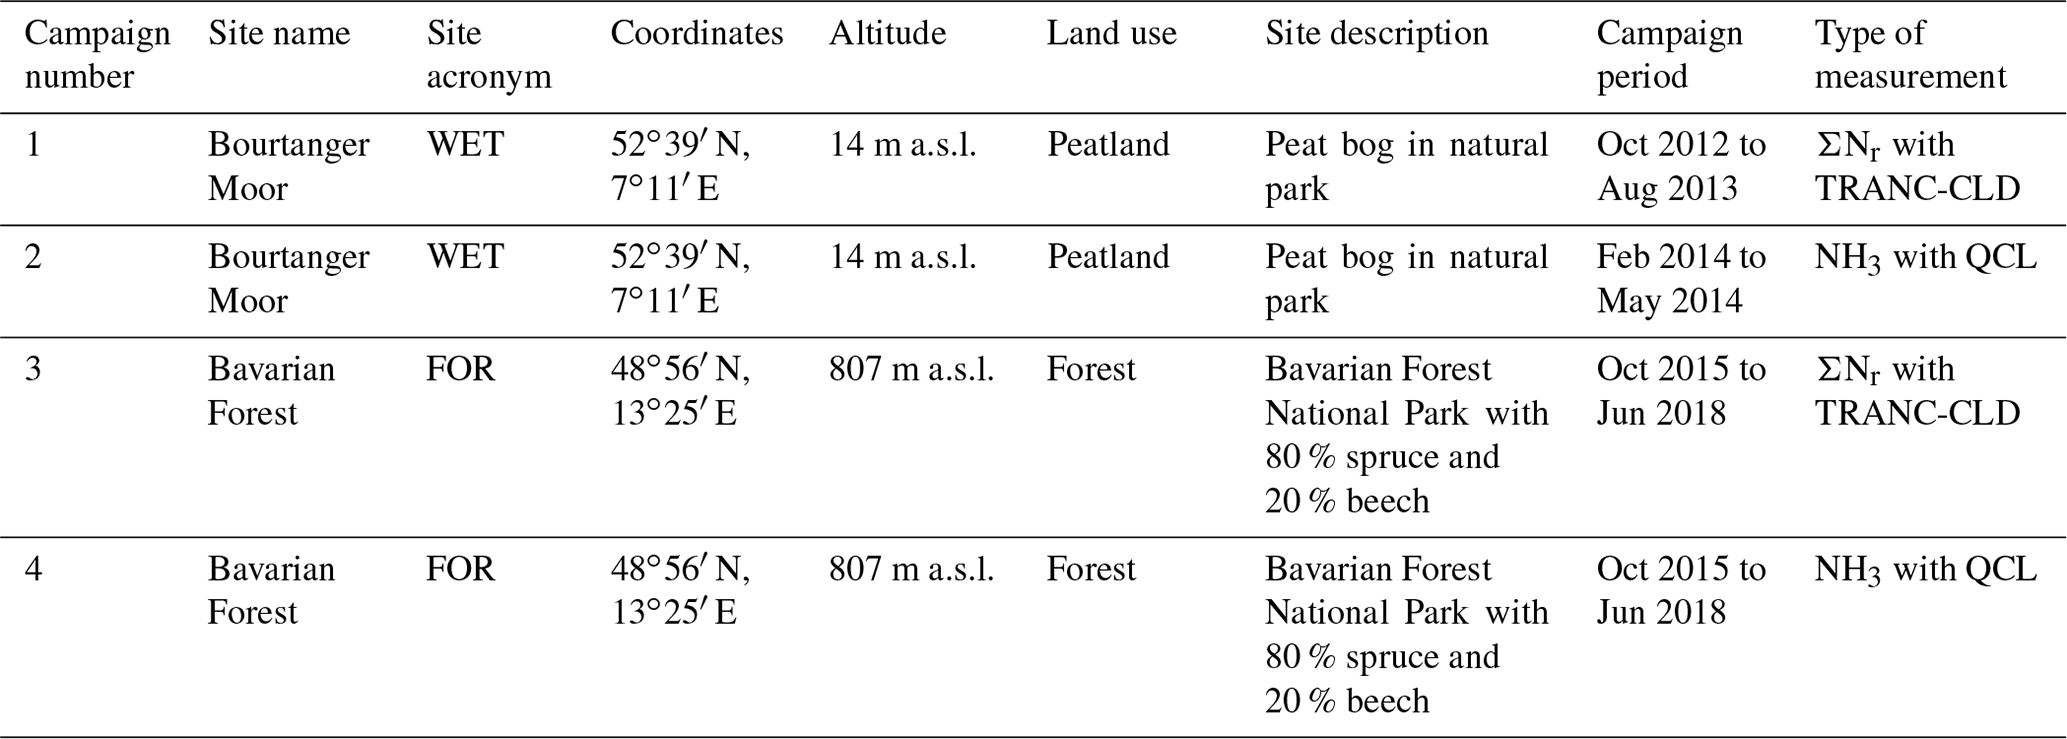
2.1 Bourtanger Moor site (WET)
The Bourtanger Moor is a natural park in the border region between northwest Germany and the northeast Netherlands. The area was a wide-ranging and intact raised bog ecosystem in central Europe before being drained and cultivated in the 17th century (Casparie, 1993). Before rewetting was considered, the site had been moderately drained since the 1950s and constitutes nowadays one of the last protected semi-natural peatlands in the region, whereas the surrounding raised bog complex of an approximate size of 700 ha is characterized by extensive peat excavation with drainage ditches and water table lowering primarily for the purpose of oil and gas drilling. Maximum accumulated peat depth is roughly 4 m. Main vegetation components are bog heather (Erica tetralix), purple moor grass (Molinia caerulea), cotton grass (Eriophorum vaginatum and Eriophorum angustifolium), coppices with some solitary birches (Betula pubescens) and Scots pines (Pinus sylvestris), and Sphagnum mosses. The Bourtanger Moor is surrounded by an area of intensive crop production and livestock breeding resulting in ∼ 25 kg ha−1 atmospheric nitrogen deposition annually. The ratio of dry to wet deposition has been found to be ∼ 2:3 (Hurkuck et al., 2014), thereby substantially exceeding the critical N load of 5 to 10 kg ha−1 yr−1 prescribed for semi-natural peatlands. More site-specific information about the Bourtanger Moor can be found in the publications by Hurkuck et al. (2015, 2016) and references therein. Considerable seasonal variability in water table depth was observed with fully water saturated soil in December and January and up to 60 cm below surface in late summer and early autumn averaging annually at around 10 cm. Annual average air temperature and precipitation for the period 1981 to 2010 at a nearby weather station from the German Meteorological Service in Lingen was 10.0 ∘C and 799 mm, respectively.
2.2 Bavarian Forest site (FOR)
The Bavarian Forest site represents a remote location some tens of kilometres away from rather small anthropogenic emission sources providing the opportunity to study background concentration variability and natural flux exchange of a mixed-forest ecosystem. The site is located in the Forellenbach catchment in the Bavarian Forest National Park, thereby being unmanaged with a tree composition of ∼ 80 % spruce (Picea abies) and ∼ 20 % beech (Fagus sylvatica) in the flux tower footprint. The forest was subjected to a massive bark beetle outbreak between 1995 and 2000 and is still recovering from the disturbance (Beudert et al., 2014). Stand height during the campaign was up to 20 m. Mean annual air temperature and precipitation according to records from the Bavarian Forest National Park Administration from the years 1978 to 2017 is 6.6 ∘C and 1563 mm, respectively.
The Bavarian Forest National Park is part of several international observation networks. The most important are the Long-Term Ecological Research (LTER, https://data.lter-europe.net/, last access: 6 March 2021) network with the Forellenbach catchment furthermore being part of the International Cooperative Program on Integrated Monitoring of Air Pollution Effects on Ecosystems (ICP IM) within the framework of the Geneva Convention on Long-Range Transboundary Air Pollution (https://unece.org/fileadmin//DAM/env/lrtap/WorkingGroups/wge/ im.htm, last access: 6 March 2021).
3.1 TRANC – Total Reactive Atmospheric Nitrogen Converter
The detection of concentrations of total reactive nitrogen (ΣNr) were conducted with a manufactured in-house device named TRANC connected upstream to a chemiluminescence detector (CLD, model 780TR, ECO PHYSICS AG, Dürnten, Switzerland). The housing of the TRANC has an outer diameter of 12 cm and is 71 cm long. In all field campaigns the sonic anemometer was positioned upwind of the TRANC from the main wind direction, thereby keeping unintended disturbance of the natural micro-turbulence as low as possible. The measurement concept is based on two sequential conversion paths with the first one being a thermal step and the second one being a catalytic step including the addition of carbon monoxide (CO) as a reducing agent. Reaction temperatures are 870 and 300 ∘C in an actively heated iron–nickel–chrome (FeNiCr) tube and a passively heated gold tube, respectively. Within the two paths, all reactive nitrogen compounds are converted to nitric oxide (NO), which is analysed in a downstream connected CLD at a frequency of 10 Hz (FOR site) or 20 Hz (WET site). Flow rate was kept constant at ∼ 2.0 L min−1 depending on site setup (cf. Table 2) by using a dry vacuum scroll pump (BOC Edwards XDS10, Sussex, UK) connected to the CLD. Pressure reduction was assured through a critical orifice upstream of the CLD ensuring the required regime of approximately 14 mbar needed for the operation of the reaction chamber. The conversion efficiency of the TRANC under both laboratory conditions and in a long-term field experiment was tested by Marx et al. (2012). In the laboratory, the authors examined recovery rates for the gases NO2 and NH3, which were found to be 99 % and 95 %, respectively. A further test for a compound mixture of NO2 and NH3 during an 11-month field campaign resulted in an average recovery of 91 %. Detailed information on TRANC description and performance are presented in Ammann et al. (2012), Brümmer et al. (2013), Wintjen et al. (2020), Zöll et al. (2019), and in Figs. 1 and 2.
Table 2Setups and data characteristics with ΣNr referring to the sum of all reactive nitrogen compounds, with TRANC being the Total Reactive Atmospheric Nitrogen Converter, QCL being a quantum cascade laser spectrometer, and CLD being a chemiluminescence detector.
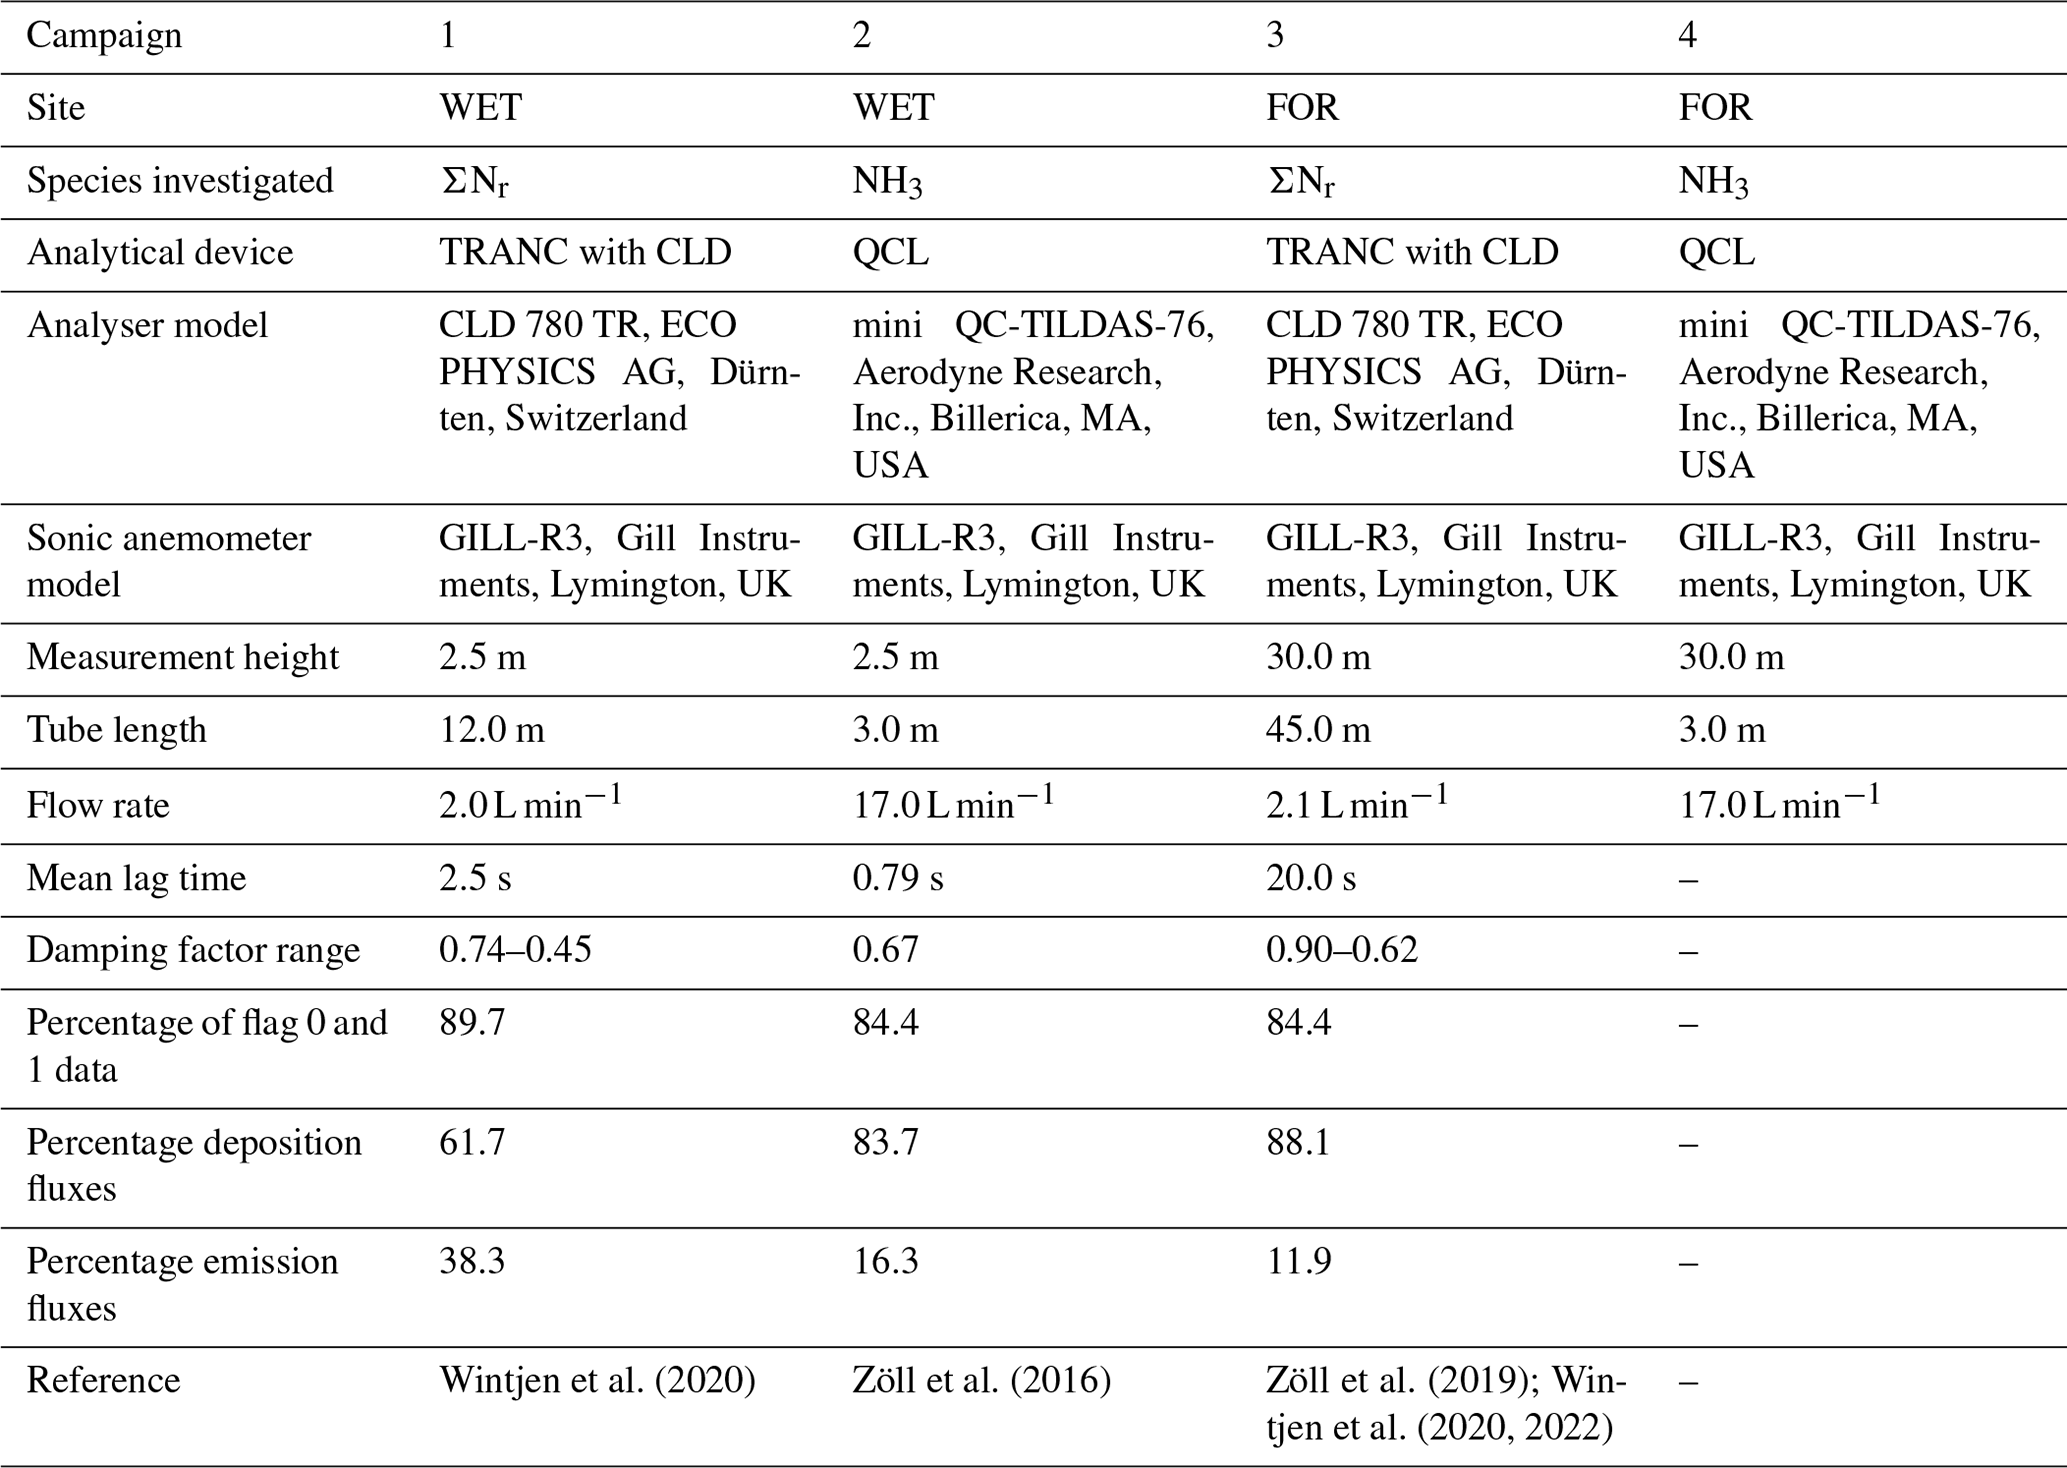
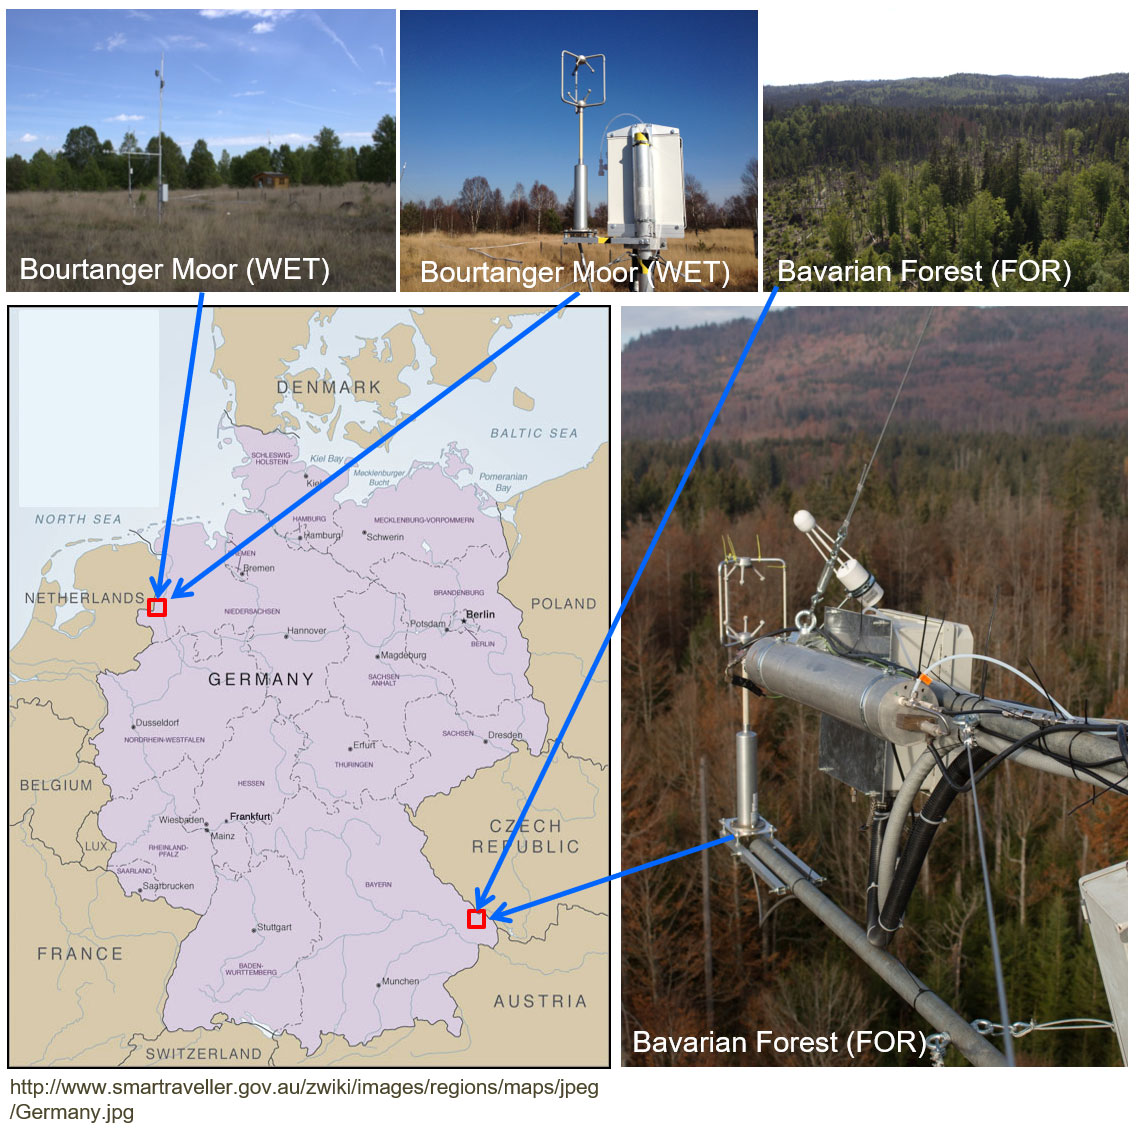
Figure 1Map of campaign locations and setup pictures.
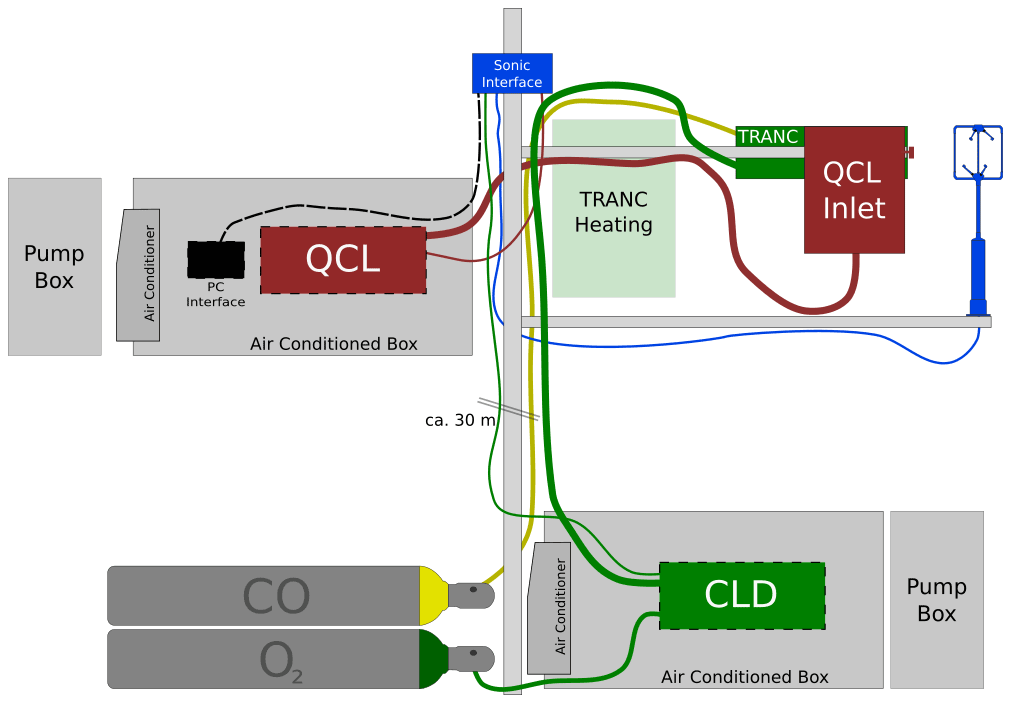
Figure 2Exemplary sketch of instrumentation with QCL and TRANC being simultaneously operated, not true to scale; QCL is quantum cascade laser, CLD is chemiluminescence detector, and TRANC is Total Reactive Atmospheric Nitrogen Converter.
3.2 QCL – quantum cascade laser spectrometer
Ammonia concentration measurements were conducted with a quantum cascade laser absorption spectrometer, model mini QC-TILDAS-76, Aerodyne Research, Inc., Billerica, MA, USA. The QCL was connected to a dry vacuum scroll pump (TriScroll 600, Agilent Technologies, Santa Clara, USA) maintaining a flow rate through the system of approximately 17 L min−1. Ammonia concentrations were measured in a 0.5 L multi-pass adsorption cell (76 m path length) at a frequency of 10 Hz. The signal was corrected for water vapour dilution using an online implementation, thereby providing mixing ratios of moles of NH3 per mole of dry air. The QCL has a detection limit in the sub-ppb (parts per billion) range (cf. McManus et al., 2008). Precision of the instrument is 0.042, 0.021, 0.016, and 0.010 ppb over 1, 10, 20, and 60 s, respectively. A specifically designed “inertial inlet” box by the manufacturer was installed upstream of the QCL using a 3.5 m heated (40 ∘C) anti-adhesive perfluoroalkoxy (PFA) tube to avoid unintended interactions of NH3 with other gases, particles, and surfaces. More than 50 % of the aerosols (>300 nm) were removed inside the inlet box through a split in the incoming air and a forced 180∘ turn of the air sample (Ellis et al., 2010; Ferrara et al., 2012; von Bobrutzki et al., 2010; Zöll et al., 2016). Additionally, an “active passivation” system injecting a surfactant vapour (perfluorooctylamine) to the inlet of the instrument to continuously coat the inlet walls was used for response time improvements and minimizing wall losses (cf. Roscioli et al., 2016). A critical glass orifice maintained an operating pressure range of 4.6 to 6 kPa. Glass parts of the inlet box were cleaned prior to each campaign and at least once a month during field operation. The system was calibrated internally by the laser itself through alignment of the sampled NH3 absorption peak to the standard of the HITRAN database (Rothman et al., 2009). Other than measurement height (cf. Table 2), the setup for ammonia concentration measurements at each campaign was identical to the one reported in Zöll et al. (2016), where also details about instrument performance can be found.
3.3 Low-resolution samplers
3.3.1 Passive samplers
During each of the campaigns, passive samplers of the IVL type (named after the Swedish Environmental Research Institute; Ferm, 1991) were used for monthly integrated NH3 concentration measurements. IVL samplers had been satisfactorily tested in past comparison studies (Dämmgen et al., 2010; Kirchner et al., 1999; Zimmerling et al., 2000). The sampler consists of a lens tube (length: 10 mm; opening: 20 mm; material: PP (polypropylene)) that is attached vertically to the exposure. The upper tube opening is closed with a snap cover (material: PE (polyethylene)) attached to a coated filter (company: Sartorius, Göttingen, Germany; material: cellulose; pore size: 0.45 µm). The lower opening is closed by a PTFE filter (company: Millipore, Darmstadt, Germany; diameter: 25 mm; pore size: 1.0 µm), which is stabilized on both sides with a stainless-steel mesh (mesh size: 0.125 mm; wire diameter: 0.08 mm). A PTFE membrane and steel mesh are pressed onto the tube using a second snap cover (material: PE), which has a punched opening of 20 mm and is the sample opening of the passive collector. For NH3 separation, the cellulose filter was coated with citric acid. The mass of NH3 being deposited on the coated filter depends on the molecular diffusion coefficient, exposure period, and design of the sampler (Dämmgen et al., 2010; Ferm, 1991). During laboratory analysis, impregnated filters were extracted with 5 mL ultrapure water using a shaking apparatus for 1 h before applying either segmented flow analysis or ion chromatography for NH3 detection.
3.3.2 DELTA denuder and filter samplers
Monthly integrated air concentrations of NH3, HONO, HNO3, particulate NH4, and particulate NO3 were measured with a custom-built DELTA (DEnuder for Long-Term Atmospheric sampling) system. A comprehensive description of the measurement principle is given in Sutton et al. (2001) and Tang et al. (2009). The system consists of four cylindrical denuders, two of which are for the determination of acidic gases and two for ammonia. A filter pack captures nitrogen species in particulate matter. Air flow was recorded with a standard gas meter and was usually averaging 0.5 m3 d−1. In each of the campaigns, the sampling height of the DELTA system was equal to the measurement height of the sonic anemometer (cf. Table 2). Basic denuders were coated with sodium carbonate and glycerol dissolved in water and methanol, whereas acidic denuders were coated with citric acid and glycerol and also dissolved in water and methanol. The filter pack was a two-stage holder using round cellulose filter (Whatman No. 1, diameter 25 mm): one coated with citric acid saturated in methanol and the other one coated in potassium hydroxide solution in methanol. Sample processing and analysis were identical to the procedures used for the KAPS denuder described in Dämmgen et al. (2010) and Hurkuck et al. (2014). The amount of substances on equally coated denuders was added.
3.4 Instrumentation for meteorological measurements
At all campaign sites, the same ultrasonic anemometer model (R3, Gill Instruments, Lymington, UK) was installed for the measurement of the three-dimensional wind components (u, v, and w). From these signals wind speed, wind direction, friction velocity (u∗), and atmospheric stability were calculated. Measurement heights above ground were adapted to the respective vegetation type and are listed in Table 2. In every setup, both the QCL inlet box and TRANC were mounted on a separate boom at the north side of the anemometer, which was in all cases an infrequent (<10 %) wind direction. The position of the sample air inlets was approximately 10 cm below and 30 cm north of the centre of the sonic anemometer array. Air temperature (Ta) and relative humidity (RH) were measured with a HC2S3 probe (Campbell Scientific, Logan, Utah, USA). Global radiation (Rg), i.e. total incoming shortwave radiation, was recorded by the upward-facing pyranometer from a CNR4 net radiometer (Kipp&Zonen B.V., Delft, the Netherlands). An internal Pt-100 and a thermistor temperature sensor were used to correct for instrument heating. Precipitation was recorded with an automatic tipping-bucket rain gauge (Thies Clima, Göttingen, Germany). During all campaigns, meteorological instruments were installed at approximately the same height as the sonic anemometer. Further details can be taken from the individual campaign publications listed in Table 2.
4.1 Acquisition and flux calculation
The procedure of data collection was nearly the same at all sites. The software EddyMeas, a program of the software package EddySoft (Kolle and Rebmann, 2007), was used for half-hourly recording of the measurements at all sites but with different time resolutions. In campaign 1 (WET-TRANC, Table 1), the sampling frequency was 20 Hz, whereas the data acquisition of sonic anemometer and respective gas analysers was set to a frequency of 10 Hz during campaigns 2 to 4 (WET-QCL, FOR-TRANC, FOR-QCL). Analogue signals of the CLD, QCL, and anemometer were recorded at the sonic's interface and joined to a common data stream. Only at WET, NH3 measurements were logged separately on the onboard computer of the QCL. Thus, data from the QCL and the sonic had to be interpolated to a reference timestamp (cf. Zöll et al., 2016). Before calculating eddy-covariance fluxes (Aubinet et al., 2012; Burba, 2013), periods of maintenance, instrument malfunction, and obvious outliers were flagged based on visually checking instrumental performance and parameters such as flow rate, laser operating temperature, absorption cell pressure and temperature, and TRANC heating temperature. The software EddyPro (https://www.licor.com/env/support/EddyPro/topics/introduction.html, last access: 14 February 2022) was used for eddy flux calculation. Raw data time series were accounted for spikes after Vickers and Mahrt (1997), a 2-D rotation of the wind vector components was applied (Wilczak et al., 2001), and block averaging was performed. Half-hourly fluxes were calculated using the eddy-covariance method. The time series of vertical wind speed and gas concentration are shifted against each other until the covariance is maximized. The number of samples a time series has to be shifted corresponds to the time lag. The physical time lag is the elapsed duration from a point in time when the measurement of an air sample is done by the sonic anemometer until the gas concentration of the same sample is recorded by the gas analyser after moving through the sample tubes. We used the option covariance maximization with default for determining time lags and their corresponding fluxes in the respective half hour. The default values, which are given in Table 2, as well as the range around the physical lag were based on theoretical considerations. Ranges were adapted to the highest time lag density and were mostly ±3 s around the default value. For quantitative investigation of the fluxes, several quality flagging criteria were applied. These were (i) removing flux and concentration outliers; (ii) excluding values where w, T, or ΣNr concentration were larger than the mean plus 3 × 1.96σ with σ being the standard deviation of the variances; and (iii) discarding fluxes, which were attributed to very stable atmospheric conditions, i.e. m s−1 (cf. Zöll et al., 2019). Furthermore, (iv) only fluxes with flag “0” and flag “1” after Mauder and Foken (2006) were used. The contribution of flag 0 and flag 1 to available fluxes after application of visual screening of outliers (i), exclusions based on variances (ii), and low turbulence (iii) is given in Table 2. After application of all quality criteria, 48 % of the ΣNr fluxes were left for further flux analysis.
4.2 High-frequency damping corrections
High-frequency signals measured by any eddy-covariance setup are influenced by chemical, physical, or sampling processes leading to noise and to a reduced intensity in high- or low-frequency parts of the signal. Thus, fluxes calculated from these filtered signals are attenuated by a certain factor compared to signals, which would be measured by an ideal instrument, especially in the high-frequency range. These losses are relatively large for closed-path instruments designed for measuring Nr compounds, since these gases are highly reactive and some of them “sticky” compared to inert gases like CO2, CH4, or N2O. As chemical and physical characteristics of inert compounds are different from those of reactive gases, formerly developed high-frequency correction methods for inert gases are not necessarily suitable for Nr compounds like NH3 and ΣNr. Wintjen et al. (2020) proposed empirical methods for determining high-frequency damping factors of ΣNr. Since site setups differed in studies where flux measurements of various reactive compounds have been presented (e.g. Ammann et al., 2012; Brümmer et al., 2013; Ferrara et al., 2012; Moravek et al., 2019), several empirical methods had to be used for a precise quantification of the specific high-frequency damping. For the determination of damping factors of ΣNr for both WET and FOR site measurements, ICO, i.e. the in situ co-spectral method proposed by Wintjen et al. (2020), was applied. NH3 fluxes of WET site measurements were corrected by the ogive method following Ammann et al. (2006) (cf. Zöll et al., 2016). Median damping factor ranges for the individual site setups are given in Table 2. A detailed description of the used damping correction method can be found in the cited publications.
4.3 Gap filling
Every set of eddy-covariance measurements usually reveals data gaps of various lengths after rigorous quality control, irrespective of the species of interest. These gaps may originate from situations where the basic assumptions of eddy-covariance theory fail, e.g. under non-turbulent conditions or when fluxes represent an area (footprint) that is non-uniform or non-horizontal. Further violations arise when the average of fluctuations does not equal zero or when significant density fluctuations are observed (Aubinet et al., 2012). Other reasons for data gaps commonly include instrument failure or implausible spikes of unknown origin. With the here presented datasets we provide gap-filled time series of NH3 and ΣNr to better facilitate estimations of the sites' nitrogen budgets.
4.3.1 Data-driven gap filling
A common approach for gap filling is the usage of statistical methods such as lookup tables (LUTs), mean diurnal variation (MDV), or non-linear regression (NLR) (Falge et al., 2001). These methods were originally developed for fluxes of carbon dioxide and/or water vapour and require short-term stability of exchange patterns for a sufficient quality of the gap-filled flux values. In case of ΣNr and NH3, the exchange pattern can heavily vary over different timescales as these species usually exhibit lower autocorrelation and higher non-stationarity than for example carbon dioxide or water vapour. Thus, the application of data-driven methods to ΣNr fluxes is recommended for data gaps spanning only over a few days. LUTs require that dependencies of the gas of interest on several parameters such as temperature, relative humidity, radiation, concentration, or turbulence-related parameters are well defined. Applying LUT on ΣNr becomes complicated since ΣNr describes the sum of several Nr compounds. These gases and particles differ significantly in physical and chemical properties and in their contribution to ΣNr. The ratio of the compounds varies throughout the annual cycle (Wintjen et al., 2022) and further depends on site characteristics and surrounding conditions. Little is known about the overall dependency of ΣNr on the climatic parameters. We therefore decided to use MDV as a gap-filling technique. In our dataset, the window for calculating the filled flux was set to 5 d before and 5 d after the gap in the original time series.
4.3.2 Model-based gap filling (FOR-ΣNr only)
Regular MDV gap filling cannot account for long gaps due to a limited averaging window size. However, filling these gaps is a necessary step before calculating long-term budgets, which was one of the main goals of the measurement campaign at FOR. We therefore used a dry deposition inferential model as an additional gap-filling method during this campaign. The computer code DEPAC (Deposition of Acidifying Compounds; Van Zanten et al., 2010) version 3.21 was used in a stand-alone version, i.e. with input data measured at the site instead of modelled inside a chemistry transport model (CTM). We here used the variant of DEPAC that is used within the chemistry transport model LOTOS-EUROS (Manders et al., 2017) to fill gaps in the measured fluxes. It is slightly different from the one described in Van Zanten et al. (2010) in the sense that it respects co-deposition of SO2 and NH3 in the non-stomatal deposition pathway (Wichink Kruit et al., 2017) and uses a 1-month moving average NH3 concentration instead of instantaneous concentration measurements in the parameterization of the stomatal compensation point (cf. Wichink Kruit et al., 2010). Aerodynamic and boundary resistances were modelled following Garland (1977) and Jensen and Hummelshoj (1995, 1997), respectively, using stability corrections following Webb (1970) and Paulson (1970).
An approximation to the dry deposition of ΣNr that was used to fill gaps was calculated as the sum of the modelled dry deposition fluxes of NH3, NO, NO2, and HNO3. Particle deposition was not modelled. Input data were available on a half-hour basis for most variables. These include temperature, relative humidity, global radiation, ambient pressure, and friction velocity, as well as concentrations of the individual chemical compounds. Monthly DELTA denuder concentration measurements were used for HNO3 and, during times of QCL malfunction, NH3.
4.4 Dry deposition inferential modelling (WET-NH3 only)
A dry deposition inferential model was used as an additional plausibility check in our first NH3-QCL campaign at WET (Zöll et al., 2016). We used the parameterization of a bidirectional canopy compensation point model of Massad et al. (2010), following the works of Nemitz et al. (2001), in a single-layer big-leaf configuration (i.e. without explicitly modelling exchange with the ground layer). The stomatal resistance was modelled using the approach of Wesely (1989), who implemented a dependency on temperature and radiation with a minimum stomatal resistance for H2O of 200 s m−1; all other exchange resistances and parameters were set following the recommendations of Massad et al. (2010) with default parameters for semi-natural vegetation described therein. Exchange parameters at the leaf layer (e.g. stomatal and non-stomatal resistance) were calculated using temperature and relative humidity at the mean notional height of trace gas exchange (cf. Nemitz et al., 2009). The accuracy of the gap-filling method from this section and from Sect. 4.3.2 by comparing the model outputs with original flux data is shown in the Supplement.
4.5 Uncertainty estimation
While understanding and reporting of uncertainty is not consistent across disciplines (Alekandrov, 2001), describing the quality of measurements is necessary to understand the level of confidence in any observation (Csavina et al., 2017). The eddy flux community usually distinguishes between random and systematic errors in tower-based measurements. Random errors may arise from a variety of sources including (i) turbulence sampling errors, e.g. due to incomplete sampling of large eddies and the associated uncertainty in the calculated covariance between vertical wind velocity (w) and the scalar of interest (c); (ii) instrument errors in the measurement of w and c; and (iii) uncertainty attributable to changes in wind direction and velocity which influence the footprint (Aubinet et al., 2012). Systematic errors originate from unmet assumptions and methodological challenges such as advection – preferentially over non-flat terrain – or errors resulting from instrument calibration and design including high-frequency losses (Wintjen et al., 2020) and additionally from those errors associated with data processing (e.g. through detrending, coordinate rotation, gap filling). While for some sources of uncertainty a reliable quantification is impossible without further observations, e.g. in the case of advective fluxes, other procedures mentioned above have been developed for CO2 fluxes such as bias errors for annual sums of carbon budgets as a consequence of gap filling (Richardson et al., 2008; Lucas-Moffat et al., 2018) and can therefore not be straightforwardly applied to reactive nitrogen compounds presented in this study due to the different exchange behaviour of the gases.
For the here presented datasets we provide uncertainty estimates as follows:
-
If the originally measured half-hour flux value is kept, i.e. has a quality flag of 0 or 1 assigned based on the criteria of Mauder and Foken (2006), we calculated random uncertainty following Finkelstein and Sims (2001).
When short gaps are filled with the MDV method, we use the standard error of the mean from the half hours in the respective calculation window.
-
In the FOR TRANC dataset, larger gaps were filled by DEPAC model estimates (Sect. 4.3.2). For those half hours, the uncertainty is given by
with being the median of the distribution , which is based on the uncertainty of measured fluxes with quality flags 0 or 1 (Func,meas01), i.e. the Finkelstein and Sims (2001) method as mentioned above, and originally measured fluxes where also quality flags 0 or 1 had been assigned (Fmeas01).
-
The uncertainty of cumulative fluxes (Funccum; Fig. 6) was estimated following the commonly used method from the eddy flux community given in Pastorello et al. (2020), i.e. by
The presentation and structure of the published campaign datasets were attempted to be as self-explanatory as possible. Tables 1 to 3 containing information on site description, technical details with data descriptors, and column explanations were published alongside the data time series in the Zenodo repository (https://doi.org/10.5281/zenodo.4513854). In the following, we briefly highlight key characteristics of the high-resolution TRANC and QCL data. A comparison with low-resolution concentration data from DELTA denuders and passive samplers is given in the Supplement.
Campaign time series and mean diurnal courses of both concentrations and fluxes are shown in Fig. 3. The considerably different pollution climate between the peatland (WET), which is subjected to intensive agricultural land use in close vicinity to the measurement location (cf. Hurkuck et al., 2014), and the forest (FOR) within a protected national park becomes obvious. While at WET mean campaign values of ΣNr and NH3 were 21.7 and 15.1 ppb, respectively, forest campaign means were 5.2 ppb for ΣNr and 1.8 ppb for NH3 (Fig. 4). At all campaigns, clear diurnal concentration patterns with unexpectedly low noise were observed. Surprisingly, WET NH3 and FOR ΣNr – two different sites and two different analysers – revealed an almost similar bimodal distribution with one peak around noon and an even larger peak in the late afternoon. The lowest numbers were found during the night. The only apparent difference between these campaigns were the mean daily amplitude. While concentrations at WET NH3 stretched over ∼ 7 ppb, the daily averaged span at FOR ΣNr was within 1 ppb. The diurnal concentration pattern at FOR NH3 was similar to that of FOR ΣNr and WET NH3, but it was showing only one distinct peak in the late afternoon. Different diurnal concentration dynamics were found at WET ΣNr. While the averaged daily amplitude was ∼ 4 ppb, the peak was found in the early morning hours, whereas lowest values were observed shortly after midday.
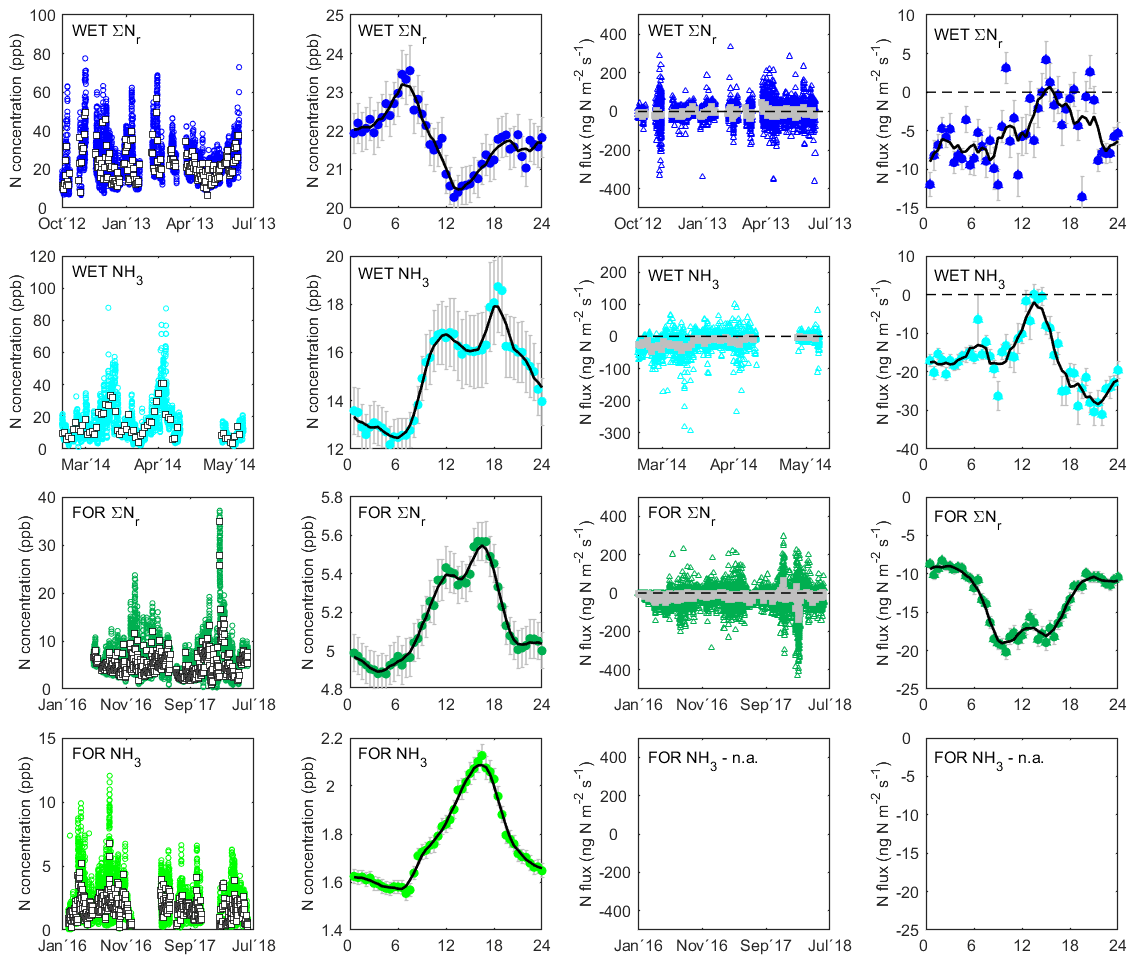
Figure 3Campaign time series of half-hourly (coloured) and daily mean (white squares with black edges/grey squares) concentrations (first column) and fluxes (third column); the second and fourth column represent mean diurnal courses of concentrations and fluxes of the specific entire campaign period, respectively; black lines are 3 h moving averages; positive flux values indicate emission, negative flux values indicate deposition of nitrogen; error bars are the standard error of the mean. Flux data shown in the third column are the gap-filled time series using the mean diurnal variation (MDV) method for the WET campaigns and the model-filled time series for the FOR campaign. See Sect. 4.3 for details. The mean diurnal flux courses in the fourth column are based on the given time series in the third column. Insufficient high-frequency variability in the low-concentration regime of ammonia measured by QCL at the FOR site made a robust covariance detection unreliable with fluxes largely under the lower detection limit of 7.75 ng N m−2 s−1. NH3 fluxes at the FOR site are therefore not given.
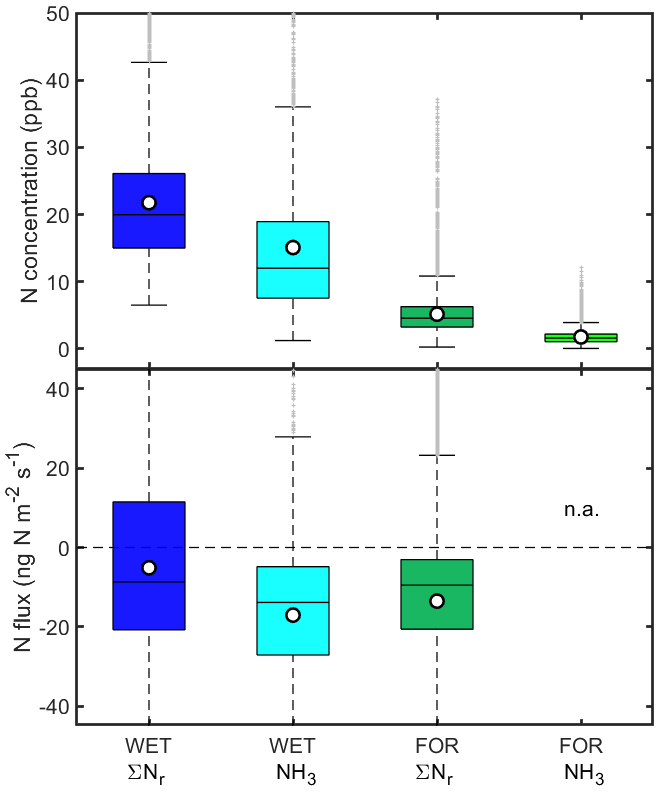
Figure 4Summary of campaign concentrations and fluxes. White circles with black edges represent the campaign mean, horizontal lines within boxes indicate the median, vertical box dimensions indicate lower and upper quartile values, whiskers represent the interquartile range, and outliers from this range are plotted as grey crosses; positive flux values indicate emission, and negative flux values indicate deposition of nitrogen.
During all campaigns both emission and deposition of nitrogen could be detected on a half-hourly time resolution (Figs. 3 and 5). Mean campaign fluxes at WET ΣNr, WET NH3, and FOR ΣNr were −5, −17, and −14 ng N m−2 s−1, respectively. Negative numbers indicate an overall net deposition to the respective ecosystem. After rigorous QA/QC, we concluded that a reliable calculation of NH3 fluxes at FOR site could not be achieved. Due to the very low concentration level close to the detection limit of the analyser (cf. Zöll et al., 2016), we observed insufficient variability in NH3 concentrations, leading to a low signal-to-noise ratio making a covariance detection between vertical wind and NH3 concentration impossible.
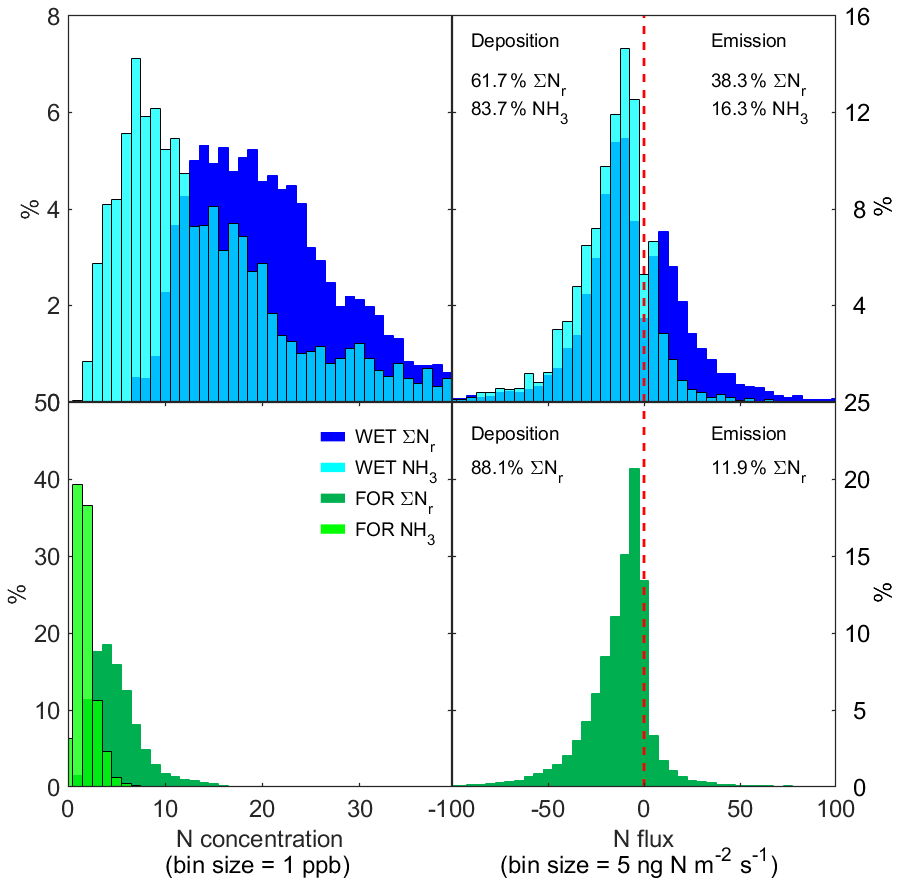
Figure 5Frequency distribution of half-hourly campaign concentrations and fluxes; n=9005 at WET ΣNr campaign, n=2916 at WET NH3 campaign, n=42 635 at FOR ΣNr campaign, and n=23 046 at FOR NH3 campaign; positive flux values indicate emission, and negative flux values indicate deposition of nitrogen.
As for the concentration regime, we found clear diurnal flux patterns with relatively low noise in the signal, at least at WET NH3 and FOR ΣNr. At WET ΣNr, no average net nitrogen exchange was observed in the afternoon, while ΣNr uptake was relatively stable around −7 ng N m−2 s−1 during the night. The flux pattern for NH3 at WET was similar, but with near-neutral exchange occurring a few hours earlier in the afternoon. Night-time NH3 uptake was stronger around ∼ 20 to 25 ng N m−2 s−1. The diurnal flux pattern of ΣNr at FOR was approximately inverted to those at the WET site. The highest average uptake around 18 ng N m−2 s−1 was found between 09:00 and 15:00, whereas night-time uptake of ΣNr was considerably lower at around 10 ng N m−2 s−1.
The frequency distribution of concentrations and fluxes is shown in Fig. 5. While relatively narrow peaks with >50 % of the overall data in only two to three concentration and flux bins were found at FOR campaigns, a wide distribution spanning over a large range of bins was observed during the WET campaigns. At both sites NH3 was peaking at the respective lower concentration end, i.e. at 7 and 1 ppb for WET and FOR, respectively, whereas ΣNr was more broadly distributed towards higher concentrations with less distinctive peaks. This could be expected as NH3 is part of the ΣNr signal, thereby making the shape of the frequency distribution a matter of the contribution strength of other Nr compounds to the ΣNr signal. The different site-specific shares are presented alongside the flux dataset in the form of monthly integrated HONO, HNO3, aerosol NH4, and aerosol NO3 measured by DELTA denuder and filter samplers. Further details for the WET and FOR sites can be found in the publications of Hurkuck et al. (2014) and Wintjen et al. (2022), respectively. In more than a third (38.3 %) of the campaign time, net emission of ΣNr was observed at the peatland site. For NH3, the distribution was shifted towards larger and more frequent deposition (83.7 %). With 88.1 % of all fluxes being recorded as net reactive nitrogen uptake by the ecosystem, the forest site revealed the most dominant deposition regime.
As campaign lengths differed substantially, total cumulative N exchange of the campaigns cannot be directly compared. However, their sums and evolution offer a useful opportunity to assess atmospheric N loads over longer time spans (see Sect. 6). In the 9 weeks of QCL measurements, 892 g N ha−1 in the form of NH3 was taken up by the peatland. At the same site, net ΣNr uptake was even less (830 g N ha−1), indicating both bidirectionality of Nr compounds (e.g. NO is usually emitted, NO2 is deposited, and NH3 can be emitted or deposited) and most likely a tendency towards N saturation at the site due to the historic land use in the region over the past decades (cf. Hurkuck et al., 2014). The forest site was a clear sink for ΣNr with 10.6 kg N ha−1 being recorded after 2.5 years of measurements.
Various useful applications arise from the datasets presented in this study. Information on nitrogen exchange has remained highly speculative or had to undergo comprehensive process-based or statistical modelling based on a number of vague assumptions in the past before a clear picture could be derived. Through technological advancements given and detailed in the introductory and methodological section above, the long-term continuous character in combination with a much higher temporal resolution mainly led to novel opportunities understanding the functioning of ecosystems and their associated land surface–atmosphere interactions. These are briefly outlined in the following paragraph.
-
Improving process understanding through high temporal resolution. While information on sub-daily Nr exchange had been challenging to get due to metrological limitations (cf. Sutton et al., 2009), half-hour fluxes from eddy-covariance measurements allow for investigating the mechanisms governing the surface–atmosphere exchange on different temporal scales. For example, high temporal resolution helps to identify the bidirectional exchange of NH3 (Nemitz et al., 2001; Zhu et al., 2015; Schulte et al., 2021) and reveals phases of net emission vs. net deposition (McGinn et al., 2016; Zöll et al., 2016; Wintjen et al., 2022). A clearer picture can be derived about the interplay of stomatal (Geßler et al., 2002) and non-stomatal pathways (Schrader et al., 2016); the exchange between soil and the atmosphere; seasonal site-specific conditions, e.g. through vegetation senescence and decomposition of fallen leaves (Hansen et al., 2013); or periods of elevated evaporation from either water droplets on leaves (Hales and Drewes, 1979) or whole water bodies. Furthermore, although not presented in this study, short-term temporal dynamics of Nr after field management like crop or grassland fertilization usually leading to immediate emission peaks (Martins et al., 2017) can be used for better quantification of nitrogen losses to the atmosphere (Brümmer et al., 2013; Ma et al., 2020).
-
Integrated view of total Nr dynamics through TRANC technology. While in the past, a laborious combination of several methods was required, TRANC data have the advantage that the sum of all relevant reactive nitrogen compounds is ready to use for further analysis by the measurement of a single signal. This provides a simple integrated overview representing the internally complex interactions of Nr species – such as NO emission from soil, atmospheric NO2 or HNO3 deposition, bidirectional NH3 exchange, or gas-particle interactions (Nemitz and Sutton, 2004; Wolff et al., 2010), amongst others – all incorporated in one single number. Although TRANC data do not reveal single compound patterns, applying the TRANC technology reduces effort and investments for studies focussing on ΣNr balances and characteristics (e.g. Zöll et al., 2019; Wintjen et al., 2022).
-
Assessment of critical level and critical load exceedance. Critical loads and levels are a tool for evaluating the risk of air pollution impacts to ecosystems and are widely used by environmental protection agencies (Wichink Kruit et al., 2014). With datasets presented in this study, a robust assessment becomes possible through information on both concentration and flux averages as well as their total deposition sums over longer time periods. For example, ombrotrophic bogs like the Bourtanger Moor (WET site) represent ecosystems that are most sensitive to increased atmospheric nitrogen input (Bobbink et al., 2010). An exceedance of a certain deposition threshold (e.g. 5 kg N ha−1 yr−1 for bogs) may result in an invasion by more nitrophilous grasses and trees (e.g. Molinia caerulea, Betula pubescens) and a decline in the native ecosystem-specific species (Tomassen et al., 2003; Hurkuck et al., 2014). Figures 4 and 6 highlight the potential of campaign data being used in local validations of possible critical level and critical load exceedances. In our cases, we found that ambient concentrations at a peatland site are similar to those at highly fertilized arable land (cf. Brümmer et al., 2013). Furthermore, unmanaged remote forest sites (like FOR) some tens of kilometres away from emission sources offer an opportunity to investigate the natural exchange mechanisms of trees with the atmosphere.
-
Determination of controlling factors. A further potential application is the analysis of controlling factors of reactive nitrogen exchange. Fluxes have been shown to be highly non-linear (e.g. Flechard et al., 2013) in space and time, which complicates the development of surface–atmosphere exchange schemes. On the basis of the FOR dataset, Wintjen et al. (2022) demonstrate that mean diurnal flux courses stratified by concentration, temperature, moisture, or surface wetness reveal the strongest dependence on the actual ΣNr concentration regardless of flux direction, i.e. situations of deposition or emission. Deposition velocity (vd), however, was invariant with changing concentration, temperature, and relative humidity under dry leaf conditions, whereas wet leaf surfaces led to increased atmospheric resistances (Ra) and decreased vd, thereby reducing the ΣNr flux magnitudes.
-
Verification of annual Nr budgets and management strategies. Long-term data on average exchange fluxes help establish nitrogen budgets and provide an essential piece in the nitrogen cycle, particularly with regard to its temporal resolution. Cumulating all half-hourly fluxes like in Fig. 6 showcases a robust way to quantify total nitrogen input or loss from an ecosystem over a certain time span. A number of applications can be drawn from this information, e.g. (cross-)validation of models or verification of annual nitrogen budgets. Furthermore, management practices like proper timing of fertilization events with their respective amounts of nitrogen content can be derived. In Brümmer et al. (2013) the authors conclude that the last of three fertilizer inputs at a Thuringian crop site was likely to be unnecessary as much of the added nitrogen was not properly taken up by already senescing wheat plants and was immediately lost to the atmosphere, thereby causing an additional yet avoidable burden to local air quality.
-
Investigation of Nr deposition effects on greenhouse gas exchange and carbon storage capacity of ecosystems. Finally, continuous Nr flux datasets like the ones presented in this study can be used to analyse interactive effects with other components of biogeochemical cycles when carried out over multiple years. Particular interest is placed on how nitrogen deposition may alter the carbon sink strength over different land-use types. While ecosystems such as forests may benefit from an increased nitrogen input from the atmosphere (de Vries et al., 2009; Flechard et al., 2020; Fleischer et al., 2013; Bala et al., 2013), others like nitrogen-limited peatlands were shown to respond with inhibited carbon uptake as a consequence of surplus available nitrogen (Limpens et al., 2011). The here presented datasets may offer the opportunity to validate those results and help find potential – yet unknown – effects on shorter timescales.
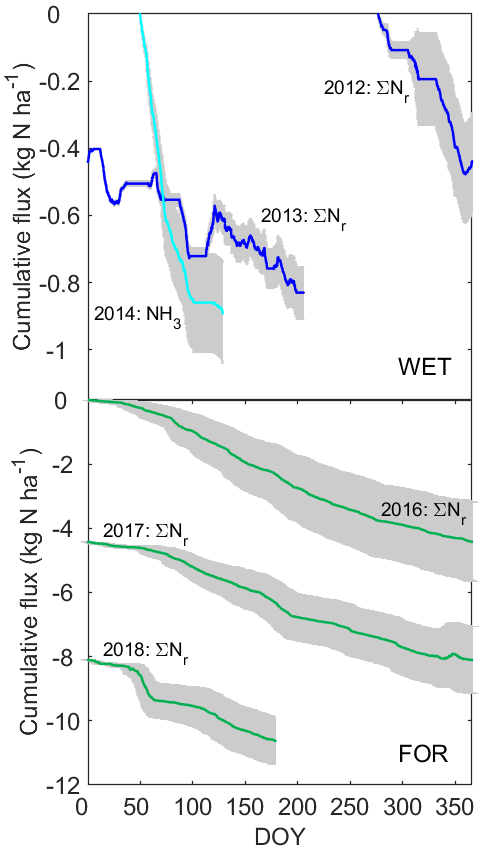
Figure 6Cumulative campaign fluxes; larger gaps at the WET site were not further interpolated; negative cumulative flux values indicate overall deposition of nitrogen; grey shaded areas represent uncertainty (see Sect. 4.5 for details).
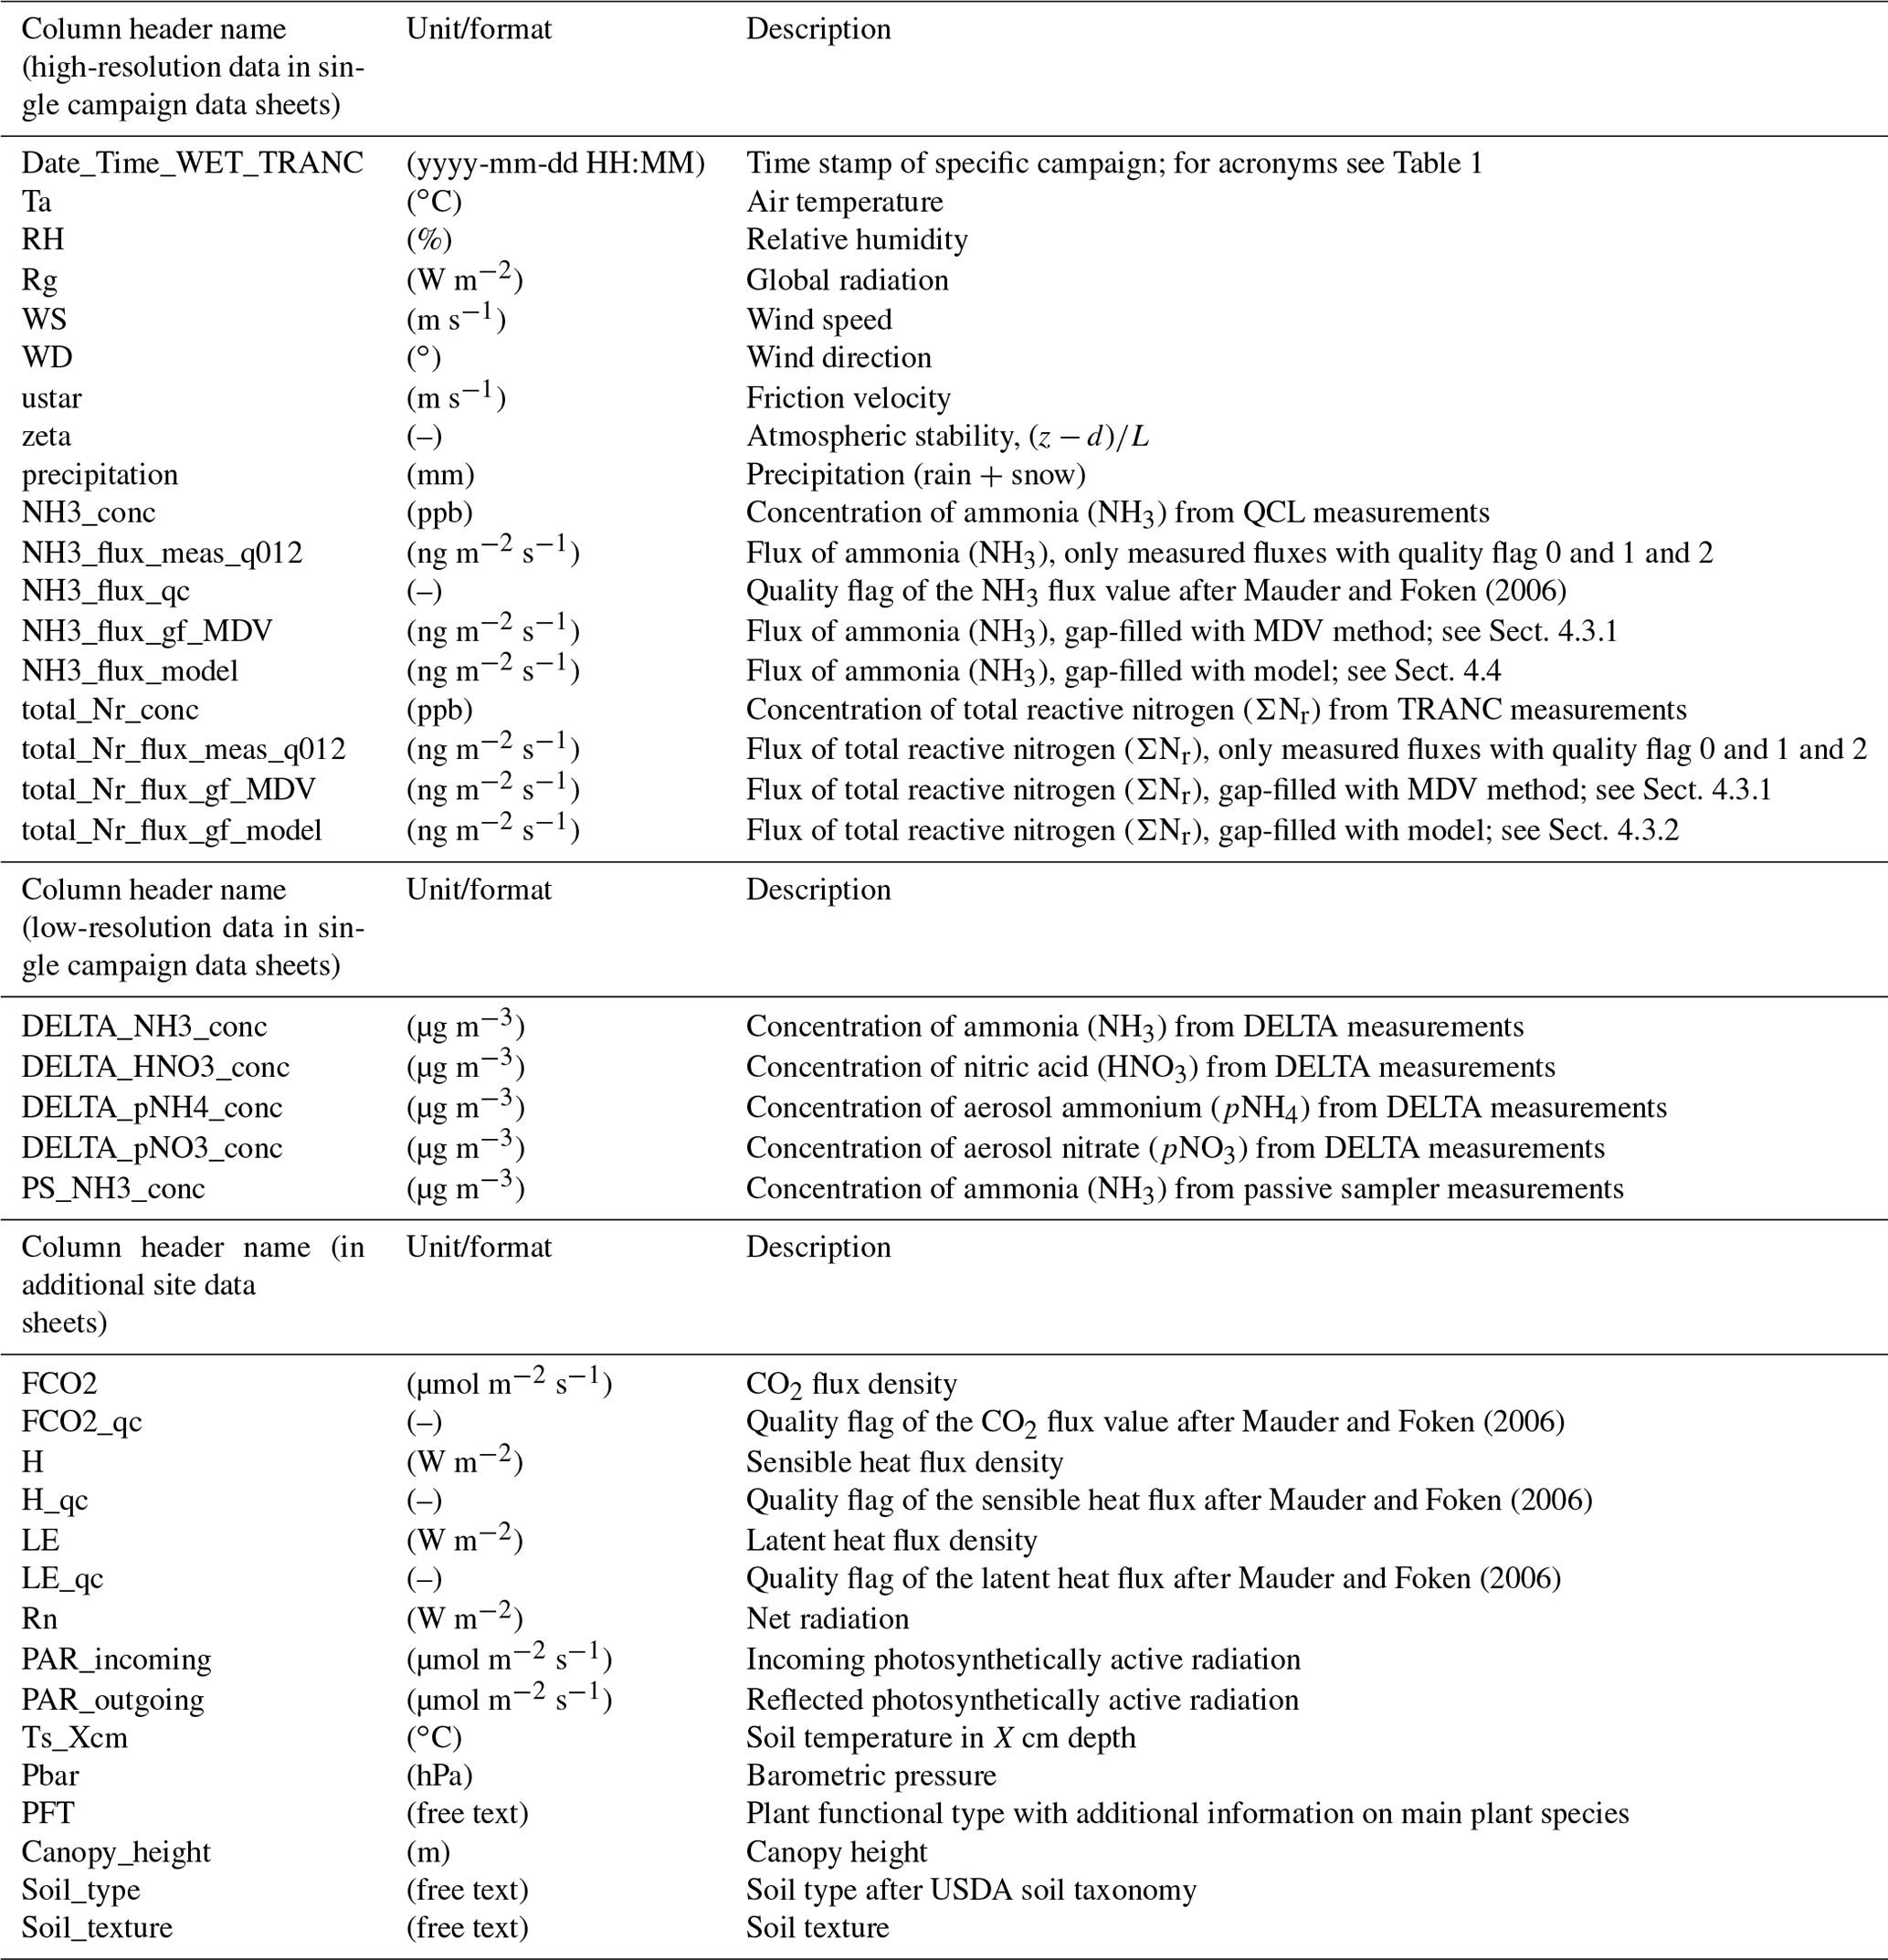
The presented datasets have been placed into the Zenodo data repository and are accessible under https://doi.org/10.5281/zenodo.4513854 (Brümmer et al., 2022). The structure of the dataset is given in Table 3 of this paper. Besides auxiliary meteorological data like air temperature, relative humidity, global radiation, wind speed, wind direction, friction velocity, atmospheric stability, and precipitation, we make field campaign measurements and model output of concentrations and fluxes of total reactive nitrogen and ammonia on a half-hourly basis publicly available. After the initial submission, some additional site data sheets of interest were added. These can be found in the tables beginning with “additional_WET_site_data” and “additional_FOR_site_data” and comprise CO2, sensible and latent heat fluxes, net radiation, photosynthetically active radiation, soil temperature, barometric pressure, plant functional type, leaf area index, canopy height, soil type, and soil texture, where available.
Table 3Dataset structure and description. Note that not every column header exists in every data table due to the focus on the specific gas and gap-filling method.
Our datasets demonstrate the suitability of QCL (quantum cascade laser) and TRANC (Total Reactive Atmospheric Nitrogen Converter) to measure eddy-covariance fluxes of NH3 and ΣNr, respectively. In terms of stability, practicality, and ease of operation, the standardization of field setups and data post-processing of reactive nitrogen measurements still have a highly experimental character, thereby being two decades behind those of inert greenhouse gas measurements, which are nowadays organized in continental-scale flux networks like ICOS in Europe (Heiskanen et al., 2022) or the National Ecological Observation Network (NEON, Metzger et al., 2019) in North America. Rigorous estimation of high-frequency flux losses and their respective application are inevitable. Dry deposition model schemes can be used for measurement data gap filling, while measured data can be used for model validation and derivation of deposition velocities. As underlying mechanisms of biosphere–atmosphere exchange of NH3 and ΣNr are not yet fully understood, continuous long-term measurements are beneficial for understanding temporal dynamics and their controls. A number of potential applications arise from the datasets presented in this study such as the assessment of critical loads, the verification of management strategies, or a proper analysis of Nr deposition effects on greenhouse gas exchange and carbon storage capacity of ecosystems. We recommend future QCL and TRANC measurement campaigns at fertilized arable sites for the provision of verification opportunities for emission factors used in national emission inventories. Furthermore, selected sites in long-term research infrastructure networks should be equipped with (low-cost) measurement devices for reactive nitrogen compounds as it has been recently shown by Schrader et al. (2020) that a link between stomatal conductance derived from CO2 measurements may be useful for estimating ammonia dry deposition, which would in turn offer a potential validation tool for regional- to national-scale deposition maps.
The supplement related to this article is available online at: https://doi.org/10.5194/essd-14-743-2022-supplement.
CB, JJR, JPD, PW, and FS designed the study and performed QA/QC on datasets during campaigns and post-processing. JJR and JPD designed the field setups and developed data acquisition procedures. JJR, JPD, CB, and PW conducted the measurements, and BB provided scientific advice and logistical support for the Bavarian forest campaign. MS and FS developed and provided model schemes used for flux data analyses and gap filling. CA and PW developed and implemented correction procedures for high-frequency flux losses and helped optimize the analyser performance. FS, PW, JJR, and CB established the database. CB, PW, and FS wrote the manuscript, and all authors provided substantial input.
The contact author has declared that neither they nor their co-authors have any competing interests.
Publisher's note: Copernicus Publications remains neutral with regard to jurisdictional claims in published maps and institutional affiliations.
We highly appreciate data QA/QC, data processing, and field campaign support by Undine Zöll. Ute Tambor, Andrea Niemeyer, and Daniel Ziehe are thanked for laboratory analyses of denuder and filter samplers. David D. Nelson and Mark Zahniser introduced the authors to the operation of the laser spectrometer and supported remote maintenance procedures for the instrument, which is highly appreciated.
This research has been supported by the German Federal Ministry of Education and Research (BMBF) within the framework of the Junior Research Group NITROSPHERE under support code FKZ 01LN1308A and by the German Environmental Protection Agency (UBA) for the FORESTFLUX project under grant number FKZ 3715512110. Further support was provided by the German Federal Ministry of Food and Agriculture (BMEL) through the Thünen Institute of Climate-Smart Agriculture.
This paper was edited by David Carlson and reviewed by two anonymous referees.
Alekandrov, Y. I.: Uncertainty of measurement: twenty years afterwards, Fresenius', J. Anal. Chem., 370, 690–693, 2001.
Ammann, C., Brunner, A., Spirig, C., and Neftel, A.: Technical note: Water vapour concentration and flux measurements with PTR-MS, Atmos. Chem. Phys., 6, 4643–4651, https://doi.org/10.5194/acp-6-4643-2006, 2006.
Ammann, C., Wolff, V., Marx, O., Brümmer, C., and Neftel, A.: Measuring the biosphere-atmosphere exchange of total reactive nitrogen by eddy covariance, Biogeosciences, 9, 4247–4261, https://doi.org/10.5194/bg-9-4247-2012, 2012.
Aubinet, M., Vesala, T., and Papale, D., eds.: Eddy Covariance: A Practical Guide to Measurement and Data Analysis, Springer Science+Business Media B.V. 2012, 438 pp., https://doi.org/10.1007/978-94-007-2351-1, 2012.
Bala, G., Devaraju, N., Chaturvedi, R. K., Caldeira, K., and Nemani, R.: Nitrogen deposition: how important is it for global terrestrial carbon uptake?, Biogeosciences, 10, 7147–7160, https://doi.org/10.5194/bg-10-7147-2013, 2013.
Baldocchi, D.: Measuring fluxes of trace gases and energy between ecosystems and the atmosphere – the state and future of the eddy covariance method, Glob. Change Biol., 20, 3600–3609, https://doi.org/10.1111/gcb.12649, 2014.
Beudert, B., Bässler, C., Thorn, S., Noss, R., Schröder, B., Dieffenbach-Fries, H., Foullois, N., and Müller, J.: Bark beetles increase biodiversity while maintaining drinking water quality, Conserv. Lett., 8, 272–281, 2014.
Bobbink, R., Hicks, K., Galloway, J., Spranger, T., Alkemade, R., Ashmore, M., Bustamante, M., Cinderby, S., Davidson, E., Dentener, F., Emmett, B.A., Erisman, J. W., Fenn, M., Gilliam, F.S., Nordin, A., Pardo, L., and de Vries, W.: Global assessment of nitrogen deposition effects on terrestrial plant diversity: a synthesis, Ecol. Appl. 20, 30–59, 2010.
Brümmer, C., Marx, O., Kutsch, W., Ammann, C., Wolff, V., Flechard, C. R., and Freibauer, A.: Fluxes of total reactive atmospheric nitrogen (ΣNr) using eddy covariance above arable land, Tellus B, 65, 19770, https://doi.org/10.3402/tellusb.v65i0.19770, 2013.
Brümmer, C., Schrader, F., and Wintjen, P.: A novel approach to investigate effects of atmospheric nitrogen deposition on ecosystem productivity and greenhouse gas exchange, Final Report of the NITROSPHERE Junior Research Group, in German, BMBF support code 01LN1308A, TIB Leibniz Information Centre for Science and Technology, University Library, Hanover, 2019.
Brümmer, C., Schrader, F., Wintjen, P., Zöll, U., and Schaap, M.: FORESTFLUX – Improvement of assessment tools for policy advice through local validation of atmospheric pollution modelling, in German, UBA Texte 40/2020, Umweltbundesamt, Dessau-Roßlau, 2020.
Brümmer, C., Rüffer, J. J., Delorme, J.-P., Wintjen, P., Schrader, F., Beudert, B., Schaap, M., and Ammann, C.: Reactive nitrogen fluxes over peatland (Bourtanger Moor) and forest (Bavarian Forest National Park) using micrometeorological measurement techniques (1.1), Zenodo [data set], https://doi.org/10.5281/zenodo.5841074, 2022.
Burba, G.: Eddy Covariance Method for Scientific, Industrial, Agricultural and Regulatory Applications: A Field Book on Measuring EcosystemGas Exchange and Areal Emission Rates, LI-COR Biosciences, 2013.
Casparie, W. A.: The Bourtanger Moor – Endurance and vulnerability of a raised bog system, Hydrobiologia, 265, 203–215, 1993.
Csavina, J., Roberti, J. A., Taylor, J. R., and Loescher, H. W.: Traceable measurements and calibration: a primer on uncertainty analysis, Ecosphere, 8, e01683, https://doi.org/10.1002/ecs2.1683, 2017.
Dämmgen, U., Thöni, L., Lumpp, R., Gilke, K., Seitler, E., and Bullinger, M.: Intercomparison of methods to assess ammonia and ammonium concentrations in ambient air – results of a field experiment performed in Braunschweig, Germany, 2005 to 2008, in German, Landbauforschung Völkenrode, 337, 2010.
de Vries, W., Solberg, S., Dobbertin, M., Sterba, H., Laubhann, D., Van Oijen, M., Evans, C., Gundersen, P., Kros, J., Wamelink, G. W. W., Reinds, G. J., and Sutton, M. A.: The impact of nitrogen deposition on carbon sequestration by European forests and heathlands, Forest Ecol. Manag., 258, 1814–1823, 2009.
Ellis, R. A., Murphy, J. G., Pattey, E., van Haarlem, R., O'Brien, J. M., and Herndon, S. C.: Characterizing a Quantum Cascade Tunable Infrared Laser Differential Absorption Spectrometer (QC-TILDAS) for measurements of atmospheric ammonia, Atmos. Meas. Tech., 3, 397–406, https://doi.org/10.5194/amt-3-397-2010, 2010.
Erisman, J. W., Van Pul, A., and Wyers, P.: Parametrization of surface resistance for the quantification of atmospheric deposition of acidifying pollutants and ozone, Atmos. Environ., 28, 2595–2607, https://doi.org/10.1016/1352-2310(94)90433-2, 1994.
Erisman, J. W., Sutton, M. A., Galloway, J., Klimont, Z., and Winiwarter, W.: How a century of ammonia synthesis changed the world, Nat. Geosci., 1, 636–639, https://doi.org/10.1038/ngeo325, 2008.
Falge, E., Baldocchi, D., Olson, R., Anthoni, P., Aubinet, M., Bernhofer, C., Burba, G., Ceulemans, R., Clement, R., Dolman, H., Granier, A., Gross, P., Grünwald, T., Hollinger, D., Jensen, N.-O., Katul, G., Keronen, P., Kowalski, A., Lai, C. T., Law, B. E., Meyers, T., Moncrieff, J., Moors, E., Munger, J., Pilegaard, K., Rannik, Ü., Rebmann, C., Suyker, A., Tenhunen, J., Tu, K., Verma, S., Vesala, T., Wilson, K., and Wofsy, S.: Gap filling strategies for defensible annual sums of net ecosystem exchange, Agr. Forest Meteorol., 107, 43–69, https://doi.org/10.1016/S0168-1923(00)00225-2, 2001.
Farmer, D. K. and Cohen, R. C.: Observations of HNO3, ∑AN, ∑PN and NO2 fluxes: evidence for rapid HOx chemistry within a pine forest canopy, Atmos. Chem. Phys., 8, 3899–3917, https://doi.org/10.5194/acp-8-3899-2008, 2008.
Ferm, M.: A sensitive diffusional sampler, Report L91-172, Gothenburg, Swedish Environmental Research Institute, 1991.
Ferrara, R. M., Loubet, B., Di Tommasi, P., Bertolini, T., Magliulo, V., Cellier, P., Eugster, W., and Rana, G.: Eddy covariance measurement of ammonia fluxes: Comparison of high frequency correction methodologies, Agr. Forest Meteorol., 158–159, 30–42, 2012.
Finkelstein, P. L. and Sims, P. F.: Sampling error in eddy correlation flux measurements, J. Geophys. Res., 106, 3503–3509, 2001.
Flechard, C. R., Nemitz, E., Smith, R. I., Fowler, D., Vermeulen, A. T., Bleeker, A., Erisman, J. W., Simpson, D., Zhang, L., Tang, Y. S., and Sutton, M. A.: Dry deposition of reactive nitrogen to European ecosystems: a comparison of inferential models across the NitroEurope network, Atmos. Chem. Phys., 11, 2703–2728, https://doi.org/10.5194/acp-11-2703-2011, 2011.
Flechard, C. R., Massad, R.-S., Loubet, B., Personne, E., Simpson, D., Bash, J. O., Cooter, E. J., Nemitz, E., and Sutton, M. A.: Advances in understanding, models and parameterizations of biosphere-atmosphere ammonia exchange, Biogeosciences, 10, 5183–5225, https://doi.org/10.5194/bg-10-5183-2013, 2013.
Flechard, C. R., van Oijen, M., Cameron, D. R., de Vries, W., Ibrom, A., Buchmann, N., Dise, N. B., Janssens, I. A., Neirynck, J., Montagnani, L., Varlagin, A., Loustau, D., Legout, A., Ziemblińska, K., Aubinet, M., Aurela, M., Chojnicki, B. H., Drewer, J., Eugster, W., Francez, A.-J., Juszczak, R., Kitzler, B., Kutsch, W. L., Lohila, A., Longdoz, B., Matteucci, G., Moreaux, V., Neftel, A., Olejnik, J., Sanz, M. J., Siemens, J., Vesala, T., Vincke, C., Nemitz, E., Zechmeister-Boltenstern, S., Butterbach-Bahl, K., Skiba, U. M., and Sutton, M. A.: Carbon–nitrogen interactions in European forests and semi-natural vegetation – Part 2: Untangling climatic, edaphic, management and nitrogen deposition effects on carbon sequestration potentials, Biogeosciences, 17, 1621–1654, https://doi.org/10.5194/bg-17-1621-2020, 2020.
Fleischer, K., Rebel, K. T., van der Molen, M. K., Erisman, J. W., Wassen, M. J., van Loon, E. E., Montagnani, L., Gough, C. M., Herbst, M., Janssens, I. A., Gianelle, D., and Dolman, A. J.: The contribution of nitrogen deposition to the photosynthetic capacity of forests, Glob. Biogeochem. Cyc., 27, 187–199, https://doi.org/10.1002/gbc.20026, 2013.
Franz, D., Acosta, M., Altimir, N., et al.: Towards long-term standardised carbon and greenhouse gas observations for monitoring Europe's terrestrial ecosystems: a review, Int. Agrophys., 32, 439–455, https://doi.org/10.1515/intag-2017-0039, 2018.
Fratini, G., Ibrom, A., Arriga, N., Burba, G., and Papale, D.: Relative humidity effects on water vapour fluxes measured with closed-path eddy-covariance systems with short sampling lines, Agr. Forest Meteorol., 165, 53–63, https://doi.org/10.1016/j.agrformet.2012.05.018, 2012.
Galloway, J. N., Aber, J. D., Erisman, J. W., Seitzinger, S. P., Howarth, R. W., Cowling, E. B., and Cosby, B. J.: The nitrogen cascade, BioScience, 53, 341–356, 2003.
Garland, J. A.: The Dry Deposition of Sulphur Dioxide to Land and Water Surfaces, Proceedings of the Royal Society A: Mathematical, Phys. Eng. Sci., 354, 245–268, https://doi.org/10.1098/rspa.1977.0066, 1977.
Geßler, A., Rienks, M., and Rennenberg, H.: Stomatal uptake and cuticular adsorption contribute to dry deposition of NH3 and NO2 to needles of adult spruce (Picea abies) trees, New Phytol., 156, 179–194, 2002.
Gielen, B., op de Beeck, M., Loustau, D., Ceulemans, R., Jordan, A., and Papale, D.: Integrated Carbon Observation System (ICOS): an infrastructure to monitor the European greenhouse gas balance, in: Terrestrial Ecosystem Research Infrastructures: challenges and opportunities, edited by: Chabbi, A. and Loescher, H. W., 1st Edition, Boca Raton, Fla: CRC Press, ISBN 978-1-4987-5131-5, 978-1-4987-5133-9, 505–520, 2017.
Hales, J. M. and Drewes, D. R.: Solubility of ammonia in water at low concentrations, Atmos. Environ., 13, 1133–1147, 1979.
Hansen, K., Sørensen, L. L., Hertel, O., Geels, C., Skjøth, C. A., Jensen, B., and Boegh, E.: Ammonia emissions from deciduous forest after leaf fall, Biogeosciences, 10, 4577–4589, https://doi.org/10.5194/bg-10-4577-2013, 2013.
Heiskanen, J., Brümmer, C., Buchmann, N., Calfapietra, C., Chen, H., Gielen, B., Gkritzalis, T., Hammer, S., Hartman, S., Herbst, M., Janssens, I. A., Jordan, A., Juurola, E., Karstens, U., Kasurinen, V., Kruijt, B., Lankreijer, H., Levin, I., Linderson, M.-J., Loustau, D., Merbold, L., Lund Myhre, C., Papale, D., Pavelka, M., Pilegaard, K., Ramonet, M., Rebmann, C., Rinne, J., Rivier, L., Saltikoff, E., Sanders, R., Steinbacher, M., Steinhoff, T., Watson, A., Vermeulen, A. T., Vesala, T., Vítková, G., and Kutsch, W. L.: The Integrated Carbon Observation System in Europe, B. Am. Meteorol. Soc., https://doi.org/10.1175/BAMS-D-19-0364.1, 2022.
Hurkuck, M., Brümmer, C., Mohr, K., Grünhage, L., Flessa, H., and Kutsch, W. L.: Determination of atmospheric nitrogen deposition to a semi-natural peat bog site in an intensively managed agricultural landscape, Atmos. Environ., 97, 296–309, https://doi.org/10.1016/j.atmosenv.2014.08.034, 2014.
Hurkuck, M., Brümmer, C., Mohr, K., Spott, O., Well, R., Flessa, H., and Kutsch, W. L.: Effects of grass species and grass growth on atmospheric nitrogen deposition to a bog ecosystem surrounded by intensive agricultural land use, Ecol. Evol., 5, 2556–2571, https://doi.org/10.1002/ece3.1534, 2015.
Hurkuck, M., Brümmer, C., and Kutsch, W. L.: Near-neutral carbon dioxide balance at a semi-natural, temperate bog ecosystem, J. Geophys. Res.-Biogeosci., 12, 370–384, https://doi.org/10.1002/2015JG003195, 2016.
Ibrom, A., Dellwick, E., Flyvbjerg, H., Jensen, N. O., and Pilegaard, K.: Strong low-pass filtering effects on water vapour flux measurements with closed-path eddy correlation systems, Agr. Forest Meteorol., 147, 140–156, https://doi.org/10.1016/j.agrformet.2007.07.007, 2007.
Jensen, N. O. and Hummelshoj, P.: Derivation of canopy resistance for water vapor fluxes over a spruce forest, using a new technique for the viscous sublayer resistance, Agr. Forest Meteorol., 73, 339–352, https://doi.org/10.1016/0168-1923(94)05083-I, 1995.
Jensen, N. O. and Hummelshoj, P.: Erratum to “Derivation of canopy resistance for water vapor fluxes over a spruce forest, using a new technique for the viscous sublayer resistance”, Agr. Forest Meteorol., 85, 289, https://doi.org/10.1016/S0168-1923(97)00024-5, 1997.
Kirchner, M., Bräutigam, S., Ferm, M., Haas, M., Hangartner, M., Hofschreuder, P., Kasper-Giebl, A., Römmelt, H., Striedner, J., Terzer, W., Thöni, L., Werner, H., and Zimmerling, R.: Field intercomparison of diffusive samplers for measuring ammonia, J. Environ. Monit., 1, 259–265, 1999.
Kolle, O. and Rebmann, C.: EddySoft Documentation of a Software Package to Acquire and Process Eddy Covariance Data, techreport,MPI-BGC, https://repository.publisso.de/resource/frl:4414276-1/data (last access: 14 February 2022), 2007.
Limpens, J., Granath, G., Gunnarsson, U., Aerts, R., Bayley, S., Bragazza, L., Bubier, J., Buttler, A., van den Berg, L.J.L., Francez, A.-J., Gerdol, R., Grosvernier, P., Heijmans, M.M.P.D., Hoosbeek, M. R., Hotes, S., Ilomets, M., Leith, I., Mitchell, E. A. D., Moore, T., Nilsson, M.B., Nordbakken, J.-F., Rochefort, L., Rydin, H., Sheppard, L. J., Thormann, M., Wiedermann, M. M., Williams, B. L., and Xu, B.: Climatic modifiers of the response to nitrogen deposition in peat-forming Sphagnum mosses: a meta-analysis, New Phytol., 191, 496–507, https://doi.org/10.1111/j.1469-8137.2011.03680.x, 2011.
Lucas-Moffat, A. M., Huth, V., Augustin, J., Brümmer, C., Herbst, M., and Kutsch, W. L.: Towards pairing plot and field scale measurements in managed ecosystems: Using eddy covariance to cross-validate CO2 fluxes modeled from manual chamber campaigns, Agr. Forest Meteorol., 256–257, 362–378, https://doi.org/10.1016/j.agrformet.2018.01.023, 2018.
Ma, R., Zou, J., Han, Z., Yu, K., Wu, S., Li, Z., Liu, S., Niu, S., Horwath, W. R., and Zhu-Barker, X.: Global soil-derived ammonia emissions from agricultural nitrogen fertilizer application: A refinement based on regional and crop-specific emission factors, Glob. Change Biol., 27, 855–867, 2020.
Mamadou, O., Gourlez de la Motte, L., De Ligne, A., Heinisch, B., and Aubinet, M.: Sensitivity of the annual net ecosystem exchange to the cospectral model used for high frequency loss corrections at a grazed grassland site, Agr. Forest Meteorol., 228–229, 360–369, https://doi.org/10.1016/j.agrformet.2016.06.008, 2016.
Manders, A. M. M., Builtjes, P. J. H., Curier, L., Denier van der Gon, H. A. C., Hendriks, C., Jonkers, S., Kranenburg, R., Kuenen, J. J. P., Segers, A. J., Timmermans, R. M. A., Visschedijk, A. J. H., Wichink Kruit, R. J., van Pul, W. A. J., Sauter, F. J., van der Swaluw, E., Swart, D. P. J., Douros, J., Eskes, H., van Meijgaard, E., van Ulft, B., van Velthoven, P., Banzhaf, S., Mues, A. C., Stern, R., Fu, G., Lu, S., Heemink, A., van Velzen, N., and Schaap, M.: Curriculum vitae of the LOTOS–EUROS (v2.0) chemistry transport model, Geosci. Model Dev., 10, 4145–4173, https://doi.org/10.5194/gmd-10-4145-2017, 2017.
Martins, M. R., Sant'Anna, S. A. C., Zaman, M., Santos, R. C., Monteiro, R. C., Alves, B. J. R., Jantalia, C. P., Boddey, R. M., and Urquiaga, S.: Strategies for the use of urease and nitrification inhibitors with urea: Impact on N2O and NH3 emissions, fertilizer-15N recovery and maize yield in a tropical soil, Agr. Ecosyst. Environ., 247, 54–62, 2017.
Marx, O., Brümmer, C., Ammann, C., Wolff, V., and Freibauer, A.: TRANC – a novel fast-response converter to measure total reactive atmospheric nitrogen, Atmos. Meas. Tech., 5, 1045–1057, https://doi.org/10.5194/amt-5-1045-2012, 2012.
Massad, R.-S., Nemitz, E., and Sutton, M. A.: Review and parameterisation of bi-directional ammonia exchange between vegetation and the atmosphere, Atmos. Chem. Phys., 10, 10359–10386, https://doi.org/10.5194/acp-10-10359-2010, 2010.
Mauder, M. and Foken, T.: Impact of post-field data processing on eddy covariance flux estimates and energy balance closure, Meteorol. Z., 15, 597–609, https://doi.org/10.1127/0941-2948/2006/0167, 2006.
McGinn, S. M., Janzen, H. H., Coates, T. W., Beauchemin, K. A., and Flesch, T. K.: Ammonia emission from a beef cattle feedlot and its local dry deposition and re-emission, J. Environ. Qual., 45, 1178–1185, 2016.
McManus, J. B., Shorter, J. H., Nelson, D. D., Zahniser, M. S., Glenn, D. E., and McGovern, R. M.: Pulsed quantum cascade laser instrument with compact design for rapid, high sensitivity measurements of trace gases in air, Appl. Phys. B, 92, 387–392, 2008.
Meixner, F. X.: Surface exchange of odd nitrogen oxides, Nova Act. LC, 70, 299–348, 1994.
Metzger, S., Ayres, E., Durden, D., Florian, C., Lee, R., Lunch, C., Luo, H., Pingintha-Durden, N., Roberti, J. A., SanClements, M., Sturtevant, C., Xu, K., and Zulueta, R. C.: From NEON Field Sites to Data Portal: A Community Resource for Surface–Atmosphere Research Comes Online, B. Am. Meteorol. Soc., 100, 2305–2325, 2019.
Moravek, A., Singh, S., Pattey, E., Pelletier, L., and Murphy, J. G.: Measurements and quality control of ammonia eddy covariance fluxes: a new strategy for high-frequency attenuation correction, Atmos. Meas. Tech., 12, 6059–6078, https://doi.org/10.5194/amt-12-6059-2019, 2019.
Nemitz, E. and Sutton, M. A.: Gas-particle interactions above a Dutch heathland: III. Modelling the influence of the NH3-HNO3-NH4NO3 equilibrium on size-segregated particle fluxes, Atmos. Chem. Phys., 4, 1025–1045, https://doi.org/10.5194/acp-4-1025-2004, 2004.
Nemitz, E., Milford, C., and Sutton, M. A.: A two-layer canopy compensation point model for describing bi-directional biosphere-atmosphere exchange of ammonia, Q. J. Roy. Meteor. Soc., 127, 815–833, https://doi.org/10.1002/qj.49712757306, 2001.
Nemitz, E., Hargreaves, K. J., Neftel, A., Loubet, B., Cellier, P., Dorsey, J. R., Flynn, M., Hensen, A., Weidinger, T., Meszaros, R., Horvath, L., Dämmgen, U., Frühauf, C., Löpmeier, F. J., Gallagher, M. W., and Sutton, M. A.: Intercomparison and assessment of turbulent and physiological exchange parameters of grassland, Biogeosciences, 6, 1445–1466, https://doi.org/10.5194/bg-6-1445-2009, 2009.
Ollinger, S. V., Aber, J. D., Reich, P. B., and Freuder, R. J.: Interactive effects of nitrogen deposition, tropospheric ozone, elevated CO2 and land use history on the carbon dynamics of northern hardwood forests, Glob. Change Biol., 8, 545–562, 2002.
Pastorello, G., Trotta, C., Canfora, E., et al.: The FLUXNET2015 dataset and the ONEFlux processing pipeline for eddy covariance data, Sci. Data 7, 225, https://doi.org/10.1038/s41597-020-0534-3, 2020.
Paulson, C. A.: The Mathematical Representation of Wind Speed and Temperature Profiles in the Unstable Atmospheric Surface Layer, J. Appl. Meteorol., 9, 857–861, https://doi.org/10.1175/10.1175/1520-0450(1970)009$<$0857:TMROWS$>$2.0.CO;2, 1970.
Rebmann, C., Aubinet, M., Schmid, H. P., Arriga, N., Aurela, M., Burba, G., Clement, R., De Ligne, A., Fratini, G., Gielen, B., Grace, J., Graf, A., Gross, P., Haapanala, S., Herbst, M., Hörtnagl, L., Ibrom, A., Joly, L., Kljun, N., Kolle, O., Kowalski, A., Lindroth, A., Loustau, D., Mammarella, I., Mauder, M., Merbold, L., Metzger, S., Mölder, M., Montagnani, L., Papale, D., Pavelka, M., Peichl, M., Roland, M., Serrano-Ortiz, P., Siebicke, L., Steinbrecher, R., Tuovinen, J.-P., Vesala, T., Wohlfahrt, G., and Franz, D.: ICOS eddy covariance flux-station site setup: a review, Int. Agrophys., 32, 471–494, https://doi.org/10.1515/intag-2017-0044, 2018.
Richardson, A. D., Mahecha, M. D., Falge, E., Kattge, J., Moffat, A. M., Papale, D., Reichstein, M., Stauch, V. J., Braswell, B. H., Churkina, G., Kruijt, B., and Hollinger, D. Y.: Statistical properties of random CO2 flux measurement uncertainty inferred from model residuals, Agr. Forest Meteorol., 148, 38–50, https://doi.org/10.1016/j.agrformet.2007.09.001, 2008.
Rothman, L. S., Gordon, I. E., Barbe, A., Benner, D. C., Bernath, P. F., Birk, M., Boudon, V., Brown, L. R., Campargue, A., Champion, J.-P., Chance, K., Coudert, L. H., Dana, V., Devi, V. M., Fally, S., Flaud, J.-M., Gamache, R. R., Goldman, A., Jacquemart, D., Kleiner, I., Lacome, N., Lafferty, W., Mandin, J.-Y., Massie, S. T., Mikhailenko, S. N., Miller, C. E., Moazzen-Ahmadi, N., Naumenko, O. V., Nikitin, A. V., Orphal, J., Perevalov, V. I., Perrin, A., Predoi-Cross, A., Rinsland, C. P., Rotger, M., Simeckova, M., Smith, M. A. H., Sung, K., Tashkun, S. A., Tennyson, J., Toth, R. A., Vandaele, A. C., and Vander Auwera J.: The HITRAN 2008 molecular spectroscopic database, J. Quant. Spectrosc. Ra., 110, 533–572, 2009.
Roscioli, J. R., Zahniser, M. S., Nelson, D. D., Herndon, S. C., and Kolb, C. E.: New Approaches to Measuring Sticky Molecules: Improvement of Instrumental Response Times Using Active Passivation, J. Phys. Chem. A, 120, 1347–1357, https://doi.org/10.1021/acs.jpca.5b04395, 2016.
Schrader, F.: Challenges and perspectives in modelling biosphere-atmosphere exchange of ammonia, PhD thesis, Vrije Universiteit Amsterdam, 2019.
Schrader, F., Brümmer, C., Flechard, C. R., Wichink Kruit, R. J., van Zanten, M. C., Zöll, U., Hensen, A., and Erisman, J. W.: Non-stomatal exchange in ammonia dry deposition models: comparison of two state-of-the-art approaches, Atmos. Chem. Phys., 16, 13417–13430, https://doi.org/10.5194/acp-16-13417-2016, 2016.
Schrader, F., Erisman, J. W., and Brümmer, C.: Towards a coupled paradigm of NH3-CO2 biosphere-atmosphere exchange modelling, Global Change Biol., 26, 4654–4663, https://doi.org/10.1111/gcb.15184, 2020.
Schulte, R. B., van Zanten, M. C., Rutledge-Jonker, S., Swart, D. P. J., Wichink Kruit, R. J., Krol, M. C., van Pul, W. A. J., and Vilà-Guerau de Arellano, J.: Unraveling the diurnal atmospheric ammonia budget of a prototypical convective boundary layer, Atmos. Environ., 249, 118153, https://doi.org/10.1016/j.atmosenv.2020.118153, 2021.
Simpson, D., Butterbach-Bahl, K., Fagerli, H., Kesik, M., Skiba, U., and Tang, S.: Deposition and Emissions of Reactive Nitrogen over European Forests: A Modelling Study, Atmos. Environ., 40, 5712–5726, 2006.
Sutton, M., Howard, C., Erisman, J., Billen, G., Bleeker, A., Grennfelt, P., van Grinsven, H., and Grizzetti, B.: Assessing our nitrogen inheritance, in: The European Nitrogen Assessment: Sources, Effects and Policy Perspectives, edited by: Sutton, M., Howard, C., Erisman, J., Billen, G., Bleeker, A., Grennfelt, P., van Grinsven, H., and Grizzetti, B., pp. 1–6, Cambridge: Cambridge University Press, https://doi.org/10.1017/CBO9780511976988.004, 2011.
Sutton, M. A., Tang, Y. S., Miners, B., and Fowler, D.: A new diffusion denuder system for long-term, regional monitoring of atmospheric ammonia and ammonium, Water Air Soil Pollut. Focus 1, 145–156, 2001.
Sutton, M. A., Nemitz, E., Milford, C., Campbell, C., Erisman, J. W., Hensen, A., Cellier, P., David, M., Loubet, B., Personne, E., Schjoerring, J. K., Mattsson, M., Dorsey, J. R., Gallagher, M. W., Horvath, L., Weidinger, T., Meszaros, R., Dämmgen, U., Neftel, A., Herrmann, B., Lehman, B. E., Flechard, C., and Burkhardt, J.: Dynamics of ammonia exchange with cut grassland: synthesis of results and conclusions of the GRAMINAE Integrated Experiment, Biogeosciences, 6, 2907–2934, https://doi.org/10.5194/bg-6-2907-2009, 2009.
Tang, Y. S., Simmons, I., van Dijk, N., Di Marco, C., Nemitz, E., Dämmgen, U., Gilke, K., Djuricic, V., Vidic, S., Gliha, Z., Borovecki, D., Mitosinkova, M., Hanssen, J. E., Uggerud, T. H., Sanz, M. J., Sanz, P., Chorda, J. V., Flechard, C. R., Fauvel, Y., Ferm, M., Perrino, C., and Sutton, M. A.: European scale application of atmospheric reactive nitrogen measurements in a low-cost approach to infer dry deposition fluxes, Agric. Ecosyst. Environ., 133, 183–195, https://doi.org/10.1016/j.agee.2009.04.027, 2009.
Tomassen, H. B. M., Smolders, A. J. P., Lamers, J. P. A., and Roelofs, G. J.: Stimulated growth of Betula pubescens and Molinia caerulea on ombrotrophic bogs: role of high levels of atmospheric nitrogen deposition, J. Ecol., 91, 357–370, 2003.
Van Zanten, M. C., Sauter, F. J., Wichink Kruit, R. J., Van Jaarsveld, J. A., and Van Pul, W. A. J.: Description of the DEPAC module, Dry deposition modeling with DEPAC_GCN2010, RIVM, Bilthoven, 2010.
Vickers, D. and Mahrt, L.: Quality Control and Flux Sampling Problems for Tower and Aircraft Data, J. Atmos. Ocean. Tech., 14, 512–526, https://doi.org/10.1175/1520-0426(1997)014<0512:QCAFSP>2.0.CO;2, 1997.
von Bobrutzki, K., Braban, C. F., Famulari, D., Jones, S. K., Blackall, T., Smith, T. E. L., Blom, M., Coe, H., Gallagher, M., Ghalaieny, M., McGillen, M. R., Percival, C. J., Whitehead, J. D., Ellis, R., Murphy, J., Mohacsi, A., Pogany, A., Junninen, H., Rantanen, S., Sutton, M. A., and Nemitz, E.: Field inter-comparison of eleven atmospheric ammonia measurement techniques, Atmos. Meas. Tech., 3, 91–112, https://doi.org/10.5194/amt-3-91-2010, 2010.
Webb, E. K.: Profile relationships: The log-linear range, and extension to strong stability, Q. J. Roy. Meteor. Soc., 96, 67–90, https://doi.org/10.1002/qj.49709640708, 1970.
Wesely, M.: Parameterization of surface resistances to gaseous dry deposition in regional-scale numerical models, Atmos. Environ., 23, 1293–1304, https://doi.org/10.1016/0004-6981(89)90153-4, 1989.
Wichink Kruit, R. J., van Pul, W. A. J., Sauter, F. J., van den Broek, M., Nemitz, E., Sutton, M. A., Krol, M., and Holtslag, A. A. M.: Modeling the surface-atmosphere exchange of ammonia, Atmos. Environ., 44, 877–1004, https://doi.org/10.1016/j.atmosenv.2009.11.049, 2010.
Wichink Kruit, R. J., Schaap, M., Segers, A., Heslinga, D., Builtjes P., Banzhaf, S., and Scheuschner, T.: Modelling and mapping of atmospheric nitrogen and sulphur deposition and critical loads for ecosystem specific assessment of threats to biodiversity in Germany – PINETI (Pollutant INput and EcosysTem Impact), Substudy Report 1, UBA Texte 60/2014, Umweltbundesamt, ISSN 1862-4804, Dessau-Roßlau, 2014.
Wichink Kruit, R. J., Aben, J., de Vries, W., Sauter, F., van der Swaluw, E., van Zanten, M. C., and van Pul, W. A. J.: Modelling trends in ammonia in the Netherlands over the period 1990–2014, Atmos. Environ., 154, 20–30, https://doi.org/10.1016/j.atmosenv.2017.01.031, 2017.
Wilczak, J. M., Oncley, S. P., and Stage, S. A.: Sonic Anemometer Tilt Correction Algorithms, Bound.-Lay. Meteorol., 99, 127–150, https://doi.org/10.1023/A:1018966204465, 2001.
Wintjen, P., Ammann, C., Schrader, F., and Brümmer, C.: Correcting high-frequency losses of reactive nitrogen flux measurements, Atmos. Meas. Tech., 13, 2923–2948, https://doi.org/10.5194/amt-13-2923-2020, 2020.
Wintjen, P., Schrader, F., Schaap, M., Beudert, B., and Brümmer, C.: Forest–atmosphere exchange of reactive nitrogen in a remote region – Part I: Measuring temporal dynamics, Biogeosciences, 19, 389–413, https://doi.org/10.5194/bg-19-389-2022, 2022.
Wolff, V., Trebs, I., Ammann, C., and Meixner, F. X.: Aerodynamic gradient measurements of the NH3-HNO3-NH4NO3 triad using a wet chemical instrument: an analysis of precision requirements and flux errors, Atmos. Meas. Tech., 3, 187–208, https://doi.org/10.5194/amt-3-187-2010, 2010.
Zhu, L., Henze, D., Bash, J., Jeong, G.-R., Cady-Pereira, K., Shephard, M., Luo, M., Paulot, F., and Capps, S.: Global evaluation of ammonia bidirectional exchange and livestock diurnal variation schemes, Atmos. Chem. Phys., 15, 12823–12843, https://doi.org/10.5194/acp-15-12823-2015, 2015.
Zimmerling, R., Dämmgen, U., and Haenel, H.-D.: Methoden zur Bestimmung von Konzentrationen und Flüssen luftgetragener Stoffe in Wald- und Forstökosystemen in Nordost-Brandenburg, Landbauforschung Völkenrode, Sonderheft 213, 17–42, 2000.
Zöll, U., Brümmer, C., Schrader, F., Ammann, C., Ibrom, A., Flechard, C. R., Nelson, D. D., Zahniser, M., and Kutsch, W. L.: Surface–atmosphere exchange of ammonia over peatland using QCL-based eddy-covariance measurements and inferential modeling, Atmos. Chem. Phys., 16, 11283–11299, https://doi.org/10.5194/acp-16-11283-2016, 2016.
Zöll, U., Lucas-Moffat, A. M., Wintjen, P., Schrader, F., Beudert, B., and Brümmer, C.: Is the biosphere-atmosphere exchange of total reactive nitrogen above forest driven by the same factors as carbon dioxide? An analysis using artificial neural networks, Atmos. Environ., 206, 108–118, https://doi.org/10.1016/j.atmosenv.2019.02.042, 2019.
- Abstract
- Introduction
- Field campaign sites
- Measurement techniques
- Data processing
- Data description
- Potential applications
- Data availability and structure
- Conclusions and outlook
- Author contributions
- Competing interests
- Disclaimer
- Acknowledgements
- Financial support
- Review statement
- References
- Supplement