the Creative Commons Attribution 4.0 License.
the Creative Commons Attribution 4.0 License.
 | 17 Feb 2022
Black carbon and organic carbon dataset over the Third Pole
Shichang Kang
Pengfei Chen
Junming Guo
Qianggong Zhang
Zhiyuan Cong
Susan Kaspari
Lekhendra Tripathee
Tanguang Gao
Hewen Niu
Xinyue Zhong
Xintong Chen
Zhaofu Hu
Xiaofei Li
Yang Li
Bigyan Neupane
Fangping Yan
Dipesh Rupakheti
Chaman Gul
Wei Zhang
Guangming Wu
Ling Yang
Zhaoqing Wang
Chaoliu Li
The Tibetan Plateau and its surroundings, also known as the Third Pole, play an important role in the global and regional climate and hydrological cycle. Carbonaceous aerosols (CAs), including black carbon (BC) and organic carbon (OC), can directly or indirectly absorb and scatter solar radiation and change the energy balance on the Earth. CAs, along with the other atmospheric pollutants (e.g., mercury), can be frequently transported over long distances into the inland Tibetan Plateau. During the last decades, a coordinated monitoring network and research program named “Atmospheric Pollution and Cryospheric Changes” (APCC) has been gradually set up and continuously operated within the Third Pole regions to investigate the linkage between atmospheric pollutants and cryospheric changes. This paper presents a systematic dataset of BC, OC, water-soluble organic carbon (WSOC), and water-insoluble organic carbon (WIOC) from aerosols (20 stations), glaciers (17 glaciers, including samples from surface snow and ice, snow pits, and 2 ice cores), snow cover (2 stations continuously observed and 138 locations surveyed once), precipitation (6 stations), and lake sediment cores (7 lakes) collected across the Third Pole, based on the APCC program. These data were created based on online (in situ) and laboratory measurements. High-resolution (daily scale) atmospheric-equivalent BC concentrations were obtained by using an Aethalometer (AE-33) in the Mt. Everest (Qomolangma) region, which can provide new insight into the mechanism of BC transportation over the Himalayas. Spatial distributions of BC, OC, WSOC, and WIOC from aerosols, glaciers, snow cover, and precipitation indicated different features among the different regions of the Third Pole, which were mostly influenced by emission sources, transport pathways, and deposition processes. Historical records of BC from ice cores and lake sediment cores revealed the strength of the impacts of human activity since the Industrial Revolution. BC isotopes from glaciers and aerosols identified the relative contributions of biomass and fossil fuel combustion to BC deposition on the Third Pole. Mass absorption cross sections of BC and WSOC from aerosol, glaciers, snow cover, and precipitation samples were also provided. This updated dataset is released to the scientific communities focusing on atmospheric science, cryospheric science, hydrology, climatology, and environmental science. The related datasets are presented in the form of excel files. BC and OC datasets over the Third Pole are available to download from the National Cryosphere Desert Data Center (https://doi.org/10.12072/ncdc.NIEER.db0114.2021; Kang and Zhang, 2021).
- Article
(12817 KB) - Full-text XML
- BibTeX
- EndNote


With high elevations (average >4000 m a.s.l.), the Tibetan Plateau (TP) and its surroundings, known as the Third Pole, play an important role in the Earth's climate through its complex topography (Yao et al., 2019). Due to the wide distributions of mountain glaciers, snow cover, permafrost, and seasonally frozen ground, the TP and its surroundings are also known as the Asian Water Tower (Immerzeel et al., 2010; Yao et al., 2012), which consists of the source regions of several large Asian rivers (e.g., Yellow, Yangtze, Brahmaputra, Ganges, and Indus rivers). The TP is particularly sensitive to climate change and regional anthropogenic forcing and currently has been experiencing significant warming (Chen et al., 2015; Gao et al., 2019; Huss and Hock, 2018; IPCC, 2021; Kang et al., 2010; Ramanathan et al., 2007b; Ramanathan and Carmichael, 2008; Xu et al., 2009; You et al., 2021). Recent rapid cryospheric changes (e.g., glacier melting, permafrost thawing, snow cover declining) on the TP profoundly affect the regional water cycle and ecosystems (Brun et al., 2020; M. Chen et al., 2019; Kang et al., 2015; Immerzeel et al., 2020; Nie et al., 2021; Sun et al., 2021; Yao et al., 2012, 2019; G. Zhang et al., 2020).
Due to the harsh environment and poor accessibility, observed data on the TP are still scarce, which limits the effective investigation, verification, and calibration of reanalysis data and modeling simulations (Qian et al., 2015; You et al., 2020). In particular, studies on atmospheric carbonaceous components (e.g., black carbon, BC; organic carbon, OC) have gained wide attention due to the fact that they can directly or indirectly absorb or scatter solar radiation, alternately interact with the nucleation of clouds, and influence the precipitation efficiency (Bond et al., 2013; IPCC, 2013; Ji et al., 2016; Ramanathan et al., 2005; Ramanathan and Carmichael, 2008; Ramachandran et al., 2020; Yang et al., 2020). These carbonaceous aerosols (CAs) have substantially influenced the climate and environmental changes on the Earth (Kang et al., 2020; X. Li et al., 2017; Xu et al., 2012; P. Chen et al., 2019; Zhang et al., 2017a; Zhang et al., 2012). The TP has recently been polluted by anthropogenic emissions mainly from long-range atmospheric transport, especially during the pre-monsoon, when the aerosols accumulated and combined with westerlies and local mountain valley breeze (Cong et al., 2015; Kang et al., 2019; Painicker et al., 2021; Yang et al., 2018). Although the atmospheric environment over the TP is minimally disturbed by local anthropogenic activity because of the sparse population and limited industries (Cong et al., 2013; Kang et al., 2019), local emissions from booming tourism traffic or domestic fossil fuel and biomass burning also potentially contributed to the climatic and environmental changes (Li et al., 2018a). The investigations of CAs from various environmental media in the TP will improve our understanding of recent environmental changes and their impact on rapid cryospheric melting under climate warming.
The glaciers provide natural archives of climate and environmental information (Jouzel, 2013; Thompson, 2000; Yao et al., 2006). Historical BC records from the Tibetan glacier ice cores revealed the impact of anthropogenic emissions, with BC concentrations increasing by a factor of 2–3 since the 1950s (Kaspari et al., 2011; Wang et al., 2015, 2021). Light-absorbing BC and OC (including water-soluble organic carbon (WSOC) and water-insoluble organic carbon (WIOC)) deposited on the glacier and snow cover induced surface darkening and enhanced melting (Flanner et al., 2007; Kang et al., 2020; Lau and Kim, 2018; Santra et al., 2019; Xu et al., 2009; Y. Zhang et al., 2020, 2021b). Estimates indicated that BC in snow resulted in accelerated glacier melt by approximately 15 %–20 % in the southeastern and central TP and Central Asia (Li et al., 2020; Zhang et al., 2017a, 2020b) and reduced snow cover duration by 3–4 d across the TP and 3–6 d in northern Xinjiang (Zhang et al., 2018b; Zhong et al., 2019), respectively. Meanwhile, WSOC in snow may also contribute to glacier melting (Hu et al., 2018; Gao et al., 2020) due to its light absorption property equal to approximately 10 % of that by BC in the northern TP and northern Xinjiang (Yan et al., 2016; Zhang et al., 2019). The isotopic signatures of BC from glaciers and modeling results constrained BC sources in the TP, which indicated that BC was predominately derived from fossil fuel combustion (>60 %) in the northern TP. Meanwhile in the southern TP, comparable contributions from fossil fuel combustion (46 %) and biomass burning (54 %) to BC were observed (Li et al., 2016a; Yang et al., 2018; Zhang et al., 2017a). WSOC in precipitation can provide carbon to the ecosystems (Li et al., 2018b). It was reported that the average WSOC concentrations of precipitation in the Nam Co region (inland TP) were lower than those in the urban areas but higher than those from snow pit samples (Li et al., 2018b).
Over the TP, large numbers of lakes are distributed (including proglacial lakes) (Brun et al., 2020; G. Zhang et al., 2020). As BC is chemically inert in the lake sediment cores, it can serve as an archive and reliable indicator to investigate the source and transport of BC in the past (Han et al., 2012). The BC investigation from lake sediment cores over the plateau revealed an increasing trend of BC concurrent with increased anthropogenic emissions since the 1950s (Cong et al., 2013; Han et al., 2015; Neupane et al., 2019; Zhu et al., 2020) and suggested that BC deposition in recent decades has increased about 2–3-fold compared to the background level.
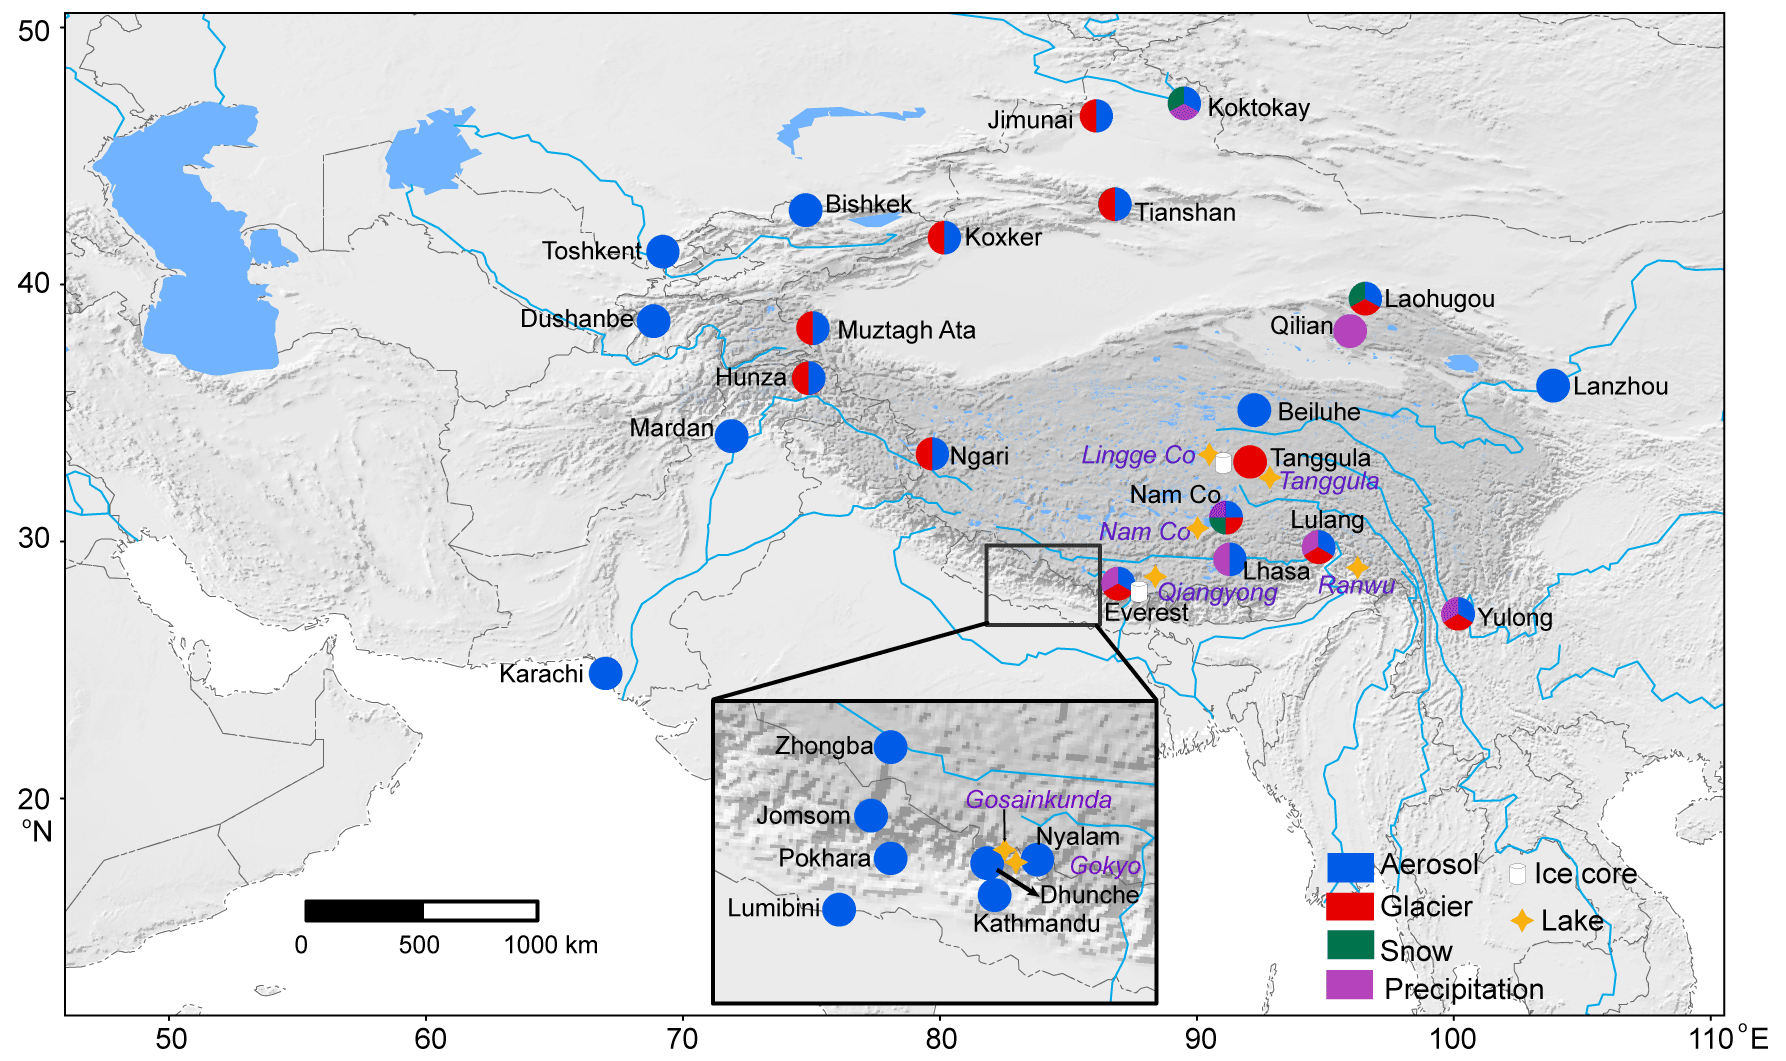
Figure 1Schematic overview of measurements from the Atmospheric Pollution and Cryospheric Changes program over the Third Pole, in which coordinated carbonaceous component measurements were made on samples from the atmosphere, glaciers, snow cover, precipitation, and lake sediment cores. The location information for each station, glacier, and lake is provided in Tables 1, 2, and 3.
During the past decades, our research team has gradually set up a coordinated monitoring network and research program (Atmospheric Pollution and Cryospheric Changes; APCC), linking atmospheric pollution and cryospheric changes, covering the TP and its surrounding region (Fig. 1) (Kang et al., 2019). Based on the APCC program, our overarching goal is to perform more integrated and in-depth investigations of the origins and distributions of atmospheric pollutants and their impacts on cryospheric changes. The updated specific goals include the following:
-
Characterize the features of atmospheric pollutants (including new emergent pollutants), and depict their spatial and seasonal variations in different environmental media over the Third Pole region.
-
Investigate the source appointment of different atmospheric pollutants based on chemical tracers and modeling, and reveal the transport pathways and mechanisms by which atmospheric pollutants are transboundary-transported to the Third Pole region.
-
Quantify the contribution of atmospheric pollutants deposited as light-absorbing impurities to the glacier and snow melting, determine the fate of environmentally relevant pollutants within glaciers and snowpack, and further estimate the feedback of cryospehric melting to the carbon (and nitrogen) cycle and hydrological changes.
A series of search results have been published on the research progress that depends on or is related to the APCC program during the past several years (Kang et al., 2019). Recently, new progress was also achieved, including extending the study area to Central Asia (P. Chen et al., 2021; Zhang et al., 2021b), investigating new emergent pollutant microplastics in snow (Zhang et al., 2021c), and discussing the potential impact of glacier melting and permafrost thaw on the carbon cycle (Gao et al., 2021a; Zhang et al., 2021a). Therefore, in this article, we introduce and provide access to the systematic dataset of BC and OC from the atmosphere, glaciers (including ice cores), snow cover, precipitation, and lake sediment cores over the TP and its surroundings based on the APCC program. The site description, online observations, and sampling are summarized in Sects. 2 and 3, respectively. A detailed data description of laboratory analysis and BC, OC, WSOC, and WIOC concentrations from aerosols, glaciers, precipitation, snow cover, and refractory BC (rBC) historical records from ice cores and BC from lake sediment cores is given in Sect. 4, highlighting the primary results and differences and similarities among the studied regions. Meanwhile, mass absorption cross section (MAC) values of BC and WSOC from aerosols, glaciers, snow cover, and precipitation and carbon isotopic signatures (Δ14C, δ13C) from glacier snow pits, precipitation, and aerosols are also provided. The data availability and access are provided in Sect. 5, and the conclusions are summarized in Sect. 6.
2.1 Overview of site distributions
The TP can be divided into three distinct sub-regions, respectively associated with the dominant influence of the westerlies (northern TP), Indian monsoon (southern TP), and the transition region in between. These sub-regions do not have an exact boundary (Yao et al., 2013). These different features in sub-regions motivated the need for network observations to understand the atmospheric pollutants and their possible impact on the environment. The APCC program currently consists of 29 stations across the TP and its surroundings covering these 3 distinct sub-regions (Fig. 1). As shown in Table 1, there is only one station (Nam Co) for observations of aerosol, glacier, precipitation, and snow cover together; one station (Laohugou) for observation of aerosol, glacier, and snow cover together; and three stations (Everest, Lulang, and Yulong) for observation of aerosol, precipitation, and glaciers together. Meanwhile, there are six stations for observation of aerosol and glaciers and one station (Lhasa) for observation of aerosols and precipitation. Besides, there are 14 stations for only observation of aerosol, 1 station (Qilian) for only observation of precipitation, 1 station (Tanggula) for only observation of glacier, and 1 station (Koktokay) for only observation of snow cover (Table 1). In summary, there are 27 stations supporting aerosol sampling and observations, 20 glaciers observed, 3 stations for snow cover observations, 138 locations for snow cover sampling once, and 6 stations for precipitation observations (Table 1 and Fig. 1). In addition, lake sediment cores were studied from seven lakes across the Himalayas and TP. According to the distance and the extent of impact from anthropogenic activity, these stations were distributed into two major types, namely urban stations (strongly influenced by anthropogenic activity) and remote stations (weakly impacted by direct anthropogenic emissions). As this paper is the first dataset report based on the APCC program, we will release the carbonaceous dataset from 20 stations for aerosols, 17 glaciers (including samples from surface snow and ice, snow pits, and 2 ice cores), 2 stations for continuous snow cover observations, 138 locations during snow cover surveys, 6 stations for precipitation, and 7 lake sediment cores across the TP and its surroundings. In the future, more comprehensive datasets on mercury, heavy metals, and persistent organic pollutants will also be reported gradually from the APCC program.
Table 1Detailed geographic characteristics of the Atmospheric Pollution and Cryospheric Changes program observation stations across the Tibetan Plateau and its surroundings in this paper.

2.2 Stations for the aerosol and precipitation studies
The APCC network has a total of 29 stations for the aerosol and precipitation studies. In specific, for the spatial distributions (Fig. 1 and Table 1), the APCC program includes eight stations from Nepal across the central Himalayas to Tibet (Lumbini, Kathmandu, Jomsom, Pokhara, Dhunche, Nyalam, Zhongba, Everest), three stations in Pakistan (Hunza, Mardan, Karachi), and two stations in the southeastern TP (Lulang, Yulong), all of which are dominantly influenced by the Indian monsoon. There are 12 sites (Dushanbe, Toshkent, Bishkek, Jimunai, Koktokay, Tianshan, Koxkar, Muztagh Ata, Ngari, Laohugou, Qilian, Beiluhe) distributed in Central Asia, the Xinjiang Uygur Autonomous Region (China), and the western and northern TP, mainly controlled by the westerlies. In the inland TP, two stations (Nam Co, Tanggula) are distributed across the Nyainqentanglha Mountains to the Tanggula Mountains, which are alternately influenced by the Indian monsoon and westerlies (as the transition sub-region; Yao et al., 2013). Aerosol samples were also collected from Lhasa and Lanzhou city. The elevations of these stations ranged from 13 to over 5000 m a.s.l. (Table 1), with landscapes including forest, alpine steppe, alpine meadow, and desert. These sites served as the key locations for field observations and measurements.
There are five stations located on the southern side of the Himalayas in Nepal, focusing on aerosol studies to resolve the transboundary transport of air pollutants (Tripathee et al., 2017; Chen et al., 2020). A list of the detailed information on observation items is in Table 1. Kathmandu, the capital city of Nepal, is characterized by rapid but uncontrolled urban growth and has severe air pollution problems. Pokhara, a famous tourist city, has undergone rapid urbanization with increased numbers of vehicles and industries. Lumbini, located on the northern edge of the Indo-Gangetic Plain (IGP), is a typical rural site located in a mixed setting with a large number of agricultural and industrial activities. Dhunche is a small town situated in the Langtang National Park in the Rusuwa District in the foothills of the Himalayan Mountains; it is approximately 50 km north of Kathmandu. Jomsom is a semi-arid small town in the Mustang District, located in the Kali Gandaki River valley across the Himalayas.
In Pakistan, three stations (namely Karachi, Mardan, and Hunza) are studied based on the APCC program (Gul et al., 2018). Karachi is the capital city of Sindh Province, with almost half of the domestic industries in this city. The sampling place is in the extreme southern portion, just a few kilometers away from the Arabian Sea. Mardan, located near Peshawar city, is the second-largest city in Khyber Pakhtunkhwa Province. The sampling locations are 10 to 15 km away towards the northern side of central Mardan city. Hunza is situated in a valley of Gilgit-Baltistan, on the northern edge of Pakistan, sharing borders with the Wakhan Corridor of Afghanistan and Xinjiang Province of China. The sampling location is at the terminus of Passu glacier and very close to Gulkin glacier.
In the Central Asian countries, three stations were selected and set up for the aerosol studies. Dushanbe is the capital city of Tajikistan. The aerosol sample collection is performed at the Physical Technical Institute of the Academy of Sciences of Tajikistan, which is located in an urban environment on a hill in the eastern part of Dushanbe. Toshkent Shahri is the capital city of Uzbekistan, located in the eastern part of the country and between the Tianshan Mountains and the Syr River. Bishkek is the capital of Kyrgyzstan, at the foot of the Alatao Mountains in the north of the country and in the central Chu River basin. All of these sites are located in the arid and semi-arid regions with a dry continental climate.
There are 18 stations (Lanzhou, Lhasa, Everest, Zhongba, Nyalam, Lulang, Yulong, Nam Co, Tanggula, Beiluhe, Qilian, Laohugou, Ngari, Muztagh Ata, Koxkar, Tianshan, Koktokay, and Jimunai) continuously observed over the TP and its surroundings within China. Lanzhou is the capital city of Gansu Province and is an important industrial base and comprehensive transportation hub in northwestern China. Lhasa, China's highest-altitude city, is located on the banks of the Lhasa River and serves as the capital of the Tibet Autonomous Region. Everest, Zhongba, and Nyalam are located on the northern side of the Himalayas, characterized by agriculture and yak husbandry and dominated by the Indian monsoon. In particular, at the Qomolangma Atmospheric and Environmental Observation and Research Station of the Chinese Academy of Sciences (CAS) on the northern slope of Mt. Everest (Everest station), real-time data of equivalent BC concentrations (eBC; measured by the Aethalometer model, AE-33) have been observed since May 2015 (Chen et al., 2018). Lulang is located in a sub-valley of the Yarlung Tsangpo Grand Canyon, a corridor for the warm and humid Indian monsoon to penetrate the inland TP. Yulong, the southernmost glaciated mountain in the Eurasian continent, close to Lijiang city (Yunnan Province), may be affected by local emissions. Nam Co is a typical pastoral area in the inland TP. Beiluhe is located to the east of Kekexili of the inland TP. Laohugou is a remote hinterland site located in the western Qilian Mountains. Ngari is located in the western TP, a typical arid area covered by bare soil or grasslands. The Koxkar station is located on the southern slope of Mt. Tomur, which is the highest peak in western Tianshan. Tianshan Glaciological Station (Tianshan station) is located in the upper reaches of the Urumqi River. Jimunai is located in northern Xinjiang, near the Altai Mountains.
Precipitation samples in this paper were collected from six stations (Fig. 1), namely the upper Heihe River basin (Qilian), Nam Co, Everest, Lulang, Yulong, and Lhasa city (Gao et al., 2021b; Li et al., 2018b; Niu et al., 2019). The upper Heihe River basin is a typical permafrost basin, located in the Qilian Mountains of the northern TP (Chen et al., 2014). The other five stations have been described in the previous paragraphs.
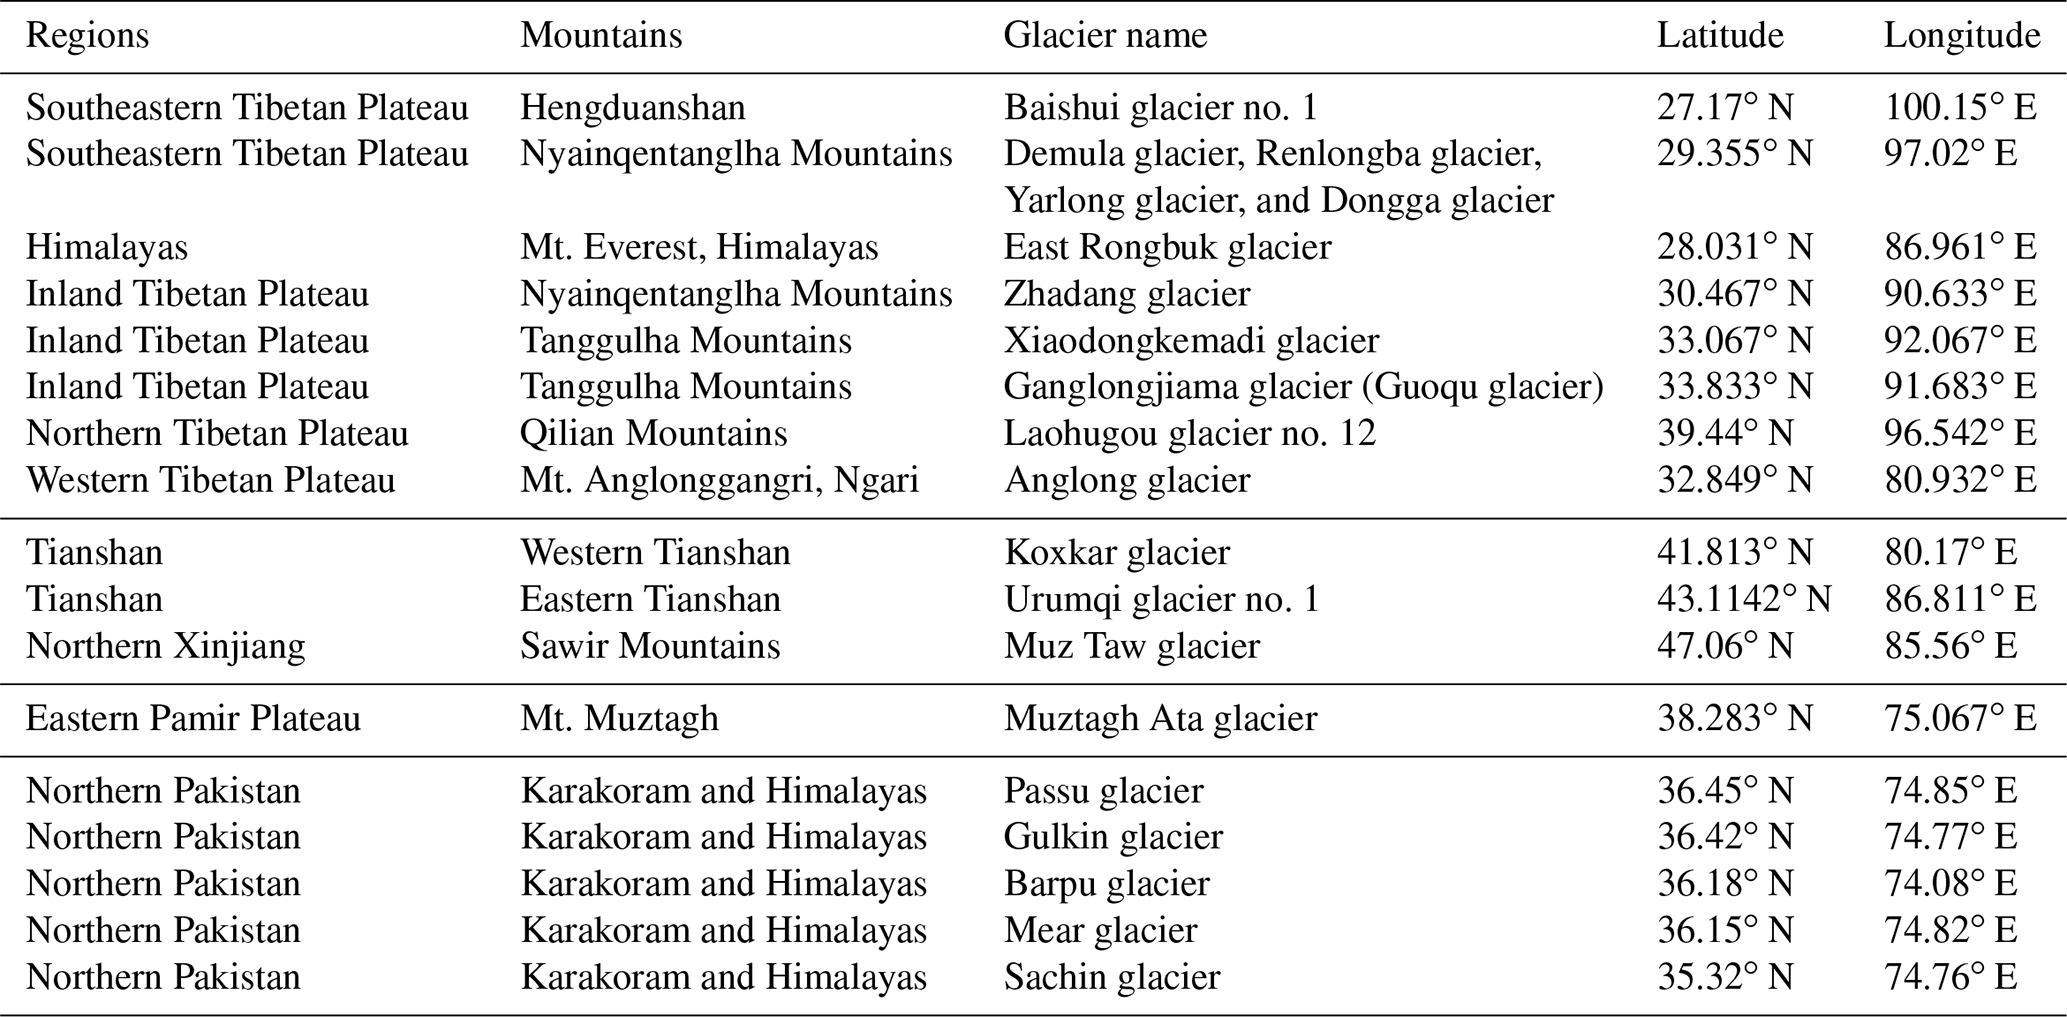
Table 2Detailed information for the observed glaciers based on the Atmospheric Pollution and Cryospheric Changes program across the Third Pole.
Note: an ice core with a depth of 108 m was collected from the col of the East Rongbuk glacier (28.03∘ N, 86.96∘ E; 6518 m a.s.l.) located on the northeastern ridge of Mt. Everest; an ice core with a depth of 147 m was collected from the upper basin of the Ganglongjiama glacier (Guoqu glacier; 33.58∘ N, 91.18∘ E; 5750 m a.s.l.) on the northern slope of Mt. Geladaindong.
2.3 Glaciers
Carbonaceous data from a total of 17 glaciers are provided in this paper (Table 2, Fig. 1). There are 11 glaciers located in the Indian-monsoon-dominated region. Among them, Baishui glacier no. 1 of Yulong Snow Mountain and the other four glaciers (namely Demula, Renlongba, Yarlong, Dongga) are located in the southeastern TP (Niu et al., 2018a; Zhang et al., 2017a), and the East Rongbuk glacier is located in the central Himalayas on the northern slope of Mt. Everest. In the inland TP, three glaciers are observed and studied. The Zhadang glacier, with an area of 2.0 km2 and a length of 2.2 km, is located on the northeastern slope of the Nyainqentanglha mountain range (X. Li et al., 2018). The Xiaodongkemadi glacier, with an area of approximately 1.60 km2 and facing southwest, is located at the headwaters of the Dongkemadi River, a tributary at the upper reaches of the Buqu River near the Tanggula Pass in the central TP (Gao et al., 2012; C. Li et al., 2017b). The Ganglongjiama glacier (also known as Guoqu glacier) is located on the northern slope of Mt. Geladaindong, the summit peak of the Tanggula Mountains (Hu et al., 2020). Meanwhile, there are five glaciers studied in northern Pakistan. The Passu and Gulkin glaciers are located very near the Karakoram highway connecting Pakistan with China. The Barpu and Mear glaciers are located very close to each other and around 3 km away from the residential area of the Hopar and Nagar valleys, and Sachin glacier is close to a small city (Astore) (Gul et al., 2018).
There are six glaciers monitored in the westerly-dominated regions. The Laohugou glacier no. 12, a typical valley glacier, is located on the northern slope of the western Qilian Mountains in the northern TP and covers an area of 21.9 km2 (Y. Li et al., 2019; Zhang et al., 2017b). The Muztagh Ata glacier has an area of ∼0.96 km2 and a length of 1.8 km, located in the eastern Pamir Plateau (Yao et al., 2012). The Anglong glacier is located in the headwater region of Indus, covering an area of 1.5 km2 (Y. Chen et al., 2021). The Koxkar glacier (also named Keqikaer glacier) is located on the southern slope of Mt. Tomur, the highest peak in western Tianshan, on the border between China and Kyrgyzstan (Zhang et al., 2017c). The Urumqi glacier no. 1 is located at the headwater of the Urumqi River in eastern Tianshan, which is surrounded by the Taklimakan Desert to the south, the Gurbantungut Desert to the north, and the Gobi Desert to the east. This glacier has an area of 1.65 km2 (50 % of the basin) (X. Li et al., 2019). The Muz Taw glacier is located on the northern slope of the Sawir Mountains in northern Xinjiang, south of the Ertix River in Central Asia (Y. Zhang et al., 2020).
There are two ice cores retrieved from the East Rongbuk glacier (Mt. Everest region) and the Ganglongjiama (Mt. Geladaindong region) glacier, respectively (Jenkins et al., 2016; Kaspari et al., 2011; Zhang et al., 2015) (Fig. 1).
2.4 Snow cover
Snow cover samples were collected from 2 stations (the Laohugou and Koktokay) (Fig. 1) and 138 snow survey locations once in the TP and the northern Xinjiang (Zhang et al., 2018a; Zhong et al., 2019, 2021). The Koktokay Snow Station at the headwater of the Irtysh River is selected as the fixed-point site, which is located in the Kayiertesi River basin, the first tributary of the Irtysh River. The Kayiertesi River basin is in the southern Altai Mountains in China, covering 2365 km2. Seasonally frozen soil and permafrost are widely spread in the basin, and the basin is rich in vegetation (39.2 % vegetation coverage in 2014) (Zhang et al., 2016). The land surface is generally covered by forest in the shade and semi-shade and by grassland and shrubs on the sunny and semi-sunny slopes (Zhang et al., 2016). The lowest air temperature is below −45 ∘C in winter. Average annual maximum snow depth exceeds 1 m (Zhang et al., 2014). Floods in the river basin are due to rain-on-snow events, originating from the combination of rapidly melting snow and intense precipitation. There were 27 sampling locations for snow cover sampling distributed in the southern TP, 10 locations in the central TP, and 10 locations from one glacial river basin (Laohugou region in the northern TP) (Zhang et al., 2018b). There were 91 surveyed locations distributed across northern Xinjiang. Among them, 11 sampling locations were selected during the whole snow season, including 5 locations in the southern Altai Mountains, 3 locations on the western side of the Junggar Basin, and 3 locations in the northern Tianshan Mountains (Zhong et al., 2019).
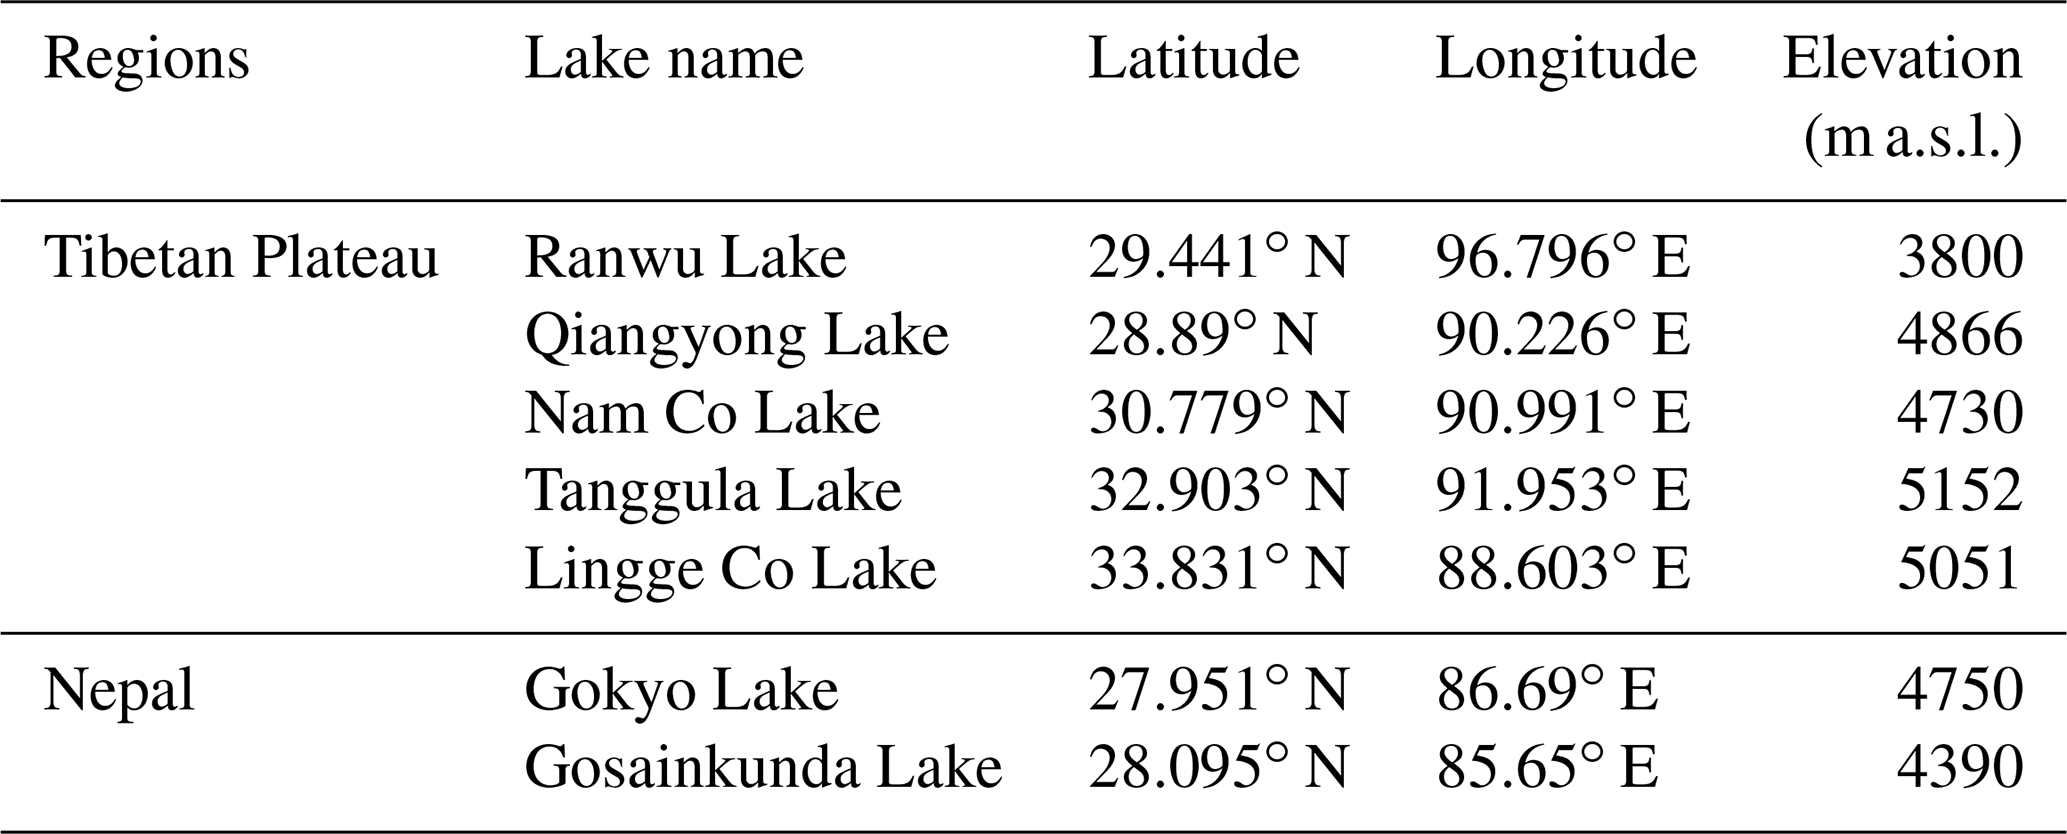
Table 3Detailed information for the lake sediment cores across the Third Pole in this paper.
2.5 Sediment cores from the lakes
Lake sediment cores were studied from seven lakes distributed across the Himalayas and TP (Cong et al., 2013; Neupane et al., 2019) (Table 3, Fig. 1). Gosainkunda Lake and Gokyo Lake are located on the southern slope of the Nepalese Himalayas. Qiangyong Lake and Ranwu Lake are located in the southern and southeastern TP, respectively. Nam Co Lake, Lingge Co Lake, and Tanggula Lake are located in the inland TP. Riverine BC inputs to the Qiangyong and Ranwu lakes were controlled by the surrounding snow cover and glacier meltwater. All the above lakes are located far from areas with large amounts of anthropogenic activity.
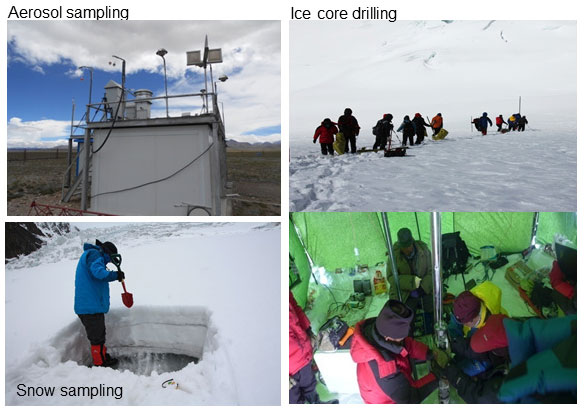
Figure 2Photos of aerosol sampling, snow sampling, and ice core drilling on the Tibetan Plateau.
3.1 Atmospheric aerosol and precipitation sampling
In this study, carbonaceous data (elemental carbon, EC; OC; WSOC) from atmospheric aerosols (total suspended particulates, TSPs) were collected and reported from 19 stations based on the APCC program, distributed in the TP, Southeast Asia, and Central Asia. Generally, the TSPs were collected on pre-combusted (550 ∘C, 6 h) quartz fiber filters (90 mm in diameter, with pore size of 2.2 µm, Whatman) with a TSP cyclone at a flow rate of 100 L min−1 for 24 h (urban or rural sites) or 48 h (remote sites) (P. Chen et al., 2019). The TSP sampler was set up on the roof of the observation building to avoid the effects of ground dust (Fig. 2). After sampling, the filters were kept frozen until analysis. TSP samples were collected every 6 d to bypass the “weekend effect”, which indicated that the weekly cycle of aerosol composite (with low values on weekends and high values on weekdays) was usually governed by the anthropogenic emissions (Satheesh et al., 2011). These quartz filters will be used for measurement of EC, OC, and WSOC from the aerosols.
When precipitation occurred, wet deposition samples were collected by an automated precipitation collector for the analysis of BC and WIOC. After the precipitation event, the precipitation amount was also recorded, and the samples were transferred into high-density polyethylene bottles (250 mL) and kept frozen until analysis. Samples of WSOC were collected in prebaked aluminum basins (450 ∘C, 6 h) that were placed on a 1.5 m high platform (Li et al., 2016b, c, 2018b, 2021; Niu et al., 2019). Due to limitations in the volume of samples collected during small precipitation events, only those with a large enough volume of sample were selected to determine Δ14C and δ13C.
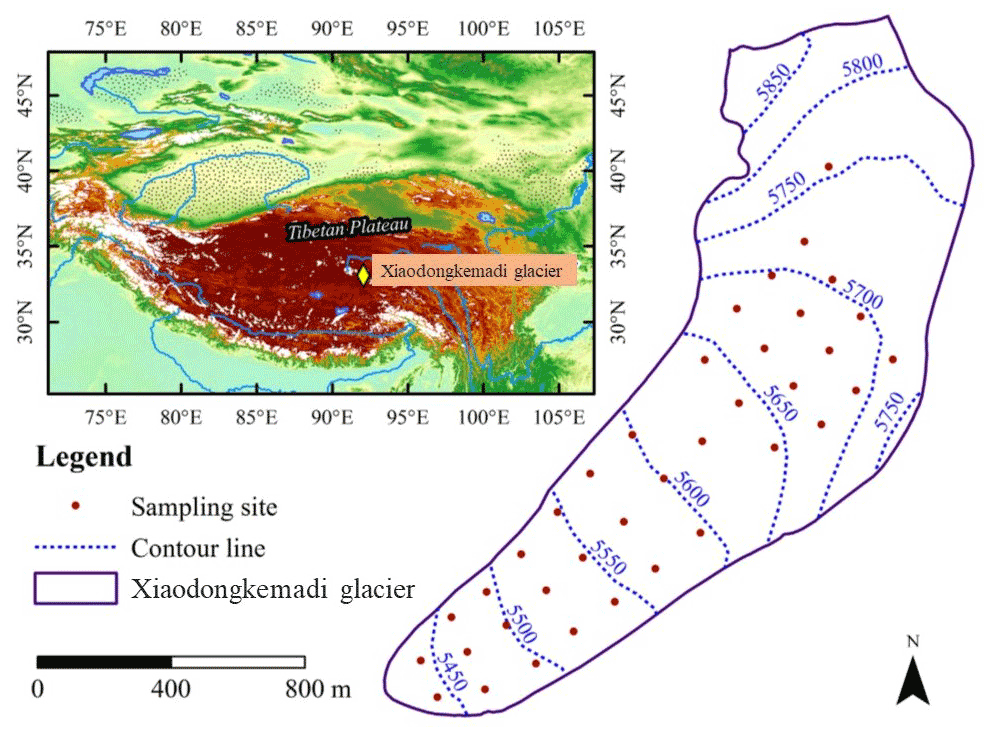
Figure 3Black carbon and organic carbon data in surface snow and snow pit sampling sites from the Xiaodongkemadi glacier in the Tanggula Mountains in the central Tibetan Plateau. Modified from X. Li et al. (2017).
3.2 Glaciers, snow cover, and ice core sampling
Surface snow and ice and snow pits were sampled from glaciers, and meteorological variables in glacial regions were observed by automatic weather stations (Fig. 2). Generally, for glacier surface snow and ice sampling, different types of snow and ice (fresh snow, aged snow, and granular ice) samples were collected across the ablation and accumulation zone of the entire glacier (Fig. 3). Whirl-Pak bags were used to collect surface snow samples from the upper 0–10 cm (or 0–5 cm) of depth (approximately 2 L, unmelted) as well as surface granular ice samples. In general, the snow pit samples were collected at the accumulation zone of glaciers using a stainless-steel spoon with a vertical depth interval of 5, 10, or 15 cm and transferred into a Whirl-Pak bag, following the protocol described by Kang et al. (2007). Generally, duplicate samples were collected to evaluate the differences between sampling. In situ observations included snow thickness, density, grain size, and surface albedo, which are used to estimate the post-deposition processes, chemicals flux, and effect of BC on glacier melt.
In field surveys across the northern, eastern, and southern TP and northern Xinjiang (Zhang et al., 2018b; Zhong et al., 2019), snow depth, snow density, snow grain size, and surface albedo were observed, and snow cover samples were collected. At each sampling location, snow samples were collected from the top 5 cm of the snowpack and stored in a Whirl-Pak bag. The vertical resolution of the snow pit profile at Koktokay Snow Station was 5 cm intervals from the snow surface to a depth of 20 cm; then samples were collected every 10 cm from a depth of 20 cm to the bottom. During the snow accumulation period (November) and the stable period (from December through early March), snow pit samples were collected three times a month at 10:00 (UTC/GMT +8.00, the same below). During the intense snowmelt period (from early or mid-March to early April), snow samples were collected twice a day at 10:00 and 19:00, respectively. Snow cover samples for analyses of WSOC were directly collected into the square polycarbonate bottles (Zhang et al., 2019). The samples were kept frozen until they were melted and filtered in the laboratory.
In this paper, historical rBC records from two ice cores were reported. In 2002, a 108 m ice core was collected from the col of the East Rongbuk glacier located on the northeastern ridge of Mt. Everest on the northern slope of the Himalayas (Kaspari et al., 2011). In 2016, a shallow ice core (8 m length) was drilled by the team from the same glacier to expand rBC records since 2000. In November 2005, a 147 m ice core was collected from the upper basin of the Ganglongjiama glacier (Guoqu glacier) on the northern slope of Mt. Geladaindong using an electro-mechanical drill (Jenkins et al., 2016; Zhang et al., 2015). The drilled ice cores were packed in polyethylene tubing in the field, transported frozen to the State Key Laboratory of Cryospheric Science, Chinese Academy of Sciences, in Lanzhou, and kept in a cold room at −20 ∘C until sample preparation and analysis (Kang et al., 2015).
3.3 Lake sediment core sampling
Lake sediment cores were drilled from the deep basin of the studied lakes during 2008–2017 using a gravity coring system with a 6 cm inner diameter polycarbonate tube (Cong et al., 2013; Neupane et al., 2019). The core sediments were sliced in the field at intervals of 0.5 cm, except for Lingge Co Lake and Ranwu Lake, which were sliced at 1 cm intervals, stored in plastic bags, and kept frozen until analysis.
4.1 Real-time atmospheric BC observation using an Aethalometer
BC is an important part of atmospheric particulate aerosols and imposes adverse effects on atmospheric visibility, health, and climate change (Ramanathan and Carmichael, 2008). The eBC is operationally defined as the amount of strongly light-absorbing carbon with the approximate optical properties of carbon soot that would give the same signal in an optical instrument (e.g., Aethalometer) (Andreae and Gelencsér, 2006). At the Everest station, a real-time optical instrument (Aethalometer model AE-33, Magee Scientific Corporation, USA) for measurement of eBC from atmospheric aerosols was operated with an inlet installed at approximately 3 m above the ground level since March 2015. The airflow rate was operated at 4 L min−1. The eBC concentrations can be acquired according to the light absorption and attenuation characteristics from the seven fixed wavelengths (e.g., 370, 470, 520, 590, 660, 880, and 950 nm) (Chen et al., 2018; Drinovec et al., 2015). In general, the eBC concentration measured at 880 nm is used as the BC concentration in the atmosphere as the absorption of other types of aerosols (e.g., OC and dust) is greatly reduced at this wavelength (Sandradewi et al., 2008). When calculating eBC concentrations, it is therefore possible to eliminate the “loading effect” with the loading compensation parameter k, which allows extrapolation to zero loading, and the accurate ambient BC concentration is obtained (Drinovec et al., 2015). Previous studies have evaluated the real-time compensation algorithm of the dual-spot Aethalometer model AE-33 and indicated that the AE-33 agreed well with the post-processed loading-effect-compensated data obtained using earlier Aethalometer models and other filter-based absorption photometers (Chen et al., 2018; Drinovec et al., 2015).

Figure 4Daily mean BC aerosol concentrations at the Everest station (Mt. Everest region) measured by AE-33 from 15 May 2015 to 29 December 2019. Light-blue lines refer to daily data; the thick blue lines represent the smoothing results.
At the Everest station, daily and monthly mean eBC concentrations presented strong seasonal variations during 2015–2019, which showed the highest values in the pre-monsoon season (∼923 ng m−3 in April) and the lowest values in the monsoon season (∼88.5 ng m−3 in July) (APCC dataset I-1 and Fig. 4). In the pre-monsoon season, BC from the Indo-Gangetic Plain (IGP) region can be transported and concentrated on the southern slope of the Himalayas by the northwesterly winds in the lower atmosphere and then further transported across the Himalayas by mountain valley winds (Cong et al., 2015). Simulations further indicated that the BC aerosols in South Asia could be uplifted and transported to the Mt. Everest region by the southerly winds in the upper atmosphere in the monsoon season (Chen et al., 2018). The results indicated that the seasonal cycle of BC was significantly influenced by the atmospheric circulation and combustion intensity in the Mt. Everest region. Meanwhile, there were continuously high concentrations of eBC above 1000 ng m−3 during 8–10 June 2015, 19–22 March 2016, 9–30 April 2016, and 11–14 April 2017, indicating that the heavy-pollution episodes occurred at Mt. Everest during those days (Chen et al., 2018).
4.2 Analysis methods and data of atmospheric aerosol EC and OC
After the TSP sampling, the aerosol EC and OC concentrations were measured by a thermal-optical carbon analyzer (Desert Research Institute DRI Model 2001 or Sunset Lab) (P. Chen et al., 2019). In detail, for the aerosol samples (TSP quartz filters), a punch of sample (with a filter area of 0.5 cm2) was put in a quartz boat inside the analyzer and heated stepwise at the different temperature plateaus (IMPROVE_A temperature protocol with an optical reflectance correction for sample charring) (Chow et al., 2007). The IMPROVE_A temperature protocol defined temperature plateaus for thermally derived carbon fractions of 140 ∘C for OC1, 280 ∘C for OC2, 480 ∘C for OC3, and 580 ∘C for OC4 in a helium (He) carrier gas and 580 ∘C for EC1, 740 ∘C for EC2, and 840 ∘C for EC3 in a 98 % He/2 % oxygen (O2) carrier gas. Each carbon fraction reported to the IMPROVE_A network database consisted of a value and a precision. The aerosol OC and EC by thermal-optical reflectance (TOR) were sensitive to the change in such temperature protocol. Therefore, EC, OC, and total carbon (TC) were calculated from the eight carbon fractions as
where OP in the equation represented pyrolyzed OC, which was defined as the carbon evolving between the introduction of oxygen in the helium atmosphere and the return of reflectance to its initial values (the OC–EC split) (Chow et al., 2005). The accuracy of the measurement was ±10 %, and the detection limits for OC, EC, and TC were 0.43, 0.12, and 0.49 µg C cm−2, respectively (P. Chen et al., 2019).
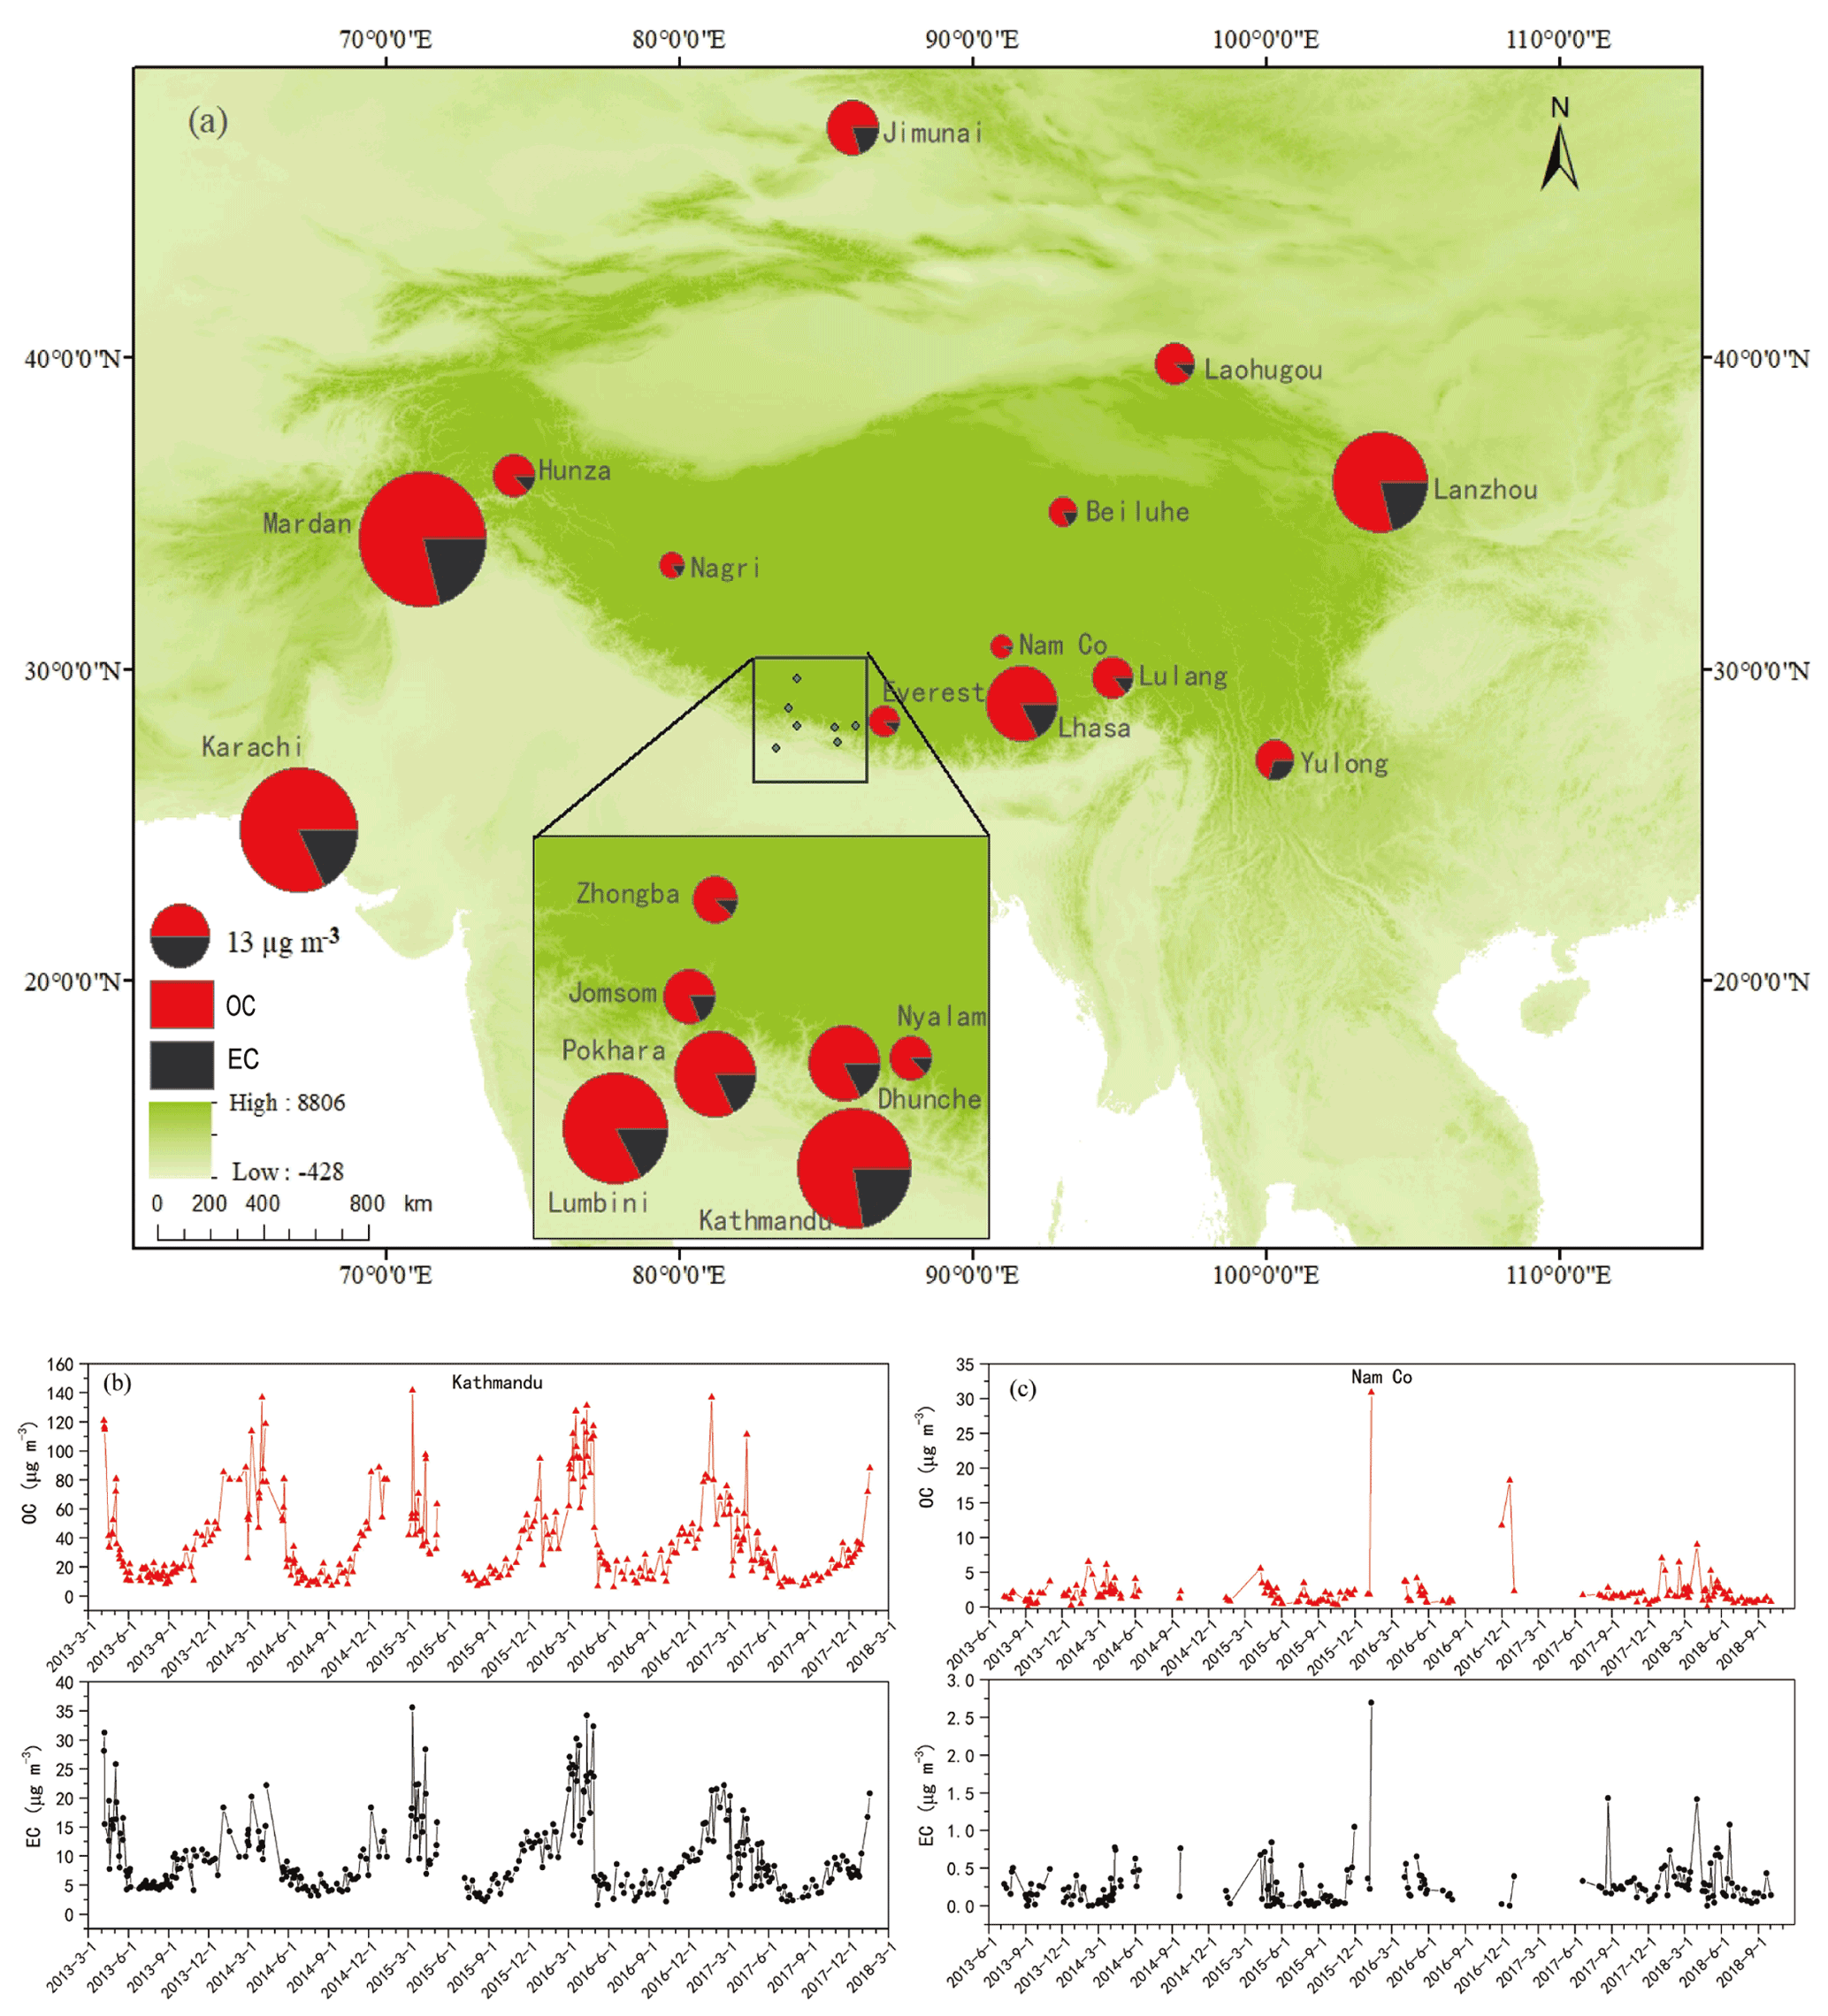
Figure 5Aerosol OC and EC concentration distributions in the Tibetan Plateau and its surroundings (top) and temporal variations in OC and EC concentrations at the Kathmandu and Nam Co station (bottom) during the observed periods, respectively. The abbreviations can be found in Table 1.
Approximately 1000 samples from 19 different stations are analyzed in this paper (APCC dataset I-1). Annual average TC, EC, and OC distributions across the TP usually showed higher values in the urban and rural stations and lower values in the remote stations, which considerably decreased from outside to the inland TP (P. Chen et al., 2019) (Fig. 5). The highest TC, EC, and OC values were found over urban areas (e.g., Kathmandu: OC = 34.8 µg m−3, EC = 9.97 µg m−3; Mardan: OC = 44.7 µg m−3, EC = 11.7 µg m−3; Lanzhou: OC = 25.4 µg m−3, EC = 6.7 µg m−3), indicating the impact from increased anthropogenic emissions. The OC and EC concentrations at stations on the edge of the TP were much lower than those in cities (e.g., Lulang: OC = 4.86 µg m−3, EC = 0.7 µg m−3; Hunza: OC = 5.12 µg m−3, EC = 0.78 µg m−3; Laohugou: OC = 4.81 µg m−3, EC = 0.59 µg m−3) but higher than those in the inland TP regions (e.g., Ngari: OC = 1.82 µg m−3, EC = 031 µg m−3; Nam Co: OC = 1.63 µg m−3, EC = 0.13 µg m−3). Meanwhile, aerosol TC, EC, and OC concentrations revealed apparent seasonality (Fig. 5). Higher concentrations were observed over the South Asian stations (e.g., Lumbini located in the northern IGP and Kathmandu valley), particularly during the pre-monsoon season, due to regional-scale pollution plumes known as atmospheric brown clouds (Ramanathan et al., 2007a). However, different seasonal patterns were observed in the inland to northern TP. For example, at the Nam Co station, relatively high OC and EC concentrations occurred during the monsoon and post-monsoon. The regional differences in CA seasonal variations suggested differences in the pollutant sources and transport pathways. In Central Asia, the OC and EC concentrations demonstrated clear seasonal variations, with elevated concentrations observed during August to February (P. Chen et al., 2021). These results of different seasonal variations between southern and northern parts of the TP suggested differences in the patterns of pollutant sources and in distance from the sources between the regions (P. Chen et al., 2019). All of these measurements have provided the basis for understanding the spatio-temporal variations in carbonaceous particles over the vast Third Pole region, which was of great importance for scientific communities worldwide. Furthermore, these datasets were critical for further scientific studies in the future on the atmospheric environment across this sentinel region.
4.3 Mass absorption cross section (MAC) of aerosol EC and WSOC from atmospheric aerosols
The optical attenuation (ATN) can be calculated based on the transmittance signal with Eq. (4) (Cheng et al., 2011):
where Tinitial and Tfinal are the transmittance signal before and after the thermal-optical analysis, respectively. The ATN can be used to determine the absorption coefficient (babs) based on Eq. (5):
where A is the filter area (cm2), and V is the volume of air sampled (m3). Thus the MAC of EC (MACEC, m2 g−1) can be calculated as
where ECS (µg C m−2) is the filter loading of EC concentrations. As multiple-scattering effects occur associated with the filter-based measurement of absorption, they are corrected by an empirical factor of 3.6 (P. Chen et al., 2021) (Eq. 7):
The light absorption spectra of WSOC were measured between wavelengths of 200 to 800 nm with a precision of 5 nm bandwidth by a UV-visible spectrophotometer (SpectraMax M5). The value of MACWSOC can be calculated from Eq. (8) (Bosch et al., 2014; Kirillova et al., 2014):
where Ab (absorbance) is derived directly from the spectrophotometer, L is the absorbing path length, and C is WSOC concentration.

Figure 6Spatial distribution of mass absorption cross section of EC (MACEC) (annual average value) on the Tibetan Plateau. Modified from P. Chen et al. (2019).
The MACEC at 632 nm exhibited significant spatial variations, differing by a factor of up to 2 with a clear increasing trend from the outside to the inland TP (Fig. 6). For the studied stations, the annual MACEC ranged from 6.37 to 8.49 m2 g−1. Karachi had the lowest MACEC among the stations. Other stations, including Mardan and Lanzhou, exhibited a similar annual average MACBC of approximately 7.0 m2 g−1 during the sampling period. On the southern side of the TP, stations (e.g., Dhunche, Jomsom, Everest, Zhongba, Nyalam, Lulang) had moderate MACEC values, which were slightly higher than those at urban sites but lower than in the inland remote regions (e.g., Nam Co, Hunza, Ngari, and Beiluhe). In the northern TP, Laohugou demonstrated slightly lower MACEC, comparable to that in urban areas. The lower MACEC values in urban areas were mainly affected by local fresh emissions, while the relatively higher MACEC values at remote sites were mostly attributed to the coating enhancement of BC aerosols (P. Chen et al., 2019).
Aerosol MACWSOC was analyzed for 10 stations, including Kathmandu, Lumbini, Karachi, Jomsom, Lulang, Everest, Lhasa, Nam Co, Lanzhou, and Laohugou (Chen et al., 2020; Li et al., 2016b, c, 2021). Relatively higher MACWSOC was observed in Lumbini, which had an annual average value of 1.64 m2 g−1. Kathmandu, Lanzhou, and Laohugou had moderate values of approximately 1.30 m2 g−1. Jomsom and Karachi had relatively lower MACWSOC values of 0.97 and 0.87 m2 g−1, respectively. The MACWSOC values were generally higher in urban regions than those at remote stations, probably because of the larger primary and anthropogenic contribution for WSOC in urban areas in contrast to remote regions (Chen et al., 2020).
4.4 BC and WIOC from glaciers and snow cover
Before filtration, the frozen snow pit, surface snow, and snow cover samples were rapidly melted via a hot water bath (approximately 20 min for complete melting), and the meltwater (typically 0.5 to 1 L) was filtered through a pre-dried (in a desiccator at 550∘C for 6 h) weighted quartz filter (Whatman, with pore size of 2.2 µm) using a vacuum pump (Zhang et al., 2017a, 2018b; Zhong et al., 2019, 2021). Samples were filtered twice, and the filtration equipment was rinsed with ultrapure water twice (<18.2 mΩ) in order to prevent particle loss. The estimated total uncertainty in the particle concentrations was <1 % (including background counts and random counting errors).
After filtering the meltwater, the quartz filters were dried and weighed gravimetrically, then analyzed for BC and WIOC. Generally, the dust loads in the snow and ice samples were greater (approximately 2–3 orders of magnitude) than in the airborne aerosol samples. In order to eliminate the impact of dust, BC and WIOC were measured by a modified IMPROVE_A protocol by a DRI model thermal-optical carbon analyzer (Yang et al., 2015; Wang et al., 2012). Specifically, the method was modified such that only one temperature plateau (550 ∘C) was used in the 100 % helium atmosphere to reduce the time that the BC was exposed to the catalyzing atmosphere. The reported OC concentrations from the snow and ice samples accounted for only WIOC because most of the WSOC was not captured by the filter-based method. The detection limit of the analysis was 0.19±0.13 µg TC cm−2, and the filter blank was 1.23±0.38 µg TC cm−2, which was about 1 order of magnitude lower than the measured sample values (Zhang et al., 2017a).
The evaluated blank filters for total carbon were <1 µg cm−2. For the same filter, multiple measurements showed small relative standard deviations (RSDs; <10 %), indicating that the data points tended to be close to the mean value, an acceptable filtration. The duplicate snow samples demonstrated the similar concentrations of BC and WIOC. The evaluated impact of inorganic carbonates interfering with BC measurements showed that the carbonate acidification and analysis indicated acceptable data quality with a discrepancy <20 % (Zhang et al., 2017a).
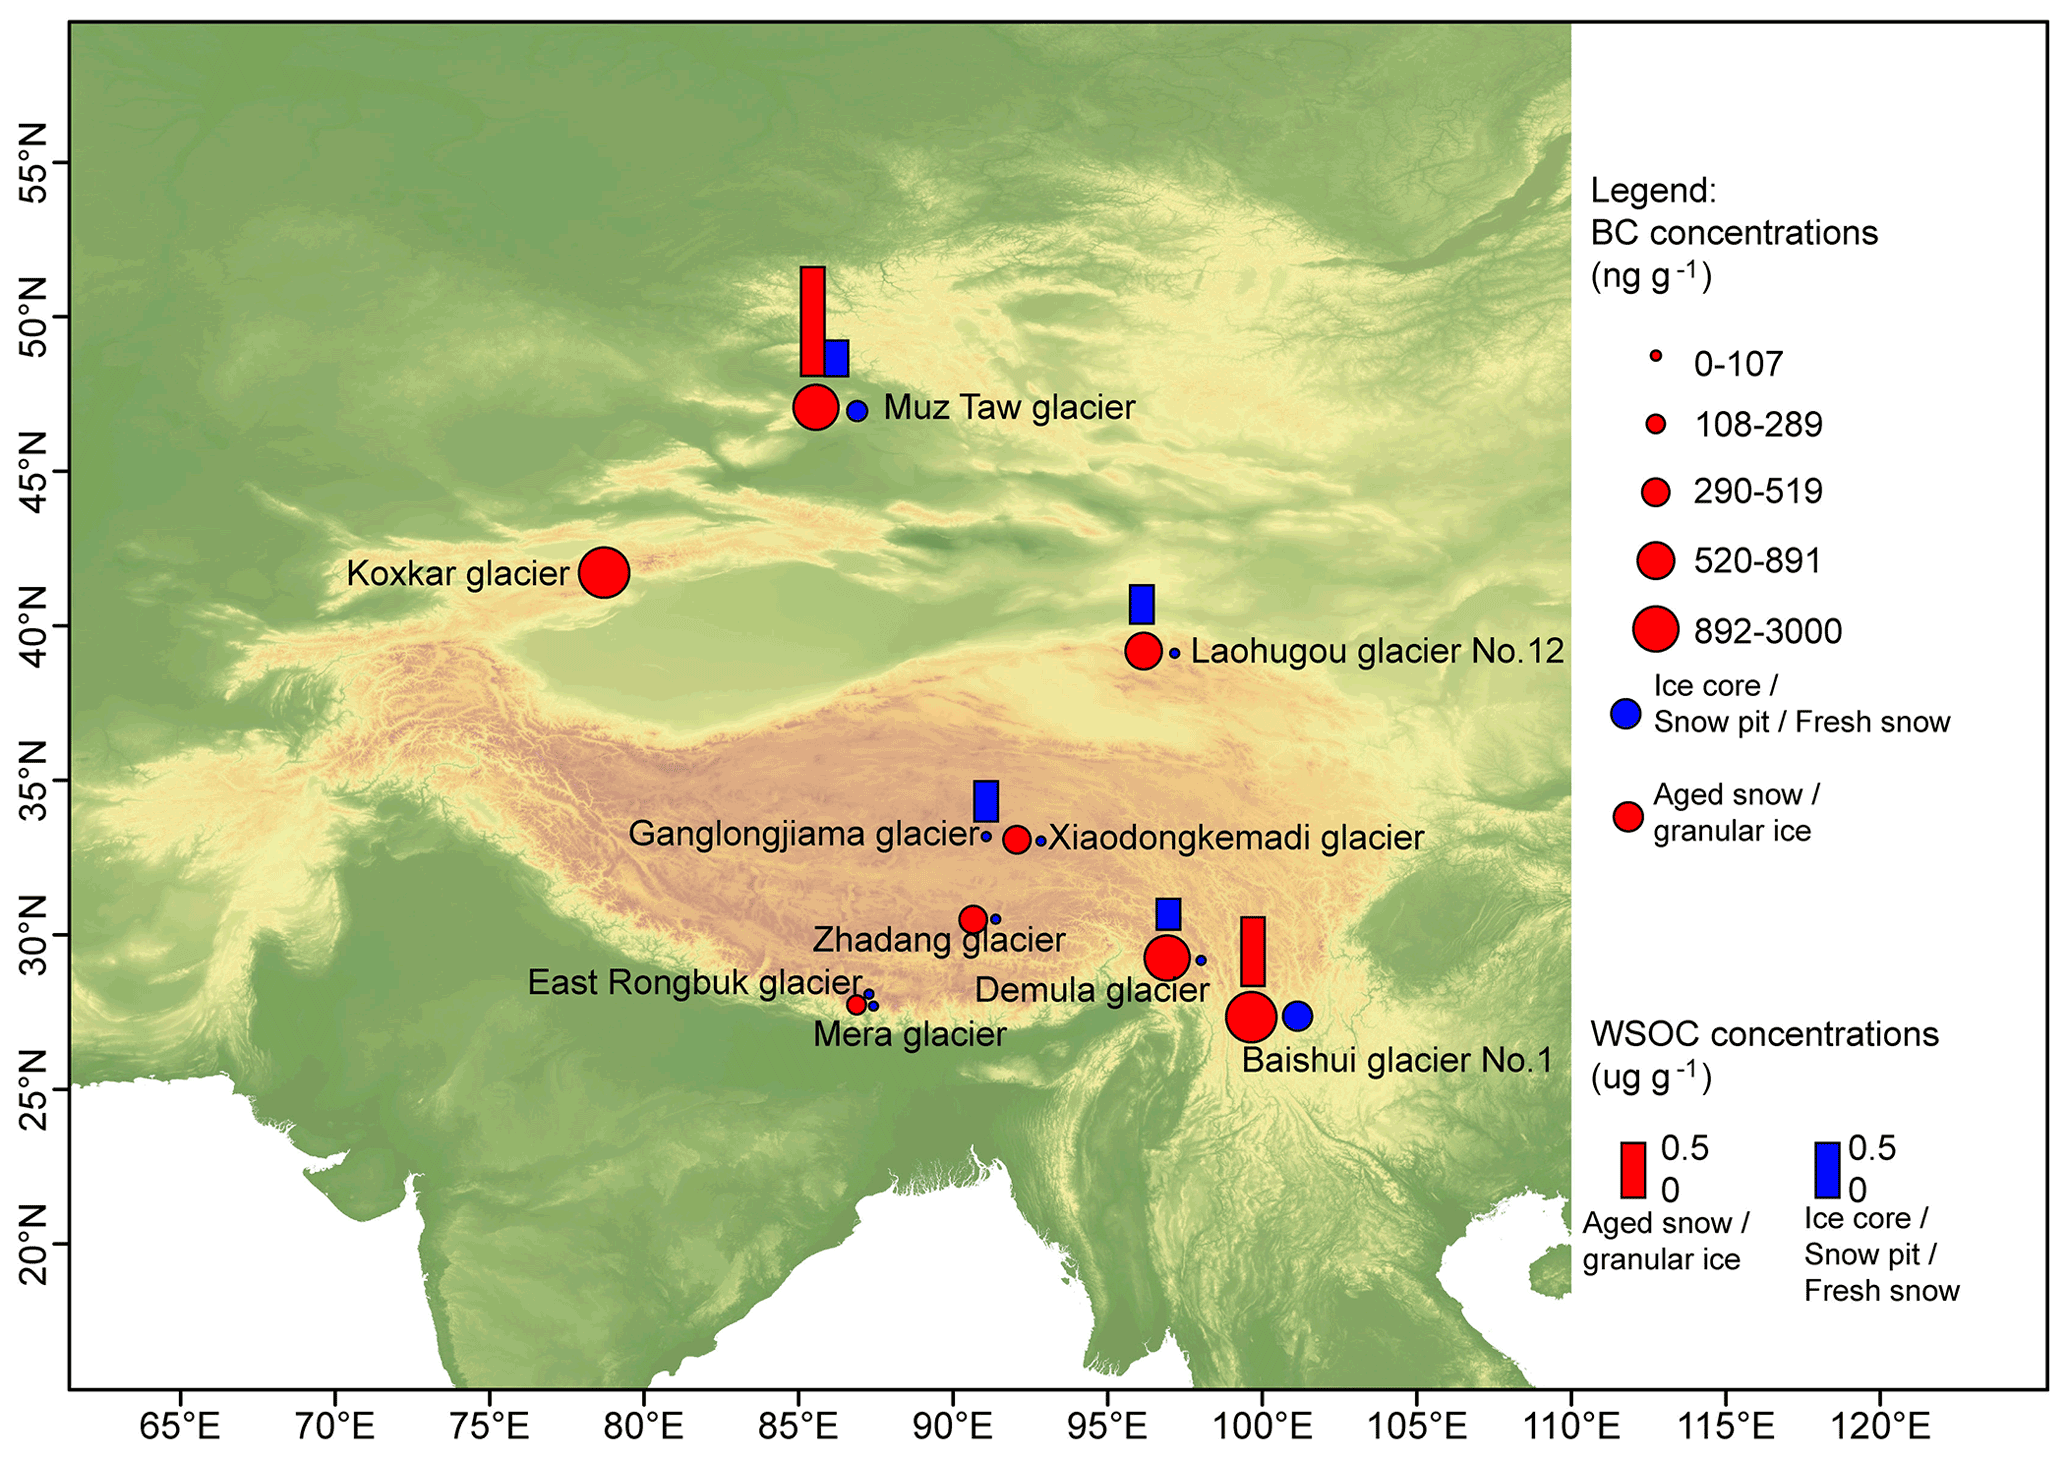
Figure 7BC and WSOC concentrations from studied glaciers distributed on the Tibetan Plateau and its surroundings.
According to the measurements, the average BC concentrations in glacier snow and ice ranged from several nanograms per gram to hundreds of nanograms per gram, with marked differences between the glaciers (APCC dataset I-2 and Fig. 7). In particular, BC concentrations in the aged snow and granular ice were usually much higher (1–2 orders of magnitude) than that in fresh snow, snow pits, and ice cores (Kang et al., 2020). Concentrations of BC and WIOC were higher in the central and northern TP than in the southern TP. There was large spatial variability in BC and WIOC in snow cover across the TP and northern Xinjiang. Concentrations of BC and WIOC in snow cover over the TP were 202–17 468 and 491–13 880 ng g−1, respectively. The values of BC and WIOC in snow cover across northern Xinjiang varied from 32 to 8841 and 77 to 8568 ng g−1, respectively. Greater BC and WIOC concentrations in snow cover appeared in the western areas (west of 83∘ E) than other areas in northern Xinjiang (Fig. 8). Vertical variations in monthly mean BC and WIOC concentrations in the snow pit profiles showed that the maximum monthly mean BC and WIOC concentrations generally appeared at the snow surface (302–6271 ng g−1 for BC and 780–17 877 ng g−1 for WIOC) (Fig. 9), suggesting that the magnitude of downward migration of BC and WIOC was much less than the enrichment in surface snow for snow cover.
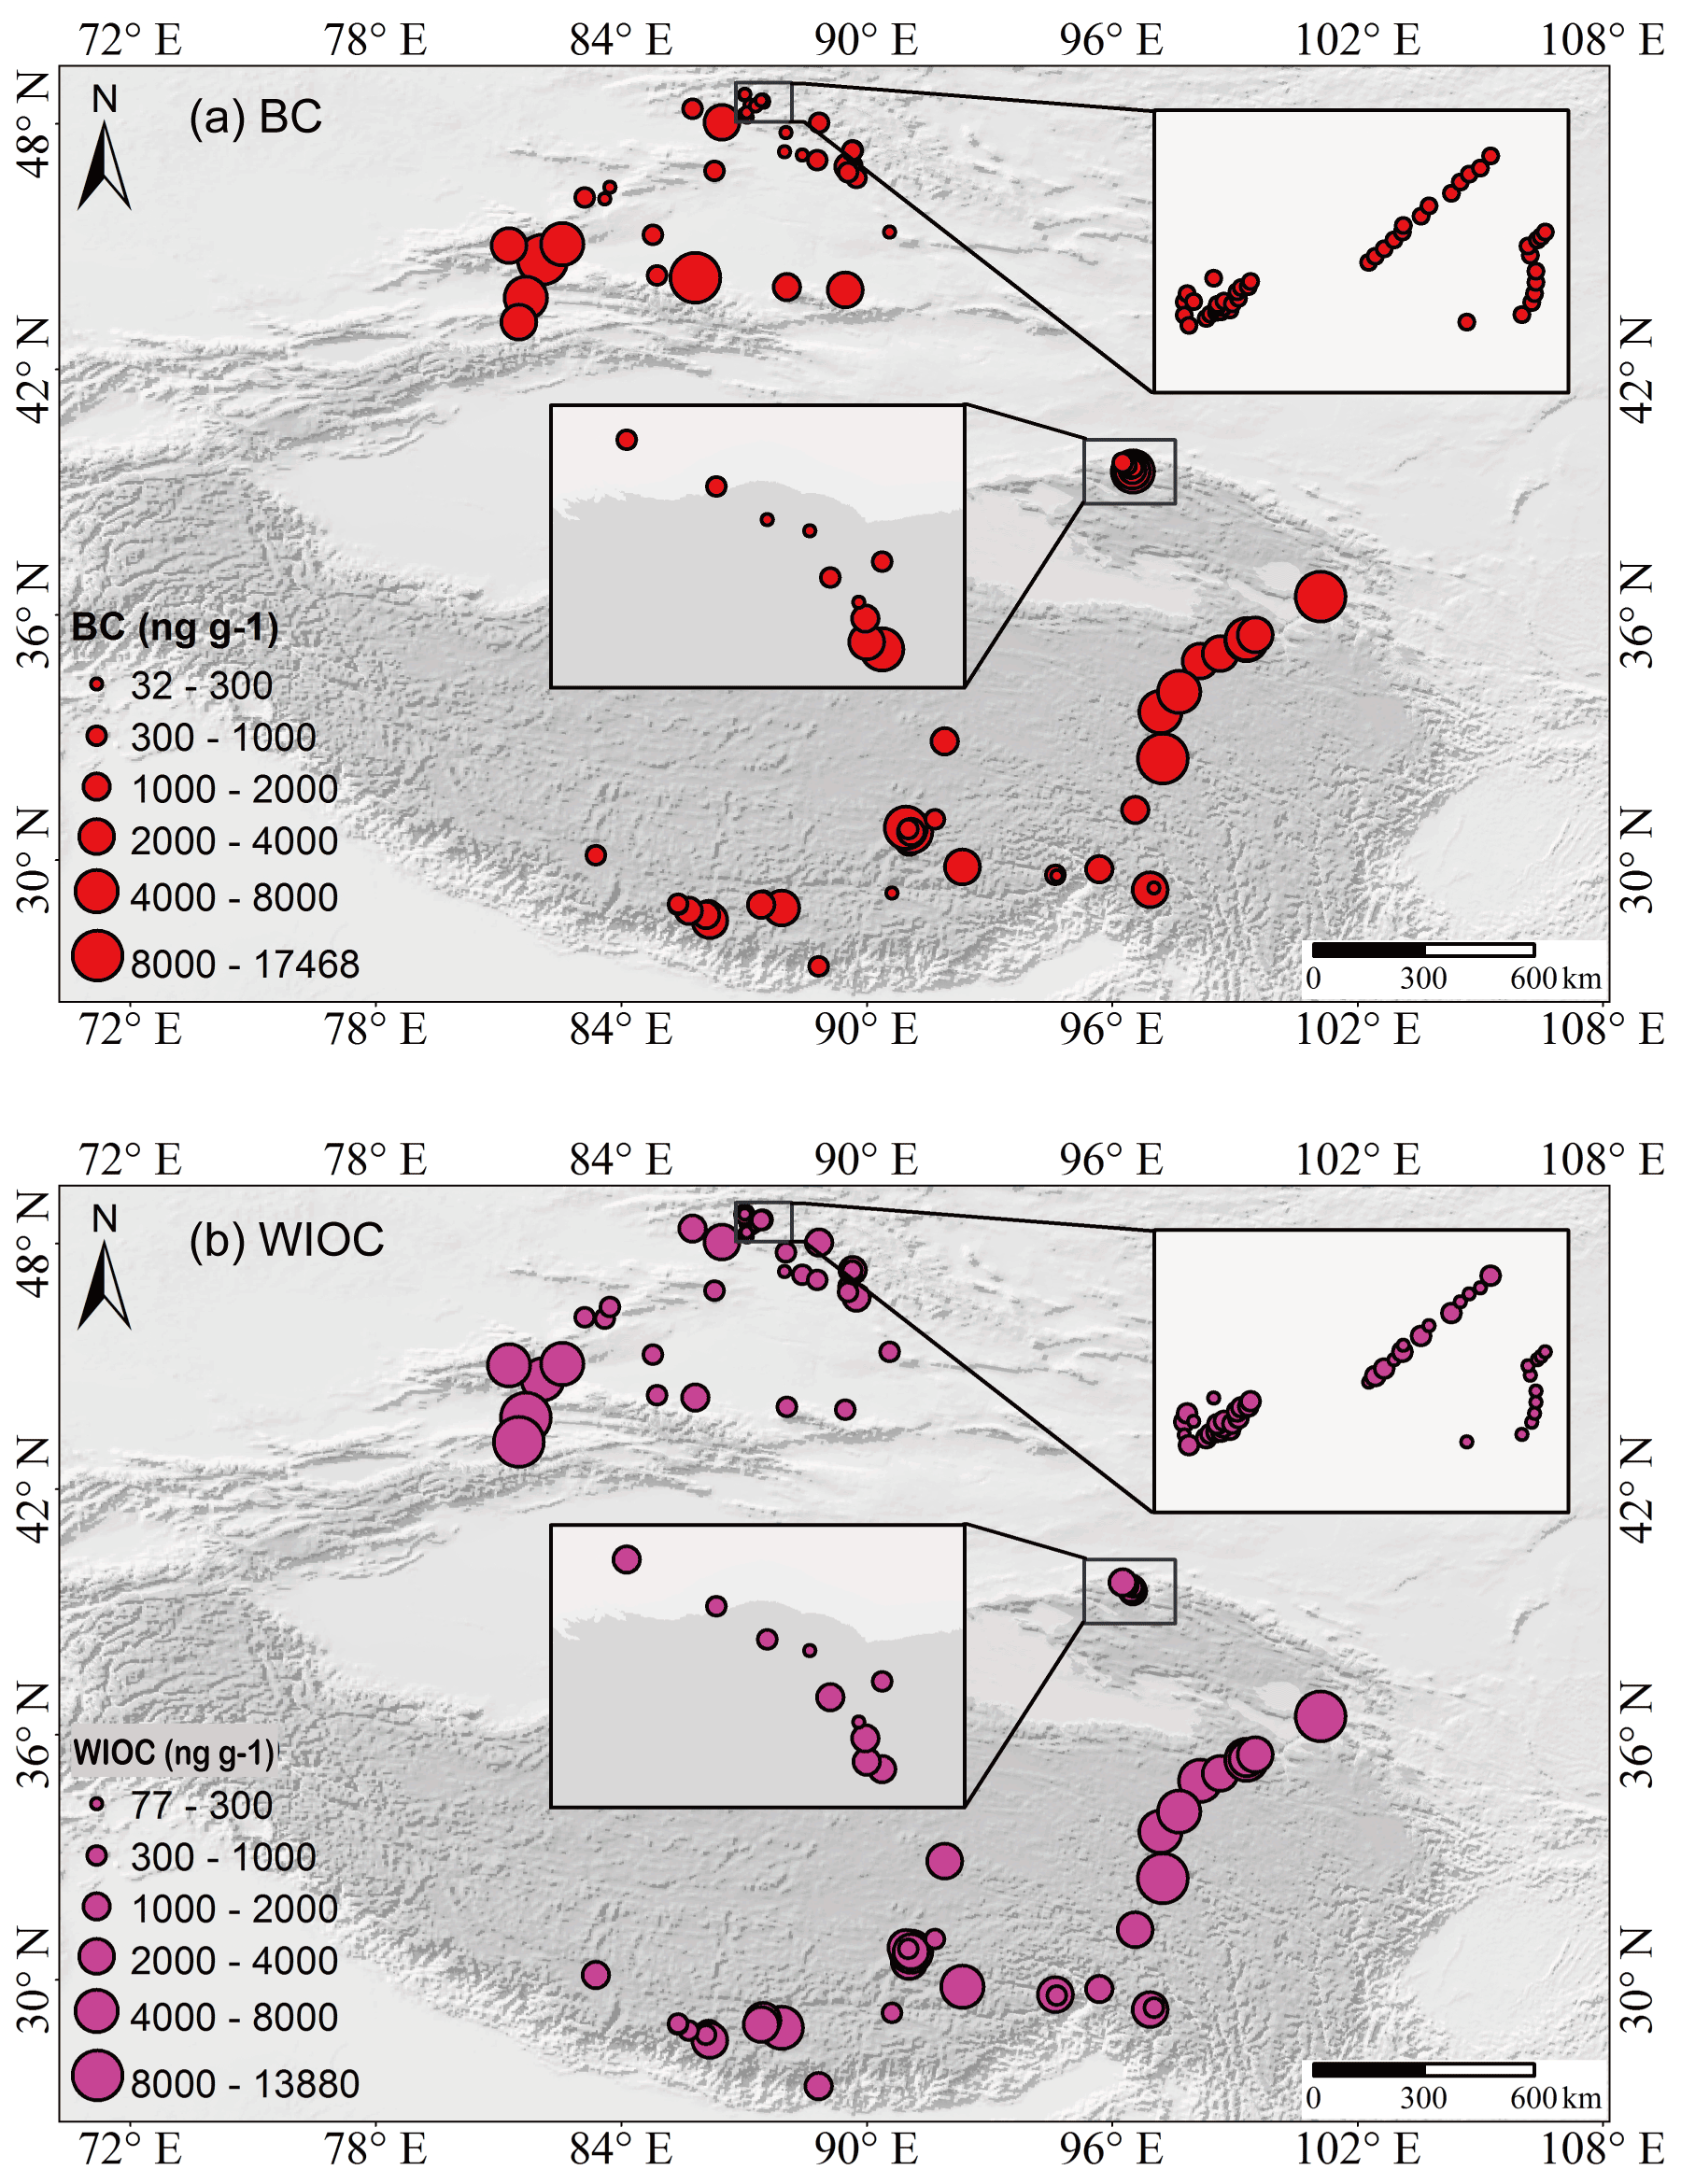
Figure 8Spatial distributions of (a) BC and (b) WIOC concentrations in snow cover for each sampling site across the Tibetan Plateau and northern Xinjiang. Data cited from Zhang et al. (2018a) and Zhong et al. (2019).
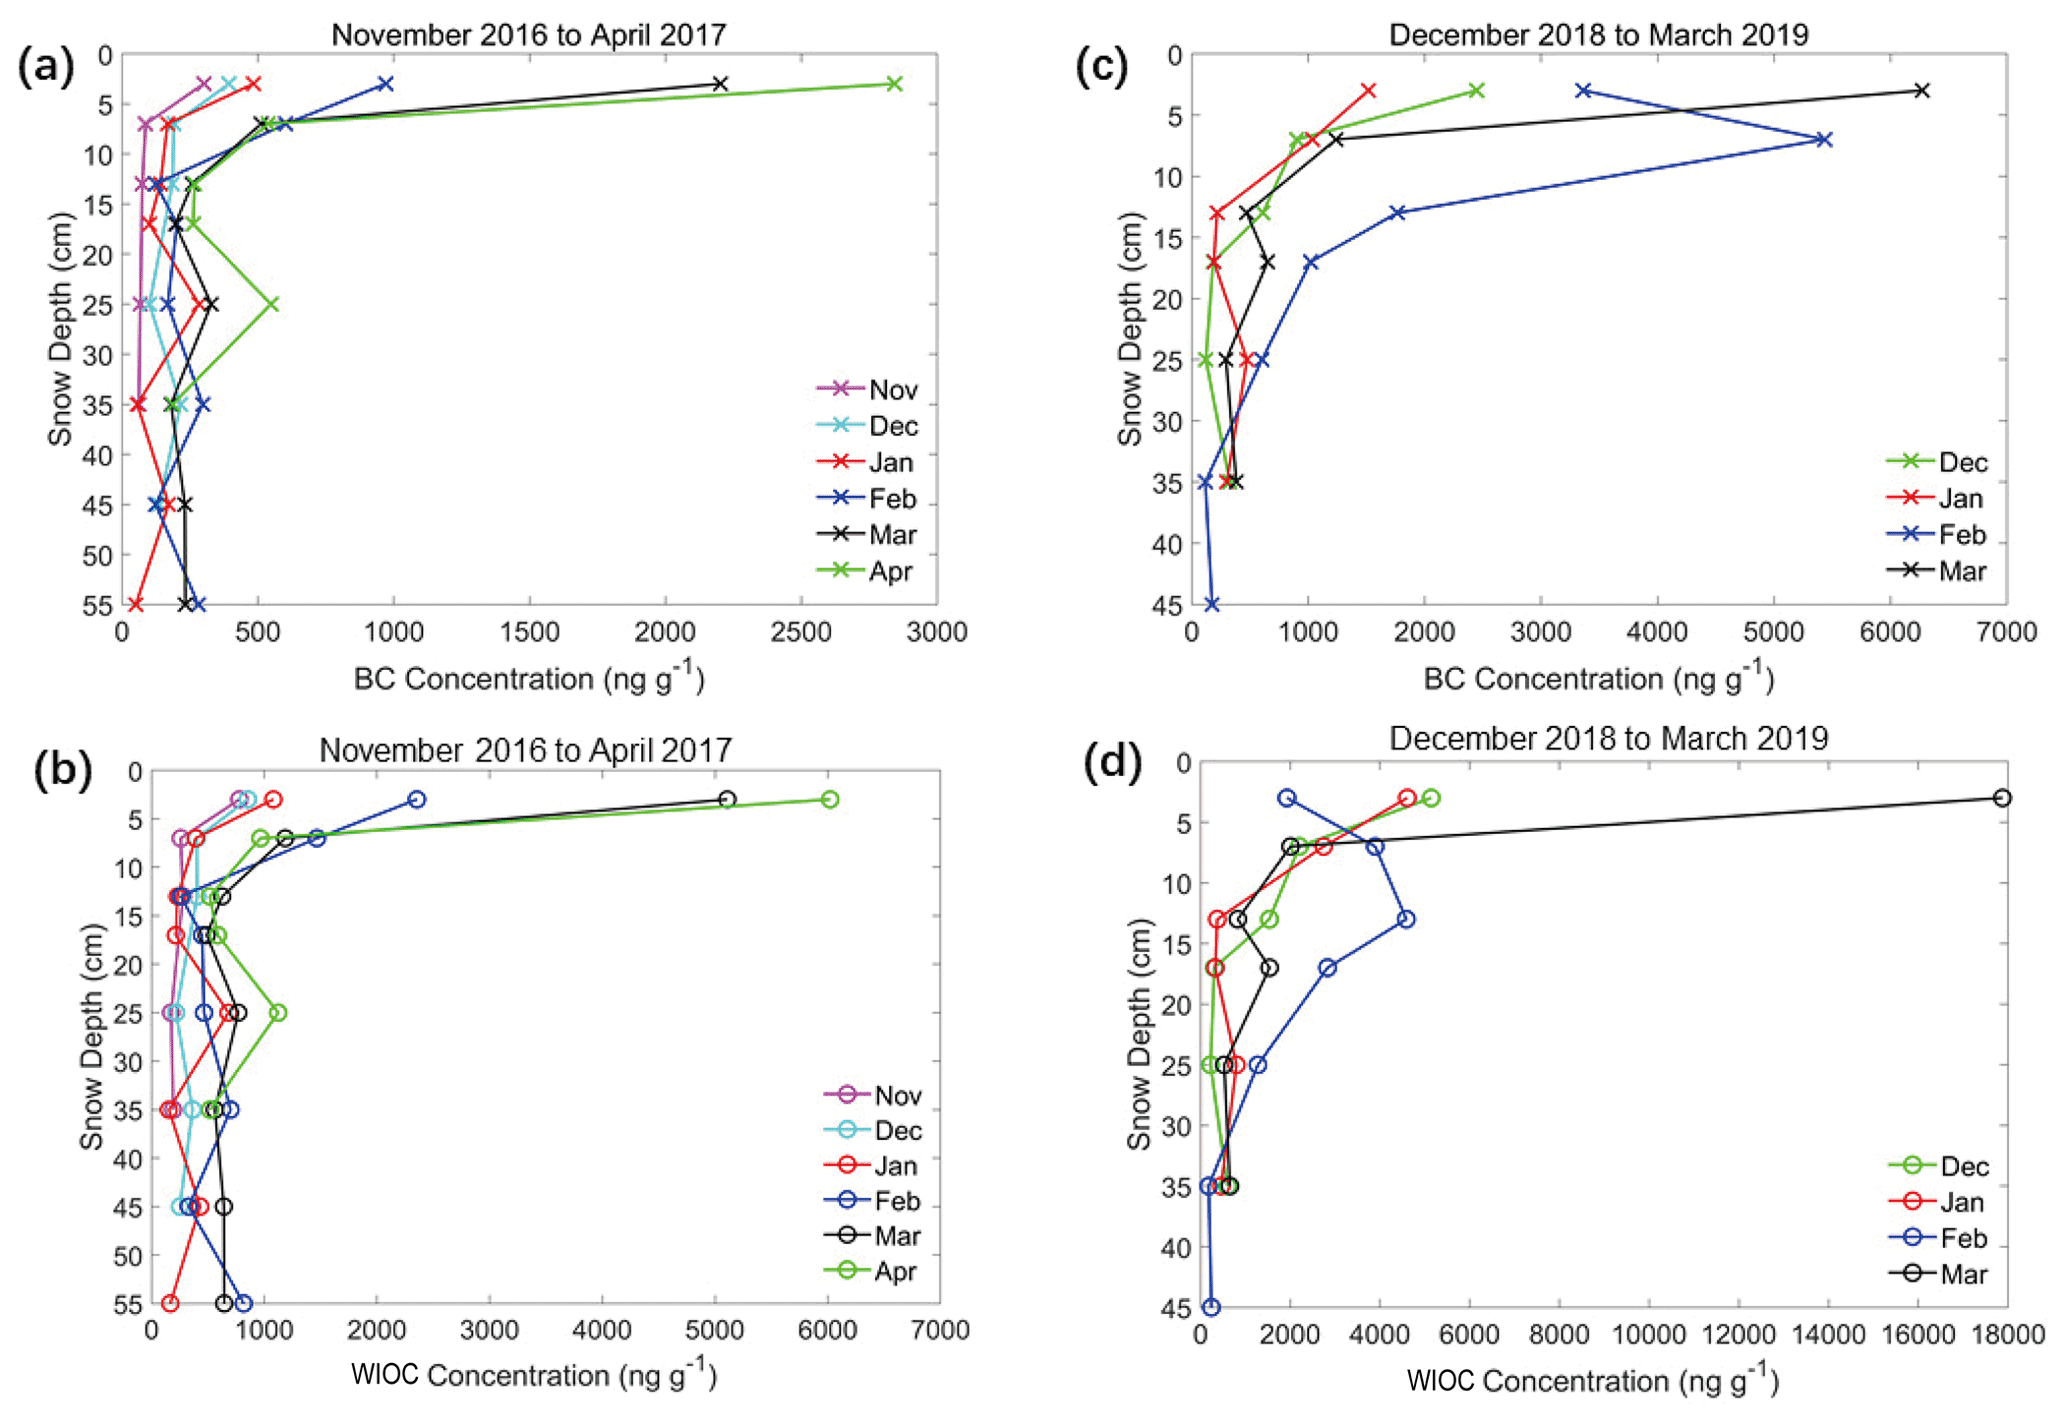
Figure 9Vertical variations in mean BC and WIOC concentrations in snow pits at Koktokay Snow Station during 2 snow years (modified from Zhong et al., 2019).
4.5 WSOC from glaciers and snow cover
Before the measurement, the melted snow and ice samples (collected using pre-cleaned 60 mL square-shaped polycarbonate bottles) were filtered through a 0.45 µm (pore size) PTFE membrane filter (Macherey–Nagel). WSOC concentrations were determined using a TOC-5000A analyzer (Shimadzu Corp, Kyoto, Japan) (Hu et al., 2021; Yan et al., 2016; Zhang et al., 2018a). The detection limit of the instrument, precision, and average WSOC concentration of the blanks were 0.015 mg L−1, ±5 %, and 0.025±0.006 mg L−1, respectively, demonstrating that contamination was minimal during the pre-treatment and analysis processing. WSOC concentrations from glacier samples were lower in the snow pit and fresh snow but higher in the aged snow or granular ice (Fig. 7). For the benchmark glaciers (Muz Taw glacier and Laohugou glacier no. 12), the spatial distribution of WSOC generally decreased with increasing elevation, indicating that more intense melting occurred in the lower-elevation ablation zones exposed to higher concentrations of WSOC (Gao et al., 2020; Hu et al., 2018).
The light absorption spectra of the WSOC were measured with a UV-visible spectrophotometer (SpectraMax M5, Molecular Devices, USA) between the wavelengths of 200 and 800 nm with an interval of 5 nm (Hu et al., 2017; Yan et al., 2016). Each spectrum was determined relative to that of Milli-Q water. The MAC values for WSOC in glaciers and snow cover samples were calculated by Eq. (8). The MACWSOC from snow pits of Laohugou glacier no. 12 and Ganglongjiama glacier (central TP) was 4.71±3.68 and 2.17±2.13 m2 g−1, respectively (Hu et al., 2018, 2020). MACWSOC from snow cover in the Altai Mountains was 0.45±0.35 m2 g−1, with higher values in March and April 2017; the fraction of radiative forcing caused by WSOC relative to BC accounted for approximately 10.5 %, indicating that WSOC was a non-negligible light-absorber in snow of the Chinese Altai region (Zhang et al., 2019). The calculated MACWSOC from Baishui glacier no. 1 at Mt. Yulong was 6.31±0.34 m2 g−1 (Niu et al., 2018b). The comparisons of MACWSOC from glaciers and snow cover revealed significant differences between regions (Fig. 10). Even for the same glacier (Baishui glacier no. 1), MACWSOC showed large variability from snow pits over different sampling periods (Niu et al., 2020).
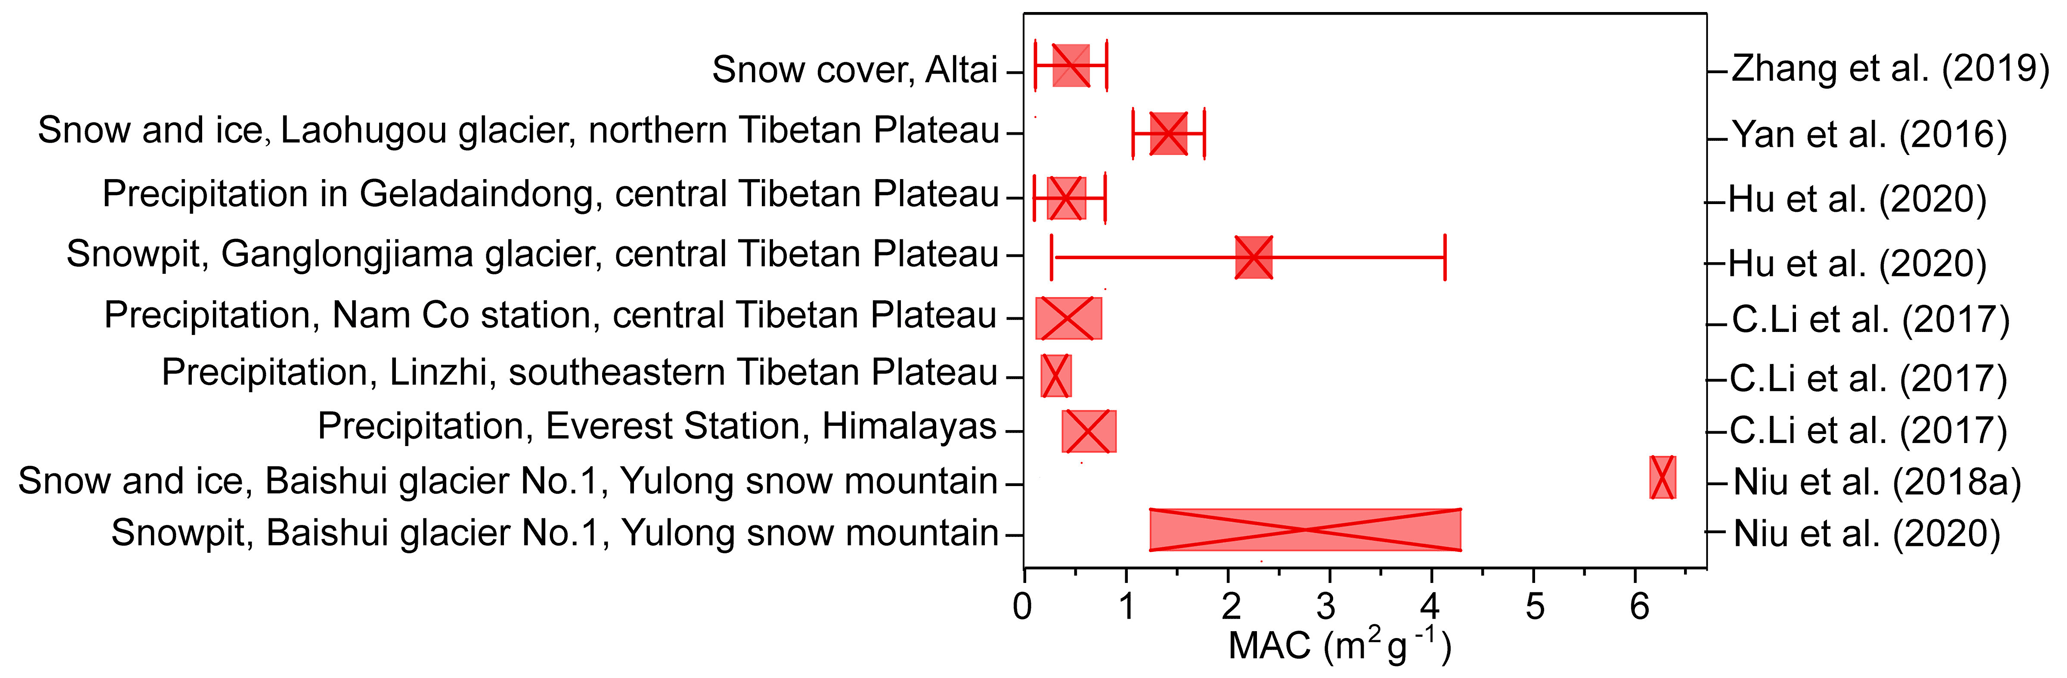
Figure 10Comparison of the mass absorption cross section (MAC) of WSOC in snow and ice and precipitation across the Tibetan Plateau and its surroundings.
4.6 WSOC from precipitation
The precipitation samples were also filtered through a PTFE membrane filter with 0.45 µm pore size (Macherey–Nagel) before the WSOC measurement. The Shimadzu TOC-5000 total organic carbon analyzer (Shimadzu Corp, Kyoto, Japan) was used to determine the precipitation WSOC concentration (Li et al., 2016d). The average blanks for precipitation WSOC were 0.08±0.05 µg C mL−1 (Gao et al., 2021b). The light absorption spectra of precipitation WSOC were measured by using the same method used for the glacier samples. The value of precipitation MACWSOC was calculated by Eq. (8).
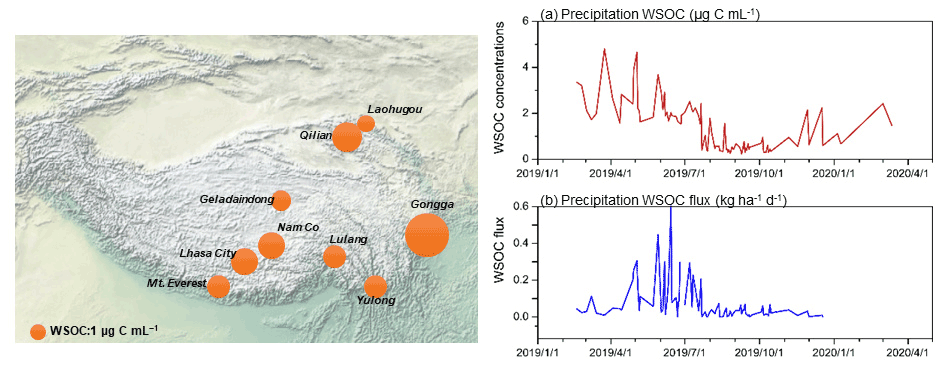
Figure 11Spatial distributions of precipitation WSOC on the Tibetan Plateau and its surroundings (left) and WSOC temporal variations in concentrations and flux from precipitation at the Qilian station in the northern Tibetan Plateau (right). (a) Precipitation WSOC concentrations and (b) precipitation WSOC flux (modified from Gao et al., 2021b).
Precipitation WSOC concentrations decreased from urban cities to remote stations, with marked seasonal variations (APCC dataset I-3 and Fig. 11) (Gao et al., 2021b; X. Li et al., 2017; C. Li et al., 2018a; Niu et al., 2019). The average precipitation WSOC concentration was 1.41 µg C mL−1 at the Qilian station of the northern TP, with WSOC flux of 6.42 kg ha−1 yr−1 (Gao et al., 2021b). For summer precipitation in the Mt. Yulong region in the southeastern TP, the average concentration of WSOC was 1.25 µg C mL−1 (Niu et al., 2019). The average precipitation WSOC concentration at Nam Co was 1.0 µg C mL−1; the estimation suggested that about 15 % of WSOC was fossil-derived (C. Li et al., 2018a). The MACWSOC values of precipitation samples were significantly lower than the aerosol samples (X. Li et al., 2017). For example, the precipitation MACWSOC only ranged from 0.26 to 1.84 m2 g−1 at the Qilian station, suggesting the potential impact of WSOC on climatic forcing in the area. Seasonally, MACWSOC of both aerosol and precipitation samples showed high values in winter and low values in summer (Gao et al., 2021b; Li et al., 2021).
4.7 Carbon isotopes from glacier snow pits and atmospheric aerosols
The dual-carbon-isotope signatures (Δ14C and δ13C) are effective ways to distinguish and track the different sources of carbon aerosols (Gustafsson et al., 2009). In this paper, BC mass contents of the filtered glacier snow pit and atmospheric aerosol (TSP) samples were quantified using the TOR technique. Briefly, filters were acidified by fumigation in open glass Petri dishes held in a desiccator with >37 % HCl acid for 24 h to remove carbonates and were subsequently dried at 60 ∘C for 1 h to remove remaining HCl acid. A 1.5 cm2 punched acid-treated filter was analyzed using a carbon analyzer (Sunset Laboratory, Tigard, OR) following the National Institute for Occupational Safety and Health (NIOSH) method 5040 to determine BC and OC concentrations of the aerosol samples and the WIOC concentrations of the particles from the collected snow samples. Sucrose standard and other reference materials were also subjected to these measurements (Li et al., 2016a). The filter area required for the subsequent 14C measurements was determined based on the measured BC concentration. The CO2 produced was cryotrapped during the BC combustion phase after removing the water and sulfur-containing gases online. Purified CO2 was then transferred in flame-sealed glass ampules to the United States National Science Foundation (US-NSF) National Ocean Science Accelerator Mass Spectrometry (NOSAMS) facility at the Woods Hole Oceanographic Institution (Woods Hole, MA, USA). For precipitation and snow samples containing more than 60 µg C (WSOC), the sample was poured into pre-cleaned quartz tubes, acidified to pH 2 with phosphoric acid, and sparged with ultrahigh-purity helium to remove inorganic carbon. Next, the sample was irradiated using a high-energy UV lamp for 5 h to quantitatively oxidize WSOC to CO2. Concentrations of WSOC were determined using a calibrated Baratron absolute pressure gauge (MKS Industries). WSOC concentrations determined by this method agreed well with those determined using the Shimadzu TOC analyzer (Raymond et al., 2007). CO2 was cryogenically purified by liquid nitrogen on a vacuum extraction line and sent to NOSAMS at Woods Hole for isotopic analysis.

Figure 12BC carbon and WSOC isotopes from snow pit samples in the studied glaciers across the Himalayas and the Tibetan Plateau. Modified from Li et al. (2016a) Tanggula means the Xiaodongkemadi glacier, and M indicates the snow pit samples collected in monsoon season.
Fossil fuel contribution to BC in both aerosol and snow pit samples decreased from the outer TP (i.e., South Asia and western China) to the inland TP (APCC dataset I-4 and Fig. 12) (Li et al., 2016a). For the Himalayan region (Thorung glacier, East Rongbuk glacier, Qiangyong glacier), equal contributions from fossil fuel (46±11 %) and biomass (54±11 %) combustion were found, consistent with BC source fingerprints from the IGP region (Dasari et al., 2020). BC in the remote northern TP (Laohugou glacier no. 12) predominantly derived from fossil fuel combustion (66±16 %), consistent with Chinese sources. The fossil fuel contributions to BC in the inland TP (Xiaodongkemadi glacier, Zhadang glacier) were lower (30±10 %), implying contributions from internal Tibetan sources (for example, yak dung combustion). A similar phenomenon was observed for WSOC in snow pits, which revealed lower fossil fuel contributions in the inner TP. The results suggested that pollutants transported from South Asia influenced the BC and WSOC concentrations over the southern part of the TP. Meanwhile, Chinese emissions influenced the northern TP, and local emissions influenced the inland TP.
4.8 rBC data from ice cores
In the laboratory, the drilled ice core sections were cut longitudinally into halves, which were sectioned using a modified band saw (stainless-steel blades, table tops and saw guides covered with Teflon) cleaned with ethyl alcohol and ultrapure water (18.2 MΩ). One half-section of the core was cut into 3–5 cm segments. For the East Rongbuk ice core, a total of 663 samples were collected for rBC analysis (Kaspari et al., 2011). For Geladaindong ice core, a total of 3585 samples were collected for rBC analyses (Jenkins et al., 2016). To eliminate possible contamination from sampling, drilling, or storage, the outer portion of each ice sample was scraped using a ceramic knife in a clean and low-temperature room (−8 ∘C). Polypropylene clean-room suits and non-powder vinyl clean-room gloves were worn throughout the sampling process to minimize potential contamination (Kang et al., 2007). After the outer section of the ice was removed, the samples were put into Whirl-Pak bags and melted at room temperature, and the meltwater was poured into high-density polyethylene vials for the subsequent experiments. The samples were stored as liquid until analysis (Jenkins et al., 2016).
The rBC records from ice cores were analyzed by using the single-particle soot photometer (SP2; Droplet Measurement Technologies), an important analytical technique applied to Arctic ice cores (McConnell et al., 2007). The SP2 uses laser-induced incandescence to measure the rBC mass in individual particles quantitatively and independent of particle morphology and coatings with light-scattering material, with a detection limit of 0.3 fg/particle (Schwarz et al., 2012). Coupled to a nebulizer, the SP2 can be used to measure rBC particles in liquid-phase samples (Lim et al., 2014; Schwarz et al., 2013). The high sensitivity and small required sample volume enabled ice cores to be analyzed at much higher resolution than thermal-optical methods. Generally, rBC concentrations from ice cores are likely to be systematically underestimated due to the nebulization efficiency. The nebulization efficiency is size-dependent, with large (>500 nm) and small (<200–250 nm) BC particles nebulized with lower efficiency than mid-sized particles (Wendl et al., 2014; Schwarz et al., 2012). Besides, ice core samples were stored in the liquid phase after melting, and prior findings indicate that storage in the liquid phase can result in as great as 80 % reduction in measured BC concentrations (Wendl et al., 2014; Kaspari et al., 2014). Nevertheless, because we focus on the temporal variation in rBC from ice cores for the historical records rather than on absolute concentrations, the systematic underestimation of rBC does not affect the historical changes.
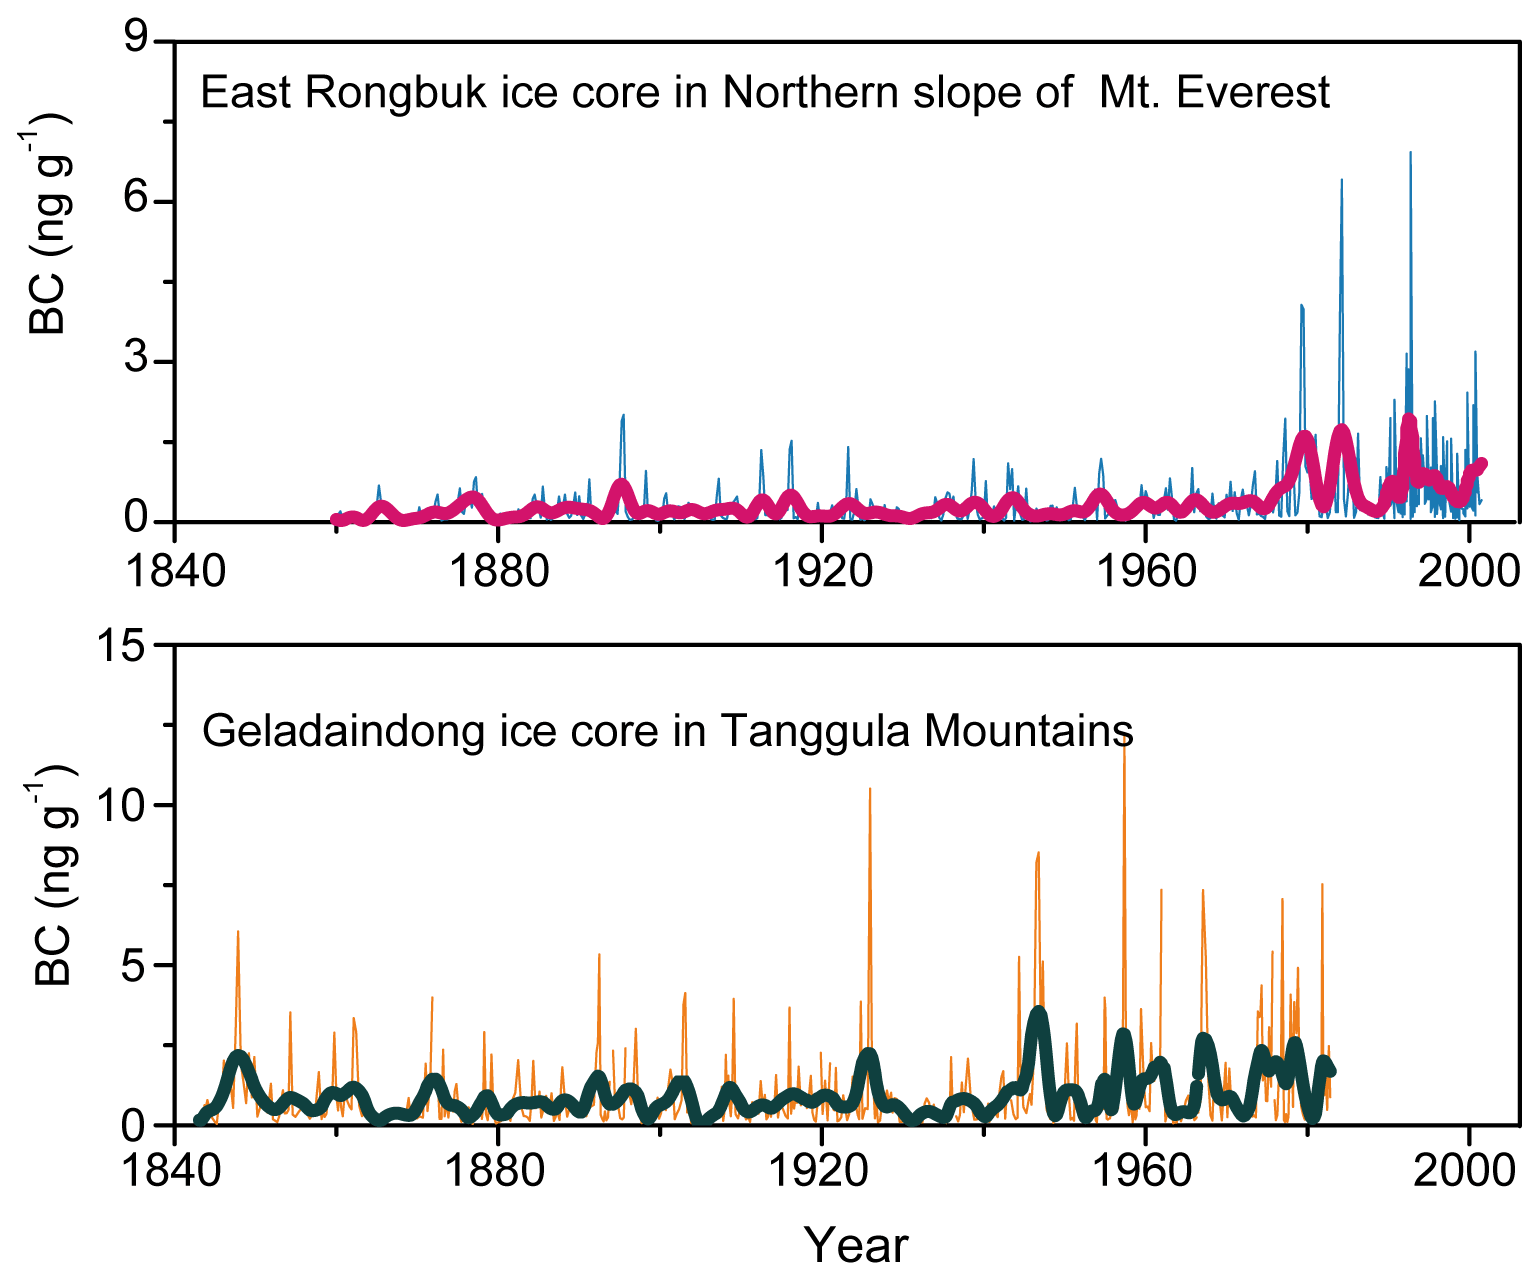
Figure 13Historical BC concentration records retrieved from ice cores over the Himalayas and the Tibetan Plateau. East Rongbuk ice core data from the northern slope of Mt. Everest in the Himalayas (Kaspari et al., 2011) and Geladaindong ice core data from the Tanggula Mountains of the central Tibetan Plateau (Jenkins et al., 2016).
Historical records from the East Rongbuk ice core showed that rBC concentrations have increased approximately 3-fold from 1975–2000 relative to 1860–1975 (APCC dataset I-5 and Fig. 13), inferring that anthropogenic BC can be transported to high-elevation regions of the Himalayas (Kaspari et al., 2011). The Geladaindong ice core provided the first long-term rBC records in the central TP spanning 1843–1982; after the 1940s, the rBC record was also characterized by an increasing trend (Fig. 13). Such an increase in rBC concentrations over the recent decades was likely attributed to the increased combustion emissions from regional BC sources, and a reduction in snow accumulation (Jenkins et al., 2016).
4.9 BC data from lake sediment cores
The freeze-dried lake sediment core samples were ground into powder with a size <0.074 mm using an agate mortar, and approximately 0.10–0.15 g of sample was transferred into a 50 mL centrifuge tube. In order to remove carbonates, silicates, and metal oxides, the sediment samples were acid-treated with 10 mL of HCl (2 N) and left for 24 h at room temperature. The supernatants were removed and rinsed with ultrapure water. Then, 15 mL of the mixture of HCl (6 N) and HF (48 % ) with a ratio of 1:2 () was added to the residue for further digestion for 24 h at room temperature and subsequently rinsed thoroughly with ultrapure water. The residue was treated with HCl (4 N) at 60 ∘C overnight to get rid of fluoride that may have formed, which was then centrifuged to remove the supernatant liquid. The residue was rinsed with pure water until the pH of the eluent became neutral. Finally, the residual solid was diluted with 200 mL of ultrapure water and filtered through a 47 mm quartz fiber filter, ensuring even distribution on the filter surface, which was then analyzed for BC abundances (Cong et al., 2013).
Generally, the IMPROVE-A protocol with TOR has been used for determination of BC concentrations in lake sediments (Neupane et al., 2019). The repeated measurement of BC in a few lake sediments (n=5) was to ensure reproducibility of measurements, which were reported with a relative percentage deviation better than 8 %. Standard reference material (marine sediments, NIST SRM-1941b) was also analyzed to assess the accuracy of measurements. It indicated an average accuracy of 5.5 % for the measurements of BC in lake sediments.
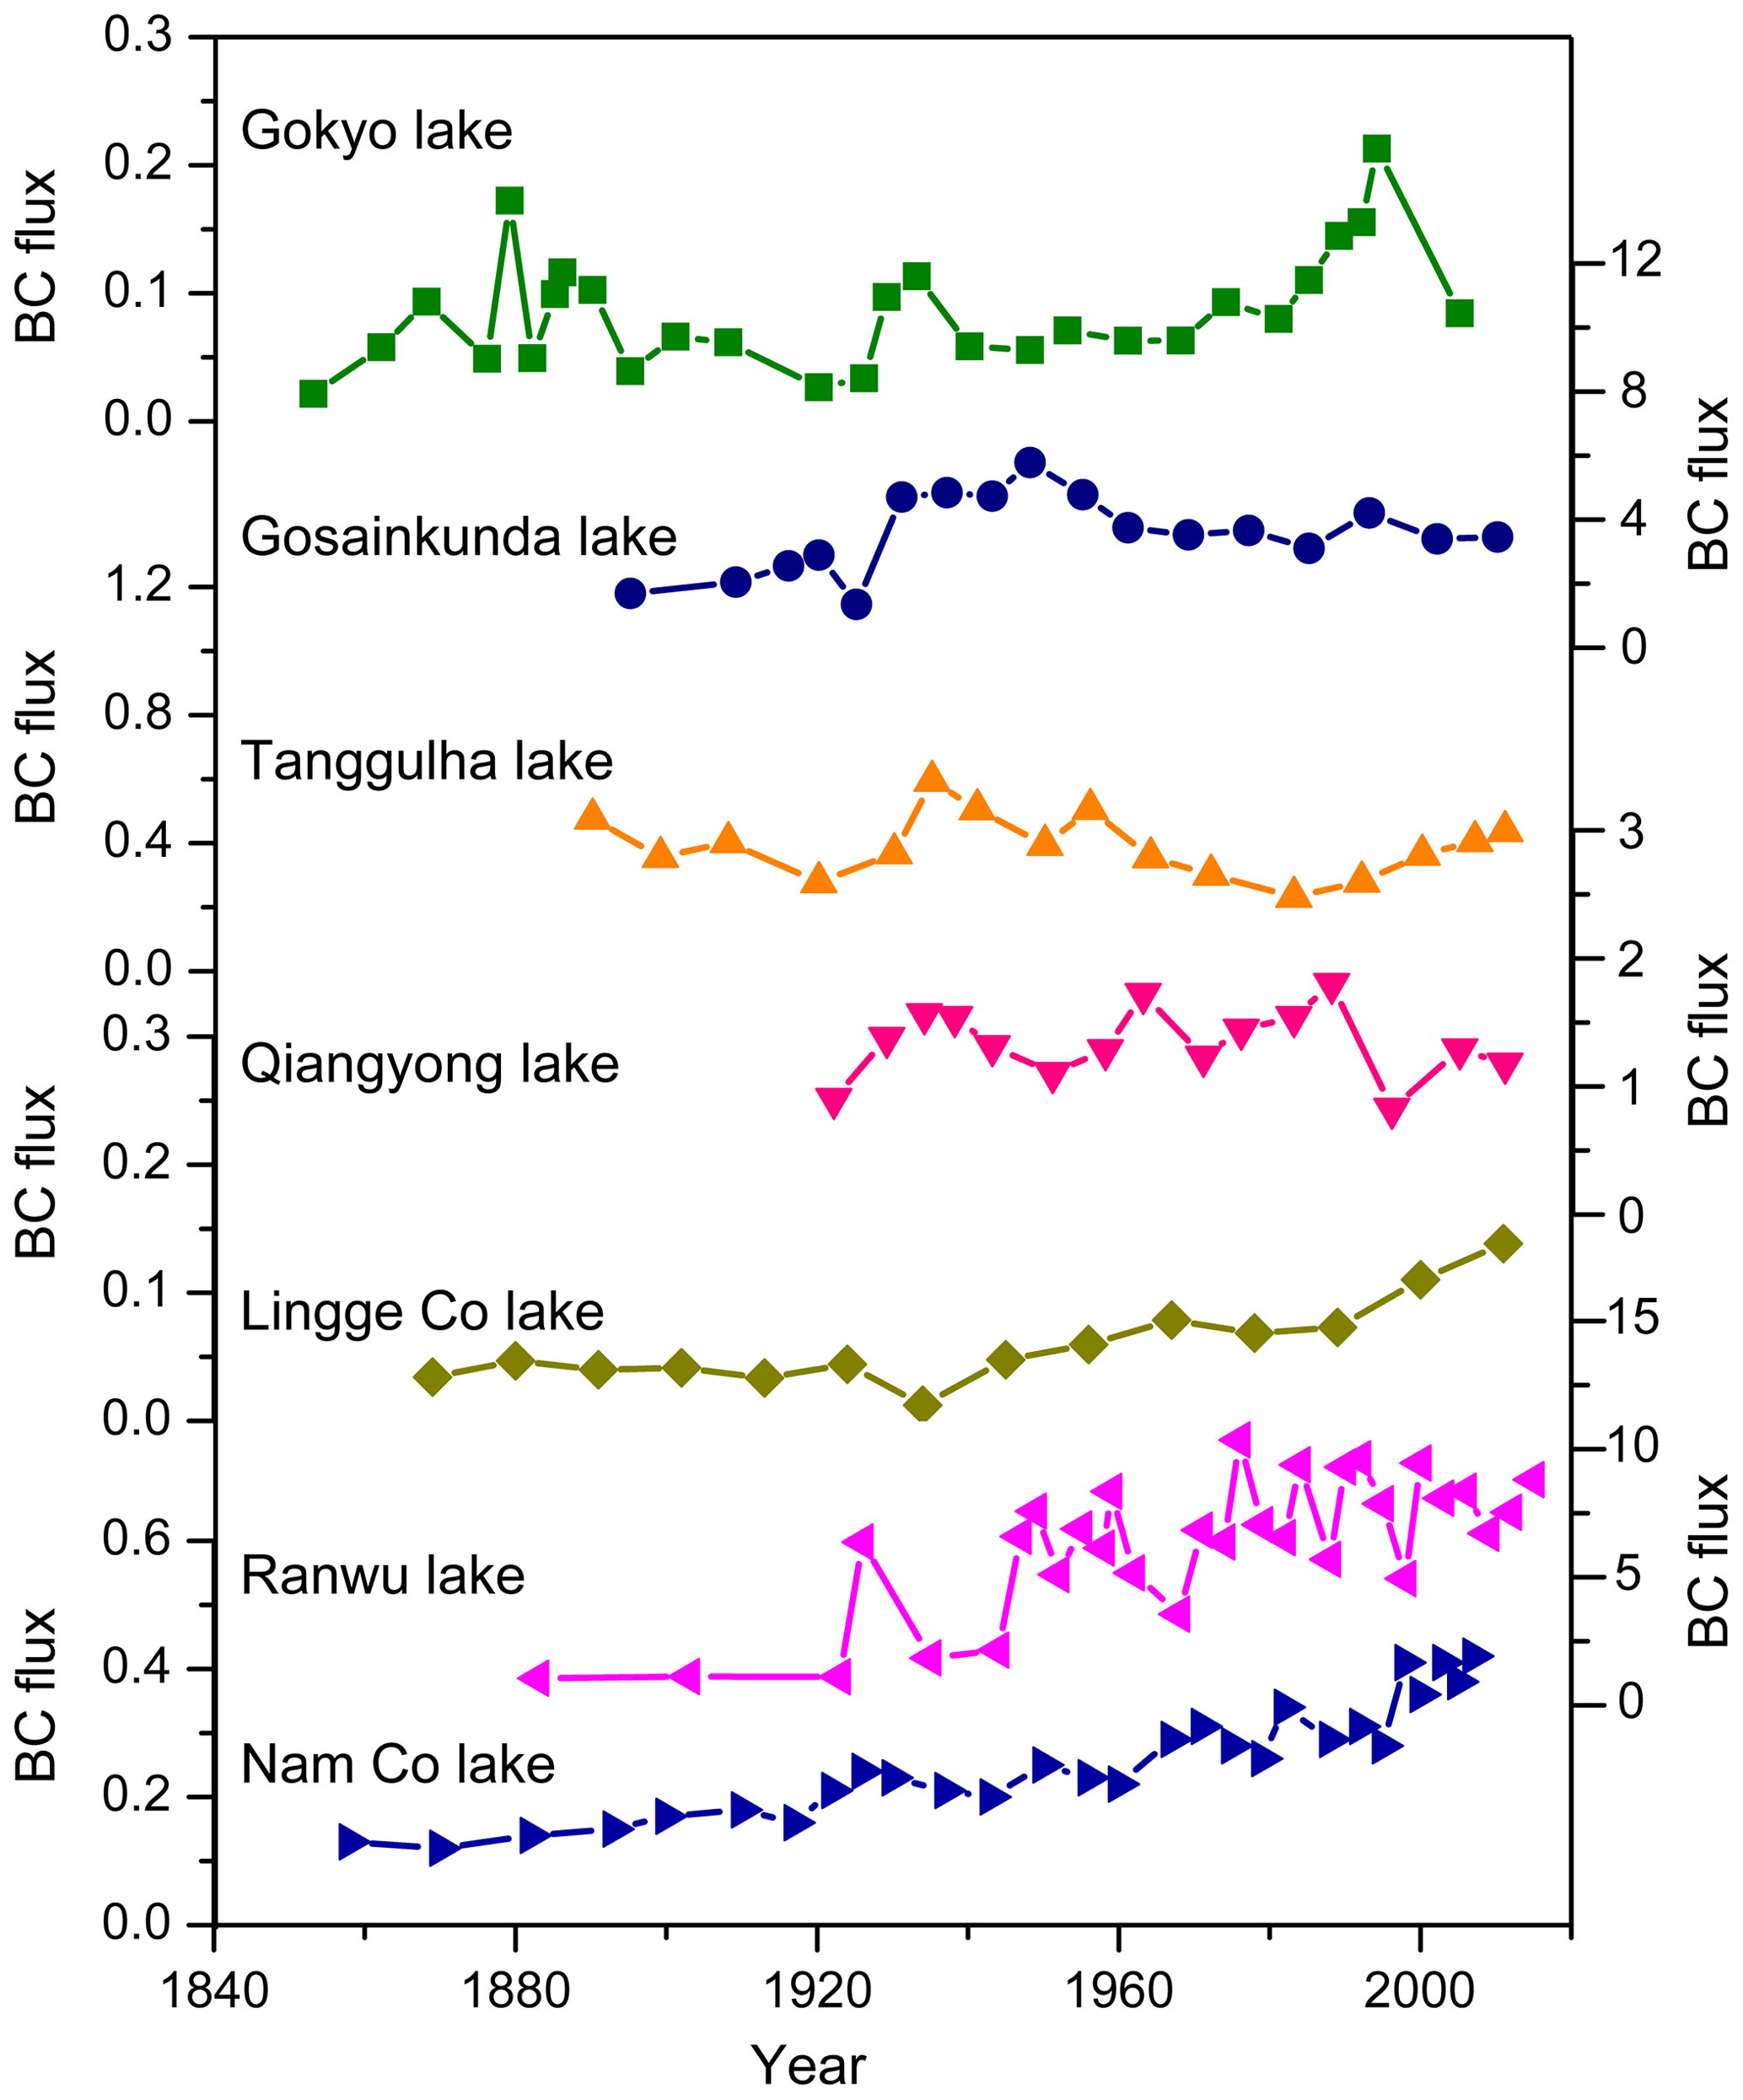
Figure 14Historical BC flux (g m−2 yr−1) retrieved from lake sediment cores across the Third Pole. Nam Co lake sediment core data were cited from Cong et al. (2013); other lake sediment core data were cited from Neupane et al. (2019).
The BC flux (g m−2 yr−1) of the lake sediment cores was calculated by multiplying the BC concentration (mg g−1) with the quotient of the total weight of the sample (dry weight per layer) and area of the gravity corer (6 cm inner diameter polycarbonate tube; area ) as well as the deposition time (e.g., the time difference between the two consecutive deposition layers):
Historical BC records from the lake sediment cores showed an increasing trend of BC concurrent with increased anthropogenic emissions since the 1950s (APCC dataset I-5 and Fig. 14). The relatively constant trend of BC before the 1950s could be attributed to the background level with minimal inputs from anthropogenic activity (Cong et al., 2013; Neupane et al., 2019). Previous studies pointed out that the deposition of BC in lake sediment cores was mainly related to river transport from the lake basin as a result of climate change (e.g., increases in temperature and precipitation) (C. Li et al., 2017a). The much higher BC flux in recent decades may also be caused by increases in direct atmospheric deposition in addition to riverine input.
All the BC, OC, WIOC, WSOC, MAC values of BC and WSOC, and BC isotope datasets presented in this paper have been released and are available to download from the National Cryosphere Desert Data Center, Chinese Academy of Sciences at Lanzhou (Kang and Zhang, 2021; https://doi.org/10.12072/ncdc.NIEER.db0114.2021).
A specific directory was designated with data classified into different categories:
-
aerosol BC and OC abundances and their MAC data (APCC dataset I-1);
-
glacier and snow cover BC, WIOC, and WSOC data and MAC values of WSOC (APCC dataset I-2);
-
carbon isotope data from snow pits and aerosol (APCC dataset I-3);
-
precipitation WSOC and BC data and MAC values of WSOC (APCC dataset I-4); and
-
BC data from ice cores and lake sediment cores (APCC dataset I-5).
In each dataset, a short summary is also provided. Auxiliary data including site descriptions (e.g., locations), observation contents, and measurements are presented.
The dataset of BC and OC concentrations and their related MAC values and carbon isotope signatures from the atmosphere, glaciers, snow cover, precipitation, and lake sediment cores based on the APCC program over the Third Pole is presented in this paper. These data are a collaborative effort aimed to address multiple scientific issues, including (1) characterizing the carbonaceous components and depicting their spatial and temporal variations over the TP and its surrounding region, (2) identifying the carbon aerosol sources and investigating the mechanisms of long-range transport, and (3) constraining the role of carbon components in the glacier and snow cover melting. Our continuous efforts based on the current APCC program are the in-depth investigations of the origins and distributions of atmospheric pollutants and their impacts and response to cryospheric changes over the Third Pole region. Moreover, this paper presents the long-term spatial analysis of carbonaceous particles from multi-environmental samples (atmosphere, glacier, lake sediments, etc.) over the Third Pole. The data from this work are also significant for understanding the negative consequences of pollution on the environment of remote regions and pave the way for future perspectives and protection strategies.
| TP | Tibetan Plateau |
| BC | Black carbon (referred to as a general concept; also equivalent to elemental carbon (EC) for the samples of aerosols, lake sediment cores, and glacier surface snow and snow pits; detected by the thermal-optical method using a modified protocol) |
| EC | Elemental carbon (aerosol samples measured by the thermal-optical method using the standard IMPROVE_A protocol) |
| eBC | Equivalent black carbon, measured by a real-time optical instrument (Aethalometer model AE-33) |
| rBC | Refractory black carbon (detected by the single-particle soot photometer, SP2) |
| OC | Organic carbon (referred to as total organic carbon from the filtered aerosol samples detected by the thermal-optical method) |
| WSOC | Water-soluble organic carbon (referred to as dissolved organic carbon in the samples of glacier, snow cover, and precipitation; also referred to as the water-soluble portion of OC from filtered aerosol samples; detected by a total organic carbon analyzer) |
| WIOC | Water-insoluble organic carbon (referred to as insoluble organic carbon from the filtered glacier, snow cover, and precipitation samples; detected by the thermal-optical method) |
| MAC | Mass absorption cross section |
SK, YZ, PC, JG, and QZ led the writing of this article and endorsed the responsibility of the experimental site and the instruments. SK and YZ drafted the manuscript, and all authors contributed to the paper writing and data preparation. SK and YZ led the consolidation of the dataset and prepared the data in the standardized format described in this paper together with all co-authors.
The contact author has declared that neither they nor their co-authors have any competing interests.
Publisher's note: Copernicus Publications remains neutral with regard to jurisdictional claims in published maps and institutional affiliations.
This article is part of the special issue “Extreme environment datasets for the three poles”. It is not associated with a conference.
We appreciate all of our international collaborators (Örjan Gustafsson, Chhatra Mani Sharma, Maheswar Rupakheti, Arnico Panday), engineers (Xiaoxiang Wang, Shaopeng Gao, Yajun Liu), and others (Shiwei Sun, Bin Qu, Zhengzheng Yang, Chengde Yang, Huijun Zheng) who participated in the field observations, maintained the observation instruments, processed the observations, and analyzed the samples in the laboratory.
This work was supported by the Second Tibetan Plateau Scientific Expedition and Research program (grant no. 2019QZKK0605), the Strategic Priority Research Program of the Chinese Academy of Sciences (grant no. XDA20040500), the State Key Laboratory of Cryospheric Science (grant no. SKLCS-ZZ-2022), the National Natural Science Foundation of China (grant no. 42071082), and the CAS “Light of the West China” program.
This paper was edited by Min Feng and reviewed by two anonymous referees.
Andreae, M. O. and Gelencsér, A.: Black carbon or brown carbon? The nature of light-absorbing carbonaceous aerosols, Atmos. Chem. Phys., 6, 3131–3148, https://doi.org/10.5194/acp-6-3131-2006, 2006.
Bond, T. C., Doherty, S. J., Fahey, D. W., Forster, P. M., Berntsen, T., De Angelo, B. J., Flanner, M. G., Ghan, S., Karcher, B., Koch, D., Kinne, S., Kondo, Y., Quiinn, P. K., Sarofim, M. C., Schultz, M. G., Schulz, M., Venkataraman, C., Zhang, H., Zhang, S., Bellouin, N., Guttikunda, S. K., Hopke, P. K., Jacobson, M. Z., Kaiser, J. W., Klimont, Z., Lohmann, U., Schwarz, J. P., Shindell, D., Storelvmo, T., Warren, S. G., and Zender, C. S.: Bounding the role of black carbon in the climate system: A scientific assessment, J. Geophys. Res.-Atmos., 118, 5380–5552, https://doi.org/10.1002/jgrd.50171, 2013.
Bosch, C., Andersson, A., Kirillova, E. N., Budhavant, K., Tiwari, S., Praveen, P., Russell, L. M., Beres, N. D., Ramanathan, V., and Gustafsson, Ö.: Source-diagnostic dual-isotope composition and optical properties of water-soluble organic carbon and elemental carbon in the South Asian outflow intercepted over the Indian Ocean, J. Geophys. Res.-Atmos., 119, 11743–11759, 2014.
Brun, F., Treichiler, D., Shean, D., and Immerzeel, W. W.: Limited contribution of glacier mass loss to the recent increase in Tibetan Plateau lake volume, Front. Earth Sci., 8, 582060, https://doi.org/10.3389/feart.2020.582060, 2020.
Chen, D., Xu, B., Yao, T., Guo, Z., Cui, P., Chen, F., Zhang, R., Zhang, X., Zhang, Y., Fan, J., Hou, Z., and Zhang, T.: Assessment of past, present and future environmental changes on the Tibetan Plateau, Chin. Sci. Bull., 60, 3025, https://doi.org/10.1360/N972014-01370, 2015.
Chen, M., Wang, C., Wang, X., Fu, J., Gong, P., Yan, J., Yu, Z., Yan, F., and Nawab, J.: Release of perfluoroalkyl substances from melting glacier of the Tibetan Plateau: Insights into the impact of global warming on the cycling of emerging pollutants, J. Geophys. Res.- Atmos., 124, 7442–7456, https://doi.org/10.1029/2019JD030566, 2019.
Chen, P., Kang, S., Li, C., Zhang, Q., Guo, J., Tripathee, L., Zhang, Y., Li, G., Gul, C., Cong, Z., Wan, X., Niu, H., Panday, A. K., Rupakheti, M., and Ji, Z.: Carbonaceous aerosol characteristics on the Third Pole: A primary study based on the Atmospheric Pollution and Cryospheric Change (APCC) network, Environ. Pollut., 253, 49–60, https://doi.org/10.1016/j.envpol.2019.06.112, 2019.
Chen, P., Kang, S., Tripathee, L., Ram, K., Rupakheti, M., Panday, A. K., Zhang, Q., Guo, J., Wang, X., and Pu, T.: Light absorption properties of elemental carbon (EC) and water-soluble brown carbon (WS–BrC) in the Kathmandu Valley, Nepal: a 5-year study, Environ. Pollut., 261, 114239, https://doi.org/10.1016/j.envpol.2020.114239, 2020.
Chen, P., Kang, S., Abdullaev, S. F., Safarov, M. S., and Li, C.: Significant influence of carbonates on determining organic carbon and black carbon: a case study in Tajikistan, central Asia, Environ. Sci. Technol., 55, 2839–2846, https://doi.org/10.1021/acs.est.0c05876, 2021.
Chen, R., Song, Y., Kang, E., Han, C., Liu, J., Yang, Y., Qing, W., and Liu, Z.: A cryospherehydrology observation system in a small alpine watershed in the Qilian Mountains of China and its meteorological gradient, Arct. Antarct. Alp. Res., 46, 503–523, 2014.
Chen, X., Kang, S., Cong, Z., Yang, J., and Ma, Y.: Concentration, temporal variation, and sources of black carbon in the Mt. Everest region retrieved by real-time observation and simulation, Atmos. Chem. Phys., 18, 12859–12875, https://doi.org/10.5194/acp-18-12859-2018, 2018.
Cheng, Y., He, K.-B., Zheng, M., Duan, F.-K., Du, Z.-Y., Ma, Y.-L., Tan, J.-H., Yang, F.-M., Liu, J.-M., Zhang, X.-L., Weber, R. J., Bergin, M. H., and Russell, A. G.: Mass absorption efficiency of elemental carbon and water-soluble organic carbon in Beijing, China, Atmos. Chem. Phys., 11, 11497–11510, https://doi.org/10.5194/acp-11-11497-2011, 2011.
Chen, Y., Tian, L., Zong, J., Zhu, D., Wang, C., and Jin, S.: Variations of the large and small Anglong glaciers in the Ali district, Tibet Autonomous Region, J. Glaciol. Geocrtol., 41, 14–23, https://doi.org/10.7522/j.issn.1000-0240.2019.0001, 2021.
Chow, J. C., Watson, J. G., Chen, L.-W. A., Paredes-Miranda, G., Chang, M.-C. O., Trimble, D., Fung, K. K., Zhang, H., and Zhen Yu, J.: Refining temperature measures in thermal/optical carbon analysis, Atmos. Chem. Phys., 5, 2961–2972, https://doi.org/10.5194/acp-5-2961-2005, 2005.
Chow, J. C., Watson, J. G., Chen, L. W. A., Chang, M. C. O., Robinson, N. F., Trimble, D., and Kohl, S.: The IMPROVE-A temperature protocol for thermal/optical carbon analysis: maintaining consistency with a long-term database, J. Air Waste Manage., 57, 1014–1023, 2007.
Cong, Z., Kang, S., Gao, S., Zhang, Y., Li, Q., and Kawamura, K.: Historical Trends of Atmospheric Black Carbon on Tibetan Plateau as reconstructed from a 150-Year Lake Sediment Record, Environ. Sci. Technol., 47, 257, https://doi.org/10.1021/es3048202, 2013.
Cong, Z., Kawamura, K., Kang, S., and Fu, P.: Penetration of biomass-burning emissions from South Asia through the Himalayas: new insights from atmospheric organic acids, Sci. Rep.-UK, 5, 9580, https://doi.org/10.1038/srep09580, 2015.
Dasari, S., Andersson, A., Stohl, A., Evangeliou, N., Bikkina, S., Holmstrand, H.,Budhavant, K., Salam, A., and Gustafsson, Ö.: Source Quantification of South Asian Black Carbon Aerosols with Isotopes and Modeling, Environ. Sci. Technol., 54, 11771–11779, https://doi.org/10.1021/acs.est.0c02193, 2020.
Drinovec, L., Močnik, G., Zotter, P., Prévôt, A. S. H., Ruckstuhl, C., Coz, E., Rupakheti, M., Sciare, J., Müller, T., Wiedensohler, A., and Hansen, A. D. A.: The “dual-spot” Aethalometer: an improved measurement of aerosol black carbon with real-time loading compensation, Atmos. Meas. Tech., 8, 1965–1979, https://doi.org/10.5194/amt-8-1965-2015, 2015.
Flanner, M. G., Zender, C. S., Randerson, J. T., and Rasch, P. J.: Present-day climate forcing and response from black carbon in snow, J. Geophys. Res., 112, D11202, https://doi.org/10.1029/2006JD008003, 2007.
Gao, H., He, X., Ye, B., and Pu, J.: Modeling the runoff and glacier mass balance in a small watershed on the Central Tibetan Plateau, China, from 1955 to 2008, Hydrol. Process., 26, 1593–1603, https://doi.org/10.1002/hyp.8256, 2012.
Gao, J., Yao, T., Masson-Delmotte, V., Steen-Larsen, H. C., and Wang, W.: Collapsing glaciers threaten Asia's water supplies, Nature, 565, 19–21, https://doi.org/10.1038/d41586-018-07838-4, 2019.
Gao, T., Kang, S., Zhang, Y., Sprenger, M., Wang, F., Du, W., and Wang, X.: Characterization, sources and transport of dissolved organic carbon and nitrogen from a glacier in the Central Asia, Sci. Total Environ., 725, 138346, https://doi.org/10.1016/j.scitotenv.2020.138346, 2020.
Gao, T., Zhang, Y., Kang, S., Abbott, B. W., Wang, X., Zhang, T., Yi, S., and Gustafsson, Ö.: Accelerating permafrost collapse on the eastern Tibetan Plateau, Environ. Res. Lett., 16, 054023, https://doi.org/10.1088/1748-9326/abf7f0, 2021a.
Gao, T., Kang, S., Chen, R., Wang, X., Yang, J., Luo, X., Wang, X., Paudyal, R., Han, C., He, R., Sillanpää, M., and Zhang, Y.: Characteristics of dissolved organic carbon and nitrogen in precipitation in the northern Tibetan Plateau, Sci. Total Environ., 776, 145911, https://doi.org/10.1016/j.scitotenv.2021.145911, 2021b.
Gul, C., Puppala, S. P., Kang, S., Adhikary, B., Zhang, Y., Ali, S., Li, Y., and Li, X.: Concentrations and source regions of light-absorbing particles in snow/ice in northern Pakistan and their impact on snow albedo, Atmos. Chem. Phys., 18, 4981–5000, https://doi.org/10.5194/acp-18-4981-2018, 2018.
Gustafsson, Ö., Krusa, M., Zencak, Z., Sheesley, R. J., Granat, L., Engström, E., Praveen, P. S., Rao, P. S. P., Leck, C., and Rodhe, H.: Brown clouds over South Asia: Biomass or fossil fuel combustion?, Science, 323, 495–498, 2009.
Han, Y. M., Marlon, J. R., Cao, J. J., Jin, Z. D., and An, Z. S.: Holocene linkages between char, soot, biomass burning and climate from Lake Daihai, China, Global Biogeochem. Cycles, 26, GB4017, https://doi.org/10.1029/2011gb004197, 2012.
Han, Y. M., Wei, C., Bandowe, B. A. M., Wilcke, W., Cao, J. J., Xu, B. Q., Gao, S. P., Tie, X. X., Li, G. H., Jin, Z. D., and An, Z. S.: Elemental Carbon and Polycyclic Aromatic Compounds in a 150-Year Sediment Core from Lake Qinghai, Tibetan Plateau, China: Influence of Regional and Local Sources and Transport Pathways, Environ. Sci. Technol., 49, 4176–4183, https://doi.org/10.1021/es504568m, 2015.
Hu, Z., Kang, S., Li, C., Yan, F., Chen, P., Gao, S., Wang, Z., Zhang, Y., and Sillanpaa, M.: Light absorption of biomass burning and vehicle emission-sourced carbonaceous aerosols of the Tibetan Plateau, Environ. Sci. Pollut. Res., 24, 15369–15378, https://doi.org/10.1007/s11356-017-9077-3, 2017.
Hu, Z., Kang, S., Yan, F., Zhang, Y., Li, Y., Chen, P., Qin, X., Wang, K., Gao, S., and Li, C.: Dissolved organic carbon fractionation accelerates glacier-melting: A case study in the northern Tibetan Plateau, Sci. Total Environ., 627, 579–585, https://doi.org/10.1016/j.scitotenv.2018.01.265, 2018.
Hu, Z., Kang, S., He, X., Yan, F., Zhang, Y., Chen, P., Li, X., Gao, S., and Li, C.: Carbonaceous matter in glacier at the headwaters of the Yangtze River: Concentration, sources and fractionation during the melting process, J. Environ. Sci., 87, 389–397, https://doi.org/10.1016/j.jes.2019.08.001, 2020.
Hu, Z., Kang, S., Chen, Q., Xu, J., Zhang, C., Li, X., Yan, F., Zhang, Y., Chen, P., and Li, C.: Photobleaching reduces the contribution of dissolved organic carbon to glacier melting in the Himalayas and the Tibetan Plateau, Sci. Total Environ., 797, 149178, https://doi.org/10.1016/j.scitotenv.2021.149178, 2021.
Huss, M. and Hock, R.: Global-scale hydrological response to future glacier mass loss, Nat. Clim. Change, 8, 135–140, https://doi.org/10.1038/s41558-017-0049-x, 2018.
Immerzeel, W. W., van Beek, L. P. H., and Bierkens, M. F. P.: Climate Change Will Affect the Asian Water Towers, Science, 328, 1382–1385, https://doi.org/10.1126/science.1183188, 2010.
Immerzeel, W. W., Lutz, A. F., Andrade, M., Bahl, A., Biemans, H., Bolch, T., Hyde, S., Brumby, S., Davies, B. J., Elmore, A. C., Emmer, A., Feng, M., Fernandez, A., Haritashya, U., Kargel, J. S., Koppes, M., Kraaijenbrink, P. D. A., Kulkarni, A. V., Mayewski, P. A., Nepal, S., Pacheco, P., Painter, T. H., Pellicciotti, F., Rajaram, H., Rupper, S., Sinisalo, A., Shrestha, A. B., Viviroli, D., Wada, Y., Xiao, C., Yao, T., and Baillie, J. E. M.: Importance and vulnerability of the world's water towers, Nature, 577, 364–369, https://doi.org/10.1038/s41586-019-1822-y, 2020.
IPCC: Working Group I Contribution to the IPCC Fifth Assessment Report Climate Change 2013: The Physical Science Basis Summary for Policymakers, edited by: Stocker, T. F., Qin, D., Plattner, G.-K., Tignor, M., Allen, S. K., Boschung, J., Nauels, A., Xia, Y., Bex, V., and Midgley, P. M., Cambridge University Press, Cambridge, United Kingdom and New York, NY, USA, 1535 pp., 2013.
IPCC: Summary for Policymakers, in: Climate Change 2021: The Physical Science Basis. Contribution of Working Group I to the Sixth Assessment Report of the Intergovernmental Panel on Climate Change, edited by: Masson-Delmotte, V., Zhai, P., Pirani, A., Connors, S. L., Péan, C., Berger, S., Caud, N., Chen, Y., Goldfarb, L., Gomis, M. I., Huang, M., Leitzell, K., Lonnoy, E., Matthews, J. B. R., Maycock, T. K., Waterfield, T., Yelekç, O., Yu, R., and Zhou, B., Cambridge University Press, in press, 2021.
Jenkins, M., Kaspari, S., Kang, S., Grigholm, B., and Mayewski, P.: Tibetan Plateau Geladaindong black carbon ice core record (1843–1982): Recent increases due to higher emissions and lower snow accumulation, Adv. Clim. Change Res., 7, 132–138, https://doi.org/10.1016/j.accre.2016.07.002, 2016.
Ji, Z., Kang, S., Zhang, Q., Cong, Z., Chen, P., and Sillanpaa, M.: Investigation of mineral aerosols radiative effects over High Mountain Asia in 1990–2009 using a regional climate model, Atmos. Res., 178, 484–496, https://doi.org/10.1016/j.atmosres.2016.05.003, 2016.
Jouzel, J.: A brief history of ice core science over the last 50 yr, Clim. Past, 9, 2525–2547, https://doi.org/10.5194/cp-9-2525-2013, 2013.
Kang, S. and Zhang, Y.: Black carbon and organic carbon dataset over the Third Pole. National Cryosphere Desert Data Center [data set], https://doi.org/10.12072/ncdc.NIEER.db0114.2021, 2021.
Kang, S., Zhang, Q., Kaspari, S., Qin, D., Cong, Z., Ren, J., and Mayewski, P. A.: Spatial and seasonal variations of elemental composition in Mt. Everest (Qomolangma) snow/firn, Atmos. Environ., 41, 7208–7218, https://doi.org/10.1016/j.atmosenv.2007.05.024, 2007.
Kang, S., Zhang, Y., Zhang, Y., Grigholm, B., Kaspari, S., Qin, D., Ren, J., and Mayewski, P.: Variability of atmospheric dust loading over the central Tibetan Plateau based on ice core glaciochemistry, Atmos. Environ., 44, 2980–2989, https://doi.org/10.1016/j.atmosenv.2010.05.014, 2010.
Kang, S., Wang, F., Morgenstern, U., Zhang, Y., Grigholm, B., Kaspari, S., Schwikowski, M., Ren, J., Yao, T., Qin, D., and Mayewski, P. A.: Dramatic loss of glacier accumulation area on the Tibetan Plateau revealed by ice core tritium and mercury records, The Cryosphere, 9, 1213–1222, https://doi.org/10.5194/tc-9-1213-2015, 2015.
Kang, S., Zhang, Q., Qian, Y., Ji, Z., Li, C., Cong, Z., Zhang, Y., Guo, J., Du, W., Huang, J., You, Q., Panday, A. K., Rupakheti, M., Chen, D., Gustafsson, Ö., Thiemens, M. H., and Qin, D.: Linking Atmospheric Pollution to Cryospheric Change in the Third Pole Region: Current Progresses and Future Prospects, Nat. Sci. Rev., 6, 796–809, https://doi.org/10.1093/nsr/nwz031, 2019.
Kang, S., Zhang, Y., Qian, Y., and Wang, H.: A review of black carbon in snow and ice and its impact on the cryosphere, Earth Sci. Rev., 210, 103346, https://doi.org/10.1016/j.earscirev.2020.103346, 2020.
Kaspari, S., Schwikowski, M., Gysel, M., Flanner, M.G., Kang, S., Hou, S., and Mayewski, P.: Recent increase in black carbon concentrations from a Mt. Everest ice core spanning 1860–2000 AD, Geophys. Res. Lett., 38, L04703, https://doi.org/10.1029/2010GL046096, 2011.
Kaspari, S., Painter, T. H., Gysel, M., Skiles, S. M., and Schwikowski, M.: Seasonal and elevational variations of black carbon and dust in snow and ice in the Solu-Khumbu, Nepal and estimated radiative forcings, Atmos. Chem. Phys., 14, 8089–8103, https://doi.org/10.5194/acp-14-8089-2014, 2014.
Kirillova, E. N., Andersson, A., Han, J., Lee, M., and Gustafsson, Ö.: Sources and light absorption of water-soluble organic carbon aerosols in the outflow from northern China, Atmos. Chem. Phys., 14, 1413–1422, https://doi.org/10.5194/acp-14-1413-2014, 2014.
Lau, W. K. M. and Kim, K.-M.: Impact of Snow Darkening by Deposition of Light-Absorbing Aerosols on Snow Cover in the Himalayas–Tibetan Plateau and Influence on the Asian Summer Monsoon: A Possible Mechanism for the Blanford Hypothesis, Atmosphere, 9, 438, https://doi.org/10.3390/atmos9110438, 2018.
Li, C., Bosch, C., Kang, S., Andersson, A., Chen, P., Zhang, Q., Cong, Z., Chen, B., Qin, D., and Gustafsson, Ö.: Source of black carbon to the Himalayan-Tibetan Plateau glaciers, Nat. Commun., 7, 12574, https://doi.org/10.1038/ncomms12574, 2016a.
Li, C., Chen, P., Kang, S., Yan, F., Hu, Z., Qu, B., and Sillanpää, M.: Concentrations and light absorption characteristics of carbonaceous aerosol in PM2.5 and PM10 of Lhasa city, the Tibetan Plateau, Atmos. Environ., 127, 340–346, 2016b.
Li, C., Yan, F., Kang, S., Chen, P., Hu, Z., Gao, S., Qu, B., and Sillanpää, M.: Light absorption characteristics of carbonaceous aerosols in two remote stations of the southern fringe of the Tibetan Plateau, China, Atmos. Environ., 143, 79–85, 2016c.
Li, C., Yan, F., Kang, S., Chen, P., Qu, B., Hu, Z., and Silanpaa, M.: Concentration, sources, and flux of dissolved organic carbon of precipitation at Lhasa city, the Tibetan Plateau, Environ. Sci. Pollut. Res., 23, 12915–12921, 2016d.
Li, C., Kang, S., and Yan, F.: Importance of Local Black Carbon Emissions to the Fate of Glaciers of the Third Pole, Environ. Sci. Technol., 52, https://doi.org/10.1021/acs.est.8b06285, 2018a.
Li, C., Chen, P., Kang, S., Yan, F., Tripathee, L., Wu, G., Qu, B., Sillanpaa, M., Yang, D., Dittmar, T., Stubbins, A., and Raymond, P. A.: Fossil fuel combustion emission from South Asia influences precipitation dissolved organic carbon reaching the remote Tibetan Plateau: Isotopic and molecular evidence, J. Geophys. Res.-Atmos., 123, 6248–6258, https://doi.org/10.1029/2017JD028181, 2018b.
Li, C., Yan, F., Kang, S., Chen, P., Han, X., Hu, Z., Zhang, G., Hong, Y., Gao, S., Qu, B., Zhu, Z., Li, J., Chen, B., and Sillanpää, M.: Re-evaluating black carbon in the Himalayas and the Tibetan Plateau: concentrations and deposition, Atmos. Chem. Phys., 17, 11899–11912, https://doi.org/10.5194/acp-17-11899-2017, 2017a.
Li, C., Yan, F., Kang, S., Chen, P., Hu, Z., Han, X., Zhang, G., Gao, S., Qu, B., and Sillanpaa, M.: Deposition and light absorption characteristics of precipitation dissolved organic carbon (DOC) at three remote stations in the Himalayas and Tibetan Plateau, China, Sci. Total Environ., 605, 1039–1046, https://doi.org/10.1016/j.scitotenv.2017.06.232, 2017b.
Li, X., Kang, S., He, X., Qu, B., Tripathee, L., Jing, Z., Paudyal, R., Li, Y., Zhang, Y., Yan, F., Li, G., and Li, C.: Light-absorbing impurities accelerate glacier melt in the Central Tibetan Plateau, Sci. Total Environ., 587, 482–490, https://doi.org/10.1016/j.scitotenv.2017.02.169, 2017.
Li, X., Kang, S., Zhang, G., Qu, B., Tripathee, L., Paudyal, R., Jing, Z., Zhang, Y., Yan, F., Li, G., Cui, X., Xu, R., Hu, Z., and Li, C.: Light-absorbing impurities in a southern Tibetan Plateau glacier: Variations and potential impact on snow albedo and radiative forcing, Atmos. Res., 200, 77–87, https://doi.org/10.1016/j.atmosres.2017.10.002, 2018.
Li, X., Ding, Y., Han, T., Kang, S., Yu, Z., and Jing, Z.: Seasonal controls of meltwater runoff chemistry and chemical weathering at Urumqi glacier No.1 in central Asia, Hydrol. Process., 33, 3258–3281, 2019.
Li, X., Kang, S., Sprenger, M., Zhang, Y., He, X., Zhang, G., Tripathee, L., Li, C., and Cao, J.: Black carbon and mineral dust on two glaciers on the central Tibetan Plateau: sources and implications, J. Glaciol., 66, 248–258, https://doi.org/10.1017/jog.2019.100, 2020.
Li, Y., Kang, S., Chen, J., Hu, Z., Wang, K., Paudyal, R., Liu, J., Wang, X., Qin, X., and Sillanpaa, M.: Black carbon in a glacier and snow cover on the northeastern Tibetan Plateau: Concentrations, radiative forcing and potential source from local topsoil, Sci. Total Environ., 686, 1030–1038, 2019.
Li, Y., Yan, F., Kang, S., Zhang, C., Chen, P., Hu, Z., and Li, C.: Sources and light absorption characteristics of water-soluble organic carbon (WSOC) of atmospheric particles at a remote area in inner Himalayas and Tibetan Plateau, Atmos. Res., 253, 105472, https://doi.org/10.1016/j.atmosres.2021.105472, 2021.
Lim, S., Faïn, X., Zanatta, M., Cozic, J., Jaffrezo, J.-L., Ginot, P., and Laj, P.: Refractory black carbon mass concentrations in snow and ice: method evaluation and inter-comparison with elemental carbon measurement, Atmos. Meas. Tech., 7, 3307–3324, https://doi.org/10.5194/amt-7-3307-2014, 2014.
McConnell, J. R., Edwards, R., Kok, G. L., Flanner, M. G., Zender, C. S., Saltzman, E. S., Banta, J. R., Pasteris, D. R., Carter, M. M., and Kahl, J. D. W.: 20th-century industrial black carbon emissions altered Arctic climate forcing, Science, 317, 1381–1386, https://doi.org/10.1126/science.1144856, 2007.
Neupane, B., Kang, S., Chen, P., Zhang, Y., Ram, K., Rupakheti, D., Tripathee, L., Sharma, C. M., Cong, Z., Li, C., Hou, J., Xu, M., and Thapa, P.: Historical Black Carbon Reconstruction from the Lake Sediments of the Himalayan-Tibetan Plateau, Environ. Sci. Technol., 53, 5641–5651, https://doi.org/10.1021/acs.est.8b07025, 2019.
Nie, Y., Pritchard, H. D., Liu, Q., Hennig, T., Wang, W., Wang, X., Liu, S., Nepal, S., Samyn, D., Hewitt, K., and Chen, X.: Glacial change and hydrological implications in the Himalaya and Karakoram, Nat. Rev. Earth Environ., 2, 91–106, https://doi.org/10.1038/s43017-020-00124-w, 2021.
Niu, H., Kang, S., Wang, H., Zhang, R., Lu, X., Qian, Y., Paudyal, R., Wang, S., Shi, X., and Yan, X.: Seasonal variation and light absorption property of carbonaceous aerosol in a typical glacier region of the southeastern Tibetan Plateau, Atmos. Chem. Phys., 18, 6441–6460, https://doi.org/10.5194/acp-18-6441-2018, 2018a.
Niu, H., Kang, S., Lu, X., and Shi, X.: Distributions and light absorption property of water soluble organic carbon in a typical temperate glacier, southeastern Tibetan Plateau, Tellus B, 70, 1–15, https://doi.org/10.1080/16000889.2018.1468705, 2018b.
Niu, H., Kang, S., Shi, X., Zhang, G., Wang, S., and Pu, T.: Dissolved organic carbon in summer precipitation and its wet deposition flux in the Mt. Yulong region, southeastern Tibetan Plateau, J. Atmos. Chem., 76, 1–20, https://doi.org/10.1007/s10874-019-9385-8, 2019.
Niu, H., Kang, S., Gao, W., Sarangi, C., Tripathee, L., Rupakheti, D., Zhang, G., and Yan, X.: Investigation of the spatio-temporal heterogeneity and optical property of water-soluble organic carbon in atmospheric aerosol and snow over the Yulong Snow Mountain, southeastern Tibetan Plateau, Environ. Int., 144, 106045, https://doi.org/10.1016/j.envint.2020.106045, 2020.
Panicker, A. S., Sandeep, K., Gautam, A. S., Trimbake, H. K., Nainwal, H. C., Beig, G., Bisht, D. S., and Das, S.: Black carbon over a central Himalayan Glacier (Satopanth): Pathways and direct radiative impacts, Sci. Total Environ., 766, 144242, https://doi.org/10.1016/j.scitotenv.2020.144242, 2021.
Qian, Y., Yasunari, T. J., Doherty, S. J., Flanner, M. G., Lau, W. K. M., Ming, J., Wang, H., Wang, M., Warren, S. G., and Zhang, R.: Light-absorbing particles in snow and ice: Measurement and modeling of climatic and hydrological impact, Adv. Atmos. Sci., 32, 64–91, https://doi.org/10.1007/s00376-014-0010-0, 2015.
Ramachandran, S., Rupakheti, M., and Lawrence, M. G.: Black carbon dominates the aerosol absorption over the Indo-Gangetic Plain and the Himalayan foothills, Environ. Int., 142, 105814, https://doi.org/10.1016/j.envint.2020.105814, 2020.
Ramanathan, V. and Carmichael, G.: Global and regional climate changes due to black carbon, Nat. Geosci., 1, 221–227, https://doi.org/10.1038/ngeo156, 2008.
Ramanathan, V., Chung, C., Kim, D., Vettge, T., Buja, L., Kiehl, J. T., Washington, W. M., Fu, Q., Sikka, D. R., and Wild, M.: Atmospheric brown clouds: impacts on South Asian climate and hydrological cycle, P. Natl. Acad. Sci. USA, 102, 5326–5333, https://doi.org/10.1073/pnas.0500656102, 2005.
Ramanathan, V., Li, F., Ramana, M. V., Praveen, P. S., Kim, D., Corrigan, C. E., Nguyen, H., Stone, E. A., Schauer, J. J., Carmichael, G. R., Adhikary, B., and Yoon, S. C.: Atmospheric brown clouds: Hemispherical and regional variations in long-range transport, absorption, and radiative forcing, J. Geophys. Res., 112, D22S21, https://doi.org/10.1029/2006JD008124, 2007a.
Ramanathan, V., Ramana, M. V., Roberts, G., Kim, D., Corrigan, C., Chung, C., and Winker, D.: Warming trends in Asia amplified by brown cloud solar absorption, Nature, 448, 575–578, https://doi.org/10.1038/nature06019, 2007b.
Raymond, P. A., McClelland, J. W., Holmes, R. M., Zhulidov, A. V., Mull, K., Peterson, B. J., Striegl, R. G., Aiken, G. R., and Gurtovaya, T. Y.: Flux and age of dissolved organic carbon exported to the Arctic Ocean: A carbon isotopic study of the five largest arctic rivers, Global Biogeochem. Cycl., 21, https://doi.org/10.1029/2007gb002934, 2007.
Sandradewi, J., Prevot, A., Szidat, S., Perron, N., Alfarra, M., Lanz, V., Weingartner, E., and Baltensperger, U.: Using aerosol light absorption measurements for the quantitative determination of wood burning and traffic emission contributions to particulate matter, Environ. Sci. Technol., 42, 3316–3323, https://doi.org/10.1021/es702253m, 2008.
Santra, S., Verma, S., Fujita, K., Chakraborty, I., Boucher, O., Takemura, T., Burkhart, J. F., Matt, F., and Sharma, M.: Simulations of black carbon (BC) aerosol impact over Hindu Kush Himalayan sites: validation, sources, and implications on glacier runoff, Atmos. Chem. Phys., 19, 2441–2460, https://doi.org/10.5194/acp-19-2441-2019, 2019.
Satheesh, S. K., Vinoj, V., and Moorthy, K. K.: Weekly periodicities of aerosol properties observed at an urban location in India, Atmos. Res., 1010, 307–313, 2011.
Schwarz, J. P., Doherty, S. J., Li, F., Ruggiero, S. T., Tanner, C. E., Perring, A. E., Gao, R. S., and Fahey, D. W.: Assessing Single Particle Soot Photometer and Integrating Sphere/Integrating Sandwich Spectrophotometer measurement techniques for quantifying black carbon concentration in snow, Atmos. Meas. Tech., 5, 2581–2592, https://doi.org/10.5194/amt-5-2581-2012, 2012.
Schwarz, J. P., Gao, R. S., Perring, A. E., Spackman, J. R., and Fahey, D. W.: Black carbon aerosol size in snow, Sci. Rep.-UK, 3, 1356, https://doi.org/10.1038/srep01356, 2013.
Sun, J., Zhou, T., Liu, M., Chen, Y., Shang, H., Zhu, L., Shedayi, A. A., Yu, H., Cheng, G., Liu, G., Xu, M., Deng, W., Fan, J., Lu, X., and Sha, Y.: Linkages of the dynamics of glaciers and lakes with the climate elements over the Tibetan Plateau, Earth Sci. Rev., 185, 308–324, 2021.
Thompson, L. G.: Ice core evidence for climate change in the Tropics: implications for our future, Quaternary Sci. Rev., 19, 19–35, 2000.
Tripathee, L., Kang, S., Rupakheti, D., Cong, Z., Zhang, Q., and Huang, J.: Chemical characteristics of soluble aerosols over the central Himalayas: insights into spatiotemporal variations and sources, Environ. Sci. Pollut. Res., 24, 24454–24472, 2017.
Wang, M., Xu, B., Zhao, H., Cao, J., Joswiak, D., Wu, G., and Lin, S.: The influence of dust on quantitative measurements of black carbon in ice and snow when using a thermal optical method, Aerosol Sci. Technol., 46, 60–69, https://doi.org/10.1080/02786826.2011.605815, 2012.
Wang, M., Xu, B., Kaspari, S., Gleixner, G., Schwab, V. F., Zhao, H., Wang, H., and Yao, P.: Century-long record of black carbon in an ice core from the Eastern Pamirs: Estimated contributions from biomass burning, Atmos. Environ., 115, 79–88, https://doi.org/10.1016/j.atmosenv.2015.05.034, 2015.
Wang, M., Xu, B., Wang, H., Zhang, R., Yang, Y., Gao, S., Tang, X., and Wang, N.: Black Carbon Deposited in Hariqin Glacier of the Central Tibetan Plateau Record Changes in the Emission from Eurasia, Environ. Pollut., 273, 115778, https://doi.org/10.1016/j.envpol.2020.115778, 2021.
Wendl, I. A., Menking, J. A., Färber, R., Gysel, M., Kaspari, S. D., Laborde, M. J. G., and Schwikowski, M.: Optimized method for black carbon analysis in ice and snow using the Single Particle Soot Photometer, Atmos. Meas. Tech., 7, 2667–2681, https://doi.org/10.5194/amt-7-2667-2014, 2014.
Xu, B., Cao, J., Hansen, J., Yao, T., Joswia, D.R., Wang, N., Wu, G., Wang, M., Zhao, H., Yang, W., Liu, X., and He, J.: Black soot and the survival of Tibetan Plateau, P. Natl. Acad. Sci. USA, 106, 22114–22118, https://doi.org/10.1073/pnas.0910444106, 2009.
Xu, B., Cao, J., Joswiak, D.R., Liu, X., Zhao, H., and He, J.: Post-depositional enrichment of black soot in snow-pack and accelerated melting of Tibetan glaciers, Environ. Res. Lett., 7, 014022, https://doi.org/10.1088/1748-9326/7/1/014022, 2012.
Yan, F., Kang, S., Li, C., Zhang, Y., Qin, X., Li, Y., Zhang, X., Hu, Z., Chen, P., Li, X., Qu, B., and Sillanpää, M.: Concentration, sources and light absorption characteristics of dissolved organic carbon on a medium-sized valley glacier, northern Tibetan Plateau, The Cryosphere, 10, 2611–2621, https://doi.org/10.5194/tc-10-2611-2016, 2016.
Yang, J., Kang, S., Ji, Z., and Chen, D.: Modeling the origin of anthropogenic black carbon and its climatic effect over the Tibetan Plateau and surrounding regions, J. Geophys. Res.-Atmos., 123, 671–692, https://doi.org/10.1002/2017JD027282, 2018.
Yang, J., Kang, S., and Ji, Z.: Critical contribution of south Asian residential emissions to atmospheric black carbon over the Tibetan Plateau, Sci. Total Environ., 709, 135923, https://doi.org/10.1016/j.scitotenv.2019.135923, 2020.
Yang, S., Xu, B., Cao, J., Zender, C. S., and Wang, M.: Climate effect of black carbon aerosol in a Tibetan Plateau glacier, Atmos. Environ., 111, 71–78, 2015.
Yao, T., Li, Z., Thompson, L.G., Moseley-Thompson, E., Wang, Y., Tian, L., Wang, N., and Duan, K.: δ18O records from Tibetan ice cores reveal differences in climatic changes, Ann. Glaciol., 43, 1–7, https://doi.org/10.3189/172756406781812131, 2006.
Yao, T., Thompson, L., Yang, W., Yu, W., Gao, Y., Guo, X., Yang, X., Duan, K., Zhao, H., Xu, B., Pu, J., Lu, A., Xiang, Y., Kattel, D. B., and Joswiak, D.: Different glacier status with atmospheric circulations in Tibetan Plateau and surroundings, Nat. Clim. Change, 2, 663–667, https://doi.org/10.1038/NCLIMATE1580, 2012.
Yao, T., Masson-Delmotte, V., Gao, J., Yu, W., Yang, X., Risi, C., Sturm, C., Werner, M., Zhao, H., He, Y., Ren, W., Tian, L., Shi, C., and Hou, S.: A review of climatic controls on δ18O in precipitation over the Tibetan Plateau: Observations and simulations, Rev. Geophys., 51, 525–548, https://doi.org/10.1002/rog.20023, 2013.
Yao, T., Xue, Y., Chen, D., Chen, F., Thompson, L., Cui, P., Koike, T., Lau, W. K. M., Lettenmaier, D., Mosbrugger, V., Zhang, R., Xu, B., Dozier, J., Gillespie, T., Gu, Y., Kang, S., Piao, S., Sugimoto, S., Ueno, K., Wang, L., Wang, W., Zhang, F., Sheng, Y., Guo, W., Ailikun, Yang, X., Ma, Y., Shen, S. S. P., Su, Z., Chen, F., Liang, S., Liu, Y., Singh, V. P., Yang, K., Yang, D., Zhao, X., Qian, Y., Zhang, Y., and Li, Q.: Recent Third Pole's rapid warming accompanies cryospheric melt and water cycle intensification and interactions between monsoon and environment: multi-disciplinary approach with observations, modeling, and analysis, B. Am. Meteorol. Soc., 100, 423–444, https://doi.org/10.1175/BAMS-D-17-0057.1, 2019.
You, Q., Wu, T., Shen, L., Pepin, N., Zhang, L., Jiang, Z., Wu, Z., Kang, S., and AghaKouchak, A.: Review of snow cover variation over the Tibetan Plateau and its influence on the broad climate system, Earth Sci. Rev., 201, 103043, https://doi.org/10.1016/j.earscirev.2019.103043, 2020.
You, Q., Cai, Z., Pepin, N., Chen, D., Ahrens, B., Jiang, Z., Wu, F., Kang, S., Zhang, R., Wu, T., Wang, P., Li, M., Zuo, Z., Gao, Y., Zhai, P., and Zhang, Y.: Warming amplification over the Arctic Pole and Third Pole: Trends, mechanisms and consequences, Earth Sci. Rev., 217, 103625, https://doi.org/10.1016/j.earscirev.2021.103625, 2021.
Zhang, G., Yao, T., Xie, H., Yang, K., Zhu, L., Shum, C. K., Bolch, T., Yi, S., Allen, S., Jiang, L., Chen, W., and Ke, C.: Response of Tibetan Plateau lakes to climate change: trends, patterns, and mechanisms, Earth Sci. Rev., 208, 103269, https://doi.org/10.1016/j.earscirev.2020.103269, 2020.
Zhang, Q., Huang, J., Wang, F., Mark, L., Xu, J., Armstrong, D., Li, C., Zhang, Y., and Kang, S.: Mercury Distribution and Deposition in Glacier Snow over Western China, Environ. Sci. Technol., 46, 5404–5413, https://doi.org/10.1021/es300166x, 2012.
Zhang, Y., Kang, S., Zhang, Q., Grigholm, B., Kaspari, S., You, Q., Qin, D., Mayewski, P. A., Cong, Z., Huang, J., Sillanpaa, M., and Chen, F.: A 500-year atmospheric dust deposition retrieved from a Mt. Geladaindong ice core in the central Tibetan Plateau, Atmos. Res., 166, 1–9, https://doi.org/10.1016/j.atmosres.2015.06.007, 2015.
Zhang, W., Shen, Y., He, J., He, B., Wu, X., Chen, A., and Li, H.: Assessment of the effects of forest on snow ablation in the headwaters of the Irtysh River, Xinjiang, J. Glaciol. Geocryol., 36, 1260–1270, 2014 (in Chinese with English abstract).
Zhang, W., Shen, Y., Wang, N., He, J., Chen, A., and Zhou, J.: Investigations on physical properties and ablation processes of snow cover during the spring snowmelt period in the headwater region of the Irtysh river, Chinese Altai Mountains, Environ. Earth Sci., 75, 199, https://doi.org/10.1007/s12665-015-5068-1, 2016.
Zhang, Y., Kang, S., Cong, Z., Schmale, J., Sprenger, M., Li, C., Yang, W., Gao, T., Sillanpää, M., Li, X., Liu, Y., Chen, P., and Zhang, X.: Light-absorbing impurities enhance glacier albedo reduction in the southeastern Tibetan Plateau, J. Geophys. Res.-Atmos., 122, 6915–6933, https://doi.org/10.1002/2016JD026397, 2017a.
Zhang, Y., Kang, S., Li, C., Gao, T., Cong, Z., Sprenger, M., Liu, Y., Li, X., Guo, J., Sillanpaa, M., Wang, K., Chen, J., Li, Y., and Sun, S.: Characteristics of black carbon in snow from Laohugou No. 12 glacier on the northern Tibetan Plateau, Sci. Total Environ., 607, 1237–1249, https://doi.org/10.1016/j.scitotenv.2017.07.100, 2017b.
Zhang, Y., Kang, S., Xu, M., Sprenger, M., Gao, T., Cong, Z., Li, C., Guo, J. X., Li, Z. Y., Li, G., Li, X., Liu, Y., and Han, H.: Light-absorbing impurities on Keqikaer Glacier in western Tian Shan: concentrations and potential impact on albedo reduction, Sci. Cold Arid Reg., 9, 97–111, https://doi.org/10.3724/SP.J.1226.2017.00097, 2017c.
Zhang, Y., Kang, S., Li, G., Gao, T., Chen, P., Li, X., Liu, Y.., Hu, Z., Sun, S., Guo, J., Wang, K., Chen, X., and Sillanpää, M.: Dissolved organic carbon in glaciers of the southeastern Tibetan Plateau: Insights into concentrations and possible sources, PLoS ONE, 13, e0205414, https://doi.org/10.1371/journal.pone.0205414, 2018a.
Zhang, Y., Kang, S., Sprenger, M., Cong, Z., Gao, T., Li, C., Tao, S., Li, X., Zhong, X., Xu, M., Meng, W., Neupane, B., Qin, X., and Sillanpää, M.: Black carbon and mineral dust in snow cover on the Tibetan Plateau, The Cryosphere, 12, 413–431, https://doi.org/10.5194/tc-12-413-2018, 2018b.
Zhang, Y., Kang, S., Gao, T., Schmale, J., Liu, Y., Zhang, W., Guo, J., Du, W., Hu, Z., Cui, X., and Sillanpaa, M.: Dissolved organic carbon in snow cover of the Chinese Altai Mountains, Central Asia: Concentrations, sources and light-absorption properties, Sci. Total Environ., 647, 1385–1397, https://doi.org/10.1016/j.scitotenv.2018.07.417, 2019.
Zhang, Y., Gao, T., Kang, S., Sprenger, M., Tao, S., Du, W., Yang, J., Wang, F., and Meng, W.: Effects of black carbon and mineral dust on glacial melting on the Muz Taw glacier, Central Asia, Sci. Total Environ., 740, 140056, https://doi.org/10.1016/j.scitotenv.2020.140056, 2020.
Zhang, Y., Gao, T., Kang, S., Allen, S., Luo, X., and Allen, D.: Microplastics in glaciers of the Tibetan Plateau: evidence for long-range transport of microplastics, Sci. Total Environ., 758, 143634, https://doi.org/10.1016/j.scitotenv.2020.143634, 2021a.
Zhang, Y., Kang, S., Gao, T., Kang, S., Shangguan, D., and Luo, X.: Albedo reduction as an important driver for glacier melting in Tibetan Plateau and its surrounding areas, Earth Sci. Rev., 220, 103735, https://doi.org/10.1016/j.earscirev.2021.103735, 2021b.
Zhang, Y., Kang, S., Wei, D., Luo, X., Wang, Z., and Gao, T.: Sink or source? Methane and carbon dioxide emissions from cryoconite holds, subglacial sediments, and proglacial river runoff during intensive glacier melting on the Tibetan Plateau, Fund. Res., 1, 232–239, https://doi.org/10.1016/j.fmre.2021.04.005, 2021c.
Zhong, X., Kang, S., Zhang, W., Yang, J., Li, X., Zhang, Y., Liu, Y., and Chen, P.: Light-absorbing impurities in snow cover across Northern Xinjiang, China, J. Glaciol., 65, 940–956, https://doi.org/10.1017/jog.2019.69, 2019.
Zhong, X., Kang, S., Zhang, W., Yang, J., Niu, H., Liu Y., Guo, J., Li, X., Chen, P., and Wang, X.: Continuously observed light absorbing impurities in snow cover over the southern Altai Mts. in China: Concentrations, impacts and potential sources, Environ. Pollut., 270, 116234, https://doi.org/10.1016/j.envpol.2020.116234, 2021.
Zhu, T., Wang, X., Lin, H., Ren, J., Wang, C., and Gong, P.: Accumulation of pollutants in proglacial lake sediments: Impacts of glacial meltwater and anthropogenic activities, Environ. Sci. Technol., 54, 7901–7910, https://doi.org/10.1021/acs.est.0c01849, 2020.
- Abstract
- Introduction
- Research site descriptions
- Sampling in the field
- Observations, measurement methods, and data descriptions
- Data availability
- Conclusions
- Appendix A: Abbreviations
- Author contributions
- Competing interests
- Disclaimer
- Special issue statement
- Acknowledgements
- Financial support
- Review statement
- References