the Creative Commons Attribution 4.0 License.
the Creative Commons Attribution 4.0 License.
 | 21 Dec 2022
World Wide Lightning Location Network (WWLLN) Global Lightning Climatology (WGLC) and time series, 2022 update
Katie Hong-Kiu Lau
Here we describe the 2022 update to the World Wide Lightning Location Network (WWLLN) Global Lightning Climatology (WGLC) and time series (Kaplan and Lau, 2021), which extends the dataset with global lightning observations from 2021. This addition of new data means that the WGLC now contains 12 complete years of global lightning stroke observations covering 2010–2021. Slightly more lightning strokes (3 %) were recorded in 2021 compared to the 2012–2020 mean of 218 million strokes per year. In 2021, above-average lightning was recorded around the Gulf of Mexico, the central Andes and Amazon Basin, western Africa, and over the central Mediterranean. Lower-than-average lightning density occurred in much of southern and eastern Africa, subtropical eastern South America, western Australia, and especially over the Strait of Malacca and the South China Sea. Because below-average global lightning captured by the WWLLN in 2010 and 2011 related to the build-out of the sensor network, we reprocessed the WGLC to cover the 10-year period from 2012 to 2021 and recommend these for applications needing climatological mean lightning fields. The updated WGLC datasets are available for download from Zenodo (Kaplan and Lau, 2022, https://doi.org/10.5281/zenodo.6007052).
- Article
(4668 KB) - Full-text XML
- Former version
-
Supplement
(8843 KB) - BibTeX
- EndNote


Global observations of lightning are made with the World Wide Lightning Location Network (WWLLN) of very-low-frequency (VLF) radio sensors (http://wwlln.net, last access: 1 December 2022; Rodger et al., 2004). In 2021, we published gridded fields of lightning density and power based on WWLLN observations for use in Earth system modeling and other applications that covered the period 2010–2020 (Kaplan and Lau, 2021). This short communication is to document an update to the WWLLN Global Lightning Climatology (WGLC) gridded products that now include data from 2021. We also describe the major features of lightning observed in 2021 compared to previous years.
The method for gridding the raw lightning stroke observations made by the WWLLN is described in detail in Kaplan and Lau (2021). We made no changes in this methodology in preparing the data update. Briefly, raw lightning observations are recorded with a latitude, longitude, and time stamp. Geographic data are nominally given with a precision of 10−4 decimal degrees, but the actual location accuracy of the WWLLN has been estimated at ca. 3.4 km (Rodger et al., 2005). The time of every lightning stroke is recorded to the nearest microsecond. Individual lightning stroke observations are summed on a geographic grid at the desired spatial resolution (0.5∘ or 5 arcmin), corrected for WWLLN detection efficiency using hourly gridded fields provided by the network and aggregated into daily and monthly rasters.
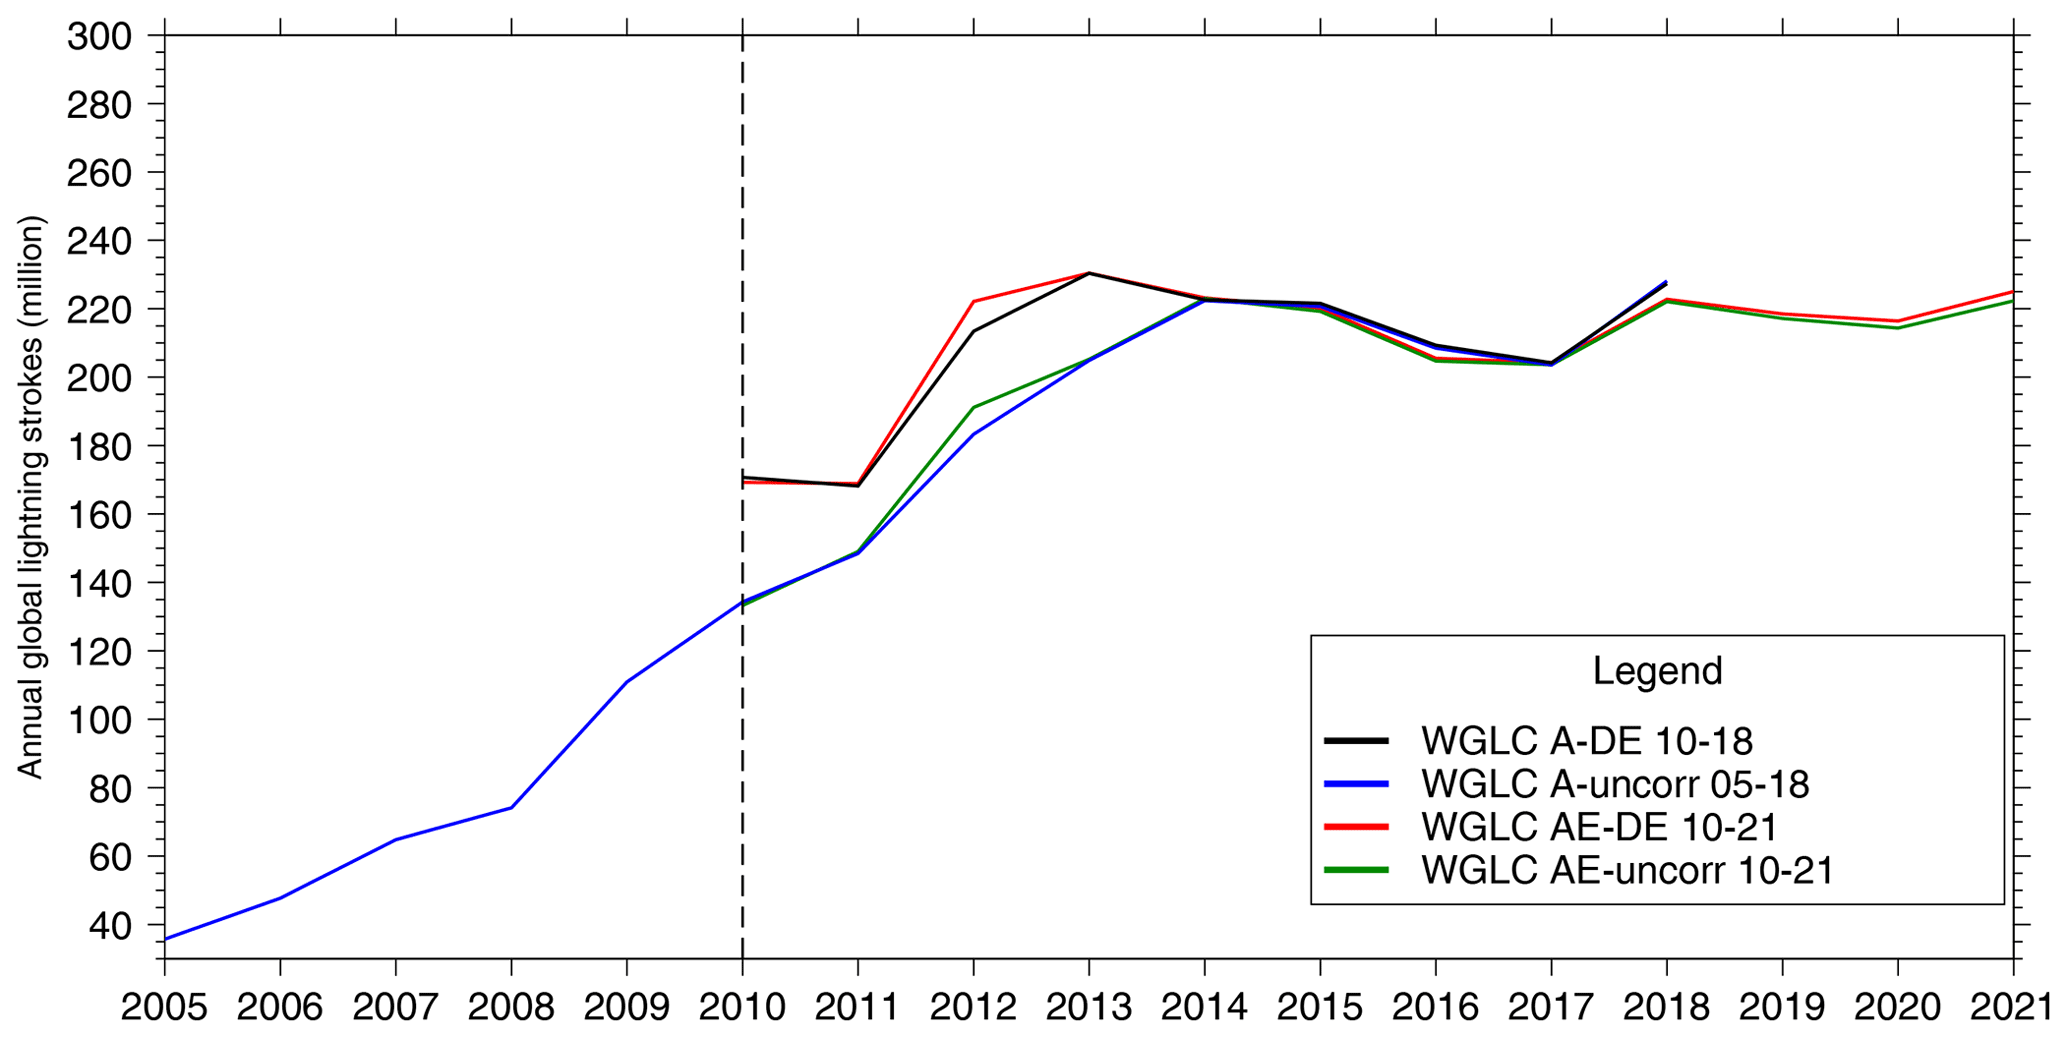
Figure 1Total global lightning strokes from 2005 to 2021. WWLLN produces two sets of raw lightning stroke data: A (A-raw) and AE (AE-raw). The A-DE and AE-DE curves are adjusted for the WWLLN reported detection efficiency. Detection efficiency and AE data were produced starting in 2010. WWLLN “A” data (A-raw and A-DE) are shown for illustrative purposes and only up to 2018.
Because below-average global lightning was captured by the WWLLN in 2010 and 2011 related to the build-out of the sensor network (Fig. 1), we reprocessed the climatological mean fields for the WGLC to cover the 10-year period from 2012 to 2021. The WGLC is distributed as a monthly time series at 0.5∘ and 5 arcmin resolution, as a daily time series at 0.5∘ resolution, and as climatological monthly means at 0.5∘ and 5 arcmin. The data are distributed in CF-compliant (where CF represents Climate and Forecast model) netCDF (version 4) files.
3.1 Trends in global lightning
Global lightning increased slightly between 2020 and 2021 from 216 to 225 million strokes, and 2021 was among the years with the greatest amount of lightning observed over the past decade (Fig. 1), although not as high as the 230 million strokes recorded in 2013. Between 2012 and 2021, no obvious trend in global lightning strokes is visible in the time series that has been adjusted for detection efficiency. Interannual variability ranged from 204 to 230 million strokes (1σ ± 8.3 million) over this period. The adjustment for detection efficiency has little effect on lightning observed in 2021, increasing the total by 2.75 million strokes, or 1.2 %.
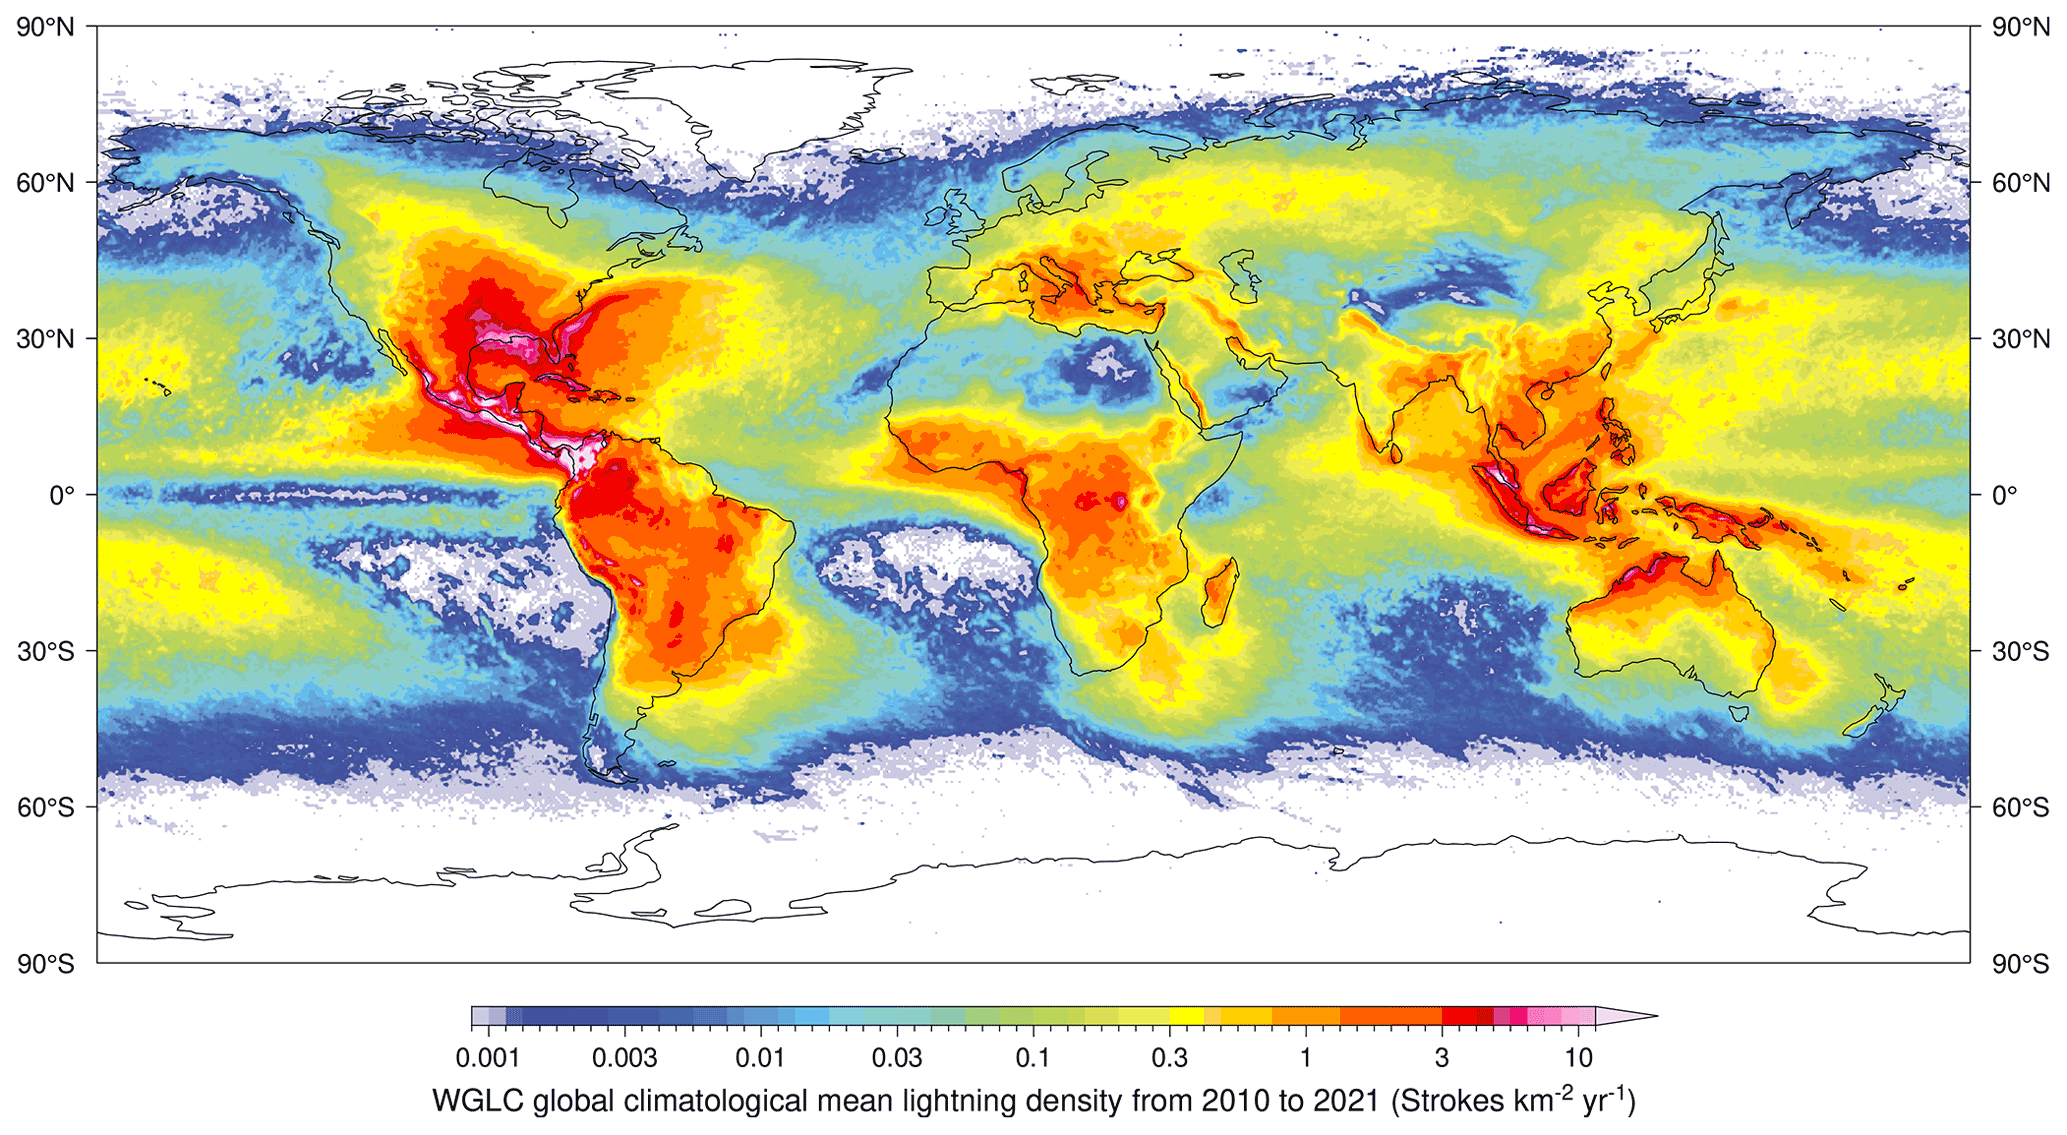
Figure 2Climatological mean annual lightning stroke density (2012–2021).
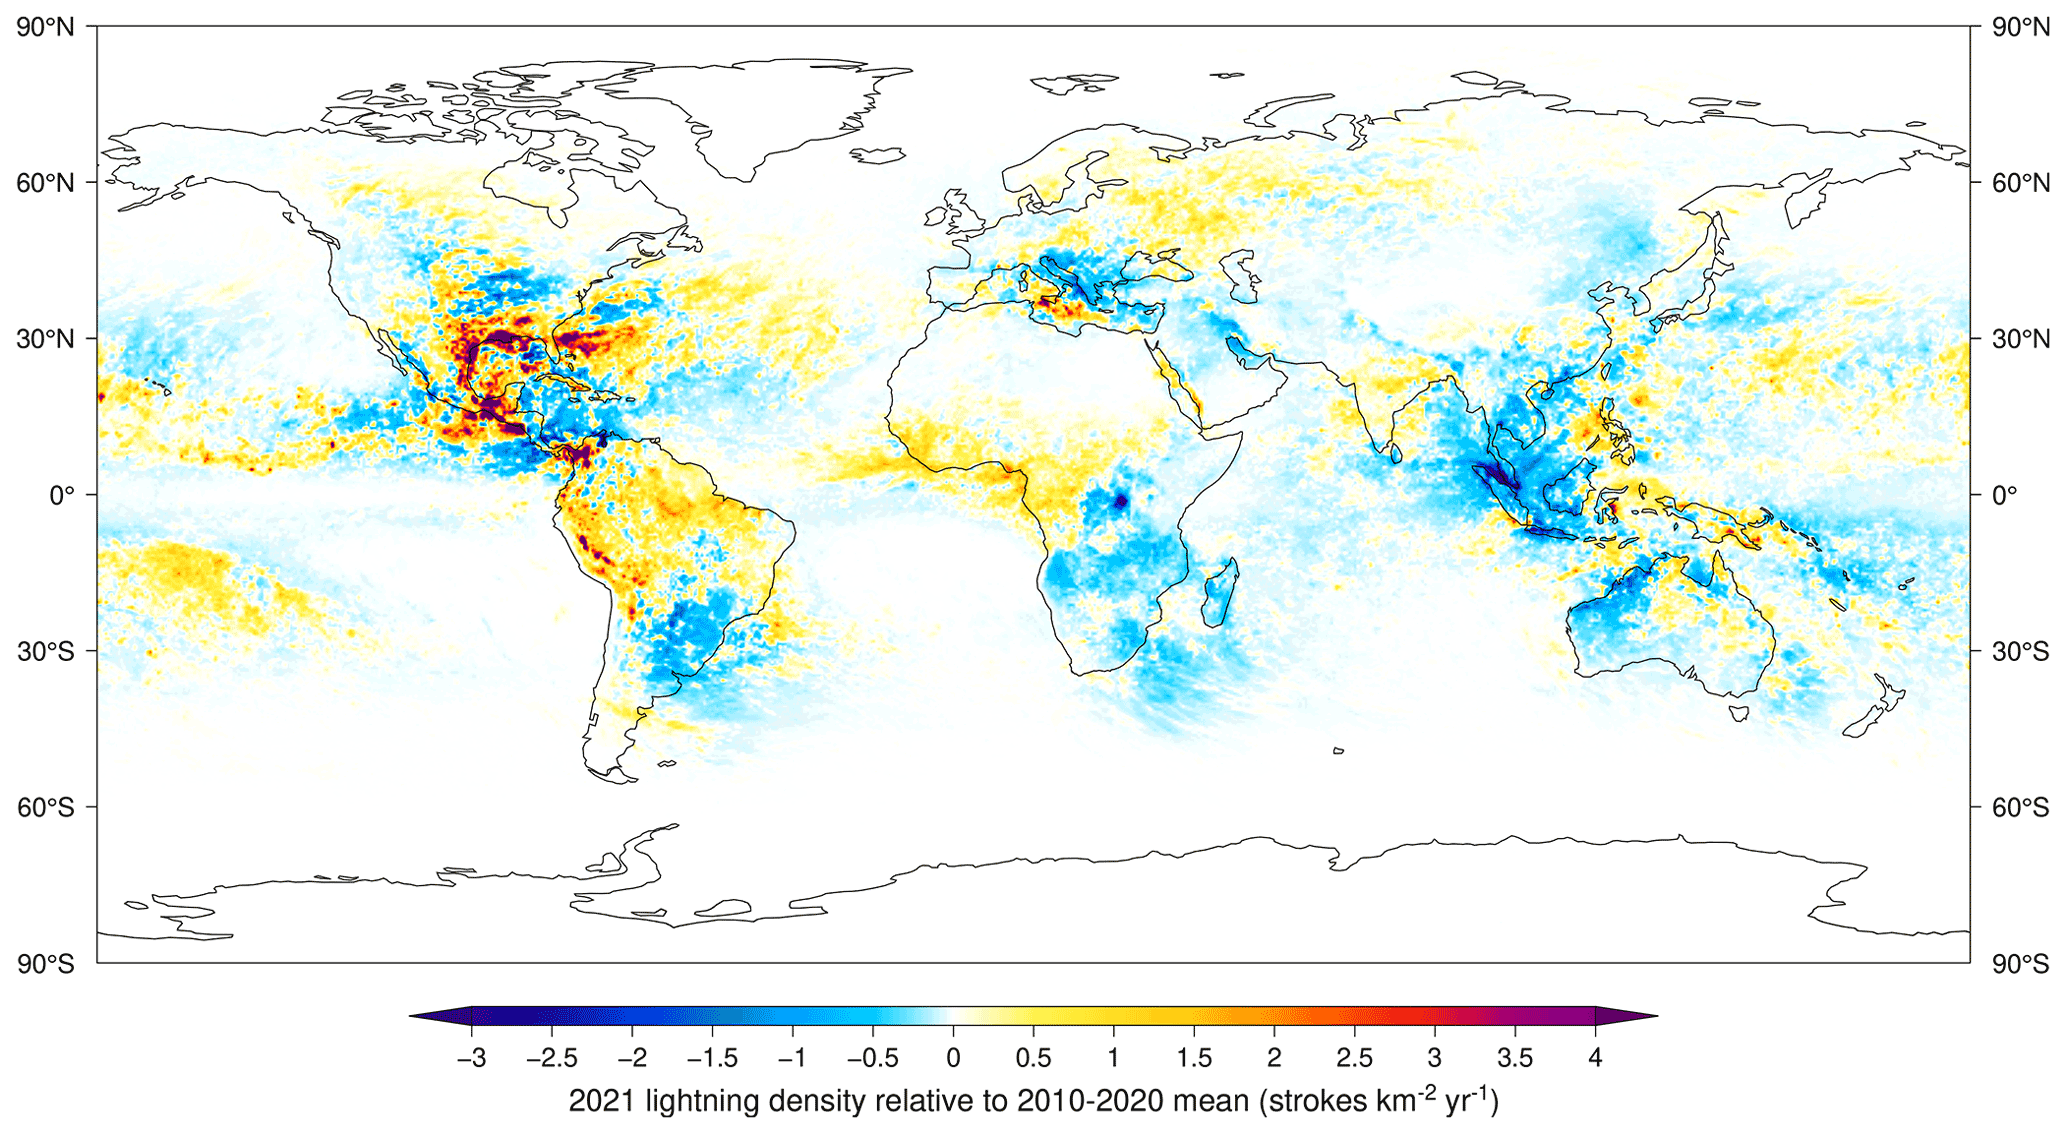
Figure 3Difference between lightning observed in 2021 and the 2010–2020 climatological mean.
3.2 Lightning observed in 2021
The spatial patterns of the new climatological mean total annual lightning over the 10-year period 2012–2021 differ little from our previous dataset (Fig. 2; Kaplan and Lau, 2021). Lightning is observed over all of Earth's land surface with the exception of the Canadian high Arctic, Greenland, and Antarctica. Lightning is also ubiquitous over the oceans, except in the Arctic, northernmost Pacific, Southern Ocean, and subtropical gyres of the Southern Hemisphere. Large amounts of lightning are observed in the tropics and subtropics, particularly over the Americas and in parts of island Southeast Asia. The greatest lightning densities are in northwestern South America and Central America and over the northern Gulf of Mexico and adjacent lands.
Despite the overall similarity in the spatial pattern of the climatological mean lightning, there were some differences in 2021 compared to the mean over the preceding years (Figs. 3 and S1 in the Supplement). In 2021, more lightning than average was recorded in the Gulf of Mexico and surrounding lands, in the tropical Pacific north and south of the Equator, off the Atlantic coast of the southeastern United States, in southern Mexico and neighboring Central America, in the northern and central parts of South America, in the central Mediterranean Sea, and over western Africa, much of India, and the easternmost South China Sea. In contrast, less lightning was recorded in mainland and island Southeast Asia, particularly over the Strait of Malacca, Java, and the South China Sea. Less lightning than average is also apparent in western Australia, west of Lake Victoria in eastern Africa, and generally across eastern and southern Africa, in southeastern South America, and over the Caribbean Sea (Fig. 3). On a seasonal basis, more lightning strokes were detected over the United States and Central America during Northern Hemisphere summer and fall (from May to October) and in the western part of the Amazon Basin during Southern Hemisphere summer (from November to February). In contrast, fewer lightning strokes were observed in the Strait of Malacca and northwestern Australia from October to March (Fig. S2 in the Supplement).
3.3 Trends in stroke power
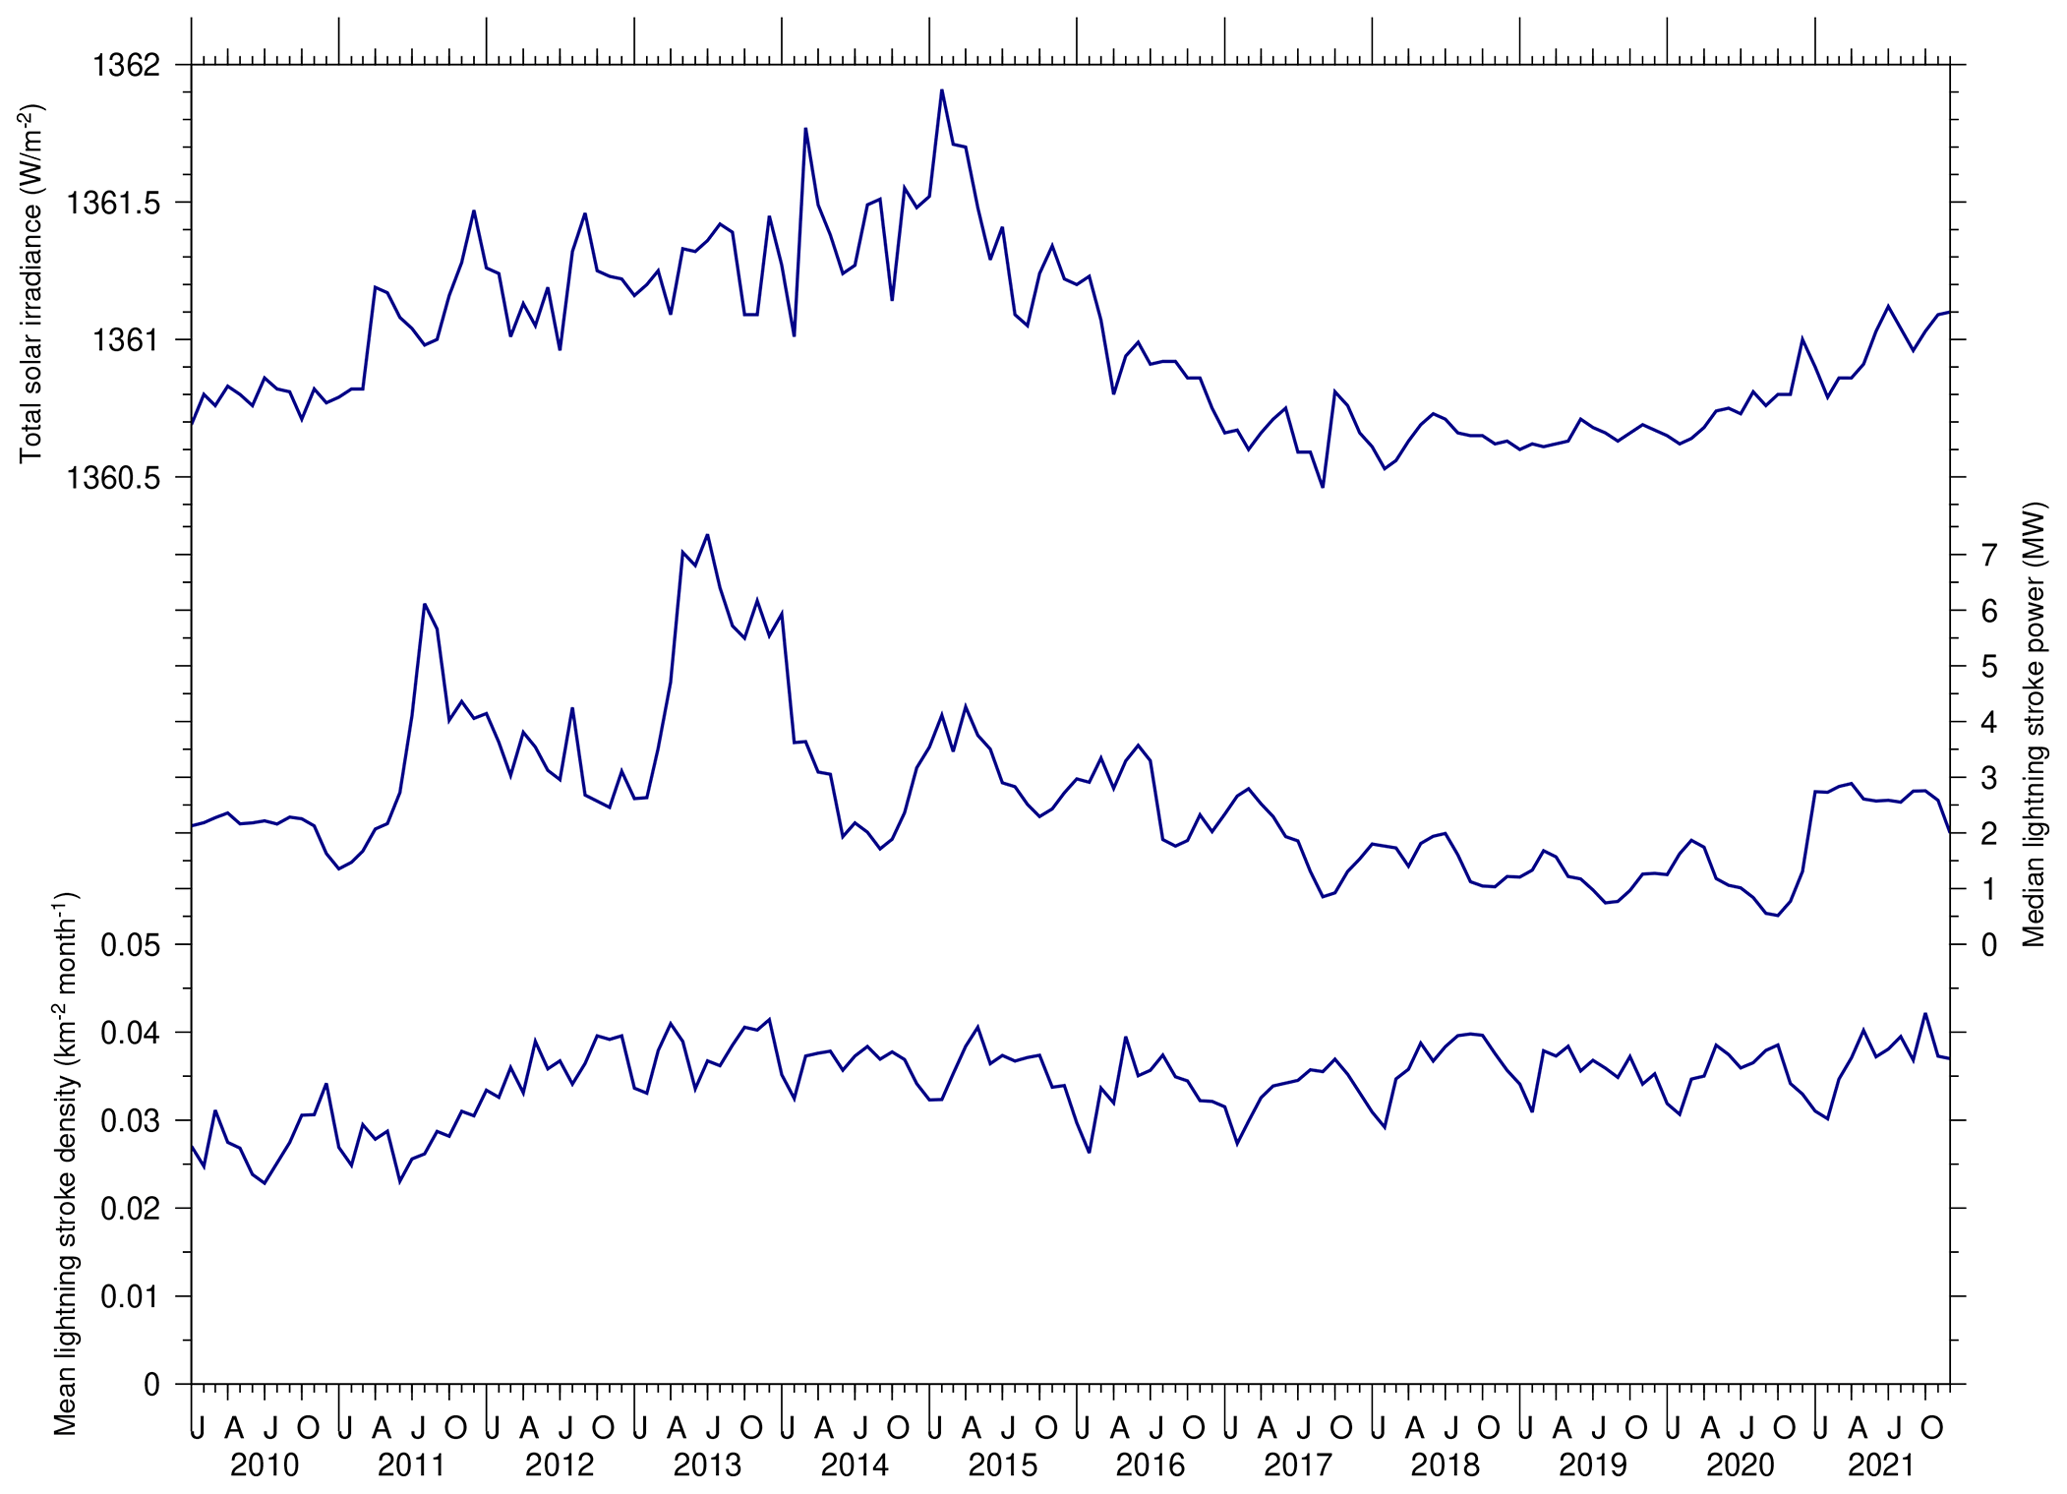
In 2021, stroke power increased slightly in comparison with previous years. Figure 4 shows monthly total solar irradiance, median lightning stroke power, and mean lightning stroke density from 2010 to 2021. Median stroke power shows substantial seasonal and interannual variability in the past decade, with a gradual decrease from a peak in March 2013 until the end of 2020. In 2021, mean annual median stroke power ranged between 2.0 and 2.8 MW throughout the year, a ca. 1 MW increase over stroke power observed between 2017 and 2020. The geographic distribution of stroke power in 2021 was similar to that observed in previous years.

Figure 5Time series of lightning over the major shipping lanes of the Bay of Bengal and South China Sea and adjacent areas (reference regions) following Thornton et al. (2017). The introduction of the IMO Global Sulfur Cap in January 2020 is marked with a dashed line.
The WGLC gridded lightning density and power fields are distributed as a time series at daily and monthly resolution and as a climatological monthly mean. The data are stored in netCDF format and are archived with Zenodo (Kaplan and Lau, 2022, https://doi.org/10.5281/zenodo.6007052).
The code used for gridding the raw stroke counts and the progressive updates to the gridded data are archived at https://doi.org/10.5281/zenodo.7389753 (Kaplan, 2022).
We suggested previously that temporal trends in lightning stroke power could be related to total solar irradiance (TSI; Kaplan and Lau, 2021), and previous studies have suggested that there could be physical mechanisms linking lightning and the solar flux (Okike and Umahi, 2019; Owens et al., 2015; Siingh et al., 2011). The 2021 lightning data do show a modest increase in median stroke power relative to the past few years, concomitant with increasing TSI in solar cycle 25 that started in early 2020. This increase in stroke power is intriguing, but it will likely take several more years of observations of both TSI and lightning to demonstrate an unequivocal link between these quantities.
The reductions in lightning over the Strait of Malacca and the South China Sea in 2021 compared to the 2010–2020 climatological mean (Fig. 3) are one of the most obvious features of the updated dataset. These major sea lanes in Southeast Asia have been recognized as lightning hotspots because aerosol emissions from shipping enhance convection and therefore lightning (Thornton et al., 2017). Analysis of the time series of lightning in and around the major Southeast Asian shipping lanes (Fig. 5) shows a general reduction in lightning over shipping lanes of the South China Sea since 2019, while lightning in the reference regions changed little; in the Indian Ocean the trend is less clear, although there seems to be some more convergence between lightning density in the shipping lanes and neighboring clean-air regions from 2018. Thornton et al. (2017) showed long-term trends of increasing lightning in the shipping lanes that we can now see were clearly an artifact of the growing detection efficiency of the WWLLN in the early part of the first decade of the 21st century (Fig. 1).
Despite the ongoing COVID-19 pandemic, there is no indication that maritime trade decreased in 2021 relative to previous years (UNCTAD, 2021). On the other hand, the International Maritime Organization's Global Sulfur Cap (IMO 2020) came into force in 2020, limiting marine bunker fuel to a sulfur content of 0.5 %. Several recent studies suggested that these new fuel standards would lead to significant reductions in marine PM2.5 emissions, particularly in East and Southeast Asia (Wang et al., 2021; Zhang et al., 2021; Sofiev et al., 2018). In addition to improving air quality, these new fuel standards may also have reduced the frequency of lightning, thereby presenting an additional benefit in terms of reduced hazards.
On the other hand, anomalously low lightning in southern Brazil, Uruguay, northeastern Argentina, eastern and southern Africa, and western Australia does not appear to be obviously related to transportation or industrial activity. India had greater-than-average lightning in 2021. These anomalies are likely related to interannual variability in precipitation and other climatic factors and deserve further study that is beyond the scope of this short communication. Although there is some indication that the ongoing COVID-19 pandemic may have led to reductions in pollution and therefore lightning (Liu et al., 2021), superficial examination of the WGLC does not reveal any immediately obvious correlations.
This 2022 update of the WGLC demonstrates several features that underscore the utility of the dataset. The WWLLN, at least after applying a detection efficiency correction, shows no long-term trend in the number of lightning strokes recorded since 2012, and we now have 10 years of quality lightning observations with which to construct global climatologies. The WGLC shows that lightning is detected worldwide, even in places with very low density, including the Arctic and over the oceans. With the availability of a decade of lightning data in the WGLC available at two spatial and three temporal resolutions, we may revisit the drivers of interannual variability in lightning summarized by Murray et al. (2012). A range of further studies could be performed in the future, even regionally, to investigate the role of climate variability and change, aerosol emissions, and solar and cosmic radiation in lightning density and stroke power. Such studies would be valuable from a risk management perspective and add value to a range of research that depends on the patterns and variability in lightning, including wildfire ignitions and the chemical composition of the atmosphere. The WGLC is free to download and will continue to be updated annually in the future.
A former version of this article was published on 6 July 2021 and is available at: https://doi.org/10.5194/essd-13-3219-2021.
The supplement related to this article is available online at: https://doi.org/10.5194/essd-14-5665-2022-supplement.
JOK conceived the datasets, developed the gridding process, and oversaw the evaluation. KHKL performed the data preprocessing and gridding and prepared the visualizations. Both authors contributed to writing the manuscript.
The contact author has declared that none of the authors has any competing interests.
Publisher's note: Copernicus Publications remains neutral with regard to jurisdictional claims in published maps and institutional affiliations.
The authors wish to thank the World Wide Lightning Location Network (http://wwlln.net, last access: 1 December 2022), a collaboration among over 50 universities and institutions, for maintaining the sensor network and providing the lightning location data used in this paper. We thank Bob Holzworth for advice and supplying us with the raw data.
This paper was edited by David Carlson and reviewed by two anonymous referees.
Kaplan, J. O.: ARVE-Research/WGLC-scripts: First release (v1.0.0), Zenodo [code], https://doi.org/10.5281/zenodo.7389753, 2022. a
Kaplan, J. O. and Lau, K. H.-K.: The WGLC global gridded lightning climatology and time series, Earth Syst. Sci. Data, 13, 3219–3237, https://doi.org/10.5194/essd-13-3219-2021, 2021. a, b, c, d, e
Kaplan, J. O. and Lau, K. H.-K.: The WWLLN Global Lightning Climatology and timeseries (WGLC), v2022.0.0, Zenodo [data set], https://doi.org/10.5281/zenodo.6007052, 2022. a, b
LASP: Monthly-averaged climate record of total solar irradiance (TSI), https://lasp.colorado.edu/lisird/data/nrl2_tsi_P1M/, last access: 20 December 2022. a
Liu, Y., Williams, E. R., Guha, A., and Said, R.: How will lightning change during the pollution-reduced COVID-19 pandemic period? A data study on the global lightning activity, in: AGU Fall meeting 2021, New Orleans, LA, USA, 13–17 December 2021, Abstract No. AE12A-02, 2021. a
Murray, L. T., Jacob, D. J., Logan, J. A., Hudman, R. C., and Koshak, W. J.: Optimized regional and interannual variability of lightning in a global chemical transport model constrained by LIS/OTD satellite data, J. Geophys. Res., 117, D20307, https://doi.org/10.1029/2012jd017934, 2012. a
Okike, O. and Umahi, A. E.: Cosmic ray – global lightning causality, J. Atmos. Sol.-Terr. Phy., 189, 35–43, https://doi.org/10.1016/j.jastp.2019.04.002, 2019. a
Owens, M. J., Scott, C. J., Bennett, A. J., Thomas, S. R., Lockwood, M., Harrison, R. G., and Lam, M. M.: Lightning as a space-weather hazard: UK thunderstorm activity modulated by the passage of the heliospheric current sheet, Geophys. Res. Lett., 42, 9624–9632, https://doi.org/10.1002/2015gl066802, 2015. a
Rodger, C. J., Brundell, J. B., Dowden, R. L., and Thomson, N. R.: Location accuracy of long distance VLF lightning locationnetwork, Ann. Geophys., 22, 747–758, https://doi.org/10.5194/angeo-22-747-2004, 2004. a
Rodger, C. J., Brundell, J. B., and Dowden, R. L.: Location accuracy of VLF World-Wide Lightning Location (WWLL) network: Post-algorithm upgrade, Ann. Geophys., 23, 277–290, https://doi.org/10.5194/angeo-23-277-2005, 2005. a
Siingh, D., Singh, R. P., Singh, A. K., Kulkarni, M. N., Gautam, A. S., and Singh, A. K.: Solar Activity, Lightning and Climate, Surv. Geophys., 32, 659–703, https://doi.org/10.1007/s10712-011-9127-1, 2011. a
Sofiev, M., Winebrake, J. J., Johansson, L., Carr, E. W., Prank, M., Soares, J., Vira, J., Kouznetsov, R., Jalkanen, J. P., and Corbett, J. J.: Cleaner fuels for ships provide public health benefits with climate tradeoffs, Nat. Commun., 9, 406, https://doi.org/10.1038/s41467-017-02774-9, 2018. a
Thornton, J. A., Virts, K. S., Holzworth, R. H., and Mitchell, T. P.: Lightning enhancement over major oceanic shipping lanes, Geophys. Res. Lett., 44, 9102–9111, https://doi.org/10.1002/2017gl074982, 2017. a, b, c
UNCTAD: Review of Maritime Transport 2021, United Nations, Geneva, 2021. a
Wang, X., Yi, W., Lv, Z., Deng, F., Zheng, S., Xu, H., Zhao, J., Liu, H., and He, K.: Ship emissions around China under gradually promoted control policies from 2016 to 2019, Atmos. Chem. Phys., 21, 13835–13853, https://doi.org/10.5194/acp-21-13835-2021, 2021. a
Zhang, Y., Eastham, S. D., Lau, A. K. H., Fung, J. C. H., and Selin, N. E.: Global air quality and health impacts of domestic and international shipping, Environ. Res. Lett., 16, 084055, https://doi.org/10.1088/1748-9326/ac146b, 2021. a