the Creative Commons Attribution 4.0 License.
the Creative Commons Attribution 4.0 License.
 | 09 Feb 2022
Distribution and characteristics of wastewater treatment plants within the global river network
Heloisa Ehalt Macedo
Bernhard Lehner
Jim Nicell
Günther Grill
Jing Li
Antonio Limtong
Ranish Shakya
The main objective of wastewater treatment plants (WWTPs) is to remove pathogens, nutrients, organics, and other pollutants from wastewater. After these contaminants are partially or fully removed through physical, biological, and/or chemical processes, the treated effluents are discharged into receiving waterbodies. However, since WWTPs cannot remove all contaminants, especially those of emerging concern, they inevitably represent concentrated point sources of residual contaminant loads into surface waters. To understand the severity and extent of the impact of treated-wastewater discharges from such facilities into rivers and lakes, as well as to identify opportunities of improved management, detailed information about WWTPs is required, including (1) their explicit geospatial locations to identify the waterbodies affected and (2) individual plant characteristics such as the population served, flow rate of effluents, and level of treatment of processed wastewater. These characteristics are especially important for contaminant fate models that are designed to assess the distribution of substances that are not typically included in environmental monitoring programs. Although there are several regional datasets that provide information on WWTP locations and characteristics, data are still lacking at a global scale, especially in developing countries. Here we introduce a spatially explicit global database, termed HydroWASTE, containing 58 502 WWTPs and their characteristics. This database was developed by combining national and regional datasets with auxiliary information to derive or complete missing WWTP characteristics, including the number of people served. A high-resolution river network with streamflow estimates was used to georeference WWTP outfall locations and calculate each plant's dilution factor (i.e., the ratio of the natural discharge of the receiving waterbody to the WWTP effluent discharge). The utility of this information was demonstrated in an assessment of the distribution of treated wastewater at a global scale. Results show that 1 200 000 km of the global river network receives wastewater input from upstream WWTPs, of which more than 90 000 km is downstream of WWTPs that offer only primary treatment. Wastewater ratios originating from WWTPs exceed 10 % in over 72 000 km of rivers, mostly in areas of high population densities in Europe, the USA, China, India, and South Africa. In addition, 2533 plants show a dilution factor of less than 10, which represents a common threshold for environmental concern. HydroWASTE can be accessed at https://doi.org/10.6084/m9.figshare.14847786.v1 (Ehalt Macedo et al., 2021).
- Article
(4637 KB) - Full-text XML
-
Supplement
(3274 KB) - BibTeX
- EndNote


In all inhabited regions of the world, the water quality of rivers, lakes, and ultimately the ocean depends on how wastewater produced from human activities in upstream areas, especially those that are densely populated, is processed and disposed. Globally produced domestic and municipal wastewater is estimated to amount to 360 km3 yr−1, of which 41 km3 yr−1 (11.4 %) is treated in wastewater treatment plants (WWTPs) and then re-used, 149 km3 yr−1 (41.4 %) is treated in WWTPs and then discharged, and 170 km3 yr−1 (47.2 %) is not treated in WWTPs but released directly into the environment (Jones et al., 2021). According to recent assessments, approximately 3.1 billion people worldwide had access to sewage systems connected to WWTPs in 2017 (WHO and UNICEF, 2019).
Although the overall goal of WWTPs is to reduce the load of pollutants reaching downstream waterbodies, they typically focus on the removal of organic matter and macro-pollutants and not pollutants of emerging concern. Thus, one of the issues of growing importance with respect to global wastewater treatment is the efficiency of removal of specific contaminants, particularly those related to new products or chemicals that are released without appropriate regulatory oversight and with uncertain or unknown effects on the environment and human health (WHO and UN Habitat, 2018). These “emerging contaminants” (e.g., pharmaceutically active compounds, microplastics, and ingredients in household and personal care products) are not commonly monitored, and most WWTPs are not designed to remove them either fully or partially before releasing effluents to nearby waterbodies. Hence, wastewater is collected from municipal sources, transported to a location where they may or may not be treated, and then released into the environment. As a result, WWTPs serve as concentrated point sources of contamination to receiving waterbodies (Daughton and Ternes, 1999; Musolff et al., 2008). Once the contamination enters the river network it continues to flow downstream, potentially accumulating with other contaminants from multiple sources along the way, to sometimes deleterious effects (UNEP, 2016; van Vliet et al., 2021).
Studies have demonstrated that the fraction of wastewater in rivers downstream of effluent discharge is directly proportional to effects on biodiversity and ecosystems (Munz et al., 2017; Neale et al., 2017; Bunzel et al., 2013). Therefore, the dilution factor (i.e., the ratio between the natural discharge of the receiving waterbody and the WWTP effluent discharge) is one of the major determinants of ecological risks originating from WWTPs (Link et al., 2017). Dilution factors have been used to predict potential exposure to down-the-drain chemicals from population density (Keller et al., 2014), which at a regional level can help prevent negative effects by identifying zones of high contaminant concentrations (i.e., “hotspots”). However, to pinpoint which waterbodies are potentially affected by treated wastewater discharged upstream, it is necessary to determine the location where these effluents are being released. This information can help in identifying which particular WWTPs should be targeted for the implementation of more stringent treatment standards and/or be upgraded through the deployment of advanced treatment technologies. For example, Rice and Westerhoff (2015) analyzed the effects of WWTP effluent locations upstream of drinking water treatment plants, and Vigiak et al. (2020) estimated the domestic waste emissions to European waters from WWTPs.
Therefore, for regulatory purposes, national and regional governments, non-governmental organizations, and commercial data providers gather information about the exact geospatial location of WWTPs and their attributes such as the population served, treated-wastewater discharge, and level of treatment. Datasets on WWTPs are available at different scales, with different attributes, and with highly variable frequencies of updates. Datasets from Europe (EEA, 2017) and from the United States (US EPA, 2016) contain information on the location and characteristics of WWTPs (e.g., generated load, treatment capacity, and level of treatment) and are easily accessed and readily available for download. In contrast, many countries, such as those throughout most of South America, Africa, eastern Europe, and Asia do not provide readily accessible information about their wastewater sector. The main sources of global wastewater information, available at the country level, are the Joint Monitoring Programme for Water Supply, Sanitation and Hygiene database (JMP-WASH) (WHO and UNICEF, 2019) and the global information system on water and agriculture, AQUASTAT (FAO, 2016). JMP-WASH provides regular global reports on drinking water and sanitation coverage for tracking progress toward the Sustainable Development Goal for clean water and sanitation (SDG 6) that has been defined by the United Nations (Herrera, 2019). AQUASTAT provides data on water resources and water use, with an emphasis on agricultural water management.
Also at the global scale, Jones et al. (2021) recently produced a modeled, spatially disaggregated map of the amounts of wastewater production, collection, treatment, and re-use. Besides estimating previously unavailable country-level wastewater statistics, the authors downscaled the country-level data to a 5 arcmin resolution grid using return-flow data from the global hydrological model PCR-GLOBWB 2 (PCRaster Global Water Balance). Nonetheless, the new dataset includes neither the exact point location of treatment plants, the location of their individual discharges into the stream network, nor the level of treatment of processed wastewater. Some web interface platforms such as Wikimapia and OpenStreetMap also provide WWTP locations as point coordinates. Both platforms are built based on contributions from users around the world and are free for public use. The information is global and constantly updated. However, user input may not be equally distributed in space; thus some regions are incomplete. Furthermore, the locations are not necessarily verified, and information other than point coordinates is often missing. Currently no comprehensive global database of geolocated WWTPs exists.
One of the main applications of WWTP datasets with spatially explicit locations is in water quality modeling, representing point sources of contaminants discharged into the river and lake system. In Europe, the Urban Waste Water Treatment Directive (UWWTD) (EEA, 2017) has been used as input data in water quality models for pharmaceuticals and nanoparticles, such as ePiE (Oldenkamp et al., 2018) and GWAVA (Dumont et al., 2015). In the United States, WWTP information from the Clean Watersheds Needs Survey (CWNS) (US EPA, 2016) has been incorporated in the models PhATE (Anderson et al., 2004) and iSTREEM (Kapo et al., 2016) to assess the concentration of pharmaceuticals and other chemicals in river systems. In Canada and China, WWTP information from government sectors was used as an input for the contaminant fate module of the river-routing model HydroROUT (Grill et al., 2016, 2018).
Whereas these existing contaminant fate models operate from local to regional scales, i.e., from catchments to continents, water pollution is of global concern. Robust estimates of current and future changes in water quality are needed to support global environmental and health risk decision making and to sustainably manage water resources to ensure clean and accessible water for all, as required by SDG 6 (Van Vliet et al., 2019; Tang et al., 2019; Strokal et al., 2019). To achieve this goal, global water quality assessments must be spatially consistent and comparable to be able to identify hotspots of contamination and trends in water pollution over time and across large regions. Global water quality models can also account for large-scale drivers that might not be captured by small-scale models (Tang et al., 2019). One of the main challenges for global water quality modeling is the lack of spatial consistency in datasets for model inputs, especially in regions where data are insufficient for a detailed assessment (Strokal et al., 2019; Tang et al., 2019; Kroeze et al., 2016). Due to the limited information on global wastewater, all published global water quality models until now (e.g., GLOBAL-FATE, Global NEWS, WorldQual, GlowPa, and IMAGE-GNM) quantify the load of wastewater into the river system using population density and national sanitation statistics as proxies (e.g., Font et al., 2019; Strokal et al., 2019; Mayorga et al., 2010; Van Drecht et al., 2009; Williams et al., 2012; Beusen et al., 2015; Hofstra et al., 2013). More specifically, calculations are typically based on the fractions of population connected to sewage systems per country.
To address this important shortcoming, the objective of the presented study is to develop a novel global database of WWTPs as a means for estimating the distribution of treated wastewater in the global river network at high spatial resolution. The database, termed HydroWASTE, includes the explicit geospatial locations of WWTPs, their main characteristics, and their linkages to the global river and lake network.
2.1 Development of HydroWASTE
To create HydroWASTE, three main steps were undertaken, as shown in Fig. 1: (1) the combination of national and regional datasets, including the correction of errors using the WWTP point locations and attributes available; (2) the georeferencing of WWTPs to a global river network, in order to connect the facilities to their receiving waterbodies; and (3) the estimation of missing attributes for each WWTP, including the population served, treated-wastewater discharge, and level of treatment, using geospatial methods and auxiliary datasets such as modeled river discharge estimates, gridded global population numbers, gross national income per capita, and country-level statistics on sanitation.
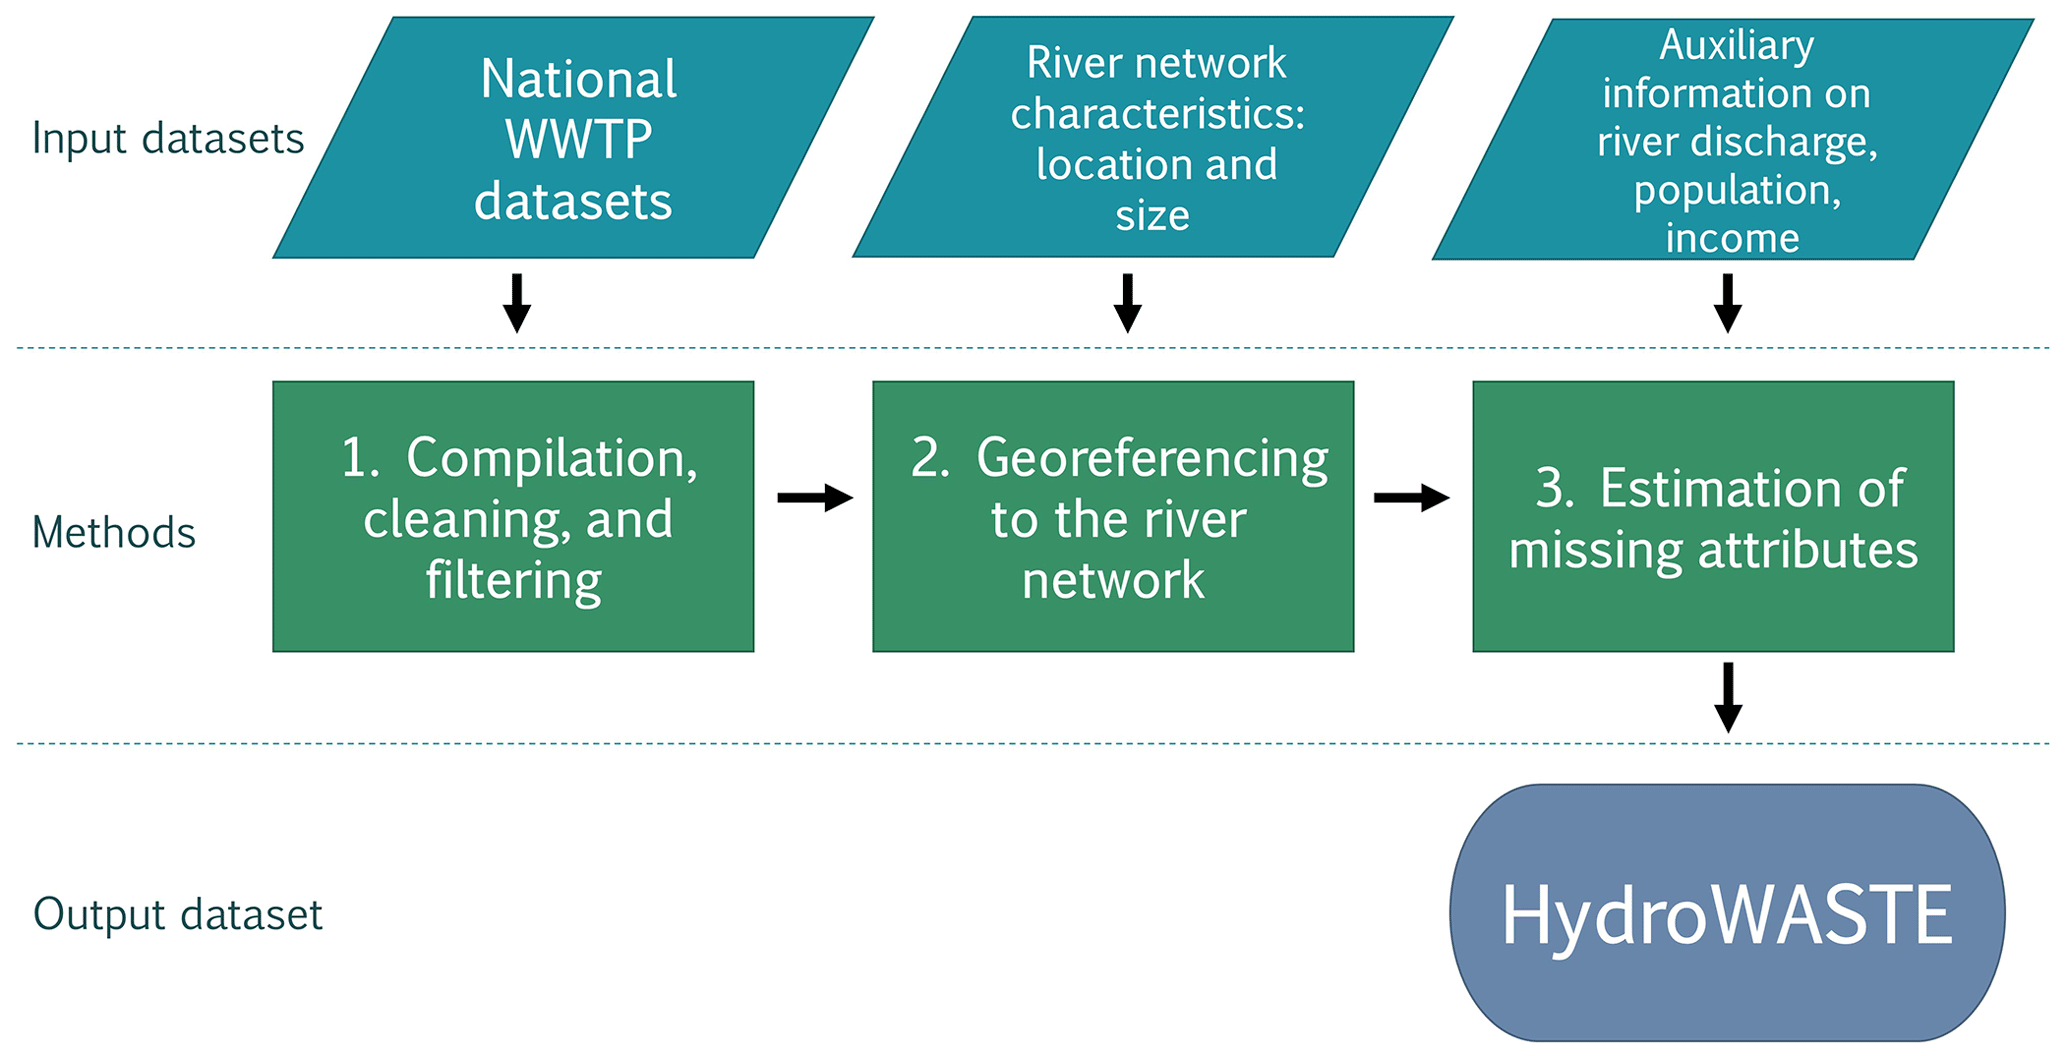
Figure 1Conceptual overview of the methodology used to create the global database of wastewater treatment plants, HydroWASTE.
The design of HydroWASTE was tailored for its potential application in water quality modeling. The main attributes that are typically required to simulate the wastewater component in water quality models include the following (Grill et al., 2016, 2018): (1) the WWTP's location (point coordinates); (2) the estimated effluent outfall location (linkage between a WWTP and river network); (3) the number of people served by the WWTP; (4) the amount of treated-wastewater discharge; and (5) the level of treatment offered by the WWTP classified as primary, secondary, or advanced (which includes tertiary and any other processes that reduce the level of contaminants in the wastewater below that attainable through secondary treatment). The WWTP location is a necessary requirement for any spatially explicit assessment that is based on point sources of effluents discharged through WWTPs. Beyond knowing the actual location of the plant, it is also important to provide the approximate effluent outfall location into the local river network, which can differ substantially from the WWTP location. The number of people served by WWTPs is required to estimate contaminant loads that reach the facility, while the treated-wastewater discharge and the corresponding level of treatment provide the basis for calculating the loads of treated or untreated contaminants that are discharged by the facility into receiving waterbodies. If no data concerning the population served are available, treated-wastewater discharge can be used in lieu of this, provided that a reasonable conversion factor between the two can be estimated (see Sect. 2.1.4 below). Some of these attributes can be directly compiled from national or regional WWTP datasets, after applying the necessary unit conversions and quality checks. Other attributes must be estimated based on geographical and statistical methods.
2.1.1 Cleaning, filtering, and combing WWTP national datasets
After intensive literature and online searches, several national (or multi-national/regional in the case of Europe) WWTP datasets were identified that provide the geographic location of WWTPs, as well as a varying list of additional attribute information such as the population served, amount of effluents discharged, and level of treatment (Table 1). In cases of multiple datasets being available for the same country, such as in the case of the USA or for individual European countries, the most comprehensive or most consistent dataset was chosen rather than merging all available data in order to avoid issues of duplicate records. In most cases, datasets were retrieved from pertinent government agencies through publicly accessible website platforms or personal communication. The quality, completeness, and consistency of the datasets strongly vary among the different sources and nations. For all countries where no national data repositories were available, WWTP point locations (without further attribute information) were added from the open-source web platform of OpenStreetMap (OSM; https://www.openstreetmap.org/, last access: October 2019).
Table 1National and regional datasets included in the HydroWASTE database with their reported attributes. For comparison, country-level statistics of the population served, as provided by the JMP-WASH database (WHO and UNICEF, 2019), and treated-wastewater discharge, as provided by Jones et al. (2021), are listed. For more information on the individual datasets, see Sect. S1 of the Supplement.
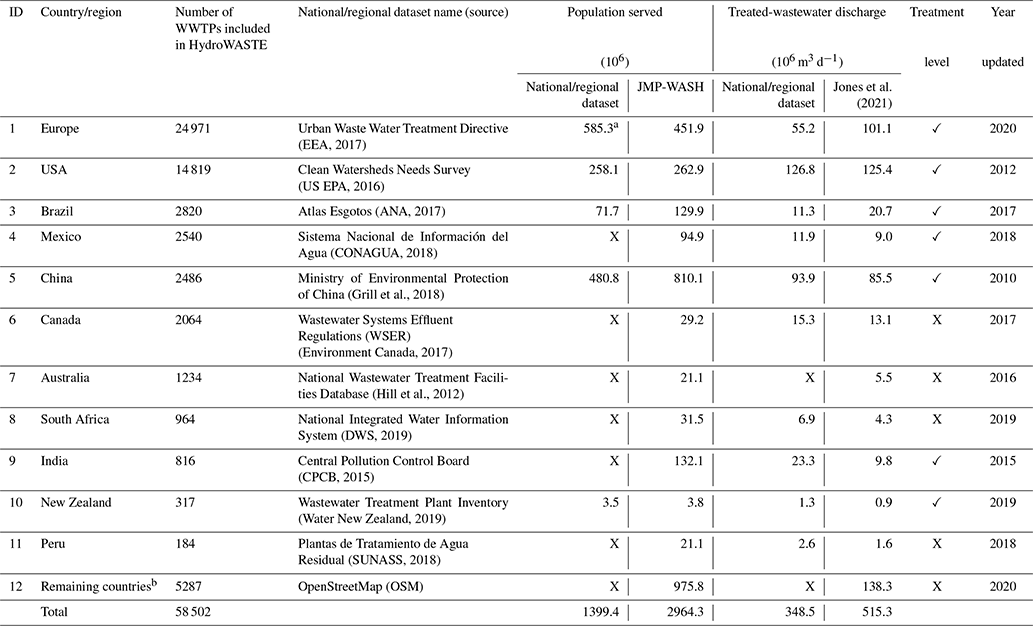
✓Data mostly available with few exceptions. X Data not available. a Capacity of WWTP reported in terms of population equivalent. b The countries with the most records were Russia (1269), Malaysia (484), Japan (378), Belarus (348), Turkey (319), and Argentina (143).
The selected datasets listed in Table 1 use different attribute nomenclatures and reporting units. For example, in the European dataset, the population size is reported in terms of “population equivalent”; that is, it assumes one person produces 54 g of dissolved organic pollutants, expressed as biological oxygen demand (BOD) per 24 h. Therefore, it accounts not only for permanent residents of the surrounding area but also for ambient populations, i.e., for differences between daytime and nighttime populations, including tourists (Nakada et al., 2017). The term “population served”, as used in most national datasets, generally refers to the population physically connected to the particular WWTP, thus paying fees for the service (Daughton, 2012). Regarding the reported value of treated-wastewater discharge, many national/regional datasets, including those of the USA and Europe, provide explicit values for both “design capacity” and “wastewater treated”. Where available, we used wastewater treated to refer to the amount of treated-wastewater discharge (the type of attribute per record is identified in the HydroWASTE database).
Filtering was necessary for some datasets that include additional records not regarding WWTPs, especially for the most comprehensive datasets of the USA and Europe. These datasets include records of decentralized wastewater treatment systems, stormwater facilities, and other wastewater collection systems that are not connected to a WWTP. Some datasets include records with geographic coordinates outside the expected national or regional boundaries, which were assumed to be errors and removed from HydroWASTE. More details about each dataset can be found in Sect. S1 of the Supplement.
2.1.2 Auxiliary datasets
River network attributes
To assign the estimated effluent outfall location of each WWTP, various raster and vector layers representing the river network and catchment boundaries were obtained from a global hydrographic database termed HydroSHEDS (Lehner et al., 2008), which was derived from digital elevation data provided by NASA's Shuttle Radar Topography Mission (SRTM) at 90 m (3 arcsec) resolution. For our study, we used a standardized derivative of this database, termed HydroATLAS (Linke et al., 2019), that offers sub-basin delineations at 12 hierarchical levels of increasingly finer subdivisions. We applied the smallest sub-basin breakdown of level 12, which provides 1 034 083 sub-basins globally with an average area of 130.6 km2 (standard deviation of 146.9 km2). HydroATLAS also offers a preprocessed river network, including discharge information, that was extracted at 500 m (15 arcsec) grid cell resolution and represents all rivers and streams where the average discharge exceeds 100 L s−1 or the upstream catchment area exceeds 10 km2 or both. Long-term (i.e., 1971–2000) average natural river discharge estimates were provided by the global hydrological model WaterGAP version 2.2 (Water – Global Assessment and Prognosis; Müller Schmied et al., 2014), which were downscaled from their original resolution of 0.5∘ grid cells to the HydroSHEDS resolution of 500 m using geostatistical techniques (Lehner and Grill, 2013). To assess dilution factors and treated-wastewater ratios in the global river system at low-flow conditions, we used the minimum discharge as provided in the HydroATLAS database, i.e., the lowest monthly flow value within an average year.
Country-level wastewater statistics
To infer missing attributes in the WWTP records, global datasets with information on wastewater at a country level were used.
Treated-wastewater discharge at the country level was provided by Jones et al. (2021), who collected and standardized data from online sources, especially the Food and Agriculture Organization's (FAO) AQUASTAT database, Global Water Intelligence (GWI), the European Statistical Office (Eurostat), and the United Nations Statistics Division (UNSD). The study provides data for the year 2015, and, where data were unavailable, the authors used multiple linear regressions to estimate the values.
The World Health Organization and the United Nations Children's Fund (WHO/UNICEF) Joint Monitoring Program (JMP) for Water Supply, Sanitation and Hygiene (WASH) is responsible for monitoring the SDG target related to WASH (WHO and UNICEF, 2019). For this study, we acquired sanitation data for each country for the year 2017. The information selected is termed “Proportion of population using improved sanitation facilities (sewer connections)”.
Population grid
Global gridded population distributions of the year 2015 from the WorldPop dataset (WorldPop and CIESIN, 2018) were disaggregated from their original spatial resolution of 1 km to the same resolution (500 m) as the applied HydroATLAS data to allow for spatially consistent calculations. WorldPop was produced using a combination of census, geospatial, and remotely sensed data in a spatial-modeling framework (Tatem, 2017).
Gross national income (GNI) per capita
The World Bank divides economies into four income groups (i.e., low, lower-middle, upper-middle, and high) based on gross national income (GNI) per capita (in US dollars), calculated using the World Bank Atlas method (World Bank, 2019). This indicator not only refers to the economy but also correlates with other non-monetary measures of quality of life. Here, the GNI of 2019 was used to classify countries based on their capacity to deploy different levels of wastewater treatment.
2.1.3 Georeferencing WWTP outfall locations to the global river network
A requirement for any spatially explicit water quality assessment that includes WWTPs is to know the approximate location at which each plant's effluents are discharged into a waterbody, i.e., typically a river, a lake, or the ocean. In reality, the location of the effluent discharge into the environment may be distinct from the WWTP's actual location, influenced by several local factors not easily obtainable and applicable at a global scale, such as environmental policies, political and social conventions, ecosystem characteristics, land use, and local conditions such as the presence of interfering pipelines and canals. Therefore, the reported WWTP locations used in this study are warranted neither to represent their actual outfall locations nor to intersect with the existing river network. In addition, due to inherent quality limitations of the global HydroATLAS river network, which was derived from a digital elevation model, and the applied spatial resolution of 500 m, the river locations do not always correspond to reality, especially for small streams.
Given these uncertainties, we developed a rule-based procedure within a geographic information system (GIS) to estimate a representative point of connection between each WWTP and the river network (referred to herein as the estimated outfall location) using the following rule set: (1) the outfall location should be within a predefined radius from the given WWTP point location; (2) only locations with average natural stream flows exceeding 100 L s−1 or with an upstream catchment area exceeding 10 km2 are considered possible outfall locations to avoid allocation to very small streams; (3) if multiple options are available, priority should be given to larger rivers under the assumption that effluents are generally directed towards larger rivers to increase dilution; and (4) the location should be within the same sub-basin as the WWTP itself to avoid misallocation to close rivers across a watershed divide. By design, this rule set assigns the outfall location to be downstream of the WWTP location (towards larger rivers), and this downstream allocation will generally reduce cases where effluents are (possibly erroneously) assigned to very small streams which could cause excessive estimates of treated-wastewater concentrations in follow-up water quality assessments. We thus consider the described procedure to deliver a best-guess association within the given river network with an intended bias to deliver conservative results in terms of environmental risk studies. It is also important to note that the estimated outfall locations should not be interpreted as true and precise geographic locations.
The predefined radius wherein the estimated outfall location can be assigned to a river was set at 10 km. This choice was based on a statistical-determination process using a subset of WWTPs and remote sensing imagery for manual verification (see Sect. S2.3). If the closest location of connection to a river is further than 10 km, then the estimated outfall of the WWTP was georeferenced to that location, independent of distance, provided that all other rules still apply. In cases where the WWTP location is close to the sub-basin outlet, limiting the estimated outfall location to less than 10 km away from the WWTP location, the outfall location was additionally moved one grid cell (∼ 500 m) further downstream, that is, into the next sub-basin and thus to a larger river, while keeping it close to the original WWTP location and in the same overarching basin (Fig. 2).
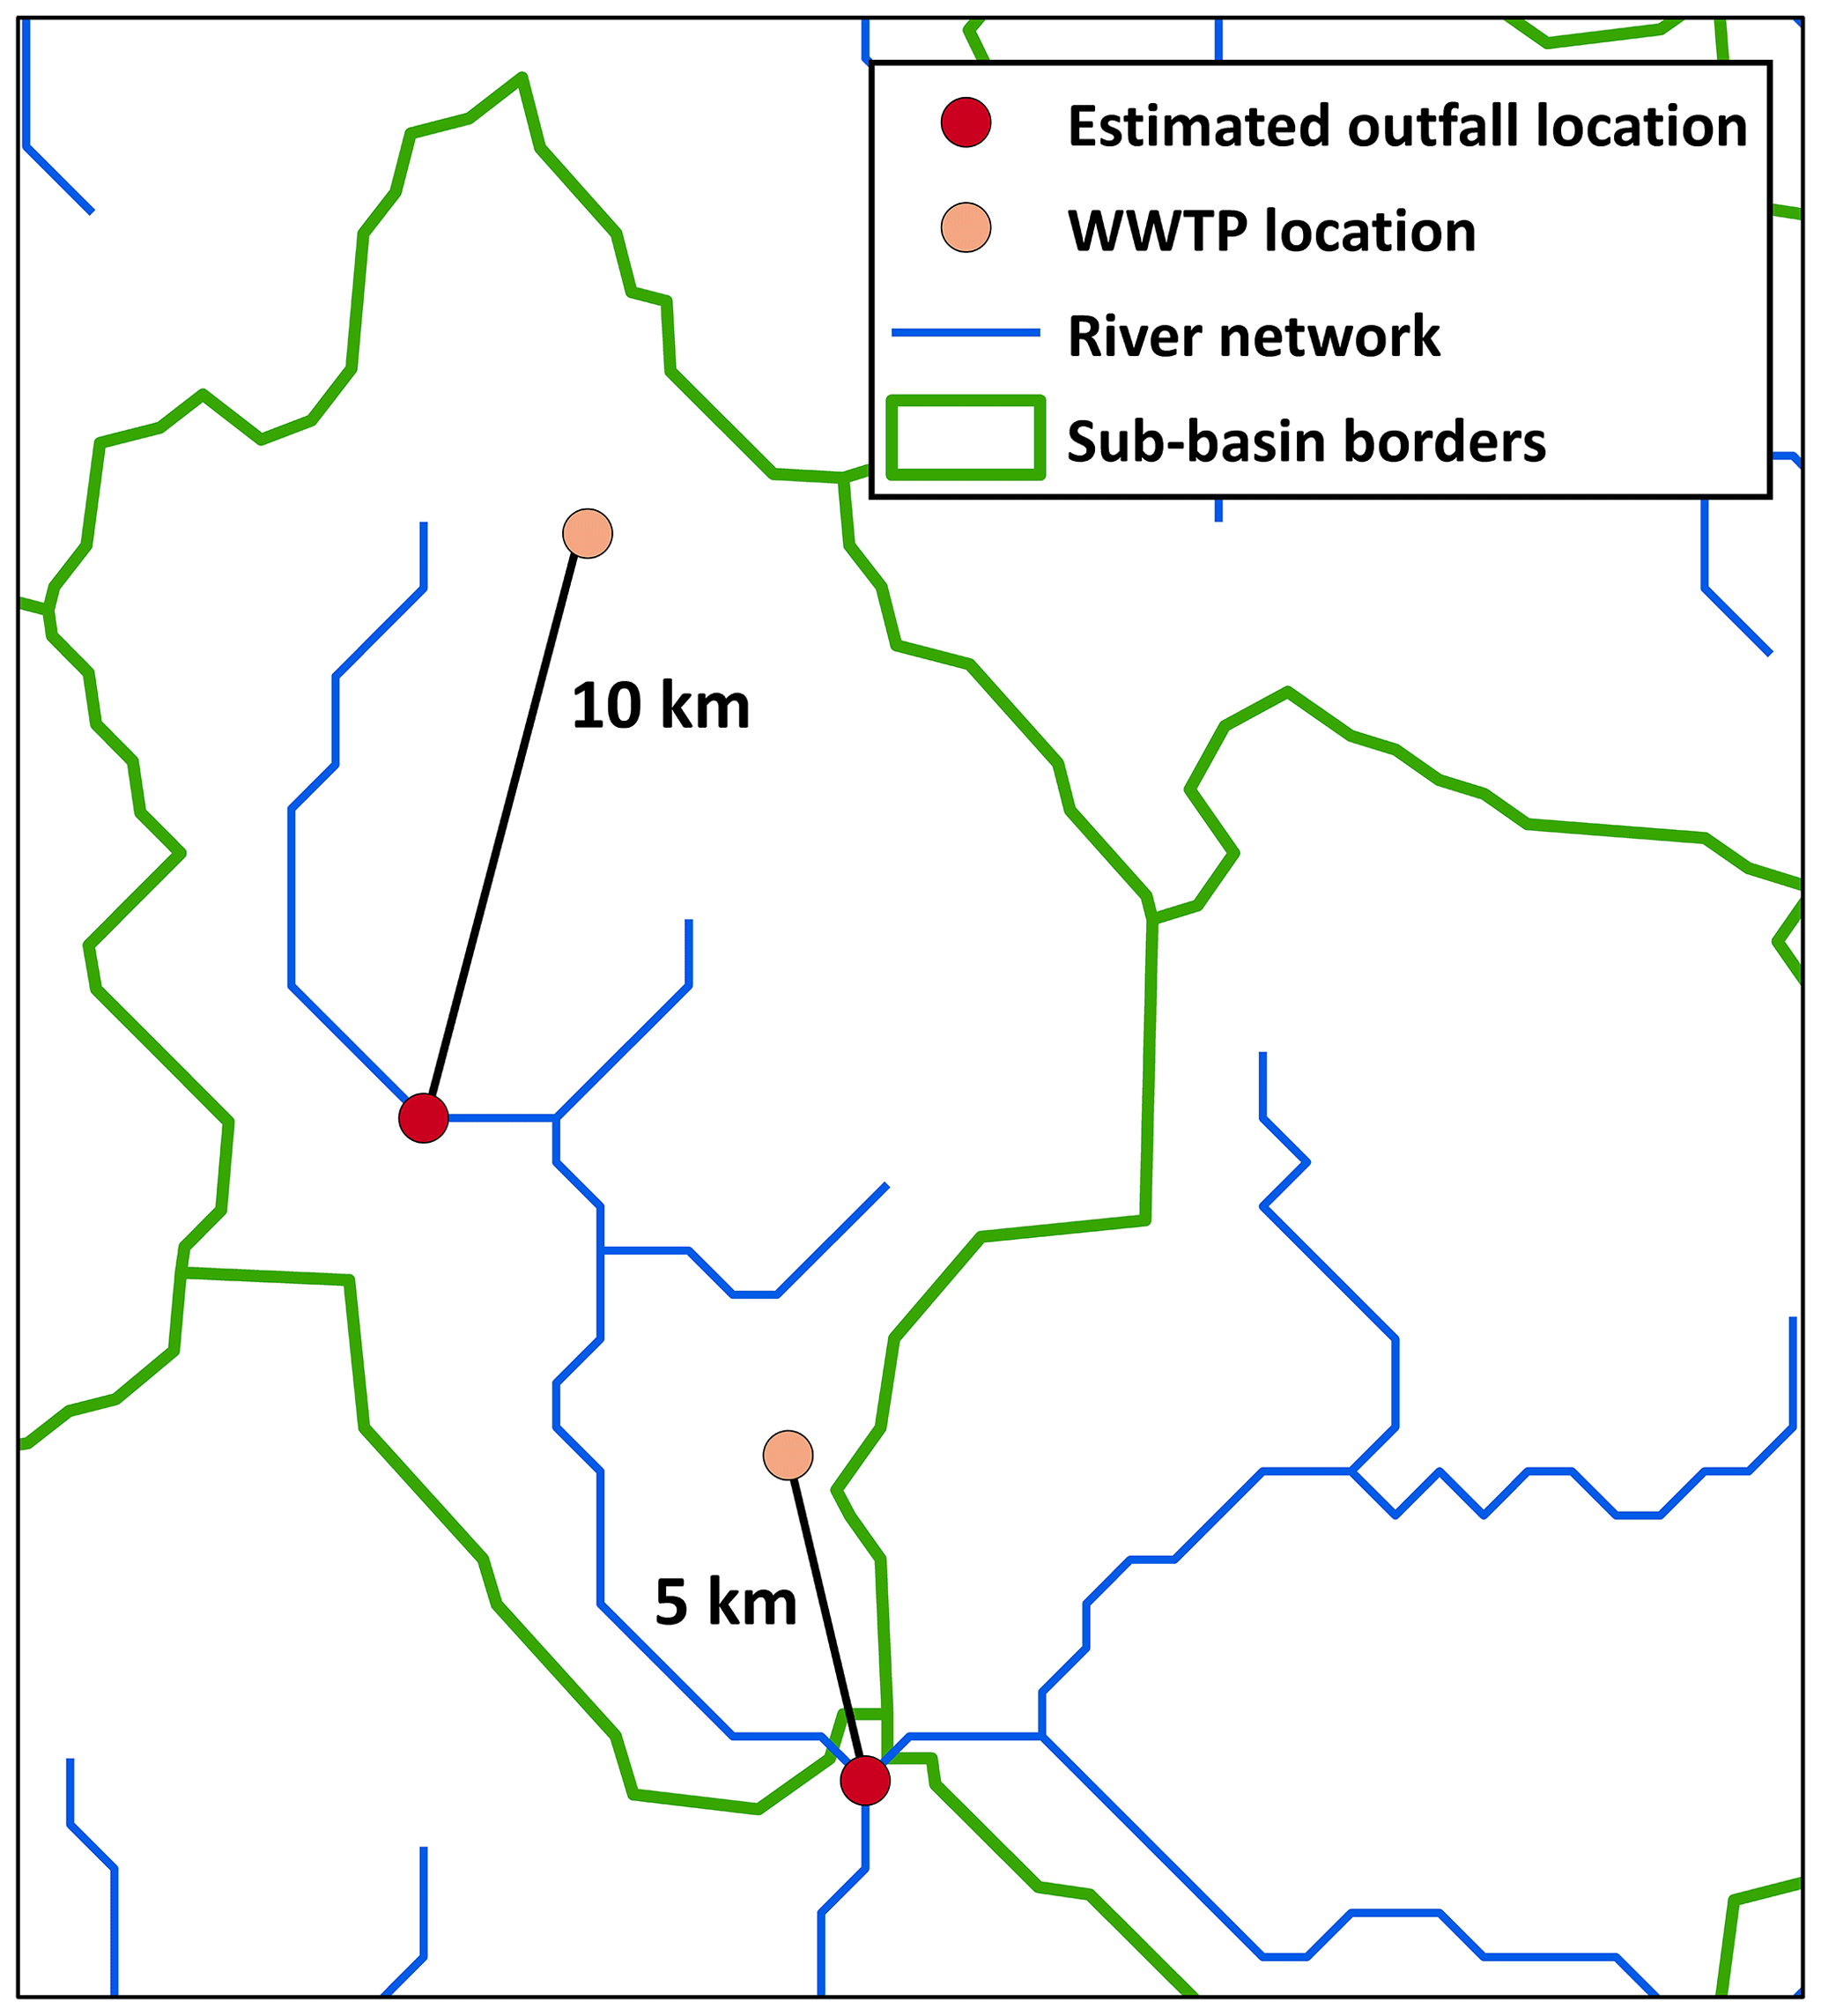
Figure 2Example of georeferencing process to assign WWTP effluent outfall locations. See text for more explanations.
2.1.4 Estimation of missing attributes
As a prerequisite for many applications, such as the development of a global contaminant fate model, the characteristics of WWTPs should be consistent throughout the database. Based on previous studies of contaminant fate in rivers (Grill et al., 2016, 2018; Strokal et al., 2019), the three most important attributes required to produce realistic contaminant load estimates are the (1) number of people served, (2) total treated wastewater discharged by the plant, and (3) level of treatment (i.e., primary, secondary, or advanced).
The availability of these three attributes in the original source data is highly variable between countries (Table 1). For instance, while data for the USA, New Zealand, Brazil, and China provide information on all three attributes, all other regions lack at least one of them, including Europe, India, Canada, and Mexico with two attributes and large parts of Africa, South America, Asia, and Australia only offering the WWTP location. For all incomplete data records, we thus inferred the missing attributes based on auxiliary information related to wastewater, such as reported country-level statistics on water use, sanitation, and the economy, as well as population distributions.
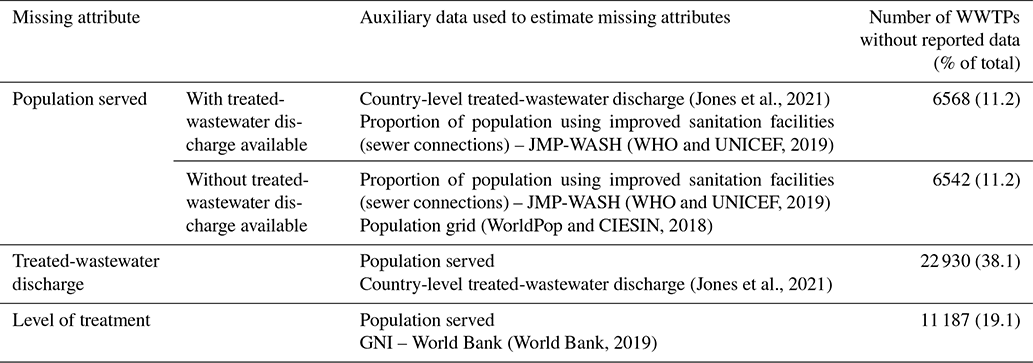
Table 2 provides an overview of the extent of missing data and the auxiliary data that were used to fill the gaps. Processing steps are explained in more detail below. Note that the order in which the missing data were estimated is predetermined: we first completed the records of population served as the results then informed the estimation of treated-wastewater discharge and level of treatment.
Table 2Summary of approaches used to estimate missing WWTP attributes based on auxiliary data.
Population served
For WWTP records that did not include information on the population served by the plant, we estimated this attribute by using up to three different approaches (A1, A2, and A3; see Sect. S3 for more information), depending on data availability and based on the following assumptions: (A1) the population served is directly related to the treated-wastewater discharge of the WWTP; (A2) the population served should reside within relatively close proximity to the WWTP; and (A3) the treatment capacity of the WWTP cannot overload the receiving river's capacity for dilution. The latter assumption is based on the fact that governments typically regulate WWTP effluents to remain within specified dilution limits to mitigate adverse effects of pollution on aquatic ecosystems downstream (Link et al., 2017; Munz et al., 2017; Neale et al., 2017). Once the different population values were estimated, the minimum value was selected to represent the limit of the WWTP's capacity in terms of the population served. We chose the minimum to avoid excessive estimates of WWTP treatment capacities and the population served, which could impair subsequent water quality assessments.
For the first approach (A1) we estimated the number of people served, Pest, using the ratio between the plant's treated-wastewater discharge, Wrep (as reported in the WWTP national dataset), and country-level statistics of treated wastewater per capita, U (as reported by Jones et al., 2021):
We tested the validity of the relationship described by Eq. (1) using countries with complete data availability (see Sect. S3.1 for details), which confirmed a strong overall correlation (R2=0.80; n=28 497). If the total treated wastewater for a certain country was recorded as 0 in the reference dataset, U was substituted by the average treated wastewater per capita for the countries in the same economic group based on their GNI (World Bank, 2019).
For the second approach (A2) the method to estimate the maximum population served depended again on whether the WWTP record contained information on treated-wastewater discharge or not. If no attribute was included, the maximum population served was estimated as the total population surrounding the WWTP within a radius of 11 km, using WorldPop population counts. This radius size was determined based on the outcome of a sensitivity analysis (see Sect. S3.2). In the geospatial analysis, we ensured that each person in a region was served by only one plant, thereby avoiding double counting. In contrast, if a treated-wastewater discharge attribute was available, the total population surrounding each WWTP was computed within a radius of variable size, based on the initial value of the population served as calculated using approach A1. All WWTP records were grouped into four size categories of the population served: <50 000; 50 000–100 000; 100 000–500 000; and ≥500 000 people. The radius assigned for each group was 5, 10, 20, and 30 km, respectively. This radius assignment was based on tests using the national dataset of India (see Sect. S3.3).
For the third approach (A3), we used the dilution factor, DF, as defined by Eq. (2) to determine the limit of the WWTP's treated-wastewater discharge, W, into the receiving river's average natural discharge, Q, at the estimated outfall location (see Sect. 2.1.3 above). Q is provided by the HydroATLAS dataset (see Sect. 2.1.2 above).
The minimum DF recommended by the European Medicines Agency (EMA) for environmental risk assessments of medicinal products for human use is 10 (EMA, 2006). However, this can sometimes differ in reality. Rice and Westerhoff (2017) found a wastewater ratio higher than 50 % for over 900 streams receiving wastewater in the USA, i.e., representing a DF equal or lower than 3. For the development of HydroWASTE, we therefore applied a minimum DF of 5; i.e., WWTPs can be assigned maximum populations that would lead to effluent loads exceeding the EMA recommendation yet within the range of values that are observed in reality. For WWTPs that have estimated outfall locations within 50 km of the ocean or a large lake (defined as those with a surface area larger than 500 km2 in the global HydroLAKES dataset; Messager et al., 2016), we assume that environmental regulations are less restrictive, since there is a large waterbody nearby that could greatly dilute the effluent. For this reason, A3 is not applied for these WWTPs. The maximum population served, Pmax, that the river could support was then calculated by solving Eq. (2) for W (using DFmin=5) and inserting it into Eq. (1), resulting in
In cases where the treated-wastewater discharge is not reported (Table 2), only approaches A2 and A3 were used, which causes a higher level of uncertainty in these cases.
Finally, the minimum value among approaches A1, A2, or A3 was selected as the WWTPs estimate of population served (see Sect. S3.4 for an evaluation of each approach and the effect of using the minimum). A correction was applied if the sum of the estimated population served by WWTPs in a country, Ptot, exceeded the total national population connected to sewers, Pstat, as reported by the JMP-WASH database. In this case, the estimated population served by each WWTP was multiplied by a reduction factor (F) to ensure that the total population served per country would not surpass national statistics:
This correction was not applied for any country that reported population served in its national WWTP dataset.
Treated-wastewater discharge
Since a WWTP's wastewater discharge is directly related to the population served, Eq. (1) was modified to estimate the treated-wastewater discharge (West) from the reported or estimated population served (P) for all WWTP records that did not report on this attribute:
Level of treatment
The level of treatment of each WWTP was estimated based on the GNI per capita per annum categorization as defined by the World Bank for all countries, generally reflecting the observation that high-income countries have a higher probability of advanced wastewater treatment than low-income countries. The applied relationships between income, the population served, and the level of treatment were determined based on national datasets that reported the level of treatment (see Sect. S3.5 for details). As a result, for countries in the high-income group (GNI ≥ USD 12 536), if the population served by the WWTP exceeds 3000 (i.e., in predominantly urban settings), the level of treatment was set as advanced; otherwise, secondary treatment was assumed. For middle-income countries (GNI between USD 1036 and USD 12 535), the level of treatment was set as secondary. We did not find any WWTP regional datasets for countries from the low-income group (GNI ≤ USD 1035). We assumed that the level of treatment is the most basic, i.e., primary, in these countries, which may lead to some underestimations of their actual treatment potential.
2.2 Application of HydroWASTE to estimate dilution factors and treated-wastewater ratios in global rivers
The dilution factor was calculated for all WWTP records in HydroWASTE at the estimated outfall location using Eq. (2). The assessment was conducted for both average and minimum discharge conditions, i.e., using long-term natural average and minimum river discharge, respectively, as reported in the HydroATLAS database (see Sect. 2.1.2 above). For WWTPs where the outfall location coincides with a lake from the HydroLAKES dataset (Messager et al., 2016), DF was calculated based on the natural discharge at the outflow of the lake to the river network. Since there is no meaningful value for direct discharge into the ocean or a large lake (i.e., lakes with a surface area larger than 500 km2), the DF for WWTPs where the estimated outfall location is within 10 km of the ocean or a large lake is assumed to be infinite. This conservative assumption was made to avoid the potentially erroneous assignment of very low DF values for WWTPs located near a large waterbody (but on a small stream) given the plausible option that the WWTP can discharge its effluents directly into the lake or ocean, e.g., by artificial over- or underground drainage, to increase dilution and ensure regulatory compliance.
Finally, since dilution factors are used only as a regulatory compliance factor for WWTP effluents, i.e., determined for each WWTP location individually, we also assessed the distribution of treated wastewater throughout the entire global river network by calculating the ratio of accumulated treated wastewater to natural discharge in every river reach. As with DFs, the assessment was conducted for both average and minimum river discharge conditions. For this, the wastewater quantities discharged from all WWTPs were routed and accumulated downstream, from the estimated effluent outfall locations to the ocean, and divided by the long-term natural average and minimum river discharge, respectively, as provided for all river reaches in the HydroATLAS database (see Sect. 2.1.2 above). The WWTPs reported as “closed”, “decommissioned”, or “non-operational” were included in this analysis for their potential as source of residues in river sediments from former discharge (Thiebault et al., 2021). This process was performed using the river-routing model HydroROUT (Lehner and Grill, 2013).
3.1 HydroWASTE: a global WWTP database
HydroWASTE contains a total of 58 502 WWTPs, each including reported or estimated attributes concerning the population served, treated-wastewater discharge, and level of treatment. From these, 58 278 records were successfully georeferenced to the global river network of HydroATLAS. The remaining 224 WWTPs were not linked to the river network, as they were located on small islands or in small coastal basins and are thus assumed to discharge directly to the ocean. The average distance between the WWTP location in the source data and its estimated effluent outfall location is 6.5±3.1 km with a maximum distance of 21.8 km.
Figure 3 presents the spatial distribution of WWTPs in HydroWASTE. Europe and the USA show the highest densities of WWTPs, whereas China and India have somewhat lower densities but much larger facilities (i.e., a higher population served; see Table 3). Figure 3 also shows the comprehensiveness of the reported attributes of each regional dataset and an evaluation of HydroWASTE's population served against the JMP-WASH database (WHO and UNICEF, 2019). Since we limited our estimated values of the population served so that they did not surpass the country-level records, most errors correspond to underestimations of the population served. Exceptions occur in many European countries; here, the population served was calculated from reported values in terms of population equivalent, which includes not only permanent residents but also the ambient population and, thus, can exceed the reported national population values in the JMP-WASH database.
Table 3Top 20 countries that have the largest numbers of people served by WWTPs according to the HydroWASTE database and their total amount of treated-wastewater discharge. The country-level statistics for population served and treated-wastewater discharge were obtained from the JMP-WASH database (WHO and UNICEF, 2019) and Jones et al. (2021), respectively. Under-/overestimation is calculated using the error percentage formula “((HydroWASTE − Country-level statistics)Country-level statistics) ×100”. For a complete list of all countries, see Table S5.
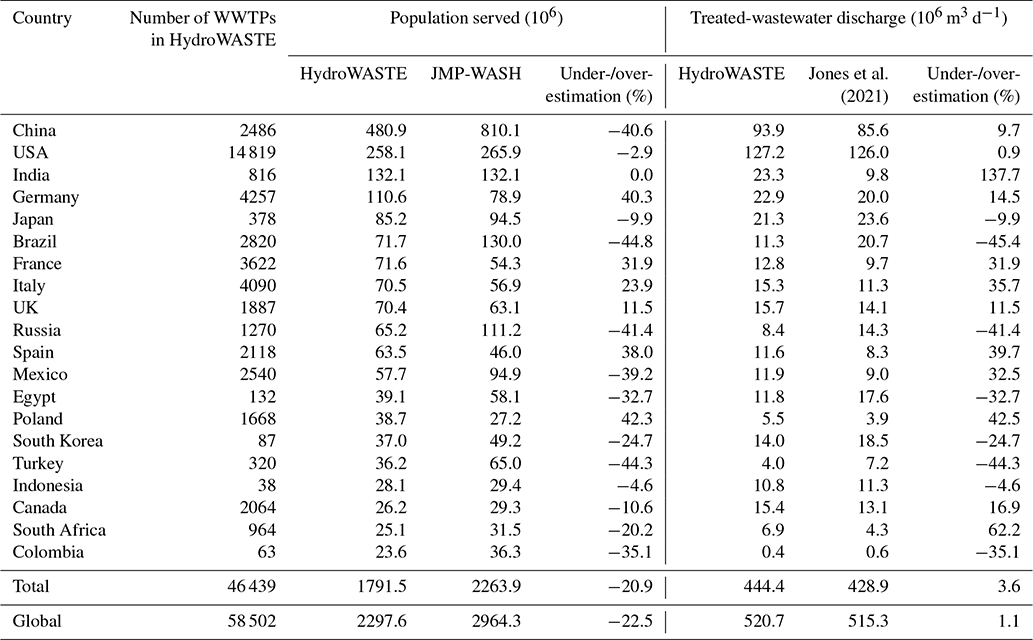
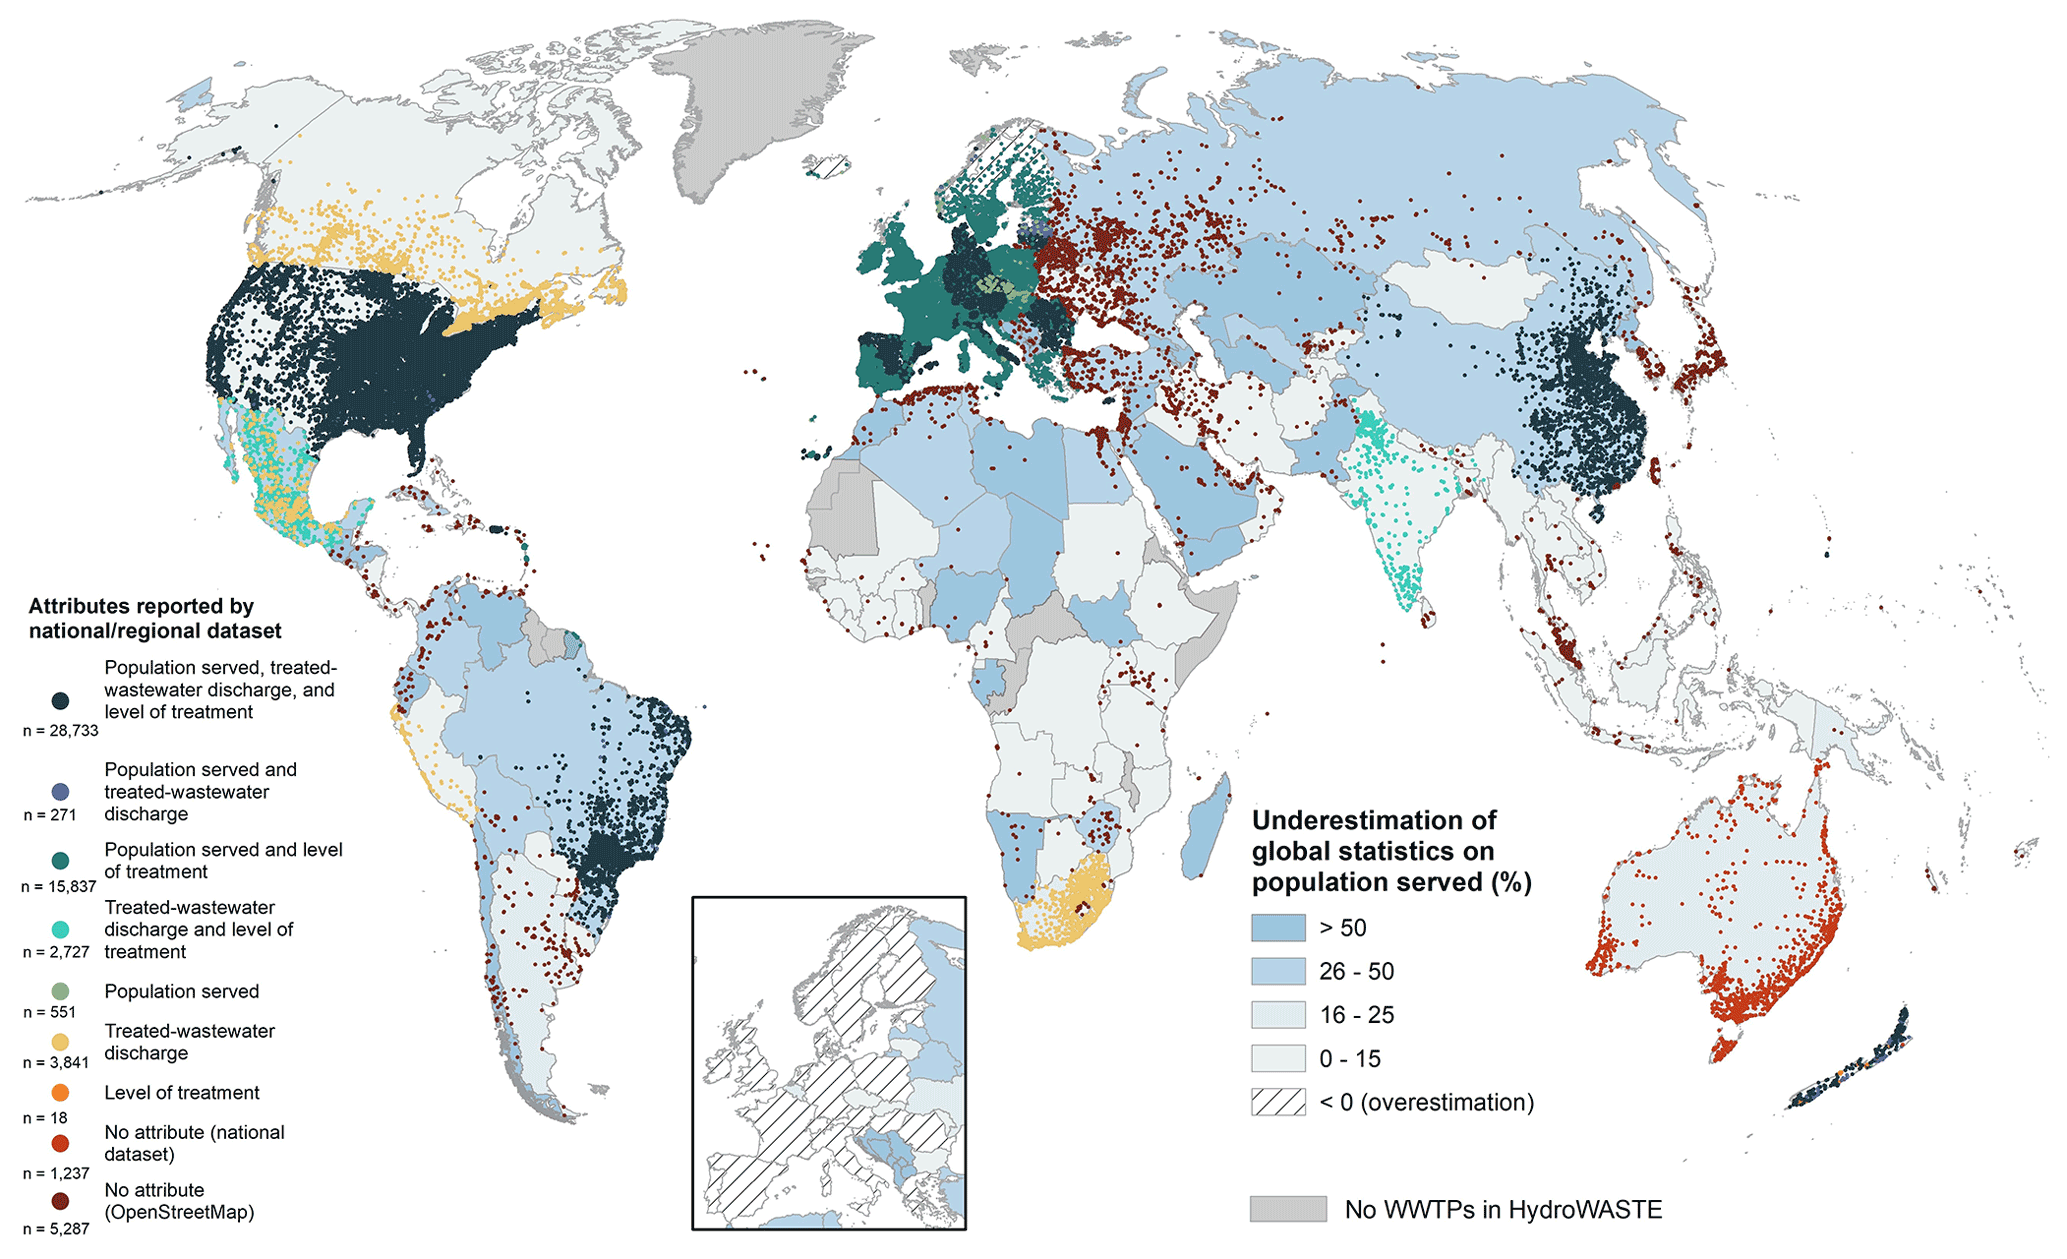
Figure 3WWTP locations, attributes, and completeness of population served in HydroWASTE. Each point represents a WWTP, with colors depicting their reported attribute completeness with respect to the population served, treated-wastewater discharge, and level of treatment. The country's area shading reflects the underestimation of the total population served per country in HydroWASTE as compared to global country statistics reported by JMP-WASH (WHO and UNICEF, 2019). Due to the high point density in Europe, an inset was added to show the underlying country shading.
Table 3 provides an overview of the 20 countries with the largest numbers of people served by WWTPs in HydroWASTE. These countries contribute around 83 % of the total global treated wastewater (Jones et al., 2021). Table 3 also includes the attributes reported by JMP-WASH (WHO and UNICEF, 2019) and Jones et al. (2021) for each country for comparison. For the population served, the results confirm that HydroWASTE tends to overestimate values for European countries compared to JMP-WASH data, whereas for other countries it tends to underestimate them (due to incomplete records), leading to an overall global underestimation of 22.5 %. However, an over- or underestimated value of the population served does not directly translate to equally over- or underestimated values of treated-wastewater discharge. In fact, total global treated-wastewater discharge from HydroWASTE overestimates the reported global value by Jones et al. (2021) by 1.1 %. The USA is the country with the best accordance regarding both attributes analyzed, reflecting a presumed high level of data completeness and quality in HydroWASTE. But even if we removed the datasets from the USA, Europe, and Canada from the comparison, HydroWASTE still covers 92 % of the reported treated-wastewater discharge by Jones et al. (2021) (see Table S5).
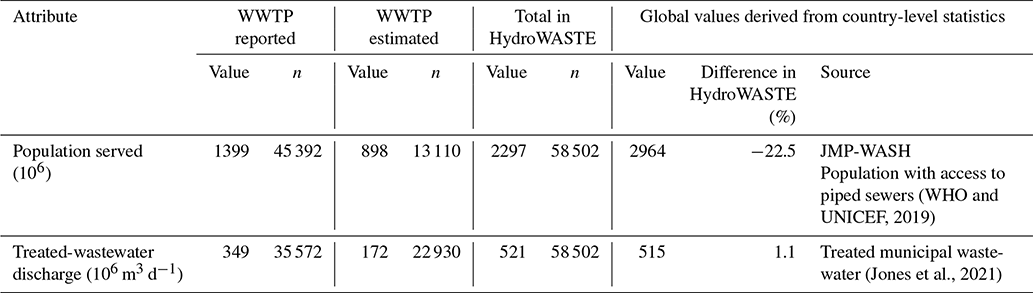
In terms of missing attribute information that was not reported but was instead complemented using statistical methods, we assigned 39 % of the total population served and 33 % of the total treated-wastewater discharge in HydroWASTE through statistical estimates (Table 4).
Table 4Global treated-wastewater discharge and population served by WWTPs, according to HydroWASTE database and as provided by reported global values derived from country-level statistics. Reported WWTP data were provided by regional datasets (Table 1). Estimated WWTP data were derived using statistical methods (see Sect. 2.1.4). n is the number of WWTP records in HydroWASTE.
In order to evaluate the robustness of the methods applied to estimate the population served and treated-wastewater discharge for records with missing information, we used a subset of 28 497 WWTPs in HydroWASTE that have reported values of both attributes (see Sect. S3.1 and Table S1 for details on these data). We applied the same methods as for the completion of missing attributes to additionally create an estimated value of both reported attributes in this WWTP subset. Figure 4 shows the comparison between the reported and the estimated values. For the population served, 97.6 % of the estimated values were within 1 order of magnitude of reported values, while for treated-wastewater discharge 99.1 % remained within 1 order of magnitude.
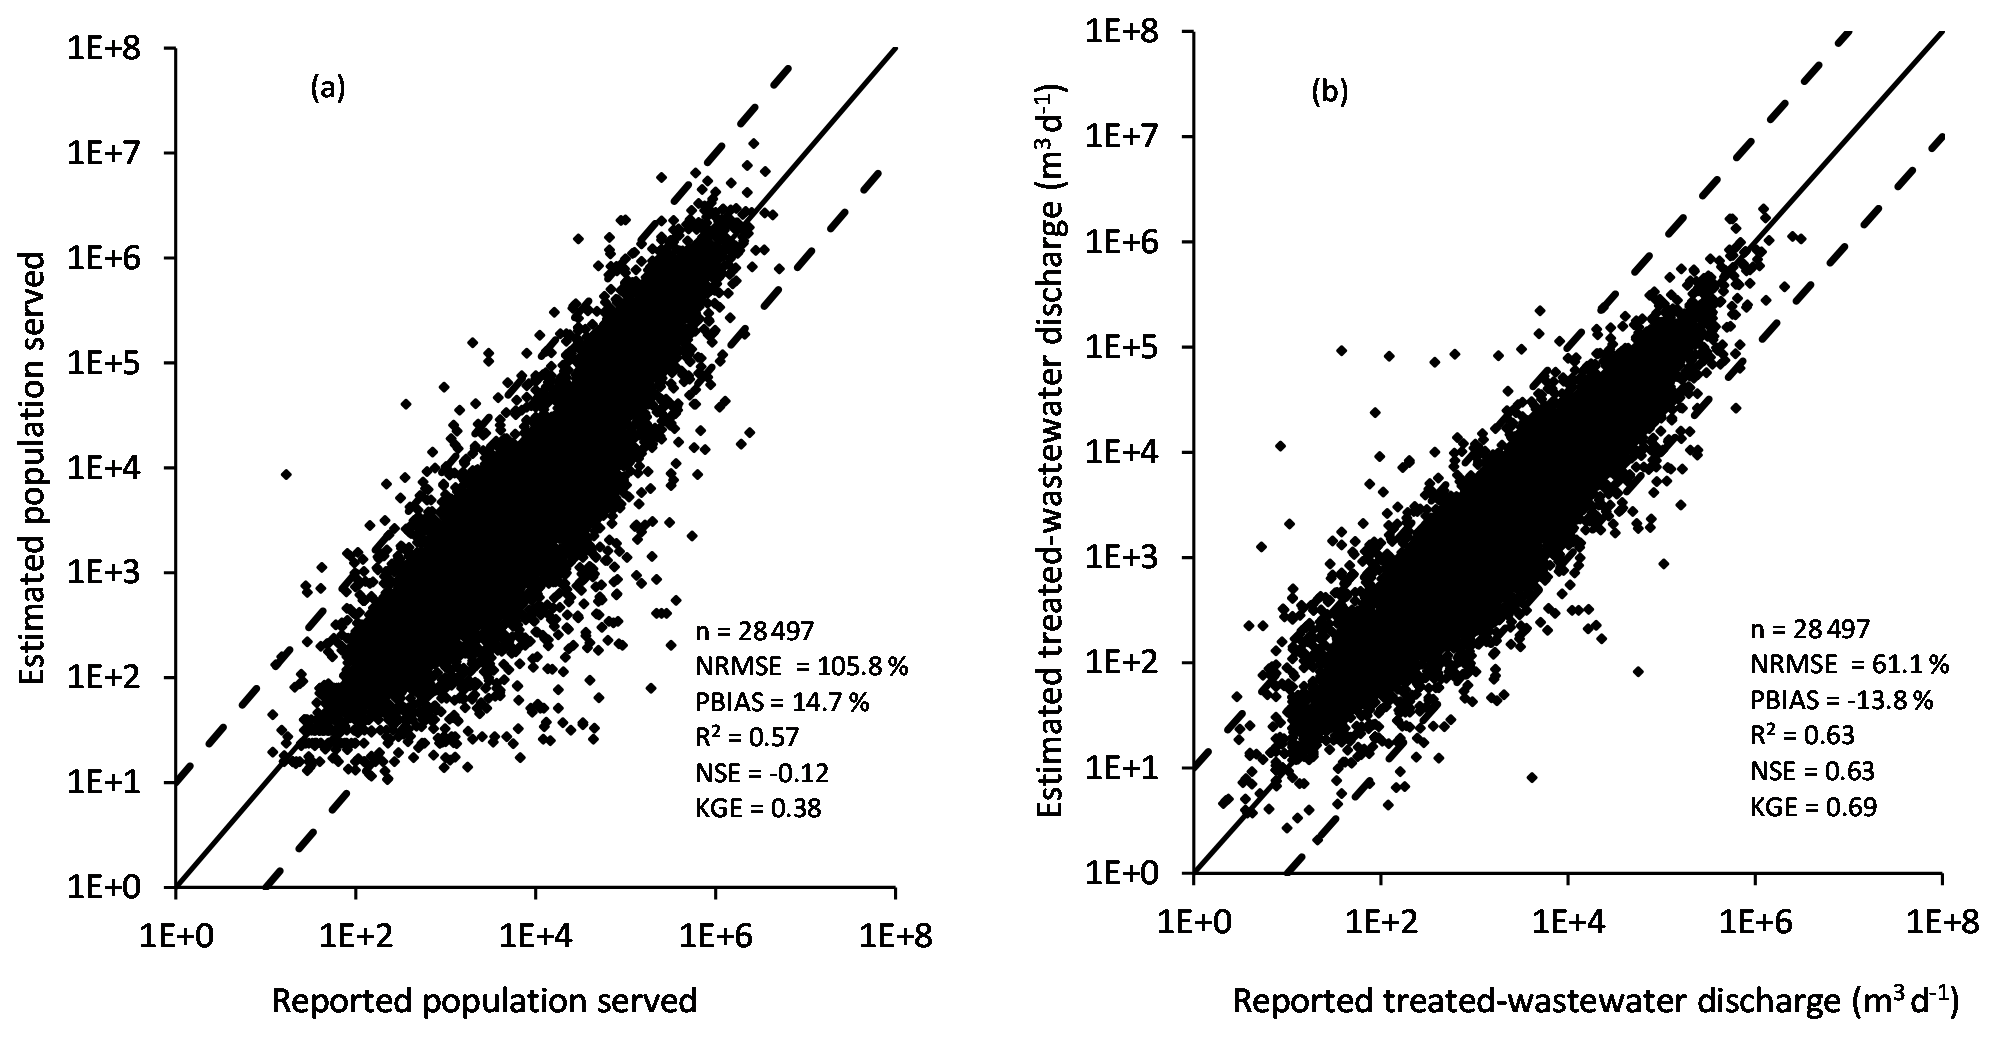
Figure 4Evaluation of the method used to estimate missing attributes (see text for more explanations): population served (a) and treated-wastewater discharge (b). n is the number of records; NRMSE is the normalized root mean square error; PBIAS is the percent bias; NSE is the Nash–Sutcliffe efficiency; and KGE is the Kling–Gupta efficiency. The solid line represents the 1:1 line, and the dashed lines represent the error lines of 1 order of magnitude.
The method to predict the level of treatment for WWTPs that lacked this attribute was evaluated by applying it to all WWTPs with reported levels of treatment (n=47 315). Overall, our model could correctly predict the level of treatment for 70 % of plants (Table 5). The “primary” treatment level could not be validated, as this treatment level was predicted only for low-income countries, yet no reported data were available for this income category to compare against.
Table 5Level of treatment according to the HydroWASTE database. The reported values are provided by the national datasets compiled, and the estimated values were produced using methods described in Sect. 2.1.4. “Correct prediction of reported treatment level” refers to the percentage of correct classifications using our prediction model.
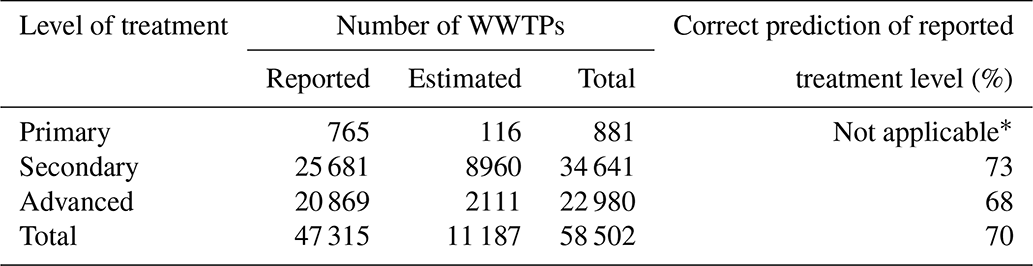
* No national dataset from a country in the low-income category was available that included this attribute.
3.2 Global dilution factors
The dilution factors (DFs) were calculated for every WWTP record using Eq. (2), except for (1) WWTPs that have their outfall location less than 10 km from large lakes or the ocean (n= 10 445), for which we assigned an infinite DF (see Sect. 2.2 for more details); (2) WWTPs that reported treated-wastewater discharge as 0 (n=175); and (3) WWTPs not connected to the river network (n=224). For average-flow conditions, the median calculated DF among the analyzed WWTPs in HydroWASTE (47 302) is 570, but 2533 (5.4 %) of the plants had a DF value below 10, i.e., lower than the recommended threshold for environmental regulations (EMA, 2006). For low-flow conditions, the median DF decreases to 203, and the number of WWTPs having a value below 10 increases to 5712 (12.1 %). Figure 5 shows the cumulative frequency distribution of DFs calculated from HydroWASTE using average river discharge (for low-flow conditions, see Fig. S6).
As part of the methods to estimate missing attributes, Eq. (3) required the setting of a minimum DF (see Sect. 2.1.4 above) to estimate the upper limit of the population served. We set this DF value to be 5 and applied it to a total of 479 WWTPs, which represent 19 % of all plants with DFs below 10.
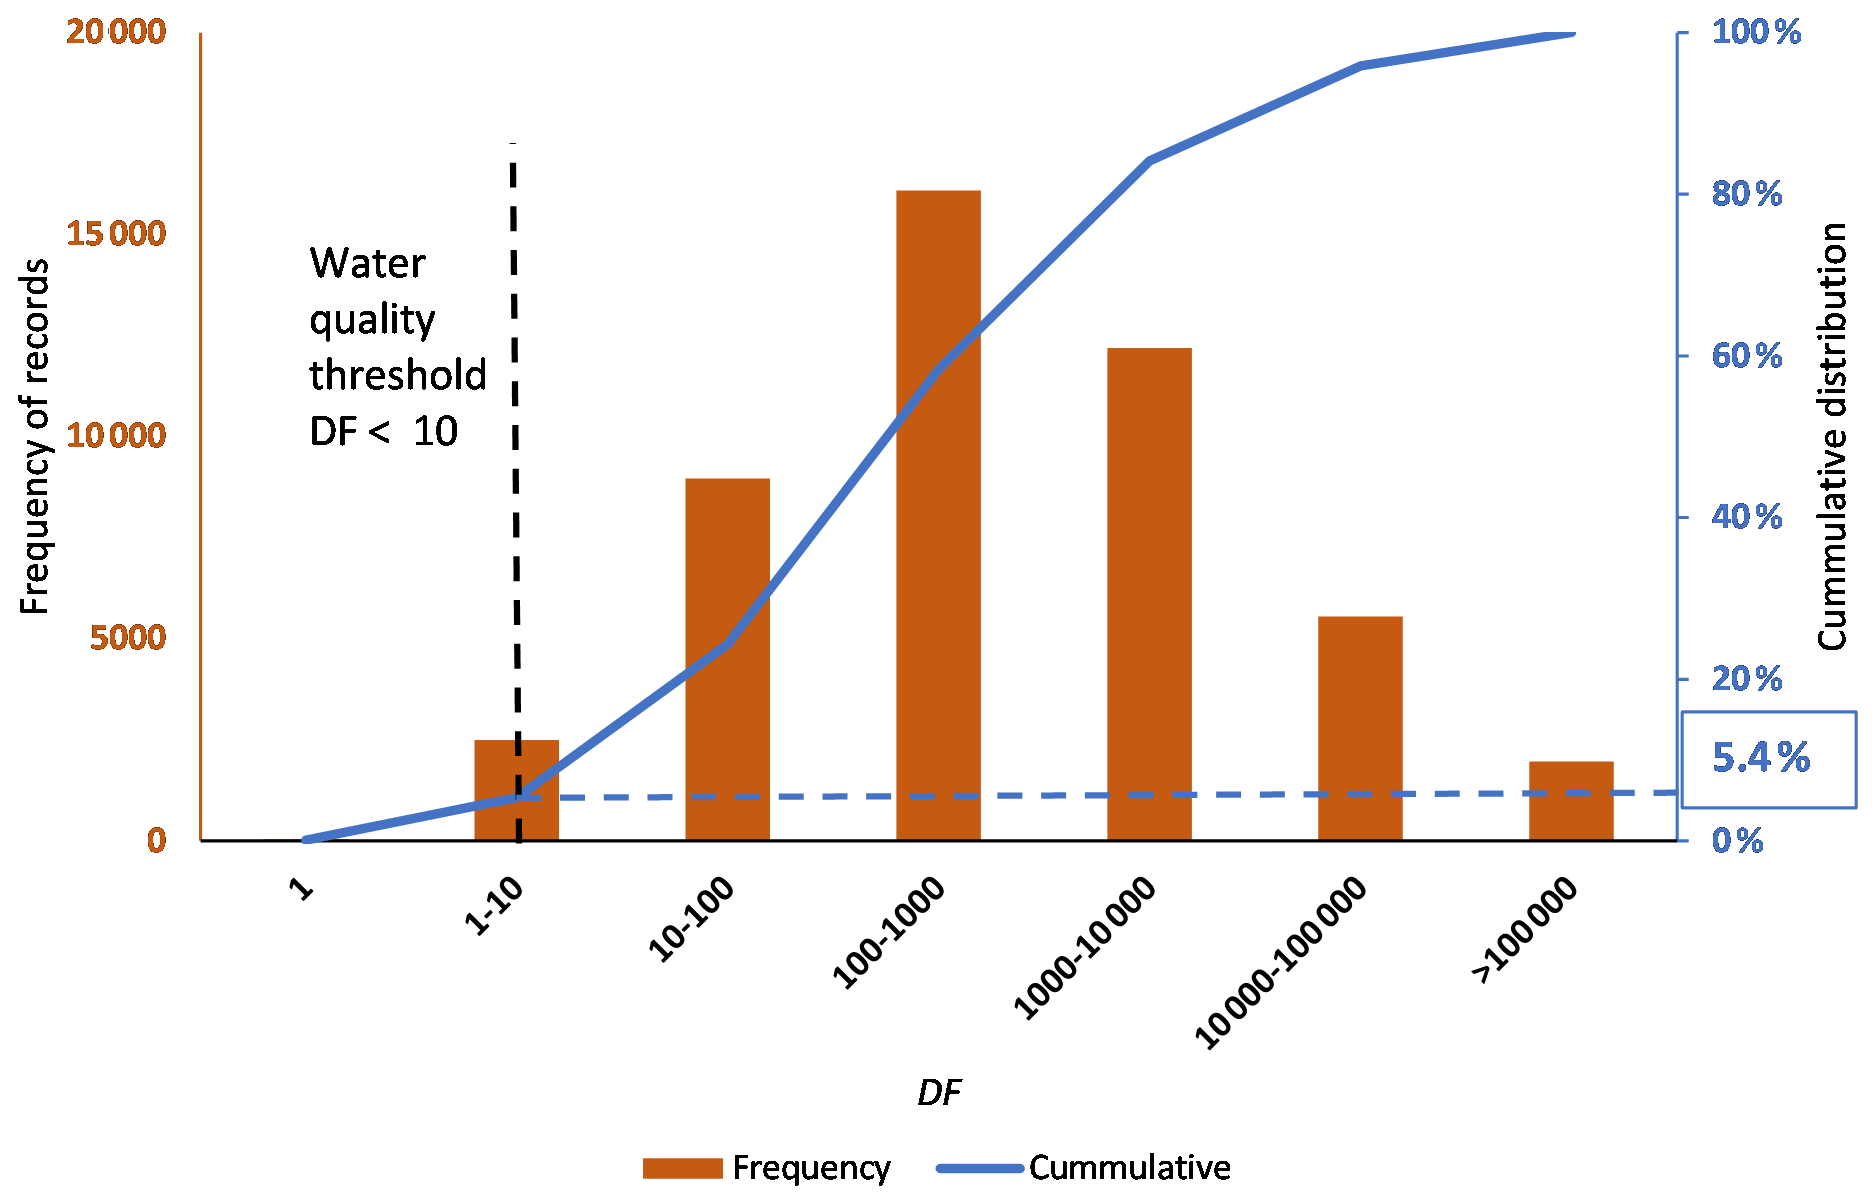
Figure 5Frequency distribution of calculated dilution factors (DFs) at average-flow conditions of all WWTPs in the HydroWASTE database (with some exceptions, see text for more information). For results at low-flow conditions, see Fig. S6.
3.3 Distribution of treated wastewater in global rivers
To demonstrate the global utility of the HydroWASTE database, we here present a first application in which we used both the location of WWTP outfalls and their associated attributes to route the discharged effluents along the global river network and calculate the ratio of treated wastewater in any river reach downstream of a WWTP in the database. The global assessment shows that more than 1 200 000 km of rivers are located downstream of WWTPs and thus contain some amount of WWTP effluents (Table 6 and Fig. 6). Of these, about 96 000 km are located downstream of WWTPs that offer only primary treatment. At average-flow conditions, about one-third (398 000 km) of all rivers containing treated wastewater exceed a treated-wastewater ratio of 1 %. Over 72 000 km (5.9 %) of impacted rivers surpass the treated-wastewater ratio of 10 % (i.e., corresponding to a dilution factor of 11), thus reaching or exceeding the recommended limit used in environmental regulations (EMA, 2006). Although 26 % (19 000 km) of these highly impacted rivers are located within close vicinity of WWTPs (i.e., within an average distance of 8.5 km measured between the estimated WWTP outfall location and the first river confluence thereafter) and may thus represent very local conditions and/or be affected by uncertainties in the WWTP locations, the remaining 74 % (53 000 km) are further downstream from WWTPs, indicating persistent risks of high potential wastewater contamination. From the 15 countries with the highest total length of rivers containing any amount of treated wastewater, more than 10 % of impacted rivers in China, Mexico, India, and South Africa exceed the 10 % treated-wastewater ratio in their discharge (Table 6). At low-flow conditions, the length of rivers surpassing the treated-wastewater ratio of 10 % triples to over 213 000 km (17.6 %). In addition, Germany and Spain join the list of countries with the largest percentages, both exceeding 30 % of rivers that contain more than 10 % of treated wastewater.
Table 6Top 15 countries by total length of rivers downstream of WWTPs and percentage of river length exceeding selected treated-wastewater ratios for average and low-flow conditions (for a complete list of countries, see Supplement, Table S6).
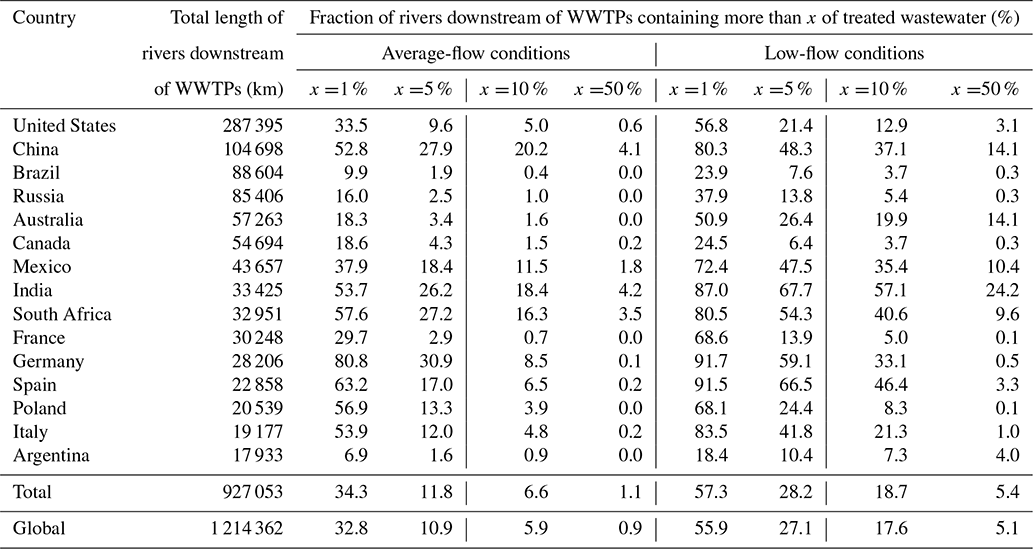

Figure 6Treated-wastewater ratios in the global river system at average-flow conditions (for low-flow conditions, see Fig. S7).
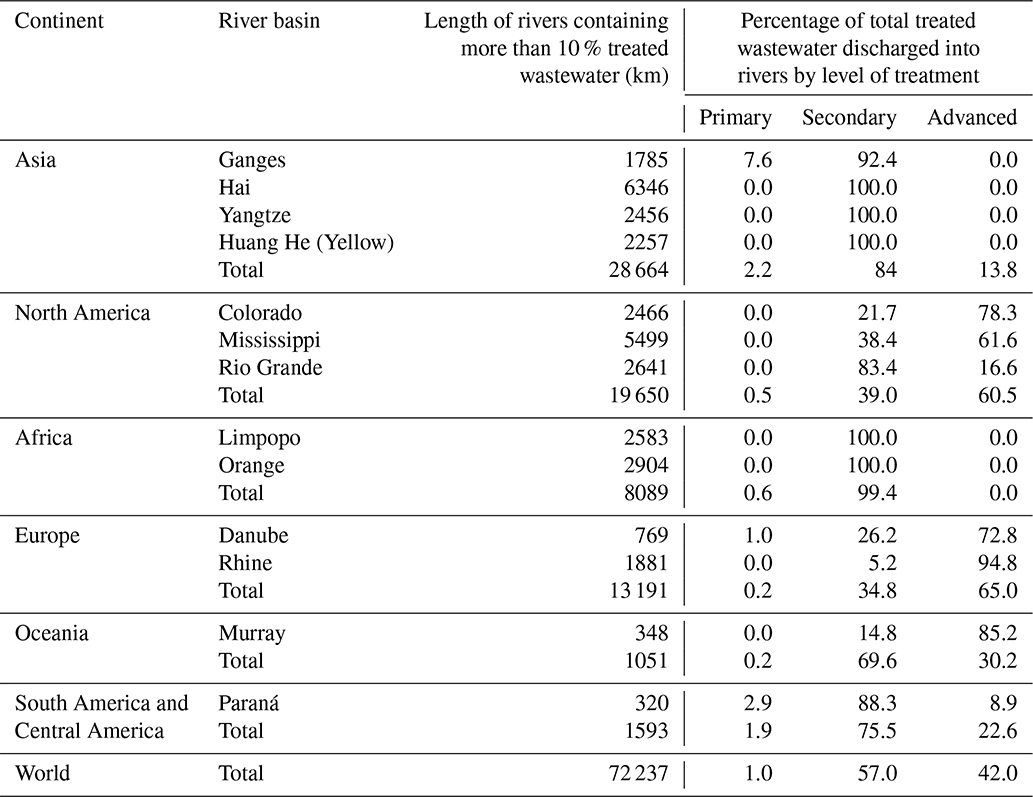
Our study highlights several large river basins, including the Hai (China), Mississippi (USA), and Orange (South Africa) with particularly long sections of impacted rivers with treated-wastewater ratios exceeding 10 % at average-flow conditions (Table 7). However, a given wastewater ratio is expected to have different implications depending on the level of treatment offered by the WWTPs upstream. For example, although both the Mississippi basin and the Hai basin have a comparable total length of rivers containing more than 10 % treated wastewater, the higher percentage of advanced treatment in the Mississippi basin may result in less environmental risk than the predominantly secondary treatment reported in the Hai basin. We conducted two more assessments, both at average-flow conditions, with a focus on ecological implications of our results. First, we found that a total of 149 000 km of river stretches with a treated-wastewater ratio exceeding 1 % and 31 000 km with a ratio exceeding 10 % are located along rivers that are currently considered to be free-flowing (Grill et al., 2019), i.e., rivers that are not substantially impacted by human activities that alter their connectivity and ecosystem services. Second, we estimate that 17 % of rivers that contain more than 10 % of treated-wastewater discharge are flowing through protected areas, defined as IUCN (International Union for Conservation of Nature) categories I–VI (UNEP-WCMC and IUCN, 2021). These results show that treated-wastewater ratios could be used as an additional and complementary metric of water quality to be integrated in refined assessments of anthropogenic impacts on river health and ecological status.
Table 7Length of rivers containing more than 10 % of treated wastewater in their natural average discharge, by continent and for selected basins. The last three columns show the percentage of total treated wastewater discharged into rivers in each basin and continent by level of treatment (i.e., primary, secondary, or advanced).
Finally, we assessed the number of potentially affected people along highly impacted rivers (i.e., rivers that carry at least 10 % of treated wastewater). Following Richter et al. (2010), we assume that people living within 10 km of a river are potentially dependent on river services, such as water provision or groundwater recharge, or are exposed to risks related to river flows, such as flooding. With this definition, as well as using population information provided in the HydroATLAS database (Linke et al., 2019), we estimate that 874 million people live within 10 km of rivers with treated-wastewater ratios exceeding 10 % at average-flow conditions. As these people potentially use river waters for various purposes (e.g., drinking, cleaning, fishing, and recreation), they are at elevated risk to be affected by water quality issues, including during floods.
HydroWASTE including all described attributes can be accessed at https://doi.org/10.6084/m9.figshare.14847786.v1 (Ehalt Macedo et al., 2021).
Detailed water quality assessments require spatially explicit information on how, where, and how much wastewater is entering the river system. Here, we developed a global geospatial wastewater treatment plant database, HydroWASTE, involving the compilation of national and regional datasets, the georeferencing of all records to a river network, and the estimation of attributes not originally reported by the source datasets. HydroWASTE can be used for numerous applications ranging from environmental to human health risk assessments. It is the first database at the global scale that includes this level of detail and comprehensiveness regarding geospatial WWTP locations, estimated effluent outfall locations, and associated attributes, such as the population served, treated-wastewater discharge, and level of treatment. In a first application, these characteristics allowed for the assessment of the distribution of treated wastewater in the global river network.
Since WWTPs are important sources of contaminants into receiving waters, spatial information on treated-wastewater discharge along with the key attributes is a critical input to water quality modeling. The most recent global assessments did not have access to this level of detail, relying on country-level statistics to account for these sources. The correct location of effluent discharge as a point source is rarely available, and if it is, it often does not connect with the river network integrated in the model. In this study we followed a conservative approach to topographically connect the point sources (WWTPs) with the river network. That is, instead of just connecting the WWTP to the nearest river reach, we introduced a tolerance of, on average, 6.5 km to allocate the outfall location further downstream, therefore connecting the WWTP to a river with larger expected discharge. This intentional bias reduces the likelihood of incorrectly predicting low dilution factors and high contamination risks on small streams; however, this approach can also cause an underestimation of the true extent of affected rivers. Nonetheless, we consider this conservative approach to be particularly important given the uncertainties in the river network quality and the reported locations of WWTPs.
As for treated-wastewater ratios, even though our assessment does not consider any removal of contaminants caused by treatment or decay processes in the river network, we believe the results can serve as a first-order proxy to highlight areas of potential risk to local ecosystems or human health. Persistent contaminants might not decay and could possibly accumulate or be transported downstream all the way to the ocean. Thus, our approach can facilitate the identification of hotspots along rivers where treated-wastewater ratios would be greatest, and this information could be used to guide regional or field studies to monitor or assess the actual local water quality.
Nonetheless, it is important to acknowledge that a certain treated-wastewater ratio in rivers will have different implications in different regions, since treatment levels vary between countries and between individual WWTPs. In fact, the goal of this preliminary analysis is not to predict the actual distribution of contaminants, since WWTPs are not the only source of pollution. In 2020, 48 % of the global population did not have access to wastewater treatment (WHO and UNICEF, 2021), thus forcing them to practice open defecation or to dump raw wastewater directly into waterbodies. The dimension of the global wastewater problem, including treated and untreated sources, therefore goes beyond the scope of our analysis.
5.1 Uncertainties
The uncertainties involved in this study mostly derive from the source datasets, which makes it difficult to trace their origins and calculate their effects on the final assessment. Some of the detectable inconsistencies relate to the reported attributes. For example, the coordinates do not always depict the precise location of the plant but instead can refer to the location of the effluent outfall or an approximate location (note that each dataset is described in more detail in Sect. S1). To quantify this type of uncertainty, we verified the given locations for a reference subset of WWTPs which demonstrated the overall robustness of the applied approaches (see Sect. S2.2).
HydroWASTE has extensive coverage of most European countries, the USA, India, China, Brazil, and Canada, which represent the vast majority of WWTPs in the world (Table 3), and their records are based on information (location and most attributes) reported by their respective national datasets. For many of the remaining countries, especially those where the WWTP locations are sourced from the OpenStreetMap (OSM) web platform, their total population served tends to be underestimated in HydroWASTE as compared to country-level statistics, reflecting the incompleteness of WWTP records. An analysis between OSM and the available national datasets (see Sect. S4.1) showed OSM to cover only 37 % of the total number of reported facilities. In terms of estimating missing WWTP attributes at OSM locations, estimated treated-wastewater discharge was compared to reported values from the South African national dataset, showing acceptable general agreement with 86 % of the estimates ranging within 1 order of magnitude of reported values (see Sect. S4.2). Overall, the lower-quality OSM-derived records constitute only 9 % of the HydroWASTE database (representing 27 % of the population served and 19 % of treated-wastewater discharge).
Besides the incompleteness of the OSM-sourced records, the national datasets may not include all facilities or may not have been updated recently. For example, the available datasets from the United States and China were last updated in 2012 and 2010, respectively, leaving around 10 years of new WWTP developments unaccounted for. This uncertainty could imply an underestimation of risk caused by missed WWTP effluents and/or an overestimation of risk caused by an exaggeration of unserved populations in environmental assessments, although concurrent changes in total population numbers and/or treatment levels add to the complexity of recent developments.
As another source of uncertainty, the European WWTP dataset reports the population number in terms of population equivalent, which refers to not only residents but also workers, tourists, and service providers, that is, not only the country's permanent population with access to wastewater treatment but the total ambient population using the sanitation services provided by the WWTPs. It can be argued that reporting in terms of population equivalent is more adequate when accounting for the amount and content of treated-wastewater discharge (Daughton, 2012; Nakada et al., 2017); however, since some WWTPs also include industrial sources of wastewater, the number of people served can be overestimated (O'Brien et al., 2014).
To indicate different levels of reliability for each attribute, including the WWTP location, several quality indicators were assigned to each record in HydroWASTE to help inform users about uncertainties inherent in the data. The quality indicators for the population served, treated-wastewater discharge, and level of treatment depend on whether the attribute is reported or estimated and on the method used if estimated. The quality indicator for the WWTP location is based on a manual accuracy assessment performed using a global subset of the HydroWASTE database (see Sect. S2.1 and S2.2 for more details).
Despite these shortcomings, we believe that the 58 502 WWTPs in HydroWASTE and their effluent discharge into the environment provide a robust first-order global representation of the majority of treated domestic wastewater.
5.2 Towards better representation of municipal treated-wastewater discharge in the global river system
The robust and consistent global HydroWASTE database presented here is designed to be used by water resource managers, policymakers, researchers, and public institutions to develop strategies to control, regulate, or mitigate the impacts of anthropogenic chemicals. It can be used to link populations to individual WWTPs and trace the pathways of specific substances from households through certain treatment levels into the river network. In addition, HydroWASTE can be used to identify WWTPs for which an upgrade in technology would deliver the biggest improvement of downstream water quality. Alternatively, where necessary, the resulting predictions could identify where local regulations should be established to limit the release of problematic pollutants. And, finally, it is conceivable that this approach could be used to predict the potential impacts that might occur with the development and anticipated widespread use of pharmaceuticals and household products, amongst other potential sources of contamination. Many applications of our novel database relate specifically to Sustainable Development Goal (SDG) 6 (“Ensure access to water and sanitation for all”), as it helps to provide reliable estimates of the distribution of treated wastewater to inform decision making that ultimately aims at achieving universal access to clean water globally.
In our efforts to obtain national datasets on WWTPs and their characteristics, we found that many countries (especially lower-income ones) do not provide openly accessible information on these facilities in a consistent and comprehensive format. Given the many implications that WWTPs have on human and environmental health, either in their role to improve water quality through removing contaminants or as a potential point source of untreated substances, we strongly recommend that governments and international organizations produce and make publicly available the data that are required to support water quality assessments from local to global scales. In the interim, HydroWASTE can serve as a starting point for large-scale water quality analyses or as an initial framework to be expanded.
The supplement related to this article is available online at: https://doi.org/10.5194/essd-14-559-2022-supplement.
HEM compiled all datasets, estimated missing attributes, and performed the analyses. HEM, BL, and JN developed the study and drafted the paper. GG, JL, AL, and RS contributed to the inclusion of national and regional datasets and their validation. All authors contributed to and approved the paper.
The contact authors have declared that neither they nor their co-authors have any competing interests.
Publisher's note: Copernicus Publications remains neutral with regard to jurisdictional claims in published maps and institutional affiliations.
We thank Edward R. Jones from Utrecht University for providing country-level estimates of wastewater information. We also thank various students in the research lab of Bernhard Lehner who contributed to data entry and validation, including Dylan Marshall, Vicente Burchard-Levine, and Mathis Messager.
This research has been supported by the Ideas Fund of the McGill Sustainability Systems Initiative (MSSI), the Natural Sciences and Engineering Research Council of Canada (NSERC Discovery (grant no. RGPIN/04541-2019)), and the James McGill Chair program of McGill University.
This paper was edited by David Carlson and reviewed by two anonymous referees.
Agência Nacional de Águas (ANA): Atlas Esgotos: Despoluição de bacias hidrográficas [data set], available at: https://metadados.snirh.gov.br/geonetwork/srv/por/catalog.search#/metadata/1d8cea87-3d7b-49ff-86b8-966d96c9eb01 (last access: September 2019), 2017.
Anderson, P. D., D'Aco, V. J., Shanahan, P., Chapra, S. C., Buzby, M. E., Cunningham, V. L., DuPlessie, B. M., Hayes, E. P., Mastrocco, F. J., Parke, N. J., Rader, J. C., Samuelian, J. H., and Schwab, B. W.: Screening Analysis of Human Pharmaceutical Compounds in U.S. Surface Waters, Environ. Sci. Technol., 38, 838–849, https://doi.org/10.1021/es034430b, 2004.
Beusen, A. H. W., Van Beek, L. P. H., Bouwman, A. F., Mogollón, J. M., and Middelburg, J. J.: Coupling global models for hydrology and nutrient loading to simulate nitrogen and phosphorus retention in surface water – description of IMAGE–GNM and analysis of performance, Geosci. Model Dev., 8, 4045–4067, https://doi.org/10.5194/gmd-8-4045-2015, 2015.
Bunzel, K., Kattwinkel, M., and Liess, M.: Effects of organic pollutants from wastewater treatment plants on aquatic invertebrate communities, Water Res., 47, 597–606, https://doi.org/10.1016/j.watres.2012.10.031, 2013.
Central Pollution Control Board (CPCB): Inventorization of Sewage Treatment Plants, available at: http://nrcd.nic.in/writereaddata/FileUpload/NewItem_210_Inventorization_of_Sewage-Treatment_Plant.pdf (last access: October 2019), 2015.
Comisión Nacional del Agua (CONAGUA): Plantas de tratamiento de agua residual (nacional), SINA [data set], available at: http://sina.conagua.gob.mx/sina/tema.php?tema=plantasTratamiento (last access: October 2019), 2018.
Daughton, C. G.: Real-time estimation of small-area populations with human biomarkers in sewage, Sci. Total Environ., 414, 6–21, https://doi.org/10.1016/j.scitotenv.2011.11.015, 2012.
Daughton, C. G. and Ternes, T. A.: Pharmaceuticals and personal care products in the environment: agents of subtle change?, Environ. Health Perspect., 107, 907–938, https://doi.org/10.1289/ehp.99107s6907, 1999.
Department of Water and Sanitation (DWS): National Integrated Water Information System, available at: https://www.dws.gov.za/niwis2, last access: October 2019.
Dumont, E., Johnson, A. C., Keller, V. D. J., and Williams, R. J.: Nano silver and nano zinc-oxide in surface waters – Exposure estimation for Europe at high spatial and temporal resolution, Environ. Pollut., 196, 341–349, https://doi.org/10.1016/j.envpol.2014.10.022, 2015.
Ehalt Macedo, H., Lehner, B., Nicell, J., Grill, G., Li, J., Limtong, A., and Shakya, R.: HydroWASTE version 1.0., figshare [dataset], https://doi.org/10.6084/m9.figshare.14847786.v1, 2021.
Environment Canada: Wastewater Systems Effluent Regulations, WSER [data set], available at: https://www.canada.ca/en/environment-climate-change/services/wastewater/publications/wastewater-data-reports.html (last access: October 2019), 2017.
Environmental Medicines Agency (EMA): Guideline on the environmental risk assessment of medicinal products for human use: available at: https://www.ema.europa.eu/en/environmental-risk-assessment-medicinal-products-human-use#current-version-section (last access: December 2019), 2006.
European Environment Agency (EEA): Waterbase-UWWTD: Urban Waste Water Treatment Directive – reported data, EEA [data set], available at: https://www.eea.europa.eu/data-and-maps/data/waterbase-uwwtd-urban-waste-water-treatment-directive-6 (last access: October 2019), 2017.
Food and Agriculture Organization of the United Nations (FAO): AQUASTAT Core Database, available at: https://www.fao.org/aquastat/en/databases/maindatabase/ (last access: October 2019), 2016.
Font, C., Bregoli, F., Acuña, V., Sabater, S., and Marcé, R.: GLOBAL-FATE (version 1.0.0): A geographical information system (GIS)-based model for assessing contaminants fate in the global river network, Geosci. Model Dev., 12, 5213–5228, https://doi.org/10.5194/gmd-12-5213-2019, 2019.
Grill, G., Khan, U., Lehner, B., Nicell, J., and Ariwi, J.: Risk assessment of down-the-drain chemicals at large spatial scales: Model development and application to contaminants originating from urban areas in the Saint Lawrence River Basin, Sci. Total Environ., 541, 825–838, https://doi.org/10.1016/j.scitotenv.2015.09.100, 2016.
Grill, G., Li, J., Khan, U., Zhong, Y., Lehner, B., Nicell, J., and Ariwi, J.: Estimating the eco-toxicological risk of estrogens in China's rivers using a high-resolution contaminant fate model, Water Res., 145, 707–720, https://doi.org/10.1016/j.watres.2018.08.053, 2018.
Grill, G., Lehner, B., Thieme, M., Geenen, B., Tickner, D., Antonelli, F., Babu, S., Borrelli, P., Cheng, L., Crochetiere, H., Ehalt Macedo, H., Filgueiras, R., Goichot, M., Higgins, J., Hogan, Z., Lip, B., McClain, M. E., Meng, J., Mulligan, M., Nilsson, C., Olden, J. D., Opperman, J. J., Petry, P., Reidy Liermann, C., Sáenz, L., Salinas-Rodríguez, S., Schelle, P., Schmitt, R. J. P., Snider, J., Tan, F., Tockner, K., Valdujo, P. H., van Soesbergen, A., and Zarfl, C.: Mapping the world's free-flowing rivers, Nature, 569, 215–221, https://doi.org/10.1038/s41586-019-1111-9, 2019.
Herrera, V.: Reconciling global aspirations and local realities: Challenges facing the Sustainable Development Goals for water and sanitation, World Dev., 118, 106–117, https://doi.org/10.1016/j.worlddev.2019.02.009, 2019.
Hill, R., Carter, L., and Kay, R.: Wastewater Treatment Facilities, Geoscience Australia [data set], https://doi.org/10.4225/25/543B53F92E643, 2012.
Hofstra, N., Bouwman, A. F., Beusen, A. H. W., and Medema, G. J.: Exploring global Cryptosporidium emissions to surface water, Sci. Total Environ., 442, 10–19, https://doi.org/10.1016/j.scitotenv.2012.10.013, 2013.
Jones, E. R., van Vliet, M. T. H., Qadir, M., and Bierkens, M. F. P.: Country-level and gridded estimates of wastewater production, collection, treatment and reuse, Earth Syst. Sci. Data, 13, 237–254, https://doi.org/10.5194/essd-13-237-2021, 2021.
Kapo, K. E., DeLeo, P. C., Vamshi, R., Holmes, C. M., Ferrer, D., Dyer, S. D., Wang, X., and White-Hull, C.: iSTREEM®: An approach for broad-scale in-stream exposure assessment of “down-the-drain” chemicals, Integr. Environ. Assess. Manage., 12, 782–792, https://doi.org/10.1002/ieam.1793, 2016.
Keller, V. D. J., Williams, R. J., Lofthouse, C., and Johnson, A. C.: Worldwide estimation of river concentrations of any chemical originating from sewage-treatment plants using dilution factors, Environ. Toxicol. Chem., 33, 447–452, https://doi.org/10.1002/etc.2441, 2014.
Kroeze, C., Gabbert, S., Hofstra, N., Koelmans, A. A., Li, A., Löhr, A., Ludwig, F., Strokal, M., Verburg, C., Vermeulen, L., van Vliet, M. T. H., de Vries, W., Wang, M., and van Wijnen, J.: Global modelling of surface water quality: a multi-pollutant approach, Curr. Opin. Env. Sust., 23, 35–45, https://doi.org/10.1016/j.cosust.2016.11.014, 2016.
Lehner, B. and Grill, G.: Global river hydrography and network routing: baseline data and new approaches to study the world's large river systems, Hydrol. Process., 27, 2171–2186, https://doi.org/10.1002/hyp.9740, 2013.
Lehner, B., Verdin, K., and Jarvis, A.: New global hydrography derived from spaceborne elevation data, Eos, 89, 93–94, https://doi.org/10.1029/2008EO100001, 2008.
Link, M., von der Ohe, P. C., Voß, K., and Schäfer, R. B.: Comparison of dilution factors for German wastewater treatment plant effluents in receiving streams to the fixed dilution factor from chemical risk assessment, Sci. Total Environ., 598, 805–813, https://doi.org/10.1016/j.scitotenv.2017.04.180, 2017.
Linke, S., Lehner, B., Ouellet Dallaire, C., Ariwi, J., Grill, G., Anand, M., Beames, P., Burchard-Levine, V., Maxwell, S., Moidu, H., Tan, F., and Thieme, M.: Global hydro-environmental sub-basin and river reach characteristics at high spatial resolution, Sci. Data, 6, 283, https://doi.org/10.1038/s41597-019-0300-6, 2019.
Mayorga, E., Seitzinger, S. P., Harrison, J. A., Dumont, E., Beusen, A. H. W., Bouwman, A. F., Fekete, B. M., Kroeze, C., and Van Drecht, G.: Global Nutrient Export from WaterSheds 2 (NEWS 2): Model development and implementation, Environ. Modell. Softw., 25, 837–853, https://doi.org/10.1016/j.envsoft.2010.01.007, 2010.
Messager, M. L., Lehner, B., Grill, G., Nedeva, I., and Schmitt, O.: Estimating the volume and age of water stored in global lakes using a geo-statistical approach, Nat. Commun., 7, 13603, https://doi.org/10.1038/ncomms13603, 2016.
Müller Schmied, H., Eisner, S., Franz, D., Wattenbach, M., Portmann, F. T., Flörke, M., and Döll, P.: Sensitivity of simulated global-scale freshwater fluxes and storages to input data, hydrological model structure, human water use and calibration, Hydrol. Earth Syst. Sci., 18, 3511–3538, https://doi.org/10.5194/hess-18-3511-2014, 2014.
Munz, N. A., Burdon, F. J., de Zwart, D., Junghans, M., Melo, L., Reyes, M., Schönenberger, U., Singer, H. P., Spycher, B., Hollender, J., and Stamm, C.: Pesticides drive risk of micropollutants in wastewater-impacted streams during low flow conditions, Water Res., 110, 366–377, https://doi.org/10.1016/j.watres.2016.11.001, 2017.
Musolff, A., Leschik, S., Reinstorf, F., Strauch, G., and Schirmer, M.: Assessing emerging contaminants – Case study of the city of Leipzig, Germany, IAHS-AISH P., 178–185, 2008.
Nakada, N., Hanamoto, S., Jürgens, M. D., Johnson, A. C., Bowes, M. J., and Tanaka, H.: Assessing the population equivalent and performance of wastewater treatment through the ratios of pharmaceuticals and personal care products present in a river basin: Application to the River Thames basin, UK, Sci. Total Environ., 575, 1100–1108, https://doi.org/10.1016/j.scitotenv.2016.09.180, 2017.
Neale, P. A., Munz, N. A., Aït-Aïssa, S., Altenburger, R., Brion, F., Busch, W., Escher, B. I., Hilscherová, K., Kienle, C., Novák, J., Seiler, T.-B., Shao, Y., Stamm, C., and Hollender, J.: Integrating chemical analysis and bioanalysis to evaluate the contribution of wastewater effluent on the micropollutant burden in small streams, Sci. Total Environ., 576, 785–795, https://doi.org/10.1016/j.scitotenv.2016.10.141, 2017.
O'Brien, J. W., Thai, P. K., Eaglesham, G., Ort, C., Scheidegger, A., Carter, S., Lai, F. Y., and Mueller, J. F.: A Model to Estimate the Population Contributing to the Wastewater Using Samples Collected on Census Day, Environ. Sci. Technol., 48, 517–525, https://doi.org/10.1021/es403251g, 2014.
Oldenkamp, R., Hoeks, S., Čengić, M., Barbarossa, V., Burns, E. E., Boxall, A. B. A., and Ragas, A. M. J.: A High-Resolution Spatial Model to Predict Exposure to Pharmaceuticals in European Surface Waters: ePiE, Environ. Sci. Technol., 52, 12494–12503, https://doi.org/10.1021/acs.est.8b03862, 2018.
Rice, J. and Westerhoff, P.: Spatial and Temporal Variation in De Facto Wastewater Reuse in Drinking Water Systems across the U.S.A, Environ. Sci. Technol., 49, 982–989, https://doi.org/10.1021/es5048057, 2015.
Rice, J. and Westerhoff, P.: High levels of endocrine pollutants in US streams during low flow due to insufficient wastewater dilution, Nat. Geosci., 10, 587–591, https://doi.org/10.1038/ngeo2984, 2017.
Richter, B. D., Postel, S., Revenga, C., Scudder, T., Lehner, B., Churchill, A., and Chow, M. J. W.: Lost in development's shadow: The downstream human consequences of dams, Water Altern., 3, 14–42, 2010.
Strokal, M., Spanier, J. E., Kroeze, C., Koelmans, A. A., Flörke, M., Franssen, W., Hofstra, N., Langan, S., Tang, T., van Vliet, M. T. H., Wada, Y., Wang, M., van Wijnen, J., and Williams, R.: Global multi-pollutant modelling of water quality: scientific challenges and future directions, Curr. Opin. Env. Sust., 36, 116–125, https://doi.org/10.1016/j.cosust.2018.11.004, 2019.
Superintendencia Nacional de Servicios de Saneamiento (SUNASS): Plantas de Tratamiento de Agua Residual, GEOSUNASS [data set], available at: https://geosunass.sunass.gob.pe/geoportal/sunass/home/index (last access: October 2019), 2018.
Tang, T., Strokal, M., van Vliet, M. T. H., Seuntjens, P., Burek, P., Kroeze, C., Langan, S., and Wada, Y.: Bridging global, basin and local-scale water quality modeling towards enhancing water quality management worldwide, Curr. Opin. Env. Sust., 36, 39–48, https://doi.org/10.1016/j.cosust.2018.10.004, 2019.
Tatem, A. J.: WorldPop, open data for spatial demography, Sci. Data, 4, 170004, https://doi.org/10.1038/sdata.2017.4, 2017.
Thiebault, T., Alliot, F., Berthe, T., Blanchoud, H., Petit, F., and Guigon, E.: Record of trace organic contaminants in a river sediment core: From historical wastewater management to historical use, Sci. Total Environ., 773, 145694, https://doi.org/10.1016/j.scitotenv.2021.145694, 2021.
United Nations Environment Programme (UNEP): A Snapshot of the World's Water Quality: Towards a global assessment, United Nations Environment Programme, Nairobi, Kenya, 162 pp., 2016.
United Nations Environment Programme – World Conservation Monitoring Centre (UNEP–WCMC) and International Union for Conservation of Nature (IUCN): Protected Planet: The World Database on Protected Areas (WDPA), available at: https://www.iucn.org/theme/protected-areas/our-work/quality-and-effectiveness/world-database-protected-areas-wdpa, last access: January 2021.
United States Environmental Protection Agency (US EPA): Clean Watersheds Needs Survey, EPA [data set], available at: https://www.epa.gov/cwns (last access: December 2019), 2016.
Van Drecht, G., Bouwman, A. F., Harrison, J., and Knoop, J. M.: Global nitrogen and phosphate in urban wastewater for the period 1970 to 2050, Global Biogeochem. Cycles, 23, GB0A03, https://doi.org/10.1029/2009gb003458, 2009.
van Vliet, M. T. H., Flörke, M., Harrison, J. A., Hofstra, N., Keller, V., Ludwig, F., Spanier, J. E., Strokal, M., Wada, Y., Wen, Y., and Williams, R. J.: Model inter-comparison design for large-scale water quality models, Curr. Opin. Env. Sust., 36, 59–67, https://doi.org/10.1016/j.cosust.2018.10.013, 2019.
van Vliet, M. T. H., Jones, E. R., Flörke, M., Franssen, W. H. P., Hanasaki, N., Wada, Y., and Yearsley, J. R.: Global water scarcity including surface water quality and expansions of clean water technologies, Environ. Res. Lett., 16, 024020, https://doi.org/10.1088/1748-9326/abbfc3, 2021.
Vigiak, O., Grizzetti, B., Zanni, M., Aloe, A., Dorati, C., Bouraoui, F., and Pistocchi, A.: Domestic waste emissions to European waters in the 2010s, Sci. Data, 7, 33, https://doi.org/10.1038/s41597-020-0367-0, 2020.
Water New Zealand: New Zealand Wastewater Treatment Plant Inventory, WWTP [data set], available at: https://www.waternz.org.nz/WWTPInventory, last access: October 2019.
Williams, R., Keller, V., Voß, A., Bärlund, I., Malve, O., Riihimäki, J., Tattari, S., and Alcamo, J.: Assessment of current water pollution loads in Europe: estimation of gridded loads for use in global water quality models, Hydrol. Process., 26, 2395–2410, https://doi.org/10.1002/hyp.9427, 2012.
World Bank: Gross National Income (GNI) per capita, Atlas method, available at: https://datahelpdesk.worldbank.org/knowledgebase/articles/906519-world-bank-country-and-lending-groups, last access: December 2019.
World Health Organization (WHO) and United Nations Habitat (UN Habitat): Progress on safe treatment and use of wastewater: piloting the monitoring methodology and initial findings for SDG indicator 6.3.1, WHO and UN-Habitat, Geneva, Switzerland, 40 pp., ISBN 978-9241514897, 2018.
World Health Organization(WHO) and United Nations Children's Fund (UNICEF): Joint Monitoring Programme (JMP) for water supply and sanitation (WASH), available at: https://washdata.org/, last access: December 2019.
World Health Organization (WHO) and United Nations Children's Fund (UNICEF): Progress on household drinking water, sanitation and hygiene 2000–2020: five years into the SDGs, WHO and UNICEF, Geneva, Switzerland, 164 pp., ISBN (WHO) 978-9240030848, 2021.
WorldPop and Center for International Earth Science Information Network (CIESIN): Global High Resolution Population Denominators Project, https://doi.org/10.5258/SOTON/WP00647, 2018.