the Creative Commons Attribution 4.0 License.
the Creative Commons Attribution 4.0 License.
 | 15 Dec 2022
A dataset of 10-year regional-scale soil moisture and soil temperature measurements at multiple depths on the Tibetan Plateau
Pei Zhang
Rogier van der Velde
Jun Wen
Yaoming Ma
Yijian Zeng
Xin Wang
Zuoliang Wang
Jiali Chen
Zhongbo Su
Soil moisture and soil temperature (SMST) are important state variables for quantifying the exchange of heat and water between land and atmosphere. Yet, long-term, regional-scale in situ SMST measurements are scarce on the Tibetan Plateau (TP), with even fewer are available for multiple soil depths. Tibet-Obs is such a long-term, regional-scale SMST observatory in the TP that has been established 10 years ago and includes three SMST monitoring networks, i.e. Maqu, Naqu, and Ngari (including Ali and Shiquanhe), located in the cold humid area covered by grassland, the cold semiarid area dominated by tundra, and the cold arid area dominated by desert, respectively. This paper presents a long-term (∼ 10 years) SMST profile dataset collected from the Tibet-Obs, which includes the original in situ measurements at a 15 min interval collected between 2008 and 2019 from all the three networks and the spatially upscaled data (SMups and STups) for the Maqu and Shiquanhe networks. The quality of the upscaled data is proved to be good, with errors that are generally better than the measured accuracy of adopted SMST sensors. Long-term analysis of the upscaled SMST profile data shows that the amplitudes of SMST variations decrease with increasing soil depth, and the deeper soil layers present a later onset of freezing and an earlier start of thawing and, thus, a shorter freeze–thaw duration in both the Maqu and Shiquanhe networks. In addition, there are notable differences between the relationships of SMups and STups under freezing conditions for the Maqu and Shiquanhe networks. No significant trend can be found for the SMups profile in the warm season (from May to October) for both networks that is consistent with the tendency of precipitation. A similar finding is also found for the STups profile and air temperature in the Shiquanhe network during the warm season. For the cold season (from November to April), a drying trend is noted for the SMups above 20 cm in the Maqu network, while no significant trend is found for those in the Shiquanhe network. Comparisons between the long-term upscaled data and five reanalysis datasets, including the ECMWF reanalysis v5 (ERA5), Modern-Era Retrospective analysis for Research and Applications, version 2 (MERRA-2), Global Land Data Assimilation System version 2 Catchment Land Surface Model (GLDAS-2.1 CLSM), GLDAS-2.1 Noah, and GLDAS-2.1 variable infiltration capacity (GLDAS-2.1 VIC), indicate that none of the current model-based products can reproduce the seasonal variations and interannual trend changes in the measured SMST profile dynamics in both networks. All the products underestimate the STups at every depth, leading to an earlier onset of freezing and a later onset of thawing, which essentially demonstrates that the current models are not able to adequately simulate winter conditions on the TP. In short, the presented dataset would be valuable for evaluation and improvement in long-term satellite- and model-based SMST products on the TP, enhancing the understanding of TP hydrometeorological processes and their response to climate change. The dataset is available in the 4TU.ResearchData repository at https://doi.org/10.4121/20141567.v1 (Zhang et al., 2022).
- Article
(13098 KB) - Full-text XML
- BibTeX
- EndNote


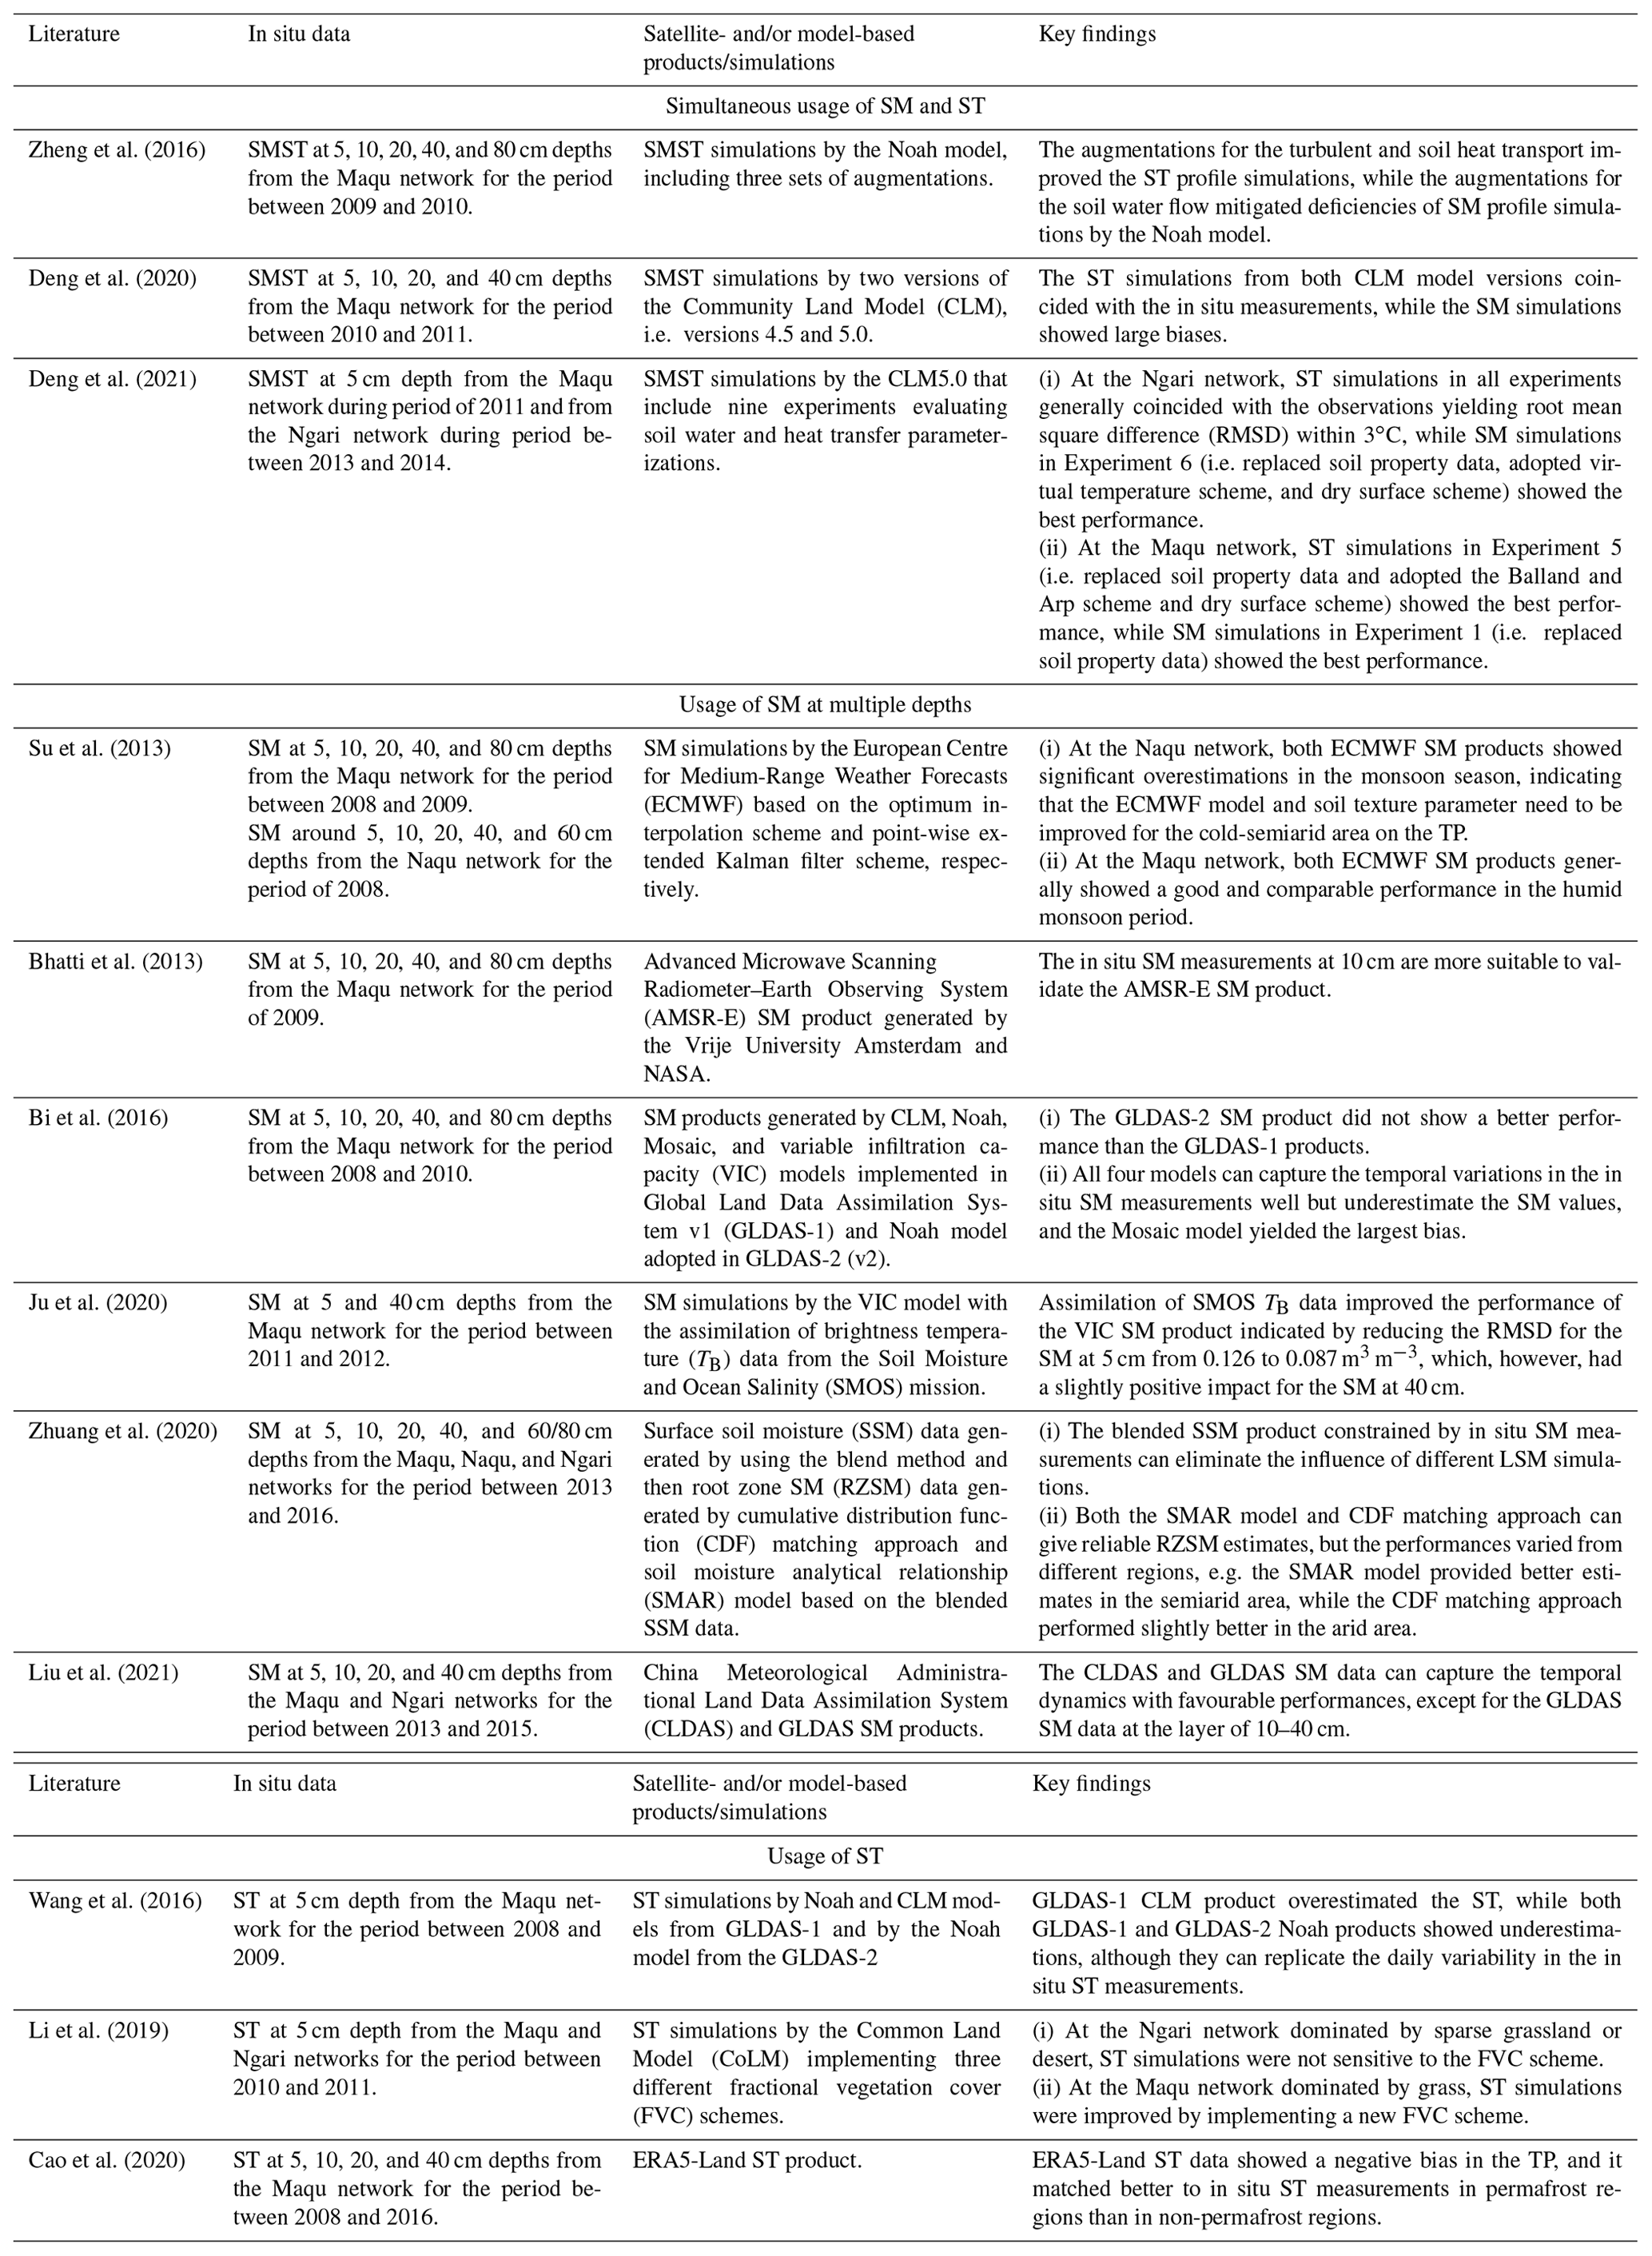
Soil moisture and soil temperature (SMST) are important state variables for quantifying water, energy, and carbon exchange processes in the soil–vegetation–atmosphere system (van der Velde et al., 2009; Zheng et al., 2018). Quantifying the seasonal dynamics and trend changes in the SMST is important for understanding the response of hydrological cycle and vegetation dynamics to climate change. Over the past few decades, many efforts have been dedicated to obtain worldwide reliable SMST data through in situ measurements, remote sensing, and model simulations (Rodell et al., 2004; Entekhabi et al., 2010; Dorigo et al., 2011). Among these, in situ measurements are essential for the creation of a ground reference for the validation of remote sensing and model-based products (Zeng et al., 2015; Chen et al., 2017; Colliander et al., 2017;), in addition to improving model parameterizations (Zheng et al., 2015a, b, 2017) and remote sensing retrieval algorithms (Zheng et al., 2018, 2019). Since the SMST measurements at a single site cannot represent the value of a satellite pixel or model grid due to spatial variability well, several regional-scale monitoring networks were established to collect SMST measurements at the regional scale, some of which are contributing to the International Soil Moisture Network (ISMN; Dorigo et al., 2011, 2021).
Known as the third pole, the exchange of water and energy between land and atmosphere on the Tibetan Plateau (TP) plays a crucial role in regulating climate processes in the Northern Hemisphere and the evolution of the Asian monsoon (Wu and Zhang, 1998; Yao et al., 2012). The soil freeze–thaw (F/T) cycle is a typical process on the TP, which has a significant impact on the energy exchange between land and atmosphere and water cycle (Zheng et al., 2017, 2018). Knowledge on SMST seasonal variations, trend changes, and the F/T states on the TP can, therefore, contribute to a better understanding of the Asian monsoon circulation and cryosphere changes. However, SMST monitoring networks are scarce on the TP compared to its vast territory, and even fewer exist with long time series measurements and/or with measurements at multiple soil depths. To our knowledge, there are only two operational SMST observatories that provide long-term measurements at multiple soil depths on the TP, i.e. Tibet-Obs (Tibetan Plateau observatory of plateau-scale SMST; Su et al., 2011; Zhang et al., 2021) and CTP-SMTMN (soil moisture and temperature monitoring network on the central TP; Yang et al., 2013).
The Tibet-Obs is the first operational SMST observatory on the TP that started providing SMST measurements in 2008, which was designed to provide a representative coverage of distinct climate regimes and land surface conditions across the TP (Su et al., 2011). The Tibet-Obs comprises three in situ monitoring networks, i.e. Maqu, Naqu, and Ngari (including Ali and Shiquanhe; Fig. 1), which are, respectively, located in the cold humid area with cold dry winter and rainy summer covered by grassland, the cold semiarid area dominated by tundra, and the cold arid area dominated by desert (Su et al., 2011; Beck et al., 2018; Zhang et al., 2021). In the Tibet-Obs, SMST sensors were installed at multiple depths, which facilitate the calibration/validation of satellite-based retrieval algorithms and products and the model-based SMST products. Table 1 summarizes the main applications of the Tibet-Obs SMST data with a focus on the simultaneous usage of soil moisture (SM) and soil temperature (ST) measurements or usage of SM/ST measurements at multiple depths for the product validations. A summary related to the usage of surface SM data only are included in Zhang et al. (2021). Based on Table 1 and the summary made in Zhang et al. (2021), it may be concluded that the Tibet-Obs data were mainly applied to evaluate surface SM products, whereas a few studies simultaneously evaluated SM and ST products, and even fewer focused on the investigation of profile dynamics using measurements at multiple depths. In addition, most of previous studies focused on a certain short-term period (e.g. several years), while the Tibet-Obs holds SMST data for more than 10 years (Zhang et al., 2021), and most of the current satellite- and model-based products also provide long-term (e.g. ≥10 years) SMST data. Moreover, previous assessments were mainly concentrated on estimating error metrics between SMST products and measurements, while how well these SMST products can capture the long-term trend and variations in the in situ SMST dynamics is still unknown. Therefore, the development of a long-term dataset of SMST measurements at multiple depths based on the Tibet-Obs is essential to comprehensively assess and improve the reliability of current SMST products regarding seasonal variations and trend changes and enhancing their applications to improve our understanding on changes in hydrological and cryosphere processes on the TP.
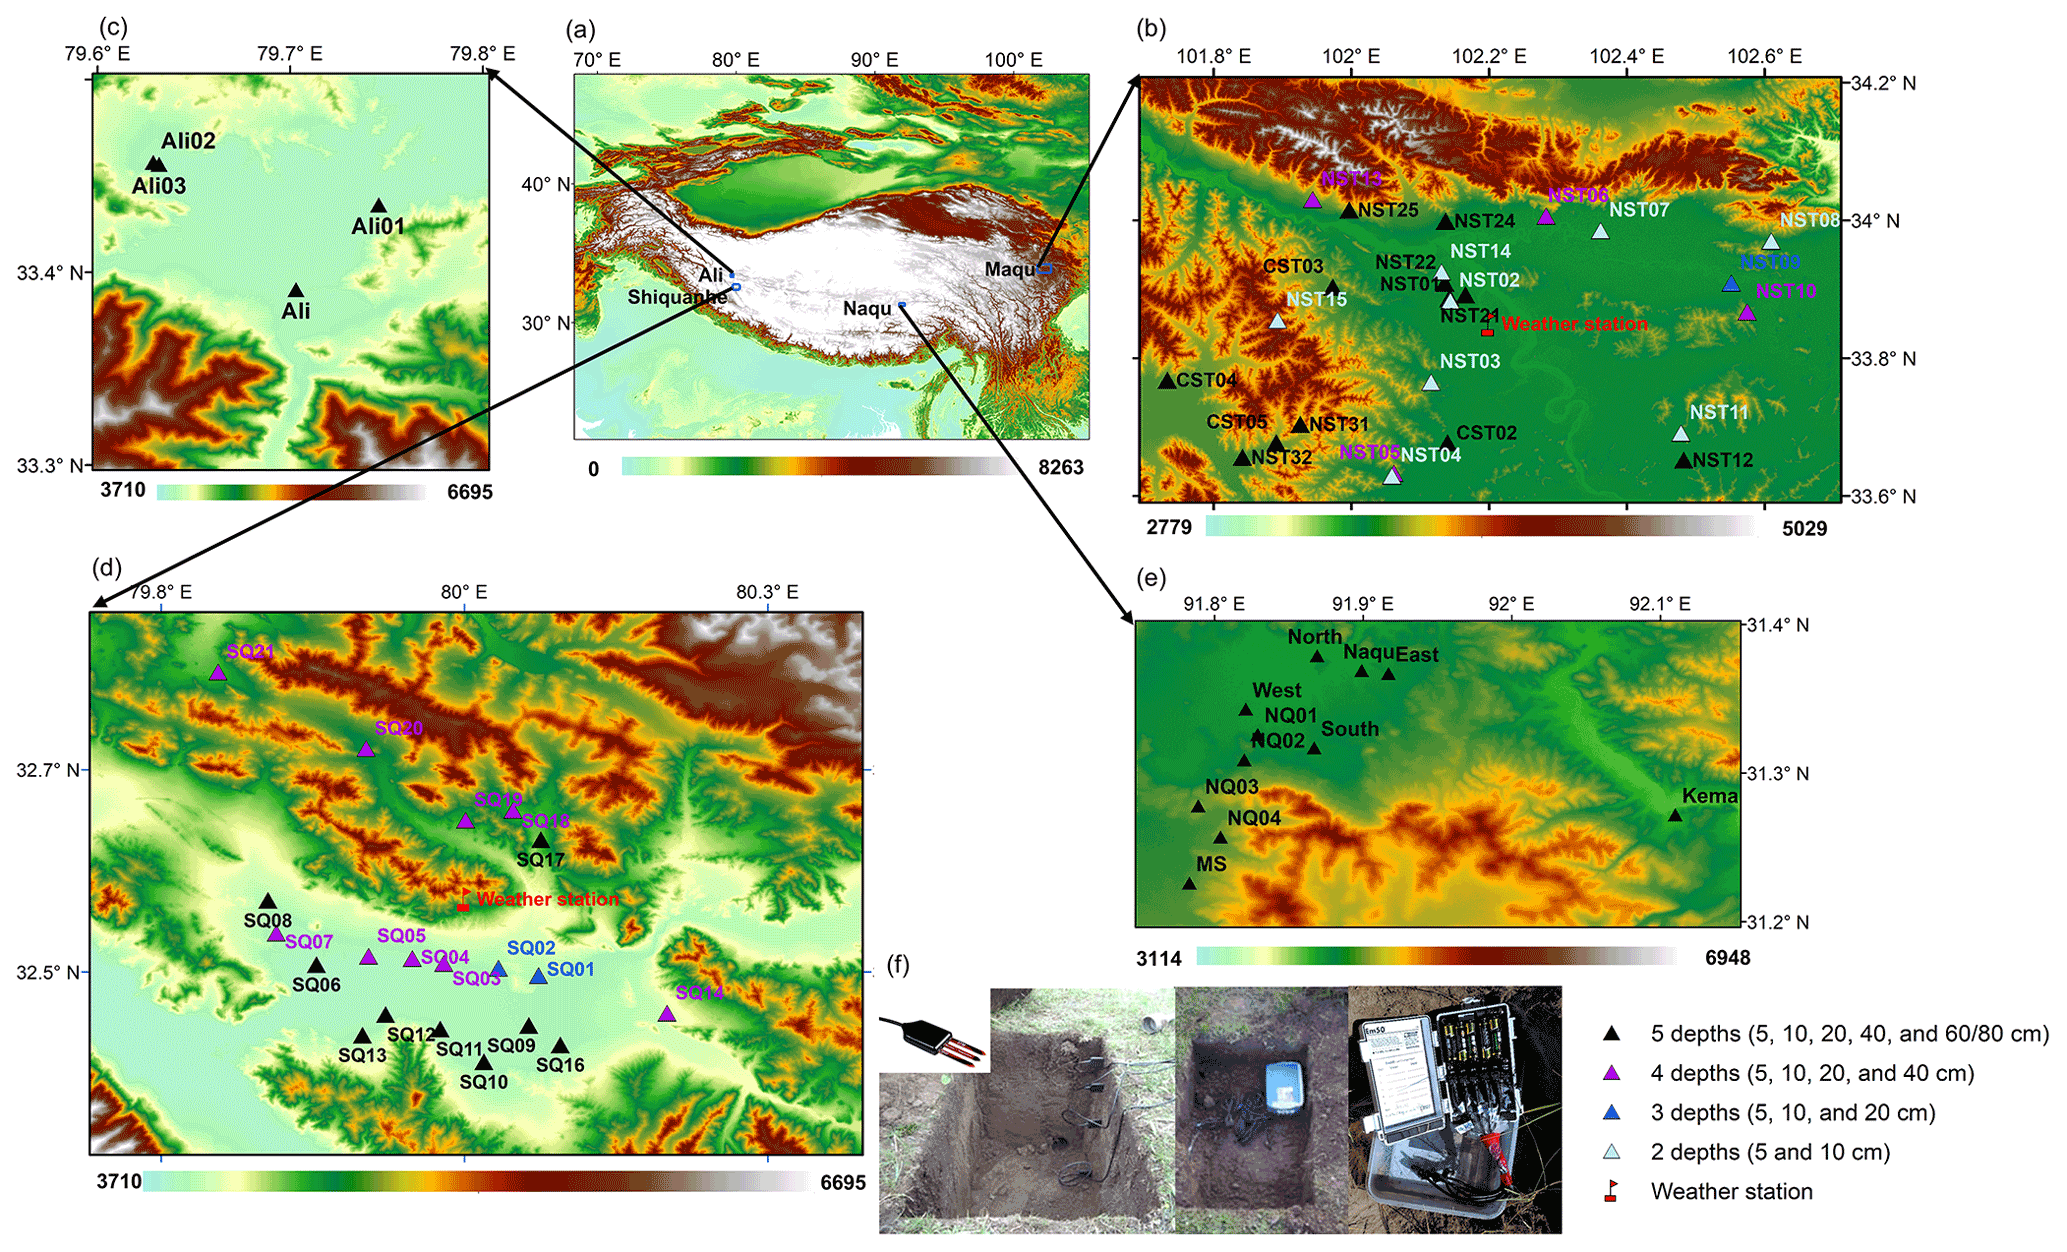
Figure 1(a) Location of the Tibet-Obs network over the TP. Spatial distributions of SMST monitoring sites and weather station within the (b) Maqu, (c) Ali, (d) Shiquanhe, and (e) Naqu networks. (f) An example of the instruments configured for each SMST monitoring site. The elevation of the network is shown at the bottom of each subplot. The triangles with different colours represent the SMST measured at different depths. The base map is from the © U.S. Geological Survey's Center for Earth Resources Observation and Science (EROS).
Table 1Summary of the applications of the Tibet-Obs SMST data and the corresponding findings.
In this paper, we present a long-term (∼ 10 years) SMST profile dataset collected from the Tibet-Obs, which expands the surface SM dataset introduced by Zhang et al. (2021) to include both SM and ST measurements collected at multiple depths. As such, an analysis of freezing and thawing characteristics becomes possible. The analysis of seasonal dynamics and trend changes in addition to the validation of model-based products is also extended to multiple depths for an approximately 10-year period. In addition, more model-based products are evaluated in this paper. In the Tibet-Obs, Decagon (now the METER Group) EC-TM/5TM probes and EM50 data loggers were deployed for each site at multiple depths (e.g. 5, 10, 20, 40, 60, or 80 cm below the surface) to record SMST profile measurements with a 15 min interval. The presented SMST profile dataset includes in situ measurements collected between May 2008 and August 2019 for all three networks of the Tibet-Obs and spatially upscaled data for the Maqu and Shiquanhe networks.
The objective of this paper is twofold, namely (1) to describe the long-term in situ SMST profile dataset including its generation and validation and (2) to demonstrate its uniqueness for evaluating model-based SMST profile products for a long-term period (∼ 10 years). The paper is organized as follows: Sect. 2 describes the in situ SMST measurements collected from the Tibet-Obs and other data used in this research, including meteorological data and model-based products. Section 3 presents the spatial upscaling method, data pre-processing steps, statistical performance metrics, and Mann–Kendall trend test methods. The preliminary analysis and applications of the SMST profile dataset are presented in Sect. 4. The information of data availability is shown in Sect. 5. Finally, the conclusions are drawn in Sect. 6.
2.1 Tibet-Obs network and in situ SMST profile measurements
2.1.1 Network design and instrumentation
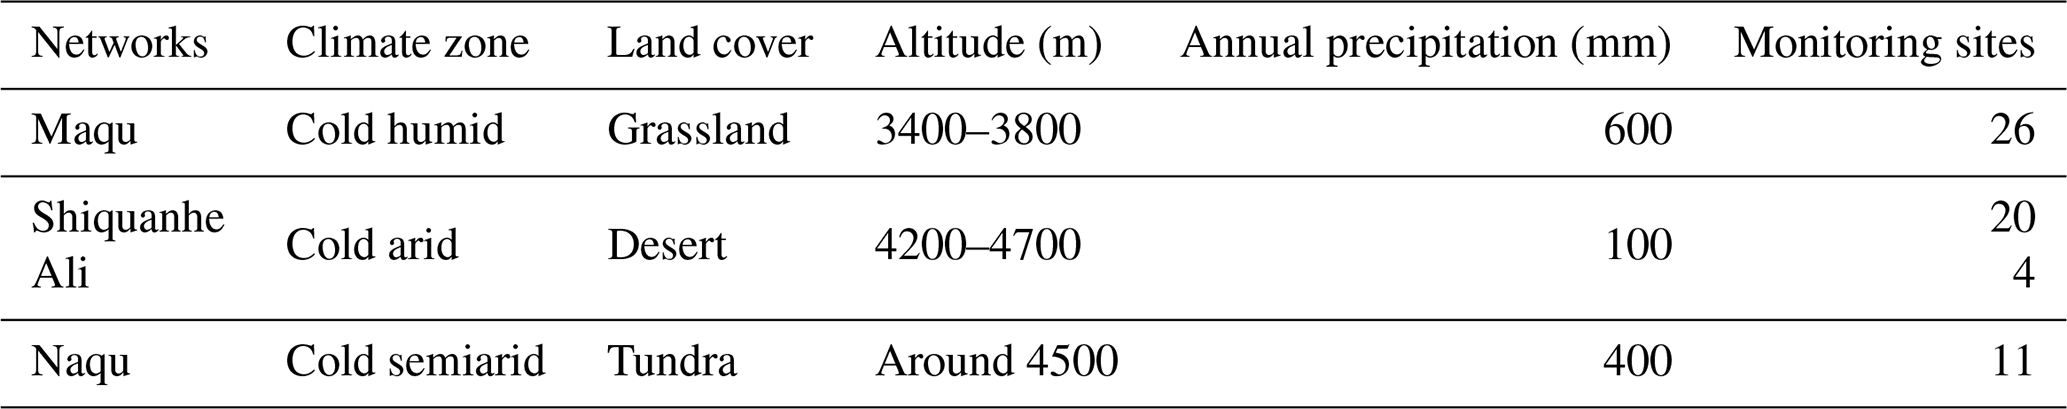
The Tibet-Obs was originally established in 2008 and includes three regional-scale SMST monitoring networks (Fig. 1), i.e. the Maqu network at the eastern TP located in cold humid climate area, the Naqu network in the central TP located in cold semiarid climate area, and the Ngari network (including Ali and Shiquanhe) in the western TP located in cold arid climate area (see Table 2). Each network includes various numbers of in situ SMST monitoring sites, and each monitoring site is configured with one Decagon EM50 data logger and several Decagon SMST probes (i.e. EC-TM and 5TM) to record the SMST profile dynamics every 15 min. The SMST probes were installed with the pins inserted in a horizontal direction at multiple depths up to 80 cm (see Fig. 1f). The measured range of the ST sensor is from −40 to 60 ∘C at 0.1 ∘C resolution with ±1 ∘C accuracy. The SM sensor measures liquid water content at a 0.0008 m3 m−3 resolution with ±0.03 m3 m−3 accuracy. The accuracy of the SM sensor was further improved via a soil-specific calibration, leading to a RMSD of about 0.02 m3 m−3 (Dente et al., 2012). Nominal instrument maintenance, battery replacement, and data collection took place every year. Several initially established SMST monitoring sites were damaged by local people or animals, and more than 15 sites have been newly installed between 2014 and 2016 (see Tables A1–A3). Therefore, there are only few monitoring sites that could provide long-term continuous SMST data records throughout the period from 2008 to 2019. Brief descriptions of SMST profile data records at each monitoring network are further provided in the following subsections, and additional information about the Tibet-Obs can be found in Su et al. (2011) and Zhang et al. (2021).
2.1.2 Maqu network
The Maqu network is located in the headwaters of the Yellow River (33.60–34.20∘ N, 101.70–102.70∘ E), with a land cover dominated by grassland. It covers a large river valley, and its surroundings have elevations varying from 3400 to 3800 m above sea level (a.s.l.). Its annual mean air temperature is about 1.2 ∘C, and precipitation is around 600 mm yr−1. The Maqu network includes 26 SMST monitoring sites and covers an area of approximately 40 km by 80 km (Fig. 1b). There are 13 sites collecting SMST measurements at depths of 5, 10, 20, 40, and 80 cm, four sites with measurements at 5, 10, 20, and 40 cm, one site with measurements at 5, 10, and 20 cm, and eight sites with measurements at 5 and 10 cm. The corresponding data length for every depth of each site is presented in Table A1 for every year from May 2008 to May 2019. Eight initially established monitoring sites were damaged before 2015, and six new sites were installed between 2014 and 2016. Figure 2a shows the number of available monitoring sites for collecting SMST measurements at different depths in the Maqu network for every month between 2008 and 2019. The number of available monitoring sites providing SMST measurements of 5 cm is up to 19 in 2009, which, however, decreased as time progressed. The number of sites providing SMST measurements of 10 cm is comparable to that of 5 cm, but the SMST measurements at 20, 40, and 80 cm depths are considerably less. It can be found that the period between May 2010 and May 2011 contains the largest number of available monitoring sites. Among all the sites, the CST05 and NST01 sites provide, with 11 years of data, the longest records of SMST measurements for depths of 5, 10, 20, 40, and 80 cm from 2008 to 2019 (see Table A1).
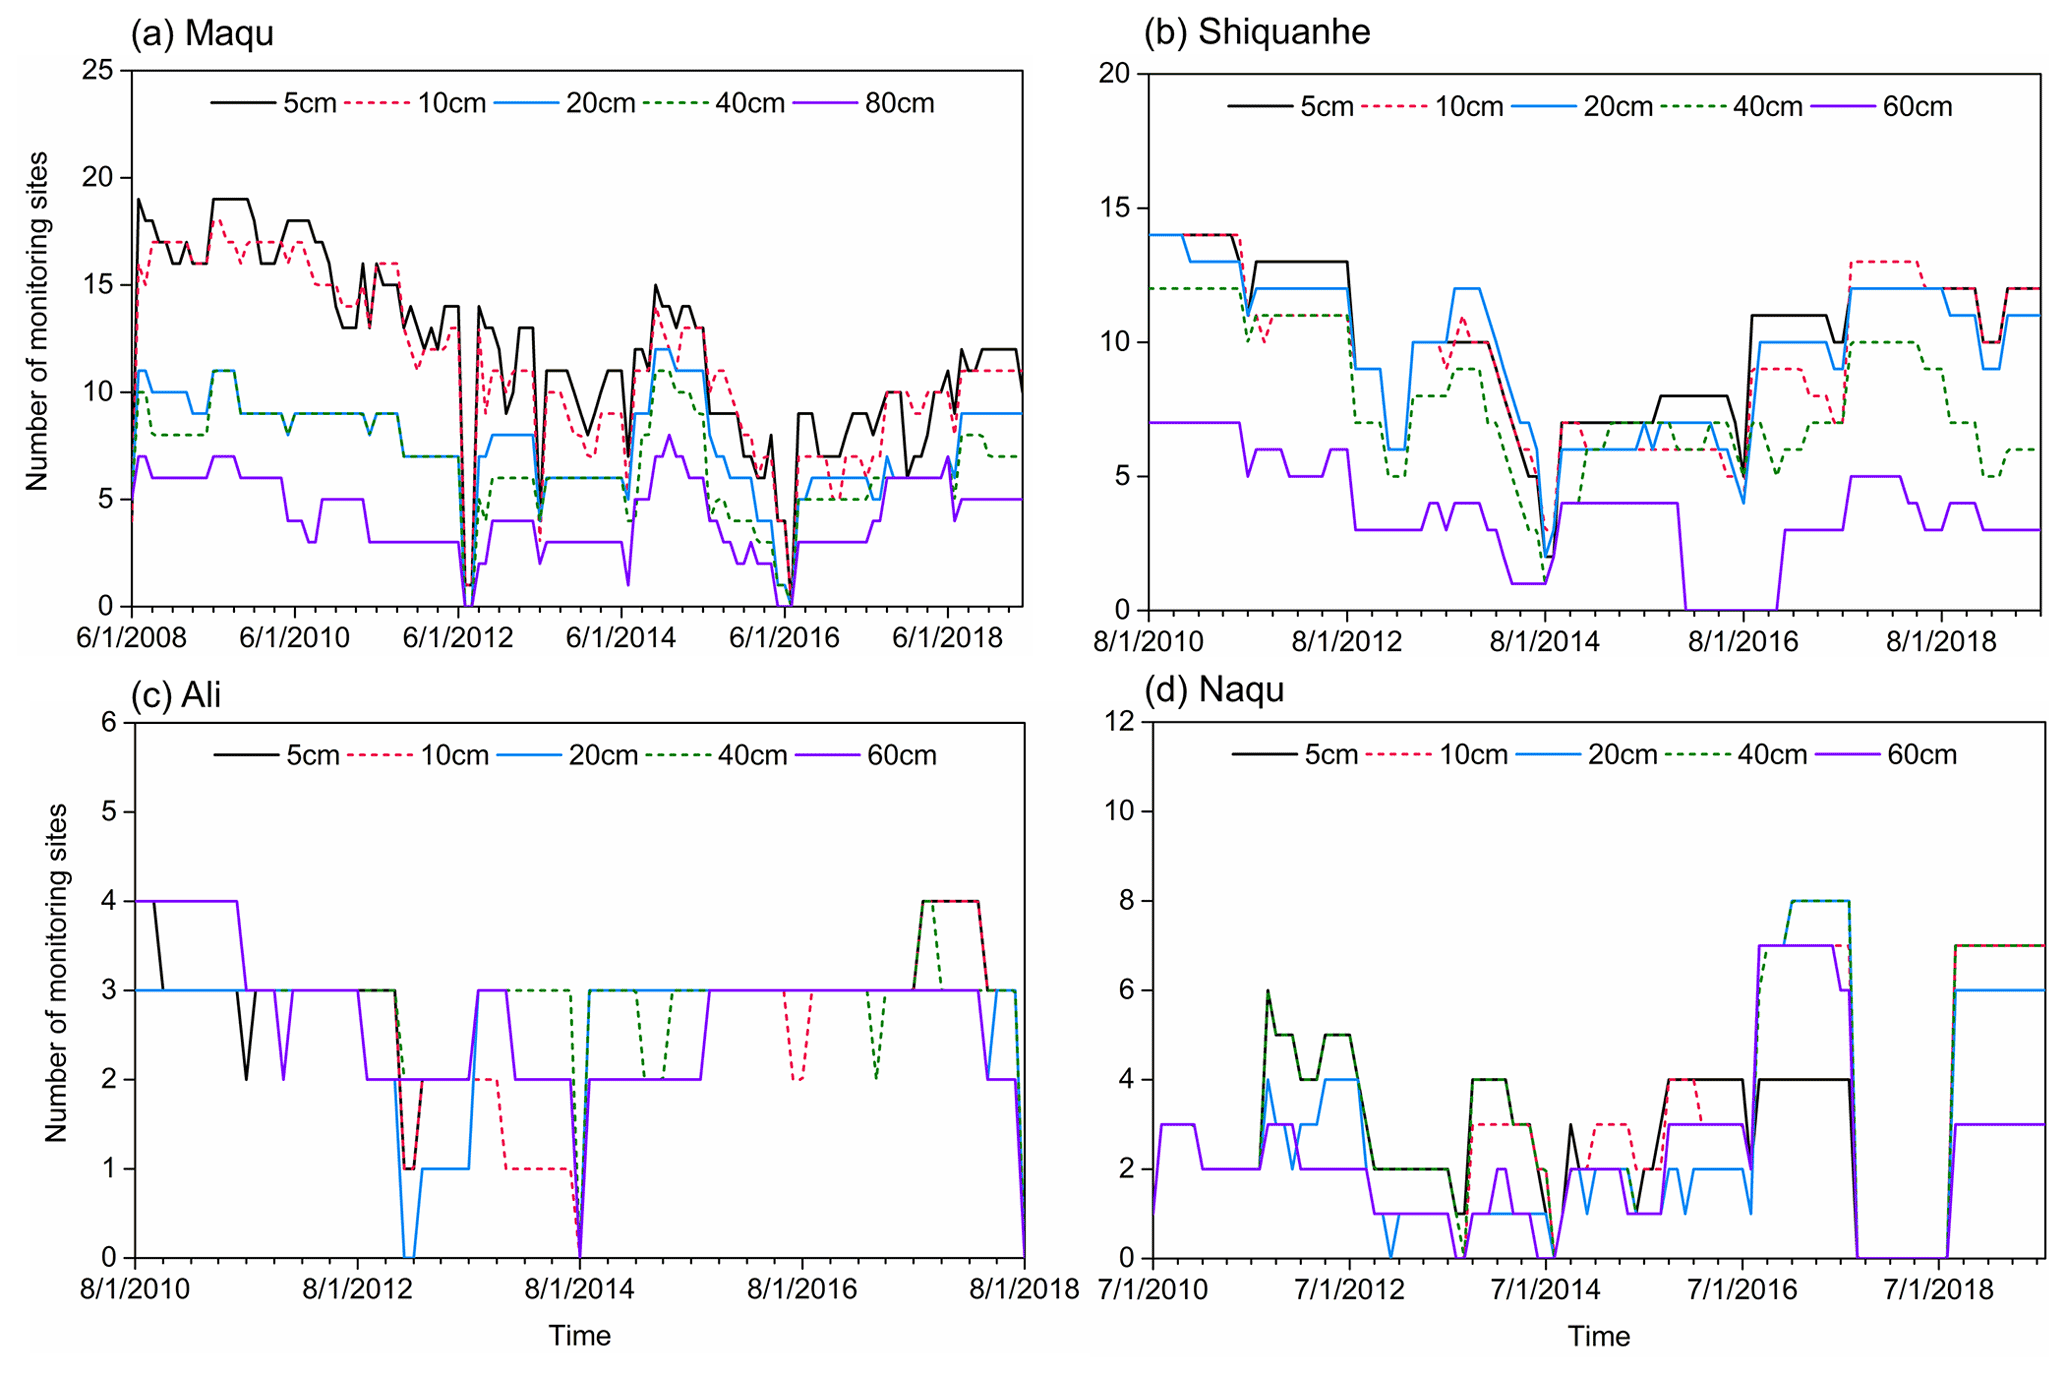
Figure 2Number of available SMST monitoring sites for different depths at each month for the (a) Maqu, (b) Shiquanhe, (c) Ali, and (d) Naqu networks.
2.1.3 Ngari network
The Ngari network is located in the Ngari prefecture and includes the Shiquanhe and Ali networks. The land cover of the network is dominated by a desert system at elevations varying from 4200 to 4700 m a.s.l. Its annual mean air temperature is about 7.0 ∘C, and precipitation is less than 100 mm yr−1. The Shiquanhe network situated in vicinity of the Shiquanhe county (32.36–32.76∘ N, 79.75–80.25∘ E), which includes 20 monitoring sites and covers an area of approximately 30 km by 40 km (Fig. 1d). There are nine sites collecting the SMST measurements at depths of 5, 10, 20, 40, and 60 cm, nine sites with measurements at 5, 10, 20, and 40 cm, and two sites with measurements at 5, 10, and 20 cm. The corresponding data length for every depth of each site is presented in Table A2 for every year from August 2010 to August 2019. Six initially established monitoring sites were damaged before 2016, and five new sites were installed in 2016. Figure 2b shows the number of available monitoring sites for collecting SMST measurements at different depths in the Shiquanhe network for every month between 2010 and 2019. The number of available monitoring sites providing SMST measurements of 5 cm is up to 14 in 2010, which then decreased as time progressed, until 2016, when new additional sites were installed, making the total up to 13 sites in 2017. The number of sites proving SMST measurements of 10, 20, and 40 cm are comparable to that of 5 cm, which is, however, significantly less for the SMST measurements at 60 cm. It can be also found that the period between August 2017 and August 2018 contains the largest number of available monitoring sites. Among all the sites, the SQ03 and SQ14 sites provide, with 10 years of data, the longest records of SMST measurements for depths of 5, 10, 20, and 40 cm from 2010 to 2019 (see Table A2). The Ali network is located near the Ngari station for the Desert Environment Observation and Research of the Chinese Academy of Science (NASDE/CAS; 33.30–33.50∘ N, 79.60–79.80∘ E). It consists of four monitoring sites (Fig. 1c) that all collect the SMST measurements at depths of 5, 10, 20, 40, and 60 cm. The corresponding data length for every depth and each site are presented in Table A2 for every year from August 2010 to August 2019 as well. Figure 2c shows the number of available monitoring sites for collecting SMST measurements at different depths in the Ali network every month between 2010 and 2018. It can be found that the number of available monitoring sites providing SMST measurements for every depth is generally less than four, and the valid data records are not continuous, and thus the Ali network will not be used for further analysis in this study.
2.1.4 Naqu network
The Naqu network is located in the Naqu River basin (31.20–31.40∘ N, 91.75–92.15∘ E) with a land cover dominated by tundra. It covers a flat terrain with rolling hills at 4500 m a.s.l. on average. It has a dry winter and rainy summer receiving about 400 mm precipitation per year. The Naqu network includes 11 SMST monitoring sites (Fig. 1e) that all collect the SMST measurements at around 5, 10, 20, 40, and 60 cm depths. The corresponding data length for every depth of each site is presented in Table A3 for every year from June 2010 to August 2019. Three initially established monitoring sites were damaged before 2016, and four new sites were installed in 2016. Figure 2d shows the number of available monitoring sites for collecting SMST measurements at different depths in the Naqu network every month between 2010 and 2019. The number of available monitoring sites providing SMST measurements for every depth is generally less than 4 before 2016, which increased significantly after 2016 but with continuous valid data of less than 2 years. Therefore, the SMST data in the Naqu network will also not be used for further analysis in this study.
2.2 Meteorological data
Precipitation and air temperature data used in this study for the Maqu and Shiquanhe networks are obtained from the meteorological dataset provided by the China Meteorological Administration (http://data.cma.cn/en/?r=data/detail&dataCode=A.0012.0001, last access: 9 September 2022). The dataset includes air pressure, air temperature, evaporation, precipitation, relative humidity, sunshine duration, and wind speed, which were collected by automatic weather stations. The daily precipitation and air temperature collected at the Maqu (34.00∘ N, 102.08∘ E) and Shiquanhe (32.50∘ N, 80.08∘ E) weather stations are used for comparison with the time series of SMST profile data, and the corresponding monthly values are used for a trend analysis. The daily precipitation is the cumulative value for the period between 20:00 China Standard Time (CST; this applies throughout, unless otherwise indicated) of the previous day and 20:00 CST of the current day, while the daily air temperature is the mean value for the period. The monthly precipitation is calculated by summing the daily precipitation, while the monthly mean air temperature is the average of daily air temperature within each month.
2.3 Model-based SMST products
Basic information of selected model-based SMST products is given in Table 3, and brief descriptions of each product are provided in the following subsections. The reason for selecting these products is due to the fact that they are more widely adopted and extensively assessed.
Table 3Information on the selected model-based products.
* The depth of this layer varies with region, and the value shown here is for our study area.
2.3.1 ERA5
The ERA5 is a reanalysis product obtained through the assimilation of as many observations as possible in the upper air and near surface. The SMST data are available from 1979 until the present, with a grid spacing of 0.25∘ × 0.25∘ and an hourly temporal resolution. The SMST data of the top three model layers are used in this study, which represent the soil depths of 0–7, 7–28, and 28–100 cm, respectively. The ERA5 product is available in the Climate Change Service (CSC) Climate Data Store (CDS) at https://cds.climate.copernicus.eu/cdsapp#!/dataset/reanalysis-era5-single-levels?tab=form (last access: 27 June 2022). More information about the ERA5 product can be found in Hersbach et al. (2020).
2.3.2 GLDAS-2.1 CLSM
The Global Land Data Assimilation System version 2 Catchment Land Surface Model (GLDAS-2.1 CLSM) product is based on simulations by the Catchment F2.5 land surface model (LSM) performed with the Land Information System (LIS) version 7. The SMST data are available from 2000 until the present, with a grid resolution of 1.0∘ × 1.0∘ and at a time interval of 3 h. The ST data for the depths of 0–10, 10–29, and 29–68 cm are selected in this study, and the surface SM (0–2 cm) and root zone SM (0–100 cm) data are also used. The GLDAS-2.1 CLSM product is available in the Goddard Earth Science Data and Information Services Center (GES DISC) at https://disc.gsfc.nasa.gov/datasets/GLDAS_CLSM10_3H_2.1/summary (last access: 27 June 2022). More information about the GLDAS product can be found in Rodell et al. (2004).
2.3.3 GLDAS-2.1 Noah
The GLDAS-2.1 Noah product is based on the Noah LSM version 3.6 simulations performed with the LIS version 7. The SMST data are available from 2000 to the present, with a grid resolution of 0.25∘ × 0.25∘ and with a 3 h interval. The SMST data for the depths of 0–10, 10–40, and 40–100 cm are used in this study. The GLDAS-2.1 Noah product is available in the GES DISC at https://disc.gsfc.nasa.gov/datasets/GLDAS_NOAH025_3H_2.1/summary (last access: 27 June 2022).
2.3.4 GLDAS-2.1 VIC
The GLDAS-2.1 variable infiltration capacity (GLDAS-2.1 VIC) product is based on the VIC 4.1.2 LSM simulations performed with the LIS version 7. The coverage period, grid spacing, and time interval of the SMST data are the same as the GLDAS-2.1 CLSM product. The SMST data of the first and second model layers are selected in this study. The surface layer has a 30 cm depth, whereas the depth of second layer varies with region that is about 30–130 cm for our study areas, as can be found at https://ldas.gsfc.nasa.gov/gldas/specifications (last access: 27 June 2022). The GLDAS-2.1 VIC product is available in the GES DISC at https://disc.gsfc.nasa.gov/datasets/GLDAS_VIC10_3H_2.1/summary (last access: 27 June 2022).
2.3.5 MERRA-2
The Modern-Era Retrospective analysis for Research and Applications, version 2 (MERRA-2), is the latest version of global atmospheric reanalysis product which uses the Goddard Earth Observing System (GEOS) model version 5.12.4. The SMST data are available from 1980 to the present, with a grid size of 0.5∘ × 0.625∘ and an hourly interval. The ST data of the top three model layers and SM data of the surface (0–5 cm) and root zone (0–100 cm) are selected in this study. The layer thicknesses of model layers for the ST data also varies with region, which are 0–10, 10–30, and 30–70 cm for our study areas, as can be found at https://disc.gsfc.nasa.gov/datasets/M2C0NXLND_5.12.4/summary (last access: 27 February 2022). The MERRA-2 product is available from the GES DISC at https://disc.gsfc.nasa.gov/datasets/M2T1NXLND_5.12.4/summary (last access: 27 June 2022). More information about the MERRA-2 product can be found in Gelaro et al. (2017).
3.1 Production and uncertainty analysis of upscaled SMST profile dataset
Spatial upscaling is used to create regional-scale SMST data from in situ measurements collected at an individual location that matched with the spatial domain of satellite-based and model-based products. Zhang et al. (2021) demonstrated the better performance of the arithmetic averaging approach in upscaling the surface SM of the Tibet-Obs network in comparison to the Voronoi diagrams, time stability, and apparent thermal inertia methods that are widely adopted in the existing literature (Qin et al., 2015; Colliander et al., 2017). Therefore, the arithmetic averaging approach is also adopted in this study to obtain the regional-scale SMST profile data for Maqu and Shiquanhe. The arithmetic averaging method assigns equal weight to each SMST monitoring site of the network, which can be formulated as follows:
where t represents the time in days, i represents the ith SMST monitoring site, M represents the total number of monitoring sites, stands for the upscaled SMST, and is the SMST measurements for the ith site.
Considering that the number of available SMST monitoring sites in the Tibet-Obs network generally changes with time (see Fig. 2), Zhang et al. (2021) suggested using only the sites that provide the longest continuous measurements to obtain the long-term upscaled dataset. They also showed that the upscaled surface SM with the input of all active monitoring sites, regardless of the continuity, tends to produce an inconsistent trend. Therefore, we use the sites of Maqu and Shiquanhe networks that have the longest records of SMST profile data from 2009 to 2019 to produce the long-term upscaled dataset. Specifically, measurements collected from the CST05 and NST01 sites in the Maqu network are selected to produce the long-term regional-scale SMST dataset for depths of 5, 20, 40, and 80 cm for the period between May 2009 and May 2019. The measurements at the 10 cm are not used for the upscaling because the sensor at 10 cm depth at the CST05 site was changed once in mid-May 2011, which led to a discontinuity in the collected time series. As in Zhang et al. (2021), the measurements collected in the year with the largest number of available monitoring sites, i.e. May 2010 and May 2011 for the Maqu network (see Fig. 2), are used to preliminarily quantify the uncertainty in the upscaled SMST profile data, whereby the average of the measurements at all the available sites is treated as a ground reference for the Maqu network. Similarly, measurements collected from the SQ03 and SQ14 sites in the Shiquanhe network are selected to produce the long-term regional-scale SMST dataset for depths of 5, 10, 20, and 40 cm for the period between August 2010 and August 2019, since both sites only provide SMST profile measurements up to 40 cm. The average of the measurements collected for the period between August 2017 and August 2018 that has the largest number of available sites is used to quantify the uncertainty in the upscaled SMST data in the Shiquanhe network.
3.2 Pre-processing of model-based products
We select five widely used model-based products (see Sect. 2.3) which contain both SM and ST profile simulations. To make an objective evaluation of these products using the Tibet-Obs in situ SMST data, some essential pre-processing steps are undertaken regarding to three aspects, namely to unify the time interval and units of SMST simulations, determine the number of model grids that cover the in situ network, and match the model layers to the depths of in situ measurements.
The units of SM data from the GLDAS-2.1 CLSM, Noah, and VIC products are converted from kilograms per metre squared (kg m−2) to cubic metres per cubic metre (m3 m−3), following Eq. (2), and the units for the ERA5 and MERRA-2 SM data are already in cubic metres per cubic metre (m3 m−3).
where SWC represents the soil water content (kg m−2), L (m) represents the layer thickness, and represents the soil water density (kg m−3). The units of ST data from all the model-based products are converted from Kelvin (K) to degrees Celsius (∘C). The hourly or 3 h SMST data from all the products are averaged to daily values. We define the period between 1 May and 31 October as the warm season and the period between 1 November of the previous year and 30 April of the following year as the cold season. The ERA5, GLDAS-2.1 CLSM, and VIC SM data in the cold seasons are excluded for the analysis in this study, since their values represent the total soil water content, including both liquid water and ice content, while the in situ SM data only provide measurements of liquid water content.
All the model grids falling into the scope of in situ network are extracted from each product. Afterwards, the native grids of each product are downscaled to 0.25∘ × 0.25∘ sub-grid cells using a bilinear interpolation. Subsequently, the SMST data in all the sub-grid cells falling into the scope of the in situ network are averaged to match the upscaled in situ SMST data that represent the regional-scale mean values of the in situ network (see Fig. B1).
To match the depths of the in situ SMST measurements, we compared the linear interpolation method and the depth-weighted interpolation method that are widely used to resample the SMST data across the vertical soil profile in the previous studies (Gao et al., 2017), and the results were found to be comparable to each other (figure not shown). To make full use of the valid in situ measurements, the linear interpolation method was thus adopted in this study. We assume that the SMST values of each model layer are representative of the mid-point of this layer. For example, the SMST for the layer of 10–40 cm in the GLDAS-2.1 Noah product is representative of the depth of 25 cm. The detailed calculation processes are presented in Appendix B.
3.3 Statistical indicator
Four statistical indicators are used in this study for the evaluation of the upscaled in situ SMST data and the model-based products, including bias, root mean square difference (RMSD), unbiased RMSD (ubRMSD), and the Pearson correlation coefficient (R). They can be formulated as follows:
where N denotes the number of data points. For the evaluation of upscaled in situ SMST data, represents the mean SMST of the largest number of available monitoring sites in a certain year for each in situ network (see Sect. 3.1), and represents the upscaled SMST based on the monitoring sites that provide the longest continuous measurements as input. For the assessment of model-based products, represents the upscaled SMST for each in situ network, and represents the SMST simulations derived from each product.
3.4 Trend analysis
The Mann–Kendall trend test reported by Gilbert (1987) is used in this study to determine whether a trend is presented within the long-term SMST time series derived either from the upscaled in situ measurements or from the model-based products. The trend analysis is also performed for the precipitation and air temperature data for comparison purposes. The trend analysis is, respectively, carried out over the warm season, the cold season, and the full year. Therefore, the data points are the monthly mean values of each year for calculating seasonal statistics instead of the annual mean value, and all missing data points are assigned an equal value smaller than the existing valid data points. If the trend test results show a significant upward or downward tendency, then the Sen's slope estimate method is adopted to quantify the magnitude of the tendency. A detailed description of the trend analysis process can be found in Appendix C.
Section 4.1 gives the uncertainty analysis results for the upscaled SMST profile data. Section 4.2 presents the upscaled SMST profile data for the Maqu and Shiquanhe networks spanning the 10-year period from 2010 to 2019 (see Sect. 3.1), together with the analysis results for the SMST seasonal dynamics, trend test, detection of F/T state, and soil freezing characteristics at different depths. The application of the upscaled data to evaluate the performance of model-based products is presented in Sect. 4.3 to demonstrate its suitability for the evaluation of readily available SMST profile products.
4.1 Uncertainty analysis of the upscaled SMST profile dataset
The spatial upscaling data are inevitably subject to uncertainty as a result of the SMST spatial variabilities. Therefore, in this section, we quantify the uncertainties in the long-term upscaled SMST profile dataset for the Maqu and Shiquanhe networks via comparisons with the mean of the SM and ST measurements collected during the year and the largest number of active monitoring sites that is considered to be the ground truth (hereafter SMtru and STtru), as shown in Zhang et al. (2021; see Sect. 3.1). The selected validation periods are from 16 May 2010 to 15 May 2011 and from 1 September 2017 to 31 August 2018 for the Maqu and Shiquanhe networks, respectively.
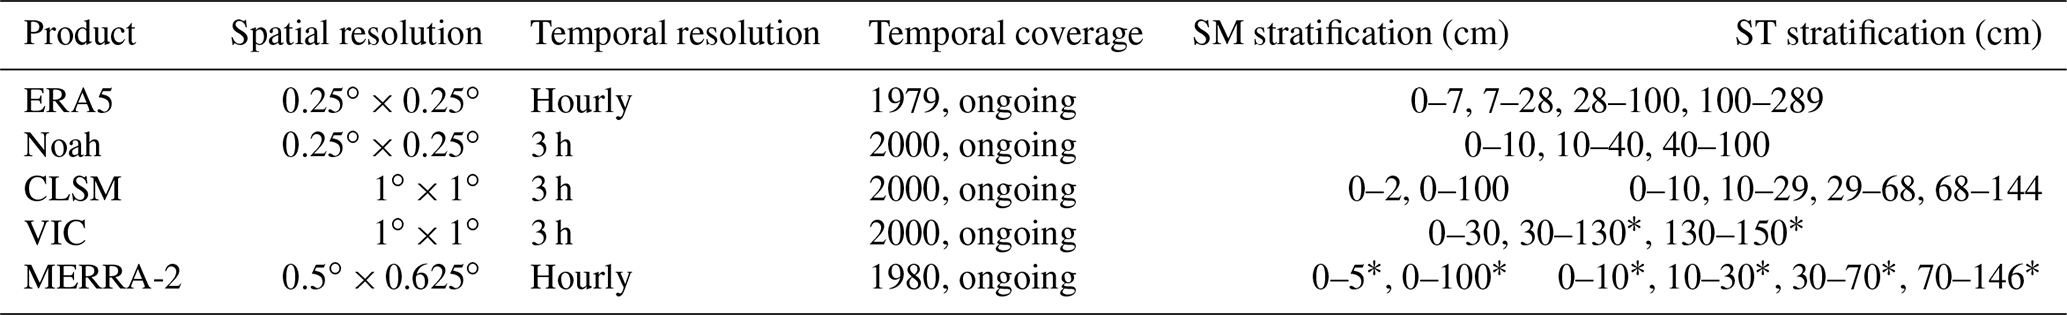
Figure 3a shows the comparisons between the time series of SMups and SMtru at soil depths of 5, 20, and 40 cm with a 15 min interval for the Maqu network from 16 May 2010 to 15 May 2011, and the comparisons between the STups and STtru profile dynamics are shown in Fig. 3b. The statistical performance metrics, i.e. bias, RMSD, ubRMSD, and R, computed between the upscaled SMST and the ground truth are shown in the figure as well. In general, the variations in SMups and SMtru are consistent with each other at every depth, as indicated by the very high R values (≥0.985), yielding RMSD values of 0.025, 0.019, and 0.030 m3 m−3 at the depths of 5, 20, and 40 cm, respectively. These RMSD values are comparable to and even better than the measurement accuracy (see Sect. 2.1), indicating the good performance for the SMups profile data. The consistency between the STups and STtru variations is even better, as indicated by higher R values (≥0.995) for each soil depth, yielding RMSD values of 0.7, 0.2, and 0.3 ∘C at the depths of 5, 20, and 40 cm, respectively. These RMSD values are also better than the reported accuracy of the temperature measurements (see Sect. 2.1), implying the good performance for the STups profile data as well. Table 4 presents further the freezing start day (FSD), thawing end day (TED), and F/T duration for 5, 20, and 40 cm soil depths estimated based on the upscaled SMST profile data and ground truth, respectively. The estimated FSD, TED, and F/T duration are close to each other, especially at the upper soil layers (e.g. 5 and 20 cm), and the noted differences for the FSD and TED are generally less than 3 d, except for that of TED at 40 cm, leading to differences of not more than 4 d for the F/T duration.
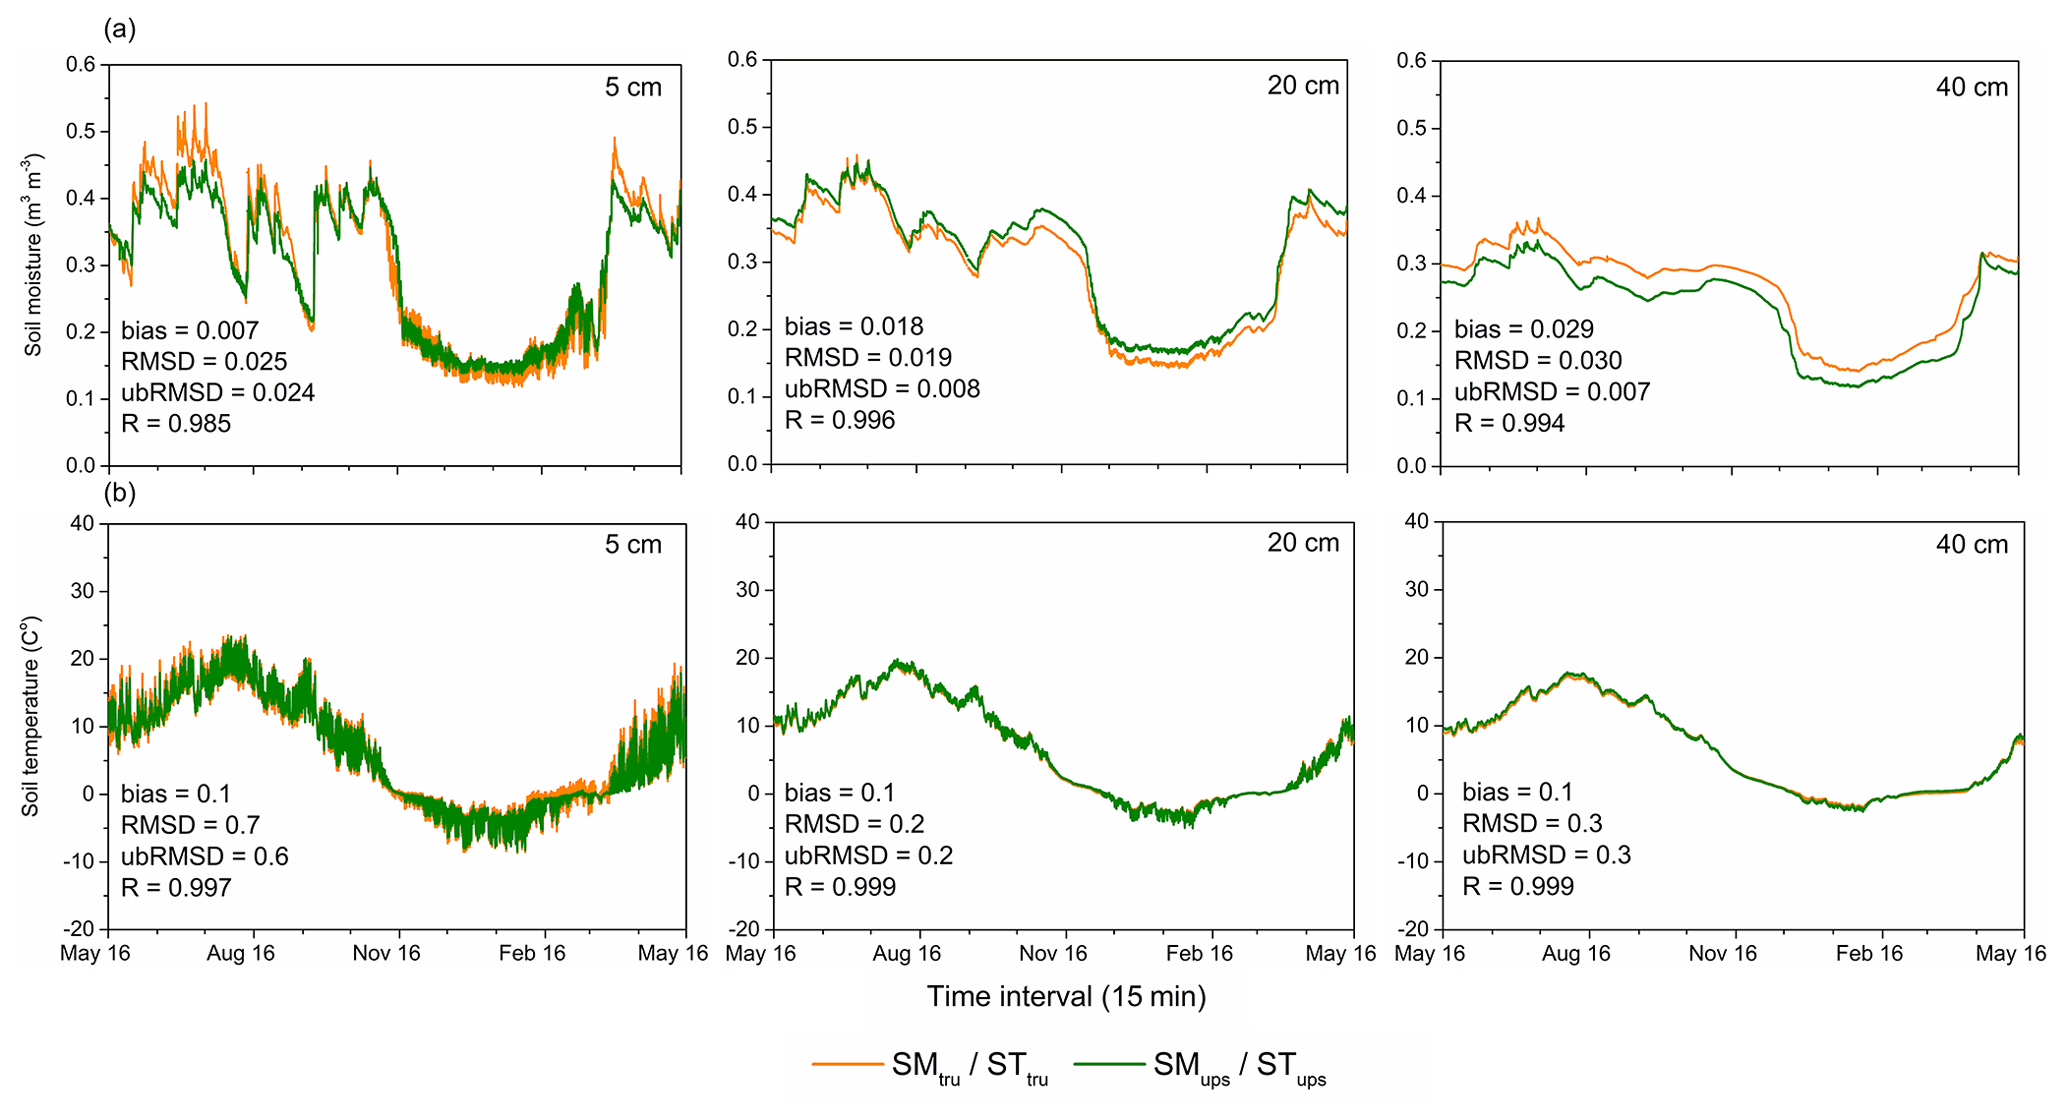
Figure 3Comparisons between the time series of (a) SMups and SMtru and (b) STups and STtru at soil depths of 5, 20, and 40 cm with 15 min interval from 16 May 2010 to 16 May 2011 for the Maqu network.
Table 4Estimation of FSD, TED, and F/T duration at soil depths of 5, 20, and 40 cm using the upscaled SMST profile dataset and ground truth in the selected single year for the Maqu and Shiquanhe networks.
Figure 4a shows the comparisons between the time series of SMups and SMtru at soil depths of 5, 20, and 40 cm with 15 min interval for the Shiquanhe network from 1 September 2017 to the 31 August 2018, and the comparisons between the STups and STtru profile dynamics are shown in Fig. 4b. The statistical performance metrics are shown in the figures as well. Similar to the Maqu network, the variations in SMups and SMtru are consistent with each other for each soil depth, as indicated by high R values (>0.92), yielding RMSD values of 0.011, 0.009, and 0.010 m3 m−3 at the depths of 5, 20, and 40 cm, respectively. These RMSD values are much better than the measured accuracy of the adopted SM sensor (see Sect. 2.1), indicating the good performance for the SMups profile data. The consistency between the STups and STtru variations is even better, as indicated by higher R value (≥0.97) for every soil depth. Table 4 presents the FSD, TED, and F/T duration for 5, 20, and 40 cm soil depths estimated based on the upscaled SMST profile data and ground truth, respectively. The estimated FSD, TED, and F/T duration are close to each other, especially at the upper soil layers (e.g. 5 and 20 cm), and there is little difference for the FSD and TED, except for that of TED at 40 cm, leading to differences of not more than 8 d for the F/T duration.
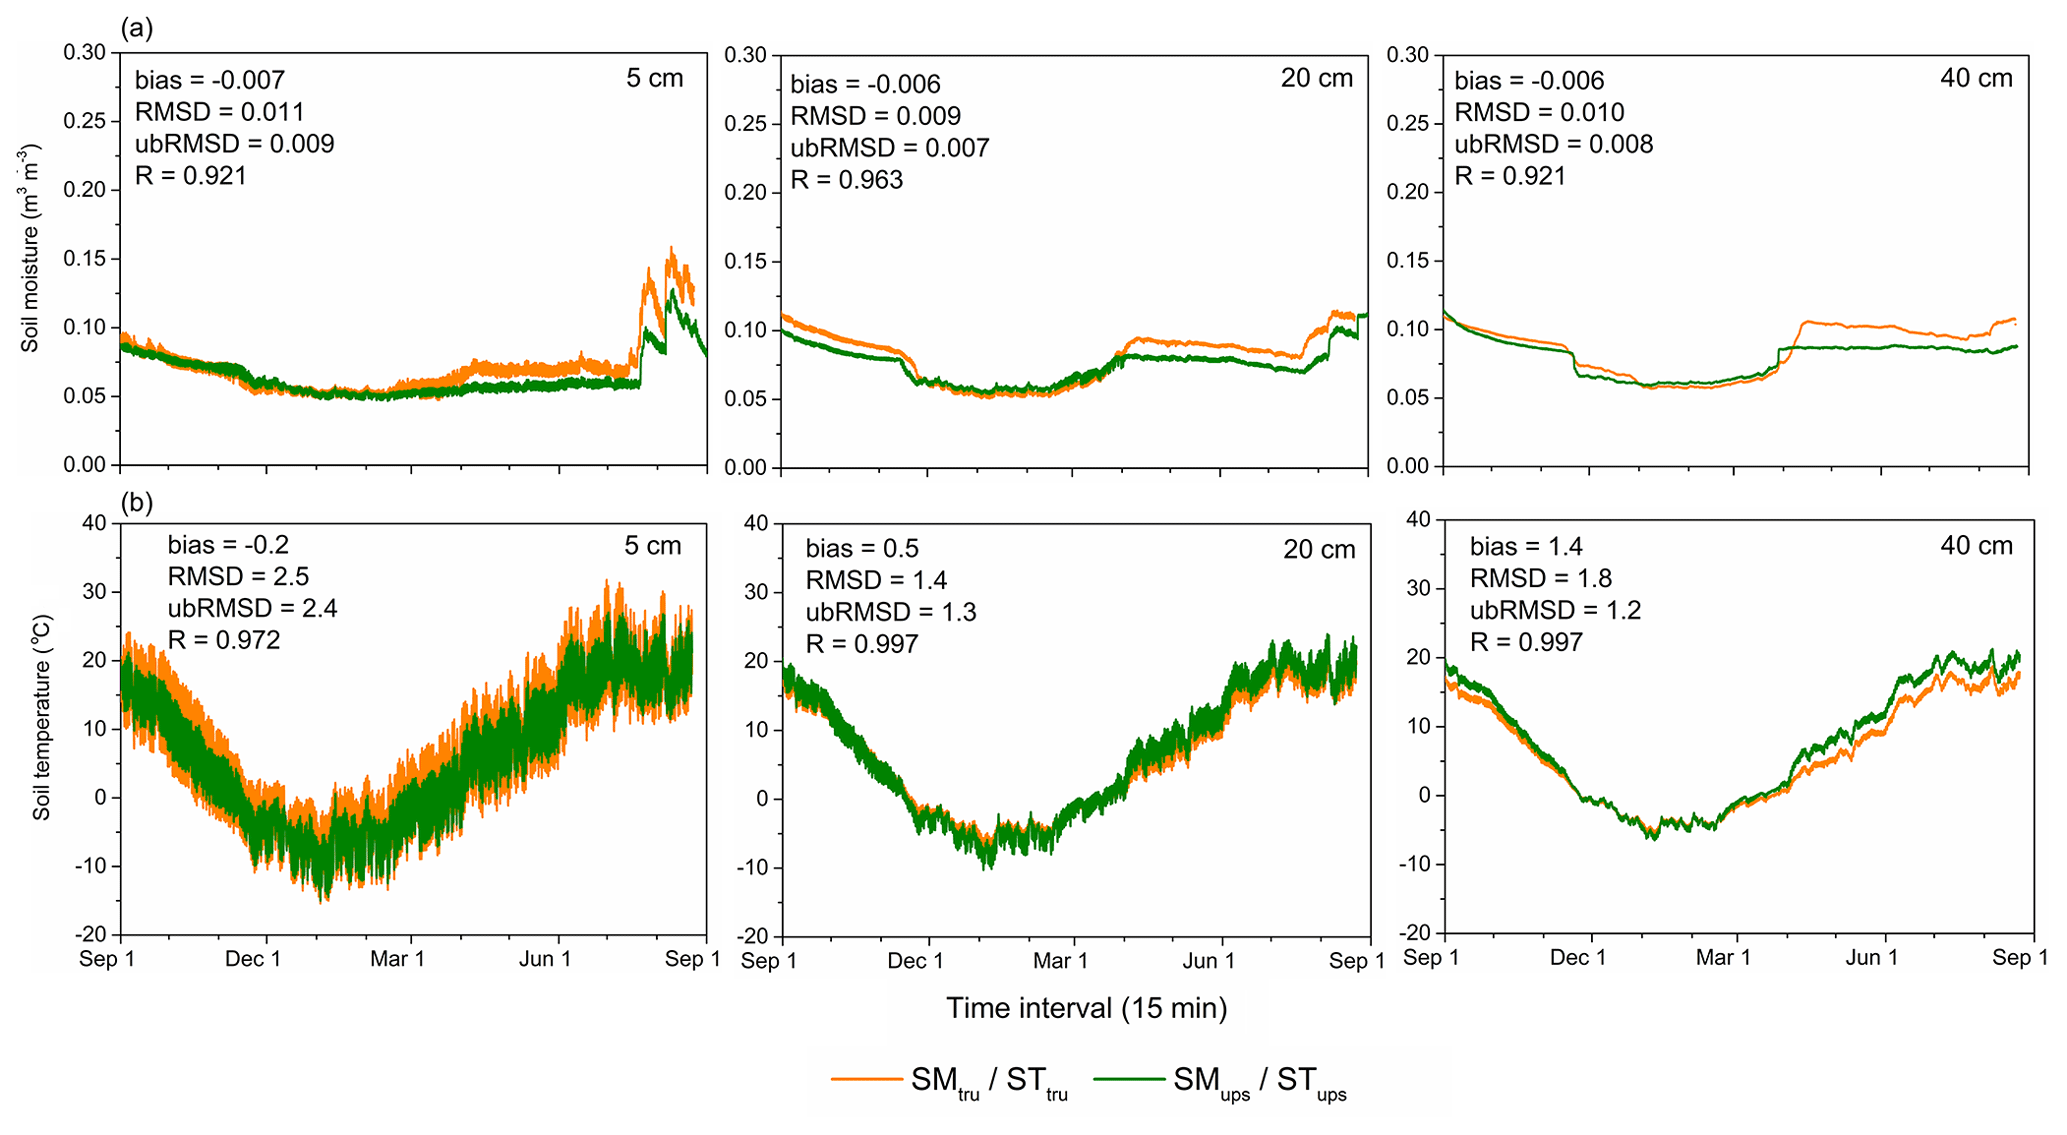
Figure 4Same as Fig. 3 but for the Shiquanhe network from 1 September 2017 and 31 August 2018.
4.2 Analysis of the upscaled SMST profile measurements
4.2.1 Maqu network
Figure 5a and c show the time series of upscaled daily SM (SMups) and ST (STups) at depths of 5, 20, 40, and 80 cm from January 2010 to December 2018 for the Maqu network, respectively. The daily precipitation (P) and air temperature (Ta) collected from the Maqu weather station (Fig. 1b) are also shown for comparison purposes. The time series of the SMups at different depths shows similar seasonal variations, with high values in warm summers with larger amounts of precipitation and low values in cold winters with soil freezing and much smaller amounts of precipitation. The amplitudes of SMups variations generally decrease with increasing soil depth, with larger variations noted for soil layers above 20 cm and smallest one at the deepest depth of 80 cm. The soil layers below 20 cm are drier than the upper layers in the warm season, whereas the soil at depth of 80 cm is wetter than 40 cm, which might be attributed to absence of evapotranspiration and existence of shallow groundwater (Li et al., 2021). The time series of the STups at different depths also show similar seasonality, with peak values in summer and the lowest values in winter, which is in agreement with the seasonal Ta dynamics. The soil layers above 40 cm generally drop below 0 ∘C in winter, while the STups of 80 cm is always greater than 0 ∘C throughout the year, indicating that the maximum freezing depth in the Maqu network is shallower than 80 cm. The magnitude of STups variations also diminishes with increasing soil depth.

Figure 5Time series of upscaled daily (a) SMups and (c) STups at depths of 5, 20, 40, and 80 cm for the Maqu network between January 2010 and December 2018. The subplots highlight the time series of upscaled (b) SMups and (d) STups with intervals of 15 min between 16 May 2010 and 16 May 2011. (e) Annual variations in FSD, TED, and F/T duration at 5, 20, and 40 cm depths. The time series of daily precipitation and air temperature are shown in panels (a) and (c) as well.
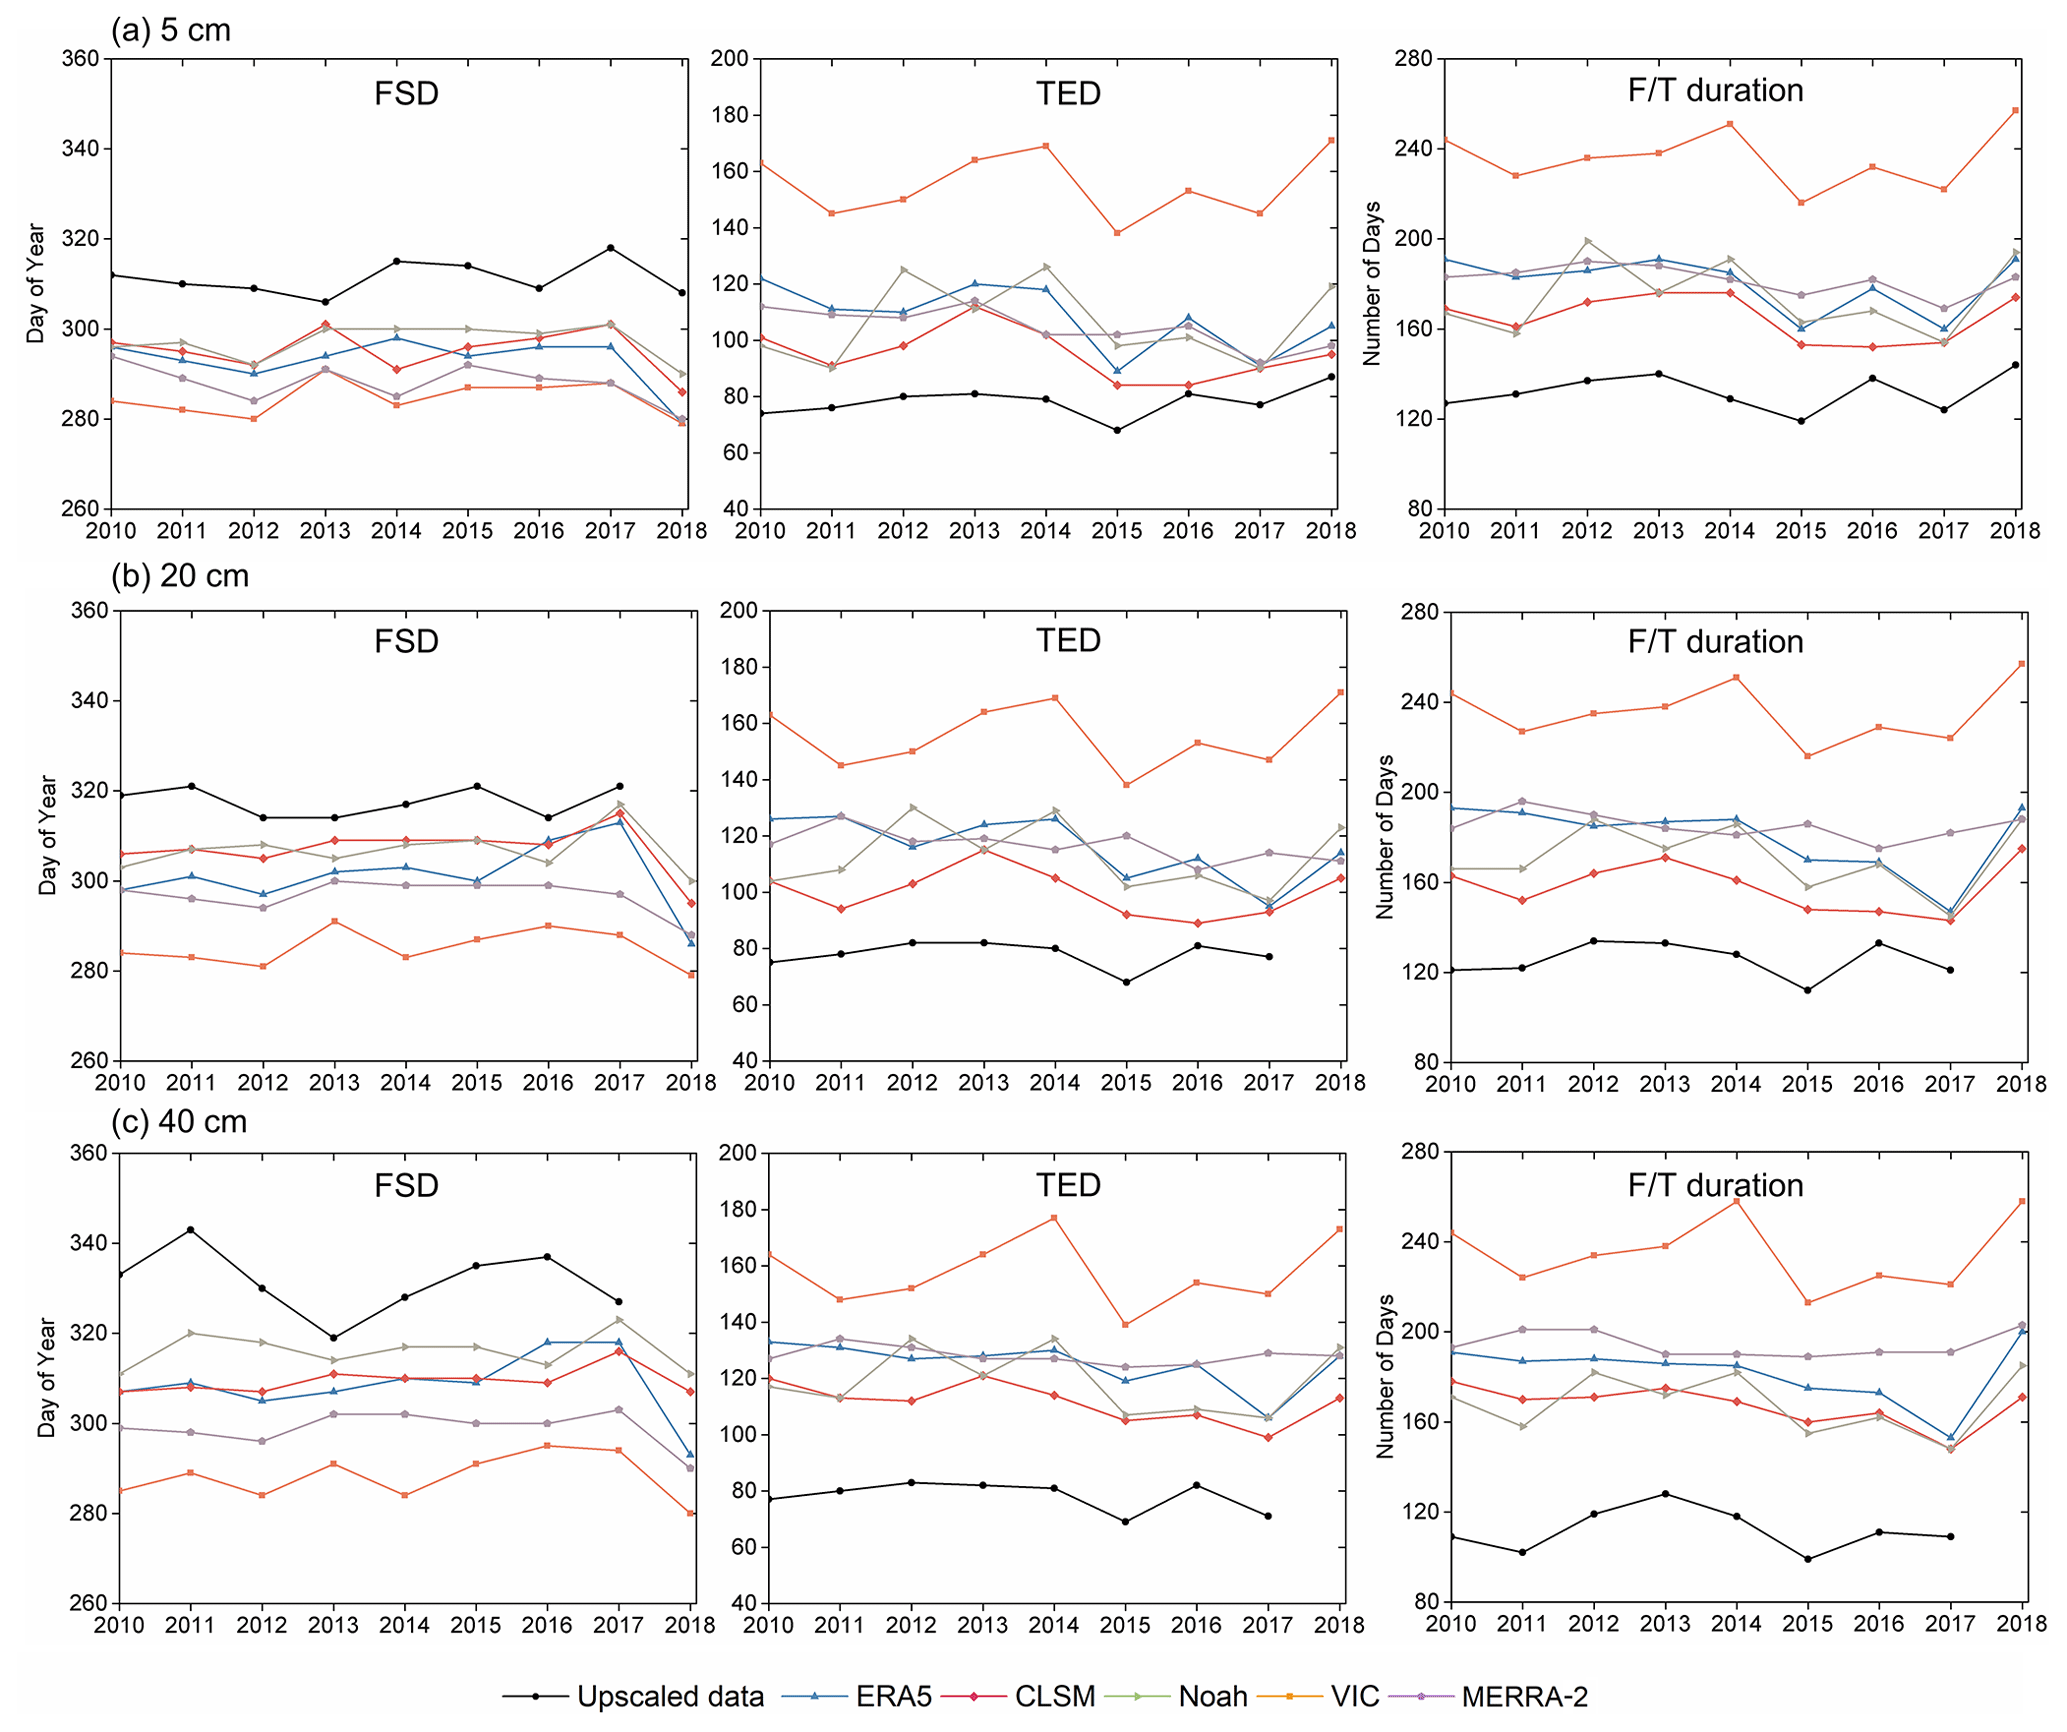
Figure 5b and d show the SMups and STups profile dynamics with 15 min interval for a single year between May 2010 and May 2011, which confirm that amplitudes of both SMups and STups variations decrease with depth. The SMups variations at 5 and 20 cm are comparable to each other and larger than those at 40 and 80 cm, which also show better response to the precipitation in rainy season. Obvious diurnal cycles can be noted for the STups at 5 cm, which diminish with depth and are virtually absent at 40 cm. The STups at 5 cm starts to drop below 0 ∘C in around mid-November, leading to a sharp decrease in surface SMups due to the freezing of the soil. The deeper layers gradually freeze as time progresses, and the freezing depths reach its peak around mid-February. Later on, the soil starts thawing with a sharp increase in SMups as the STups rises above 0 ∘C, and the entire soil profile is totally thawed around the mid-April. In general, both the start date of the soil freezing and end date of the soil thawing increase with increasing soil depth. To further explore the characteristics of F/T cycle in the Maqu network, Fig. 5e shows the freezing start day (FSD), thawing end day (TED), and F/T duration of each year for the depths of 5, 20, and 40 cm during the study period, and the 80 cm layer does not freeze (see Fig. 5c and d). The FSD is defined as the first day that the daily ST drops below 0 ∘C, along with a sharp SM decrease in the current year, and the TED is the last day of ST below 0 ∘C in the next year. The number of days between the FSD and TED is referred to as the F/T duration. There is no specific information on the FSD and TED in 2017 for the depths of 5 and 20 cm due to missing data of the in situ ST measurements in this period, and the same holds for the soil depth of 40 cm between 2015 and 2018 (see Figs. 2a and A1). It can be observed that the interannual variabilities in the FSD, TED, and F/T duration for each depth are within 30 d, and no significant trend is found. It also confirms that the deeper layer generally shows a late onset of freezing and an earlier start of thawing every year, leading to a shorter F/T duration.
Figure 6a and b show the Mann–Kendall trend test and Sen's slope estimate for the 9-year (2010–2018) SMups and STups at depths of 5 and 20 cm for the Maqu network in the warm season, cold season, and for the full year. The trend analysis for the depth of 40 cm is not presented, since there is not a long enough (<7 years) continuous SMST time series due to missing data. The trends of the P and Ta are also shown in Fig. 6a and b, respectively. As described in Sect. 3.4, the time series would present a significant trend if the absolute value of statistic Z is greater than 1.96 in this study. The results show that no significant trend is found for the SMups at 5 and 20 cm in the warm season as for the P. For the cold season, the SMups at depths of 5 and 20 cm shows a drying trend despite the absence of a P trend. Consequently, the SMups at 5 and 20 cm in the full year also shows a drying trend, with Sen's slopes of −0.004 (m3 m−3 yr−1) and −0.002 (m3 m−3 yr−1), respectively, which is in agreement with the P trend. The full-year trend analysis results are consistent with the results reported by Shi et al. (2021), using the European Space Agency (ESA) Climate Change Initiative (CCI) SM product, since precipitation is the dominant driver of SM variation, which shows a significant negative trend in the humid area on the TP. The STups at depth of 5 cm shows a decreasing trend in the warm season, while no significant trend is found for the Ta and STups at 20 cm. In the cold season, there is no significant trend found for the Ta and STups at 5 and 20 cm. For the full year, the STups at 5 cm shows a decreasing trend with a Sen's slope of −0.08 (∘C yr−1), while no significant trend is found for the STups at 20 cm as for the Ta.
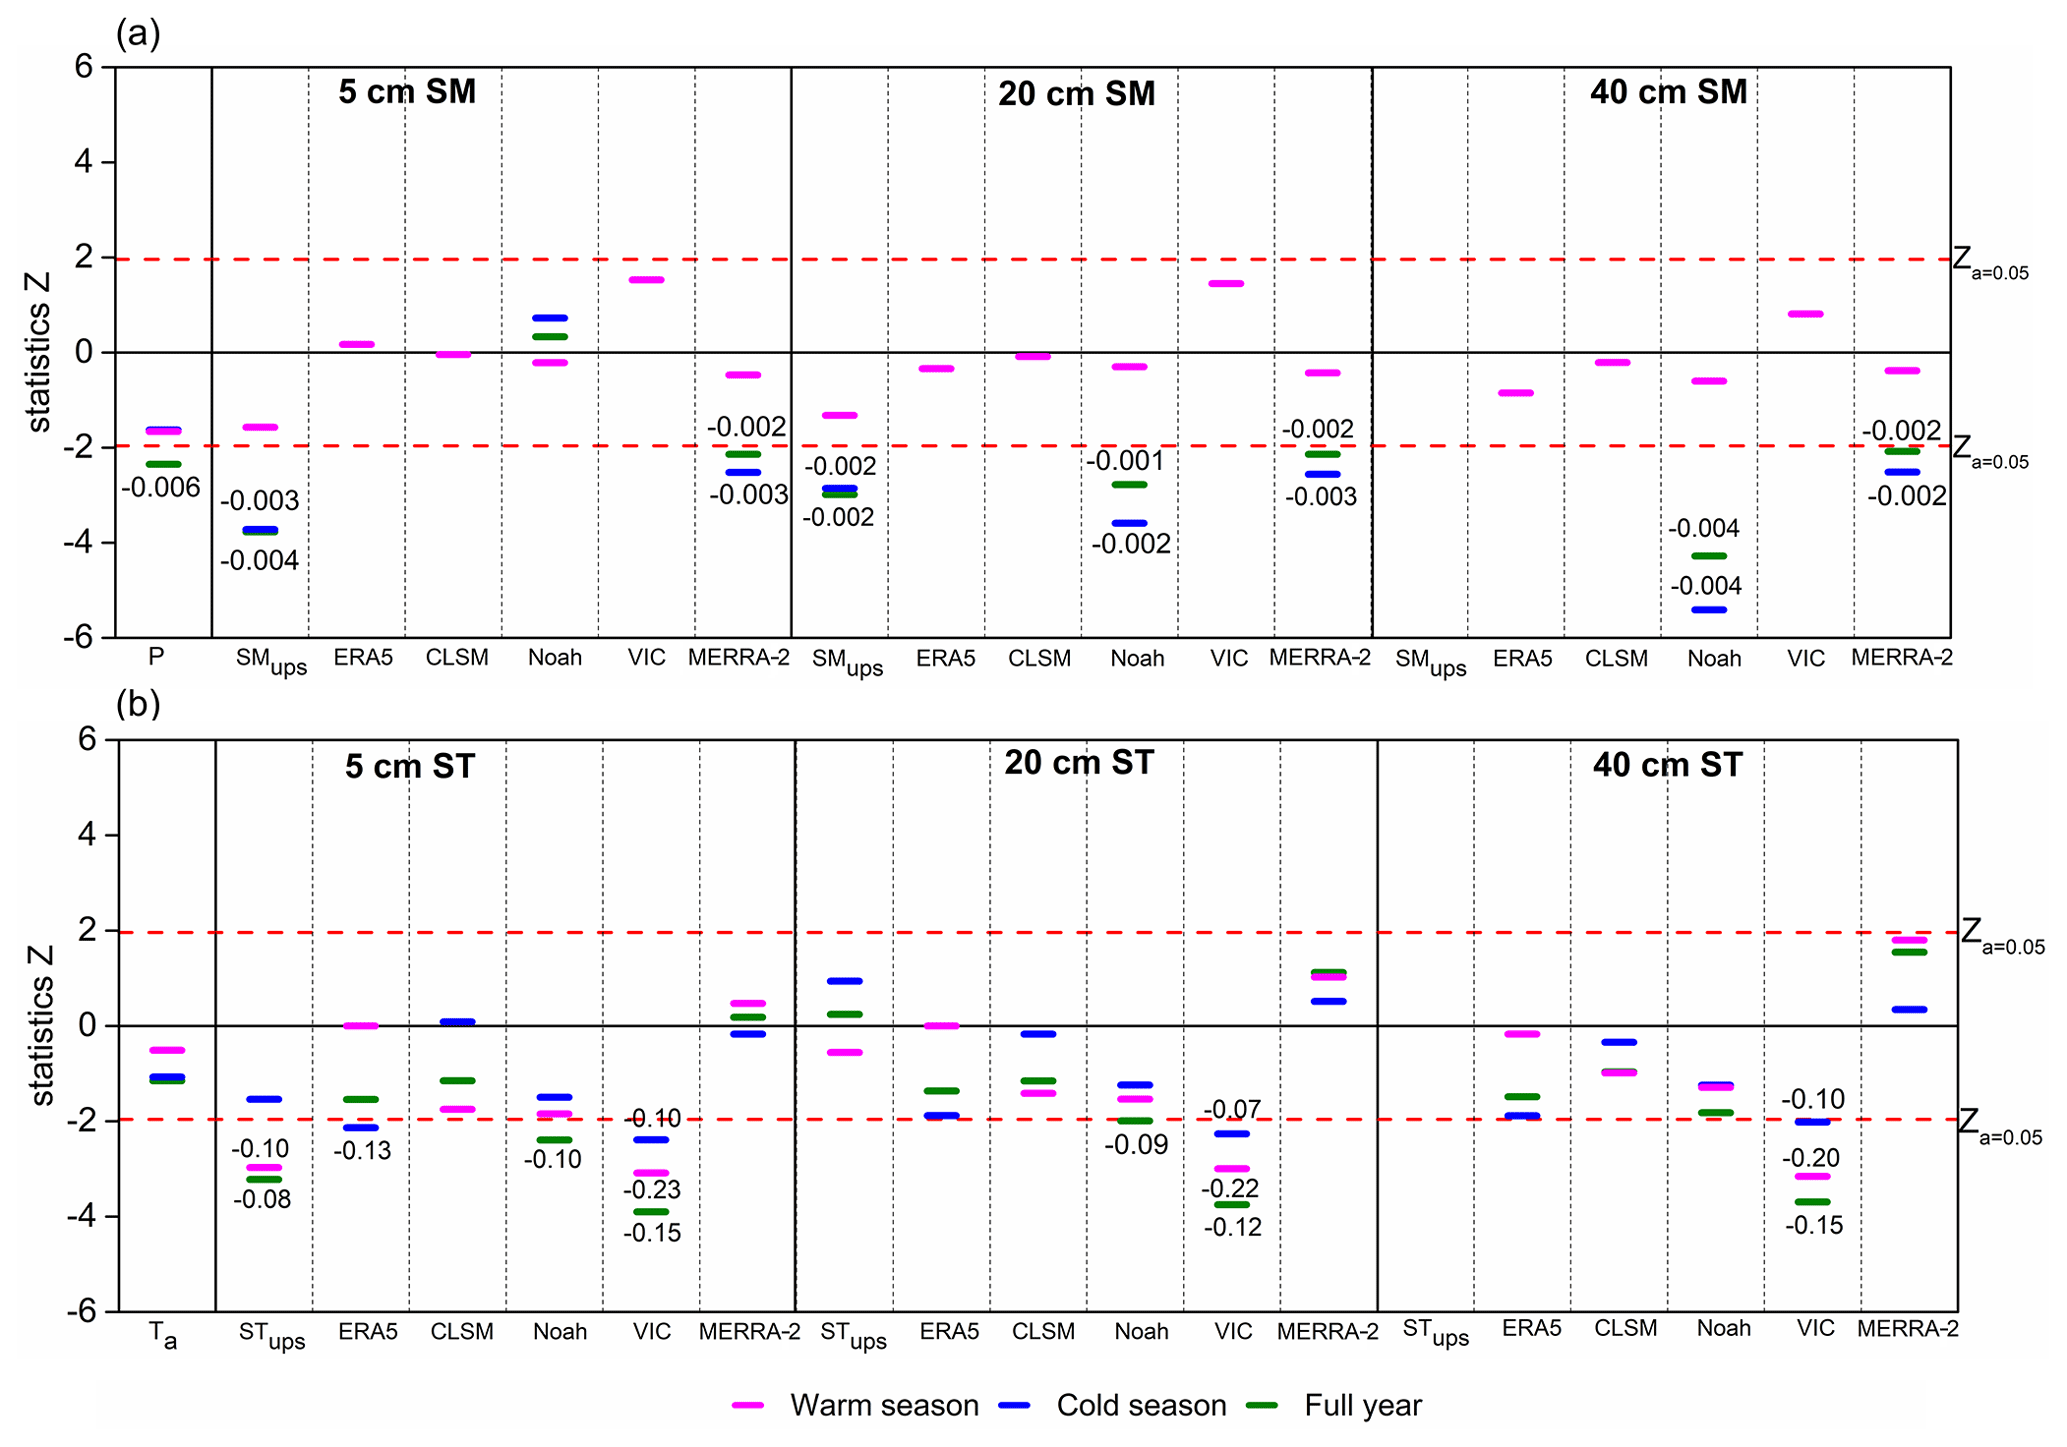
Figure 6Mann–Kendall trend test and Sen's slope estimate for the long-term (a) SM and (b) ST at depths of 5, 20, and 40 cm from 2010 to 2018 as obtained from the upscaled dataset and different model-based products for the Maqu network. The trend analysis results for the precipitation and air temperature are also shown in panels (a) and (b), respectively. The digits in the figure represent the values of the Sen's slope estimate.
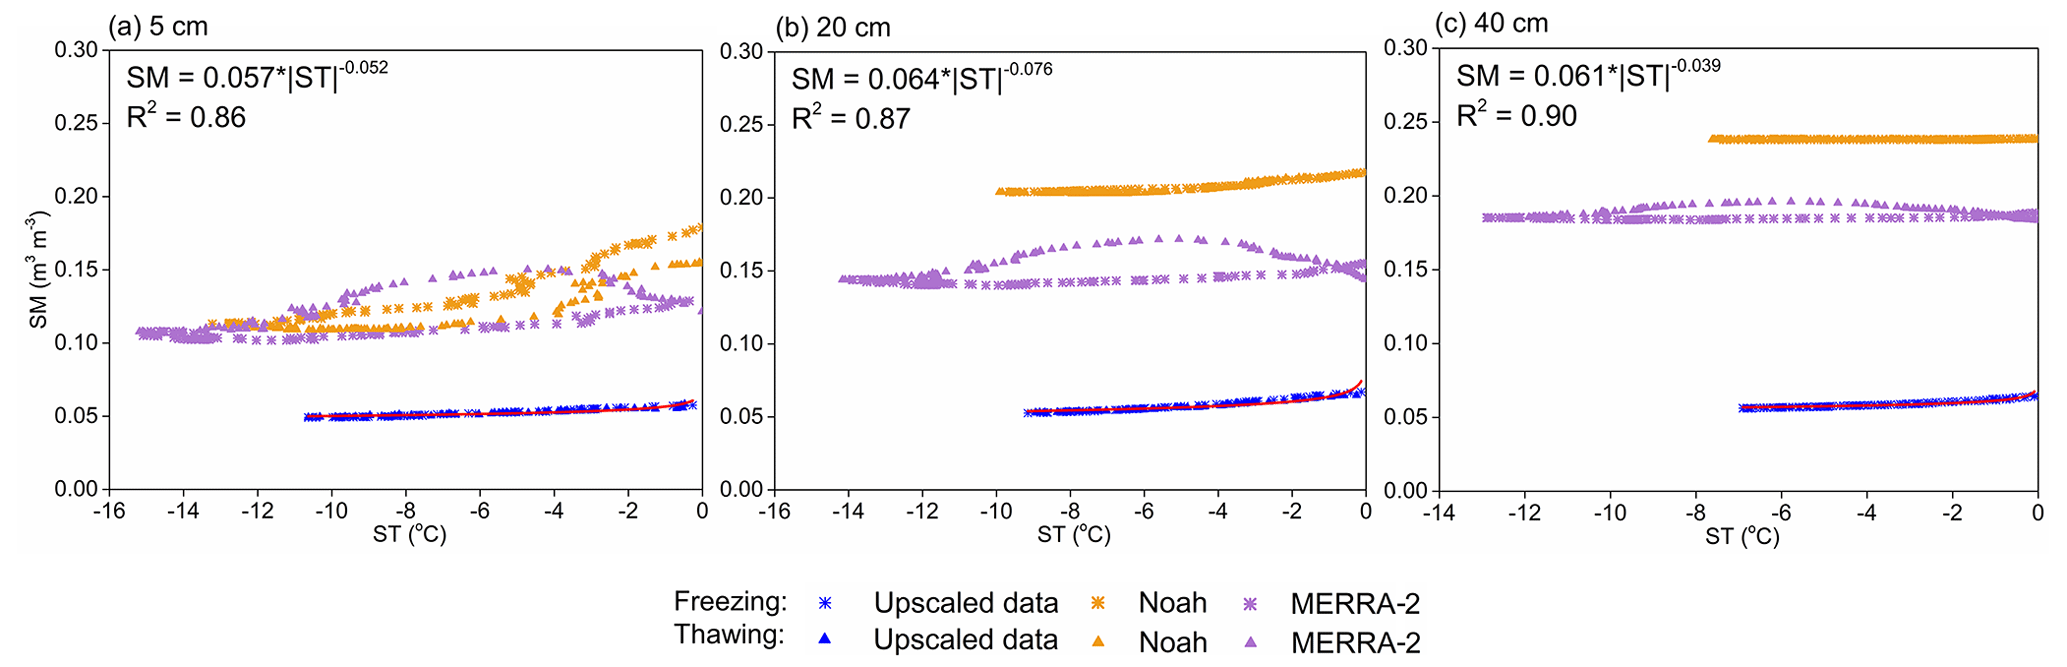
Figure 7 shows the soil freezing characteristics for the depths of 5, 20, and 40 cm for the Maqu network by plotting the STups against corresponding measured unfrozen SM for all subzero temperatures during the freezing and thawing periods in the cold season. The freezing period defined in this study spans the first date of ST falling below zero to the date when the lowest ST occurs, whereby the SM value is generally decreasing in this period. Later on, the thawing period starts and ends when the ST rises above zero, whereby the SM value is increasing during this period. The power function fitting curves to the soil freezing characteristics and corresponding fitting parameters are given in the figure for both freezing and thawing periods. The difference between the soil freezing characteristics of freezing and thawing periods is much smaller at the surface layer (i.e. 5 cm), which increases with increasing soil depth. At the deeper soil layers (e.g. 20 and 40 cm), the freezing rate (i.e. the amount of change in unfrozen SM with temperature) of unfrozen SM with decreasing ST in the freezing period is larger than the thawing rate of ice content with increasing ST during the thawing period. As such, the obtained parameter values of the power function fitting curves are identical to each other at the surface layer for the freezing and thawing periods, which are different for the deeper soil layers. The obtained parameter values are also distinct from each other at different soil layers, indicating the layering characteristics of frozen soil in the Maqu network.

Figure 7Soil freezing characteristics for depths of (a) 5, (b) 20, and (c) 40 cm, as determined from the measured and simulated unfrozen SM and subzero ST obtained from the upscaled dataset, GLDAS Noah, and MERRA-2 products, for the Maqu network.
4.2.2 Shiquanhe network
Figure 8a and c show the time series of daily SMups and STups at depths of 5, 10, 20, and 40 cm from January 2011 to December 2018 for the Shiquanhe network, respectively. The daily P and Ta collected from the Shiquanhe weather station (Fig. 1d) are also shown for comparison purposes. The SMups time series at different depths display the similar seasonality to that found for the Maqu network. The amplitudes of SMups variations generally decrease with increasing soil depth, with slightly larger variations noted for soil layers above 10 cm, and smallest one at the deepest depth of 40 cm. The layers above 10 cm are drier than the deeper layers in the warm season, except for the rainy period. The time series of the STups at different depths also show the similar seasonality to that found for the Maqu network, whereas the amplitudes of STups variations are larger than those of the Maqu network and diminish with soil depth. The soil layers above 40 cm generally drop below 0 ∘C in winter, indicating that the maximum freezing depth in the Shiquanhe network is deeper than 40 cm.
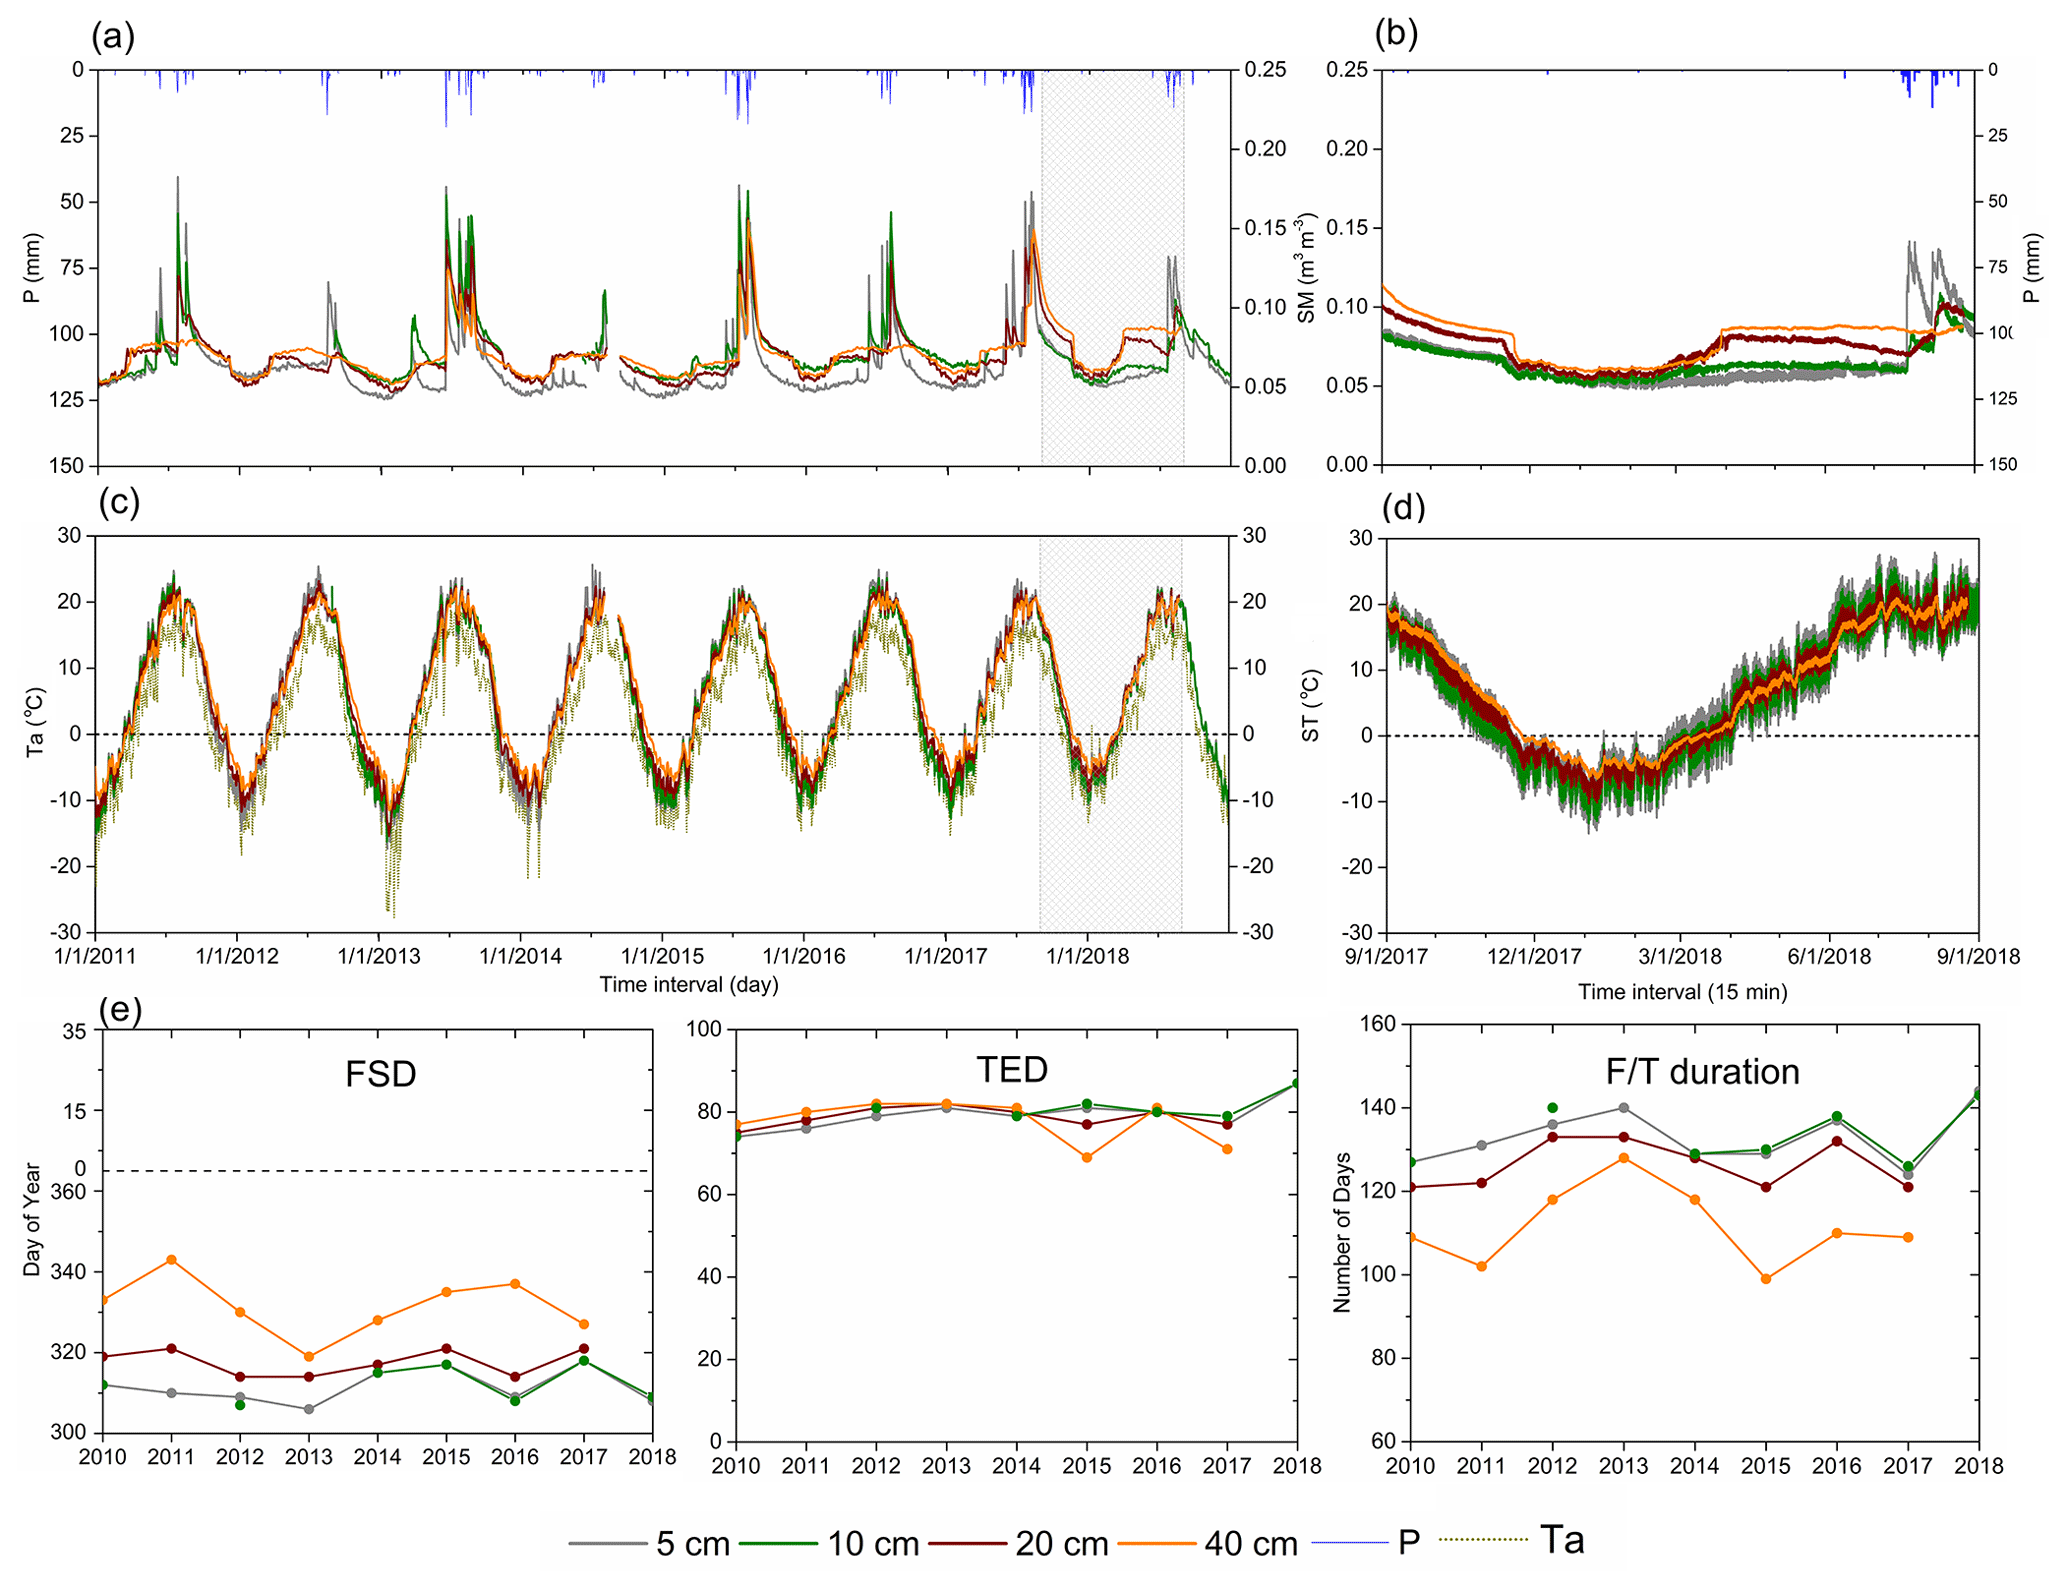
Figure 8Time series of upscaled daily (a) SMups and (c) STups at depths of 5, 10, 20, and 40 cm for the Shiquanhe network between January 2011 and December 2018. The subplots highlight the time series of the upscaled (b) SMups and (d) STups with intervals of 15 min between 1 September 2017 and 31 August 2018. (e) Annual variations in FSD, TED, and F/T duration at 5, 10, 20, and 40 cm depths. The time series of daily precipitation and air temperature are shown in panels (a) and (c) as well.
Figure 8b and d show the SMups and STups profile dynamics with a 15 min interval for a single year between August 2017 and August 2018, which confirms that amplitudes of both SMups and STups variations decrease with depth. The SMups variations at 5 and 10 cm are comparable to each other and larger than those at 20 and 40 cm, which also show a better response to the precipitation. Obvious diurnal cycles can be noted for the STups at 5, 10, and 20 cm, which diminish with depth and are almost absent at 40 cm. The STups at 5 and 10 cm starts to drop below 0 ∘C around early November, leading to a decrease in SMups due to soil freezing. The deeper layers freeze as time progresses, and the freeze depths reach its maximum around early January. Later on, the soil starts thawing, with an increase in SMups when the STups rises above 0 ∘C, and the entire soil profile is totally thawed around mid-March. To further explore the characteristics of F/T cycles in Shiquanhe, Fig. 8e shows the FSD, TED, and F/T duration of each year for the depths of 5, 10, 20, and 40 cm during the study period. There is no specific information on the FSD and TED in 2011 and 2013 for the depth of 5 cm due to the missing data of the in situ ST measurements for this period, and the same holds for the soil depths of 20 and 40 cm in 2018 (see Figs. 2b and A2). In general, the FSD increases with increasing soil depth, whereas the TED is comparable at each depth. It can be observed that the interannual variabilities in the FSD, TED, and F/T duration for each depth are within 20 d, and there is no significant trend found for them. It also confirms that the F/T cycles at 5 and 10 cm are almost the same, and the deeper layers (i.e. 20 and 40 cm) generally show a late onset of freezing, leading to a shorter duration.
Figure 9a and b show the trend analysis results for the 8-year (2011–2018) SMups and STups at depths of 5, 20, and 40 cm for the Shiquanhe network in the warm season, cold season, and full year. The trends of the P and Ta are also shown in Fig. 9a and b, respectively. The results show that no significant trend is found for the SMups at all three depths in the warm season, which is in agreement with the P trend. Meanwhile, the SMups at 5 and 20 cm also does not show a significant trend in the cold season, as for the P, whereas the SMups at 40 cm shows a wetting trend. Consequently, the SMups at 40 cm shows a wetting trend with a Sen's slope of 0.001 (m3 m−3 yr−1), while no trend is found for the P and SMups at 5 and 20 cm for the full year. The result is slightly different from Shi et al. (2021), and that might be attributed to the different time span. Nevertheless, it is in agreement with the conclusion of spatiotemporal trend changes in surface SM generally decreasing from southeast to northwest over the TP compared to the trend analysis result of Maqu network area. The STups at all three depths does not show a significant trend in the warm season, while an increasing trend is found in the cold season, which is in agreement with Ta trend. For the full year, no trend is found for the STups at depths of 5 and 20 cm, as for Ta, while an increasing trend is found for STups of 40 cm.
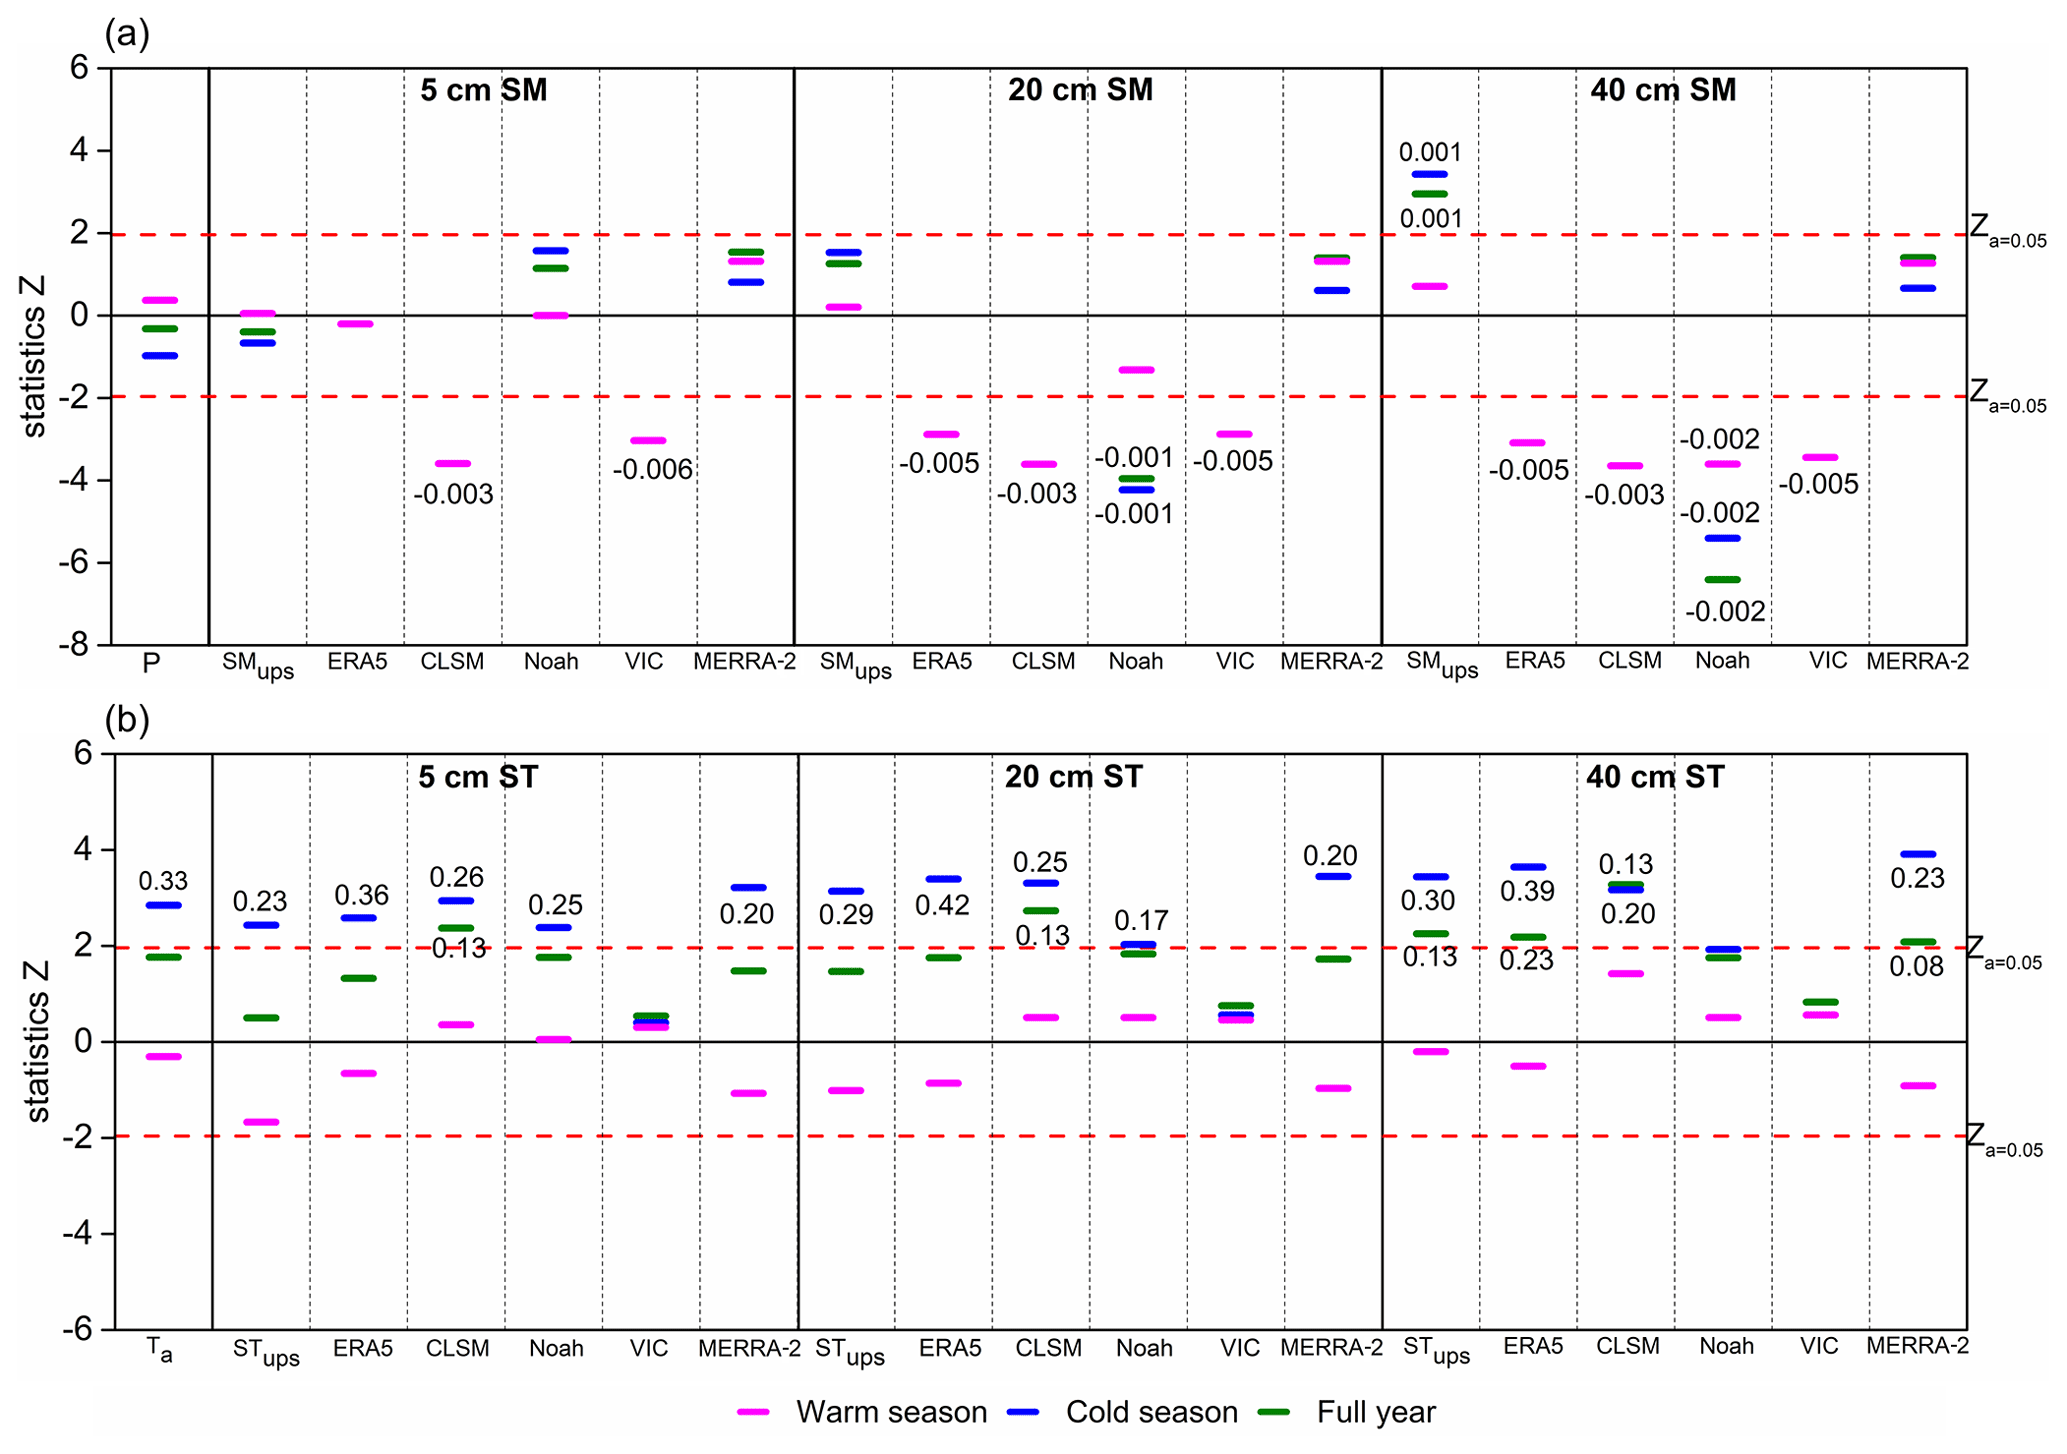
Figure 10 shows the soil freezing characteristics for the depths of 5, 20, and 40 cm for the Shiquanhe network. The fitted power functions to the soil freezing characteristics and the corresponding parameters are also given for the freezing and thawing periods. It is observed that there is no notable difference between the soil freezing characteristic of freezing and thawing periods at each depth. As such, the obtained parameter values of the power function fitting curves are identical for the freezing and thawing periods. However, the obtained parameter values are distinct from each other at different soil layers, indicating the layering characteristics of frozen soil in the Shiquanhe network.
4.3 Application of the upscaled SMST profile dataset to validate model-based products
To demonstrate the uniqueness of the upscaled SMST profile dataset for validating existing products for a long-term period, the performance of five model-based products is investigated in this section, including the ERA5, MERRA-2, GLDAS-2.1 CLSM (hereafter CLSM), GLDAS-2.1 Noah (hereafter Noah), and GLDAS-2.1 VIC (hereafter VIC; see Sect. 2.3). The performance of these model-based products in capturing the SMST seasonal variations, long-term trend changes, and the F/T cycle at depths of 5, 20, and 40 cm in the Maqu and Shiquanhe networks is evaluated. The cold season SM data of the ERA5, CLSM, and VIC products are excluded from the analysis, since their values represent the total soil water content, while in situ sensors measure the liquid soil water content in frozen soil, and the MERRA-2 and Noah SM products can provide liquid soil water content (Gelaro et al., 2017; Zheng et al., 2017).
4.3.1 Maqu network
Figure 11a–c show the time series of the daily average SM at soil depths of 5, 20, and 40 cm derived from the SMups and the five model-based products from January 2010 to December 2018 for the Maqu network. The error metrics, i.e. bias, RMSD, ubRMSD, and R, computed between the five model-based SM data and the SMups for the warm and cold season are listed in Table 5. Among the five model-based products, the ERA5 SM product agrees best with the SMups at 5 and 20 cm in the warm season with the lowest RMSD values of 0.053 and 0.032 m3 m−3 and the largest R values of 0.76 and 0.74, but it tends to overestimate the SMups at 40 cm with a bias of 0.108 m3 m−3. Similarly, the VIC SM product is also able to capture the magnitude of the SMups dynamics at 5 and 20 cm in the warm season, with slightly larger RMSD values of 0.060 and 0.049 m3 m−3 but also overestimates the SMups at 40 cm with a bias of 0.088 m3 m−3. The other three products tend to considerably underestimate the SMups at 5 and 20 cm in the warm season, but they yield better estimates of the SM at 40 cm, as indicated by smaller biases and RMSD values. In general, the modelling uncertainties may be caused by many factors, such as model structure, model parameterization and parameters, and meteorological forcing data. The underestimation of the surface SM noted for the Noah, CLSM, and MERRA-2 can be related to fact that the impact of organic matter on soil hydraulic parameters is ignored (Yi et al., 2011; Chen et al., 2013; Zheng et al., 2015a). The better performance of ERA5 can be associated with the better estimation of the precipitation and assimilation of ASCAT SM product (Hersbach et al., 2020; Shi et al., 2021). In the cold season, the Noah SM product generally captures the SMups variations at surface layer (i.e. 5 cm) well but overestimates the SMups at deeper layers (e.g. 20 and 40 cm), and overestimations are also found for the MERRA-2 products at all depths. The overestimation can be related to the inappropriate parameterization of soil freezing characteristics, as shown in Fig. 7 (Zheng et al., 2017). The trend analysis results for the five model-based SM data are also presented in Fig. 6a. The results show that no significant trend is found for any of five model-based SM products at every depth in the warm season, which is in agreement with the trend of SMups. Both Noah and MERRA-2 SM products are able to reproduce the drying trend noted for the SMups in the cold season and full year, except for the Noah SM product of 5 cm.
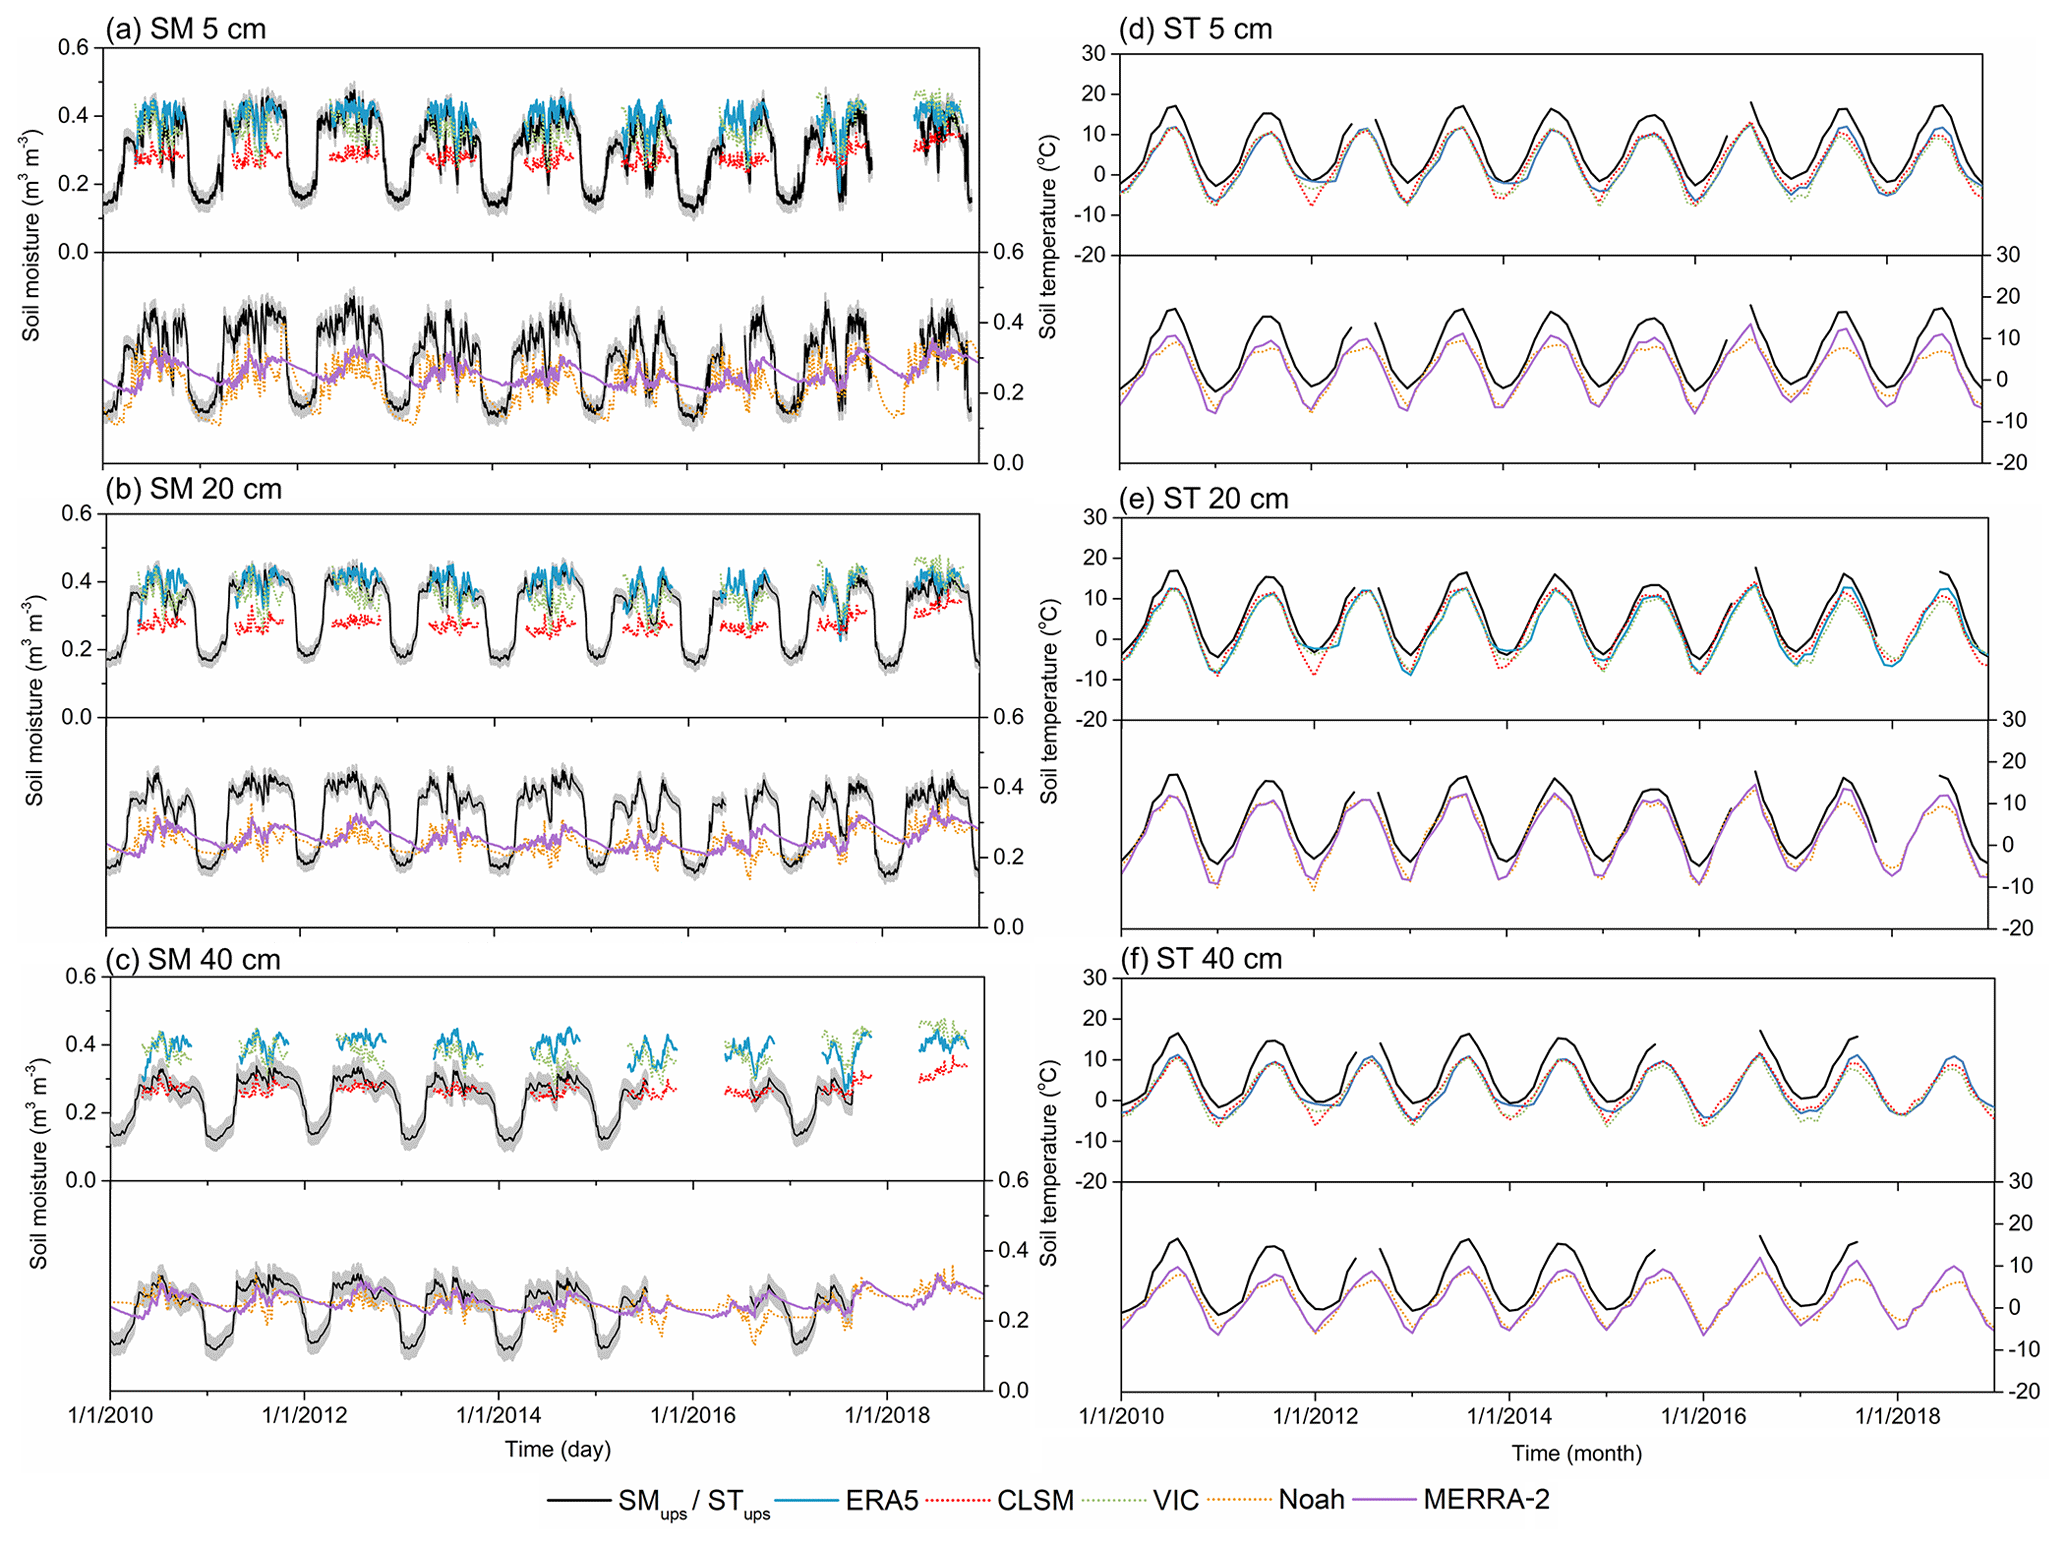
Figure 11Time series of daily average SM (a–c) and monthly mean ST (d–f) at soil depths of 5 (a, d), 20 (b, e), and 40 cm (c, f), as derived from the upscaled SMST dataset and five model-based products from January 2010 to December 2018 for the Maqu network.
Table 5Statistical indicators of model-based SMST products at soil depths of 5, 20, and 40 cm for the Maqu network in the warm and cold season, respectively.
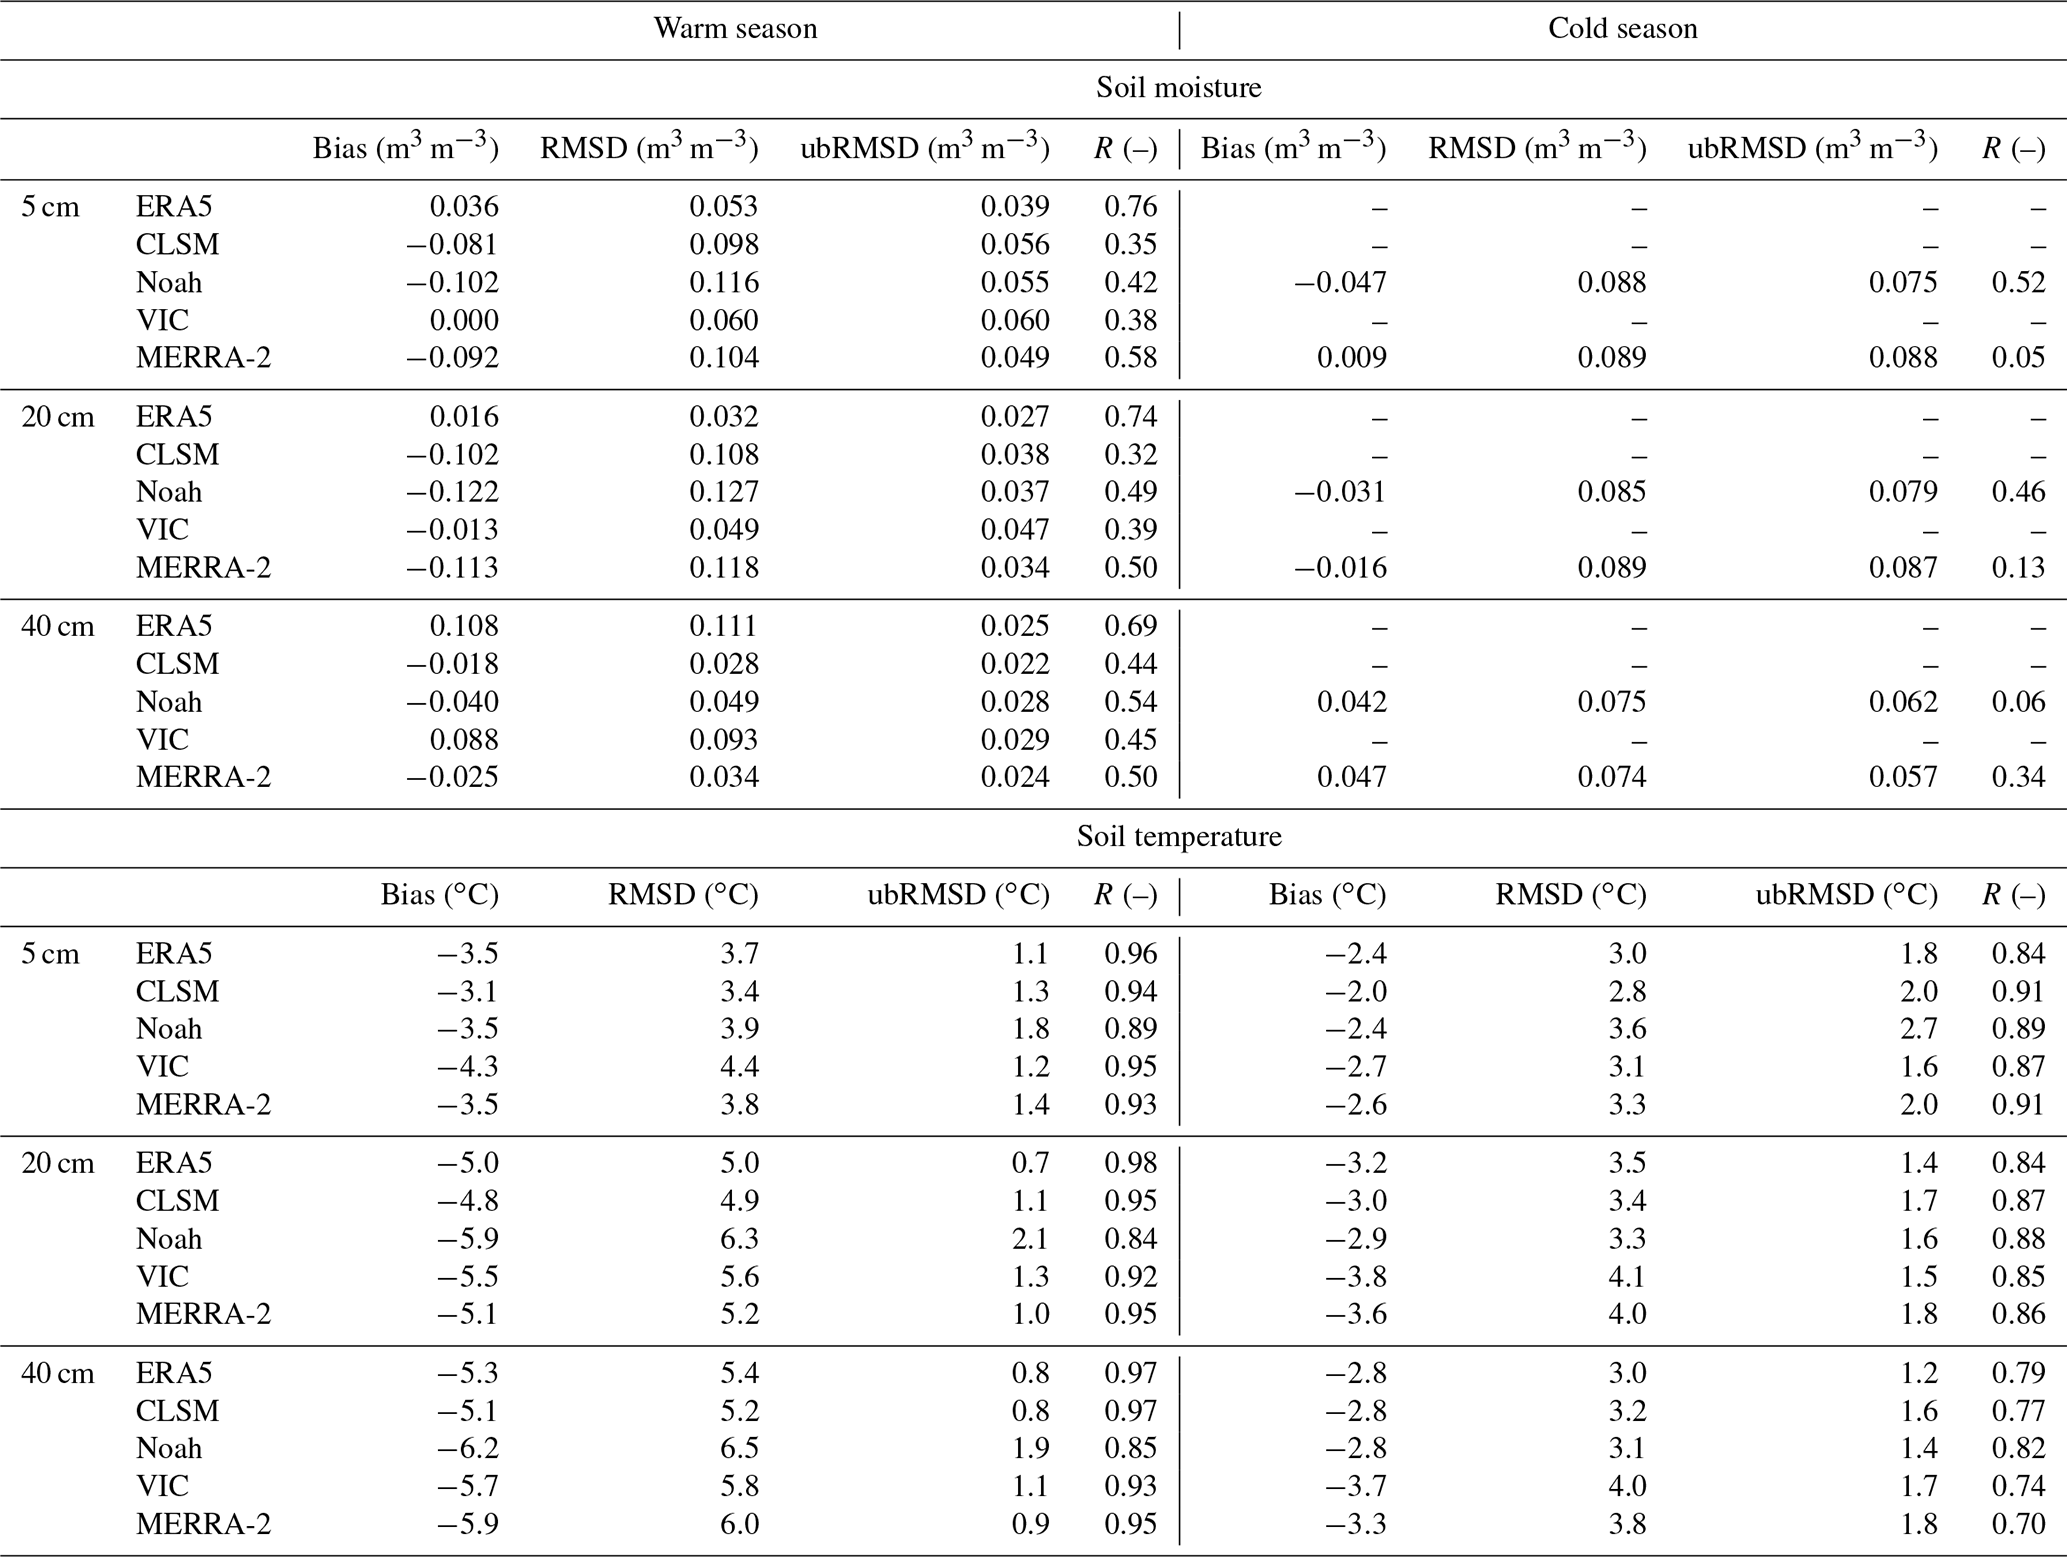
The “–” sign indicates that there are no statistical data for the ERA5, CLSM, and VIC products in the cold season.
Figure 11d–f show the time series of monthly average ST at soil depths of 5, 20, and 40 cm derived from STups and the five model-based products for the Maqu network. The corresponding error metrics computed by daily STups are listed in Table 5 as well. In general, the five model-based ST products have similar performance and can capture the seasonal variations in STups at every depth well. However, they tend to underestimate the STups across the entire study period, and the magnitude of underestimations generally increases with increasing soil depths. Similar findings have recently been reported by Ma et al. (2021). The underestimation can be due to the (i) underestimation of the downward shortwave or longwave radiation (Chen et al., 2011; Wang et al., 2016), (ii) inappropriate parameterization of diurnally varying roughness length for heat transfer (Chen et al., 2011; Zheng et al., 2015b; Reichle et al., 2017), and (iii) overlooking the impact of organic matter on soil thermal parameters (Zheng et al., 2015b). The trend analysis results for the five model-based ST data are also presented in Fig. 6b. At the surface layer (i.e. 5 cm), only the VIC ST product shows a decreasing trend in the warm season, as for the STups, while no significant trend is found for other products. In the cold season, there is no significant trend presented for the CLSM, Noah, and MERRA-2 ST products at surface layer that is consistent with STups, while the other two products show a decreasing trend. For the full year, the Noah and VIC ST products are able to reproduce the decreasing trend found for the STups of 5 cm, whereas no significant trend is found for other products. The trends for the deeper soil layers (i.e. 20 and 40 cm depths) are consistent with each other for each model-based ST product, and there is no significant trend found for the products in both warm and cold season, as for STups, except the VIC ST product, which shows a decreasing trend. Consequently, the ERA5, CLSM, and MERRA-2 ST products do not show a significant trend at deeper layers in the full year that is consistent with STups, whereas the VIC product of two depths and Noah product of 20 cm show a decreasing trend for the full year.
To further investigate the performance of five model-based products in capturing the characteristics of the F/T cycle in the Maqu network, Fig. 12 shows the FSD, TED, and F/T duration derived from the five model-based products and upscaled dataset for each year during the study period. It can be observed that all the five model-based products underestimate the FSD, especially at deeper depths. The FSD is estimated based on the upscaled dataset and generally increases with increasing depth, while those estimates using the model-based products are close to each other at different depths. In contrast to the FSD, all the products overestimate the TED at deeper depths. In other words, all the model-based products tend to produce an earlier onset of freezing and a later onset of thawing, leading to a longer F/T duration in comparison to the upscaled dataset. This can be related to the underestimation of ST noted for all the model-based products. The soil freezing characteristics for depths of 5, 20, and 40 cm obtained based on the Noah and MERRA-2 products are shown in Fig. 7 as well. It can be observed that the difference between the soil freezing characteristics of the freezing and thawing periods generally decreases with increasing soil depth for the two models, which is inconsistent with the upscaled dataset. In comparison to the upscaled dataset, both Noah and MERRA-2 products tend to produce higher unfrozen SM values at the same subzero ST in the freezing period, and overestimations are also found in the thawing period, except for that of the Noah model at 5 cm. This can explain why the two models overestimate the SMups in the cold season, especially at deeper depths, as shown in Fig. 11.
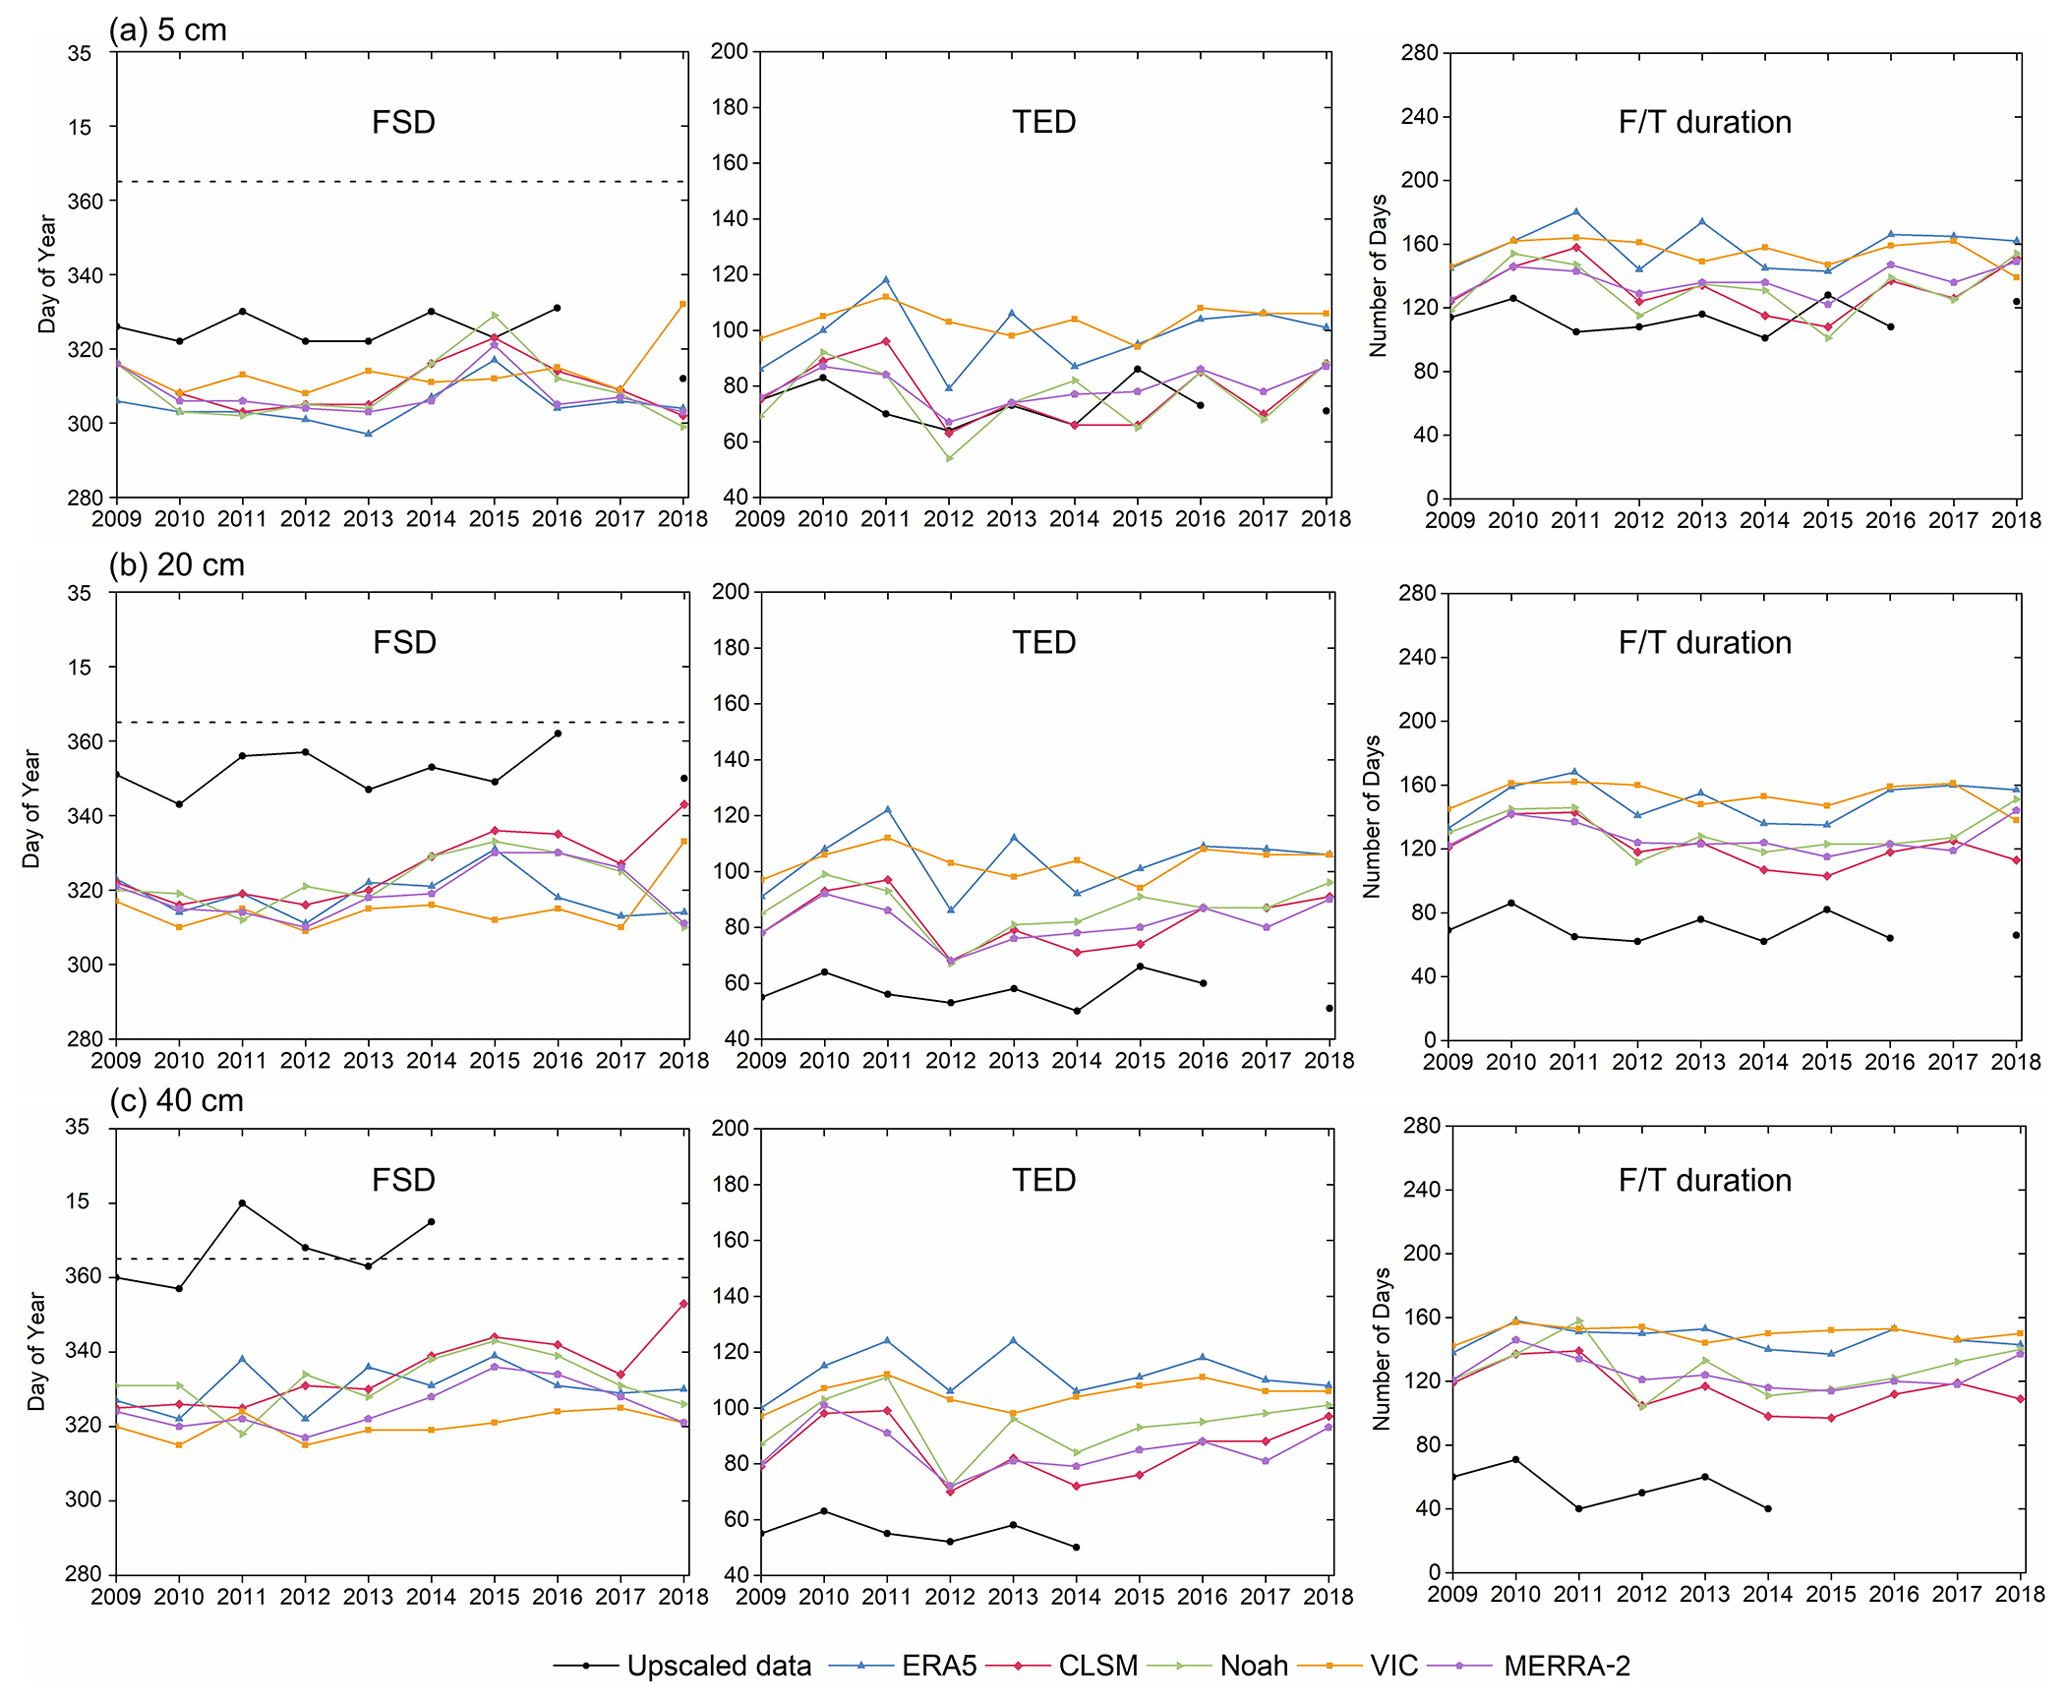
Figure 12The annual variations in the FSD, TED, and F/T duration at the depths of (a) 5, (b) 20, and (c) 40 cm obtained from the upscaled dataset and five model-based products for the Maqu network.
4.3.2 Shiquanhe network
Figure 13a–c show the time series of the daily average SM at soil depths of 5, 20, and 40 cm, as derived from the SMups, and the five model-based products from January 2011 to December 2018 for the Shiquanhe network. The error metrics computed between the five model-based SM data and the SMups for the warm and cold season are listed in Table 6. Among the five model-based SM products, the ERA5 product agrees best with the SMups at 5 cm in the warm season, with the lowest RMSD of 0.06 m3 m−3 and largest R value of 0.80, while other products tend to overestimate the SMups, especially for the VIC product. As in the Maqu network, the better performance of ERA5 can be associated with the better estimation of precipitation and assimilation of the Advanced SCATterometer (ASCAT) SM product (Hersbach et al., 2020; Shi et al., 2021). The overestimation noted in other products can be associated with the overestimations of precipitation (Yang et al., 2020) and uncertainty in soil texture and, thus, the overestimation of soil porosity (Shangguan et al., 2013; Su et al., 2013; Bi et al., 2016). Both the Noah and MERRA-2 products also overestimate the SMups of 5 cm in the cold season, which is related to the inappropriate parameterization of soil freezing characteristics, as shown in Fig. 10. For the 20 and 40 cm deeper depths, all the products systematically overestimate the SMups due to the uncertainty in soil texture, among which the ERA5 product shows the lowest bias, while the VIC product presents the largest bias. The trend analysis results for the five model-based SM data are also presented in Fig. 9a. The results show that no significant trend is found for the MERRA-2 product at every depth throughout the year that is consistent with the SMups of the upper layers (i.e. 5 and 20 cm), whereas both CLSM and VIC products show a drying trend at each depth. At soil depths of 5 cm, there is also no significant trend found for the ERA5 and Noah products like the SMups, while the ERA5 product shows a drying trend at deeper layers (i.e. 20 and 40 cm) in the warm season, and the Noah product also presents a drying trend at deeper layers for the cold season and full year, both of which are inconsistent with those of SMups.
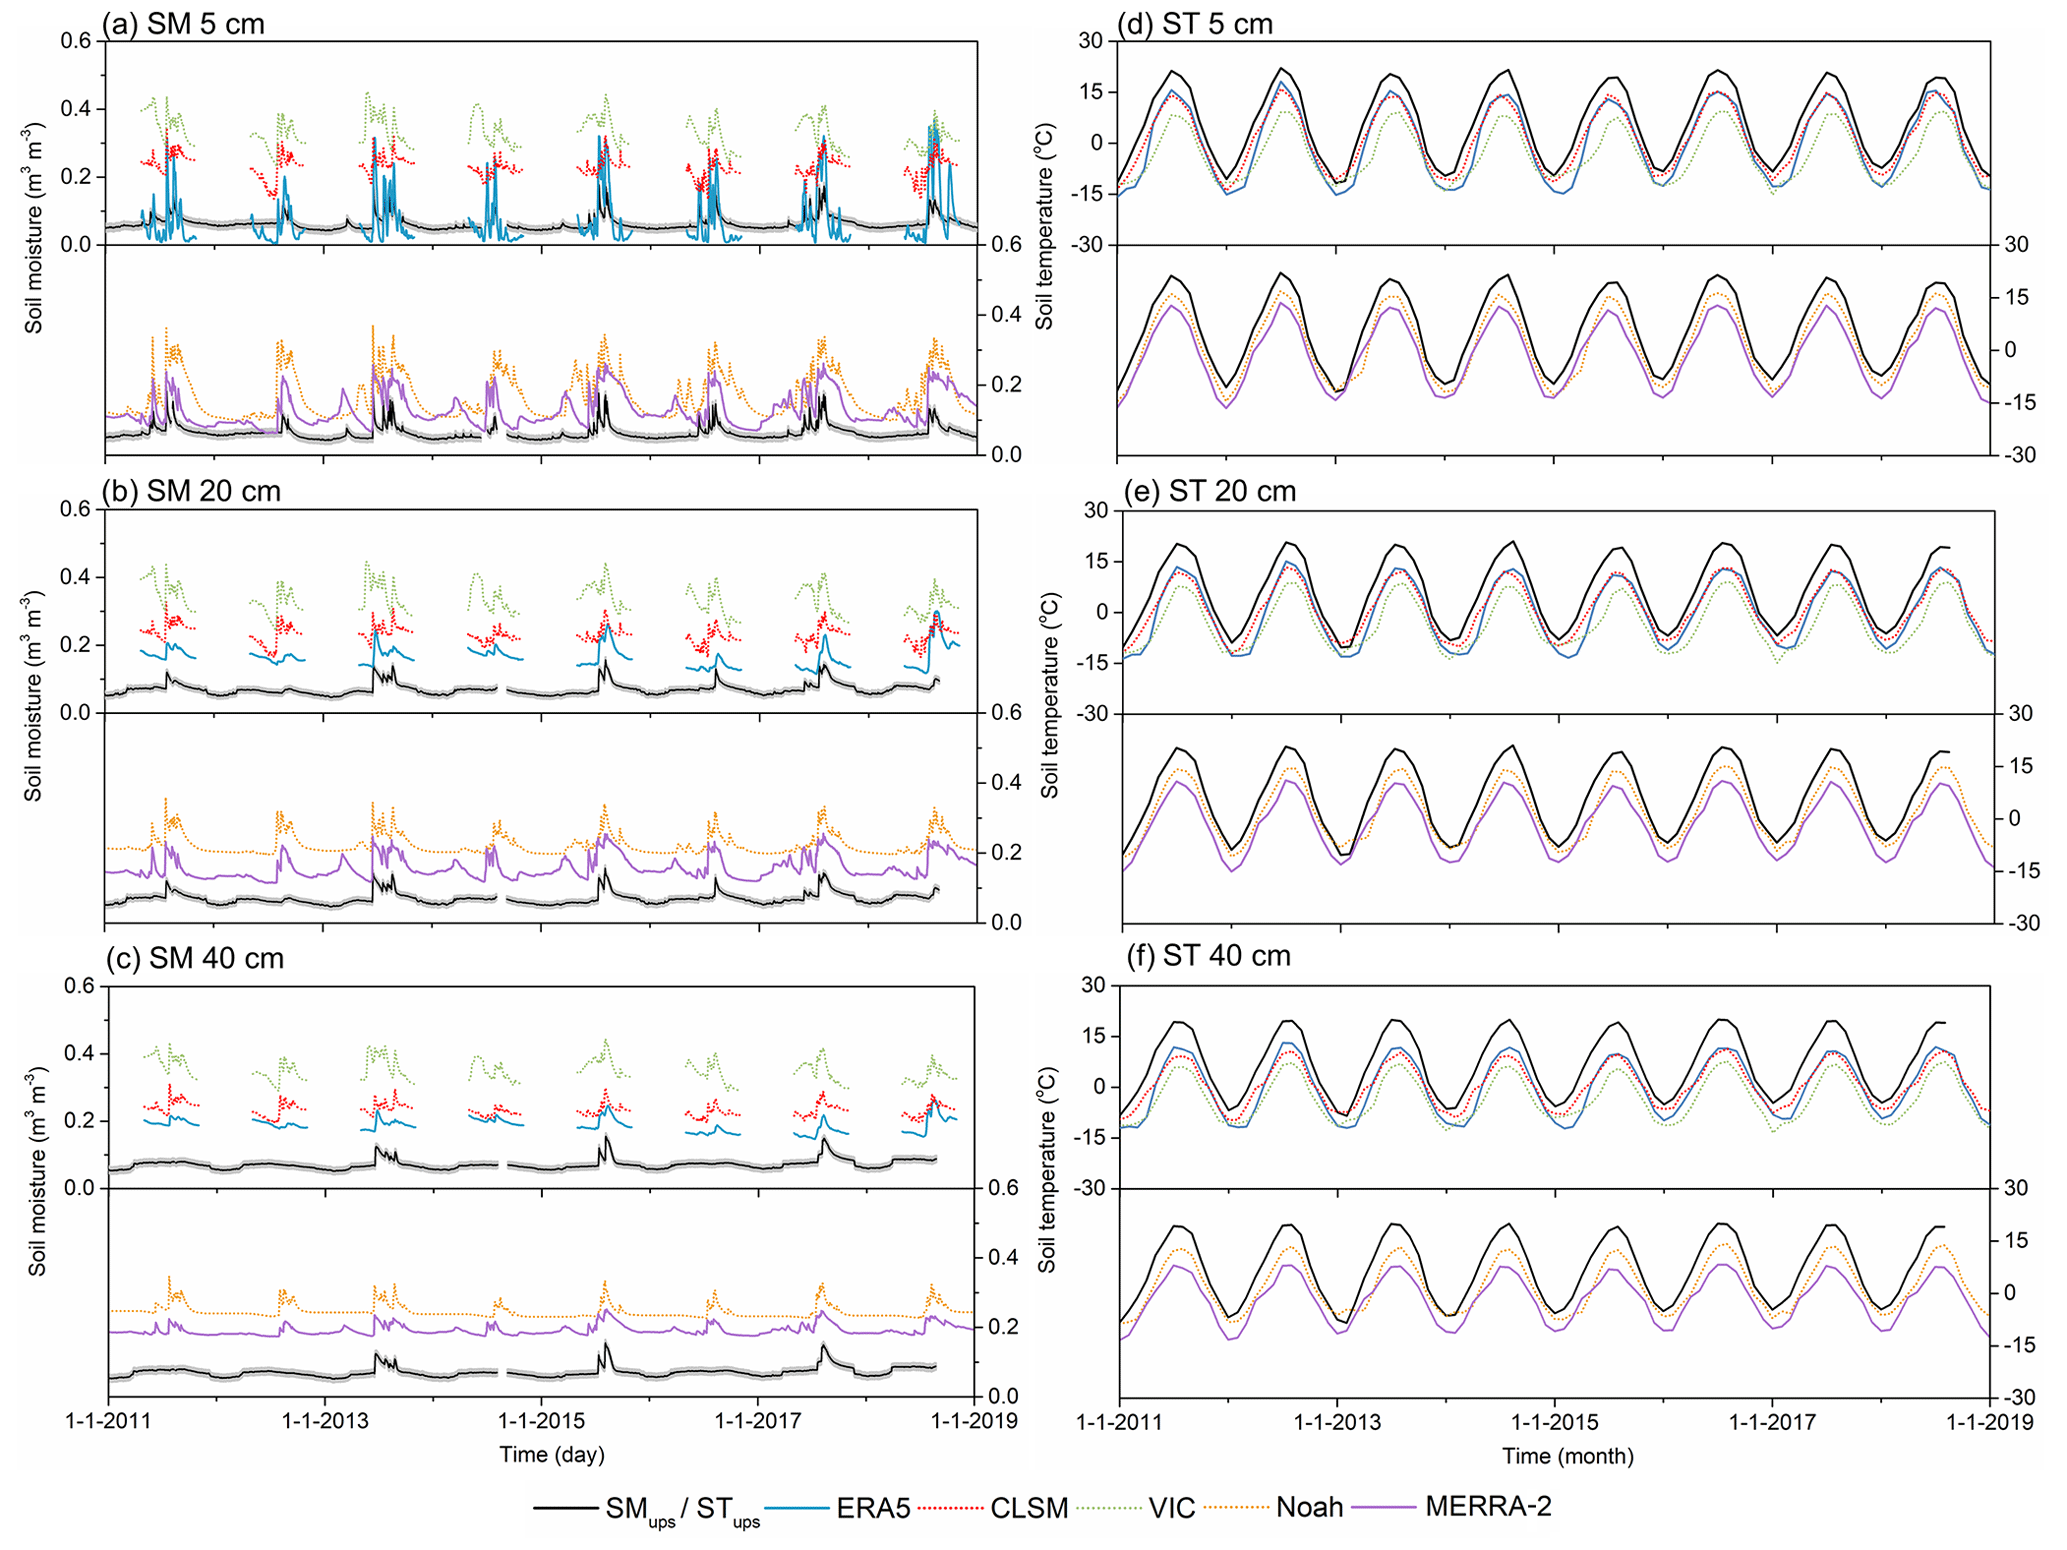
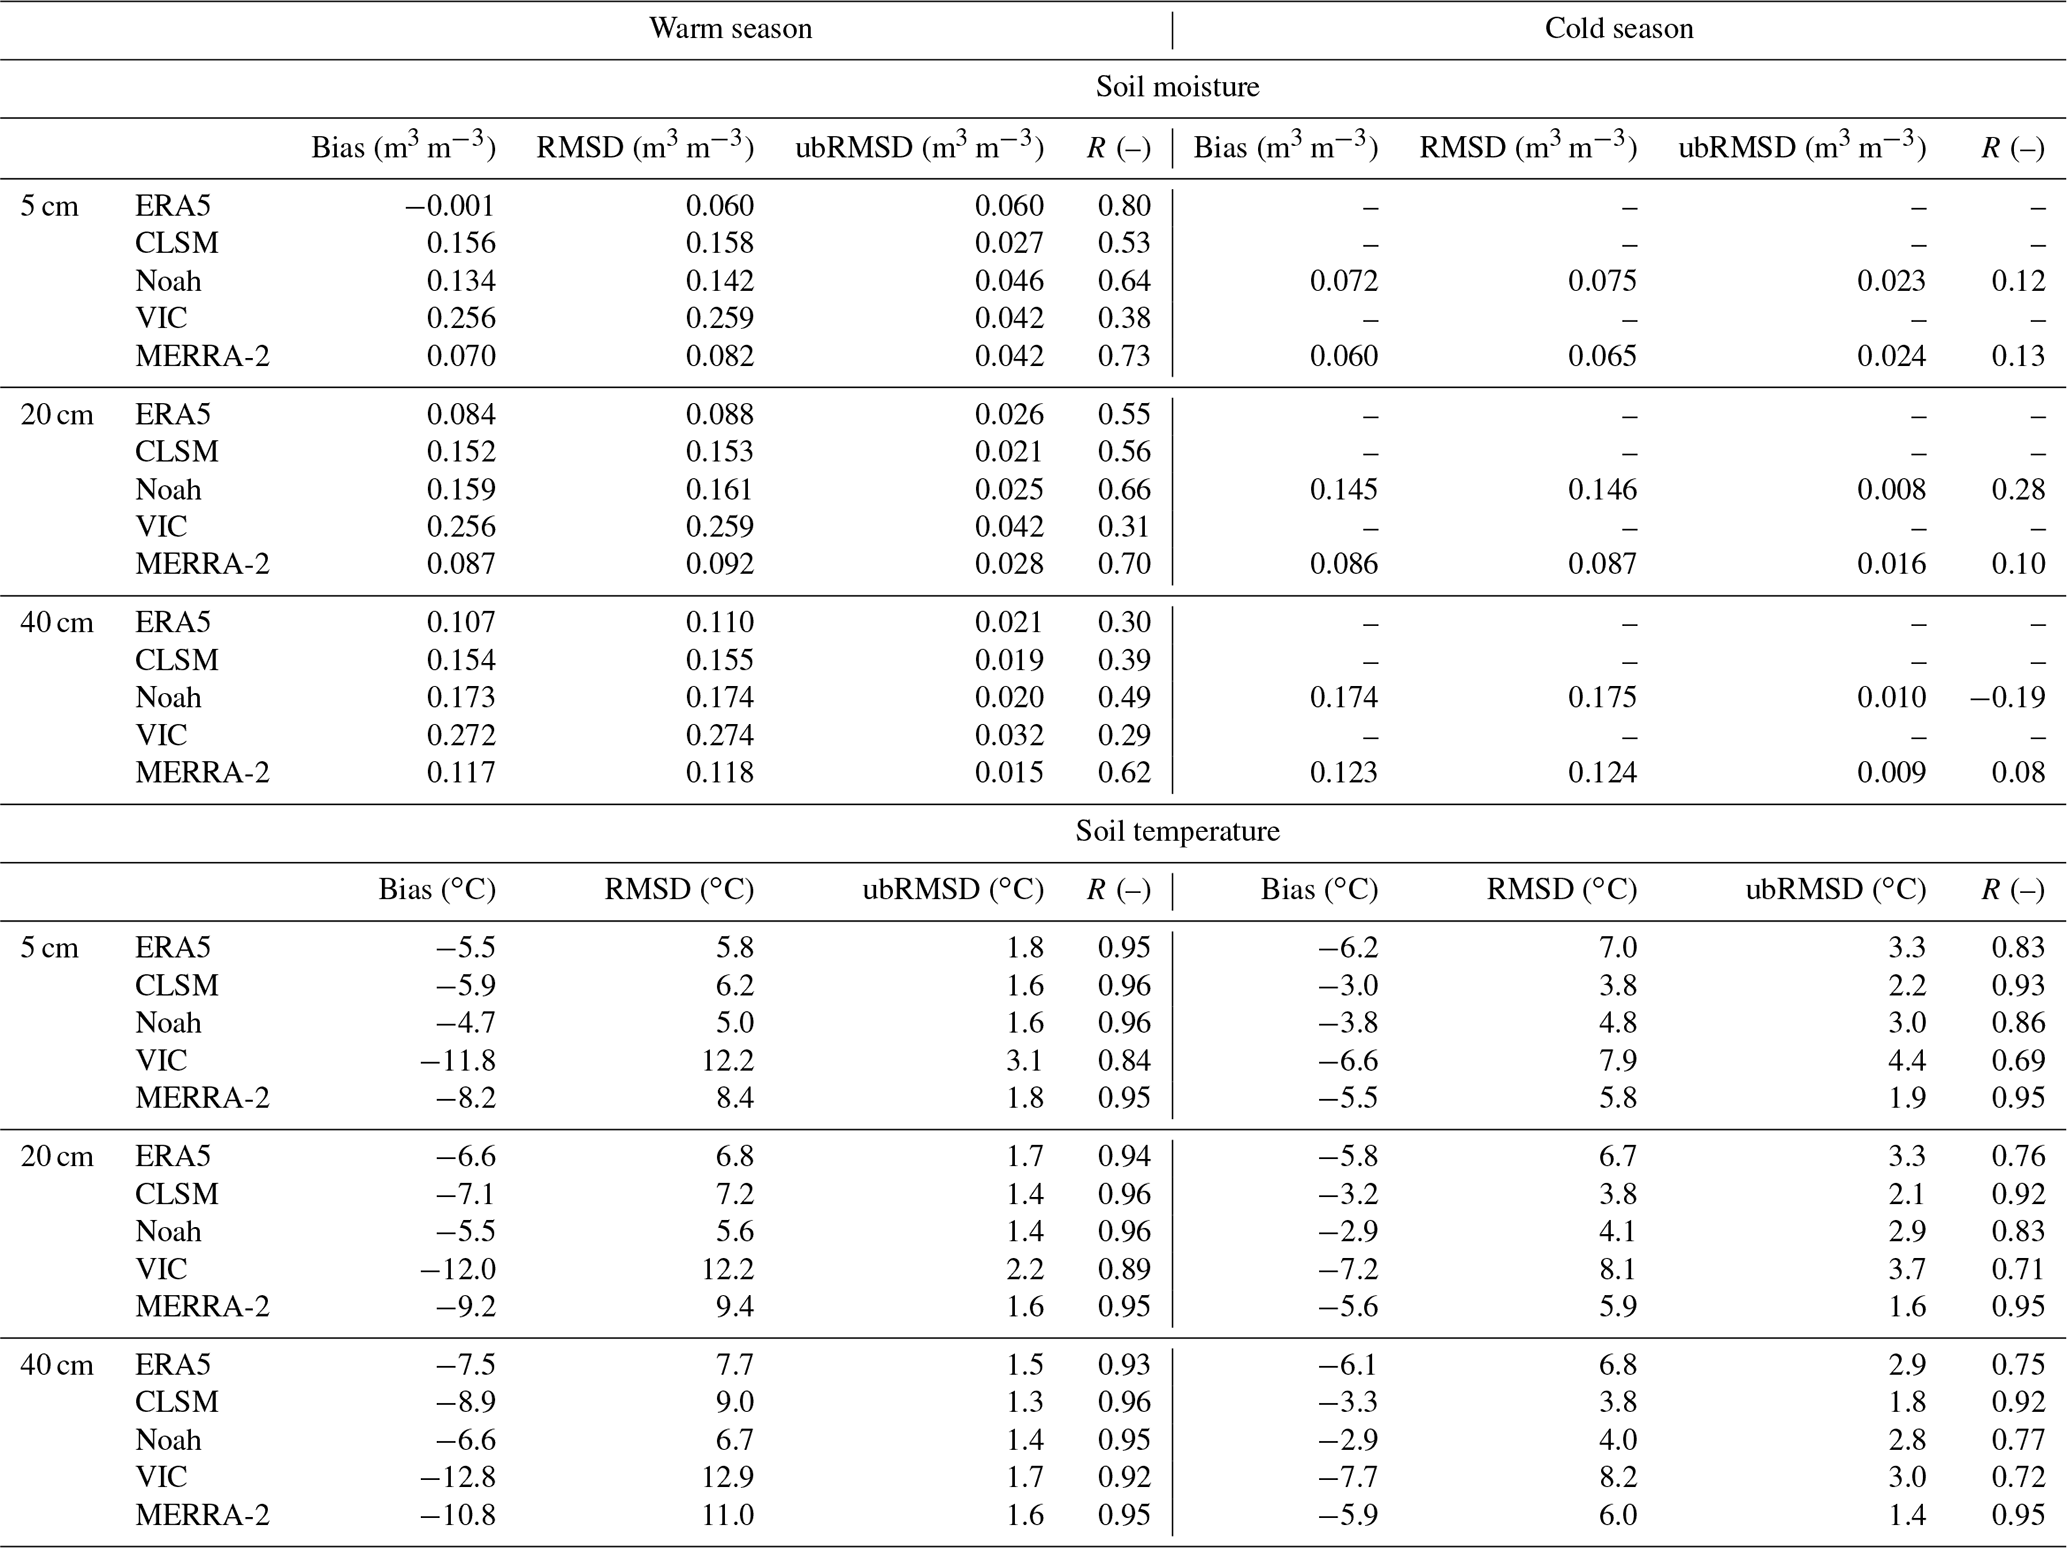
Figure 13d–f show the time series of monthly average ST at soil depths of 5, 20, and 40 cm, as derived from the STups and the five model-based ST products from January 2011 to December 2018 for the Shiquanhe network. The corresponding error metrics computed by the daily STups are also listed in Table 6. Similar to the Maqu network, all the five model-based products capture the seasonal variations in STups at every depth well, but they tend to underestimate the STups throughout the entire study period, and the magnitude of underestimations also increases with increasing soil depth. The reason for the underestimation can be the same as for the Maqu network. Among all the products, the Noah and CLSM products yield the lowest bias and RMSD in the warm and cold seasons, respectively, while the VIC product presents the largest bias for both seasons. It should be noted that the Noah product is slightly worse than the CLSM product in the cold season. The trend analysis results for the five model-based ST data are also presented in Fig. 9b. The results show that all products do not show a significant trend at every depth in the warm season that is consistent with that of STups. In the cold season, the ERA5, CLSM, and MERRA-2 products show an increasing trend at every depth that is consistent with the STups, while no significant trend is found for the VIC product. An increasing trend is also noted for the Noah product at 5 and 20 cm despite no trend being found at 40 cm. For the full year, only the ERA5 and MERRA-2 products capture the trends of STups at all three depths. At depths of 5 and 20 cm, except for the CLSM product, no significant trend is found for other products that is consistent with the STups. For the depth of 40 cm, besides the Noah and VIC products, an increasing trend is found for other products and the STups.
To further investigate the performance of five model-based products in capturing the characteristics of F/T cycle in the Shiquanhe network, Fig. 14 shows the FSD, TED, and F/T duration derived from the five model-based products and upscaled dataset for each year during the study period. Similar to the Maqu network, all the model-based products tend to produce earlier onset of freezing and later onset of thawing at every depth due to the underestimation of ST, leading to the underestimation of FSD and the overestimation of TED and thus a longer F/T duration in comparison to the upscaled dataset. Among the five model-based products, the CLSM product provides the closet estimates of TED and F/T duration compared to the upscaled dataset, while the VIC product presents the worst performance. The soil freezing characteristics for the depths of 5, 20, and 40 cm obtained from the Noah and MERRA-2 products are shown in Fig. 10 as well. Similar to the Maqu network, both Noah and MERRA-2 products tend to produce higher unfrozen SM values at the same subzero ST in both freezing and thawing periods, leading to the overestimation of SM in the cold season in comparison to the upscaled dataset (see Fig. 13), and the magnitude of the overestimation increases with increasing soil depth.
A long-term (2008–2019) dataset of SMST at multiple depths on the TP is freely available from the 4TU.ResearchData repository at https://doi.org/10.4121/20141567.v1 (Zhang et al., 2022). The original in situ SMST data, the upscaled SMST data, and the supplementary data are stored in .xlsx files. A user guide document is provided to introduce the content of the dataset and to provide the method to download online datasets used in this paper.
The Tibet-Obs is a long-term SMST observatory in the TP covering different representative climatic and land surface conditions, which includes the Maqu, Naqu, and Ngari (including Ali and Shiquanhe) networks. The three networks are located in the cold humid area covered by grassland, the polar area dominated by tundra, and the cold arid area dominated by desert, respectively. Each network includes various numbers of in situ SMST monitoring sites, and each monitoring site is configured with one Decagon (now the METER group) EM50 data logger and several Decagon SMST probes (i.e. EC-TM and 5TM) to monitor SMST dynamics at multiple depths (e.g. 5, 10, 20, 40, and 60/80 cm underground) every 15 min, which have generally been in operation for over a decade. This paper presents a long-term (∼ 10 years) SMST profile dataset collected from the Tibet-Obs, which includes original in situ measurements collected between 2008 and 2019 from all the three networks and the spatially upscaled data (SMups and STups) for the Maqu and Shiquanhe networks. The uncertainty in the spatially upscaled dataset is first quantified via a comparison with the average of the SMST measurements collected for at a certain year with the largest number of available valid monitoring sites, i.e. ground truth (SMtru and STtru). The results show that the SMups and SMtru are consistent with each other at every depth for both the Maqu and Shiquanhe networks, yielding RMSD values that are better than the measured accuracy of adopted SM sensor. The variations in STups also agree well with the STtru, and the obtained RMSD value is also better than the measured accuracy of adopted ST sensor in the Maqu network. Therefore, it can be concluded that the quality of the upscaled dataset is generally good.
Based on the upscaled dataset, the analysis of the seasonal variations and interannual trend changes in profile SMST dynamics, in addition to the characteristics of F/T cycle in an approximately 10-year period, is carried out for the two hydrometeorologically contrasting networks. The results show that the time series of both SMups and STups at each depth display notable seasonality, with peak values in the warm summer and the lowest values in the cold winter, and the amplitudes of their variations generally decrease with increasing soil depth for both networks. It can be noted that the amplitudes of the seasonal SMupas variations in the cold-humid Maqu network area are larger than those of the cold-arid Shiquanhe network, whereas the STups seasonality is generally stronger within the Shiquanhe measurements. The Mann–Kendall trend analysis results demonstrate that no significant trend is found for the SMups profile in the warm season (from May to October) for both networks that is consistent with the precipitation (P) trend. A similar finding is also found for the STups profile and air temperature Ta for the Shiquanhe network during the warm season. For the cold season (from November to April) and the full year, a drying trend is noted for the SMups above 20 cm in the Maqu network, while no significant trend is found for those in the Shiquanhe network. In general, the deeper soil layers in both networks present a later onset of freezing and earlier thawing and, thus, a shorter F/T duration in comparison to the surface layer. The obtained parameter values of the power function fitting curves to the soil freezing characteristics are distinct from each other at different soil layers in both networks, confirming the layering characteristics of frozen soil on the TP.
To demonstrate the uniqueness of the upscaled SMST profile dataset for validating existing products for a long-term period, the performance of five model-based products is investigated. The results show that none of the model-based products can reproduce the seasonal variations and interannual trend changes in the profile SMST dynamics, and the characteristics of the F/T cycle obtained are based on the upscaled dataset. Among the five products, only the ERA5 product captures the seasonal variations and trend changes in SMups dynamics at the surface layer (i.e. 5 cm) well during the warm season in both networks, which also provides the lowest bias for the estimations of SM above 20 cm during the warm season. All the products underestimate the STups at every depth in both networks, where the Noah and ERA5 products provide better estimations in the warm season, and the CLSM and Noah products yield better simulations for the cold season. Consequently, all the model-based products tend to produce earlier onset of freezing and a later start of thawing at every depth, leading to the underestimation of FSD and the overestimation of TED and, thus, a longer F/T duration than observed on the ground.
Overall, the Tibet-Obs SMST observatory has greatly advanced the evaluation and improvement in satellite- and model-based SM and ST products for their applications to the TP over the past decade (see Table 1). The development of the long-term (∼ 10 years) SMST profile dataset collected from the Tibet-Obs is urgently needed to further strengthen relevant research and could be of value for calibration and validation of long-term satellite- and/or model-based SMST products, improving the representation of TP hydrometeorological processes in current land surface model and satellite-based SM retrieval algorithms and other applications across scientific disciplines such hydrology, meteorology, and climatology.
Table A1Data records of the SMST measured at different depths with temporal persistence from May 2008 to May 2019 (y axis) for all the monitoring sites in the Maqu network (x axis). Cells with different colours and digits represent different number of months that contain valid SMST data in each year. Blank cells indicate that there are no measurements performed. Site names that are highlighted and have a red font represent the sites used to produce the long-term (May 2009–May 2019) upscaled SMST dataset, and site names only highlighted represent the sites used for generating ground truth for a selected year (May 2010–May 2011).

Table A2Same as Table A1 but for the Ngari network with temporal persistence from August 2010 to August 2019. Site names that are highlighted and have a red font represent the sites used to produce the long-term (August 2010–August 2019) upscaled SMST dataset, and site names only highlighted represent the sites used for generating ground truth for a selected year (August 2017–August 2018) in the Shiquanhe network.

Table A3Same as Table A1 but for the Naqu network with temporal persistence from June 2010 to August 2019.
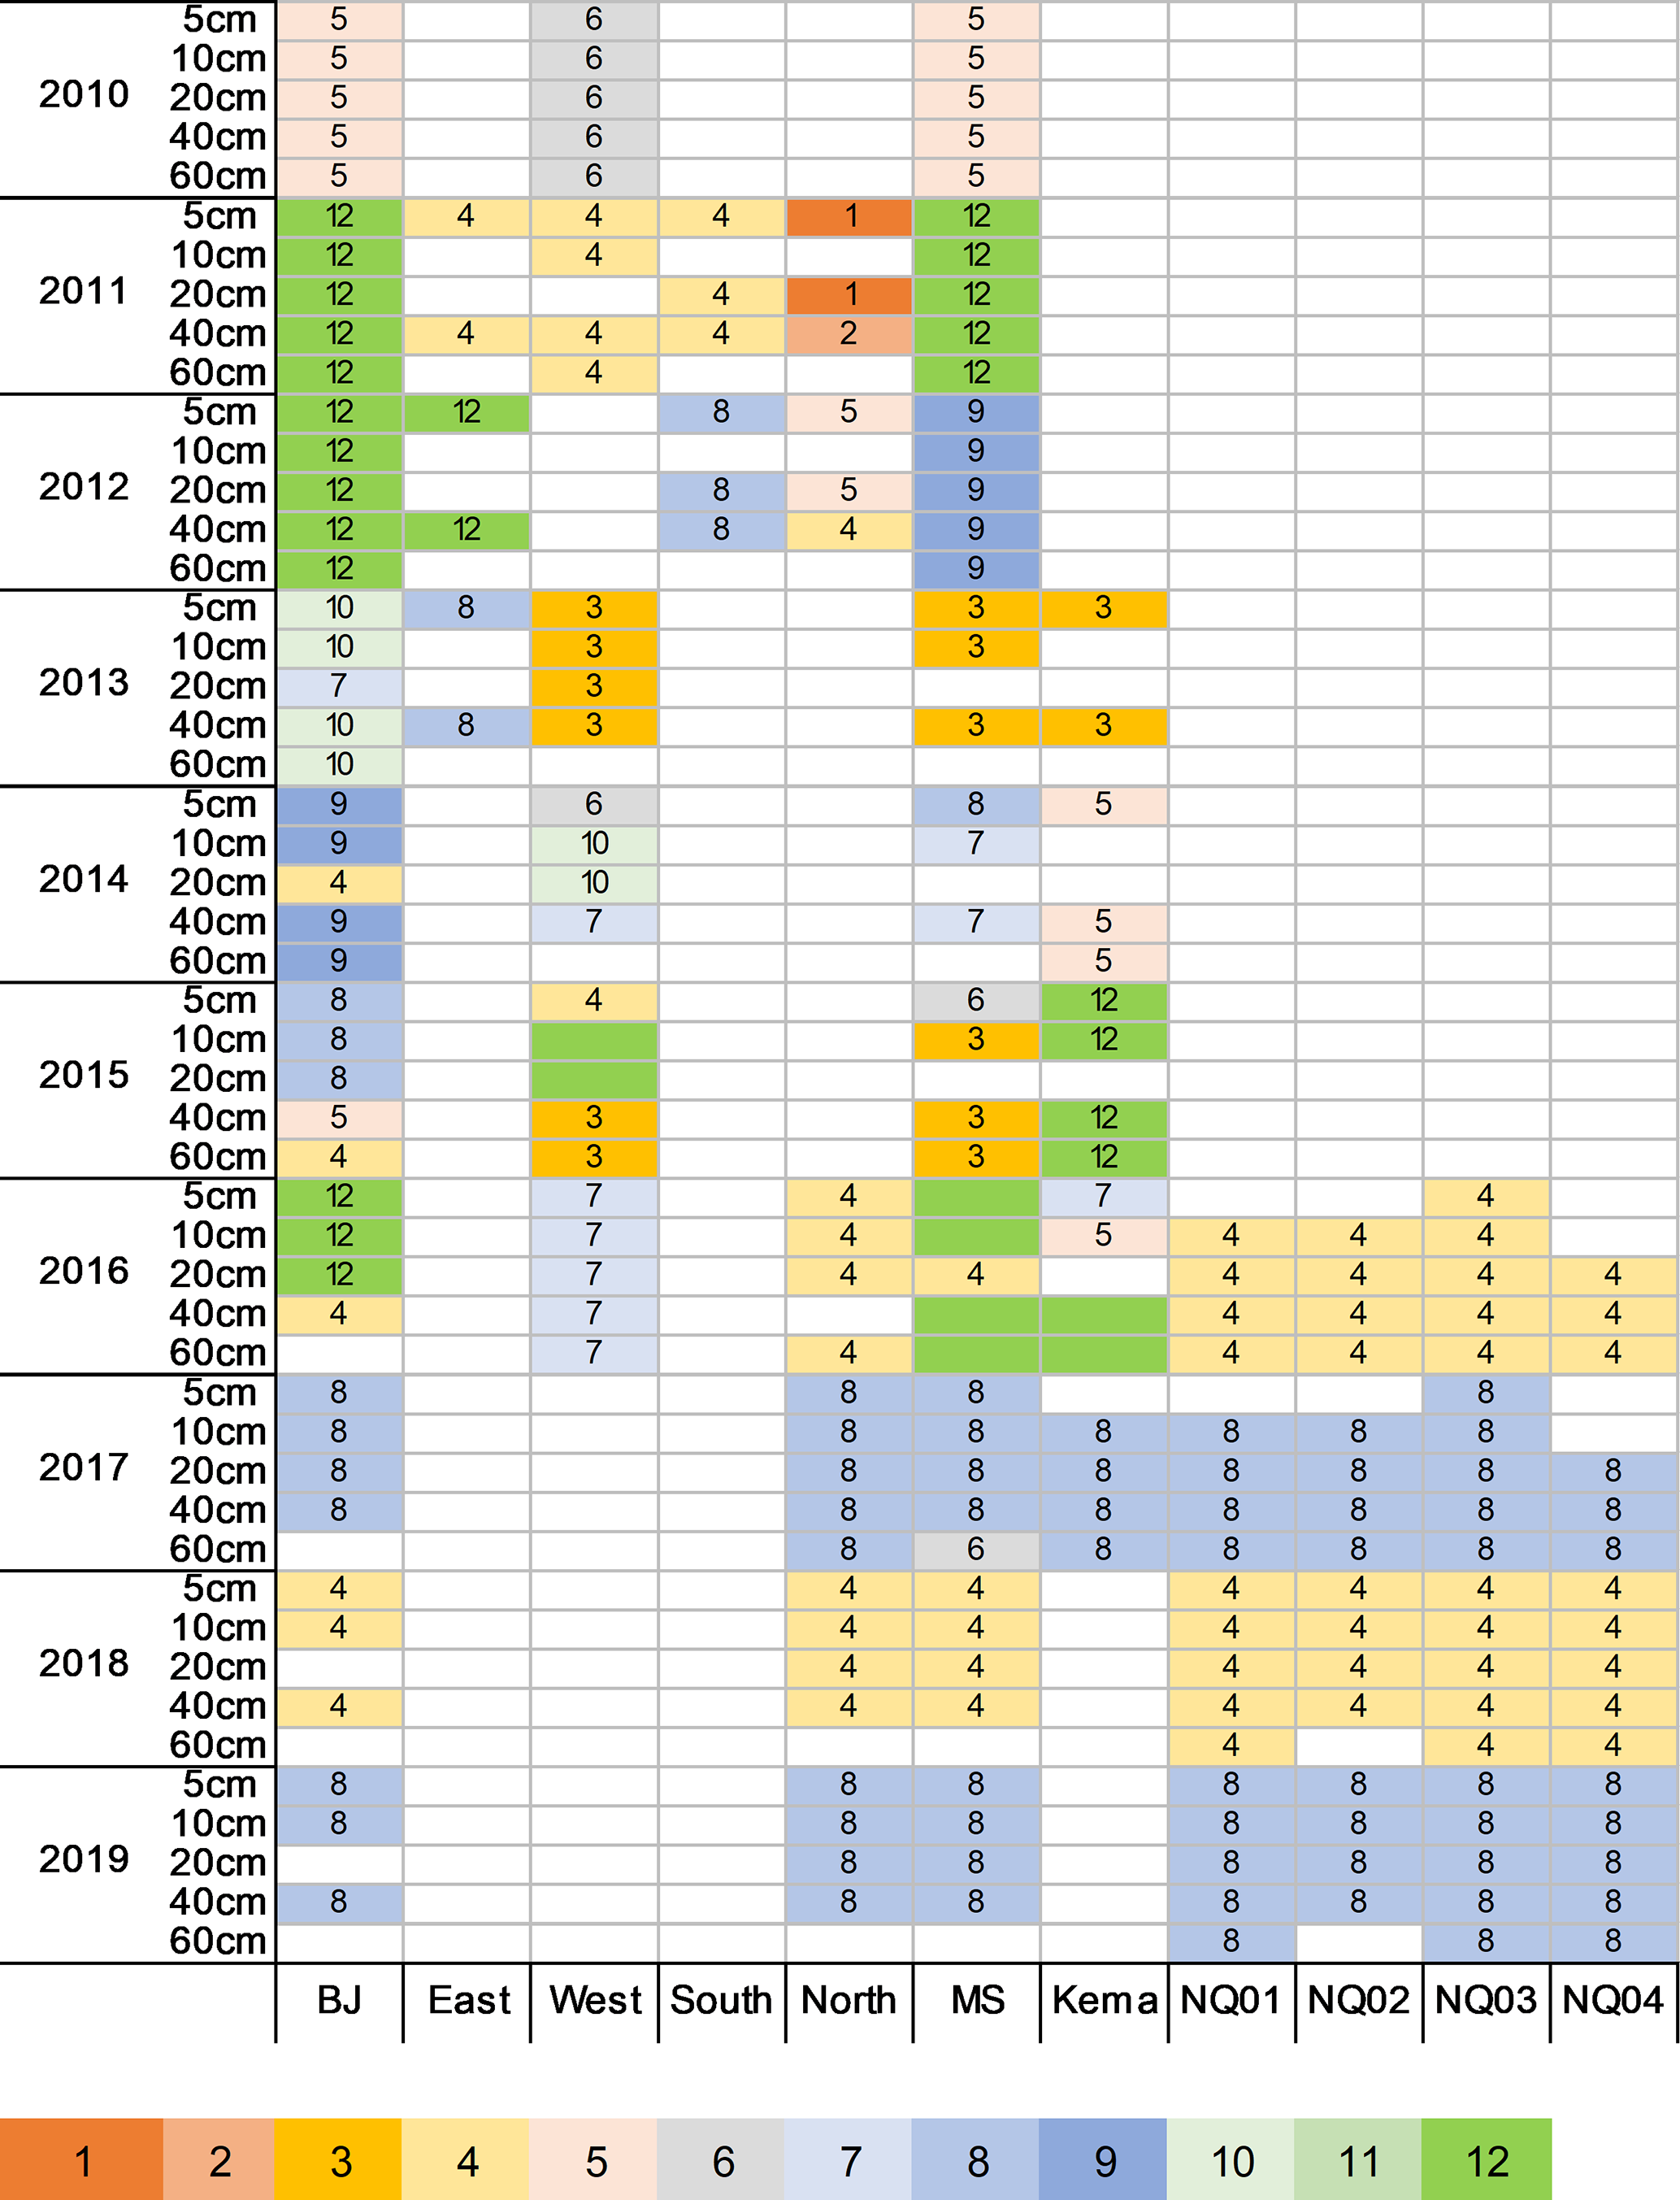
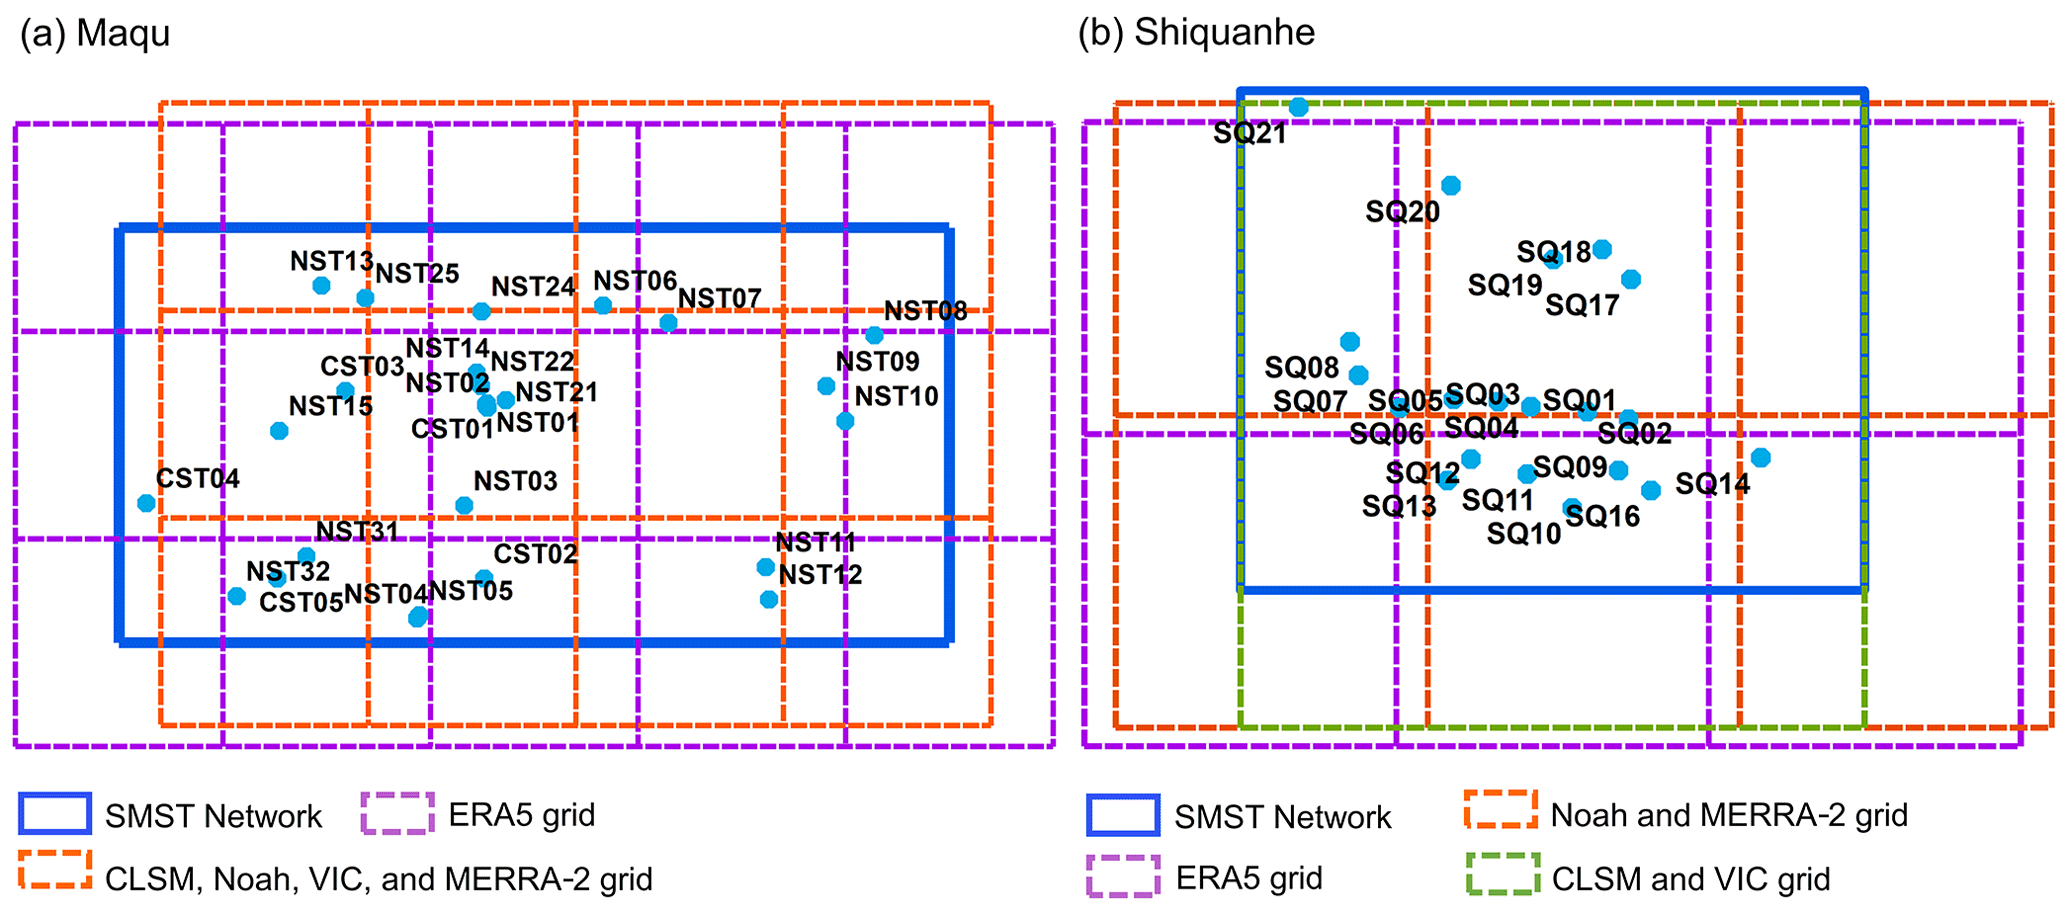
Figure B1Grids of the model-based products falling into the (a) Maqu and (b) Shiquanhe network areas (denoted by the colourful dashed rectangles).
B1 ERA5 SMST data
The SMST derived from the ERA5 product for the depths of 5, 20, and 40 cm are calculated as follows:
where X5,ERA5, X20,ERA5, and X40,ERA5 represent the interpolated SMST values at 5, 20, and 40 cm depths for the ERA5 product, and X0–7,ERA5, X7–28,ERA5, and X28–100,ERA5 represent the SMST values for layers of 0–7, 7–28, 28–100 cm derived from the ERA5 product.
B2 GLDAS-2.1 CLSM SMST data
The SM derived from GLDAS-2.1 CLSM product for the depths of 5, 20, and 40 cm is calculated as follows:
The ST derived from GLDAS-2.1 CLSM product for the depths of 5, 20, and 40 cm is calculated as follows:
B3 GLDAS-2.1 Noah SMST data
The SMST derived from the GLDAS-2.1 Noah product for the depths of 5, 20, and 40 cm is calculated as follows:
B4 GLDAS-2.1 VIC SMST data
The SMST derived from the GLDAS-2.1 VIC product for the depths of 5, 20, and 40 cm is calculated as follows:
B5 MERRA-2 SMST data
The SM derived from MERRA-2 product for the depths of 5, 20, and 40 cm is calculated as follows:
The ST derived from MERRA-2 product for the depths of 5, 20, and 40 cm is calculated as follows:
A trend analysis for each time series is carried out through the following steps:
-
Calculate the month's statistics (Si). For the ith month (1∼ 12), Si is calculated as follows:
where Xi,L and Xi,K represent the monthly value of the data (e.g. SMST at different depths, precipitation, and air temperature) for the Kth and Lth year (satisfying , ), and Y represents the total number of years (e.g. 9 years for the Maqu network and 8 years for the Shiquanhe network).
-
Calculate the variance of Si (VAR(Si)). For the ith month (1–12), VAR(Si) is calculated as follows:
where gi is the total number of equal-value data point groups, and ti,p is the number of equal-value data points in the pth group.
-
Calculate the season's statistic and its variance (S and VAR (S)). For the full year, cold seasons, and warm seasons, S and VAR (S) are calculated as follows:
where i denotes 1–12 for the full year, 5–10 for the warm season, and 1–4, 11, and 12 for the cold seasons.
-
Calculate the final statistic (Z). The final statistic Z for the full year, cold seasons, and warm seasons is calculated as follows:
If the final statistic Z is positive (negative), and its absolute value is greater than (here α=0.05, and ), then the time series showed an upward trend (downtrend) at the significance level of α. Otherwise, there is no significant trend in existence.
-
Calculate the Sen's slope estimate. If there is a trend in existence, we will further estimate the trend slope using Sen's method. For the ith month, individual slope Qi is calculated as follows:
where i denotes 1–12 for the full year, 5–10 for the warm season, and 1–4, 11, and 12 for the cold seasons. The median value of the Qi is considered to be the Sen's trend slope.
PZ, DZ, RvdV, and ZS designed the framework of this work. PZ performed the computations and data analysis and wrote the paper. DZ, RvdV, and ZS supervised the progress of this work, provided critical suggestions, and revised the paper. ZS, JW, and YM designed the set-up of Tibet-Obs. YZ, XW, and ZW were involved in maintaining the Tibet-Obs and downloading the original measurements. PZ, ZW, and JC organized the data.
The contact author has declared that none of the authors has any competing interests.
Publisher’s note: Copernicus Publications remains neutral with regard to jurisdictional claims in published maps and institutional affiliations.
This article is part of the special issue “Extreme environment datasets for the three poles”. It is not associated with a conference.
This study has been supported by the National Key Research and Development Program of China (grant no. 2021YFB3900104), the Strategic Priority Research Program of the Chinese Academy of Sciences (grant no. XDA20100103), and the National Natural Science Foundation of China (grant nos. 41971308 and 41871273).
This research has been supported by the National Key Research and Development Program of China (grant no. 2021YFB3900104), the Strategic Priority Research Program of the Chinese Academy of Sciences (grant no. XDA20100103), and the National Natural Science Foundation of China (grant nos. 41971308 and 41871273).
This paper was edited by Min Feng and reviewed by Yangxiaoyue Liu and one anonymous referee.
Beck, H. E., Zimmermann, N. E., McVicar, T. R., Vergopolan, N., Berg, A., and Wood, E. F.: Present and future Köppen-Geiger climate classification maps at 1-km resolution, Sci. Data, 5, 180214, https://doi.org/10.1038/sdata.2018.214, 2018.
Bhatti, H. A., Rientjes, T., Verhoef, W., and Yaseen, M.: Assessing temporal stability for coarse scale satellite moisture validation in the Maqu area, Tibet, Sensors (Basel), 13, 10725–10748, https://doi.org/10.3390/s130810725, 2013.
Bi, H., Ma, J., Zheng, W., and Zeng, J.: Comparison of soil moisture in GLDAS model simulations and in situ observations over the Tibetan Plateau, J. Geophys. Res.-Atmos., 121, 2658–2678, https://doi.org/10.1002/2015JD024131, 2016.
Cao, B., Gruber, S., Zheng, D., and Li, X.: The ERA5-Land soil temperature bias in permafrost regions, The Cryosphere, 14, 2581–2595, https://doi.org/10.5194/tc-14-2581-2020, 2020.
Chen, Y., Yang, K., He, J., Qin, J., Shi, J., Du, J., and He, Q.: Improving land surface temperature modeling for dry land of China, J. Geophys. Res.-Atmos., 116, D20104, https://doi.org/10.1029/2011JD015921, 2011.
Chen, Y., Yang, K., Qin, J., Zhao, L., Tang, W., and Han, M.: Evaluation of AMSR-E retrievals and GLDAS simulations against observations of a soil moisture network on the central Tibetan Plateau, J. Geophys. Res.-Atmos., 118, 4466–4475, https://doi.org/10.1002/jgrd.50301, 2013.
Chen, Y., Yang, K., Qin, J., Cui, Q., Lu, H., La, Z., Han, M., and Tang, W.: Evaluation of SMAP, SMOS, and AMSR2 soil moisture retrievals against observations from two networks on the Tibetan Plateau, J. Geophys. Res.-Atmos., 122, 5780–5792, https://doi.org/10.1002/2016JD026388, 2017.
Colliander, A., Jackson, T. J., Bindlish, R., Chan, S., Das, N., Kim, S. B., Cosh, M. H., Dunbar, R. S., Dang, L., Pashaian, L., Asanuma, J., Aida, K., Berg, A., Rowlandson, T., Bosch, D., Caldwell, T., Caylor, K., Goodrich, D., al Jassar, H., Lopez-Baeza, E., Martínez-Fernández, J., González-Zamora, A., Livingston, S., McNairn, H., Pacheco, A., Moghaddam, M., Montzka, C., Notarnicola, C., Niedrist, G., Pellarin, T., Prueger, J., Pulliainen, J., Rautiainen, K., Ramos, J., Seyfried, M., Starks, P., Su, Z., Zeng, Y., van der Velde, R., Thibeault, M., Dorigo, W., Vreugdenhil, M., Walker, J. P., Wu, X., Monerris, A., O'Neill, P. E., Entekhabi, D., Njoku, E. G., and Yueh, S.: Validation of SMAP surface soil moisture products with core validation sites, Remote Sens. Environ., 191, 215–231, https://doi.org/10.1016/j.rse.2017.01.021, 2017.
Deng, M., Meng, X., Lyv, Y., Zhao, L., Li, Z., Hu, Z., and Jing, H.: Comparison of Soil Water and Heat Transfer Modeling Over the Tibetan Plateau Using Two Community Land Surface Model (CLM) Versions, J. Adv. Model. Earth Sy., 12, e2020MS002189, https://doi.org/10.1029/2020MS002189, 2020.
Deng, M., Meng, X., Lu, Y., Li, Z., Zhao, L., Hu, Z., Chen, H., Shang, L., Wang, S., and Li, Q.: Impact and Sensitivity Analysis of Soil Water and Heat Transfer Parameterizations in Community Land Surface Model on the Tibetan Plateau, J. Adv. Model. Earth Sy., 13, e2021MS002670, https://doi.org/10.1029/2021MS002670, 2021.
Dente, L., Vekerdy, Z., Wen, J., and Su, Z.: Maqu network for validation of satellite-derived soil moisture products, Int. J. Appl. Earth Obs., 17, 55–65, https://doi.org/10.1016/j.jag.2011.11.004, 2012.
Dorigo, W., van Oevelen, P., Wagner, W., Drusch, M., Mecklenburg, S., Robock, A., and Jackson, T.: A New International Network for in Situ Soil Moisture Data, Eos Trans. AGU, 92, 141–142, https://doi.org/10.1029/2011EO170001, 2011.
Dorigo, W., Himmelbauer, I., Aberer, D., Schremmer, L., Petrakovic, I., Zappa, L., Preimesberger, W., Xaver, A., Annor, F., Ardö, J., Baldocchi, D., Bitelli, M., Blöschl, G., Bogena, H., Brocca, L., Calvet, J.-C., Camarero, J. J., Capello, G., Choi, M., Cosh, M. C., van de Giesen, N., Hajdu, I., Ikonen, J., Jensen, K. H., Kanniah, K. D., de Kat, I., Kirchengast, G., Kumar Rai, P., Kyrouac, J., Larson, K., Liu, S., Loew, A., Moghaddam, M., Martínez Fernández, J., Mattar Bader, C., Morbidelli, R., Musial, J. P., Osenga, E., Palecki, M. A., Pellarin, T., Petropoulos, G. P., Pfeil, I., Powers, J., Robock, A., Rüdiger, C., Rummel, U., Strobel, M., Su, Z., Sullivan, R., Tagesson, T., Varlagin, A., Vreugdenhil, M., Walker, J., Wen, J., Wenger, F., Wigneron, J. P., Woods, M., Yang, K., Zeng, Y., Zhang, X., Zreda, M., Dietrich, S., Gruber, A., van Oevelen, P., Wagner, W., Scipal, K., Drusch, M., and Sabia, R.: The International Soil Moisture Network: serving Earth system science for over a decade, Hydrol. Earth Syst. Sci., 25, 5749–5804, https://doi.org/10.5194/hess-25-5749-2021, 2021.
Entekhabi, D., Njoku, E. G., O'Neill, P. E., Kellogg, K. H., Crow, W. T., Edelstein, W. N., Entin, J. K., Goodman, S. D., Jackson, T. J., Johnson, J., Kimball, J., Piepmeier, J. R., Koster, R. D., Martin, N., McDonald, K. C., Moghaddam, M., Moran, S., Reichle, R., Shi, J. C., Spencer, M. W., Thurman, S. W., Tsang, L., and van Zyl, J.: The Soil Moisture Active Passive (SMAP) Mission, P. IEEE, 98, 704–716, https://doi.org/10.1109/JPROC.2010.2043918, 2010.
Gao, X., Zhao, X., Brocca, L., Huo, G., Lv, T., and Wu, P.: Depth scaling of soil moisture content from surface to profile: multistation testing of observation operators, Hydrol. Earth Syst. Sci. Discuss. [preprint], https://doi.org/10.5194/hess-2017-292, 2017.
Gelaro, R., McCarty, W., Suárez, M. J., Todling, R., Molod, A., Takacs, L., Randles, C. A., Darmenov, A., Bosilovich, M. G., Reichle, R., Wargan, K., Coy, L., Cullather, R., Draper, C., Akella, S., Buchard, V., Conaty, A., da Silva, A. M., Gu, W., Kim, G.-K., Koster, R., Lucchesi, R., Merkova, D., Nielsen, J. E., Partyka, G., Pawson, S., Putman, W., Rienecker, M., Schubert, S. D., Sienkiewicz, M., and Zhao, B.: The Modern-Era Retrospective Analysis for Research and Applications, Version 2 (MERRA-2), J. Climate, 30, 5419–5454, https://doi.org/10.1175/JCLI-D-16-0758.1, 2017.
Gilbert, R. O.: Statistical Methods for Environmental Pollution Monitoring, United States, https://www.osti.gov/biblio/7037501 (last access: 28 June 2022), 1987.
Hersbach, H., Bell, B., Berrisford, P., Hirahara, S., Horányi, A., Muñoz-Sabater, J., Nicolas, J., Peubey, C., Radu, R., Schepers, D., Simmons, A., Soci, C., Abdalla, S., Abellan, X., Balsamo, G., Bechtold, P., Biavati, G., Bidlot, J., Bonavita, M., de Chiara, G., Dahlgren, P., Dee, D., Diamantakis, M., Dragani, R., Flemming, J., Forbes, R., Fuentes, M., Geer, A., Haimberger, L., Healy, S., Hogan, R. J., Hólm, E., Janisková, M., Keeley, S., Laloyaux, P., Lopez, P., Lupu, C., Radnoti, G., de Rosnay, P., Rozum, I., Vamborg, F., Villaume, S., and Thépaut, J.-N.: The ERA5 global reanalysis, Q. J. Roy. Meteor. Soc., 146, 1999–2049, https://doi.org/10.1002/qj.3803, 2020.
Ju, F., An, R., Yang, Z., Huang, L., and Sun, Y.: Assimilating SMOS Brightness Temperature for Hydrologic Model Parameters and Soil Moisture Estimation with an Immune Evolutionary Strategy, Remote Sens. (Basel), 12, 1556, https://doi.org/10.3390/rs12101556, 2020.
Li, C., Lu, H., Leung, L. R., Yang, K., Li, H., Wang, W., Han, M., and Chen, Y.: Improving Land Surface Temperature Simulation in CoLM Over the Tibetan Plateau Through Fractional Vegetation Cover Derived From a Remotely Sensed Clumping Index and Model-Simulated Leaf Area Index, J. Geophys. Res.-Atmos., 124, 2620–2642, https://doi.org/10.1029/2018JD028640, 2019.
Li, M., Zeng, Y., Lubczynski, M. W., Roy, J., Yu, L., Qian, H., Li, Z., Chen, J., Han, L., Zheng, H., Veldkamp, T., Schoorl, J. M., Hendricks Franssen, H.-J., Hou, K., Zhang, Q., Xu, P., Li, F., Lu, K., Li, Y., and Su, Z.: A first investigation of hydrogeology and hydrogeophysics of the Maqu catchment in the Yellow River source region, Earth Syst. Sci. Data, 13, 4727–4757, https://doi.org/10.5194/essd-13-4727-2021, 2021.
Liu, Y., Jing, W., Sun, S., and Wang, C.: Multi-Scale and Multi-Depth Validation of Soil Moisture From the China Land Data Assimilation System, IEEE J. Sel. Top. Appl. Earth Obs. Remote Sens., 14, 9913–9930, https://doi.org/10.1109/JSTARS.2021.3116583, 2021.
Ma, H., Zeng, J., Zhang, X., Fu, P., Zheng, D., Wigneron, J.-P., Chen, N., and Niyogi, D.: Evaluation of six satellite- and model-based surface soil temperature datasets using global ground-based observations, Remote Sens. Environ., 264, 112605, https://doi.org/10.1016/j.rse.2021.112605, 2021.
Qin, J., Zhao, L., Chen, Y., Yang, K., Yang, Y., Chen, Z., and Lu, H.: Inter-comparison of spatial upscaling methods for evaluation of satellite-based soil moisture, J. Hydrol., 523, 170–178, https://doi.org/10.1016/j.jhydrol.2015.01.061, 2015.
Reichle, R. H., de Lannoy, G. J. M., Liu, Q., Ardizzone, J. v, Colliander, A., Conaty, A., Crow, W., Jackson, T. J., Jones, L. A., Kimball, J. S., Koster, R. D., Mahanama, S. P., Smith, E. B., Berg, A., Bircher, S., Bosch, D., Caldwell, T. G., Cosh, M., González-Zamora, Á., Holifield Collins, C. D., Jensen, K. H., Livingston, S., Lopez-Baeza, E., Martínez-Fernández, J., McNairn, H., Moghaddam, M., Pacheco, A., Pellarin, T., Prueger, J., Rowlandson, T., Seyfried, M., Starks, P., Su, Z., Thibeault, M., van der Velde, R., Walker, J., Wu, X., and Zeng, Y.: Assessment of the SMAP Level-4 Surface and Root-Zone Soil Moisture Product Using In Situ Measurements, J. Hydrometeorol., 18, 2621–2645, https://doi.org/10.1175/JHM-D-17-0063.1, 2017.
Rodell, M., Houser, P. R., Jambor, U., Gottschalck, J., Mitchell, K., Meng, C.-J., Arsenault, K., Cosgrove, B., Radakovich, J., Bosilovich, M., Entin, J. K., Walker, J. P., Lohmann, D., and Toll, D.: The Global Land Data Assimilation System, B. Am. Meteorol. Soc., 85, 381–394, https://doi.org/10.1175/BAMS-85-3-381, 2004.
Shangguan, W., Dai, Y., Liu, B., Zhu, A., Duan, Q., Wu, L., Ji, D., Ye, A., Yuan, H., Zhang, Q., Chen, D., Chen, M., Chu, J., Dou, Y., Guo, J., Li, H., Li, J., Liang, L., Liang, X., Liu, H., Liu, S., Miao, C., and Zhang, Y.: A China data set of soil properties for land surface modeling, J. Adv. Model. Earth Sy., 5, 212–224, https://doi.org/10.1002/jame.20026, 2013.
Shi, P., Zeng, J., Chen, K.-S., Ma, H., Bi, H., and Cui, C.: The 20-y spatio-temporal trends of remotely sensed soil moisture and vegetation and their response to climate change over the Third Pole, J. Hydrometeorol., 22, 2877–2896, https://doi.org/10.1175/JHM-D-21-0077.1, 2021.
Su, Z., Wen, J., Dente, L., van der Velde, R., Wang, L., Ma, Y., Yang, K., and Hu, Z.: The Tibetan Plateau observatory of plateau scale soil moisture and soil temperature (Tibet-Obs) for quantifying uncertainties in coarse resolution satellite and model products, Hydrol. Earth Syst. Sci., 15, 2303–2316, https://doi.org/10.5194/hess-15-2303-2011, 2011.
Su, Z., de Rosnay, P., Wen, J., Wang, L., and Zeng, Y.: Evaluation of ECMWF's soil moisture analyses using observations on the Tibetan Plateau, J. Geophys. Res.-Atmos., 118, 5304–5318, https://doi.org/10.1002/jgrd.50468, 2013.
van der Velde, R., Su, Z., Ek, M., Rodell, M., and Ma, Y.: Influence of thermodynamic soil and vegetation parameterizations on the simulation of soil temperature states and surface fluxes by the Noah LSM over a Tibetan plateau site, Hydrol. Earth Syst. Sci., 13, 759–777, https://doi.org/10.5194/hess-13-759-2009, 2009.
Wang, L., Li, X., Chen, Y., Yang, K., Chen, D., Zhou, J., Liu, W., Qi, J., and Huang, J.: Validation of the global land data assimilation system based on measurements of soil temperature profiles, Agr. Forest Meteorol., 218–219, 288–297, https://doi.org/10.1016/j.agrformet.2016.01.003, 2016.
Wu, G. and Zhang, Y.: Tibetan Plateau Forcing and the Timing of the Monsoon Onset over South Asia and the South China Sea, Mon. Weather Rev., 126, 913–927, https://doi.org/10.1175/1520-0493(1998)126<0913:TPFATT>2.0.CO;2, 1998.
Yang, K., Qin, J., Zhao, L., Chen, Y., Tang, W., Han, M., Lazhu, Chen, Z., Lv, N., Ding, B., Wu, H., and Lin, C.: A Multiscale Soil Moisture and Freeze–Thaw Monitoring Network on the Third Pole, B. Am. Meteorol. Soc., 94, 1907–1916, https://doi.org/10.1175/BAMS-D-12-00203.1, 2013.
Yang, K., Chen, Y., He, J., Zhao, L., Lu, H., and Qin, J.: Development of a daily soil moisture product for the period of 2002–2011 in Mainland China., Sci. China Earth Sci., 63, 1113–1125, https://doi.org/10.1007/s11430-019-9588-5, 2020.
Yao, T., Thompson, L. G., Mosbrugger, V., Zhang, F., Ma, Y., Luo, T., Xu, B., Yang, X., Joswiak, D. R., Wang, W., Joswiak, M. E., Devkota, L. P., Tayal, S., Jilani, R., and Fayziev, R.: Third Pole Environment (TPE), Environ. Dev., 3, 52–64, https://doi.org/10.1016/j.envdev.2012.04.002, 2012.
Yi, Y., Kimball, J., Jones, L., Reichle, R., and Mcdonald, K.: Evaluation of MERRA Land Surface Estimates in Preparation for the Soil Moisture Active Passive Mission, J. Climate, 24, 3797–3816, https://doi.org/10.1175/2011JCLI4034.1, 2011.
Zeng, J., Li, Z., Chen, Q., Bi, H., Qiu, J., and Zou, P.: Evaluation of remotely sensed and reanalysis soil moisture products over the Tibetan Plateau using in-situ observations, Remote Sens. Environ., 163, 91–110, https://doi.org/10.1016/j.rse.2015.03.008, 2015.
Zhang, P., Zheng, D., van der Velde, R., Wen, J., Zeng, Y., Wang, X., Wang, Z., Chen, J., and Su, Z.: Status of the Tibetan Plateau observatory (Tibet-Obs) and a 10-year (2009–2019) surface soil moisture dataset, Earth Syst. Sci. Data, 13, 3075–3102, https://doi.org/10.5194/essd-13-3075-2021, 2021.
Zhang, P., Zheng, D., van der Velde, R., Wen, J., Ma, Y., Zeng, Y., Wang, X., Wang, Z., Chen, J., and Su, Z.: A dataset of 10-year regional-scale soil moisture and soil temperature measurements at multiple depths on the Tibetan Plateau, 4TU.ResearchData [data set], https://doi.org/10.4121/20141567.v1, 2022.
Zheng, D., van der Velde, R., Su, Z., Wang, X., Wen, J., Booij, M. J., Hoekstra, A. Y., and Chen, Y.: Augmentations to the Noah Model Physics for Application to the Yellow River Source Area. Part I: Soil Water Flow, J. Hydrometeorol., 16, 2659–2676, https://doi.org/10.1175/JHM-D-14-0198.1, 2015a.
Zheng, D., van der Velde, R., Su, Z., Wang, X., Wen, J., Booij, M. J., Hoekstra, A. Y., and Chen, Y.: Augmentations to the Noah Model Physics for Application to the Yellow River Source Area. Part II: Turbulent Heat Fluxes and Soil Heat Transport, J. Hydrometeorol., 16, 2677–2694, https://doi.org/10.1175/JHM-D-14-0199.1, 2015b.
Zheng, D., van der Velde, R., Su, Z., Wen, J., Wang, X., Booij, M. J., Hoekstra, A. Y., Lv, S., Zhang, Y., and Ek, M. B.: Impacts of Noah model physics on catchment-scale runoff simulations, J. Geophys. Res.-Atmos., 121, 807–832, https://doi.org/10.1002/2015JD023695, 2016.
Zheng, D., van der Velde, R., Su, Z., Wen, J., Wang, X., and Yang, K.: Evaluation of Noah Frozen Soil Parameterization for Application to a Tibetan Meadow Ecosystem, J. Hydrometeorol., 18, 1749–1763, https://doi.org/10.1175/JHM-D-16-0199.1, 2017.
Zheng, D., Wang, X., van der Velde, R., Ferrazzoli, P., Wen, J., Wang, Z., Schwank, M., Colliander, A., Bindlish, R., and Su, Z.: Impact of surface roughness, vegetation opacity and soil permittivity on L-band microwave emission and soil moisture retrieval in the third pole environment, Remote Sens. Environ., 209, 633–647, https://doi.org/10.1016/j.rse.2018.03.011, 2018.
Zheng, D., Li, X., Wang, X., Wang, Z., Wen, J., van der Velde, R., Schwank, M., and Su, Z.: Sampling depth of L-band radiometer measurements of soil moisture and freeze-thaw dynamics on the Tibetan Plateau, Remote Sens. Environ., 226, 16–25, https://doi.org/10.1016/j.rse.2019.03.029, 2019.
Zhuang, R., Zeng, Y., Manfreda, S., and Su, Z.: Quantifying Long-Term Land Surface and Root Zone Soil Moisture over Tibetan Plateau, Remote Sens. (Basel), 12, 509, https://doi.org/10.3390/rs12030509, 2020.
- Abstract
- Introduction
- Data
- Methods
- Results
- Data availability
- Conclusions
- Appendix A: SMST data records of the Tibet-Obs
- Appendix B: Linear interpolation method for the model-based SMST data
- Appendix C: Mann–Kendall trend test and Sen's slope estimate
- Author contributions
- Competing interests
- Disclaimer
- Special issue statement
- Acknowledgements
- Financial support
- Review statement
- References