the Creative Commons Attribution 4.0 License.
the Creative Commons Attribution 4.0 License.
 | 15 Dec 2022
Landsat- and Sentinel-derived glacial lake dataset in the China–Pakistan Economic Corridor from 1990 to 2020
Muchu Lesi
Dan Hirsh Shugar
Jida Wang
Qian Deng
Huayong Chen
Jianrong Fan
The China–Pakistan Economic Corridor (CPEC) is one of the flagship projects of the One Belt One Road Initiative, which faces threats from water shortage and mountain disasters in the high-elevation region, such as glacial lake outburst floods (GLOFs). An up-to-date high-quality glacial lake dataset with parameters such as lake area, volume, and type, which is fundamental to water resource and flood risk assessments and prediction of glacier–lake evolutions, is still largely absent for the entire CPEC. This study describes a glacial lake dataset for the CPEC using a threshold-based mapping method associated with rigorous visual inspection workflows. This dataset includes (1) multi-temporal inventories for 1990, 2000, and 2020 produced from 30 m resolution Landsat images and (2) a glacial lake inventory for the year 2020 at 10 m resolution produced from Sentinel-2 images. The results show that, in 2020, 2234 lakes were derived from the Landsat images, covering a total area of 86.31±14.98 km2 with a minimum mapping unit (MMU) of 5 pixels (4500 m2), whereas 7560 glacial lakes were derived from the Sentinel-2 images with a total area of 103.70±8.45 km2 with an MMU of 5 pixels (500 m2). The discrepancy shows that Sentinel-2 can detect a large quantity of smaller lakes compared to Landsat due to its finer spatial resolution.
Glacial lake data in 2020 were validated by Google Earth-derived lake boundaries with a median (± standard deviation) difference of 7.66±4.96 % for the Landsat-derived product and 4.46±4.62 % for the Sentinel-derived product. The total number and area of glacial lakes from consistent 30 m resolution Landsat images remain relatively stable despite a slight increase from 1990 to 2020. A range of critical attributes has been generated in the dataset, including lake types and mapping uncertainty estimated by an improved equation of Hanshaw and Bookhagen (2014). This comprehensive glacial lake dataset has the potential to be widely applied in studies on water resource assessment, glacial lake-related hazards, and glacier–lake interactions and is freely available at https://doi.org/10.12380/Glaci.msdc.000001 (Lesi et al., 2022).
- Article
(12428 KB) - Full-text XML
- BibTeX
- EndNote


Glaciers in High Mountain Asia (HMA) play a crucial role in regulating climate; supporting ecosystems; modulating the release of freshwater into rivers; and sustaining municipal water supplies (Wang et al., 2019; Viviroli et al., 2020), agricultural irrigation, and hydropower generation (Pritchard, 2019; Nie et al., 2021). Most HMA glaciers are losing mass in the context of climate change (Brun et al., 2017; Maurer et al., 2019; Shean et al., 2020; Bhattacharya et al., 2021); therefore, unsustainable glacier melt and the passing of peak water are reducing the hydrological role of glaciers (Huss and Hock, 2018) and impacting downstream ecosystem services, agriculture, hydropower, and other socioeconomic values (Carrivick and Tweed, 2016; Nie et al., 2021). The present and future glacier changes not only impact the water supply for the downstream area but also alter the frequency and intensity of glacier-related hazards, such as glacial lake outburst floods (GLOFs) (Nie et al., 2018; Rounce et al., 2020; Zheng et al., 2021), and rock and ice avalanches (Shugar et al., 2021). Global glacial lake numbers and total area both increased between 1990 and 2018 in response to glacier retreat and climate change (Shugar et al., 2020a), affecting the allocation of freshwater resources. The Indus is globally the most important and vulnerable water tower unit where glaciers, lakes, and reservoir storage contribute about two-thirds of the water supply (Immerzeel et al., 2020). Ice-marginal lakes store ∼1 % of total ice discharge in Greenland and accelerate lake-terminating ice velocity by ∼25 % (Carrivick et al., 2022). An increasing frequency and risk of GLOFs (Nie et al., 2021; Zheng et al., 2021) is threatening the Asian population and infrastructures in the mountain ranges, such as the China–Pakistan Economic Corridor (CPEC), a flagship component of the One Belt One Road Initiative (Battamo et al., 2021; Li et al., 2021). The northern section of the CPEC passes through the Pamir, Karakoram, Hindu Kush, and Himalaya mountains where droughts and glacier-related hazards are frequent and severe (Hewitt, 2014; Bhambri et al., 2019; Pritchard, 2019), threatening local people, and the existing, under-construction, and planned infrastructures, such as highways, hydropower plants, and railways. Understanding the risk posed by water shortage and glacier-related hazards is a critical step toward sustainable development for the CPEC.
Glacial lake inventories with a range of attributes benefit water resource assessment and disaster risk assessment related to glacial lakes (Wang et al., 2020; Carrivick et al., 2022) and contribute to predicting glacier–lake evolution and cryosphere–hydrosphere interactions under climate change (Nie et al., 2017; Brun et al., 2019; Maurer et al., 2019; Carrivick et al., 2020; Liu et al., 2020). Remote sensing is the most viable way to map glacial lakes and detect their spatiotemporal changes in the high-elevation zones where in situ accessibility is extremely low (Huggel et al., 2002; Quincey et al., 2007). Studies in glacial lake inventories using satellite observations have been heavily conducted at regional scales recently, such as in the Tibetan Plateau (Zhang et al., 2015), the Himalaya (Gardelle et al., 2011; Nie et al., 2017), the HMA (Wang et al., 2020; Chen et al., 2021), the Tien Shan (Wang et al., 2013), Alaska (Rick et al., 2022), Greenland (How et al., 2021), and northern Pakistan (Ashraf et al., 2017). However, the latest glacial lake mapping in 2020 is still absent along the CPEC. Among existing studies, Landsat archival images are the most widely used due to their multi-decadal record of earth surface observations, reasonably high spatial resolution (30 m), and publicly available distribution (Roy et al., 2014). Freely available Sentinel-2 satellite images show more potential than Landsat in glacial lake mapping and inventories due to their higher spatial resolution (10 m) and global coverage but have only been available since late 2015 (Williamson et al., 2018; Paul et al., 2020). Glacial lake inventories using Sentinel-2 images are relatively scarce at regional scales, and studies of the latest glacial lake mapping, as well as comparisons of glacial lake datasets derived from Sentinel-2 and Landsat observations, are still lacking.
Discrepancies between various glacial lake inventories (Zhang et al., 2015; Shugar et al., 2020a; Wang et al., 2020; Chen et al., 2021; How et al., 2021) result from differences in mapping methods, minimum mapping units, the definition of glacial lakes, periods, data sources, and other factors. For example, the manual vectorization method was widely adopted in the earlier stages for its high accuracy. However, it is time-consuming, is associated with high labor intensity and is only practical at regional scales (Zhang et al., 2015; Wang et al., 2020). Automated and semi-automated lake mapping methods, such as multispectral index classification (Gardelle et al., 2011; Nie et al., 2017; Zhang et al., 2018; How et al., 2021), have been developed to improve the efficiency of glacial lake inventories using optical images, although manual modification is often unavoidable to assure the quality of lake data impacted by cloud cover, mountain shadows, seasonal snow cover, and frozen lake surfaces (Sheng et al., 2016; Wang et al., 2017, 2018). Backscatter images from synthetic aperture radar (SAR) (Wangchuk and Bolch, 2020; How et al., 2021) were used to remove the impact of cloud cover for lake mapping. Besides, other approaches such as hydrological sink detection using DEM (How et al., 2021) and land surface temperature-based detection methods (Zhao et al., 2020) were also used for lake inventories. Different classification methods impact the results of lake mapping and monitoring. So far, we are lacking a unified standard for the classification system of glacial lakes (Yao et al., 2018). Existing classification systems are generally used for research purposes, mainly based on the relative positions of glacial lakes and glaciers, the supply conditions of glaciers, and the attributes of dams. In addition to different classification standards, the same type of glacial lakes may also have different names given by different scholars. For example, ice-marginal (Carrivick and Quincey, 2014; Carrivick et al., 2020), ice-contact (Carrivick and Tweed, 2013), and proglacial (Nie et al., 2017) lakes all represent glacial lakes that share the boundary with glaciers. Glacial lakes in currently available datasets have been traditionally categorized by their spatial relationship with upstream glaciers (Gardelle et al., 2011; Wang et al., 2020; Chen et al., 2021), and classification attributes considering the formation mechanism and the properties of dams are rare or incomplete in the CPEC (Yao et al., 2018; Li et al., 2020). Dam-type classification of glacial lakes provide a crucial attribute for glacier–lake interactions and risk assessment (Emmer and Cuøín, 2021). Therefore, an up-to-date glacial lake dataset with critical, quality-assured parameters (e.g., lake area, volume, and type) is necessary.
This study aims to (1) present an up-to-date glacial lake dataset in the CPEC in 2020 using both Landsat 8 and Sentinel-2 images to accurately document its detailed lake distribution; (2) present two historical glacial lake datasets for the CPEC to show the extent in 1990 and 2000 using consistent 30 m Landsat images to reveal glacial lake changes at three time periods (1990, 2000, and 2020); and (3) generate a range of critical attributes for glacial lake inventories to benefit studies on water resource evaluation, risk assessment of GLOFs, and glacier–lake evolution modeling in the HMA.
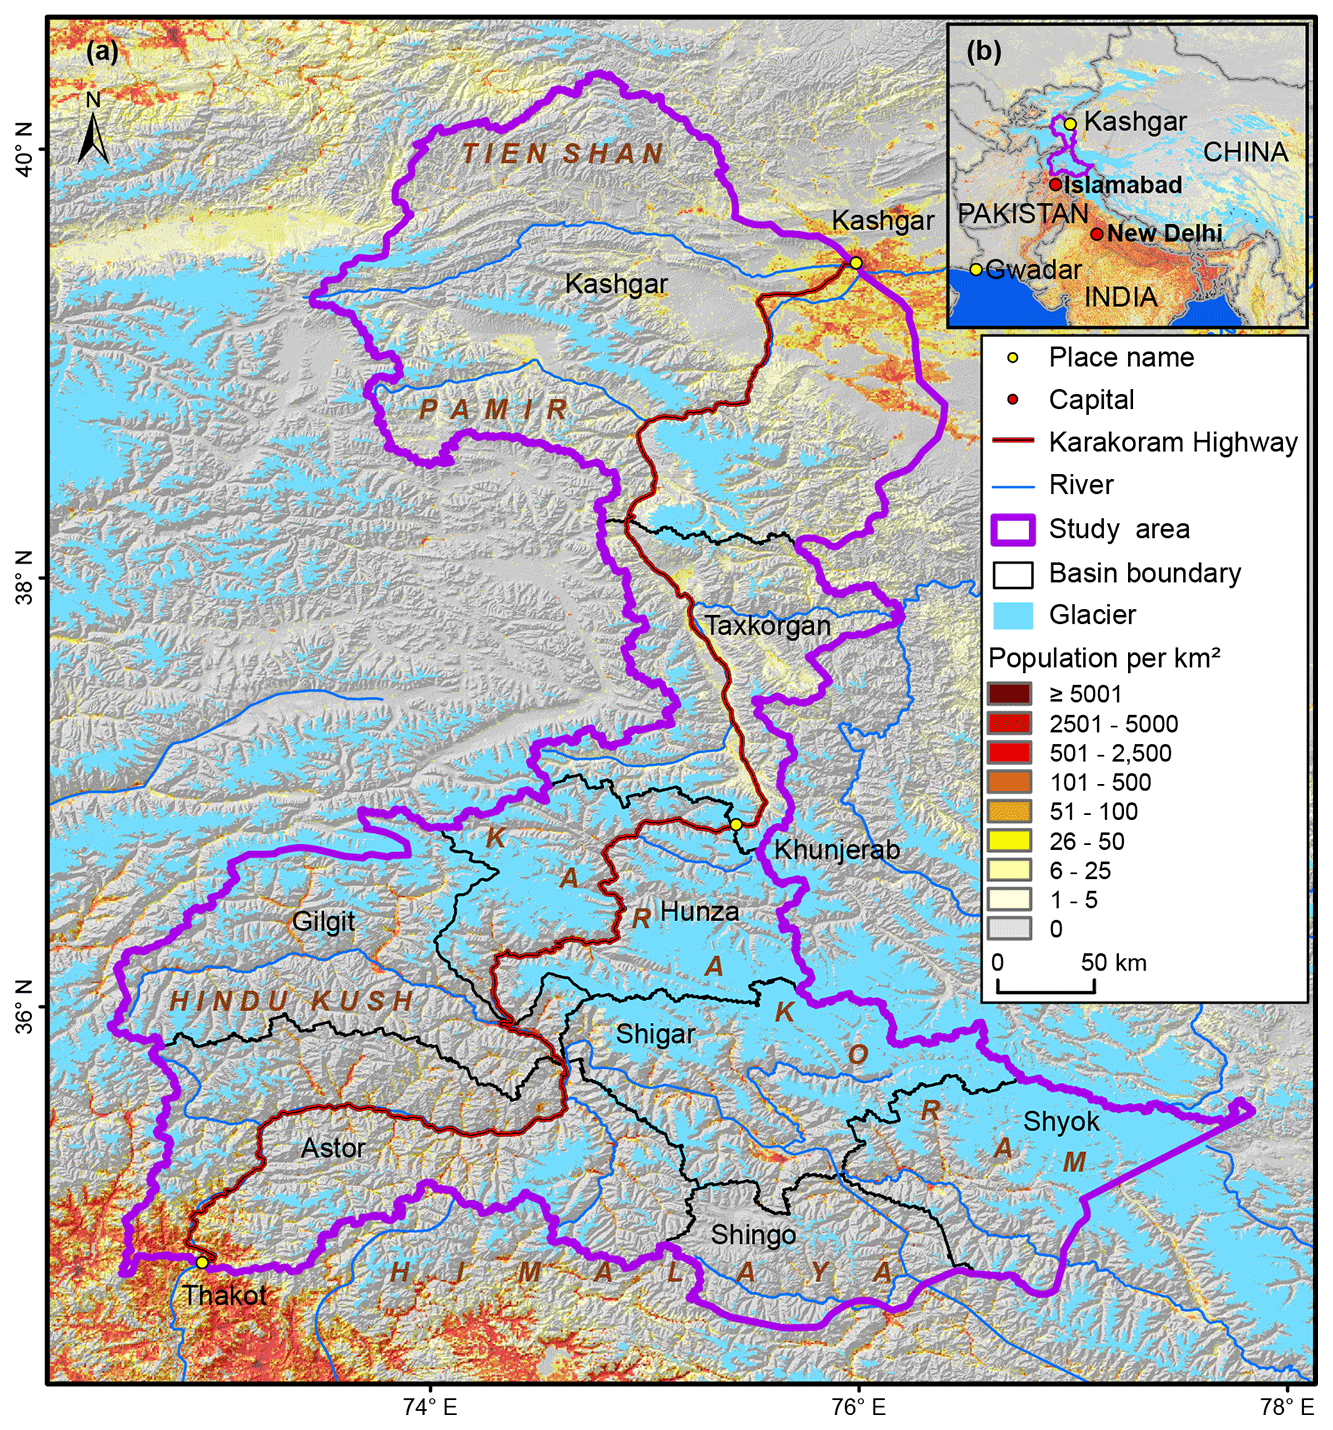
Figure 1Location of the study area associated with the distribution of glaciers (RGI Consortium, 2017), mountains, basins, and population (Rose et al., 2021) (a), and its location within the CPEC (b).
The northern part of the CPEC is selected as the study area (Fig. 1). The CPEC, originating from Kashgar of the Xinjiang Uygur Autonomous Region, China, and extending to Gwadar Port, Pakistan (Ullah et al., 2019; Yao et al., 2020), connects China and Pakistan via the only Karakoram Highway. The study area covers all the drainage basins along Karakoram Highway, starting from Kashgar and ending at Thakot, with a total area of ∼125 000 km2. The upper Indus basins beyond the Pakistani-administrated border are excluded from this study due to the spatial coverage of the CPEC. The entire study area is divided into eight sub-basins, covering most of the Karakoram with the highest elevation up to 8611 m, western Himalaya and Tien Shan, eastern Hindu Kush, and the Pamir mountains. The 9710 glaciers in the study area cover a total area of 17 447 km2, and nearly 60 % of glaciers are distributed in the Karakoram (5818 glaciers with a total area of 14 067.52 km2) (RGI Consortium, 2017). Most glaciers in the western Himalaya and eastern Hindu Kush are losing mass in the context of climate change (Kääb et al., 2012; Yao et al., 2012; Brun et al., 2017; Shean et al., 2020; Hugonnet et al., 2021), whereas the glaciers in the eastern Karakoram and Pamir have shown unusually little changes, including unchanged, retreated, advanced, and surged glaciers (Hewitt, 2005; Kääb et al., 2012; Bolch et al., 2017; Brun et al., 2017; Shean et al., 2020; Nie et al., 2021). The spatially heterogeneous distribution and changes of glaciers are primarily explained as a result of differences in the dominant precipitation-bearing atmospheric circulation patterns that include the winter westerlies and the Indian summer monsoon, their changing trends, and their interactions with local extreme topography (Yao et al., 2012; Azam et al., 2021; Nie et al., 2021).
Both Landsat and Sentinel-2 images have been employed to map glacial lakes between 1990 and 2020 in the CPEC (Fig. 2). A total number of 71 Landsat Thematic Mapper (TM), Thematic Mapper Plus (ETM+), and Landsat 8 Operational Land Imager (OLI) images with a consistent spatial resolution of 30 m were downloaded from the United States Geological Survey Global Visualization Viewer (GloVis, https://glovis.usgs.gov/, last access: 20 December 2021) to be used to create glacial lake inventories in 1990, 2000, and 2020. High-quality Landsat 5 images around 2010 are insufficient to cover the entire study area, so we were unable to map lakes in 2010 due to Landsat 7's scan-line corrector errors and significant cloud covers. In addition, 39 Sentinel-2 images (23 scenes in 2020) were downloaded from Copernicus Open Access Hub (https://scihub.copernicus.eu/, last access: 8 December 2021) to produce the 10 m resolution glacial lake inventory in 2020. All images used in this study have been orthorectified before download, but we still find that one Sentinel-2 image was not well matched with Landsat images, leading to the discrepancy between the two glacial lake datasets. We manually georeferenced the shifted image to minimize the difference between Sentinel- and Landsat-derived glacial lakes.
Cloud and snow covers heavily affect the usability of optical satellite images (Wulder et al., 2019) and their availability in the entire study area, so we took advantage of the images acquired before and after each of the baseline years – 1990, 2000, and 2020 – to construct the glacial lake inventories. Only 4 images in 1990 (the largest covering the study area), 16 images in 2000, and 23 images in 2020 were used for matching baseline year. Spatially, high-quality images in given baseline years were preferentially chosen, or we selected one or more alternative images acquired in adjacent years to delineate glacial lakes by removing the effect of cloud and snow covers. To minimize the impact of intra-annual changes on glacial lakes, most of the used images (82 % for Sentinel-2 and 75 % for Landsat) were acquired from August to October in the given baseline year with cloud coverage of <20 % for each image. For some specific scenes where cloud cover exceeded the threshold of 20 %, we selected more than one image to remedy the effect of cloud contamination (Nie et al., 2010, 2017; Jiang et al., 2018).
Other datasets used include the Randolph Glacier Inventory (RGI) version 6.0 (Pfeffer et al., 2014; RGI Consortium, 2017) and the Glacier Area Mapping for Discharge from the Asian Mountains (GAMDAM) glacier inventory (Sakai, 2019). These two glacier datasets were used to determine glacial lake types, such as ice-contact, ice-dammed, and unconnected-glacier-fed lakes. The Shuttle Radar Topography Mission Digital Elevation Model (SRTM DEM), at a 1 arcsec (30 m) resolution (Jarvis et al., 2008), was employed to extract the altitudinal characteristics of the glacial lakes. The absolute vertical accuracy of the SRTM DEM is 16 m (90 %) (Rabus et al., 2003; Farr et al., 2007). We also applied other published glacial lake datasets for comparative analysis. They include the glacial lake inventories of HMA in 1990 and 2018, downloaded from https://doi.org/10.12072/casnw.064.2019.db (Wang et al., 2021); the Third Pole region in 1990, 2000, and 2010, publicly shared at http://en.tpedatabase.cn/ (last access: 8 August 2019) (Zhang, 2018); the Tibetan Plateau from 2008 to 2017, accessed at https://doi.org/10.5281/zenodo.4275164 (Chen et al., 2020); and the entire world in 1990, 2000, and 2015, provided at https://doi.org/10.5067/UO20NYM3YQB4 (Shugar et al., 2020b). In addition, field survey data collected between 2017 and 2018 were also used to assist in lake mapping and glacial lake type classification.
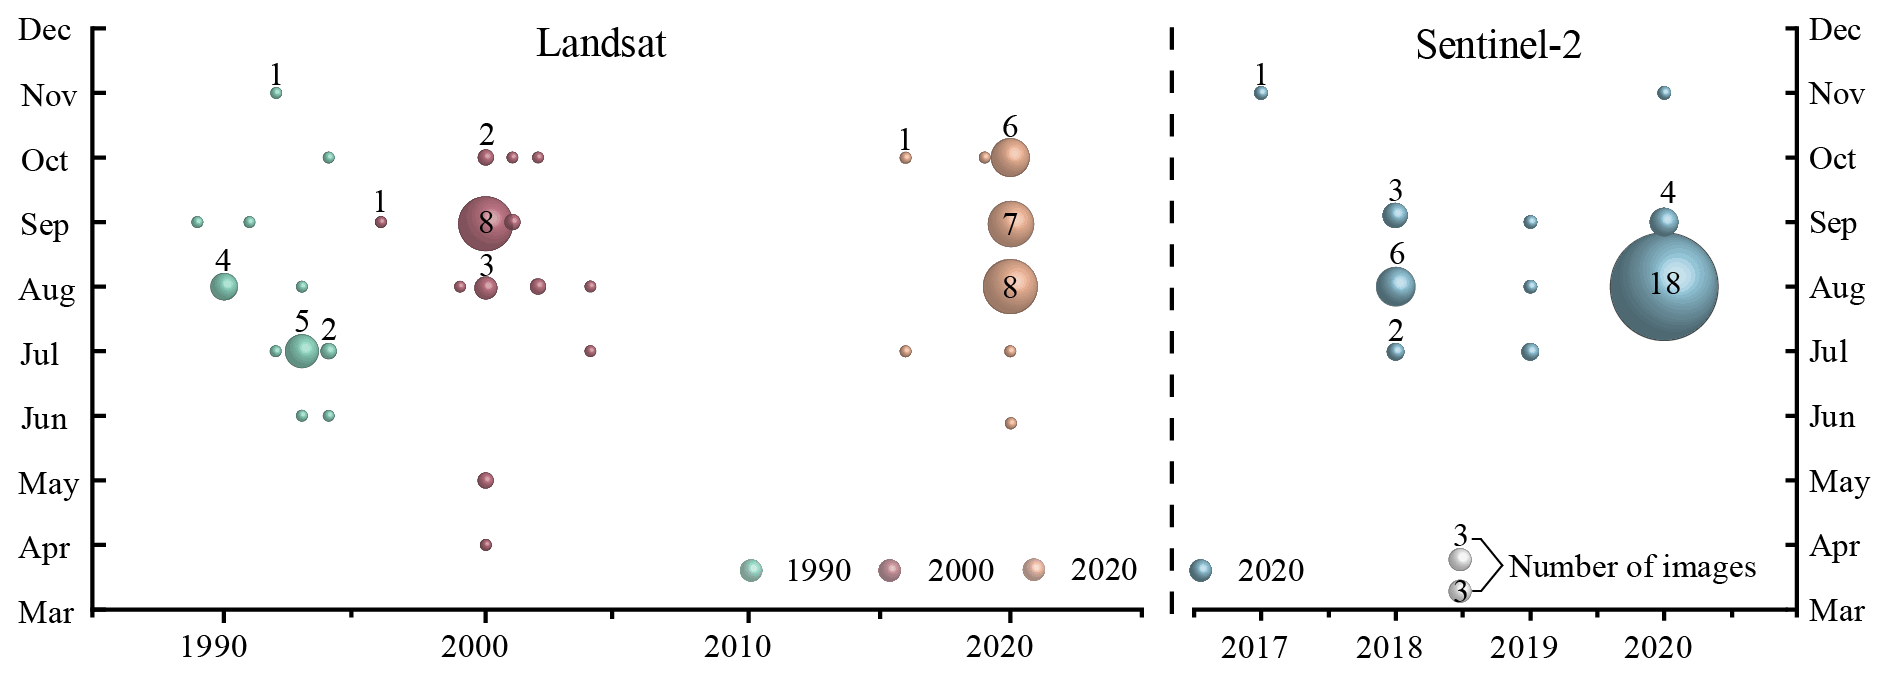
Figure 2Acquisition of years and months of Landsat and Sentinel-2 images selected for glacial lake inventories. The bubble size indicates the available high-quality image number.
4.1 Definition of glacial lakes
We consider a glacial lake as one that formed as a result of modern or ancient glaciation. Contemporary glacial lakes are easily recognized using a combination of glacier inventories and remote sensing images. Ancient glacial lakes can be identified from periglacial geomorphological characteristics, including moraine remnants and U-shaped valleys that are discernible from satellite observations (Post and Mayo, 1971; Westoby et al., 2014; Nie et al., 2018; Martín et al., 2021). A 10 km buffering distance of RGI 6.0 glacier boundaries that has been widely used in previous studies (Zhang et al., 2015; Wang et al., 2020) was created to help map glacial lakes. A few glacial lakes in the study area (a total of 84 lakes for the Sentinel-2 dataset and 55 lakes for the Landsat dataset in 2020) beyond the buffering zone, located near buffering boundaries, were intentionally included due to clear evidence of glaciation (Fig. 3). Landslide-dammed lakes (Chen et al., 2017) in the buffering zone were excluded from our inventories because of their irrelevance to glaciation. All glacial lakes in the study area were mapped according to our definition. We were able to implement this definition by carefully leveraging the spectral properties of glacial lakes and the periglacial geomorphological features that are often evident in remote sensing images (see more in Sect. 4.3 and 4.4).
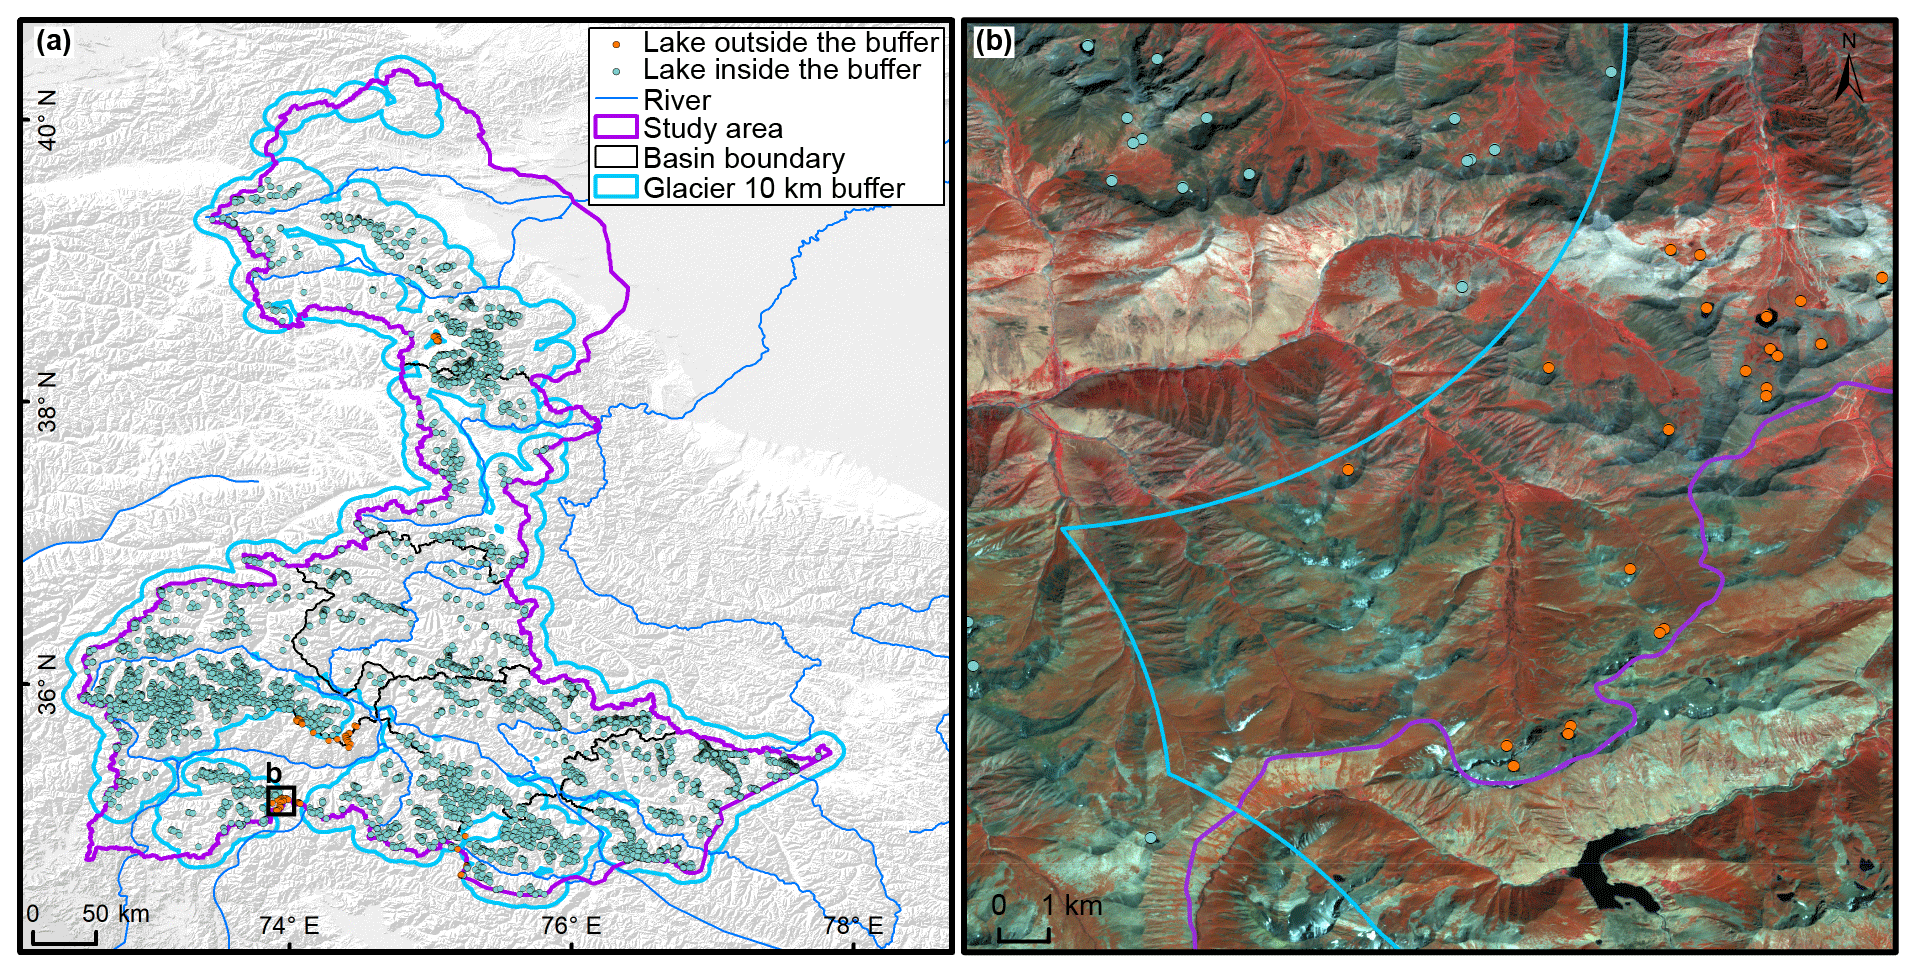
Figure 3The 10 km buffer zone of RGI 6.0 glacier boundaries (a) and Sentinel-derived glacial lakes located near buffering boundary within the study area (b).
4.2 Interactive lake mapping
A human-interactive and semi-automated lake mapping method (Wang et al., 2014; Nie et al., 2017, 2020) was adopted to accurately extract glacial lake extents using Landsat and Sentinel-2 images, based on the Normalized Difference Water Index (NDWI) (Mcfeeters, 1996). The NDWI uses the green and near-infrared bands and is calculated using the following equation:
where the green band and near-infrared band were provided by both Landsat and Sentinel multispectral images.
Specifically, the method calculated the NDWI histogram based on the pixels with each user-defined and manually drawn region of interest. The NDWI threshold that separates the lake surface from the land was interactively determined by screening the NDWI histogram against the lake region in the imagery (Wang et al., 2014; Nie et al., 2020). This way, the determined NDWI threshold can be well-tuned to adapt to various spectral conditions of the studied glacial lakes. The raster lake extents segmented by the thresholds were then automatically converted to vector polygons. We first completed the glacial lake inventory in 2020 using this interactive mapping method, and the 2020 inventory was then used as a reference to facilitate the lake mapping for other periods.
The minimum mapping unit (MMU) was set to 5 pixels for both Landsat (0.0045 km2) and Sentinel-2 images (0.0005 km2) in this study. The MMU determines the total number and area of glacial lakes in the dataset and varies in the previous studies, such as 3 pixels (Zhang et al., 2015), 6 pixels (Wang et al., 2020), or 9 pixels (Chen et al., 2021) for a regional scale or 55 pixels (Shugar et al., 2020a) for a global scale. While a smaller threshold leads to a large number of lakes mapped, it also generates larger mapping noises or uncertainties. Considering this signal–noise balance and our focus on identifying prominent glacier–lake dynamics in the study area, we opted to use 5 pixels as the MMU for both Landsat and Sentinel-2 images.
Several procedures were taken to assure the quality assurance and quality control for lake mapping, including (1) visual inspection and modification using the threshold-based mapping method for each lake according to Landsat and Sentinel-2 images and Google Earth at a finer scale overlaying preliminarily lake boundary extraction at the given period; (2) time series check for Landsat-derived glacial lake datasets from 1990 and 2020 and cross-check between Landsat- and Sentinel-2-derived lake datasets in 2020 to reduce errors of omission and commission; (3) topological validation of glacial lake mapping, such as repeated removal and elimination of small sliver polygons; and (4) logical check for lake types between two classification systems of glacial lakes. False lake extents resulting from cloud or snow cover, lake ice, and topographic shadows (Nie et al., 2017, 2020) were modified using the previous semi-automated mapping method based on alternative images acquired in adjacent years. Those procedures were time-consuming but helped to minimize the effect of cloud and snow covers, and lake mapping errors, and to maximize the quality of the produced lake product and the derived glacial lake changes.
4.3 Classification of glacial lakes
Two glacial lake classification systems (GLCSs) have been established based on the relationship of the interaction between glacial lakes and glaciers, as well as lake formation mechanism and dam material properties. In the first GLCS (GLCS1), glacial lakes were classified into four types based on their spatial relationship to upstream glaciers: supraglacial, ice-contact, unconnected-glacier-fed lakes, and non-glacier-fed lakes according to Gardelle et al. (2011) and Carrivick et al. (2013). Alternatively, by combining the formation mechanism of glacial lakes and the properties of natural dam features, glacial lakes were classified into five categories (herein named GLCS2) modified from Yao's classification system (2018): supraglacial, end-moraine-dammed, lateral-moraine-dammed, glacial-erosion lakes, and ice-dammed lakes. Subglacial lakes were excluded due to the mapping challenge from spectral satellite images alone. Characterization and examples of each type are provided in Tables 1 and 2. Individual glacial lakes were categorized into the specific types for each GLCS according to available glacier inventory data, and geomorphological and spectral characteristics were interpreted from Landsat and Sentinel images and Google Earth. The synergy of these two GLCSs is beneficial to predicting glacier–lake evolutions and providing fundamental data for water resource and glacial lake disaster risk assessment.
Table 1A classification system of glacial lake types (GLCS1) according to the relationship between glacial lakes and glaciers (© Google Earth 2019). Glacier outlines are from RGI 6.0 (RGI Consortium, 2017), and the yellow marker represents the target lake.
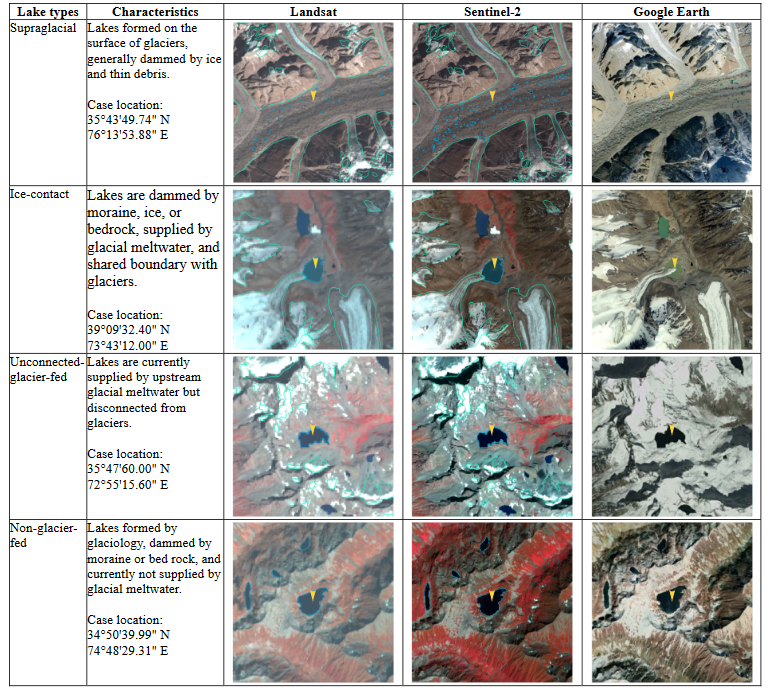
Table 2A classification system of glacial lake types (GLCS2) according to the formation mechanism of glacial lakes and dam material properties (© Google Earth 2019). The glacier outlines from RGI 6.0 (RGI Consortium, 2017), and the yellow marker represents the target lake.
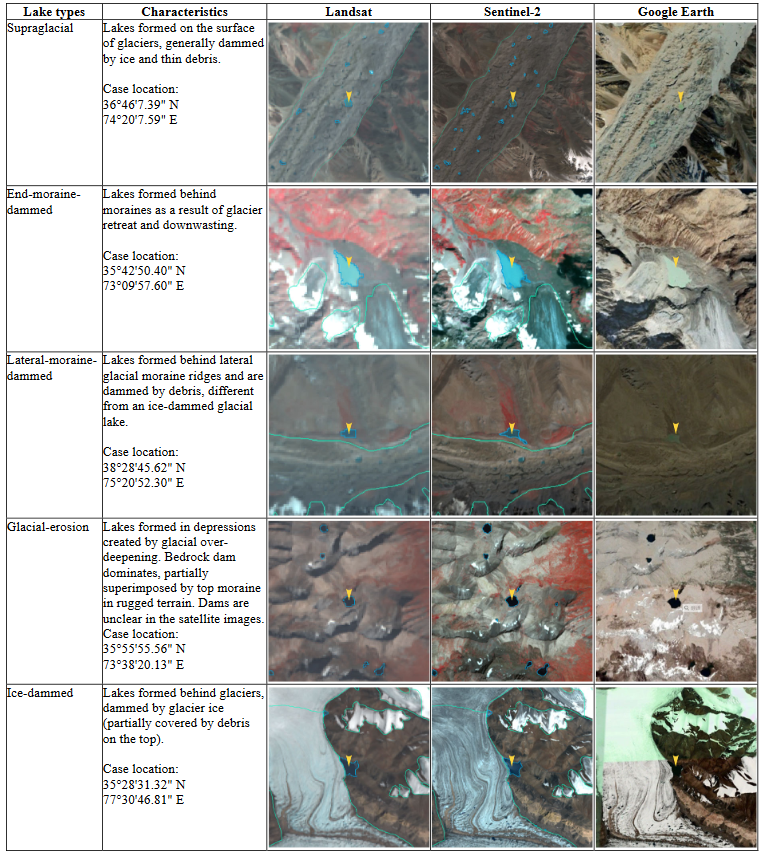

Figure 4Sketch estimating the actual edge pixels for uncertainty calculation of individual glacial lakes (with a and without islands b).
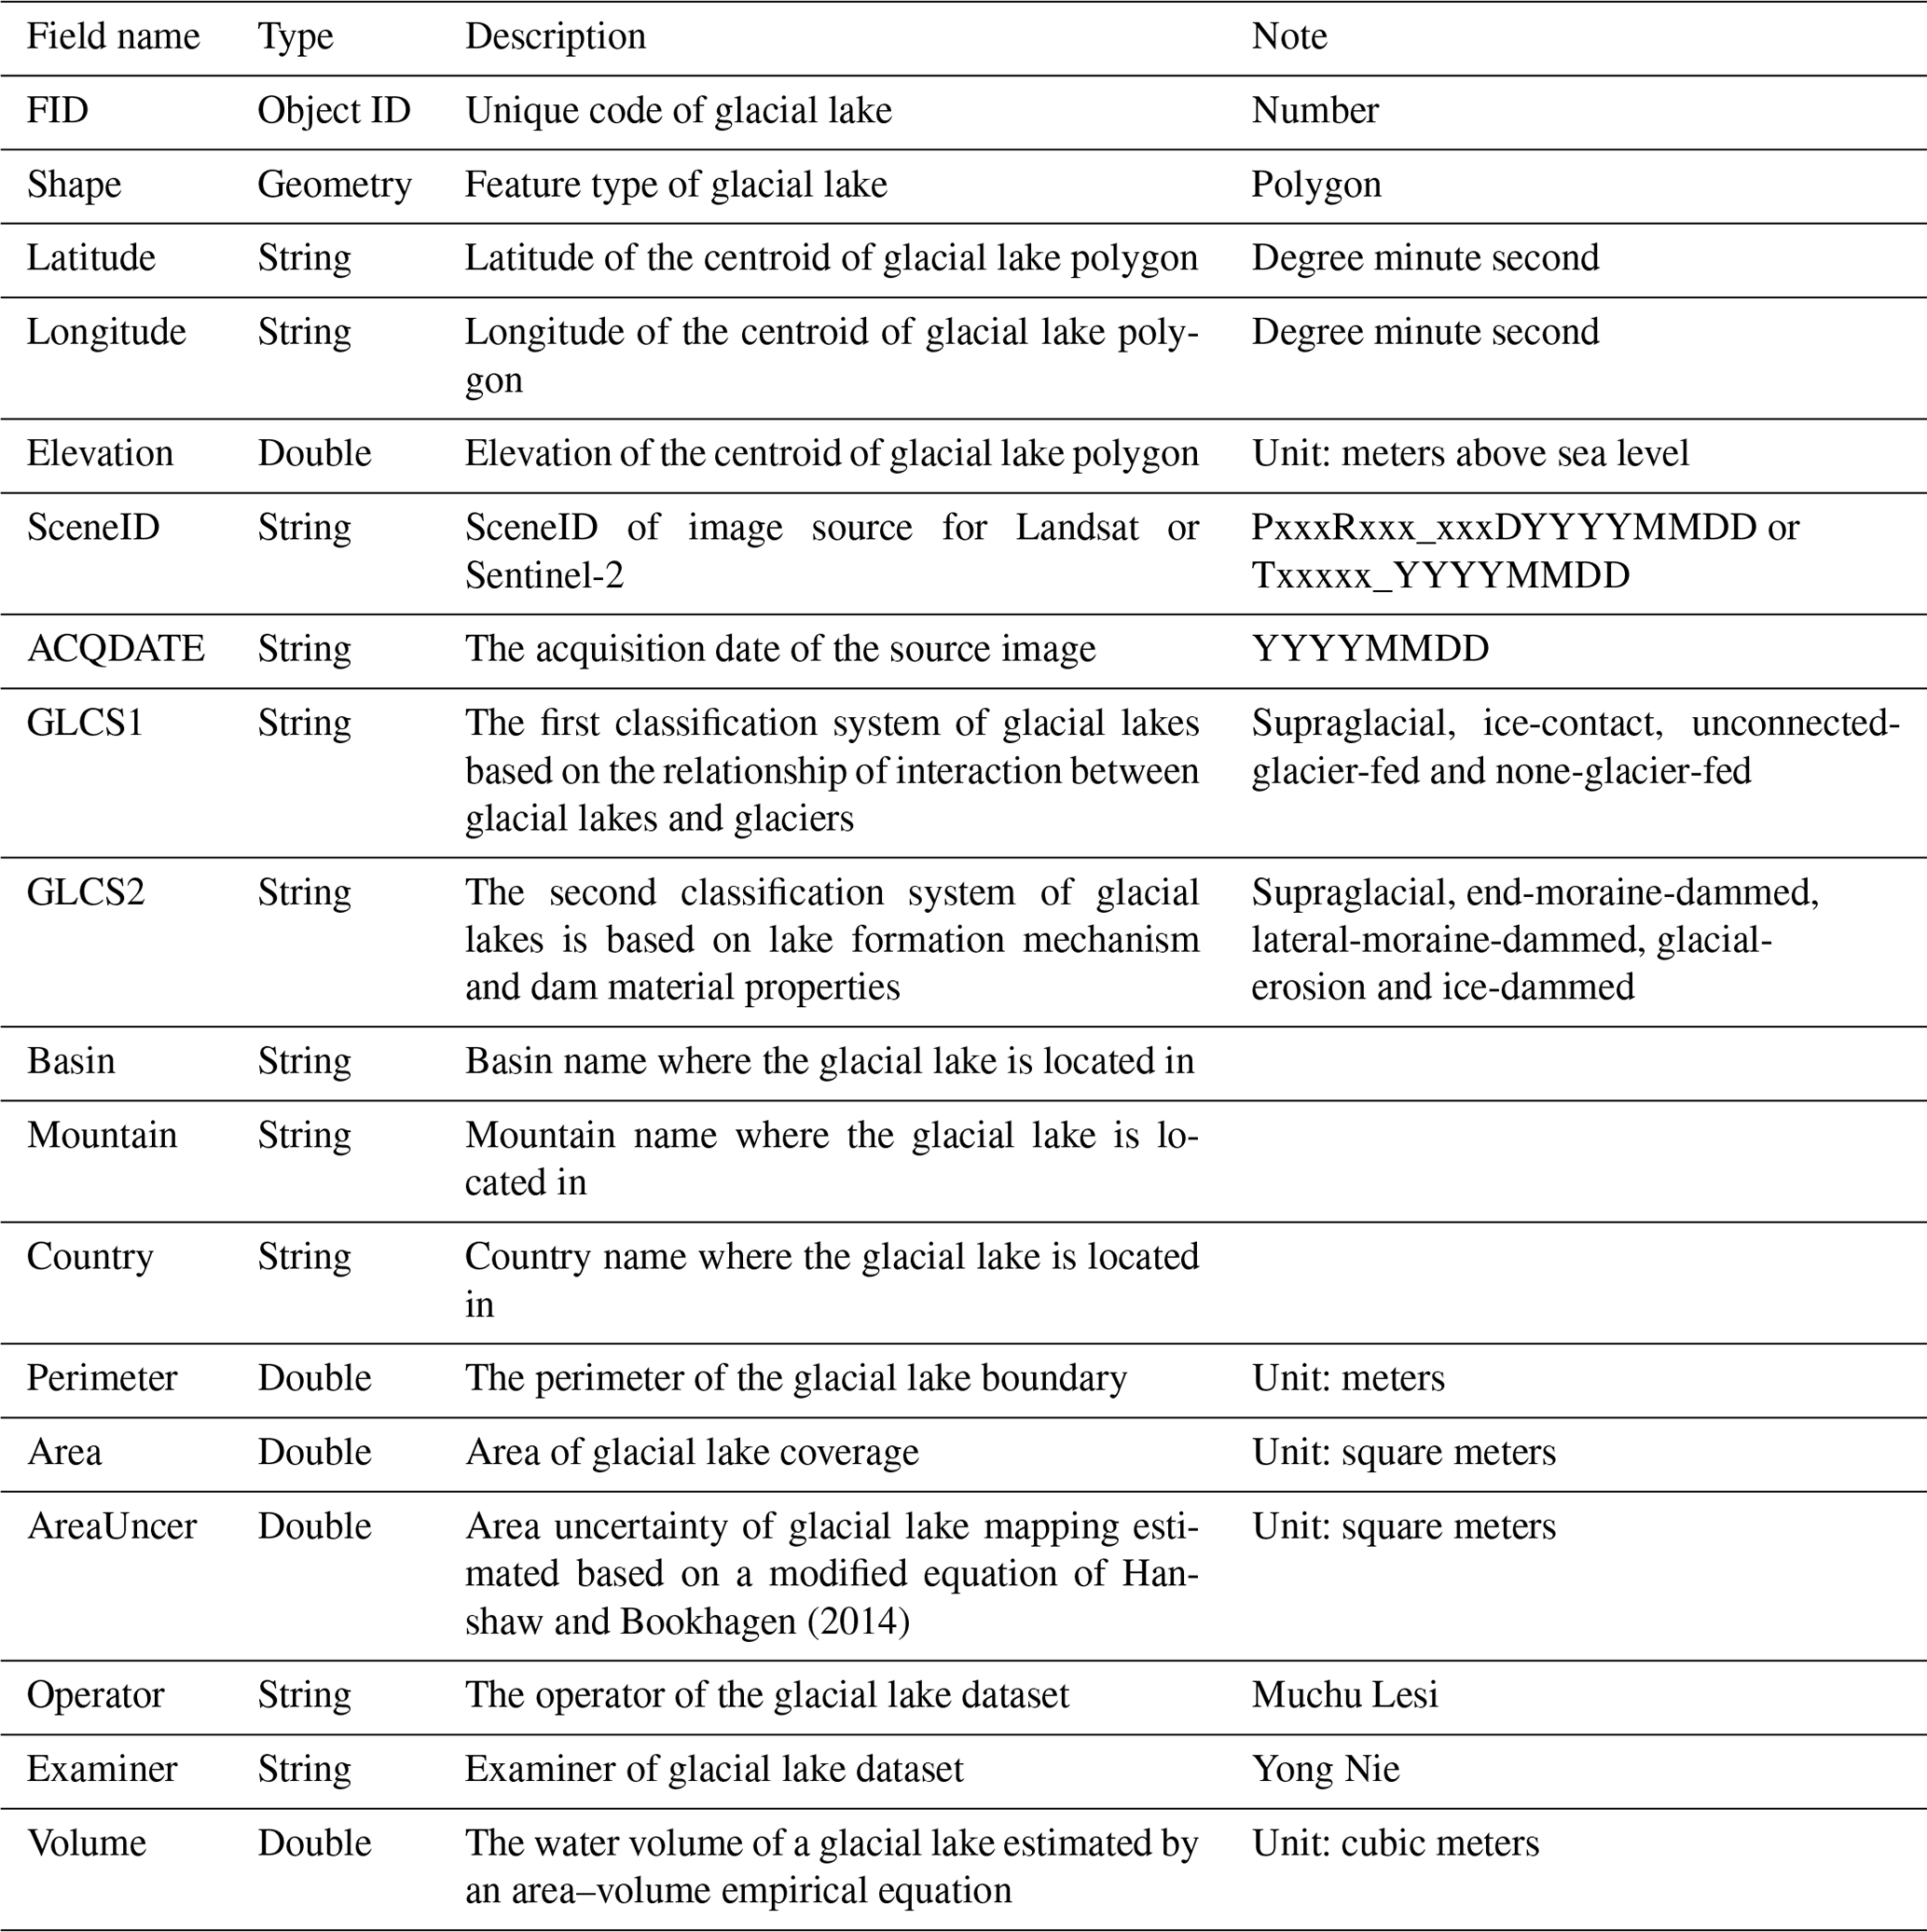
4.4 Attributes of glacial lake data
A total of 18 attribute fields were input into our glacial lake datasets (Table 3). They include lake location (longitude and latitude), lake elevation (centroid elevation), orbital number of the image source, image acquisition date, lake area, lake perimeter, lake types of the two GLCSs, mapping uncertainty, lake water volume and the country, sub-basin, and mountain range associated with the lake. Among the attributes, lake location was calculated based on the centroid of each glacial lake polygon associated with the DEM; N represents northing and E represents easting. The orbital number of the image source was filled with the corresponding satellite image, with the codes expressed as “PxxxRxxx” or “Txxxxx”, where P and R indicate the path and row for Landsat image and T represents the tile of Sentinel-2 image associated with five-digit code of the military grid reference system. SceneID indicated identifying information of the image source for Landsat or Sentinel-2, consisting of the orbital number, sensor ID, and acquisition date (YYYYMMDD) for Landsat image or the orbital number and acquisition date (YYYYMMDD) for Sentinel-2 image. Area and perimeter were automatically calculated based on glacial lake extents. Lake water volume was estimated by an area–volume empirical equation (Cook and Quincey, 2015). Lake types were attributed using the characterization and interpretation marks described in Sect. 4.3. Mapping uncertainty was estimated using our modified equation which will be introduced in Sect. 4.5 and the Appendix tutorial. The located country, sub-basin, and mountain range of each glacial lake were identified by overlapping the geographic boundaries of countries, basins, and mountain ranges.
4.5 Error and uncertainty assessment
4.5.1 Improved uncertainty estimating method
We modified the equation of Hanshaw and Bookhagen (2014) that had been used to calculate lake area mapping uncertainty. Lake perimeter and displacement error are widely used to estimate the uncertainty of glacier and lake mapping from satellite observation (Carrivick and Quincey, 2014; Hanshaw and Bookhagen, 2014; Wang et al., 2020). Hanshaw and Bookhagen (2014) proposed an equation to calculate the error of area measurement by the number of edge pixels of the lake boundary multiplied by half of a single pixel area. The number of edge pixels is simply calculated by the perimeter divided by the grid size. The equation is expressed below:
where G is the cell size of the remote sensing imagery (10 m for Sentinel-2 image and 30 m for Landsat image). P is the perimeter of individual glacial lake (m), and the coefficient of 0.6872 (1σ), which means nearly 69 % of the edge pixels are subject to errors (Hanshaw and Bookhagen, 2014), was chosen assuming that area measurement errors follow a Gaussian distribution. Relative error (D) was calculated by Eq. (3), in which A is the area of an individual glacial lake.
In the original Eq. (2), the number of edge pixels varies by the shape of the lake and is indicated by . However, the pixels in the corner are double-counted (Fig. 4). The total number of repeatedly calculated edge pixels equals the number of inner nodes. Therefore, we adjusted the calculation of the actual number of edge pixels as the maximum of edge pixels () subtracting the number of inner nodes. Accordingly, the equation of uncertainty estimation for lake mapping is modified as below:
where NInner is the number of inner nodes (inflection points) of each lake. The modified equation is also suitable for lakes with islands (as illustrated in Fig. 4b).
For polygons without islands (Fig. 4a), use the following equation:
NTotal is the total number of nodes, including both the outer and inner. NTotal is calculated using the “Field Calculator” in ArcGIS; in some cases, it is necessary to remove the redundant nodes before calculating the total number of nodes (see the Appendix for more details). An inner node is a polygon vertex where the interior angle surrounding it is greater than 180∘. An outer node is the opposite of the inner node, where the interior angle is less than 180∘. We found that the outer nodes are usually four more than the inner nodes in our glacial lake dataset. The total nodes in ArcGIS contain one overlapping node to close the polygon, meaning the endpoint is also the start point. This extra count was deleted from the calculation (Eq. 5).
For polygons with an island (Fig. 4b), use the following equation:
NIsland is the number of islands within each polygon. A calculation method of NIsland is given in the Appendix.
4.5.2 Validation of glacial lake mapping
A total of 89 glacial lakes were selected by stratified random sampling and manually digitized based on the Google Earth images circa 2020 with a spatial resolution of ∼2 m acquired from WorldView, GeoEye, Pléiades, etc. satellites (© 2022 Maxar technologies and © 2022 CNES/Airbus) to further validate the absolute error of our glacial lake products in 2020 due to lacking field measurements for glacial lakes in the study area. During the sampling, we set a minimum lake area to be 4500 m2 and a relative difference between Landsat- and Sentinel-derived lake areas of less than 18 % (nearly equaling the average relative error of ±17.36 % for Landsat lake mapping) to minimize the effect of lake changes from multi-temporal satellite observations circa 2020. The 89 sample lakes range from 0.005 to 0.802 km2 with a median (standard deviation) size of 0.047±0.134 km2 and a total area of 8.033 km2 for Landsat-derived datasets and range from 0.005 to 0.849 km2 with a median (standard deviation) size of 0.045±0.144 km2 and a total area of 8.447 km2 for Sentinel-derived datasets.
5.1 Glacial lake distribution and changes observed from Landsat
We mapped 2234 glacial lakes in 2020 across the studied CPEC from Landsat 8 images, with a total area of 86.31±14.98 km2 (Fig. 5a and b). Unconnected-glacier-fed lakes are dominant in the first classification system, followed by non-glacier-fed lakes (Fig. 6), whereas glacial-erosion lakes dominate at both number (1478) and area (57.02 km2) in the second classification system (Fig. 7), followed by end-moraine-dammed lakes and supraglacial lakes. Among the classified lakes, 137 are ice-contact lakes and cover an area of 5.56 km2, implying a higher mean size of ice-contact lakes than supraglacial lakes.
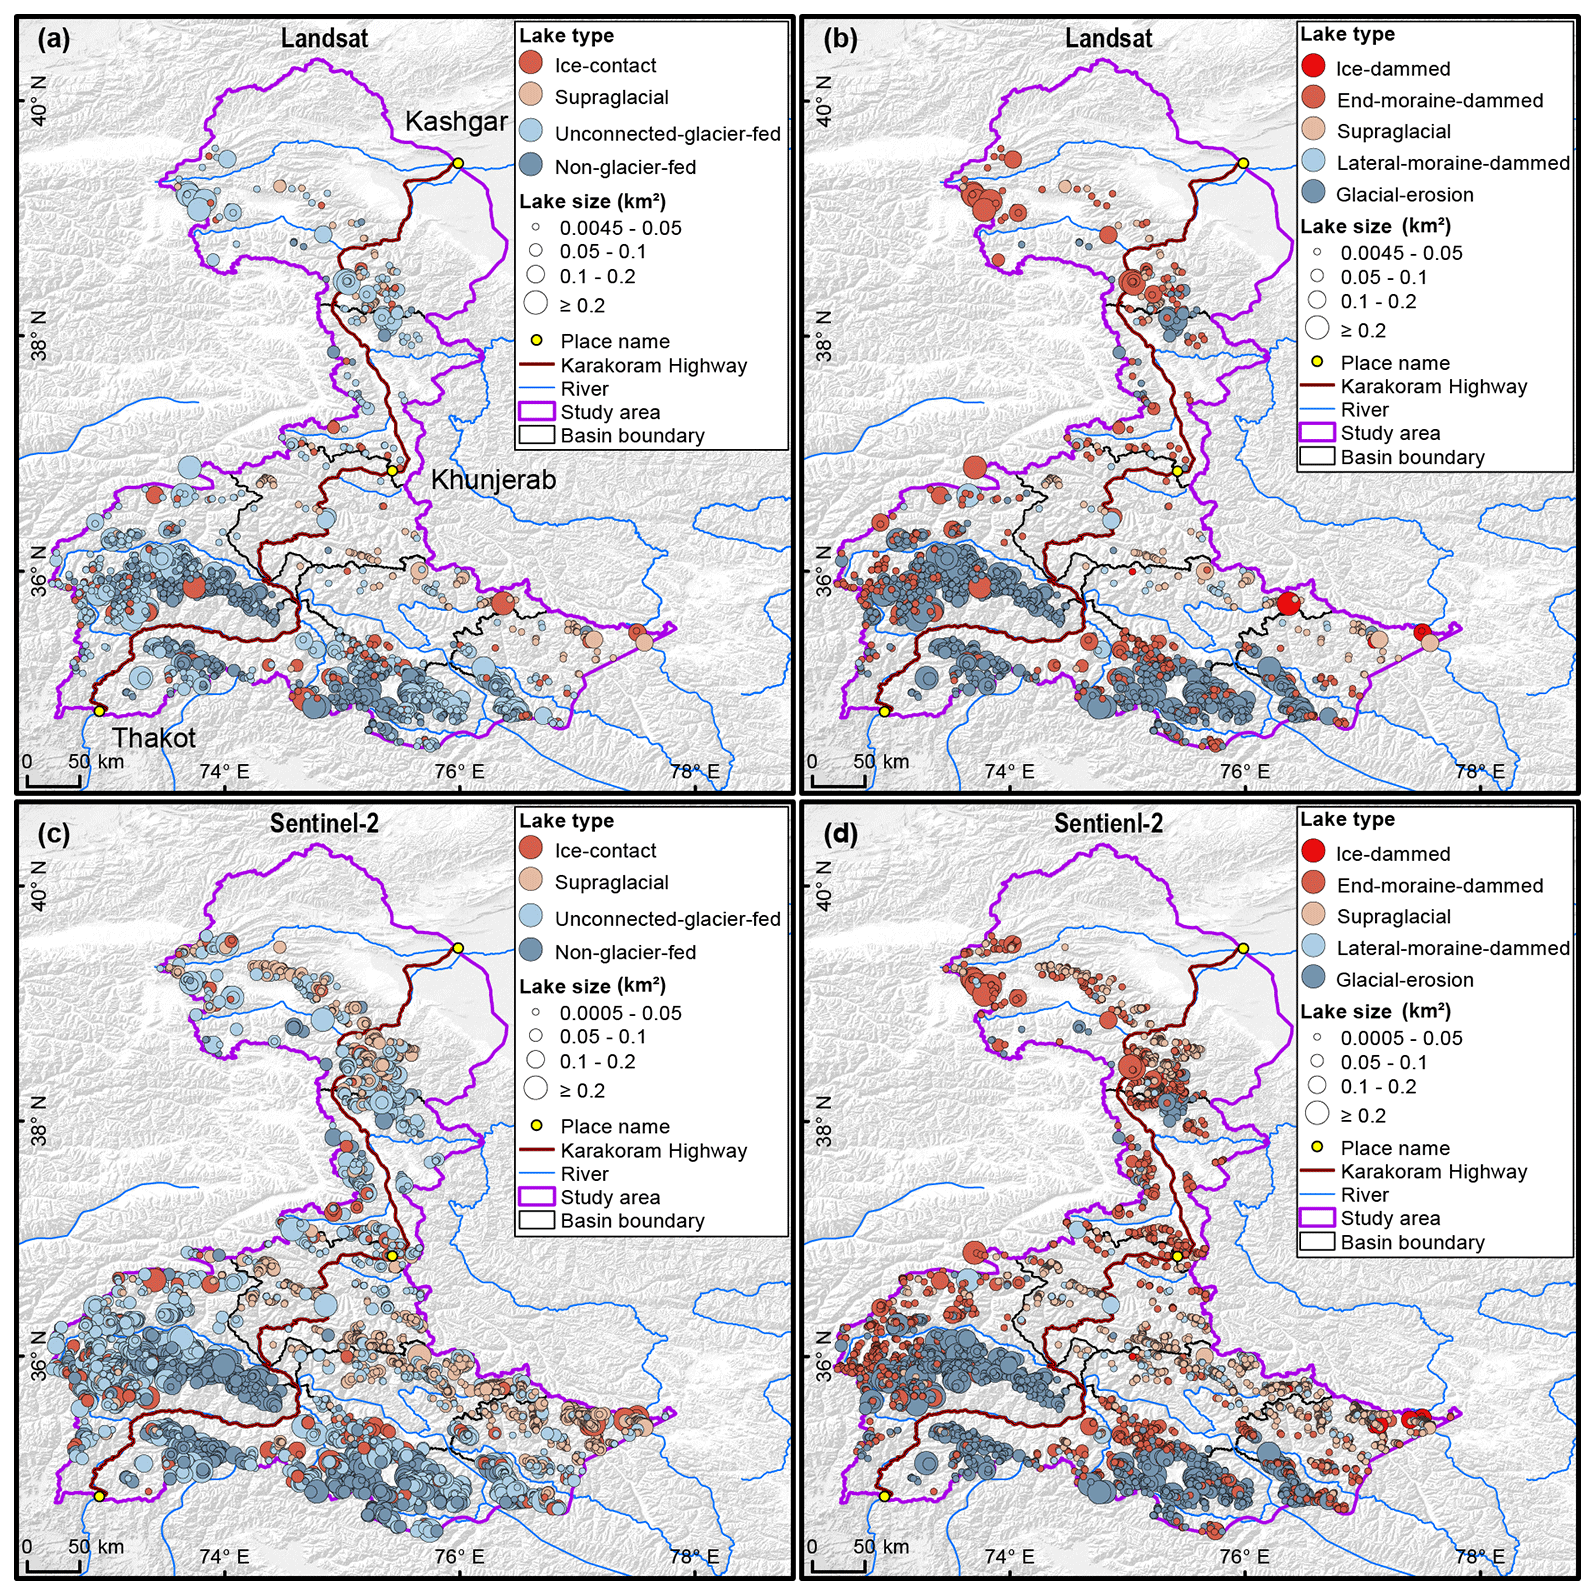
Figure 5Distribution of glacial lakes in 2020 extracted from Landsat (a, b) and Sentinel-2 (c, d) images. Panels (a) and (c) are classified by GLCS1 and GLCS2 for panels (b) and (d).
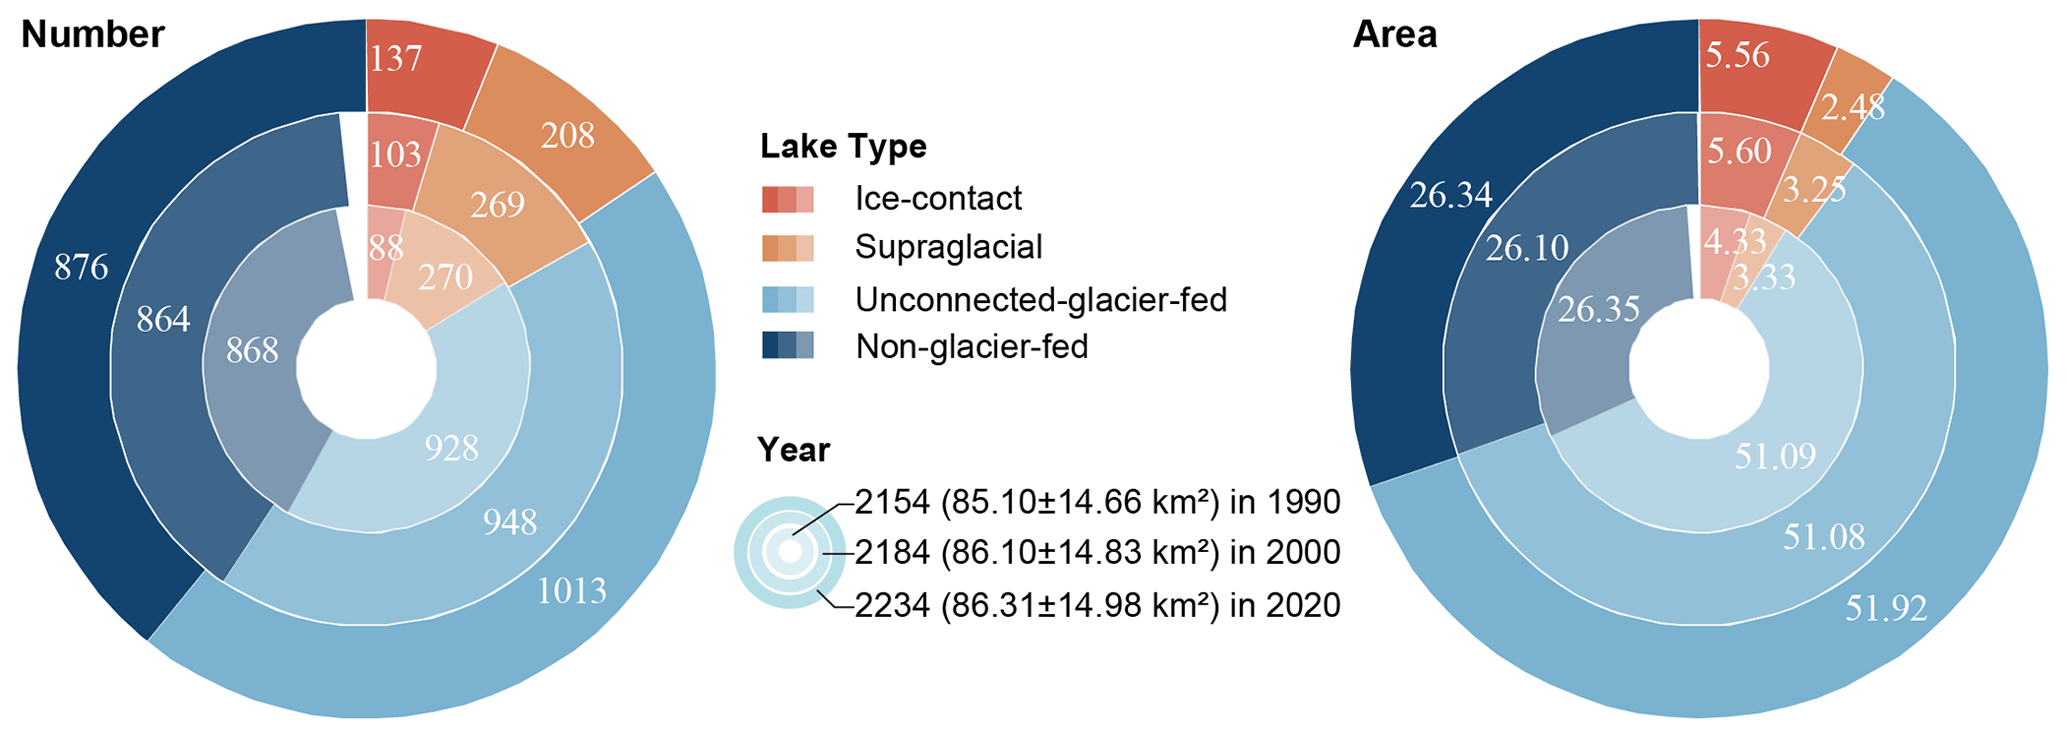
Figure 6The number and area of different types of glacial lakes are classified based on the condition of glacier supply in the study area (GLCS1). The outermost ring represents glacial lake data for 2020, the middle ring for 2000 and the innermost ring for 1990. Lake number and area in 2020 were selected as references, meaning a concept of “100 %” for a complete ring. Labeled values are scaled in degrees rather than the radius of rings.

Figure 7The number and area of different types of glacial lakes are classified based on glaciation and the nature of the dam in the study area (GLCS2). The outermost ring represents glacial lake data for 2020, the middle ring for 2000 and the innermost ring for 1990. Lake number and area in 2020 were selected as references, meaning a concept of “100 %” for a complete ring. Labeled values are scaled in degrees rather than the radius of rings.
The total number and area of glacial lakes in the study remain relatively stable with a slight increase between 1990 and 2020, and the changes in count and area among various types of glacial lakes vary substantially (Figs. 6 and 7). From 1990 to 2020, the total number of glacial lakes increased by 80 (or 3.70 %), while the area grew by 1.21 km2 (or 1.42 %). In GLCS1, unconnected-glacier-fed lakes have the largest increase in number, followed by ice-contact and non-glacier-fed lakes, whereas supraglacial lakes decreased by 62 in count. Ice-contact lakes expanded by 1.24 km2 (equaling an increase of 26 % in ice-contact lakes), contributing one-third of the total area increase. Supraglacial lakes decreased by 0.85 km2 in area, whereas the areas of unconnected-glacier-fed and non-glacier-fed lakes remained stable as a result of disconnections from glaciers (Fig. 6). In GLCS2, end-moraine-dammed lakes increased by 2.48 km2 and contributed most of the glacial lake area expansion, whereas supraglacial, ice-dammed, and lateral-moraine-dammed lakes decreased slightly in both number and area. Glacial-erosion lakes accounted for the maximum percentage (about 66 % for both count and area) in each period and remained stable (Fig. 7).
5.2 Glacial lake distribution observed from Sentinel-2
Sentinel-derived results show that there are 7560 glacial lakes (103.70±8.45 km2) in 2020 across the entire CPEC under an MMU of 5 pixels (500 m2). Compared with the Landsat-derived product, glacial lakes from Sentinel-2 have similar spatial distribution characteristics (Fig. 5); meanwhile, a larger quantity of glacial lakes, with more accurate boundaries and a greater total lake area, were generated from Sentinel-2 images (Table 4). The smallest size class (0.0005–0.0045 km2) contains the maximum lake number (4969) but the least lake area (7.73±2.62 km2), which is not available in the Landsat-derived lake data due to a coarser spatial resolution. In each size class, the overlap ratios are greater than 85 % in count and area, and there are also a higher number and larger area of glacial lakes from Sentinel images than of Landsat images. Sentinel-2 images (10 m) with a finer spatial resolution produce more glacial lakes than those from Landsat images (30 m). The discrepancy is mainly attributed to the inconsistency of spatial resolutions and image acquisition dates, as discussed in Sect. 6.2.
Table 4Count and area of glacial lakes mapped from Sentinel-2 and Landsat images in 2020 in various size classes.
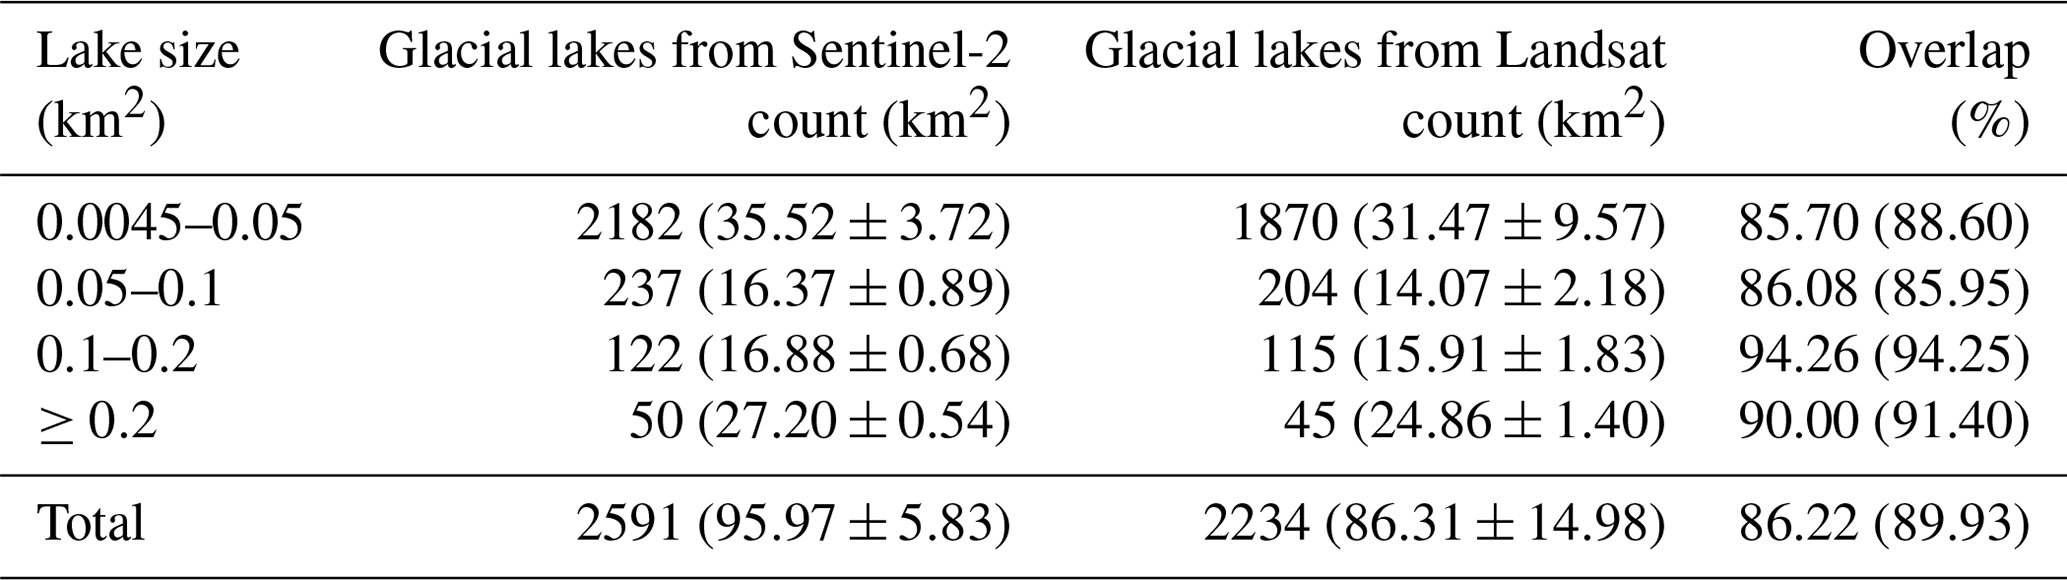
Note: second column excludes 4969 (7.73±2.62 km2) lakes in the 0.0005 to 0.0045 km2 range. Overlap (%) represents the ratios between our Landsat-derived dataset and Sentinel-derived product in count and area, respectively.
6.1 Uncertainty and error of lake mapping
The uncertainty estimated from our improved equation shows that the relative error of individual glacial lakes decreases when lake size increases or the cell size of remote sensing images reduces (Lyons et al., 2013; Carrivick and Quincey, 2014) (Fig. 8). Total area errors of glacial lakes in the study area are approximately ±14.98 and ±8.45 km2 in 2020 for Landsat and Sentinel-2 datasets, respectively, and the average relative errors are ±17.36 % and ±8.15 %. Generally, small lakes have greater relative errors. For example, the mean relative error is 35.38 % for Landsat-derived glacial lakes between 0.0045 and 0.1 km2 and 10.63 % for glacial lakes greater than 0.1 km2. The mean area error of Sentinel-derived glacial lakes is almost one-third of that extracted from Landsat images for glacial lakes of all or specific size groups. Because the relative error was estimated as a function of satellite image spatial resolution and lake perimeter, the calculated error for a large lake is proportionally smaller than that of a small lake (Salerno et al., 2012), and the error for a Landsat-derived lake is naturally greater than that of a Sentinel-derived lake in the same size group.
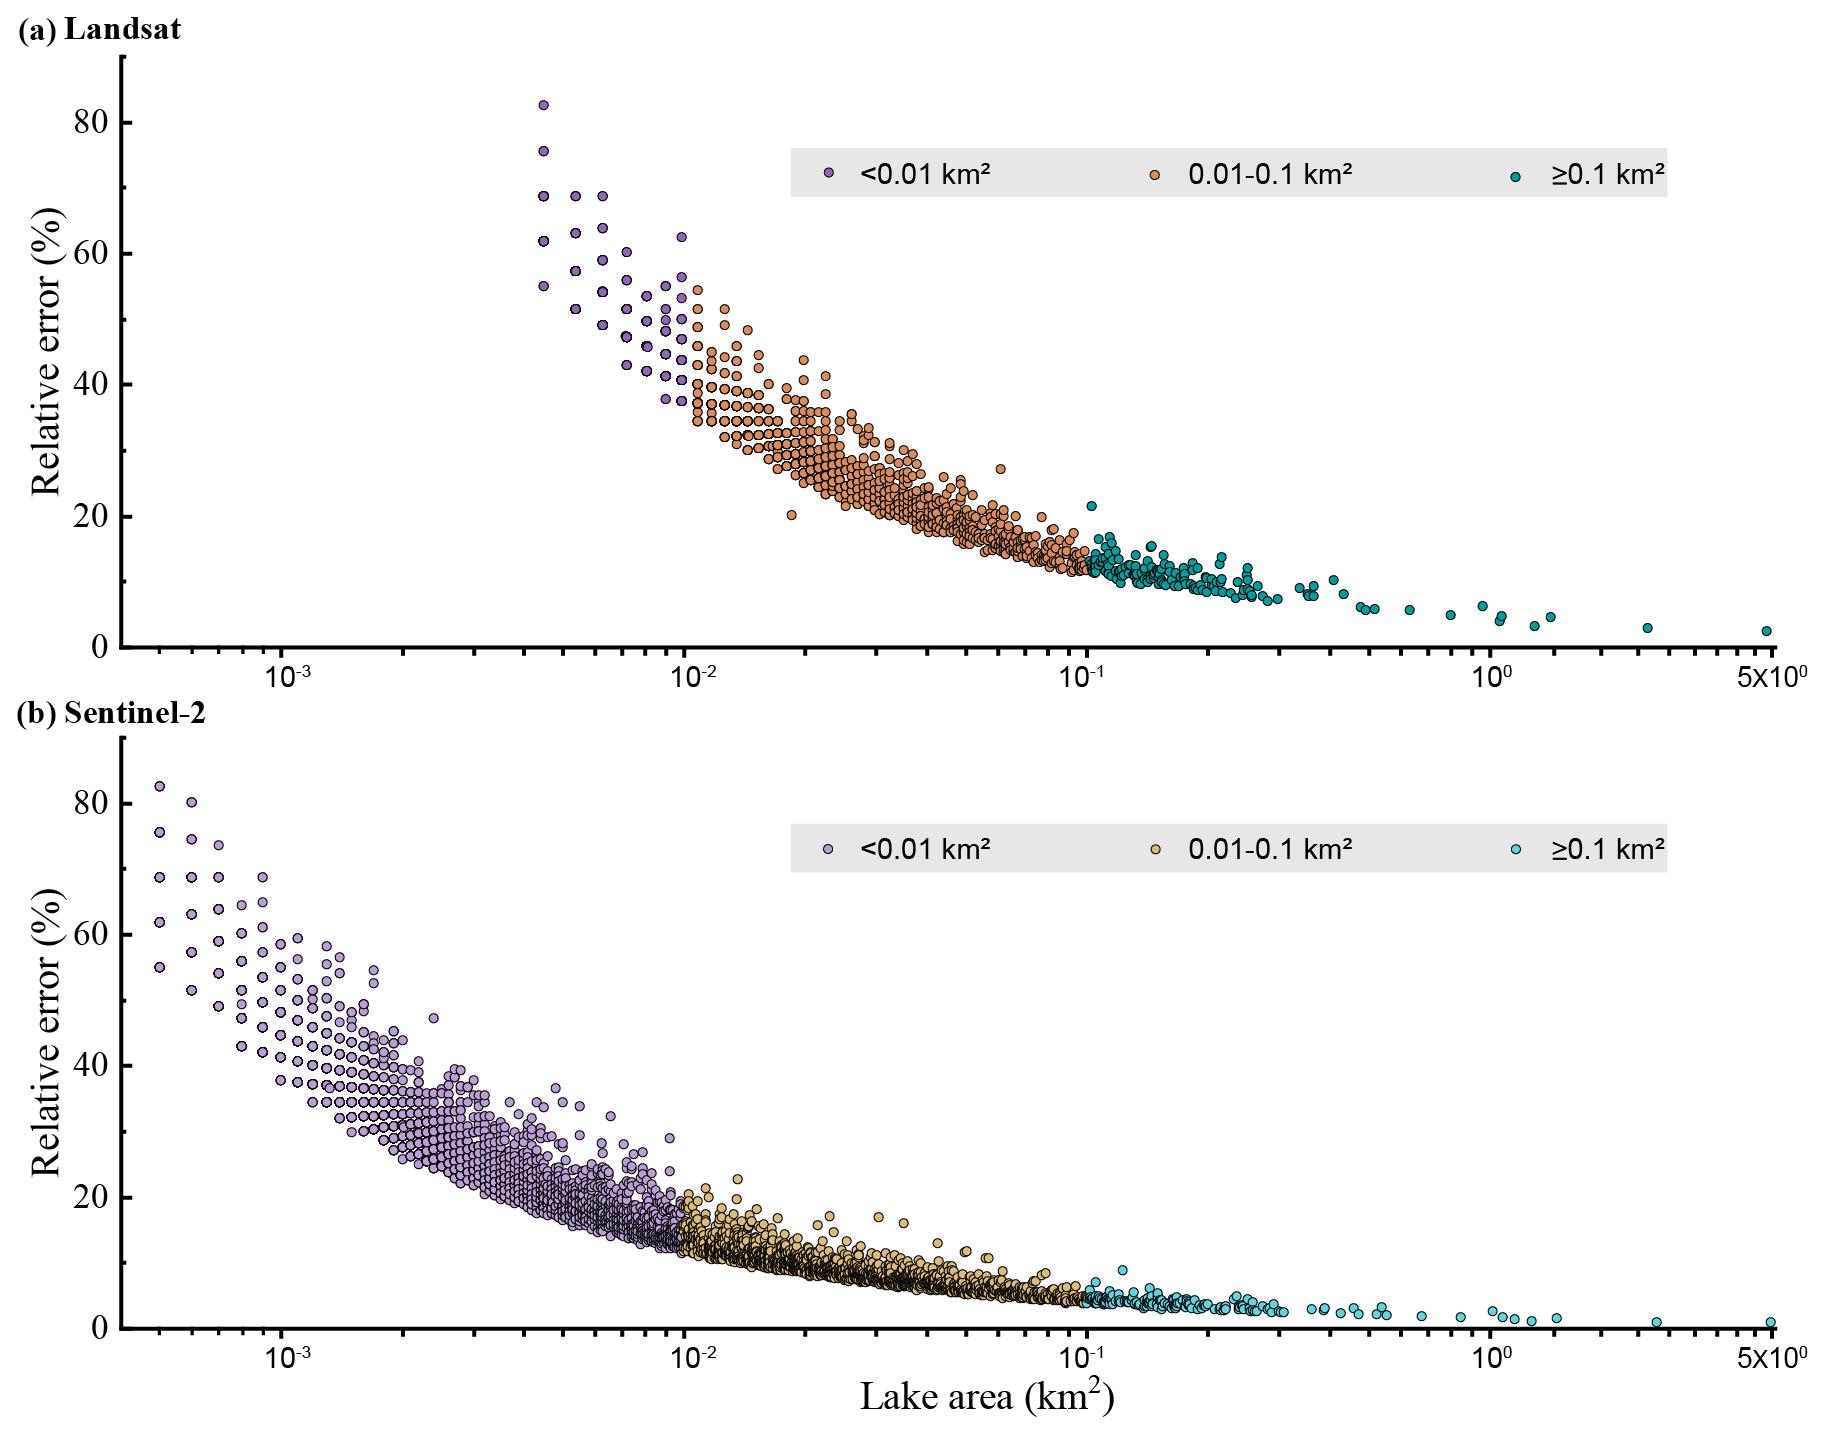
Figure 8The estimated relative error for glacial lakes of all or specific size ranges in the study area. Error estimation is based on the modified equation and lake data extracted from Landsat (a) and Sentinel-2 images (b).
Our Landsat- and Sentinel-derived glacial lake dataset match well lake boundaries in Google Earth higher-resolution images (Fig. 9). The mean difference in area is 0.005 km2 between Landsat- and Google Earth-derived lakes and 0.001 km2 between Sentinel- and Google Earth-derived lakes, and major validation samples (84/89) are within the confidence interval of 95 %, indicating high accuracy in lake mapping (Fig. 9c and d). The error of 89 sample lakes is 5.48 % of the total area for Landsat- and Google Earth-derived data and 0.61 % for Sentinel- and Google Earth-derived data. The median (± standard deviation) in a discrepancy of the individual lake area is 7.66±4.96 % for Landsat- and Google Earth-derived data and 4.46±4.62 % for Sentinel- and Google Earth-derived data. Our glacial lake dataset shows satisfactory mapping accuracy, although Sentinel-derived lake data perform more accurately than those from Landsat images. We also validated the sampling of 89 Landsat-derived lakes by the existing Landsat-extracted lake data produced by Wang et al. (2020). A total of 83 lakes are available in Wang's data with a mean difference of 0.005 km2 in the lake area (Fig. A8). This also shows an improvement in our lake product in contrast to the existing dataset.
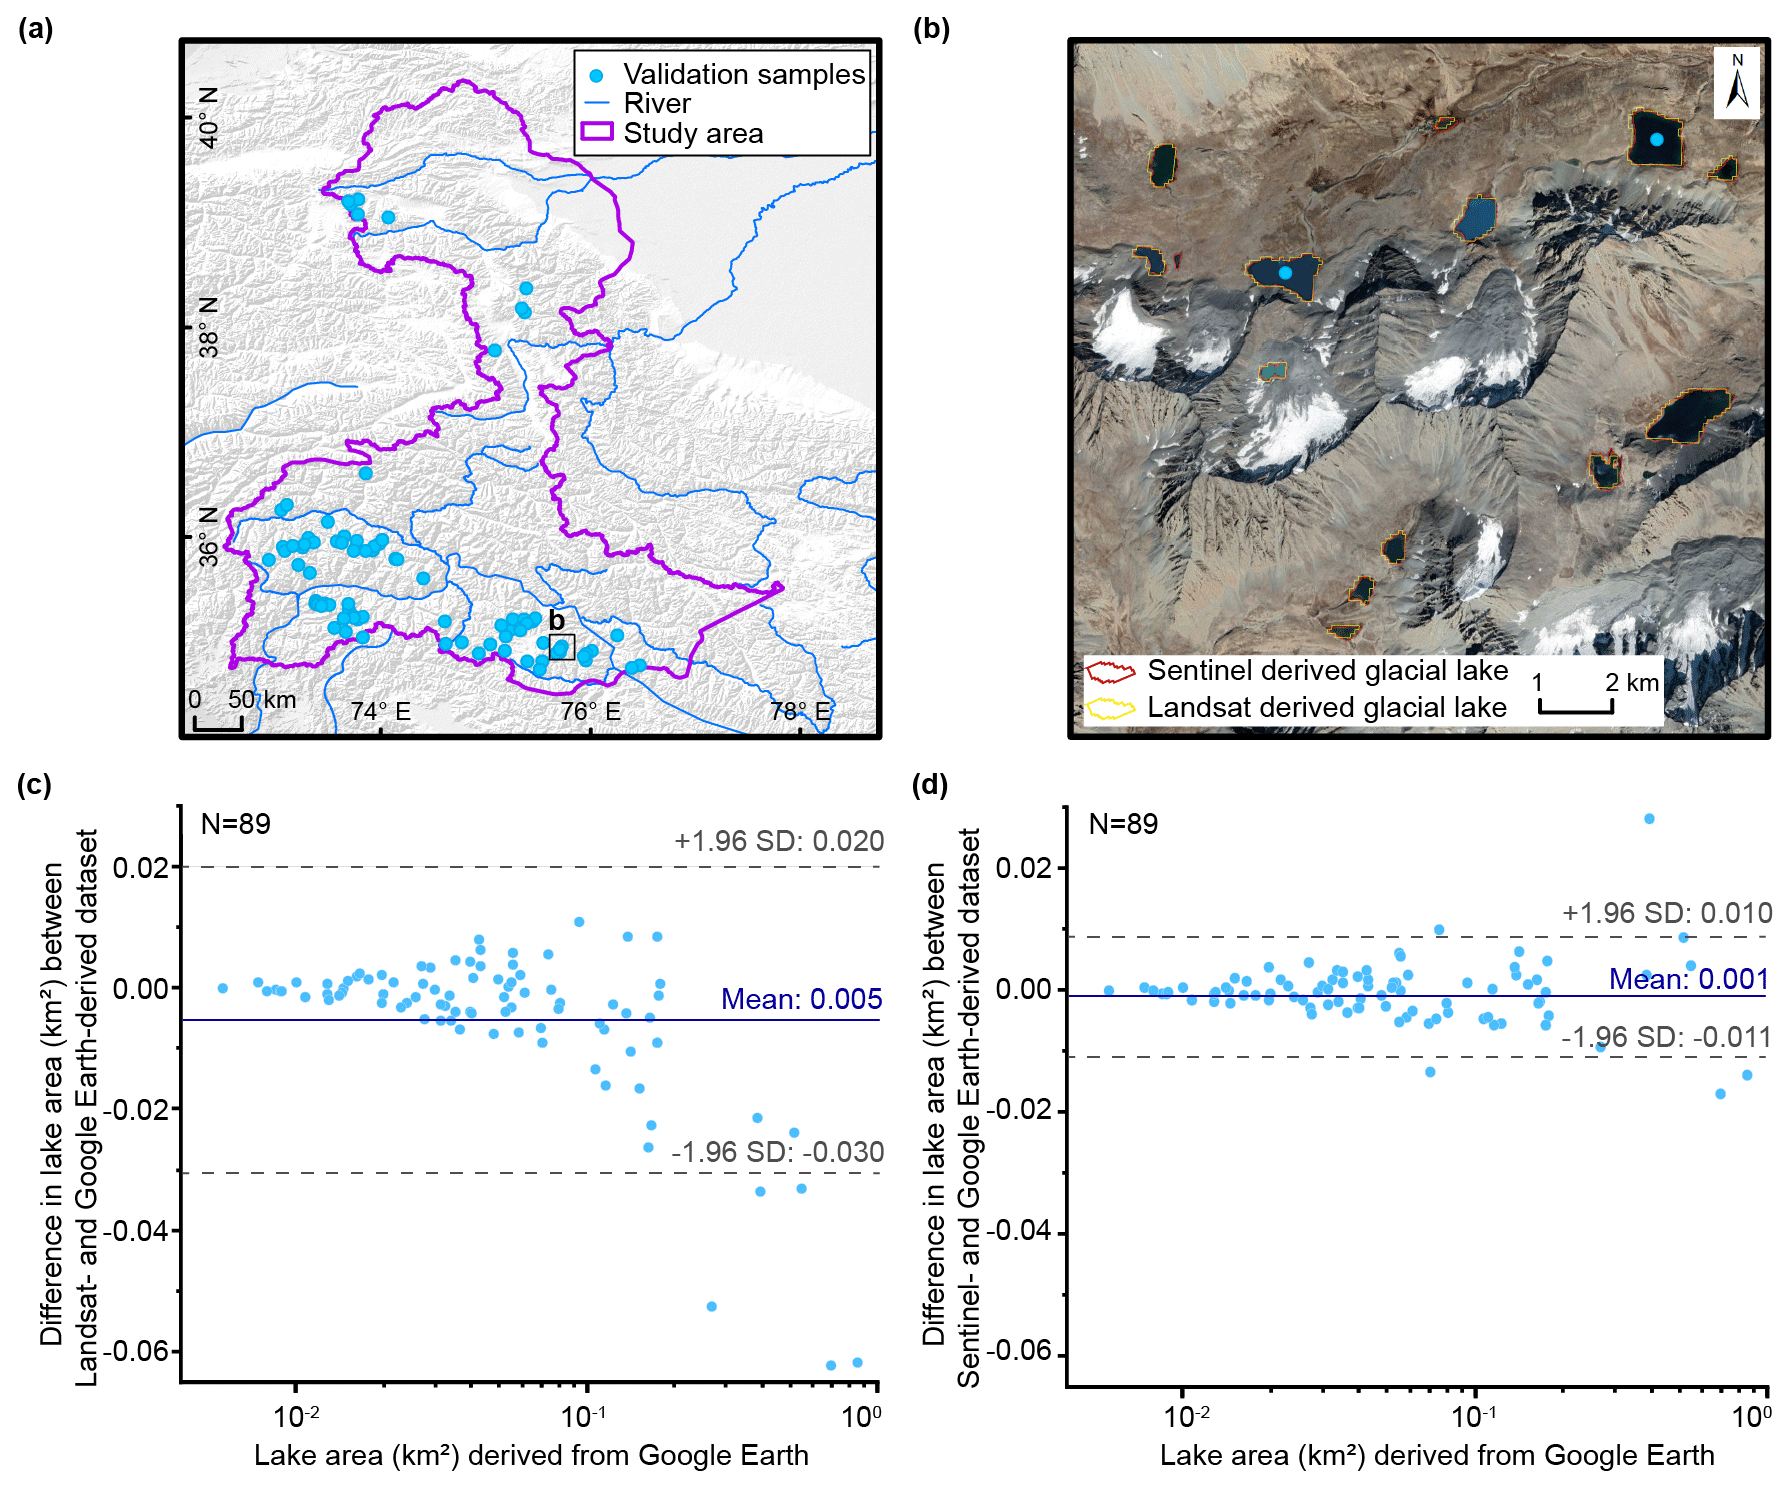
Figure 9Distribution of the validation sample (a), visual comparison of glacial lakes derived from Landsat and Sentinel-2 images overlaying Google Earth imagery (© Google Earth 2019) in a zoomed in site (b), and differences between our glacial lake product (mapped from Landsat and Sentinel-2 images) and the validation reference (digitized from Google Earth at a finer scale) (c, d).
6.2 Comparison of Sentinel- and Landsat-derived products
Glacial lakes from Landsat and Sentinel-2 images have high consistency in number and area with overlap rates from approximately 86 % to 94 % for all lakes greater than 0.0045 km2 (Table 4), indicating a good potential for coordinated utility with Landsat archived observation (Fig. 10). Lake extents extracted from Landsat and Sentinel images match well for various types and sizes (Figs. 10 and 11, Table 4). The best consistency rate reaches 94 % for the glacial lakes between 0.1 and 0.2 km2. The difference in the area of glacial lakes extracted from Landsat and Sentinel-2 images generally lies within the uncertainty ranges.
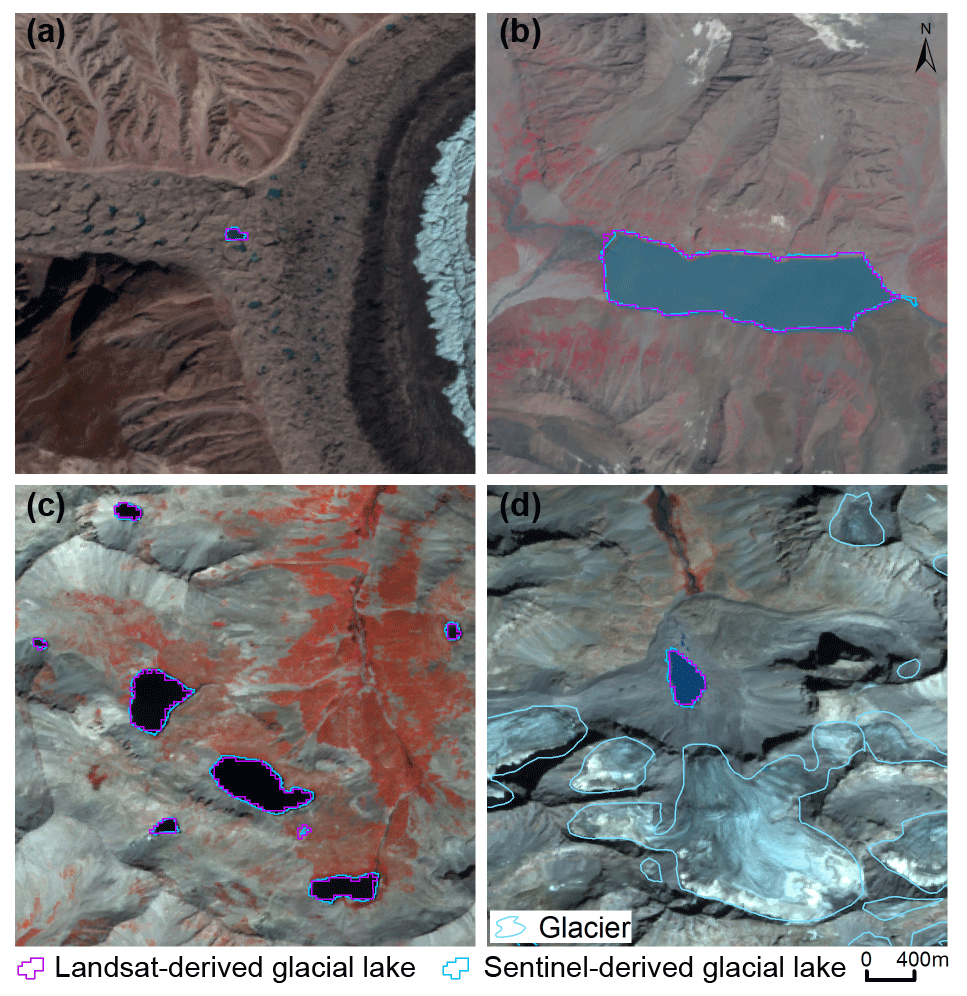
Figure 10High consistency of lake extents extracted from Landsat and Sentinel-2 images. Lake types shown include a supraglacial lake (a), a glacier-fed moraine-dammed lake (b), an unconnected glacial-erosion lake without glacier melt supply (c) and a glacier-fed moraine-dammed lake (d).
The spatial resolution of satellite images plays a primary role in the discrepancies in count and area of glacial lakes extracted from Landsat (30 m) and Sentinel-2 (10 m) observations. Due to a finer spatial resolution, Sentinel-2 images can extract more glacial lakes and more accurate extents than those from Landsat images. We set the same 5 pixels as the MMU for both Landsat and Sentinel-2 images, which corresponds to a minimum area of 0.0045 and 0.0005 km2, respectively. The minimum mapping area results in generating nearly 5000 more lakes from Sentinel-2 images than from Landsat images, causing the greatest discrepancy in number, such as Fig. 11. Small lakes such as supraglacial lakes play an important role in analyzing glacier evolution and supraglacial drainage systems (Liu and Mayer, 2015; Miles et al., 2018), implying a potential of our dataset to be applied in studies of glacier–lake evolutions. Meanwhile, Sentinel-2 images can depict boundaries of glacial lakes with lower uncertainty, as some small islands and narrow channels (Fig. 11b and c) were mapped from Sentinel-2 imagery that were unable to be detected in Landsat imagery.
In addition to the difference in image resolution, different acquisition dates between Sentinel-2 and Landsat images can also contribute to the discrepancy between those two glacial lake datasets. The total number of supraglacial lakes and ice-dammed glacial lakes are less than 300, but those lakes are controlled by glacier movement and temperature changes (Liu and Mayer, 2015; Miles et al., 2018), which vary faster with time than relatively stable glacial-erosion and moraine-dammed lakes. Acquiring same-day images from the two sensors was not always possible due to the impacts of cloud contaminations, topographic shadows, snow cover, and revisit periods (Williamson et al., 2018; Paul et al., 2020). Despite our efforts of leveraging all available high-quality images, the overlap of acquisition dates between Landsat and Sentinel-2 images for the same location is relatively low (only 7 scenes of Sentinel-2 images or 112 glacial lakes in 2020) in this study area, and the consequential temporal gaps led to a difference in the number and area of the derived glacial lakes. As exemplified in Fig. 11d, the mapped supraglacial lakes in the same location exhibit a considerable discrepancy, which is likely a joint consequence of both sensor difference and glacial lake evolution.
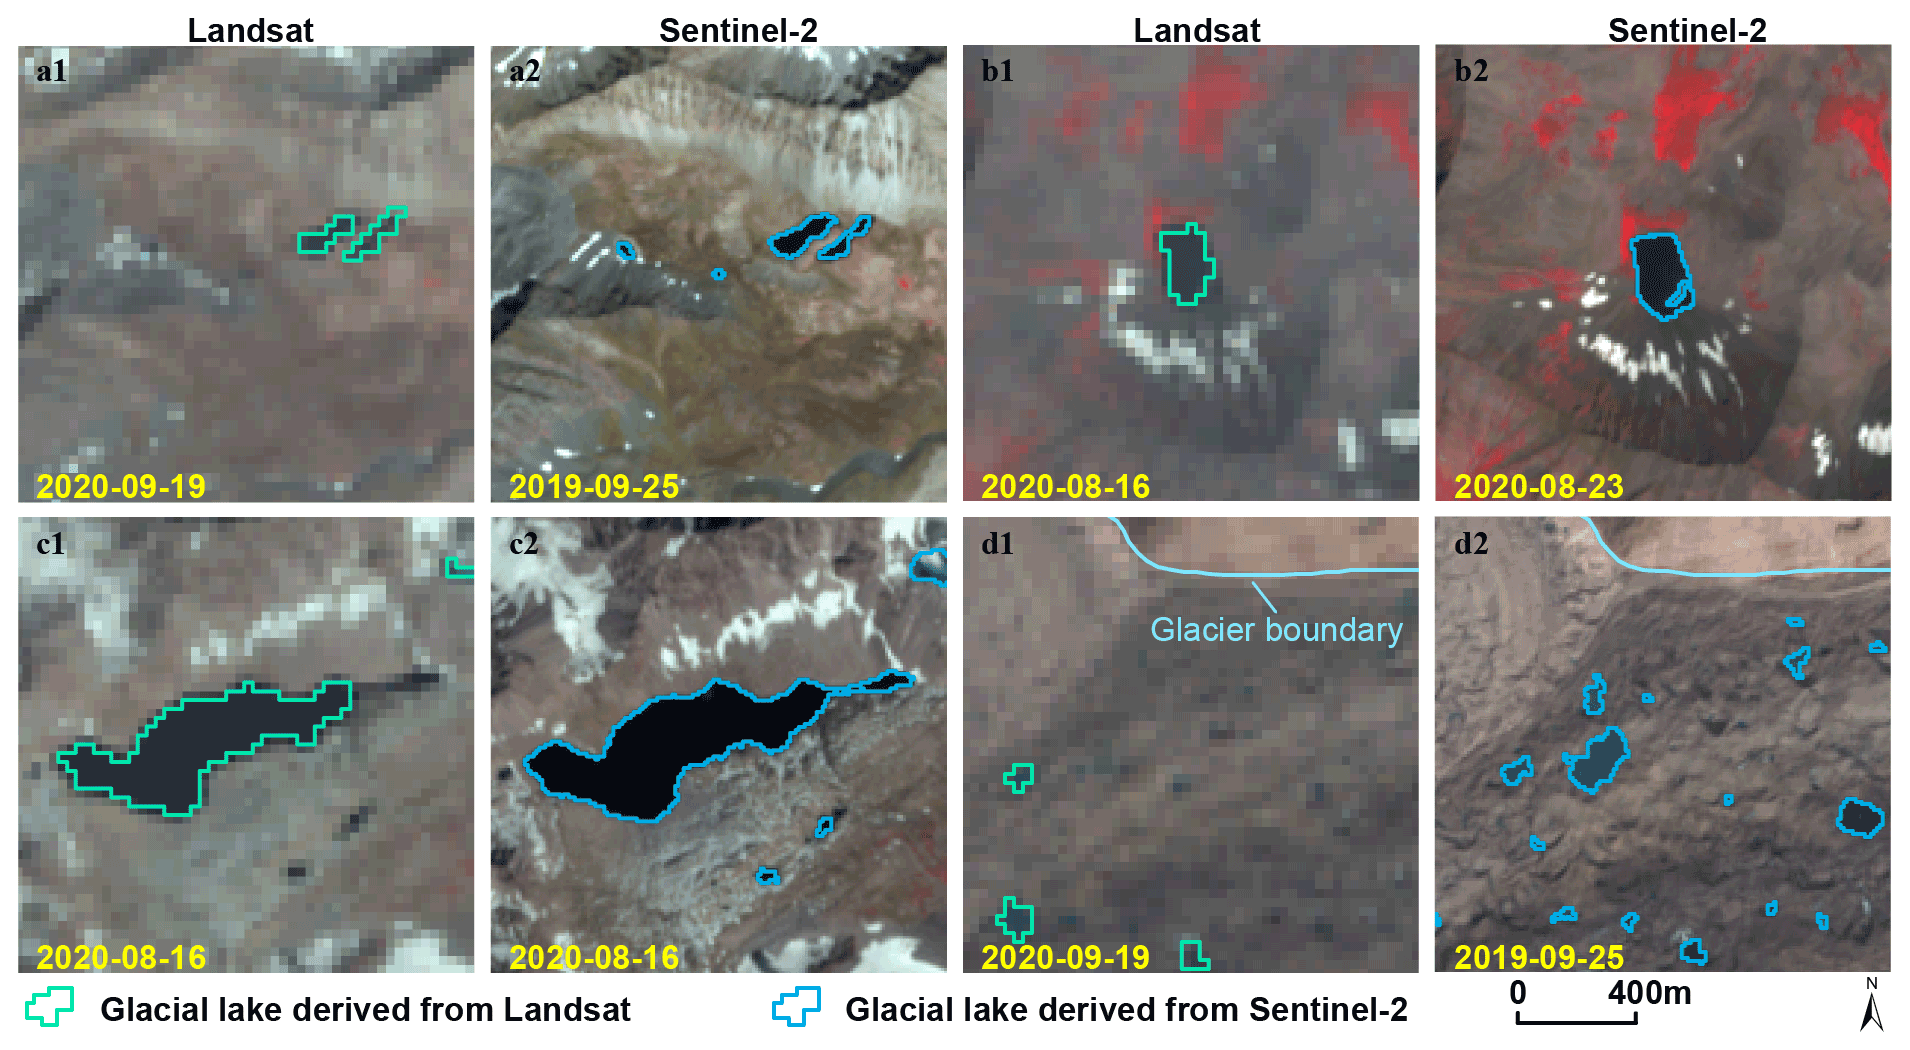
Figure 11The discrepancy of lake extents extracted from Landsat and Sentinel-2 images.
6.3 Comparison with the previous similar datasets
An increasing number of glacial lake datasets have been released over the past years, and most of them were produced from long-term Landsat archives. Regional glacial lake datasets using Sentinel images are scarce. The lack of Sentinel-derived glacial lake data in the study area makes it impossible to compare. Here we selected four available glacial lake datasets to compare with our Landsat-derived dataset at the same MMU and study area.
We provide the latest glacial lake dataset (in 2020) and the most long-term 30 m Landsat observation (1990 to 2020) for this study, with a range of critical attributes including two types of classification systems. Within the same study area, our 2020 glacial lakes appear to be closest to the 2018 dataset produced by Wang et al. (2020), with the highest overlap of greater than 91 % in count at the MMU of 5400 m2 or 6 pixels (Table 5). Wang's dataset (2020) contains many large landslide-dammed lakes that are excluded in our glacial lake mapping, so their total glacial lake area is greater than ours. The overlapping rates between Wang's glacial lakes (2020) in 1990 and ours are more than 83 % in count. However, their results show a distinct increase of glacial lakes in number and area between 1990 and 2018 (Wang et al., 2020), whereas our data show a more stable change between 1990 and 2020. One possible reason is that manually delineating glacial lakes twice by different operators during Wang's lake mapping (2020) exacerbates the errors of mapping. Another reason is that their data contain landslide-dammed lakes that fluctuate greatly with time and expanded recently. One example is Attabad Lake (located at 36∘18′ 22.33′′ N, 74∘49′ 34.36′′ E).
Table 5Comparison between our Landsat-based mapping and other third-party Landsat-based glacial lake datasets in the study area.
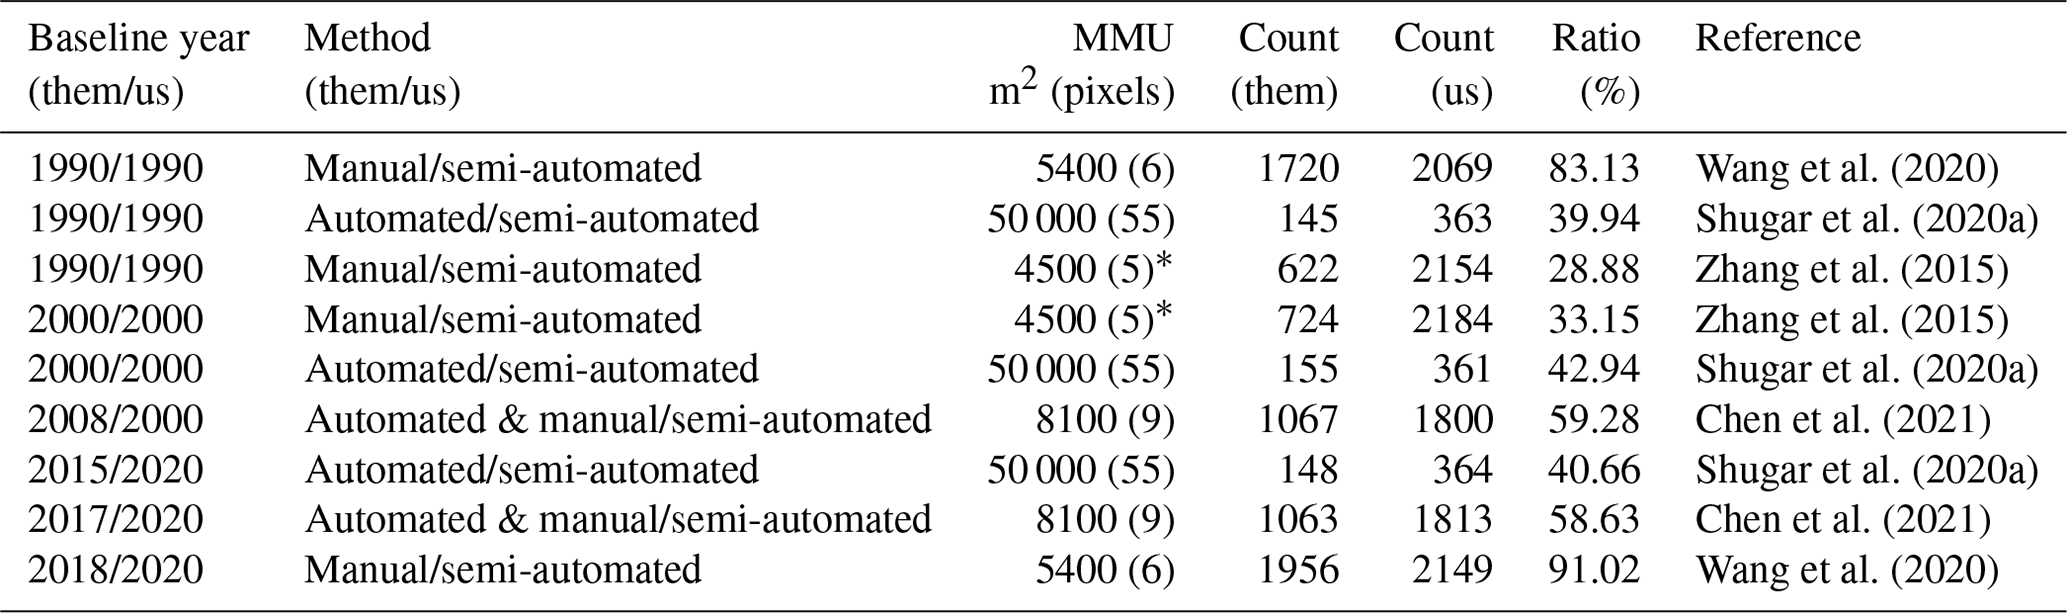
Note: the MMU represents the minimum mapping unit that is possible to enable a valid comparison between our product and each of the third-party datasets. * The MMU in the dataset of Zhang et al. (2015) is 3 pixels, finer than 5 pixels in our product, so an MMU threshold of 5 pixels was used for this comparison.
The second highest overlapping rate is approximately 59 % for 2008 and 58 % for 2017 in count compared with Chen's data (Chen et al., 2021). Similarly, the overlapping rate between Shugar's dataset (2020a) and ours is lower than 43 % in count at the MMU of 50 000 m2. The dataset from Zhang et al. (2015) shows fewer glacial lakes in 1990 and 2000 at the same MMU of 5 pixels. Our product has more lakes than each of the other four products at nine time periods. By inspecting their dataset, we attributed this anomalous discrepancy to a range of glacial lakes that were missing due to a lack of thorough cross-check quality assurance during their lake mapping over a larger study area. And those additional glacial lakes show an improvement of our product in contrast to the previous similar datasets. Our Landsat-derived glacial lake dataset has been visually cross-checked over three time periods after the step of threshold-based semi-automated lake mapping and has also been visually validated by Sentinel-derived glacial lakes. Through this series of quality assurance, we aim at delivering one of the most reliable multi-decadal glacial lake products for this study area.
Other factors, such as image quality and acquisition dates, mapping methods, and a quality assurance workflow, might also lead to discrepancies between the glacial lake datasets. Despite such discrepancies, an increasing number of publicly shared datasets benefit potential users to select the most suitable one for their objectives. Herein, we provide an up-to-date glacial lake dataset derived from both Landsat and Sentinel-2 observations, which further increased the availability of glacial lake datasets for water resource and GLOF risk assessment, predicting glacier–lake evolutions (Carrivick et al., 2020) in the context of climate change.
6.4 Limitation and updating plan
We would like to acknowledge several limitations of our glacial lake dataset, largely due to the availability of high-quality satellite images in the study area and inadequate field survey data (Wang et al., 2020; Chen et al., 2021). First, it is unlikely for one to collect enough good-quality images within 1 calendar year for the entire study area due to the high possibility of cloud or snow cover. Even though the capacity of repeat observations for Landsat 8 OLI and Sentinel-2 increased (Roy et al., 2014; Williamson et al., 2018; Wulder et al., 2019; Paul et al., 2020), the 2020 glacial lake dataset has to employ images acquired in adjacent years besides 2020. Most images used from Landsat and Sentinel-2 platforms were imaged in autumn, and some images taken between April and July and in November were also employed. Distribution and changes in glacial lakes primarily represent the characteristics between August and October. Glacial lakes evolve with time and space (Nie et al., 2017), and subtle inter- and intra-annual changes (Liu et al., 2020) for each period were ignored. Second, field investigation data are limited due to the low accessibility of the high mountain environment in the study area, which restrained the accuracy in classifying the glacial lake types. Although very high-resolution Google Earth images were utilized to assist in lake-type interpretation, occasional misclassification was unavoidable. We implemented two types of classification systems based on a careful utilization of glacier data, DEM, geomorphological features, and expert knowledge. However, the lack of in situ surveys prohibited a thorough validation of the glacial lake types. Third, the rigorous quality assurance and cross-check after semi-automated lake mapping assure the quality of our lake dataset but are still time- and cost-prohibitive. State-of-the-art mapping methods, such as deep learning (Wu et al., 2020), Google Earth Engine cloud computing (Chen et al., 2021), and synergy of SAR and optical images (Wangchuk and Bolch, 2020; How et al., 2021), could be used in the future to balance product accuracy and time cost.
The glacial lake dataset will be updated using newly collected Landsat and Sentinel images at a 5-year interval or modified according to user feedback. The updated glacial lake dataset will continue to be released freely and publicly on the Mountain Science Data Center sharing platform.
Our glacial lake dataset extracted from Sentinel-2 images in 2020 and Landsat observation between 1990 and 2020 is available online via the Mountain Science Data Center, the Institute of Mountain Hazards and Environment, the Chinese Academy of Sciences at https://doi.org/10.12380/Glaci.msdc.000001 (Lesi et al., 2022). The glacial lake dataset is provided in both the Esri shapefile format (total size of 22.6 MB) and the GeoPackage format (version 1.2.1) with a total size of 9.2 MB, which can be opened and further processed by open-source geographic information system software such as QGIS.
Glacial lake inventories of the entire China–Pakistan Economic Corridor in 2020 were provided based on Landsat and Sentinel-2 images using a threshold-based semi-automated mapping method. Both Landsat- and Sentinel-2- derived glacial lake datasets show similar characteristics in spatial distribution and the statistics of count and area. By contrast, the glacial lake dataset derived from Sentinel-2 images with a spatial resolution of 10 m has a lower mapping error and more accurate lake boundary than those from 30 m spatial resolution Landsat images, whereas Landsat imagery is more suitable to analyze spatiotemporal changes at a longer timescale due to its long-term archived observations at a consistent 30 m spatial resolution starting from the late 1980s.
Glacial lakes in the study area remain relatively stable with a slight increase in number and area between 1990 and 2020 according to Landsat observations. Our dataset reveals that 2154 glacial lakes in 1990 covering 85.1±14.66 km2 increased to 2234 lakes with a total area of 86.31±14.98 km2. The same mapping method and rigorous workflow of quality assurance and quality control used in this study reduced the error in multi-temporal changes of glacial lakes.
The error estimation method of Hanshaw and Bookhagen (2014) for pixel-based lake mapping was improved by removing repeatedly calculated edge pixels that vary with lake shape. Therefore, the newly proposed method reduces the estimated value of uncertainty from satellite observations. The average relative error is ±17.36 % for the Landsat-derived dataset and ±8.15 % for the product from Sentinel-2.
Our glacial lake dataset contains a range of critical parameters that maximize their potential utility for water resource and GLOF risk evaluation, cryosphere–hydrological, and glacier–lake evolution projection. The dual classification systems of glacial lake types were developed and are very likely to attract broader researchers and scientists to use our datasets. In comparison with other existing glacial lake datasets, our products were created through a thorough consideration of lake types, cross-checks, and rigorous quality assurance and will be updated and released continuously in the Mountain Science Data Center. As such, we expect that our glacial lake dataset will have significant value for cryospheric–hydrology research, the assessment of water resources, and glacier-related hazards in the CPEC.
The equation of Hanshaw and Bookhagen (2014) was originally proposed for pixelated polygons (such as a polygon directly extracted from a remote sensing image) and performed more robustly than manually digitized polygons (where vertices do not necessarily follow the pixel edges). Our improved method also performs better for pixelated polygons. This tutorial is dedicated to help implement our improved uncertainty estimating method.
A1 The procedure of uncertainty estimating method (using ArcGIS (© Esri) as an example)
1. Removing redundant nodes (optional)
We found that a small proportion (∼1 %) of the pixelated lake polygons (directly extracted from satellite images) have redundant nodes, which affects the value of inner nodes. If no redundant nodes exist, this step can be skipped. Or, we recommend using the “Simplify Polygon” tool in ArcGIS to remove those nodes (Fig. A1).
-
Open the Simplify Polygon panel.
-
Input your dataset.
-
Set the output path and output file name.
-
Choose the simplification algorithm. We recommended “POINT_REMOVE”.
-
Set the tolerance of the simplification algorithm. In this step, we need to ensure that the polygon boundaries remain unchanged after deleting redundant nodes. Generally, a tolerance of 1 m will suffice, or you can adjust the threshold to your satisfaction.
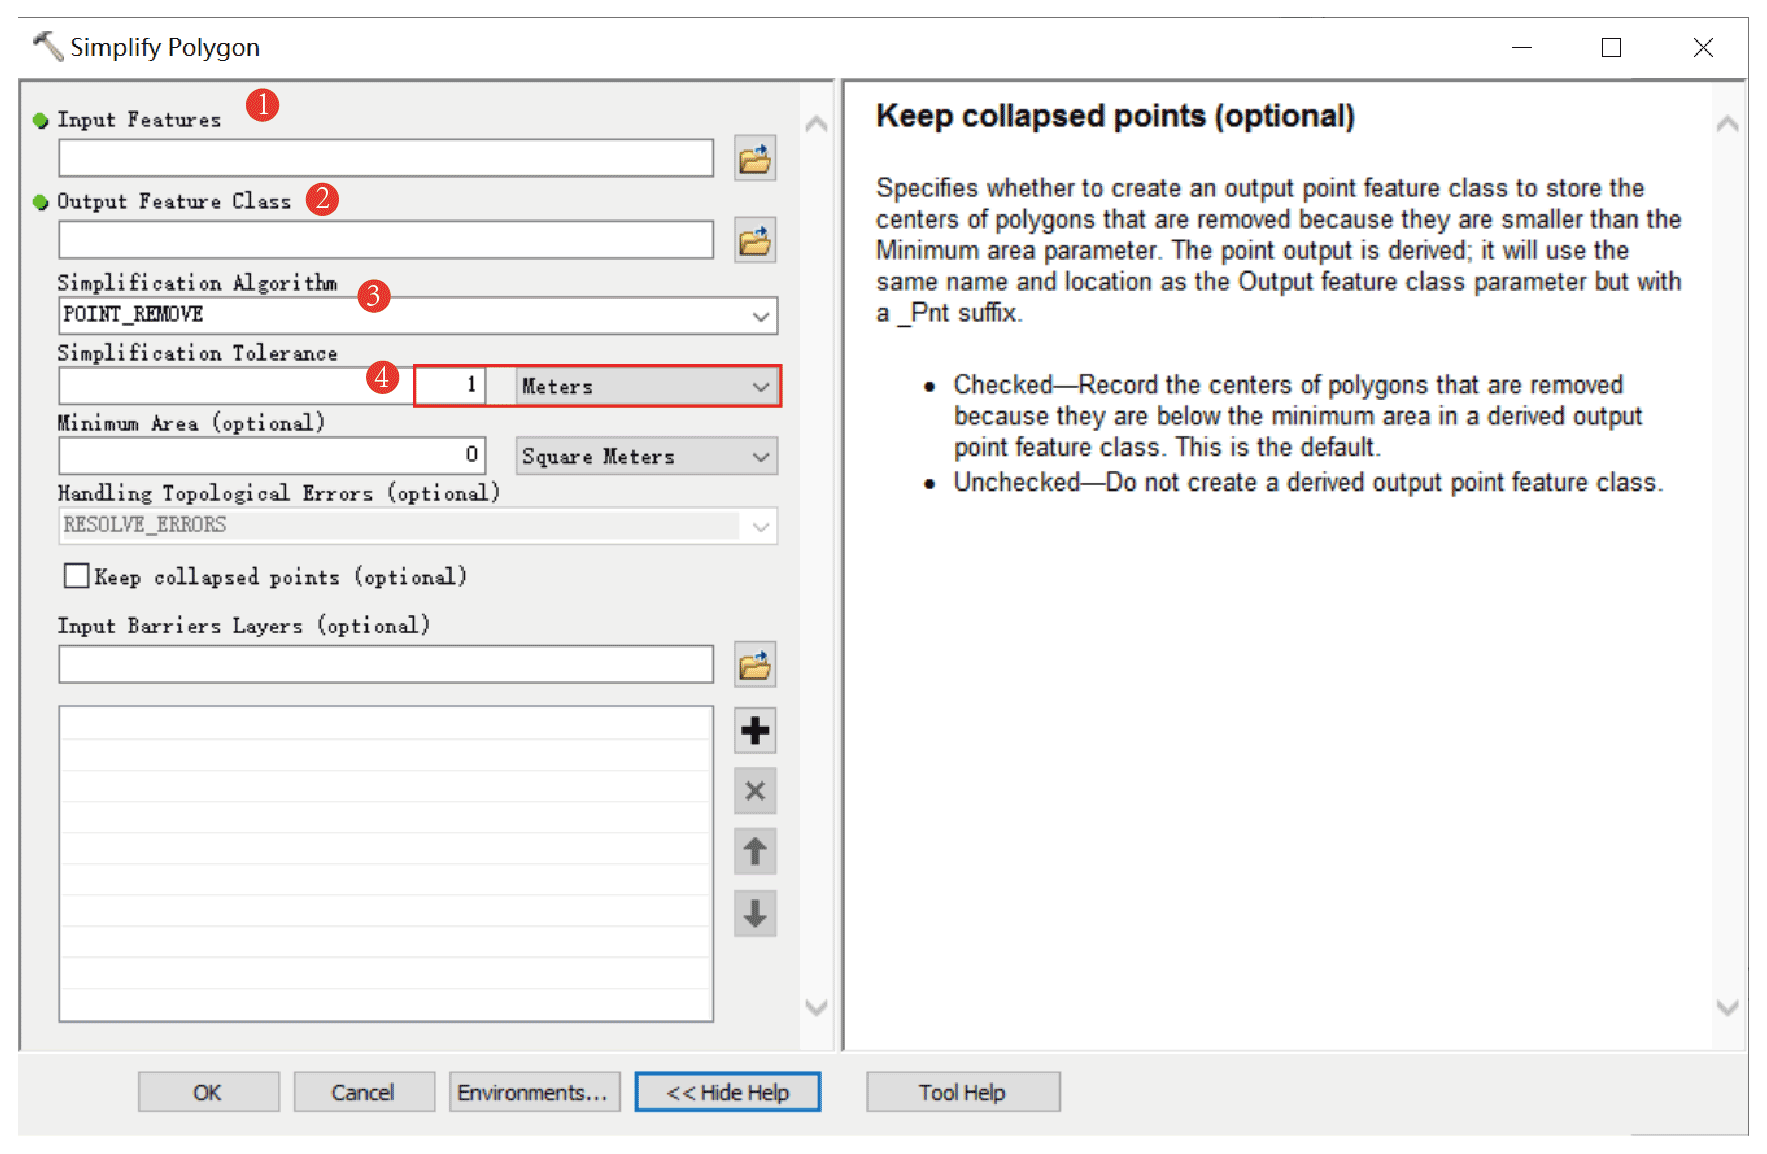
Figure A1Input and option for Simplify Polygon in ArcGIS.
2. Calculating the total number of nodes using ArcGIS (Fig. A2)
-
Add a new field in the attribute table of the dataset.
-
Open Field Calculator.
-
Switch the parser to Python mode, and enter “!shape.pointcount!” in the blue box to calculate the total number of nodes for each glacial lake boundary.
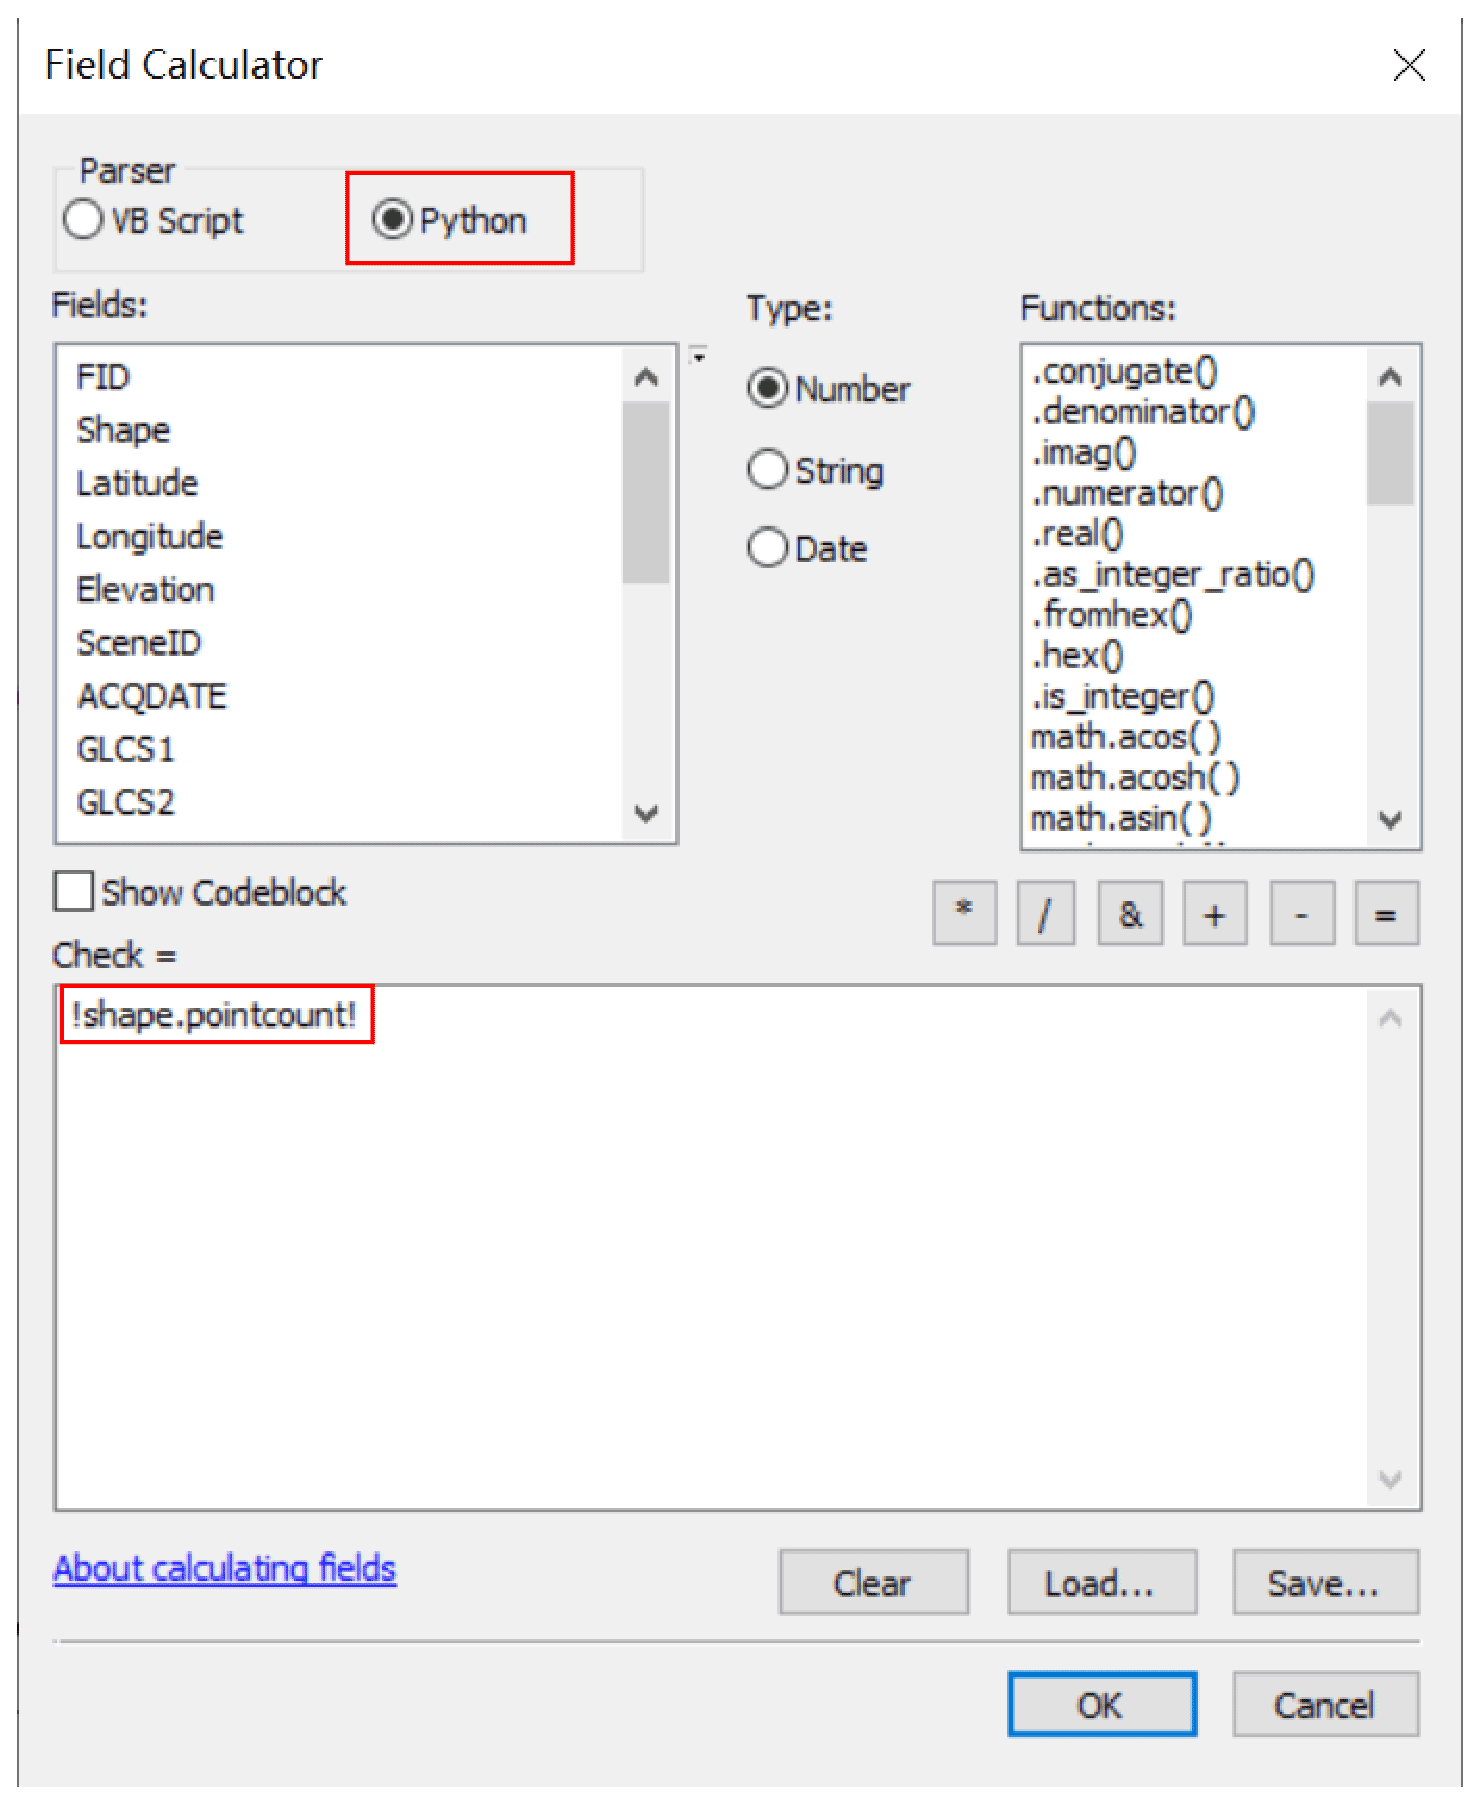
Figure A2Total node calculation in ArcGIS.
3. Calculating the number of inner nodes
For polygons without islands (Fig. A3), use Eq. (5). An inner node is a polygon vertex where the interior angle surrounding it is greater than 180∘. An outer node is the opposite of the inner node, where the interior angle is less than 180∘. We found that the outer nodes are usually four more than the inner nodes in our glacial lake dataset. The total nodes in ArcGIS contain one overlapping node to close the polygon, meaning the endpoint is also the start point. This extra count was deleted from the calculation (Eq. 5).
For polygons with islands (Fig. A4), use Eq. (6).
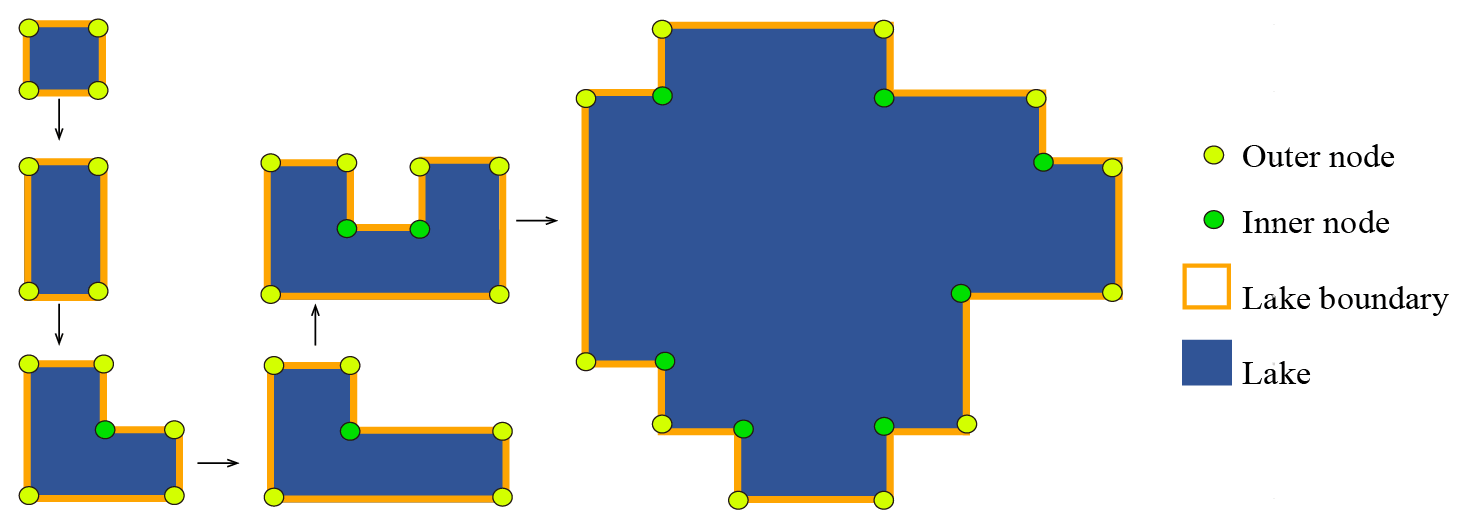
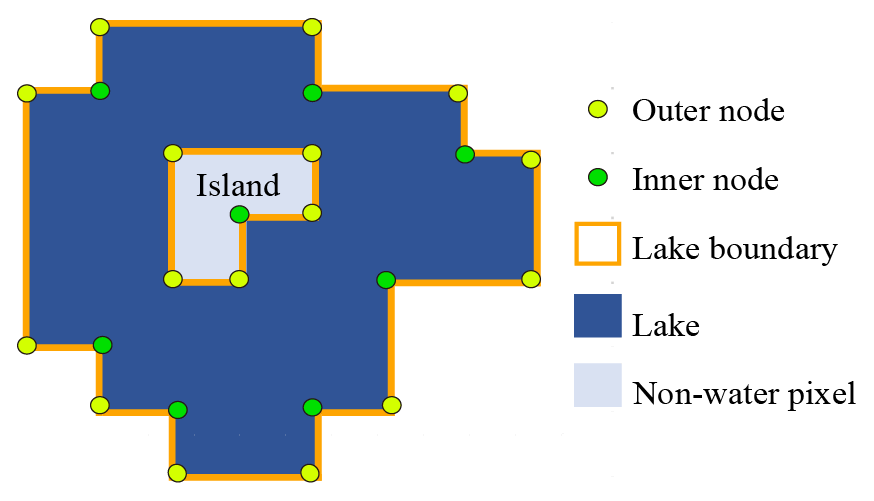
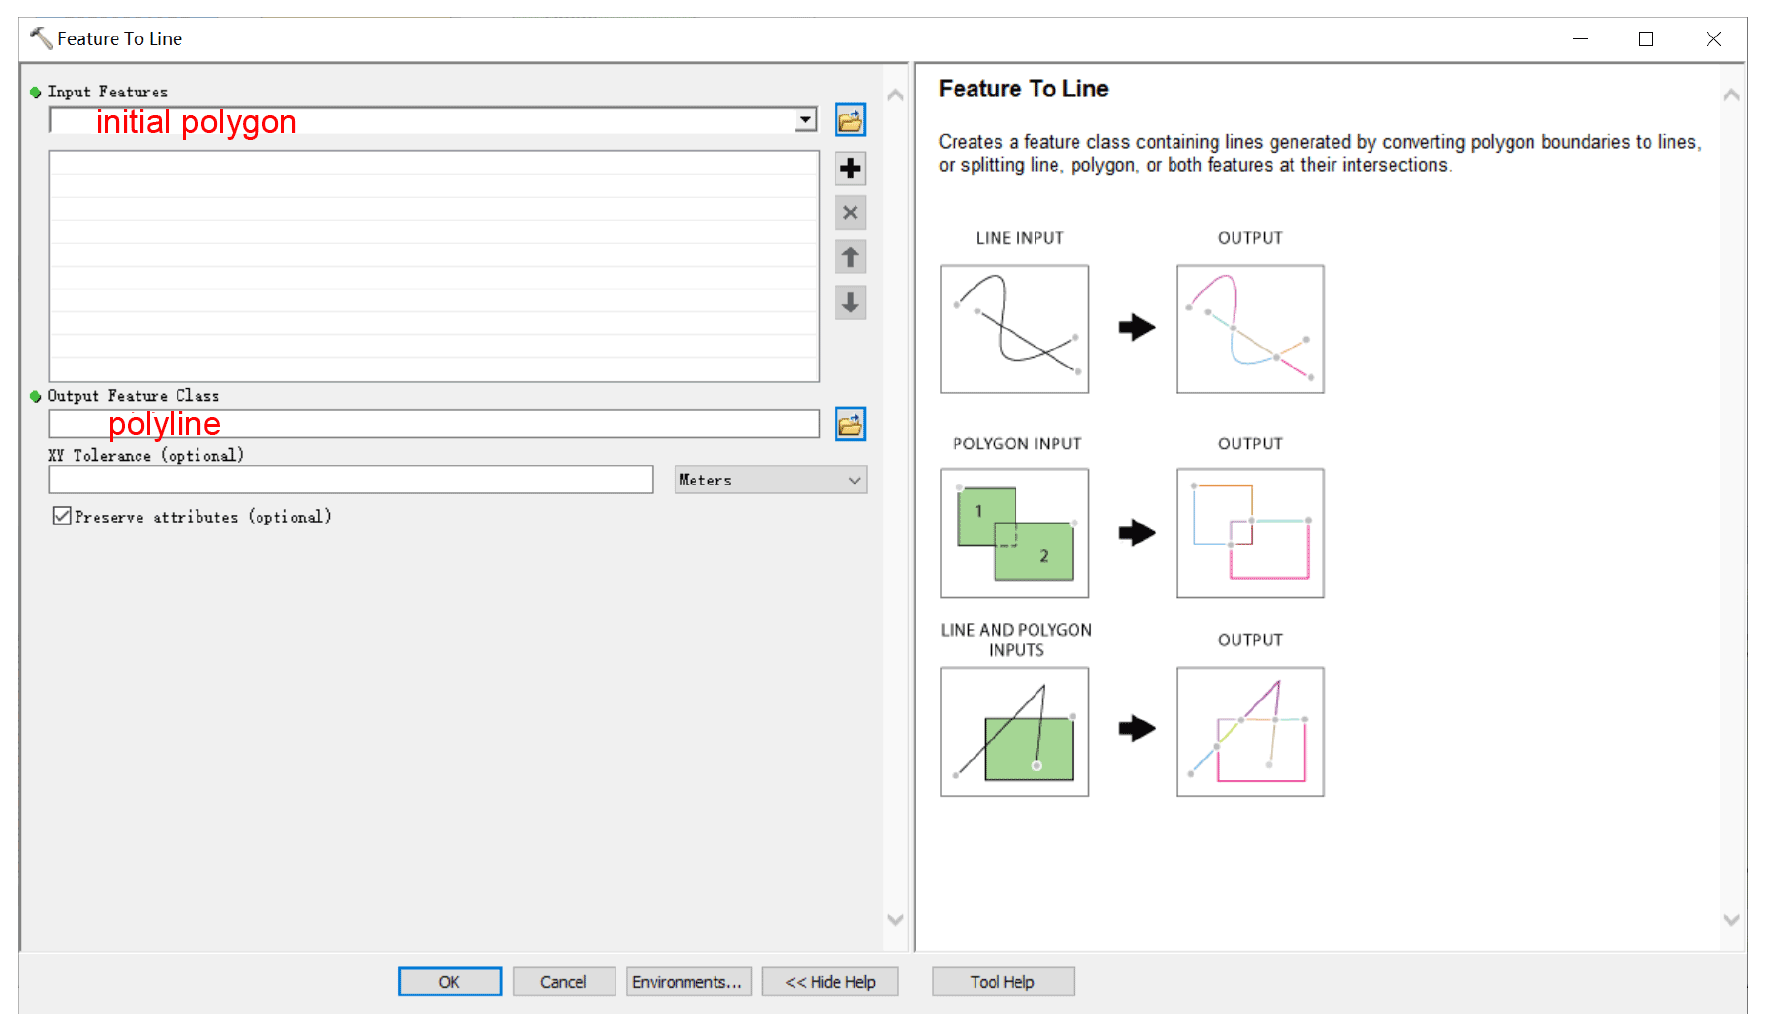
Figure A5Feature To Line tool in ArcGIS.

Figure A6Feature To Polygon tool in ArcGIS.
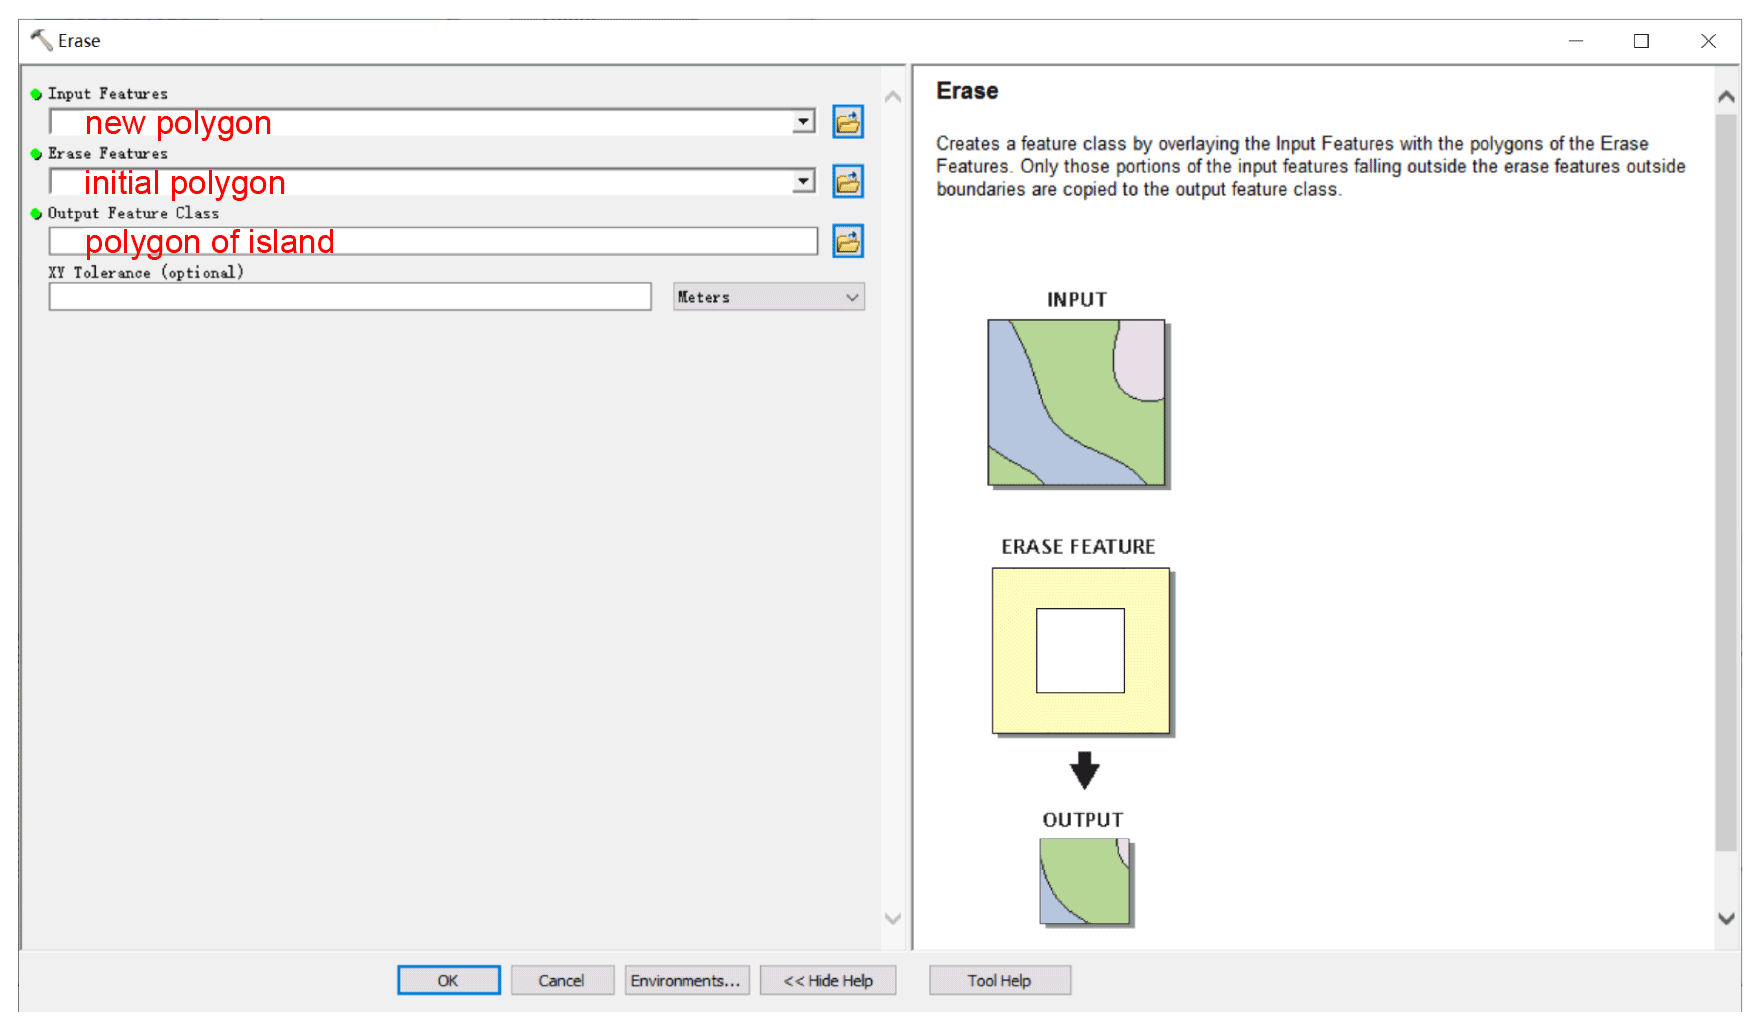
Figure A7Erase tool in ArcGIS.
We further specify the steps below to help implement Eq. (6).
Step 1. Detect the number of islands within each polygon.
-
Convert the initial lake polygon to a polyline using the “Feature To Line” tool (Fig. A5).
-
Convert the polyline to generate a new polygon (Fig. A6).
-
Erase the new polygon by the initial polygon, which outputs the islands. Then we can count how many islands there are in each lake (Fig. A7).
Step 2. Calculate the number of inner nodes for each polygon with an island or islands using Eq. (6).
4. Calculating the uncertainty of lake mapping using Eq. (4)
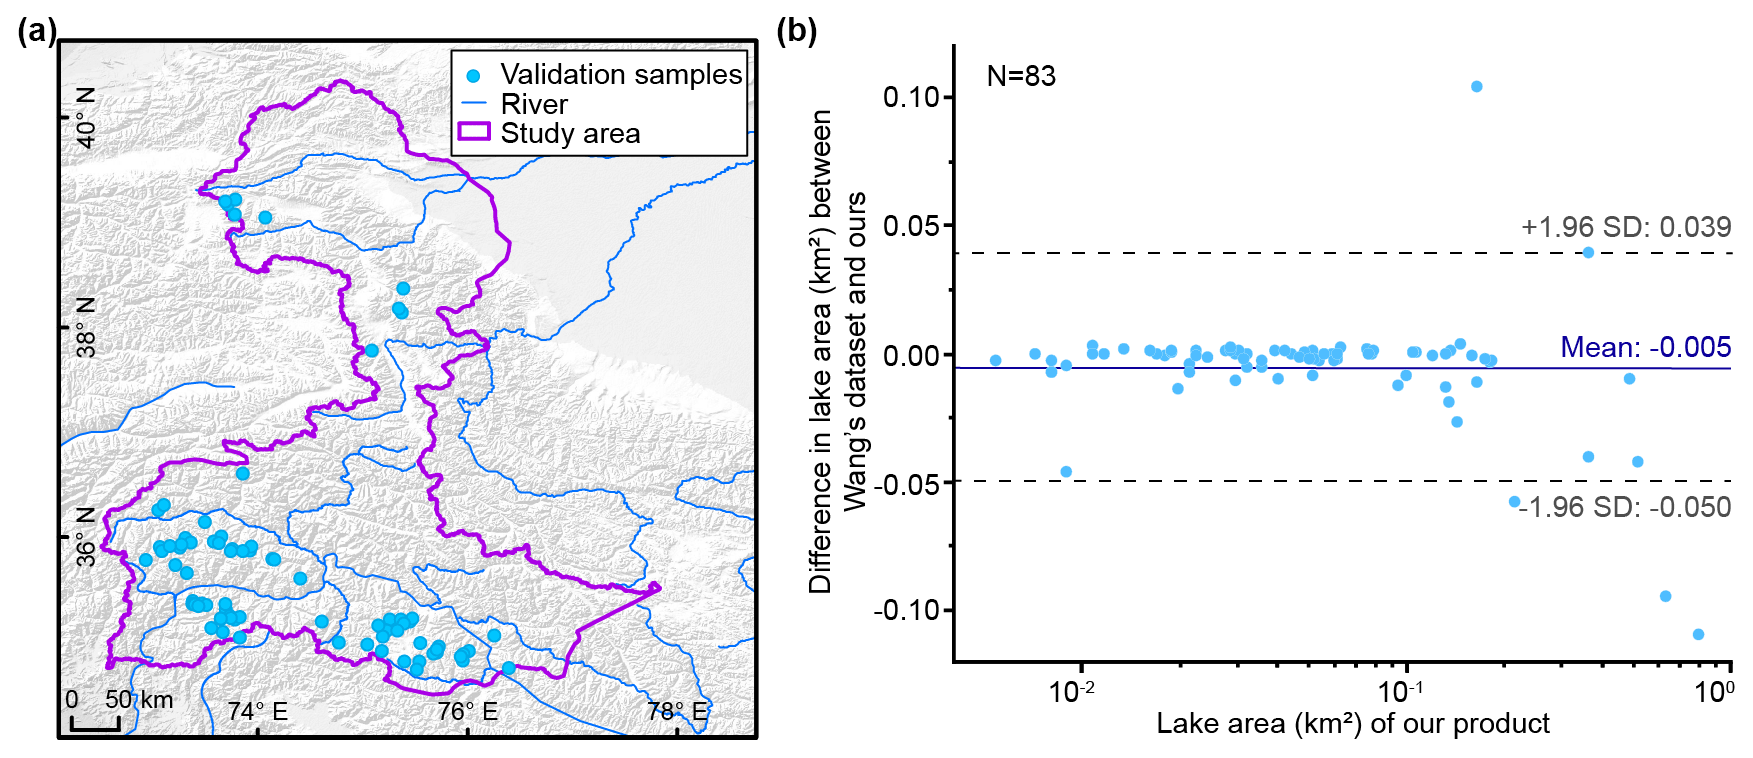
Figure A8Distribution of validation samples (a) and comparison of glacial lakes (b) derived from our Landsat product in 2020 and Wang's lake data in 2018.
ML and YN conceived the study; ML, YN and QD performed data processing and analysis of the glacial lake inventory data; JW contributed to tool development and mapping methods; and ML and YN wrote the manuscript. All authors reviewed and edited the manuscript before submission.
The contact author has declared that none of the authors has any competing interests.
Publisher's note: Copernicus Publications remains neutral with regard to jurisdictional claims in published maps and institutional affiliations.
We are grateful to the chief editor Kenneth Mankoff and three anonymous referees for their constructive comments that greatly helped us to improve this paper.
This research has been supported by the Second Tibetan Plateau Scientific Expedition and Research Program (grant no. 2019QZKK0603), the National Natural Science Foundation of China (grant nos. 42171086, 41971153), the International Science & Technology Cooperation Program of China (no. 2018YFE0100100), the Chinese Academy of Sciences “Light of West China”, and the Natural Sciences and Engineering Research Council of Canada (grant no. DG-2020-04207).
This paper was edited by Kenneth Mankoff and reviewed by three anonymous referees.
Ashraf, A., Naz, R., and Iqbal, M. B.: Altitudinal dynamics of glacial lakes under changing climate in the Hindu Kush, Karakoram, and Himalaya ranges, Geomorphology, 283, 72–79, https://doi.org/10.1016/j.geomorph.2017.01.033, 2017.
Azam, M. F., Kargel, J. S., Shea, J. M., Nepal, S., Haritashya, U. K., Srivastava, S., Maussion, F., Qazi, N., Chevallier, P., Dimri, A. P., Kulkarni, A. V., Cogley, J. G., and Bahuguna, I.: Glaciohydrology of the Himalaya-Karakoram, Science, 373, f3668, https://doi.org/10.1126/science.abf3668, 2021.
Battamo, A. Y., Varis, O., Sun, P., Yang, Y., Oba, B. T., and Zhao, L.: Mapping socio-ecological resilience along the seven economic corridors of the Belt and Road Initiative, J. Clean. Prod., 309, 127341, https://doi.org/10.1016/j.jclepro.2021.127341, 2021.
Bhambri, R., Hewitt, K., Kawishwar, P., Kumar, A., Verma, A., Snehmani, Tiwari, S., and Misra, A.: Ice-dams, outburst floods, and movement heterogeneity of glaciers, Karakoram, Global Planet. Change, 180, 100–116, https://doi.org/10.1016/j.gloplacha.2019.05.004, 2019.
Bhattacharya, A., Bolch, T., Mukherjee, K., King, O., Menounos, B., Kapitsa, V., Neckel, N., Yang, W., and Yao, T.: High Mountain Asian glacier response to climate revealed by multi-temporal satellite observations since the 1960s, Nat. Commun., 12, 4133, https://doi.org/10.1038/s41467-021-24180-y, 2021.
Bolch, T., Pieczonka, T., Mukherjee, K., and Shea, J.: Brief communication: Glaciers in the Hunza catchment (Karakoram) have been nearly in balance since the 1970s, The Cryosphere, 11, 531–539, https://doi.org/10.5194/tc-11-531-2017, 2017.
Brun, F., Berthier, E., Wagnon, P., Kääb, A., and Treichler, D.: A spatially resolved estimate of High Mountain Asia glacier mass balances from 2000 to 2016, Nat. Geosci., 10, 668–673, https://doi.org/10.1038/ngeo2999, 2017.
Brun, F., Wagnon, P., Berthier, E., Jomelli, V., Maharjan, S. B., Shrestha, F., and Kraaijenbrink, P. D. A.: Heterogeneous Influence of Glacier Morphology on the Mass Balance Variability in High Mountain Asia, J. Geophys. Res.-Earth., 124, 1331–1345, https://doi.org/10.1029/2018JF004838, 2019.
Carrivick, J. L. and Quincey, D. J.: Progressive increase in number and volume of ice-marginal lakes on the western margin of the Greenland Ice Sheet, Global Planet. Change, 116, 156–163, https://doi.org/10.1016/j.gloplacha.2014.02.009, 2014.
Carrivick, J. L. and Tweed, F. S.: Proglacial lakes: character, behaviour and geological importance, Quaternary Sci. Rev., 78, 34–52, https://doi.org/10.1016/j.quascirev.2013.07.028, 2013.
Carrivick, J. L. and Tweed, F. S.: A global assessment of the societal impacts of glacier outburst floods, Global Planet. Change, 144, 1–16, https://doi.org/10.1016/j.gloplacha.2016.07.001, 2016.
Carrivick, J. L., Tweed, F. S., Sutherland, J. L., and Mallalieu, J.: Toward Numerical Modeling of Interactions Between Ice-Marginal Proglacial Lakes and Glaciers, Front. Earth Sci., 8, 577068, https://doi.org/10.3389/feart.2020.577068, 2020.
Carrivick, J. L., How, P., Lea, J. M., Sutherland, J. L., Grimes, M., Tweed, F. S., Cornford, S., Quincey, D. J., and Mallalieu, J.: Ice-Marginal Proglacial Lakes Across Greenland: Present Status and a Possible Future, Geophys. Res. Lett., 49, e2022GL099276, https://doi.org/10.1029/2022GL099276, 2022.
Chen, F., Zhang, M., Guo, H., Allen, S., Kargel, J. S., Haritashya, U. K., and Watson, C. S.: Annual 30-meter Dataset for Glacial Lakes in High Mountain Asia from 2008 to 2017, Zenodo [data set], https://doi.org/10.5281/zenodo.4275164, 2020.
Chen, F., Zhang, M., Guo, H., Allen, S., Kargel, J. S., Haritashya, U. K., and Watson, C. S.: Annual 30 m dataset for glacial lakes in High Mountain Asia from 2008 to 2017, Earth Syst. Sci. Data, 13, 741–766, https://doi.org/10.5194/essd-13-741-2021, 2021.
Chen, X., Cui, P., You, Y., Cheng, Z., Khan, A., Ye, C., and Zhang, S.: Dam-break risk analysis of the Attabad landslide dam in Pakistan and emergency countermeasures, Landslides, 14, 675–683, https://doi.org/10.1007/s10346-016-0721-7, 2017.
Cook, S. J. and Quincey, D. J.: Estimating the volume of Alpine glacial lakes, Earth Surf. Dynam., 3, 559–575, https://doi.org/10.5194/esurf-3-559-2015, 2015.
Emmer, A. and Cuřín, V.: Can a dam type of an alpine lake be derived from lake geometry? A negative result, J. Mt. Sci., 18, 614–621, https://doi.org/10.1007/s11629-020-6003-9, 2021.
Farr, T. G., Rosen, P. A., Caro, E., Crippen, R., Duren, R., Hensley, S., Kobrick, M., Paller, M., Rodriguez, E., Roth, L., Seal, D., Shaffer, S., Shimada, J., Umland, J., Werner, M., Oskin, M., Burbank, D., and Alsdorf, D.: The Shuttle Radar Topography Mission, Rev. Geophys., 45, G2004, https://doi.org/10.1029/2005RG000183, 2007.
Gardelle, J., Arnaud, Y., and Berthier, E.: Contrasted evolution of glacial lakes along the Hindu Kush Himalaya mountain range between 1990 and 2009, Global Planet. Change, 75, 47–55, https://doi.org/10.1016/j.gloplacha.2010.10.003, 2011.
Hanshaw, M. N. and Bookhagen, B.: Glacial areas, lake areas, and snow lines from 1975 to 2012: status of the Cordillera Vilcanota, including the Quelccaya Ice Cap, northern central Andes, Peru, The Cryosphere, 8, 359–376, https://doi.org/10.5194/tc-8-359-2014, 2014.
Hewitt, K.: The Karakoram Anomaly? Glacier Expansion and the “Elevation Effect”, Karakoram Himalaya, Mt. Res. Dev., 25, 332–340, https://doi.org/10.1659/0276-4741(2005)025[0332:TKAGEA]2.0.CO;2, 2005.
Hewitt, K. (Ed.): Glaciers of the Karakoram Himalaya, Advances in Asian Human-Environmental Research, Springer, Dordrecht, 363 pp., https://doi.org/10.1007/978-94-007-6311-1_1, 2014.
How, P., Messerli, A., Mätzler, E., Santoro, M., Wiesmann, A., Caduff, R., Langley, K., Bojesen, M. H., Paul, F., Kääb, A., and Carrivick, J. L.: Greenland-wide inventory of ice marginal lakes using a multi-method approach, Sci. Rep.-UK, 11, 4481, https://doi.org/10.1038/s41598-021-83509-1, 2021.
Huggel, C., Kääb, A., Haeberli, W., Teysseire, P., and Paul, F.: Remote sensing based assessment of hazards from glacier lake outbursts: a case study in the Swiss Alps, Can. Geotech. J., 39, 316–330, https://doi.org/10.1139/t01-099, 2002.
Hugonnet, R., McNabb, R., Berthier, E., Menounos, B., Nuth, C., Girod, L., Farinotti, D., Huss, M., Dussaillant, I., Brun, F., and Kääb, A.: Accelerated global glacier mass loss in the early twenty-first century, Nature, 592, 726–731, https://doi.org/10.1038/s41586-021-03436-z, 2021.
Huss, M. and Hock, R.: Global-scale hydrological response to future glacier mass loss, Nat. Clim. Change, 8, 135–140, https://doi.org/10.1038/s41558-017-0049-x, 2018.
Immerzeel, W. W., Lutz, A. F., Andrade, M., Bahl, A., Biemans, H., Bolch, T., Hyde, S., Brumby, S., Davies, B. J., Elmore, A. C., Emmer, A., Feng, M., Fernández, A., Haritashya, U., Kargel, J. S., Koppes, M., Kraaijenbrink, P. D. A., Kulkarni, A. V., Mayewski, P. A., Nepal, S., Pacheco, P., Painter, T. H., Pellicciotti, F., Rajaram, H., Rupper, S., Sinisalo, A., Shrestha, A. B., Viviroli, D., Wada, Y., Xiao, C., Yao, T., and Baillie, J. E. M.: Importance and vulnerability of the world's water towers, Nature, 577, 364–369, https://doi.org/10.1038/s41586-019-1822-y, 2020.
Jarvis, A., Reuter, H. I., Nelson, A., and Guevara, E.: Hole-filled seamless SRTM data V4, International Centre for Tropical Agriculture (CIAT), http://srtm.csi.cgiar.org (last access: 5 March 2021), 2008.
Jiang, S., Nie, Y., Liu, Q., Wang, J., Liu, L., Hassan, J., Liu, X., and Xu, X.: Glacier Change, Supraglacial Debris Expansion and Glacial Lake Evolution in the Gyirong River Basin, Central Himalayas, between 1988 and 2015, Remote Sens., 10, 986, https://doi.org/10.3390/rs10070986, 2018.
Kääb, A., Berthier, E., Nuth, C., Gardelle, J., and Arnaud, Y.: Contrasting patterns of early twenty-first-century glacier mass change in the Himalayas, Nature, 488, 495–498, https://doi.org/10.1038/nature11324, 2012.
Lesi, M., Nie, Y., Shugar, D. H., Wang, J., Deng, Q., Chen, H., and Fan, J.: Landsat and Sentinel-derived glacial lake dataset in the China-Pakistan Economic Corridor from 1990 to 2020, Mountain Science Data Center [data set], https://doi.org/10.12380/Glaci.msdc.000001, 2022.
Li, D., Shangguan, D., and Anjum, M. N.: Glacial Lake Inventory Derived from Landsat 8 OLI in 2016–2018 in China–Pakistan Economic Corridor, ISPRS Int. J. Geo-Inf., 9, 294, https://doi.org/10.3390/ijgi9050294, 2020.
Li, Z., Deng, X., and Zhang, Y.: Evaluation and convergence analysis of socio-economic vulnerability to natural hazards of Belt and Road Initiative countries, J. Clean. Prod., 282, 125406, https://doi.org/10.1016/j.jclepro.2020.125406, 2021.
Liu, Q. and Mayer, C.: Distribution and interannual variability of supraglacial lakes on debris-covered glaciers in the Khan Tengri-Tumor Mountains, Central Asia, Environ. Res. Lett., 10, 14014, https://doi.org/10.1088/1748-9326/10/1/014014, 2015.
Liu, Q., Mayer, C., Wang, X., Nie, Y., Wu, K., Wei, J., and Liu, S.: Interannual flow dynamics driven by frontal retreat of a lake-terminating glacier in the Chinese Central Himalaya, Earth Planet. Sc. Lett., 546, 116450, https://doi.org/10.1016/j.epsl.2020.116450, 2020.
Lyons, E. A., Sheng, Y., Smith, L. C., Li, J., Hinkel, K. M., Lenters, J. D., and Wang, J.: Quantifying sources of error in multitemporal multisensor lake mapping, Int. J. Remote Sens., 34, 7887–7905, https://doi.org/10.1080/01431161.2013.827343, 2013.
Martín, C. N. S., Ponce, J. F., Montes, A., Balocchi, L. D., Gorza, C., and Andrea, C.: Proglacial landform assemblage in a rapidly retreating cirque glacier due to temperature increase since 1970, Fuegian Andes, Argentina, Geomorphology, 390, 107861, https://doi.org/10.1016/j.geomorph.2021.107861, 2021.
Maurer, J. M., Schaefer, J. M., Rupper, S., and Corley, A.: Acceleration of ice loss across the Himalayas over the past 40 years, Sci. Adv., 5, v7266, https://doi.org/10.1126/sciadv.aav7266, 2019.
McFeeters, S. K.: The use of the Normalized Difference Water Index (NDWI) in the delineation of open water features, Int. J. Remote Sens., 17, 1425–1432, https://doi.org/10.1080/01431169608948714, 1996.
Miles, E. S., Watson, C. S., Brun, F., Berthier, E., Esteves, M., Quincey, D. J., Miles, K. E., Hubbard, B., and Wagnon, P.: Glacial and geomorphic effects of a supraglacial lake drainage and outburst event, Everest region, Nepal Himalaya, The Cryosphere, 12, 3891–3905, https://doi.org/10.5194/tc-12-3891-2018, 2018.
Nie, Y., Zhang, Y., Liu, L., and Zhang, J.: Glacial change in the vicinity of Mt. Qomolangma (Everest), central high Himalayas since 1976, J. Geogr. Sci., 20, 667–686, https://doi.org/10.1007/s11442-010-0803-8, 2010.
Nie, Y., Sheng, Y., Liu, Q., Liu, L., Liu, S., Zhang, Y., and Song, C.: A regional-scale assessment of Himalayan glacial lake changes using satellite observations from 1990 to 2015, Remote Sens. Environ., 189, 1–13, https://doi.org/10.1016/j.rse.2016.11.008, 2017.
Nie, Y., Liu, Q., Wang, J., Zhang, Y., Sheng, Y., and Liu, S.: An inventory of historical glacial lake outburst floods in the Himalayas based on remote sensing observations and geomorphological analysis, Geomorphology, 308, 91–106, https://doi.org/10.1016/j.geomorph.2018.02.002, 2018.
Nie, Y., Liu, W., Liu, Q., Hu, X., and Westoby, M. J.: Reconstructing the Chongbaxia Tsho glacial lake outburst flood in the Eastern Himalaya: Evolution, process and impacts, Geomorphology, 370, 107393, https://doi.org/10.1016/j.geomorph.2020.107393, 2020.
Nie, Y., Pritchard, H. D., Liu, Q., Hennig, T., Wang, W., Wang, X., Liu, S., Nepal, S., Samyn, D., Hewitt, K., and Chen, X.: Glacial change and hydrological implications in the Himalaya and Karakoram, Nat. Rev. Earth Environ., 2, 91–106, https://doi.org/10.1038/s43017-020-00124-w, 2021.
Paul, F., Rastner, P., Azzoni, R. S., Diolaiuti, G., Fugazza, D., Le Bris, R., Nemec, J., Rabatel, A., Ramusovic, M., Schwaizer, G., and Smiraglia, C.: Glacier shrinkage in the Alps continues unabated as revealed by a new glacier inventory from Sentinel-2, Earth Syst. Sci. Data, 12, 1805–1821, https://doi.org/10.5194/essd-12-1805-2020, 2020.
Pfeffer, W. T., Arendt, A. A., Bliss, A., Bolch, T., Cogley, J. G., Gardner, A. S., Hagen, J., Hock, R., Kaser, G., Kienholz, C., Miles, E. S., Moholdt, G., Mölg, N., Paul, F., Radić, V., Rastner, P., Raup, B. H., Rich, J., and Sharp, M. J.: The Randolph Glacier Inventory: a globally complete inventory of glaciers, J. Glaciol., 60, 537–552, https://doi.org/10.3189/2014JoG13J176, 2014.
Post, A. and Mayo, L. R.: Glacier dammed lakes and outburst floods in Alaska, U.S. Geological Survey, Report 455, 1–10, https://doi.org/10.3133/ha455, 1971.
Pritchard, H. D.: Asia's shrinking glaciers protect large populations from drought stress, Nature, 569, 649–654, https://doi.org/10.1038/s41586-019-1240-1, 2019.
Quincey, D. J., Richardson, S. D., Luckman, A., Lucas, R. M., Reynolds, J. M., Hambrey, M. J., and Glasser, N. F.: Early recognition of glacial lake hazards in the Himalaya using remote sensing datasets, Global Planet. Change, 56, 137–152, https://doi.org/10.1016/j.gloplacha.2006.07.013, 2007.
Rabus, B., Eineder, M., Roth, A., and Bamler, R.: The shuttle radar topography mission–a new class of digital elevation models acquired by spaceborne radar, Isprs J. Photogramm., 57, 241–262, https://doi.org/10.1016/S0924-2716(02)00124-7, 2003.
RGI Consortium: Randolph Glacier Inventory – A Dataset of Global Glacier Outlines, Version 6, National Snow and Ice Data Center [data set], https://doi.org/10.7265/4m1f-gd79, 2017.
Rick, B., McGrath, D., Armstrong, W., and McCoy, S. W.: Dam type and lake location characterize ice-marginal lake area change in Alaska and NW Canada between 1984 and 2019, The Cryosphere, 16, 297–314, https://doi.org/10.5194/tc-16-297-2022, 2022.
Rose, A., Mckee, J., Sims, K., Bright, E., Reith, A., and Urban, M.: LandScan Global 2020, Oak Ridge National Laboratory, https://doi.org/10.48690/1523378, 2021.
Rounce, D. R., Hock, R., and Shean, D. E.: Glacier Mass Change in High Mountain Asia Through 2100 Using the Open-Source Python Glacier Evolution Model (PyGEM), Front. Earth Sci., 7, 331, https://doi.org/10.3389/feart.2019.00331, 2020.
Roy, D. P., Wulder, M. A., Loveland, T. R., C. E., W., Allen, R. G., Anderson, M. C., Helder, D., Irons, J. R., Johnson, D. M., Kennedy, R., Scambos, T. A., Schaaf, C. B., Schott, J. R., Sheng, Y., Vermote, E. F., Belward, A. S., Bindschadler, R., Cohen, W. B., Gao, F., Hipple, J. D., Hostert, P., Huntington, J., Justice, C. O., Kilic, A., Kovalskyy, V., Lee, Z. P., Lymburner, L., Masek, J. G., McCorkel, J., Shuai, Y., Trezza, R., Vogelmann, J., Wynne, R. H., and Zhu, Z.: Landsat-8: Science and product vision for terrestrial global change research, Remote Sens. Environ., 145, 154–172, https://doi.org/10.1016/j.rse.2014.02.001, 2014.
Sakai, A.: Brief communication: Updated GAMDAM glacier inventory over high-mountain Asia , The Cryosphere, 13, 2043–2049, https://doi.org/10.5194/tc-13-2043-2019, 2019.
Salerno, F., Thakuri, S., D'Agata, C., Smiraglia, C., Manfredi, E. C., Viviano, G., and Tartari, G.: Glacial lake distribution in the Mount Everest region: Uncertainty of measurement and conditions of formation, Global Planet. Change, 92–93, 30–39, https://doi.org/10.1016/j.gloplacha.2012.04.001, 2012.
Shean, D. E., Bhushan, S., Montesano, P., Rounce, D. R., Arendt, A., and Osmanoglu, B.: A Systematic, Regional Assessment of High Mountain Asia Glacier Mass Balance, Front. Earth Sci., 7, 363, https://doi.org/10.3389/feart.2019.00363, 2020.
Sheng, Y., Song, C., Wang, J., Lyons, E. A., Knox, B. R., Cox, J. S., and Gao, F.: Representative lake water extent mapping at continental scales using multi-temporal Landsat-8 imagery, Remote Sens. Environ., 185, 129–141, https://doi.org/10.1016/j.rse.2015.12.041, 2016.
Shugar, D. H., Burr, A., Haritashya, U. K., Kargel, J. S., Watson, C. S., Kennedy, M. C., Bevington, A. R., Betts, R. A., Harrison, S., and Strattman, K.: Rapid worldwide growth of glacial lakes since 1990, Nat. Clim. Change, 10, 939–945, https://doi.org/10.1038/s41558-020-0855-4, 2020a.
Shugar, D., Burr, A., Haritashya, U. K., Kargel, J., Watson, C. S., Kennedy, M. C., Bevington, A. R., Betts, R. A., Harrison, S., and Strattman, K.: High Mountain Asia Near-Global Multi-Decadal Glacial Lake Inventory, Version 1, NASA National Snow and Ice Data Center Distributed Active Archive Center [data set], https://doi.org/10.5067/UO20NYM3YQB4, 2020b.
Shugar, D. H., Jacquemart, M., Shean, D., Bhushan, S., Upadhyay, K., Sattar, A., Schwanghart, W., McBride, S., de Vries, M., Mergili, M., Emmer, A., Deschamps-Berger, C., McDonnell, M., Bhambri, R., Allen, S., Berthier, E., Carrivick, J. L., Clague, J. J., Dokukin, M., Dunning, S. A., Frey, H., Gascoin, S., Haritashya, U. K., Huggel, C., Kaab, A., Kargel, J. S., Kavanaugh, J. L., Lacroix, P., Petley, D., Rupper, S., Azam, M. F., Cook, S. J., Dimri, A. P., Eriksson, M., Farinotti, D., Fiddes, J., Gnyawali, K. R., Harrison, S., Jha, M., Koppes, M., Kumar, A., Leinss, S., Majeed, U., Mal, S., Muhuri, A., Noetzli, J., Paul, F., Rashid, I., Sain, K., Steiner, J., Ugalde, F., Watson, C. S., and Westoby, M. J.: A massive rock and ice avalanche caused the 2021 disaster at Chamoli, Indian Himalaya, Science, 373, 300–306, https://doi.org/10.1126/science.abh4455, 2021.
Ullah, S., You, Q., Ali, A., Ullah, W., Jan, M. A., Zhang, Y., Xie, W., and Xie, X.: Observed changes in maximum and minimum temperatures over China- Pakistan economic corridor during 1980–2016, Atmos. Res., 216, 37–51, https://doi.org/10.1016/j.atmosres.2018.09.020, 2019.
Viviroli, D., Kummu, M., Meybeck, M., Kallio, M., and Wada, Y.: Increasing dependence of lowland populations on mountain water resources, Nat. Sustain., 3, 917–928, https://doi.org/10.1038/s41893-020-0559-9, 2020.
Wang, J., Sheng, Y., and Tong, T. S. D.: Monitoring decadal lake dynamics across the Yangtze Basin downstream of Three Gorges Dam, Remote Sens. Environ., 152, 251–269, https://doi.org/10.1016/j.rse.2014.06.004, 2014.
Wang, J., Sheng, Y., and Wada, Y.: Little impact of the Three Gorges Dam on recent decadal lake decline across China's Yangtze Plain, Water Resour. Res., 53, 3854–3877, https://doi.org/10.1002/2016WR019817, 2017.
Wang, J., Song, C., Reager, J. T., Yao, F., Famiglietti, J. S., Sheng, Y., MacDonald, G. M., Brun, F., Schmied, H. M., Marston, R. A., and Wada, Y.: Recent global decline in endorheic basin water storages, Nat. Geosci., 11, 926–932, https://doi.org/10.1038/s41561-018-0265-7, 2018.
Wang, X., Ding, Y., Liu, S., Jiang, L., Wu, K., Jiang, Z., and Guo, W.: Changes of glacial lakes and implications in Tian Shan, Central Asia, based on remote sensing data from 1990 to 2010, Environ. Res. Lett., 8, 44052, https://doi.org/10.1088/1748-9326/8/4/044052, 2013.
Wang, X., Liu, S., and Zhang, J.: A new look at roles of the cryosphere in sustainable development, Adv. Clim. Chang. Res., 10, 124–131, https://doi.org/10.1016/j.accre.2019.06.005, 2019.
Wang, X., Guo, X., Yang, C., Liu, Q., Wei, J., Zhang, Y., Liu, S., Zhang, Y., Jiang, Z., and Tang, Z.: Glacial lake inventory of high-mountain Asia in 1990 and 2018 derived from Landsat images, Earth Syst. Sci. Data, 12, 2169–2182, https://doi.org/10.5194/essd-12-2169-2020, 2020.
Wang, X., Guo, X., Yang, C., Liu, Q., Wei, J., Zhang, Y., Liu, S., Zhang, Y., Jiang, Z., and Tang, Z.: Cataloging data set of high Asian ice lakes, National Cryosphere Desert Data Center [data set], https://doi.org/10.12072/casnw.064.2019.db, 2021.
Wangchuk, S. and Bolch, T.: Mapping of glacial lakes using Sentinel-1 and Sentinel-2 data and a random forest classifier: Strengths and challenges, Sci. Remote Sens., 2, 100008, https://doi.org/https://doi.org/10.1016/j.srs.2020.100008, 2020.
Westoby, M. J., Glasser, N. F., Brasington, J., Hambrey, M. J., Quincey, D. J., and Reynolds, J. M.: Modelling outburst floods from moraine-dammed glacial lakes, Earth-Sci. Rev., 134, 137–159, https://doi.org/10.1016/j.earscirev.2014.03.009, 2014.
Williamson, A. G., Banwell, A. F., Willis, I. C., and Arnold, N. S.: Dual-satellite (Sentinel-2 and Landsat 8) remote sensing of supraglacial lakes in Greenland, The Cryosphere, 12, 3045–3065, https://doi.org/10.5194/tc-12-3045-2018, 2018.
Wu, R., Liu, G., Zhang, R., Wang, X., Li, Y., Zhang, B., Cai, J., and Xiang, W.: A Deep Learning Method for Mapping Glacial Lakes from the Combined Use of Synthetic-Aperture Radar and Optical Satellite Images, Remote Sens., 12, 4020, https://doi.org/10.3390/rs12244020, 2020.
Wulder, M. A., Loveland, T. R., Roy, D. P., Crawford, C. J., Masek, J. G., Woodcock, C. E., Allen, R. G., Anderson, M. C., Belward, A. S., Cohen, W. B., Dwyer, J., Erb, A., Gao, F., Griffiths, P., Helder, D., Hermosilla, T., Hipple, J. D., Hostert, P., Hughes, M. J., Huntington, J., Johnson, D. M., Kennedy, R., Kilic, A., Li, Z., Lymburner, L., McCorkel, J., Pahlevan, N., Scambos, T. A., Schaaf, C., Schott, J. R., Sheng, Y., Storey, J., Vermote, E., Vogelmann, J., White, J. C., Wynne, R. H., and Zhu, Z.: Current status of Landsat program, science, and applications, Remote Sens. Environ., 225, 127–147, https://doi.org/10.1016/j.rse.2019.02.015, 2019.
Yao, C., Wang, X., Zhao, X., Wei, J., and Zhang, Y.: Temporal and Spatial Changes of Glacial Lakes in the China-Pakistan Economic Corridor from 1990 to 2018, J. Glaciol. Geocryol., 42, 33–42, https://doi.org/10.7522/j.issn.1000-0240.2020.0009, 2020.
Yao, T., Thompson, L., Yang, W., Yu, W. S., Gao, Y., Guo, X. J., Yang, X. X., Duan, K. Q., Zhao, H. B., Xu, B. Q., Pu, J. C., Lu, A. X., Xiang, Y., Kattel, D. B., and Joswiak, D.: Different glacier status with atmospheric circulations in Tibetan Plateau and surroundings, Nat. Clim. Change, 2, 663–667, https://doi.org/10.1038/NCLIMATE1580, 2012.
Yao, X., Liu, S., Han, L., Sun, M., and Zhao, L.: Definition and classification system of glacial lake for inventory and hazards study, J. Geogr. Sci., 28, 193–205, https://doi.org/10.1007/s11442-018-1467-z, 2018.
Zhang, G.: Data on glacial lakes in the TPE (V1.0) (1990, 2000, 2010). National Tibetan Plateau Data Center [data set], https://doi.org/10.11888/Hydrology.tpe.249459.file, 2018.
Zhang, G., Yao, T., Xie, H., Wang, W., and Yang, W.: An inventory of glacial lakes in the Third Pole region and their changes in response to global warming, Global Planet. Change, 131, 148–157, https://doi.org/10.1016/j.gloplacha.2015.05.013, 2015.
Zhang, M., Chen, F., and Tian, B.: An automated method for glacial lake mapping in High Mountain Asia using Landsat 8 imagery, J. Mt. Sci., 15, 13–24, https://doi.org/10.1007/s11629-017-4518-5, 2018.
Zhao, W., Xiong, D., Wen, F., and Wang, X.: Lake area monitoring based on land surface temperature in the Tibetan Plateau from 2000 to 2018, Environ. Res. Lett., 15, 084033, https://doi.org/10.1088/1748-9326/ab9b41, 2020.
Zheng, G., Allen, S. K., Bao, A., Ballesteros-Cánovas, J. A., Huss, M., Zhang, G., Li, J., Yuan, Y., Jiang, L., Yu, T., Chen, W., and Stoffel, M.: Increasing risk of glacial lake outburst floods from future Third Pole deglaciation, Nat. Clim. Change, 11, 411–417, https://doi.org/10.1038/s41558-021-01028-3, 2021.
- Abstract
- Introduction
- Study area
- Data sources
- Glacial lake inventory methods
- Results
- Discussions
- Data availability
- Conclusions
- Appendix A: Tutorial for the improved uncertainty estimating method
- Author contributions
- Competing interests
- Disclaimer
- Acknowledgements
- Financial support
- Review statement
- References