the Creative Commons Attribution 4.0 License.
the Creative Commons Attribution 4.0 License.
 | 13 Dec 2022
In situ stress database of the greater Ruhr region (Germany) derived from hydrofracturing tests and borehole logs
Michal Kruszewski
Gerd Klee
Thomas Niederhuber
Oliver Heidbach
Between 1986 and 1995, 429 hydrofracturing tests have been carried out in six now-abandoned coal mines and two coal bed methane boreholes at depths between 600 and 1950 m within the greater Ruhr region in western Germany. From these tests, stress magnitudes and orientations of the stress tensor are derived. The majority of hydrofracturing tests were carried out from mine galleries away from mine workings in a relatively undisturbed rock mass. These data along with detailed information have been disclosed recently. In combination with already published material, we provide the first comprehensive stress database of the greater Ruhr region. Our study summarises the results of the extensive in situ stress test campaign and assigns quality to each data record using the established quality ranking schemes of the World Stress Map project. The stress magnitudes suggest predominantly strike-slip stress regime, where the magnitude of the minimum horizontal stress, Shmin, is half of the magnitude of the maximum horizontal stress, SHmax, implying that the horizontal differential stress is high. We observe no particular change in the stress gradient at depth throughout the Carboniferous layers and no significant difference between tests carried out in coal mines and deep boreholes. The mean SHmax orientation varies between 133 ± 13∘ in the westernmost located Friedrich Heinrich coal mine and 168 ± 23∘ in the easternmost located Westphalia coal mine. The mean SHmax orientation, based on 87 data records from this and already published studies, of 161 ± 43∘ is in good agreement with the regional stress orientation observed in northwestern Europe. The presented public database provides in situ stress magnitude and stress orientation data records that are essential for the calibration of geomechanical numerical models on regional and/or reservoir scales for, among others, assessing stability issues of borehole trajectories, caverns, and georeservoirs in general. For an application example of this database, we estimate slip and dilation tendencies of major geological discontinuities, discovered during the 700-year-long coal mining activities in the region. The result, although burdened by high uncertainties, shows that the discontinuities striking in the N–S and NW–SE directions have a higher slip tendency compared to the ones striking ENE–WSW and NNW–SSE, whereas a high dilation tendency is observed for discontinuities striking NNW–SSE and a low dilation tendency for the ones striking ENE–WSW. The stress orientation database is available under https://doi.org/10.24406/fordatis/200 (Kruszewski et al., 2022a), the stress magnitude database is available under https://doi.org/10.24406/fordatis/201 (Kruszewski et al., 2022b), whereas the hydrofracturing test reports are available under https://doi.org/10.24406/fordatis/222 (Kruszewski et al., 2022c).
- Article
(8750 KB) - Full-text XML
- BibTeX
- EndNote


Knowledge of the contemporary 3D stress state in the upper crust is essential information for the design and operation of any type of subsurface operations including extraction of geothermal energy, CO2 storage, or mine flooding (Segall and Fitzgerald, 1998; Henk, 2009; Blöcher et al., 2018; Kruszewski et al., 2021a). The stress state determines, among others, permeability anisotropy, extent and orientation of fractures created during hydraulic fracturing operations, slip, dilation, and stability of geological discontinuities, be it either natural fracture networks or major fault zones. To describe the 3D stress state, forward geomechanical models are used and calibrated with stress magnitude data records within the model volume (e.g. Reiter and Heidbach, 2014; Hergert et al., 2015). For the latter, not only are the number of data records important, but also their quality, which can be used as weights during model calibration (e.g. Lecampion and Lei, 2010; Ziegler and Heidbach, 2020). For the greater Ruhr region located in western Germany (Fig. 1a), mainly due to confidentiality reasons, a comprehensive and public compilation of in situ stress data was missing. As of the recent change of subsurface data regulations in Germany, these data have now become accessible. Furthermore, an assignment of qualities to the individual data records has only been done for some of the data records that show the orientation of the maximum horizontal stress, SHmax (Reiter et al., 2015), using the quality ranking scheme of the World Stress Map (WSM) project (Heidbach et al., 2016). Only recently, Morawietz et al. (2020) presented a quality ranking scheme for stress magnitude data developed for the first German stress magnitude database. However, in their compilation, stress magnitude data for the greater Ruhr region are missing (Fig. 1a).
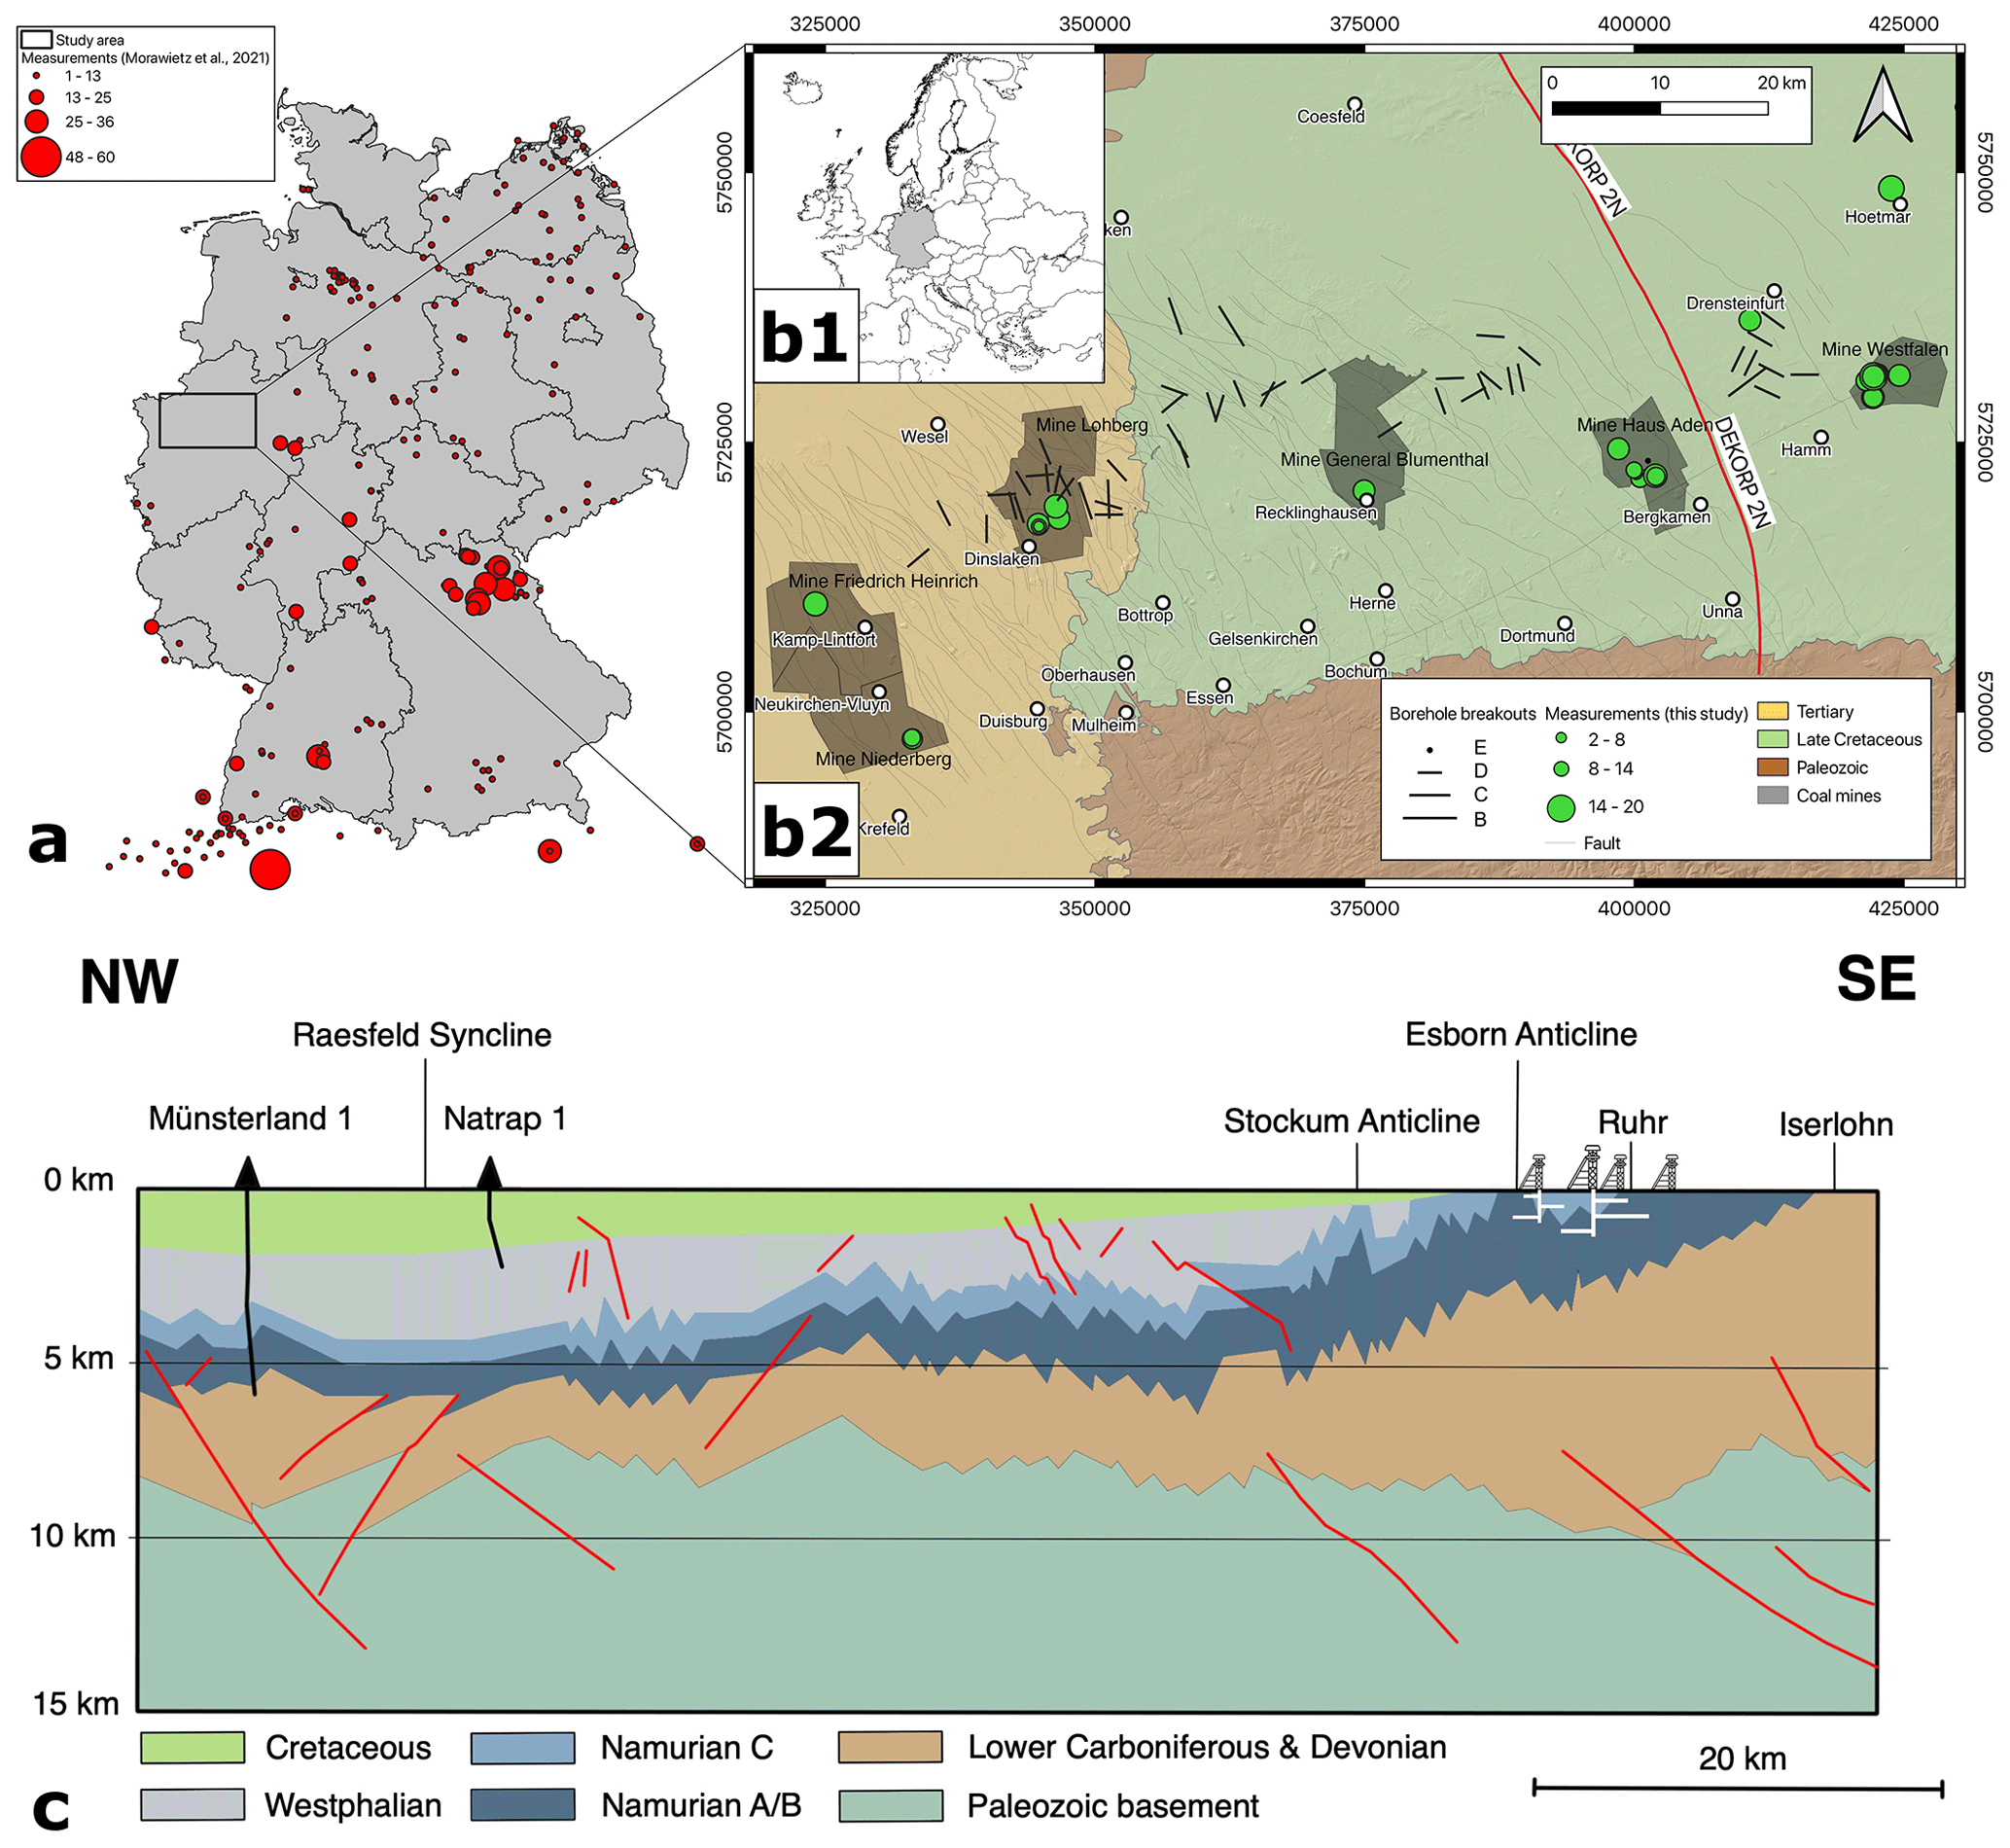
Figure 1(a) A map of Germany with administrative regions and available stress magnitudes from Morawietz et al. (2020); (b1) the location of Germany (marked in grey) within Europe; (b2) a map of the greater Ruhr region with major fault zones (modified after GD NRW, 2017, 2019) and locations of stress magnitude data records described in this study with black shaded areas representing coal mines active in 1980s (black thick lines show the orientation of the maximum horizontal stress, SHmax, available in the World Stress Map database (Heidbach et al., 2018), where line length is proportional to the data quality); DEKORP 2N seismic line (DEKORP, 1990; Stiller et al., 2021) marked in red; (c) a simplified geological cross-section of the northern part of the DEKORP 2N seismic line (DEKORP, 1990) with fault zones marked in red (modified after Drozdzewski, 1988).
The application of established quality ranking schemes is not only important for the model calibration, but also guarantees the comparability of stress data records that result from a wide range of different stress indicators, measurements, and indirect stress information (Amadei and Stephansson, 1997; Ljunggren et al., 2003; Schmitt et al., 2012).
This study presents the first comprehensive public database of stress orientation and stress magnitude data records for the greater Ruhr region, including the application of established quality ranking schemes from the WSM project for the assignment of qualities for each data record. Throughout the years, few publications have already published subsets of our compilation (i.e. Kück, 1988; Müller, 1989, 1991; Stelling and Rummel, 1992; Rummel and Weber, 1993; Kruszewski et al., 2021b, 2022d); however, without making critical information (i.e. test location, depth, testing method, or uncertainty) available. A lack of such information made utilisation of these data (e.g. for the calibration of geomechanical models) impossible and qualities, in most cases, could not be reliably estimated.
We now have access to internal reports that were recently disclosed by the Deutsche Montan Technologie GmbH (DMT) and ConocoPhillips (MeSy, 1994, 1995a, e, f, g, h, i, j, k, l, b, c, and d, and 1996a, b, and c). These reports contain essential and detailed information from 429 hydrofracturing tests, that were performed between 1986 and 1995, in 43 vertical and horizontal boreholes in the greater Ruhr region. This in situ measurement campaign spanned over an east-west range of around 100 km, a north-south range of approximately 55 km, and a depth range of 1.35 km (i.e. between 600 and 1950 m depth) (Fig. 1b). Hydrofracturing tests were carried out in (i) mine galleries of six now-abandoned coal mines, located far away from mine workings in relatively undisturbed rock mass, using short, both vertical and horizontal, exploration boreholes, and in (ii) two deep vertical exploration coal bed methane (CBM) boreholes located to the north of the coal mines in the Münster region.
From the collected data, we derive data records of the magnitudes of the minimum, Shmin, and the maximum, SHmax, horizontal stresses. Additionally, for each borehole, the SHmax orientation was derived based on the orientations of the fractures induced during the hydrofracturing test. The majority of compiled data is presented for the first time to the wider scientific community with full open access. To our knowledge, we present all performed in situ stress tests in the greater Ruhr region along with a detailed description of testing and stress estimation methodology as well as an assignment of data quality using the WSM quality ranking schemes (Heidbach et al., 2016; Morawietz et al., 2020). Additionally, we provide all needed information for utilisation of such data in numerical modelling studies for planning future subsurface activities within the greater Ruhr region and for an evaluation of the state of stress of the Carboniferous layers and its vertical and spatial variability.
This study is split into eight main parts presenting the following: (i) an overview of the geological setting of the greater Ruhr region, (ii) theoretical background on the stress tensor, (iii) a description of each test location, (iv) a description of the hydrofracturing procedures and testing tools, (v) methodology for interpretation and evaluation of the principal stresses based on results from hydrofracturing tests, (vi) results with a quality assignment, (vii) discussion where few ways of utilising the database including slip and dilation tendency analysis of major geological discontinuities in the study region were presented, and (viii) conclusions.
The greater Ruhr region, located east of the Wales–Brabant Massif, is part of an external autochthonous fold and thrust belt of the latest stage of the Variscan orogeny and its Rhenohercynian and Subvariscan zones (Brix et al., 1988; Drozdzewski et al., 2009). The Variscan orogeny developed throughout the Late Paleozoic convergence of Gondwanaland and Euramerican continental masses, where the convergence and collision occurred during the Carboniferous and Devonian geological periods (Ziegler, 1990). The Variscan Deformation Front (VDF) is terminated in the north-east by the Osning fault zone (bordering the Lower Saxony Basin) with an offset of approximately 100 km (Drozdzewski et al., 2009). Significant tectonic activity in the region followed during the Late Triassic. Furthermore, the Ruhr region was affected by the Late Cretaceous transpression and Tertiary extension (Drozdzewski, 1993). The greater Ruhr region constitutes the western part of the Eurasian Plate with its present-day state of stress being a result of a combination of the ridge push from the central and northern segments of the Mid-Atlantic Ridge as well as a northwards directed push of the African continent with respect to Europe (i.e. Alpine collision zone) (Grünthal and Stromeyer, 1994). The studied region is located between the three natural regions of Germany, i.e. Westphalian Lowlands (being part of the North German Plain), composed of rocks of the Late Cretaceous and Quaternary geological periods, in the north; the Rhenish Massif, made up mainly from Paleozoic era rocks, in the south; and the Lower Rhine Plain, consisting mainly of Tertiary-age rocks, to the west (Fig. 1b).
The rock strata of the greater Ruhr region is under the influence of two major fault network systems (Fig. 1b) which both formed by the Variscan orogeny and its main NW–SE shortening direction. The first system is represented by the NE–SW oriented thrusts with steeply inclined to bed-parallel dip angles reaching lengths of 40 km. These thrust faults have a horizontal displacement of tens to hundreds of meters with some reaching up to ∼ 2.5 km. Thrusts are dissected by a network of NW–SE striking normal faults, which results in a horst and graben structure of the region. Few strike-slip faults with varying orientations have also been seen in the region (Brix et al., 1988; Drozdzewski, 1988). The folds observed in the Ruhr region, oriented NE–SW, vary significantly in shape and dimension and have wavelengths of up to 10 km, increasing towards the north, and amplitudes of several hundred meters.
Across the greater Ruhr region, 700-year-long coal mining activities exposed molasse-type clastic sediments of the Upper Carboniferous period, including shales, silt- to coarse-grained sandstones, and coal seams of varied strength, all heavily deformed by folding and thrusting (Bachmann et al., 1971). North of the Ruhr region, Cretaceous strata, in places up to 1.8 km deep (Hesemann, 1965), overlay the Carboniferous layers (Drozdzewski, 1993). Four deep exploratory boreholes (i.e. Münsterland 1 (Hesemann, 1965), Vingerhoets 93 (Eder et al., 1983), Versold 1, and Isselburg 3 (Drozdzewski, 1993)), located north of the Ruhr region, have all reached Devonian strata. The carbonate layers of the Middle and Upper Devonian period, which are part of the Devonian Reef Complex, outcrop south of the Ruhr region close to the city of Iserlohn (Fig. 1c). As of today, there is however no direct proof of Devonian carbonates underlying the coal-bearing Carboniferous strata below the Ruhr region. Nevertheless, the DEKORP 2N seismic line interpretations (DEKORP, 1990) indicate strong reflections, corresponding to a high material contrast at around 5 km depth, which is thought to be the depth of Devonian platform carbonates, encountered in deep boreholes north of the region (Drozdzewski, 1988; Franke et al., 1990; Drozdzewski, 1993). Devonian carbonates below the Ruhr region have been considered as potential geothermal reservoirs (Balcewicz et al., 2021; Kruszewski et al., 2021b).
Given the large lateral variability of stiffness and density as shown in the geological cross-section in Fig. 1c, one of the key questions is if this also has an impact on the geomechanical stratification. Lateral density, strength, and stiffness contrasts have been proposed to cause changes in the stress field (Tingay et al., 2006; Rajabi et al., 2016); however, this has not been proven in general and not in particular for the Ruhr region. The unique data set that we investigate in the following study allows this question to be addressed.
The stress state at a given point is described with a second rank tensor consisting of nine components (Fig. 2a). Due to the conservation of momentum, the so-called stress tensor is symmetric, which means that there exists a coordinate system where shear stresses vanish along the cube faces (Fig. 2b). In this principal axis system, the three remaining stresses are the principal stresses (Jaeger et al., 2007). With the assumption that the vertical stress, Sv, is one of the principal stresses, which is a good approximation in the Earth crust (Zoback, 2007), Shmin and SHmax are also considered as principal stresses. This so-called reduced stress tensor is fully determined with only four components, the SHmax orientation and the magnitudes of Shmin, SHmax, and Sv (Fig. 2c).
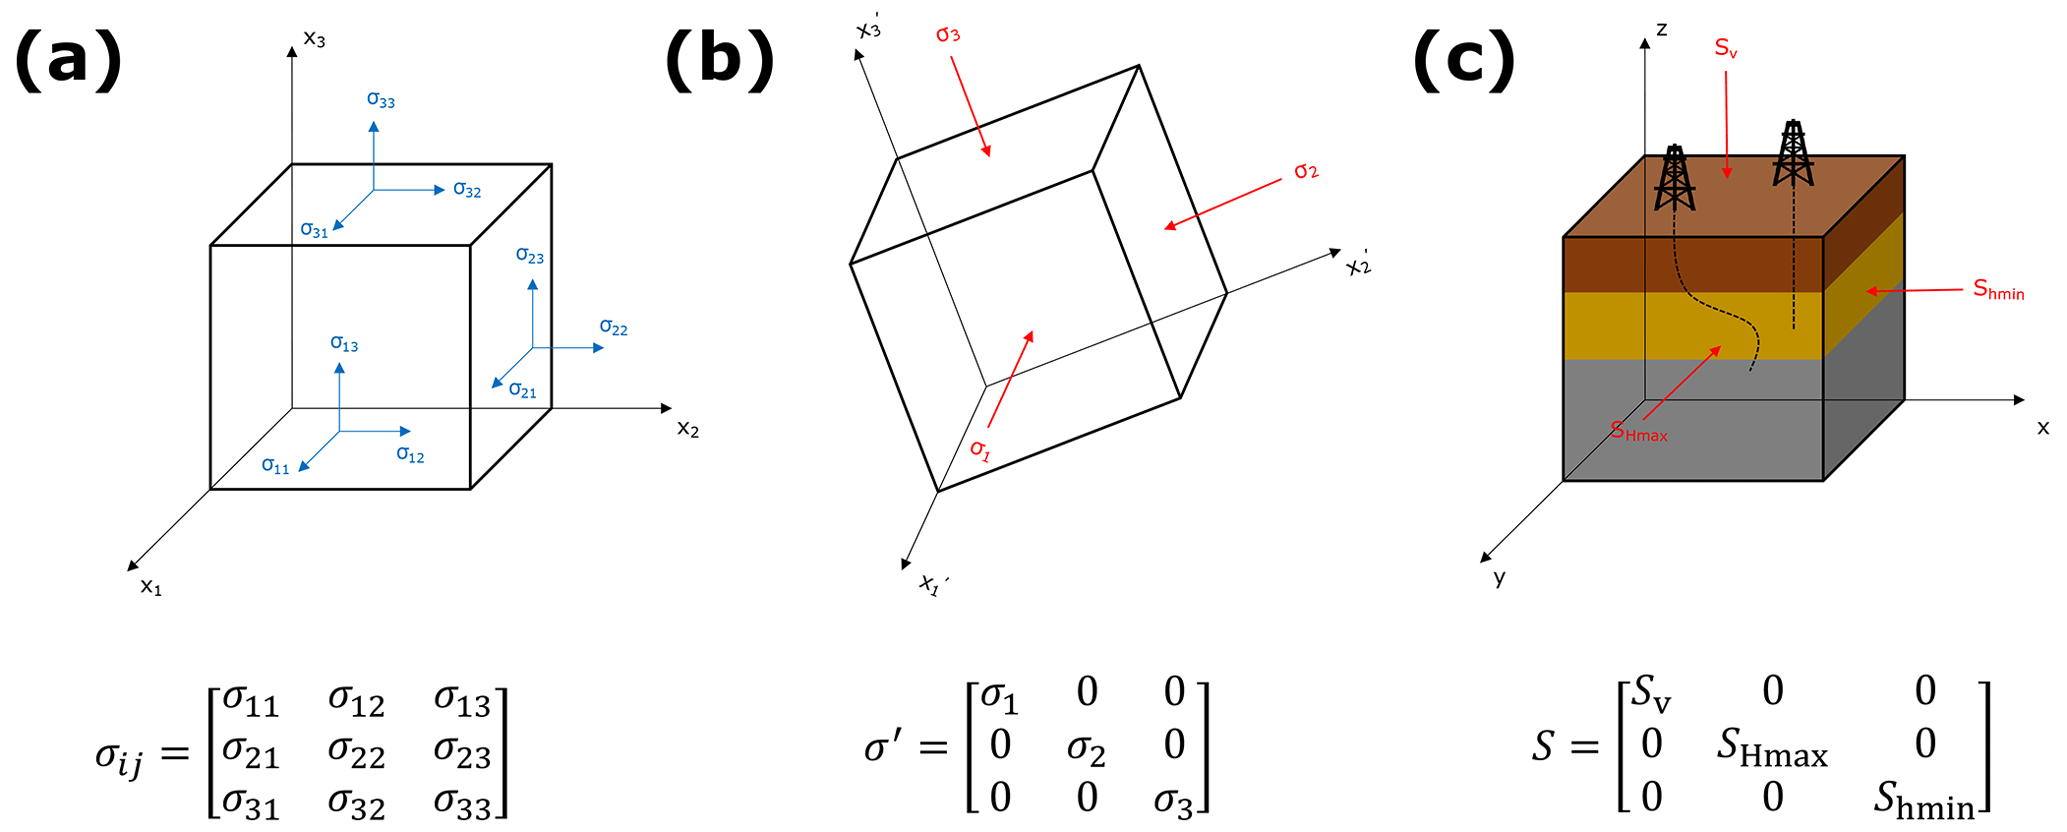
Figure 2The nine stress tensor components define the stress state at any point and enable the determination of a stress vector on any surface within a given body (a). Based on the momentum conservation, a stress tensor has to be symmetric, which means that a coordinate system exists where shear stresses are negligible along the cube faces (b). In this so-called principal axis system, remaining stresses are called principal stresses. With an assumption that vertical stress, Sv, is a principal stress, which is a common assumption within the Earth crust, minimum, Shmin, and maximum, SHmax, horizontal stresses are also considered to be principal stresses (c). As a result, the so-called reduced stress tensor can be fully determined with only four components including SHmax orientation and magnitudes of Shmin, SHmax, and Sv.
The test locations where the hydrofracturing tests were carried out ranged from the city of Hoetmar in the Münster region within the Westphalian Lowlands to the east, and mine Friedrich Heinrich in the vicinity of Kamp-Lintfort in the eastern part of the Lower Rhine Plain to the west. The detailed locations of the hydrofracturing tests as well as coal mines, active around the time of the tests, are presented in Fig. 1b. Below, a brief description of each test location and penetrated lithology is presented. The depth of measurements indicated throughout the paper are expressed using the actual depth below the surface and not the NHN values, with the latter being common for the German mining industry.
4.1 Kamp-Lintfort (Friedrich Heinrich mine)
Thirty hydrofracturing tests on the premises of the Friedrich Heinrich mine in the city of Kamp-Lintfort were carried out at a depth of 586 m, around 1000 m south-west from the shaft IV, in two boreholes. The first borehole is vertical with a length of 40 m drilled in compact claystone–siltstone series. The second is a 37 m long horizontal borehole drilled towards the NW direction in compact claystone–siltstone series. The tests were located in Middle Witten formations within the Westphalian A stage of the Carboniferous period.
4.2 Neukirchen-Vluyn (Niederberg mine)
On the premises of the Niederberg mine in the city of Neukirchen-Vluyn, 27 hydrofracturing tests were carried out at a depth of 630 m in three boreholes from which two were horizontal and one vertical. The horizontal wells were drilled with azimuths of 120 and 97∘ N in both sandstones and slates, whereas the vertical borehole penetrated mainly sandstones.
4.3 Dinslaken (Lohberg mine)
On the premises of the Lohberg coal mine in the vicinity of the city of Dinslaken, 84 hydrofracturing tests were performed in 10 boreholes. Four test locations were located on the fifth level (i.e. at a depth of 1315 m), near shaft II, with a maximum horizontal distance between test locations of around 2500 m. All test locations except one were located south of the Bruckhauser fault. Drilled boreholes had a length between approximately 33 and 60 m and penetrated either compact sandstone or claystone series with interlayering coal series. The horizontal boreholes were drilled in both NE and E directions. All boreholes were drilled in Upper Bochum formations within the Westphalian A stage of the Carboniferous period.
4.4 Recklinghausen (General Blumenthal mine)
In three boreholes in the General Blumenthal coal mine in the vicinity of the city of Recklinghausen, 34 hydrofracturing tests were carried out. The drilling operations took place on the ninth level of the coal mine at depth of 975 m directly below the Dickebank coal seam. The horizontal boreholes were drilled along both NW and NNE directions. All boreholes, each 40 m length, were drilled in the sandstone series of the Upper Bochum formations of the Westphalian A stage of the Carboniferous period.
4.5 Bergkamen (Haus Aden mine)
Seventy-six hydrofracturing tests were performed at two depths levels, i.e. 750 and 998 m in 10 boreholes within the Haus Aden coal mine in the vicinity of the city of Bergkamen. The boreholes drilled at 750 m depth, two of which were vertical and two horizontal, had a length of 38 to 42 m and penetrated mainly compact medium-to-fine grained sandstones, claystones, and few coal seams. The horizontal boreholes at those depths were drilled in the NE directions. At a depth level of 998 m, six boreholes (two of which were horizontal and drilled in the NE direction) with lengths ranging between 40 and 76 m were drilled. Tests at depth of 998 m were carried out in the Middle Bochum formations, whereas tests at depth of 750 m were carried out within the Upper Bochum formations. The formations penetrated by the boreholes in the Haus Aden mine belong to the Westphalian A stage of the Carboniferous period.
4.6 Hamm (Westphalia mine)
In the Westphalia coal mine in the vicinity of the city of Hamm (Westph.), 149 hydrofracturing tests were carried out in 13 boreholes at two depths levels, i.e. 1030 and 1250 m, where the maximum horizontal distance between tests amounted to approximately 2100 m. At depth of 1300 m, four boreholes, two of which were horizontal (drilled in both NE and NW directions), with a length between 40 and 50 m were drilled. The penetrated formations included mainly compact or fractured sandstone and, occasionally, coal layers. At depth of 1250 m, nine boreholes with lengths between 39 and 43 m were drilled into compact sandstone layers and some coal layers. All tests were carried out in the Middle Bochum formations of the Westphalian A stage of the Carboniferous period.
4.7 Münster area (Hoetmar and Drensteinfurt)
As a part of a coal bed methane exploration program, two deep vertical boreholes (i.e. Natrap-1 and Rieth-1) were drilled around 20 km south from the city of Münster, north of the Ruhr region. In both boreholes, located approximately 17 km away from each other, hydrofracturing and permeability tests were carried out in cased and open hole borehole sections. In the Natrap-1 well, located approximately 1.5 km north of the city of Hoetmar, cased hole tests were carried out in three perforated sections between 1380 and 1949 m depth, within eleven coal seams, and open hole tests between 1418 and 1935 m depth. In total, 17 hydrofracturing tests were carried out in both Westphalian A and B stages of the Carboniferous geological period in the Natrap-1 borehole. In the Rieth-1 borehole, located around 4 km south-west of the city of Drensteinfurt, hydrofracturing tests were carried out in 10 perforated cased borehole sections at depths between 1082 and 1582 m and open borehole sections between depths of 1694 and 1705 m. In total, 12 hydrofracturing tests were performed in coal seams and coal-bearing formations in the Westphalian A stage of the Carboniferous geological in the Natrap-1 borehole. An estimation of hydrofracturing tensile strength and fracture breakdown pressure was only possible for open hole tests, whereas no tests of the orientation of SHmax were carried out in the deep boreholes, primarily due to the difficulty of estimating fracture orientation in perforated borehole sections.
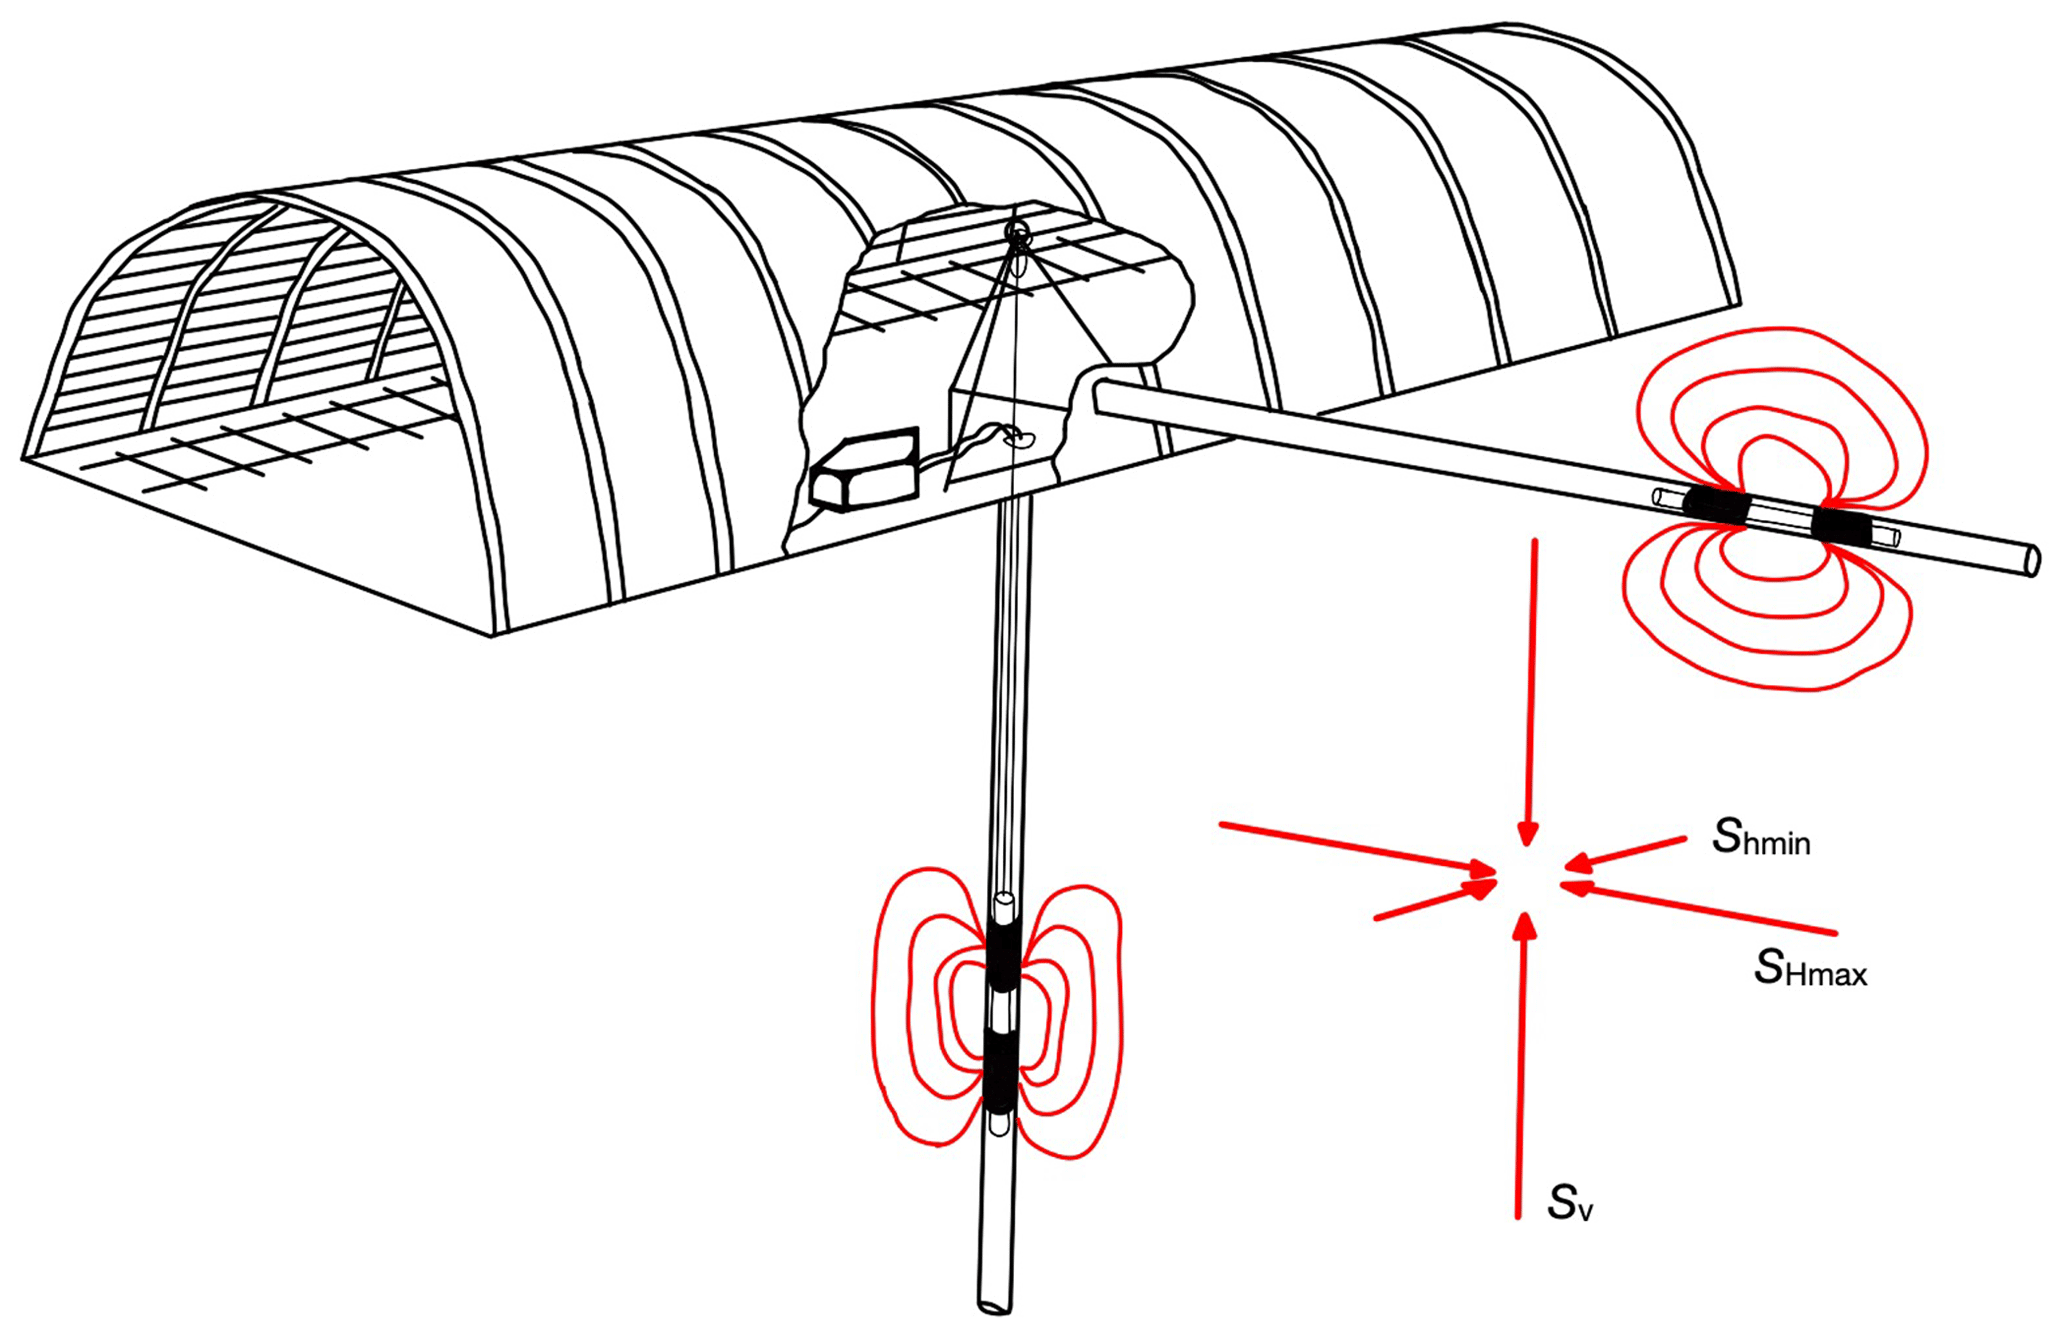
All hydrofracturing tests were carried out by the former MeSy GmbH (now Solexperts GmbH) and their proprietary testing equipment designed for deep mines and conditions of high differential pressures ranging between 30 and 40 MPa. The packer system was designed for 48 to 60 mm diameter boreholes. The packer tool was tripped into a vertical borehole on a steel cable together with two hydraulic lines of 6 to 8 mm inside diameter for both packer and zonal pressurisation. The length of each packer element was about 1 m and the interval between packers had a length of around 0.6 m. Pressure data were recorded at the wellhead with a mechanical data acquisition system respecting the safety requirements. A schematic picture of a hydrofracturing test in a vertical and horizontal borehole in a coal mine is presented in Fig. 3. In each borehole, of about 40 m in length multiple interval sections were tested beginning from the bottom of the borehole and moving towards the wellhead. The following procedure was conducted at each interval: (i) inflation of the packer system at the desired depth; (ii) pressurising of the test interval to a small differential pressure to ensure that the selected location is suited for hydrofracturing test (i.e. proving that no significant open fractures exist at the depth of interest); (iii) pressurising the interval until formation breakdown (i.e. fracture initiation) with a pumping rate of a few L min−1, termination of fluid injection, and system shut-in; (iv) several repressurisations of the test interval until constant injection pressure is reached (so-called refrac test), termination of injection and shut-in to determine refrac (or reopening) and instantaneous shut-in pressures; and (v) deflating the packer system and moving to another test section. A schematic example of a hydrofracturing test from one of the coal mines in the Ruhr region with its characteristic phases is presented in Fig. 4a. After all hydrofracturing tests were carried out in a given borehole, in most cases, the double packer tool was replaced with the impression packer tool consisting of a single packer element with a soft rubber membrane and a magnetic single shot for a test of the fracture orientation. In deep boreholes, in both cased and open hole borehole sections, similar procedures to the ones in coal mines, as described above, were utilised with few improvements including, among others, utilising an additional computer-based digital data acquisition system rather than a mechanical pressure recording device.
6.1 Coal mines
To interpret stress magnitudes based on the pressure curves recorded during hydrofracturing tests conducted in anisotropic and fractured Carboniferous rock mass (Fig. 4), inversion techniques following the classical hydraulic fracturing theory (Hubbert and Willis, 1957; Amadei and Stephansson, 1997; Haimson and Cornet, 2003; Schmitt et al., 2012) were applied. For its application, it has been assumed that (i) a borehole is aligned with a principal stress axis. Such an assumption will be valid mainly for vertical boreholes, located away from mine workings or in deep boreholes; (ii) rock mass is homogeneous and isotropic. Neglecting coal seams, the compact sandstone and siltstone layers fulfill this assumption, i.e. fracture propagation remains not affected by the properties of the rock mass; (iii) fracturing fluid does not penetrate the rock prior to the fracture initiation. As the permeability of the rock mass of the Carboniferous rocks is extremely low, this assumption remains valid; (iv) once the fracture is initiated, it propagates in the direction perpendicular to the orientation of the Shmin. As this assumption remains true for vertical boreholes, it may not be true for the horizontal boreholes in cases when a borehole is not aligned with a principal stress axis. In few cases, drilling direction of horizontal boreholes was selected based on results from a vertical borehole accounting for mine geometry restrictions. For other cases, the orientation of horizontal principal stresses was unknown prior to testing and drilling direction was limited by the mine geometry. In a case of a borehole not being aligned with a principal stress axis, fracture orientation was excluded from the further analysis.
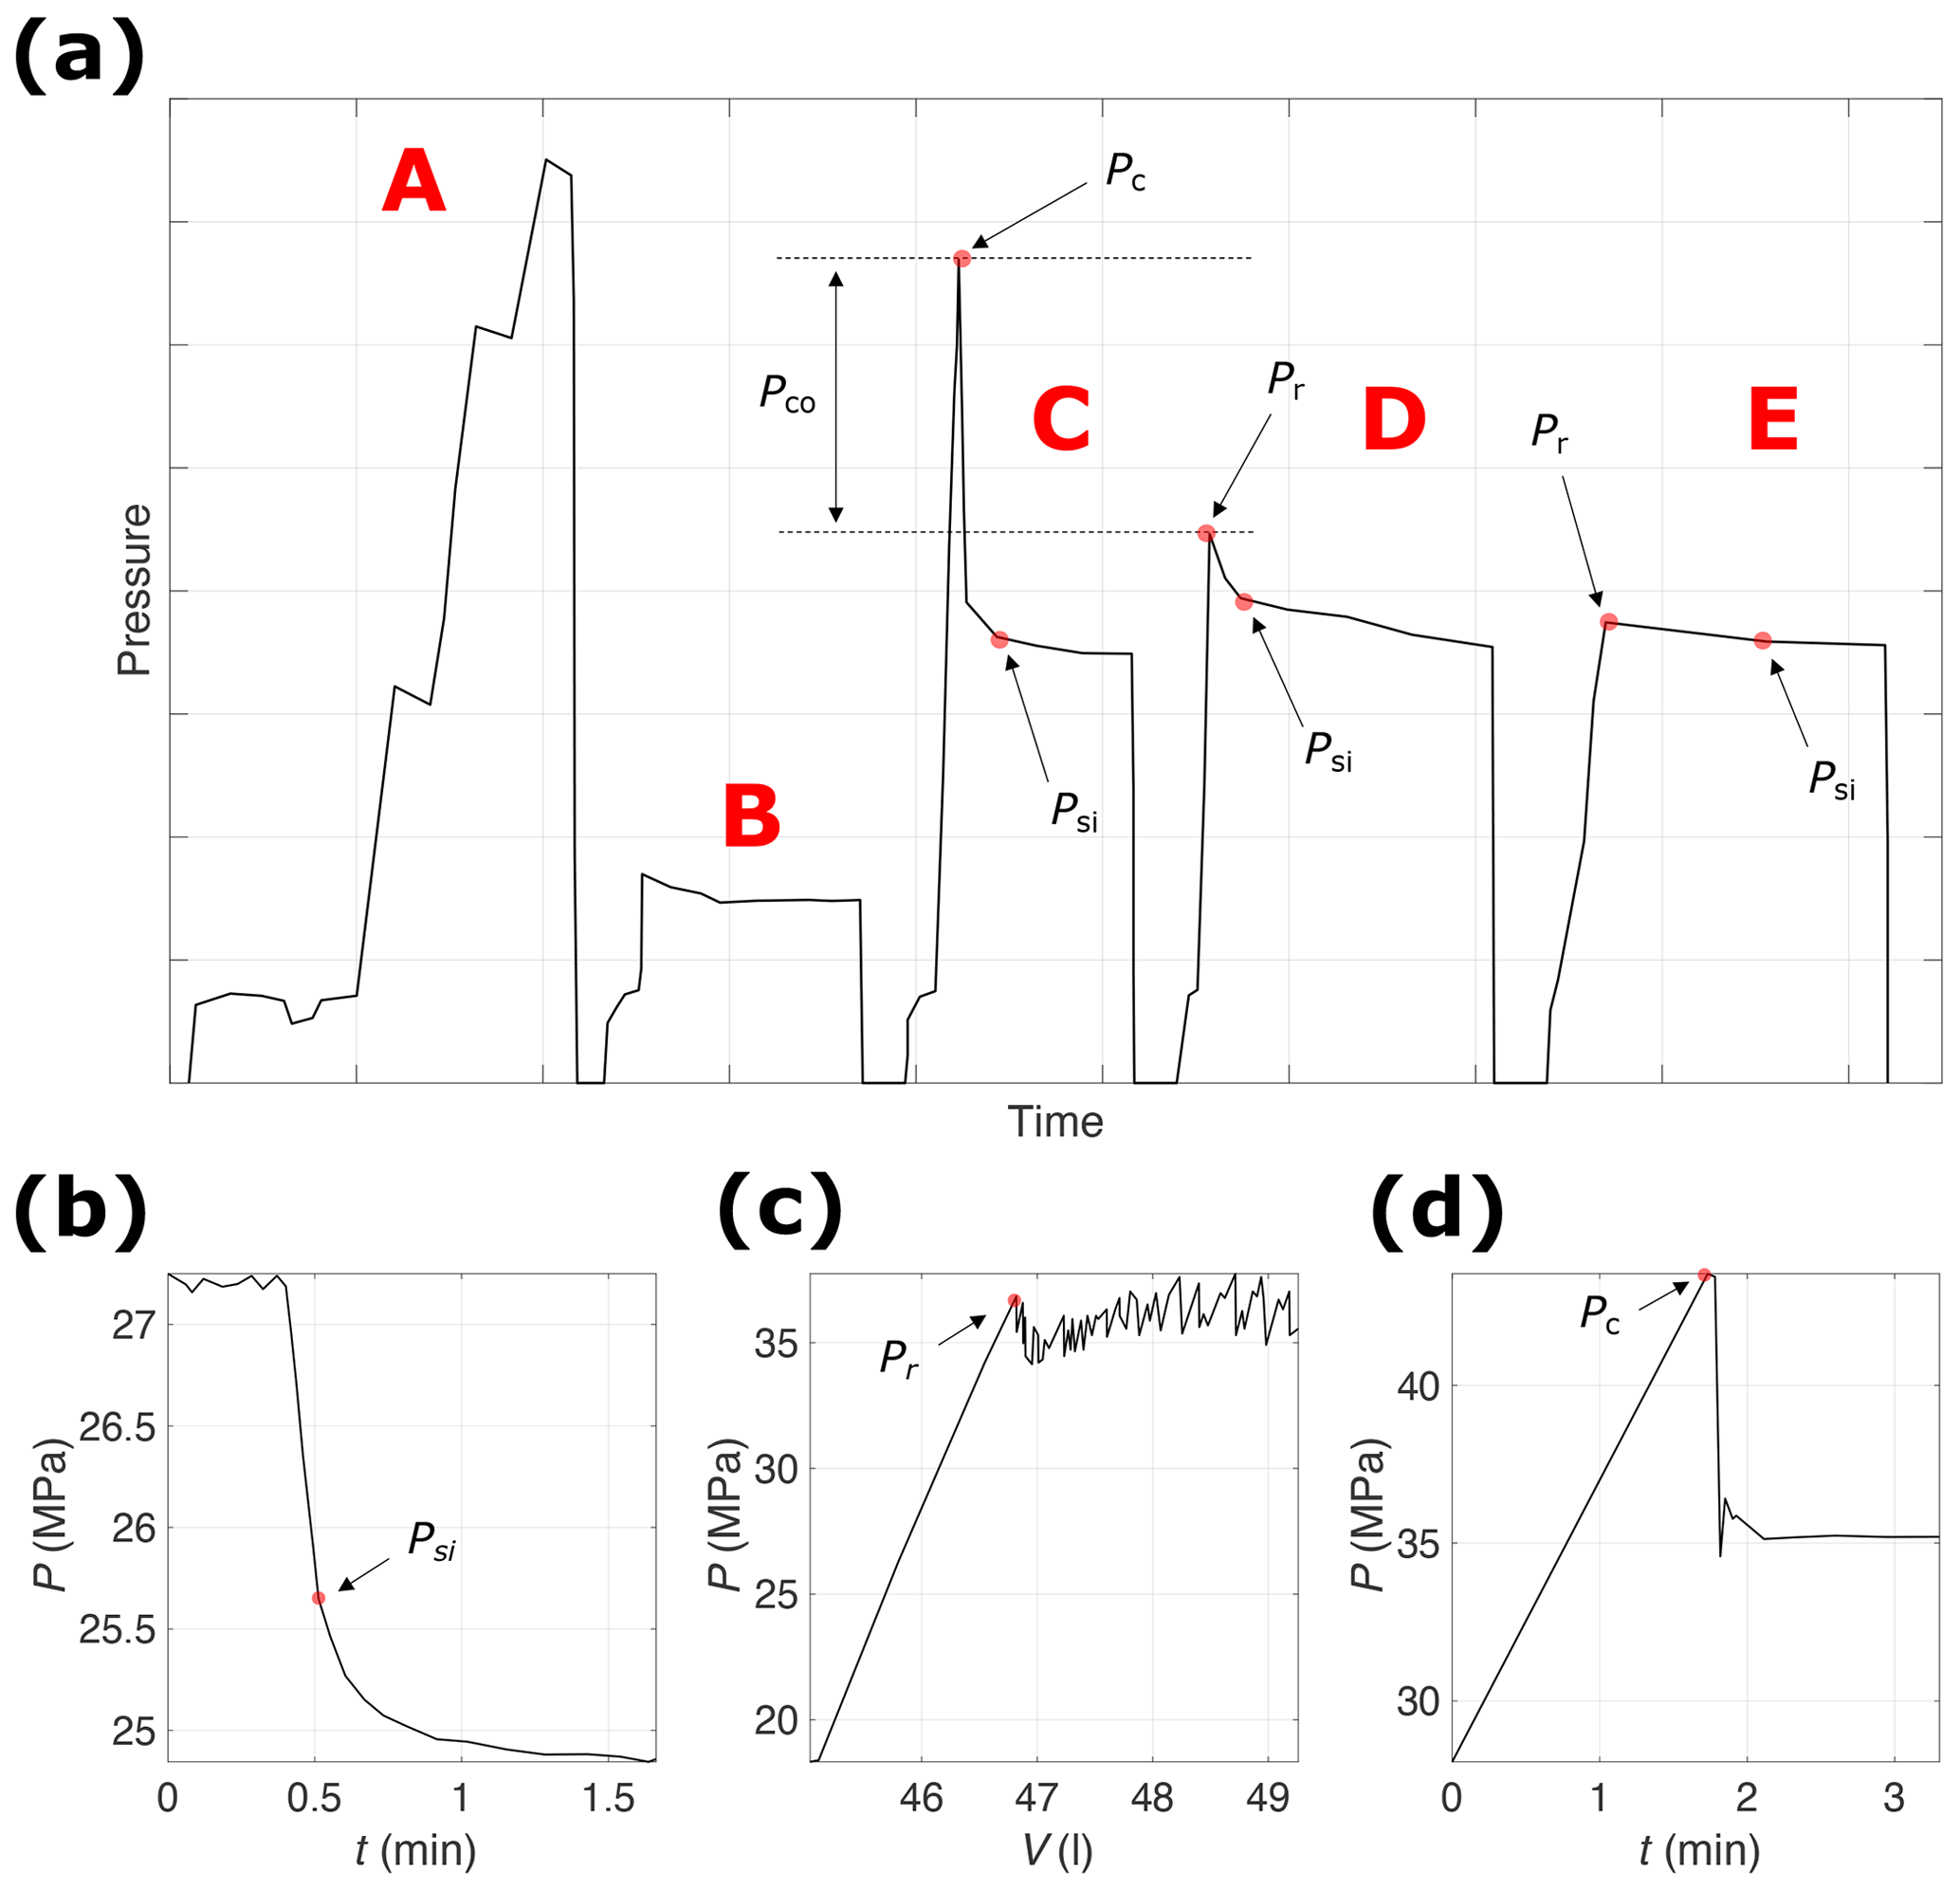
Figure 4(a) A schematic example of a hydrofracturing test carried out in a coal mine within the Ruhr region (A – packer inflation, B – pressure pulse test, C – fracture initiation test, D – first refracturing test, and E – second refracturing test, Pc – breakdown pressure at fracture initiation, Pr – fracture reopening pressure, Psi – shut-in pressure during fracture closure, Pco – rock mass (hydrofracturing) tensile strength). An example of a typical hydrofracturing test carried out in an open hole section of the Natrap-1 well at true vertical depth of 1584 m (MeSy, 1995d) with methodology for estimation of (b) Psi, (c) Pr, and (d) Pc.
A schematic example of a hydrofracturing test from one of the coal mines in the Ruhr region with estimates of the shut-in pressure during fracture closure, Psi, fracture reopening pressure, Pr, the rock mass (hydrofracturing) tensile strength, Pco, and the breakdown pressure at fracture initiation, Pc, is presented in Fig. 4a. Assuming negligible pore pressure, P0, in impermeable and compact Carboniferous rock mass within the Ruhr region, for a case of vertical boreholes, where a vertical fracture was induced, Shmin is assumed to be equal to Psi:
For the case of vertical boreholes and vertical fracture, SHmax was computed as follows:
Utilising the bulk density, ρb, of the rock mass of 2500 kg m−3, based on ρb of the Ruhr sandstone (Brenne, 2016; Duda and Renner, 2012), and the true vertical depth (TVD) of a test location, z, Sv was computed using the following:
Although ρb of the Carboniferous rocks in the greater Ruhr region could be lower (in the case of coal seams) or higher (in the case of siltstones or shales) than 2500 kg m−3, this ρb value is considered as a good first-order average approximation for the study region.
In a case of a horizontal borehole aligned with SHmax orientation and a vertical fracture induced, estimation of Shmin was calculated according to Eq. (1). If a horizontal borehole was drilled along the SHmax orientation, instead of estimating SHmax magnitude as in the case of a vertical well, Sv magnitude was estimated instead,
For the case of horizontal boreholes aligned with Shmin orientation and a radial fracture, Shmin estimation follows Eq. (1). The same goes for the estimation of Shmin from horizontal boreholes aligned with Shmin orientation and a vertical fracture. Additionally, in this particular case, Sv was calculated with Eq. (4). For a case of horizontal boreholes aligned with Shmin orientation and a horizontal fracture, Sv was assumed to be equal to Psi,
whereas SHmax, for this particular case, was computed as follows:
The results from vertical boreholes can be considered to yield better quality than horizontal boreholes, due to the uncertainty connected to their alignment with a principal stress axis.
6.2 Deep boreholes
In deep boreholes, the shut-in pressure was determined using a three-step analysis of the pressure plots which included: (i) pressure vs. flow rate plot, where the moment at which flow is stopped was used to estimate an upper bound on Psi; (ii) the so-called Muskat pressure plot (Muskat, 1937) for estimating the lower bound on Psi, assuming that the linear part of the plot characterises radial flow (i.e. stimulated fracture is closed); and (iii) within the two limits, Psi value marks the transition from a rapid linear pressure drop to a diffusion dominated pressure decrease, where the transition can be determined by a tangent (i.e. inflection point) method (Fig. 4b). In some hydrofracturing tests, determination of Psi could be only carried out through pressure versus flow rate plots. Considering the system stiffness, Pr was constrained based on the deviation of the linear pressure versus injected volume plot (Fig. 4c) which indicates fracture opening. Pc was determined as the maximum pressure registered during the fracture initiation phase of a hydrofracturing test (Fig. 4d). As the analysed deep boreholes were drilled vertically, Eqs. (1) and (2) were used to estimate Shmin and SHmax, respectively. Equation (3) and an assumption of ρb of the rock mass of 2500 kg m−3 was used to estimate Sv from the two deep boreholes.
7.1 Fracture initiation, refracturing, and shut-in pressure
The detailed results of Psi, Pr, Pc, and Pco averaged within each borehole and their uncertainties are presented in Table 1. Both Psi and Pr show relatively small uncertainties amounting to values between 2 and 4 MPa and present no significant variations, except increasing magnitudes with depth. Characteristic pressure peaks for fracture reopening pressure during subsequent slow pumping rates were observed. Pressures only slightly decreased during shut in, which is an indication of extremely low rock permeability. Pc, on the other hand, shows significant variations due to local rock strength variations and relatively high uncertainties of about 5 MPa on average. Pc values are high, approaching, at times, technical limits of the testing tool. The tensile strength of the rock mass, computed from the in situ stress tests, can be considered as high, with an average tensile strength of 6.5 MPa for the study region. An increasing trend of Pco with depth was observed.
Table 1Results of hydrofracturing tests performed across the greater Ruhr region (TVD – true vertical depth, Li – length of a test interval, Nm – number of stress magnitude tests, Psi – shut-in pressure during fracture closure, Pr – fracture reopening pressure, Pc – breakdown pressure at fracture initiation, Pco – rock mass (hydrofracturing) tensile strength). Easting and northing were presented according to the EPSG:31466 geographical projection.
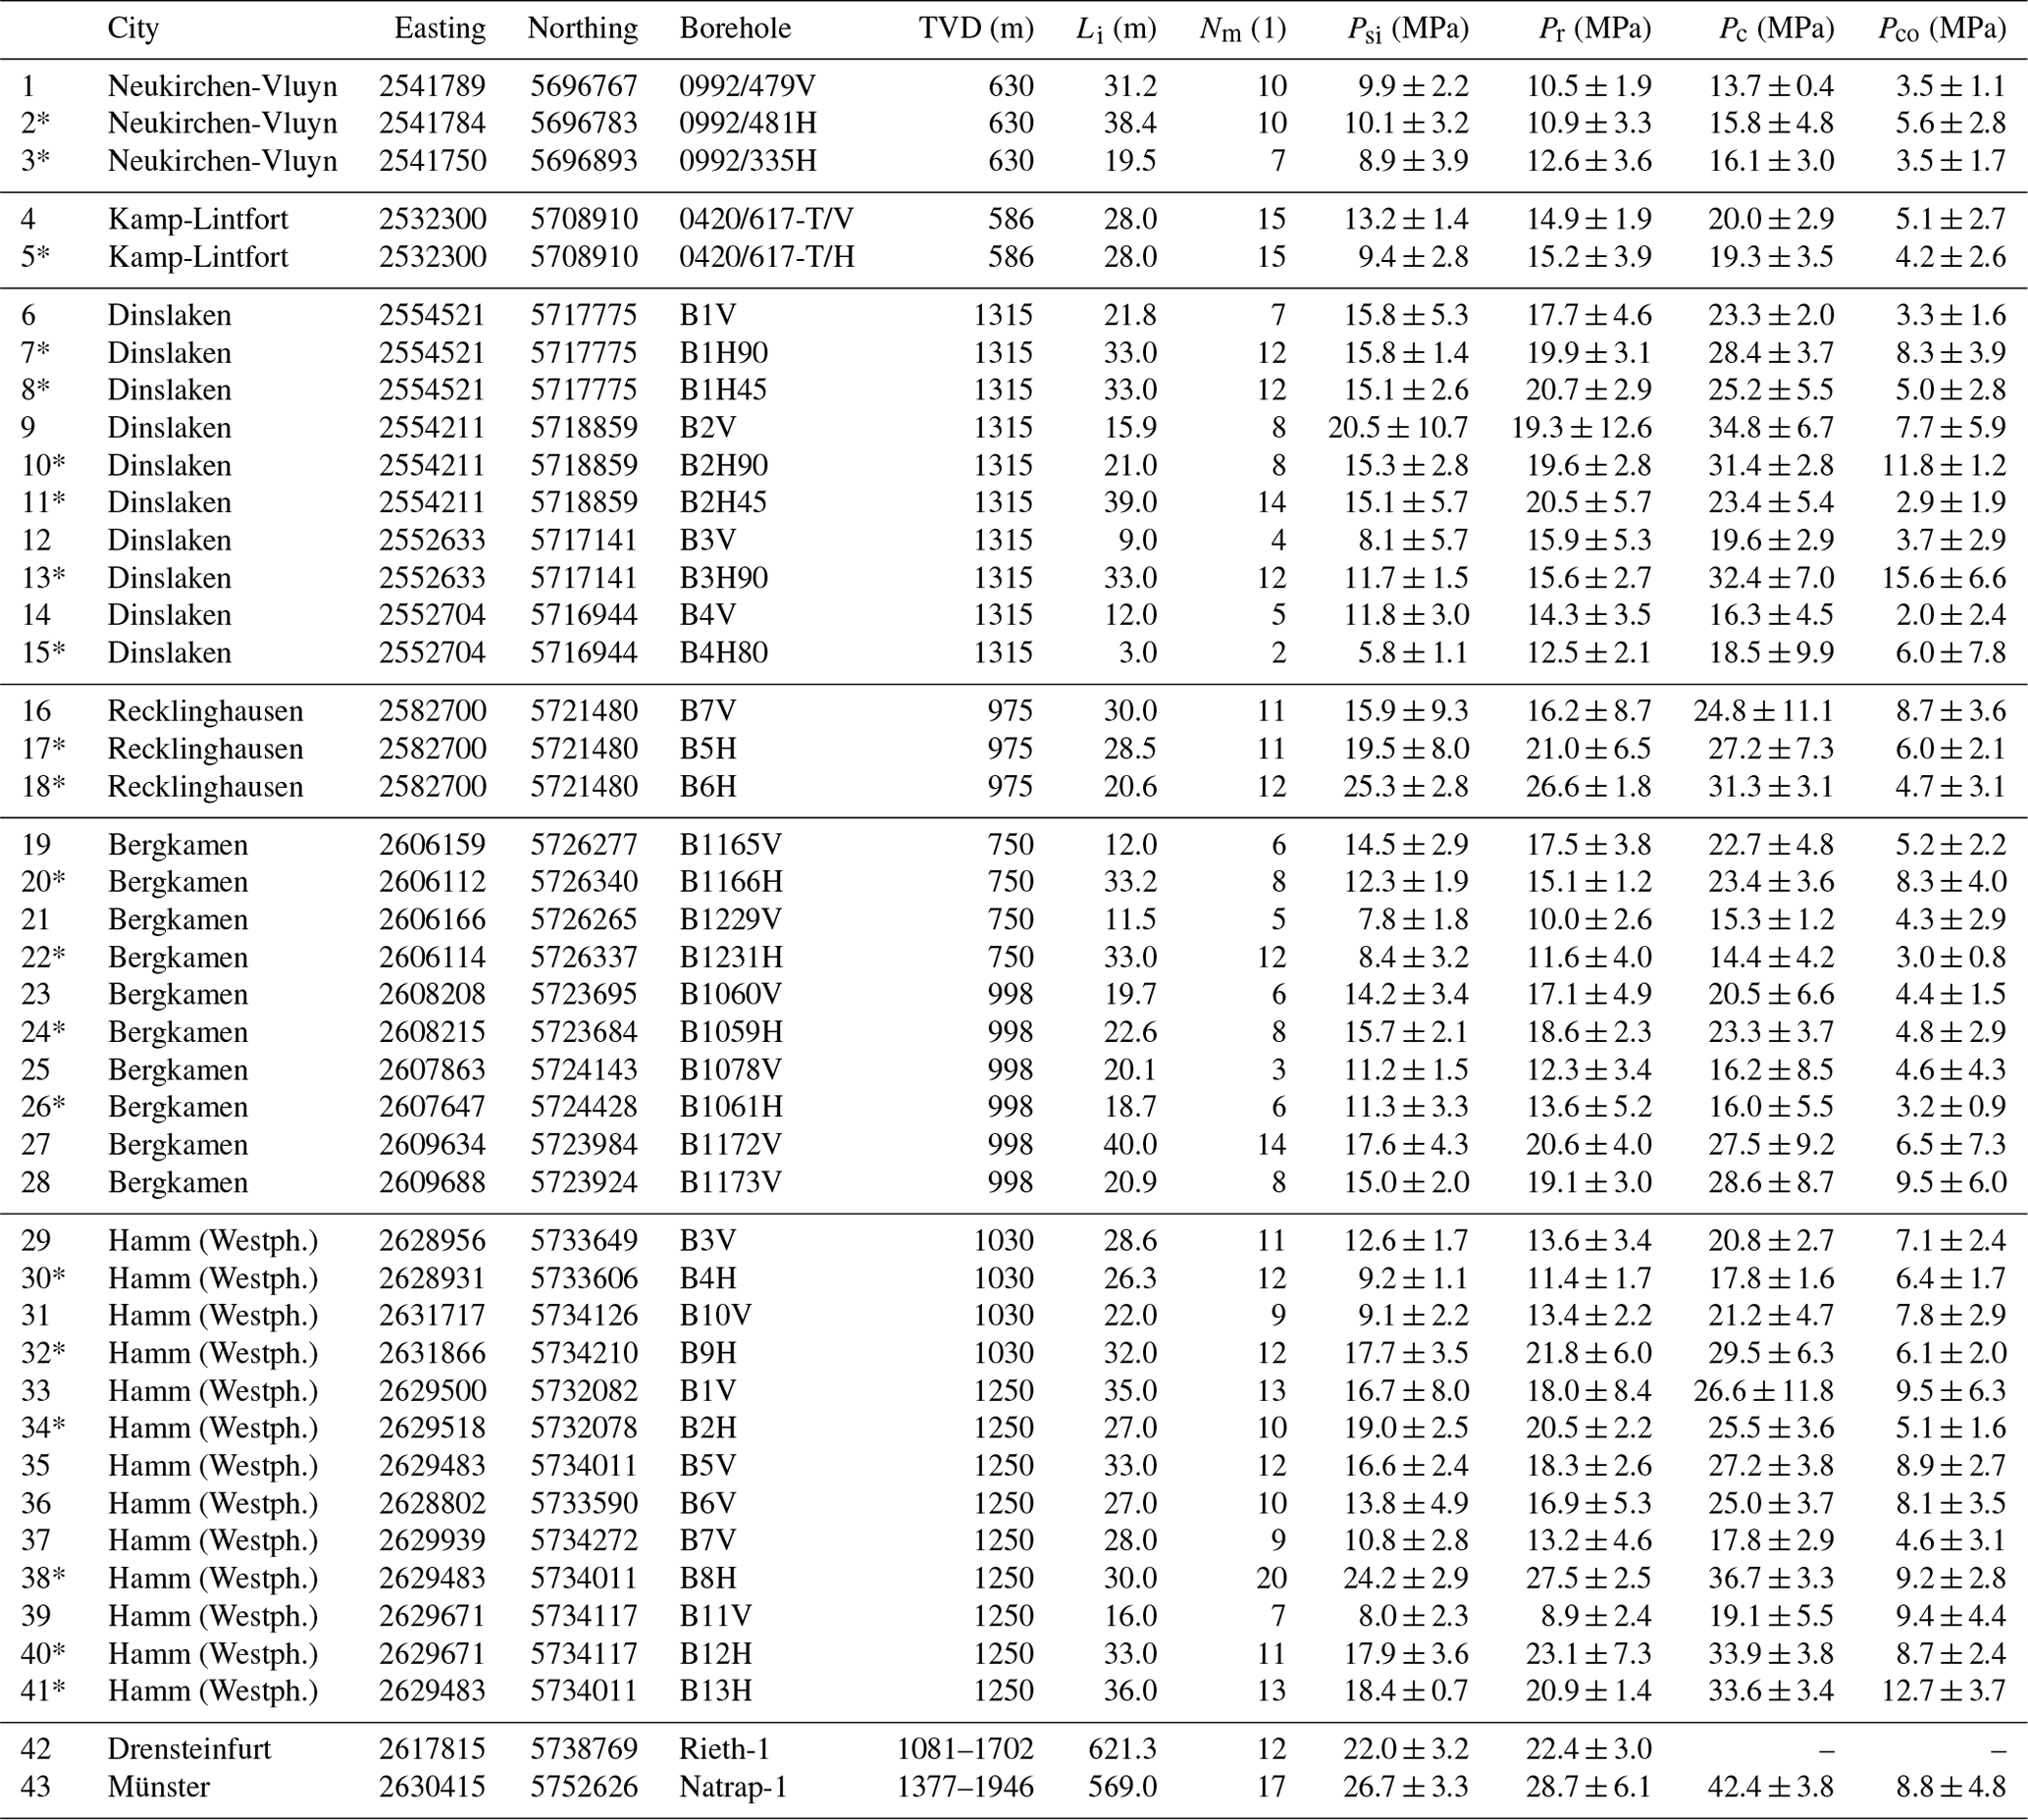
The data records presented are average values for each borehole; ∗ horizontal borehole.
7.2 In situ stress magnitudes and quality assignment
The results of the determined in situ stress magnitudes are presented in Table 2. Based on the collected data, it can be observed that Shmin is significantly lower than the vertical stress (with an average ratio of 0.6), whereas SHmax is on average around 1.9 times higher than the Shmin, proving high differential horizontal stresses at depth in the studied area. The vertical stress derived from the horizontal boreholes agrees with the vertical stress computed for the overburden bulk density of 2500 kg m−3, with a few tests slightly exceeding this value. The SHmax magnitude is higher than the vertical stress with an average ratio of 1.2. However, there is an always-present uncertainty related especially to the estimation of SHmax based on the classical hydraulic fracturing approach used in this study, values of SHmax from both coal mines and deep boreholes are comparable, and therefore should be treated as reliable. Generally, the studied region represents strike-slip stress regime, where (Fig. 5a). Based on the average stress values from each test location presented in Table 3, gradients of Shmin, SHmax, and Sv valid for depths between 0.6 and 1.7 km with their coefficient of determination, R2, are as follows:

Figure 5(a) In situ stress magnitudes recorded across the greater Ruhr region based on averaged values from each test location (differentiation was made for values from different depth levels in the same coal mine) with trend lines computed based on Eqs. (7), (8), and (9) (see Table 3 for the actual values; TVD – true vertical depth); (b) mean stress ratio, k (i.e. ratio of average horizontal stress and the vertical stress), based on the averaged stress magnitudes recorded across the greater Ruhr region (see Table 3 for actual values). The average k of 0.86 based on hydrofracturing test results acquired from this study is marked with a solid black line. For comparison, k computed based on the approach by Sheorey (1994) for Young's modulus, Esh, of 36 ± 11 GPa, based on laboratory measurements on core samples from the Westphalia coal mine (MeSy, 1994), is presented with solid red line and area shaded in red represents its standard deviation.
Table 2Results of hydrofracturing tests performed across the greater Ruhr region (TVD – true vertical depth, Li – length of a test interval, Nm – number of stress magnitude tests, Shmin – magnitude of the minimum horizontal stress, SHmax – magnitude (and orientation) of the maximum horizontal stress, Sv – magnitude of the vertical horizontal stress, Qa – quality of the SHmax orientation data record). Easting and northing were presented according to the EPSG:31466 geographical projection.
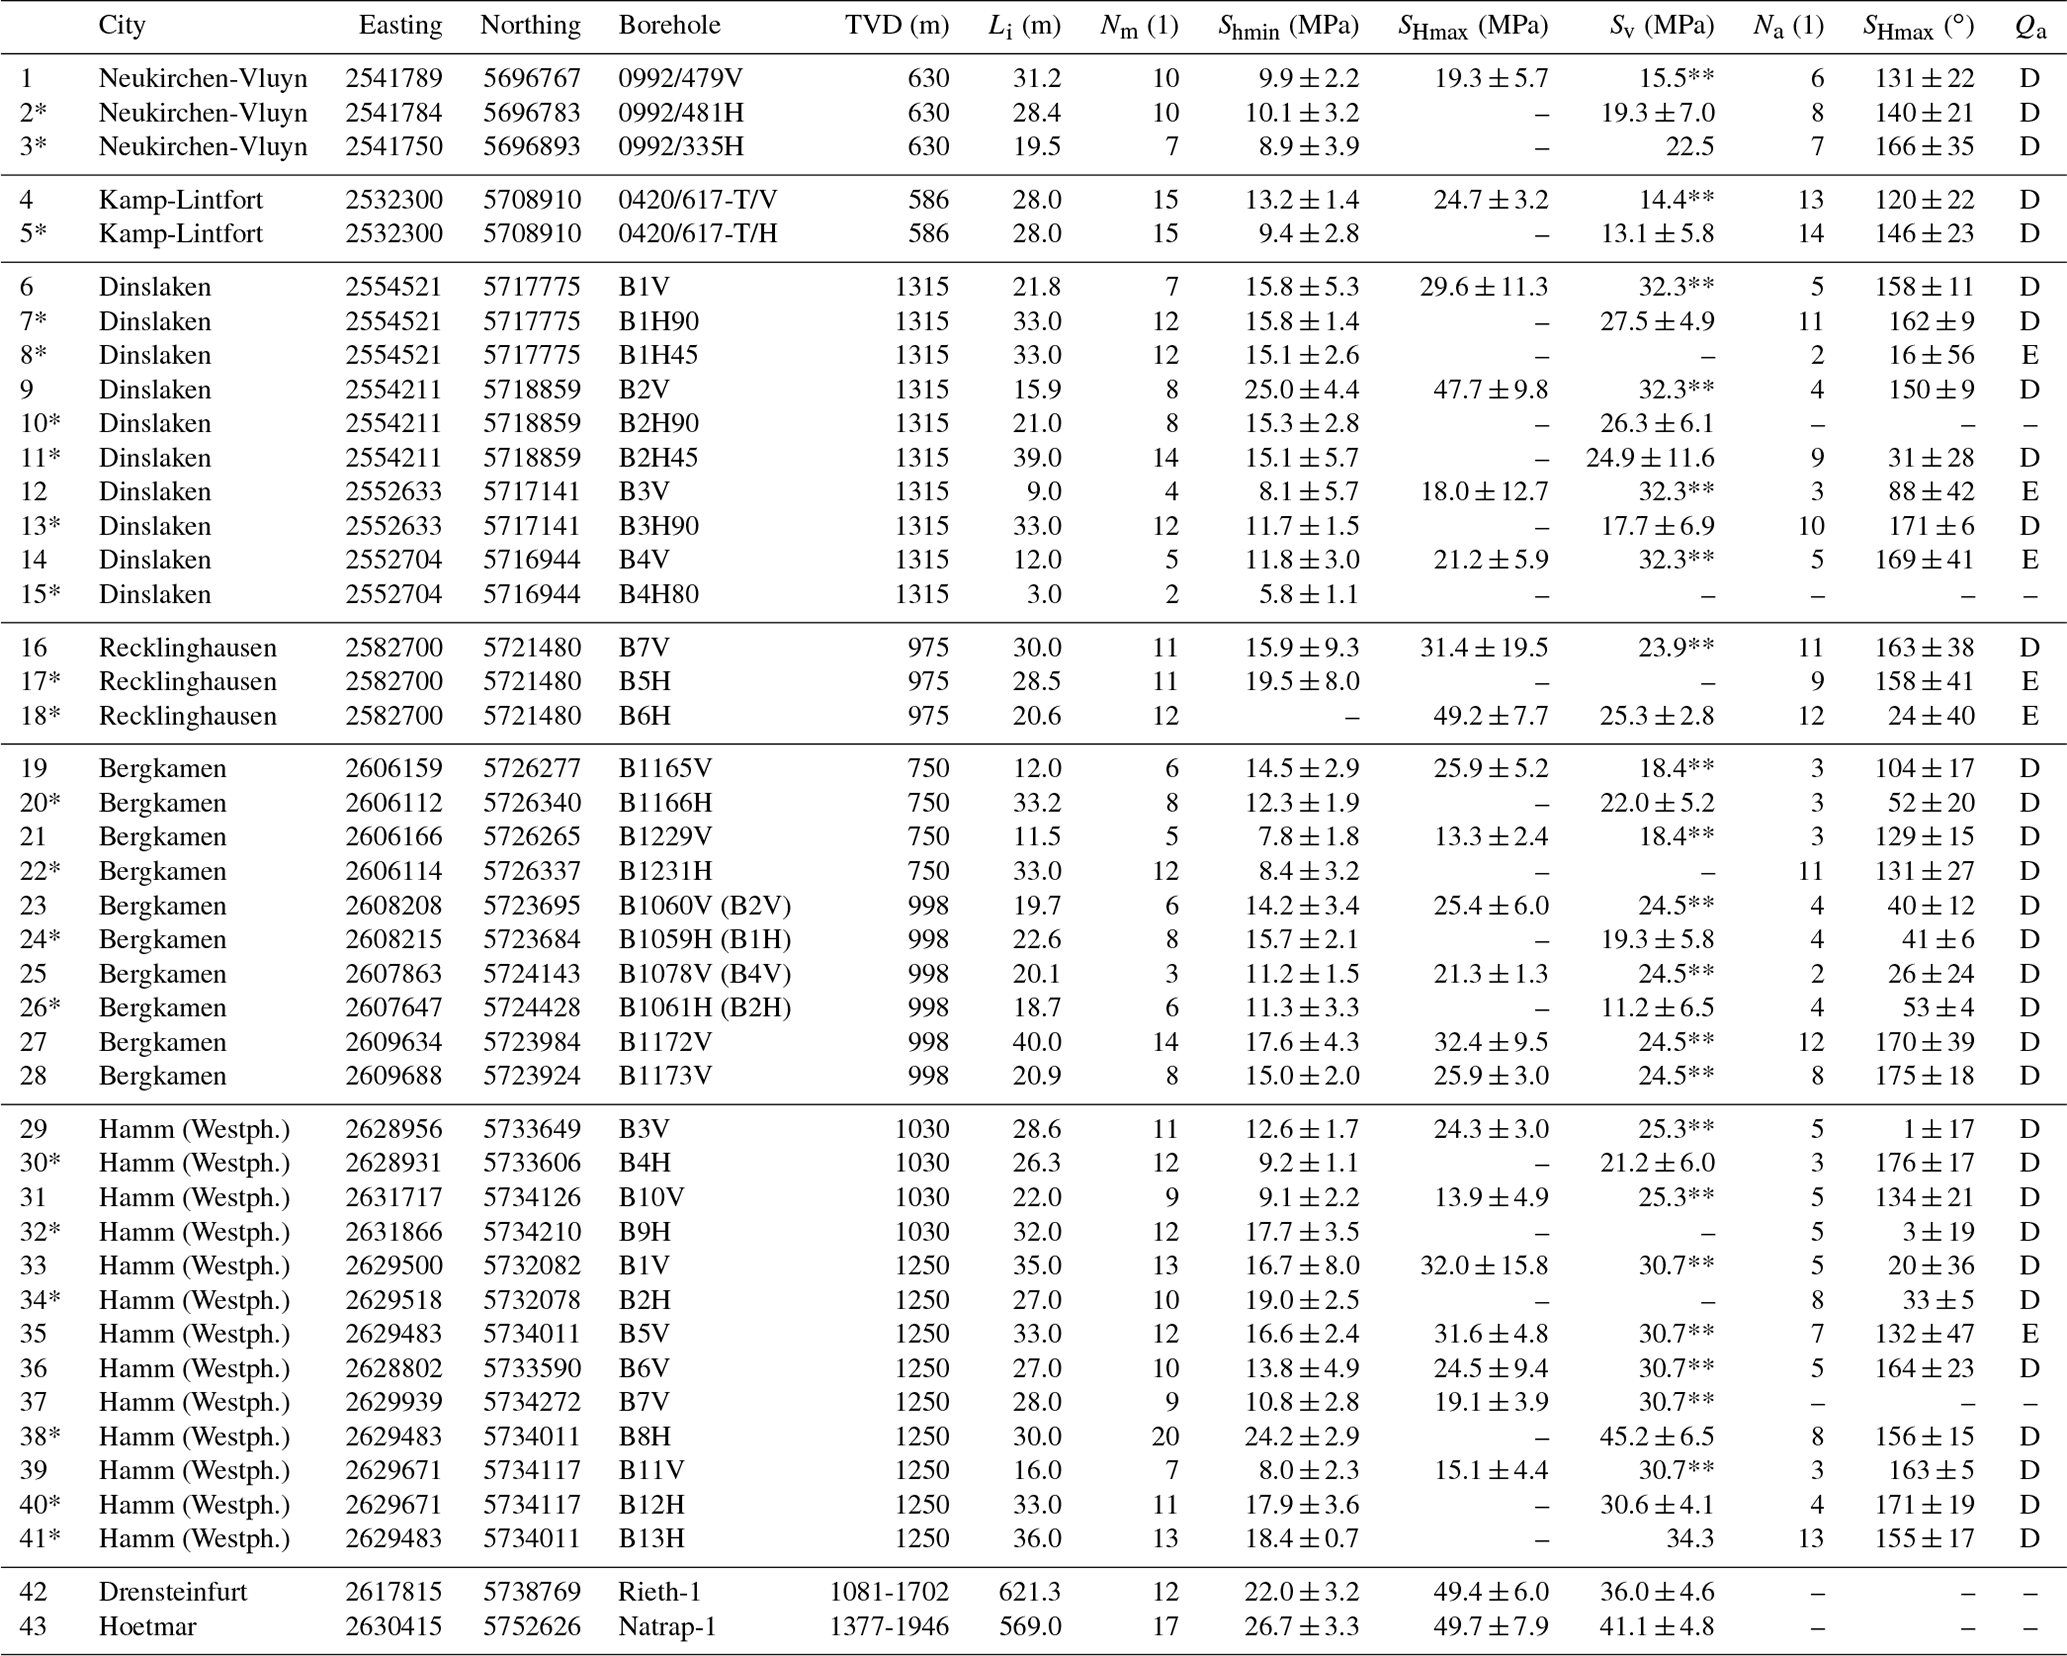
The data records presented are average values for each borehole; ∗ horizontal borehole, computed based on bulk density of the rock mass of 2500 kg m−3.
It can be observed that at depths between 1000 and 1300 m, the horizontal stresses especially are slightly lower than for tests carried out at shallower or greater depths, pointing towards a more extensional stress regime. Based on Fig. 6, which presents a normalised stress polygon with averaged results from each location (differentiating depth levels) computed within this study (Table 3), and assuming negligible pore pressure, one can see that the majority of stress tests fall predominantly into a strike-slip stress regime and only a few present normal stress regime. Looking at Fig. 5b, which presents a so-called mean stress ratio, k (i.e. a ratio of average horizontal stress, Sh, and Sv), it could be concluded that stress does not change significantly at depth and that an average k value of 0.86 represents the studied area most accurately. For comparison, stress ratio computed based on the approach by Sheorey (1994) for Young modulus, Esh, of 36 ± 11 GPa, which was based on 29 static measurements on fine-grained sandstone core samples extracted from the H13 borehole from the Westphalia coal mine at 1250 m depth (MeSy, 1994), is presented in Fig. 5b.
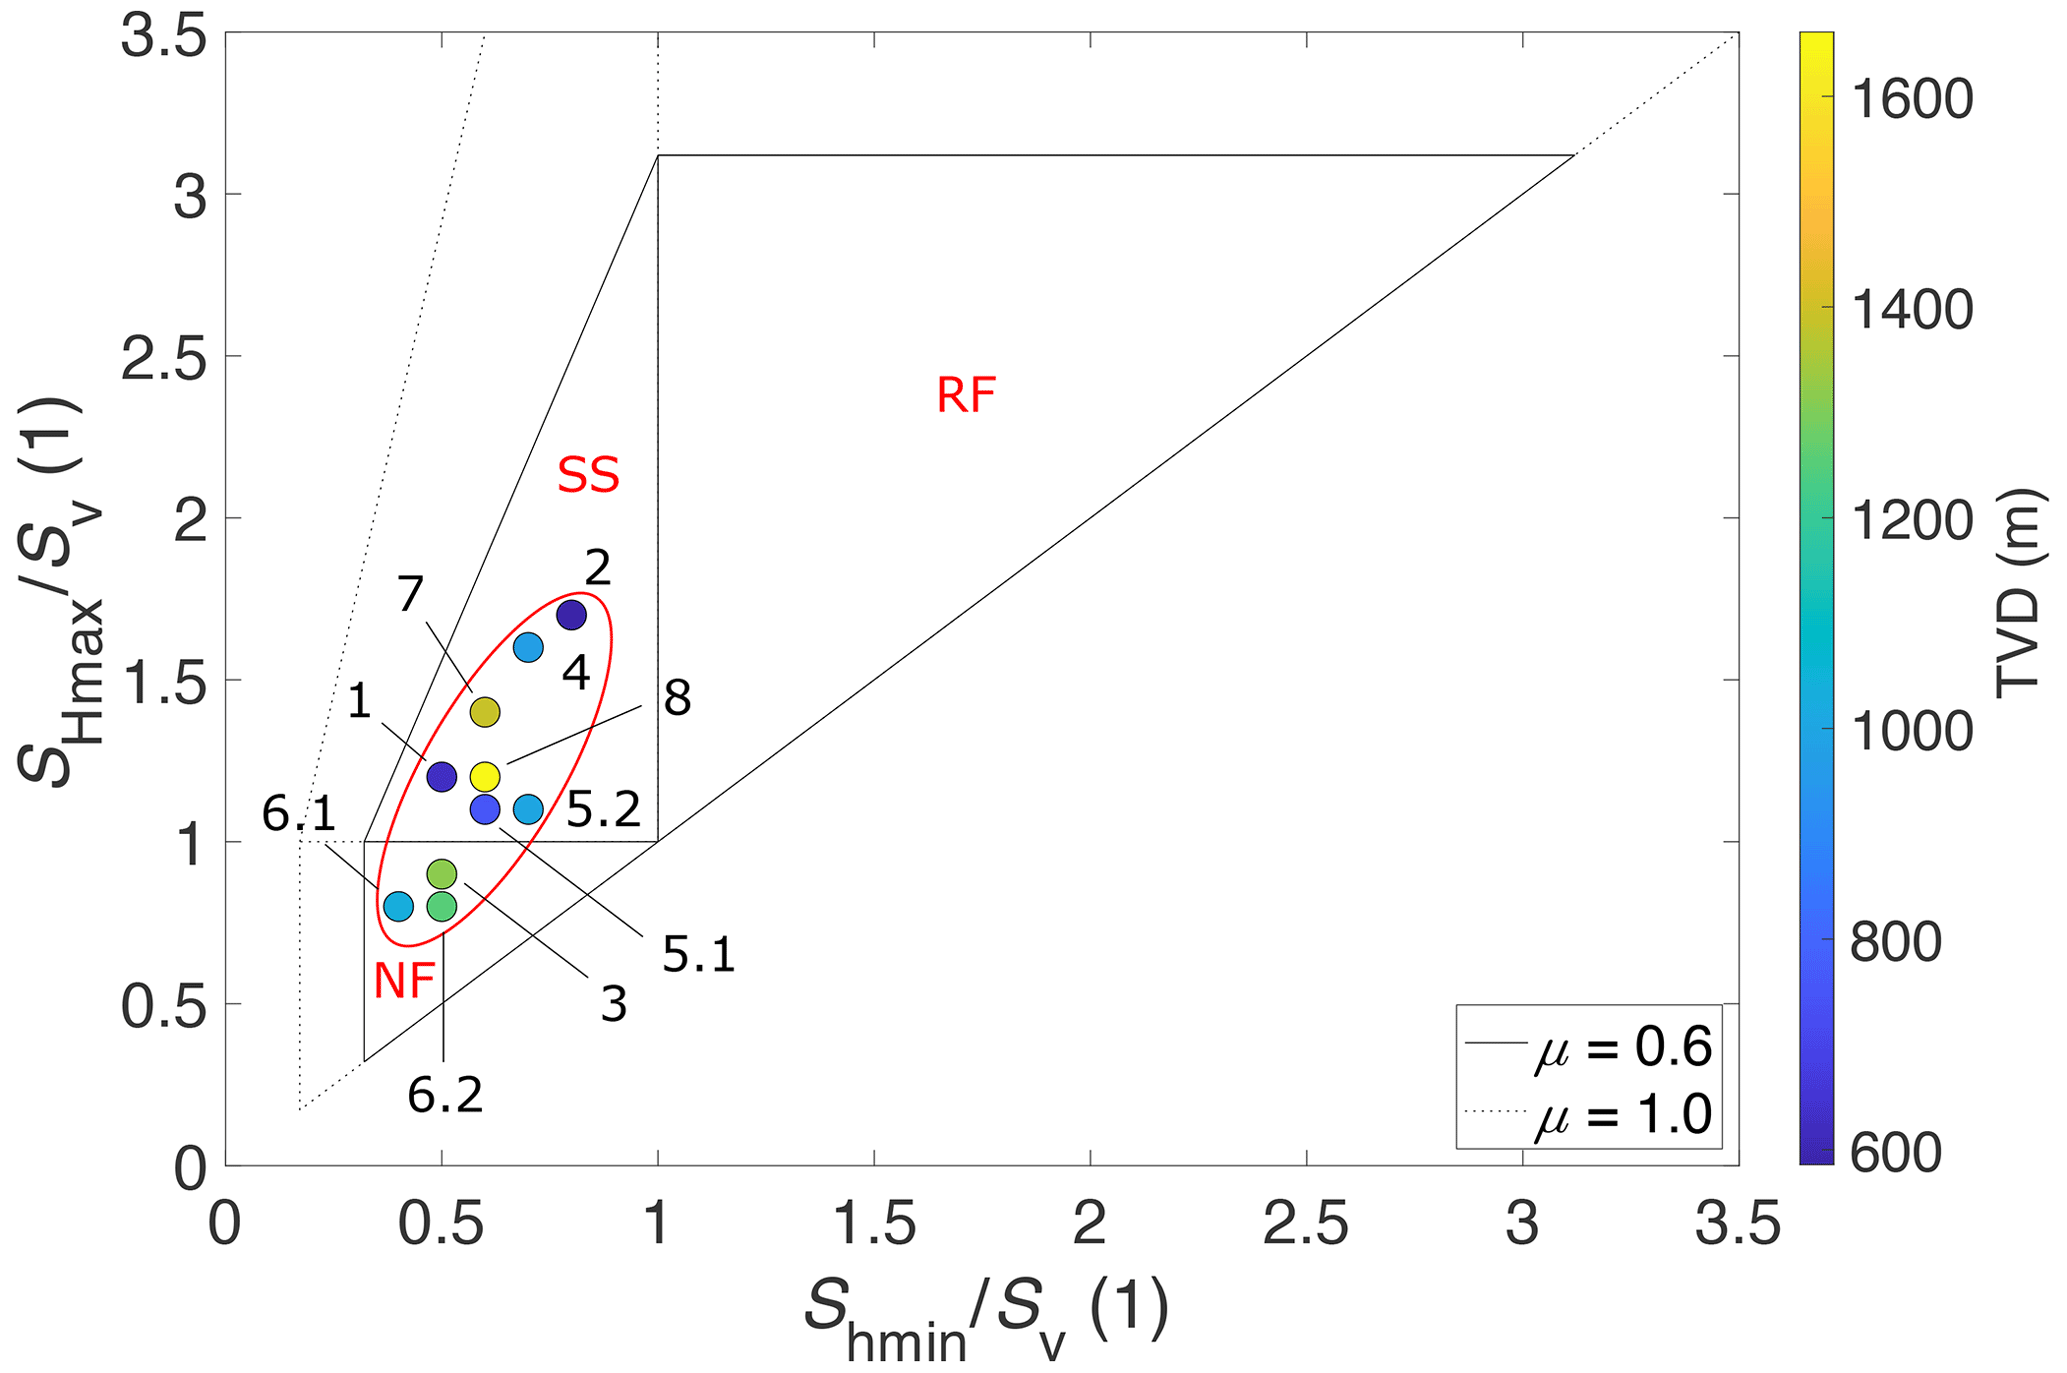
Figure 6Normalised stress polygon for two different coefficients of friction, μ, of 0.6 and 1.0 with averaged stress magnitude values recorded across the greater Ruhr region (see Table 3 for the actual values) for each test location and depth level (NF – normal faulting, SS – strike-slip faulting, RF – reverse/thrust faulting, TVD – true vertical depth). Numbers correlate to references from Table 3. The stress regime of the study area, based on the collected data within this study, is outlined with a red ellipse.
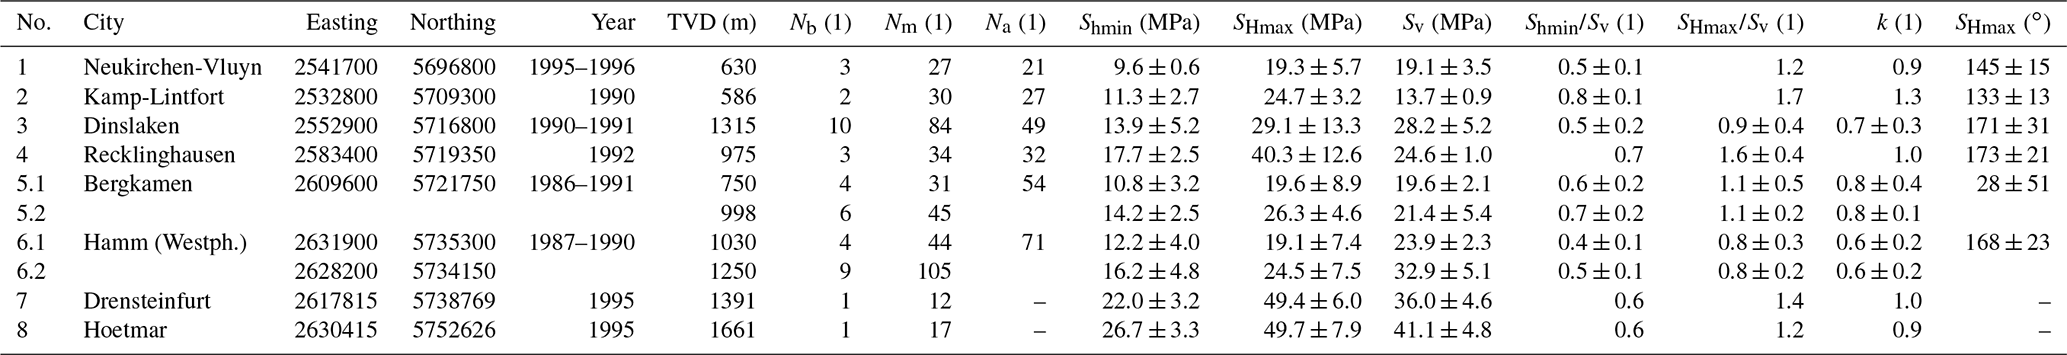
Table 3Average values for each test location obtained from the results of the hydrofracturing testing campaign performed across the greater Ruhr region; values were averaged for the same depth level (TVD – true vertical depth, Nb – number of boreholes, Nm – number of stress magnitude tests, Na – number of the stress orientation measurements, Shmin – magnitude of the minimum horizontal stress, SHmax – magnitude of the maximum horizontal stress, Sv – magnitude of the vertical stress, k – mean stress ratio. Easting and northing were presented according to the EPSG:31466 geographical projection.
After data evaluation, the quality ranking scheme developed by Morawietz et al. (2020) was applied for the derived Shmin magnitudes. The test results collected within this study and ones from already published studies are summarised in Table 4. In total, 429 hydrofracturing tests were carried out during the measurement campaign. Based on these tests, 429 unique Shmin data records were derived, from which 367 received the highest, i.e. A-quality, 19 data records received C-quality (due to the tests being carried out in cased borehole sections), and 43 data records where it was not possible to derive the Shmin magnitude received E-quality (due to either no pressure build-up in the tested interval or an estimation of Sv magnitude, instead of Shmin, in the case of several horizontal boreholes).
Table 4Number of data records from the greater Ruhr region, including their quality assignment (based on Morawietz et al., 2020 and Heidbach et al., 2016), from this and already published studies. As the quality ranking scheme by Morawietz et al. (2020) allows only to determine quality of the Shmin magnitude, no quality was assigned to the magnitude estimates of SHmax and Sv.
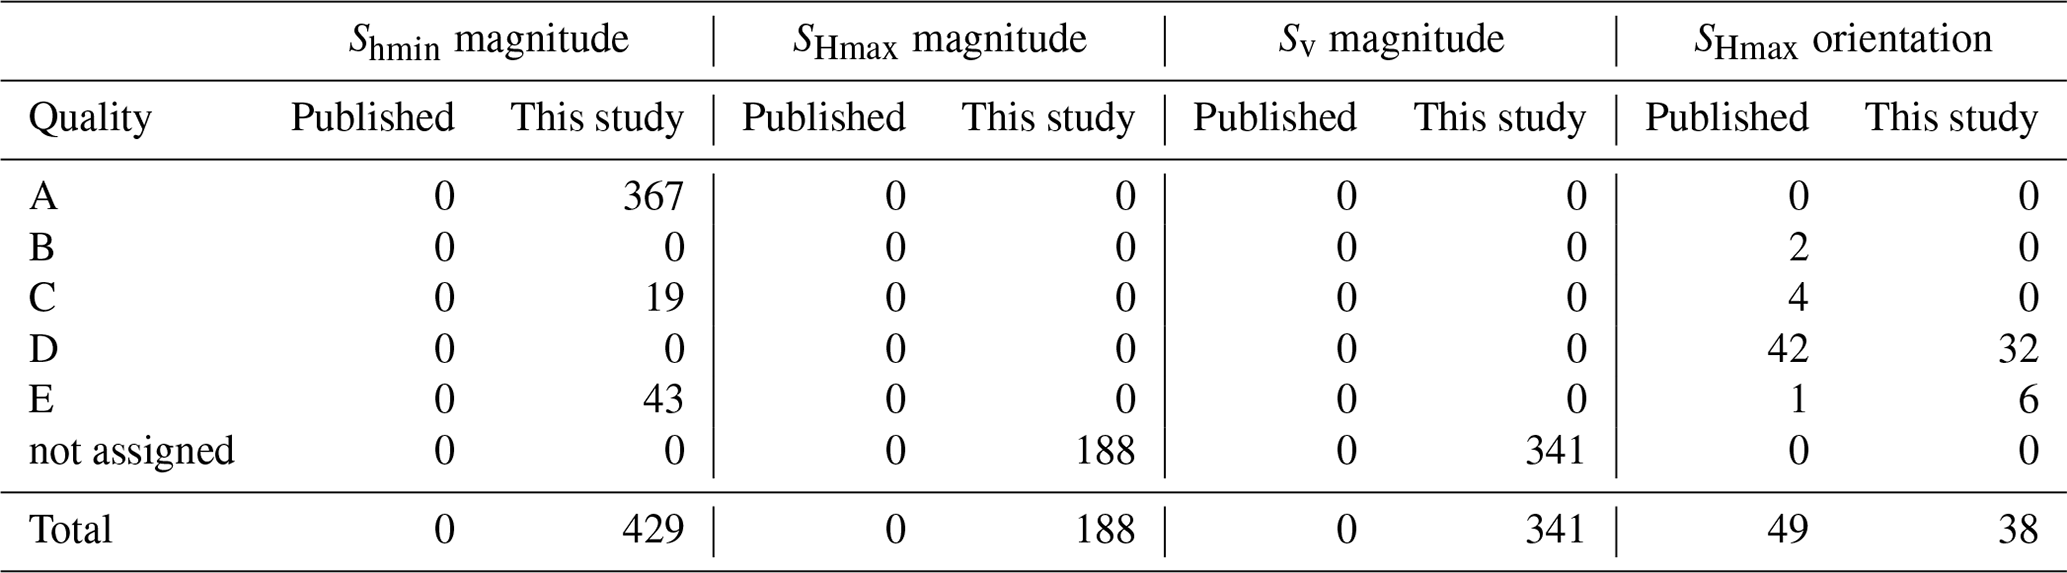
Furthermore, based on 429 hydrofracturing tests, 188 data records of SHmax magnitudes and 341 data records of Sv magnitudes were derived. The magnitudes of Sv are a combination of stress magnitude values derived from hydrofracturing tests for horizontal boreholes and estimations of Sv magnitudes based on the bulk density of the rock mass of 2500 kg m−3 (Duda and Renner, 2012; Brenne, 2016) for vertical boreholes (Table 2). The stress data record quality assessment developed by Morawietz et al. (2020), as of today, refers to Shmin magnitudes only, and therefore no quality was assigned to SHmax or Sv magnitudes.
7.3 SHmax orientations and quality assignment
Following the WSM data assessment guidelines and the WSM quality ranking scheme (Heidbach et al., 2016), an estimation of the mean orientation of the induced fractures, assumed to be equal to the mean SHmax orientation, was carried out in each borehole. For the estimation of the mean SHmax orientation and its standard deviation from each borehole needed for the quality assignment (Heidbach et al., 2016), the statistics of bi-modal data (Mardia, 1975) were utilised.
From 429 hydrofracturing tests, in 254 cases the orientation of the induced fractures was measured. From this data set, 38 SHmax orientation data records were derived. These acquired SHmax orientations increase the number of data records in the greater Ruhr region from 49, which are already available in the WSM database release from 2016 (Heidbach et al., 2018), to 87. In some hydrofracturing tests, several fractures were observed at the same test location. Once these fracture orientations differed from each other by more than 25∘, the data record was not taken into account for further analysis. This procedure was performed to exclude data records with high uncertainties of fracture orientations being an actual indicator of the SHmax orientation. The resulting SHmax orientation, including its standard deviation using the statistic of bi-modal data, is provided in the second last column of Table 2. Figure 7a shows the final stress map of the greater Ruhr region with the distribution of SHmax orientations, whereas Fig. 7b and c present rose plots of SHmax orientations from this and already published studies. Since the boreholes in the six investigated coal mines areas are close to each other, derived SHmax orientations are represented with six polar plots presenting mean values (solid black line) and its standard deviation (dashed black line) from each mine.
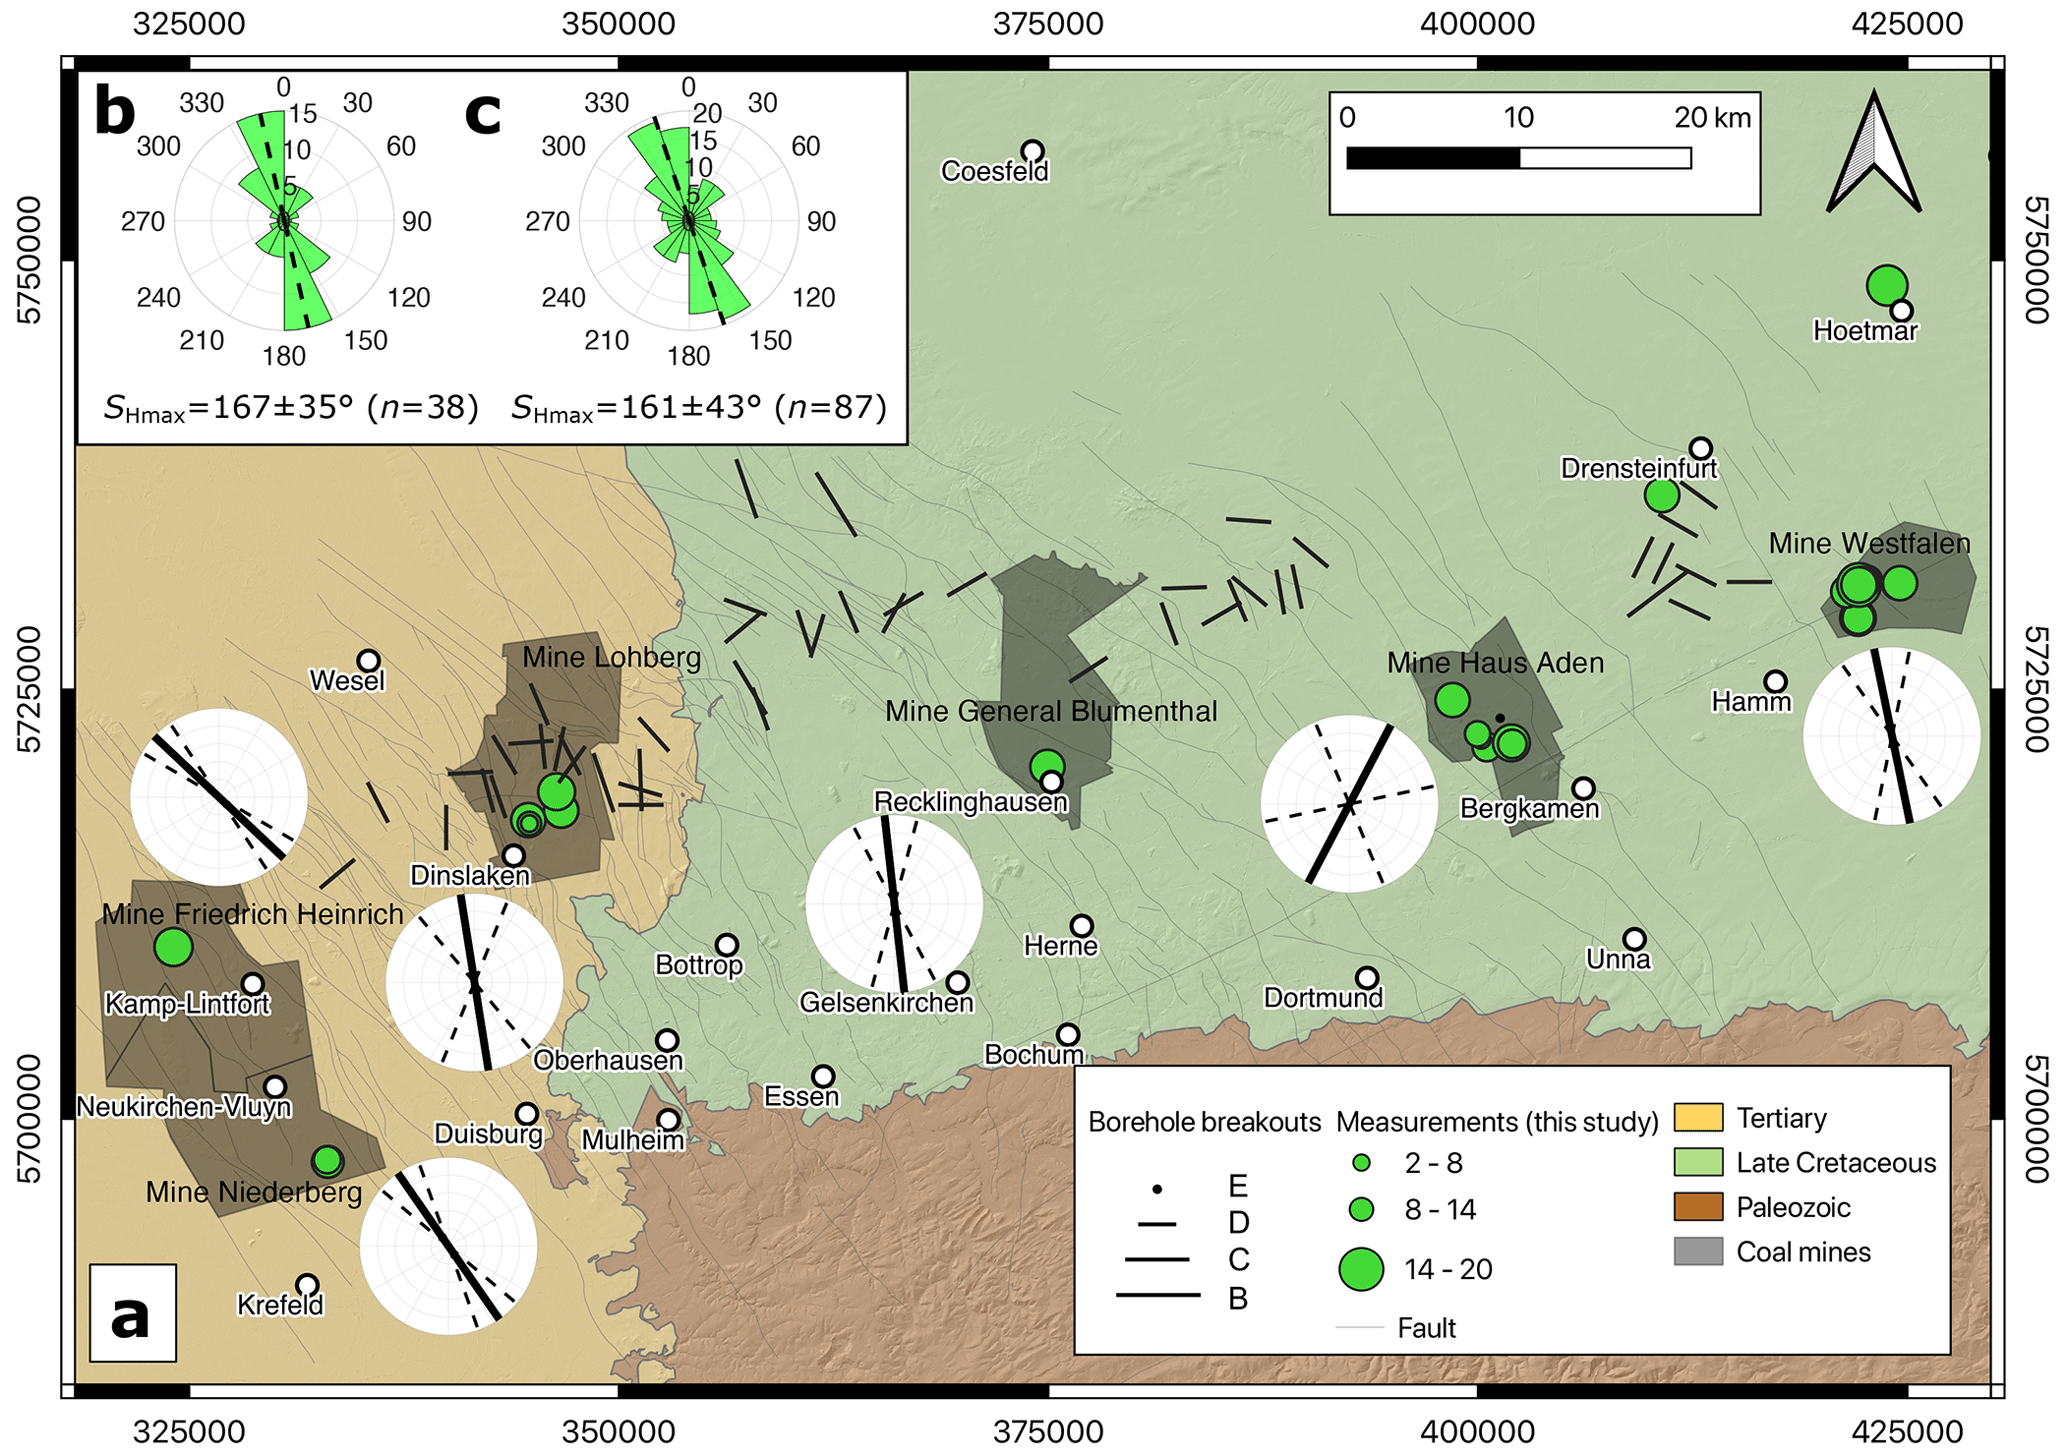
Figure 7(a) A map of the greater Ruhr region with major geological discontinuities (modified after GD NRW, 2017, 2019) and locations of stress magnitude data records described in this study. Black shaded areas represent coal mining areas active in 1980s. Polar plots represent average SHmax orientations (solid line) and its standard deviation (dashed line) registered in each coal mine (black thick lines show the orientation of the maximum horizontal stress, SHmax, available in the World Stress Map database (Heidbach et al., 2018), where line length is proportional to data quality). (b) Rose plot of SHmax orientations based on hydrofracturing tests collected in this study (n=38) with D- and E-qualities where average SHmax orientation (dashed line) amounted to 167 ± 35∘. (c) Rose plot of SHmax orientation data records based on this study and data points from the greater Ruhr region available in the World Stress Map database release from 2016 (Heidbach et al., 2018), with B- to E-qualities, with an average SHmax orientation (dashed line) of 161 ± 43∘ (n=87).
As presented in Table 2, the uncertainty of six SHmax orientations is considered as high, as it is either equal to or higher than 40∘. These data records were assigned the lowest i.e. E-quality according to the quality assessment by Heidbach et al. (2016). Due to the short length of the tested intervals (i.e. less than 40 m), the rest of 32 SHmax orientation data records from hydrofracturing tests were deemed to be of D-quality according to the WSM quality assessment (Heidbach et al., 2016).

Figure 8Results of the deeper sections of the Natrap-1 well (TVD – true vertical depth) with (a) lithostratigraphic column, (b) gamma-ray, GR, log (due to high sampling frequency of the gamma-ray log, data was smoothed out), (c) magnitudes of a minimum horizontal stress, Shmin, maximum horizontal stress, SHmax, and vertical stress, Sv, measured in the Natrap-1 borehole (Sv was computed based on a bulk density log available between depth of 1300 and 1970 m, with an assumption of bulk density of rock mass of 2500 kg m−3 between surface and depth of 1300 m), and (d) measured rock mass permeability, kr.
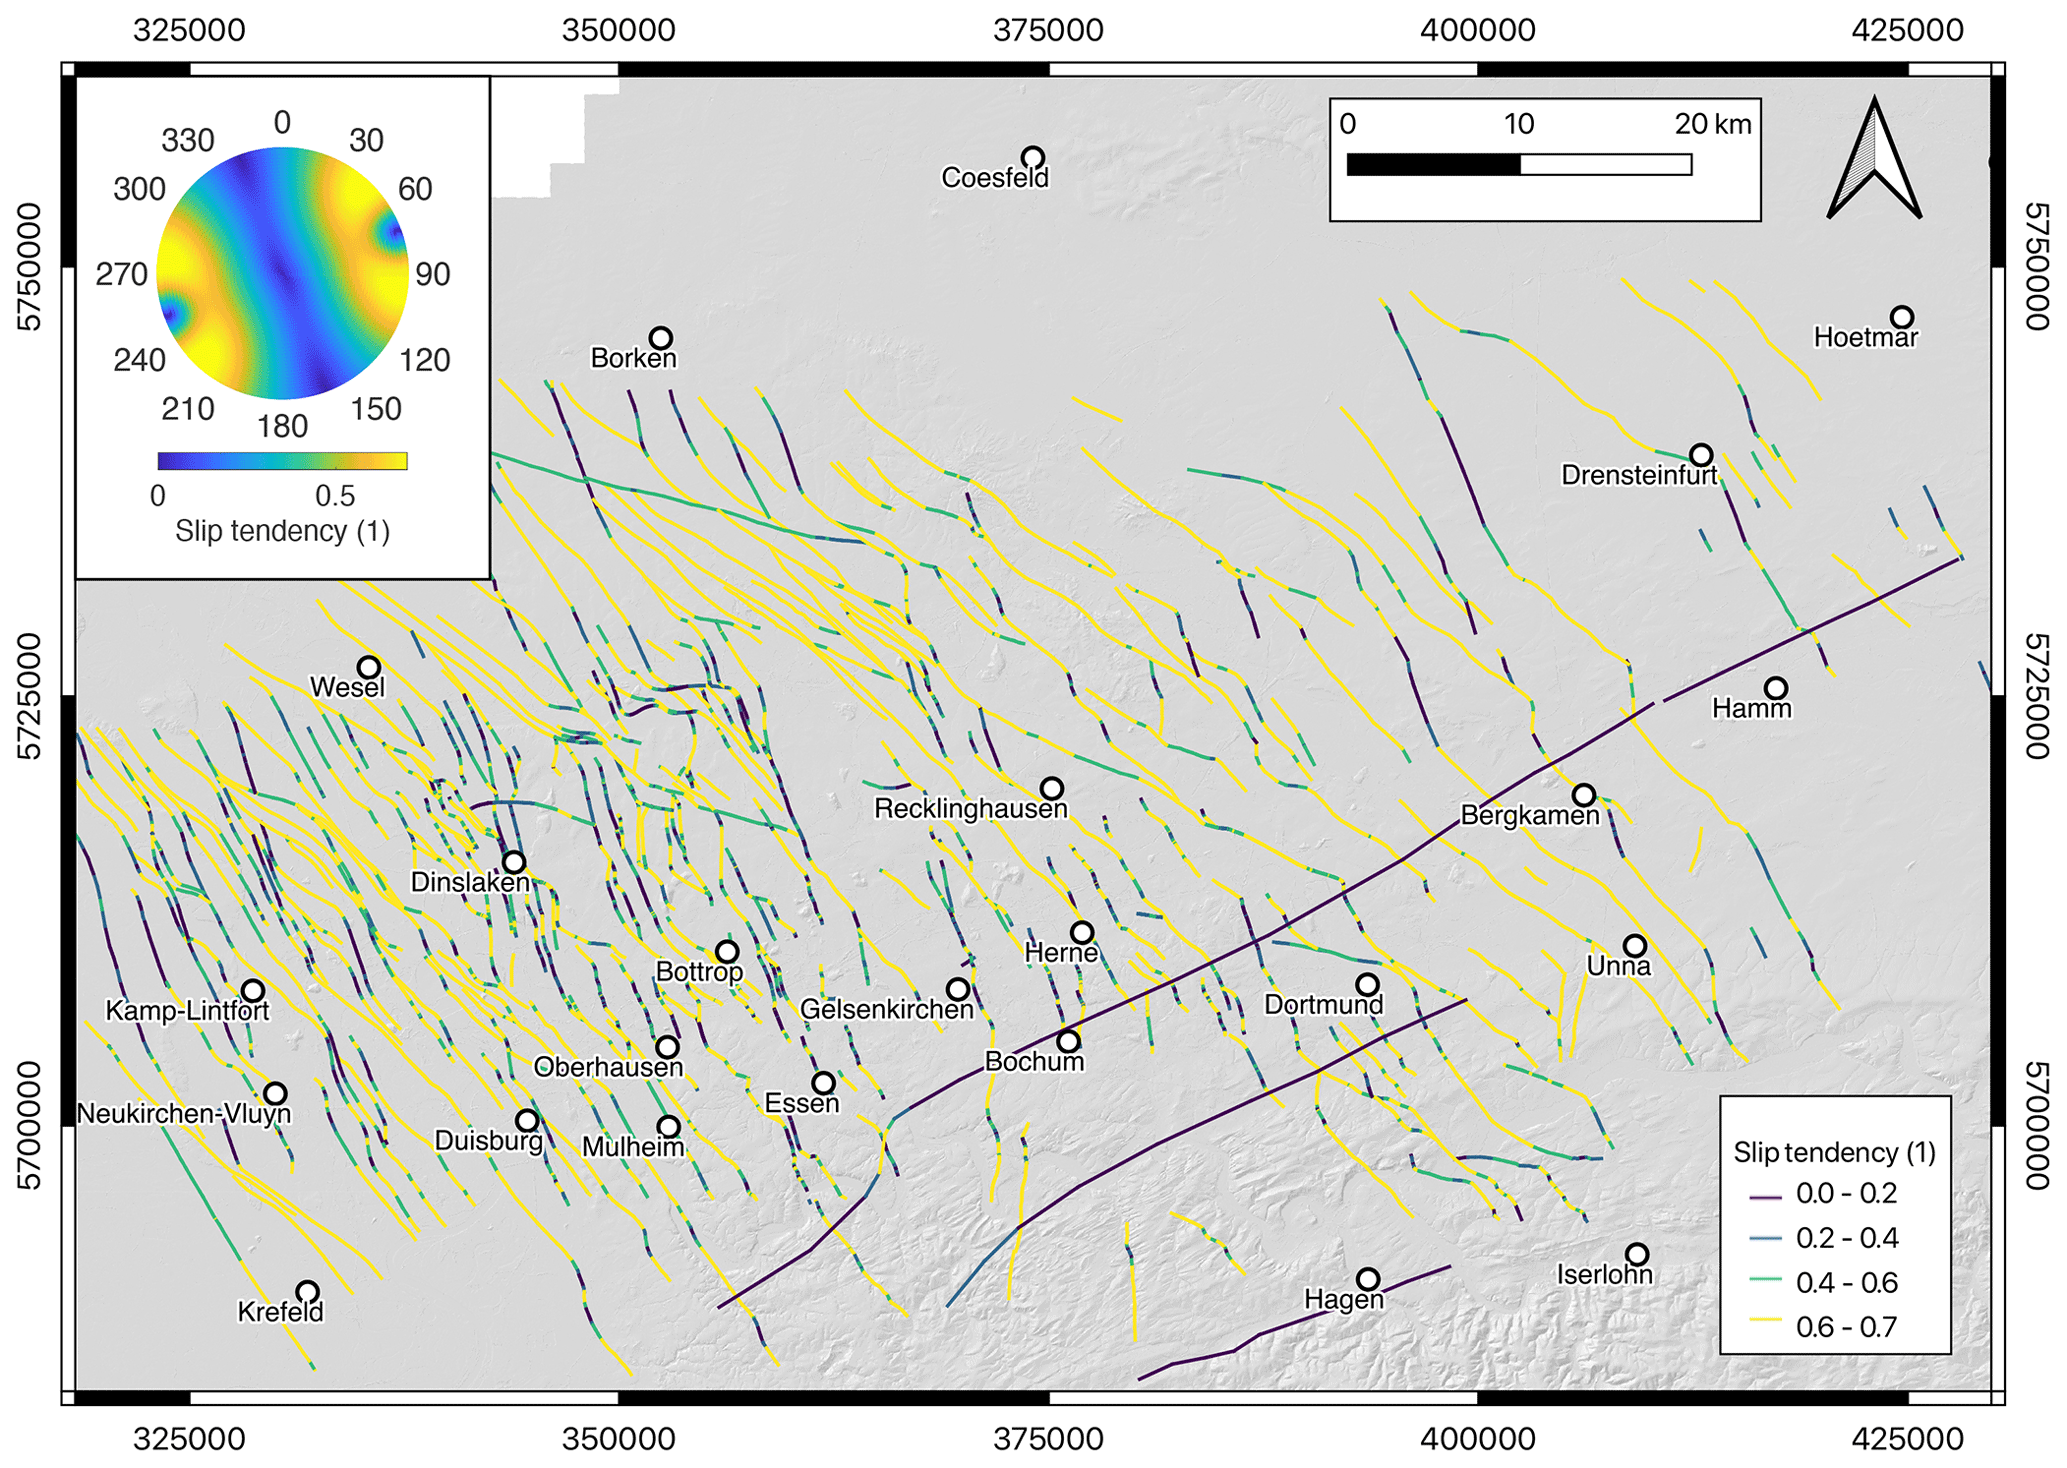
Figure 9Slip tendency of geological discontinuities within the Ruhr region (GD NRW, 2017, 2019) at depth of 1200 m computed based on the stress tensor constrained from this study with Pp of 11.8 MPa, Shmin of 17.4 MPa, SHmax of 33.7 MPa, Sv of 29.3 MPa, and average SHmax orientation of 161∘. Stereographic projection of slip tendency based on the constructed stress tensor is presented in the top left corner.
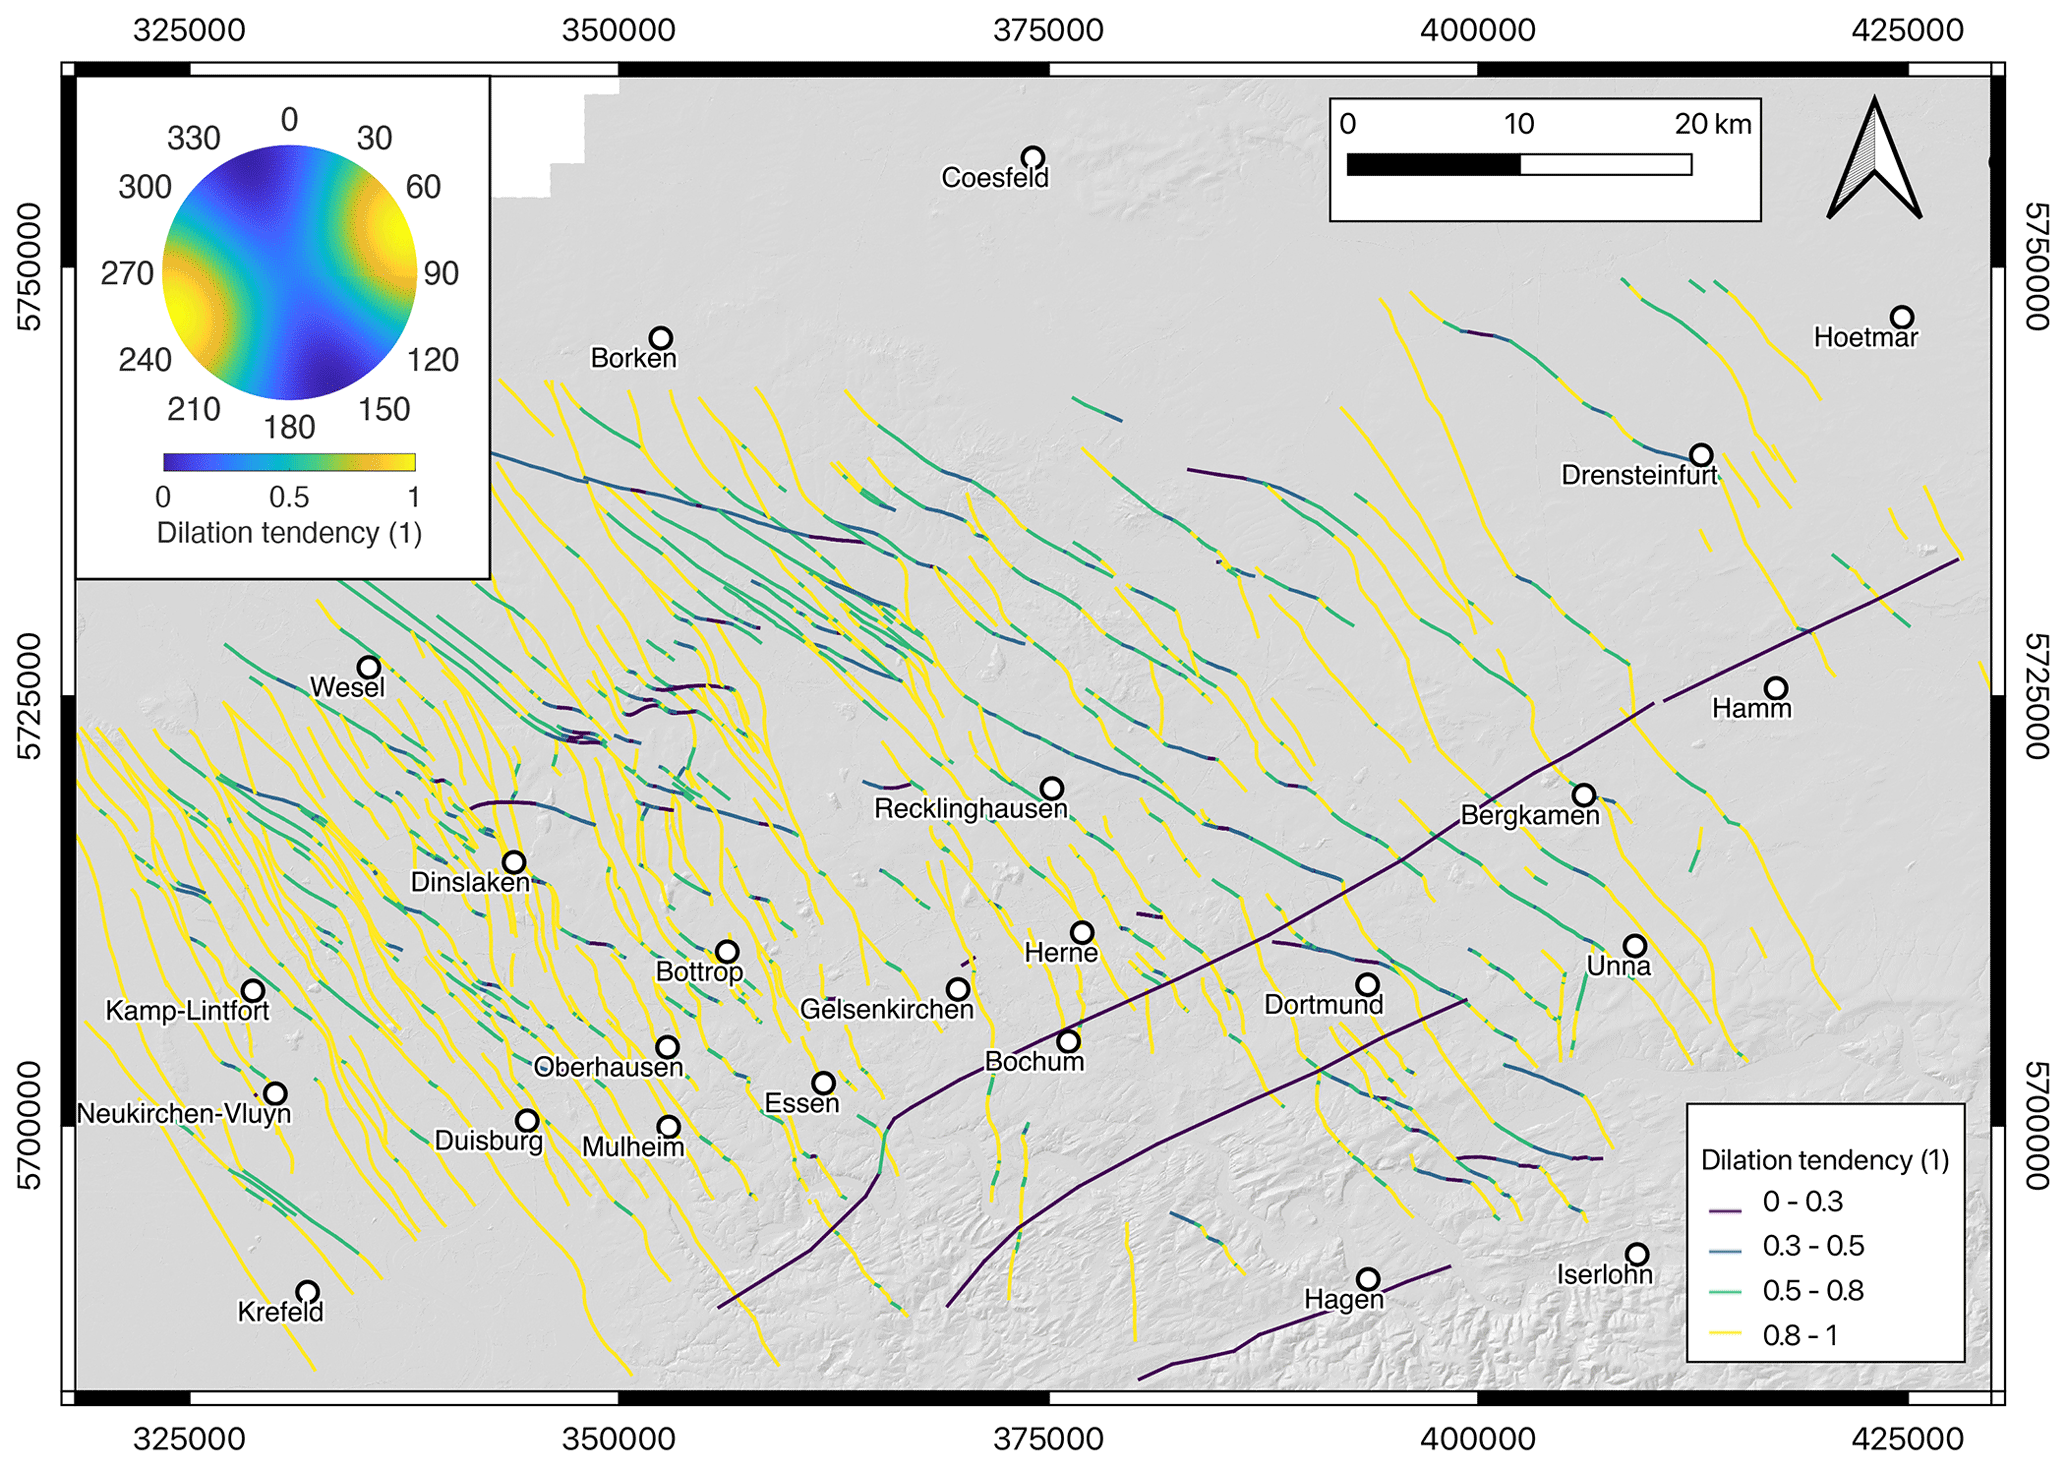
Figure 10Dilation tendency of geological discontinuities within the Ruhr region (GD NRW, 2017, 2019) at depth of 1200 m computed based on the stress tensor constrained from this study with Pp of 11.8 MPa, Shmin of 17.4 MPa, SHmax of 33.7 MPa, Sv of 29.3 MPa, and average SHmax orientation of 161∘. Stereographic projection of dilation tendency based on the constructed stress tensor is presented in the top left corner.
Based on the collected data, five main points regarding the in situ stress state of the greater Ruhr region can be made. These points are summarised below.
- i.
Neglecting the accuracy of the SHmax magnitude estimation method based on classical hydraulic fracturing theory, it can be concluded that the studied region is primarily under the influence of strike-slip stress regime, with few outsider values indicating normal faulting stress regime. Neglecting the few scattered values, vertical stress constrained from the horizontal boreholes proved to agree with the vertical stress recomputed for the overburden density of 2500 kg m−3.
- ii.
Results from hydrofracturing tests from the two deep boreholes and coal mines proved to be relatively similar; therefore, it could be expected that the infrastructure of the coal mines does not significantly disturb the in situ stress field (at least not in the areas where the tests were carried out). It should however be mentioned that the individual data records could be potentially influenced by the coal mining activities and other man-made effects (i.e. large-scale rock withdrawal, long-term dewatering, and mine flooding activities). In this study, we however do not discriminate between in situ stress measurements being influenced by these anthropogenic effects and ones presenting the undisturbed stress state, but rather present all stress measurements available in the region. This should however be the task for future studies in the region and should be also reflected in the future stress indicator quality rating schemes (Heidbach et al., 2016; Morawietz et al., 2020).
- iii.
There is no particular spatial and vertical difference in stress magnitudes across the studied region, which can be considered homogeneous on a more regional scale in terms of the stress state conditions, except for the usual increase of stresses at depth. This can be observed in Fig. 8, where results from hydrofracturing tests and borehole logging in the Natrap-1 well, which intersected different lithostratigraphic units of the Carboniferous period, were presented. No significant change in stress magnitudes and permeability is observed in this well between layers of Westphalian A and B stage of the Carboniferous geologic period depths. Interestingly enough, an increase of Shmin and a significant decrease of SHmax was observed at depths where a permeable fault zone was intersected in the borehole. Similar occurrences were previously observed in the literature (e.g. Wu and Zoback, 2008). This could prove that the major differences in stresses at depth will be potentially related to geological discontinuities such as fault zones. It means that neither stress decoupling nor strong lithological differences of stress are to be anticipated within the Carboniferous layers in the region. At deeper depths and below Carboniferous strata, where Devonian carbonates considered to be much stiffer than the Carboniferous rocks (Balcewicz et al., 2021) are expected to exist (DEKORP, 1990), one could expect stress variations, being different from the estimated trends for the Carboniferous layers. A slight decrease of the stress state has been observed between 1000 and 1300 m depth. It is, however, unknown what caused this phenomenon and to what degree coal mining activities were responsible for it. To be able to discriminate between hydrofracturing test results presenting the virgin in situ stress field and test results perturbed by anthropogenic effects (i.e. coal mining activities) more in-depth analysis, including the influence of mine geometry, is needed. The influence of coal mining activities on the orientation of maximum horizontal stress based on selected hydrofracturing measurements from the Ruhr region has been addressed recently by Niederhuber et al. (2022).
- iv.
Although a slight fan-like shape of the azimuth of SHmax was observed spanning between NW–SE orientation in the west and NNW–SSE SHmax orientation in the east of the region, and singular SHmax orientation data records demonstrated significant scatter and uncertainty, the mean SHmax orientation from 38 new data records in the study region of 167 ± 35∘ is in a good agreement with the stress orientation of northwestern Europe (Baumann, 1981). Accounting for the 49 SHmax orientations already available within the WSM (Heidbach et al., 2018), the mean SHmax orientation of the greater Ruhr region amounts to 161 ± 43∘ (Fig. 7c) and proves significant uncertainty. It remains, however, unknown if the fan-like shape of the SHmax orientation could be related to, e.g. a larger tectonic unit such as the Lower Rhine Embayment or if it is a result of geological anisotropies. The anticlockwise rotation of average SHmax orientations in the two most western-located mines (i.e. Niederberg and Friedrich Heinrich) could potentially prove the influence of the Lower Rhine Embayment with its average SHmax orientation of 118∘ (Hinzen, 2003). Additionally, a clockwise rotation of SHmax orientation in the vicinity of the Haus Aden mine can be observed. This rotation seems to align with the strike of the major thrust faults in the region and could potentially indicate their influence on the stress measurements. Additionally, the primary NNW–SSE orientation of SHmax proves that the infrastructure of the coal mine does not influence the stress field in a significant way (at least not in the areas where tests were carried out).
- v.
The permeability of the coal-bearing formations of the Carboniferous layers in the Ruhr region is extremely low and amounts to an average value of 0.1 mD (or ). No clear permeability dependence with depth was observed in the two investigated deep boreholes.
Slip and dilation tendency
To showcase how a data set presented in this study can be utilised, slip and dilation tendencies were calculated for the major geological discontinuities discovered throughout the 700-year-long coal mining activities in the Ruhr region (GD NRW, 2017, 2019). The average SHmax orientation of 161∘ obtained from this study and Eqs. (7), (8), and (9) were used to constrain the mean in situ stress state at a depth of 1200 m, representing the coal mining depth. The assumption was made that the pore pressure starts from the surface level and that the pore fluid has a constant density of 1000 kg m−3. Another assumption, caused by the lack of data on fault geometry, assumes that all evaluated discontinuities are vertical. This may not be always true in reality, i.e. fault's dip may significantly differ (e.g. Fig. 1c) from the one assumed in this study. It is therefore advised to treat results of the slip and dilation tendency in a more relative manner rather than as absolute values. To address the full range of uncertainties on slip and dilation tendency values of major faults in the greater Ruhr region, including in situ stress tensor and fault geometry, a probabilistic assessment should be carried out in the future studies (e.g. Walsh and Zoback, 2016; Healy and Hicks, 2022). Based on the abovementioned assumptions and stress gradients developed in this study, Pp of 11.8 MPa, Shmin of 17.4 MPa, SHmax of 33.7 MPa, and Sv of 29.3 MPa were used. Based on the methodology presented in Jaeger et al. (2007), normal effective and shear stresses were computed for each discontinuity segment and simultaneously slip (Morris et al., 1996) and dilation (Ferrill et al., 1999) tendencies were calculated. Results of these computations are presented in Figs. 9 and 10. As it can be seen in Fig. 9, where the colour of a discontinuity segment represents different slip tendency values, the N–S and NW–SE-striking discontinuities (with azimuths of 5 and 137∘ N, respectively) have the highest slip tendency values. This indicates that these structures are the most prone to be reactivated (either a- or co-seismically) by pressure and/or temperature changes created during, e.g. geothermal fluid production or fluid injection. On the other hand, discontinuities that are considered “locked” in the prevailing stress state are the ones striking in the ENE–WSW and NNW–SSE directions (with azimuths of 71 and 161∘ N, respectively). Figure 10 presents the results of dilation tendencies for the discontinuities within the Ruhr region, where the colour of a discontinuity segment represents different dilation tendency values. It can be observed that the NNW–SSE-striking structures (with an azimuth of 161∘ N), i.e. ones striking along SHmax orientation, will be the ones that are the most likely to stay open (if not filled by, e.g. secondary fluid mineralisation) in the prevailing stress regime. These geological discontinuities will therefore be the most permeable ones within the region, and could be considered as potential targets for, e.g. establishing a geothermal systems. On the contrary, the hydraulically “dead” discontinuities will be the ones striking ENE–WSW (with an azimuth of 71∘ N). These impermeable structures could lead to, e.g. reservoir compartmentalisation.
The stress orientation database is available under https://doi.org/10.24406/fordatis/200 (Kruszewski et al., 2022a), the stress magnitude database is available under https://doi.org/10.24406/fordatis/201 (Kruszewski et al., 2022b), and the hydrofracturing test reports are available under https://doi.org/10.24406/fordatis/222 (Kruszewski et al., 2022c).
Within this study, we present for the first time a comprehensive assessment of 429 hydrofracturing tests that were carried out in 43 vertical and horizontal boreholes located across the greater Ruhr region recorded between 1986 and 1995. The database presented here is the world's largest public database of stress magnitudes from a single region. Based on the analysis carried out in this study, we could derive 429 data records of Shmin magnitude with assigned qualities. This database nearly doubles the number of stress magnitudes currently available for Germany and its adjacent regions from 568 to 997 unique Shmin values. Additionally, based on 254 single measurements of the orientation of the induced fractures in exploration boreholes, we derived 38 new data records of the SHmax orientation, simultaneously nearly doubling the amount of already available stress orientation data records from 49 to 87 for the greater Ruhr region. We conclude from the principal stress magnitudes that the stress regime is predominantly strike-slip, where SHmax is approximately double the size of Shmin, implying high differential horizontal stresses in the subsurface. We also conclude no substantial spatial or vertical change of stress state or stress decoupling within the Carboniferous layers of the greater Ruhr region, implying a relatively homogeneous stress field. No significant difference between the results of tests carried out in coal mines and deep boreholes were observed, proving the small influence of the mine infrastructure on the test result (at least not in the areas where tests were carried out). The average SHmax orientation of the region amounts to 161 ± 43∘. The high standard deviation of the SHmax orientation is caused not only by high uncertainties of the individual SHmax orientation data records, but also by local variability and a potential anticlockwise rotation of the SHmax orientation from E to W. Nevertheless, the mean SHmax orientation is overall in good agreement with the NW–SE SHmax orientation of northwestern Europe. Utilising results from this study, slip and dilation tendencies of major geological discontinuities within the Ruhr region were calculated. Considering average values of the in situ stress tensor of the greater Ruhr region and simplified fault geometries, the N–S and NW–SE-striking structures prove to be the most likely to be reactivated during, e.g. fluid injection, whereas the NNW–SSE-striking discontinuities are the most permeable structures and may be considered as potential exploration targets for geothermal energy provision. The database created within this study presents unique and high-quality stress input data for future reservoir and geomechanical numerical models and should aid the subsurface operations in the region. This study could also serve as a template for other national (and international) stress magnitude compilations.
MK released the in situ stress data from the data owner to the public, compiled, validated, analysed, and visualised the data, coordinated and conceptualised the study, and prepared and wrote the first draft paper. GK enabled contact with data owners, provided hydrofracturing reports, and reviewed the paper. TN reviewed the paper. OH acquired approval from the data owners for public release of data, helped with conceptualisation of the study, and co-wrote and reviewed the paper.
The authors declare that they have no conflict of interest.
The authors reserve the right not to be responsible for the topicality, correctness, completeness, and quality of the information provided. Liability claims regarding damage caused by the use of any information provided will be rejected. Conclusions made in this study are solely opinions of the authors and do not express the views of the employer, university, or funding agency.
Publisher's note: Copernicus Publications remains neutral with regard to jurisdictional claims in published maps and institutional affiliations.
This publication is dedicated to the memory of Fritz Rummel who passed away in 2019 and has been for many years involved in carrying out hydrofracturing tests across the greater Ruhr region. The authors are particularly grateful to ConocoPhillips and Deutsche Montan Technologie GmbH (DMT) for providing an opportunity to review and summarise the vast amount of hydrofracturing data obtained between 1986 and 1995 in the greater Ruhr region as well as borehole logging data. The authors especially thank Peter Bormann from ConocoPhillips and Bodo Lehmann from DMT. The authors would like to also thank engineers, scientists, and mining and drilling technicians that were involved in carrying out hydrofracturing tests analysed in this study. The authors would like to especially thank the personnel of the former MeSy GmbH who prepared many technical reports and summaries which served as a base for this work. The authors would like to also acknowledge the help of Thomas Reinsch from Fraunhofer IEG, Erik H. Saenger from Fraunhofer IEG and Bochum University of Applied Sciences, Thomas Röckel from Piewak & Partner GmbH, and Birgit Müller from Karlsruhe Institute of Technology during the preparation period of this paper. Additional thanks go to Alexander Jüstel from Fraunhofer IEG for helping with GIS data. The authors would like to especially thank Jochem Kück and Paola Montone for carefully revising the paper as well as Joschka Röth and Daniel Bücken for their useful comments.
The funding of the Geothermale Papiertrocknung project (EFRE-0801837) depicting the frameworks for the elaboration of the present study, by the European Union and the Ministry for Economic Affairs, Innovation, Digitalisation and Energy of the state of North Rhine-Westphalia and the Ministry of Culture and Science of the State of North Rhine-Westphalia, respectively, is greatly appreciated. The funding of the 3DRuhrMarie (FHprofUnt2016) project from the German Federal Ministry of Education and Research and geomecon GmbH is also acknowledged. The work has also been supported by the project Spannungsmodell Endlagerung Deutschland SpannEnD 2.0 funded by the federal company for radioactive waste disposal BGE.
This paper was edited by Kirsten Elger and reviewed by Jochem Kück and Paola Montone.
Amadei, B. and Stephansson, O.: Rock stress and its measurement, Chapman & Hall, 490 pp., https://doi.org/10.1007/978-94-011-5346-1, 1997. a, b
Bachmann, M., Michelau, P., and Rabitz, A.: Das Rhein-Ruhr-Revier Stratigraphie, Fortschr. Geol. Rheinld. u. Westf., 19, 19–33, 1971. a
Balcewicz, M., Ahrens, B., Lippert, K., and Saenger, E. H.: Characterization of discontinuities in potential reservoir rocks for geothermal applications in the Rhine-Ruhr metropolitan area (Germany), Solid Earth, 12, 35–58, https://doi.org/10.5194/se-12-35-2021, 2021. a, b
Baumann, H.: Regional Stress Field and Rifting in Western Europe, in: Mechanism of Graben Formation, edited by: ILLIES, J., Vol. 17 of Developments in Geotectonics, 105–111, Elsevier, https://doi.org/10.1016/B978-0-444-41956-9.50013-7, 1981. a
Blöcher, G., Cacace, M., Jacquey, A. B., Zang, A., Heidbach, O., Hofmann, H., Kluge, C., and Zimmermann, G.: Evaluating micro-seismic events triggered by reservoir operations at the geothermal site of Groß Schönebeck (Germany), Rock Mechan. Rock Eng., 51, 3265–3279, 2018. a
Brenne, S.: Hydraulic fracturing and flow experiments on anisotropic and pre-fractured rocks, PhD thesis, Ruhr-University Bochum, Bochum, Germany, 182 pp., urn:nbn:de:hbz:294-49165, 2016. a, b
Brix, M., Drozdzewski, G., Greiling, R., Wolf, R., and Werde, V.: The N Variscan margin of the Ruhr coal district (Western Germany): structural style of a buried thrust front?, Geol. Rundsch., 77, 115–126, https://doi.org/10.1007/BF01848679, 1988. a, b
DEKORP: Results of deep-Seismic reflection investigations in the Rhenish Massif, Tectonophysics, 173, 507–515, https://doi.org/10.1016/0040-1951(90)90242-Z, 1990. a, b, c, d
Drozdzewski, G.: Die Wurzel der Osning-Überschiebung und der Mechanismus herzynischer Inversionsstörungen in Mitteleuropa, Geologische Rundschau (1910. Print), 1988. a, b, c
Drozdzewski, G.: The Ruhr coal basin (Germany): structural evolution of an autochthonous foreland basin, Int. J. Coal Geol., 23, 231–250, https://doi.org/10.1016/0166-5162(93)90050-K, 1993. a, b, c, d
Drozdzewski, G., Henscheid, S., Hoth, P., Juch, D., Littke, R., Vieth, A., and Wrede, V.: The pre-Permian of NW-Germany – structure and coalification map, Z. Dtsch. Ges. Geowiss., 160, 159–172, https://doi.org/10.1127/1860-1804/2009/0160-0159, 2009. a, b
Duda, M. and Renner, J.: The weakening effect of water on the brittle failure strength of sandstone, Geophys. J. Int., 192, 1091–1108, https://doi.org/10.1093/gji/ggs090, 2012. a, b
Eder, F., Engel, W., Franke, W., and Sadler, P.: Devonian and Carboniferous limestone-turbidites of the Rheinisches Schiefergebirge and their tectonic significance, in: Intracontinental fold belts, Springer, 93–124, https://doi.org/0.1007/978-3-642-69124-9_5, 1983. a
Ferrill, D., Winterle, J., Wittmeyer, G., Sims, D., Colton, S., and Armstrong, A.: Stressed Rock Strains Groundwater at Yucca Mountain, Nevada, in: GSA Today, A Publication of the Geological Society of America, Vol. 2, 2–8, 1999. a
Franke, W., Bortfeld, R., Brix, M., Drozdzewski, G., Dürbaum, H., Giese, P., Janoth, W., Jödicke, H., Reichert, C., Scherp, A., Schmoll, J., Thomas, R., Thünker, M., Weber, K., Wiesner, M., and Wong, H.: Crustal structure of the Rhenish Massif: results of deep seismic reflection lines DEKORP 2-North and 2-North-Q, Geologische Rundschau, 79, 523–566, 1990. a
GD NRW: Großtektonik Ruhrgebiet, https://www.opengeodata.nrw.de/produkte/geologie/geologie/SP/grosstekruhr/3b81e661-ac40-44f9-ab8a-93a8bed8b620 (last access: 10 January 2022), 2017. a, b, c, d, e
GD NRW: Geologische Übersichtskarte von Nordrhein-Westfalen, https://www.opengeodata.nrw.de/produkte/geologie/geologie/GK/ISGK500/ (last access: 29 September 2022), 2019. a, b, c, d, e
Grünthal, G. and Stromeyer, D.: The recent crustal stress field in Central Europe sensu lato and its quantitative modelling, Geol. Mijn., 73, 173–180, 1994. a
Haimson, B. and Cornet, F.: ISRM suggested methods for rock stress estimation – part 3: hydraulic fracturing (HF) and/or hydraulic testing of pre-existing fractures (HTPF), Int. J. Rock Mechan. Mining Sci., 40, 1011–1020, 2003. a
Healy, D. and Hicks, S. P.: De-risking the energy transition by quantifying the uncertainties in fault stability, Solid Earth, 13, 15–39, https://doi.org/10.5194/se-13-15-2022, 2022. a
Heidbach, O., Barth, A., Müller, B., Reinecker, J., Stephansson, O., Tingay, M., and Zang, A.: WSM quality ranking scheme, database description and analysis guidelines for stress indicator, https://gfzpublic.gfz-potsdam.de/pubman/item/item_4732890 (last access: 10 January 2022), 2016. a, b, c, d, e, f, g, h
Heidbach, O., Rajabi, M., Cui, X., Fuchs, K., Müller, B., Reinecker, J., Reiter, K., Tingay, M., Wenzel, F., Xie, F., Ziegler, M., Zoback, M. L., and Zoback, M.: The World Stress Map database release 2016: Crustal stress pattern across scales, Tectonophysics, 744, 484–498, https://doi.org/10.1016/j.tecto.2018.07.007, 2018. a, b, c, d, e
Henk, A.: Perspectives of Geomechanical Reservoir Models - Why Stress is Important, Oil Gas Europ. Mag., 35, 20–24, 2009. a
Hergert, T., Heidbach, O., Reiter, K., Giger, S. B., and Marschall, P.: Stress field sensitivity analysis in a sedimentary sequence of the Alpine foreland, northern Switzerland, Solid Earth, 6, 533–552, https://doi.org/10.5194/se-6-533-2015, 2015. a
Hesemann, J.: Die Ergebnisse der Bohrung Münsterland 1, VS Verlag für Sozialwissenschaften, https://doi.org/10.1007/978-3-663-06999-7_3, 1965. a, b
Hinzen, K.-G.: Stress field in the Northern Rhine area, Central Europe, from earthquake fault plane solutions, Tectonophysics, 377, 325–356, 2003. a
Hubbert, M. K. and Willis, D. G.: Mechanics of hydraulic fracturing, Trans. AIME, 210, 153–168, 1957. a
Jaeger, J., Cook, N., and Zimmerman, R.: Fundamental of Rock Mechanics, Cambridge University Press, https://doi.org/10.1017/CBO9780511735349, 2007. a, b
Kruszewski, M., Hofmann, H., Alvarez, F. G., Bianco, C., Haro, A. J., Garduño, V. H., Liotta, D., Trumpy, E., Brogi, A., Wheeler, W., and Bastesen, E.: Integrated stress field estimation and implications for enhanced geothermal system development in Acoculco, Mexico, Geothermics, 89, 101931, https://doi.org/10.1016/j.geothermics.2020.101931, 2021a. a
Kruszewski, M., Montegrossi, G., Backers, T., and Saenger, E. H.: In Situ Stress State of the Ruhr Region (Germany) and Its Implications for Permeability Anisotropy, Rock Mechan. Rock Eng., 54, 6649–6663, https://doi.org/10.1007/s00603-021-02636-3, 2021b. a, b
Kruszewski, M., Klee, G., Niederhuber, T., and Heidbach, O.: In-Situ Stress Orientation Data from the Greater Ruhr Region (Germany) Derived from Hydrofracturing Tests and Borehole Logs, Fordatis [data set], https://doi.org/10.24406/fordatis/200, 2022a. a, b
Kruszewski, M., Klee, G., Niederhuber, T., and Heidbach, O.: In-Situ Stress Magnitude Data from the Greater Ruhr Region (Germany) Derived from Hydrofracturing Tests and Borehole Logs, Fordatis [data set], https://doi.org/10.24406/fordatis/201, 2022b. a, b
Kruszewski, M., Klee, G., Niederhuber, T., and Heidbach, O.: Reports from Hydrofracturing Tests Performed in the Greater Ruhr Region (Germany) between 1986 and 1995, Fordatis [data set], https://doi.org/10.24406/fordatis/222, 2022c. a, b
Kruszewski, M., Montegrossi, G., Balcewicz, M., de Los Angeles Gonzalez de Lucio, G., Igbokwe, O. A., Backers, T., and Saenger, E. H.: 3D in situ stress state modelling and fault reactivation risk exemplified in the Ruhr region (Germany), Geomechan. Energy Environ., https://doi.org/10.1016/j.gete.2022.100386, 2022d. a
Kück, J.: Hydraulic Fracturing Gebirgsspannungsmessungen auf der 940 m Sohle des Ruhrkohle-Bergwerks Haus Aden. Diplomarbeit., Ph.D. thesis, Ruhr-Universität Bochum, Bochum, Germany, 1988. a, b
Lecampion, B. and Lei, T.: Reconstructing the 3d initial stress state over reservoir geo-mechanics model from local measure-ments and geological priors: a bayesian approach, Schlumberger J. Model Des. Simul., 1, 100–4, 2010. a
Ljunggren, C., Chang, Y., Janson, T., and Christiansson, R.: An overview of rock stress measurement methods, Int. J. Rock Mechan. Mining Sci., 40, 975–989, 2003. a
Mardia, K. V.: Statistics of directional data, J. Roy. Stat. Soc. B (Methodological), 37, 349–371, 1975. a
MeSy: Compilation of Existing Hydrofrac In-Situ Stress Data For the Ruhr Carboniferous, Report No. 28.94, internal report in German, 1994 (unpublished). a, b, c
MeSy: CBM – Project Sigillaria License Area. Cased-Hole Permeability And Hydrofrac Stress Measurements in Borehole Natrap-1, Final Report, Report No. 39.95, internal report in German, unpublished, 1995a.
MeSy: CBM – Project Sigillaria License Area. Open-Hole Permeability And Hydrofrac Stress Measurements in Borehole Rieth-1, Final Report, Report no. 27.95, internal report in German, unpublished, 1995b.
MeSy: CBM – Project Sigillaria License Area. Open-Hole Permeability And Hydrofrac Stress Measurements in Borehole Rieth-1, Operation Report, internal report in German, unpublished, 1995c.
MeSy: CBM – Project Sigillaria License Area. Open-Hole Permeability And Hydrofrac Stress Measurements in Borehole Natrap-1, Final Report, Report no. 35.95, internal report in German, unpublished, 1995d. a
MeSy: CBM – Project Sigillaria License Area. Cased-Hole Permeability And Stress Measurements in Borehole Natrap-1, Operation Report and Overview Plots, internal report in German, unpublished, 1995e.
MeSy: CBM – Project Sigillaria License Area. Cased-Hole Permeability And Stress Measurements in Borehole Rieth-1, Final Report, Report No. 29.95, internal report in German, unpublished, 1995f.
MeSy: CBM – Project Sigillaria License Area. Cased-Hole Permeability And Stress Measurements in Borehole Rieth-1, Phase II, Operation Report, internal report in German, unpublished, 1995g.
MeSy: CBM – Project Sigillaria License Area. Cased-Hole Permeability And Stress Measurements in Borehole Rieth-1, Operation Report, internal report in German, unpublished, 1995h.
MeSy: Hydrofrac Spannungsmessungen in Einer Vertikal- und Einer Horizontalbohrung im Bergwerk Niederberg Neukirchen-Vluyn. 3. Sohle, ca. – 630 m. Endbericht, Bericht Nr. 19.95, internal report in German, unpublished, 1995i.
MeSy: Hydrofrac Spannungsmessungen in Einer Vertikal- und Einer Horizontalbohrung auf der 3. Sohle, ca. 630 m Bergwerk Niederberg, Neukirchen-Vluyn, internal report in German, unpublished, 1995j.
MeSy: CBM – Project Sigillaria License Area. Cased-Hole Permeability And Hydrofrac Stress Measurements in Borehole Natrap-1, Final Report, Report No. 39.95, internal report in German, unpublished, 1995k.
MeSy: CBM – Project Sigillaria License Area. Open-Hole Permeability And Hydrofrac Stress Measurements in Borehole Natrap-1, Operation Report, internal report in German, unpublished, 1995l.
MeSy: CBM – Project Sigillaria License Area. Cased-Hole Permeability Measurements in Borehole Natrap-1, Final Report, Report No. 23.96, internal report in German, unpublished, 1996a.
MeSy: CBM – Project Sigillaria License Area. Cased-Hole Permeability Measurements in Borehole Natrap-1, Final Report, Report No. 23.96, internal report in German, unpublished, 1996b.
MeSy: Hydrofrac Spannungsmessungen in Einer Vertikal- und Einer Horizontalbohrung im Bergwerk Niederberg Neukirchen-Vluyn, 3. Sohle, ca. – 630 m, Endbericht, Bericht Nr. 02.96, internal report in German, unpublished, 1996c.
Morawietz, S., Heidbach, O., Reiter, K., Ziegler, M., Rajabi, M., Zimmermann, G., Müller, B., and Tingay, M.: An open-access stress magnitude database for Germany and adjacent regions, Geotherm. Energy, 8, 25, https://doi.org/10.1186/s40517-020-00178-5, 2020. a, b, c, d, e, f, g, h
Morris, A., Ferrill, D. A., and Henderson, D. B.: Slip-tendency analysis and fault reactivation, Geology, 24, 275–278, https://doi.org/10.1130/0091-7613(1996)024<0275:STAAFR>2.3.CO;2, 1996. a
Müller, W.: Messung der absoluten Gebirgsspannungen im Steinkohlenbergbau, Glückauf-Forschungshefte, 50, 105–112, 1989. a
Muskat, M.: Use of data oil the build-up of bottom-hole pressures, T. AIME, 123, 44–48, 1937. a
Müller, W.: The stress state in the Ruhr Coalfield, in: Proc., 7th ISRM Congress, Int. Soc. Rock Mechan., Aachen Germany, ISRM-7CONGRESS-1991-306, 1707–1711, 1991. a
Niederhuber, T., Kruszewski, M., Röckel, T., Rische, M., Alber, M., and Müller, B.: Stress orientations from hydraulic fracturing tests in the Ruhr area in comparison to stress orientations from borehole observations and earthquake focal mechanisms, Z. Dtsch. Ges. Geowiss., 12, https://doi.org/10.1127/zdgg/2022/0352, 2022. a
Rajabi, M., Tingay, M., and Heidbach, O.: The present-day stress field of New South Wales, Australia, Aust. J. Earth Sci., 63, 1–21, https://doi.org/10.1080/08120099.2016.1135821, 2016. a
Reiter, K. and Heidbach, O.: 3-D geomechanical–numerical model of the contemporary crustal stress state in the Alberta Basin (Canada), Solid Earth, 5, 1123–1149, https://doi.org/10.5194/se-5-1123-2014, 2014. a
Reiter, K., Heidbach, O., Reinecker, J., Müller, B., and Röckel, T.: Spannungskarte Deutschland 2015, Erdöl Erdgas Kohle, 131, 437–442, https://gfzpublic.gfz-potsdam.de/pubman/item/item_1361435 (last access: 10 January 2022), 2015. a
Rummel, F. and Weber, U.: Stress field in the coal mines of the Ruhr coal district, in: Géotechnique, MeSy Geo-Messsyssteme GmbH, U.S. symposium on rock mechanics, 34, Bochum 4630, Germany, ARMA-93-0609, 1993. a
Schmitt, D. R., Currie, C. A., and Zhang, L.: Crustal stress determination from boreholes and rock cores: Fundamental principles, Tectonophysics, 580, 1–26, https://doi.org/10.1016/j.tecto.2012.08.029, 2012. a, b
Segall, P. and Fitzgerald, S. D.: A note on induced stress changes in hydrocarbon and geothermal reservoirs, Tectonophysics, 289, 117–128, https://doi.org/10.1016/S0040-1951(97)00311-9, 1998. a
Sheorey, P.: A theory for In Situ stresses in isotropic and transverseley isotropic rock, Int. J. Rock Mechan. Min. Sci. Geomechan. Ab., 31, 23–34, https://doi.org/10.1016/0148-9062(94)92312-4, 1994. a, b
Stelling, W. and Rummel, F.: Messung von Primärspannungen durch Hydraulic Fracturing auf dem Bergwerk Haus Aden, Mitteilung aus dem Markscheidewesen, 99, 176–184, 1992. a
Stiller, M., Kaerger, L., Agafonova, T., Krawczyk, C., Oncken, O., Weber, M., Former DEKORP Project Leaders, Former DEKORP Research Group, and Former DEKORP Processing Centre: Deep seismic reflection profile DEKORP 1986-2N across the eastern Rhenish Massif and the Muensterland Basin, Northwest Germany, GFZ Data Services [data set], https://doi.org/10.5880/GFZ.DEKORP-2N.001, 2021. a
Tingay, M., Muller, B., Reinecker, J., and Heidbach, O.: State and origin of the present-day stress field in sedimentary basins: New results from the World Stress Map Project, in: Golden Rocks 2006, The 41st US Symposium on Rock Mechanics (USRMS), OnePetro, ISBN 1604236221, 2006. a
Walsh, F. R. and Zoback, M. D.: Probabilistic assessment of potential fault slip related to injection-induced earthquakes: Application to north-central Oklahoma, USA, Geology, 44, 991–994, https://doi.org/10.1130/G38275.1, 2016. a
Wu, F. and Zoback, M.: Observations and modelling of co-seismic stress changes in the M7.6 Chi-Chi earthquake, in: Abstracts of the 3rd World Stress Map conference, Potsdam, World Stress Map, p. 73, 2008. a
Ziegler, M. O. and Heidbach, O.: The 3D stress state from geomechanical–numerical modelling and its uncertainties: a case study in the Bavarian Molasse Basin, Geotherm. Energy, 8, 1–21, https://doi.org/10.1186/s40517-020-00162-z, 2020. a
Ziegler, P. A.: Geological atlas of western and central Europe, Geological Society of London, 239 pp., ISBN 9066441259, 9789066441255, 1990. a
Zoback, M. D.: Reservoir Geomechanics, Cambridge University Press, 449 pp., https://doi.org/10.1017/CBO9780511586477, 2007. a
- Abstract
- Introduction
- Geological Setting
- Reduced stress tensor
- Test locations
- Measuring system and testing procedure
- Data interpretation and in situ stress estimation
- Results
- Discussion
- Data availability
- Conclusions
- Author contributions
- Competing interests
- Disclaimer
- Acknowledgements
- Financial support
- Review statement
- References