the Creative Commons Attribution 4.0 License.
the Creative Commons Attribution 4.0 License.
 | 30 Nov 2022
The hourly wind-bias-adjusted precipitation data set from the Environment and Climate Change Canada automated surface observation network (2001–2019)
Eva Mekis
Megan Hartwell
Amber Ross
The measurement of precipitation in the Environment and Climate Change Canada (ECCC) surface network is a crucial component for climate and weather monitoring, flood and water resource forecasting, numerical weather prediction, and many other applications that impact the health and safety of Canadians. Through the late 1990s and early 2000s, the ECCC surface network modernization resulted in a shift from manual to automated precipitation measurements. Although many advantages to automation are realized, such as enhanced capabilities for monitoring in remote locations and a higher frequency of observations at lower cost, the increased reliance on automated precipitation gauges has also resulted in additional challenges, especially with data quality and homogenization. The automated weighing precipitation gauges used in the ECCC operational network have an increased propensity for wind-induced undercatch of solid precipitation. One outcome of the World Meteorological Organization (WMO) Solid Precipitation Intercomparison Experiment (SPICE) was the development of transfer functions for the adjustment of high-frequency solid precipitation measurements made with gauge/wind shield configurations used in the ECCC surface network. Using the SPICE universal transfer function (UTF), hourly precipitation measurements from 397 ECCC automated climate stations were retroactively adjusted for wind undercatch. The data format, quality control, and adjustment procedures are described here. The hourly adjusted data set (2001–2019; version v2019UTF) is available via the ECCC data catalogue at https://doi.org/10.18164/6b90d130-4e73-422a-9374-07a2437d7e52 (ECCC, 2021). A basic spatial impact assessment shows that the highest relative total precipitation adjustments occur in the Arctic, where solid precipitation has an overall higher annual occurrence ratio. The highest adjustments for solid precipitation are shared by the Arctic, Southern Prairies, and the coastal Maritimes, where stations tend to be more exposed and snowfall events occur at higher wind speeds.
- Article
(4630 KB) - Full-text XML
- BibTeX
- EndNote


1.1 Motivation
Accurate precipitation measurements are required for many climatological, meteorological, and hydrological applications such as climate trend analysis (Vincent and Mekis, 2006; Vincent et al., 2018), water resource forecasting (Barnett et al., 2005; Pomeroy et al., 2007), and numerical weather prediction model verification (Buisán et al., 2020; Køltzow et al., 2020). It is well recognized that precipitation observations made in cold regions are prone to underestimation due to the undercatch of solid precipitation related to gauge configuration and wind speed (e.g. Sevruk et al., 1991; Goodison et al., 1998; Kochendorfer et al., 2017a).
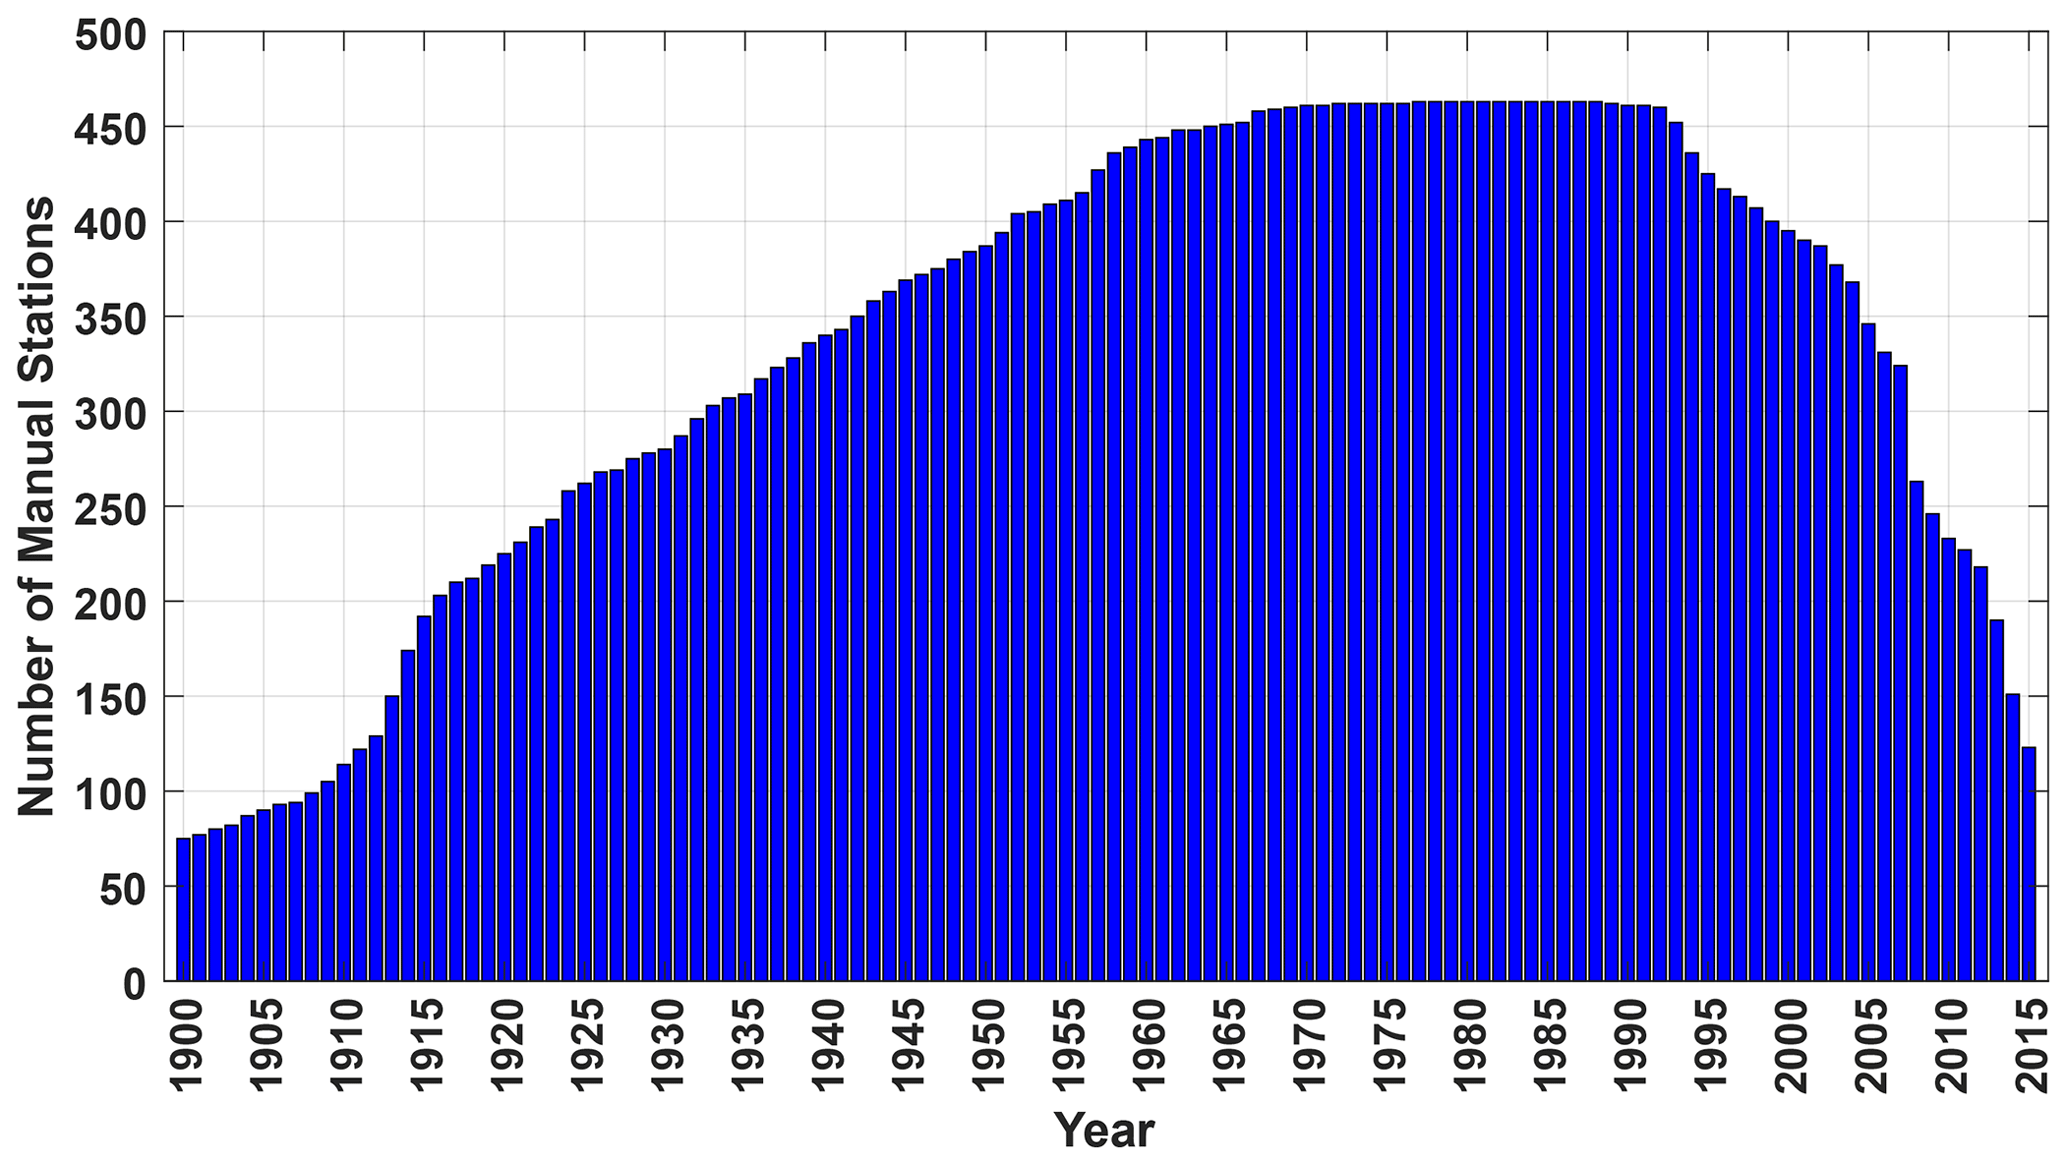
Figure 1Evolution of the quantity of manual stations in the ECCC operational network from 1900 to 2015 (from Mekis et al., 2018).
The Environment and Climate Change Canada (ECCC) surface observation network has undergone many historical transitions, but perhaps the most significant is the shift from manual to automated measurements. This transition began in the early 1990s and accelerated in the early 2000s (Fig. 1; Mekis et al., 2018). The transition to automated precipitation measurements has both advantages and disadvantages. Although automation of stations is a cost-saving alternative, the current state of technology is such that this practice imposes limitations in terms of data quality and availability (such as the lack of independent snowfall observations). Furthermore, the lack of detailed metadata limits the possibilities for correcting some of the observations (Mekis et al., 2018). Automation does provide the potential for lower cost monitoring in remote regions with the increased frequency of observations (i.e. hourly rather than daily measurements).
Along with station automation came the change in instrument configuration for the measurement of precipitation. While the use of the manual type B gauges for measuring liquid precipitation and the snow ruler or Canadian Nipher gauge for measuring solid and mixed precipitation were prevalent into the mid-1990s (Devine and Mekis, 2008), the use of automated gauges such as the Belfort Universal and Fisher and Porter (which appeared as early as 1965) became more common. Eventually, the Geonor T-200B, OTT Pluvio1, and OTT Pluvio2L became the standard gauge configuration in the ECCC automated network (Mekis et al., 2018). Gauge intercomparisons as early as the 1970s and 1980s (Goodison, 1978; Goodison et al., 1998) showed that catch efficiency of these automated configurations (both shielded and unshielded) for solid precipitation decreased with wind speed much faster than for the Canadian Nipher gauge. The resulting inhomogeneities introduced into the Canadian observation network with automated gauges are problematic for climate trend analysis, but historically, the impact of these inhomogeneities were mitigated by employing climate-dependent conversions to manual snow ruler measurements as a proxy for the gauge measurement of solid precipitation (Mekis and Brown, 2010; Mekis and Vincent, 2011). However, this technique is now threatened by the continued decline in manual snow ruler snowfall measurements in much of Canada, which hastens the need to utilize the automated precipitation gauge measurements from the in situ ECCC observation network. In turn, this necessitates the adjustment of those measurements for the systematic bias due to wind-induced undercatch of solid precipitation.
1.2 WMO-SPICE recommendations
The World Meteorological Organization (WMO) Solid Precipitation Intercomparison Experiment (SPICE) was an international field measurement program that took place during the Northern Hemisphere winters of 2013/2014 and 2014/2015. SPICE involved 16 countries contributing 20 intercomparison sites and incorporating over 200 instrument installations. A complete SPICE project description with detailed results (IOM Report-No. 131; Nitu et al., 2018) is available via the WMO library (https://library.wmo.int/doc_num.php?explnum_id=5686, last access: October 2022).
One of the key objectives of WMO SPICE was to assess the possibility of deriving transfer functions to account for (and, ideally, to correct) wind-induced error in solid precipitation measurement, and this included investigating the concept of universal transfer functions, which can be applied to data from instruments with a specific configuration in different climate conditions (Nitu et al., 2018).
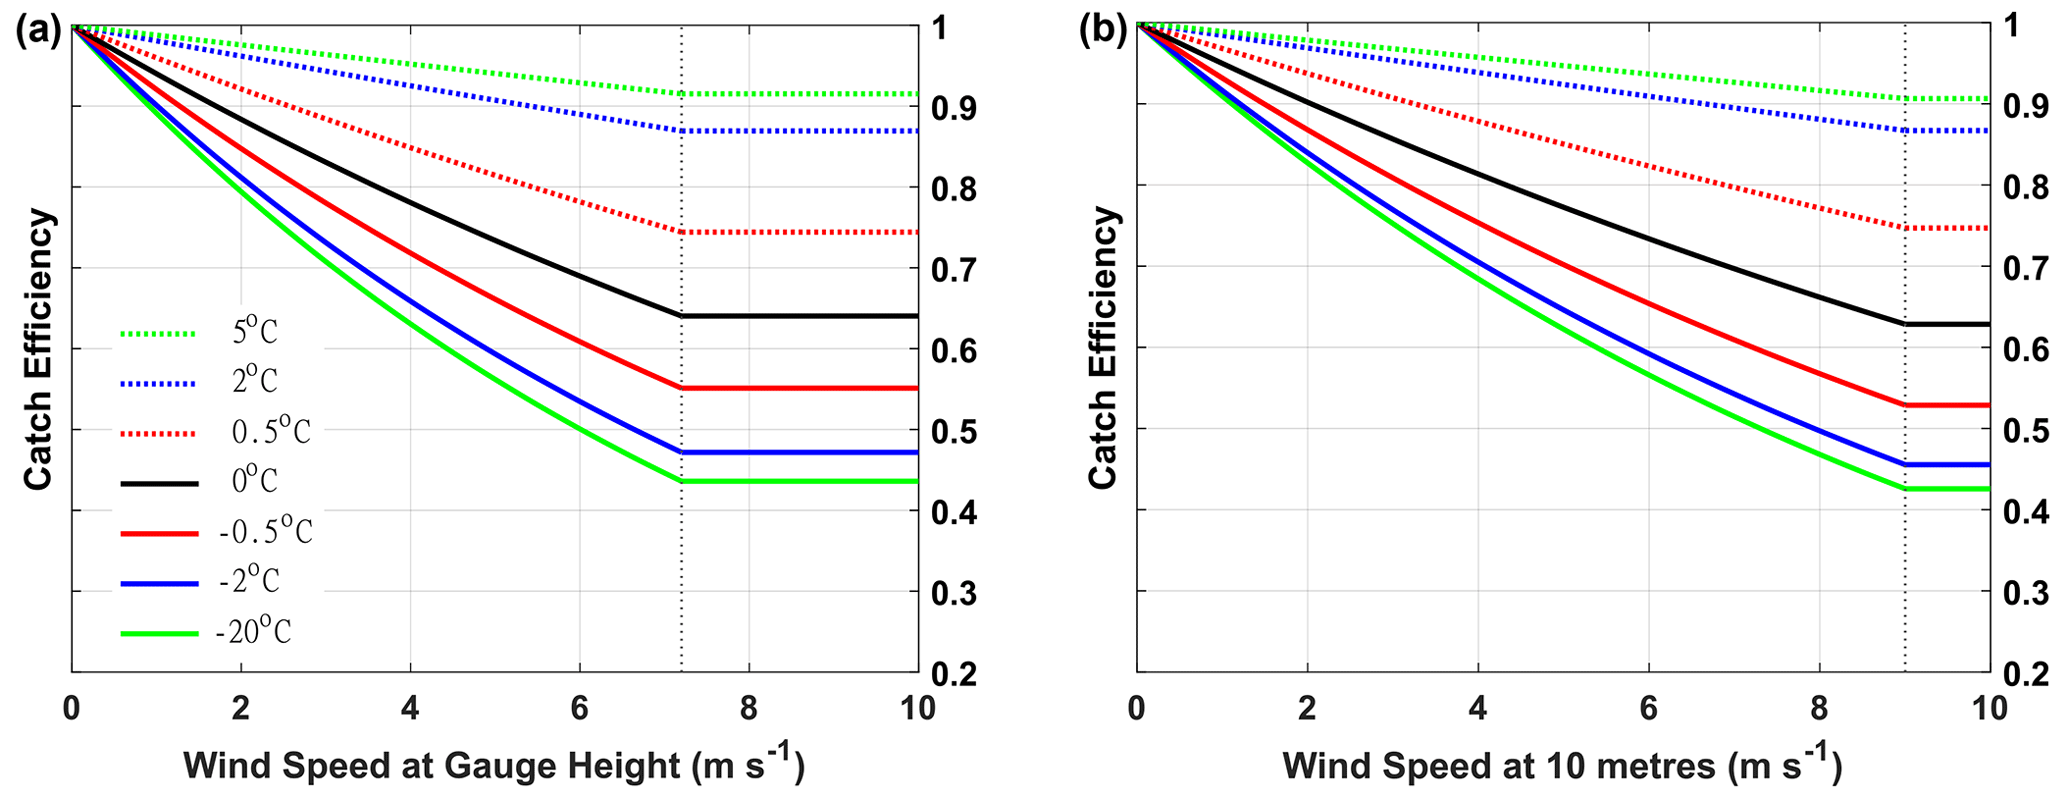
Figure 2The SPICE universal transfer function (Eq. 1) plotted with coefficients for the single Alter Shield and wind measured at gauge height (a) and 10 m (b) for temperatures of +5, +2, +0.5, 0, −0.5, −2, and −20 ∘C. The inflection point where the catch efficiency is set to a minimum occurs at wind speed thresholds (Ut) of 7.2 m s−1 (for gauge height wind) and 9.0 m s−1 (for 10 m wind) and is marked by the vertical dotted line.
Following SPICE analysis, and the development of a universal transfer function (hereafter referred to as UTF), the recommendation from SPICE is to apply the methods for developing transfer functions and apply those transfer functions to national and regional precipitation measurements in various climate regimes, while recognizing that more work is necessary for the development of climate zone specific transfer functions (Nitu et al., 2018).

Figure 3Location of the 397 ECCC automated climate stations selected for the application of the SPICE UTF.
1.3 The SPICE universal transfer function
The development of the SPICE UTF for adjusting the automated accumulating gauge measurements of solid precipitation followed the development of previous transfer functions that were generally more focused on site-specific gauge intercomparisons (Smith, 2008; Wolff et al., 2015; Kochendorfer et al., 2017a). What makes the SPICE UTF unique is the methodology that combines the catch efficiency ratios (configuration under test vs. the reference) for automated gauges using the same shield configuration at multiple (eight) sites. Kochendorfer et al. (2017b) describes this methodology, and the resulting transfer functions, in more detail. The methodology employed the WMO Double Fence Automated Reference (DFAR) system, which incorporated a precipitation detection device to increase the reliability of the 30 min event-based data used to fit the transfer function model. There were two transfer function models published by Kochendorfer et al. (2017b), where there is one that is continuous with temperature and the other requires the user to determine precipitation phase. Since there are no direct observations of phase available operationally in Canada via the automated networks (and determining phase would require user subjectivity), the temperature continuous transfer function model was chosen for this application. This transfer function takes the following form:
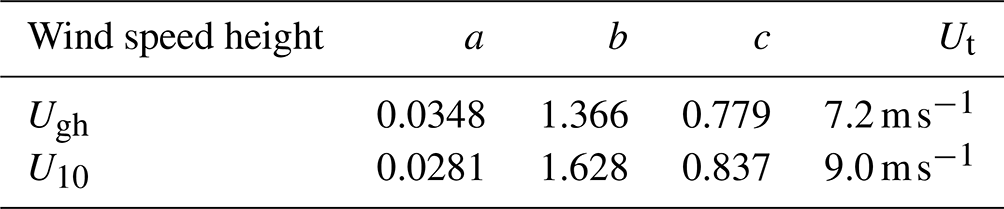
where CE is the catch efficiency of the automated gauge, U is wind speed (either measured at the standard 10 m height or at gauge height) in metres per second (m s−1), Tair is air temperature in degrees Celsius (∘C), and a, b, and c are coefficients to fit the data to the model. In the SPICE methodology, to reduce the impact of fewer events at higher wind speeds and the potential impacts of blowing snow, the SPICE data were filtered to remove 30 min precipitation events with mean wind speeds higher than a threshold (Ut) of 7.2 m s−1 (9 m s−1) at gauge height (10 m). The transfer function for a single Alter Shield gauge is shown in Fig. 2, using the coefficients from Kochendorfer et al. (2017b; Table 1) for wind speed measured at gauge height (typically 2 m above ground level) and at selected distinct temperatures between +5 and −20 ∘C.
A performance assessment was completed on the UTF by both Kochendorfer et al. (2017b) and Smith et al. (2020). Kochendorfer et al. (2017b), using data from the same intercomparison period as used for the UTF development, showed that the application of the UTF to individual sites reduced the bias in the precipitation measurement but did not necessarily decrease the uncertainty. Similar to Kochendorfer et al. (2017b), Smith et al. (2020) used a more independent (post-SPICE) assessment data set and showed that the performance of the UTF varied substantially with site, generally under-adjusting solid precipitation measurements at windy sites and over-adjusting solid precipitation measurements at less windy sites (using a 10 m mean wind speed during snowfall of approximately 3 m s−1 to divide the sites into the two wind classes). The message from both assessments is that the adjustments should be used with some caution, recognizing that site climatic conditions impact the UTF performance, and that this impact is difficult to assess without a co-located reference.
The stations list for the hourly wind-bias-adjusted precipitation data set is a subset of the stations in the automatic station network operated by ECCC. The network consists of fully automated stations, including both surface weather and Reference Climate Stations (RCS). Special focus was given to the RCS protected stations, i.e. those identified by ECCC to the WMO for longevity and reliability (Vincent et al., 2020) to fulfil the climate-research-focused requirements in data-sparse areas of Canada. The typical observed parameters are air temperature, precipitation accumulation and intensity, wind speed and direction, snow depth, humidity, and air pressure. Most locations are inspected by the ECCC on a regular (annual or semi-annual) basis.
All hourly precipitation, temperature and wind observations were extracted from the Historical Climate Data repository of ECCC's National Climate Archive (http://www.climate.weather.gc.ca, last access: November 2022).
2.1 Site selection
Initial station selection included all Geonor and Pluvio gauges that were installed prior to 2015 (Milewska et al., 2019). This included many stations in northern Canada, where automation started in the early 2000s. A later set of stations was added to this list, which were selected for the value they add to climate research. These later additions were selected from the automated stations installed post-2015 and included those that were in proximity to earlier manual or Adjusted and Homogenized Canadian climate Data (AHCCD; Mekis and Vincent, 2011) station. This expanded list of stations is being used in homogenization precipitation projects that are currently in progress. An effort was made to include all RCS locations, as they are designated as protected sites.

Figure 4Standard automated precipitation gauge configurations deployed across the ECCC network. Geonor T-200B gauge with single Alter Shield (a). OTT Pluvio2L gauge with double Alter Shield (b).
2.2 Precipitation measurements
The first version of this adjusted automated data set, published by Milewska et al. (2019), used a transfer function developed prior to WMO-SPICE and included 312 Geonor T-200B (600 mm capacity) and 34 OTT Pluvio1 (1000 mm capacity) or Pluvio2L (1500 mm capacity) automated gauges. However, the gauge types deployed in the network change over time, with stations being updated with new instruments from different manufacturers. The most significant network modernization effort is the gradual replacement of the single Alter Shield Geonor T-200B (Fig. 4a) with the double Alter Shield OTT Pluvio2L (Fig. 4b) gauge, resulting in the evolution of the ratio of Geonor to Pluvio2L gauges in the network. This change has implications for catch efficiency, varying with location, based on double Alter Shield deployment, and impacting adjustment procedures (discussed in later sections).
The Geonor T-200B weighing gauge operates using a collecting bucket suspended in a tray connected to the frame by three vibrating wire transducers. The bucket weight (and equivalent precipitation accumulation) is calculated by applying a quadratic calibration function to the measured vibration frequency for each transducer, sampled every 5 s over the last 5 min of every 15 min period. The data logger records the raw bucket weight, filtered bucket weight, and total precipitation calculated as the filtered bucket weight differential from the previous 15 min period, for each of the three vibrating wire transducers.
The similarly shaped OTT Pluvio1 and Pluvio2L precipitation gauges operate by measuring the bucket weight with a load cell. The older-generation Pluvio1 uses an internal processor to produce a pulse output for each 0.1 mm equivalency increase in the bucket weight, which is then interpreted as a precipitation accumulation. The sensor's 0.1 mm pulses are sampled once every 5 s, and the number of pulses are summed to calculate the 15 and 60 min total precipitation. The Pluvio2L is a newer generation of this instrument, with more complex onboard algorithms and the capability of digital output. The Pluvio2L digital output of accumulated precipitation amount is sampled and logged every 15 min, and interval precipitation is calculated as the difference between the current and previous amount.
Digital data processing is applied to all automated gauges. Further processing details, including processing and output characteristics, are summarized in Mekis et al. (2018). The generated output fields are controlled and stored by on-site data loggers (Campbell Scientific CR3000 or legacy CR23X) via nationally deployed data logger software programs which also perform basic sampling and filtering tasks at each location. Depending on the gauge configuration, a logger-based filter is used to minimize signal noise and false precipitation reports and is set at a threshold based on the minimum measurable amount for each gauge type (0.2 mm for the Geonor and 0.1 mm for the Pluvio2L).
2.3 Wind speed and temperature measurements
For the adjustment procedure (see Sect. 1.3 and Eq. 1), good quality and reliable hourly temperature and wind observations are required. Similar to the precipitation, the hourly surface temperature and wind observations across Canada were retrieved from the Historical Climate Data repository of ECCC's National Climate Archive (https://climate.weather.gc.ca/index_e.html, last access: November 2022).
From the National Archive, the following information was used
-
Element number 078. This is hourly surface dry-bulb temperatures (0.1 ∘C) measured inside Meteorological Service of Canada (MSC) Stevenson screens by the YSI 44212EC temperature sensors.
-
Element number 076. This is hourly wind speed (0.1 km h−1) measured with a Campbell Scientific wind monitor (mainly model no. 05103 but can have local variations, https://www.campbellsci.ca/05103-10, last access: November 2022) at 10 m heights. In the aviation network, this observation is a 2 min mean averaged prior to the top of the hour. At the MSC automatic stations, this is a 10 min mean, averaged prior to the top of the hour. Neither observation represents the mean wind speed for the full hour (this is discussed more in Sect. 3).
-
Element numbers 271–274. These are 15 min wind speed (0.1 km h−1) averages measured at the gauge height (approximately 2 m above ground level or a.g.l.) for minutes 00–15, 15–30, 30–45, and 45–60, respectively. This instrument is also mainly a Campbell Scientific model no. 05103 wind monitor. Unlike element number 076, elements 271–274 represent the mean for the period which they represent. The four 15 min elements are averaged to produce an hourly mean which is used in the adjustment.
Both wind speed measurements (element no. 076 at 10 m and element nos. 271–274 at gauge height) are required for this adjustment exercise. The gauge height wind is the preferred measurement for use in Eq. (1), but it is unfortunately not always available. The selection process and data flagging for wind are explained further in Sect. 2.5 and 2.6.
2.4 Data quality control and CODECON correction
After the initial filtering by the data logger, the precipitation data are processed through the ECCC Data Management System (DMS) and then stored in the National Climate Data Archives. The required hourly and 15 min values are extracted directly from the archive, and subjected to enhanced quality control (QC) procedures.
The first enhanced QC procedure for precipitation is a range check against a fixed threshold to screen extraneously large values. This threshold is set to 75 mm for 15 min values and 110 mm for hourly values, based on the Canadian all-time records in these respective observation periods (Milewska et al., 2019). Next, the data are checked for negative values, which could occur when the gauge is being serviced or through filtering errors at the data logger. In this particular precipitation data set, many small negative values of −0.1 mm needed to be removed, occurring primarily from the Geonor gauges prior to 2014. Similar to this, the entire data set is filtered for precipitation observations that are less than a pre-determined noise threshold for a particular gauge. These small amounts are too low to be distinguished from noise, and the thresholds correspond to the reporting limits for each gauge (Nitu et al., 2018). This also resulted in the removal of many 0.1 mm values from the Geonor gauges prior to 2014 due to the gauge reporting threshold of 0.2 mm. No small values needed to be removed from the OTT Pluvio (generations 1 and 2) gauges due to their higher precision reporting threshold of 0.1 mm.
Following the automated QC, the data are then screened manually, under the guidance of ECCC regional climatologists that provide local context. The data were first examined visually to detect large values when compared to the daily total precipitation and the monthly ratios of the 15 min and hourly totals compared to the daily totals. These checks were applied to data collected in 2013 and earlier. Subsequent checks of the hourly values were performed in comparison to the spread around the station mean. An hourly value was flagged and manually inspected if the value exceeded 11 standard deviations (SDs) from the station's mean value. The decision on the verity of the hourly value was made based on comparing it to the daily value, neighbouring stations, historical radar, and station intensity–duration–frequency (IDF) curves; over 1000 suspicious values were checked in this manner, and approximately 68 % of these values were removed.
A final manual check of the monthly total precipitation values was performed using the de-seasonalized time series. High values were identified as exceeding four SDs from the monthly de-seasonalized mean. All flagged months were inspected at the hourly level, and any erroneous hourly data were removed.
Some basic quality control was performed on the hourly temperature and wind speed values after they were extracted from the archive. The hourly temperatures were identified as possible outliers if they were below −55 ∘C or above 40 ∘C. None of these values were deemed erroneous, and all were retained. The hourly wind speed was replaced with a missing value if it was below 0 km h−1 or above 150 km h−1; there were only a handful of occurrences of the high wind speed. If 12 or more consecutive hours reported a wind speed of exactly 0 km h−1, then the full string is replaced as missing; this is likely caused by a seized anemometer (due to frost or other mechanisms).
Another revision to the archived precipitation data was required to fix issues created by a legacy data filter designed to remove relatively small noise amounts recorded by older generation automatic precipitation gauges that were prone to issues such as wind pumping (where airflow over the gauge causes the spring weighing mechanism to bounce and register false precipitation amounts). This filter was part of a data management system called Code Conversion (CODECON) that predated the current DMS and remained in place for several years following the replacement of the older-generation precipitation gauges with models that were less prone to wind pumping errors. The filter was applied by the data management system after the observations were logged by the data logger but before the data were archived. The pre-filtered logger data were not archived and therefore are not available. The result was the erroneous filtering of small but realistic precipitation amounts observed by the newer gauges capable of observations at much higher resolutions (i.e. 10ths rather than whole millimetres). Henceforth, the filter will be called the CODECON filter, and the error adjustment will be called the CODECON correction. Both are explained in greater detail by Milewska et al. (2019).
The CODECON filter was in place up until December 2013 and impacted the hourly accumulated total precipitation amounts saved in the archive. The 15 min precipitation values were not affected by the CODECON filter, so, when available (availability being temporally and spatially variable), these were used to compute the hourly precipitation values, effectively bypassing the CODECON filtering issue. However, when and where the 15 min data were unavailable, an alternative correction methodology was required. First, stations with overlapping 15 min and hourly precipitation values were used to quantify the impact of the CODECON filter on the scale of monthly precipitation, and this amount was regionally averaged to be used as a correction for each hour with precipitation. This amount was calculated for each region and month, and then divided between all hours with > 0 mm precipitation at stations without 15 min observations.
2.5 Applying the universal transfer function
The adjustment to the hourly precipitation measurements are completed using Eq. (1) and the coefficients shown in Table 1 (plotted in Fig. 2), depending on the available wind speed measurement. The default is to use the gauge height hourly mean (average of elements 271–274) wind speed measurement when available, but the adjustment reverts to the 10 m (element 076) wind speed measurement if the gauge height measurement is not available. The availability information for the wind speed measurement used in the adjustment is declared via a flag for each hourly observation. If either the air temperature or the wind speed measurement is missing, then no adjustment is made to the precipitation measurement. However, if either ancillary measurement is missing but there is a valid unadjusted precipitation measurement, then the unadjusted measurement is presented and flagged accordingly.
Since Eq. (1) is continuous with temperature, an adjustment to a precipitation event above 0 ∘C can occur. This allows for the adjustment of solid and mixed precipitation that occurs when near-surface air temperatures are above freezing. However, adjustments can conceivably occur at higher temperatures when the precipitation phase is almost definitely rain. Although Eq. (1) approaches 1 at higher temperatures, there is a small potential for the over-adjustment of rain at high wind speeds. For this reason, CE is set to 1 at all temperatures greater than 5 ∘C. It is also important to note that the SPICE transfer functions were neither designed nor intended to be used for the bias adjustment of warm season liquid precipitation.
The estimated CODECON correction explained above, if required, is added to the precipitation measurement following the adjustment. This sequence of adjustment was chosen to avoid compounding uncertainty related to both the application of the transfer function and the estimate of the CODECON correction. The data flags related to the transfer function adjustment are described in the next section and exceptions for adjustments related to the ancillary data or the gauge configuration are noted in the discussion (Sect. 3).
2.6 Data format and flagging
2.6.1 File naming and format
The data files are ASCII space delimited text files, with one file for each of the 397 stations. The file naming nomenclature is as follows: #######_UTF_hly_prec.txt, where ######## is the seven-digit station identifier. A comma-delimited station catalogue contains the station identifiers, station names, province of installation, spatial coordinates, and the start and end dates of the station data. This catalogue file is stored in the linked data archive.
Table 1Coefficients a, b, and c used in Eq. (1) specified for a single Alter Shield gauge with wind speed measured at gauge height (Ugh) and at 10 m (U10) (from Kochendorfer et al., 2017b).
2.6.2 Data description
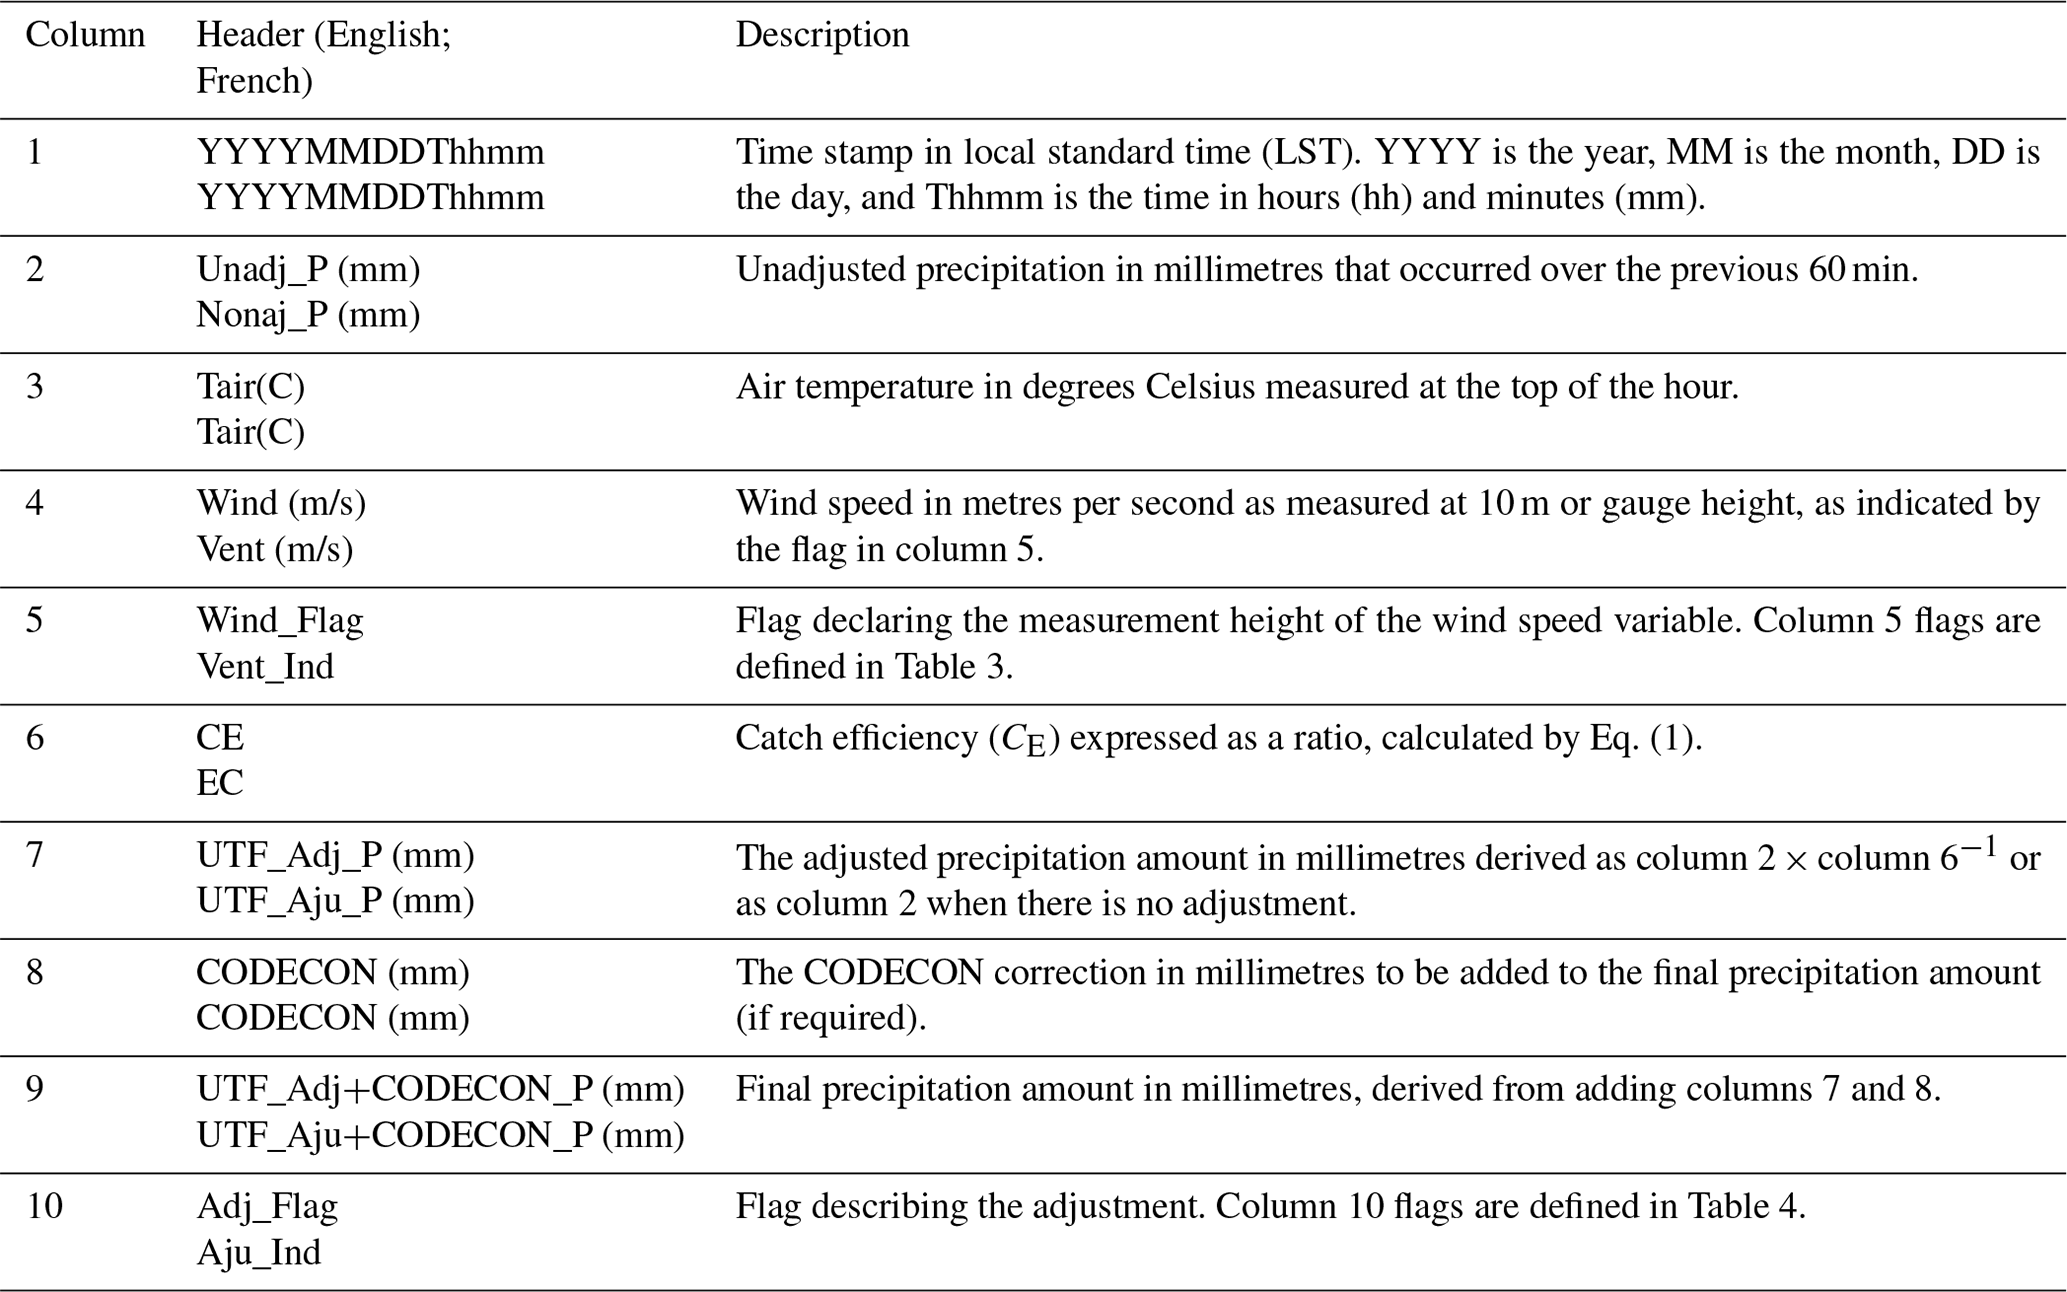
Data files contain hourly data and consist of two header rows (one in English and one in French declaring the variable name and the units) and 10 columns, with one timestamp, two flags, and seven data columns. The timestamp is in local standard time (LST; consistent with the ECCC archive), using the ISO 8601 formatting of YYYYMMDDThhmm (where YYYY is the year, MM is the month, DD is the day, and the time of day follows, with T, and the hour as hh and the minute as mm). The timestamp represents the end of the accumulation or averaging period. Table 2 describes the content of the 10 columns, and the following section describes the flagging.
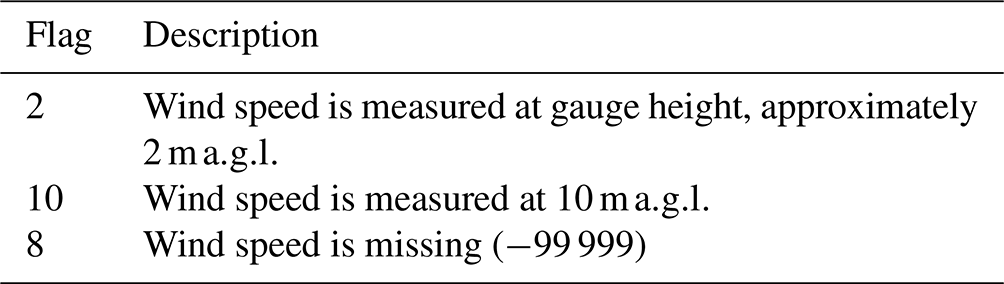
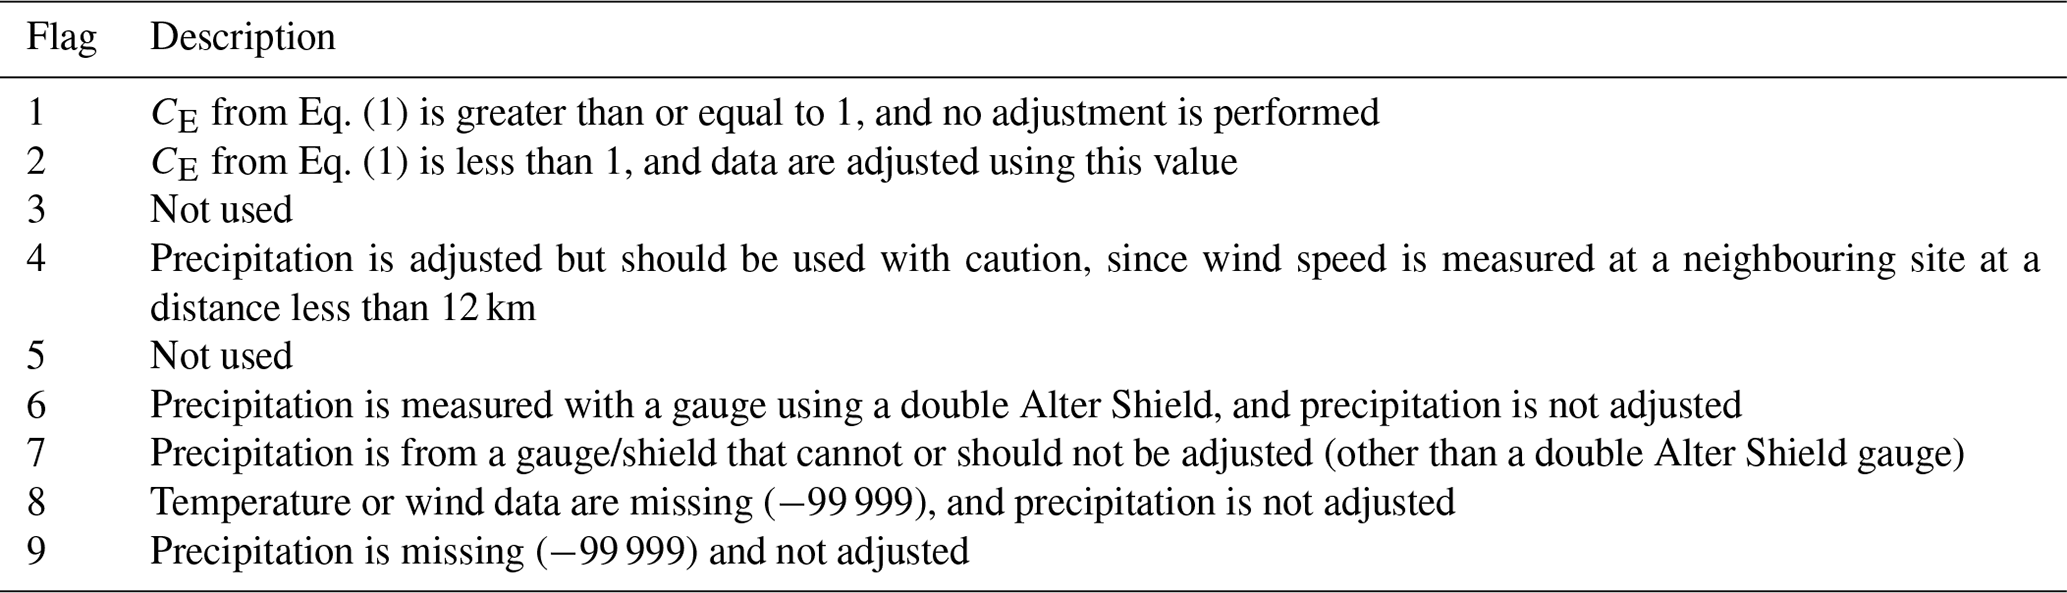
2.6.3 Flagging
Two flagging columns appear in the data, i.e. columns 5 and 10. Column 5 flags the wind speed measurement height used in Eq. (1) to calculate the catch efficiency, and they are defined in Table 3. The flag in column 10 describes the adjustment. These are defined in Table 4. All flags are discussed further in Sect. 3.
3.1 Adjustments and exceptions
Extensive effort has been made to produce a complete adjusted precipitation data set, but there are limitations to the adjustment capabilities of the generalized SPICE UTF. The UTF equation (Eq. 1) was developed for single Alter Shield automated precipitation gauges, predominately Geonor T-200B or OTT Pluvio2 gauges, because these gauges were more widely deployed during the SPICE project. Hence, we have the most confidence in applying the SPICE UTF to similar automated gauge configurations. For the most part, the single Alter Shield Geonor and Pluvio2L comprise the majority of the gauges in this data set. The exceptions, with the approximate number of each deployed in the network shown in parentheses (as of 2019), include single Alter Shield Belfort Universal (10), Tretyakov or unshielded Pluvio1 (31), Geonor high-capacity T-200B (2), and double Alter Shield Pluvio2L (68) gauges. The high-capacity single Alter Shield Geonor T-200B and Belfort Universal gauges, because of the applied common wind shield, are expected to have similar CE to the single Alter Shield gauges assessed during SPICE. This expectation can be justified via previous studies showing that, in determining CE, the shield configuration is more important than the actual gauge inside the shield (Yang et al., 1999; Rasmussen et al., 2012; Kochendorfer et al., 2017b). Therefore all measurements from the single Alter Shield Geonor T-200B and Belfort Universal gauges are adjusted using the UTF. The Tretyakov and unshielded Pluvio1 gauges are mostly deployed in the province of British Columbia (with one each in the Yukon and Northwest Territories and two in Ontario). Since there is not a transfer function for these automated configurations, they have not been adjusted, and the data from these gauges are flagged with a number 7 (Table 4).
There are four stations measuring precipitation without co-located wind speed data available for a portion of the record, where a neighbouring site (< 12 km distant) is used. These precipitation measurements are adjusted but flagged with a number 4, indicating that they should be used with caution. This occurs at Kelowna UBCO (University of British Columbia – Okanagan Campus; ID 1123996), Vancouver Harbour (ID 1108446), Pemberton Airport (ID 1086082), and Edmonton International Airport (ID 3012205).
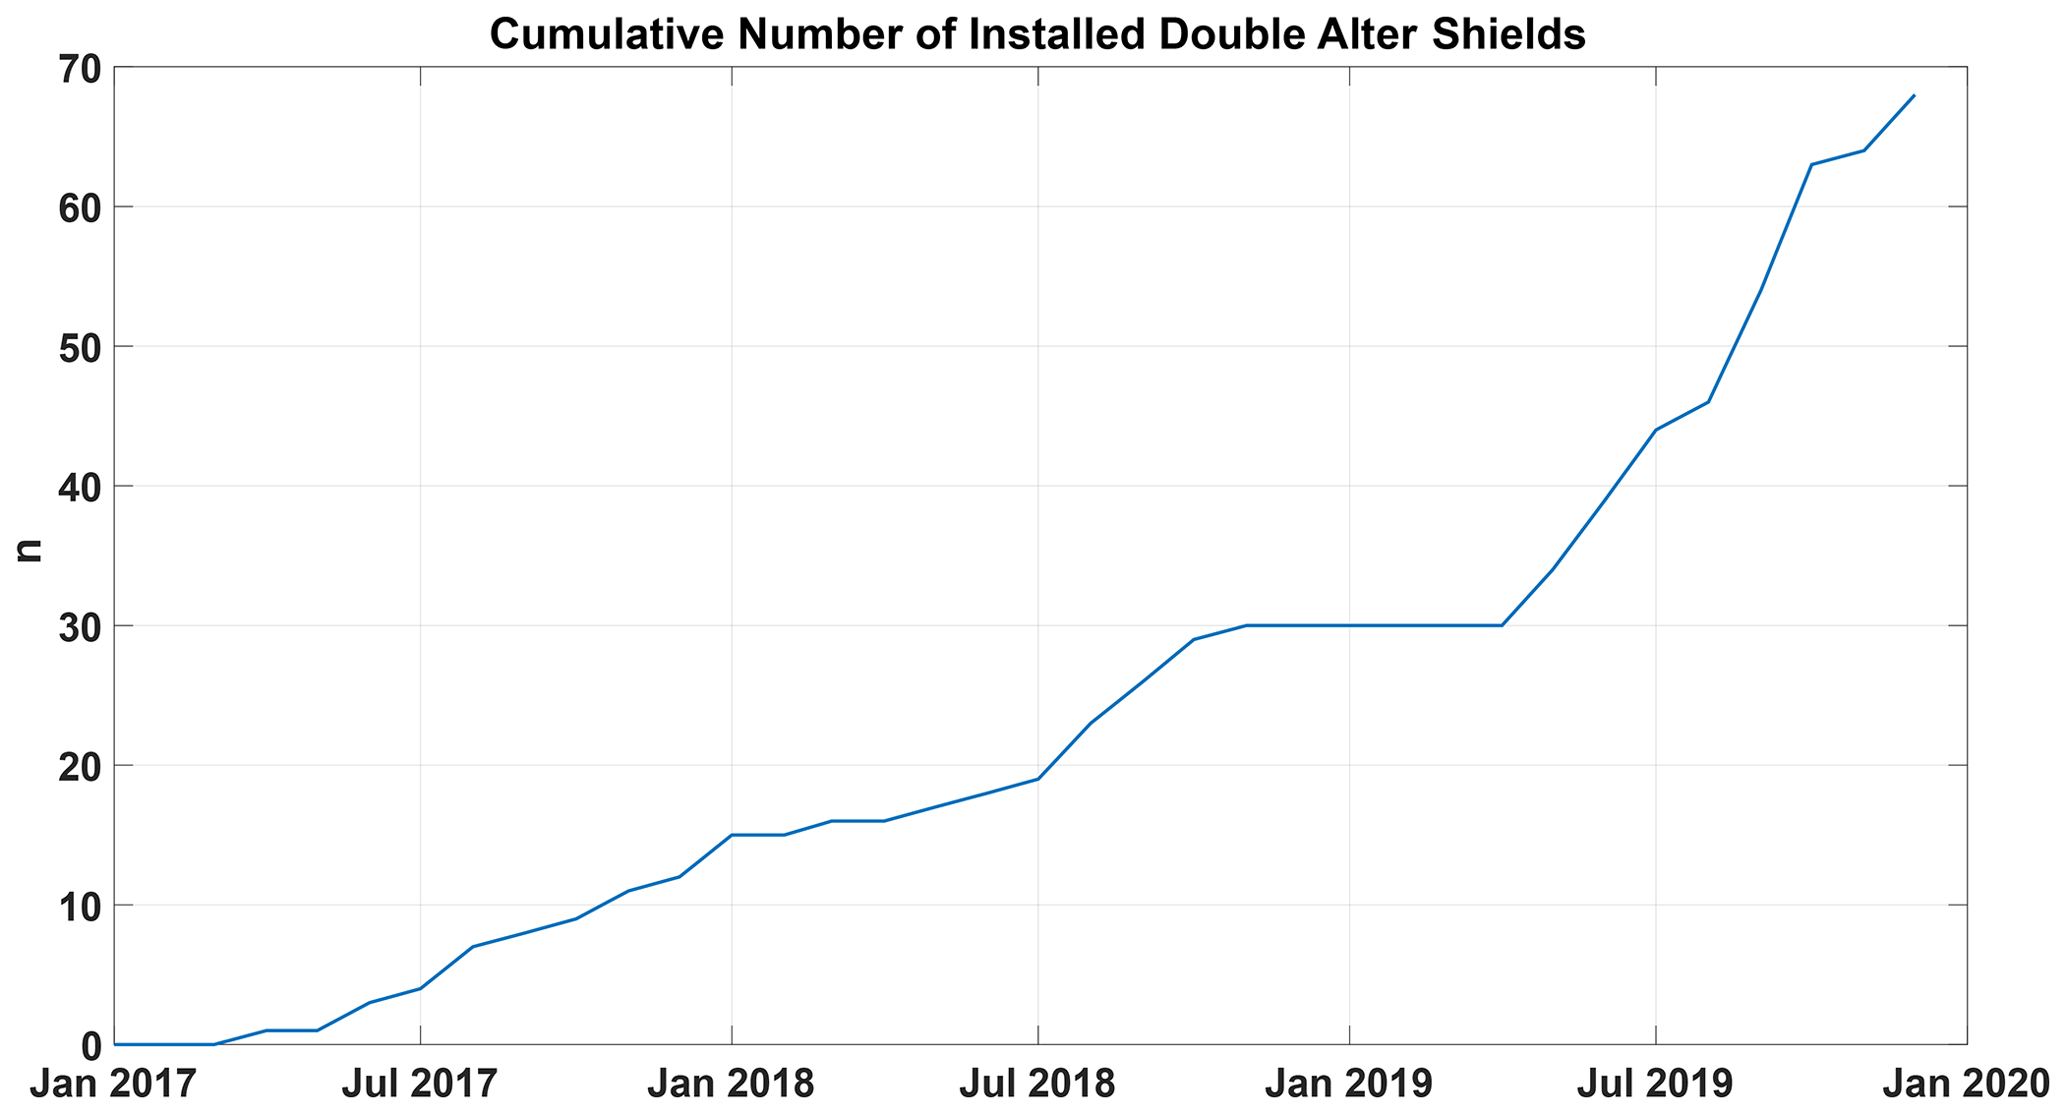
Figure 5Cumulative total number of Pluvio2L double Alter Shield gauges installed in this subset (n = 397) of stations in the ECCC operational network from January 2017 through December 2019.
Measurements made with the double Alter Shield Pluvio2L are also not adjusted in this data set. The cumulative number of affected stations, extracted from the network metadata (Jan 2021), are displayed in Fig. 5, although the metadata records for the network (dates and numbers of double Alter Shield installations) are somewhat dynamic due to an ongoing metadata database revision exercise. It is well understood that double shielding can substantially increase the catch of solid precipitation (Watson et al., 2008; Kochendorfer et al., 2018; Nitu et al., 2018) as compared to a single Alter Shield gauge configuration. The assumption was made that using the SPICE UTF (Eq. 1) with the single Alter Shield coefficients (Table 1) to adjust the data collected with a double Alter Shield gauge would result in a substantial over-adjustment. The date of the double Alter Shield installation was derived from the station metadata, and the Pluvio2L measurements were not adjusted after this date. These unadjusted data are flagged with a number 6. Although Kochendorfer et al. (2018) did present a transfer function for adjusting double Alter Shield gauges, this transfer function is developed with very limited data and assessment and is therefore not used here. As the number of double Alter Shield gauges increase in the network (post-2019), an appropriate transfer function will need to be developed and applied.
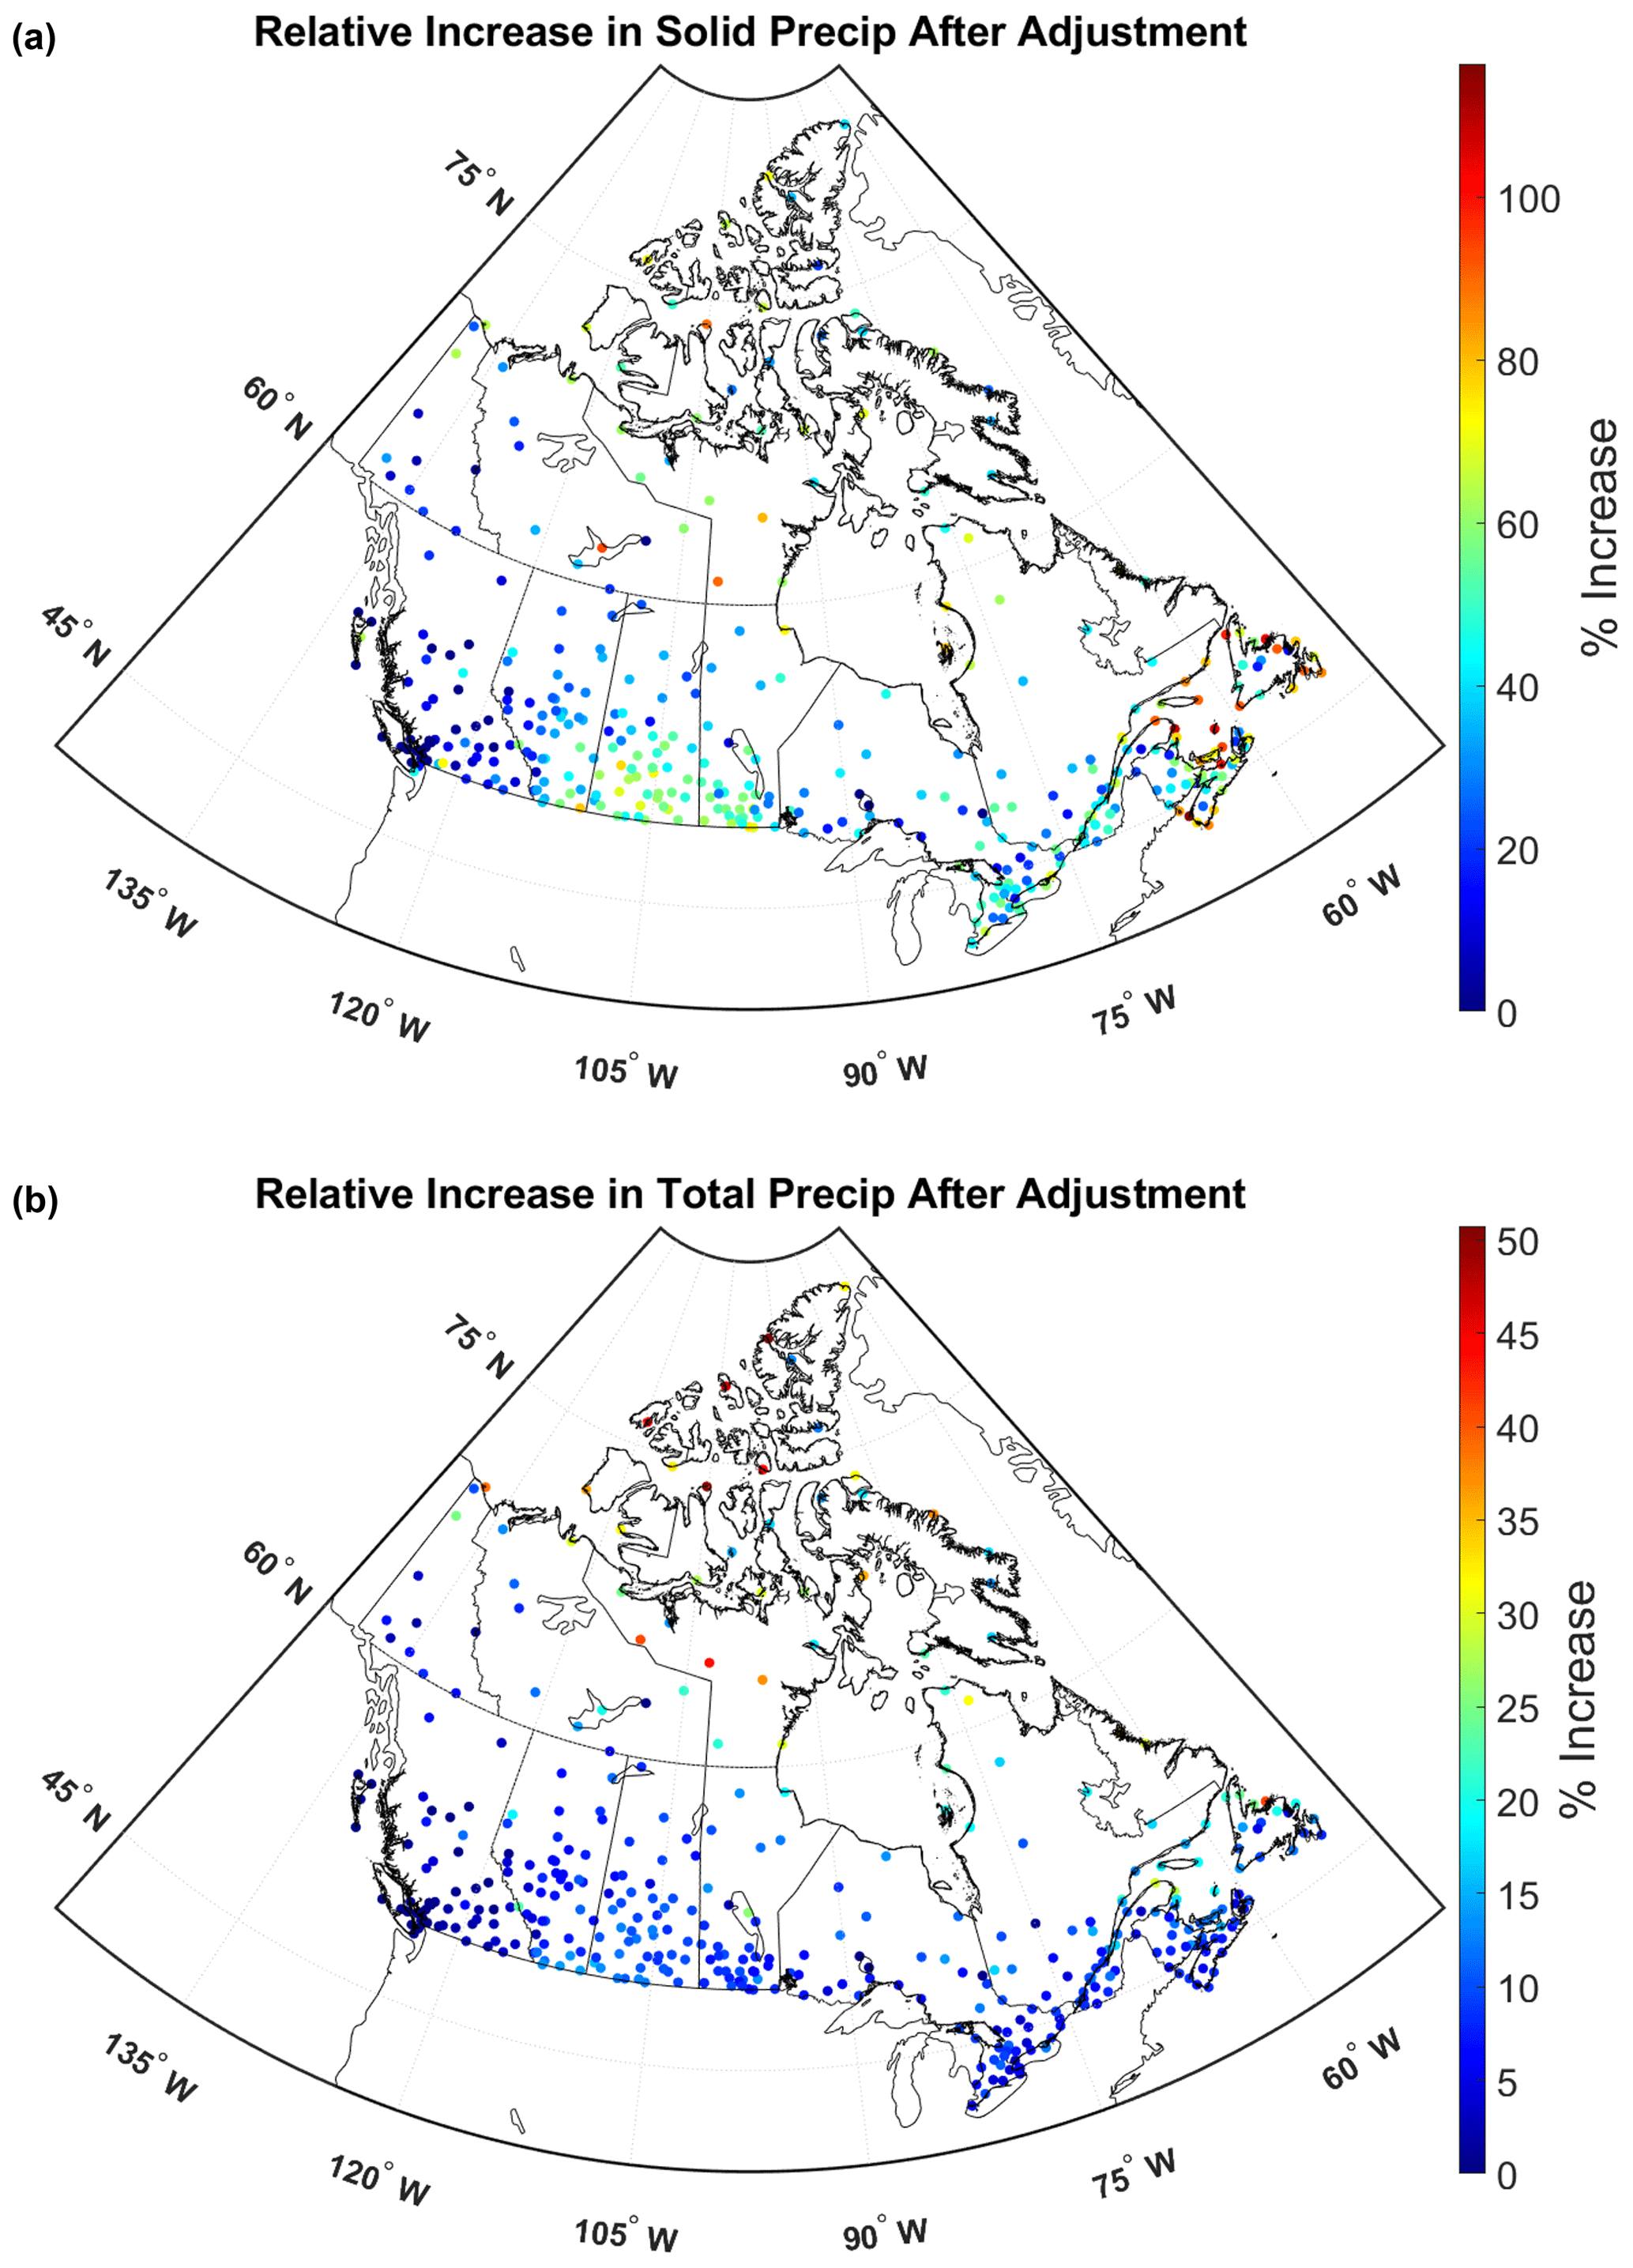
Figure 6Relative increase in station solid precipitation (a) and total precipitation (b), following the adjustment for wind bias using the WMO-SPICE UTF for the entire station record following automation.
3.2 Impacts of adjustments on regional precipitation totals
The impact of the wind bias adjustment on measured precipitation, by station, falling as solid (snow) and as total precipitation is shown in Fig. 6. The regional impact on the measurement of precipitation falling as snow (Fig. 6, top; hourly mean Tair < −2 ∘C) is apparent in the Arctic, Southern Prairies, and along the east coast of the Maritimes. These are generally stations with high exposure and high wind speeds during snowfall events. While solid precipitation after adjustment increases by nearly 75 % at some Prairie stations, the change is more than double at several Maritime stations. The impact of the adjustments on total precipitation is more muted, especially at stations where the solid to total precipitation ratio is low (west coast, south-central, and southern Maritime regions). The largest impacts are shown in the Arctic, where snowfall is a larger portion of total precipitation, with Arctic stations showing a general increase between 20 % and 40 %, while some Arctic stations show over 50 % total increase.
3.3 Uncertainty and potential bias in the adjustment
One potential source of uncertainty in the applied adjustment occurs when the data availability necessitate the use of 10 m rather than 2 m wind (gauge height) speeds. The concern is rooted in the methodology that MSC uses to determine hourly 10 m wind speed, which involves calculating the hourly mean wind speed using the last 10 min of the hour rather than the whole hour (see Sect. 2.3). To assess the sensitivity of CE to this potential error, three continuous months (starting in December 2015) of 1 min 10 m wind speed data from Bratt's Lake, SK, Canada (Smith, 2008), was used to calculate the hourly wind speed using (1) all of the 1 min data for each hour and (2) the last 10 min of 1 min data for each hour. The root mean square error (RMSE) for these two methods was 0.5 m s−1 and resulted in a potential difference in CE of less than 5 % at low wind speeds (near 0 m s−1) and at −20 ∘C (when the rate of change in the transfer function curve is the highest; see Fig. 2b). At the mean 10 m wind speed of 3.6 m s−1, the potential error decreases to a difference in CE of 3 %. Although not insubstantial, it is difficult to put this uncertainty into context with the other uncertainties involved in measuring and adjusting precipitation, especially considering that this potential error will vary with the site-dependent variability in wind speed with time. The potential error, however, is minimized through the use of the 2 m wind speed (which is more representative of the whole hour) when available, and the adjustment is flagged accordingly.
Another consideration when using this adjusted precipitation data set is the potential uncertainty and bias remaining in the observations following the adjustment. Kochendorfer et al. (2018) pointed out that the uncertainty in post-adjusted precipitation data using WMO-SPICE transfer functions increased with the relative magnitude of the adjustment, showing that the RMSE for a single Alter Shield adjusted measurement nearly tripled (from ∼ 0.2 to ∼ 0.6 mm) as gauge height wind speed increased towards the threshold (Ut) of 7.2 m s−1. This is a justification for increased shielding around precipitation gauges, such as the double Alter Shield that is being installed throughout the ECCC network during modernization efforts. More substantial shielding increases the CE of solid precipitation for a given wind speed, thereby decreasing the magnitude of the required adjustments and the associated uncertainty.
Smith et al. (2020) showed that the post-adjusted RMSE (for solid precipitation) at Canadian test sites varied from 0.10 mm (low precipitation and exposed continental site) to 0.18 mm (higher precipitation and sheltered boreal site), which is very similar to the RMSE of the unadjusted observations (i.e. the adjustment did not increase the observation uncertainty).
Regarding the bias adjustment, it is obvious that a transfer function adjustment increases precipitation (especially solid precipitation) towards a true amount as represented by reference measurements. Smith et al. (2020) suggest that, at cold and windy sites with low annual total and frequent light precipitation events, such as those in the Canadian Arctic and southern Prairies, the UTF tends to under-adjust solid precipitation by up to 30 %. This would suggest that the adjusted winter precipitation in these regions remains biased low due to wind undercatch. On the other hand, the same analysis shows that at wetter, less windy Canadian sites (based on test sites in southern boreal and wet continental climates), the UTF tends to over-adjust solid precipitation, such that the adjusted amounts could be up to 110 % of the reference amount.
3.4 Next steps
The application of the UTF on this set of 397 stations is the first step to achieving the overall objective of developing and applying climate-dependent transfer functions on all stations across Canada. WMO-SPICE intercomparison data have been used to fit site-/climate-specific transfer functions at eight SPICE sites (Køltzow et al., 2020; John Kochendorfer, personal communication, 2020); work is in progress to develop more transfer functions further representing climates in Canada. However, no procedure currently exists to determine how to assign a climate specific transfer function to stations in such a climate-diverse country as Canada. In order to sort and classify individual stations for adjustment, their climate characteristics must first be identified. These may be quantified with this adjusted precipitation data set and its accompanying wind and temperature observations using two scenarios, i.e. (1) metrics calculated using the full station period and (2) metrics calculated using data during precipitation occurrences. Also, options will be explored to match climate-specific transfer functions to operational stations with qualitative climate characteristics from existing spatial climate classifications. Qualitative classification techniques may include, but are not limited to, the Köppen climate classification, the geographic information system (GIS)-based climatological districts already used by ECCC, climate zones as defined in the Climate Trends and Variation Bulletin, and ecozones defined by the Canadian Council on Ecological Areas (CCEA).
It is anticipated that this adjusted precipitation data set will be updated periodically (the current data end at the end of 2019) with new observations but also with the refinement of the transfer functions and the adjustment process. For this reason, this data set has been versioned as v2019UTF.
This hourly wind-bias-adjusted data set provides a wide range of opportunities in both climate and meteorological research areas.
Climate change detection needs long, reliable, and homogeneous data sets. The AHCCD adjusted daily rainfall and snowfall data set (using the manual network) is available for 464 stations (Mekis and Vincent, 2011) up to 2016, and the Adjusted Daily Rainfall and Snowfall (AdjDlyRS) data set (Wang et al., 2017), which includes all 3346 segments from the manual archive, is available up to 2020. Built on the foundation of combining both manual and automated station observations, further development is underway to produce a more recent monthly adjusted and homogenized precipitation data set for 426 core stations. The hourly wind-bias-adjusted data set will be linked into this data set for the overlapping locations.
The above-mentioned AdjDlyRS 3346 adjusted daily stations were used to produce the ANUSPLIN gridded adjusted precipitation data set on daily, pentad, and monthly timescales (MacDonald et al., 2021). In the future, our new wind-bias-adjusted automated observations will be used as an independent source for verification of the ANUSPLIN gridded precipitation data set.
Accurate and high-resolution analysis of precipitation accumulation is also of primary importance for hydrological applications. In the last decade, the Canadian Precipitation Analysis (CaPA; Lespinas et al., 2015; Asong et al., 2017; Fortin et al., 2018) system has been developed and implemented at MSC. It uses the optimal contributions of short-range forecasts from ECCC's Global Environmental Multiscale (GEM) numerical weather prediction (NWP) model and observations from surface stations and ground-based radars. There is, however, uncertainty with the input data used for solid precipitation and with precipitation estimates in areas with few ground-based observations. The goal is to improve CaPA system performance by including adjusted solid precipitation, radar, and satellite information to the system. The UTF hourly adjusted data set will be used for verification purposes in the above ongoing joint collaboration between Manitoba Hydro, University of Quebec, Meteorological Research Division and Climate Research Division.
Version v2019UTF of this data set, including documentation, is available via the Government of Canada Open Data Portal. To access the data, follow the DOI (https://doi.org/10.18164/6b90d130-4e73-422a-9374-07a2437d7e52; ECCC, 2021) to the metadata entry in the ECCC Data Catalogue. From the metadata page in the catalogue, the ECCC Data Mart links are shown by selecting the “Downloads, views, and links” option displayed below the data abstract. Following these links to the Data Mart will reveal the list of archived data and data description files available for download. The use of this data is subject to the Open Government License – Canada (https://open.canada.ca/en/open-government-licence-canada, last access: November 2022).
The hourly wind-bias-adjusted precipitation data set from the ECCC automated surface observation network contains hourly wind-adjusted precipitation data, as measured at 397 ECCC automated weather stations between 2001 and 2019. Based on WMO recommendations (Nitu et al., 2018), the hourly precipitation observations were adjusted using the WMO-SPICE universal transfer function (UTF). Although we recognize that the SPICE UTF has performance issues that vary with site and climate (Smith et al., 2020), the high proportion of precipitation in Canada that falls as snow necessitates a measurement adjustment for undercatch due to wind. The adjusted precipitation data, including data documentation are available through the Government of Canada Open Data Portal (https://doi.org/10.18164/6b90d130-4e73-422a-9374-07a2437d7e52), currently versioned as v2019UTF (ECCC, 2021). This data set will be periodically updated with new data to include (1) post-2019 adjusted precipitation, (2) additional stations in the ECCC automated network, and (3) additional adjusted segments using newly developed (double Alter Shield and climate-specific) transfer functions.
CDS is the lead and corresponding author of this work and provided the wind bias adjustment. EM contributed to the paper and provided expertise on the ECCC observation network and data quality control. MH provided quality control of the raw precipitation and met data and contributed to the paper. AR provided coding and data processing support and reviewed the paper.
The contact author has declared that none of the authors has any competing interests.
Publisher's note: Copernicus Publications remains neutral with regard to jurisdictional claims in published maps and institutional affiliations.
The authors would like to express their appreciation to John Kochendorfer and the anonymous referee, for reviewing and providing feedback for the improvement of this work. We would also like to thank Xiaolan Wang (Climate Research Division, ECCC), for providing the list of selected stations and the quality control protocols.
This paper was edited by David Carlson and reviewed by John Kochendorfer and one anonymous referee.
Asong, Z. E., Razavi, S., Wheater, H. S., and Wong, J. S.: Evaluation of Integrated Multisatellite Retrievals for GPM (IMERG) over southern Canada against ground precipitation observations: A preliminary assessment, J. Hydrometeorol., 18, 1033–1050, 2017.
Barnett, T. P., Adam, J. C., and Lettenmaier, D. P.: Potential impacts of a warming climate on water availability in snow dominated regions, Nature, 438, 303–309, 2005.
Buisán, S. T., Smith, C. D., Ross, A., Kochendorfer, J., Collado, J. L., Alastrue, J., Wolff, M., Roulet, Y., Earle, M. E., Laine, T., Rasmussen, R., and Nitu, R.: The potential for uncertainty in Numerical Weather Prediction model verification when using solid precipitation observations, Atmos. Sci. Lett., 2, e976, https://doi.org/10.1002/asl.976, 2020.
Devine, K. A. and Mekis, É.: Field accuracy of Canadian rain measurements, Atmosphere-Ocean, 46, 213–227, https://doi.org/10.3137/ao.460202, 2008.
Environment and Climate Change Canada: Hourly wind-bias-adjusted precipitation data from the ECCC automated surface observation network, Government of Canada Open Data portal [data set], https://doi.org/10.18164/6b90d130-4e73-422a-9374-07a2437d7e52, 2021.
Fortin, V., Roy, G., Stadnyk, T., Koenig, K., Gasset, N., and Mahidjiba, A.: Ten years of science based on the Canadian precipitation analysis: A CaPA system overview and literature review, Atmosphere-Ocean, 56, 178–196, 2018.
Goodison, B., Louie, P., and Yang, D.: The WMO solid precipitation measurement intercomparison, World Meteorological Organization-Publications-WMO/TD No. 872, 212 pp., https://library.wmo.int/doc_num.php?explnum_id=9694 last access: November 2022), 1998.
Goodison, B. E.: Accuracy of Canadian Snow Gage Measurements, J. Appl. Meteorol. Clim., 17, 1542–1548, 1978.
Kochendorfer, J., Rasmussen, R., Wolff, M., Baker, B., Hall, M. E., Meyers, T., Landolt, S., Jachcik, A., Isaksen, K., Brækkan, R., and Leeper, R.: The quantification and correction of wind-induced precipitation measurement errors, Hydrol. Earth Syst. Sci., 21, 1973–1989, https://doi.org/10.5194/hess-21-1973-2017, 2017a.
Kochendorfer, J., Nitu, R., Wolff, M., Mekis, E., Rasmussen, R., Baker, B., Earle, M. E., Reverdin, A., Wong, K., Smith, C. D., Yang, D., Roulet, Y.-A., Buisan, S., Laine, T., Lee, G., Aceituno, J. L. C., Alastrué, J., Isaksen, K., Meyers, T., Brækkan, R., Landolt, S., Jachcik, A., and Poikonen, A.: Analysis of single-Alter-shielded and unshielded measurements of mixed and solid precipitation from WMO-SPICE, Hydrol. Earth Syst. Sci., 21, 3525–3542, https://doi.org/10.5194/hess-21-3525-2017, 2017b.
Kochendorfer, J., Nitu, R., Wolff, M., Mekis, E., Rasmussen, R., Baker, B., Earle, M. E., Reverdin, A., Wong, K., Smith, C. D., Yang, D., Roulet, Y.-A., Meyers, T., Buisan, S., Isaksen, K., Brækkan, R., Landolt, S., and Jachcik, A.: Testing and development of transfer functions for weighing precipitation gauges in WMO-SPICE, Hydrol. Earth Syst. Sci., 22, 1437-1452, https://doi.org/10.5194/hess-22-1437-2018, 2018.
Køltzow, M., Casati, B., Haiden, T., and Valkonen, T.: Verification of Solid Precipitation Forecasts from Numerical Weather Prediction Models in Norway, Weather Forecast., 35, 2279–2292, https://doi.org/10.1175/WAF-D-20-0060.1, 2020.
Lespinas, F., Fortin, V., Roy, G., Rasmussen, P., and Stadnyk, T.: Performance evaluation of the Canadian precipitation analysis (CaPA), J. Hydrometeorol., 16, 2045–2064, 2015.
MacDonald, H., McKenney, D. W., Wang, X. L., Pedlar, J., Papadopol, P., Lawrence, K., Feng, Y., and Hutchinson, M. F.: Spatial Models of Adjusted Precipitation for Canada at Varying Time Scales, J. Appl. Meteorol. Clim., 60, 291–304, 2021.
Mekis, É. and Brown, R.: Derivation of an adjustment factor map for the estimation of the water equivalent of snowfall from ruler measurements in Canada, Atmosphere-Ocean, 48, 284–293, https://doi.org/10.3137/AO1104.2010, 2010.
Mekis, É. and Vincent, L. A.: An Overview of the Second Generation Adjusted Daily Precipitation Dataset for Trend Analysis in Canada, Atmosphere-Ocean, 49, 163–177, https://doi.org/10.1080/07055900.2011.583910, 2011.
Mekis, É., Donaldson, N., Reid, J., Zucconi, A., Hoover, J., Li, Q., Nitu, R., and Melo, S.: An Overview of Surface-Based Precipitation Observations at Environment and Climate Change Canada, Atmosphere-Ocean, 56, 71–95, https://doi.org/10.1080/07055900.2018.1433627, 2018.
Milewska, E. J., Vincent, L. A., Hartwell, M. M., Charlesworth, K., and Mekis, E: Adjusting precipitation amounts from Geonor and Pluvio automated weighing gauges to preserve continuity of observations in Canada, Can. Water Resour. J., 44, 127–145, https://doi.org/10.1080/07011784.2018.1530611, 2019.
Nitu, R., Roulet, Y.-A., Wolff, M., Earle, M., Reverdin, A., Smith, C., Kochendorfer, J., Morin, S., Rasmussen, R., Wong, K., Alastrué, J., Arnold, L., Baker, B., Buisán, S., Collado, J. L., Colli, M., Collins, B., Gaydos, A., Hannula, H.-R., Hoover, J., Joe, P., Kontu, A., Laine, T., Lanza, L., Lanzinger, E., Lee, G. W., Lejeune, Y., Leppänen, L., Mekis, E., Panel, J.-M., Poikonen, A., Ryu, S., Sabatini, F., Theriault, J., Yang, D., Genthon, C., van den Heuvel, F., Hirasawa, N., Konishi, H., Nishimura, K., and Senese, A.: WMO Solid Precipitation Intercomparison Experiment (SPICE) (2012–2015), Instruments and Observing Methods Report No. 131, World Meteorological Organization, Geneva, https://library.wmo.int/doc_num.php?explnum_id=5686, last access: November 2022), 2018.
Pomeroy, J. W., Gray, D. M., Brown, T., Hedstrom, N. R., Quinton, W. L., Granger, R. J., and Carey, S. K.: The cold regions hydrological model: a platform for basing process representation and model structure on physical evidence, Hydrol. Process., 2667, 2650–2667, 2007.
Rasmussen, R. M., Baker, B., Kochendorfer, J., Meyers, T., Landolt, S., Fischer, A. P., Black, J., Theriault, J. M., Kucera, P., Gochis, D., Smith, C., Nitu, R., Hall, M., Ikeda, K., and Gutmann, E.: How Well Are We Measuring Snow: The NOAA/FAA/NCAR Winter Precipitation Test Bed, B. Am. Meteorol. Soc., 93, 811–829, 2012.
Sevruk, B., Hertig, J.-A., and Spiess, R.: The effect of precipitation gauge orifice rim on the wind field deformation as investigated in a wind tunnel, Atmos. Environ., 25A, 1173–1179, 1991.
Smith, C. D.: Correcting the wind bias in snowfall measurements made with a Geonor T-200B precipitation gauge and Alter wind shield, CMOS Bulletin SCMO, 36, 162–167, 2008.
Smith, C. D., Ross, A., Kochendorfer, J., Earle, M. E., Wolff, M., Buisán, S., Roulet, Y.-A., and Laine, T.: Evaluation of the WMO Solid Precipitation Intercomparison Experiment (SPICE) transfer functions for adjusting the wind bias in solid precipitation measurements, Hydrol. Earth Syst. Sci., 24, 4025–4043, https://doi.org/10.5194/hess-24-4025-2020, 2020.
Vincent, L. A. and Mekis, E.: Changes in Daily and Extreme Temperature and Precipitation Indices for Canada over the Twentieth Century, Atmosphere-Ocean, 44, 177–193, https://doi.org/10.3137/ao.440205, 2006.
Vincent, L. A., Zhang, X., Mekis, É., Wan, H., and Bush, E. J.: Changes in Canada's climate: Trends in indices based on daily temperature and precipitation data, Atmosphere-Ocean, 56, 332–349, https://doi.org/10.1080/07055900.2018.1514579, 2018.
Vincent, L. A., Hartwell, M. M., and Wang, X. L.: A third generation of homogenized temperature for trend analysis and monitoring changes in Canada's climate, Atmosphere-Ocean, 58, 173–191, https://doi.org/10.1080/07055900.2020.1765728, 2020.
Wang, X. L., Xu, H., Qian, B., Feng, Y., and Mekis, E.: Adjusted daily rainfall and snowfall data for Canada, Atmosphere-Ocean, 55, 155–168, 2017.
Watson, S., Smith, C., Lassi, M., and Misfeldt, J.: An evaluation of the effectiveness of the double-Alter wind shield for increasing the catch efficiency of the Geonor T-200B precipitation gauge, Can. Meteorol. Oceanogr. Soc. Bull., 36, 168–175, 2008.
Wolff, M. A., Isaksen, K., Petersen-Øverleir, A., Ødemark, K., Reitan, T., and Brækkan, R.: Derivation of a new continuous adjustment function for correcting wind-induced loss of solid precipitation: results of a Norwegian field study, Hydrol. Earth Syst. Sci., 19, 951–967, https://doi.org/10.5194/hess-19-951-2015, 2015.
Yang, D. Q., Goodison, B. E., Metcalfe, J. R., Louie, P., Leavesley, G., Emerson, D., Hanson, C. L., Golubev, V. S., Elomaa, E., Gunther, T., Pangburn, T., Kang, E., and Milkovic, J.: Quantification of precipitation measurement discontinuity induced by wind shields on national gauges, Water Resour. Res., 35, 491–508, 1999.