the Creative Commons Attribution 4.0 License.
the Creative Commons Attribution 4.0 License.
 | 22 Nov 2022
Rates and timing of chlorophyll-a increases and related environmental variables in global temperate and cold-temperate lakes
Jane Ye
Bhaleka D. Persaud
Stephanie Slowinski
Homa Kheyrollah Pour
Philippe Van Cappellen
Lakes are key ecosystems within the global biogeosphere. However, the environmental controls on the biological productivity of lakes – including surface temperature, ice phenology, nutrient loads, and mixing regime – are increasingly altered by climate warming and land-use changes. To better characterize global trends in lake productivity, we assembled a dataset on chlorophyll-a concentrations as well as associated water quality parameters and surface solar radiation for temperate and cold-temperate lakes experiencing seasonal ice cover. We developed a method to identify periods of rapid net increase of in situ chlorophyll-a concentrations from time series data and applied it to data collected between 1964 and 2019 across 343 lakes located north of 40∘. The data show that the spring chlorophyll-a increase periods have been occurring earlier in the year, potentially extending the growing season and increasing the annual productivity of northern lakes. The dataset on chlorophyll-a increase rates and timing can be used to analyze trends and patterns in lake productivity across the northern hemisphere or at smaller, regional scales. We illustrate some trends extracted from the dataset and encourage other researchers to use the open dataset for their own research questions. The PCI dataset and additional data files can be openly accessed at the Federated Research Data Repository at https://doi.org/10.20383/102.0488 (Adams et al., 2021).
- Article
(4390 KB) - Full-text XML
-
Supplement
(1165 KB) - BibTeX
- EndNote


Lakes play an important role in the biogeochemical cycling of many elements (Battin et al., 2008; Cole et al., 2007; O'Connell et al., 2020; Rousseaux and Gregg, 2013; Schindler, 1971). With over 100 million documented lakes on earth (Verpoorter et al., 2014), evidence indicates that the majority of global lakes are shallow, with enough light and nutrients available to make them highly productive ecosystems (Downing et al., 2006; Wetzel, 2001). Lakes therefore represent active sites for the storage, transport, and transformation of carbon, nutrients (e.g., nitrogen, phosphorus, silicon, iron), and contaminants (e.g., mercury) along the freshwater continuum (Lauerwald et al., 2019; Tranvik et al., 2009). They are also sensitive to the effects of climate change (Williamson et al., 2009; Rouse et al., 1997).
There are multiple environmental controls on lake primary productivity, including water temperature, ice phenology, nutrient concentrations, circulation, mixing regime, and solar radiation (Lewis, 2011; Zohary et al., 2009). Stressors such as climate change and nutrient pollution can significantly impact these controls, altering the ecosystem structure and biogeochemical functioning of lakes (Jeppesen et al., 2020; Markelov et al., 2019). Changes affecting northern lakes include warmer water temperatures, enhanced stratification and hypoxia, nutrient enrichment, light attenuation by chromophoric organic matter, and increases in the relative abundance of toxic cyanobacteria in the phytoplankton community (Deng et al., 2018; Huisman and Hulot, 2005; Jeppesen et al., 2003; Creed et al., 2018). For example, Lake Superior has seen an increase in primary production – together with increasing surface water temperatures and longer seasonal stratification and ice-free periods – during the last century (O'Beirne et al., 2017). Other lakes are similarly experiencing increases in productivity. According to Lewis (2011), the current mean primary production of lakes is 260 g C m−2 yr−1, which is 162 % higher than earlier estimations under historical baseline conditions.
Globally, phytoplankton (i.e., algae) are the main primary producers in lakes and generally make up the foundation of lentic food webs (Carpenter et al., 2016). Periods of high lake productivity coincide with a rapid increase in phytoplankton biomass. In extreme cases, algal blooms can reach hundreds to thousands of cells per millilitre (Henderson-Seller and Markland, 1987). These bloom events produce large quantities of decomposing organic matter that cause the expansion of hypoxic conditions within the lake (Watson et al., 2016). In harmful algal blooms, certain algal species also release hepatotoxic and neurotoxic compounds (Codd et al., 2005). Thus, identifying trends in the timing and intensity of seasonal algal growth and linking them to changes in environmental stressors can help to predict the future of lake productivity and to assess the risk of undesirable algal blooms.
Because it is challenging to measure algal abundance and growth directly, chlorophyll-a is often used as a proxy for algae biomass and as an indicator of the associated primary production in lakes (Huot et al., 2007). Although other proxies have been developed (Lyngsgaard et al., 2017), chlorophyll-a is the most common metric to characterize trends in algal biomass within and across lakes, especially in historical water quality records. Tett (1987) proposes a chlorophyll-a threshold of 100 µg L−1 to define “exceptional blooms”; Jonsson et al. (2009) use a threshold of 5 µg L−1to identify a bloom; Binding et al. (2021) flag an algal bloom when the chlorophyll-a concentrations extracted from satellite observations exceed 10 µg L−1. Such threshold values, however, do not take into account the baseline (i.e., no-bloom) chlorophyll-a concentration specific to a given lake or the lake's trophic status (Germán et al., 2017). Furthermore, focusing on harmful and nuisance algal blooms alone may mask the impact that a changing climate or other stressors may have on a lake's overall biological productivity.
Intra-annual fluctuations in lake chlorophyll-a concentrations result from the interactions of multiple variables and processes, including grazing by zooplankton, competition between algal species with different growth strategies and chlorophyll-a contents, and changes in temperature, light, and nutrient availability (Lyngsgaard et al., 2017; Sommer et al., 1986). In dimictic lakes, for example, there are usually two peaks in algal biomass and hence also in chlorophyll-a concentrations in the spring and fall, with a smaller biomass stock of slower growing species during the summer and an even smaller stock of algae (in terms of both biovolume and chlorophyll-a) under the ice cover in the winter (Hampton et al., 2017).
The spring increase in algal biomass generally consists of fast-growing algal species that take advantage of the increases in temperature and light following ice-off as well as the available inorganic nutrients that were generated by mineralization under the ice over the winter. The shift from spring to summer algal communities often coincides with high zooplankton grazing rates exceeding the spring algal growth rates, hence bringing down the total algal biomass. The high zooplankton grazing rates favour the growth during the summer of algal species that are less edible by grazers but which tend to grow at slower rates. Lake overturn in the fall initiates the transition from the predominance of the slow-growing species in the summer to the fast-growing phytoplankton species in the fall, causing a second peak in algal biomass (Sommer et al., 1986).
A common approach for comparing chlorophyll-a trends across multiple lakes is to consider the maximum or mean annual chlorophyll-a concentrations. For example, Ho et al. (2019) applied the Mann–Kendall trend test to analyze time series of annual maximum chlorophyll-a concentrations, while Shuvo et al. (2021) used a random forest regression approach to assess the relative importance of climatic versus non-climatic controls on mean chlorophyll-a concentrations. Both these studies analyzed chlorophyll concentrations derived from satellite observations rather than measured in situ. In addition, these approaches did not specifically identify the periods of the year when chlorophyll-a concentrations experienced rapid changes.
Alternatively, the rate of increase in chlorophyll-a concentration can be used to constrain the timing of rapid increases in algal biomass usually associated with periods of high primary productivity. In this study, we refer to these as “periods of chlorophyll-a increase” (PCIs). The weeks leading up to a PCI are crucial to create the necessary conditions that enable algal growth (Lewis et al., 2018). Thus, to analyze trends in lake net primary productivity, one should consider environmental variables, such as surface water temperature, solar radiation, and nutrient concentrations, both during and preceding the annual PCIs.
Although the rate of chlorophyll-a concentration increase has been used to detect algal blooms within individual water bodies, e.g., in the San Roque reservoir (Germán et al., 2017), it has rarely been used across large temporal (i.e., more than a few years) and spatial (i.e., regional and up) scales. Here, we present a method for calculating net rates of chlorophyll-a increase (RCI). The timing of PCIs and values of the corresponding RCIs were derived from in situ chlorophyll-a concentrations obtained for 343 lakes located at latitudes above 40∘ N. The entire dataset covers the period of 1964–2019 and further contains data on coincident environmental control variables, including surface solar radiation. To illustrate the potential applications of the resulting dataset, we present some temporal trends of the chlorophyll-a rates and their relationships with environmental variables. The dataset is made available as an open resource that other researchers are encouraged to use in their own work.
All data processing, visualizations, and analyses were carried out with Python (ver. 3.7.6; Python Software Foundation, 2021) using the pandas library (Reback et al., 2020), NumPy library (Harris et al., 2020), and Dplython library (Riederer, 2015), while QGIS/PYQGIS was used for all spatial data analyses (ver. 3.16; QGIS.org, 2021).
2.1 Data acquisition, compilation, and quality control
2.1.1 Lake data selection
In situ chlorophyll-a concentrations and other lake physico-chemical data were extracted from open source international, national, and regional databases (see Table A1 for a summary of all databases used). The data include surface water temperature, Secchi depth, and pH as well as the concentrations of particulate organic carbon (POC), total phosphorus (TP), soluble reactive phosphorus (SRP), total Kjeldahl nitrogen (TKN), and dissolved organic carbon (DOC).
To enable readers to compare the methods used by different lake monitoring agencies and researchers to collect and process in situ samples, we provide the links to the raw data sources and metadata files in the appendix (Tables A1–A3). When selecting data, we remained as consistent as possible by implementing the following steps (more details can be found in the “initial formatting” folder found in the associated GitHub repository, https://github.com/hfadams/pci/tree/main/code/initial_formatting, last access: 7 August 2022).
We only included measurements taken at ≤3 m water depth. When the sampling depth was not provided, we assumed the sample was taken from within the top 0.5–3 m of the lake, given that this is the usual standard sampling protocol (Dorset Environmental Science Centre, 2010; United States Environmental Protection Agency, 2012).
We selected lakes from mid to high latitudes (≥40∘ N). Lakes at these latitudes typically experience seasonal ice cover and thermal stratification during the summer in contrast to low-latitude lakes that are typically meromictic or polymictic (Woolway and Merchant, 2019).
We omitted all variable values below the corresponding analytical detection limit. Data from different sources were individually reformatted to yield consistent (standard) units and headings. Where needed, reported values were averaged to yield daily mean values before being combined into a single CSV file. When multiple chlorophyll-a data types were available (as, for example, in the Laurentian Great Lakes data series), we selected the uncorrected data, because most reported lake chlorophyll-a concentrations have not been corrected for phaeophytin pigments. If no coordinates were provided, we assigned those of the lake centroid in QGIS. Fifteen lakes had unknown locations and were removed from the final dataset. We further restricted ourselves to lakes that, in most years, were sampled at least six times per year, which was considered the minimum sampling frequency to reliably detect the yearly PCIs. Lake names were standardized by expanding on abbreviations and removing unnecessary capitalization and special characters.
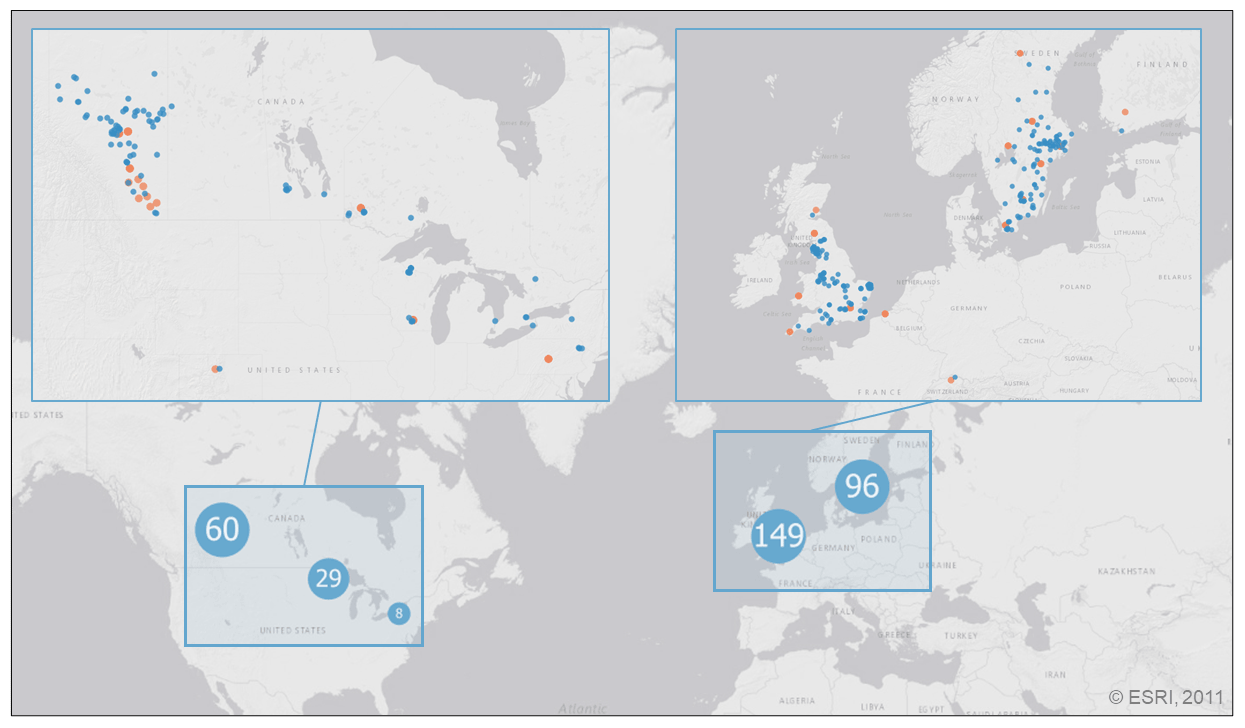
Figure 1Distribution of the 343 lake sampling locations in the PCI dataset. Lake sampling points are clustered by proximity, where marker size and value indicate the number of unique locations represented by each point (light blue markers with white text). Enlarged sections show each lake sampling location (blue markers) along with the location of the 320 paired SSR stations (orange markers). Base map credit: ESRI, 2011.
With the above selection criteria, the final dataset contained 52116 potential PCIs for 343 lakes at ≥40∘ N and covering the period 1964–2019. The location of the lake sampling locations in the PCI dataset are shown in Fig. 1.
2.1.2 Surface solar radiation data
Open source in situ surface solar radiation (SSR) data for the period 1950–2020 were collected from stations paired with the selected lakes (see Table A2 for data sources). Each lake was paired with the closest SSR station using the nearest neighbour function in QGIS, allowing for a maximum radius of 3 degrees (Schwarz et al., 2018; Fig. 1). In the dataset provided here, the geodesic distance between each lake and its paired SSR station as well as the differences in elevation are given.
The SSR data temporal resolutions varied from minutes to months. Hence, where needed, the SSR data were resampled to yield monthly mean values. For the Experimental Lakes Area (ELA) in Ontario, Canada, the data were converted from photosynthetically active radiation (PAR) to SSR, where the PAR wavelength range (400–700 nm) was averaged to 550 nm.
2.1.3 Lake characteristics
For each lake, we calculated the trophic status index (TSI) based on the mean chlorophyll-a concentration over the sampling period. This TSI value was used to assign the lake to the corresponding trophic state category according to Carlson and Simpson (1996). The HydroLAKES shapefile yielded the lake's surface area, mean depth, and volume (ver. 1.0; Messager et al., 2016). Lake elevation was extracted from a digital elevation model (DEM) (Danielson and Gesch, 2010), and each lake was assigned its corresponding climate zone using HydroATLAS data (ver. 1.0; Linke et al., 2019). The metadata for these variables are published as part of the data publication (Adams et al., 2021), and a summary table of associated lake data is provided in the appendix (Table A4).
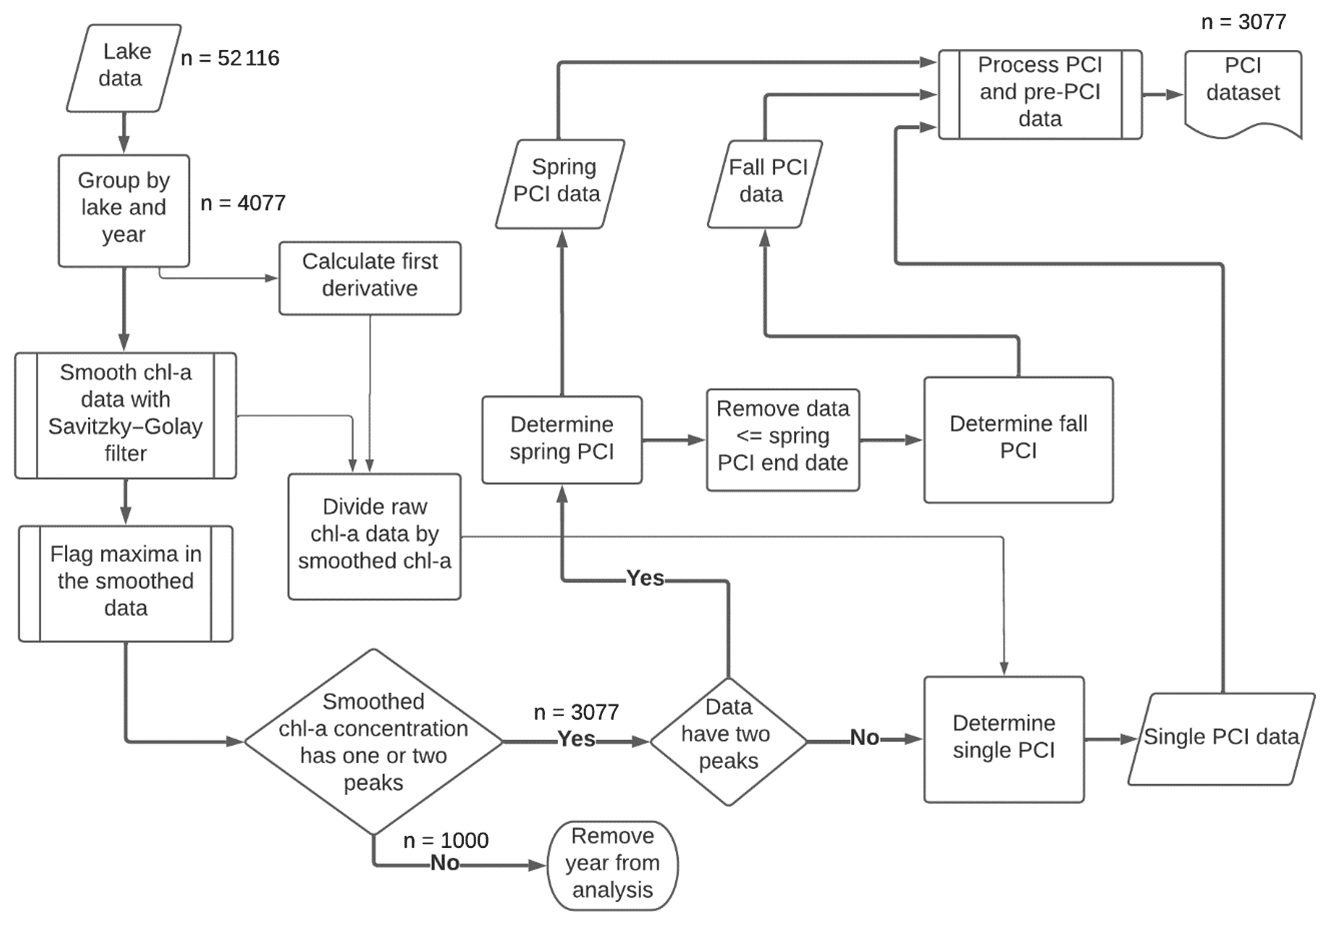
Figure 2Workflow for detecting PCIs and processing data. For each lake sampling point, chlorophyll-a (Chl-a) data are smoothed with a Savitzky–Golay filter, and then PCIs are detected based on peaks in the chlorophyll-a concentration. PCIs are flagged as spring, fall, or single PCIs. The data density is shown at key points along the workflow.
2.2 Detecting seasonal periods of chlorophyll-a increase
Periods of chlorophyll-a increase (PCIs) were identified based on the normalized net rate of change in chlorophyll-a concentration (NRCC) at each lake sampling point throughout the year. To locate the start and end of a PCI, we smoothed the annual chlorophyll-a time series using a Savitzky–Golay filter (SciPy.signal savgol_filter) and flagged optima in the smoothed data (SciPy.signal find_peaks) using functions from the open source SciPy ecosystem (Virtanen et al., 2020). The procedure is illustrated in Fig. 2.
The NRCC at any given time during the year was calculated by computing the first derivative of the smoothed chlorophyll-a concentration versus time and then dividing the derivative value by the corresponding chlorophyll-a concentration. For each lake and each year, the start of the first PCI was defined as the day the NRCC surpassed 0.4 d−1. This threshold rate was selected following a series of sensitivity tests (details provided in the supplementary information). A threshold NRCC value was considered more preferable than a threshold RCI value, because it accounts for variations among lakes and among years in the baseline chlorophyll-a concentrations during the non-growing season.
The PCI ended on the day the peak in chlorophyll-a concentration was reached – that is, just before the NRCC turned negative. If a threshold NRCC of 0.4 d−1 was not reached during a given year, the PCI began when the NRCC first became positive. The second (fall) PCI was identified in the same way, following the end of the first (spring) PCI. If the annual chlorophyll-a concentration only yielded one peak value in the smoothed data series, only one PCI was identified for that year, which was then labelled as a “single PCI” year. Years with more than two chlorophyll-a peaks or with no peaks were not included in the PCI dataset.
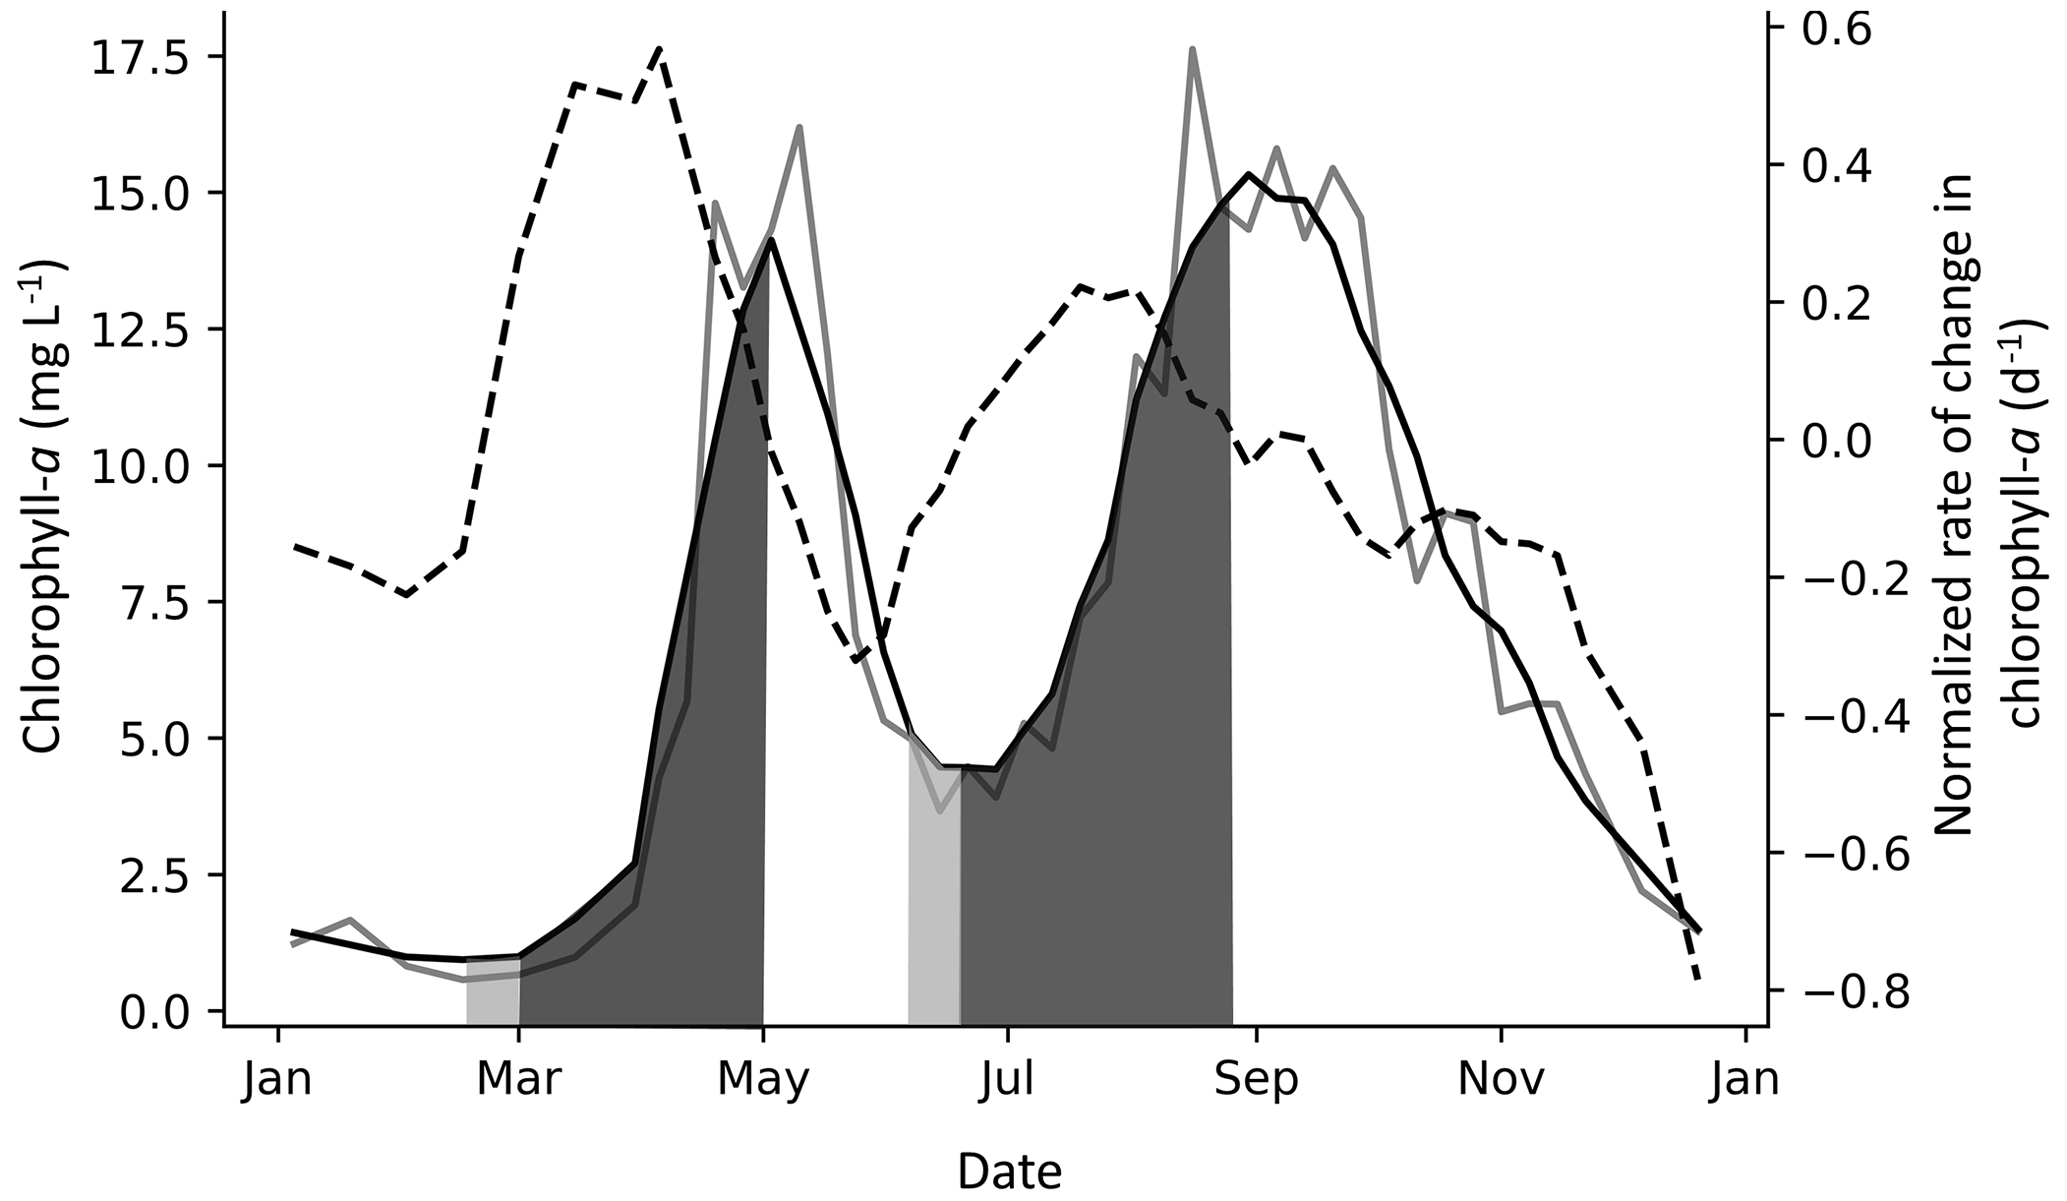
Figure 3Example of spring and fall PCIs in Lake Windermere's north basin in 1988. The solid grey line is the chlorophyll-a concentration (µg L −1), and the solid black line is the chlorophyll-a concentration smoothed with a Savitzky–Golay filter. The dashed line is the normalized rate of change in chlorophyll-a (NRCC) (d−1), where the first derivative is divided by the smoothed chlorophyll-a concentration and is plotted using the right axis. The PCI begins when the NRCC surpasses a threshold of 0.4 d−1, as shown in the first (spring) PCI, and ends when the NRCC turns negative, which is when the peak chlorophyll-a concentration is reached. When a peak is detected but the NRCC does not surpass a threshold of 0.4 d−1, the PCI begins when the NRCC surpasses 0 d−1, as shown in the second (fall) PCI. The PCI and pre-PCI (two weeks leading up to the PCI) are shown in dark and light grey shading, respectively.
Depending on data availability, the pre-PCI period was defined as the one- or two-week period immediately preceding the PCI start day. For each pre-PCI, the mean surface water temperature, SSR, and TP concentration were compiled. These served as simple indicators of how favourable in-lake conditions were to initiate algal growth (Lyngsgaard et al., 2017). An example of a year with a spring and fall PCI is shown in Fig. 3. Note that we use the label “fall” to indicate the second yearly PCI, although in some cases, the fall PCI was initiated before the fall equinox.
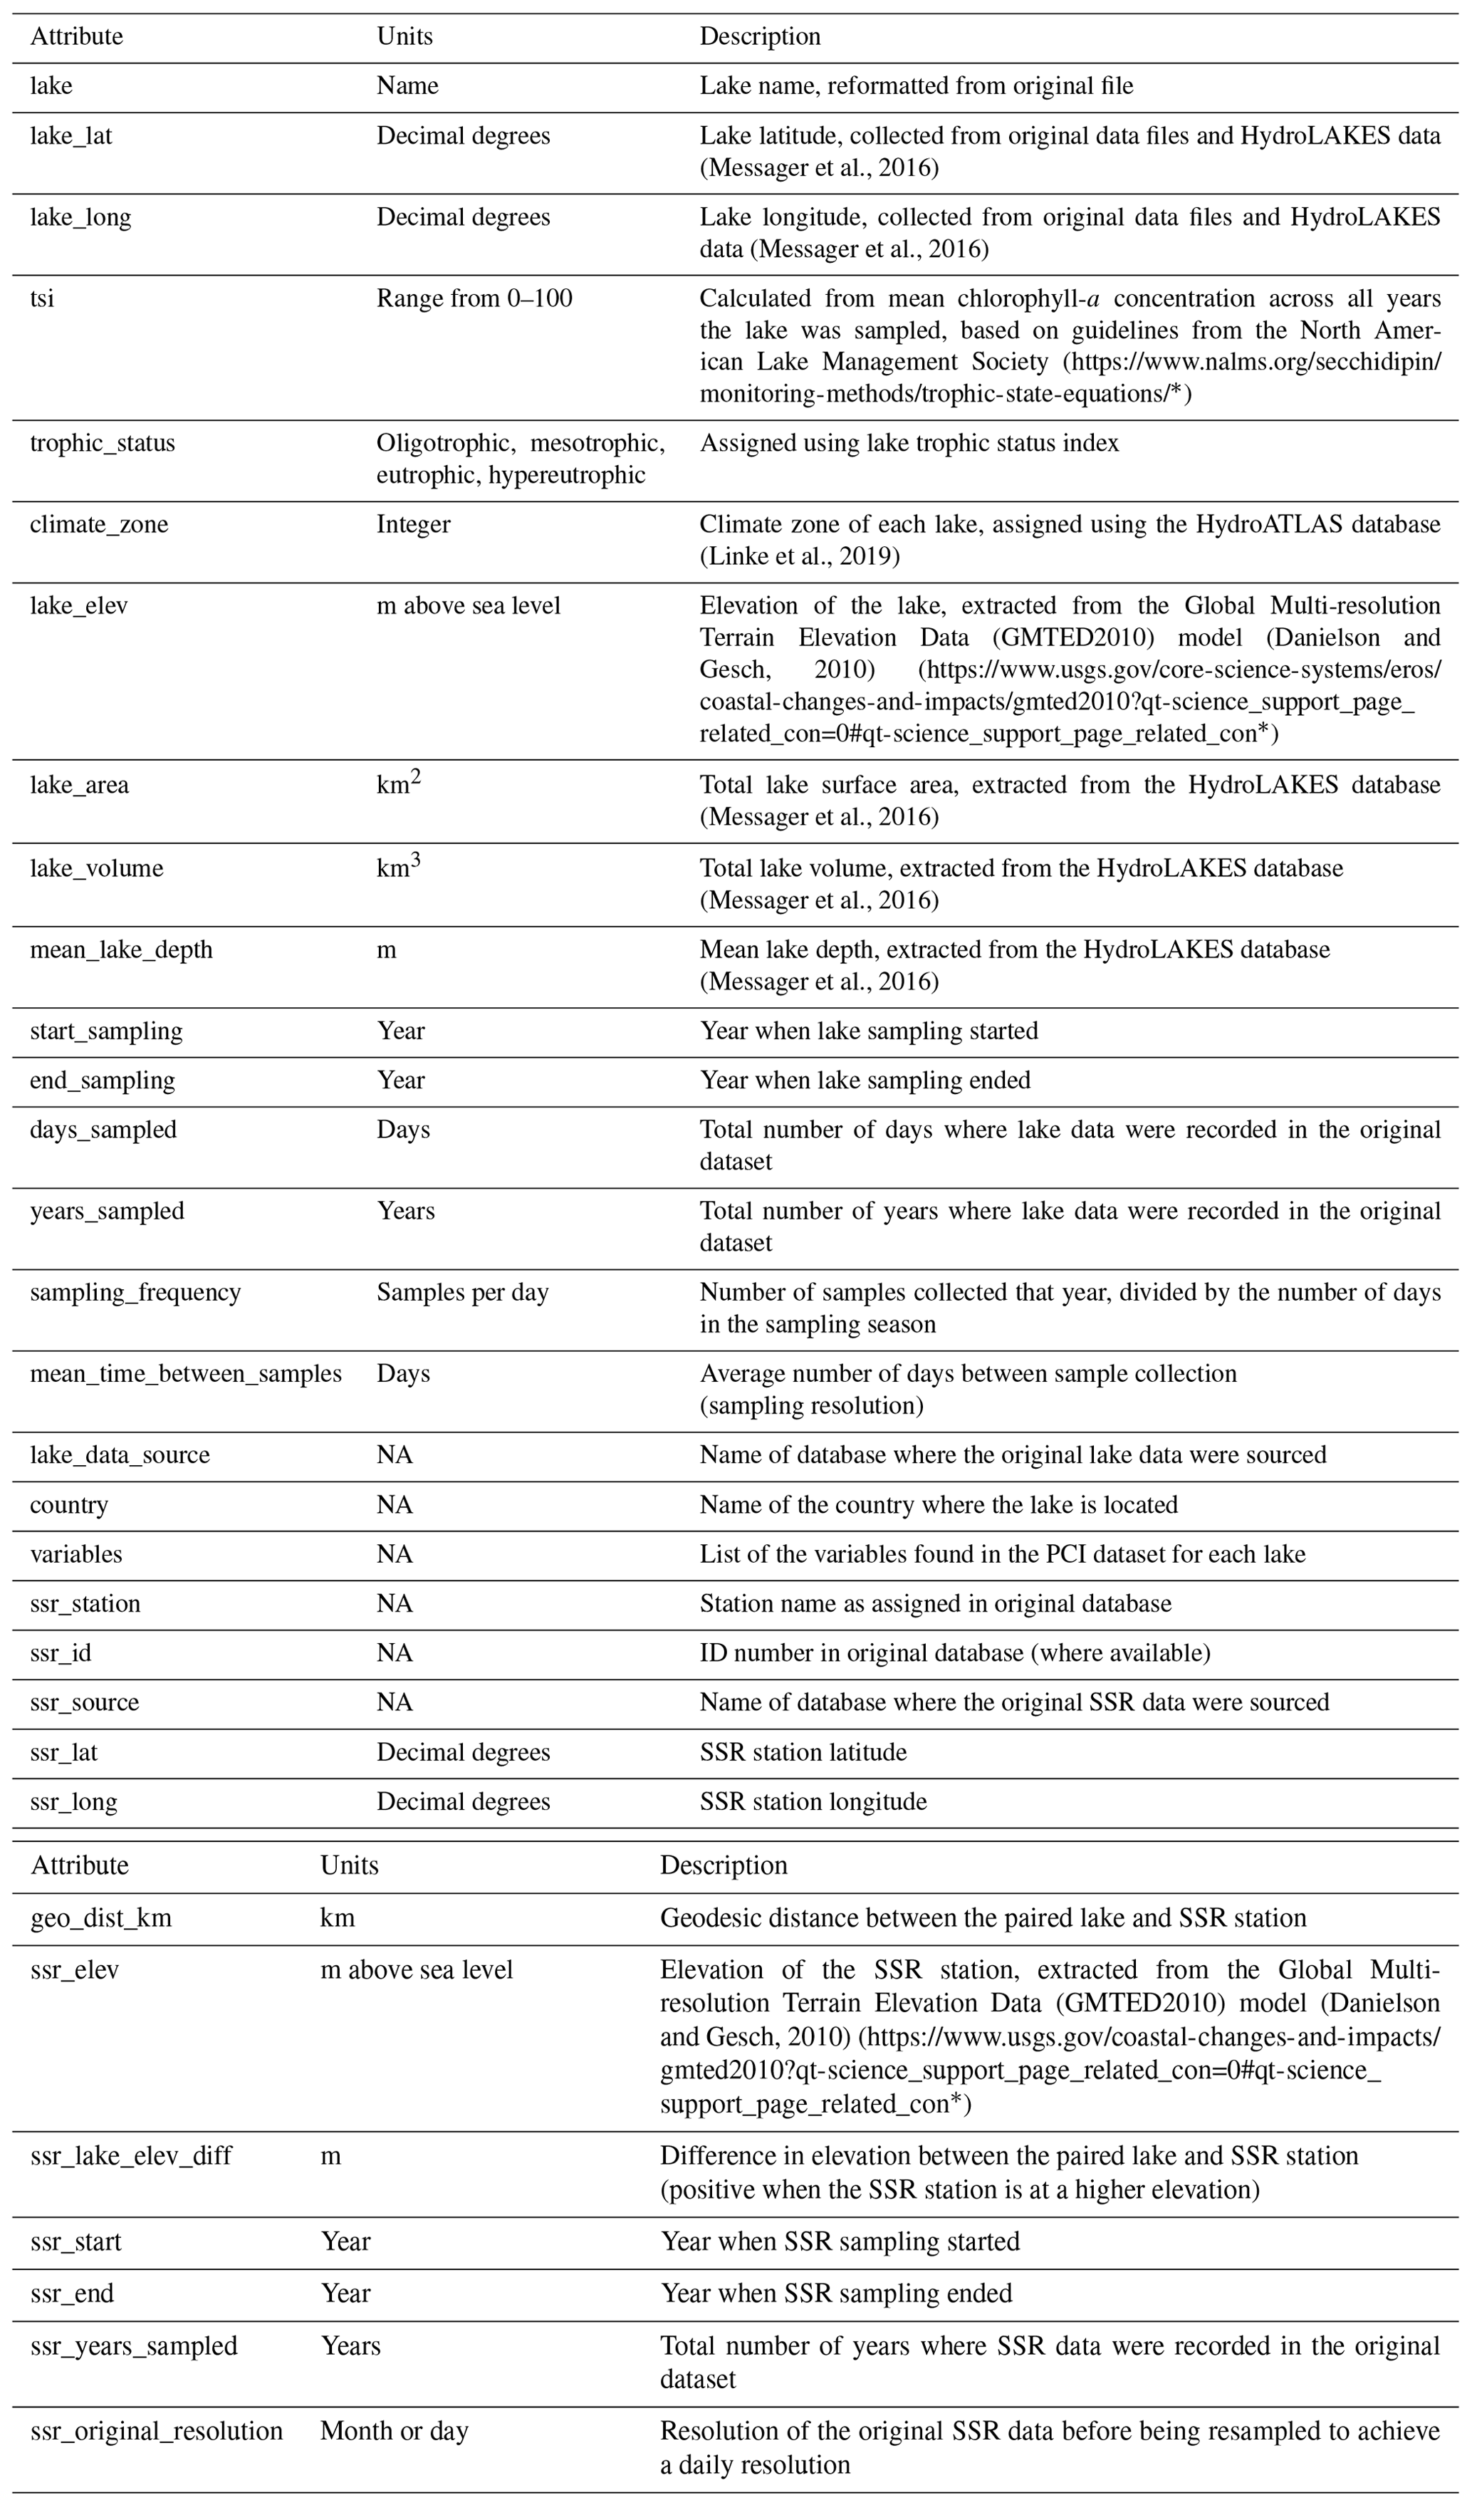
Table 1Summary of variables in the PCI dataset. Associated lake data (e.g., lake depth, surface area, volume, climate zone) are available in the Appendix (Table A4).
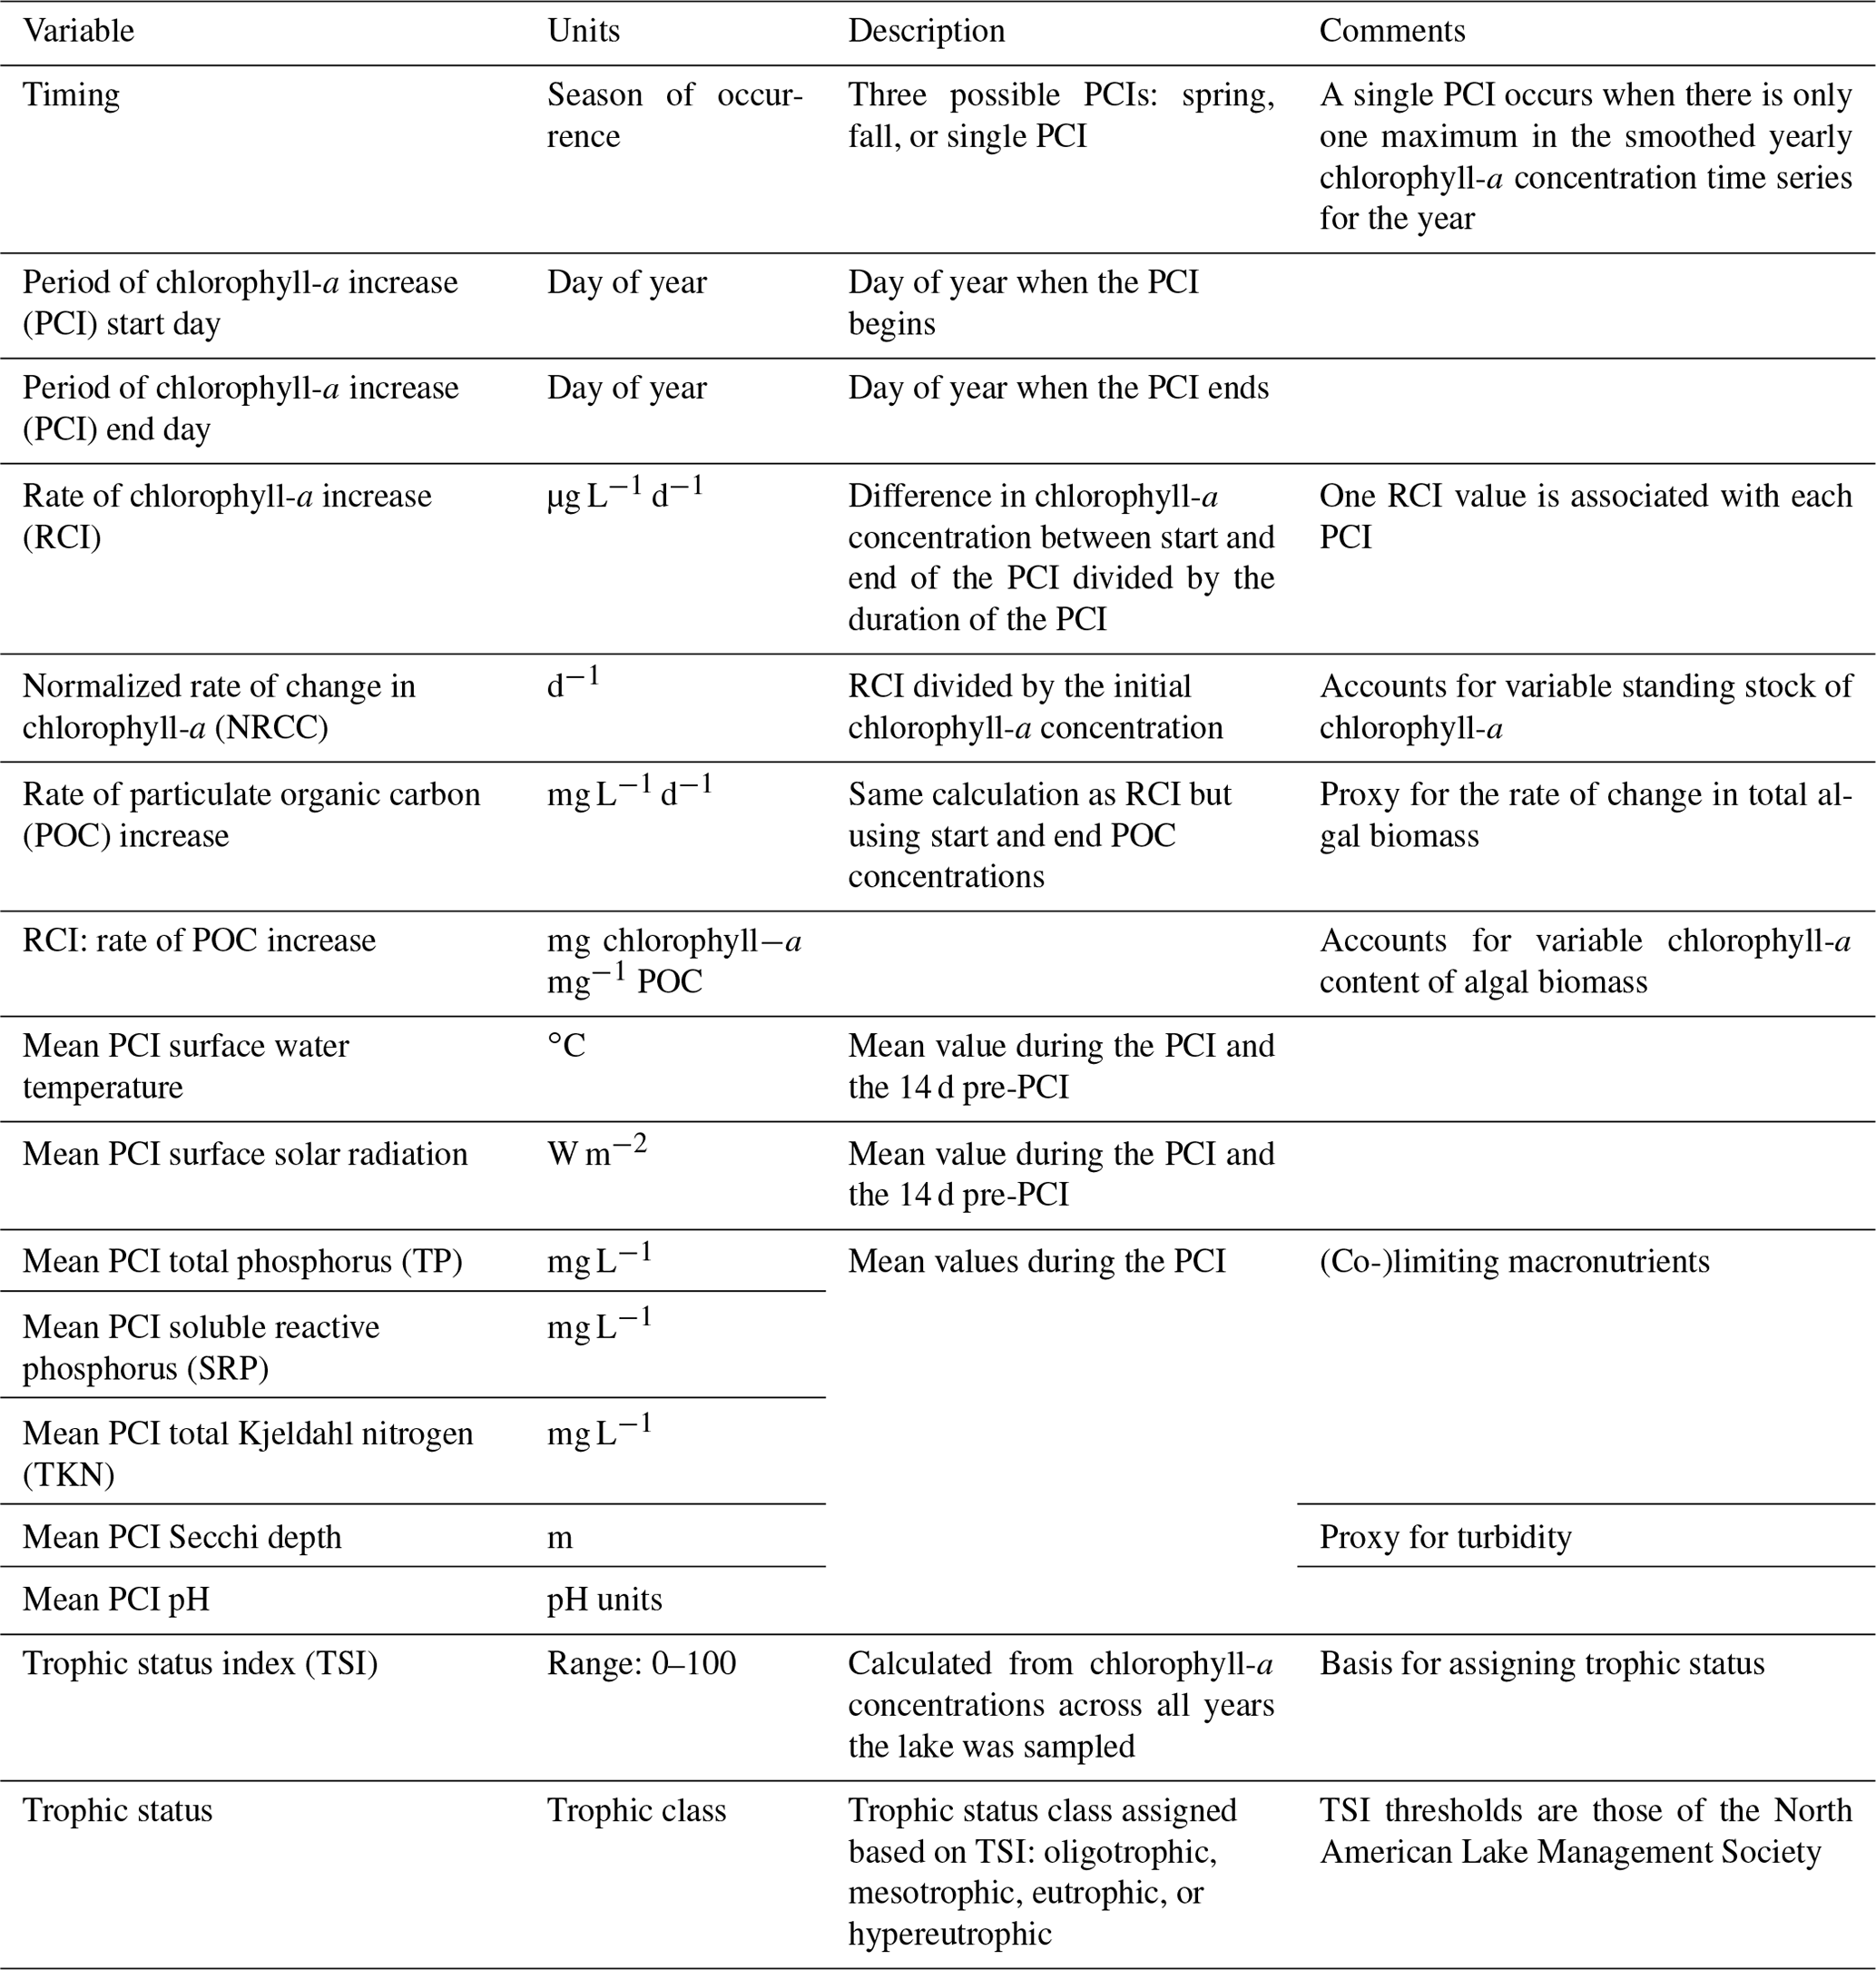
Once the PCI and pre-PCI durations were determined, the mean values of the variables listed in Table 1 were calculated. This was done for each lake and for each year data were available. In the dataset, each row represents a single PCI and includes the timing and duration, RCI value, and the mean values for all other relevant lake variables, including SSR, averaged for the PCI and pre-PCI. Note that, along with the variables in Table 1, we included the total number of samples collected each year and the mean time between samples. Thus, if desired, the user can filter the dataset for a higher sampling frequency than done here. The supplementary information of the dataset also identifies the organization responsible for monitoring each lake.
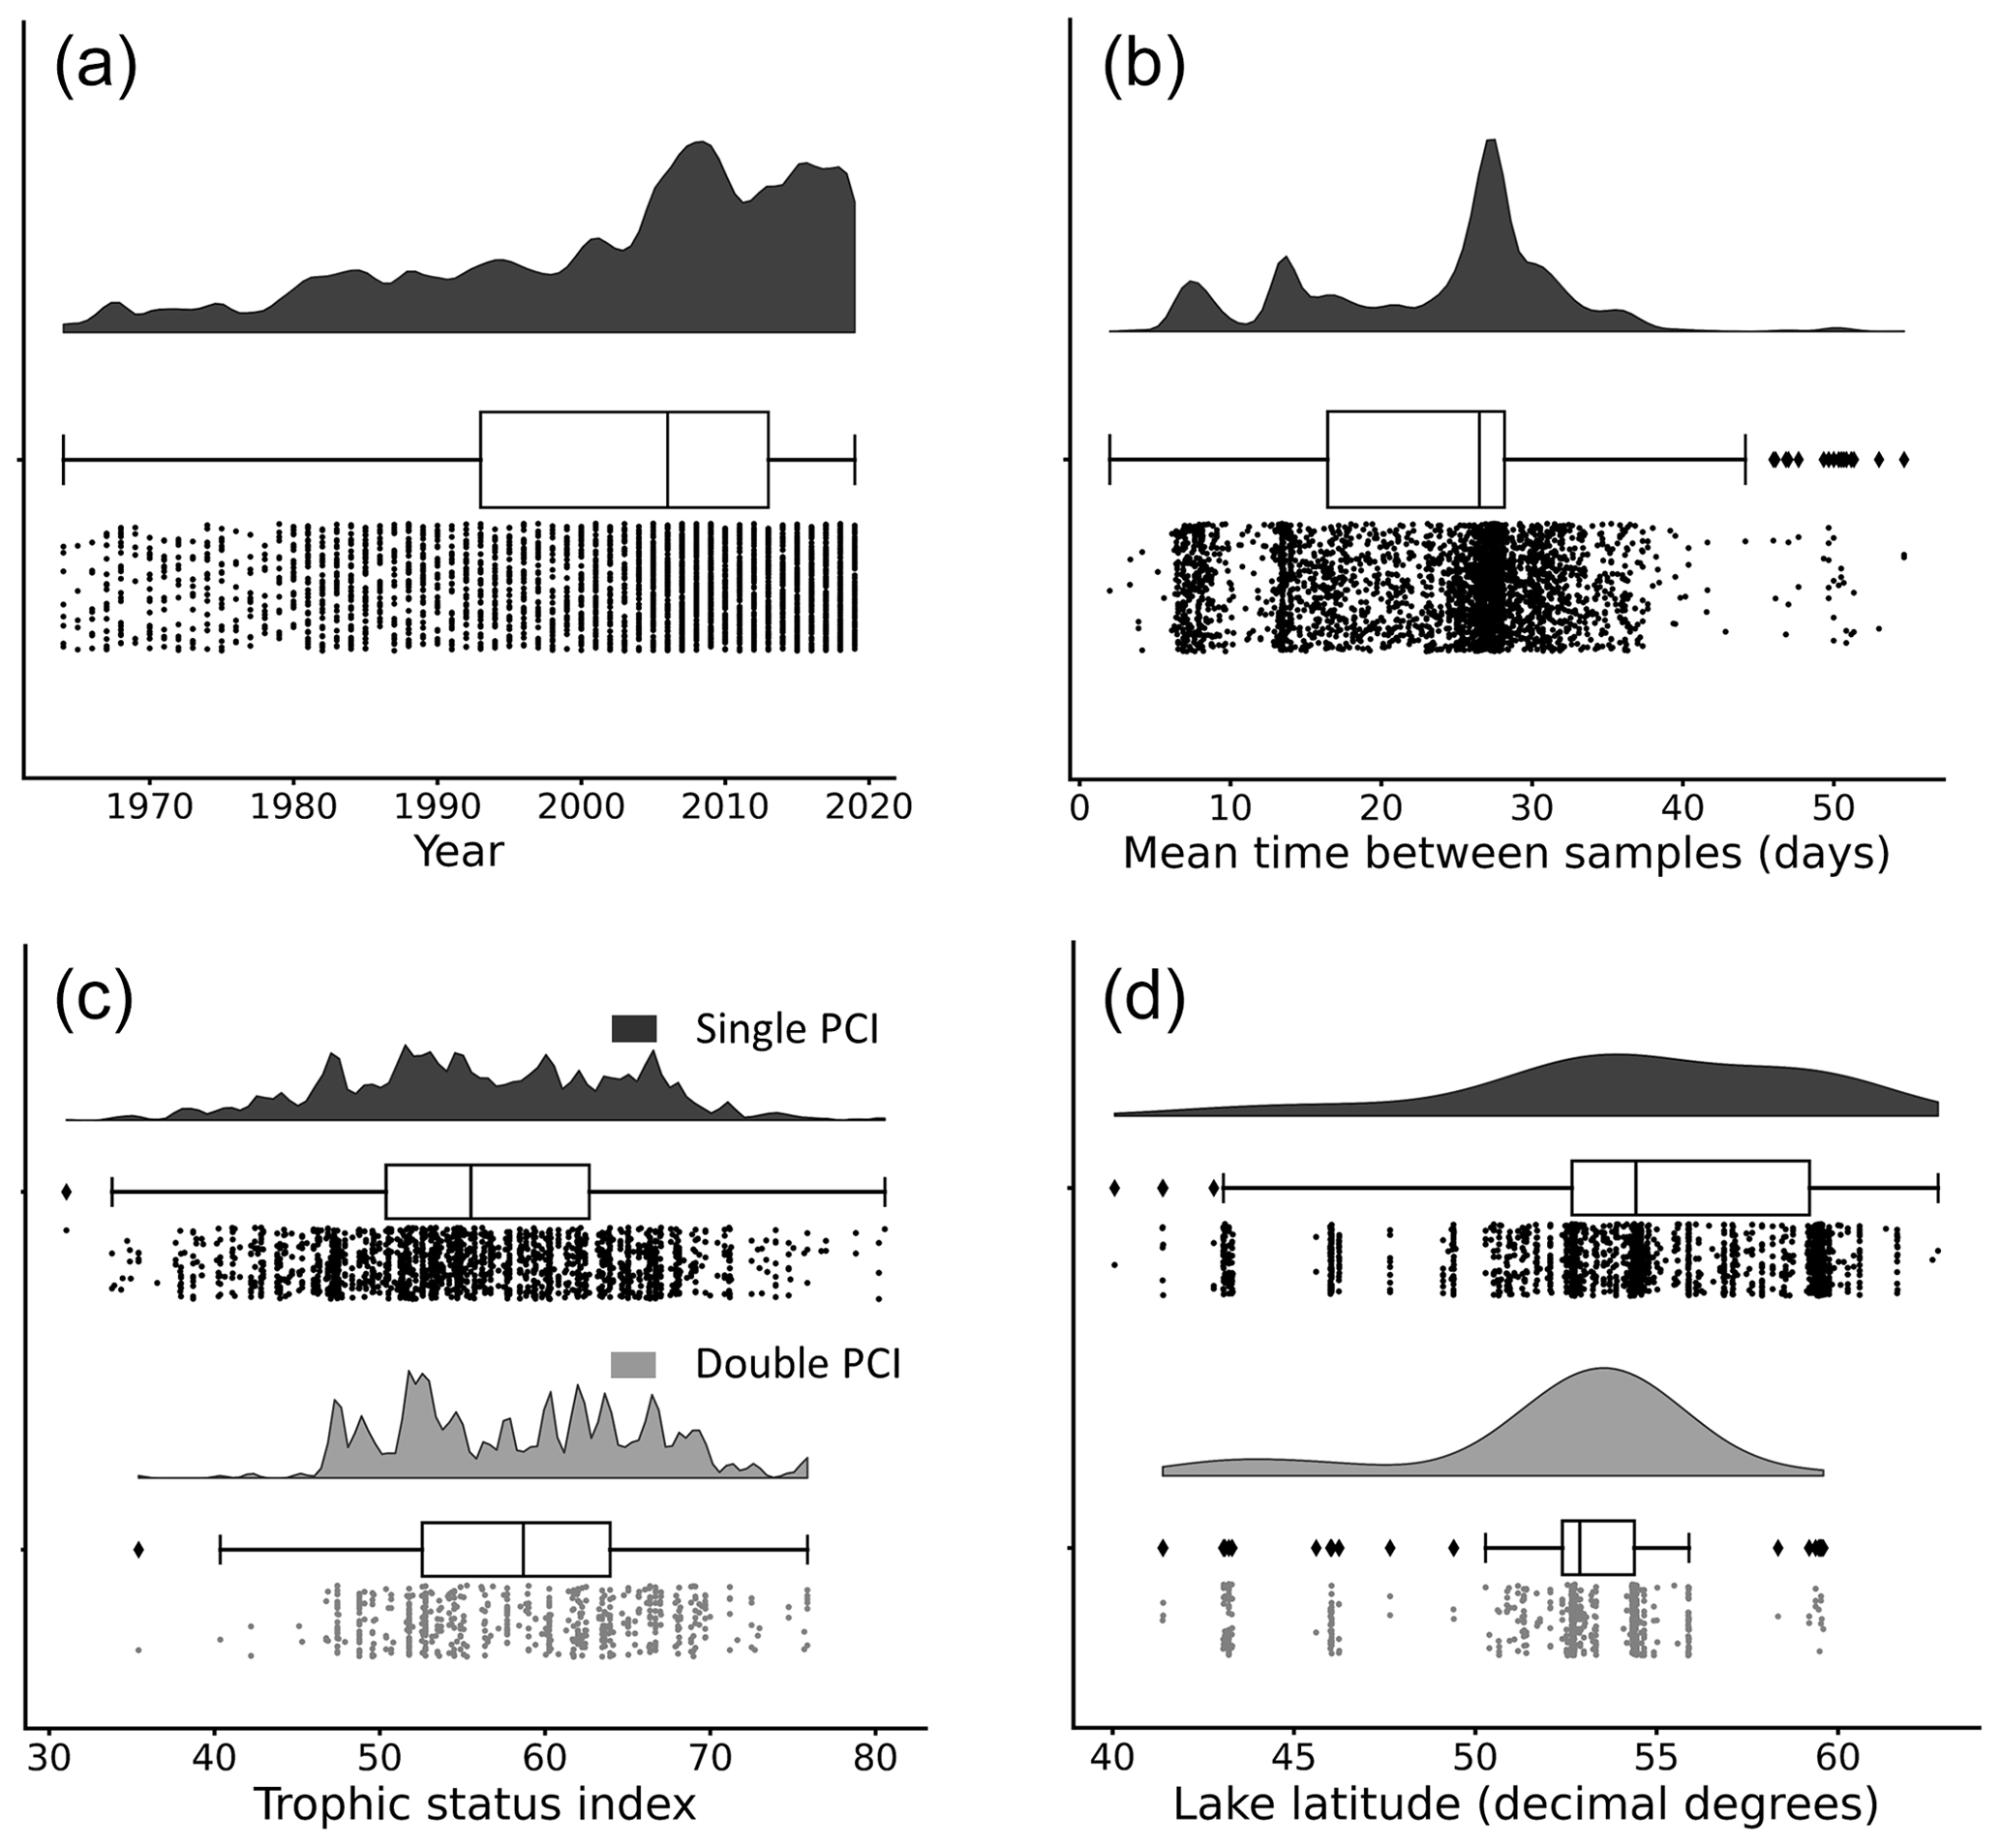
Figure 4Distributions of (a) year of occurrence, (b) mean time between samples, (c) lake trophic status index, and (d) lake latitude for each PCI in the dataset. Data are grouped by “double PCI” or “single PCI” year. The data is skewed toward more recent years and higher latitudes. Lakes in the oligotrophic category (TSI <40) have a higher proportion of single PCIs. These “rain-cloud plots” show the same data visualized in three different ways for each group: frequency distribution, boxplot with quartiles (outliers as represented as points), and a jitter plot of data points as different ways to visualize the data (Allen et al., 2021). Note that the amplitude of the frequency distribution is not proportional between categories.
3.1 Dataset characteristics
Most lakes in the dataset are located between 50 and 60∘ N. The majority of available open data are from organizations within the United Kingdom, Sweden, Canada, and the United States. The years with available data in the dataset are unevenly distributed. The majority of PCIs fall in the period 2005–2019 (Fig. 4a), likely due to a combination of increased lake monitoring efforts and a push in recent years towards greater accessibility of publicly funded data (Hallegraeff et al., 2021; Roche et al., 2020). Most sampling frequencies are in the range of 25 to 30 d, with additional peaks at 7 and 14 d (Fig. 4b). Thus, with a few exceptions, the PCIs included in the dataset occurred in lakes sampled at a monthly frequency or better.
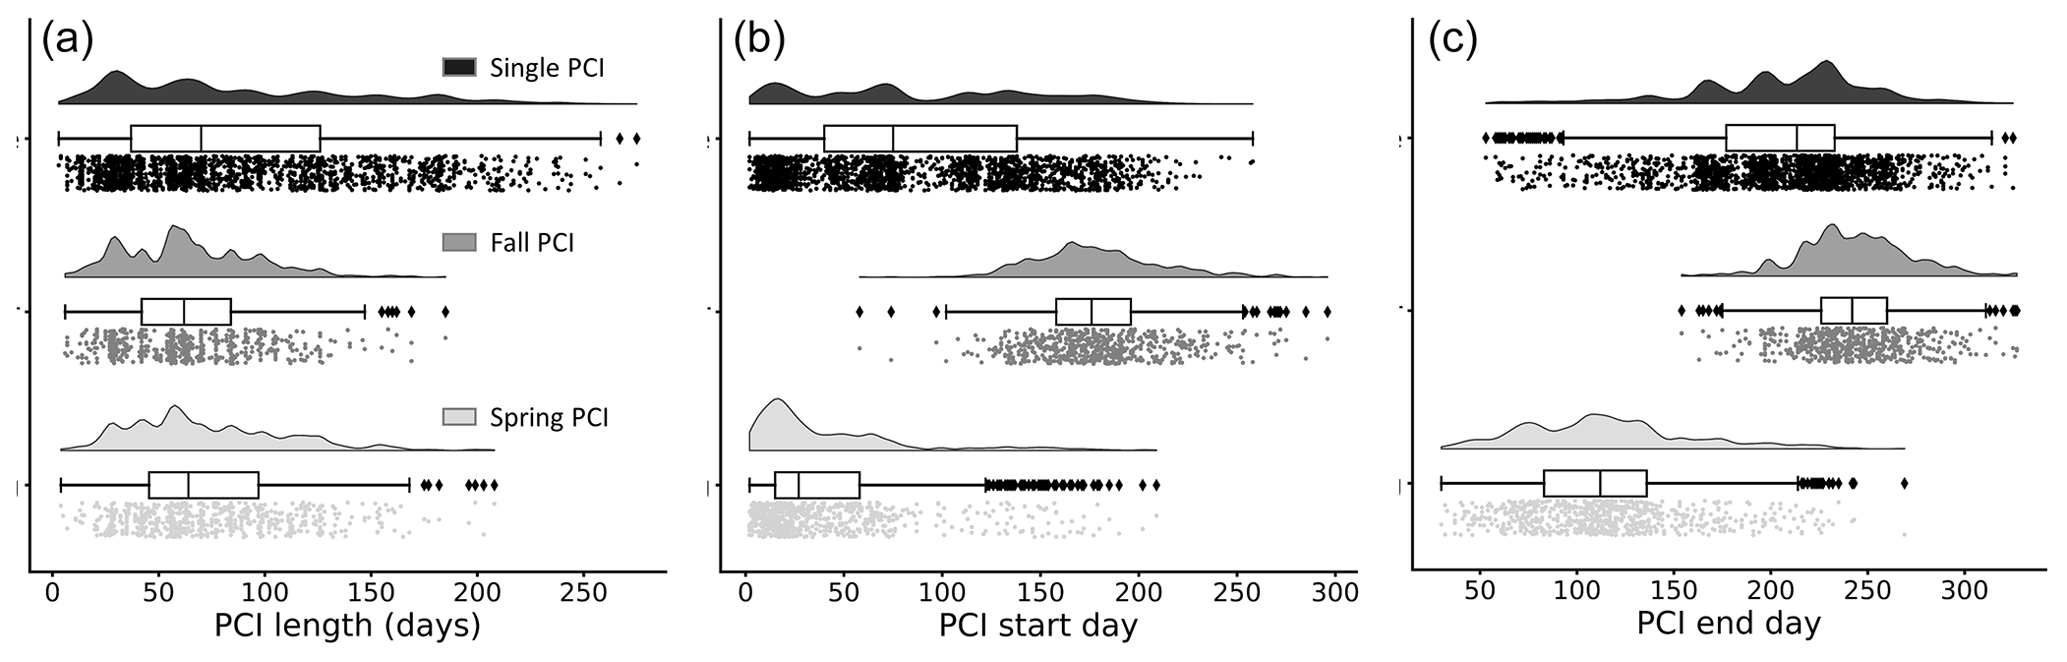
Figure 5Frequency distributions of (a) duration, (b) start day (day of year), and (c) end day (day of year) of the PCIs, grouped by PCI type. Single PCIs have the longest range in length, while fall PCIs tend to be the shortest. Single PCIs have the largest range of start and end days, while the spring and fall PCIs tend to start and end within a smaller window. These rain-cloud plots show the same data visualized in three different ways for each group: frequency distribution, boxplot with quartiles (outliers represented as points), and a jitter plot of data points.
The distribution of trophic states of the PCIs recorded in the dataset are 1.6 % oligotrophic, 18.6 % mesotrophic, 75.2 % eutrophic, and 4.6 % hypereutrophic. Single PCIs dominate oligotrophic lakes, where they make up 96.1 % of all PCIs (Fig. 4c). This may reflect the severe nutrient limitation in oligotrophic lakes, which prevents the occurrence of a second annual algal PCI (Rigosi et al., 2014). Oligotrophic lakes also tend to dominate at latitudes ≥55∘ N (Fig. 4d), where lower water temperatures and lower cumulative solar radiation may further limit algal growth (Lewis, 2011). The PCI durations range from 3 to 275 d, with a median of 68 d (Fig. 5a). Fall PCIs tend to be shorter than spring and single PCIs, with the latter exhibiting the most variable start and end days (Fig. 5b).
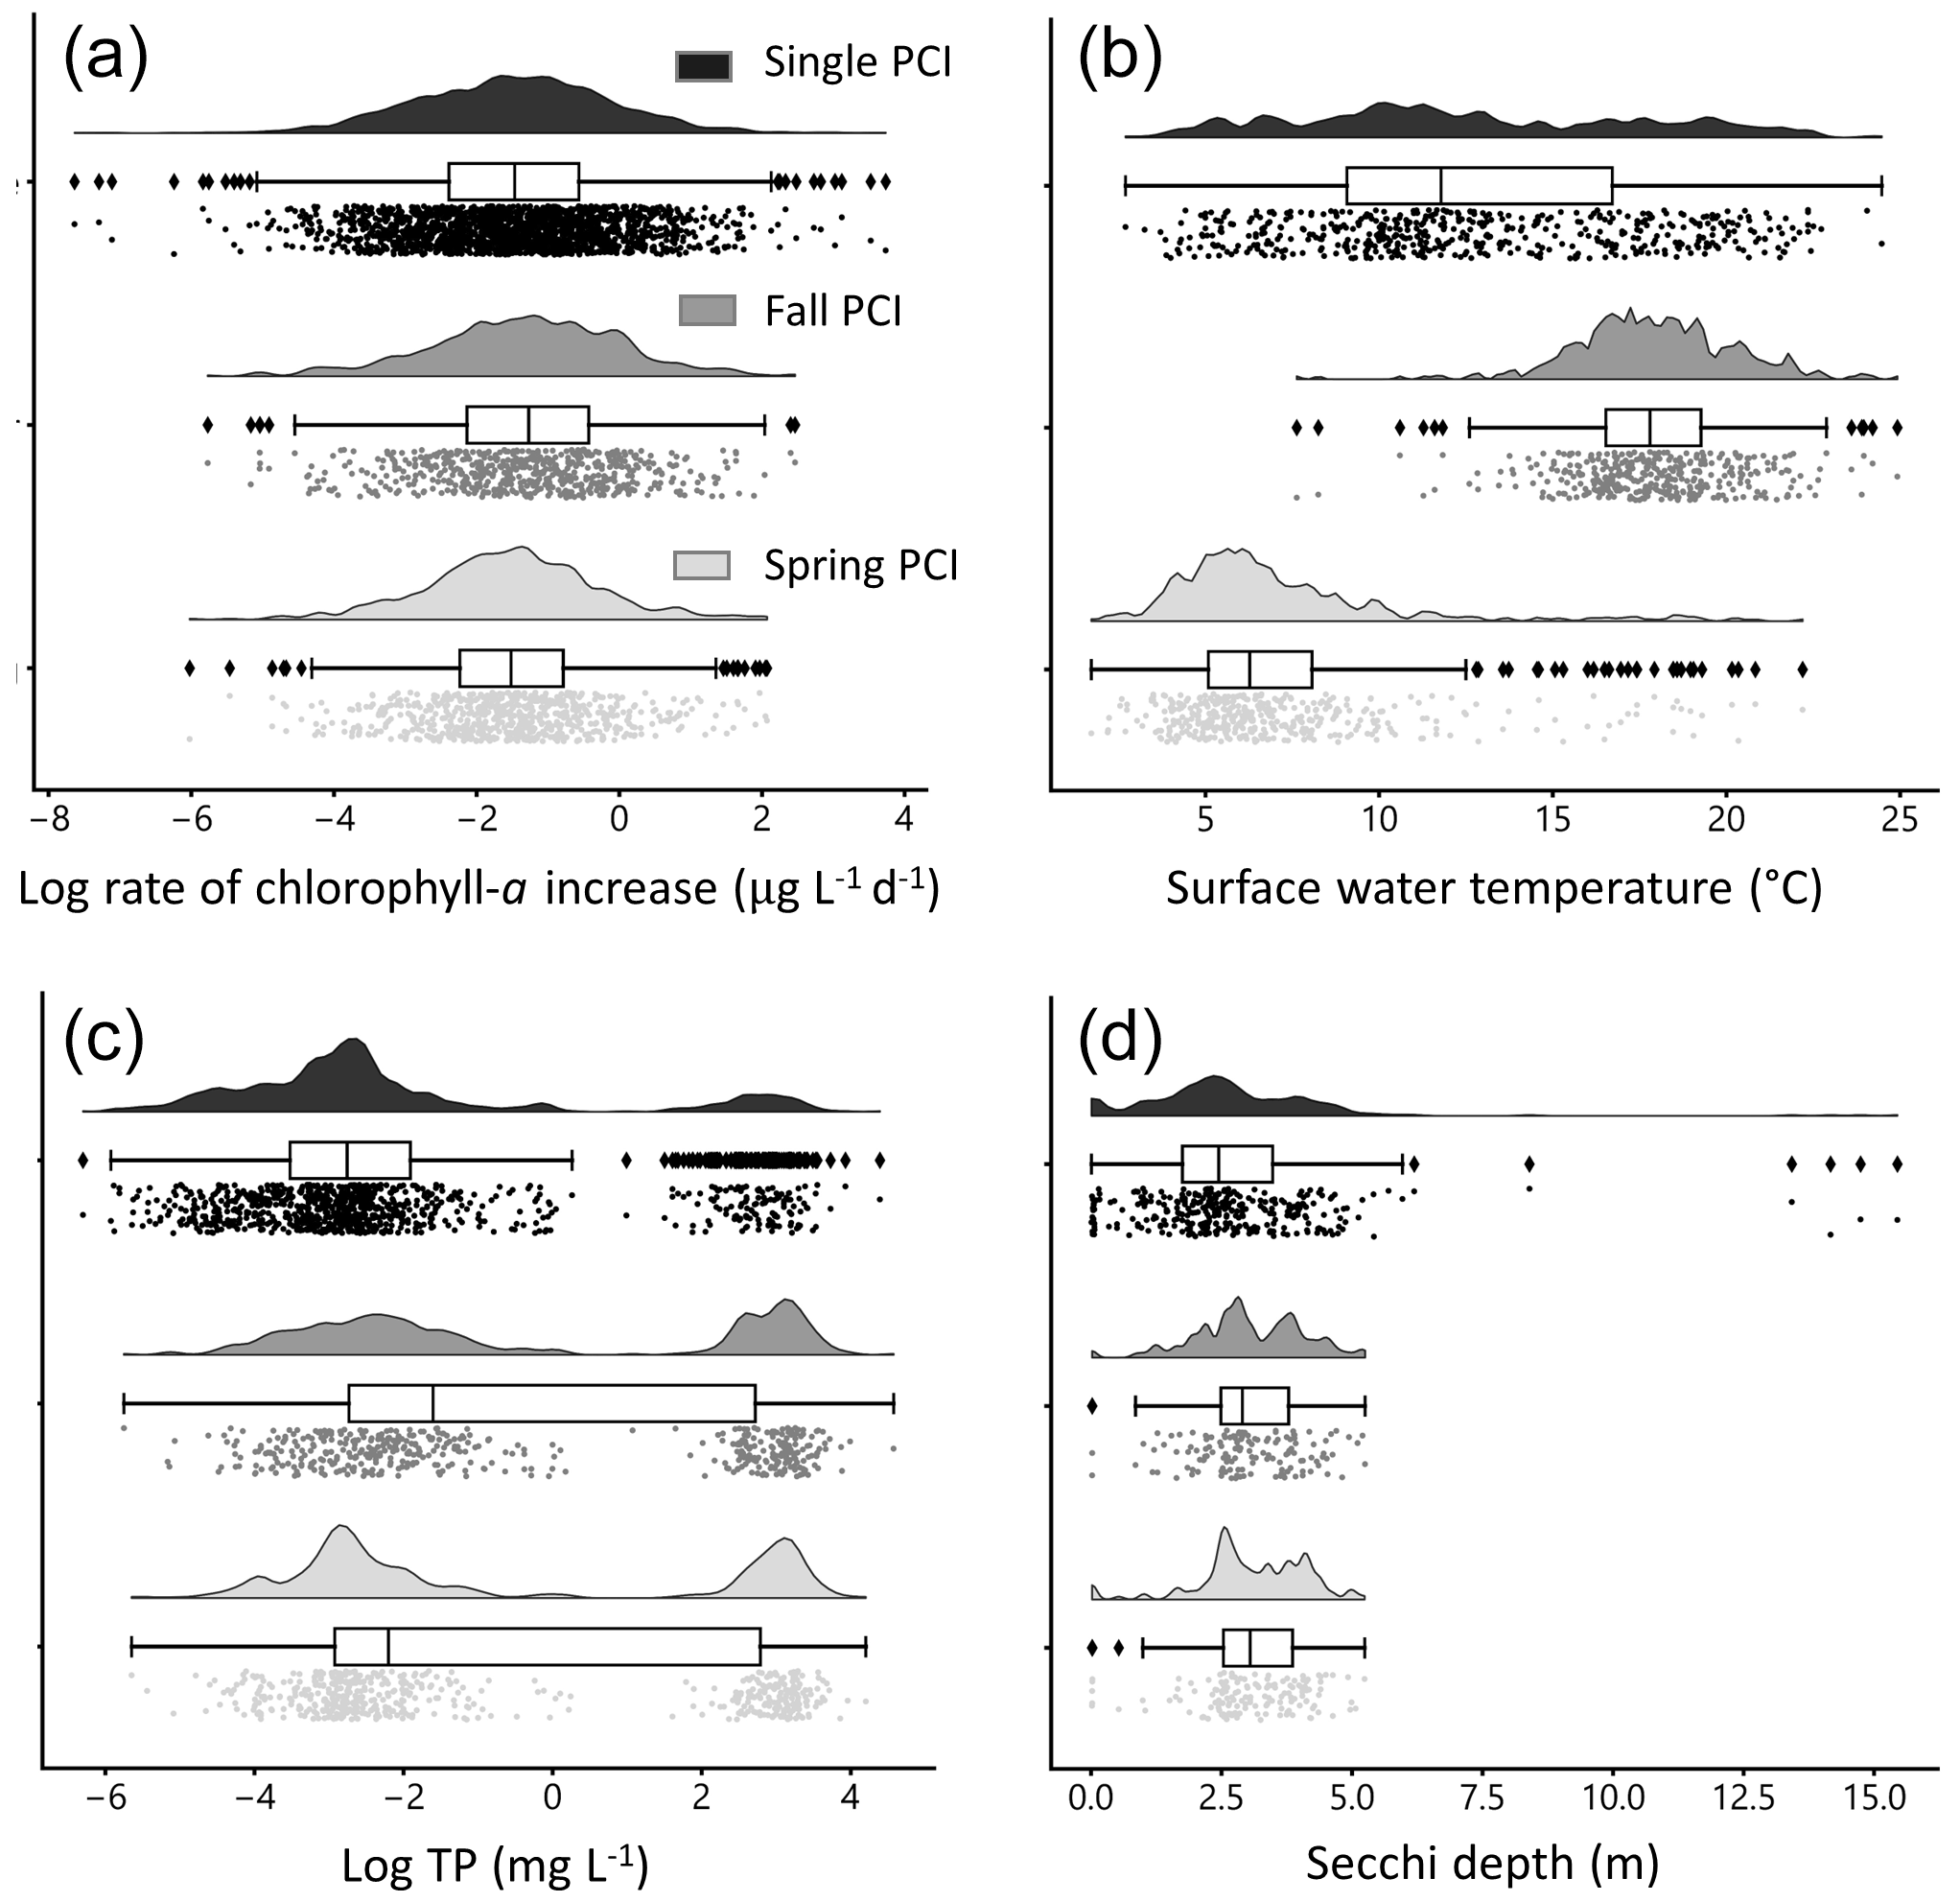
Figure 6Distributions of selected water quality variables during PCIs: (a) log rate of chlorophyll-a increase, (b) mean surface water temperature, (c) log mean total phosphorus (TP), and (d) mean Secchi depth. The mean rate of chlorophyll-a increase is lowest in the single PCI category and highest in the fall PCIs. For the single PCIs, temperature is evenly distributed across the annual range, as they occur throughout the ice-free season. Total phosphorus concentrations are lowest during the spring PCIs, which likely reflects a greater control of P limitation on algal growth during spring compared to summer and fall. Each PCI category has a similar range in Secchi depth, between 0 and 5 m. Rain-cloud plots show the frequency distribution, boxplot with quartiles (outliers as represented as points), and a jitter plot of data points for each group.
3.2 Environmental conditions during PCIs
Rates of chlorophyll-a increase during the PCIs exhibit log-normal distributions (Fig. 6a). The mean chlorophyll-a rate is lowest in the single PCI category and highest in the fall PCIs. Mean surface water temperature has a distinct bimodal spring–fall distribution (Fig. 6b). For the single PCIs, the corresponding mean temperatures are evenly distributed across the annual range, which reflects the large spread in the timing of the single PCIs (Fig. 5b). Total P concentrations are lowest during the spring PCIs (Fig. 6c), consistent with a greater control of P limitation on algal growth during spring compared to summer and fall (Kirillin et al., 2012). Secchi depth during the PCIs ranges from 0.01 to 15.4 m, with fall PCIs experiencing the lowest mean Secchi depth (Fig. 6d), as turbidity generally increases after the spring bloom.

Figure 7Rate of chlorophyll-a increase (RCI) trends in the dataset, grouped by (a) trophic status, (b) latitude, and (c) climate zone. Lakes of a higher trophic status have a higher mean RCI, while lakes at higher latitudes have lower RCI (with considerable overlap between all categories). Grouping by climate zone shows minimal effect on RCI. The number of lakes represented by each violin is shown in grey text on the panels. Climate zones are as follows: 7 = cold and mesic; 8 = cool, temperate, and dry; 10 = warm, temperate, and mesic. White circles indicate the mean value for each violin.
The PCI delineation and the estimation of RCI can, in principle, be applied to any lake for which time series chlorophyll-a concentration data are available. By creating a dataset comprising many lakes and covering multi-year time periods, it becomes possible to extract global trends in lake chlorophyll-a. Here, we provide a few illustrative examples of how the dataset can be interrogated, setting the stage for its use and extension by other researchers.
4.1 Chlorophyll-a rates: trophic status, latitude and climate zone
When grouped by trophic status, mean and median chlorophyll-a growth rates (RCIs) show the expected increase from oligotrophic to hypereutrophic lakes (Fig. 7a). The rates in the different trophic categories, however, cover large and overlapping ranges. When grouped according to latitude, lakes between 40 and 50∘ N exhibit the widest range in RCIs (Fig. 7b), in part due to the high proportion of lakes in this latitude range. The highest latitude lakes (60–70∘ N) tend to have the lowest RCIs, which may reflect the cooler temperatures experienced (Lewis, 2011).
The lakes are spread across three climate zones: cold and mesic; cool, temperate, and dry; and warm, temperate, and mesic (Fig. 7c). There is considerable overlap in RCI across the climate zones, with no systematic differences in the mean and median RCI values between the zones.
While variations in chlorophyll-a rates of increase (RCIs) are often assumed to reflect comparable differences in algal biomass growth rates, it is important to note that the chlorophyll-a to biomass ratio varies within and among lakes. In particular, chlorophyll-a to biomass ratios are known to be sensitive to variations in solar radiation, temperature, algal species, and cell size (Baumert and Petzodt, 2008; Inomura et al., 2019; Geider, 1987; Álvarez et al., 2017). The summer ratio of chlorophyll-a to biomass (the latter typically expressed as particulate organic carbon concentration) generally increases with increasing latitude, because algae are adapted to harvest the more variable daylight conditions, including longer summer photoperiods, at higher latitudes (Behrenfeld et al., 2016; Taylor et al., 1997). By contrast, cooler temperatures at higher latitudes may result in higher chlorophyll-a to biomass ratios because of lower growth rates, at least when the algae are nutrient replete (Behrenfeld et al., 2016). Thus, the use of a relative rate (NRCC) as the threshold value for defining a PCI and as a metric reported in the dataset facilitates comparisons between lakes of different trophic status or standing stock of chlorophyll-a.
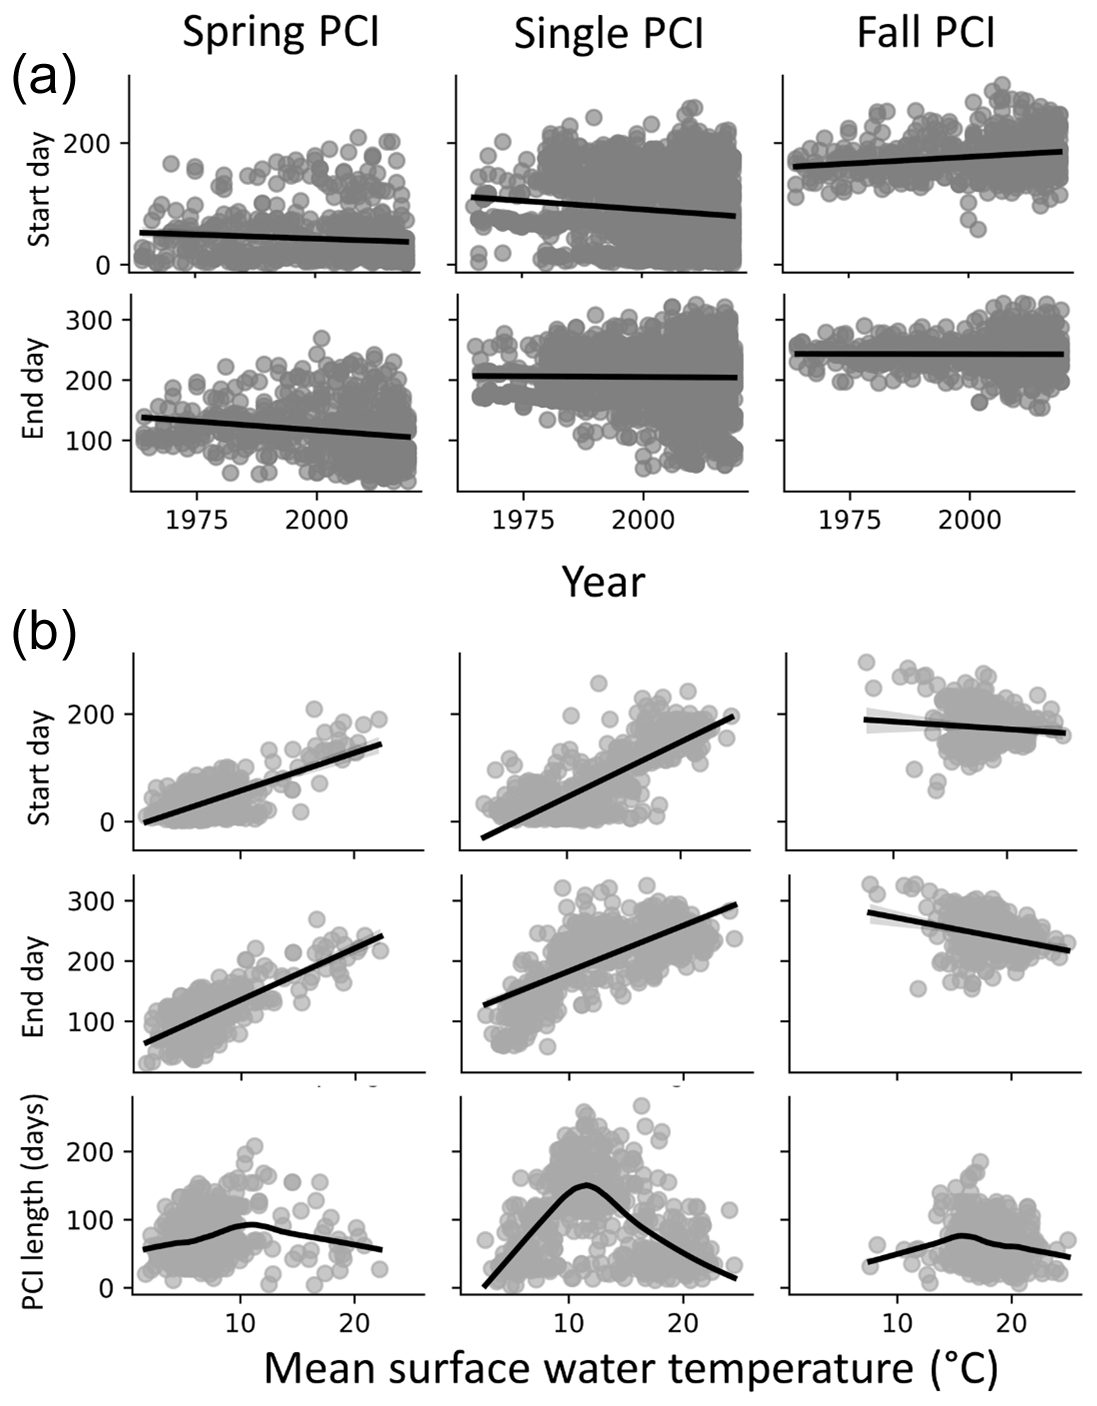
Figure 8(a) Start and end days for the spring, fall, and single PCIs for all the lakes in the dataset; spring and single PCI categories show trends toward earlier start and end days, while fall PCI start days occur earlier in the year. (b) Start and end days of the PCIs as a function of temperature (top two rows in panel B, linear regression trend line in black) suggest a positive relationship between PCI timing and surface water temperature in the spring and a negative relationship in the fall. Longer PCIs occur at moderate surface water temperatures, which are observed less often during the fall PCIs (trend line fitting data in the bottom row are locally weighted scatterplot smoothing).
4.2 Chlorophyll-a rates: temperature and climate warming
The start and end days of the spring and single PCIs show temporal trends towards occurrence earlier in the year (Fig. 8a). Earlier springtime algal activity could be linked to global warming. The latter is expected to result in earlier ice break up and earlier surface water temperature conditions favourable for algal growth (Markelov et al., 2019). The start and end days of the spring PCIs show a positive correlation with increasing temperature (Fig. 8b). By contrast, little or even negative correlations are seen for the fall PCIs. Thus, all other conditions unchanged, a warmer climate would see earlier spring blooms but few temporal shifts for the fall PCIs and, possibly, even a slight delay. For the spring and single PCIs, the duration shows a maximum around 10 ∘C. Therefore, moderate temperatures near or slightly above 10 ∘C should, on average, produce the longest lasting algal growth events. The same trend is not seen for the fall PCIs, possibly because they occur when water temperatures are already above 10 ∘C.
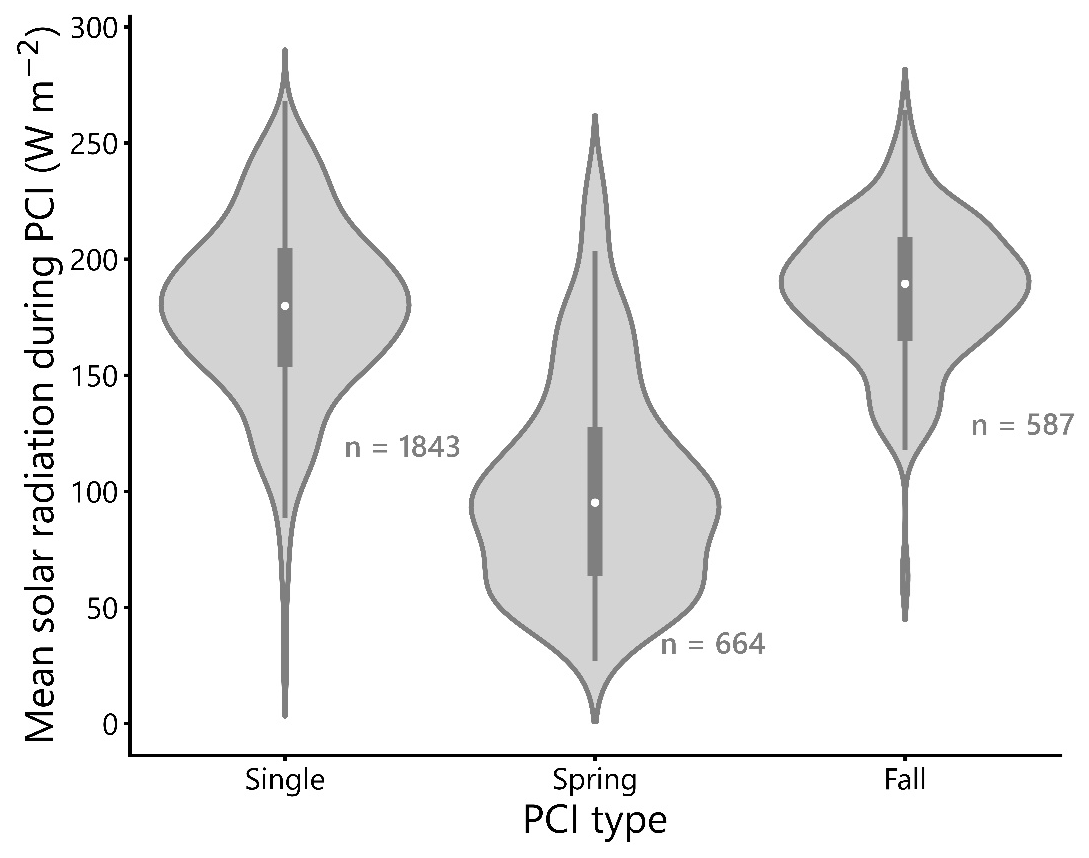
Figure 9Mean PCI surface solar radiation (SSR) grouped by PCI type (single, spring, or fall). White circles show the mean value for each violin. The mean SSR during spring PCIs is lower than that of single and fall PCIs, which have similar distributions.
4.3 Surface solar radiation during PCIs: seasonal distributions and distances to lakes
The mean SSR during spring PCIs in the dataset is approximately 100 W m−2 (Fig. 9), which is lower than the mean SSR values of single and fall PCIs, which are both close to 175 W m−2. This difference in mean SSR between spring and fall PCIs is expected, given the longer daylight hours and more intense sunlight experienced in summer and fall compared to early spring. The similarity in mean SSR between single and fall PCIs may be related to the observation that, at higher latitudes (>55∘ N), single PCIs occur more commonly than double PCIs (Fig. 4d). Higher latitude lakes tend to bloom only once during the summer months, taking advantage of the period of the year with the highest SSR (Behrenfeld et al., 2016; Lewis, 2011). In support of this, Fig. 5b and c show that single PCIs tend to occur between late spring and early fall. On the other hand, at lower latitudes (40–45∘ N), double PCIs are more common than single PCIs, likely due to the higher temperatures and longer periods of sufficient daylight experienced during the spring and fall “shoulder seasons” at these latitudes.

Figure 10Frequency distribution of distances between the lake sampling points and the nearest surface solar radiation (SSR) sampling stations in decimal degrees. Most lake–SSR distances are within 200 km of each other. Cloud cover, atmospheric aerosols, and their interactions are a major control on incident SSR at a given surface location; therefore, the SSR values may become less representative of the paired lake with increasing distances. The middle line in the boxplot shows the median value.
Despite the defining importance of sunlight for photosynthesis, in situ SSR time series data are rarely measured systematically as part of lake monitoring programs (Sterner et al., 1997). Although gridded reanalysis datasets that include solar radiation parameters exist, their comparability with in situ SSR measurements remains questionable (Wohland et al., 2020). In gathering open source data, we compiled in situ SSR measurements from locations as close as possible to the lakes with chlorophyll-a data. Nonetheless, many of the SSR values in our dataset were collected at considerable distances from the corresponding lakes (up to ∼ 300 km, Fig. 10). For our dataset, only ∼ 10 % of the locations where SSR was measured are less than 20 km away from the corresponding lakes, while ∼ 40 % are 20–50 km away, ∼ 43 % are 50–100 km away, and ∼ 7 % are more than 100 km away. Hence, in a significant number of cases, the actual mean SSR during a PCI may differ from the in situ mean SSR reported here due to differences in cloud cover and levels of atmospheric aerosols (among other factors) (Alpert and Kishcha, 2008). Users are therefore advised to consider this limitation when making use of the SSR values in our dataset. Overall, we recognize a need for SSR data to be more systematically measured and reported as part of lake-monitoring programs, in particular for oligotrophic lakes.
All code is available in the project GitHub repository (https://github.com/hfadams/pci, last access: 7 August 2022) and in Zenodo (https://doi.org/10.5281/zenodo.6972355, Adams, 2022). The PCI dataset and additional data files can be openly accessed at the Federated Research Data Repository at https://doi.org/10.20383/102.0488 (Adams et al., 2021).
We present a novel way to delineate annual periods of chlorophyll-a increase (PCIs) in lakes that, presumably, overlap with periods of algal growth. We apply this approach to derive the chlorophyll-a rates of increase (RCIs) during the PCIs of 343 lakes from cold and cold-temperate regions in the Northern Hemisphere and covering the period 1964–2019. The derived RCIs are assembled in an open source dataset, together with additional information on the lakes, including water quality, trophic state, and surface solar radiation. Note that the dataset can be paired with other databases, such as HydroLAKES (https://www.hydrosheds.org/products/hydrolakes, last access: July 2022, Messager et al., 2016), HydroATLAS (https://www.hydrosheds.org/hydroatlas, last access: July 2022, Linke et al., 2019), and GLCP (Meyer et al., 2020), to access additional lake and/or watershed attributes. Our dataset is designed to support comparative analyses of the controls on lake chlorophyll-a dynamics and also, by extension, algal dynamics within and between lakes. We present several examples of such analyses. We hope these will encourage others to use the dataset in their own research and to further expand the dataset's geographical reach and information content.
Table A1Summary of sources and licensing for the chlorophyll-a data. Direct links to the datasets are provided where possible, and lake names can be searched within the database. Note that not all lakes in these databases met the requirements to be retained in the PCI dataset. * Last access: August 2021.
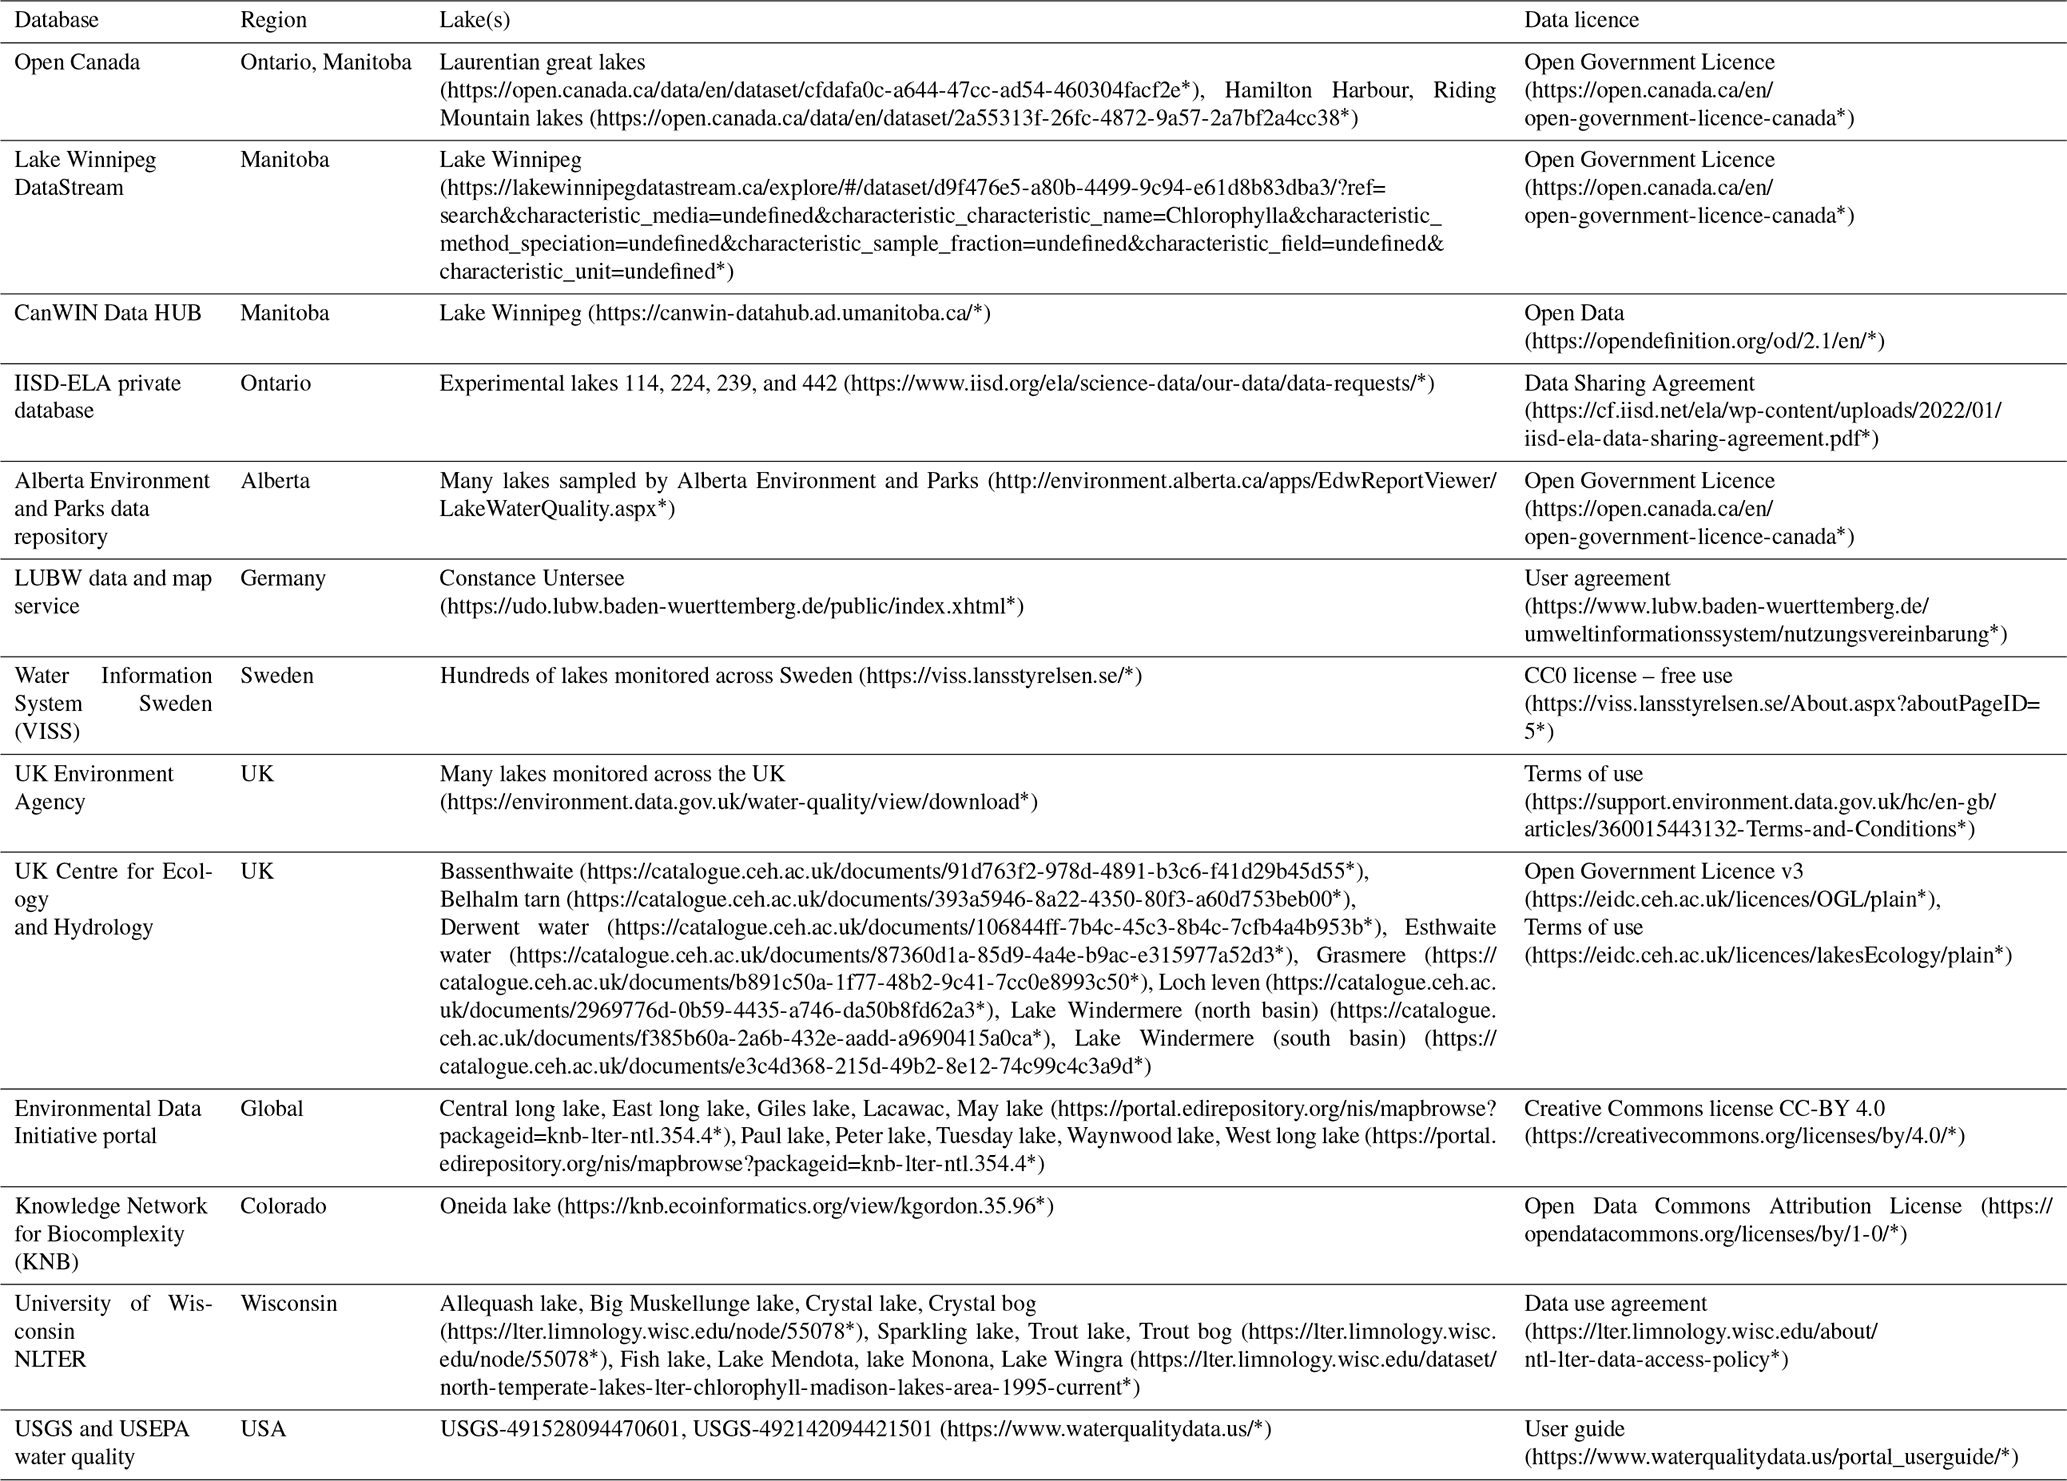
Table A2Summary of sources and licensing for the surface solar radiation data. Direct links to the databases are provided where possible, but the Environment and Climate Change Canada (ECCC) and IISD-ELA data were acquired through communication with the curators. * Last access: July 2022.
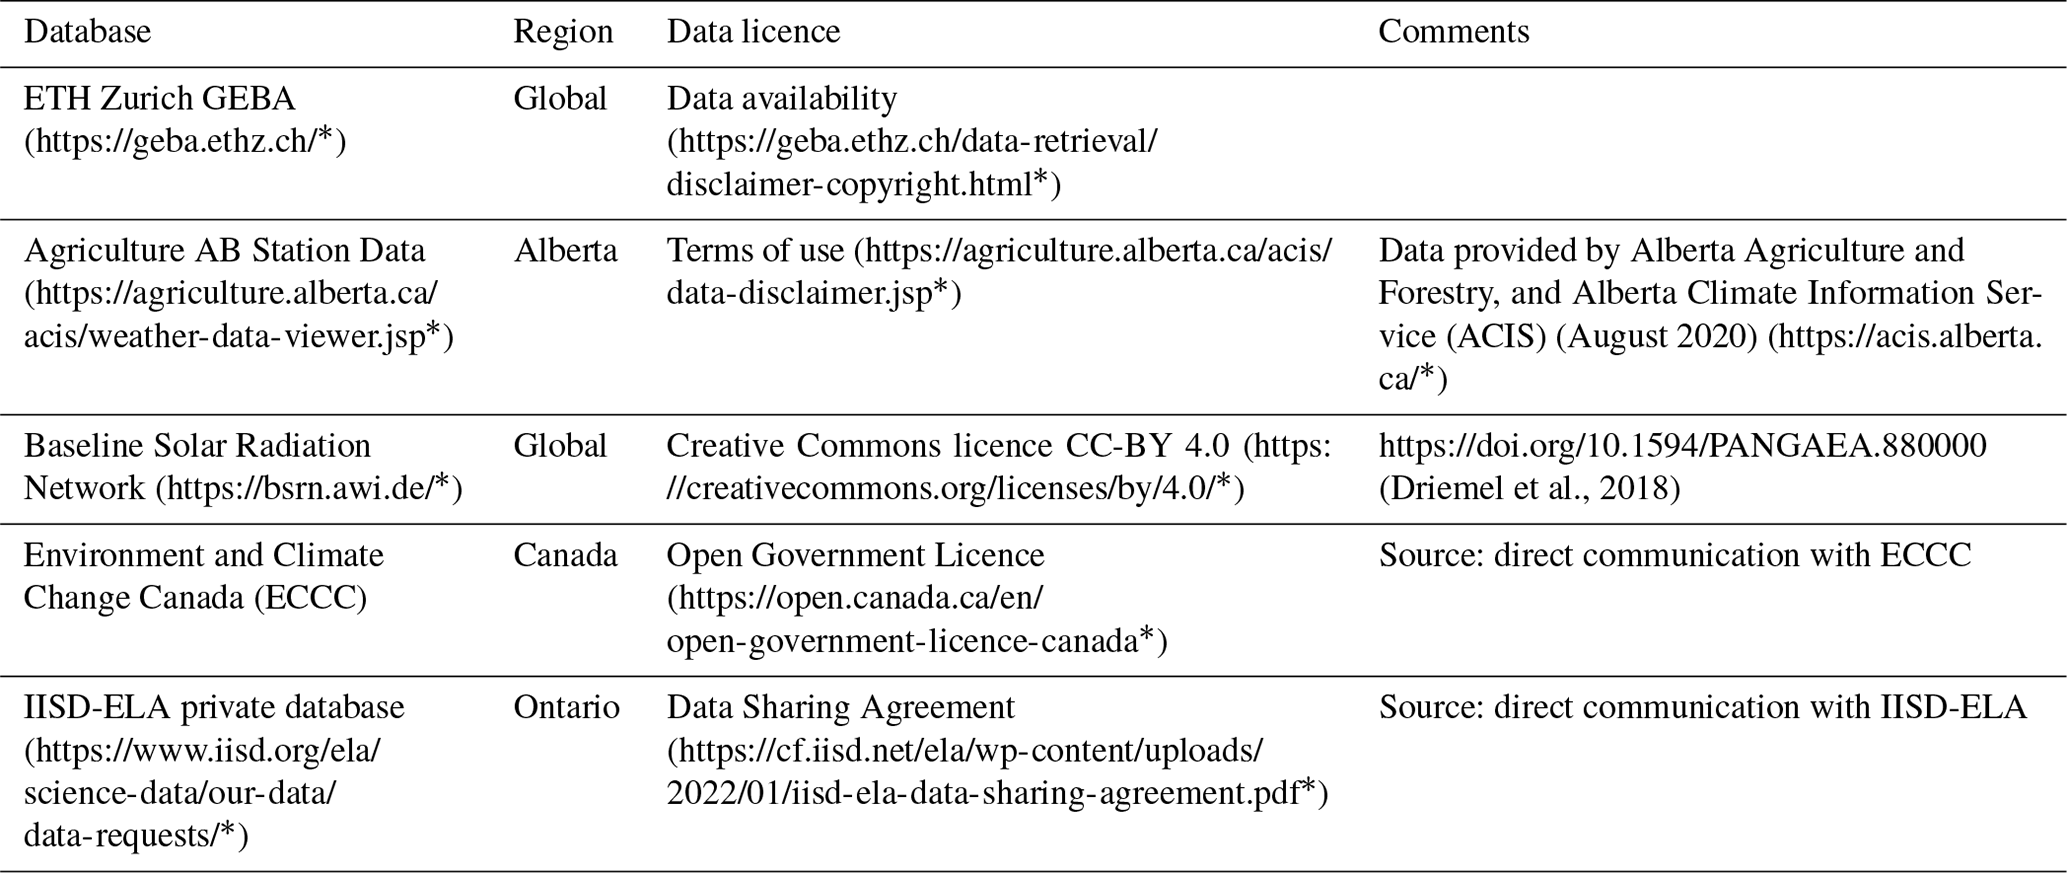
Table A3Summary of miscellaneous databases used to acquire lake attributes. Follow embedded links to access the database and metadata. * Last access: July 2022.
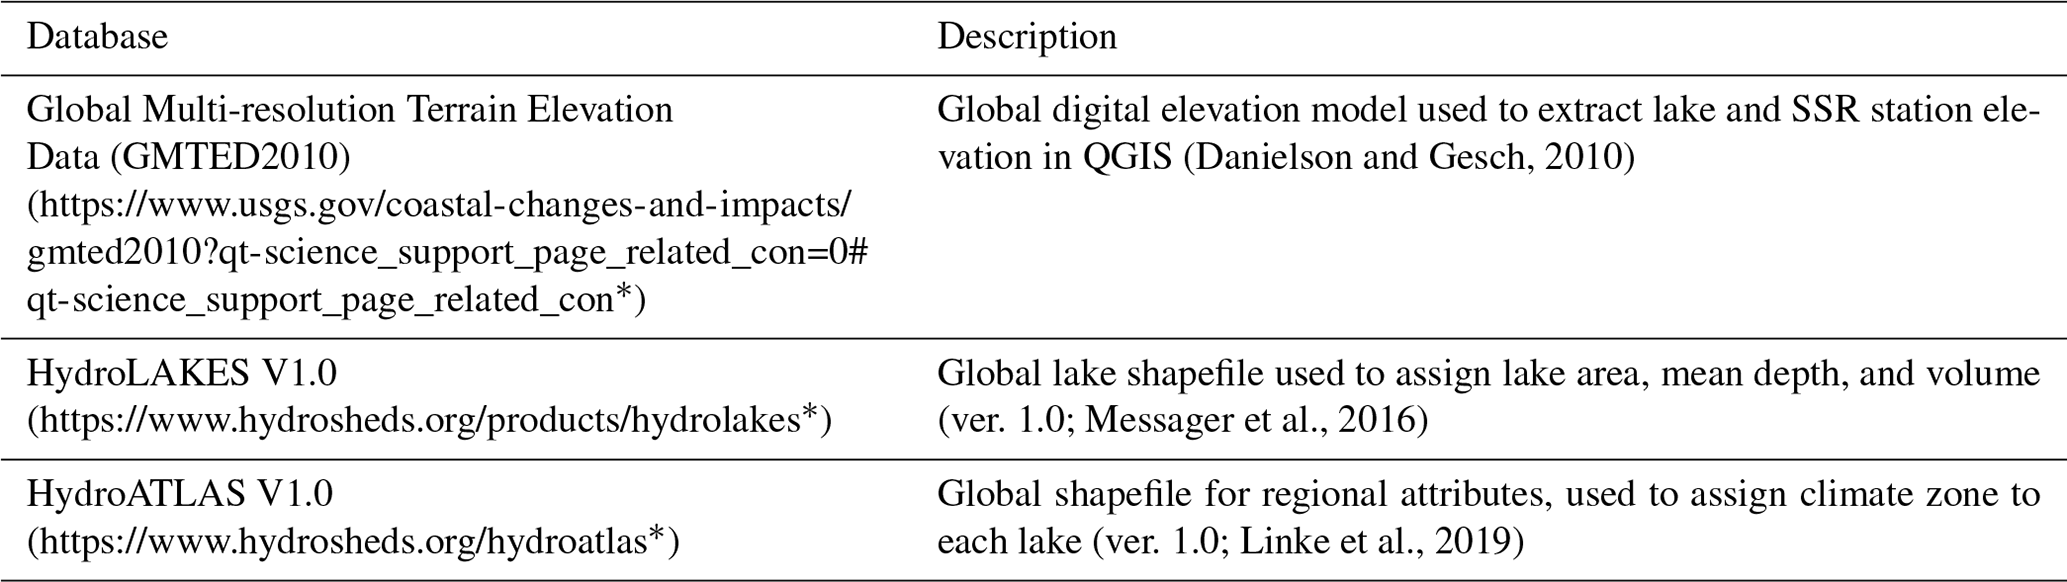
Table A4Lake attributes published alongside the PCI dataset (https://doi.org/10.20383/102.0488, Adams et al., 2021). * Last access: July 2022.
The supplement related to this article is available online at: https://doi.org/10.5194/essd-14-5139-2022-supplement.
All authors took part in development of the study. SS, BDP, and PVC conceptualized the study, while HA and JY developed the methods and carried out the data collection and data post-processing. HA wrote the original manuscript with contributions from JY, BDP, SS, HKP, and PVC. All authors reviewed and edited the final paper.
The contact author has declared that none of the authors has any competing interests.
Publisher's note: Copernicus Publications remains neutral with regard to jurisdictional claims in published maps and institutional affiliations.
We would like to thank all of the institutions and authors listed in the Supplement for making their data open source and free to support our work.
This work was funded by the Lake Futures project within the Global Water Futures (GWF) project, supported by the Canada First Research Excellence Fund (CFREF).
This paper was edited by Birgit Heim and reviewed by two anonymous referees.
Adams, H.: hfadams/pci: (v1.1), Zenodo [code], https://doi.org/10.5281/zenodo.6972355, 2022.
Adams, H., Ye, J., Slowinski, S., Persaud, B., Kheyrollah Pour, H., and Van Cappellen, P.: Rates and timing of chlorophyll-a increases and related environmental variables in global temperate and cold-temperate lakes, Federated Research Data Repository [data set], https://doi.org/10.20383/102.0488, 2021.
Allen, M., Poggiali, D., and Whitaker, K.: Raincloud plots: a multi-platform tool for robust data visualization [version 2; peer review: 2 approved], Wellcome Open Res., 4, 63, https://doi.org/10.12688/wellcomeopenres.15191.2, 2021.
Alpert, P. and Kishcha, P.: Quantification of the effect of urbanization on solar dimming, Geophys. Res. Lett., 35, L08801, https://doi.org/10.1029/2007GL033012, 2008.
Álvarez, E., Nogueira, E., and López-Urrutia, Á.: In vivo single-cell fluorescence and size scaling of phytoplankton chlorophyll content, Appl. Environ. Microbiol., 83, e03317-16, https://doi.org/10.1128/AEM.03317-16, 2017.
Battin, T. J., Kaplan, L. A., Findlay, S., Hopkinson, C. S., Marti, E., Packman, A. I., Newbold, J. D., and Sabater, F.: Biophysical controls on organic carbon fluxes in fluvial networks, Nat. Geosci., 1, 95–100, https://doi.org/10.1038/ngeo101, 2008.
Baumert, H. Z. and Petzodt, T.: The role of temperature, cellular quota and nutrient concentrations for photosynthesis, growth and light-dark acclimation in phytoplankton, Limnologica, 38, 313–326, https://doi.org/10.1016/J.LIMNO.2008.06.002, 2008.
Behrenfeld, M. J., O'Malley, R. T., Boss, E. S., Westberry, T. K., Graff, J. R., Halsey, K. H., Milligan, A. J., Siegel, D. A., and Brown, M. B.: Revaluating ocean warming impacts on global phytoplankton, Nat. Clim. Change, 6, 323–330, https://doi.org/10.1038/nclimate2838, 2016.
Carlson, R. E. and Simpson, J.: A coordinator's guide to volunteer lake monitoring methods, North Am. Lake Manag. Soc., 96, p. 305, 1996.
Carpenter, S. R., Kitchell, J. F., Hodgson, J. R., Carpenter, S. R., Kitchell, J. F., and Hodgson, J. R.: Cascading trophic interactions and lake productivity, BioScience, 35, 634–639, https://doi.org/10.2307/1309989, 2016.
Codd, G. A., Morrison, L. F., and Metcalf, J. S.: Cyanobacterial toxins: Risk management for health protection, Toxicol. Appl. Pharmacol., 203, 264–272, https://doi.org/10.1016/j.taap.2004.02.016, 2005.
Cole, J., J., Prarie, Y. T., Caraco, N. F., McDowel, L. T., Tranvik, L. J., Striegel, C. M., Duarte, C. M., Kortelainen, P., Downing, J. A., Middleburg, J. J., and Melack, J.: Plumbing the Global Carbon Cycle: Integrating Inland Waters into the Terrestrial Carbon Budget, Ecosystems, 10, 171–184, https://doi.org/10.1007/s10021-006-9013-8, 2007.
Creed, I. F., Bergström, A. K., Trick, C. G., Grimm, N. B., Hessen, D. O., Karlsson, J., Kidd, K. A., Kritzberg, E., McKnight, D. M., Freeman, E. C., Senar, O. E., Andersson, A., Ask, J., Berggren, M., Cherif, M., Giesler, R., Hotchkiss, E. R., Kortelainen, P., Palta, M. M., Vrede, T., and Weyhenmeyer, G. A.: Global change-driven effects on dissolved organic matter composition: Implications for food webs of northern lakes, Glob. Chang. Biol., 24, 3692–3714, https://doi.org/10.1111/gcb.14129, 2018.
Danielson, J. and Gesch, D.: Global Multi-resolution terrain elevation data 2010 (GMTED2010), U.S. Geol. Surv. open-file Rep., 26, 2011–1073, 2010.
Deng, J., Paerl, H. W., Qin, B., Zhang, Y., Zhu, G., Jeppesen, E., Cai, Y., and Xu, H.: Climatically-modulated decline in wind speed may strongly affect eutrophication in shallow lakes, Sci. Total Environ., 645, 1361–1370, https://doi.org/10.1016/j.scitotenv.2018.07.208, 2018.
Dorset Environmental Science Centre: Lakeshore Capacity Assessment Handbook: Protecting Water Quality in Inland Lakes on Ontario's Precambrian Shield Appendix C, Dorset Environmental Science Centre Technical Bulletins, Toronto, Ontario, Canada, Technical Bulletin No. DESC-4, 2010.
Downing, J. A., Prarie, Y. T., Cole, J., J., Duarte, C. M., Tranvik, L. J., Striegl, R. G., McDowell, W. H., Kortelainen, P., Caraco, N. F., Melack, J., M., and Middelburg, J. J.: The global abundance and size distribution of lakes, ponds and impoundments, Limnol. Oceanogr., 51, 2388–2397, https://doi.org/10.1016/B978-012370626-3.00025-9, 2006.
Driemel, A., Augustine, J., Behrens, K., Colle, S., Cox, C. J., Cuevas-Agulló, E., Denn, F. M., Duprat, T., Dutton, E. G., Fukuda, M., Grobe, H., Haeffelin, M., Hodges, G., Hyett, N., Ijima, O., Kallis, A., Knap, W., Kustov, V., Lanconelli, C., Long, C., Longenecker, D., Lupi, A., Maturilli, M., Mimouni, M., Ntsangwane, L., Ogihara, H., Olano, X., Olefs, M., Omori, M., Passamani, L., Pereira, E. B., Schmithüsen, H., Schumacher, S., Sieger, R., Tamlyn, J., Vogt, R., Vuilleumier, L., Xia, X., Ohmura, A., and König-Langlo, G.: Baseline surface radiation data (1992–2017), PANGAEA [data set], https://doi.org/10.1594/PANGAEA.880000, 2018.
Geider, R. J.: Light and Temperature Dependence of the Carbon to Chlorophyll a Ratio in Microalgae and Cyanobacteria: Implications for Physiology and Growth of Phytoplankton, New Phytol., 106, 1–34, https://www.jstor.org/stable/2434683 (last access: August 2021), 1987.
Germán, A., Tauro, C., Scavuzzo, M. C., and Ferral, A.: Detection of algal blooms in a eutrophic reservoir based on chlorophyll-a time series data from MODIS, Int. Geosci. Remote Sens. Symp., 2017-July, 4008–4011, https://doi.org/10.1109/IGARSS.2017.8127879, 2017.
Gleick, P.: Water and conflict, Int. Secur., 18, 112, https://doi.org/10.1016/S0262-4079(13)60875-1, 1993.
Hallegraeff, G. M., Anderson, D. M., Belin, C., Bottein, M.-Y. D., Bresnan, E., Chinain, M., Enevoldsen, H., Iwataki, M., Karlson, B., McKenzie, C. H., Sunesen, I., Pitcher, G. C., Provoost, P., Richardson, A., Schweibold, L., Tester, P. A., Trainer, V. L., Yñiguez, A. T., and Zingone, A.: Perceived global increase in algal blooms is attributable to intensified monitoring and emerging bloom impacts, Commun. Earth Environ., 2, 117, https://doi.org/10.1038/s43247-021-00178-8, 2021.
Hampton, S. E., Galloway, A. W. E., Powers, S. M., Ozersky, T., Woo, K. H., Batt, R. D., Labou, S. G., O'Reilly, C. M., Sharma, S., Lottig, N. R., Stanley, E. H., North, R. L., Stockwell, J. D., Adrian, R., Weyhenmeyer, G. A., Arvola, L., Baulch, H. M., Bertani, I., Bowman, L. L., Carey, C. C., Catalan, J., Colom-Montero, W., Domine, L. M., Felip, M., Granados, I., Gries, C., Grossart, H. P., Haberman, J., Haldna, M., Hayden, B., Higgins, S. N., Jolley, J. C., Kahilainen, K. K., Kaup, E., Kehoe, M. J., MacIntyre, S., Mackay, A. W., Mariash, H. L., McKay, R. M., Nixdorf, B., Nõges, P., Nõges, T., Palmer, M., Pierson, D. C., Post, D. M., Pruett, M. J., Rautio, M., Read, J. S., Roberts, S. L., Rücker, J., Sadro, S., Silow, E. A., Smith, D. E., Sterner, R. W., Swann, G. E. A., Timofeyev, M. A., Toro, M., Twiss, M. R., Vogt, R. J., Watson, S. B., Whiteford, E. J., and Xenopoulos, M. A.: Ecology under lake ice, Ecol. Lett., 20, 98–111, https://doi.org/10.1111/ELE.12699, 2017.
Harris, C. R., Millman, K. J., van der Walt, S. J., Gommers, R., Virtanen, P., Cournapeau, D., Wieser, E., Taylor, J., Berg, S., Smith, N. J., Kern, R., Picus, M., Hoyer, S., van Kerkwijk, M. H., Brett, M., Haldane, A., del Río, J. F., Wiebe, M., Peterson, P., Gérard-Marchant, P., Sheppard, K., Reddy, T., Weckesser, W., Abbasi, H., Gohlke, C., and Oliphant, T. E.: Array programming with NumPy, Nature, 585, 357–362, https://doi.org/10.1038/s41586-020-2649-2, 2020.
Henderson-Seller, B. and Markland, H. R.: Decaying Lakes – The Origins and Control of Cultural Eutrophication, edited by: Menzel, R. G., John Wiley & Sons, Inc., New York, NY, https://doi.org/10.2134/jeq1989.00472425001800010030x, 1987.
Ho, J. C., Michalak, A. M., and Pahlevan, N.: Widespread global increase in intense lake phytoplankton blooms since the 1980s, Nature, 574, 667–670, https://doi.org/10.1038/s41586-019-1648-7, 2019.
Huisman, J. and Hulot, F. D.: Population Dynamics of Harmful Cyanobacteria, Harmful Cyanobacteria, 3, 143–176, https://doi.org/10.1007/1-4020-3022-3_7, 2005.
Huot, Y., Babin, M., Bruyant, F., Grob, C., Twardowski, M. S., and Claustre, H.: Relationship between photosynthetic parameters and different proxies of phytoplankton biomass in the subtropical ocean, Biogeosciences, 4, 853–868, https://doi.org/10.5194/bg-4-853-2007, 2007.
Inomura, K., Deutsch, C., Wilson, S. T., Masuda, T., Lawrenz, E., Bučinská, L., Sobotka, R., Gauglitz, J. M., Saito, M. A., Prášil, O., and Follows, M. J.: Quantifying oxygen management and temperature and light dependencies of nitrogen fixation by Crocosphaera watsonii, Msphere, 4, e00531-19, https://doi.org/10.1128/mSphere.00531-19, 2019.
Jeppesen, E., Søndergaard, M., and Jensen, J. P.: Climatic warming and regime shifts in lake food webs – Some comments, Limnol. Oceanogr., 48, 1346–1349, https://doi.org/10.4319/lo.2003.48.3.1346, 2003.
Jeppesen, E., Canfield, D. E., Bachmann, R. W., Søndergaard, M., Havens, K. E., Johansson, L. S., Lauridsen, T. L., Sh, T., Rutter, R. P., Warren, G., Ji, G., and Hoyer, M. V.: Toward predicting climate change effects on lakes: a comparison of 1656 shallow lakes from Florida and Denmark reveals substantial differences in nutrient dynamics, metabolism, trophic structure, and top-down control, Inl. Waters, 10, 197–211, https://doi.org/10.1080/20442041.2020.1711681, 2020.
Jonsson, P. R., Pavia, H., and Toth, G.: Formation of harmful algal blooms cannot be explained by allelopathic interactions, Proc. Natl. Acad. Sci. U. S. A., 106, 11177–11182, https://doi.org/10.1073/pnas.0900964106, 2009.
Kirillin, G., Leppäranta, M., Terzhevik, A., Granin, N., Bernhardt, J., Engelhardt, C., Efremova, T., Golosov, S., Palshin, N., Sherstyankin, P., Zdorovennova, G., and Zdorovennov, R.: Physics of seasonally ice-covered lakes: A review, Aquat. Sci., 74, 659–682, https://doi.org/10.1007/s00027-012-0279-y, 2012.
Lauerwald, R., Regnier, P., Figueiredo, V., Enrich-Prast, A., Bastviken, D., Lehner, B., Maavara, T., and Raymond, P.: Natural Lakes Are a Minor Global Source of N2O to the Atmosphere, Global Biogeochem. Cycles, 33, 1564–1581, https://doi.org/10.1029/2019GB006261, 2019.
Lewis, K. M., Arntsen, A. E., Coupel, P., Lowry, K. E., Dijken, G. L. Van, Selz, V., Arrigo, K. R., Matsuoka, A., and Mills, M. M.: Photoacclimation of Arctic Ocean phytoplankton to shifting light and nutrient limitation, Limnology and Oceanography, 64, 1–18, https://doi.org/10.1002/lno.11039, 2018.
Lewis, W.: Global primary production of lakes: 19th Baldi Memorial Lecture, Inl. Waters, 1, 1–28, https://doi.org/10.5268/iw-1.1.384, 2011.
Linke, S., Lehner, B., Ouellet Dallaire, C., Ariwi, J., Grill, G., Anand, M., Beames, P., Burchard-Levine, V., Maxwell, S., Moidu, H., Tan, F., and Thieme, M.: Global hydro-environmental sub-basin and river reach characteristics at high spatial resolution, Sci. Data, 6, 1–15, https://doi.org/10.1038/s41597-019-0300-6, 2019.
Lyngsgaard, M. M., Markager, S., Richardson, K., Møller, E. F., and Jakobsen, H. H.: How Well Does Chlorophyll Explain the Seasonal Variation in Phytoplankton Activity?, Estuaries and Coasts, 40, 1263–1275, https://doi.org/10.1007/s12237-017-0215-4, 2017.
Markelov, I., Couture, R. M., Fischer, R., Haande, S., and Van Cappellen, P.: Coupling Water Column and Sediment Biogeochemical Dynamics: Modeling Internal Phosphorus Loading, Climate Change Responses, and Mitigation Measures in Lake Vansjø, Norway, J. Geophys. Res.-Biogeo., 124, 3847–3866, https://doi.org/10.1029/2019JG005254, 2019.
Messager, M. L., Lehner, B., Grill, G., Nedeva, I., and Schmitt, O.: Estimating the volume and age of water stored in global lakes using a geo-statistical approach, Nat. Commun., 7, 13603, https://doi.org/10.1038/ncomms13603, 2016.
Meyer, M. F., Labou, S. G., Cramer, A. N., Brousil, M. R., and Luff, B. T.: The global lake area, climate, and population dataset, Sci. Data 2020, 71, 1–12, https://doi.org/10.1038/s41597-020-0517-4, 2020.
O'Beirne, M. D., Werne, J. P., Hecky, R. E., Johnson, T. C., Katsev, S., and Reavie, E. D.: Anthropogenic climate change has altered primary productivity in Lake Superior, Nat. Commun., 8, 15713, https://doi.org/10.1038/ncomms15713, 2017.
O'Connell, D. W., Ansems, N., Kukkadapu, R. K., Jaisi, D., Orihel, D. M., Cade-Menun, B. J., Hu, Y., Wiklund, J., Hall, R. I., Chessell, H., Behrends, T., and Van Cappellen, P.: Changes in Sedimentary Phosphorus Burial Following Artificial Eutrophication of Lake 227, Experimental Lakes Area, Ontario, Canada, J. Geophys. Res.-Biogeo., 125, e2020JG005713, https://doi.org/10.1029/2020JG005713, 2020.
Python Software Foundation: Python Language, https://www.python.org/ (last access: August 2021), 2021.
QGIS.org: QGIS Geographic Information System, https://qgis.org/en/site/ (last access: August 2021), 2021.
Reback, J., McKinney, W. jbrockmendel, Van den Bossche, J., Augspurger, T., Cloud, P., Gfyoung, Sinhrks, Klein, A., Roeschke, M., Hawkins, S., Tratner, J., She, C., Ayd, W., Petersen, T., Garcia, M., Schendel, J., and Hayden, A.: pandas-dev/pandas: Pandas 1.0.3 (v1.0.3), https://pandas.pydata.org/docs/ (last access: August 2021), 2020.
Riederer, C.: Dplython, GitHub [code], https://github.com/dodger487/dplython/releases/tag/0.0.7 (last access: August 2021), 2015.
Rigosi, A., Carey, C. C., Ibelings, B. W., and Brookes, J. D.: The interaction between climate warming and eutrophication to promote cyanobacteria is dependent on trophic state and varies among taxa, Limnol. Oceanogr., 59, 99–114, https://doi.org/10.4319/lo.2014.59.1.0099, 2014.
Roche, D. G., Granados, M., Austin, C. C., Wilson, S., and Mitchell, G. M.: Open government data and environmental science: a federal Canadian perspective, FACETS, 5, 942–962, https://doi.org/10.1139/facets-2020-0008, 2020.
Rouse, W. R., Douglas, M. S., Hecky, R. E., Hershey, A. E., King, G. W., Lesack, L., Marsh, P., McDonald, M., Nicholson, B. J., Roulet, N. T., and Smol, J. P.: Effects of climate change on the freshwaters of arctic and subarctic North America, Hydrol. Process., 11, 873–902, 1997.
Rousseaux, C. S. and Gregg, W. W.: Interannual variation in phytoplankton primary production at a global scale, Remote Sens., 6, 1–19, https://doi.org/10.3390/rs6010001, 2013.
Schindler, D. W.: A Hypothesis to Explain Differences and Similarities Among Lakes in the Experimental Lakes Area, Northwestern Ontario, J. Fish. Res. Board Canada, 28, 295–301, https://doi.org/10.1139/f71-039, 1971.
Schwarz, M., Folini, D., Hakuba, M. Z., and Wild, M.: From Point to Area: Worldwide Assessment of the Representativeness of Monthly Surface Solar Radiation Records, J. Geophys. Res. Atmos., 123, 13857–13874, https://doi.org/10.1029/2018JD029169, 2018.
Shuvo, A., O'Reilly, C. M., Blagrave, K., Ewins, C., Filazzola, A., Gray, D., Mahdiyan, O., Moslenko, L., Quinlan, R., and Sharma, S.: Total phosphorus and climate are equally important predictors of water quality in lakes, Aquat. Sci., 831, 1–11, https://doi.org/10.1007/S00027-021-00776-W, 2021.
Sommer, U., Gliwicz, Z. M., Lampert, W., and Duncan, A.: The PEG-model of seasonal succession of planktonic events in fresh waters, Arch. Hydrobiol., 106, 433–471, 1986.
Sterner, R. W., Elser, J. J., Fee, E. J., Guildford, S. J., and Chrzanowski, T. H.: The light: Nutrient ratio in lakes: The balance of energy and materials affects ecosystem structure and process, Am. Nat., 150, 663–684, 1997.
Taylor, A. H., Geider, R. J., and Gilbert, F. J.: Seasonal and latitudinal dependencies of phytoplankton carbon-to-chlorophyll a ratios: results of a modelling study, Mar. Ecol.-Prog. Ser., 152, 51–66, 1997.
Tett, P.: The ecophysiology of exceptional blooms, Rapp. Proces-verbaux des Reun. Cons. Int. pour l'Exploration la Mer, 3, 47–60, 1987.
Tranvik, L. J., Downing, J. A., Cotner, J. B., Loiselle, S. A., Striegl, R. G., Ballatore, T. J., Dillon, P., Finlay, K., Fortino, K., Knoll, L. B., Kortelainen, P. L., Kutser, T., Larsen, S., Laurion, I., Leech, D. M., Leigh McCallister, S., McKnight, D. M., Melack, J. M., Overholt, E., Porter, J. A., Prairie, Y., Renwick, W. H., Roland, F., Sherman, B. S., Schindler, D. W., Sobek, S., Tremblay, A., Vanni, M. J., Verschoor, A. M., Von Wachenfeldt, E., and Weyhenmeyer, G. A.: Lakes and reservoirs as regulators of carbon cycling and climate, Limnol. Oceanogr., 54, 2298–2314, https://doi.org/10.4319/lo.2009.54.6_part_2.2298, 2009.
United States Environmental Protection Agengy: 2012 National Lakes Assessment. Field Operations Manual, Washington DC, USA, EPA 841-B-11-003, https://www.epa.gov/national-aquatic-resource-surveys/national-lakes-assessment-2012-field-operations-manual (last access: August 2021), 2012.
Verpoorter, C., Kutser, T., Seekell, D., and Tranvik, L.: A global inventory of lakes based on high-resolution satellite imagery, Geophys. Res. Lett., 41, 6396–6402, https://doi.org/10.1002/2014GL060641, 2014.
Virtanen, P., Gommers, R., Oliphant, T. E., Haberland, M., Reddy, T., Cournapeau, D., Burovski, E., Peterson, P., Weckesser, W., Bright, J., van der Walt, S. J., Brett, M., Wilson, J., Millman, K. J., Mayorov, N., Nelson, A. R. J., Jones, E., Kern, R., Larson, E., Carey, C. J., Polat, İ., Feng, Y., Moore, E. W., VanderPlas, J., Laxalde, D., Perktold, J., Cimrman, R., Henriksen, I., Quintero, E. A., Harris, C. R., Archibald, A. M., Ribeiro, A. H., Pedregosa, F., van Mulbregt, P., Vijaykumar, A., Bardelli, A. Pietro, Rothberg, A., Hilboll, A., Kloeckner, A., Scopatz, A., Lee, A., Rokem, A., Woods, C. N., Fulton, C., Masson, C., Häggström, C., Fitzgerald, C., Nicholson, D. A., Hagen, D. R., Pasechnik, D. V., Olivetti, E., Martin, E., Wieser, E., Silva, F., Lenders, F., Wilhelm, F., Young, G., Price, G. A., Ingold, G. L., Allen, G. E., Lee, G. R., Audren, H., Probst, I., Dietrich, J. P., Silterra, J., Webber, J. T., Slavič, J., Nothman, J., Buchner, J., Kulick, J., Schönberger, J. L., de Miranda Cardoso, J. V., Reimer, J., Harrington, J., Rodríguez, J. L. C., Nunez-Iglesias, J., Kuczynski, J., Tritz, K., Thoma, M., Newville, M., Kümmerer, M., Bolingbroke, M., Tartre, M., Pak, M., Smith, N. J., Nowaczyk, N., Shebanov, N., Pavlyk, O., Brodtkorb, P. A., Lee, P., McGibbon, R. T., Feldbauer, R., Lewis, S., Tygier, S., Sievert, S., Vigna, S., Peterson, S., More, S., Pudlik, T., et al.: SciPy 1.0: fundamental algorithms for scientific computing in Python, Nat. Methods, 17, 261–272, https://doi.org/10.1038/s41592-019-0686-2, 2020.
Watson, S. B., Miller, C., Arhonditsis, G., Boyer, G. L., Carmichael, W., Charlton, M. N., Confesor, R., Depew, D. C., Höök, T. O., Ludsin, S. A., Matisoff, G., McElmurry, S. P., Murray, M. W., Peter Richards, R., Rao, Y. R., Steffen, M. M., and Wilhelm, S. W.: The re-eutrophication of Lake Erie: Harmful algal blooms and hypoxia, Harmful Algae, 56, 44–66, https://doi.org/10.1016/j.hal.2016.04.010, 2016.
Wetzel, R. G.: Limnology: Lake and River Ecosystems, third edition, Academic press, eBook ISBN 9780080574394, 2001.
Williamson, C. E., Saros, J. E., Vincent, W. F., and Smol, J. P.: Lakes and reservoirs as sentinels, integrators, and regulators of climate change, Limnol. Oceanogr., 54, 2273–2282, https://doi.org/10.4319/LO.2009.54.6_PART_2.2273, 2009.
Wohland, J., Brayshaw, D., Bloomfield, H., and Wild, M.: European multidecadal solar variability badly captured in all centennial reanalyses except CERA20C, Environ. Res. Lett., 15, 104021, https://doi.org/10.1088/1748-9326/ABA7E6, 2020.
Woolway, R. I. and Merchant, C. J.: Worldwide alteration of lake mixing regimes in response to climate change, Nat. Geosci., 12, 271–276, https://doi.org/10.1038/s41561-019-0322-x, 2019.
Zohary, T., Padisák, J., and Naselli-Flores, L.: Phytoplankton in the physical environment: beyond nutrients, at the end, there is some light, Hydrobiol., 6391, 261–269, https://doi.org/10.1007/S10750-009-0032-2, 2009.
productivityin lakes. To predict how environmental factors like nutrient concentrations, ice cover, and water temperature will continue to influence lake productivity in this changing climate, we created a dataset of chlorophyll-a concentrations (a compound found in algae), associated water quality parameters, and solar radiation that can be used to for a wide range of research questions.